UNITED STATES
SECURITIES AND EXCHANGE COMMISSION
Washington, D.C. 20549
Form 10-K
(Mark One)
| x | ANNUAL REPORT PURSUANT TO SECTION 13 OR 15(d) OF THE SECURITIES EXCHANGE ACT OF 1934 |
For the fiscal year ended December 31, 2010
OR
| ¨ | TRANSITION REPORT PURSUANT TO SECTION 13 OR 15(d) OF THE SECURITIES EXCHANGE ACT OF 1934 |
For transition period from to
Commission File Number 001-33622
VMWARE, INC.
(Exact name of registrant as specified in its charter)
| Delaware | 94-3292913 | |
(State or other jurisdiction of incorporation or organization) | (I.R.S. Employer Identification Number) | |
3401 Hillview Avenue Palo Alto, CA | 94304 | |
| (Address of principal executive offices) | (Zip Code) |
(650) 427-5000
(Registrant's telephone number, including area code)
Securities registered pursuant to Section 12(b) of the Act:
Title of each class | Name of each exchange on which registered | |
| Class A Common Stock, par value $0.01 | New York Stock Exchange |
Securities registered pursuant to section 12(g) of the Act:
None
Indicate by a check mark if the registrant is a well-known seasoned issuer, as defined in Rule 405 of the Securities Act. Yes x No ¨
Indicate by check mark if the registrant is not required to file reports pursuant to Section 13 or Section 15(d) of the Act. Yes ¨ No x
Indicate by check mark whether the registrant (1) has filed all reports required to be filed by Section 13 or 15(d) of the Securities Exchange Act of 1934 during the preceding 12 months (or for such shorter period that the registrant was required to file such reports), and (2) has been subject to such filing requirements for the past 90 days. Yes x No ¨
Indicate by check mark whether the registrant has submitted electronically and posted on its corporate Web site, if any, every Interactive Data File required to be submitted and posted pursuant to Rule 405 of Regulation S-T (§232.405 of this chapter) during the preceding 12 months (or for such shorter period that the registrant was required to submit and post such files). Yes x No ¨
Indicate by check mark if disclosure of delinquent filers pursuant to Item 405 of Regulation S-K is not contained herein, and will not be contained, to the best of registrant's knowledge, in definitive proxy or information statements incorporated by reference in Part III of this Form 10-K or any amendment to this Form 10-K. ¨
Indicate by check mark whether the registrant is a large accelerated filer, an accelerated filer, a non-accelerated filer, or a smaller reporting company. See the definitions of "large accelerated filer," "accelerated filer" and "smaller reporting company" in Rule 12b-2 of the Exchange Act.
Large accelerated filer x | Accelerated filer ¨ | |||
Non-accelerated filer ¨ (Do not check if a smaller reporting company) | Smaller reporting company ¨ | |||
Indicate by check mark whether the registrant is a shell company (as defined in Rule 12b-2 of the Exchange Act). Yes ¨ No x
At June 30, 2010, the aggregate market value of the registrant's Class A common stock held by non-affiliates of the registrant (based upon the closing sale price of such shares on the New York Stock Exchange on June 30, 2010) was approximately $4,563,264,652. Shares of the registrant's Class A common stock and Class B common stock held by each executive officer and director and by each entity or person, other than investment companies, that, to the registrant's knowledge, owned 5% or more of the registrant's outstanding Class A common stock as of June 30, 2010 have been excluded in that such persons may be deemed to be affiliates of the registrant. This determination of affiliate status is not necessarily a conclusive determination for other purposes.
As of February 18, 2011, the number of shares of common stock, par value $0.01 per share, of the registrant outstanding was 418,271,740, of which 118,271,740 shares were Class A common stock and 300,000,000 were Class B common stock.
DOCUMENTS INCORPORATED BY REFERENCE
Information required in response to Part III of Form 10-K (Items 10, 11, 12, 13 and 14) is hereby incorporated by reference to portions of the registrant's Proxy Statement for the Annual Meeting of Stockholders to be held in 2011. The Proxy Statement will be filed by the registrant with the Securities and Exchange Commission no later than 120 days after the end of the registrant's fiscal year ended December 31, 2010.
TABLE OF CONTENTS
| Page | ||||||
| PART I | ||||||
| Item 1. | Business | 1 | ||||
| Item 1A. | Risk Factors | 11 | ||||
| Item 1B. | Unresolved Staff Comments | 36 | ||||
| Item 2. | Properties | 37 | ||||
| Item 3. | Legal Proceedings | 37 | ||||
| PART II | ||||||
| Item 5. | Market for Registrant's Common Equity, Related Stockholder Matters and Issuer Purchases of Equity Securities | 40 | ||||
| Item 6. | Selected Financial Data | 43 | ||||
| Item 7. | Management's Discussion and Analysis of Financial Condition and Results of Operations | 44 | ||||
| Item 7A. | Quantitative and Qualitative Disclosures About Market Risk | 67 | ||||
| Item 8. | Financial Statements and Supplementary Data | 69 | ||||
| Item 9. | Changes in and Disagreements with Accountants on Accounting and Financial Disclosures | 109 | ||||
| Item 9A. | Controls and Procedures | 109 | ||||
| Item 9B. | Other Information | 109 | ||||
| PART III | ||||||
| Item 10. | Directors, Executive Officers and Corporate Governance | 110 | ||||
| Item 11. | Executive Compensation | 110 | ||||
| Item 12. | Security Ownership of Certain Beneficial Owners and Management, and Related Stockholder Matters | 110 | ||||
| Item 13. | Certain Relationships and Related Transactions, and Director Independence | 110 | ||||
| Item 14. | Principal Accountant Fees and Services | 110 | ||||
| PART IV | ||||||
| Item 15. | Exhibits and Financial Statement Schedule | 111 | ||||
Signatures | 113 | |||||
VMware, VMworld, VMware vSphere, VMware vCloud, VMare Fusion, vMotion, Hyperic, ESX, Zimbra and SpringSource are registered trademarks or trademarks of VMware, Inc. in the United States and/or other jurisdictions. All other marks and names mentioned herein may be trademarks of their respective companies.
FORWARD-LOOKING STATEMENTS
This Annual Report on Form 10-K contains forward-looking statements, including, without limitation, statements regarding: the potential role of our products in cloud computing and other shifts in computing infrastructures; expectations of, and our plans for, achieving future business growth; future product offerings; plans for future acquisitions; our view of the competitive landscape and our plans for maintaining our leadership position, funding expansion of our industry segment share and developing long term relationships with our customers; our anticipation that we will not declare any cash dividends, the availability of suitable facilities for our future operations; our plans for meeting product development objectives and introducing new products; our revenue outlook and mix; customer demand for our products; trends in enterprise license agreement ("ELA") size and renewals and information technology ("IT") spending in general; projections of, and expectations for, stock-based compensation expense; the delivery of professional services to our customers; the sufficiency of our liquidity and capital reserves to fund our operations and business strategy; continuation of our stock repurchase program; factors effecting our tax position; and our belief that the resolution of pending claims and legal proceedings will not have a material adverse effect on us.
These forward-looking statements involve risks and uncertainties and the cautionary statements set forth above and those contained in the section of this report entitled "Risk Factors" identify important factors that could cause actual results to differ materially from those predicted in any such forward-looking statements. We assume no obligation to, and do not currently intend to, update these forward-looking statements.
i
PART I
| ITEM 1. | BUSINESS |
Overview
VMware, Inc. is the leading provider of virtualization and virtualization-based cloud infrastructure solutions from the desktop to the data center and to the cloud. Our virtualization solutions reflect a pioneering approach to computing that separates application software from the underlying hardware to achieve significant improvements in efficiency, agility, availability, flexibility and manageability. Our broad and proven suite of virtualization solutions addresses a range of complex information technology ("IT") problems that include cost and operational inefficiencies, facilitating access to "cloud computing" capacity, business continuity, software lifecycle management, and corporate end-user computing device management. The benefits to our customers include substantially lower IT costs, cost-effective high availability across a wide range of applications, and a more automated and resilient systems infrastructure capable of responding dynamically to variable business demands. Our customers' deployments range in size from a single virtualized server for small businesses to up to thousands of virtual machines for our Fortune 1000 enterprise customers. Our solutions enable organizations to aggregate multiple servers, storage infrastructure and networks together into shared pools of capacity that can be allocated dynamically, securely and reliably to applications as needed, increasing hardware utilization and reducing spending. Once created, these internal computing infrastructures, or "clouds", can be dynamically linked by our customers to external computing resources from third-party cloud computing providers that run on a common VMware virtualization platform. The result is a "hybrid" computing cloud of highly available internal and external computing resources that organizations can access on demand. In the twelve years since the introduction of our first virtualization platform, we have expanded our product offerings to address distributed and heterogeneous infrastructure challenges such as planned and unplanned downtime management, system recoverability and reliability, backup and recovery, resource provisioning and management, capacity and performance management and security.
We work closely with more than 1,700 technology partners, including leading server, microprocessor, storage, networking and software vendors. We have shared the economic opportunities surrounding virtualization with our partners by facilitating solution development through open Application Programming Interface ("APIs") formats and protocols and providing access to our source code and technology. The endorsement and support of our partners have further enhanced the awareness, reputation and adoption of our virtualization solutions.
We have developed a multi-channel distribution model to expand our presence and reach various segments of the market. We derive a significant majority of our revenues from our large indirect sales channel that include distributors, resellers, system vendors and systems integrators. We believe that our partners benefit greatly from the sale of our solutions through additional services, software and hardware sales opportunities. We have trained a large number of partners and end-users to deploy and leverage our solutions.
We were incorporated as a Delaware corporation in 1998 and continued to operate in large measure as a stand-alone company following our acquisition by EMC Corporation ("EMC") in 2004 and following our initial public offering of our Class A common stock in August 2007. EMC holds approximately 80% of our outstanding common stock, including 33 million shares of our Class A common stock and all of our Class B common stock, and we are considered a "controlled company" under the rules of the New York Stock Exchange. Total revenues in 2010 increased 41% to $2,857.3 million. This included license revenues of $1,401.4 million and services revenues of $1,455.9 million. In the years ended December 31, 2010, 2009 and 2008, our license revenues came primarily from sales of our Cloud Infrastructure solutions. The balance of our license revenues came from our other solutions: Cloud Application Platform, End-User Computing, and Virtualization and Cloud Management. Of our total services revenues in 2010, 84% were software maintenance revenues and 16% were professional services revenues, including training. For additional financial information on our business by product and geographic area, see Note N to the consolidated financial statements included elsewhere in this filing. Our corporate headquarters are located at 3401 Hillview Avenue, Palo Alto, California and we have 97 offices worldwide.
1
Our solutions are based upon our core virtualization technology and are organized into four main product groups:
| • | Cloud Infrastructure |
| • | Cloud Application Platform |
| • | End-User Computing |
| • | Virtualization and Cloud Management |
Background
Overview of Virtualization
Virtualization was first introduced in the 1970s to enable multiple business applications to share and fully harness the centralized computing capacity of mainframe systems. Virtualization was effectively abandoned during the 1980s and 1990s when client-server applications and inexpensive x86 servers and personal computers established the model of distributed computing. Rather than sharing resources centrally in the mainframe model, organizations used the low cost of distributed systems to build up islands of computing capacity, providing some benefits but also introducing new challenges. Some of these challenges include a gross underutilization of hardware resources, inability to easily assure quality of service to applications and unwieldy management processes made cumbersome by the tight coupling of applications to the underlying hardware.
Cloud Infrastructure
Today, x86 hardware is becoming increasingly proficient with multi-core processors, growing memory capacity and higher speed interconnects shipping in standard servers. Complexity of applications continues to rise with multi-element, mixed operating system ("OS") applications becoming increasingly common, making it difficult to provide a uniform quality of service across all components. Virtualization has become accepted as a standard way of computing in data centers that enables highly efficient utilization of hardware.
VMware's infrastructure virtualization platform, VMware vSphere, not only decouples the entire software environment from its underlying hardware infrastructure, but also enables the aggregation of multiple servers, storage infrastructure and networks into shared pools of resources that can be delivered dynamically, securely and reliably to applications as needed. This approach enables organizations to build a computing infrastructure with high levels of utilization, availability, automation and flexibility using building blocks of inexpensive industry-standard servers.
In addition, VMware vSphere is able to deliver services to applications running inside virtual machines, in an OS and application agnostic manner. This increases operational efficiency, since these services are built-in and easily enabled, and also allows mixed-element, multi-OS applications to get standard service levels delivered by the infrastructure, broadening customer deployment choices.
In effect, VMware's virtualization platform converts IT infrastructure into a "computing cloud." Applications running in virtual machines can move across servers, storage and networks without disruption or downtime to dynamically match computing supply and demand while built-in services ensure high levels of availability, security and scalability.
To best leverage this cloud computing infrastructure, virtualization management products help streamline IT processes and reduce operating costs by automating critical workflows in the data center. VMware products for application management enable organizations to accelerate application development, automate application lifecycle processes and manage to application performance service levels. Infrastructure management products help companies automate business continuity processes, manage capacity more efficiently and provide financial cost information for internal chargeback.
2
Virtual machine standardization coupled with our VMware vCloud initiative directed to hosting and cloud computing vendors enables organizations to choose more freely between running applications in virtual machines on their own "private clouds" inside their data center or on "public clouds" hosted by a service provider. With a common VMware platform available across the public and private clouds, applications can be readily moved between the two based on economics and organizational need. External cloud capacity can be accessed on-demand without the need to customize or change applications.
Products and Technology
Cloud Infrastructure Products and Technology
VMware vSphere is our flagship data center platform. Users can choose to deploy the VMware ESX or VMware ESXi hypervisor when they purchase VMware vSphere. A "hypervisor" is a layer of software that resides between the operating system and system hardware to enable virtualization. VMware ESX is the industry's most mature hypervisor. VMware ESXi is a compact, small disk footprint version of VMware ESX with the same functionality and performance. Other components of our various VMware vSphere offerings include capabilities such as the following:
| • | VMware vMotion and VMware Storage vMotion enables the live migration of actively running virtual machines across servers or storage locations without disruption or downtime. |
| • | VMware High Availability enables cost-effective high availability for all applications against hardware and operating system failures. |
| • | VMware Fault Tolerance enables zero downtime, zero data loss and continuous availability for applications. |
| • | VMware Distributed Resource Scheduler enables continuous monitoring of virtual machines that ensure optimal placement on hardware based on resource requirements and priorities. |
| • | VMware vNetwork Distributed Switch enables centralized point of control for cluster level networking. |
In 2010 we announced VMware vShield, a new family of security products designed specifically for virtual data centers and cloud environments. Key vShield products include:
| • | VMware vShield Edge provides perimeter network and security services for virtual datacenters, end-user computing and cloud environments. |
| • | VMware vShield App provides application protection within the virtual datacenter, end-user computing and cloud environments. |
| • | VMware vShield Endpoint enables efficient anti-virus agent offloading from guest virtual machines in virtual datacenters, end-user computing and cloud environments. |
Cloud Application Platform
VMware Cloud Application Platform solutions help organizations build, run and manage enterprise applications by utilizing application frameworks. An application framework is a collection of software libraries that structures and simplifies the work of software developers building applications. Our SpringSource product group develops and supports the Spring application framework for enterprise Java applications and the Grails framework for high productivity web applications written in the Groovy programming language. Both of these frameworks are open source software. Our Cloud Application Platform provides open source application frameworks, application run-time and data management solutions, and monitoring solutions for enterprise applications and infrastructure. Key VMware Cloud Application Platform products include the following:
| • | VMware vFabric tcServer, an enterprise Tomcat App server. |
3
| • | VMware vFabric Enterprise Ready, an enterprise Apache Web server. |
| • | VMware vFabric Hyperic provides web and custom application monitoring and performance management for physical, virtual and cloud environments. |
| • | VMware vFabric GemFire enables real-time data distribution, caching and management for modern applications. |
| • | RabbitMQ provides robust and reliable inter-system messaging for modern applications. |
We also seek to partner with leading cloud vendors to enable them to deliver software as a service, or SaaS, applications that leverage and integrate with our technologies.
End-User Computing
Enterprises are increasingly challenged to provide secure access to a growing mobile workforce while managing the diversity of data, applications and devices to run their business. VMware's End-User Computing solutions are designed to enable a user-centric approach to personal computing that ensures secure access to applications and data from a variety of devices and locations, while also addressing the needs of corporate IT departments.
The VMware End-User Computing product line is comprised of solutions to simplify desktop delivery and application management, enable communication and collaboration and provide support for operating environment flexibility across endpoint devices.
VMware's End-User Computing strategy addresses the needs of corporate IT enabling IT organizations to deliver an environment with high-quality service, improved availability and scalable performance while leveraging both legacy and cloud architectures. Key VMware End-User Computing solutions include:
| • | VMware View, an enterprise desktop virtualization platform designed to optimize application and desktop management and enable flexibility for end-users. In 2010, VMware released VMware View 4.5, which introduced integrated offline desktop virtualization. |
| • | VMware ThinApp, an application virtualization solution designed to accelerate application deployment and simplify application migration. |
| • | VMware Zimbra, an enterprise-class, calendar and collaboration platform based on the popular Zimbra open source project. |
| • | VMware Workstation, a solution that enables multiple operating systems to run at the same time on a single endpoint device. |
| • | VMware Fusion, a solution for Apple users to seamlessly run Windows and Windows applications on an Intel processor-powered Apple OS X Macintosh computer. |
Virtualization and Cloud Management
VMware management solutions are designed to simplify and automate management of dynamic cloud infrastructure, cloud applications and end-user computing platforms. Our management solutions are optimized for dynamic vSphere environments while also managing aspects of physical infrastructure important to customers as they expand virtualization to critical applications and deploy cloud infrastructure. VMware virtualization and cloud management products help customers increase the efficiency and availability of infrastructure resources, accelerate application development, manage application performance service levels and streamline IT processes.
Key VMware virtualization and cloud management products include the following:
| • | VMware vCenter Server provides the central management and control point for vSphere environments. |
4
| • | VMware vCenter Orchestrator automates tasks and workflows for vSphere as well as other VMware and 3rd party management solutions. |
| • | VMware vCloud Director enables self-service access to logical pools of compute, network and storage resources with policy driven controls and service level agreements. |
| • | VMware vCenter Site Recovery Manager provides one-button disaster recovery for virtualized environments. |
| • | VMware vCenter Lab Manager establishes an automated process for software development environments. |
| • | VMware vCenter Capacity IQ provides virtual infrastructure capacity management, optimization and forecasting. |
| • | VMware vCenter Configuration Manager automates configuration management for virtual and physical servers, workstations and desktops. |
| • | VMware vCenter AppSpeed enables troubleshooting application performance in virtual environments. |
| • | VMware vCenter Application Discovery Manager provides automated, real-time application discovery and dependency mapping for physical and virtual environments. |
| • | VMware Service Manager automates IT Service Management processes. |
| • | VMware vCloud Request Manager, automated approval workflows, license tracking and policy-based provisioning for vCloud Director-based cloud environments. |
| • | VMware vCenter Chargeback enables visibility, reporting and chargeback of virtual resource consumption and IT costs. |
Support and Services
We believe that a strong services organization and frequent customer touch points are critical to establish loyal customers and help promote our technology across various industries. We have implemented a broad services strategy that leverages the professional services organizations of our partners. We have also established our own services offerings to complement our partners' services offerings and to ensure customer satisfaction, drive additional sales, and promote renewals and upgrades. Our services offerings include customized solutions and onsite support that enable us and our channel partners to provide a positive overall customer experience.
We have established our global customer support organization to align with and support our expanding customer base.
| • | VMware Global Support Services. We offer a suite of support packages backed by industry-leading expertise. We offer four support and subscription programs that allow customers to pay a set amount over an annual or multi-year basis: Basic, Production, Business Critical and Mission Critical. Basic Support includes VMware technical support along with access to periodic updates, bug fixes and enhancements to our products. Production Support builds on Basic Support and includes more aggressive response targets and ongoing support for high severity issues. Business Critical Support and Mission Critical Support provide customers personalized technical support delivered by a team of experts familiar with a customer's specific system configuration, past support experience, and business needs. Of our customers who purchase support, the majority purchase Production Support. We sell and market our support and service agreements through the same network of channel partners who also sell our products. We utilize a third-party vendor to sell renewals directly to end-user customers and complement our channel partners' efforts by providing quotation and sales support to our channel partners. |
5
The core support and subscription offerings provide live phone support, and our customers have access to an online product knowledge database and various other social media for help with troubleshooting and operational questions. Our support teams provide first response and manage the resolution of customer issues. In addition, we have authorized certain systems vendors and independent service providers to provide support for our products on our behalf.
We also offer a range of professional services under our VMware Professional Services offering, which includes the following:
| • | VMware Consulting Services. VMware Certified Professionals ("VCPs") and VMware Certified Design Experts ("VCDXs") provide on-site VMware product design, implementation and management assistance throughout the virtualization adoption lifecycle to accelerate the implementation of our virtualization solutions. VCPs and VCDXs conduct initial assessments, workshops and prepare detailed implementation project plans. Once customers are ready for VMware standardization across their enterprise, VCPs and VCDXs help integrate VMware products into their enterprise systems and processes. VCPs and VCDXs include VMware employees, partners and customers who have completed training and have successfully passed our VCP or VCDX exams. |
| • | VMware Education Services. We have an extensive portfolio of instructor-led VMware courses that provide extensive hands-on labs, case study examples and course materials. Customers work in teams of two on servers located offsite using a variety of remote access technologies. Customers can enroll in these courses directly through VMware or though Value Added Training Partners as well as having the courses delivered on-site. Additionally, VMware Education Services has a broad library of e-learning modules and certifications. |
| • | VMware Technical Account Manager ("TAM"). TAM service provides our customers with a dedicated VMware expert, which enables customers to accelerate standardization of VMware products by assessing their unique environment, proactively recommending solutions, and identifying unforeseen circumstances that may cause delays in deployment. |
Technology Alliances
Consistent with our partner-centric strategy, we have engaged a broad group of hardware, software, and cloud computing service vendors to cooperatively advance virtualization technology through joint marketing, product interoperability, collaboration and co-development. We create opportunity for partners by enabling them to build products that utilize our virtualization technology and create differentiated value through joint solutions.
We have more than 1,700 technology partners with whom we bring joint offerings to the marketplace. We classify our partners as follows:
| • | Independent Hardware Vendors ("IHVs"). We have established strong relationships with large system vendors, including Cisco, Dell, Fujitsu, Fujitsu-Siemens, HP, IBM, Lenovo and NEC for joint certification and co-development. We also work closely with AMD, Intel and other IHVs to provide input on product development to enable them to deliver hardware advancements that benefit virtualization users. We coordinate with the leading storage and networking vendors to ensure joint interoperability, and enable our software to access their differentiated functionality. |
| • | Independent Software Vendors ("ISVs"). We partner with leading systems management, infrastructure software and application software vendors to enable them to deliver value-added products that integrate with our VMware vSphere, vFabric and vCenter suite of products. |
| • | vCloud Service Providers. We have established partnerships with over 3,400 service providers including Bluelock, Colt, Sing Tel, Terremark and Verizon to enable them to host and deliver enterprise-class hybrid clouds as a way for enterprises to extend their datacenters to external clouds, while preserving security, compliance and quality of service. |
6
The VMware Technology Alliance Partner program facilitates joint solution creation and coordinated go-to-market activities with our partners. Over 2,400 of the most widely used applications from ISVs support the VMware vSphere platform. Each month, dozens of additional applications are added to the supported list. These applications include business solutions for enterprise resource planning, human resource management, electronic medical records management, financial processing, and middleware such as application servers and databases. As an extension to this rapidly growing list, we have expanded our VMware Ready Management program to allow middleware and application software to qualify for the VMware Ready logo. The VMware Ready Management program validates the integrations of partner solutions that simplify comprehensive management of VMware virtual datacenter operating system environments.
Our ISVs and other alliance partners, open source contributors and other VMware community members have distributed more than 1,500 software applications as virtual appliances. In addition to developing open APIs, formats and protocols at multiple levels in our products, we provide source code access to select partners in our "Community Source" program to facilitate joint development and partner differentiation. We provide access to our ESX source code to approximately 600 developers from more than 40 partners for joint development projects. We also work with our industry partners to promote and foster the adoption of industry standards.
We invest significant capital in testing and certification of infrastructure to rigorously ensure our software works well with major hardware and software products. We have more than 4,500 servers, storage, I/O and thin-client devices from approximately 200 companies that are VMware Ready. We have successfully tested approximately 500 operating system versions for use with our solutions. We believe that the scale and scope of this effort is a significant competitive advantage.
Research and Development
We have made, and expect to continue to make, significant investments in research and development ("R&D"). We have assembled an experienced group of developers with system level, systems management, desktop, security, application development and open source software expertise. We also have strong ties to leading academic institutions around the world, and we support academic programs that range from shared source code for research to sabbatical programs for visiting professors.
We prioritize our product development efforts through a combination of engineering-driven innovation and customer and market-driven feedback. Our R&D culture places high value on innovation, quality and open collaboration with our partners. We currently participate in numerous standards groups, and VMware employees hold a variety of standards organization leadership positions, including with the Distributed Management Task Force, the Standard Performance Evaluation Corporation, the InterNational Committee for Information Technology Standards (INCITS), the Storage Networking Industry Association and the OSGi Alliance. We believe that maintaining the strength of our R&D organization is critical to our ability to compete.
Our R&D expenses totaled $653.0 million, $496.6 million and $429.2 million in 2010, 2009 and 2008, respectively.
Sales and Marketing
We sell and market our products largely through a network of channel partners, which includes distributors, resellers, system vendors and systems integrators, with over 85% of our sales in 2010 derived from this network. The remainder is primarily derived from direct sales.
We have established ongoing business relationships with our distributors. Our distributors purchase software licenses and software support from us for resale to end-user customers via resellers.
A substantial majority of our resellers obtain software licenses and software support from our distributors and market and sell them to our end-user customers. These resellers are part of our VMware Partner Network ("VPN"), which offers these resellers sales and product training and pricing incentives and rebates and access to the worldwide network of VMware distributors and the VMware Partner Central Web portal.
7
We offer several levels of membership in our VPN depending on a reseller's interest and capability of providing demand generation, fulfillment, service delivery, and education to customers and prospects. We also have certain resellers, as well as systems integrators, who obtain software licenses and software support directly from VMware. The VPN agreements signed by the resellers carry no obligation to purchase or sell VMware products and can be terminated at any time by either party.
We have a direct sales force that complements our channel partners' efforts. Our sales force works with our channel partners to introduce them to end-user customer accounts and new sales opportunities.
In addition, our channel partner network includes certain systems integrators and resellers trained and certified to deliver consulting services and solutions leveraging VMware products.
We generally do not have long-term contracts or minimum purchase commitments with our distributors, resellers, system vendors and systems integrators, and our contracts with these channel partners do not prohibit them from offering products or services that compete with ours.
We primarily sell our software under perpetual licenses, and our sales contracts generally require end-user customers to purchase maintenance for the first year. Maintenance periods typically range from one to five years. Customers often purchase additional licenses when their initial maintenance period expires and renewals have typically been equal to or longer than the initial maintenance period. Software maintenance and renewals are sold both directly to end-user customers and via our network of channel partners. The majority of professional services are sold directly, with some professional services sold via our channel partners. End-users can obtain licenses to our products through individual discrete purchases to meet their immediate needs or through the adoption of enterprise license agreements ("ELAs"). ELAs are comprehensive volume license offerings that provide for multi-year maintenance and support at discounted prices. ELAs enable us to build long-term relationships with our customers as they commit to VMware's virtual infrastructure solutions in their data centers. Our sales cycle with end-user customers ranges from less than 90 days to over a year depending on several factors, including the size and complexity of the customer's infrastructure.
The competitive landscape in which we operate includes not only other software virtualization vendors, but also traditional hardware solutions. In establishing prices for our products, we take into account, among other factors, the value our products and solutions deliver, and the cost of both alternative virtualization and hardware solutions.
Our marketing efforts focus on communicating the benefits of our solutions and educating our customers, distributors, resellers, system vendors, systems integrators, the media and analysts about the advantages of our innovative virtualization technology.
We raise awareness of our company and brands, market our products, and generate sales leads through industry events, public relations efforts, marketing materials, free downloads and our website. We also have created an online community called VMware Technology Network that enables customers and partners to share and discuss sales and development resources, implementation best practices, and industry trends among other topics. Our annual user conference, VMworld, which is held in both the U.S. and Europe, has grown in attendance each year. We also offer management presentations, seminars, and webinars on our products and topics of virtualization. We believe a combination of these efforts strengthens our brand and enhances our leading market position in our industry.
Our business is subject to seasonality in the sale of our products and services. For example, our fourth quarter revenues are affected by a number of seasonal factors, including fiscal year-end spending trends. Such factors historically have contributed to stronger fourth quarter revenues in any given year. We believe that seasonal factors are common within our industry.
8
Customers
Our customer deployments range in size from a single virtualized server for small businesses to up to thousands of virtual machines for our largest enterprise customers. In periodic third-party surveys commissioned by us, our customers indicate very high satisfaction rates with our products and many have indicated a strong preference for repeat purchases.
During 2010, three distributors, who purchase software licenses and software support from us for resale to end-user customers directly or via resellers, each accounted for over 10% of our worldwide revenues. Arrow Electronics, Inc., Ingram Micro, Inc. and Tech Data Corporation accounted for 13%, 11% and 10%, respectively, of our worldwide revenues in 2010. Our distribution agreements are typically terminable at will by either party upon 30 to 90 days' prior written notice to the other party, and neither party has any obligation to purchase or sell any products under the agreement. No other channel partner accounted for more than 10% of our revenues in 2010.
Competition
The cloud computing and virtualization markets are inter-related and rapidly evolving. We experienced increased competition during 2010 and expect it to significantly intensify in the future. We compete with large and small vendors in different segments of the cloud computing and virtualization markets, and expect new entrants will continue to enter the market and develop technologies that, if commercialized, may compete with our products.
We believe that the key competitive factors in the cloud computing and virtualization markets include:
| • | the level of reliability and new functionality of product offerings; |
| • | the ability to provide comprehensive solutions, including management capabilities; |
| • | the ability to offer products that support multiple hardware platforms, operating systems, applications and application development frameworks; |
| • | the ability to deliver an intuitive end-user experience for accessing data, applications and services from a wide variety of end-user devices; |
| • | a proven track record of formulating and delivering a roadmap of compelling software and service capabilities; |
| • | pricing of products, individually and in bundles; |
| • | the ability to attract and preserve a large installed base of customers; |
| • | the ability to attract and maintain a large number of application developers for a given cloud ecosystem; |
| • | the ability to create and maintain partnering opportunities with hardware vendors, infrastructure software vendors and cloud service providers; |
| • | the ability to develop robust indirect sales channels; and |
| • | the ability to attract and retain cloud, virtualization and systems experts as key employees. |
The cloud computing market is in a high state of flux with both established and new technology companies vying for thought leadership and market share. Currently, Amazon EC2, Microsoft Azure and emerging open source efforts present alternatives to VMware's hybrid cloud computing vision.
Microsoft is also our primary competitor for data center virtualization solutions. In 2010, Microsoft continued to release incremental improvements to its Hyper-V virtualization offering and System Center suite of virtualization management products. Microsoft's offerings are positioned to compete with our virtual infrastructure, virtualization management and some of our free data center product offerings.
9
We also compete with Citrix and its collaborations with Microsoft for end-user computing solutions and with companies whose virtualization products are based on emerging open-source technologies. In addition, we compete with companies that take different approaches to virtualization. Furthermore, our VMware vSphere suites compete with products that provide high availability clustering, workload management and resource management.
We also expect to compete with new entrants to the cloud computing, end-user computing and virtualization markets, which may include parties currently selling our products and/or our current technology partners. Existing and future competitors may introduce products in the same markets we serve or intend to serve, and competing products may have better performance, lower prices, better functionality and broader acceptance than our products. Our competitors may also add features to their cloud computing, end-user computing and virtualization products that are similar to features that presently differentiate our product offerings from theirs. Additionally, some of our competitors may make acquisitions or enter into partnerships or other strategic relationships with one another to offer more comprehensive solutions than those they individually had offered. Some competitors have in the past, and may in the future, take advantage of their existing relationships with our business partners to engage in business practices such as distribution and license restrictions that make our products less attractive to our channel partners and end-users.
Information technology companies are also increasingly seeking to deliver top-to-bottom IT solutions to end-users that combine enterprise-level hardware and software solutions that can offer alternatives to our cloud computing, end-user computing and virtualization platform. In addition, competitors who have existing relationships with our current or prospective end-users could integrate competitive capabilities into their existing products and make them available without additional charge. Many of our current and potential competitors have longer operating histories, greater name recognition, a larger customer base, and significantly greater financial, technical, sales and marketing and other resources than we do.
Overall however, we believe our market position, large virtualization customer base, strong partner network, broad and innovative solutions suite, and platform-agnostic approach position us to compete effectively.
Intellectual Property
As of December 31, 2010, the United States Patent and Trademark Office has issued us more than 100 patents covering various aspects of our server virtualization and other technologies. The granted United States patents will expire beginning in 2018, with the last patent expiring in 2029. We also have numerous pending United States provisional and non-provisional patent applications, and numerous pending foreign and international patent applications, that cover other aspects of our virtualization and other technologies.
We have registered trademarks in the United States for "VMWARE," "VMWORLD," "VMWARE FUSION," "VMWARE VSPHERE," "VMWARE VCLOUD," "SPRINGSOURCE," "HYPERIC," "VMOTION," "ESX," and numerous other trademarks. We have also registered trademarks in a number of foreign countries.
We rely on a combination of patent, trademark, copyright and trade secret laws in the United States and other jurisdictions, as well as confidentiality procedures and contractual provisions to protect our intellectual property rights and our brand.
We enforce our intellectual property rights in the United States and a number of foreign countries. Despite our efforts, the steps we have taken to protect our proprietary rights may not be adequate to preclude misappropriation of our proprietary information or infringement of our intellectual property rights, and our ability to police such misappropriation or infringement is uncertain, particularly in countries outside of the United States. United States patent filings are intended to provide the holder with a right to exclude others from making, using, selling, or importing in the United States the inventions covered by the claims of granted patents.
10
Our granted United States patents, and any future patents (to the extent they are issued), may be contested, circumvented, or invalidated in the future. Moreover, the rights granted under any issued patents may not provide us with proprietary protection or competitive advantages, and we may not be able to prevent third parties from infringing these patents. Therefore, the exact effect of our patents and the other steps we have taken to protect our intellectual property cannot be predicted with certainty.
Employees
As of December 31, 2010, we had approximately 9,000 employees in offices worldwide, less than 5% of which were contracted through EMC. None of our employees are represented by labor unions, and we consider current employee relations to be good.
We contract with EMC to utilize personnel who are dedicated to work for VMware on a full-time basis. These individuals are located in countries in which we do not currently have an operating subsidiary and are predominantly dedicated to our sales and marketing efforts. We use contractors from time to time for temporary assignments and in locations in which we do not currently have operating subsidiaries. In the event that these contractor resources were not available, we do not believe that this would have a material adverse effect on our operations.
Available Information
Our Annual Reports on Form 10-K, Quarterly Reports on Form 10-Q, Current Reports on Form 8-K, and amendments to reports filed or furnished pursuant to Sections 13(a) and 15(d) of the Securities Exchange Act of 1934, as amended (the "Exchange Act"), are made available free of charge on or through our website at www.vmware.com as soon as reasonably practicable after such reports are filed with, or furnished to, the Securities and Exchange Commission (the "SEC"). Copies of (i) the charters for our Audit Committee, Compensation and Corporate Governance Committee, and Mergers and Acquisitions Committee, (ii) our Business Conduct Guidelines (code of business conduct and ethics), and (iii) our Corporate Governance Guidelines are available on the Investor Relations page of our website at www.vmware.com. We periodically webcast company announcements, product launch events and executive presentations which can be viewed via our Investor Relations website. Additionally, we may provide notifications from time to time of material news including SEC filings, investor events, press releases and corporate blogs on our Investor Relations website. The contents of these web sites are not intended to be incorporated by reference into this report or in any other report or document we file. None of the information posted on or accessible through our website is incorporated by reference into this Annual Report on Form 10-K.
Unless the context requires otherwise, we are referring to VMware, Inc. when we use the terms "VMware," the "Company," "we," "our" or "us."
| ITEM 1A. | RISK FACTORS |
The risk factors that appear below could materially affect our business, financial condition and results of operations. The risks and uncertainties described below are not the only risks and uncertainties facing us. Our business is also subject to general risks and uncertainties that affect many other companies.
Risks Related to Our Business
The virtualization and cloud computing products and services we sell are now increasingly targeted at emerging applications and therefore the potential market for our products remains uncertain.
Our products and services are based on computer virtualization and related technologies that have primarily been used for virtualizing on-premises data centers. We are also designing our products and services for use in emerging applications as a platform for cloud computing and end-user computing. Cloud computing applications for our products and services include infrastructure-as-a-service, or "IaaS," platform-as-a-service, or "PaaS," and
11
software-as-a-service, or "SaaS". Our success depends on organizations and customers perceiving technological and operational benefits and cost savings associated with the increasing adoption of virtual infrastructure solutions for on-premises data centers as well as for cloud computing and end-user computing. Although the use of virtualization technologies on servers and in on-premises data centers has gained acceptance for enterprise-level applications, the extent to which adoption of virtualization for cloud computing and end-user computing remains uncertain. As the markets for our products mature and the scale of our business increases, the rate of growth in our product sales will likely be lower than those we have experienced in earlier periods. In addition, to the extent that virtualization infrastructure solutions are adopted more slowly or less comprehensively than we expect, our revenue growth rates may slow materially or our revenue may decline substantially.
We expect to face increasing competition that could result in a loss of customers, reduced revenues or decreased operating margins.
The cloud computing, virtualization and end-user markets are inter-related and rapidly evolving, and we expect competition to significantly intensify in the future. For example, Microsoft continues to make incremental improvements to its virtual infrastructure and virtual management products. Microsoft also has cloud-based computing offerings. We also face competition from other companies that have announced a number of new product initiatives, alliances and consolidation efforts. For example, Citrix Systems continues to enhance its end-user and server virtualization offerings and now has a client hypervisor in the market. IBM, Google and Amazon have announced new cloud computing initiatives. Red Hat has also released commercial versions of Linux that have virtualization capabilities as part of the Linux kernel ("KVM"). Other companies have also indicated their intention to expand offerings of virtual management and cloud computing solutions.
We believe that the key competitive factors in the virtualization and cloud computing markets include:
| • | the level of reliability and new functionality of product offerings; |
| • | the ability to provide comprehensive solutions, including management capabilities; |
| • | the ability to provide end-users access to their applications and data from multiple devices and through multiple content delivery mechanisms; |
| • | the ability to offer products that support multiple hardware platforms and operating systems; |
| • | the proven track record of formulating and delivering a roadmap of virtualization and cloud computing capabilities; |
| • | competitive pricing of products, individually and in bundles; |
| • | the ability to attract and preserve a large installed base of customers; |
| • | the ability to attract and preserve a large number of application developers to develop to a given cloud ecosystem; |
| • | the ability to create and maintain partnering opportunities with hardware vendors, infrastructure software vendors and cloud service providers; |
| • | the ability to develop robust indirect sales channels; and |
| • | the ability to attract and retain cloud, virtualization and systems experts as key employees. |
Existing and future competitors may introduce products in the same markets we serve or intend to serve, and competing products may have better performance, lower prices, better functionality and broader acceptance than our products. Our competitors may also add features to their virtualization, end-user and cloud computing products similar to features that presently differentiate our product offerings from theirs. Many of our current or potential competitors also have longer operating histories, greater name recognition, larger customer bases and significantly greater financial, technical, sales, marketing and other resources than we do. This competition could result in increased pricing pressure and sales and marketing expenses, thereby materially reducing our operating
12
margins, and could harm our ability to increase, or cause us to lose, market share. Increased competition also may prevent us from entering into or renewing service contracts on terms similar to those that we currently offer and may cause the length of our sales cycle to increase. Some of our competitors and potential competitors supply a wide variety of products to, and have well-established relationships with, our current and prospective end-users. For example, small to medium sized businesses and companies in emerging markets that are evaluating the adoption of virtualization-based technologies and solutions may be inclined to consider Microsoft solutions because of their existing use of Windows and Office products. Some of these competitors have in the past and may in the future take advantage of their existing relationships to engage in business practices that make our products less attractive to our end-users. Other competitors have limited or denied support for their applications running in VMware virtualization environments. These distribution, licensing and support restrictions, as well as other business practices that may be adopted in the future by our competitors, could materially impact our prospects regardless of the merits of our products. In addition, competitors with existing relationships with our current or prospective end-users could in the future integrate competitive capabilities into their existing products and make them available without additional charge. For example, Oracle provides free server virtualization software intended to support Oracle and non-Oracle applications, and Microsoft offers its own server virtualization software packaged with its Windows Server product and may offer built-in virtualization for future releases of the client version of Windows. By engaging in such business practices, our competitors can diminish competitive advantages we may possess by incentivizing end-users to choose products that lack some of the technical advantages of our own offerings.
We also face potential competition from our partners. For example, third parties currently selling our products could build and market their own competing products and services or market competing products and services of third parties. If we are unable to compete effectively, our growth and our ability to sell products at profitable margins could be materially and adversely affected.
Ongoing uncertainty regarding global economic conditions and the stability of regional financial markets may reduce information technology spending below current expectations and therefore adversely impact our revenues, impede end-user adoption of new products and product upgrades and adversely impact our competitive position.
Our business depends on the overall demand for information technology and on the economic health of our current and prospective customers. The purchase of our products is often discretionary and may involve a significant commitment of capital and other resources. Weak economic conditions or significant uncertainty regarding the stability of financial markets could adversely impact our business, financial condition and results of operations in a number of ways, including by lengthening sales cycles, affecting the size of enterprise license agreements ("ELAs") that customers will commit to, lowering prices for our products and services, reducing unit sales, reducing the rate of adoption of our products by new customers and the willingness of current customers to purchase upgrades to our existing products.
Ongoing economic uncertainty has also resulted in general and ongoing tightening in the credit markets, lower levels of liquidity, increases in the rates of default and bankruptcy and significant volatility in the credit, equity and fixed income markets. As a result, current or potential customers may be unable to fund software purchases, which could cause them to delay, decrease or cancel purchases of our products and services. Even if customers are willing to purchase our products and services, if they do not meet our credit requirements, we may not be able to record accounts receivable or unearned revenue or recognize revenues from these customers until we receive payment, which could adversely affect the amount of revenues we are able to recognize in a particular period.
In addition, although we plan to continue making strategic investments in our business, many of our competitors have significantly greater financial, technical and other resources than we do, and if the economic recovery is anemic or not sustained, they may be better positioned to continue investment in competitive technologies.
13
Industry alliances or consolidation may result in increased competition.
Some of our competitors have made acquisitions or entered into partnerships or other strategic relationships to offer more comprehensive virtualization and cloud computing solutions than they individually had offered. For example, in 2010, Red Hat acquired Makara, a developer of PaaS solutions, and Citrix acquired VMLogix, a developer of lab management solutions that can be applied to cloud computing. Citrix Systems continues to work in close collaboration with Microsoft in the desktop virtualization market. Moreover, information technology companies are increasingly seeking to deliver top-to-bottom IT solutions to end-users that combine enterprise-level hardware and software solutions to provide an alternative to our virtualization platform. For example, in early 2010, Oracle completed its acquisition of Sun Microsystems, which was both a hardware vendor and a provider of virtualization technology, and Microsoft and Hewlett-Packard announced a collaboration based on Microsoft's cloud computing and virtualization platforms. We expect these trends to continue as companies attempt to strengthen or maintain their market positions in the evolving virtualization infrastructure and enterprise IT solutions industry. Many of the companies driving this trend have significantly greater financial, technical and other resources than we do and may be better positioned to acquire and offer complementary products and technologies. The companies and alliances resulting from these possible combinations may create more compelling product offerings and be able to offer greater pricing flexibility than we can or may engage in business practices that make it more difficult for us to compete effectively, including on the basis of price, sales and marketing programs (such as providing greater incentives to our channel partners to sell a competitor's product), technology or product functionality. This competition could result in a substantial loss of customers or a reduction in our revenues.
Our operating results may fluctuate significantly, which makes our future results difficult to predict and may result in our operating results falling below expectations or our guidance, which could cause the price of our Class A common stock to decline.
Our operating results may fluctuate due to a variety of factors, many of which are outside of our control. As a result, comparing our operating results on a period-to-period basis may not be meaningful. Our past results should not be relied upon as an indication of our future performance. In addition, a significant portion of our quarterly sales typically occurs during the last month of the quarter, which we believe generally reflects customer buying patterns for enterprise technology. As a result, our quarterly operating results are difficult to predict even in the near term. If our revenues or operating results fall below the expectations of investors or securities analysts or below any guidance we may provide to the market, the price of our Class A common stock would likely decline substantially.
In addition, factors that may affect our operating results include, among others:
| • | general economic conditions in our domestic and international markets and the effect that these conditions have on our customers' capital budgets and the availability of funding for software purchases; |
| • | fluctuations in demand, adoption rates, sales cycles and pricing levels for our products and services; |
| • | fluctuations in foreign currency exchange rates; |
| • | changes in customers' budgets for information technology purchases and in the timing of their purchasing decisions; |
| • | the timing of recognizing revenues in any given quarter, which, as a result of software revenue recognition policies, can be affected by a number of factors, including product announcements, beta programs and product promotions that can cause revenue recognition of certain orders to be deferred until future products to which customers are entitled become available; |
| • | the sale of our products in the time frames we anticipate, including the number and size of orders in each quarter; |
14
| • | our ability to develop, introduce and ship in a timely manner new products and product enhancements that meet customer demand, certification requirements and technical requirements; |
| • | the timing of the announcement or release of upgrades or new products by us or by our competitors; |
| • | our ability to maintain scalable internal systems for reporting, order processing, license fulfillment, product delivery, purchasing, billing and general accounting, among other functions; |
| • | our ability to control costs, including our operating expenses; |
| • | changes to our effective tax rate; |
| • | the increasing scale of our business and its effect on our ability to maintain historical rates of growth; |
| • | our ability to attract and retain highly skilled employees, particularly those with relevant experience in software development and sales; |
| • | our ability to conform to emerging industry standards and to technological developments by our competitors and customers; |
| • | renewal rates for ELAs as original ELA terms expire; |
| • | the timing and amount of software development costs that are capitalized beginning when technological feasibility has been established and ending when the product is available for general release; |
| • | unplanned events that could affect market perception of the quality or cost-effectiveness of our products and solutions; and |
| • | the recoverability of benefits from goodwill and intangible assets and the potential impairment of these assets. |
If operating system and hardware vendors do not cooperate with us or we are unable to obtain early access to their new products, or access to certain information about their new products to ensure that our solutions interoperate with those products, our product development efforts may be delayed or foreclosed.
Our products interoperate with Windows, Linux and other operating systems and the hardware devices of numerous manufacturers. Developing products that interoperate properly requires substantial partnering, capital investment and employee resources, as well as the cooperation of the vendors or developers of the operating systems and hardware. Operating system and hardware vendors may not provide us with early access to their technology and products, assist us in these development efforts or share with or sell to us any application programming interfaces, or APIs, formats, or protocols we may need. If they do not provide us with the necessary early access, assistance or proprietary technology on a timely basis, we may experience product development delays or be unable to expand our products into other areas. To the extent that software or hardware vendors develop products that compete with ours or those of our controlling stockholder, EMC, they may have an incentive to withhold their cooperation, decline to share access or sell to us their proprietary APIs, protocols or formats or engage in practices to actively limit the functionality, or compatibility, and certification of our products. To the extent that we enter into collaborations or joint development and marketing arrangements with certain hardware and software vendors, vendors who compete with our collaborative partners may similarly choose to limit their cooperation with us. In addition, hardware or operating system vendors may fail to certify or support or continue to certify or support our products for their systems. If any of the foregoing occurs, our product development efforts may be delayed or foreclosed and our business and results of operations may be adversely affected.
Our new product and technology initiatives subject us to additional business, legal and competitive risks.
Over the last several years, we have introduced new product and technology initiatives that aim to leverage our virtualization infrastructure software products into the emerging areas of cloud computing and end-user computing as alternatives to the provisioning of physical computing resources. In connection with our September
15
2009 acquisition of SpringSource, we announced our intention to use SpringSource solutions to extend VMware's strategy to deliver solutions in the emerging PaaS market and have since, also acquired GemFire and RabbitMQ as part of VMware's overall PaaS strategy. Additionally, SpringSource's current offerings and their underlying open source technology position us in the enterprise and web application development and management markets. Our February 2010 acquisition of Zimbra extended our footprint to cloud-based email and collaboration services-a part of VMware's strategy to extend into the emerging SaaS market. We also recently announced our vCenter family of products to more fully manage virtualized and cloud environments, which may cause us to compete with other virtualization management vendors.
These initiatives may present new and difficult technology challenges, end-users may choose not to adopt our new product or service offerings, and we may be subject to claims if customers of these offerings experience service disruptions or failures, security breaches or other quality issues. Further, the success of these new offerings depends upon the cooperation of hardware, software and cloud hosting vendors to ensure interoperability with our products and offer compatible products and services to end-users.
The cloud computing and end-user computing markets are in early stages of development. Other companies seeking to enter and develop competing standards for the cloud computing market, such as Microsoft, IBM, Oracle, Google and Amazon, and the end-user computing market, such as Citrix and Microsoft, have introduced or are likely to introduce their own initiatives that may compete with or not be compatible with our cloud and end-user computing initiatives which could limit the degree to which other vendors develop products and services around our offerings and end-users adopt our platforms. Additionally, our operating margins in our newer initiatives may be lower than those we have achieved in the markets we currently serve, we will need to develop appropriate pricing strategies for our new product initiatives and we may not be successful enough in these newer activities to recoup our investments in them. If any of this were to occur, it could damage our reputation, limit our growth and negatively affect our operating results.
We rely on distributors, resellers, system vendors and systems integrators to sell our products, and our failure to effectively develop, manage or prevent disruptions to our distribution channels and the processes and procedures that support them could cause a reduction in the number of end-users of our products.
Our future success is highly dependent upon maintaining and increasing the number of our relationships with distributors, resellers, system vendors and systems integrators. Because we rely on distributors, resellers, system vendors and systems integrators, we may have little or no contact with the ultimate users of our products, thereby making it more difficult for us to establish brand awareness, ensure proper delivery and installation of our products, service ongoing customer requirements, estimate end-user demand and respond to evolving customer needs.
Recruiting and retaining qualified channel partners and training them in the use of our technology and product offerings requires significant time and resources. In order to develop and expand our distribution channel, we must continue to expand and improve our processes and procedures that support our channel, including our investment in systems and training, and those processes and procedures may become increasingly complex and difficult to manage. The time and expense required for sales and marketing organizations of our channel partners to become familiar with our product offerings, including our new product developments, may make it more difficult to introduce those products to end-users and delay end-user adoption of our product offerings.
We generally do not have long-term contracts or minimum purchase commitments with our distributors, resellers, system vendors and systems integrators, and our contracts with these channel partners do not prohibit them from offering products or services that compete with ours. Our competitors may be effective in providing incentives to existing and potential channel partners to favor products of our competitors or to prevent or reduce sales of our products. Certain system vendors now offer competing virtualization products preinstalled on their server products. Additionally, our competitors could attempt to require key distributors to enter into exclusivity
16
arrangements with them or otherwise apply their pricing or marketing leverage to discourage distributors from offering our products. Accordingly, our channel partners may choose not to offer our products exclusively or at all. Our failure to maintain and increase the number of relationships with channel partners would likely lead to a loss of end-users of our products which would result in us receiving lower revenues from our channel partners. Three of our distributors each accounted for more than 10% of revenues in fiscal year 2010, and we have experienced similar concentrations in prior years. Our agreements with distributors are typically terminable by either party upon 90 days' prior written notice to the other party, and neither party has any obligation to purchase or sell any products under the agreements. While we believe that we have in place, or would have in place by the date of any such termination, agreements with replacement distributors sufficient to maintain our revenues from distribution, if we were to lose the distribution services of a significant distributor, such loss could have a negative impact on our results of operations until such time as we arrange to replace these distribution services with the services of existing or new distributors.
The concentration of our product sales among a limited number of distributors and the weakness in credit markets increases our potential credit risk. Additionally, weakness in credit markets could affect the ability of our distributors, resellers and customers to comply with the terms of credit we provide in the ordinary course of business. Accordingly, if our distributors, resellers and customers find it difficult to obtain credit or comply with the terms of their credit obligations, it could cause significant fluctuations or declines in our product revenues.
Three of our distributors each accounted for more than 10% of revenues in fiscal year 2010, and we have experienced similar concentrations in prior years. We anticipate that sales of our products to a limited number of distributors will continue to account for a significant portion of our total product revenues for the foreseeable future. The concentration of product sales among certain distributors increases our potential credit risks. For example, approximately 42% of our total accounts receivable as of December 31, 2010 was from three distributors. Some of our distributors may experience financial difficulties, which could adversely impact our collection of accounts receivable. One or more of these distributors could delay payments or default on credit extended to them. Our exposure to credit risks of our distributors may increase if our distributors and their customers are adversely affected by the global economic downturn, or if there is a continuation or worsening of the downturn. Additionally, we provide credit to distributors, resellers, and certain end-user customers in the normal course of business. Credit is generally extended to new customers based upon a credit evaluation. Credit is extended to existing customers based on ongoing credit evaluations, prior payment history, and demonstrated financial stability. Any significant delay or default in the collection of significant accounts receivable could result in an increased need for us to obtain working capital from other sources, possibly on worse terms than we could have negotiated if we had established such working capital resources prior to such delays or defaults. Any significant default could result in a negative impact on our results of operations.
The large majority of our revenues have come from our data center virtualization products including our flagship VMware vSphere product line. Decreases in demand for our data center virtualization products could adversely affect our results of operations and financial condition.
In fiscal year 2010, approximately 80% of our license revenues were from our data center virtualization and infrastructure solutions with the balance from our other solutions. Although we are continuing to develop other applications for our virtualization technology such as our cloud computing and end-user computing products, we expect that our data center virtualization products and related enhancements and upgrades will constitute a majority of our revenue for the foreseeable future. Declines and variability in demand for our data center virtualization products could occur as a result of:
| • | improved products or product versions being offered by competitors in our markets; |
| • | competitive pricing pressures; |
| • | failure to release new or enhanced versions of our data center virtualization products on a timely basis, or at all; |
17
| • | technological change that we are unable to address with our data center virtualization products; or |
| • | general economic conditions. |
Additionally, as more and more businesses achieve the virtualization of their data centers and other IT functions, the market for our VMware vSphere product line may become saturated. If we fail to introduce compelling new features in future upgrades to our VMware vSphere product line or develop new applications for our virtualization technology, demand for VMware vSphere may decline.
Due to our product concentration, our business, results of operations, financial condition, and cash flows would therefore be adversely affected by a decline in demand for our data center virtualization products.
Our revenues, collection of accounts receivable and financial results may be adversely impacted by fluctuation of foreign currency exchange rates. Although foreign currency hedges can offset some of the risk related to foreign currency fluctuations, we will continue to experience foreign currency gains and losses in certain instances where it is not possible or cost effective to hedge our foreign currency exposures.
Our revenues and our collection of accounts receivable may be adversely impacted as a result of fluctuations in the exchange rates between the U.S. Dollar and foreign currencies. For example, we have distributors in foreign countries that may incur higher costs in periods when the value of the U.S. Dollar strengthens against foreign currencies. One or more of these distributors could delay payments or default on credit extended to them as a result. Any significant delay or default in the collection of significant accounts receivable could result in an increased need for us to obtain working capital from other sources. If we determine that the amount of accounts receivable to be uncollectible is greater than our estimates, we would recognize an increase in bad debt expense, which would have a negative impact on our results of operations. In addition, in periods when the value of the U.S. Dollar strengthens, we may need to offer additional discounts, reduce prices or offer other incentives to mitigate the negative effect on demand.
Since the second quarter of 2009, we have invoiced and collected in certain non-U.S. Dollar denominated currencies, thereby conducting a portion of our revenue transactions in currencies other than the U.S. Dollar. Although this program may alleviate credit risk from our distributors during periods when the U.S. Dollar strengthens, it shifts the risk of currency fluctuations to us and may negatively impact our revenues, anticipated cash flows and financial results due to fluctuations in foreign currency exchange rates, particularly the Euro, the British Pound, the Japanese Yen and the Australian Dollar relative to the U.S. Dollar. While variability in operating margin may be reduced due to invoicing in certain of the local currencies in which we also recognize expenses, increased exposure to foreign currency fluctuations will introduce additional risk for variability in revenue-related components of our consolidated financial statements.
Since July 2009, we have entered into foreign currency forward contracts to hedge a portion of our net outstanding monetary assets and liabilities against movements in certain foreign exchange rates. Although we expect the gains and losses on our foreign currency forward contracts to generally offset the majority of the gains and losses associated with the underlying foreign-currency denominated assets and liabilities that we hedge, our hedging transactions may not yield the results we expect. Additionally, we expect to continue to experience foreign currency gains and losses in certain instances where it is not possible or cost effective to hedge our foreign currency exposures.
We are dependent on our management and our key development personnel, and the loss of key personnel may prevent us from implementing our business plan in a timely manner.
Our success depends largely upon the continued services of our existing management. We are also substantially dependent on the continued service of our key development personnel for product innovation. We generally do not have employment or non-compete agreements with our existing management or development personnel and, therefore, they could terminate their employment with us at any time without penalty and could
18
pursue employment opportunities with any of our competitors. Changes to management and key employees can also lead to additional unplanned losses of key employees. The loss of key employees could seriously harm our ability to release new products on a timely basis and could significantly help our competitors.
Because competition for our target employees is intense, we may not be able to attract and retain the highly skilled employees we need to support our planned growth, and our compensation expenses may increase.
To execute on our strategy, we must attract and retain highly qualified personnel. Competition for these personnel is intense, especially for senior sales executives and engineers with high levels of experience in designing and developing software. We may not be successful in attracting and retaining qualified personnel. We have from time to time in the past experienced, and we expect to continue to experience in the future, difficulty in hiring and retaining highly skilled employees with appropriate qualifications. Many of the companies with which we compete for experienced personnel have greater resources than we have. In addition, in making employment decisions, particularly in the high-technology industry, job candidates often consider the value of the stock options, restricted stock grants or other stock-based compensation they are to receive in connection with their employment. Declines in the value of our stock could adversely affect our ability to attract or retain key employees and result in increased employee compensation expenses. If we fail to attract new personnel or fail to retain and motivate our current personnel, our business and future growth prospects could be severely harmed.
If we are unable to protect our intellectual property rights, our competitive position could be harmed or we could be required to incur significant expenses to enforce our rights.
We depend on our ability to protect our proprietary technology. We rely on trade secret, patent, copyright and trademark laws and confidentiality agreements with employees and third parties, all of which offer only limited protection. As such, despite our efforts, the steps we have taken to protect our proprietary rights may not be adequate to preclude misappropriation of our proprietary information or infringement of our intellectual property rights, and our ability to police such misappropriation or infringement is uncertain, particularly in countries outside of the United States. Further, with respect to patent rights, we do not know whether any of our pending patent applications will result in the issuance of patents or whether the examination process will require us to narrow our claims. To the extent that additional patents are issued from our patent applications, which are not certain, they may be contested, circumvented or invalidated in the future. Moreover, the rights granted under any issued patents may not provide us with proprietary protection or competitive advantages, and, as with any technology, competitors may be able to develop similar or superior technologies to our own now or in the future. In addition, we rely on confidentiality or license agreements with third parties in connection with their use of our products and technology. There is no guarantee that such parties will abide by the terms of such agreements or that we will be able to adequately enforce our rights, in part because we rely on "click-wrap" and "shrink-wrap" licenses in some instances.
Detecting and protecting against the unauthorized use of our products, technology and proprietary rights is expensive, difficult and, in some cases, impossible. Litigation may be necessary in the future to enforce or defend our intellectual property rights, to protect our trade secrets or to determine the validity and scope of the proprietary rights of others. Such litigation could result in substantial costs and diversion of management resources, either of which could harm our business, financial condition and results of operations, and there is no guarantee that we would be successful. Furthermore, many of our current and potential competitors have the ability to dedicate substantially greater resources to protecting their technology or intellectual property rights than we do. Accordingly, despite our efforts, we may not be able to prevent third parties from infringing upon or misappropriating our intellectual property, which could result in a substantial loss of our market share.
We provide access to our hypervisor and other selected source code to partners, which creates additional risk that our competitors could develop products that are similar or better than ours.
Our success and ability to compete depend substantially upon our internally developed technology, which is incorporated in the source code for our products. We seek to protect the source code, design code, documentation
19
and other information relating to our software, under trade secret and copyright laws. However, we have chosen to provide access to our hypervisor and other selected source code to more than 50 of our partners for co-development, as well as for open APIs, formats and protocols. Though we generally control access to our source code and other intellectual property, and enter into confidentiality or license agreements with such partners, as well as with our employees and consultants, our safeguards may be insufficient to protect our trade secrets and other rights to our technology. Our protective measures may be inadequate, especially because we may not be able to prevent our partners, employees or consultants from violating any agreements or licenses we may have in place or abusing their access granted to our source code. Improper disclosure or use of our source code could help competitors develop products similar to or better than ours.
We are, and may in the future be, subject to claims by others that we infringe their proprietary technology which could force us to pay damages or prevent us from using certain technology in our products.
Companies in the software and technology industries own large numbers of patents, copyrights, trademarks, and trade secrets and frequently enter into litigation based on allegations of infringement or other violations of intellectual property rights. This risk may increase as the number of products and competitors in our market increases and overlaps occur. In addition, as a well known information technology company, we face a higher risk of being the subject of intellectual property infringement claims. Any claim of infringement by a third party, even one without merit, could cause us to incur substantial costs defending against the claim, and could distract our management from our business. Furthermore, a party making such a claim, if successful, could secure a judgment that requires us to pay substantial damages. A judgment could also include an injunction or other court order that could prevent us from offering our products. In addition, we might be required to seek a license for the use of such intellectual property, which may not be available on commercially reasonable terms or at all. Alternatively, we may be required to develop non-infringing technology, which could require significant effort and expense and may ultimately not be successful. Any of these events could seriously harm our business, operating results and financial condition. Third parties may also assert infringement claims against our customers and channel partners. Any of these claims could require us to initiate or defend potentially protracted and costly litigation on their behalf, regardless of the merits of these claims, because we generally indemnify our customers and channel partners from claims of infringement of proprietary rights of third parties in connection with the use of our products. If any of these claims succeed, we may be forced to pay damages on behalf of our customers or channel partners, which could negatively affect our results of operations.
Our use of "open source" software could negatively affect our ability to sell our products and subject us to possible litigation.
A significant portion of the products or technologies acquired, licensed or developed by us may incorporate so-called "open source" software, and we may incorporate open source software into other products in the future. Additionally, open source technology underlies the offerings of SpringSource and Zimbra, businesses we have acquired since 2009. Such open source software is generally licensed by its authors or other third parties under open source licenses, including, for example, the GNU General Public License, the GNU Lesser General Public License, "Apache-style" licenses, "BSD-style" licenses and other open source licenses. We monitor our use of open source software in an effort to avoid subjecting our products to conditions we do not intend. Although we believe that we have complied with our obligations under the various applicable licenses for open source software that we use, there is little or no legal precedent governing the interpretation of many of the terms of certain of these licenses, and therefore the potential impact of these terms on our business is somewhat unknown and may result in unanticipated obligations regarding our products and technologies. For example, we may be subjected to certain conditions, including requirements that we offer our products that use the open source software for no cost, that we make available source code for modifications or derivative works we create based upon incorporating, using or distributing the open source software and/or that we license such modifications or derivative works under the terms of the particular open source license. Any of these obligations could have an adverse impact on our intellectual property rights and our ability to derive revenue from products incorporating the open source software.
20
If an author or other third party that distributes such open source software were to allege that we had not complied with the conditions of one or more of these licenses, we could be required to incur significant legal expenses defending against such allegations. If our defenses were not successful, we could be subject to significant damages, enjoined from the distribution of our products that contained the open source software and required to comply with the foregoing conditions, which could disrupt the distribution and sale of some of our products. In addition, if we combine our proprietary software with open source software in a certain manner, under some open source licenses we could be required to release the source code of our proprietary software, which could substantially help our competitors develop products that are similar to or better than ours.
In addition to risks related to license requirements, usage of open source software can lead to greater risks than use of third party commercial software, as open source licensors generally do not provide warranties or assurance of title or controls on origin of the software. In addition, many of the risks associated with usage of open source such as the lack of warranties or assurances of title, cannot be eliminated, and could, if not properly addressed, negatively affect our business. We have established processes to help alleviate these risks, including a review process for screening requests from our development organizations for the use of open source and conducting appropriate due diligence of the use of open source in the products developed by companies we acquire, but we cannot be sure that all open source software is submitted for approval prior to use in our products or is discovered during due diligence.
The product offerings from our recent acquisitions, SpringSource and Zimbra, rely upon and incorporate open source software technologies that subject us to additional risks and challenges, which could result in increased development expenses, delays or disruptions to the release or distribution of those software solutions, and increased competition.
In September 2009, we completed our acquisition of SpringSource and, in February 2010, we completed our acquisition of Zimbra. Each is a software business that broadly uses open source in its software solutions. Software solutions that are substantially or mostly based on open source software subject us to a number of risks and challenges:
| • | If open source software programmers, most of whom we do not employ, do not continue to develop and enhance open source technologies, our development expenses could be increased and our product release and upgrade schedules could be delayed. |
| • | One of the characteristics of open source software is that anyone can modify the existing software or develop new software that competes with existing open source software. As a result, competition can develop without the degree of overhead and lead time required by traditional proprietary software companies. It is also possible for new competitors with greater resources than ours to develop their own open source solutions, potentially reducing the demand for, and putting price pressure on, our solutions. |
| • | It is possible that a court could hold that the licenses under which our open source products are developed and licensed are not enforceable or that someone could assert a claim for proprietary rights in a program developed and distributed under them. Any ruling by a court that these licenses are not enforceable, or that open source components of our product offerings may not be liberally copied, modified or distributed, may have the effect of preventing us from distributing or developing all or a portion of our products. In addition, licensors of open source software employed in our offerings may, from time to time, modify the terms of their license agreements in such a manner that those license terms may no longer be compatible with other open source licenses in our offerings or our end-user license agreement, and thus could, among other consequences, prevent us from continuing to distribute the software code subject to the modified license. |
| • | Actions to protect and maintain ownership and control over our intellectual property could adversely affect our standing in the open source community, which in turn could limit our ability to continue to rely on this community, upon which we are dependent, as a resource to help develop and improve our open source products. |
21
If we are unable to successfully address the challenges of integrating products based upon open source technology into our business, our ability to realize revenues from such products will be negatively affected and our development costs may increase.
Our sales cycles can be long and unpredictable, our sales efforts require considerable time and expense and timing of sales is subject to changing purchasing behaviors of our customers. As a result, our sales are difficult to predict and may vary substantially from quarter to quarter, which may cause our operating results to fluctuate significantly.
The timing of our revenues is difficult to predict. Our sales efforts involve educating our customers about the use and benefit of our products, including their technical capabilities, potential cost savings to an organization and advantages compared to lower-cost products offered by our competitors. Customers typically undertake a significant evaluation process that has in the past resulted in a lengthy sales cycle which typically lasts several months, and may last a year or longer. We spend substantial time, effort and money on our sales efforts without any assurance that our efforts will produce any sales. In addition, product purchases are frequently subject to budget constraints, multiple approvals, and unplanned administrative, processing and other delays. Moreover, the greater number of competitive alternatives, as well as announcements by our competitors that they intend to introduce competitive alternatives at some point in the future, can lengthen customer procurement cycles, cause us to spend additional time and resources to educate end-users on the advantages of our product offerings and delay product sales. These factors can have a particular impact on the timing and length of our ELA sales cycles.
Additionally, our quarterly sales have historically reflected an uneven pattern in which a disproportionate percentage of a quarter's total sales occur in the last month, weeks and days of each quarter. Similarly, our yearly sales have historically reflected a disproportionate percentage of the year's sales in the fourth fiscal quarter. These patterns make prediction of revenues, earnings and working capital for each financial period especially difficult and uncertain and increase the risk of unanticipated variations in financial condition and results of operations. We believe this uneven sales pattern is a result of many factors including the following:
| • | the tendency of customers to wait until late in a quarter to commit to a purchase in the hope of obtaining more favorable pricing; |
| • | the fourth quarter influence of customers spending their remaining capital budget authorization prior to new budget constraints in the first nine months of the following year; and |
| • | seasonal influences. |
If sales expected from a specific customer for a particular quarter are not realized in that quarter or at all, our results could fall short of public expectations and our business, financial condition and results of operations could be materially adversely affected.
Our current research and development efforts may not produce significant revenues for several years, if at all.
Developing our products is expensive. Our investment in research and development may not result in marketable products or may result in products that take longer to generate revenues, or generate less revenues, than we anticipate. Our research and development expenses were over 20% of our total revenues, in each of fiscal year 2010 and 2009. Our future plans include significant investments in software research and development and related product opportunities. We believe that we must continue to dedicate a significant amount of resources to our research and development efforts to maintain our competitive position. However, we may not receive significant revenues from these investments for several years, if at all.
We may not be able to respond to rapid technological changes with new solutions and services offerings, which could have a material adverse effect on our sales and profitability.
The markets for our software solutions are characterized by rapid technological changes, changing customer needs, frequent new software product introductions and evolving industry standards. The introduction of third-
22
party solutions embodying new technologies and the emergence of new industry standards could make our existing and future software solutions obsolete and unmarketable. We may not be able to develop updated products that keep pace with technological developments and emerging industry standards and that address the increasingly sophisticated needs of our customers or that interoperate with new or updated operating systems and hardware devices or certify our products to work with these systems and devices. As a result, we may not be able to accurately predict the lifecycle of our software solutions, and they may become obsolete before we receive the amount of revenues that we anticipate from them. There is no assurance that any of our new offerings would be accepted in the marketplace. Significant reductions in server-related costs or the rise of more efficient infrastructure management software could also affect demand for our software solutions. As hardware and processors become more powerful, we will have to adapt our product and service offerings to take advantage of the increased capabilities. For example, while the introduction of more powerful servers presents an opportunity for us to provide better products for our customers, the migration of servers to quad-core and greater multi-core microprocessor technology also allows an end-user with a given number of licensed copies of our software to more than double the number of virtualization machines run per server socket without having to purchase additional licenses from us. If any of the foregoing events were to occur, our ability to retain or increase market share and revenues in the virtualization software market could be materially adversely affected.
Our success depends upon our ability to develop new products and services, integrate acquired products and services and enhance our existing products and services and develop appropriate business and pricing models.
If we are unable to develop new products and services, integrate acquired products and services, enhance and improve our products and support services in a timely manner or position and/or price our products and services to meet market demand, customers may not buy new software licenses from us or renew software license updates and product support. In addition, information technology standards from both consortia and formal standards-setting forums as well as de facto marketplace standards are rapidly evolving. We cannot provide any assurance that the standards on which we choose to develop new products will allow us to compete effectively for business opportunities in emerging areas such as cloud computing.
New product development and introduction involves a significant commitment of time and resources and is subject to a number of risks and challenges including:
| • | managing the length of the development cycle for new products and product enhancements, which has frequently been longer than we originally expected; |
| • | managing customers' transitions to new products, which can result in delays in their purchasing decisions; |
| • | adapting to emerging and evolving industry standards and to technological developments by our competitors and customers; |
| • | entering into new or unproven markets with which we have limited experience; |
| • | tailoring our business and pricing models appropriately as we enter new markets and respond to competitive pressures and technological changes; |
| • | incorporating and integrating acquired products and technologies; and |
| • | developing or expanding efficient sales channels. |
In addition, if we cannot adapt our business models to keep pace with industry trends, our revenues could be negatively impacted. For example, if we increase our adoption of subscription-based pricing models for our products, we may fail to set pricing at levels appropriate to maintain our revenue streams or our customers may choose to deploy products from our competitors that they believe are priced more favorably.
23
Our ability to sell our products is dependent on the quality of our support and services offerings, and our failure to offer high-quality support and services could have a material adverse effect on our sales and results of operations.
Once our products are integrated within our customers' hardware and software systems, our customers may depend on our support organization to resolve any issues relating to our products. A high level of support is critical for the successful marketing and sale of our products. If we or our channel partners do not effectively assist our customers in deploying our products, succeed in helping our customers quickly resolve post-deployment issues, and provide effective ongoing support, our ability to sell our products to existing customers would be adversely affected, and our reputation with potential customers could be harmed. If our customers with ELAs have a poor perception of our support and services offerings, they may choose not to renew their ELAs when they expire. In addition, as we expand our operations internationally, our support organization will face additional challenges, including those associated with delivering support, training and documentation in languages other than English. As a result, our failure to maintain high-quality support and services, or to adequately assist our channel partners in providing high-quality support and services, could result in customers choosing to use our competitors' products instead of ours in the future.
Acquisitions could disrupt our business, cause dilution to our stockholders and harm our business, financial condition and results of operations.
We have in the past and plan in the future to acquire other businesses, products or technologies. For example, since September 2009 we have completed a number of acquisitions, including acquisitions of SpringSource, Zimbra, certain assets from EMC's Ionix division and Integrien. We may not be able to find suitable acquisition candidates, and we may not be able to complete acquisitions on favorable terms, if at all. If we do complete acquisitions, we may not ultimately strengthen our competitive position or achieve our goals, or they may be viewed negatively by customers, financial markets or investors.
Acquisitions may disrupt our ongoing operations, divert management from day-to-day responsibilities, increase our expenses and adversely impact our business, financial condition and results of operations. An acquired business may not deliver the expected results. For example, an acquisition may not further our strategies or results in expected benefits, which may include benefits relating to enhanced revenues, technology, human resources, cost savings, operating efficiencies and other synergies. Acquisitions may reduce our cash available for operations and other uses and could result in an increase in amortization expense related to identifiable intangible assets acquired, potentially dilutive issuances of equity securities or the incurrence of debt.
Additionally, we have limited historical experience with the integration of acquired companies. There can be no assurance that we will be able to manage the integration of acquired businesses effectively or be able to retain and motivate key personnel from these businesses. Any difficulties we encounter in the integration process could divert management from day-to-day responsibilities, increase our expenses and have a material adverse effect on our business, financial condition and results of operations. We may also face difficulties due to the lack of experience in new markets, products or technologies or the initial dependence on unfamiliar supply or distribution partners. Other risks related to acquisitions include the assumption of the liabilities of the acquired business, including litigation-related liabilities.
In addition, we review our amortizable intangible assets annually for impairment, or more frequently, when events or changes in circumstances indicate the carrying value may not be recoverable, and we are required to test goodwill for impairment at least annually. We may be required to record a significant charge to earnings in our financial statements during the period in which any impairment of our goodwill or amortizable intangible assets resulting from an acquisition or otherwise is determined, resulting in an adverse impact on our results of operations. In addition to the risks commonly encountered in the acquisition of a business as described above, we may also experience risks relating to the challenges and costs of closing a transaction. Further, the risks described above may be exacerbated as a result of managing multiple acquisitions at the same time. We also seek to invest
24
in businesses that offer complementary products, services or technologies. These investments are accompanied by risks similar to those encountered in an acquisition of a business.
Operating in foreign countries subjects us to additional risks that may harm our ability to increase or maintain our international sales and operations.
Revenues from customers outside the United States comprised approximately 49% of our total revenues in both fiscal year 2010 and 2009. We have sales, administrative, research and development and technical support personnel in numerous countries worldwide. We expect to continue to add personnel in additional countries. Our international operations subject us to a variety of risks, including:
| • | the difficulty of managing and staffing international offices and the increased travel, infrastructure and legal compliance costs associated with multiple international locations; |
| • | increased exposure to foreign currency exchange rate risk; |
| • | difficulties in enforcing contracts and collecting accounts receivable, and longer payment cycles, especially in emerging markets; |
| • | difficulties in delivering support, training and documentation in certain foreign markets; |
| • | tariffs and trade barriers and other regulatory or contractual limitations on our ability to sell or develop our products in certain foreign markets; |
| • | economic or political instability and security concerns in countries that are important to our international sales and operations; |
| • | the overlap of different tax structures or changes in international tax laws; |
| • | reduced protection for intellectual property rights, including reduced protection from software piracy in some countries; |
| • | difficulties in transferring funds from certain countries; and |
| • | difficulties in maintaining appropriate controls relating to revenue recognition practices. |
Additionally, as we continue to expand our business globally, we will need to maintain compliance with legal and regulatory requirements covering the foreign activities of U.S. corporations, such as export control requirements and the Foreign Corrupt Practices Act. Our success will depend, in large part, on our ability to anticipate and effectively manage these and other risks associated with our international operations. We expect a significant portion of our growth to occur in foreign countries, which can add to the difficulties in maintaining adequate management and compliance systems and internal controls over financial reporting and increase challenges in managing an organization operating in various countries.
Our failure to manage any of these risks successfully could negatively affect our reputation, harm our operations and reduce our international sales.
Our products are highly technical and may contain errors, defects or security vulnerabilities which could cause harm to our reputation and adversely affect our business.
Our products are highly technical and complex and, when deployed, have contained and may contain errors, defects or security vulnerabilities. Some errors in our products may only be discovered after a product has been installed and used by customers. Any errors, defects or security vulnerabilities discovered in our products after commercial release could result in loss of revenues or delay in revenue recognition, loss of customers and increased service and warranty cost, any of which could adversely affect our business, financial condition and results of operations. Undiscovered vulnerabilities in our products could expose them to hackers or other unscrupulous third parties who develop and deploy viruses, worms, and other malicious software programs that could attack our products. Actual or perceived security vulnerabilities in our products could harm our reputation and lead some customers to return products, to reduce or delay future purchases or use competitive products.
25
End-users, who rely on our products and services for the interoperability of enterprise servers and applications that are critical to their information systems, may have a greater sensitivity to product errors and security vulnerabilities than customers for software products generally. Any security breaches could lead to interruptions, delays and data loss and protection concerns. In addition, we could face claims for product liability, tort or breach of warranty, including claims relating to changes to our products made by our channel partners. Our contracts with customers contain provisions relating to warranty disclaimers and liability limitations, which may not be upheld and customers and channel partners may seek indemnification from us for their losses and those of their customers. Defending a lawsuit, regardless of its merit, is costly and time-consuming and may divert management's attention and adversely affect the market's perception of us and our products. In addition, if our business liability insurance coverage proves inadequate or future coverage is unavailable on acceptable terms or at all; our business, financial condition and results of operations could be adversely impacted.
If we fail to maintain an effective system of internal controls, we may not be able to accurately report our financial results or prevent fraud. As a result, our stockholders could lose confidence in our financial reporting, which could harm our business and the trading price of our Class A common stock.
We have complied with Section 404 of the Sarbanes-Oxley Act of 2002 by assessing, strengthening and testing our system of internal controls. Even though we concluded our system of internal controls was effective as of December 31, 2010, we need to continue to maintain our processes and systems and adapt them to changes as our business changes and we rearrange management responsibilities and reorganize our business accordingly. We may seek to automate certain processes to improve efficiencies and better ensure ongoing compliance but such automation may itself disrupt existing internal controls and introduce unintended vulnerability to error or fraud. This continuous process of maintaining and adapting our internal controls and complying with Section 404 is expensive and time-consuming, and requires significant management attention. We cannot be certain that our internal control measures will continue to provide adequate control over our financial processes and reporting and ensure compliance with Section 404. Furthermore, as our business changes and as we expand through acquisitions of other companies, our internal controls may become more complex and we will require significantly more resources to ensure our internal controls overall remain effective. Failure to implement required new or improved controls, or difficulties encountered in their implementation, could harm our operating results or cause us to fail to meet our reporting obligations. If we or our independent registered public accounting firm identify material weaknesses, the disclosure of that fact, even if quickly remedied, could reduce the market's confidence in our financial statements and harm our stock price. In addition, if we are unable to continue to comply with Section 404, our non-compliance could subject us to a variety of administrative sanctions, including the suspension or delisting of our Class A common stock from the New York Stock Exchange and the inability of registered broker-dealers to make a market in our Class A common stock, which could reduce our stock price.
Problems with our information systems could interfere with our business, and our website may be subject to intentional disruption that could adversely impact our operations.
We rely on our information systems and those of third parties for processing customer orders, delivery of products, providing services and support to our customers, billing and tracking our customers, fulfilling contractual obligations, and otherwise running our business. Any disruption in our information systems and those of the third parties upon whom we rely could have a significant impact on our business. In addition, we continuously work to enhance our information systems. The implementation of these types of enhancements is frequently disruptive to the underlying business of an enterprise, which may especially be the case for us due to the size and complexity of our business. Any disruptions relating to our systems enhancements, particularly any disruptions impacting our operations during the implementation period, could adversely affect our business in a number of respects. Even if we do not encounter these adverse effects, the implementation of these enhancements may be much more costly than we anticipated. If we are unable to successfully implement the information systems enhancements as planned, our financial position, results of operations, and cash flows could be negatively impacted.
26
Additionally, experienced computer programmers may attempt to penetrate our network security or the security of our website and misappropriate proprietary information and/or cause interruptions of our services. Because the techniques used by such computer programmers to access or sabotage networks change frequently and may not be recognized until launched against a target, we may be unable to anticipate these techniques. The theft and/or unauthorized use or publication of our trade secrets and other confidential business information as a result of such an event could adversely affect our competitive position, reputation, brand and future sales of our products and our customers may assert claims against us related to resulting losses of confidential or proprietary information. Our business could be subject to significant disruption, and we could suffer monetary and other losses and reputational harm, in the event of such incidents and claims.
If we fail to manage future growth effectively, we may not be able to meet our customers' needs or be able to meet our future reporting obligations.
We have rapidly expanded our operations since inception and anticipate further expansion in the future. This future growth, if it occurs, will place significant demands on our management, infrastructure and other resources. Additionally, further international growth may occur in regions where we presently have little or no infrastructure. To manage any future growth, we will need to hire, integrate and retain highly skilled and motivated employees. We will also need to continue to improve our financial and management controls, reporting and operational systems and procedures. If we do not effectively manage our growth, we may not be able to meet our customers' needs, thereby adversely affecting our sales, or be able to meet our future reporting obligations.
Our financial results may be adversely impacted by higher than expected tax rates, and we may have exposure to additional tax liabilities.
As a multinational corporation, we are subject to income taxes as well as non-income based taxes, in both the United States and various foreign jurisdictions. Our domestic and international tax liabilities are subject to the allocation of revenues and expenses in different jurisdictions and the timing of recognizing revenues and expenses. Additionally, the amount of income taxes paid is subject to our interpretation of applicable tax laws in the jurisdictions in which we file and changes to tax laws. Significant judgment is required in determining our worldwide provision for income taxes and other tax liabilities. From time to time, we are subject to income tax audits. While we believe we have complied with all applicable income tax laws, there can be no assurance that a governing tax authority will not have a different interpretation of the law and assess us with additional taxes. Should we be assessed with additional taxes, there could be a material adverse effect on our financial condition or results of operations.
Our future effective tax rate may be affected by such factors as changes in tax laws, regulations or rates, changing interpretation of existing laws or regulations, the impact of accounting for stock-based compensation, the impact of accounting for business combinations, changes in our international organization, and changes in overall levels of income before tax.
For example, during 2010, the IRS announced and finalized Schedule UTP, Uncertain Tax Positions Statement. This schedule is an annual disclosure of certain federal UTPs, ranked in order of magnitude, to be included in corporate tax filings for U.S. federal income tax purposes. According to the IRS, the disclosure is to include "a concise description of the tax position, including a description of the relevant facts affecting the tax treatment of the position and information that reasonably can be expected to apprise the Service of the identity of the tax position." As a result of this additional disclosure requirement, the amount of taxes paid could increase.
Also, in December 2010, H.R. 4853, Tax Relief, Unemployment Insurance Reauthorization, and the Job Creation Act of 2010, which included an extension of a number of expired tax provisions, took effect retroactively to 2010 and prospectively through 2011. Among the extended tax provisions was the U.S. Federal R&D tax credit, which provides a significant reduction in our effective tax rate. The renewal of this credit beyond 2011 is uncertain.
27
In addition, in the ordinary course of our global business, there are many intercompany transactions and calculations where the ultimate tax determination is uncertain. Although we believe that our tax estimates are reasonable, we cannot ensure that the final determination of tax audits or tax disputes will not be different from what is reflected in our historical income tax provisions and accruals.
We are also subject to non-income taxes, such as payroll, sales, use, value-added, net worth, property and goods and services taxes, in both the United States and various foreign jurisdictions. We are under audit from time to time by tax authorities with respect to these non-income taxes and may have exposure to additional non-income tax liabilities.
Our business is subject to the risks of earthquakes, fire, floods and other natural catastrophic events such as pandemics, and to interruption by man-made problems, such as computer viruses, unanticipated disruptions in local infrastructure or terrorism, which could result in delays or cancellations of customer orders or the deployment of our products.
Our corporate headquarters are located in the San Francisco Bay Area, a region known for seismic activity. A significant natural disaster, such as an earthquake, fire, flood or other act of God, could have a material adverse impact on our business, financial condition and results of operations. As we continue to grow internationally, increasing amounts of our business will be located in foreign countries that may be more subject to political or social instability that could disrupt operations. In addition, our servers are vulnerable to computer viruses, break-ins and similar disruptions from unauthorized tampering with our computer systems. Unanticipated disruptions in services provided through localized physical infrastructure, such as utility or telecommunication outages, can curtail the functioning of local offices as well as critical components of our information systems and adversely affect our ability to process orders, respond to customer requests and maintain local and global business continuity. Furthermore, acts of terrorism or war could cause disruptions in our or our customers' business or the economy as a whole and disease pandemics could temporarily sideline a substantial part of our or our customers' workforce at any particular time. To the extent that such disruptions result in delays or cancellations of customer orders, or the deployment of our products, our revenues would be adversely affected.
Our business is subject to a variety of U.S. and international laws regarding data protection.
Our business is subject to federal, state and international laws regarding privacy and protection of user data. We post, on our website, our privacy policies and practices concerning the use and disclosure of user data. Any failure by us to comply with our posted privacy policies or other federal, state or international privacy-related or data protection laws and regulations could result in proceedings against us by governmental entities or others which could have a material adverse effect on our business, results of operations and financial condition.
It is possible that these laws may be interpreted and applied in a manner that is inconsistent with our data practices. If so, in addition to the possibility of fines and penalties, a governmental order requiring that we change our data practices could result, which in turn could have a material adverse effect on our business. Compliance with these regulations may involve significant costs or require changes in business practices that result in reduced revenue. Noncompliance could result in penalties being imposed on us or we could be ordered to cease conducting the noncompliant activity.
Additionally, our virtualization technology is used by cloud computing vendors, and we have expanded our involvement in the delivery and provision of cloud computing through business alliances with various providers of cloud computing services and software and expect to continue to do so in the future. The application of U.S. and international data privacy laws to cloud computing vendors is uncertain, and our existing contractual provisions may prove to be inadequate to protect us from claims for data loss or regulatory noncompliance made against cloud computing providers who we may partner with. Accordingly, the failure to comply with data protection laws and regulations by our customers and business partners who provide cloud computing services could have a material adverse effect on our business.
28
If we fail to comply with our customer contracts or government contracting regulations, our business could be adversely affected.
Our contracts with our customers may include unique and specialized performance requirements. In particular, our contracts with federal, state, and local and non-U.S. governmental customers are subject to various procurements regulations, contract provisions and other requirements relating to their formation, administration and performance. Any failure by us to comply with provisions in our customer contracts or any violation of government contracting regulations could result in the imposition of various civil and criminal penalties, which may include termination of contracts, forfeiture of profits, suspension of payments and, in the case of our government contracts, fines and suspension from future government contracting. Further, any negative publicity related to our customer contracts or any proceedings surrounding them, regardless of its accuracy, may damage our business and affect our ability to compete for new contracts. If our customer contracts are terminated, if we are suspended from government work, or if our ability to compete for new contracts is adversely affected, we could suffer an adverse affect on our business, operating results or financial condition.
Changes in accounting principles and guidance, or their interpretation, could result in unfavorable accounting charges or effects, including changes to our previously-filed financial statements, which could cause our stock price to decline.
We prepare our consolidated financial statements in accordance with accounting principles generally accepted in the United States of America. These principles are subject to interpretation by the SEC and various bodies formed to interpret and create appropriate accounting principles and guidance. A change in these principles or guidance, or in their interpretations, may have a significant effect on our reported results and retroactively affect previously reported results.
Risks Related to Our Relationship with EMC
As long as EMC controls us, other holders of our Class A common stock will have limited ability to influence matters requiring stockholder approval.
As of December 31, 2010, EMC owned 33,012,000 shares of our Class A common stock and all 300,000,000 shares of our Class B common stock, representing approximately 80% of the total outstanding shares of common stock or 97% of the voting power of outstanding common stock. The holders of our Class A common stock and our Class B common stock have identical rights, preferences and privileges except with respect to voting and conversion rights, the election of directors, certain actions that require the consent of holders of Class B common stock and other protective provisions as set forth in our certificate of incorporation. Holders of our Class B common stock are entitled to 10 votes per share of Class B common stock on all matters except for the election of our Group II directors, in which case they are entitled to one vote per share, and the holders of our Class A common stock are entitled to one vote per share of Class A common stock. The holders of Class B common stock, voting separately as a class, are entitled to elect 80% of the total number of directors on our board of directors that we would have if there were no vacancies on our board of directors at the time. These are our Group I directors. Subject to any rights of any series of preferred stock to elect directors, the holders of Class A common stock and the holders of Class B common stock, voting together as a single class, are entitled to elect our remaining directors, which at no time will be less than one director-our Group II director(s). Accordingly, the holders of our Class B common stock currently are entitled to elect 7 of our 8 directors.
If EMC transfers shares of our Class B common stock to any party other than a successor-in-interest or a subsidiary of EMC prior to a distribution to its stockholders under Section 355 of the Internal Revenue Code of 1986, as amended, (a "355 distribution"), those shares will automatically convert into Class A common stock. Additionally, if, prior to a 355 distribution, EMC's ownership falls below 20% of the outstanding shares of our common stock, all outstanding shares of Class B common stock will automatically convert to Class A common stock. Following a 355 distribution, shares of Class B common stock may convert to Class A common stock if such conversion is approved by VMware stockholders after the 355 distribution. For so long as EMC or its
29
successor-in-interest beneficially owns shares of our common stock representing at least a majority of the votes entitled to be cast by the holders of outstanding voting stock, EMC will be able to elect all of the members of our board of directors.
In addition, until such time as EMC or its successor-in-interest beneficially owns shares of our common stock representing less than a majority of the votes entitled to be cast by the holders of outstanding voting stock, EMC will have the ability to take stockholder action without the vote of any other stockholder and without having to call a stockholder meeting, and holders of our Class A common stock will not be able to affect the outcome of any stockholder vote during this period. As a result, EMC will have the ability to control all matters affecting us, including:
| • | the composition of our board of directors and, through our board of directors, any determination with respect to our business plans and policies; |
| • | any determinations with respect to mergers, acquisitions and other business combinations; |
| • | our acquisition or disposition of assets; |
| • | our financing activities; |
| • | certain changes to our certificate of incorporation; |
| • | changes to the agreements we entered into in connection with our transition to becoming a public company; |
| • | corporate opportunities that may be suitable for us and EMC; |
| • | determinations with respect to enforcement of rights we may have against third parties, including with respect to intellectual property rights; |
| • | the payment of dividends on our common stock; and |
| • | the number of shares available for issuance under our stock plans for our prospective and existing employees. |
Our certificate of incorporation and the master transaction agreement entered into between us and EMC in connection with our initial public offering ("IPO") also contain provisions that require that as long as EMC beneficially owns at least 20% or more of the outstanding shares of our common stock, the prior affirmative vote or written consent of EMC (or its successor-in-interest) as the holder of the Class B common stock is required (subject in each case to certain exceptions) in order to authorize us to:
| • | consolidate or merge with any other entity; |
| • | acquire the stock or assets of another entity in excess of $100 million; |
| • | issue any stock or securities except to our subsidiaries or pursuant to our employee benefit plans; |
| • | establish the aggregate annual amount of shares we may issue in equity awards; |
| • | dissolve, liquidate or wind us up; |
| • | declare dividends on our stock; |
| • | enter into any exclusive or exclusionary arrangement with a third party involving, in whole or in part, products or services that are similar to EMC's; and |
| • | amend, terminate or adopt any provision inconsistent with certain provisions of our certificate of incorporation or bylaws. |
If EMC does not provide any requisite consent allowing us to conduct such activities when requested, we will not be able to conduct such activities and, as a result, our business and our operating results may be harmed. EMC's voting control and its additional rights described above may discourage transactions involving a change
30
of control of us, including transactions in which holders of our Class A common stock might otherwise receive a premium for their shares over the then-current market price. EMC is not prohibited from selling a controlling interest in us to a third party and may do so without the approval of the holders of our Class A common stock and without providing for a purchase of any shares of Class A common stock held by persons other than EMC. Accordingly, shares of Class A common stock may be worth less than they would be if EMC did not maintain voting control over us nor have the additional rights described above.
In the event EMC is acquired or otherwise undergoes a change of control, any acquirer or successor will be entitled to exercise the voting control and contractual rights of EMC, and may do so in a manner that could vary significantly from EMC's historic practice.
By becoming a stockholder in our company, holders of our Class A common stock are deemed to have notice of and have consented to the provisions of our certificate of incorporation and the master transaction agreement with respect to the limitations that are described above.
Our business and that of EMC overlap, and EMC may compete with us, which could reduce our market share.
EMC and we are both IT infrastructure companies providing products related to storage management, back-up, disaster recovery, security, system management and automation, provisioning and resource management. There can be no assurance that EMC will not engage in increased competition with us in the future. In addition, the intellectual property agreement that we have entered into with EMC provides EMC the ability to use our source code and intellectual property, which, subject to limitations, it may use to produce certain products that compete with ours. EMC's rights in this regard extend to its majority-owned subsidiaries, which could include joint ventures where EMC holds a majority position and one or more of our competitors hold minority positions.
EMC could assert control over us in a manner which could impede our growth or our ability to enter new markets or otherwise adversely affect our business. Further, EMC could utilize its control over us to cause us to take or refrain from taking certain actions, including entering into relationships with channel, technology and other marketing partners, enforcing our intellectual property rights or pursuing corporate opportunities or product development initiatives that could adversely affect our competitive position, including our competitive position relative to that of EMC in markets where we compete with them. In addition, EMC maintains significant partnerships with certain of our competitors, including Microsoft.
EMC's competition in certain markets may affect our ability to build and maintain partnerships.
Our existing and potential partner relationships may be affected by our relationship with EMC. We partner with a number of companies that compete with EMC in certain markets in which EMC participates. EMC's majority ownership in us might affect our ability to effectively partner with these companies. These companies may favor our competitors because of our relationship with EMC.
EMC competes with certain of our significant channel, technology and other marketing partners, including IBM and Hewlett-Packard. Pursuant to our certificate of incorporation and other agreements that we have with EMC, EMC may have the ability to impact our relationship with those of our partners that compete with EMC, which could have a material adverse effect on our results of operations or our ability to pursue opportunities which may otherwise be available to us.
In order to preserve the ability for EMC to distribute its shares of our Class B common stock on a tax-free basis, we may be prevented from pursuing opportunities to raise capital, to effectuate acquisitions or to provide equity incentives to our employees, which could hurt our ability to grow.
Beneficial ownership of at least 80% of the total voting power is required in order for EMC to affect a tax-free spin-off of VMware or certain other tax-free transactions. We have agreed that for so long as EMC or its
31
successor-in-interest continues to own greater than 50% of the voting control of our outstanding common stock, we will not knowingly take or fail to take any action that could reasonably be expected to preclude EMC's or its successor-in-interest's ability to undertake a tax-free spin-off. Additionally, under our certificate of incorporation and the master transaction agreement we entered into with EMC, we must obtain the consent of EMC or its successor-in-interest, as the holder of our Class B common stock, to issue stock or other VMware securities, excluding pursuant to employee benefit plans (provided that we obtain Class B common stockholder approval of the aggregate annual number of shares to be granted under such plans), which could cause us to forgo capital raising or acquisition opportunities that would otherwise be available to us. As a result, we may be precluded from pursuing certain growth initiatives.
Third parties may seek to hold us responsible for liabilities of EMC, which could result in a decrease in our income.
Third parties may seek to hold us responsible for EMC's liabilities. Under our master transaction agreement with EMC, EMC will indemnify us for claims and losses' relating to liabilities related to EMC's business and not related to our business. However, if those liabilities are significant and we are ultimately held liable for them, we cannot be certain that we will be able to recover the full amount of our losses from EMC.
Although we have entered into a tax sharing agreement with EMC under which our tax liabilities effectively will be determined as if we were not part of any consolidated, combined or unitary tax group of EMC Corporation and/or its subsidiaries, we nonetheless could be held liable for the tax liabilities of other members of these groups.
We have historically been included in EMC's consolidated group for U.S. federal income tax purposes, as well as in certain consolidated, combined or unitary groups that include EMC Corporation and/or certain of its subsidiaries for state and local income tax purposes. Pursuant to our tax sharing agreement with EMC, we and EMC generally will make payments to each other such that, with respect to tax returns for any taxable period in which we or any of our subsidiaries are included in EMC's consolidated group for U.S. federal income tax purposes or any other consolidated, combined or unitary group of EMC Corporation and/or its subsidiaries, the amount of taxes to be paid by us will be determined, subject to certain adjustments, as if we and each of our subsidiaries included in such consolidated, combined or unitary group filed our own consolidated, combined or unitary tax return.
We have been included in the EMC consolidated group for U.S. federal income tax purposes since our acquisition by EMC, and expect to continue to be included in such consolidated group for periods in which EMC owns at least 80% of the total voting power and value of our outstanding stock. Each member of a consolidated group during any part of a consolidated return year is jointly and severally liable for tax on the consolidated return of such year and for any subsequently determined deficiency thereon. Similarly, in some jurisdictions, each member of a consolidated, combined or unitary group for state, local or foreign income tax purposes is jointly and severally liable for the state, local or foreign income tax liability of each other member of the consolidated, combined or unitary group. Accordingly, for any period in which we are included in the EMC consolidated group for U.S. federal income tax purposes or any other consolidated, combined or unitary group of EMC Corporation and/or its subsidiaries, we could be liable in the event that any income tax liability was incurred, but not discharged, by any other member of any such group.
Any inability to resolve favorably any disputes that arise between us and EMC with respect to our past and ongoing relationships may result in a significant reduction of our revenues and earnings.
Disputes may arise between EMC and us in a number of areas relating to our ongoing relationships, including:
| • | labor, tax, employee benefit, indemnification and other matters arising from our separation from EMC; |
| • | employee retention and recruiting; |
32
| • | business combinations involving us; |
| • | our ability to engage in activities with certain channel, technology or other marketing partners; |
| • | sales or dispositions by EMC of all or any portion of its ownership interest in us; |
| • | the nature, quality and pricing of services EMC has agreed to provide us; |
| • | arrangements with third parties that are exclusionary to EMC; |
| • | business opportunities that may be attractive to both EMC and us; and |
| • | product or technology development or marketing activities or customer agreements which may require the consent of EMC. |
We may not be able to resolve any potential conflicts, and even if we do, the resolution may be less favorable than if we were dealing with an unaffiliated party.
The agreements we enter into with EMC may be amended upon agreement between the parties. While we are controlled by EMC, we may not have the leverage to negotiate amendments to these agreements if required on terms as favorable to us as those we would negotiate with an unaffiliated third party.
Some of our directors own EMC common stock, restricted shares of EMC common stock and/ or equity awards to acquire EMC common stock and hold management positions with EMC, which could cause conflicts of interests that result in our not acting on opportunities we otherwise may have.
Some of our directors own EMC common stock and/or equity awards to purchase EMC common stock. In addition, some of our directors are executive officers and/or directors of EMC, and EMC, as the sole holder of our Class B common stock, is entitled to elect 7 of our 8 directors. Ownership of EMC common stock, restricted shares of EMC common stock and equity awards to purchase EMC common stock by our directors and the presence of executive officers or directors of EMC on our board of directors could create, or appear to create, conflicts of interest with respect to matters involving both us and EMC that could have different implications for EMC than they do for us. Provisions of our certificate of incorporation and the master transaction agreement between EMC and us address corporate opportunities that are presented to our directors or officers that are also directors or officers of EMC. There can be no assurance that the provisions in our certificate of incorporation or the master transaction agreement will adequately address potential conflicts of interest or that potential conflicts of interest will be resolved in our favor or that we will be able to take advantage of corporate opportunities presented to individuals who are officers or directors of both us and EMC. As a result, we may be precluded from pursuing certain growth initiatives.
EMC's ability to control our board of directors may make it difficult for us to recruit independent directors.
So long as EMC beneficially owns shares of our common stock representing at least a majority of the votes entitled to be cast by the holders of outstanding voting stock, EMC can effectively control and direct our board of directors. Further, the interests of EMC and our other stockholders may diverge. Under these circumstances, persons who might otherwise accept our invitation to join our board of directors may decline.
We are a "controlled company" within the meaning of the New York Stock Exchange rules and, as a result, are relying on exemptions from certain corporate governance requirements that provide protection to stockholders of companies that are not "controlled companies."
EMC owns more than 50% of the total voting power of our common shares and, as a result, we are a "controlled company" under the New York Stock Exchange corporate governance standards. As a controlled company, we are exempt under the New York Stock Exchange standards from the obligation to comply with certain New York Stock Exchange corporate governance requirements, including the requirements:
| • | that a majority of our board of directors consists of independent directors; |
33
| • | that we have a corporate governance and nominating committee that is composed entirely of independent directors with a written charter addressing the committee's purpose and responsibilities; |
| • | that we have a compensation committee that is composed entirely of independent directors with a written charter addressing the committee's purpose and responsibilities; and |
| • | for an annual performance evaluation of the nominating and governance committee and compensation committee. |
While we have voluntarily caused our Compensation and Corporate Governance Committee to currently be composed entirely of independent directors in compliance with the requirements of the New York Stock Exchange, we are not required to maintain the independent composition of the committee. As a result of our use of the "controlled company" exemptions, holders of our Class A common stock will not have the same protection afforded to stockholders of companies that are subject to all of the New York Stock Exchange corporate governance requirements.
Our historical financial information as a business segment of EMC may not be representative of our results as an independent public company.
The historical financial information covering the periods prior to our IPO in August 2007 included in our Annual Report on Form 10-K for the fiscal year ended December 31, 2010 does not necessarily reflect what our financial position, results of operations or cash flows would have been had we been an independent entity during those historical periods. The historical costs and expenses reflected in our consolidated financial statements prior to 2008 include an allocation for certain corporate functions historically provided by EMC, including tax, accounting, treasury, legal and human resources services. Although we have transitioned most of these corporate functions to VMware personnel, in certain geographic regions where we do not have an established legal entity, we contract with EMC subsidiaries for support services and EMC employees who are managed by VMware personnel. The costs incurred by EMC on VMware's behalf related to these employees include a mark-up intended to approximate costs that would have been charged had we contracted for such services with an unrelated third party. These costs have been charged by EMC and are included as expenses in our consolidated statements of income. Our historical financial information is not necessarily indicative of what our financial position, results of operations or cash flows will be in the future if and when we contract at arm's-length with independent third parties for the services we have received and currently receive from EMC. For additional information, see "Management's Discussion and Analysis of Financial Condition and Results of Operations" and our historical consolidated financial statements and notes thereto.
Risks Related to Owning Our Class A Common Stock
Our Class A common stock has only been publicly traded since August 14, 2007 and the price of our Class A common stock has fluctuated substantially since then and may fluctuate substantially in the future.
Our Class A common stock has only been publicly traded since our IPO on August 14, 2007. The trading price of our Class A common stock has fluctuated significantly since then. For example, between January 1, 2010 and January 31, 2011, the closing trading price of our Class A common stock was very volatile, ranging between $41.58 and $97.00 per share. Our trading price could fluctuate substantially in the future due to the factors discussed in this Risk Factors section and elsewhere in this Annual Report on Form 10-K.
Substantial amounts of Class A common stock are held by our employees, EMC and Cisco, and all of the shares of our Class B common stock, which may be converted to Class A common stock upon request of the holder, are held by EMC. Shares of Class A common stock held by EMC (including shares of Class A common stock that might be issued upon the conversion of Class B common stock) are eligible for sale subject to the volume, manner of sale and other restrictions of Rule 144 of the Securities Act of 1933, as amended (the "Securities Act"), which allows the holder to sell up to the greater of 1% of our outstanding Class A common stock or our four-week average weekly trading volume during any three-month period and following the
34
expiration of their contractual restrictions. Additionally, EMC possesses registration rights with respect to the shares of our common stock that it holds. If EMC chooses to exercise such rights, its sale of the shares that are registered would not be subject to the Rule 144 limitations. If a significant amount of the shares that become eligible for resale enter the public trading markets in a short period of time, the market price of our Class A common stock may decline.
Additionally, broad market and industry factors may decrease the market price of our Class A common stock, regardless of our actual operating performance. The stock market in general and technology companies in particular, also have often experienced extreme price and volume fluctuations. In addition, in the past, following periods of volatility in the overall market and the market price of a company's securities, securities class action litigation has often been instituted, including against us, and, if not resolved swiftly, can result in substantial costs and a diversion of management's attention and resources.
If securities or industry analysts cease publishing research or reports about us, our business or our market, or if they change their recommendations regarding our stock adversely, our stock price and trading volume could decline.
The trading market for our Class A common stock will be influenced by the research and reports that industry or securities analysts may publish about us, our business, our market or our competitors. If any of the analysts who may cover us change their recommendation regarding our stock adversely, or provide more favorable relative recommendations about our competitors, our stock price would likely decline. If any analyst who may cover us were to cease coverage of our company or fail to regularly publish reports on us, we could lose visibility in the financial markets, which in turn could cause our stock price or trading volume to decline.
Delaware law and our certificate of incorporation and bylaws contain anti-takeover provisions that could delay or discourage takeover attempts that stockholders may consider favorable.
Provisions in our certificate of incorporation and bylaws will have the effect of delaying or preventing a change of control or changes in our management. These provisions include the following:
| • | the division of our board of directors into three classes, with each class serving for a staggered three-year term, which would prevent stockholders from electing an entirely new board of directors at any annual meeting; |
| • | the right of the board of directors to elect a director to fill a vacancy created by the expansion of the board of directors; |
| • | following a 355 distribution of Class B common stock by EMC to its stockholders, the restriction that a beneficial owner of 10% or more of our Class B common stock may not vote in any election of directors unless such person or group also owns at least an equivalent percentage of Class A common stock or obtains approval of our board of directors prior to acquiring beneficial ownership of at least 5% of Class B common stock; |
| • | the prohibition of cumulative voting in the election of directors or any other matters, which would otherwise allow less than a majority of stockholders to elect director candidates; |
| • | the requirement for advance notice for nominations for election to the board of directors or for proposing matters that can be acted upon at a stockholders' meeting; |
| • | the ability of the board of directors to issue, without stockholder approval, up to 100,000,000 shares of preferred stock with terms set by the board of directors, which rights could be senior to those of common stock; and |
| • | in the event that EMC or its successor-in-interest no longer owns shares of our common stock representing at least a majority of the votes entitled to be cast in the election of directors, stockholders may not act by written consent and may not call special meetings of the stockholders. |
35
Until such time as EMC or its successor-in-interest ceases to beneficially own 20% or more of the outstanding shares of our common stock, the affirmative vote or written consent of the holders of a majority of the outstanding shares of the Class B common stock will be required to:
| • | amend certain provisions of our bylaws or certificate of incorporation; |
| • | make certain acquisitions or dispositions; |
| • | declare dividends, or undertake a recapitalization or liquidation; |
| • | adopt any stockholder rights plan, "poison pill" or other similar arrangement; |
| • | approve any transactions that would involve a merger, consolidation, restructuring, sale of substantially all of our assets or any of our subsidiaries or otherwise result in any person or entity obtaining control of us or any of our subsidiaries; or |
| • | undertake certain other actions. |
In addition, we have elected to apply the provisions of Section 203 of the Delaware General Corporation Law. These provisions may prohibit large stockholders, in particular those owning 15% or more of our outstanding voting stock, from merging or combining with us. These provisions in our certificate of incorporation and bylaws and under Delaware law could discourage potential takeover attempts and could reduce the price that investors might be willing to pay for shares of our common stock.
Intel's and Cisco's relationship with us and the membership on our board of individuals proposed by Intel and Cisco may create actual or potential conflicts of interest.
As a result of an investment by Intel Capital in our Class A common stock in August 2007, Intel had a one-time right to designate a director acceptable to our board of directors for an initial term of service. Pursuant to that right, we appointed an Intel executive to our board of directors. Cisco, pursuant to its purchase of our Class A common stock from EMC, also has an ownership relationship with us, and we appointed an executive officer of Cisco (since retired from Cisco) proposed by Cisco as one of our directors. Neither Intel nor Cisco has an ongoing right to designate a director for our board. However, each of the directors initially proposed by them continues to serve on our board. These relationships may create actual or potential conflicts of interest and the best interests of Intel or Cisco may not reflect the best interests of other holders of our Class A common stock.
| ITEM 1B. | UNRESOLVED STAFF COMMENTS |
None.
36
| ITEM 2. | PROPERTIES |
As of December 31, 2010, we owned or leased the facilities described below:
Location | Approximate Sq. Ft.* | Principal Use(s) | ||||||||
Palo Alto, CA |
| owned: leased: |
|
| 462,000 427,000 |
| Executive and administrative offices, sales and marketing, R&D, and data center | |||
North and Latin American region (excluding Palo Alto, CA) | leased: | 534,000 | ** | Administrative offices, sales and marketing, R&D, and data center | ||||||
Asia Pacific region | leased: | 346,000 | Administrative offices, sales and marketing, R&D and data center | |||||||
Europe, Middle East and Africa region | leased: | 295,000 | Administrative offices, sales and marketing, and R&D | |||||||
| * | Of the total square feet leased, approximately 73,000 square feet were under construction as of December 31, 2010. |
| ** | Includes leased space for a Washington data center facility, for which VMware is considered to be the owner for accounting purposes. |
We believe that our current facilities are suitable for our current employee headcount and will sustain us through 2011, but we intend to add new facilities or expand existing facilities as we add employees and expand our operations. We believe that suitable additional or substitute space will be available as needed to accommodate expansion of our operations.
| ITEM 3. | LEGAL PROCEEDINGS |
VMware is named from time to time as a party to lawsuits in the normal course of its business. In such cases it is our policy to defend against such claims, or if considered appropriate, negotiate a settlement on commercially reasonable terms. However, no assurance can be given that we will be able to negotiate settlements on commercially reasonable terms, or at all, or that any litigation resulting from such claims would not have a material adverse effect on our consolidated results of operations, financial position, and cash flows, or consolidated financial statements taken as a whole.
37
EXECUTIVE OFFICERS OF THE REGISTRANT
The names of executive officers and their ages as of February 20, 2011, are as follows:
Name | Age | Position(s) | ||||
Paul A. Maritz | 55 | Chief Executive Officer and Director | ||||
Carl M. Eschenbach | 44 | Co-President, Customer Operations | ||||
Richard J. McAniff | 61 | Co-President, Products and Chief Development Officer | ||||
T. Tod Nielsen | 45 | Co-President, Application Platform | ||||
Mark S. Peek | 53 | Chief Financial Officer and Co-President, Business Operations | ||||
S. Dawn Smith | 47 | Senior Vice President, General Counsel, Chief Compliance Officer and Secretary | ||||
Betsy B. Sutter | 50 | Senior Vice President, Human Resources | ||||
Paul A. Maritz has been Chief Executive Officer and Director of VMware since July 2008. Mr. Maritz also served as VMware's President from July 2008 to January 2011. Prior to joining VMware, he served as President, Cloud Infrastructure and Services Division of EMC, VMware's parent company and controlling stockholder. Mr. Maritz joined EMC in February 2008 when EMC acquired Pi Corporation ("Pi"), which he had founded in 2003 and where he served as CEO. Pi was a software company focused on building cloud-based solutions. Prior to founding Pi, he spent 14 years working at Microsoft Corporation, where he served as a member of the five-person Executive Committee that managed the overall company prior to his retirement in 2000. He also serves as Chairman of the Board of the Grameen Foundation, which supports microfinance around the world.
Carl M. Eschenbach was appointed Co-President, Customer Operations of VMware in January 2011. Mr. Eschenbach served as VMware's Executive Vice President of Worldwide Field Operations from May 2005 to January 2011. Prior to joining VMware in 2002, he was Vice President of North America Sales at Inktomi from 2000 to 2002. He also held various sales management positions with 3Com Corporation, Lucent Technologies Inc., and EMC.
Richard J. McAniff was appointed Co-President, Products and Chief Development Officer of VMware in January 2011. Mr. McAniff served as VMware's Executive Vice President, Products and Chief Development Officer from March 2009 to January 2011. Prior to joining VMware, he served in various product development management positions at Microsoft from 1987 through 2008. As corporate vice president for Microsoft Office, Mr. McAniff was responsible for several major software tools including Excel and Access. He also oversaw the Business Intelligence effort within Office and development of Web components for the SharePoint Portal Server. Before serving as corporate vice president, Mr. McAniff served as general manager of the Visual Basic development system.
T. Tod Nielsen was appointed Co-President, Application Platform of VMware in January 2011. Mr. Nielsen served as VMware's Chief Operating Officer from January 2009 to January 2011. Prior to joining VMware, he served as President and Chief Executive Officer of Borland Software Corporation, an enterprise software company, from November 2005 to December 2008. From June 2005 to November 2005, Mr. Nielsen served as Senior Vice President, Marketing and Global Sales Support for Oracle Corporation. From August 2001 to August 2004, he served in various positions at BEA Systems, Inc., including Chief Marketing Officer and Executive Vice President, Engineering. Mr. Nielsen also spent 12 years with Microsoft in various roles, including General Manager of Database and Developer Tools, Vice President of Developer Tools, and at the time of his departure, Vice President of Microsoft's platform group.
Mark S. Peek was appointed Chief Financial Officer and Co-President, Business Operations of VMware in January 2011. Mr. Peek served as VMware's Chief Financial Officer from April 2007 to January 2011. Prior to
38
joining VMware, he served as Senior Vice President and Chief Accounting Officer of Amazon.com, Inc., an e-commerce company, from July 2002 to April 2007. Prior to joining Amazon.com in April 2000, Mr. Peek spent 19 years at Deloitte & Touche, the last ten years as a partner. Mr. Peek serves as a director of Trimble Navigation, Ltd., a maker of positioning product solutions.
S. Dawn Smith has been the Senior Vice President, General Counsel and Secretary at VMware since September 2009 and Chief Compliance Officer since August 2010. Prior to joining VMware, she was a partner at Morrison & Foerster LLP, a law firm, since January 2008 and served as an attorney since 2005. Prior to joining Morrison & Foerster LLP, she was an attorney at Wilson Sonsini Goodrich & Rosati P.C.
Betsy B. Sutter was appointed VMware's Senior Vice President, Human Resources in July 2009. Ms. Sutter previously served as VMware's Vice President, Human Resources from January 2001 through July 2009. Prior to joining VMware, Ms. Sutter was Vice President, Human Resources at Silicon Gaming from 1997 through 2000 and served in human resources management at Digital Equipment Corporation from 1989 to 1997.
39
PART II
| ITEM 5. | MARKET FOR REGISTRANT'S COMMON EQUITY, RELATED STOCKHOLDER MATTERS, AND ISSUER PURCHASES OF EQUITY SECURITIES |
Market Information
Our Class A common stock, par value $0.01 per share, trades on the New York Stock Exchange under the symbol VMW.
The following table sets forth the range of high and low sales prices of our Class A common stock on the New York Stock Exchange for the past two years during the fiscal periods shown. Our Class B common stock is not publicly traded.
| Market Prices | ||||||||
| High | Low | |||||||
Year ended December 31, 2010 | ||||||||
First Quarter | $ | 54.99 | $ | 41.09 | ||||
Second Quarter | 73.10 | 51.23 | ||||||
Third Quarter | 89.18 | 61.17 | ||||||
Fourth Quarter | 91.95 | 71.04 | ||||||
Year ended December 31, 2009 | ||||||||
First Quarter | $ | 27.21 | $ | 19.16 | ||||
Second Quarter | 33.40 | 24.42 | ||||||
Third Quarter | 41.19 | 25.75 | ||||||
Fourth Quarter | 45.57 | 36.92 | ||||||
Holders
We had 60 holders of record of our Class A common stock, and one holder of record, EMC Corporation ("EMC"), of our Class B common stock as of February 18, 2011.
Dividends
Subsequent to our initial public offering in August 2007, we have not declared or paid cash dividends on our common stock. We currently do not anticipate declaring any cash dividends in the foreseeable future. Any future determination to declare cash dividends will be made at the discretion of our board of directors, subject to the consent of the holders of our Class B common stock pursuant to our certificate of incorporation. Holders of our Class A common stock and our Class B common stock will share equally on a per share basis in any dividend declared on our common stock by our board of directors.
Recent Sales of Unregistered Securities
None.
40
Issuer Purchases of Equity Securities
Issuer purchases of Class A common stock during the quarter ended December 31, 2010:
| Total Number of Shares Purchased (1)(2)(3) | Average Price Paid Per Share (1)(2)(3) | Total Number of Shares Purchased as Part of Publicly Announced Plans or Programs (3) | Approximate Dollar Value of Shares That May Yet Be Purchased Under the Publicly Announced Plans or Programs (3)(4) | |||||||||||||
October 1 – October 31, 2010 | 799,627 | $ | 77.03 | 220,366 | $ | 96,969,221 | ||||||||||
November 1 – November 30, 2010 | 425,244 | 78.30 | 235,694 | 78,449,427 | ||||||||||||
December 1 – December 31, 2010 | 763,941 | 88.35 | 194,900 | 61,570,950 | ||||||||||||
| 1,988,812 | 81.65 | 650,960 | ||||||||||||||
| (1) | Includes 2,650 shares repurchased and retired to satisfy tax withholding obligations that arose on the vesting of shares of restricted stock. |
| (2) | Includes 1,335,202 shares purchased by EMC in open market transactions. In the first quarter of 2010, EMC announced a stock purchase program of VMware's Class A common stock to maintain its approximate level of ownership in VMware over the long term. Inclusion of EMC's purchases in the above table does not indicate that EMC is deemed to be an "affiliated purchaser" with respect to the VMware stock repurchase program discussed in the following footnote. Shares purchased by EMC remain issued and outstanding. |
| (3) | On March 2, 2010, our Board of Directors approved a stock repurchase program, authorizing the purchase of up to $400.0 million of our Class A common stock through the end of 2011 (the "VMware Repurchase Program"). Stock will be purchased pursuant to this program, from time to time, in the open market or through private transactions, subject to market conditions. In the three months ended December 31, 2010, we repurchased in open market transactions and retired 650,960 shares of our Class A common stock at a weighted-average price of $80.76 per share for an aggregate purchase price of $52,574,441. We are not obligated to purchase any shares under our stock repurchase program. Subject to applicable laws, repurchases under the stock repurchase program may be made at such times and in such amounts as we deem appropriate. Purchases under the stock repurchase program can be discontinued at any time that we feel additional purchases are not warranted. |
| (4) | Represents the amount remaining in the VMware Repurchase Program as of the end of each month and does not include potential purchases by EMC. |
Use of Proceeds
None.
41
Stock Performance Graph
The graph below compares the cumulative total stockholder return on our Class A common stock with the cumulative total return on the S&P 500 Index and the S&P 500 Systems Software index for the period beginning on August 14, 2007 (the date our Class A common stock commenced trading on the New York Stock Exchange) through December 31, 2010, assuming an initial investment of $100. While the IPO price of our common stock was $29.00 per share, the graph assumes the initial value of our common stock on August 14, 2007 was the closing sales price of $51.00 per share. Subsequent to our initial public offering in August 2007, we have not declared or paid cash dividends on our common stock, while the data for the S&P 500 Index and the S&P 500 Systems Software Index assume reinvestment of dividends.
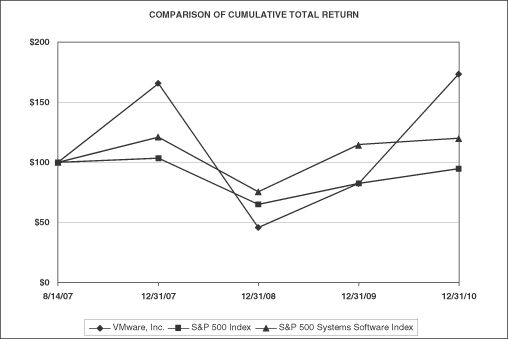
| Base Period 8/14/07 | 12/31/07 | 12/31/08 | 12/31/09 | 12/31/10 | ||||||||||||||||
VMware, Inc. | $ | 100.00 | $ | 166.65 | $ | 46.45 | $ | 83.10 | $ | 174.33 | ||||||||||
S&P 500 Index | 100.00 | 103.83 | 65.42 | 82.73 | 95.19 | |||||||||||||||
S&P 500 Systems Software Index | 100.00 | 121.87 | 76.12 | 114.99 | 120.51 | |||||||||||||||
Note: The stock price performance shown on the graph above is not necessarily indicative of future price performance. This graph shall not be deemed "filed" for purposes of Section 18 of the Exchange Act or otherwise subject to the liabilities of that section nor shall it be deemed incorporated by reference in any filing under the Securities Act or the Exchange Act, regardless of any general incorporation language in such filing.
42
| ITEM 6. | SELECTED FINANCIAL DATA |
FIVE-YEAR SELECTED CONSOLIDATED FINANCIAL DATA
(in thousands, except per share amounts)
| Year Ended December 31, | ||||||||||||||||||||
| 2010 | 2009 | 2008 | 2007 | 2006 | ||||||||||||||||
Summary of Operations: | ||||||||||||||||||||
Revenues: | ||||||||||||||||||||
License | $ | 1,401,424 | $ | 1,029,442 | $ | 1,178,142 | $ | 905,368 | $ | 491,902 | ||||||||||
Services | 1,455,919 | 994,495 | 702,885 | 420,443 | 212,002 | |||||||||||||||
Total revenues | $ | 2,857,343 | $ | 2,023,937 | $ | 1,881,027 | $ | 1,325,811 | $ | 703,904 | ||||||||||
Operating income | $ | 427,993 | $ | 219,295 | $ | 312,525 | $ | 235,341 | $ | 120,639 | ||||||||||
Net income | 357,439 | 197,098 | 290,133 | 218,137 | 85,890 | |||||||||||||||
Net income per weighted average share, basic, for Class A and Class B | $ | 0.87 | $ | 0.50 | $ | 0.75 | $ | 0.62 | $ | 0.26 | ||||||||||
Net income per weighted average share, diluted, for Class A and Class B | $ | 0.84 | $ | 0.49 | $ | 0.73 | $ | 0.61 | $ | 0.26 | ||||||||||
Weighted average shares, basic, for Class A and Class B | 409,805 | 394,269 | 385,068 | 350,493 | 332,500 | |||||||||||||||
Weighted average shares, diluted, for Class A and Class B | 423,446 | 399,776 | 397,185 | 359,189 | 332,500 | |||||||||||||||
| December 31, | ||||||||||||||||||||
| 2010 | 2009 | 2008 | 2007 | 2006 | ||||||||||||||||
Balance Sheet Data: | ||||||||||||||||||||
Cash, cash equivalents and short-term investments (1) | $ | 3,323,640 | $ | 2,513,821 | $ | 1,840,812 | $ | 1,231,168 | $ | 176,134 | ||||||||||
Working capital (deficiency) (1) | 2,508,503 | 1,888,438 | 1,510,338 | 935,162 | (55,318 | ) | ||||||||||||||
Total assets (1) | 6,797,319 | 5,066,984 | 3,839,205 | 2,695,700 | 1,145,950 | |||||||||||||||
Long-term obligations (2) | 450,000 | 450,000 | 450,000 | 450,000 | 800,000 | |||||||||||||||
Stockholders' equity (deficit) (1)(2) | 3,808,443 | 2,742,951 | 2,070,067 | 1,340,617 | (230,812 | ) | ||||||||||||||
Cash Flow Data: | ||||||||||||||||||||
Net cash provided by operating activities | $ | 1,174,389 | $ | 985,616 | $ | 800,131 | $ | 552,436 | $ | 279,863 | ||||||||||
Free cash flows (3) | 1,202,002 | 839,844 | 603,411 | 235,742 | 194,766 | |||||||||||||||
| (1) | In August 2007, we completed our IPO in which we sold 37,950,000 shares (including 4,950,000 shares pursuant to the underwriters' full exercise of their over-allotment option) of our Class A common stock at a price to the public of $29.00 per share. The net proceeds to us were $1,035.2 million. Subsequent to receiving the proceeds, we purchased our new headquarters facilities from EMC for $132.6 million, which is equal to the cost expended by EMC through the date of purchase. We also repaid $350.0 million of principal on the note payable to EMC. Also in August 2007, we sold 9,500,000 shares of our Class A common stock to Intel Capital at $23.00 per share. The net proceeds to us from that transaction were $218.3 million. Refer to Item 8 in Part II of our Annual Report on Form 10-K for the fiscal year ended December 31, 2007 for additional information. |
| (2) | In April 2007, we declared an $800.0 million dividend to EMC paid in the form of a note. This dividend was given retroactive effect as of December 31, 2006. Subsequent to receiving the proceeds from the IPO in August 2007, we repaid $350.0 million of principal on the note. See Note H to the consolidated financial statements for additional information. In 2005, we declared and paid a cash dividend of $190.0 million to EMC. |
| (3) | Free cash flows, a non-GAAP financial measure, is defined as net cash provided by operating activities plus the excess tax benefits from stock-based compensation, less capital expenditures and capitalized software development costs. Each adjusting item is separately presented on our consolidated statements of cash flows. See Item 7 of Part II, "Management's Discussion and Analysis of Financial Condition and Results of Operations-Non-GAAP Financial Measures" for further information. |
43
| ITEM 7. | MANAGEMENT'S DISCUSSION AND ANALYSIS OF FINANCIAL CONDITION AND RESULTS OF OPERATIONS |
This Management's Discussion and Analysis of Financial Condition and Results of Operations ("MD&A") should be read in conjunction with our annual consolidated financial statements and notes thereto which appear elsewhere in this Annual Report on Form 10-K.
All dollar amounts expressed as numbers in this MD&A (except per share amounts) are in millions.
Overview
Our primary source of revenues is the licensing of virtualization and cloud infrastructure solutions and related support and services for use by businesses and organizations of all sizes and across numerous industries in their information technology ("IT") infrastructure. Our virtualization solutions reflect a pioneering approach to computing that separates application software from the underlying hardware to achieve significant improvements in efficiency, agility, availability, flexibility and manageability. Our broad and proven suite of virtualization solutions addresses a range of complex IT problems that include cost and operational inefficiencies, facilitating access to "cloud computing" capacity, business continuity, software lifecycle management and corporate end-user computing device management. Our solutions run on industry-standard servers and desktop computers and support a wide range of operating system and application environments, as well as networking and storage infrastructures. Our solutions enable organizations to aggregate multiple servers, storage infrastructure and networks together into shared pools of capacity that can be allocated dynamically, securely and reliably to applications as needed, increasing hardware utilization and reducing spending. The benefits to our customers include substantially lower IT costs, cost-effective high availability across a wide range of applications, and a more automated and resilient systems infrastructure capable of responding dynamically to variable business demands. With our latest platform, VMware vSphere, we are helping companies along the path of cloud computing by providing compatible IT infrastructures for both businesses and cloud service providers.
Although we believe we are currently the leading provider of virtualization infrastructure software solutions, we face competitive threats to our leadership position from a number of companies, some of which have significantly greater resources than we do, which could result in increased pressure to reduce prices on our offerings. As a result, we believe it is important to continue to invest in strategic initiatives related to product research and development, market expansion and associated support functions to expand our industry leadership. We believe that we will be able to continue to meet our product development objectives through continued investment in our existing infrastructure, supplemented with strategic hires and acquisitions, funded through the operating cash flows generated from the sale of our products and services. We believe this is the appropriate priority for the long-term health and growth of our business.
Our current financial focus is on long-term revenue growth to generate free cash flows 1 to fund our expansion of industry segment share and to evolve our virtualization-based products for data centers, desktop computers and cloud computing through a combination of internal development and acquisitions. We expect to grow our business by broadening our virtualization infrastructure software solutions technology and product portfolio, increasing product awareness, promoting the adoption of virtualization and building long-term relationships with our customers through the adoption of enterprise license agreements ("ELAs"). Since the introduction in 2009 of VMware vSphere and VMware View 4, we have introduced more products that build on the vSphere foundation. In the third quarter of 2010, we released updated versions of VMware vSphere and VMware View, and we plan to continue to introduce additional products in the future. Additionally, we have made, and expect to continue to make, acquisitions designed to strengthen our product offerings and/or extend our strategy to deliver solutions that can be hosted at customer data centers or at service providers.
| 1 | Free cash flows, a non-GAAP financial measure, is defined as net cash provided by operating activities plus the excess tax benefits from stock-based compensation, less capital expenditures and capitalized software development costs. Each adjusting item is separately presented on our consolidated statements of cash flows. See "Non-GAAP Financial Measures" for further information. |
44
In evaluating our results, we also focus on operating margin excluding certain expenses included in our total operating expenses calculated in accordance with GAAP. The expenses excluded are stock-based compensation, the net effect of the amortization and capitalization of software development costs and certain other expenses consisting of employer payroll taxes on employee stock transactions, amortization of intangible assets and acquisition-related items. We believe this measure reflects our ongoing business in a manner that allows meaningful period-to-period comparisons. We are not currently focused on short-term operating margin expansion, but rather on investing at appropriate rates to support our growth and future product offerings in what may be a substantially more competitive environment.
We have developed a multi-channel distribution model to expand our presence and to reach various segments of the industry. In 2010 we derived over 85% of our sales from our channel partners, which include distributors, resellers, system vendors and systems integrators. Sales to our channel partners often involve three tiers of distribution: a distributor, a reseller and an end-user customer. Our sales force works collaboratively with our channel partners to introduce them to customers and new sales opportunities. As we expand geographically, we expect to continue to add additional channel partners. The remainder of our sales is primarily derived from purchases made directly by end-user customers.
From late 2008 and through most of 2009, macroeconomic conditions deteriorated globally and we observed that customers responded to the economic downturn with reductions in IT spending. Since the fourth quarter of 2009 and through 2010, we have benefited, along with the IT industry, from pent-up demand for IT products and services. While the overall macroeconomic environment has improved since late 2009, and while we believe that our customers continue to adopt our product platform as a strategic investment that enables substantial cost savings and improves efficiency and flexibility for their business, we continue to be cautious about the macroeconomic environment and the volatility we are observing in the world economy. We expect to continue to manage our resources prudently, while making key investments in support of our long-term growth objectives.
The majority of our contracts include both perpetual software licenses and ongoing software maintenance contracts. License revenues are recognized when the elements of revenue recognition for the licensed software are complete, generally upon electronic shipment of the software. Software maintenance revenues are typically recognized ratably over the term of the software maintenance period, i.e. over periods from one to five years subsequent to the initial contract, and include renewals of software maintenance sold after the initial software maintenance period expires. We also recognize revenues from professional services provided to our customers primarily as services are performed. Vendor-specific objective evidence ("VSOE") of fair value for software maintenance services is established by the rates charged in stand-alone sales of software maintenance contracts or the stated renewal rate for software maintenance included in the license agreement. Our software products may also be sold with professional services. VSOE of fair value for professional services is based upon the standard rates we charge for such services when sold separately. The revenues allocated to the software license included in multiple-element contracts represent the residual amount of the contract after the fair value of the other elements has been determined.
As a consequence of the timing differences in the recognition of license revenues and software maintenance revenues, variability in operating margin can result from differences in when we quote and contract for our services and when the cost is incurred. Variability in operating margin can also result when we recognize our foreign denominated unearned maintenance revenues in future periods. Due to our use of the U.S. Dollar as our functional currency, unearned revenue remains at its historical rate when recognized into revenue while our operating expenses in future periods are based upon the foreign exchange rates at that time. Our unearned revenue, both current and long-term, represents a liability on our consolidated balance sheets as the requirements of revenue recognition have not yet been met, and it consists of amounts received from customers and amounts billed but not collected for which revenue has not yet been recognized.
Our unearned revenues consist of unearned software maintenance revenues, unearned professional services revenues and unearned license revenues. As of December 31, 2010, total unearned revenues were $1,860.1, an increase of 40% from the previous year. Of the total, $1,536.6 will be recognized ratably over terms from one to five years, and is comprised of $1,461.3 of software maintenance revenue and $75.3 of license revenue. The
45
weighted-average remaining term of arrangements where revenue will be recognized ratably is approximately 1.8 years. Additionally, unearned revenues of $191.8 are related to software license revenue, which will be recognized upon the shipment of either existing or future products and is classified as current unearned revenue. Future products include, in some cases, emerging products that are offered as part of product promotions where the purchaser of an existing product is entitled to receive a promotional product at no additional charge. We regularly offer product promotions, generally as a strategy to build awareness of our emerging products. To the extent promotional products are not yet available, the revenue for the entire order is deferred until such time as all product obligations have been fulfilled. The remaining unearned revenues of $131.7 relate to professional services and will be recognized when the services are delivered. We believe our overall unearned revenue balance improves predictability of future revenues and that it is a key indicator of the health and growth of our business.
Until the second quarter of 2009, most of our revenue contracts with international channel partners were denominated in U.S. Dollars, but a portion of our operating expenses were, and continue to be, denominated in currencies other than the U.S. Dollar. This currency difference between our revenues and operating expenses historically caused variability in our operating margins due to fluctuations in the U.S. Dollar as compared with other currencies. In the second quarter of 2009, we started to invoice and collect in the Euro, the British Pound, the Japanese Yen and the Australian Dollar in their respective regions. As a result of invoicing in these local currencies in which we also have expenses, variability in operating margin due to foreign currency fluctuations has been reduced. However, increased exposure to foreign currency fluctuations introduces additional risk for variability in revenue-related components of our consolidated financial statements when these locally denominated revenues are remeasured into U.S. Dollars. We calculate the foreign currency impact on our revenues as the difference between revenues translated at current exchange rates and the same revenues translated at prior-period exchange rates. Given that we began to invoice and collect in currencies other than the U.S. Dollar during the second quarter of 2009, we are not able to determine the full year-over-year impact of foreign currency fluctuations on our revenues. The uncertainty and volatility of currency fluctuations will continue to impact our results. In order to manage our exposure to foreign currency fluctuations, since July 2009, we have entered into foreign currency forward contracts to hedge a portion of our net outstanding monetary assets and liabilities against movements in certain foreign exchange rates. These forward contracts are not designated as hedging instruments under applicable accounting guidance, and therefore all changes in the fair value of the forward contracts are reported in other income (expense), net in the consolidated statements of income. The gains and losses on our foreign currency forward contracts generally offset the majority of the gains and losses associated with the underlying foreign-currency denominated assets and liabilities that we hedge.
Our Relationship with EMC
As of December 31, 2010, EMC owned 33,012,000 shares of Class A common stock and all 300,000,000 shares of Class B common stock, representing approximately 80% of our total outstanding shares of common stock and 97% of the combined voting power of our outstanding common stock.
In April 2010, we acquired certain software product technology and expertise from EMC's Ionix IT management business for cash consideration of $175.0. EMC retained the Ionix brand and will continue to offer customers the products acquired by us, pursuant to the ongoing reseller agreement we have with EMC. The net assets and expertise acquired from EMC constituted a business and were accounted for as a business combination between entities under common control pursuant to generally accepted accounting principles ("GAAP"). See Note E to the consolidated financial statements included elsewhere in this filing for further information. In the fourth quarter of 2010, we paid $10.6 of contingent amounts to EMC in accordance with the asset purchase agreement.
Pursuant to the ongoing reseller arrangement with EMC that commenced in 2009, EMC bundles our products and services with EMC's hardware and sells them to end-users. In 2010 and 2009, we recognized
46
revenues of $48.5 and $14.1, respectively, from products and services sold pursuant to our reseller arrangement with EMC. As of December 31, 2010 and 2009, $29.0 and $22.4, respectively, of revenues from products and services sold under the reseller arrangement were included in unearned revenue.
In the years ended December 31, 2010, 2009 and 2008, we recognized professional services revenues of $60.6, $25.2 and $16.9, respectively, for services provided to EMC's customers pursuant to our contractual agreements with EMC. As of December 31, 2010 and 2009, $5.9 and $0.7, respectively, of revenues from professional services to EMC customers were included in unearned revenue.
In the years ended December 31, 2010, 2009 and 2008, we recognized revenues of $6.1, $5.6 and $4.1, respectively, from server and desktop products and services purchased by EMC for internal use pursuant to our contractual agreements with EMC. As of December 31, 2010 and 2009, $19.3 and $3.7, respectively, of revenues from server and desktop products and services purchased by EMC for internal use were included in unearned revenue.
We purchased storage systems and software, as well as consulting services, from EMC for $18.4, $9.7 and $25.2 in the years ended December 31, 2010, 2009 and 2008, respectively.
In certain geographic regions where we do not have an established legal entity, we contract with EMC subsidiaries for support services and EMC employees who are managed by our personnel. The costs incurred by EMC on our behalf related to these employees are passed on to us and we are charged a mark-up intended to approximate costs that would have been charged had we contracted for such services with an unrelated third party. These costs are included as expenses in our consolidated statements of income and primarily include salaries and benefits, travel and rent. Additionally, EMC historically incurred certain costs on our behalf in the U.S., which primarily related to a shared system for travel. In the fourth quarter of 2009, we implemented our own travel system in the U.S. and are now incurring these costs directly. The total cost of the services provided to us by EMC as described above was $66.4, $95.6 and $139.8 in the years ended December 31, 2010, 2009 and 2008, respectively.
As calculated under our tax sharing agreement with EMC, we paid EMC $5.1 in 2010 for our portion of EMC's consolidated federal income taxes. Under the same tax sharing agreement, EMC paid us $2.5 in 2010 for a refund of an overpayment related to the consolidated federal and state income taxes for the fiscal year ended December 31, 2008. In 2009 and 2008, we paid $14.2 and $64.3, respectively, for our portion of EMC's consolidated federal and state income taxes for various periods, as well as the conclusion of the 2005 and 2006 federal income tax audit. In 2009, EMC paid us $107.6 for our stand-alone federal taxable loss for the fiscal year ending December 31, 2008 and for a refund of an overpayment related to our portion of EMC's 2007 federal consolidated income taxes. No payments were made by EMC in 2008. The amounts that we pay to EMC for our portion of federal income taxes on EMC's consolidated tax return differ from the amounts we would owe on a stand-alone basis and the difference is presented as a component of stockholders' equity. In 2010 and 2008, the difference between the amount of tax calculated on a stand-alone basis and the amount of tax calculated per the tax sharing agreement was recorded as an increase in stockholders' equity of $6.5 and $5.2, respectively. In 2009, the difference between the amount of tax calculated on a stand-alone basis and the amount of tax calculated per the tax sharing agreement was recorded as a decrease in stockholders' equity of $8.0.
Interest expense with EMC, net, primarily consists of interest expense on the note payable to EMC. In 2010, 2009 and 2008, $4.1, $6.5 and $18.6, respectively, of interest expense was recorded related to the note payable to EMC and included in interest expense with EMC, net, recorded on the consolidated statements of income. Our interest income and expenses as a separate, stand-alone company may be higher or lower than the amounts reflected in the consolidated financial statements.
In 2008, we resolved with EMC certain acquisition-related intercompany liabilities due to EMC. As a result, intercompany liabilities due to EMC of $9.7 were recorded as a capital contribution from EMC in additional paid-in capital without the issuance of additional equity by us or remittance of any cash.
47
As of December 31, 2010, we had $76.5 due from EMC, which was partially offset by $21.0 due to EMC. As of December 31, 2009, we had $47.1 due from EMC, which was partially offset by $20.7 due to EMC. The net amounts due from EMC as of December 31, 2010 and December 31, 2009 were $55.5 and $26.4, respectively, and resulted from the related party transactions described above. In addition to the $55.5 due from EMC as of December 31, 2010, we had $144.3 of income taxes receivable due from EMC, which is included in other current assets on our consolidated balance sheets. As of December 31, 2009, we had $3.0 of income taxes receivable due from EMC and $10.5 of income taxes payable due to EMC. A large portion of the income tax receivable is related to 2010 federal income taxes and is expected to be received from EMC after the 2010 consolidated federal tax return extension is filed. Balances due to or from EMC which are unrelated to tax obligations are generally settled in cash within 60 days of each quarter-end. The timing of the tax payments due to and from EMC is governed by the tax sharing agreement with EMC.
By nature of EMC's majority ownership of us, the amounts we recorded for our intercompany transactions with EMC would not be considered arm's-length with an unrelated third party. Therefore the financial statements included herein may not necessarily reflect our financial condition, results of operations and cash flows had we engaged in such transactions with an unrelated third party during all periods presented. Accordingly, our historical results should not be relied upon as an indicator of our future performance as a stand-alone company.
Income Statement Presentation
As we operate our business in one operating segment, our revenues and operating expenses are presented and discussed at the consolidated level.
Sources of Revenues
License revenues
Our license revenues consist of revenues earned from the licensing of our software products. These products are generally priced and licensed on a perpetual basis based upon the number of physical desktop computers or server processors on which our software runs. Certain products are licensed on a subscription basis. Effective September 1, 2010, our management solutions are priced on a per-virtual-machine basis. The new model for management products better aligns with our customer's need to manage the number of virtual machines, rather than to the management of physical hardware.
Software maintenance revenues
Software maintenance revenues are recognized ratably over the contract period. Our contract periods typically range from one to five years. Customers receive various types of technical support based on the level of support purchased. Customers who are party to software maintenance agreements with us are entitled to receive product updates and upgrades on a when-and-if-available basis.
Professional services revenues
Professional services include design, implementation and training. Professional services are not considered essential to the functionality of our products, as these services do not alter the product capabilities and may be performed by our customers or by other vendors. Professional services engagements performed for a fixed fee, for which we are able to make reasonably dependable estimates of progress toward completion, are recognized on a proportional performance basis based on hours incurred and estimated hours of completion. Professional services engagements that are on a time and materials basis are recognized based on hours incurred. Revenues on all other professional services engagements are recognized upon completion.
48
Operating Expenses
Cost of license revenues
Our cost of license revenues principally consists of the amortization of capitalized software development costs and of intangibles, as well as royalty costs in connection with technology licensed from third-party providers and the cost of fulfillment of our software. The cost of fulfillment of our software includes product packaging, personnel costs and related overhead associated with the physical and electronic delivery of our software products.
Cost of services revenues
Our cost of services revenues includes the costs of personnel and related overhead to deliver technical support for our products and to provide our professional services.
Research and development expenses
Our research and development ("R&D") expenses include the personnel and related overhead associated with the research and development of new product offerings and the enhancement of our existing software offerings, net of amounts capitalized.
Sales and marketing expenses
Our sales and marketing expenses include personnel costs, sales commissions and related overhead associated with the sale and marketing of our license and services offerings, as well as the cost of product launches and certain marketing initiatives, including our annual VMworld conferences in the U.S. and Europe. Sales commissions are generally earned and expensed when a firm order is received from the customer and may be recognized in a period different than the period in which the related revenue is recognized.
General and administrative expenses
Our general and administrative expenses include personnel and related overhead costs to support the overall business. These expenses include the costs associated with our facilities, finance, human resources, IT infrastructure and legal departments.
Results of Operations
Revenues
Our revenues for the years ended 2010, 2009 and 2008 are as follows:
| For the Year Ended December 31, | % Change | |||||||||||||||||||
| 2010 | 2009 | 2008 | 2010 vs. 2009 | 2009 vs. 2008 | ||||||||||||||||
Revenues: | ||||||||||||||||||||
License | $ | 1,401.4 | $ | 1,029.4 | $ | 1,178.1 | 36 | % | (13 | )% | ||||||||||
Services: | ||||||||||||||||||||
Software maintenance | 1,217.0 | 823.8 | 555.9 | 48 | 48 | |||||||||||||||
Professional services | 238.9 | 170.7 | 147.0 | 40 | 16 | |||||||||||||||
Total services | 1,455.9 | 994.5 | 702.9 | 46 | 41 | |||||||||||||||
| $ | 2,857.3 | $ | 2,023.9 | $ | 1,881.0 | 41 | 8 | |||||||||||||
Revenues: | ||||||||||||||||||||
United States | $ | 1,452.7 | $ | 1,039.0 | $ | 987.6 | 40 | % | 5 | % | ||||||||||
International | 1,404.6 | 984.9 | 893.4 | 43 | 10 | |||||||||||||||
| $ | 2,857.3 | $ | 2,023.9 | $ | 1,881.0 | 41 | 8 | |||||||||||||
49
Total revenues were $2,857.3 in 2010, $2,023.9 in 2009 and $1,881.0 in 2008, representing year-over-year increases of $833.4 or 41% in 2010 and $142.9 or 8% in 2009. The revenue mix in 2010 reflected an increase in license revenues and an increase in services revenues as compared with 2009. The revenue mix in 2009 reflected a decrease in license revenues and an increase in services revenues as compared with 2008. In 2010 and 2009, the growth in our services revenues was driven by strong maintenance renewals, multi-year software maintenance contracts sold in previous periods and additional maintenance contracts sold in conjunction with software licenses. Our professional services practice has continued to grow in conjunction with the growth of our customer base. During 2010, we saw improved economic conditions and a corresponding increase in customer spending, which drove our license revenue growth for the year. Geographically, both U.S. and international revenues increased in 2010 and 2009, respectively, as compared with their respective prior years. The decline in license revenues year-over-year in 2009 was a result of customers delaying or reducing their IT purchases in response to the macroeconomic environment.
License Revenues
Software license revenues were $1,401.4 in 2010, $1,029.4 in 2009 and $1,178.1 in 2008, representing a year-over-year increase of $372.0 or 36% in 2010 and a year-over-year decrease of $148.7 or 13% in 2009. We believe license revenues benefited in 2010 from the improving macroeconomic environment, resulting in strong customer demand for the vSphere platform and growing interest in our desktop and management solutions. We believe that the revenue decline in 2009 compared with 2008 was due to the difficult macroeconomic environment and the related challenges that our customers faced, including reduced budgets for IT spending.
We have promoted the adoption of virtualization and built long-term relationships with our customers through the adoption of ELAs. ELAs continue to be an important component of our revenue growth and are offered both directly by us and through certain channel partners. ELAs are core to our strategy to build long-term relationships with customers as they commit to our virtualization infrastructure software solutions in their data centers. ELAs provide a base from which to sell additional products, such as our application platform products, our end-user computing products, and virtualization and cloud management products. Under a typical ELA, a portion of the revenues is attributed to the license and recognized immediately and the remainder is deferred and recognized as services maintenance revenues in future periods. In addition, ELAs typically include an initial maintenance period that is longer than other types of license sales.
In 2010, we observed an increase in the volume of our ELAs as compared with 2009 and 2008, due in part to growing international customer interest as well as the improving economic environment. In addition, in 2010, customers generally renewed their ELAs at a dollar value higher than the original transaction and with an average maintenance term of three years. The increase in the value of the renewed ELAs compared with the initial ELAs is typically due to additional products and upgrades added to the renewed ELAs, as well as the expanding use of originally purchased products within the customer's environment.
Services Revenues
Services revenues were $1,455.9 in 2010, $994.5 in 2009 and $702.9 in 2008, representing year-over-year increases of $461.4 or 46% in 2010 and $291.6 or 41% in 2009. The increase in services revenues during 2010 and 2009 was primarily attributable to growth in our software maintenance revenues.
Software maintenance revenues were $1,217.0 in 2010, $823.8 in 2009 and $555.9 in 2008, representing year-over-year increases of $393.3 or 48% in 2010 and $267.9 or 48% in 2009. In 2010 and 2009, software maintenance revenues benefited from strong renewals, multi-year software maintenance contracts sold in previous periods, and additional maintenance contracts sold in conjunction with software licenses. In 2010, customers continued to buy, on average, more than 24 months of support and maintenance with each new license purchased, which we believe illustrates our customers' commitment to VMware as a core element of their data center architecture. In addition, in 2009, services revenues increased year-over-year as a result of customers becoming current on their maintenance agreements in order to receive our 2009 release of vSphere 4.0 as a part of their service arrangements.
50
Professional services revenues were $238.9 in 2010, $170.7 in 2009 and $147.0 in 2008, representing year-over-year increases of $68.2 or 40% in 2010 and $23.7 or 16% in 2009. Professional services revenues increased as growth in our installed-base led to strong demand for our professional services, including consulting and customer training. As we continue to invest in our partners and expand our eco-system of third-party professionals with expertise in our solutions to independently provide professional services to our customers, we do not expect our professional services revenues to constitute an increasing component of our revenue mix. As a result of this strategy, our professional services revenue can vary based on the delivery channels used in any given period as well as the timing of engagements.
Operating Expenses
Information about our operating expenses is as follows:
| For the Year Ended December 31, 2010 | ||||||||||||||||||||
| Core Operating Expenses (1) | Stock- Based Compen- sation | Capitalized Software Development Costs, net | Other Expenses | Total Operating Expenses | ||||||||||||||||
Cost of license revenue | $ | 52.4 | $ | 1.7 | $ | 99.5 | $ | 23.9 | $ | 177.5 | ||||||||||
Cost of services revenue | 292.3 | 18.5 | - | 5.5 | 316.3 | |||||||||||||||
Research and development | 537.8 | 164.4 | (60.7 | ) | 11.5 | 653.0 | ||||||||||||||
Sales and marketing | 931.7 | 73.1 | - | 8.5 | 1,013.3 | |||||||||||||||
General and administrative | 230.1 | 34.0 | - | 5.2 | 269.3 | |||||||||||||||
Total operating expenses | $ | 2,044.3 | $ | 291.7 | $ | 38.8 | $ | 54.6 | $ | 2,429.4 | ||||||||||
Operating income | $ | 428.0 | ||||||||||||||||||
Operating margin | 15.0 | % | ||||||||||||||||||
| For the Year Ended December 31, 2009 | ||||||||||||||||||||
| Core Operating Expenses (1) | Stock- Based Compen- sation | Capitalized Software Development Costs, net | Other Expenses | Total Operating Expenses | ||||||||||||||||
Cost of license revenue | $ | 30.8 | $ | 1.3 | $ | 82.9 | $ | 11.7 | $ | 126.7 | ||||||||||
Cost of services revenue | 217.7 | 14.9 | - | 0.4 | 233.0 | |||||||||||||||
Research and development | 441.6 | 121.8 | (68.6 | ) | 1.8 | 496.6 | ||||||||||||||
Sales and marketing | 675.5 | 58.6 | - | 2.3 | 736.4 | |||||||||||||||
General and administrative | 174.6 | 34.9 | - | 2.4 | 211.9 | |||||||||||||||
Total operating expenses | $ | 1,540.2 | $ | 231.5 | $ | 14.3 | $ | 18.6 | $ | 1,804.6 | ||||||||||
Operating income | $ | 219.3 | ||||||||||||||||||
Operating margin | 10.8 | % | ||||||||||||||||||
| For the Year Ended December 31, 2008 | ||||||||||||||||||||
| Core Operating Expenses (1) | Stock- Based Compen- sation | Capitalized Software Development Costs, net | Other Expenses | Total Operating Expenses | ||||||||||||||||
Cost of license revenue | $ | 24.1 | $ | 1.1 | $ | 51.6 | $ | 11.3 | $ | 88.1 | ||||||||||
Cost of services revenue | 202.2 | 13.5 | - | 0.2 | 215.9 | |||||||||||||||
Research and development | 432.7 | 78.0 | (90.9 | ) | 9.4 | 429.2 | ||||||||||||||
Sales and marketing | 599.5 | 49.8 | - | 4.8 | 654.1 | |||||||||||||||
General and administrative | 153.9 | 24.1 | - | 3.2 | 181.2 | |||||||||||||||
Total operating expenses | $ | 1,412.4 | $ | 166.5 | $ | (39.3 | ) | $ | 28.9 | $ | 1,568.5 | |||||||||
Operating income | $ | 312.5 | ||||||||||||||||||
Operating margin | 16.6 | % | ||||||||||||||||||
51
| (1) | Core operating expenses is a non-GAAP financial measure that excludes stock-based compensation, the net effect of the amortization and capitalization of software development costs and certain other expenses from our total operating expenses calculated in accordance with GAAP. The other expenses excluded are employer payroll taxes on employee stock transactions, amortization of intangible assets and acquisition-related items. See "Non-GAAP Financial Measures" below for further information. |
Operating margins increased from 10.8% in 2009 to 15.0% in 2010 and decreased from 16.6% in 2008 to 10.8% in 2009. The increase in our operating margin in 2010 compared with 2009 primarily related to the increase in our revenues, which outpaced the increase in our expenses. The decrease in our operating margin in 2009 compared with 2008 primarily related to slower revenue growth, which was negatively impacted by the global economic downturn in 2009 and late 2008 and our continued investments in our products and the Company's infrastructure. In evaluating our results, we generally focus on core operating expenses. We believe that our core operating expenses reflect our ongoing business in a manner that allows meaningful period-to-period comparisons. Our core operating expenses are reconciled to the most comparable GAAP measure, "total operating expenses," in the table above.
Core Operating Expenses
The following discussion of our core operating expenses and the components comprising our core operating expenses highlights the factors that our management focuses upon in evaluating our operating margin and operating expenses. The increases or decreases in operating expenses discussed in this section do not include changes relating to stock-based compensation, the net effect of the amortization and capitalization of software development costs and certain other expenses, which consist of employer payroll taxes on employee stock transactions, amortization of intangible assets and acquisition-related items set forth above.
Core operating expenses increased by $504.1 or 33% in 2010 compared with 2009 and $127.8 or 9% in 2009 compared with 2008. As quantified below, these increases were primarily due to increases in employee-related expenses, which include salaries and benefits, bonuses, commissions, and recruiting and training. The increases in employee-related expenses for both periods were largely a result of incremental headcount from strategic hiring, business growth and business acquisitions, as well as from higher commission expense as a result of increased sales volumes beginning in the fourth quarter of 2009 and continuing through 2010. In 2009, the increase in core operating expenses was partially offset by the benefit from the austerity measures that we introduced at the end of 2008 in response to the global economic downturn. These austerity measures included reduced travel and entertainment costs, decreased contractor costs, hiring limits and suspensions of merit pay increases and matching contributions to employee 401(k) retirement plan accounts. We reinstated matching contributions to 401(k) retirement plan accounts in the fourth quarter of 2009, and we reinstated a budget for merit pay increases effective in the second quarter of 2010.
A portion of our core operating expenses, primarily the cost of personnel to deliver technical support on our products and professional services, marketing, and research and development, are denominated in foreign currencies, and are thus exposed to foreign exchange rate fluctuations. Core operating expenses were negatively impacted by $4.1 in 2010 and benefited by $28.0 in 2009, as compared with their respective prior years, due to the effect of fluctuations in the exchange rates between the U.S. Dollar and foreign currencies.
Cost of License Revenues
Core operating expenses in cost of license revenues increased by $21.6 or 70% in 2010 compared with 2009 and by $6.7 or 28% in 2009 as compared with 2008. The increases were primarily due to increases of $19.2 and $8.1, respectively, in royalty and licensing costs for technology licensed from third-party providers that is used in our products.
52
Cost of Services Revenues
Core operating expenses in cost of services revenues increased by $74.6 or 34% in 2010 compared with 2009 and by $15.5 or 8% in 2009 compared with 2008. The increase in 2010 was primarily due to growth in employee-related expenses of $41.1, which were largely driven by incremental headcount from business growth and acquisitions, as well as an increase in third-party professional services costs of $19.1 to provide professional services and training, primarily associated with increased services revenues. The increase in 2009 was primarily due to increases in employee-related expenses of $13.5, which were largely driven by incremental headcount to support the services function, as well as an increase in third-party professional services costs of $10.5 to provide technical support and professional services, primarily associated with increased services revenues. These increases in 2009 were partially offset by a decrease of $9.4 for certain costs that were previously categorized as cost of services revenues that are now recorded in other operating expense categories on our consolidated statements of income.
Research and Development Expenses
Core operating expenses for R&D increased by $96.2 or 22% in 2010 compared with 2009 and by $8.9 or 2% in 2009 compared with 2008. The increase in 2010 was primarily due to growth in employee-related expenses of $80.3, which was primarily driven by incremental headcount from strategic hiring and business acquisitions. The increase in 2009 was primarily due to employee-related expenses of $27.9 driven primarily by incremental headcount from strategic hiring. This increase was partially offset by a decrease of $16.5 in corporate and legal expenses and contractor costs due to the austerity measures we introduced at the end of 2008 in response to the global economic downturn.
Sales and Marketing Expenses
Core operating expenses for sales and marketing increased by $256.2 or 38% in 2010 compared with 2009 and by $76.0 or 13% in 2009 compared with 2008. The increase in 2010 was primarily due to growth in employee-related expenses of $159.3 driven by incremental headcount from strategic hiring and business acquisitions as well as by higher commission expense due to increased sales volumes. In support of our expanding markets and sales efforts, the costs of marketing programs increased by $36.9, and travel and entertainment expense increased by $19.9. We also incurred additional expenses of $20.6 for IT infrastructure development to support revenue growth, as well as consulting projects. The fluctuations in the exchange rate between the U.S. Dollar and foreign currencies had a minimal impact on expenses in 2010. The increase in 2009 was primarily due to increases in employee-related expenses of $82.9 driven by incremental headcount added in conjunction with our international expansion as well as by higher commission expense due to increased sales volumes. These increases in 2009 were partially offset by the positive impact of $16.6 from fluctuations in the exchange rate between the U.S. Dollar and foreign currencies, a decrease in travel and entertainment expense of $13.1 resulting from the austerity measures we implemented at the end of 2008, and a decrease in the costs of marketing programs of $7.5.
General and Administrative Expenses
Core operating expenses for general and administrative increased by $55.5 or 32% in 2010 compared with 2009 and by $20.7 or 13% in 2009 compared with 2008. The increase in 2010 was primarily due to an increase of $21.2 related to corporate expenses, including contributions to our charitable foundation and legal fees. Also contributing to the increase in expenses in 2010 was depreciation and equipment expenses of $11.3 and employee-related expenses of $10.9 due to the incremental growth in headcount. The increase in 2009 was primarily due to an increase of $18.3 related to employee-related expenses as a result of additional personnel employed to enhance the infrastructure of our business and to expand our own administrative functions. The increase in employee-related expenses in 2009 also included expenses related to the relocation of certain functions to lower-cost geographical regions.
53
Stock-Based Compensation Expense
| For the Year Ended December 31, | ||||||||||||
| 2010 | 2009 | 2008 | ||||||||||
Stock-based compensation, excluding amounts capitalized | $ | 291.7 | $ | 231.5 | $ | 166.5 | ||||||
Stock-based compensation capitalized | 10.9 | 14.9 | 22.7 | |||||||||
Stock-based compensation, including amounts capitalized | $ | 302.6 | $ | 246.4 | $ | 189.2 | ||||||
Stock-based compensation expense was $302.6 in 2010, $246.4 in 2009 and $189.2 in 2008, representing year-over-year increases of $56.2 and $57.2, respectively. The increase in stock-based compensation expense in 2010 over 2009 was primarily due to an increase of $29.9 for grants made to new employees, an increase of $28.2 from new awards made to our existing employees, and an increase of $20.8 from equity awards issued in connection with the acquisition of SpringSource late in the third quarter of 2009. These increases were offset in part by a decrease of $20.8 primarily related to forfeitures and grants reaching a fully vested status. In 2009, stock-based compensation increased over 2008 primarily due to an increase of $36.1 from restricted stock unit awards to certain international employees who were not eligible to participate in the September 2008 offer to exchange certain employee stock options issued under VMware's 2007 Equity and Incentive Plan and restricted stock unit awards to various other employees for retention purposes. Additionally, stock-based compensation increased by $14.8 for new awards made to our existing employees in the second quarter of 2009 and $14.3 from equity awards issued in connection with the acquisition of SpringSource late in the third quarter of 2009. The 2009 increases were offset by a decrease of $9.7 primarily related to forfeitures and grants reaching a fully vested status.
Stock-based compensation is recorded to each operating expense category based upon the function of the employee to whom the stock-based compensation relates and fluctuates based upon the value and number of awards granted. Compensation philosophy varies by function, resulting in different weightings of cash incentives versus equity incentives. As a result, functions with larger cash-based components, such as commissions, will have comparatively lower stock-based compensation expense than other functions.
As of December 31, 2010, the total unamortized fair value of our outstanding equity-based awards held by our employees was approximately $595.8. This amount will be recognized over the awards' requisite service periods, and is expected to result in stock-based compensation expense of approximately $270.6, $169.8, $114.3 and $41.1 for 2011, 2012, 2013 and 2014, respectively.
In future quarters, we expect our total stock-based compensation expense to increase as a result of additional equity grants we have recently made as well as grants we expect to make. Stock-based compensation expense reported in our consolidated statements of income is reduced by the amount of stock-based compensation that may be capitalized for the development of new software products and the amount of awards that are forfeited.
Capitalized Software Development Costs, Net
Capitalization of material development costs of software to be sold, leased, or otherwise marketed are subject to capitalization beginning when the products' technological feasibility has been established and ending when the product is available for general release. The R&D expenses and amounts that we capitalize as software development costs may not be comparable to our peer companies due to differences in a variety of factors, including multiple areas of judgment inherent in the assessment of these costs.
In 2010, 2009 and 2008, we capitalized $71.6 (including $10.9 of stock-based compensation), $83.5 (including $14.9 of stock-based compensation), and $113.6 (including $22.7 of stock-based compensation), respectively, of costs incurred for the development of software products. These amounts have been excluded from R&D expense on our accompanying consolidated statements of income. The decrease in capitalized
54
software development costs of $10.1 in 2010 as compared with 2009 was primarily due to the timing of when products reached technological feasibility. The decrease in capitalized software costs of $30.1 in 2009 as compared with 2008 was primarily due to $37.7 of reduced costs capitalized for VMware vSphere 4.0 as most of the vSphere 4.0 costs were capitalized during the second half of 2008. This decrease was partially offset by an increase of $14.5 related to the development of version 4.1 of VMware vSphere, which was released in the third quarter of 2010.
In 2010, 2009 and 2008, amortization expense from capitalized software development costs was $99.5, $82.9 and $51.6. These amounts are included in cost of license revenues on our accompanying consolidated statements of income. The increase in the amortization of software development costs of $16.6 in 2010 compared with 2009 was primarily due to the general release of VMware vSphere 4.0 in the second quarter of 2009 and the subsequent release of version 4.1 in the third quarter of 2010. This resulted in an increase in amortization of $36.2 in 2010 as compared with 2009 that was partially offset by $22.8 of amortization for certain capitalized projects that were fully amortized prior to the end of 2009. The increase in the amortization of software development costs of $31.3 in 2009 compared with 2008 was primarily due to the general release of VMware vSphere 4.0 in the second quarter of 2009, which resulted in an increase in amortization of $38.7 in 2009 as compared with 2008.
Other Operating Expenses
Other operating expenses, which consist of employer payroll tax on employee stock transactions, intangible amortization and acquisition-related items, were $54.6 in 2010, $18.6 in 2009 and $28.9 in 2008, representing an increase of $35.9 in 2010 and a decrease of $10.3 in 2009. The increase in 2010 was primarily due to additional intangible amortization of $20.6, primarily resulting from new acquisitions, as well as an increase of $13.4 in employer payroll taxes on employee stock transactions, which was driven by the increase in the market value of our stock and the number of awards exercised, sold or vested. The decrease in 2009 was primarily due to expensed in-process research and development of $6.6 in 2008, which was not repeated in 2009, and a decrease of $3.3 resulting from the completion of intangible amortization related to historical acquisitions.
Investment Income
Investment income decreased by $1.6 or 19% to $6.6 in 2010, as compared with $8.2 in 2009. Investment income decreased by $20.1 or 71% in 2009, as compared with $28.3 in 2008. Investment income primarily consists of interest earned on cash, cash equivalents and short-term investment balances partially offset by the amortization of premiums paid on fixed income securities. Investment income decreased in 2010 compared with 2009 primarily due to a decrease in the average rate of interest earned as a result of lower market interest rates. This decrease was partially offset by higher yields earned on our fixed income securities during the second half of 2010 and increased cash equivalent and short-term investment balances. During the second quarter of 2010, we began investing in fixed income securities in order to achieve investment returns in line with our objectives of principal preservation and risk management. Investment income decreased in 2009 compared with 2008 primarily due to a decrease in the average rate of interest earned as a result of lower market interest rates.
Interest Expense with EMC, Net
Interest expense with EMC, net, decreased by $2.9 or 41%, to $4.1 in 2010, as compared with $7.0 in 2009 and by $11.3 or 62% to $7.0 in 2009, as compared with $18.3 in 2008. Interest expense with EMC, net primarily consists of interest expense incurred on the note issued to EMC in April 2007. The interest rate on the note payable resets quarterly and is determined using the 90-day LIBOR rate plus 55 basis points, two business days prior to the first day of each fiscal quarter. The decrease in interest expense in 2010 and 2009, as compared with 2009 and 2008, respectively, was due to lower interest rates on the note. For 2010, 2009 and 2008, the weighted-average rate was 0.9%, 1.45% and 4.14%, respectively.
55
Other Income (Expense), Net
Other expense, net of $14.2 in 2010 changed by $17.1 as compared with other income, net of $2.9 in 2009. Other income, net of $2.9 in 2009 changed by $6.1 as compared with other expense, net of $3.2 in 2008. The change in 2010 compared with 2009 was primarily due to $8.2 of foreign exchange loss from the net impact of underlying foreign currency exposure and foreign currency forward contracts. These losses were partially offset by a gain of $5.9 recognized in the third quarter of 2009 from the remeasurement to fair value of a previously held equity interest in SpringSource in connection with the acquisition of SpringSource. The change in 2009 compared with 2008 was primarily due to the aforementioned gain of $5.9 recognized in 2009, partially offset by losses on foreign currency transactions.
Income Tax Provision
Our effective tax rate for 2010 was 14.2% as compared with 11.8% for 2009 and 9.1% for 2008. The higher effective tax rate in 2010 was primarily attributable to a jurisdictional shift of income from lower-tax jurisdictions to the United States, which was offset by a decrease in unrecognized tax positions relative to income before income tax. The increase in the effective rate to 11.8% in 2009 from 9.1% in 2008 was mainly attributable to an increase in unrecognized tax positions as a percent of income before tax, offset by the increase in the favorable impact of tax credits relative to income before tax.
The 2011 tax rate is expected to be higher than the fiscal year 2010 tax rate primarily due to a forecasted shift of earnings from lower-tax jurisdictions to the United States and a lower U.S. Federal R&D tax credit, partially offset by a decrease in unrecognized tax positions as a percent of income before income tax. The effective tax rate for fiscal year 2011 is based upon the income for the year, the composition of the income in different countries, and adjustments, if any, for the potential tax consequences related to the resolution of audits or changes in uncertain tax positions. Our aggregate income tax rate in foreign jurisdictions is lower than our income tax rate in the United States.
We have been included in the EMC consolidated group for U.S. federal income tax purposes, and expect to continue to be included in such consolidated group for periods in which EMC owns at least 80% of the total voting power and value of our outstanding stock as calculated for U.S. federal income tax purposes. The percentage of voting power and value calculated for U.S. federal income tax purposes may differ from the percentage of outstanding shares beneficially owned by EMC due to the greater voting power of our Class B common stock as compared to our Class A common stock and other factors. Each member of a consolidated group during any part of a consolidated return year is jointly and severally liable for tax on the consolidated return of such year and for any subsequently determined deficiency thereon. Should EMC's ownership fall below 80% of the total voting power or value of our outstanding stock in any period, then we would no longer be included in the EMC consolidated group for U.S. federal income tax purposes, and thus no longer be liable in the event that any income tax liability was incurred, but not discharged, by any other member of the EMC consolidated group. Additionally, our U.S. federal income tax would be reported separately from that of the EMC consolidated group.
Our future effective tax rate may be affected by such factors as changes in tax laws, regulations or rates, changing interpretation of existing laws or regulations, the impact of accounting for stock-based compensation, the impact of accounting for business combinations, changes in our international organization, shifts in the amount of income before tax earned in the U.S. as compared with other regions in the world, and changes in overall levels of income before tax.
Liquidity and Capital Resources
During the second quarter of 2010, we began investing in fixed income securities, which drove a shift from cash and cash equivalents to short-term investments. Our fixed income investment portfolio is denominated in U.S. Dollars and consists of various holdings, types and maturities. Our primary objective for holding fixed
56
income securities is to achieve an appropriate investment return consistent with preserving principal and managing risk.
| December 31, | ||||||||
| 2010 | 2009 | |||||||
Cash and cash equivalents | $ | 1,629.0 | $ | 2,486.5 | ||||
Short-term investments | 1,694.7 | 27.4 | ||||||
Total cash, cash equivalents and short-term investments | $ | 3,323.7 | $ | 2,513.9 | ||||
Our operating activities in 2010, 2009 and 2008, respectively, generated sufficient cash to meet our operating needs. Our cash flows for the years ended 2010, 2009 and 2008 were as follows:
| For the Year Ended December 31, | ||||||||||||
| 2010 | 2009 | 2008 | ||||||||||
Net cash provided by (used in): | ||||||||||||
Operating activities | $ | 1,174.4 | $ | 985.6 | $ | 800.1 | ||||||
Investing activities | (2,261.9 | ) | (562.4 | ) | (421.9 | ) | ||||||
Financing activities | 230.1 | 222.4 | 231.4 | |||||||||
Net increase (decrease) in cash and cash equivalents | $ | (857.4 | ) | $ | 645.6 | $ | 609.6 | |||||
In evaluating our liquidity internally, we focus on long-term, sustainable growth in free cash flows and in non-GAAP cash flows from operating activities ("non-GAAP operating cash flows"). We define non-GAAP operating cash flows as net cash provided by operating activities less capitalized software development costs plus the excess tax benefits from stock-based compensation. We define free cash flows, also a non-GAAP financial measure, as non-GAAP operating cash flows less capital expenditures. See "Non-GAAP Financial Measures" for additional information.
Our non-GAAP operating cash flows and free cash flows for 2010, 2009 and 2008 were as follows:
| For the Year Ended December 31, | ||||||||||||
| 2010 | 2009 | 2008 | ||||||||||
Net cash provided by operating activities | $ | 1,174.4 | $ | 985.6 | $ | 800.1 | ||||||
Capitalized software development costs | (64.1 | ) | (68.6 | ) | (90.9 | ) | ||||||
Excess tax benefits from stock-based compensation | 223.4 | 26.2 | 85.8 | |||||||||
Non-GAAP operating cash flows | 1,333.7 | 943.2 | 795.0 | |||||||||
Capital expenditures | (131.7 | ) | (103.4 | ) | (191.6 | ) | ||||||
Free cash flows | $ | 1,202.0 | $ | 839.8 | $ | 603.4 | ||||||
Free cash flows increased by $362.2 or 43% to $1,202.0 for the year ended December 31, 2010, compared with $839.8 for the year ended December 31, 2009, and by $236.4 or 39% to $839.8 for the year ended December 2009, compared with $603.4 for the year ended December 31, 2008. The increase in free cash flows in 2010 and 2009 was primarily due to increased sales and related cash collections.
Historically, we have invested excess cash predominantly in money market securities that are liquid and of high quality investment grade. The fair value for money market securities is determined based on quoted market prices as of the valuation date. We limit the amount of our domestic and international investments with any single issuer and any single financial institution, and also monitor the diversity of the portfolio, thereby diversifying the credit risk. In the second quarter of 2010, we began investing in fixed income securities. As of December 31, 2010, we held a diversified portfolio of money market funds and fixed income securities, which
57
primarily consist of highly liquid debt instruments of the U.S. government and its agencies, U.S. municipal obligations, and U.S. and foreign corporate debt securities.
We expect to continue to generate positive cash flows from operations in 2011 and to use cash generated by operations as our primary source of liquidity. We believe that existing cash and cash equivalents, together with any cash generated from operations will be sufficient to meet normal operating requirements including strategic acquisitions and capital expenditures for at least the next twelve months.
Operating Activities
Cash provided by operating activities is driven by our net income, adjusted for non-cash items and changes in assets and liabilities. Non-cash adjustments include depreciation, amortization of intangible assets, amortization of premiums paid upon purchase of investments in our fixed income portfolio, stock-based compensation expense, deferred income taxes, excess tax benefits from stock-based compensation and other adjustments. Net changes in assets and liabilities were impacted by increases in unearned revenues in the periods presented, and we expect this trend to continue in the future.
Cash provided by operating activities increased by $188.8 to $1,174.4 in 2010, as compared with $985.6 in 2009. The increase in operating cash flows for 2010 was the result of an increase in cash collections from customers driven by strong sales volume. The increase in cash collections was partially offset by increases in our core operating expenses, primarily related to incremental headcount from strategic hiring and business acquisitions as well as an increase in the excess tax benefit from stock-based compensation due to the increase in market value of our stock.
Cash flows from operating activities in 2009 were positively impacted by the collection of $107.6 from EMC related to the 2008 joint income tax return with EMC. The receivable was due to our stand-alone taxable loss for the year-ended December 31, 2008, which was primarily attributable to tax deductions arising from both non-qualified stock option exercises and from restricted stock where the restrictions lapsed. Under the tax sharing agreement with EMC, EMC is obligated to pay us an amount equal to the tax benefit that EMC will recognize on its tax return. In 2009, the receipt was offset by the payment of $14.2 for our portion of EMC's consolidated federal and state income taxes for various periods, as well as the conclusion of the 2005 and 2006 federal income tax audit.
Investing Activities
Cash used in investing activities is primarily attributable to the purchase of fixed income securities, business acquisitions, capital expenditures and capitalized software development costs. Cash provided by investing activities is primarily attributable to the sales or maturities of fixed income securities.
We began investing in fixed income securities during the second quarter of 2010 to achieve our objective of an appropriate investment return consistent with the preservation of principal and management of risk. Total fixed income securities of $2,101.9 purchased in 2010 are classified as cash outflows from investing activities. We classify these investments as short-term investments on our consolidated balance sheets based upon the nature of the security and their availability for use in current operations or for other purposes, such as business acquisitions and strategic investments. These cash outflows were partially offset by a cash inflow of $516.3 as a result of the sales and maturities of these fixed income securities.
In 2010, we acquired certain software product technology and expertise from EMC's Ionix IT management business for $175.0 and paid $10.6 in contingent amounts to EMC. The net assets and expertise acquired from EMC constituted a business and were accounted for as a business combination between entities under common control. See Note E to the consolidated financial statements included elsewhere in this filing for further information.
58
During 2010, we paid $293.0 for various business acquisitions as compared with $356.3 paid for SpringSource in 2009 and $138.6 for various acquisitions in 2008. Business acquisitions are an important element in our industry and we expect to continue to consider additional strategic acquisitions in the future.
Financing Activities
Proceeds from the issuance of our Class A common stock from the exercise of stock options and the purchase of shares under the VMware Employee Stock Purchase Plan ("ESPP"), were $431.3, $227.7 and $190.1 in 2010, 2009 and 2008, respectively. In 2009, the timing of purchases under our ESPP was amended and, as a result, we completed two ESPP purchases of shares in 2010 with aggregate proceeds of $45.1, while in 2009 we completed one ESPP purchase with proceeds of $18.3.
In 2010, the cash inflows were partially offset by cash outflows of $338.5 in 2010 to repurchase shares of our Class A common stock as part of our stock repurchase program. In March 2010, our Board of Directors approved a stock repurchase program, authorizing the purchase of up to $400.0 of our Class A common stock through the end of 2011. From time-to-time, subject to market conditions, stock is purchased pursuant to this program in the open market or through private transactions as permitted by securities laws and other legal requirements. In 2010, we repurchased and retired 4.9 million shares of our Class A common stock at a weighted-average price of $68.96 per share under the stock repurchase program that we announced in March 2010. As of December 31, 2010, authorized funds of $61.6 remained available under the stock repurchase program.
There were additional cash outflows of $86.2, $31.5 and $44.5 in 2010, 2009 and 2008, respectively, to repurchase shares of our Class A common stock to cover tax withholding obligations in conjunction with the net share settlement upon the vesting of restricted stock units and restricted stock. Additionally, the excess tax benefit from stock-based compensation was $223.5, $26.2 and $85.8 in 2010, 2009 and 2008, respectively, and is shown as a reduction to cash flows from operating activities and an increase to cash flows from financing activities. The year-over-year change in the repurchase of shares and the excess tax benefit from stock-based compensation in 2010 was primarily due to the increase in the market value of our stock and the number of awards exercised, sold or vested. The year-over-year change in the repurchase of shares and the excess tax benefit from stock-based compensation in 2009 was primarily due to the decline in the market value of our stock and the number of awards exercised, sold, or vested.
Future cash proceeds from issuances of common stock and the excess tax benefit from stock-based compensation and future cash outflows to repurchase our shares to cover tax withholding obligations will depend upon, and could fluctuate significantly from period-to-period based on the market value of our stock, the number of awards exercised, sold or vested, the tax benefit realized and the tax-affected compensation recognized.
To date, inflation has not had a material impact on our financial results.
Non-GAAP Financial Measures
Regulation S-K Item 10(e), "Use of Non-GAAP Financial Measures in Commission Filings," defines and prescribes the conditions for use of non-GAAP financial information. Our measures of core operating expenses, non-GAAP operating cash flows and free cash flows each meet the definition of a non-GAAP financial measure.
Core Operating Expenses
Management uses the non-GAAP measure of core operating expenses to understand and compare operating results across accounting periods, for internal budgeting and forecasting purposes, for short- and long-term operating plans, to calculate bonus payments and to evaluate our financial performance, the performance of its individual functional groups and the ability of operations to generate cash. Management believes that core
59
operating expenses reflect our ongoing business in a manner that allows for meaningful period-to-period comparisons and analysis of trends in our business, as they exclude certain expenses that are not reflective of ongoing operating results.
We define core operating expenses as our total operating expenses excluding the following components, which we believe are not reflective of our ongoing operational expenses. In each case, for the reasons set forth below, management believes that excluding the component provides useful information to investors and others in understanding and evaluating our operating results and future prospects in the same manner as management, in comparing financial results across accounting periods and to those of peer companies and to better understand the long-term performance of our core business.
| • | Stock-based compensation. Although stock-based compensation is an important aspect of the compensation of our employees and executives, determining the fair value of the stock-based instruments involves a high degree of judgment and estimation and the expense recorded may bear little resemblance to the actual value realized upon the future exercise or termination of the related stock-based awards. Furthermore, unlike cash compensation, the value of stock-based compensation is determined using a complex formula that incorporates factors, such as market volatility, that are beyond our control. |
| • | Amortization and capitalization of software development costs. Amortization and capitalization of software development costs can vary significantly depending upon the timing of products reaching technological feasibility and being made generally available. |
| • | Other expenses. Other expenses excluded are employer payroll taxes on employee stock transactions, amortization of intangible assets and acquisition-related items. The amount of employer payroll taxes on stock-based compensation is dependent on our stock price and other factors that are beyond our control and do not correlate to the operation of the business. Regarding the amortization of intangible assets, a portion of the purchase price of our acquisitions is generally allocated to intangible assets, such as intellectual property, and is subject to amortization. However, we do not acquire businesses on a predictable cycle. Additionally, the amount of an acquisition's purchase price allocated to intangible assets and the term of its related amortization can vary significantly and are unique to each acquisition. Acquisition-related items include direct costs of acquisitions, such as transaction fees, which vary significantly and are unique to each acquisition. Additionally, we do not acquire businesses on a predictable cycle. |
Non-GAAP operating cash flows and free cash flows
We define non-GAAP operating cash flows as net cash provided by operating activities less capitalized software development costs plus the excess tax benefits from stock-based compensation. We define free cash flows as non-GAAP operating cash flows less capital expenditures. Management uses non-GAAP operating cash flows as another measure of cash flows from operations because this measure offers a perspective of our operating cash flows that aligns with how management internally views our overall and individual functional group operating results. When viewing operating results for evaluating our past performance and for planning purposes, management excludes certain items, including the effect of capitalizing and amortizing software development costs and items related to stock-based compensation, which are also excluded in the non-GAAP operating cash flows measure. Management uses free cash flows as a measure of financial progress in our business, as it balances operating results, cash management and capital efficiency. In addition to quarterly free cash flows, management also focuses on trailing twelve month free cash flows, as free cash flows can be volatile in the short-term.
We believe that our measures of non-GAAP operating cash flows and free cash flows provide useful information to investors and others, as they allow for meaningful period-to-period comparisons of our operating cash flows for analysis of trends in our business. Additionally, we believe that information regarding non-GAAP
60
operating cash flows and free cash flows provides investors and others with an important perspective on cash that we may choose to make available for strategic acquisitions and investments, the repurchase of shares, ongoing operations and other capital expenditures.
We deduct capitalization of software development costs from both measures because these costs are considered to be a necessary component of our ongoing operations and the amount capitalized under GAAP can vary significantly from period-to-period depending upon the timing of products reaching technological feasibility and being made generally available. Consequently, software development costs paid out during a period that are capitalized under GAAP and do not impact GAAP operating cash flows for that period do result in a decrease to our measures of non-GAAP operating cash flows and non-GAAP free cash flows, thereby providing management with useful measures of cash flows generated from operations during the period. We add back the excess income tax benefits from stock-based compensation to our measures of non-GAAP operating cash flows and free cash flows as management internally views cash flows arising from income taxes as similar to operating cash flows rather than as financing cash flows as required under GAAP. Furthermore, we exclude capital expenditures on property and equipment from free cash flows because these expenditures are also considered to be a necessary component of ongoing operations.
Limitations on the use of Non-GAAP financial measures
A limitation of our non-GAAP financial measures of core operating expenses, non-GAAP operating cash flows and free cash flows is that they do not have uniform definitions. Our definitions will likely differ from the definitions used by other companies, including peer companies, and therefore comparability may be limited. Thus, our non-GAAP measures of core operating expenses, non-GAAP operating cash flows and free cash flows should be considered in addition to, not as a substitute for, or in isolation from, measures prepared in accordance with GAAP. Additionally, in the case of stock-based compensation, if we did not pay out a portion of compensation in the form of stock-based compensation and related employer payroll taxes, the cash salary expense included in costs of revenues and operating expenses would be higher which would affect our cash position. Further, the non-GAAP measure of core operating expenses has certain limitations because it does not reflect all items of income and expense that affect our operations and are reflected in the GAAP measure of total operating expenses.
We compensate for these limitations by reconciling core operating expenses to the most comparable GAAP financial measure. Management encourages investors and others to review our financial information in its entirety, not to rely on any single financial measure and to view our non-GAAP financial measures in conjunction with the most comparable GAAP financial measures.
See "Results of Operations-Operating Expenses" for a reconciliation of the non-GAAP financial measure of core operating expenses to the most comparable GAAP measure, "total operating expenses," for the years ended December 31, 2010, 2009 and 2008.
See "Liquidity and Capital Resources" for a reconciliation of non-GAAP operating cash flows and free cash flows to the most comparable GAAP measure, "net cash provided by operating activities," for the years ended December 31, 2010, 2009 and 2008.
Off-Balance Sheet Arrangements, Contractual Obligations, Contingent Liabilities and Commitments
Guarantees and Indemnification Obligations
We enter into agreements in the ordinary course of business with, among others, customers, distributors, resellers, system vendors and systems integrators. Most of these agreements require us to indemnify the other party against third-party claims alleging that one of our products infringes or misappropriates a patent, copyright,
61
trademark, trade secret, and/or other intellectual property right. Certain of these agreements require us to indemnify the other party against certain claims relating to property damage, personal injury, or the acts or omissions by us and our employees, agents, or representatives.
We have agreements with certain vendors, financial institutions, lessors and service providers pursuant to which we have agreed to indemnify the other party for specified matters, such as acts and omissions by us and our employees, agents, or representatives.
We have procurement or license agreements with respect to technology that we have obtained the right to use in our products and agreements. Under some of these agreements, we have agreed to indemnify the supplier for certain claims that may be brought against such party with respect to our acts or omissions relating to the supplied products or technologies.
We have agreed to indemnify our directors and executive officers, to the extent legally permissible, against all liabilities reasonably incurred in connection with any action in which such individual may be involved by reason of such individual being or having been a director or officer. Our by-laws and charter also provide for indemnification of our directors and officers to the extent legally permissible, against all liabilities reasonably incurred in connection with any action in which such individual may be involved by reason of such individual being or having been a director or executive officer. We also indemnify certain employees who provide service with respect to employee benefits plans, including the members of the Administrative Committee of the VMware 401(k) Plan.
In connection with certain acquisitions, we have agreed to indemnify the former directors and officers of the acquired company in accordance with the acquired company's by-laws and charter in effect immediately prior to the acquisition or in accordance with indemnification or similar agreements entered into by the acquired company and such persons. We typically purchase a "tail" directors' and officers' insurance policy, which should enable us to recover a portion of any future indemnification obligations related to the former officers and directors of an acquired company.
It is not possible to determine the maximum potential amount under these indemnification agreements due to our limited history with prior indemnification claims and the unique facts and circumstances involved in each particular agreement. Historically, payments made by us under these agreements have not had a material effect on our consolidated financial position, results of operations, or cash flows.
Contractual Obligations
We have various contractual obligations impacting our liquidity. The following represents our contractual obligations as of December 31, 2010:
| Payments Due by Period | ||||||||||||||||||||
| Total | Less than 1 year | 1-3 years (1) | 3-5 years (2) | More than 5 years | ||||||||||||||||
Note payable to EMC (3) | $ | 450.0 | $ | - | $ | 450.0 | $ | - | $ | - | ||||||||||
Operating leases (4) | 421.3 | 40.8 | 63.1 | 42.4 | 275.0 | |||||||||||||||
Other agreements (5) | 65.7 | 15.7 | 22.8 | 5.8 | 21.4 | |||||||||||||||
Sub-Total | $ | 937.0 | $ | 56.5 | $ | 535.9 | $ | 48.2 | $ | 296.4 | ||||||||||
Uncertain tax positions (6) | 107.9 | |||||||||||||||||||
Total | $ | 1,044.9 | ||||||||||||||||||
| (1) | Includes payments from January 1, 2012 through December 31, 2013. |
| (2) | Includes payments from January 1, 2014 through December 31, 2015. |
62
| (3) | The note is due and payable in full on April 6, 2012; however, we can pay down the note at an earlier date in full or in part at our election. |
| (4) | Our operating leases are primarily for office space around the world. |
| (5) | Consisting of various contractual agreements, which include commitments on the lease for our Washington data center facility. |
| (6) | As of December 31, 2010, we had $107.9 of non-current net unrecognized tax benefits under generally accepted accounting guidance. We are not able to provide a reasonably reliable estimate of the timing of future payments relating to these obligations. |
Critical Accounting Policies
Our consolidated financial statements are based on the selection and application of accounting principles generally accepted in the United States of America that require us to make estimates and assumptions about future events that affect the amounts reported in our financial statements and the accompanying notes. Future events and their effects cannot be determined with certainty. Therefore, the determination of estimates requires the exercise of judgment. Actual results could differ from those estimates, and any such differences may be material to our financial statements. We believe that the critical accounting policies set forth below may involve a higher degree of judgment and complexity in their application than our other significant accounting policies and represent the critical accounting policies used in the preparation of our financial statements. If different assumptions or conditions were to prevail, the results could be materially different from our reported results. Our significant accounting policies are presented within Note A, "Overview and Basis of Presentation," to our consolidated financial statements appearing in this Annual Report on Form 10-K.
Revenue Recognition
We derive revenues from the licensing of software and related services. We recognize revenues when persuasive evidence of an arrangement exists, delivery has occurred, the sales price is fixed or determinable, and collectibility is probable. Determining whether and when some of these criteria have been satisfied often involves assumptions and judgments that can have a significant impact on the timing and amount of revenue we report.
We recognize license revenues from the sale of software licenses when risk of loss transfers, which is generally upon electronic shipment. We primarily license our software under perpetual licenses through our channel of distributors, resellers, system vendors, systems integrators and our direct sales force. To the extent we offer product promotions and the promotional products are not yet available, the revenue for the entire order is deferred until such time as all product obligations have been fulfilled. We defer revenues relating to products that have shipped into our channel until our products are sold through the channel. We estimate and record reserves for products that are not sold through the channel based on historical trends and relevant current information. We obtain sell-through information from distributors and certain resellers on a monthly basis and reconcile any estimates, if necessary, made in the previous month. Historically, actual information has not differed materially from the related estimate. For our channel partners who do not report sell-through data, we determine sell-through based on payment of such distributors' and certain resellers' accounts receivable balances and other relevant factors. For software sold by system vendors that is bundled with their hardware, unless we have a separate license agreement with the end-user, revenue is recognized in arrears upon the receipt of binding royalty reports. The accuracy of our reserves depends on our ability to estimate the product sold through the channels and could have a significant impact on the timing and amount of revenue we report.
We offer rebates to certain channel partners, which are recognized as a reduction of revenue at the time the related product sale is recognized. When rebates are based on the set percentage of actual sales, we recognize the costs of the rebates as a reduction of revenue when the underlying revenue is recognized. In cases where rebates are earned if a cumulative level of sales is achieved, we recognize the cost of the rebates as a reduction of revenue proportionally for each sale that is required to achieve the target. The estimated reserves for channel
63
rebates and sales incentives are based on channel partners' actual performance against the terms and conditions of the programs, historical trends and the value of the rebates. The accuracy of these reserves for these rebates and sales incentives depends on our ability to estimate these items and could have a significant impact on the timing and amount of revenue we report.
With limited exceptions, VMware's return policy does not allow product returns for a refund. Certain distributors and resellers may rotate stock when new versions of a product are released. We estimate future product returns at the time of sale. Our estimate is based on historical return rates, levels of inventory held by distributors and resellers and other relevant factors. The accuracy of these reserves depends on our ability to estimate sales returns and stock rotation among other criteria. If we were to change any of these assumptions or judgments, it could cause a material increase or decrease in the amount of revenue that we report in a particular period. Returns have not been material to date and have been in line with our expectations.
Our services revenues consist of software maintenance and professional services. We recognize software maintenance revenues ratably over the contract period. Typically, our contract periods range from one to five years. Professional services include design, implementation and training. Professional services are not considered essential to the functionality of our products because services do not alter the product capabilities and may be performed by customers or other vendors. Professional services engagements performed for a fixed fee, for which we are able to make reasonably dependable estimates of progress toward completion are recognized on a proportional performance basis based on hours and direct expenses incurred. Professional services engagements that are on a time and materials basis are recognized based upon hours incurred. Revenues on all other professional services engagements are recognized upon completion. If we were to change any of these assumptions or judgments regarding our services revenues, it could cause a material increase or decrease in the amount of revenue that we report in a particular period.
Our software products are typically sold with software maintenance services. VSOE of fair value for software maintenance services is established by the rates charged in stand-alone sales of software maintenance contracts or the stated renewal rate for software maintenance included in the license agreement. Our software products may also be sold with professional services. VSOE of fair value for professional services is based upon the standard rates we charge for such services when sold separately. The revenues allocated to the software license included in multiple-element contracts represent the residual amount of the contract after the fair value of the other elements has been determined. If we are unable to establish VSOE of fair value for one of the undelivered elements included in a multiple-element contract, the revenue is deferred until VSOE of fair value for the undelivered element has been established or the element has been delivered. If the element involves time-based delivery, the entire arrangement is recognized ratably over the delivery period.
Customers under software maintenance agreements are entitled to receive updates and upgrades on a when-and-if-available basis, and various types of technical support based on the level of support purchased. In the event specific features or functionalities, entitlements or the release number of an upgrade have been announced but not delivered, and customers will receive that upgrade as part of a current software maintenance contract, a specified upgrade is deemed created and product revenues are deferred on purchases made after the announcement date until delivery of the upgrade. The amount and elements to be deferred are dependent on whether the company has established VSOE of fair value for the upgrade. VSOE of fair value of these upgrades is established based upon the price set by management. We have a history of selling such upgrades on a stand-alone basis. We are required to exercise judgment in determining whether VSOE exists for each undelivered element based on whether our pricing for these elements is sufficiently consistent with the sale of these elements on a stand-alone basis. This determination could cause a material increase or decrease in the amount of revenue that we report in a particular period.
64
Accounting for Stock Options
Generally accepted accounting principles require recognizing compensation costs for all share-based payment awards made to employees based upon the awards' estimated grant date fair value.
We elected to estimate the fair value of employee stock option awards and options under our Employee Stock Purchase Plan using the Black-Scholes option pricing model. The determination of the fair value of our share-based payment awards on the date of grant using the Black-Scholes option pricing model is affected by our stock price, as well as assumptions regarding a number of subjective variables. These variables include the expected stock price volatility over the term of the awards, the risk-free interest rate associated with the expected term of the awards, expected dividends and actual and projected employee stock option exercise behaviors. If any of the assumptions used in the Black-Scholes option pricing model change significantly, stock-based compensation expense may differ materially in the future from that recorded in the current period.
The estimation of stock awards that will ultimately vest requires judgment, and to the extent actual results or updated estimates differ from our current estimates, such amounts will be recorded as an adjustment in the period the estimates are revised. Should our actual forfeitures differ from our estimates, this could have a material impact on our financial statements.
Capitalized Software Development Costs
Costs related to R&D are generally charged to expense as incurred. Capitalization of material development costs of software to be sold, leased, or otherwise marketed are subject to capitalization from the time technological feasibility is established until the product is available for general release. Judgment is required to determine when technological feasibility is established. Changes in judgment as to when technological feasibility is established, or changes in our business, including our go-to-market strategy, would likely materially impact the amount of costs capitalized. For example, if the length of time between technological feasibility and general availability declines in the future, the amount of costs capitalized would likely decrease. In addition, our R&D expenses and amounts capitalized as software development costs may not be comparable to our peer companies due to differences in judgment as to when technological feasibility has been reached or differences in judgment regarding when the product is available for general release. Generally accepted accounting principles require annual amortization expense of capitalized software development costs to be the greater of the amounts computed using the ratio of current gross revenue to a product's total current and anticipated revenues, or the straight-line method over the product's remaining estimated economic life. To date, we amortized these costs using the straight-line method as it is the greater of the two amounts. The ongoing assessment of the recoverability of these costs requires considerable judgment by management with respect to certain external factors such as anticipated future revenue, estimated economic life, and changes in software and hardware technologies. Material differences in amortization amounts could occur as a result of changes in the periods over which we actually generate revenues or the amounts of revenues generated.
Asset Valuation
Asset valuation includes assessing the recorded value of certain assets, including accounts receivable, other intangible assets and goodwill. We use a variety of factors to assess valuation, depending upon the asset. Accounts receivable are evaluated based upon the creditworthiness of our customers, historical experience, the age of the receivable and current market and economic conditions. Should current market and economic conditions deteriorate, our actual bad debt expense could exceed our estimate. Other intangible assets are evaluated based upon the expected period during which the asset will be utilized, forecasted cash flows, changes in technology and customer demand. Changes in judgments on any of these factors could materially impact the value of the asset. As we operate our business in one operating segment and one reporting unit, our goodwill is assessed at the consolidated level for impairment in the fourth quarter of each year or more frequently if events or changes in circumstances indicate that the asset might be impaired. The assessment is performed by comparing the market value of our reporting unit to its carrying value.
65
Accounting for Income Taxes
In calculating our income tax expense, management judgment is necessary to make certain estimates and judgments for financial statement purposes that affect the recognition of tax assets and liabilities.
In order for us to realize our deferred tax assets, we must be able to generate sufficient taxable income in those jurisdictions where the deferred tax assets are located. We record a valuation allowance to reduce our deferred tax assets to the amount that is more likely than not to be realized. We consider future market growth, forecasted earnings, future taxable income, and prudent and feasible tax planning strategies in determining the need for a valuation allowance. In the event we were to determine that we would not be able to realize all or part of our net deferred tax assets in the future, an adjustment to the deferred tax assets would be charged to earnings in the period in which we make such determination. Likewise, if we later determine that it is more likely than not that the net deferred tax assets would be realized, we would reverse the applicable portion of the previously provided valuation allowance.
We calculate our current and deferred tax provision based on estimates and assumptions that could differ from the actual results reflected in income tax returns filed during the subsequent year. Adjustments based on filed returns are generally recorded in the period when the tax returns are filed.
The amount of income tax we pay is subject to audits by federal, state and foreign tax authorities, which may result in proposed assessments. Our estimate of the potential outcome for any uncertain tax issue is highly judgmental. We believe that we have adequately provided for any reasonably foreseeable outcome related to these matters. However, our future results may include favorable or unfavorable adjustments to our estimated tax liabilities in the period the assessments are made or resolved, audits are closed or when statutes of limitation on potential assessments expire. Additionally, the jurisdictions in which our earnings or deductions are realized may differ from our current estimates. As a result, our effective tax rate may fluctuate significantly on a quarterly basis.
We do not provide for a U.S. income tax liability on undistributed earnings of our foreign subsidiaries. The earnings of non-U.S. subsidiaries, which reflect full provision for non-U.S. income taxes, are indefinitely reinvested in non-U.S. operations or will be remitted substantially free of additional tax.
Income taxes are calculated on a separate tax return basis, although we are included in the consolidated tax return of EMC. The difference between the income taxes payable that is calculated on a separate return basis and the amount actually paid to EMC pursuant to our tax sharing agreement with EMC is presented as a component of additional paid-in capital.
New Accounting Pronouncements
Revenue Recognition
In September 2009, the Financial Accounting Standards Board ("FASB") issued new standards for multiple-deliverable revenue arrangements. These new standards affect the determination of when individual deliverables included in a multiple-element arrangement may be treated as separate units of accounting. In addition, these new standards modify the manner in which the transaction consideration is allocated across separately identified deliverables, eliminate the use of the residual value method of allocating arrangement consideration and require expanded disclosure. These new standards became effective for us for multiple-element arrangements entered into or materially modified on or after January 1, 2011. We have determined that these new standards did not have an impact on our consolidated financial statements as our business is currently conducted.
Software
In September 2009, the FASB issued amended standards for the accounting for certain revenue arrangements that include software elements. These new standards amend pre-existing software revenue
66
guidance by removing from its scope tangible products that contain both software and non-software components that function together to deliver the product's functionality. These amended standards became effective for us for revenue arrangements entered into or materially modified on or after January 1, 2011. We have determined that these new standards are not applicable to our business and will not have an impact on our consolidated financial statements.
Consolidations
In December 2009, the FASB issued standards for consolidation of variable interest entities ("VIEs") primarily related to the determination of the primary beneficiary of the VIE. These amended standards became effective for us on January 1, 2010. The adoption of these standards did not have a material impact on our consolidated financial position and results of operations. These amended standards may, however, have an impact on accounting for any changes to existing relationships or future investments.
| ITEM 7A. | QUANTITATIVE AND QUALITATIVE DISCLOSURES ABOUT MARKET RISK |
Foreign Exchange Risk
We operate in foreign countries, which expose us to market risk associated with foreign currency exchange rate fluctuations between the U.S. Dollar and various foreign currencies, the most significant of which is the Euro.
International revenues as a percentage of total revenues were 49% in 2010, 49% in 2009 and 48% in 2008. Historically, our revenue contracts were primarily denominated in U.S. Dollars. In May 2009, we began to invoice and collect in the Euro, the British Pound, the Japanese Yen and the Australian Dollar in their respective regions. Additionally, a portion of our operating expenses, primarily the cost of personnel to deliver technical support on our products and professional services, sales and sales support and research and development, are denominated in foreign currencies, primarily the Euro, the British Pound, the Australian Dollar and the Indian Rupee. Revenues resulting from selling in local currencies and costs incurred in local currencies are exposed to foreign exchange rate fluctuations which can affect our operating income. As exchange rates vary, operating margins may differ materially from expectations.
Operating expenses were negatively impacted by $4.1 million in 2010 and $10.6 million in 2008, and benefited by $28.0 million in 2009, due to fluctuations in the exchange rates between the U.S. Dollar and foreign currencies as compared with the same period in the prior year. We calculate the foreign currency impact on our operating expenses as the difference between operating expenses translated at current exchange rates and the same expenses translated at prior-period exchange rates. Given that we began to invoice and collect in currencies other than the U.S. Dollar during the second quarter of 2009, we will not be able to determine the year-over-year impact of foreign currency fluctuations on our revenues for the periods disclosed until we have a full year of prior-year comparable information.
To manage the risk associated with fluctuations in foreign currency exchange rates, we utilize derivative financial instruments, such as foreign currency forward contracts. We enter into foreign currency forward contracts to hedge a portion of our net outstanding monetary assets and liabilities against movements in certain foreign exchange rates. Our foreign currency forward contracts are generally traded on a monthly basis with a typical contractual term of one month. As of December 31, 2010, we had outstanding forward contracts with a total notional value of $238.9 million. The fair value of these forward contracts was immaterial as of December 31, 2010. There can be no assurance that our hedging activities will adequately protect us against the risks associated with foreign currency fluctuations. A hypothetical adverse foreign currency exchange rate movement of 10% would have resulted in a potential loss in fair value of our foreign currency forward contracts of $23.9 million as of December 31, 2010. This sensitivity analysis disregards any potentially offsetting gain that may be associated with the underlying foreign-currency denominated assets and liabilities that VMware hedges.
67
This analysis also assumes a parallel adverse shift of all foreign currency exchange rates against the U.S. Dollar; however, foreign currency exchange rates do not always move in such a manner and actual results may differ materially. We do not enter into speculative foreign exchange contracts for trading purposes. See Note D to the consolidated financial statements for further information.
Interest Rate Risk
Fixed Income Securities
During the second quarter of 2010, we began investing in fixed income securities. Our fixed income investment portfolio is denominated in U.S. Dollars and consists of various holdings, types and maturities.
Our primary objective for holding fixed income securities is to achieve an appropriate investment return consistent with preserving principal and managing risk. At any time, a sharp rise in interest rates or credit spreads could have a material adverse impact on the fair value of our fixed income investment portfolio. Hypothetical changes in interest rates of 50 basis points and 100 basis points would have changed the fair value of our fixed income investment portfolio as of December 31, 2010 by $7.6 million and $15.1 million, respectively. This sensitivity analysis assumes a parallel shift of all interest rates, however, interest rates do not always move in such a manner and actual results may differ materially. We monitor our interest rate and credit risk, including our credit exposures to specific rating categories and to individual issuers. There were no impairment charges on our cash equivalents and fixed income securities during 2010. These instruments are not leveraged and we do not enter into speculative securities for trading purposes. See Notes C and D to the consolidated financial statements for further information.
Note Payable to EMC
As of December 31, 2010, $450.0 million was outstanding on our consolidated balance sheet in relation to the note payable with EMC. The interest rate on the note payable was 0.84% as of both December 31, 2010 and 2009 and 4.43% as of December 31, 2008. In 2010, 2009 and 2008, $4.1 million, $6.5 million and $18.6 million, respectively, of interest expense was recorded related to the note payable.
The note may be repaid, without penalty, at any time. The note matures in April 2012 and bears an interest rate of the 90-day LIBOR plus 55 basis points, with interest payable quarterly in arrears. The interest rate on the note resets quarterly and is determined on the two business days prior to the first day of each fiscal quarter. If the interest rate on the note payable were to change 100 basis points from the December 31, 2010 rate and assuming no additional repayments on the principal were made, our annual interest expense would change by $4.5 million.
Equity Price Risk
Our investments in equity securities expose us to market risk associated with publicly traded equity securities. These investments are classified as short-term investments on our consolidated balance sheets. A hypothetical change of 10% and 20% in the publicly traded price for our investments in equity securities would have changed the fair value of these investments by $5.2 million and $10.4 million, respectively, as of December 31, 2010.
68
| ITEM 8. | FINANCIAL STATEMENTS AND SUPPLEMENTARY DATA |
VMware, Inc.
INDEX TO CONSOLIDATED FINANCIAL STATEMENTS AND SCHEDULE
Report of Independent Registered Public Accounting Firm | 70 | |||
Consolidated Statements of Cash Flows for the years ended December 31, 2010, 2009 and 2008 | 71 | |||
Consolidated Statements of Income for the years ended December 31, 2010, 2009 and 2008 | 72 | |||
Consolidated Balance Sheets at December 31, 2010 and 2009 | 73 | |||
Consolidated Statements of Stockholders' Equity for the years ended December 31, 2010, 2009 and 2008 | 74 | |||
Notes to Consolidated Financial Statements | 75 | |||
Schedule: | ||||
Schedule II-Valuation and Qualifying Accounts | 114 |
Note: All other financial statement schedules are omitted because they are not applicable or the required information is included in the consolidated financial statements or notes thereto.
69
REPORT OF INDEPENDENT REGISTERED PUBLIC ACCOUNTING FIRM
To the Stockholders and Board of Directors of VMware, Inc.:
In our opinion, the consolidated financial statements listed in the accompanying index present fairly, in all material respects, the financial position of VMware, Inc. and its subsidiaries at December 31, 2010 and 2009, and the results of their operations and their cash flows for each of the three years in the period ended December 31, 2010 in conformity with accounting principles generally accepted in the United States of America. In addition, in our opinion, the financial statement schedule listed in the accompanying index presents fairly, in all material respects, the information set forth therein when read in conjunction with the related consolidated financial statements. Also in our opinion, the Company maintained, in all material respects, effective internal control over financial reporting as of December 31, 2010, based on criteria established in Internal Control-Integrated Framework issued by the Committee of Sponsoring Organizations of the Treadway Commission (COSO). The Company's management is responsible for these financial statements and financial statement schedule, for maintaining effective internal control over financial reporting and for its assessment of the effectiveness of internal control over financial reporting, included in Management's Report on Internal Control over Financial Reporting appearing under Item 9A. Our responsibility is to express opinions on these financial statements, on the financial statement schedule, and on the Company's internal control over financial reporting based on our audits which were integrated audits in 2010 and 2009. We conducted our audits in accordance with the standards of the Public Company Accounting Oversight Board (United States). Those standards require that we plan and perform the audits to obtain reasonable assurance about whether the financial statements are free of material misstatement and whether effective internal control over financial reporting was maintained in all material respects. Our audits of the financial statements included examining, on a test basis, evidence supporting the amounts and disclosures in the financial statements, assessing the accounting principles used and significant estimates made by management, and evaluating the overall financial statement presentation. Our audit of internal control over financial reporting included obtaining an understanding of internal control over financial reporting, assessing the risk that a material weakness exists, and testing and evaluating the design and operating effectiveness of internal control based on the assessed risk. Our audits also included performing such other procedures as we considered necessary in the circumstances. We believe that our audits provide a reasonable basis for our opinions.
A company's internal control over financial reporting is a process designed to provide reasonable assurance regarding the reliability of financial reporting and the preparation of financial statements for external purposes in accordance with generally accepted accounting principles. A company's internal control over financial reporting includes those policies and procedures that (i) pertain to the maintenance of records that, in reasonable detail, accurately and fairly reflect the transactions and dispositions of the assets of the company; (ii) provide reasonable assurance that transactions are recorded as necessary to permit preparation of financial statements in accordance with generally accepted accounting principles, and that receipts and expenditures of the company are being made only in accordance with authorizations of management and directors of the company; and (iii) provide reasonable assurance regarding prevention or timely detection of unauthorized acquisition, use, or disposition of the company's assets that could have a material effect on the financial statements.
Because of its inherent limitations, internal control over financial reporting may not prevent or detect misstatements. Also, projections of any evaluation of effectiveness to future periods are subject to the risk that controls may become inadequate because of changes in conditions, or that the degree of compliance with the policies or procedures may deteriorate.
/s/ PricewaterhouseCoopers LLP
San Jose, California
February 28, 2011
70
VMware, Inc.
CONSOLIDATED STATEMENTS OF CASH FLOWS
(in thousands)
| For the Year Ended December 31, | ||||||||||||
| 2010 | 2009 | 2008 | ||||||||||
Operating activities: | ||||||||||||
Net income | $ | 357,439 | $ | 197,098 | $ | 290,133 | ||||||
Adjustments to reconcile net income to net cash provided by operating activities: | ||||||||||||
Depreciation and amortization | 260,551 | 198,486 | 158,628 | |||||||||
Stock-based compensation, excluding amounts capitalized | 291,691 | 231,456 | 166,516 | |||||||||
Excess tax benefits from stock-based compensation | (223,457 | ) | (26,214 | ) | (85,776 | ) | ||||||
Other | 13,083 | 2,816 | 8,663 | |||||||||
Changes in assets and liabilities, net of acquisitions: | ||||||||||||
Accounts receivable | (77,121 | ) | (193,610 | ) | (52,527 | ) | ||||||
Other assets | (79,431 | ) | (14,181 | ) | (21,910 | ) | ||||||
Due to/from EMC, net | (28,508 | ) | (64,762 | ) | 40,348 | |||||||
Accounts payable | 8,881 | (17,886 | ) | 3,012 | ||||||||
Accrued expenses | 120,880 | 124,685 | 22,930 | |||||||||
Income taxes receivable from EMC | 2,508 | 107,927 | (111,050 | ) | ||||||||
Income taxes payable | 89,439 | 32,779 | 26,623 | |||||||||
Deferred income taxes, net | (56,948 | ) | (40,476 | ) | 38,908 | |||||||
Unearned revenue | 495,382 | 447,498 | 315,633 | |||||||||
Net cash provided by operating activities | 1,174,389 | 985,616 | 800,131 | |||||||||
Investing activities: | ||||||||||||
Additions to property and equipment | (131,695 | ) | (103,375 | ) | (191,596 | ) | ||||||
Capitalized software development costs | (64,149 | ) | (68,611 | ) | (90,900 | ) | ||||||
Purchases of available-for-sale securities | (2,101,907 | ) | - | - | ||||||||
Sales of available-for-sale securities | 389,251 | - | - | |||||||||
Maturities of available-for-sale securities | 127,054 | - | - | |||||||||
Purchase of strategic investments | (4,800 | ) | (34,665 | ) | (1,750 | ) | ||||||
Sale of strategic investments | 2,648 | - | - | |||||||||
Business acquisitions, net of cash acquired | (292,970 | ) | (356,278 | ) | (138,569 | ) | ||||||
Transfer of net assets under common control | (185,580 | ) | - | - | ||||||||
Decrease in restricted cash | 206 | 549 | 928 | |||||||||
Net cash used in investing activities | (2,261,942 | ) | (562,380 | ) | (421,887 | ) | ||||||
Financing activities: | ||||||||||||
Proceeds from issuance of common stock | 431,306 | 227,666 | 190,107 | |||||||||
Repurchase of common stock | (338,527 | ) | - | - | ||||||||
Excess tax benefits from stock-based compensation | 223,457 | 26,214 | 85,776 | |||||||||
Shares repurchased for tax withholdings on vesting of restricted stock | (86,179 | ) | (31,467 | ) | (44,483 | ) | ||||||
Net cash provided by financing activities | 230,057 | 222,413 | 231,400 | |||||||||
Net increase (decrease) in cash and cash equivalents | (857,496 | ) | 645,649 | 609,644 | ||||||||
Cash and cash equivalents at beginning of the period | 2,486,461 | 1,840,812 | 1,231,168 | |||||||||
Cash and cash equivalents at end of the period | $ | 1,628,965 | $ | 2,486,461 | $ | 1,840,812 | ||||||
Supplemental disclosures of cash flow information: | ||||||||||||
Cash paid for interest | $ | 6,194 | $ | 10,963 | $ | 20,180 | ||||||
Cash paid (refunded) for taxes | 23,428 | (74,362 | ) | 74,549 | ||||||||
Non-cash items: | ||||||||||||
Changes in capital additions, accrued but not paid | $ | (1,338 | ) | $ | (11,303 | ) | $ | 19,566 | ||||
Capitalization of facilities under financing lease transaction | - | - | 19,077 | |||||||||
Fair value of stock options assumed in acquisition | - | 16,187 | 2,388 | |||||||||
The accompanying notes are an integral part of the consolidated financial statements.
71
VMware, Inc.
CONSOLIDATED STATEMENTS OF INCOME
(in thousands, except per share amounts)
| For the Year Ended December 31, | ||||||||||||
| 2010 | 2009 | 2008 | ||||||||||
Revenues: | ||||||||||||
License | $ | 1,401,424 | $ | 1,029,442 | $ | 1,178,142 | ||||||
Services | 1,455,919 | 994,495 | 702,885 | |||||||||
| 2,857,343 | 2,023,937 | 1,881,027 | ||||||||||
Operating expenses (1) : | ||||||||||||
Cost of license revenues | 177,458 | 126,686 | 88,156 | |||||||||
Cost of services revenues | 316,257 | 233,042 | 215,949 | |||||||||
Research and development | 652,968 | 496,552 | 429,204 | |||||||||
Sales and marketing | 1,013,281 | 736,383 | 654,083 | |||||||||
General and administrative | 269,386 | 211,979 | 181,110 | |||||||||
Operating income | 427,993 | 219,295 | 312,525 | |||||||||
Investment income | 6,633 | 8,233 | 28,301 | |||||||||
Interest expense with EMC, net | (4,069 | ) | (6,958 | ) | (18,316 | ) | ||||||
Other income (expense), net | (14,182 | ) | 2,879 | (3,225 | ) | |||||||
Income before income taxes | 416,375 | 223,449 | 319,285 | |||||||||
Income tax provision | 58,936 | 26,351 | 29,152 | |||||||||
Net income | $ | 357,439 | $ | 197,098 | $ | 290,133 | ||||||
Net income per weighted-average share, basic for Class A and Class B | $ | 0.87 | $ | 0.50 | $ | 0.75 | ||||||
Net income per weighted-average share, diluted for Class A and Class B | $ | 0.84 | $ | 0.49 | $ | 0.73 | ||||||
Weighted-average shares, basic for Class A and Class B | 409,805 | 394,269 | 385,068 | |||||||||
Weighted-average shares, diluted for Class A and Class B | 423,446 | 399,776 | 397,185 | |||||||||
| ||||||||||||
(1) Includes stock-based compensation as follows: | ||||||||||||
Cost of license revenues | $ | 1,653 | $ | 1,293 | $ | 1,120 | ||||||
Cost of services revenues | 18,478 | 14,874 | 13,485 | |||||||||
Research and development | 164,435 | 121,770 | 77,992 | |||||||||
Sales and marketing | 73,146 | 58,610 | 49,762 | |||||||||
General and administrative | 33,979 | 34,909 | 24,157 | |||||||||
The accompanying notes are an integral part of the consolidated financial statements.
72
VMware, Inc.
CONSOLIDATED BALANCE SHEETS
(in thousands, except per share amounts)
| December | ||||||||
| 2010 | 2009 | |||||||
ASSETS | ||||||||
Current assets: | ||||||||
Cash and cash equivalents | $ | 1,628,965 | $ | 2,486,461 | ||||
Short-term investments | 1,694,675 | 27,360 | ||||||
Accounts receivable, net | 614,726 | 534,196 | ||||||
Due from EMC, net | 55,481 | 26,402 | ||||||
Deferred tax asset, current portion | 100,689 | 63,360 | ||||||
Other current assets | 203,119 | 44,701 | ||||||
Total current assets | 4,297,655 | 3,182,480 | ||||||
Property and equipment, net | 419,065 | 402,356 | ||||||
Capitalized software development costs, net and other | 151,945 | 169,293 | ||||||
Deferred tax asset, net of current portion | 149,126 | 102,529 | ||||||
Intangible assets, net | 210,928 | 94,557 | ||||||
Goodwill | 1,568,600 | 1,115,769 | ||||||
Total assets | $ | 6,797,319 | $ | 5,066,984 | ||||
| LIABILITIES AND STOCKHOLDERS' EQUITY | ||||||||
Current liabilities: | ||||||||
Accounts payable | $ | 58,913 | $ | 50,566 | ||||
Accrued expenses and other | 459,813 | 334,523 | ||||||
Unearned revenue, current portion | 1,270,426 | 908,953 | ||||||
Total current liabilities | 1,789,152 | 1,294,042 | ||||||
Note payable to EMC | 450,000 | 450,000 | ||||||
Unearned revenue, net of current portion | 589,668 | 416,345 | ||||||
Deferred tax liability | 30,096 | 60,300 | ||||||
Other liabilities | 129,960 | 103,346 | ||||||
Total liabilities | 2,988,876 | 2,324,033 | ||||||
Commitments and contingencies (see Note J) | ||||||||
Stockholders' equity: | ||||||||
Class A common stock, par value $.01; authorized 2,500,000 shares; issued and outstanding 116,701 and 102,785 shares | 1,167 | 1,028 | ||||||
Class B convertible common stock, par value $.01; authorized 1,000,000 shares; issued and outstanding 300,000 shares | 3,000 | 3,000 | ||||||
Additional paid-in capital | 2,955,971 | 2,263,129 | ||||||
Accumulated other comprehensive income | 19,635 | 4,563 | ||||||
Retained earnings | 828,670 | 471,231 | ||||||
Total stockholders' equity | 3,808,443 | 2,742,951 | ||||||
Total liabilities and stockholders' equity | $ | 6,797,319 | $ | 5,066,984 | ||||
The accompanying notes are an integral part of the consolidated financial statements
73
VMware, Inc.
CONSOLIDATED STATEMENTS OF STOCKHOLDERS' EQUITY
(in thousands)
| Class
A Common Stock | Class B Convertible Common Stock | Additional Paid-in Capital | Retained Earnings (Accumulated Deficit) | Accumulated Other Comprehensive Income | Stockholders' Equity | |||||||||||||||||||||||||||
| Shares | Par Value | Shares | Par Value | |||||||||||||||||||||||||||||
Balance, January 1, 2008 | 82,924 | $ | 829 | 300,000 | $ | 3,000 | $ | 1,352,788 | $ | (16,000 | ) | $ | - | $ | 1,340,617 | |||||||||||||||||
Proceeds from issuance of common stock | 8,247 | 82 | - | - | 190,025 | - | - | 190,107 | ||||||||||||||||||||||||
Issuance of stock options in acquisition | - | - | - | - | 2,388 | - | - | 2,388 | ||||||||||||||||||||||||
Issuance of restricted stock, net of cancellations | 104 | 1 | - | - | (1 | ) | - | - | - | |||||||||||||||||||||||
Shares repurchased or withheld and retired for tax withholdings on vesting of restricted stock | (827 | ) | (8 | ) | - | - | (44,475 | ) | - | - | (44,483 | ) | ||||||||||||||||||||
Stock-based compensation | - | - | - | - | 190,622 | - | - | 190,622 | ||||||||||||||||||||||||
Excess tax benefits from stock- based compensation | - | - | - | - | 85,776 | - | - | 85,776 | ||||||||||||||||||||||||
Credit from tax sharing arrangement (see Note A) | - | - | - | - | 5,242 | - | - | 5,242 | ||||||||||||||||||||||||
Capital contribution by EMC (see Note A) | - | - | - | - | 9,665 | - | - | 9,665 | ||||||||||||||||||||||||
Net income | - | - | - | - | - | 290,133 | - | 290,133 | ||||||||||||||||||||||||
Balance, December 31, 2008 | 90,448 | 904 | 300,000 | 3,000 | 1,792,030 | 274,133 | - | 2,070,067 | ||||||||||||||||||||||||
Proceeds from issuance of common stock | 10,423 | 104 | - | - | 228,464 | - | - | 228,568 | ||||||||||||||||||||||||
Issuance of stock options in acquisition | - | - | - | - | 16,187 | - | - | 16,187 | ||||||||||||||||||||||||
Issuance of restricted stock, net of cancellations | 2,944 | 30 | - | - | (30 | ) | - | - | - | |||||||||||||||||||||||
Shares repurchased or withheld and retired for tax withholdings on vesting of restricted stock | (1,030 | ) | (10 | ) | - | - | (31,457 | ) | - | - | (31,467 | ) | ||||||||||||||||||||
Stock-based compensation | - | - | - | - | 246,039 | - | - | 246,039 | ||||||||||||||||||||||||
Excess tax benefits from stock- based compensation | - | - | - | - | 19,887 | - | - | 19,887 | ||||||||||||||||||||||||
Amounts due from tax sharing arrangement (see Note A) | - | - | - | - | (7,991 | ) | - | - | (7,991 | ) | ||||||||||||||||||||||
Unrealized gain on available-for- sale securities, net of tax (see Note L) | - | - | - | - | - | - | 4,563 | 4,563 | ||||||||||||||||||||||||
Net income | - | - | - | - | - | 197,098 | - | 197,098 | ||||||||||||||||||||||||
Balance, December 31, 2009 | 102,785 | 1,028 | 300,000 | 3,000 | 2,263,129 | 471,231 | 4,563 | 2,742,951 | ||||||||||||||||||||||||
Proceeds from issuance of common stock | 17,084 | 171 | - | - | 432,074 | - | - | 432,245 | ||||||||||||||||||||||||
Repurchase and retirement of common stock | (4,909 | ) | (49 | ) | - | - | (338,478 | ) | (338,527 | ) | ||||||||||||||||||||||
Issuance of restricted stock, net of cancellations | 2,998 | 30 | - | - | (30 | ) | - | - | - | |||||||||||||||||||||||
Shares repurchased or withheld and retired for tax withholdings on vesting of restricted stock | (1,258 | ) | (13 | ) | - | - | (87,047 | ) | - | - | (87,060 | ) | ||||||||||||||||||||
Stock-based compensation | - | - | - | - | 302,923 | - | - | 302,923 | ||||||||||||||||||||||||
Excess tax benefits from stock- based compensation | - | - | - | - | 218,883 | - | - | 218,883 | ||||||||||||||||||||||||
Credit from tax sharing arrangement (see Note A) | - | - | - | - | 7,231 | - | - | 7,231 | ||||||||||||||||||||||||
Unrealized gain on available- for-sale securities, net of tax (see Note L) | - | - | - | - | - | - | 15,072 | 15,072 | ||||||||||||||||||||||||
Capital contribution from EMC, net (see Note E) | - | - | - | - | 157,286 | - | - | 157,286 | ||||||||||||||||||||||||
Net income | - | - | - | - | - | 357,439 | - | 357,439 | ||||||||||||||||||||||||
Balance, December 31, 2010 | 116,700 | $ | 1,167 | 300,000 | $ | 3,000 | $ | 2,955,971 | $ | 828,670 | $ | 19,635 | $ | 3,808,443 | ||||||||||||||||||
The accompanying notes are an integral part of the consolidated financial statements
74
VMware, Inc.
NOTES TO CONSOLIDATED FINANCIAL STATEMENTS
A. Overview and Basis of Presentation
Company and Background
VMware, Inc. ("VMware" or the "Company") is the leading provider of virtualization infrastructure software solutions from the desktop to the data center and to the cloud. VMware's virtualization infrastructure software solutions run on industry-standard desktop computers and servers and support a wide range of operating system and application environments, as well as networking and storage infrastructures.
Accounting Principles
The financial statements and accompanying notes are prepared in accordance with accounting principles generally accepted in the United States of America.
Basis of Presentation
VMware was incorporated as a Delaware corporation in 1998 and continues to operate in large measure as a stand-alone company following the Company's acquisition by EMC Corporation ("EMC") in 2004 and following VMware's initial public offering of VMware's Class A common stock in August 2007. As of December 31, 2010, EMC holds approximately 80% of VMware's outstanding common stock, including 33.0 million shares of VMware's Class A common stock and all of VMware's Class B common stock. VMware is considered a "controlled company" under the rules of the New York Stock Exchange. VMware historically has received, and continues to receive, certain administrative services from EMC, and VMware and EMC engage in certain intercompany transactions. Costs incurred by EMC for the direct benefit of VMware, such as rent, salaries and benefits, plus a mark-up intended to approximate third-party costs, are included in VMware's consolidated financial statements. Management believes the assumptions underlying the consolidated financial statements are reasonable. However, the amounts recorded for VMware's intercompany transactions with EMC would not be considered arm's length with an unrelated third party by nature of EMC's majority ownership of VMware. Therefore, the financial statements included herein may not necessarily reflect the cash flows, results of operations and financial condition had VMware engaged in such transactions with an unrelated third party during all periods presented. Accordingly, VMware's historical financial information is not necessarily indicative of what the Company's cash flows, results of operations and financial condition will be in the future if and when VMware contracts at arm's-length with unrelated third parties for services the Company has received and currently receives from EMC.
Upon retirement of repurchased shares, VMware historically recorded the excess of the cost of treasury stock over its par value as a reduction of retained earnings. Effective 2010, the Company has reflected these amounts as a reduction of additional-paid-in-capital and reclassified historical results accordingly. The amounts reclassified were not material to VMware's consolidated financial statements and did not have an effect on VMware's total stockholders' equity.
Prior period financial statements have been reclassified to conform to current period presentation.
Principles of Consolidation
The consolidated financial statements include the accounts of VMware and its subsidiaries. All intercompany transactions and balances between VMware and its subsidiaries have been eliminated. All intercompany transactions with EMC in the consolidated statements of cash flows will be settled in cash, and changes in the intercompany balances are presented as a component of cash flows from operating activities.
75
VMware, Inc.
NOTES TO CONSOLIDATED FINANCIAL STATEMENTS (continued)
Use of Accounting Estimates
The preparation of financial statements in conformity with generally accepted accounting principles requires management to make estimates and assumptions that affect the reported amounts of assets and liabilities, the reported amounts of revenues and expenses during the reporting periods, and the disclosure of contingent liabilities at the date of the financial statements. Estimates are used for, but not limited to, capitalized software development costs, trade receivable valuation, certain accrued liabilities, useful lives of fixed assets and intangible assets, valuation of acquired intangibles, revenue reserves, income taxes, stock-based compensation and contingencies. Actual results could differ from those estimates.
Revenue Recognition
VMware derives revenues from the licensing of software and related services. VMware recognizes revenues when persuasive evidence of an arrangement exists, delivery has occurred, the sales price is fixed or determinable, and collectibility is probable.
The following summarizes the major terms of VMware's contractual relationships with customers and the manner in which VMware accounts for sales transactions.
License revenues
VMware recognizes revenues from the sale of software licenses when risk of loss transfers, which is generally upon electronic shipment.
VMware licenses most of its software under perpetual licenses through its channel of distributors, resellers, system vendors, systems integrators and through its direct sales force. VMware also licenses certain software products on a subscription basis. To the extent VMware offers product promotions and the promotional products are not yet available, the revenue for the entire order is deferred until such time as all product obligations have been fulfilled. Revenues relating to products that have shipped into a channel are deferred until the products are sold through the channel. VMware obtains sell-through information from distributors and certain resellers on a monthly basis. For VMware's channel partners who do not report sell-through data, VMware determines sell-through information based on payment of such distributors' and certain resellers' accounts receivable balances and other relevant factors. For software sold by system vendors that is bundled with their hardware, unless the Company has a separate license agreement with the end-user, revenue is recognized in arrears upon the receipt of binding royalty reports.
For all sales, VMware uses one of the following to constitute evidence of an arrangement:
| • | a purchase order or equivalent; |
| • | a license agreement and a purchase order or equivalent; |
| • | a license agreement which includes language that the agreement also serves as the purchase order; or |
| • | a master agreement and a binding royalty report. |
Sales through distributors and resellers are evidenced by a master distribution agreement, together with purchase orders or equivalent, on a transaction-by-transaction basis.
With limited exceptions, VMware's return policy does not allow product returns for a refund. Certain distributors and resellers may rotate stock when new versions of a product are released. VMware estimates future
76
VMware, Inc.
NOTES TO CONSOLIDATED FINANCIAL STATEMENTS (continued)
product returns at the time of sale based on historical return rates, levels of inventory held by distributors and resellers, and other relevant factors. Returns have not been material to date and have been in line with VMware's expectations.
VMware offers rebates to certain channel partners. When rebates are based on a set percentage of actual sales, VMware recognizes the amount of the rebates as a reduction of revenues when the underlying revenue is recognized. When rebates are earned only if a cumulative level of sales is achieved, VMware recognizes the amount of the rebates as a reduction of revenues proportionally for each sale that is required to achieve the target.
VMware also offers marketing development funds to certain channel partners. VMware records the amount of the marketing development funds, based on the maximum potential liability, as a reduction of revenues at the time the underlying revenue is recognized.
Services revenues
Services revenues consist of software maintenance and professional services. VMware recognizes software maintenance revenues ratably over the contract period, which typically ranges from one to five years. Professional services include design, implementation and training. Professional services are not considered essential to the functionality of VMware's products as these services do not alter the product capabilities and may be performed by customers or other vendors. Professional services engagements performed for a fixed fee, for which VMware is able to make reasonably dependable estimates of progress toward completion, are recognized on a proportional performance basis based on hours and direct expenses incurred. Professional services engagements that are on a time and materials basis are recognized based upon hours incurred. Revenues on all other professional services engagements are recognized upon completion.
Multiple-element arrangements
VMware software products are typically sold with software maintenance services. Vendor-specific objective evidence ("VSOE") of fair value for software maintenance services is established by the rates charged in stand-alone sales of software maintenance contracts or the stated renewal rate for software maintenance included in the license agreement. VMware software products may also be sold with professional services. VSOE of fair value for professional services is based upon the standard rates VMware charges for such services when sold separately. VMware perpetual software products may be sold with products licensed on a subscription basis. VSOE of fair value for subscription license products is established by the rates charged in stand-alone sales of subscription license products. The revenues allocated to the software license included in multiple-element contracts represent the residual amount of the contract after the fair value of the other elements has been determined. If VMware is unable to establish VSOE of fair value for one of the undelivered elements included in a multiple-element contract, the revenue is deferred until VSOE of fair value for the undelivered element has been established or the element has been delivered. If the element involves time-based delivery, the entire arrangement is recognized ratably over the delivery period.
Customers under software maintenance agreements are entitled to receive updates and upgrades on a when-and-if-available basis, and various types of technical support based on the level of support purchased. In the event specific features or functionality, entitlements, or the release number of an upgrade have been announced but not delivered, and customers will receive that upgrade as part of a current software maintenance contract, a specified upgrade is deemed created and product revenues are deferred on purchases made after the announcement date until delivery of the upgrade. The amount and elements to be deferred are dependent on whether the company has established VSOE of fair value for the upgrade. On occasion, VSOE of fair value of
77
VMware, Inc.
NOTES TO CONSOLIDATED FINANCIAL STATEMENTS (continued)
these upgrades is established based upon the price set by management. VMware has a history of selling such upgrades on a stand-alone basis.
Unearned revenues include unearned software maintenance fees, professional services fees and license fees.
Foreign Currency Translation
The U.S. Dollar is the functional currency of VMware's foreign subsidiaries. Gains and losses from foreign currency transactions are included in other income (expense), net and were not material on a net basis in any period presented.
Cash and Cash Equivalents and Short-Term Investments
VMware invests a portion of its excess cash primarily in money market funds, highly liquid debt instruments of the U.S. government and its agencies, U.S. municipal obligations, and U.S. and foreign corporate debt securities. VMware classifies all highly liquid investments with maturities of three months or less from date of purchase as cash equivalents and all highly liquid investments with maturities of greater than three months from date of purchase as short-term investments. VMware classifies its investments as available-for-sale. VMware may sell these securities at any time for use in current operations or for other purposes, such as consideration for acquisitions and strategic investments. Consequently, VMware may or may not hold securities with stated maturities greater than twelve months until maturity. As a result, VMware classifies its investments, which include securities with maturities beyond twelve months, as current assets in the accompanying consolidated balance sheets.
VMware carries its fixed income investments, as well as its equity investments in public companies that have readily determinable fair values, at fair value and reports unrealized gains and losses on these investments, net of estimated tax provisions or benefits, in accumulated other comprehensive income, a component of stockholders' equity. Unrealized losses which are determined to be other than temporary, as well as realized gains and losses are recorded to VMware's consolidated statements of income. Realized gains and losses on the sale of fixed income securities issued by the same issuer and of the same type are determined using the first-in first-out ("FIFO") method. Equity investments, for which VMware has the ability to exercise significant influence over the investee, are accounted for using the equity method of accounting. Under the equity method, VMware's investment is initially recorded at cost and subsequently adjusted through other income (expense), net on a go forward basis to recognize VMware's share of the investee's income (loss) after the acquisition date. If at any point VMware's share of the investee's loss exceeds VMware's investment, no further loss is recognized once VMware's investment has been reduced to zero. VMware periodically evaluates whether declines in fair values of its investments below their cost basis are other-than-temporary. This evaluation consists of several qualitative and quantitative factors, including VMware's ability and intent to hold the investment until a forecasted recovery occurs, as well as any decline in the investment quality of the security and the severity and duration of the unrealized loss.
In addition, VMware has restrictions on certain cash amounts pursuant to the terms of various agreements. VMware includes this restricted cash in other current assets in the accompanying consolidated balance sheets. The amount of restricted cash was not material in any period presented.
Allowance for Doubtful Accounts
VMware maintains an allowance for doubtful accounts for estimated probable losses on uncollectible accounts receivable. The allowance is based upon the creditworthiness of VMware's customers, historical
78
VMware, Inc.
NOTES TO CONSOLIDATED FINANCIAL STATEMENTS (continued)
experience, the age of the receivable and current market and economic conditions. Uncollectible amounts are charged against the allowance account. The allowance for doubtful accounts was $4.5 million and $2.5 million as of December 31, 2010 and 2009, respectively.
Property and Equipment, Net
Property and equipment, net are recorded at cost. Depreciation commences upon placing the asset in service and is recognized on a straight-line basis over the estimated useful lives of the assets, as follows:
Buildings | 39 to 51 years | |
Land improvements | 15 years | |
Furniture and fixtures | 5 years | |
Equipment and software | 2 to 5 years | |
Leasehold improvements | Lease term, not to exceed 5 years |
Upon retirement or disposition, the asset cost and related accumulated depreciation are removed with any gain or loss recognized as operating expenses in the consolidated statements of income. Repair and maintenance costs that do not extend the economic life of the underlying assets are expensed as incurred.
Research and Development and Capitalized Software Development Costs
Costs related to research and development ("R&D") are generally charged to expense as incurred. Capitalization of material development costs of software to be sold, leased, or otherwise marketed are subject to capitalization beginning when technological feasibility has been established and ending when the product is available for general release. Judgment is required in determining when technological feasibility is established. Changes in judgment as to when technological feasibility is established, or changes in VMware's business, including go-to-market strategy, would likely materially impact the amount of costs capitalized. For example, if the length of time between technological feasibility and general availability declines in the future, the amount of costs capitalized would likely decrease with a corresponding increase in R&D expense. In addition, VMware's R&D expenses and amounts capitalized as software development costs may not be comparable to VMware's peer companies due to differences in judgment as to when technological feasibility has been reached or differences in judgment regarding when the product is available for general release. Generally accepted accounting principles require annual amortization expense of capitalized software development costs to be the greater of the amounts computed using the ratio of current gross revenue to a product's total current and anticipated revenues, or the straight-line method over the product's remaining estimated economic life. To date, VMware has amortized these costs using the straight-line method as it is the greater of the two amounts. The costs are amortized over periods ranging from 18 to 24 months, which represent the product's estimated economic life. The ongoing assessment of the recoverability of these costs requires considerable judgment by management with respect to certain external factors such as anticipated future revenue, estimated economic life, and changes in software and hardware technologies. Material differences in amortization amounts could occur as a result of changes in the periods over which VMware actually generates revenues or the amounts of revenues generated.
Unamortized software development costs were $103.3 million and $129.4 million as of December 31, 2010 and 2009, respectively, and are included in capitalized software development costs, net and other on the consolidated balance sheet. The $103.3 million of unamortized software development costs as of December 31, 2010 include $1.7 million of capitalized software development costs transferred from EMC in connection with VMware's acquisition of EMC's Ionix IT management business in the second quarter of 2010. See Note E for further information.
79
VMware, Inc.
NOTES TO CONSOLIDATED FINANCIAL STATEMENTS (continued)
For the years ended December 31, 2010, 2009 and 2008, VMware capitalized $71.6 million (including $10.9 million of stock-based compensation), $83.5 million (including $14.9 million of stock-based compensation) and $113.6 million (including $22.7 million of stock-based compensation), respectively, of costs incurred for the development of software products. These amounts have been excluded from R&D expenses on the accompanying consolidated statements of income. Amortization expense from capitalized amounts was $99.5 million, $82.9 million and $51.6 million for the years ended December 31, 2010, 2009 and 2008, respectively. Amortization expense is included in cost of license revenues on the consolidated statements of income.
Intangible Assets and Goodwill
Intangible assets, other than goodwill, are amortized over their estimated useful lives, which range up to 13 years, during which the assets are expected to contribute directly or indirectly to future cash flows. In the years ended December 31, 2010, 2009 and 2008, VMware amortized $34.8 million, $14.1 million and $17.5 million, respectively, for intangible assets.
VMware reviews intangible assets for impairment in the fourth quarter of each year or more frequently if events or changes in business circumstances indicate that the carrying amounts of the assets may not be fully recoverable or that the useful lives of these assets are no longer appropriate.
Goodwill is initially carried at its historical cost. VMware tests goodwill for impairment in the fourth quarter of each year or more frequently if events or changes in circumstances indicate that the asset might be impaired.
To date, there have been no impairments of goodwill or other intangible assets.
Derivative Instruments
Derivative instruments and hedging activities are measured at fair value and reported as a net asset and net liability on the consolidated balance sheet, as applicable.
In order to manage VMware's exposure to foreign currency fluctuations, VMware enters into foreign currency contracts to hedge a portion of VMware's net outstanding monetary asset and liability positions. VMware's foreign currency forward contracts are generally traded on a monthly basis, with a typical contractual term of one month and are adjusted to fair value through other income (expense), net in the consolidated statements of income. The Company does not enter into speculative foreign exchange contracts for trading purposes. See Note D to the consolidated financial statements for further information.
Business Combinations
For business combinations, VMware recognizes the identifiable assets acquired, the liabilities assumed, and any non-controlling interests in an acquiree, which are measured based on the acquisition date fair value. Businesses acquired from EMC are accounted for as a business combination between entities under common control pursuant to generally accepted accounting principles. VMware includes the results of operations of the acquired businesses under common control, if material, in the period of acquisition as if it had occurred at the beginning of the period and retrospectively adjusts financial information presented for prior years. VMware recognizes the net assets under common control at their carrying values as of the date of the transfer and records the excess of the carrying values over the cash consideration as an equity transaction. Goodwill for all other business combinations is measured as the excess of consideration transferred, the fair value of any non-controlling interest, and the fair value of previously held equity interest over the net amounts of the identifiable assets acquired and the liabilities assumed at the acquisition date.
80
VMware, Inc.
NOTES TO CONSOLIDATED FINANCIAL STATEMENTS (continued)
VMware uses significant estimates and assumptions, including fair value estimates, to determine the fair value of assets acquired and liabilities assumed and when applicable the related useful lives of the acquired assets, as of the business combination date. When those estimates are provisional, VMware refines them as necessary, during the measurement period. The measurement period is the period after the acquisition date, not to exceed one year, in which VMware may gather new information about facts and circumstances that existed as of the acquisition date to adjust the provisional amounts recognized. Measurement period adjustments are applied retrospectively. All other adjustments are recorded to the consolidated statements of income.
Costs to effect an acquisition are recorded in general and administrative expenses on the consolidated statements of income as the expenses are incurred.
Advertising
Advertising production costs are expensed as incurred. Advertising expense was $13.7 million, $5.0 million and $9.4 million in the years ended December 31, 2010, 2009 and 2008, respectively.
Income Taxes
Income taxes as presented herein are calculated on a separate tax return basis, although VMware is included in the consolidated tax return of EMC. Deferred tax assets and liabilities are recognized for the expected future tax consequences of events that have been included in the financial statements or tax returns. Deferred tax assets and liabilities are determined based on the difference between the tax basis of assets and liabilities and their reported amounts using enacted tax rates in effect for the year in which the differences are expected to reverse. Tax credits are generally recognized as reductions of income tax provisions in the year in which the credits arise. The measurement of deferred tax assets is reduced by a valuation allowance if, based upon available evidence, it is more likely than not that some or all of the deferred tax assets will not be realized.
VMware does not provide for a U.S. income tax liability on undistributed earnings of VMware's foreign subsidiaries. The earnings of non-U.S. subsidiaries, which reflect full provision for non-U.S. income taxes, are currently indefinitely reinvested in non-U.S. operations or will be remitted substantially free of additional tax.
The difference between the income taxes payable that is calculated on a separate return basis and the amount actually paid to EMC pursuant to VMware's tax sharing agreement (see Note I) is presented as a component of additional paid-in capital.
Earnings Per Share
Basic net income per share is calculated using the weighted-average number of shares of VMware's common stock outstanding during the period. Diluted earnings per share are calculated using the weighted-average number of common shares including the dilutive effect of equity awards as determined under the treasury stock method. VMware has two classes of common stock, Class A and Class B common stock. For purposes of calculating earnings per share, VMware uses the two-class method. As both classes share the same rights in dividends, basic and diluted earnings per share are the same for both classes.
Comprehensive Income
The components of comprehensive income include net income adjusted for (i) unrealized gains (losses) on available-for-sale securities, net of tax, and (ii) reclassification of (gains) losses on available-for-sale securities recognized during the period, net of taxes. See Note L to the consolidated financial statements for more information.
81
VMware, Inc.
NOTES TO CONSOLIDATED FINANCIAL STATEMENTS (continued)
Concentrations of Risks
Financial instruments, which potentially subject VMware to concentrations of credit risk, consist principally of cash and cash equivalents, short-term investments and accounts receivable. Cash on deposit with banks exceeds the amount of insurance provided on such deposits. These deposits may be redeemed upon demand. VMware places cash, cash equivalents and short-term investments primarily in money market funds and fixed income securities and limits the amount of investment with any single issuer and any single financial institution. VMware holds a diversified portfolio of money market funds and fixed income securities, which primarily consist of various highly liquid debt instruments of the U.S. government and its agencies, U.S. municipal obligations, and U.S. and foreign corporate debt securities. VMware's fixed income investment portfolio is denominated in U.S. dollars and consists of securities with various maturities.
VMware monitors the counterparty risk to ensure adequate diversification amongst the financial institutions holding the funds. VMware also monitors counterparty risk to financial institutions with which VMware enters into derivatives to ensure that these financial institutions are of high credit quality.
VMware provides credit to distributors, resellers, and certain end-user customers in the normal course of business. Credit is generally extended to new customers based upon a credit evaluation. Credit is extended to existing customers based on ongoing credit evaluations, prior payment history and demonstrated financial stability.
As of December 31, 2010, three distributors accounted for 18%, 13% and 12%, respectively, of VMware's accounts receivable balance. As of December 31, 2009, one distributor accounted for 18% and two distributors accounted for 13% each, respectively, of VMware's accounts receivable balance.
One distributor accounted for 13% of revenues in 2010 and 16% of revenues in both 2009 and 2008, respectively, and another distributor accounted for 11%, 15% and 18% of revenues in 2010, 2009 and 2008, respectively. A third distributor accounted for 10% of revenues in 2010, but less than 10% in 2009 and 2008. One channel partner accounted for less than 10% of revenues in 2010 and 2009, but accounted for 11% of revenues in 2008, respectively.
Accounting for Stock-Based Compensation
VMware utilizes the Black-Scholes option-pricing model to determine the fair value of VMware's stock option awards. The Black-Scholes model includes assumptions regarding dividend yields, expected volatility, expected term and risk-free interest rates. These assumptions reflect the Company's best estimates, but these items involve uncertainties based on market and other conditions outside of the Company's control. VMware restricted stock unit awards are valued based on the Company's stock price on the date of grant. VMware recognizes compensation cost on a straight-line basis over the awards' vesting periods for those awards which contain only a service vesting feature.
New Accounting Pronouncements
Revenue Recognition
In September 2009, the Financial Accounting Standards Board ("FASB") issued new standards for multiple-deliverable revenue arrangements. These new standards affect the determination of when individual deliverables included in a multiple-element arrangement may be treated as separate units of accounting. In addition, these new standards modify the manner in which the transaction consideration is allocated across separately identified
82
VMware, Inc.
NOTES TO CONSOLIDATED FINANCIAL STATEMENTS (continued)
deliverables, eliminate the use of the residual value method of allocating arrangement consideration and require expanded disclosure. These new standards became effective for us for multiple-element arrangements entered into or materially modified on or after January 1, 2011. VMware has determined that these new standards did not have an impact on VMware's consolidated financial statements as the Company's business is currently conducted.
Software
In September 2009, the FASB issued amended standards for the accounting for certain revenue arrangements that include software elements. These new standards amend pre-existing software revenue guidance by removing from its scope tangible products that contain both software and non-software components that function together to deliver the product's functionality. These amended standards became effective for VMware for revenue arrangements entered into or materially modified on or after January 1, 2011. VMware has determined that these new standards are not applicable to the Company's business and will not have an impact on its consolidated financial statements.
Consolidations
In December 2009, the FASB issued standards for consolidation of variable interest entities ("VIEs") primarily related to the determination of the primary beneficiary of the VIE. These amended standards became effective for VMware on January 1, 2010. The adoption of these standards did not have a material impact on VMware's consolidated financial position and results of operations. These amended standards may, however, have an impact on accounting for any changes to existing relationships or future investments.
B. Earnings per Share
Basic net income per share is computed by dividing net income by the weighted-average number of common shares outstanding during the period. Diluted net income per share is computed by dividing net income by the weighted-average number of common shares outstanding and potentially dilutive securities, as calculated using the treasury stock method, outstanding during the period. Potentially dilutive securities include stock options, unvested restricted stock units, unvested restricted stock awards, other unvested restricted stock, and purchase options under VMware's employee stock purchase plan. Securities are excluded from the computations of diluted net income per share if their effect would be anti-dilutive. As of December 31, 2010, VMware had 116.4 million shares of Class A common stock and 300.0 million shares of Class B common stock outstanding that were included in the calculation of basic earnings per share. VMware uses the two-class method to calculate earnings per share as both classes share the same rights in dividends, therefore basic and diluted earnings per share are the same for both classes.
The following table sets forth the computations of basic and diluted net income per share (table in thousands, except per share data):
| For the Year Ended December 31, | ||||||||||||
| 2010 | 2009 | 2008 | ||||||||||
Net income | $ | 357,439 | $ | 197,098 | $ | 290,133 | ||||||
Weighted-average shares, basic for Class A and Class B | 409,805 | 394,269 | 385,068 | |||||||||
Effect of dilutive securities | 13,641 | 5,507 | 12,117 | |||||||||
Weighted-average shares, diluted for Class A and Class B | 423,446 | 399,776 | 397,185 | |||||||||
Net income per weighted-average share, basic for Class A and Class B | $ | 0.87 | $ | 0.50 | $ | 0.75 | ||||||
Net income per weighted-average share, diluted for Class A and Class B | $ | 0.84 | $ | 0.49 | $ | 0.73 | ||||||
83
VMware, Inc.
NOTES TO CONSOLIDATED FINANCIAL STATEMENTS (continued)
For the years ended December 31, 2010, 2009 and 2008, stock options to purchase 2.9 million, 20.6 million and 11.4 million shares, respectively, of VMware Class A common stock were excluded from the diluted earnings per share calculations because their effect would have been anti-dilutive. For the years ended December 31, 2010, 2009 and 2008, 0.1 million, 2.9 million and 5.4 million shares of restricted stock were excluded from the diluted earnings per share calculations because their effect would have been anti-dilutive.
C. Investments
During 2010, VMware began investing in fixed income securities. Investments as of December 31, 2010 consisted of the following (table in thousands):
| Cost or Amortized Cost | Unrealized Gains | Unrealized Losses | Aggregate Fair Value | |||||||||||||
U.S. government and agency obligations | $ | 379,288 | $ | 326 | $ | (310 | ) | $ | 379,304 | |||||||
U.S. and foreign corporate debt securities | 522,677 | 724 | (286 | ) | 523,115 | |||||||||||
Foreign governments and multi-national agency obligations | 63,101 | 72 | (13 | ) | 63,160 | |||||||||||
Municipal obligations | 660,138 | 111 | (762 | ) | 659,487 | |||||||||||
Asset-backed securities | 17,800 | 9 | - | 17,809 | ||||||||||||
Total fixed income securities | 1,643,004 | 1,242 | (1,371 | ) | 1,642,875 | |||||||||||
Equity securities | 20,000 | 31,800 | - | 51,800 | ||||||||||||
Total investments | $ | 1,663,004 | $ | 33,042 | $ | (1,371 | ) | $ | 1,694,675 | |||||||
Gross realized gains and gross realized losses on investments in the year ended December 31, 2010 were not material.
As of December 31, 2010, VMware did not have investments in a continuous unrealized loss position for twelve months or greater. Unrealized losses on investments as of December 31, 2010 that have been in a net loss position for less than twelve months were classified by investment category as follows (table in thousands):
| Fair Value | Gross Unrealized Losses | |||||||
U.S. government and agency obligations | $ | 109,932 | $ | (310 | ) | |||
U.S. and foreign corporate debt securities | 149,831 | (286 | ) | |||||
Foreign governments and multi-national agency obligations | 26,415 | (13 | ) | |||||
Municipal obligations | 412,882 | (762 | ) | |||||
Total investments | $ | 699,060 | $ | (1,371 | ) | |||
VMware evaluated its investments in fixed income securities and publicly traded equity securities as of December 31, 2010 and determined that there were no unrealized losses that indicated an other-than-temporary impairment.
84
VMware, Inc.
NOTES TO CONSOLIDATED FINANCIAL STATEMENTS (continued)
Contractual Maturities
The contractual maturities of investments held at December 31, 2010 consisted of the following (table in thousands):
| Amortized Cost Basis | Aggregate Fair Value | |||||||
Due within one year | $ | 753,201 | $ | 753,370 | ||||
Due after 1 year through 5 years | 776,933 | 776,635 | ||||||
Due after 5 years | 112,870 | 112,870 | ||||||
Total | $ | 1,643,004 | $ | 1,642,875 | ||||
D. Fair Value Measurements and Derivative Instruments
Fair Value Measurements
Generally accepted accounting principles provide that fair value is an exit price, representing the amount that would be received to sell an asset or paid to transfer a liability in an orderly transaction between market participants. As such, fair value is a market-based measurement that is determined based on assumptions that market participants would use in pricing an asset or liability. As a basis for considering such assumptions, generally accepted accounting principles established a three-tier value hierarchy, which prioritizes the inputs used in measuring fair value as follows: (Level 1) inputs are quoted prices in active markets for identical assets or liabilities; (Level 2) inputs other than the quoted prices included within Level 1 that are observable for the assets or liabilities, either directly or indirectly; and (Level 3) unobservable inputs for the assets or liabilities in which there is little or no market data, which requires VMware to develop its own assumptions.
VMware's Level 1 classification of the fair value hierarchy includes money market funds, available-for-sale equity securities and certain available-for-sale fixed income securities because these securities are valued using quoted prices in active markets for identical assets. VMware's Level 2 classification includes the remainder of the available-for-sale fixed income securities because these securities are priced using quoted market prices for similar instruments and non-binding market prices that are corroborated by observable market data.
The following table sets forth the fair value hierarchy of VMware's money market funds and available-for-sale securities, including those securities classified within cash and cash equivalents on the consolidated balance sheet, that were required to be measured at fair value as of December 31, 2010 (table in thousands):
| Level 1 | Level 2 | Total | ||||||||||
Money-market funds | $ | 1,436,319 | $ | - | $ | 1,436,319 | ||||||
U.S. government and agency obligations | 66,762 | 312,543 | 379,305 | |||||||||
U.S. and foreign corporate debt securities | - | 537,544 | 537,544 | |||||||||
Foreign governments and multi-national agency obligations | - | 63,161 | 63,161 | |||||||||
Municipal obligations | - | 659,487 | 659,487 | |||||||||
Asset-backed securities | - | 55,749 | 55,749 | |||||||||
Equity securities | 51,800 | - | 51,800 | |||||||||
Total cash equivalents and investments | $ | 1,554,881 | $ | 1,628,484 | $ | 3,183,365 | ||||||
85
VMware, Inc.
NOTES TO CONSOLIDATED FINANCIAL STATEMENTS (continued)
VMware's valuation inputs for foreign currency forward contracts are based on quoted prices and quoted pricing intervals from public data sources. These contracts are typically classified within Level 2 of the fair value hierarchy and are discussed below in the derivative instruments section. VMware does not have any assets or liabilities that fall into Level 3 of the fair value hierarchy.
Derivative Instruments
In May 2009, VMware started to invoice and collect in the Euro, the British Pound, the Japanese Yen and the Australian Dollar in their respective regions. Since July 2009, in order to manage its exposure to foreign currency fluctuations, VMware has entered into foreign currency forward contracts to hedge a portion of its net outstanding monetary assets and liabilities against movements in certain foreign exchange rates. These forward contracts are not designated as hedging instruments under applicable accounting guidance, and therefore all changes in the fair value of the forward contracts are reported in other income (expense), net in the consolidated statements of income. The gains and losses on VMware's foreign currency forward contracts generally offset the majority of the gains and losses associated with the underlying foreign-currency denominated assets and liabilities that VMware hedges. VMware does not enter into speculative foreign exchange contracts for trading purposes.
VMware's foreign currency forward contracts are generally traded on a monthly basis with a typical contractual term of one month. As of December 31, 2010, VMware had outstanding forward contracts with a total notional value of $238.9 million. The fair value of these forward contracts was immaterial as of December 31, 2010 and therefore excluded from the table above. The fair value was measured under Level 2 sources as discussed above.
E. Business Combinations, Goodwill and Intangible Assets, Net
Business Combinations
The results of operations of all acquired companies and transferred net assets mentioned below have been included in VMware's consolidated financial statements from the respective dates of purchase or transfer, as applicable. Pro forma results of operations have not been presented as the results of the acquired companies and transferred net assets, prior to being acquired by VMware, were not material, individually or in aggregate, to the consolidated results of operations in the years ended December 31, 2010, 2009 or 2008.
86
VMware, Inc.
NOTES TO CONSOLIDATED FINANCIAL STATEMENTS (continued)
Fiscal Year 2010
Business Acquisitions
In the year ended December 31, 2010, VMware acquired six companies, which were not material to VMware's consolidated financial statements, either individually or in the aggregate. The aggregate consideration for these acquisitions was $293.0 million, net of cash acquired. The following table summarizes the allocation of the consideration paid to the fair value of the tangible and intangible assets acquired and liabilities assumed (table in thousands):
Other current assets | $ | 6,328 | ||
Intangible assets | 114,100 | |||
Goodwill | 178,160 | |||
Deferred tax assets | 48,323 | |||
Total tangible and intangible assets acquired | 346,911 | |||
Unearned revenue | (21,425 | ) | ||
Deferred tax liabilities | (30,103 | ) | ||
Accrued liabilities and other | (2,413 | ) | ||
Total liabilities assumed | (53,941 | ) | ||
Fair value of tangible and intangible assets acquired and liabilities assumed | $ | 292,970 | ||
Transfer of Net Assets Under Common Control
In April 2010, VMware acquired certain software product technology and expertise from EMC's Ionix information technology ("IT") management business for cash consideration of $175.0 million. The acquired software product technology and expertise complement VMware's existing development efforts and expand its vCenter product family. EMC retained the Ionix brand and continues to offer customers the products acquired by VMware, pursuant to the ongoing reseller agreement between EMC and VMware. Additionally, contingent amounts totaling up to $25.0 million may be payable to EMC by the end of the second anniversary of the transfer. These amounts are contingent on EMC achieving certain revenue milestones.
The net assets and expertise acquired from EMC constituted a business and were accounted for as a business combination between entities under common control pursuant to generally accepted accounting principles. Accordingly, VMware included the carrying values of the transferred assets and liabilities as of the date of transfer in its consolidated financial statements, as well as recorded the excess of the carrying values over the cash consideration as an equity transaction. Contingent consideration, if any, paid by VMware to EMC will be recorded as an equity transaction when due. VMware did not revise its historical consolidated financial statements as the historical impact of the acquired net assets was not material.
During the three months ended December 31, 2010, $10.6 million of the $25.0 million contingent amounts was paid to EMC. This amount was recorded as an offset to the initial capital contribution from EMC.
87
VMware, Inc.
NOTES TO CONSOLIDATED FINANCIAL STATEMENTS (continued)
The following table summarizes the net carrying values of the tangible and intangible assets and liabilities transferred to VMware and the capital contribution from EMC, as of the transfer date, and exclude the subsequent contingent consideration paid referenced above (table in thousands):
Property and equipment | $ | 3,092 | ||
Other assets | 1,383 | |||
Deferred tax asset | 48,618 | |||
Intangible assets | 37,029 | |||
Goodwill | 275,260 | |||
Total tangible and intangible assets acquired | 365,382 | |||
Unearned revenue | (17,990 | ) | ||
Deferred tax liabilities | (2,888 | ) | ||
Other liabilities | (1,638 | ) | ||
Capital contribution from EMC | (167,866 | ) | ||
Total liabilities assumed and capital received | (190,382 | ) | ||
Tangible and intangible assets acquired and liabilities assumed, and capital received | $ | 175,000 | ||
Fiscal Year 2009
On September 15, 2009, VMware acquired all of the remaining outstanding capital stock of SpringSource Global, Inc. ("SpringSource"), under the terms of an Agreement and Plan of Merger entered into in August 2009. The SpringSource acquisition was accounted for as a business combination.
The aggregate consideration transferred to acquire SpringSource was $389.2 million, which included cash of $373.0 million and the fair value of stock options assumed attributed to pre-combination services of $16.2 million. In addition, the Company assumed stock options attributed to post-combination services and issued restricted common stock with a total fair value of $44.6 million.
In accordance with the merger agreement, the number of VMware stock options into which assumed SpringSource stock options were converted and the number of shares of restricted common stock that were issued were determined based on a ratio. The ratio was derived from the per share merger consideration payable to holders of SpringSource capital stock and the ten-day trading average of VMware's Class A common stock two trading days immediately prior to September 15, 2009. The assumed vested and unvested stock options converted into 652,253 and 476,081, respectively, of VMware stock options to purchase Class A common stock with a weighted-average exercise price of $4.87 per share. In addition, 572,492 shares of VMware Class A restricted common stock were issued to certain employees of SpringSource who agreed to accept shares of VMware Class A common stock subject to vesting restrictions in lieu of a portion of their cash merger proceeds. The shares are subject to vesting restrictions based upon continued employment with VMware. Subject to meeting the vesting requirements, the holders of the shares will receive a guaranteed minimum value that is equivalent to the portion of their cash merger proceeds foregone to receive the shares. To the extent that the fair value of the shares is less than the guaranteed minimum value, the difference will be paid in cash upon vesting. At December 31, 2010, the fair value of shares exceeded the minimum value guarantee.
The Company included the fair value of the stock options assumed by VMware attributed to pre-combination services of $16.2 million in the consideration transferred for the acquisition. The fair value of the stock options attributed to post-combination services and the fair value of the restricted common stock of $44.6 million were not included in the consideration transferred and are being recognized as stock-based
88
VMware, Inc.
NOTES TO CONSOLIDATED FINANCIAL STATEMENTS (continued)
compensation expense over their remaining requisite service periods. The fair value of the stock options was estimated using a Black-Scholes option-pricing model with the following weighted-average assumptions: i) market price of $40.00 per share, which was the closing price of VMware's Class A common stock on the acquisition date; ii) expected term of 1.6 years; iii) risk-free interest rate of 0.7%; iv) annualized volatility of 38.1%; and v) no dividend yield. The weighted-average acquisition-date fair value of the assumed stock options attributed to post-combination services was $35.02. The fair value of the restricted common stock was based on the acquisition-date closing price of $40.00 per share for VMware's Class A common stock.
In connection with the acquisition, VMware also agreed to offer additional equity incentives to SpringSource employees. Accordingly, VMware granted an aggregate of approximately 2.3 million stock options and 0.8 million restricted stock units under its 2007 Equity and Incentive Plan shortly after the close of the acquisition. Stock-based compensation expense of approximately $58 million will be recognized over the four-year vesting term of the awards. Of the total $58 million in stock-based compensation expense, approximately $14 million and $4 million were recorded during the years ended December 31, 2010 and 2009, respectively, on VMware's consolidated statement of income.
The following table summarizes the allocation of the consideration paid to the fair value of the tangible and intangible assets acquired and liabilities assumed as of December 31, 2009, and reflect immaterial adjustments made in 2010 to finalize the purchase price allocation (table in thousands):
Cash | $ | 16,703 | ||
Other current assets | 8,147 | |||
Property and equipment | 1,071 | |||
Intangible assets | 46,000 | |||
Goodwill | 340,092 | |||
Deferred tax asset and other assets | 16,405 | |||
Total assets acquired | 428,418 | |||
Deferred tax liability | (16,761 | ) | ||
Unearned revenue | (7,811 | ) | ||
Other current liabilities | (3,063 | ) | ||
Income taxes payable | (9,925 | ) | ||
Total liabilities assumed | (37,560 | ) | ||
Fair value of identifiable assets acquired and liabilities assumed | $ | 390,858 | ||
As required by generally accepted accounting principles, VMware remeasured a previously held equity interest in SpringSource to a fair value of $10.9 million immediately before the acquisition date and recorded a gain of $5.9 million in other income (expense), net on the consolidated statements of income for the year ended December 31, 2009. The $10.9 million was recorded to goodwill, bringing the total amount of goodwill related to SpringSource to $350.0 million for the year ended December 31, 2009. The $10.9 million in goodwill is not included in the table above as it is not considered part of the purchase price. The $350.0 million in goodwill represents the excess of the consideration transferred and the fair value of the previously held equity interest over the fair values assigned to the assets acquired and liabilities assumed, and was allocated to VMware's one reporting unit. Management believes that the goodwill mainly represents the synergies expected from combining the technologies of VMware and SpringSource. None of the goodwill was deductible for income tax purposes.
89
VMware, Inc.
NOTES TO CONSOLIDATED FINANCIAL STATEMENTS (continued)
Fiscal Year 2008
On July 1, 2008, VMware acquired all of the outstanding capital stock of a privately-held application performance management software company. The aggregate consideration transferred in this acquisition was $60.8 million, which includes cash of $58.4 million and the fair value of stock options assumed attributed to pre-combination services of $2.4 million.
The following table summarizes the allocation of the consideration paid to the fair value of the tangible and intangible assets acquired and liabilities assumed as of December 31, 2008, and reflect immaterial adjustments made in 2009 to finalize the purchase price allocation (table in thousands):
Cash | $ | 216 | ||
Intangible assets | 18,503 | |||
Goodwill | 52,803 | |||
Assets acquired | 5,511 | |||
Total assets acquired | 77,033 | |||
Total liabilities assumed | (16,209 | ) | ||
Fair value of identifiable assets acquired and liabilities assumed | $ | 60,824 | ||
In addition to the above acquisition, VMware acquired six companies during 2008 for aggregate cash consideration of $80.3 million, net of cash acquired and including transaction costs. In connection with these acquisitions, the Company acquired technologies that are complementary to VMware's core virtualization technology. Acquired intangibles totaled $23.9 million, consisted primarily of purchased technology, and have a weighted-average estimated useful life of 7.1 years. The excess of the purchase price over the fair value of the net assets acquired was $67.2 million and is classified as goodwill on the consolidated balance sheet, which reflects adjustments made in 2009 to finalize the purchase price allocations.
The purchase prices for the companies acquired in 2008 were allocated to the assets acquired and the liabilities assumed based on their final fair value.
Goodwill
Goodwill is tested for impairment on an annual basis and between annual tests if the Company becomes aware of any events occurring or changes in circumstances that would indicate a reduction in the fair value of the goodwill below its carrying amount. Changes in the carrying amount of goodwill for the years ended December 31, 2010 and 2009 consisted of the following (table in thousands):
| December 31, | ||||||||
| 2010 | 2009 | |||||||
Balance, beginning of the year | $ | 1,115,769 | $ | 771,088 | ||||
Increase in goodwill related to business combinations | 453,420 | 350,036 | ||||||
Deferred tax adjustments to purchase price allocations on previous acquisitions | 2,062 | (3,752 | ) | |||||
Other adjustments to purchase price allocations on previous acquisitions | (2,651 | ) | (1,603 | ) | ||||
Balance, end of the year | $ | 1,568,600 | $ | 1,115,769 | ||||
90
VMware, Inc.
NOTES TO CONSOLIDATED FINANCIAL STATEMENTS (continued)
Intangible Assets, Net
Intangible assets, net, excluding goodwill, as of December 31, 2010 and 2009, consisted of the following (table in thousands):
2010 | Weighted-Average Useful Lives (in years) | Gross Carrying Amount | Accumulated Amortization | Net Book Value | ||||||||||||
Purchased technology | 4.8 | $ | 279,052 | $ | (157,409 | ) | $ | 121,643 | ||||||||
Customer relationships and customer lists | 7.9 | 88,994 | (23,856 | ) | 65,138 | |||||||||||
Trademarks and tradenames | 6.2 | 24,780 | (11,116 | ) | 13,664 | |||||||||||
Other | 4.3 | 18,425 | (7,942 | ) | 10,483 | |||||||||||
Total intangible assets, net, excluding goodwill | $ | 411,251 | $ | (200,323 | ) | $ | 210,928 | |||||||||
2009 | Weighted-Average Useful Lives (in years) | Gross Carrying Amount | Accumulated Amortization | Net Book Value | ||||||||||||
Purchased technology | 4.9 | $ | 168,822 | $ | (114,804 | ) | $ | 54,018 | ||||||||
Customer relationships and customer lists | 8.6 | 37,694 | (6,451 | ) | 31,243 | |||||||||||
Trademarks and tradenames | 7.4 | 14,680 | (7,607 | ) | 7,073 | |||||||||||
Other | 4.3 | 8,625 | (6,402 | ) | 2,223 | |||||||||||
Total intangible assets, net, excluding goodwill | $ | 229,821 | $ | (135,264 | ) | $ | 94,557 | |||||||||
Amortization expense on intangibles was $34.8 million, $14.1 million and $17.5 million in the years ended December 31, 2010, 2009 and 2008, respectively. Based on intangible assets recorded as of December 31, 2010 and assuming no subsequent additions or impairment of underlying assets, the remaining estimated annual amortization expense is expected to be as follows (table in thousands):
2011 | $ | 51,393 | ||
2012 | 49,921 | |||
2013 | 35,605 | |||
2014 | 28,101 | |||
2015 | 18,539 | |||
Thereafter | 27,369 | |||
Total | $ | 210,928 | ||
91
VMware, Inc.
NOTES TO CONSOLIDATED FINANCIAL STATEMENTS (continued)
F. Property and Equipment, Net
Property and equipment, net, as of December 31, 2010 and 2009 consisted of the following (table in thousands):
| December 31, | ||||||||
| 2010 | 2009 | |||||||
Equipment and software | $ | 438,384 | $ | 327,148 | ||||
Buildings and improvements | 270,786 | 256,758 | ||||||
Furniture and fixtures | 52,613 | 48,075 | ||||||
Construction in progress | 3,082 | 5,892 | ||||||
Total property and equipment | 764,865 | 637,873 | ||||||
Accumulated depreciation | (345,800 | ) | (235,517 | ) | ||||
Total property and equipment, net | $ | 419,065 | $ | 402,356 | ||||
Depreciation expense was $114.2 million, $102.3 million and $89.5 million in the years ended December 31, 2010, 2009 and 2008, respectively.
In conjunction with the completion of portions of its Washington data center facility, VMware increased the estimated useful lives of certain fixed assets from 3 to 5 years during the second quarter of 2009. This change in estimate was prospectively applied beginning on April 1, 2009. In the year ended December 31, 2009, this change in estimate reduced depreciation expense by $10.7 million. After considering the tax effect on the reduction in depreciation expense, there was a $0.02 impact on basic and diluted earnings per share in the year ended December 31, 2009. In the second quarter of 2008, VMware increased the estimated useful lives of computers and other related equipment from 2 years to 3 years to match the length of the related warranty contracts. In the year ended December 31, 2008, these changes in estimates reduced depreciation expense by $10.4 million and increased both basic and diluted earnings per share by $0.02, from what would have been reported otherwise in the year ended December 31, 2008. VMware reviewed and revised the useful lives of these fixed assets in 2009 and 2008 after considering (i) the estimated future benefits the Company expects to receive from those assets, (ii) the pattern of consumption of those benefits and (iii) the information available regarding those benefits.
G. Accrued Expenses and Other
Accrued expenses as of December 31, 2010 and 2009 consisted of the following (table in thousands):
| December 31, | ||||||||
| 2010 | 2009 | |||||||
Salaries, commissions, bonuses and benefits | $ | 242,180 | $ | 174,207 | ||||
Accrued partner liabilities | 94,676 | 77,264 | ||||||
Other | 122,957 | 83,052 | ||||||
Total accrued expenses | $ | 459,813 | $ | 334,523 | ||||
Accrued partner liabilities relate to rebates and marketing development fund accruals for channel partners, system vendors and systems integrators, as well as accrued royalties.
92
VMware, Inc.
NOTES TO CONSOLIDATED FINANCIAL STATEMENTS (continued)
H. Note Payable to EMC
In April 2007, VMware declared an $800.0 million dividend to EMC paid in the form of a note payable, of which $450.0 million remained outstanding as of December 31, 2010. The note matures in April 2012, with interest payable quarterly in arrears commencing June 30, 2007. The interest rate resets quarterly and bears an interest rate of the 90-day LIBOR plus 55 basis points. In the years ended December 31, 2010, 2009 and 2008, $4.1 million, $6.5 million and $18.6 million, respectively, of interest expense was recorded related to the note payable. The note may be repaid, without penalty, at any time commencing July 2007. No repayments of principal were made during 2010 and 2009.
I. Income Taxes
The domestic and foreign components of income before provisions for income taxes were as follows (table in thousands):
| For the Year Ended December 31, | ||||||||||||
| 2010 | 2009 | 2008 | ||||||||||
Domestic | $ | 127,293 | $ | 31,690 | $ | 63,588 | ||||||
International | 289,082 | 191,759 | 255,697 | |||||||||
Total | $ | 416,375 | $ | 223,449 | $ | 319,285 | ||||||
VMware's provision for income taxes consisted of the following (table in thousands):
| For the Year Ended December 31, | ||||||||||||
| 2010 | 2009 | 2008 | ||||||||||
Federal: | ||||||||||||
Current | $ | 65,796 | $ | 41,114 | $ | (27,524 | ) | |||||
Deferred | (42,158 | ) | (35,908 | ) | 38,348 | |||||||
| 23,638 | 5,206 | 10,824 | ||||||||||
State: | ||||||||||||
Current | 15,496 | 6,070 | (824 | ) | ||||||||
Deferred | (9,055 | ) | (3,630 | ) | 4,044 | |||||||
| 6,441 | 2,440 | 3,220 | ||||||||||
Foreign: | ||||||||||||
Current | 34,592 | 19,643 | 18,592 | |||||||||
Deferred | (5,735 | ) | (938 | ) | (3,484 | ) | ||||||
| 28,857 | 18,705 | 15,108 | ||||||||||
Total provision for income taxes | $ | 58,936 | $ | 26,351 | $ | 29,152 | ||||||
A reconciliation of VMware's income tax rate to the statutory federal tax rate is as follows:
| For the Year Ended December 31, | ||||||||||||
| 2010 | 2009 | 2008 | ||||||||||
Statutory federal tax rate | 35.0 | % | 35.0 | % | 35.0 | % | ||||||
State taxes, net of federal benefit | 1.5 | % | 1.1 | % | 1.0 | % | ||||||
Tax rate differential for international jurisdictions | (17.3 | %) | (21.5 | %) | (23.3 | %) | ||||||
U.S. tax credits | (8.6 | %) | (8.5 | %) | (6.7 | %) | ||||||
Permanent items and other | 3.6 | % | 5.7 | % | 3.1 | % | ||||||
Effective tax rate | 14.2 | % | 11.8 | % | 9.1 | % | ||||||
93
VMware, Inc.
NOTES TO CONSOLIDATED FINANCIAL STATEMENTS (continued)
The components of the current and non-current deferred tax assets and liabilities were as follows (table in thousands):
| December 31, | ||||||||||||||||
| 2010 | 2009 | |||||||||||||||
| Deferred Tax Asset | Deferred Tax Liability | Deferred Tax Asset | Deferred Tax Liability | |||||||||||||
Current: | ||||||||||||||||
Accruals and allowances | $ | 30,673 | $ | - | $ | 20,990 | $ | - | ||||||||
Unearned revenue | 82,557 | - | 52,507 | - | ||||||||||||
Net operating loss carryforwards | 292 | - | - | - | ||||||||||||
Valuation allowance | (12,833 | ) | - | (10,137 | ) | - | ||||||||||
Total current | 100,689 | - | 63,360 | - | ||||||||||||
Non-current: | ||||||||||||||||
Property, plant and equipment, net | - | (20,227 | ) | - | (19,665 | ) | ||||||||||
Intangible and other, net | - | (1,551 | ) | - | (40,635 | ) | ||||||||||
Stock-based compensation | 52,095 | - | 49,135 | - | ||||||||||||
Unearned revenue | 24,755 | - | 19,785 | - | ||||||||||||
Other non-current liabilities | - | (8,318 | ) | - | - | |||||||||||
Tax credit and net operating loss carryforwards | 95,316 | - | 52,324 | - | ||||||||||||
Valuation allowance | (23,040 | ) | - | (18,715 | ) | - | ||||||||||
Total non-current | 149,126 | (30,096 | ) | 102,529 | (60,300 | ) | ||||||||||
Total deferred tax assets and liabilities | $ | 249,815 | $ | (30,096 | ) | $ | 165,889 | $ | (60,300 | ) | ||||||
VMware has U.S. federal net operating loss carryforwards of $117.9 million from acquisitions made since 2006. These carryforwards expire at different periods through 2030. Portions of these carryforwards are subject to annual limitations. VMware expects to be able to fully use these net operating losses against future income. Also resulting from acquisitions since 2006, VMware has state net operating loss carryforwards of $200.7 million expiring at different periods through 2030. A valuation allowance was recorded to reduce gross deferred tax assets to an amount VMware believes is more likely than not to be realized. The valuation allowance is attributable to the uncertainty regarding the realization of state tax credit carryforward benefits. VMware has non-U.S. net operating losses of $12.1 million resulting from a non-U.S. acquisition in 2009. These net operating losses have an unlimited carryforward period. VMware expects to be able to fully use these net operating losses against future non-U.S. income. Also resulting from an acquisition in 2009, VMware has non-U.S. net operating losses of $15.5 million that are subject to a full valuation allowance as VMware believes it is more likely than not that no tax benefit will be realized from these losses.
U.S. income taxes have not been provided on certain undistributed earnings of non-U.S. subsidiaries of approximately $900.3 million and $620.6 million at December 31, 2010 and 2009, respectively, because such earnings are considered to be reinvested indefinitely outside of the U.S., and it is not practicable to estimate the amount of tax that may be payable upon repatriation.
As of December 31, 2010, VMware had a net income tax receivable of $144.3 million, which was comprised of amounts due from EMC for VMware's stand-alone federal taxable loss for the fiscal year ending December 31, 2010 and for a refund of an overpayment related to the consolidated federal and state income taxes for the fiscal year ended December 31, 2009. The receivable for 2010 arose because VMware had a stand-alone taxable loss for the year ended December 31, 2010, which was primarily attributable to tax deductions arising from both non-qualified stock option exercises and from restricted stock when the restrictions lapsed. Under the
94
VMware, Inc.
NOTES TO CONSOLIDATED FINANCIAL STATEMENTS (continued)
tax sharing agreement with EMC, EMC is obligated to pay to VMware an amount equal to the tax benefit generated by VMware that EMC will recognize on its consolidated tax return. At December 31, 2009, VMware had an income tax receivable due from EMC for $3.0 million as a result of comparing the state tax provision for fiscal year ended December 31, 2008 to the final tax return. During the year ended December 31, 2009, EMC paid VMware $107.6 million due to VMware's stand-alone taxable loss for the year ended December 31, 2008, which was primarily attributable to tax deductions arising from both non-qualified stock option exercises and from restricted stock when the restrictions lapsed. Under the tax sharing agreement with EMC, EMC is obligated to pay VMware an amount equal to the tax benefit generated by VMware that EMC will recognize on its consolidated tax return.
The difference between the income taxes payable that is calculated on a separate return basis and the amount actually paid to EMC pursuant to VMware's tax sharing agreement is presented as a component of additional paid-in capital. These differences resulted in an increase in additional paid-in capital of $6.5 million in the year ended December 31, 2010 and a decrease in additional paid-in capital of $8.0 million in the year ended December 31, 2009.
As of December 31, 2010, VMware had gross unrecognized tax benefits totaling $103.9 million, which excludes $5.4 million of offsetting tax benefits. As of December 31, 2009, VMware had gross unrecognized tax benefits totaling $80.8 million, which excludes $4.2 million of offsetting tax benefits. Approximately $104.4 million of VMware's unrecognized tax benefits, if recognized, would reduce income tax expense and lower VMware's effective tax rate in the period or periods recognized. The net unrecognized tax benefits of $104.4 million as of December 31, 2010 would, if recognized, benefit VMware's effective income tax rate. The $104.4 million of net unrecognized tax benefits were classified as a non-current liability on the consolidated balance sheet. It is reasonably possible within the next 12 months that audit resolutions could potentially reduce total unrecognized tax benefits by between approximately $20 million and $24 million. Audit outcomes and the timing of audit settlements are subject to significant uncertainty.
VMware recognizes interest expense and penalties related to income tax matters in the income tax provision. VMware had accrued $3.9 million of interest as of January 1, 2010 and $4.1 million of interest as of December 31, 2010 associated with unrecognized tax benefits. These amounts are included as components of the $104.4 million net unrecognized tax benefits at December 31, 2010 and $78.0 million net unrecognized tax benefits at December 31, 2009. Income tax expense for the year ended December 31, 2010 included interest of $0.3 million associated with uncertain tax positions.
A reconciliation of the beginning and ending amount of gross unrecognized tax benefits, excluding interest associated with unrecognized tax benefits, is as follows (table in thousands):
| For the Year Ended December 31, | ||||||||||||
| 2010 | 2009 | 2008 | ||||||||||
Balance, beginning of the year | $ | 84,970 | $ | 48,407 | $ | 19,198 | ||||||
Tax positions related to current year: | ||||||||||||
Additions | 28,177 | 38,153 | 30,089 | |||||||||
Tax positions related to prior years: | ||||||||||||
Additions | 6,850 | - | 503 | |||||||||
Reductions | (10,378 | ) | (3,169 | ) | - | |||||||
Foreign currency effects | (325 | ) | 1,579 | (1,383 | ) | |||||||
Balance, end of the year | $ | 109,294 | $ | 84,970 | $ | 48,407 | ||||||
95
VMware, Inc.
NOTES TO CONSOLIDATED FINANCIAL STATEMENTS (continued)
There were no material settlements during 2010. Due to the increased complexity in international operations, including judgments in determining the appropriate tax jurisdictions for revenue and expense items, the Company's unrecognized tax benefits will likely increase in 2011. The Company cannot reasonably estimate the increase.
VMware is subject to U.S. federal income tax and various state, local and international income taxes in numerous jurisdictions. VMware's domestic and international tax liabilities are subject to the allocation of revenues and expenses in different jurisdictions and the timing of recognizing revenues and expenses. Additionally, the amount of income taxes paid is subject to the VMware's interpretation of applicable tax laws in the jurisdictions in which it files.
The U.S. federal income tax audit for 2007 and 2008 commenced during 2009 and is expected to conclude in 2011. VMware has income tax audits in progress in numerous state, local and international jurisdictions in which it operates. In the VMware international jurisdictions that comprise a significant portion of its operations, the years that may be examined vary, with the earliest year being 2004. Based on the outcome of examinations of VMware, the result of the expiration of statutes of limitations for specific jurisdictions or the result of ruling requests from taxing authorities, it is reasonably possible that the related unrecognized tax benefits could change from those recorded in the statement of financial position. It is possible that one or more of these audits may be finalized within the next twelve months. However, based on the status of examinations, and the protocol of finalizing audits, it is not possible to estimate the impact of such changes, if any, to the previously recorded uncertain tax positions.
J. Commitments and Contingencies
Litigation
VMware is named from time to time as a party to lawsuits in the normal course of its business. In such cases it is VMware's policy to defend against such claims, or if considered appropriate, negotiate a settlement on commercially reasonable terms. However, no assurance can be given that VMware will be able to negotiate settlements on commercially reasonable terms, or at all, or that any litigation resulting from such claims would not have a material adverse effect on the consolidated cash flows, results of operations, and financial position, or consolidated financial statements taken as a whole.
Operating Lease Commitments
VMware leases office facilities and equipment under various operating leases. Facility leases generally include renewal options. Rent expense for the years ended December 31, 2010, 2009 and 2008 was $46.4 million, $41.2 million and $38.0 million, respectively. VMware's future lease commitments at December 31, 2010 were as follows (table in thousands):
2011 | $ | 40,798 | ||
2012 | 34,659 | |||
2013 | 28,456 | |||
2014 | 23,567 | |||
2015 | 18,860 | |||
Thereafter | 274,962 | |||
Total minimum lease payments | $ | 421,302 | ||
The amount of the future lease commitments after 2015 is primarily for the ground lease on VMware's Palo Alto, California headquarter facilities, which expires in 2057. As several of VMware's operating leases are
96
VMware, Inc.
NOTES TO CONSOLIDATED FINANCIAL STATEMENTS (continued)
payable in foreign currencies, the operating lease payments may fluctuate in response to changes in the exchange rate between the U.S. Dollar and the foreign currencies in which the commitments are payable.
Outstanding Obligations
At December 31, 2010, VMware had various contractual commitments aggregating $65.7 million, primarily relating to VMware's Washington data center facility.
Guarantees and Indemnification Obligations
VMware enters into agreements in the ordinary course of business with, among others, customers, distributors, resellers, system vendors and systems integrators. Most of these agreements require VMware to indemnify the other party against third-party claims alleging that a VMware product infringes or misappropriates a patent, copyright, trademark, trade secret, and/or other intellectual property right. Certain of these agreements require VMware to indemnify the other party against certain claims relating to property damage, personal injury, or the acts or omissions of VMware, its employees, agents, or representatives.
VMware has agreements with certain vendors, financial institutions, lessors and service providers pursuant to which VMware has agreed to indemnify the other party for specified matters, such as acts and omissions of VMware, its employees, agents, or representatives.
VMware has procurement or license agreements with respect to technology that it has obtained the right to use in VMware's products and agreements. Under some of these agreements, VMware has agreed to indemnify the supplier for certain claims that may be brought against such party with respect to VMware's acts or omissions relating to the supplied products or technologies.
VMware has agreed to indemnify the directors and executive officers of VMware, to the extent legally permissible, against all liabilities reasonably incurred in connection with any action in which such individual may be involved by reason of such individual being or having been a director or executive officer. VMware's by-laws and charter also provide for indemnification of directors and officers of VMware and VMware subsidiaries to the extent legally permissible, against all liabilities reasonably incurred in connection with any action in which such individual may be involved by reason of such individual being or having been a director or executive officer. VMware also indemnifies certain employees who provide service with respect to employee benefits plans, including the members of the Administrative Committee of the VMware 401(k) Plan.
In connection with certain acquisitions, VMware has agreed to indemnify the former directors and officers of the acquired company in accordance with the acquired company's by-laws and charter in effect immediately prior to the acquisition or in accordance with indemnification or similar agreements entered into by the acquired company and such persons. VMware typically purchases a "tail" directors' and officers' insurance policy, which should enable VMware to recover a portion of any future indemnification obligations related to the former officers and directors of an acquired company.
It is not possible to determine the maximum potential amount under these indemnification agreements due to the Company's limited history with prior indemnification claims and the unique facts and circumstances involved in each particular agreement. Historically, payments made by the Company under these agreements have not had a material effect on the Company's consolidated results of operations, financial position, or cash flows.
97
VMware, Inc.
NOTES TO CONSOLIDATED FINANCIAL STATEMENTS (continued)
K. Stockholders' Equity
VMware Class B Common Stock Conversion Rights
Each share of Class B common stock is convertible while held by EMC or its successor-in-interest at the option of EMC or its successor-in-interest into one share of Class A common stock. If VMware's Class B common stock is distributed to security holders of EMC in a transaction (including any distribution in exchange for shares of EMC's or its successor-in-interest's common stock or other securities) intended to qualify as a distribution under Section 355 of the Internal Revenue Code, or any corresponding provision of any successor statute, shares of VMware's Class B common stock will no longer be convertible into shares of Class A common stock. Prior to any such distribution, all shares of Class B common stock will automatically be converted into shares of Class A common stock upon the transfer of such shares of Class B common stock by EMC other than to any of EMC's successors or any of its subsidiaries (excluding VMware). If such a distribution has not occurred, each share of Class B common stock will also automatically convert at such time as the number of shares of common stock owned by EMC or its successor-in-interest falls below 20% of the outstanding shares of VMware's common stock. Following any such distribution, VMware may submit to its stockholders a proposal to convert all outstanding shares of Class B common stock into shares of Class A common stock, provided that VMware has received a favorable private letter ruling from the Internal Revenue Service satisfactory to EMC to the effect that the conversion will not affect the intended tax treatment of the distribution. In a meeting of VMware stockholders called for this purpose, the holders of VMware Class A common stock and VMware Class B common stock will be entitled to one vote per share and, subject to applicable law, will vote together as a single class, and neither class of common stock will be entitled to a separate class vote. All conversions will be effected on a share-for-share basis.
VMware Equity Plan
In June 2007, VMware adopted its 2007 Equity and Incentive Plan (the "2007 Plan"). In May 2009, VMware amended its 2007 Plan to increase the number of shares available for issuance by 20.0 million shares for total shares available for issuance of 100.0 million. Awards under the 2007 Plan may be in the form of stock options or other stock-based awards, including awards of restricted stock units. The exercise price for a stock option awarded under the 2007 Plan shall not be less than 100% of the fair market value of VMware Class A common stock on the date of grant. Most options granted under the 2007 Plan vest 25% after the first year and then monthly thereafter over the following three years. All options granted pursuant to the 2007 Plan expire between six and seven years from the date of grant. Most restricted stock unit awards granted under the 2007 Plan have a three-year to four-year period over which they vest. VMware's Compensation and Corporate Governance Committee determines the vesting schedule for all equity awards. VMware utilizes both authorized and unissued shares to satisfy all shares issued under the 2007 Plan.
VMware Stock Repurchase Program
In March 2010, VMware's Board of Directors approved a stock repurchase program, authorizing the purchase of up to $400.0 million of its Class A common stock through the end of 2011. From time to time, subject to market conditions, stock is purchased pursuant to this program in the open market or through private transactions as permitted by securities laws and other legal requirements. In the year ended December 31, 2010, VMware repurchased and retired 4,908,969 shares of its Class A common stock at a weighted-average price of $68.96 per share for an aggregate purchase price of $338.5 million, including commissions. The amount of repurchased shares was classified as a reduction to additional paid-in capital. VMware is not obligated to purchase any shares under its stock repurchase program. Subject to applicable corporate and securities laws, repurchases under the stock repurchase program may be made at such times and in such amounts as VMware deems appropriate. Purchases under the stock repurchase program can be discontinued at any time that VMware feels additional purchases are not warranted.
98
VMware, Inc.
NOTES TO CONSOLIDATED FINANCIAL STATEMENTS (continued)
VMware Employee Stock Purchase Plan
In June 2007, VMware adopted its 2007 Employee Stock Purchase Plan (the "ESPP"), which is intended to be qualified under Section 423 of the Internal Revenue Code. A total of 6.4 million shares of VMware Class A common stock were reserved for future issuance. Under the ESPP, eligible VMware employees are granted options to purchase shares at the lower of 85% of the fair market value of the stock at the time of grant or 85% of the fair market value at the time of exercise. Options to purchase shares were generally granted twice yearly on January 1 and July 1 and exercisable on the succeeding June 30 and December 31 of each year until the timing of the purchase plan was amended in 2009; as a result since then, options to purchase shares are generally granted on February 1 and August 1 and exercisable on the succeeding July 31 and January 31, respectively, of each year.
In 2010, 1.5 million shares of Class A common stock were purchased under the ESPP at a weighted-average purchase price per share of $29.90. The total cash proceeds from the purchase of these shares under the ESPP were $45.2 million. As of December 31, 2010, $24.8 million of ESPP withholdings were recorded as a liability on the consolidated balance sheet for the next purchase in January 2011.
In 2009, 0.9 million shares of Class A common stock were purchased under the ESPP at a purchase price per share of $20.14. The total cash proceeds from the purchase of these shares under the ESPP were $18.3 million. As of December 31, 2009, $21.6 million of ESPP withholdings were recorded as a liability on the consolidated balance sheet for the subsequent purchase in January 2010. In 2008, 1.7 million shares of Class A common stock were purchased under the ESPP at a weighted-average purchase price per share of $28.05. The total cash proceeds from the purchase of these shares under the ESPP were $46.9 million. As part of the 1.7 million shares purchased in 2008, employees purchased 0.6 million shares under the ESPP at a purchase price per share of $24.65 related to the December 31, 2007 purchase, which was completed in January 2008.
VMware 2008 Exchange Offer
In September 2008, VMware completed an offer to exchange certain employee stock options issued under VMware's 2007 Equity and Incentive Plan ("2008 Exchange Offer"). Certain previously granted options were exchanged for new, lower-priced stock options granted on a one-for-one basis. Executive officers and members of the Company's Board of Directors were excluded from participating in the 2008 Exchange Offer. Options for an aggregate of 4.1 million shares of VMware's Class A common stock were exchanged with a weighted-average exercise price per share of $71.60. Options granted pursuant to the 2008 Exchange Offer have an exercise price of $33.95 per share, vest pro rata over four years beginning September 10, 2008 with no credit for past vesting and have a new six-year option term. The 2008 Exchange Offer resulted in incremental stock-based compensation expense of $18.0 million to be recognized over the four-year vesting term.
VMware and EMC Stock Options
Prior to the adoption of VMware's 2007 Plan in June 2007, eligible VMware employees participated in EMC's equity plans. In August 2007, VMware and EMC completed an exchange offer (the "EMC Exchange Offer") enabling eligible VMware employees to exchange their options to acquire EMC common stock for options to acquire VMware Class A common stock and to exchange restricted stock awards of EMC's common stock for restricted stock awards of VMware's Class A common stock. VMware employees who did not elect to exchange their EMC options and EMC restricted stock for options to purchase VMware Class A common stock and restricted stock awards of VMware Class A common stock, respectively, continue to have their existing grants governed under EMC's stock plans.
99
VMware, Inc.
NOTES TO CONSOLIDATED FINANCIAL STATEMENTS (continued)
The following table summarizes option activity since January 1, 2008 for VMware and EMC stock options (shares in thousands):
| VMware Stock Options | EMC Stock Options | |||||||||||||||
| Number of Shares | Weighted- Average Exercise Price (per share) | Number of Shares | Weighted- Average Exercise Price (per share) | |||||||||||||
Outstanding, January 1, 2008 | 45,339 | $ | 26.76 | 2,755 | $ | 12.22 | ||||||||||
Options relating to employees transferred from EMC | - | - | 3,411 | 15.35 | ||||||||||||
Granted (1) | 11,741 | 40.48 | - | - | ||||||||||||
Forfeited (1) | (8,033 | ) | 51.74 | (115 | ) | 13.03 | ||||||||||
Expired | (37 | ) | 24.26 | (21 | ) | 15.70 | ||||||||||
Exercised | (6,574 | ) | 21.64 | (295 | ) | 6.49 | ||||||||||
Outstanding, December 31, 2008 | 42,436 | 26.54 | 5,735 | 14.35 | ||||||||||||
Options relating to employees transferred from EMC | - | - | 96 | 16.01 | ||||||||||||
Granted | 12,500 | 29.86 | - | - | ||||||||||||
Forfeited | (3,736 | ) | 28.11 | (2,656 | ) | 14.94 | ||||||||||
Expired | (177 | ) | 45.24 | (739 | ) | 15.45 | ||||||||||
Exercised | (9,516 | ) | 22.01 | (438 | ) | 10.71 | ||||||||||
Outstanding, December 31, 2009 | 41,507 | 28.34 | 1,998 | 14.05 | ||||||||||||
Options relating to employees transferred from EMC | - | - | 2,198 | 15.53 | ||||||||||||
Granted | 3,362 | 57.60 | - | - | ||||||||||||
Forfeited | (2,220 | ) | 30.78 | (164 | ) | 11.44 | ||||||||||
Expired | (151 | ) | 83.86 | (193 | ) | 55.81 | ||||||||||
Exercised | (15,574 | ) | 24.79 | (1,175 | ) | 10.53 | ||||||||||
Outstanding, December 31, 2010 | 26,924 | 33.54 | 2,664 | 13.93 | ||||||||||||
Exercisable, December 31, 2010 | 10,706 | 29.75 | 1,434 | 13.94 | ||||||||||||
Vested and expected to vest, December 31, 2010 | 25,639 | 33.27 | 2,581 | 13.95 | ||||||||||||
| (1) | VMware stock options: Includes options for 4,017 shares exchanged in the 2008 Exchange Offer. |
As of December 31, 2010, for the VMware stock options, the weighted-average remaining contractual term was 3.2 years and the aggregate intrinsic value was $642.5 million for the 10.7 million exercisable shares. For the 25.6 million shares vested and expect to vest at December 31, 2010, the weighted-average remaining contractual term was 3.8 years and the aggregate intrinsic value was $1,438.3 million. These aggregate intrinsic values represent the total pre-tax intrinsic values based on VMware's closing stock price of $88.91 as of December 31, 2010, which would have been received by the option holders had all in-the-money options been exercised as of that date.
As of December 31, 2010, for the EMC stock options, the weighted-average remaining contractual term was 4.9 years and the aggregate intrinsic value was $14.3 million for the 1.4 million exercisable shares. For the 2.6 million shares vested and expected to vest at December 31, 2010, the weighted-average remaining contractual term was 5.9 years and the aggregate intrinsic value was $24.6 million. These aggregate intrinsic values represent the total pre-tax intrinsic values based on EMC's closing stock price of $22.90 as of December 31, 2010, which would have been received by the option holders had all in-the-money options been exercised as of that date.
Cash proceeds from the exercise of VMware stock options for the years ended December 31, 2010, 2009 and 2008 were $386.1 million, $209.4 million and $143.2 million, respectively. The options exercised in 2010,
100
VMware, Inc.
NOTES TO CONSOLIDATED FINANCIAL STATEMENTS (continued)
2009 and 2008 had a pre-tax intrinsic value of $678.8 million, $132.6 million and $219.6 million, respectively, and income tax benefits realized from the exercise of stock options of $171.2 million, $47.1 million and $71.4 million, respectively.
The pre-tax intrinsic value of EMC options held by VMware employees that were exercised during the years ended December 31, 2010, 2009 and 2008 were $10.8 million, $2.3 million and $2.8 million, respectively. Cash proceeds from the exercise of these stock options paid to EMC were $12.4 million, $4.7 million and $1.9 million for the years ended December 31, 2010, 2009 and 2008, respectively.
VMware Restricted Stock
VMware restricted stock primarily consists of restricted stock units granted to employees and also includes restricted stock awards and other restricted stock. Other restricted stock includes shares issued in 2009 to certain employees of SpringSource who agreed to accept shares of VMware Class A common stock subject to vesting restrictions in lieu of a portion of their cash merger proceeds. In addition, other restricted stock includes options exercised prior to vesting by VMware's non-employee directors. The exercise of those options prior to vesting resulted in the outstanding shares being subject to repurchase and hence restricted until such time as the respective options vest. These options completed vesting in 2010.
The following table summarizes VMware's restricted stock activity since January 1, 2008 (shares in thousands):
| Number of Shares | Weighted- Average Grant Date Fair Value (per share) | |||||||
Outstanding, January 1, 2008 | 3,565 | $ | 24.64 | |||||
Granted | 6,619 | 35.14 | ||||||
Vested | (2,153 | ) | 22.58 | |||||
Forfeited | (405 | ) | 61.90 | |||||
Outstanding, December 31, 2008 | 7,626 | 32.35 | ||||||
Restricted stock relating to employees transferred from EMC | - | - | ||||||
Granted | 5,200 | 33.63 | ||||||
Vested | (2,881 | ) | 31.31 | |||||
Forfeited | (734 | ) | 34.81 | |||||
Outstanding, December 31, 2009 | 9,211 | 33.21 | ||||||
Restricted stock relating to employees transferred from EMC | - | - | ||||||
Granted | 4,933 | 74.87 | ||||||
Vested | (3,688 | ) | 32.38 | |||||
Forfeited | (704 | ) | 39.05 | |||||
Outstanding, December 31, 2010 | 9,752 | 54.17 | ||||||
The total fair value of VMware restricted stock-based awards that vested in the years ended December 31, 2010, 2009 and 2008 was $258.0 million, $88.8 million and $116.3 million. As of December 31, 2010, restricted stock unit awards and other restricted stock representing 9.8 million shares of VMware were outstanding, with an aggregate intrinsic value of $867.1 million based on the closing share price as of December 31, 2010. These shares are scheduled to vest through 2014.
101
VMware, Inc.
NOTES TO CONSOLIDATED FINANCIAL STATEMENTS (continued)
The VMware restricted stock unit awards are valued based on the VMware stock price on the date of grant. Shares underlying restricted stock unit awards are not issued until the restricted stock units vest. The majority of VMware's restricted stock unit awards have pro rata vesting over three or four years.
VMware Shares Repurchased for Tax Withholdings
During the years ended December 31, 2010, 2009 and 2008, VMware repurchased or withheld and retired 1,257,967 shares, 1,029,581 shares and 826,731 shares of Class A common stock for $87.1 million, $31.5 million and $44.5 million, respectively, to cover tax withholding obligations. As of December 31, 2010, $0.9 million of tax withholding obligations were recorded as a liability on the consolidated balance sheet. Pursuant to the respective agreements, these shares were repurchased or withheld in conjunction with the net share settlement upon the vesting of restricted stock and restricted stock units during the period. The amount of repurchased or withheld shares, including restricted stock units, was classified as a reduction to additional paid-in capital as of December 31, 2010, 2009 and 2008, respectively.
Stock-Based Compensation Expense
The following table summarizes the components of total stock-based compensation expense included in VMware's consolidated statements of income for the years ended December 31, 2010, 2009 and 2008 (table in thousands):
| For the Year Ended December 31, | ||||||||||||
| 2010 | 2009 | 2008 | ||||||||||
Cost of license revenues | $ | 1,653 | $ | 1,293 | $ | 1,120 | ||||||
Cost of services revenues | 18,478 | 14,874 | 13,485 | |||||||||
Research and development | 164,435 | 121,770 | 77,992 | |||||||||
Sales and marketing | 73,146 | 58,610 | 49,762 | |||||||||
General and administrative | 33,979 | 34,909 | 24,157 | |||||||||
Stock-based compensation expense | 291,691 | 231,456 | 166,516 | |||||||||
Income tax benefit | 94,110 | 43,170 | 33,020 | |||||||||
Total stock-based compensation expense, net of tax | $ | 197,581 | $ | 188,286 | $ | 133,496 | ||||||
For the years ended December 31, 2010, 2009 and 2008, VMware capitalized $10.9 million, $14.9 million and $22.7 million, respectively, of stock-based compensation expense associated with capitalized software development.
As of December 31, 2010, the total unrecognized compensation cost for stock options and restricted stock was $595.8 million. This non-cash expense will be recognized through 2015 with a weighted-average remaining period of 1.3 years.
102
VMware, Inc.
NOTES TO CONSOLIDATED FINANCIAL STATEMENTS (continued)
Fair Value of VMware Options
The fair value of each option to acquire VMware Class A common stock granted during the years ended December 31, 2010, 2009 and 2008 was estimated on the date of grant using the Black-Scholes option-pricing model with the following weighted-average assumptions:
| For the Year Ended December 31, | ||||||||||||
VMware Stock Options | 2010 | 2009 | 2008 | |||||||||
Dividend yield | None | None | None | |||||||||
Expected volatility | 38.0 | % | 36.1 | % | 39.4 | % | ||||||
Risk-free interest rate | 1.5 | % | 1.9 | % | 2.5 | % | ||||||
Expected term (in years) | 3.5 | 3.7 | 3.4 | |||||||||
Weighted-average fair value at grant date | $ | 18.05 | $ | 12.18 | $ | 17.88 | ||||||
| For the Year Ended December 31, | ||||||||||||
VMware Employee Stock Purchase Plan | 2010 | 2009 | 2008 | |||||||||
Dividend yield | None | None | None | |||||||||
Expected volatility | 33.1 | % | 50.9 | % | 39.3 | % | ||||||
Risk-free interest rate | 0.2 | % | 0.3 | % | 2.7 | % | ||||||
Expected term (in years) | 0.5 | 0.5 | 0.5 | |||||||||
Weighted-average fair value at grant date | $ | 15.18 | $ | 7.79 | $ | 18.06 | ||||||
For all equity awards granted in 2010 and 2009, volatility was based on an analysis of historical stock prices and implied volatilities of publicly-traded companies with similar characteristics, including industry, stage of life cycle, size, financial leverage, as well as the implied volatilities of VMware's Class A common stock. The expected term was calculated based upon an analysis of the expected term of similar grants of comparable publicly-traded companies.
For all equity awards granted in 2008, volatility was based on an analysis of historical stock prices and implied volatility of publicly-traded companies with similar characteristics, including industry, stage of life cycle, size and financial leverage. The expected term was calculated based on the historical experience that VMware employees have had with EMC stock option grants as well as the expected term of similar grants of comparable companies.
For all periods presented, VMware's expected dividend yield input was zero as it has not historically paid, nor expects in the future to pay, cash dividends on its common stock. The risk-free interest rate was based on U.S. Treasury instrument whose term is consistent with the expected term of the stock options.
103
VMware, Inc.
NOTES TO CONSOLIDATED FINANCIAL STATEMENTS (continued)
L. Comprehensive Income
The following table sets forth the components of comprehensive income for the years ended December 31, 2010, 2009 and 2008, respectively (table in thousands):
| For the Year Ended December 31, | ||||||||||||
| 2010 | 2009 | 2008 | ||||||||||
Net income | $ | 357,439 | $ | 197,098 | $ | 290,133 | ||||||
Other comprehensive income: | ||||||||||||
Unrealized gains (losses) on available-for-sale securities, net of taxes of $9,239, $2,797 and $0 | 15,341 | 4,563 | - | |||||||||
Reclassification of (gains) losses on available-for-sale securities recognized during the period, net of taxes of $(102), $0 and $0 | (269 | ) | - | - | ||||||||
Total other comprehensive income | 15,072 | 4,563 | - | |||||||||
Total comprehensive income, net of taxes | $ | 372,511 | $ | 201,661 | $ | 290,133 | ||||||
In each period presented on VMware's consolidated balance sheets, accumulated other comprehensive income consisted of unrealized gains and losses on available-for-sale securities, net of taxes.
M. Related Party Transactions
In April 2010, VMware acquired certain software product technology and expertise from EMC's Ionix IT management business for cash consideration of $175.0 million. EMC retained the Ionix brand and will continue to offer customers the products acquired by VMware, pursuant to the ongoing reseller agreement between EMC and VMware. During the three months ended December 31, 2010, $10.6 million of contingent amounts was paid to EMC in accordance with the asset purchase agreement. This amount was recorded as a reduction to the capital contribution from EMC. See Note E for further information.
Pursuant to the ongoing reseller arrangement with EMC that commenced in 2009, EMC bundles VMware's products and services with EMC's hardware and sells them to end-users. In the years ended December 31, 2010 and 2009, VMware recognized revenues of $48.5 million and $14.1 million, respectively, from products and services sold pursuant to VMware's reseller arrangement with EMC. As of December 31, 2010 and 2009, $29.0 million and $22.4 million, respectively, of revenues from products and services sold under the reseller arrangement were included in unearned revenue.
In the years ended December 31, 2010, 2009 and 2008, VMware recognized professional services revenues of $60.6 million, $25.2 million and $16.9 million, respectively, for services provided to EMC's customers pursuant to VMware's contractual agreements with EMC. As of December 31, 2010 and 2009, $5.9 million and $0.7 million, respectively, of revenues from professional services to EMC customers were included in unearned revenue.
In the years ended December 31, 2010, 2009 and 2008, VMware recognized revenues of $6.1 million, $5.6 million and $4.1 million, respectively, from server and desktop products and services purchased by EMC for internal use pursuant to VMware's contractual agreements with EMC. As of December 31, 2010 and 2009, $19.3 million and $3.7 million, respectively, of revenues from server and desktop products and services purchased by EMC for internal use were included in unearned revenue.
104
VMware, Inc.
NOTES TO CONSOLIDATED FINANCIAL STATEMENTS (continued)
VMware purchased storage systems and software, as well as consulting services, from EMC for $18.4 million, $9.7 million and $25.2 million in the years ended December 31, 2010, 2009 and 2008, respectively.
In certain geographic regions where VMware does not have an established legal entity, VMware contracts with EMC subsidiaries for support services and EMC employees who are managed by VMware's personnel. The costs incurred by EMC on VMware's behalf related to these employees are passed on to VMware and VMware is charged a mark-up intended to approximate costs that would have been charged had VMware contracted for such services with an unrelated third party. These costs are included as expenses in VMware's consolidated statements of income and primarily include salaries and benefits, travel and rent. Additionally, EMC historically incurred certain costs on VMware's behalf in the U.S., which primarily related to a shared system for travel. In the fourth quarter of 2009, VMware implemented its own travel system in the U.S. and is now incurring these costs directly. The total cost of the services provided to VMware by EMC as described above was $66.4 million, $95.6 million and $139.8 million in the years ended December 31, 2010, 2009 and 2008, respectively.
As calculated under VMware's tax sharing agreement with EMC, VMware paid $5.1 million in the year ended December 31, 2010 for its portion of EMC's consolidated federal income taxes. Under the same tax sharing agreement, EMC paid VMware $2.5 million in the year ended December 31, 2010 for a refund of an overpayment related to the consolidated federal and state income taxes for the fiscal year ended December 31, 2008. In the years ended December 31, 2009 and 2008, VMware paid $14.2 million and $64.3 million, respectively, for its portion of EMC's consolidated federal and state income taxes for various periods, as well as the conclusion of the 2005 and 2006 federal income tax audit. In the year ended December 31, 2009, EMC paid VMware $107.6 million for VMware's stand-alone federal taxable loss for the fiscal year ending December 31, 2008 and for a refund of an overpayment related to VMware's portion of EMC's 2007 federal consolidated income taxes. No payments were made by EMC in 2008. The amounts that VMware pays to EMC for its portion of federal income taxes on EMC's consolidated tax return differ from the amounts VMware would owe on a stand-alone basis and the difference is presented as a component of stockholders' equity. In 2010 and 2008, the difference between the amount of tax calculated on a stand-alone basis and the amount of tax calculated per the tax sharing agreement was recorded as an increase in stockholders' equity of $6.5 million and $5.2 million, respectively. In 2009, the difference between the amount of tax calculated on a stand-alone basis and the amount of tax calculated per the tax sharing agreement was recorded as a decrease in stockholders' equity of $8.0 million.
Interest expense with EMC, net, primarily consists of interest expense on the note payable to EMC. In the years ended December 31, 2010, 2009 and 2008, $4.1 million, $6.5 million and $18.6 million, respectively, of interest expense was recorded related to the note payable to EMC and included in interest expense with EMC, net, recorded on the consolidated statements of income. VMware's interest income and expenses as a separate, stand-alone company may be higher or lower than the amounts reflected in the consolidated financial statements.
In the year ended December 31, 2008, VMware resolved with EMC certain acquisition-related intercompany liabilities due to EMC. As a result, intercompany liabilities due to EMC of $9.7 million were recorded as a capital contribution from EMC in additional paid-in capital without the issuance of additional equity by VMware or remittance of any cash.
As of December 31, 2010, VMware had $76.5 million due from EMC, which was partially offset by $21.0 million due to EMC. As of December 31, 2009, VMware had $47.1 million due from EMC, which was partially offset by $20.7 million due to EMC. The net amounts due from EMC as of December 31, 2010 and December 31, 2009 were $55.5 million and $26.4 million, respectively, and resulted from the related party transactions described above. In addition to the $55.5 million due from EMC, as of December 31, 2010, VMware had $144.3 million of income taxes receivable due from EMC, which is included in other current assets on
105
VMware, Inc.
NOTES TO CONSOLIDATED FINANCIAL STATEMENTS (continued)
VMware's consolidated balance sheets. As of December 31, 2009, VMware had $3.0 million of income taxes receivable due from EMC and $10.5 million of income taxes payable due to EMC. A large portion of the income tax receivable is related to 2010 federal income taxes and is expected to be received from EMC after the 2010 consolidated federal tax return extension is filed. Balances due to or from EMC which are unrelated to tax obligations are generally settled in cash within 60 days of each quarter-end. The timing of the tax payments due to and from EMC is governed by the tax sharing agreement with EMC.
Transactions with Other Related Parties
In the fourth quarter of 2009, VMware entered into a definitive agreement to invest and participate in the management of VCE, (formerly "Acadia Enterprises, LLC"). VCE is a joint venture between EMC and Cisco focused on accelerating customer build-outs of private cloud infrastructures through end-to-end enablement of service providers and large enterprise customers. In addition to Cisco and EMC as the lead investors, the build-out of VCE's expanded capabilities in 2010 has also been capitalized by investments from VMware and Intel. VMware and Intel each have a minority ownership interest in the joint venture. VMware's participation in the joint venture is accounted for under the equity method and did not have a material impact on the Company's consolidated financial statements as of and for the years ended December 31, 2010 and 2009.
Cisco Systems holds 6.5 million shares of VMware Class A common stock representing greater than 5% of VMware's outstanding Class A common stock. VMware has in the past done business, and expects to continue to do business, with Cisco on a regular arm's-length basis, on the same or similar terms as would be negotiated with unrelated third parties. The transactions with Cisco in 2010, 2009 and 2008 were not material to VMware's consolidated financial statements.
N. Segment Information
VMware operates in one reportable segment. Operating segments are defined as components of an enterprise about which separate financial information is evaluated regularly by the chief operating decision maker in deciding how to allocate resources and assessing performance. Since VMware operates in one operating segment, all required financial segment information can be found in the consolidated financial statements.
Revenues by geographic area were as follows (table in thousands):
| For the Year Ended December 31, | ||||||||||||
| 2010 | 2009 | 2008 | ||||||||||
United States | $ | 1,452,738 | $ | 1,039,033 | $ | 987,604 | ||||||
International | 1,404,605 | 984,904 | 893,423 | |||||||||
Total | $ | 2,857,343 | $ | 2,023,937 | $ | 1,881,027 | ||||||
No country other than the United States had material revenues for the years ended December 31, 2010, 2009 or 2008.
Two distributors each accounted for more than 10% of revenues in 2010, 2009 and 2008, respectively, and another distributor accounted for more than 10% of revenues in 2010, but less than 10% of revenues in 2009 and 2008. One channel partner accounted for more than 10% of revenues in 2008, but less than 10% of revenues in 2010 and 2009, respectively.
106
VMware, Inc.
NOTES TO CONSOLIDATED FINANCIAL STATEMENTS (continued)
Long-lived assets by geographic area, which primarily include property and equipment, net, at December 31, 2010, 2009 and 2008 were as follows (table in thousands):
| For the Year Ended December 31, | ||||||||||||
| 2010 | 2009 | 2008 | ||||||||||
United States | $ | 306,182 | $ | 297,232 | $ | 325,368 | ||||||
International | 43,363 | 42,758 | 44,530 | |||||||||
Total | $ | 349,545 | $ | 339,990 | $ | 369,898 | ||||||
No country other than the United States accounted for 10% or more of these assets at December 31, 2010, 2009 or 2008, respectively.
VMware groups its products into portfolios that are categorized into the following classes:
Cloud infrastructure & management products. Cloud infrastructure & management products include the Company's infrastructure virtualization and management products. The Company's infrastructure virtualization products include a hypervisor for decoupling the entire software environment from its underlying hardware infrastructure and products that enable the aggregation of multiple servers, storage infrastructure, and networks into shared pools of resources that can be delivered dynamically, securely and reliably to applications as needed. The Company's virtualization management products help streamline IT processes and reduce operating costs by automating critical workflows in the data center, while infrastructure management products help companies automate business continuity processes, manage capacity more efficiently and provide financial cost information for internal chargeback. The cloud infrastructure virtualization and management products include infrastructure features such as VMware vMotion and VMware Storage vMotion, VMware High Availability, VMware Fault Tolerance, VMware Distributed Resource Scheduler, VMware vNetwork Distributed Switch and the VMware vShield family of security products, and management products such as VMware vCenter Server, VMware vCenter Orchestrator, VMware vCloud Director, VMware vCenter Site Recovery Manager, VMware vCenter Lab Manager, VMware vCenter CapacityIQ, VMware vCenter Configuration Manager, VMware vCenter AppSpeed, VMware vCenter Application Discovery Manager, VMware Service Manager, VMware Request Manager and VMware vCenter Chargeback.
Other Products. The other product category includes application solutions and end-user computing products, including desktop virtualization products. The Company's application solutions help organizations build, run and manage enterprise applications and include products such as the VMware vFabric family of products and RabbitMQ. The Company's end-user computing products enable a user-centric approach to personal computing that ensures secure access to applications and data from a variety of devices and locations, while also addressing the needs of corporate IT departments, and include the products VMware View, VMware ThinApp, VMware Zimbra, VMware Workstation and VMware Fusion.
Revenues by class of products or services were as follows (table in thousands):
| For the Year Ended December 31, | ||||||||||||
| 2010 | 2009 | 2008 | ||||||||||
Cloud infrastructure & management | $ | 1,263,232 | $ | 945,018 | $ | 1,178,142 | ||||||
Other products | 138,192 | 84,424 | - | |||||||||
License revenues | 1,401,424 | 1,029,442 | 1,178,142 | |||||||||
Services revenues | 1,455,919 | 994,495 | 702,885 | |||||||||
Total | $ | 2,857,343 | $ | 2,023,937 | $ | 1,881,027 | ||||||
107
VMware, Inc.
NOTES TO CONSOLIDATED FINANCIAL STATEMENTS (continued)
O. Selected Quarterly Financial Data (unaudited)
Quarterly financial data for 2010 and 2009 were as follows (tables in millions, except per share amounts):
2010 | Q1 2010 | Q2 2010 | Q3 2010 | Q4 2010 | ||||||||||||
Revenues | $ | 633.5 | $ | 673.9 | $ | 714.2 | $ | 835.7 | ||||||||
Net income | $ | 78.4 | $ | 74.5 | $ | 84.6 | $ | 119.9 | ||||||||
Net income per share, basic | $ | 0.19 | $ | 0.18 | $ | 0.21 | $ | 0.29 | ||||||||
Net income per share, diluted | $ | 0.19 | $ | 0.18 | $ | 0.20 | $ | 0.28 | ||||||||
2009 | Q1 2009 | Q2 2009 | Q3 2009 | Q4 2009 | ||||||||||||
Revenues | $ | 470.3 | $ | 455.7 | $ | 489.8 | $ | 608.2 | ||||||||
Net income | $ | 69.9 | $ | 32.5 | $ | 38.2 | $ | 56.4 | ||||||||
Net income per share, basic | $ | 0.18 | $ | 0.08 | $ | 0.10 | $ | 0.14 | ||||||||
Net income per share, diluted | $ | 0.18 | $ | 0.08 | $ | 0.09 | $ | 0.14 | ||||||||
Approximately $5 million of expenses, which were recorded during the third quarter of 2009, should have been recorded during the second quarter of 2009. As a result, operating expenses for the second quarter of 2009 were understated and operating expenses for the third quarter of 2009 were overstated by approximately $5 million. The table above is shown as previously reported and does not reflect these differences. The Company performed an evaluation and concluded that this amount is not material to either period, and that there is no impact to the year ended December 31, 2009.
P. Subsequent Event
Stock Repurchases
On February 25, 2011, a committee of VMware's Board of Directors authorized the repurchase of up to an additional $550 million of VMware's Class A common stock. Stock repurchases may be made from time-to-time in open market transactions or privately negotiated transactions. The timing of any repurchases and the actual number of shares repurchased will depend on a variety of factors, including VMware's stock price, corporate and regulatory requirements and other market and economic conditions.
108
| ITEM 9. | CHANGES IN AND DISAGREEMENTS WITH ACCOUNTANTS ON ACCOUNTING AND FINANCIAL DISCLOSURES |
None.
| ITEM 9A. | CONTROLS AND PROCEDURES |
Evaluation of Disclosure Controls and Procedures
We carried out an evaluation required by the Exchange Act, under the supervision and with the participation of our principal executive officer and principal financial officer, of the effectiveness of the design and operation of our disclosure controls and procedures, as defined in Rule 13a-15(e) of the Exchange Act, as of the end of the period covered by this report. Based on this evaluation, our principal executive officer and principal financial officer concluded that our disclosure controls and procedures were effective to provide reasonable assurance that information required to be disclosed by us in the reports that we file or submit under the Exchange Act is recorded, processed, summarized and reported within the time periods specified in the Securities and Exchange Commission's rules and forms and to provide reasonable assurance that such information is accumulated and communicated to our management, including our principal executive officer and principal financial officer, as appropriate to allow timely decisions regarding required disclosures.
Management's Report on Internal Control over Financial Reporting
Management is responsible for establishing and maintaining adequate internal control over financial reporting, as defined in Rule 13a-15(f) of the Exchange Act. Management has assessed the effectiveness of our internal control over financial reporting as of December 31, 2010 based on criteria established in Internal Control-Integrated Framework issued by the Committee of Sponsoring Organizations of the Treadway Commission. As a result of this assessment, management concluded that, as of December 31, 2010, our internal control over financial reporting was effective in providing reasonable assurance regarding the reliability of financial reporting and the preparation of financial statements for external purposes in accordance with generally accepted accounting principles. The effectiveness of our internal control over financial reporting as of December 31, 2010 has been audited by PricewaterhouseCoopers, LLP, an independent registered public accounting firm, as stated in their report which appears in Item 8 of this Annual Report on Form 10-K.
Changes in Internal Controls Over Financial Reporting
There were no changes in our internal control over financial reporting during the most recent fiscal quarter ended December 31, 2010 that materially affected, or are reasonably likely to materially affect, our internal control over financial reporting.
Limitations on Controls
Our disclosure controls and procedures and internal control over financial reporting are designed to provide reasonable assurance of achieving their objectives as specified above. Management does not expect, however, that our disclosure controls and procedures or our internal control over financial reporting will prevent or detect all error and fraud. Any control system, no matter how well designed and operated, is based upon certain assumptions and can provide only reasonable, not absolute, assurance that its objectives will be met. Further, no evaluation of controls can provide absolute assurance that misstatements due to error or fraud will not occur or that all control issues and instances of fraud, if any, within the Company have been detected.
| ITEM 9B. | OTHER INFORMATION |
On February 25, 2011, a committee of VMware's Board of Directors authorized the repurchase of up to an additional $550 million of VMware's Class A common stock. Stock repurchases may be made from time-to-time in open market transactions or privately negotiated transactions. The timing of any repurchases and the actual number of shares repurchased will depend on a variety of factors, including VMware's stock price, corporate and regulatory requirements and other market and economic conditions.
109
PART III
| ITEM 10. | DIRECTORS, EXECUTIVE OFFICERS AND CORPORATE GOVERNANCE |
We will furnish to the Securities and Exchange Commission a definitive Proxy Statement no later than 120 days after the close of the fiscal year ended December 31, 2010. The information required by this item is incorporated herein by reference to the Proxy Statement. Also see "Executive Officers of the Registrant" in Part I of this Annual Report on Form 10-K.
We have a code of ethics that applies to all of our employees, including our executive officers. Our Business Conduct Guidelines (available on our website) satisfy the requirements set forth in Item 406 of Regulation S-K and apply to all relevant persons set forth therein. We intend to disclose on our website at www.vmware.com amendments to, and, if applicable, waivers of, our code of ethics.
| ITEM 11. | EXECUTIVE COMPENSATION |
The information required by this item is incorporated herein by reference to the section of the company's Proxy Statement entitled "Compensation of Executive Officers."
| ITEM 12. | SECURITY OWNERSHIP OF CERTAIN BENEFICIAL OWNERS AND MANAGEMENT AND RELATED STOCKHOLDER MATTERS |
The information required by this item is incorporated herein by reference to the section of the company's Proxy Statement entitled "Security Ownership of Certain Beneficial Owners and Management."
| ITEM 13. | CERTAIN RELATIONSHIPS AND RELATED TRANSACTIONS, AND DIRECTOR INDEPENDENCE |
The information required by this item is incorporated herein by reference to the section of the company's Proxy Statement entitled "Our Board of Directors and Nominees" and "Transactions with Related Persons."
| ITEM 14. | PRINCIPAL ACCOUNTANT FEES AND SERVICES |
The information required by this item is incorporated herein by reference to the section of the company's Proxy Statement entitled "Ratification of Selection of Independent Auditors."
110
PART IV
| ITEM 15. | EXHIBITS AND FINANCIAL STATEMENT SCHEDULE |
| (a) | Documents filed as a part of this report: |
| 1. | Financial statements |
The financial statements listed in the Index to Consolidated Financial Statements are filed as part of this report (refer to Item 8. Financial Statements and Supplementary Data).
| 2. | Financial statement schedule |
Schedule II-Valuation and Qualifying Accounts
All other schedules have been omitted because the required information is included in the consolidated financial statements or the notes thereto, or is not applicable or required.
| 3. | Index to exhibits |
Exhibit | Exhibit Description | Incorporated by Reference | ||||||
| Filed Herewith | Form/File No. | Date | ||||||
| 3.1 | Amended and Restated Certificate of Incorporation | S-1/A-2 | 7/9/2007 | |||||
| 3.2 | Amended and Restated Bylaws | S-1/A-2 | 7/9/2007 | |||||
| 4.1 | Form of specimen common stock certificate | S-1/A-4 | 7/27/2007 | |||||
| 10.1 | Form of Master Transaction Agreement between VMware, Inc. and EMC Corporation | S-1/A-2 | 7/9/2007 | |||||
| 10.2 | Form of Administrative Services Agreement between VMware, Inc. and EMC Corporation | S-1/A-2 | 7/9/2007 | |||||
| 10.3 | Form of Tax Sharing Agreement between VMware, Inc. and EMC Corporation | S-1/A-2 | 7/9/2007 | |||||
| 10.4 | Form of Intellectual Property Agreement between VMware, Inc. and EMC Corporation | S-1/A-1 | 6/11/2007 | |||||
| 10.5 | Form of Employee Benefits Agreement between VMware, Inc. and EMC Corporation | S-1/A-2 | 7/9/2007 | |||||
| 10.6 | Form of Real Estate License Agreement between VMware, Inc. and EMC Corporation | S-1/A-2 | 7/9/2007 | |||||
| 10.7+ | Letter Agreement between VMware, Inc. and Mark Peek dated March 16, 2007 | S-1/A-1 | 6/11/2007 | |||||
| 10.8+ | Form of Indemnification Agreement for directors and executive officers | S-1/A-1 | 6/11/2007 | |||||
| 10.9+ | 2007 Equity and Incentive Plan, as amended December 13, 2010 | X | ||||||
| 10.10 | Promissory Note between VMware, Inc. and EMC Corporation dated April 16, 2007 | S-1 | 6/11/2007 | |||||
| 10.11 | Form of Insurance Matters Agreement between VMware, Inc. and EMC Corporation | S-1/A-2 | 7/9/2007 | |||||
| 10.12+ | Form of Option Agreement, as amended October 15, 2010 | X | ||||||
111
Exhibit | Exhibit Description | Incorporated by Reference | ||||||
| Filed Herewith | Form/File No. | Date | ||||||
| 10.13+ | Form of Restricted Stock Unit Agreement, as amended October 15, 2010 | X | ||||||
| 10.14 | 2007 Employee Stock Purchase Plan, as amended and restated December 10, 2007 and as further amended February 4, 2009 | 10-K | 3/1/2010 | |||||
| 10.15+ | Letter Agreement between VMware, Inc. and Mark Peek dated June 13, 2007 | 10-K | 2/29/2008 | |||||
| 10.16 | Form of Early Exercise Option Agreement | S-1/A-2 | 7/27/2007 | |||||
| 10.17+ | Letter Agreement between VMware, Inc. and Paul Maritz dated September 11, 2008 | 8-K | 9/12/2008 | |||||
| 10.18+ | Letter Agreement between VMware, Inc. and Mark Peek dated November 24, 2008 | 10-K | 2/26/2009 | |||||
| 10.19+ | Letter Agreement between VMware, Inc. and Tod Nielsen dated January 5, 2009 | 10-K | 2/26/2009 | |||||
| 10.20+ | Letter Agreement between VMware, Inc. and Richard McAniff dated March 19, 2009 | 10-Q | 5/7/2009 | |||||
| 10.21+ | Letter Agreement between VMware, Inc. and Dawn Smith dated September 16, 2009 | 10-K | 3/1/2010 | |||||
| 21.1 | List of subsidiaries | X | ||||||
| 23.1 | Consent of PricewaterhouseCoopers LLP | X | ||||||
| 31.1 | Certification of Principal Executive Officer required by Rule 13a-14(a) or Rule 15d-14(a) of the Securities Exchange Act of 1934, as adopted pursuant to Section 302 of the Sarbanes-Oxley Act of 2002. | X | ||||||
| 31.2 | Certification of Principal Financial Officer required by Rule 13a-14(a) or Rule 15d-14(a) of the Securities Exchange Act of 1934, as adopted pursuant to Section 302 of the Sarbanes-Oxley Act of 2002. | X | ||||||
| 32.1 | Certification of Chief Executive Officer pursuant to 18 U.S.C. Section 1350, as adopted pursuant to Section 906 of the Sarbanes-Oxley Act of 2002. | X | ||||||
| 32.2 | Certification of Chief Financial Officer pursuant to 18 U.S.C. Section 1350, as adopted pursuant to Section 906 of the Sarbanes-Oxley Act of 2002. | X | ||||||
| 101.INS | XBRL Instance Document | X | ||||||
| 101.SCH | XBRL Taxonomy Extension Schema | X | ||||||
| 101.CAL | XBRL Taxonomy Extension Calculation Linkbase | X | ||||||
| 101.DEF | XBRL Taxonomy Extension Definition Linkbase | X | ||||||
| 101.LAB | XBRL Taxonomy Extension Label Linkbase | X | ||||||
| 101.PRE | XBRL Taxonomy Extension Presentation Linkbase | X | ||||||
| + | Management contract or compensatory plan or arrangement. |
112
SIGNATURES
Pursuant to the requirements of Section 13 or 15(d) of the Securities Exchange Act of 1934, the registrant has duly caused this report to be signed on its behalf by the undersigned, thereunto duly authorized.
| VMWARE, INC. | ||||
Dated: February 28, 2011 | By: | / S / P AUL A. M ARITZ | ||
| Paul A. Maritz | ||||
| Chief Executive Officer | ||||
| VMWARE, INC. | ||||
Dated: February 28, 2011 | By: | / S / R OBYNNE D. S ISCO | ||
Robynne D. Sisco Chief Accounting Officer and Corporate Controller (Principal Accounting Officer and Duly Authorized Officer) | ||||
Pursuant to the requirements of the Securities Exchange Act of 1934, this report has been signed below by the following persons on behalf of the registrant and in the capacities and on the dates indicated.
Date | Signature | Title | ||
| February 28, 2011 | /s/ P AUL M ARITZ Paul Maritz | Chief Executive Officer and Director (Principal Executive Officer) | ||
| February 28, 2011 | /s/ M ARK S. P EEK Mark S. Peek | Chief Financial Officer and Co-President, Business Operations (Principal Financial Officer) | ||
| February 28, 2011 | /s/ J OSEPH M. T UCCI Joseph M. Tucci | Chairman | ||
| February 28, 2011 | /s/ M ICHAEL W. B ROWN Michael W. Brown | Director | ||
| February 28, 2011 | /s/ J OHN R. E GAN John R. Egan | Director | ||
| February 28, 2011 | /s/ D AVID I. G OULDEN David I. Goulden | Director | ||
| February 28, 2011 | /s/ R ENEE J. J AMES Renee J. James | Director | ||
| February 28, 2011 | /s/ D ENNIS D. P OWELL Dennis D. Powell | Director | ||
| February 28, 2011 | /s/ D AVID N. S TROHM David N. Strohm | Director | ||
113
VMWARE, INC.
SCHEDULE II-VALUATION AND QUALIFYING ACCOUNTS
(in thousands)
Allowance for Bad Debts | Balance at Beginning of Period | Allowance for Bad Debts Charged to Selling, General, and Administrative Expenses | Charged to Other Accounts | Bad Debts Write-Offs | Balance at End of Period | |||||||||||||||
Year ended December 31, 2010 allowance for doubtful accounts | $ | 2,525 | $ | 2,574 | $ | - | $ | (580 | ) | $ | 4,519 | |||||||||
Year ended December 31, 2009 allowance for doubtful accounts | 1,690 | 1,107 | - | (272 | ) | 2,525 | ||||||||||||||
Year ended December 31, 2008 allowance for doubtful accounts | 1,603 | 254 | - | (167 | ) | 1,690 | ||||||||||||||
Tax Valuation Allowance | Balance at Beginning of Period | Tax
Valuation Allowance Charged to Income Tax Provision | Charged to Other Accounts (1) | Tax Valuation Allowance Credited to Income Tax Provision | Balance at End of Period | |||||||||||||||
Year ended December 31, 2010 income tax valuation allowance | $ | 28,852 | $ | 20,878 | $ | (13,759 | ) | $ | (98 | ) | $ | 35,873 | ||||||||
Year ended December 31, 2009 income tax valuation allowance | 15,394 | 10,644 | 4,350 | (1,536 | ) | 28,852 | ||||||||||||||
Year ended December 31, 2008 income tax valuation allowance | - | 15,394 | - | - | 15,394 | |||||||||||||||
| (1) | For the year ended December 31, 2010, VMware reduced the valuation allowance in connection with state tax credits assigned to other corporations within the combined reporting group. VMware did not credit the income tax provision because the credits assigned were subject to a full valuation allowance. For the year ended December 31, 2009, VMware increased the valuation allowance in connection with acquired deferred tax assets and non-U.S. net operating losses, which resulted in a corresponding increase to goodwill related to the acquisition. |
114