|
UNITED STATES
SECURITIES AND EXCHANGE COMMISSION
Washington, D.C. 20549
FORM 10-K |
x | ANNUAL REPORT PURSUANT TO SECTION 13 OR 15(d) OF THE SECURITIES EXCHANGE ACT OF 1934 |
| For the fiscal year ended November 1, 2015 |
|
|
o | TRANSITION REPORT PURSUANT TO SECTION 13 OF 15(d) OF THE SECURITIES EXCHANGE ACT OF 1934 |
| For the transition period from to . |
Commission File Number: 001-09232 |
VOLT INFORMATION SCIENCES, INC.
(Exact name of registrant as specified in its charter)
New York |
| 13-5658129 |
(State or other jurisdiction of incorporation or organization) |
| (I.R.S. Employer Identification No.) |
1133 Avenue of the Americas, New York, New York |
| 10036 |
(Address of principal executive offices) |
| (Zip Code) |
Registrant's telephone number, including area code:
(212) 704-2400
Securities Registered Pursuant to Section 12(b) of the Act:
Title of each class |
| Name of each exchange on which registered |
Common Stock $0.10 Par Value |
| NYSE MKT LLC |
Securities Registered Pursuant to Section 12(g) of the Act:
(Title of class)
|
Indicate by check mark if the registrant is a well-known seasoned issuer, as defined in Rule 405 of the Securities Act. Yes No x
Indicate by check mark if the registrant is not required to file reports pursuant to Section 13 or Section 15(d) of the Act. Yes No x
Indicate by check mark whether the registrant (1) has filed all reports required to be filed by Section 13 or 15(d) of the Securities Exchange Act of 1934 during the preceding 12 months (or for such shorter period that the registrant was required to file such reports) and (2) has been subject to such filing requirements for the past 90 days. Yes x No
Indicate by check mark whether the registrant has submitted electronically and posted on its corporate Website, if any, every Interactive Data File required to be submitted and posted pursuant to Rule 405 of Regulation S-T (§232.405 of this chapter) during the preceding 12 months (or for such shorter period that the registrant was required to submit and post such files). Yes x No
Indicate by check mark if disclosure of delinquent filers pursuant to Item 405 of Regulation S-K is not contained herein, and will not be contained, to the best of registrant's knowledge, in definitive proxy or information statements incorporated by reference in Part III of this Form 10-K or any amendment to this Form 10-K. o
Indicate by check mark whether the registrant is a large accelerated filer, an accelerated filer, a non-accelerated filer, or a smaller reporting company. See the definitions of "large accelerated filer," "accelerated filer" and "smaller reporting company" in Rule 12b-2 of the Exchange Act.
Large accelerated filer o |
| Accelerated filer x |
| Non-accelerated filer o |
| Smaller reporting company o |
|
|
|
| |||
|
|
|
| (Do not check if a smaller reporting company) |
|
|
Indicate by check mark whether the registrant is a shell company (as defined in Rule 12b-2 of the Act). Yes No x
As of May 1, 2015, there were 20,705,496 shares of common stock outstanding. The aggregate market value of the voting and non-voting common stock held by non-affiliates as of May 1, 2015 was $116,376,120, calculated by using the closing price of the common stock on such date on the NYSE MKT market of $11.86.
As of January 4, 2016 there were 20,830,457 shares of common stock outstanding.
DOCUMENTS INCORPORATED BY REFERENCE
Portions of the registrant's Definitive Proxy Statement to be filed for its 2016 Annual Meeting of Shareholders are incorporated by reference into Part III of this report.
|
VOLT INFORMATION SCIENCES, INC.
ANNUAL REPORT ON FORM 10-K FOR THE YEAR ENDED NOVEMBER 1, 2015
TABLE OF CONTENTS
|
| Page |
CAUTIONARY STATEMENT REGARDING FORWARD-LOOKING STATEMENTS | 3 | |
|
|
|
PART I |
|
|
|
|
|
ITEM 1. | Business | 4 |
ITEM 1A. | Risk Factors | 10 |
ITEM 1B. | Unresolved Staff Comments | 17 |
ITEM 2. | Properties | 18 |
ITEM 3. | Legal Proceedings | 18 |
ITEM 4. | Mine Safety Disclosures | 18 |
|
|
|
PART II |
|
|
|
|
|
ITEM 5. | Market for Registrant's Common Equity, Related Stockholder Matters and Issuer Purchases of Equity Securities | 19 |
ITEM 6. | Selected Financial Data | 21 |
ITEM 7. | Management's Discussion and Analysis of Financial Condition and Results of Operations | 22 |
ITEM 7A. | Quantitative and Qualitative Disclosures About Market Risk | 35 |
ITEM 8. | Financial Statements and Supplementary Data | 36 |
ITEM 9. | Changes in and Disagreements with Accountants on Accounting and Financial Disclosure | 36 |
ITEM 9A. | Controls and Procedures | 37 |
ITEM 9B. | Other Information | 39 |
|
|
|
PART III |
|
|
|
|
|
ITEM 10. | Directors, Executive Officers and Corporate Governance | 39 |
ITEM 11. | Executive Compensation | 39 |
ITEM 12. | Security Ownership of Certain Beneficial Owners and Management and Related Stockholder Matters | 39 |
ITEM 13. | Certain Relationships and Related Transactions and Director Independence | 39 |
ITEM 14. | Principal Accounting Fees and Services | 39 |
|
|
|
PART IV |
|
|
|
|
|
ITEM 15. | Exhibits, Financial Statement Schedules | 40 |
|
|
|
Signatures |
| 41 |
Table of Contents
CAUTIONARY STATEMENT REGARDING FORWARD-LOOKING STATEMENTS
Certain statements contained in this report are "forward-looking" statements within the meaning of that term in Section 27A of the Securities Act of 1933, as amended (the "Securities Act"), and Section 21E of the Securities Exchange Act of 1934, as amended (the "Exchange Act"). Forward-looking statements include statements that reflect the current views of our senior management with respect to our financial performance and future events of our business and industry in general. The terms "expect," "intend," "plan," "believe," "project," "forecast," "estimate," "may," "should," "anticipate" and similar statements of a future or forward-looking nature identify forward-looking statements. Forward-looking statements address matters that involve risks and uncertainties. Accordingly, there are or will be important factors that could cause our actual results to differ materially from those indicated in these forward-looking statements. We believe that these factors include, but are not limited to, the following:
• | competition within the staffing industry which has few barriers to entry; |
• | weak economic and uncertain business conditions; |
• | foreign currency fluctuations and other global business risks; |
• | impairment charges relating to our goodwill and long-lived assets; |
• | failure to comply with restrictive financial covenants; |
• | inability to renew our Financing Program or obtain a suitable replacement financing arrangement; |
• | fluctuations in interest rates and turmoil in the financial markets; |
• | challenges meeting contractual obligations due to delays, unanticipated costs and cancellations; |
• | contracts either provide no minimum purchase requirements, or are cancellable during the term or both; |
• | the loss of major customers; |
• | inability to attract and retain technologically qualified personnel; |
• | inability to implement new business initiatives; |
• | failure to keep pace with rapid changes in technology; |
• | failure to implement strategic information technology projects; |
• | inability to attract and maintain quality personnel; |
• | employment-related claims, client-indemnification claims and other claims from clients and third parties; |
• | inability to retain acceptable insurance coverage limits at a commercially reasonable cost and terms; |
• | unexpected changes in workers' compensation and other insurance plans; |
• | litigation costs; |
• | improper disclosure of sensitive or confidential employee or customer data; |
• | information technology systems are vulnerable to damage and interruption; |
• | inability to maintain effective internal controls over financial reporting; |
• | new and increased government regulation, employment costs and taxes; |
• | health care reform; |
• | volatility of stock price and related ability of investors to resell their shares at or above the purchase price; |
• | significant percentage of common stock owned by principal shareholders and their ability to exercise significant influence over the Company; |
• | potential proxy contest for the election of directors at our annual meeting; and |
• | New York State law and our Articles of Incorporation and By-laws contain provisions that could make the takeover of the Company more difficult. |
The foregoing factors should not be construed as exhaustive and should be read together with the other cautionary statements included in this report, including under the caption "Risk Factors" in Item 1A of this report. There can be no assurance that we have correctly identified and appropriately assessed all factors affecting our business. Additional risks and uncertainties not presently known to us or that we currently believe to be immaterial also may adversely impact us. If one or more events related to these or other risks or uncertainties materialize, or if our underlying assumptions prove to be incorrect, actual results may differ materially from what we anticipate. Readers should not place undue reliance on any forward-looking statements contained in this report, which speak only as of the date of this report. We undertake no obligation to update any forward-looking statements after the date of this report to conform such statements to actual results or to changes in our expectations.
3
PART I
ITEM 1. | BUSINESS |
Volt Information Sciences, Inc. (the "Company" or "Volt") is a global provider of staffing services (traditional time and materials-based as well as project-based), managed service programs, technology outsourcing services and information technology infrastructure services. Our staffing services consist of workforce solutions that include providing contingent workers, personnel recruitment services, and managed service programs supporting primarily professional administration, technical, information technology, light-industrial and engineering positions. Our managed service programs consist of managing the procurement and on-boarding of contingent workers from multiple providers. Our technology outsourcing services provide pre and post production development, testing, and customer support to companies in the mobile, gaming, and technology devices industries. In addition, we provide information technology infrastructure services which provide server, storage, network and desktop IT hardware maintenance, data center and network monitoring and operations. Our complementary businesses offer customized talent, technology and consulting solutions to a diverse client base. Volt services global industries including aerospace, automotive, banking and finance, consumer electronics, information technology, insurance, life sciences, manufacturing, media and entertainment, pharmaceutical, software, telecommunications, transportation, and utilities. The Company was incorporated in New York in 1957. Unless the context otherwise requires, throughout this report, the words "Volt," "the Company," "we," "us" and "our" refer to Volt Information Sciences, Inc. and its consolidated subsidiaries.
Geographic Regions and Segments:
Volt operates approximately 110 locations worldwide, with approximately 85% of our revenues generated in the United States where we have employees in all 50 states. Our principal non-U.S. markets include Canada, Europe and several Asia Pacific locations. Our global footprint enables us to deliver consistent quality to our enterprise customers that require an established international presence. For financial information concerning our domestic and international operations and segment reporting, see our Segment Disclosures Note in our Consolidated Financial Statements included in this report.
We report our activities in two reportable segments: Staffing Services and Other. Our operating segments have been determined in accordance with our internal management structure, which is based on operating activities. We evaluate business performance based upon several factors, using profitable revenue growth and segment operating income as the primary financial measures. We believe operating income provides management and investors a measure to analyze operating performance of each business segment against historical and competitors' data, although historical results, including operating income, may not be indicative of future results as operating income is highly contingent on many factors including the state of the economy, competitive conditions and customer preferences. We plan to assess potential changes to our reportable segments in fiscal 2016 based on our new management organization and the changes anticipated by implementing our new business strategies, including the initiatives to exit non-strategic and non-core operations.
We allocate all support related costs to the operating segments except for costs not directly relating to our operating activities such as corporate-wide general and administrative costs and fees related to restatement, investigations and remediation that were completed during 2014. These costs are not allocated because doing so would not enhance the understanding of segment operating performance and they are not used by management to measure segment performance.
Staffing Services
The Staffing Services segment provides workforce management expertise including technology outsourcing services and solutions. Our staffing services are provided through locations in North America, Europe and several Asia Pacific locations. We deliver a broad spectrum of contingent staffing, direct placement, staffing contracting and management, and other employment services. Our contingent workers are placed on assignment with our customers in a broad range of occupations including accounting, finance, administrative, engineering, information technology, manufacturing, assembly, warehousing and industrial. Our contingent staffing services are provided for varying periods of time to companies and other organizations (including government agencies) ranging from smaller retail accounts that may require ten or fewer contingent workers at a time to enterprise accounts that require as many as several thousand contingent workers at a time. Our enterprise accounts typically enter into longer term procurement agreements with us resulting in lower direct margins compared to our retail accounts.
Within our Staffing Services segment we refer to customers that require multi-location, coordinated account management and service delivery in multiple skill sets as enterprise customers, while our retail customers are primarily in a single location with sales and delivery handled primarily from a geographically local team and with relatively few headcount on assignment in one or two skill sets. We provide traditional staffing services for which we are paid on a time and materials basis and provide contingent staff that work under the supervision of our customers. We also provide project-based staffing services, for which we are sometimes paid on a basis other than time and materials.
4
Volt's contingent staffing services enable customers to easily scale their workforce to meet changing business conditions, complete a specific project, secure the services of a specialist on an as-needed basis, substitute for regular employees during vacation or other temporary absences, staff high turnover positions, or meet seasonal peaks in workforce needs. When requested, we also provide Volt personnel at the customer's location to coordinate and manage contingent workers. Many customers rely on Volt's staffing services as a strategic element of their overall workforce, allowing them to more efficiently meet their fluctuating staffing requirements.
Contingent staff is recruited through proprietary internet recruiting sites, independent web-based job search companies, and social networking talent communities through which we build and maintain proprietary databases of candidates from which we can fill current and future customer needs. Contingent workers become Volt employees during the period of their assignment and we are responsible for the payment of wages, payroll taxes, workers' compensation insurance, unemployment insurance and other benefits. Customers will sometimes hire Volt's contingent workers as their own employees after a period of time, for which we usually receive a fee.
We also provide recruitment and direct placement services of specialists in the information technology, engineering, technical, accounting, finance and administrative support disciplines. These services are primarily provided on a contingency basis with fees earned only if our customers ultimately hire the candidates.
Our staffing services include providing master vendor services under which we administer a customer's entire contingent workforce program. Our responsibilities for these programs usually include subcontracting procurement of contingent workers from other qualified staffing providers if we are unable to fill a position. In most cases, we are only required to pay subcontractors after we receive payment from our customer.
Our managed service programs ("MSPs") consist of managing the procurement and on-boarding of contingent workers and a broad range of specialized solutions that includes managing suppliers and providing sourcing and recruiting support, supplier performance measurement, consolidated customer billing, supplier payment, supplier optimization and analysis, and benchmarking of spend demographics and rates. The workforce placed on assignment through our MSPs is usually provided by third-party staffing providers ("associate vendors") or through our own staffing services. In most cases, we are only required to pay associate vendors after we receive payment from our customer. We also act as a subcontractor or associate vendor to other national providers in their MSPs.
Our MSPs are administered through the use of vendor management system software ("VMS") licensed from various VMS providers.
Our technology outsourcing services and solutions provide flexible and scalable customer care call centers, video and online gaming industry quality assurance testing services, project-based staffing and customer care solutions including end-user and technical, sales and retention support. Project-based staffing includes project management and provides IT infrastructure outsourcing, data center management, enterprise technology implementation and integration and corporate helpdesk services.
Other Segment
The Other segment consists of our information technology infrastructure services, telecommunication infrastructure and security services businesses, as well as our Uruguayan telephone directory publishing and printing business. We sold our telephone directory publishing and printing business during the third quarter of 2015 and we sold substantially all of the assets of our telecommunication infrastructure and security services business during the fourth quarter of 2015.
Our information technology infrastructure services business provides IT hardware maintenance services on major brands of server, storage, network and desktop products to the Fortune 1000. Other services provided include remote monitoring for corporate data centers and networks, and planning, migration and support services for clients seeking to migrate to a cloud environment. We deliver our services across the United States and in major business centers globally. We sell our services directly to corporate customers and through value-added resellers, partners and resellers. Our target markets include financial services, telecommunications and aerospace. This business has been classified as held for sale.
Our telecommunication infrastructure and security services business was an integrator of enterprise, location and metropolitan security, voice and data systems for Fortune 500 companies, critical infrastructure and telecommunications companies and government entities across the United States. We sold substantially all of the assets of this business during the fourth quarter of 2015.
Our telephone directory publishing and printing business published directories in Uruguay inclusive of telephone directories, directories for publishers in other countries, and commercial books, magazines, periodicals and advertising material. This business was sold during the third quarter of 2015.
5
Business Strategy
Fiscal 2015 was a year where Volt continued to advance our strategic plan with the disposition of several non-core assets which were very diverse with few synergies and very different business models. This challenged our organization to find collaborative opportunities and made it difficult for investors to determine the true value of our consolidated company. During the first quarter of 2015, the Company sold its Computer Systems segment which had generated operating losses in recent years and had significant upfront capital investments with extended payback periods. The results of this segment are presented as discontinued operations and have been excluded from continuing operations and from segment results for all periods presented. During the third quarter of 2015, we sold our telephone directory publishing and printing business in Uruguay as part of our continued strategy to dispose of non-core assets. During fiscal 2014, we exited our telecommunication infrastructure and security services government solutions business as reduced federal spending minimized the opportunity for growth, efficiencies and our ability to operate profitably. During the fourth quarter of 2015, we sold substantially all of the assets of this business. During the first quarter of 2016, we sold our staffing business in Uruguay. Each of these businesses had significantly different risk and return profiles than our core staffing services. These divestitures will enable the Company's management to primarily focus resources on opportunities within our core staffing services where we believe we are better positioned to add value.
Our continued strengths are our strong brand, our capabilities in sourcing a high quality contingent workforce and our longstanding relationships with our customers. Our focus continues to be expanding our revenue in more profitable vertical sectors and expanding our share of customer engagements, as well as ongoing improvements in the delivery of our staffing services. In an effort to reduce our operating costs, we are evaluating the efficiency of our current business delivery model, supply chain and back-office support functions. We expect that these activities will reduce costs of service through the consolidation and/or elimination of certain systems and processes, along with other reductions in discretionary spending. We believe that the results of these actions will ultimately drive higher revenues at improved margins. We remain committed to delivering superior client service at a reasonable cost. We believe that building upon our established brands and reinforcing our strong customer relationships will position Volt to grow both profitability and shareholder value. Key elements of our strategy include:
Provide Superior Customer Satisfaction, Interaction and Communication
In fiscal 2016, we will place increased emphasis on building end-to-end customer relationships by further enhancing our understanding of their needs and striving to anticipate and deliver the highest level of value-added service to our customers. This is a key factor that we believe will drive our top line growth and profitability.
Expand Margins and Reduce Operating Expenses
We are focused on increasing profitability through initiatives to increase revenues and expand margins, reduce operating expenses, provide superior delivery and expand profitable services. We are pursuing these initiatives along with promoting a culture of disciplined execution to further expand our operating income:
• | increase our market share in our key customers and target market sectors; |
• | provide superior delivery that will ultimately drive higher revenues at improved margins; |
• | focus on core business offerings and on market sectors where we are profitable or that have long-term growth potential, and reduce or eliminate non-core, non-strategic business; |
• | increase the percentage of our revenue represented by higher-margin business; |
• | exit or reduce business levels in sectors or with customers where profitability or business terms are unfavorable; |
• | consolidate financial and other administrative and support functions, implement process standardization, and use productivity metrics to drive more cost-effective performance; and |
• | invest in new and efficient systems, sales and marketing infrastructure. |
Volt will continue to evaluate our individual businesses and service offerings as we seek to manage the balance between profitability and top-line growth. These assessments are being conducted in the context of our broader portfolio and our targeted risk and return profile. Businesses or service offerings that do not meet our investment parameters will be discontinued or divested. We believe that these actions will continue to improve our results as well as the consistency of our returns across our portfolio of businesses.
Volt's top priority is the profitable expansion of our revenues and we believe that the actions we are taking will ultimately drive higher revenues. This will include expanding our footprint with existing customers and winning new profitable business. Also, we are taking actions to increase margins and reduce operating expenses as a percentage of margins, thus driving increased operating income.
6
Align Management Incentives with Corporate-Wide Objectives
We are changing management incentive structures corporate-wide to align with short- and long-term strategic objectives, financial goals and efficiency measures. Variable management compensation is being redesigned to tie to the achievement of our business strategy and goals emphasizing performance-based pay.
Retain, Recruit and Develop Talent Globally
We are focused on developing a workforce that has both exceptional technical capabilities and the leadership skills that are required to support future growth of the business, which will be achieved by developing new workforce capabilities and a committed, diverse executive team with the highest level of ethics and integrity.
Capital Allocation
In addition to our planned improvements in technology and overall processes which are anticipated to increase cash flows from operations over time, we have identified a number of capital allocation initiatives, which when executed, are expected to strengthen our balance sheet and increase our competitiveness in the marketplace during fiscal 2016. The timing of these initiatives is highly dependent upon attaining the cash flow and profitability objectives outlined in our plan and the cash flow resulting from the completion of our liquidity initiatives. We also see this as an opportunity to demonstrate our ongoing commitment to Volt shareholders as we continue to execute on our plan and return to sustainable profitability. Our capital allocation strategy includes the following elements:
• | Maintaining appropriate levels of working capital . Our business requires a certain level of cash resources to efficiently execute operations. Consistent with similar companies in our industry and operational capabilities, we estimate this amount to be 1.5 to 2.0 times our weekly cash disbursements on a global basis and must also accommodate seasonality and cyclical trends; |
• | Reinvesting in our business. We are executing a company-wide initiative to reinvest in our business including new information technology systems which will support our front-end recruitment and placement capabilities as well as increase efficiencies in our back-office financial suite. We are also investing in our sales and recruiting process and resources, which will enhance our ability to win in the marketplace; |
• | Deleveraging our balance sheet. By paying down our debt, we will strengthen our balance sheet, reduce interest costs and reduce risk going forward; |
• | Returning value to shareholders. Part of our capital allocation strategy in fiscal 2016 is to return value to our shareholders in connection with share buybacks through our existing share buyback program; and |
• | Acquiring value-added businesses. Identifying and acquiring companies which would be accretive to our operating income and that could leverage our scale, infrastructure and capabilities. Strategic acquisitions would strengthen us in certain industry verticals or in specific geographic locations. |
Customers
The Company serves multinational, national and local customers, providing staffing services (traditional time and materials-based as well as project-based), managed service programs, technology outsourcing services, information technology infrastructure services and telecommunication infrastructure and operations services and telephone directory publishing and printing in Uruguay through the latter part of 2015. The Company had no single customer that accounted for more than 10% of consolidated net revenue in the fiscal years 2015, 2014 and 2013. Our top 10 customers represented approximately 30%, 30% and 34% of our fiscal 2015, 2014 and 2013 revenue, respectively. The loss of one or more of these customers, unless the business is replaced, could have an adverse effect on our results of operations or cash flows.
For the fiscal years ended 2015, 2014 and 2013, 85.1%, 87.1% and 89.3% of our revenue, respectively, were from customers in the United States.
7
Competition
The markets for Volt's staffing services are highly competitive. There are few barriers to entry, so new entrants frequently appear, resulting in considerable market fragmentation. There are over 100 competitors with annual revenues over $300 million, some of whom are larger and have greater resources than we do. These large competitors collectively represent less than half of all staffing services revenues, and there are many smaller companies competing in varying degrees at local levels. Our direct staffing competitors include Adecco, Allegis, CDI Corp., Hudson Global, Inc., Insperity, Inc., Kelly Services, Inc., Manpower Group, Randstad, Recruit, Robert Half, Inc., Tempstaff and TrueBlue, Inc.
In addition, we compete with numerous smaller local companies in the various geographic markets in which we operate. Companies in our industries compete on price, service quality, new capabilities and technologies, marketing methods and speed of completing assignments.
Our IT infrastructure business competes with large system integration firms as well as software and hardware providers that are increasingly offering services to support their products. Many of our competitors are able to offer a wide range of global services and some of our competitors benefit from greater brand recognition than we have.
Intellectual Property
VOLT is the principal registered trademark for our brand in the United States. ARCTERN, A VOLT INFORMATION SCIENCES COMPANY, MAINTECH, PARTNER WITH US, COMPETE WITH ANYBODY, TEAM WITH US. COMPETE WITH ANYBODY, VOLT REACH and VOLTSOURCE are other registered trademarks in the United States. The Company also owns and uses common law trademarks and service marks.
We also own copyrights and patents and license technology from many providers. We rely on a combination of intellectual property rights in the United States and abroad to protect our brand and proprietary information.
Seasonality
Our Staffing Services segment's revenue and operating income are typically lowest in our first fiscal quarter due to the holiday season and are affected by customer facility closures during the holidays (in some cases for up to two weeks), and closures caused by severe winter weather conditions. The demand for our staffing services typically increases during our third and fourth fiscal quarters when customers increase the use of our administrative and industrial labor during the summer vacation period. The first couple of months of the calendar year typically have the lowest margins as employer payroll tax contributions restart each year in January. Margins typically increase in subsequent fiscal quarters as annual payroll tax contribution maximums are met, particularly for higher salaried employees.
Employees
As of November 1, 2015, Volt employed approximately 27,400 people, including approximately 24,700 who were on contingent staffing assignments for the Staffing Services segment. Those people on contingent staffing assignments are on our payroll for the length of their assignment.
We are focused on developing a workforce that has both exceptional technical capabilities and the leadership skills that are required to support our growth. Our strategy is to be a leader in the markets we serve, which will be achieved by developing new workforce capabilities and a committed, diverse world-class management team with the highest level of ethics and integrity.
We believe that our relations with our employees are satisfactory. While claims and legal actions related to staffing matters arise on a routine basis, we believe they are inherent in maintaining a large contingent workforce.
Regulation
Some states in the United States and certain foreign countries license and regulate contingent staffing service firms and employment agencies. Compliance with applicable present federal, state and local environmental laws and regulations has not had, and we believe that compliance with those laws and regulations in the future will not have, a material effect on our competitive position, financial condition, results of operations or cash flows.
Access to Our Information
We electronically file our Annual Report on Form 10-K, Quarterly Reports on Form 10-Q, Current Reports on Form 8-K and all amendments to those reports with the SEC. These and other SEC reports filed by us are available to the public free of charge at the SEC's website at www.sec.gov and in the Investors section at our website at www.volt.com, as soon as reasonably
8
practicable after filing with the SEC. You may read and copy any materials we file with the SEC at the SEC's Public Reference Room at 100 F Street, NE, Washington, D.C. 20549.
Copies of our Code of Business Conduct and Ethics and other significant corporate documents (our Corporate Governance Guidelines, Nominating/Governance Committee Charter, Audit Committee Charter, Compensation Committee Charter, Financial Code of Ethics, Whistleblower Policy, Foreign Corrupt Practices Act Policy and Insider Trading Policy) are also available in the Investors & Governance section at our website. Copies are also available without charge upon request to Volt Information Sciences, Inc., 1133 Avenue of the Americas, New York, NY 10036, Attention: Shareholder Relations, or by calling us at (212) 704-2400.
9
ITEM 1A. | RISK FACTORS |
Risk Factors
You should carefully consider the following risks along with the other information contained in this report. The following risks could materially adversely affect our business and, as a result, our financial condition, results of operations, and the market price of our common stock. Other risks and uncertainties not known to us or that we currently do not recognize as material could also materially adversely affect our business and, as a result, our financial condition, results of operations, cash flows, and the market price of our common stock.
Risks Relating to the Economy and our Industry
The contingent staffing industry is very competitive with few significant barriers to entry
The markets for Volt's staffing services are highly competitive. There are few barriers to entry, so new entrants frequently appear resulting in considerable market fragmentation. There are over 100 competitors with annual revenues over $300 million, some of whom are larger and have greater resources than we do. These competitors may be better able than we are to attract and retain qualified personnel, to offer more favorable pricing and terms, and otherwise attract and retain the business that we seek. In addition, some of the segment's customers, generally larger companies, are mandated or otherwise motivated to utilize the services of small or minority-owned companies rather than publicly held corporations such as Volt, and have redirected substantial amounts of their staffing business to those companies. We also face the risk that certain of our current and prospective customers may decide to provide similar services internally.
There has been a significant increase in the number of customers consolidating their staffing services purchases with a single provider or a small number of providers. This trend to consolidate purchases has, in some cases, made it more difficult for us to obtain or retain customers. Additionally, pricing pressures have intensified as customers have continued to competitively bid contracts. This trend is expected to continue for the foreseeable future. As a result, we cannot assure you that we will not encounter increased competition and lower margins in the future.
In our business segments, we have experienced competition and pressure on price, margins and markups for renewals of customers' contracts. There can be no assurance that we will be able to continue to compete in our business segments without impacting revenue or margins. Additionally, our efforts to manage costs in relation to our business volumes may not be successful, and the timing of these efforts and associated earnings charges may adversely affect our business.
Certain customers continue to contract for staffing services through managed service providers who assume all payment obligations on behalf of the end-customer to service suppliers such as Volt. These managed service providers may present greater credit risks than the end-customer and some of these managed service providers have in the past, and could in the future, default on their obligations to us, adversely impacting our business.
Our business is adversely affected by weak economic and other business conditions
During periods of elevated unemployment levels demand for contingent and permanent personnel decreases, which adversely impacts our Staffing Services segment. During slower economic activity, many of our customers reduce their use of contingent workers before undertaking layoffs of their own employees, resulting in decreased demand for contingent workers. Decreased demand and higher unemployment levels result in lower levels of pay rate increases and increased pressure on our markup of staffing service rates and direct margins and higher unemployment insurance costs. Since employees are also reluctant to risk changing employers, there are fewer openings available and, therefore, reduced activity in permanent placements. In recent years, many of our customers have significantly reduced their workforce, including their use of contingent labor.
Our operational results could be negatively impacted by currency fluctuations and other global business risks
Our global operations outside of the United States subject us to risks relating to our international business activities, including global economic conditions, fluctuations in currency exchange rates and numerous legal and regulatory requirements.
Adverse global economic conditions could have a direct impact on our business, results of operations and financial position. The demand for the Company's services is highly dependent upon the state of the economy and upon the staffing needs of the Company's clients. Any variation in the economic condition or unemployment levels of any of the foreign countries in which the Company does business may severely reduce the demand for the Company's services.
Our business is exposed to fluctuation in exchange rates. Our operations outside the United States are reported in the applicable local currencies and then translated into U.S. dollars at the applicable currency exchange rates for inclusion in our
10
Consolidated Financial Statements. Exchange rates for currencies of these countries may fluctuate in relation to the U.S. dollar and these fluctuations may have an adverse or favorable effect on our operating results when translating foreign currencies into U.S. dollars.
In addition, the Company faces risks in complying with various foreign laws and technical standards and unpredictable changes in foreign regulations, including U.S. legal requirements governing U.S. companies operating in foreign countries, legal and cultural differences in the conduct of business, potential adverse tax consequences, difficulty in staffing and managing international operations.
Decline in our operating results could lead to impairment charges relating to our goodwill and long-lived assets
We regularly monitor our goodwill and long-lived assets for impairment indicators. In conducting our goodwill impairment testing, we compare the fair value of each of our reporting units with goodwill to the related net book value. The Company performs its annual impairment review of goodwill in its second fiscal quarter and when a triggering event occurs between annual impairment tests. In conducting our impairment analysis of long-lived assets, we compare the undiscounted cash flows expected to be generated from the long-lived assets to the related net book values. Changes in economic or operating conditions impacting our estimates and assumptions could result in the impairment of our goodwill or long-lived assets. In the event that we determine that our goodwill or long-lived assets are impaired, we may be required to record a significant non-cash charge to earnings that could adversely affect our results of operations.
Risks Related to our Capital Structure and Finances
Our credit facility contains financial covenants that may limit our ability to take certain actions
We remain dependent upon others for our financing needs and our current credit facility includes certain financial covenants. These covenants could constrain the execution of our business strategy and growth plans. Our ability to continue to meet these financial covenants is not assured. If we default under any of these requirements, our lenders could declare all outstanding borrowings, accrued interest and fees to be due and payable or significantly increase the cost of the facility. In these circumstances, there can be no assurance that we would have sufficient liquidity to repay or refinance this indebtedness at favorable rates or at all. If we are forced to refinance these borrowings on less favorable terms, our results of operations and financial condition could be adversely affected by increased costs and rates. During fiscal 2015, we met all of the covenant requirements.
While our recent amendment to our credit facility reduced certain financing risks (elimination of the interest coverage test and extending the maturity of the loan), it also provides for a minimum liquidity covenant test ranging from $20.0 million to $50.0 million through 2016. Sources from certain liquidity events expected to be realized by the Company may be key factors in meeting our covenant obligations during 2016. In the event we do not meet the covenant test, there could be a default of the covenant requirement if a waiver is not obtained. A default in the credit facility could lead to an acceleration of the then outstanding amount by the lender making such amount immediately due and owing.
The inability to renew our credit facility could negatively affect our operations and limit our liquidity
We rely on financing for future working capital, capital expenditures and other corporate purposes. The structure of this financing requires us to renew our arrangements periodically. There can be no assurance that replacement financing will be available to us or that we will be able to negotiate replacement financing at reasonable costs or on reasonable terms.
The volatility in credit and capital markets may create additional risks to our business in the future. We are exposed to financial market risk (including refinancing risk) resulting from, among other things, changes in interest rates and conditions in the credit and capital markets. Turmoil in the credit markets or a contraction in the availability of credit may make it more difficult for us to meet our working capital requirements and could have a material adverse effect on our business, results of operations and financial position.
Fluctuations in interest rates and turmoil in the financial markets could increase our cost of borrowing and impede access to or increase the cost of financing our operations
While we have access to global credit markets through our financing activities, credit markets may experience significant disruptions. Interest rates are highly sensitive to many factors that are beyond our control, including general economic conditions and policies of various governmental and regulatory agencies and, in particular, the Federal Reserve Board. Increases in interest rates would likely increase our borrowing costs over the medium to long-term and could negatively impact our results of operations.
11
Deterioration in global financial markets could make future financing difficult or more expensive. If a financial institution that is party to our credit facility were to declare bankruptcy or become insolvent, they may be unable to perform under their agreement with us. This could leave us with reduced borrowing capacity, which could have an adverse impact on our business, financial condition and results of operations.
Risks Related to our Particular Customers and the Projects on which we Work
Our project-related businesses are subject to delays, unanticipated costs and cancellations that may result in unforeseen costs, reductions in revenues or the payment of liquidated damages
In some of our contracts we guarantee certain results of a project, such as the substantial completion of a project by a scheduled date, performance testing levels, results and other performance requirements. Failure to meet those criteria could result in additional costs or penalties, including liquidated damages, which could exceed our projected profit. Many projects involve extended time periods, sometimes over several years. We may encounter difficulties and delays, schedule changes, delays from our customers' failure to timely obtain rights required to perform or complete a project and other factors, some of which are beyond our control, that could impact our ability to complete projects in accordance with the original delivery schedules. In addition, we often contract with subcontractors to assist us with our responsibilities, and any delay or poor performance by subcontractors may result in delays in the overall progress of projects or may cause us to incur additional costs, or both. Delays and additional costs may be substantial, we may not be able to recover any or all of these costs and our revenues and operating profits could be significantly reduced. We also may be required to invest significant working capital to fund cost overruns. Delays or cancellations also may impact our reputation or relationships with customers, adversely affecting our ability to secure new contracts.
At times, project contracts may require customers or other parties to provide the specifications, design, equipment or materials to be used on a project. In some cases, the project schedule or the design, or equipment may be deficient or delivered later than required by the project schedule. In addition, our customers may change or delay various elements of a project after commencement, resulting in additional direct or indirect costs.
Under these circumstances, we generally attempt to negotiate with the customer with respect to the amount of additional time required and the compensation to be paid to us. We may be unable to obtain, through negotiation, arbitration, mediation, litigation or otherwise, adequate amounts to compensate us for additional work or expense incurred. Litigation, arbitration or mediation of claims for compensation may be lengthy and costly, and may not ultimately result in us receiving adequate compensation for these matters, which could adversely affect our results of operations or cash flows. Delays or cancellations also may impact our reputation or relationships with customers, adversely affecting our ability to secure new contracts.
Many of our contracts either provide no minimum purchase requirements, are cancellable during the term, or both
In our Staffing Services segment most contracts are not sole source, and many of our contracts, even those with multi-year terms, provide no assurance of any minimum amount of revenue. Under many of these contracts we still must compete for each individual placement or project. In addition, many of our long-term contracts contain cancellation provisions under which the customer can cancel the contract at any time or on relatively short notice, even if we are not in default under the contract. Therefore, these contracts do not provide the assurances that typical long-term contracts often provide and are inherently uncertain with respect to the revenues and earnings we may recognize with respect to our customer contracts. Consequently, in all our business segments, if customers do not utilize our services under existing contracts or do not renew existing contracts, that could adversely affect our results of operations or cash flows.
The loss of major customers could adversely impact our business
We experience revenue concentration with large customers within certain operating units. Although we have no customer that represents over 10% of revenues, the deterioration of the financial condition or business prospects of these customers, or a change in their strategy around the use of our services, could have a material adverse effect on our business, financial condition and results of operations.
Additionally, any reductions, delays or cancellation of contracts with any of our key customers or the loss of one or more key customers could materially reduce our revenue and operating income. There is no assurance that our current customers will continue to do business with us or that contracts with existing customers will continue at current or historical levels.
We are dependent upon our ability to attract and retain technologically skilled personnel
Our operations are dependent upon our ability to attract and retain technologically skilled personnel, particularly for temporary assignments to customers of our Staffing Services segment, projects at clients for our information technology infrastructure services as well as in the areas of implementation and upgrading of internal systems. The availability of such
12
personnel is dependent upon a number of economic and demographic conditions. We may, in the future, find it difficult or more costly to hire such personnel in the face of competition from other companies.
In addition, variations in the rate of unemployment and higher wages sought by contingent workers in certain technical fields that continue to experience labor shortages could affect our ability to meet our customers' demands in these fields and adversely affect our results of operations.
Risks Related to our Internal Organization, Projects and Operations
New business initiatives may have an adverse effect on our business
As part of our business strategy, we have implemented new initiatives to exit our non-core and unprofitable businesses. This includes actions to optimize our organizational structure, technology and delivery of services and to reduce the cost of operating our business. If these initiatives are ineffective or insufficient, we may be unable to effectively implement our business strategy and there can be no assurance that we will achieve our objectives.
Our results of operations and ability to grow may be negatively affected if we are not able to keep pace with rapid changes in technology
The Company's success depends on our ability to keep pace with rapid technological changes in the development and implementation of our services and solutions. We must innovate and evolve our services and products to satisfy customer requirements and to remain competitive. There can be no assurance that in the future we will be able to foresee changes needed to identify, develop and commercialize innovative and competitive services and products in a timely and cost-effective manner to achieve customer acceptance in markets characterized by rapidly changing technology and frequent new product and service introductions.
Our information technology projects may not yield their intended results
We currently have information technology projects in process or in the planning stages, including improvements to applicant onboarding and tracking systems and ERP systems. Although the technology is intended to increase productivity and operating efficiencies, these projects may not yield their intended results. Any delays in completing, or an inability to successfully complete, these technology initiatives or an inability to achieve the anticipated efficiencies could adversely affect our operations, liquidity and financial condition.
We are dependent upon the quality of our personnel
Our operations are dependent on the continued efforts of our senior management. In addition, we are dependent on the performance and productivity of our managers and field personnel. Our ability to attract and retain business is significantly affected by customer relationships and the quality of service rendered. The loss of high quality personnel and members of management with significant experience in our industry without replacement by personnel with similar quality and experience may cause a significant disruption to our business. Moreover, the loss of key managers and field personnel could jeopardize existing customer relationships with businesses that use our services based upon relationships with those managers and field personnel.
Risks Related to Legal Compliance and Litigation
We are subject to employment–related claims, client indemnification claims and other claims and losses that could have a material adverse effect on our business
Our Staffing Services segment employs or engages individuals on a contingent basis and places them in a customer's workplace. Our ability to control the customer's workplace is limited, and we risk incurring liability to our employees for injury (which can result in increased workers' compensation costs) or other harm that they suffer at the customer's workplace. In addition we may face claims related to violations of wage and hour regulations, discrimination, harassment, the employment of undocumented or unlicensed personnel, misconduct, negligence or professional malpractice by our employees, and claims relating to the misclassification of independent contractors, among others.
Additionally, we risk liability to our customers for the actions or inactions of our employees, including those individuals employed on a contingent basis that may result in harm to our customers. Such actions may be the result of negligence or misconduct on the part of our employees, damage to customer facilities due to negligence, criminal activity and other similar claims. In some cases, we must indemnify our customers for certain acts of our employees, and certain customers have negotiated increases in the scope of such indemnification agreements. We also may incur fines, penalties and losses that are not
13
covered by insurance or negative publicity with respect to these matters. There can be no assurance that the policies and procedures we have in place will be effective or that we will not experience losses as a result of these risks.
Our ability to retain acceptable coverage limits at commercially reasonable cost and terms may adversely impact our financial results
We cannot be certain we will be able to obtain appropriate types or levels of insurance in the future, that adequate replacement policies will be available on acceptable terms, if at all, and at commercially reasonable costs, or that the companies from which we have obtained insurance will be able to pay claims we make under such policies.
Our insurance policies for various exposures including, but not limited to, general liability, auto liability, workers' compensation and employer's liability, directors' and officers' insurance, professional liability, employment practices, loss to real and personal property, business interruption, fiduciary and other management liability, are limited and the losses that we face may be not be covered, may be subject to high deductibles or may exceed the limits purchased.
Unexpected changes in workers' compensation and other insurance plans may negatively impact our financial condition
Liability for workers' compensation, automobile and general liability is insured under a retrospective experience-rated insurance program for losses exceeding specified deductible levels and the Company is self-insured for losses below the specified deductible limits.
The Company is self-insured for a portion of its medical benefit programs. The liability for the self-insured medical benefits is limited on a per-claimant basis through the purchase of stop-loss insurance. The Company's retained liability for the self-insured medical benefits is determined by utilizing actuarial estimates of expected claims based on statistical analysis of historical data.
Unexpected changes related to our workers' compensation, disability and medical benefit plans may negatively impact our financial condition. Changes in the severity and frequency of claims, in state laws regarding benefit levels and allowable claims, actuarial estimates, or medical cost inflation could result in costs that are significantly higher. If future claims-related liabilities increase due to unforeseen circumstances, or if we must make unfavorable adjustments to accruals for prior accident years, our costs could increase significantly. There can be no assurance that we will be able to increase the fees charged to our customers in a timely manner and in a sufficient amount to cover the increased costs that result from any changes in claims-related liabilities.
Costs related to litigation could adversely impact our financial condition
We are involved in pending and threatened legal proceedings from time to time, the outcome of which is inherently uncertain and difficult to predict. It is uncertain at what point any of these or new matters may affect us, and there can be no assurance that our financial resources or related insurance are sufficient to cover these matters in their entirety or any one of these matters. Therefore, there can be no assurance that these matters will not have an adverse effect on our financial condition, results of operations or cash flows.
Improper disclosure of sensitive or confidential employee or customer data, including personal data, could result in liability and harm our reputation
Our business involves the use, storage and transmission of information about our full-time and contingent employees, customers and other individuals. This information may contain sensitive or confidential employee and customer data, including personally identifiable information. Cyber attacks or other breaches of network or information technology security, as well as risks associated with compliance on data privacy, could have an adverse effect on our systems, services, reputation and financial results. Additionally, our employees may have access or exposure to customer data and systems. The misuse of information could result in legal liability. It is possible that our security controls over sensitive or confidential data and other practices we and our third-party service providers follow may not prevent the improper access to, or disclosure of, such information. Such disclosure could harm our reputation and subject us to liability under our contracts and laws that protect sensitive or personal data and confidential information in various countries and jurisdictions, resulting in increased costs or loss of revenue. Further, data privacy is subject to frequently changing rules and regulations, which sometimes conflict among jurisdictions and countries in which we provide services. Our failure to adhere to or successfully implement processes in response to changing regulatory requirements in this area could result in legal liability or impairment to our reputation in the marketplace.
14
The possession and use of personal information and data in conducting our business subjects us to legislative and regulatory burdens. We may be required to incur significant expenses to secure our systems and comply with mandatory privacy and security standards and protocols imposed by laws, regulation, industry standards or contractual obligations.
We rely extensively on our information technology systems which are vulnerable to damage and interruption
We rely on information technology networks and systems, including the Internet, to process, transmit and store electronic and financial information, to manage a variety of business processes and activities, and to comply with regulatory, legal and tax requirements. We depend on our information technology infrastructure for digital marketing activities, collection and retention of customer data, employee information and for electronic communications among our locations, personnel, customers and suppliers around the world. These information technology systems may be susceptible to damage, disruptions or shutdowns due to failures during the process of upgrading or replacing software, databases or components thereof, power outages, hardware failures, computer viruses, attacks by computer hackers, telecommunication failures, user errors or catastrophic events. Our sales, financial condition and results of operations may be materially and adversely affected, and we could experience delays in reporting our financial results, if our information technology systems suffer severe damage, disruption or shutdown and our business continuity plans do not effectively resolve the issues in a timely manner.
Failure to maintain adequate financial and management processes and internal controls could lead to errors in our financial reporting
The accuracy of our financial reporting is dependent on the effectiveness of our internal control. If our management is unable to certify the effectiveness of our internal controls or if our independent registered public accounting firm can not render an opinion on the effectiveness of our internal controls over financial reporting, or if material weaknesses in our internal controls are identified, we could be subject to regulatory scrutiny and a loss of public confidence. In addition, if we do not maintain adequate financial and management personnel, processes and controls, we may not be able to accurately report our financial performance on a timely basis, which could lead to significant decreases in the trading price of our shares, or the delisting of our shares from the NYSE MKT, which would harm our shareholders.
New and increased government regulation, employment costs or taxes could have a material adverse effect on our business, especially for our contingent staffing business
Certain of our businesses are subject to licensing and regulation in some states and most foreign jurisdictions. There can be no assurance that we will continue to be able to comply with these requirements, or that the cost of compliance will not become material. Additionally, the jurisdictions in which we do or intend to do business may:
• | create new or additional regulations that prohibit or restrict the types of services that we currently provide; |
• | impose new or additional employment costs that we may not be able to pass on to customers or that could cause customers to reduce their use of our services, especially in our Staffing Services segment, which could adversely impact our business; |
• | require us to obtain additional licenses; or |
• | increase taxes (especially payroll and other employment-related taxes) or enact new or different taxes payable by the providers or users of services such as those offered by us, thereby increasing our costs, some of which we may not be able to pass on to customers or that could cause customers to reduce their use of our services especially in our Staffing Services segment, which could adversely impact our results of operations or cash flows. |
In some of our foreign markets, new and proposed regulatory activity may impose additional requirements and costs, and could cause changes in customers' attitudes regarding the use of outsourcing and contingent workers in general, which could have an adverse effect on our contingent staffing business.
15
Health care reform could increase the costs of the Company's staffing business
In March 2010, the Patient Protection and Affordable Care Act ("the Act") was signed into U.S. law. The Act represents comprehensive U.S. health care reform legislation that, in addition to other provisions, subject us to potential penalties unless we offer our employees minimum essential health care coverage that is affordable and provides minimum value. In order to comply with the employer mandate provision of the Act, we have begun offering health care coverage to all employees eligible for coverage under the Act. Designating employees as eligible is complex, and is subject to challenge by employees and the Internal Revenue Service. While we believe we have properly identified eligible employees, a later determination that we failed to offer the required health coverage to eligible employees could result in penalties that may harm our business. We cannot be certain that compliant insurance coverage will remain available to us on reasonable terms, and we could face additional risks arising from future changes to the Act or changed interpretations of our obligations under the Act. There can be no assurance that we will be able to recover all related costs through increased pricing to our customers or that they will be recovered in the period in which costs are incurred, and the net financial impact on our results of operations could be significant.
Risks Related to Our Common Stock
Our stock price could be volatile and, as a result, investors may not be able to resell their shares at or above the price they paid for them
Our stock price has in the past, and could in the future, fluctuate as a result of a variety of factors, including:
• | our failure to meet the expectations of the investment community or our estimates of our future results of operations; |
• | industry trends and the business success of our customers; |
• | loss of one or more key customers; |
• | strategic moves by our competitors, such as product or service announcements or acquisitions; |
• | regulatory developments; |
• | litigation; |
• | general economic conditions; |
• | other domestic and international macroeconomic factors unrelated to our performance; and |
• | any of the other previously noted risk factors. |
The stock market has experienced, and is likely to in the future experience, volatility that has often been unrelated to the operating performance of particular companies. These broad market fluctuations may also adversely affect the market price of our common stock.
Our principal shareholders, whose interests may differ from those of other shareholders, own a significant percentage of our common stock and will be able to exercise significant influence over Volt
As of December 31, 2015, a significant amount of our outstanding common stock was controlled by related family members. Although there can be no assurance as to how these shareholders will vote, if they vote in the same manner, these shareholders might be able to control the composition of our board of directors and many other matters requiring shareholder approval and would continue to have significant influence over our affairs. The interests of our principal shareholders may not align with those of our other shareholders.
Furthermore, the provisions of the New York Business Corporation Law, to which we are subject, require the affirmative vote of the holders of two-thirds of all of our outstanding shares entitled to vote in order to adopt a plan of merger or consolidation between us and another entity and to approve a sale, lease, exchange or other disposition of all or substantially all of our assets not made in our usual and regular course of business. Accordingly, our principal shareholders, acting together, could prevent the approval of such transactions even if such transactions are in the best interests of our other shareholders.
Our business could be negatively affected as a result of a potential proxy contest for the election of directors at our annual meeting, and such proxy contest could cause us to incur significant expense, hinder execution of our business strategy and impact the trading value of the Company's securities
In 2014 and 2015, the Company was subjected to a threatened proxy contest, which resulted in the negotiation of significant changes to the Board of Directors and substantial costs were incurred.
A proxy contest would require us to incur significant legal fees and proxy solicitation expenses and require significant time and attention by management and the Board of Directors. The potential of a proxy contest could interfere with our ability to execute our strategic plan, give rise to perceived uncertainties as to our future direction, adversely affect our relationships with key business partners, result in the loss of potential business opportunities and make it more difficult to attract and retain qualified personnel, any of which could materially and adversely affect our business and operating results.
16
The market price of our common stock could be subject to significant fluctuation or otherwise be adversely affected by the events, risks and uncertainties related to stockholder activism.
New York State law and our Articles of Incorporation and By-laws contain provisions that could make the takeover of Volt more difficult
Certain provisions of New York State law and our articles of incorporation and by-laws could have the effect of delaying or preventing a third party from acquiring Volt, even if a change in control would be beneficial to our shareholders. These provisions of our articles of incorporation and by-laws include:
• | permitting removal of directors only for cause; |
• | providing that vacancies on the board of directors will be filled by the remaining directors then in office, other than as set forth in the March 30, 2015 agreement between the Company and Glacier Peak Capital LLC and certain of its affiliates; and |
• | requiring advance notice for shareholder proposals and director nominees. |
In addition to the voting power of our principal shareholders discussed above, our board of directors could choose not to negotiate with a potential acquirer that it did not believe was in our strategic interests. If an acquirer is discouraged from offering to acquire Volt or prevented from successfully completing an acquisition by these or other measures, our shareholders could lose the opportunity to sell their shares at a more favorable price.
ITEM 1B. | UNRESOLVED STAFF COMMENTS |
None.
17
ITEM 2. PROPERTIES
As of December 2015, our corporate headquarters is located in approximately 15,000 square feet at 1133 Avenue of the Americas, New York, New York. A summary of our principal owned and leased properties (those exceeding 20,000 square feet) that are currently in use is set forth below:
United States
Location |
| Business Segment/Purpose |
| Own/Lease |
| Lease Expiration |
| Approximate Square Feet | ||
Orange County, California |
| Staffing Services and General and Administrative Offices |
| Own (1) |
| - | |
| 200,000 | |
San Antonio, Texas |
| Staffing Services |
| Lease |
| 2019 | |
| 71,000 | |
Redmond, Washington |
| Staffing Services |
| Lease |
| 2020 | |
| 66,000 | |
Montreal, Quebec |
| Staffing Services |
| Lease |
| 2020 | |
| 35,000 | |
Wallington, New Jersey |
| Other |
| Lease |
| 2018 | |
| 32,000 | |
(1) | See our Note on Debt in our Consolidated Financial Statements for information regarding a term loan secured by a deed of trust on this property. We lease approximately 39,000 square feet of these premises to an unaffiliated third party with a term through October 31, 2020, with the tenant having two additional 60-month lease renewal options and certain rights of early termination. We have undertaken a process for a sale leaseback transaction of our Orange, CA facility. The transaction is expected to take place within the first or second fiscal quarter of 2016. |
We lease space in approximately 100 other facilities worldwide, excluding month-to-month leases, each of which consists of less than 20,000 square feet. The Company's leases expire at various times from 2016 until 2025.
At times we lease space to others in the buildings that we own or lease if we do not require the space for our own business. We believe that our facilities are adequate for our presently anticipated uses, and we are not dependent upon any individual leased premises.
For additional information pertaining to lease commitments, see our Note on Commitments and Contingencies in our Consolidated Financial Statements.
ITEM 3. | LEGAL PROCEEDINGS |
From time to time, the Company is subject to claims in legal proceedings arising in the ordinary course of its business, including payroll-related and various employment-related matters. All litigation currently pending against the Company relates to matters that have arisen in the ordinary course of business and the Company believes that such matters will not have a material adverse effect on its consolidated financial condition, results of operations or cash flows.
ITEM 4. | MINE SAFETY DISCLOSURES |
Not applicable.
18
PART II
ITEM 5. | MARKET FOR REGISTRANT'S COMMON EQUITY, RELATED STOCKHOLDER MATTERS AND ISSUER PURCHASES OF EQUITY SECURITIES |
Until August 25, 2014, our common stock was listed on the over-the-counter market under the symbol "VISI". Since then it has traded on the NYSE MKT under the symbol "VISI". The following table sets forth, for the periods indicated, the high and low sales prices or the high and low bid quotations for our common stock for the years ended November 1, 2015 and November 2, 2014. The over-the-counter market bid quotations reflect inter-dealer prices, without retail mark-up, mark-down or commission and may not necessarily represent actual transactions.
Fiscal Period |
|
| First Quarter |
| Second Quarter |
| Third Quarter |
| Fourth Quarter | ||||||||
2015 | High |
| $ | 12.73 | |
| $ | 12.85 | |
| $ | 11.96 | |
| $ | 9.98 | |
| Low |
| $ | 8.28 | |
| $ | 10.28 | |
| $ | 8.95 | |
| $ | 7.97 | |
2014 | High |
| $ | 10.05 | |
| $ | 10.15 | |
| $ | 9.50 | |
| $ | 9.50 | |
| Low |
| $ | 8.30 | |
| $ | 7.94 | |
| $ | 7.45 | |
| $ | 7.77 | |
On January 5, 2016 there were 261 holders of record of our common stock, exclusive of shareholders whose shares were held by brokerage firms, depositories and other institutional firms in "street name" for their customers.
Issuer Purchases of Equity Securities
On January 14, 2015, the Board of Directors approved a new 36-month share repurchase program of up to 1,500,000 shares of the Company's common stock to begin on January 19, 2015, replacing a prior program. Such repurchases can be made through open market or private transactions. Share repurchases under the program will be subject to specified parameters and certain price and volume restraints and any repurchased shares will be held in treasury. The exact number and timing of share repurchases will depend upon market conditions and other factors. There were no shares purchased in the fourth quarter of fiscal 2015.
19
Performance Information
Shareholder Return Performance Graph
The Company has changed its indexes for fiscal 2015, removing both the NYSE Composite and a custom peer group of companies having market capitalizations that are within 5% of the market capitalization of the Company's common stock as of the year-end of fiscal period. This peer group was previously selected because of its operations in diverse business segments. However, as a result of our exit of non-core businesses, the Company has selected the S&P 1500 Human Resources and Employment Services Index to more appropriately reflect our performance relative to our peers. The Company has also been included in the Russell 2000 index since June 2015 and consequently, this index will replace the NYSE Composite.
The graph includes two indexes from fiscal year 2014 - NYSE Composite (Prior) and Peer Group Index (Prior).
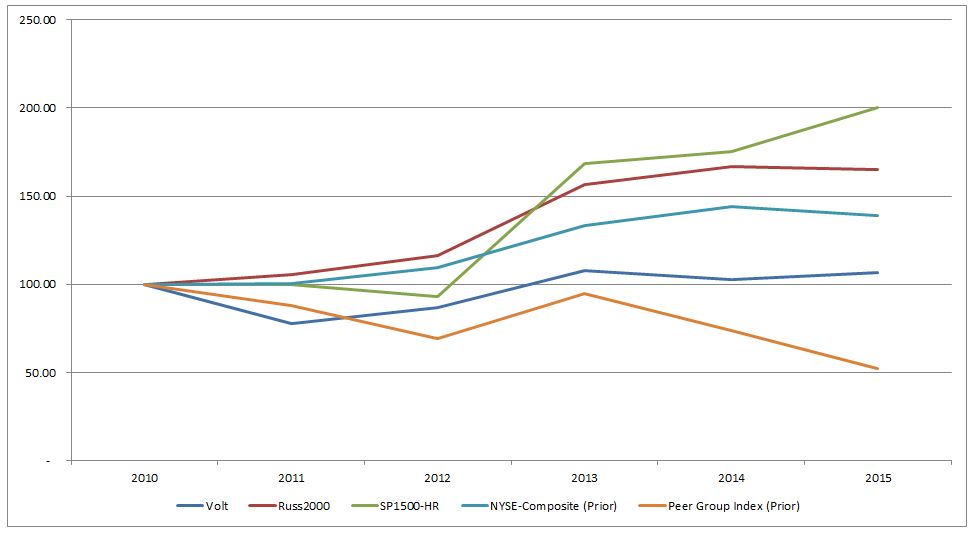
* $100 invested on 11/1/10 in stock or index, including reinvestment of dividends.
20
ITEM 6. | SELECTED FINANCIAL DATA |
The following selected financial data reflects the results of operations and balance sheet data for the fiscal years ended November 1, 2015, November 2, 2014, November 3, 2013, October 28, 2012 and October 30, 2011. The data below should be read in conjunction with, and is qualified by reference to, Item 7. Management's Discussion and Analysis of Financial Condition and Results of Operations and the Company's Consolidated Financial Statements and notes thereto. The financial information presented may not be indicative of our future performance.
Volt Information Sciences, Inc. and Subsidiaries
Selected Financial Data
| |||||||||||||||||||
For the year ended, (in thousands, except per share data) | November 1, 2015 |
| November 2, |
| November 3, |
| October 28, |
| October 30, | ||||||||||
| 52 weeks |
| 52 weeks |
| 53 weeks |
| 52 weeks |
| 52 weeks | ||||||||||
STATEMENT OF OPERATIONS DATA |
|
|
|
|
|
|
|
|
| ||||||||||
Net revenue | $ | 1,496,897 | |
| $ | 1,710,028 | |
| $ | 2,017,472 | |
| $ | 2,146,448 | |
| $ | 2,072,760 | |
Operating income (loss) | $ | (12,760 | ) |
| $ | 4,786 | |
| $ | (7,252 | ) |
| $ | (11,018 | ) |
| $ | (39,872 | ) |
Loss from continuing operations, net of income taxes | $ | (19,786 | ) |
| $ | (3,387 | ) |
| $ | (12,743 | ) |
| $ | (16,035 | ) |
| $ | (28,669 | ) |
Income (loss) from discontinued operations, net of income taxes | $ | (4,834 | ) |
| $ | (15,601 | ) |
| $ | (18,132 | ) |
| $ | 2,432 | |
| $ | 44,298 | |
Net income (loss) | $ | (24,620 | ) |
| $ | (18,988 | ) |
| $ | (30,875 | ) |
| $ | (13,603 | ) |
| $ | 15,629 | |
PER SHARE DATA: |
|
|
|
|
|
|
|
|
| ||||||||||
Basic: |
|
|
|
|
|
|
|
|
| ||||||||||
Loss from continuing operations | $ | (0.95 | ) |
| $ | (0.16 | ) |
| $ | (0.61 | ) |
| $ | (0.77 | ) |
| $ | (1.38 | ) |
Income (loss) from discontinued operations | (0.23 | ) |
| (0.75 | ) |
| (0.87 | ) |
| 0.12 | |
| 2.13 | | |||||
Net income (loss) | $ | (1.18 | ) |
| $ | (0.91 | ) |
| $ | (1.48 | ) |
| $ | (0.65 | ) |
| $ | 0.75 | |
Weighted average number of shares | 20,816 | |
| 20,863 | |
| 20,826 | |
| 20,813 | |
| 20,813 | | |||||
Diluted: |
|
|
|
|
|
|
|
|
| ||||||||||
Loss from continuing operations | $ | (0.95 | ) |
| $ | (0.16 | ) |
| $ | (0.61 | ) |
| $ | (0.77 | ) |
| $ | (1.37 | ) |
Income (loss) from discontinued operations | (0.23 | ) |
| (0.75 | ) |
| (0.87 | ) |
| 0.12 | |
| 2.12 | | |||||
Net income (loss) | $ | (1.18 | ) |
| $ | (0.91 | ) |
| $ | (1.48 | ) |
| $ | (0.65 | ) |
| $ | 0.75 | |
Weighted average number of shares | 20,816 | |
| 20,863 | |
| 20,826 | |
| 20,813 | |
| 20,896 | | |||||
|
|
|
|
|
|
|
|
|
| ||||||||||
(in thousands) | November 1, |
| November 2, |
| November 3, |
| October 28, |
| October 30, | ||||||||||
|
|
|
|
|
|
|
|
|
| ||||||||||
BALANCE SHEET DATA |
|
|
|
|
|
|
|
|
| ||||||||||
Cash and cash equivalents | $ | 10,188 | |
| $ | 6,723 | |
| $ | 8,855 | |
| $ | 22,026 | |
| $ | 34,720 | |
Working capital | $ | 144,134 | |
| $ | 59,893 | |
| $ | 69,633 | |
| $ | 102,663 | |
| $ | 117,861 | |
Total assets | $ | 326,826 | |
| $ | 424,332 | |
| $ | 501,340 | |
| $ | 557,572 | |
| $ | 579,479 | |
Short-term borrowings, including current portion of long-term debt | $ | 982 | |
| $ | 129,417 | |
| $ | 168,114 | |
| $ | 145,727 | |
| $ | 113,201 | |
Long-term debt, excluding current portion | $ | 106,313 | |
| $ | 7,216 | |
| $ | 8,127 | |
| $ | 9,033 | |
| $ | 9,801 | |
Total stockholders' equity | $ | 64,491 | |
| $ | 91,394 | |
| $ | 110,241 | |
| $ | 143,117 | |
| $ | 156,663 | |
Note - Cash dividends were not paid during the above periods. | |||||||||||||||||||
21
ITEM 7. | MANAGEMENT'S DISCUSSION AND ANALYSIS OF FINANCIAL CONDITION AND RESULTS OF OPERATIONS |
The following discussion should be read in conjunction with the Consolidated Financial Statements and notes thereto.
Note Regarding the Use of Non-GAAP Financial Measures
We have provided certain Non-GAAP financial information, which includes adjustments for special items, as additional information for our consolidated income (loss) from continuing operations and segment operating income (loss). These measures are not in accordance with, or an alternative for, generally accepted accounting principles ("GAAP") and may be different from Non-GAAP measures reported by other companies. We believe that the presentation of Non-GAAP measures provides useful information to management and investors regarding certain financial and business trends relating to our financial condition and results of operations because it permits evaluation of the results of our continuing operations without the effect of special items that management believes make it more difficult to understand and evaluate our results of operations and business trends.
Overview
We are an international provider of staffing services (traditional time and materials-based as well as project-based), information technology infrastructure services and telecommunication infrastructure and security services. Our staffing services consist of workforce solutions that include providing contingent workers, personnel recruitment services, and managed staffing services programs supporting primarily light industrial, professional administration, technical, information technology and engineering positions. Our project-based staffing assists with individual customer assignments as well as customer care call centers and gaming industry quality assurance testing services, and our managed service programs consist of managing the procurement and on-boarding of contingent workers from multiple providers. Our information technology infrastructure services provide server, storage, network and desktop IT hardware maintenance, data center and network monitoring and operations.
As of November 1, 2015, we employed approximately 27,400 people, including 24,700 contingent workers. Contingent workers are on our payroll for the length of their assignment. We operate from 110 locations worldwide with approximately 85% of our revenues generated in the United States. Our principal international markets include Canada, Europe and several Asia Pacific locations. The industry is highly fragmented and very competitive in all of the markets we serve.
Our continued strengths are our brand, our capabilities in sourcing a high quality contingent workforce and our longstanding relationships with our customers. We continued to make progress towards our primary goal of making Volt a more highly focused and profitable business which is committed to revenue growth and margin improvement. We believe this, along with ongoing improvements in the delivery of our staffing services, will ultimately drive higher revenues at improved margins. We will continue to focus on expanding our revenue from skill sets in more profitable vertical sectors in addition to increasing our share of customer engagements. We remain focused on strengthening our traditional time and material staffing services, improving our direct margin on new and existing customer contracts,investing in areas of growth and evaluating opportunities to reduce costs and drive process efficiencies. We are disposing non-core assets not aligned with our overall portfolio as evidenced by the sale of our publishing and printing business in Uruguay during the third quarter of 2015, the sale of substantially all of the assets of our telecommunication infrastructure and security services during the fourth quarter of 2015 and the sale of our staffing business in Uruguay in the first quarter of 2016. We remain committed to delivering superior client service at a reasonable cost. In an effort to reduce our operating costs, we are making a significant investment, estimated at $10.0 million to $12.0 million in expensed and capitalized costs, to update our business processes, back office financial suite and information technology tools that are critical to our success and offer more functionality at a lower cost. We expect that these activities will reduce costs of service through either the consolidation and/or elimination of certain systems and processes along with other reductions in discretionary spending. Through our strategy of improving efficiency in all aspects of our operations, we believe we can realize organic growth opportunities, reduce costs and increase profitability.
The loss in fiscal 2015 from continuing operations of $19.8 million was driven primarily by a number of special items. These special items totaled $14.3 million and were primarily comprised of $6.6 million of impairments within our Staffing and Other segments, $3.6 million of severance and related costs primarily related to the departure of our former Chief Executive Officer and Chief Financial Officer, increased stock-based compensation expense of $1.5 million for grants provided to our new Board of Directors, $0.9 million of legal settlements, $0.6 million of fees incurred related to activist shareholders and related Board of Directors search fees and $1.1 million of professional fees primarily related to the sale of non-core assets and other items. Excluding the impact of the aforementioned special items of $14.3 million , loss from continuing operations in 2015 would have been $5.5 million on a Non-GAAP basis. The loss from continuing operations in fiscal 2014 of $3.4 million included $8.0 million of special items which were comprised of $3.3 million of restatement, investigations and remediation expenses, $2.5
22
million of restructuring costs, $1.1 million of workers' compensation cost related to multiple years, $0.7 million of asset retirement obligations and $0.4 million primarily related to a bonus paid to our former Chief Financial Officer for the filing of our Form 10-K for fiscal years 2011 and 2012. Excluding the impact of the aforementioned special items of $8.0 million , income from continuing operations for 2014 would have been $4.6 million on a Non-GAAP basis.
Recent Developments
In November 2015, we implemented a cost reduction plan and estimate that we will incur restructuring charges of approximately $3.0 million throughout fiscal 2016, primarily resulting from a reduction in workforce in conjunction with facility consolidation and lease termination costs.
In December 2015, we completed the disposition of our Uruguayan staffing business (Lakyfor, S.A.) for a nominal sale price.
In January 2016, we amended our Financing Program with PNC Bank, National Association ("PNC") to extend the termination date from July 28, 2016 to January 31, 2017. The interest coverage ratio covenant included in the previous agreement was eliminated and replaced with a modified liquidity level requirement. The minimum funding threshold was reduced from 60% to 40%. In addition, the new agreement's applicable pricing was increased from a LIBOR based rate plus 1.75% to a LIBOR based rate plus 1.90% on outstanding borrowings and the facility fee increased from 0.65% to 0.70%.
The following discussion and analysis of operating results is presented at the reporting segment level. Since this discussion would be substantially the same at the consolidated level, we have therefore not included a redundant discussion from a consolidated view.
23
Consolidated Results of Continuing Operations and Financial Highlights (Fiscal 2015 vs. Fiscal 2014)
Results of Continuing Operations by Segment (Fiscal 2015 vs. Fiscal 2014)
| Year ended November 1, 2015 |
| Year ended November 2, 2014 | ||||||||||||||||||||
(in thousands) | Total |
| Staffing Services |
| Other |
| Total |
| Staffing Services |
| Other | ||||||||||||
Net Revenue | $ | 1,496,897 | |
| $ | 1,406,809 | |
| $ | 90,088 | |
| $ | 1,710,028 | |
| $ | 1,599,046 | | | $ | 110,982 | |
Expenses |
|
|
|
|
|
|
|
| | | | ||||||||||||
Direct cost of staffing services revenue | 1,192,992 | |
| 1,192,992 | |
| - | |
| 1,359,048 | |
| 1,359,048 | | | - | | ||||||
Cost of other revenue | 77,231 | |
| - | |
| 77,231 | |
| 92,440 | |
| - | | | 92,440 | | ||||||
Selling, administrative and other operating costs | 208,657 | |
| 194,652 | |
| 14,005 | |
| 231,285 | |
| 212,572 | | | 18,713 | | ||||||
Restructuring costs | 1,193 | |
| 1,102 | |
| 91 | |
| 2,010 | |
| 1,431 | | | 579 | | ||||||
Impairment charges | 6,626 | |
| 3,779 | |
| 2,847 | |
| - | |
| - | |
| - | | ||||||
Segment operating income (loss) | 10,198 | |
| 14,284 | |
| (4,086 | ) |
| 25,245 | |
| 25,995 | |
| (750 | ) | ||||||
Corporate general and administrative | 20,516 | |
|
|
|
|
| 16,701 | |
|
|
|
| ||||||||||
Corporate restructuring | 2,442 | |
|
|
|
|
| 497 | |
| |
|
| ||||||||||
Restatement, investigations and remediation | - | |
|
|
|
|
| 3,261 | |
|
|
|
| ||||||||||
Operating income (loss) | (12,760 | ) |
|
|
|
|
| 4,786 | |
|
|
|
| ||||||||||
Other income (expense), net | (2,380 | ) |
|
|
|
|
| (2,947 | ) |
|
|
|
| ||||||||||
Income tax provision | 4,646 | |
|
|
|
|
| 5,226 | |
|
|
|
| ||||||||||
Net loss from continuing operations | $ | (19,786 | ) |
|
|
|
|
| $ | (3,387 | ) |
|
|
|
| ||||||||
Results of Continuing Operations by Segments (Fiscal 2015 vs. Fiscal 2014)
Staffing Services
Net Revenue : The segment's net revenue in fiscal 2015 decreased $192.2 million , or 12.0%, to $1,406.8 million from $1,599.0 million in fiscal 2014. The revenue decline is primarily driven by lower demand from our customers in both our technical and non-technical administrative and light industrial ("A&I") skill sets as well as a change in the overall mix from technical to A&I skill sets. Declines were most prevalent with customers in the Manufacturing, Utilities and Oil and Gas industries as they continued to experience a slowdown in demand.
Direct Cost of Staffing Services Revenue : Direct cost of staffing services revenue in fiscal 2015 decreased $166.0 million , or 12.2% , to $1,193.0 million from $1,359.0 million in fiscal 2014. This decrease was primarily the result of fewer contingent staff on assignment, consistent with the related decrease in revenues. Direct margin of staffing services revenue as a percent of staffing revenue in 2015 increased to 15.2% from 15.0% in 2014. The direct margin increased primarily due to improvements in our project-based and managed service programs.
Selling, Administrative and Other Operating Costs : The segment's selling, administrative and other operating costs in fiscal 2015 decreased $17.9 million , or 8.4% , to $194.7 million from $212.6 million in fiscal 2014, primarily due to lower recruiting and delivery costs, as well as lower support and information technology costs. As a percent of staffing revenue, these costs were 13.8% and 13.3% in 2015 and 2014, respectively.
Impairment Charges : The $3.8 million charge is a result of impairment of previously capitalized internally developed software resulting from an approved plan to upgrade a certain portion of our front office technology as well as an impairment of goodwill and net assets related to our staffing reporting unit in Uruguay.
Segment Operating Income : The segment's operating income in fiscal 2015 decreased $11.7 million , or 45.1% , to $14.3 million from $26.0 million in fiscal 2014. The decrease in operating income is primarily due to a decline in revenue as well as impairment charges. These decreases to operating income were partially offset by a decrease in selling, administrative and other operating costs as well as an increase in the direct margin percentage. Operating income in 2015 of $14.3 million included $4.9 million of special items related to impairment charges of $3.8 million and restructuring costs of $1.1 million. Excluding the impact of these special items, segment operating income would have been $19.2 million on a Non-GAAP basis. Operating income in 2014 of $26.0 million included $1.4 million of special items related to restructuring costs. Excluding the impact of this special item, segment operating income would have been $27.4 million on a Non-GAAP basis.
24
Other
Net Revenue : The segment's net revenue in fiscal 2015 decreased $20.9 million , or 18.8% , to $90.1 million from $111.0 million in fiscal 2014. This decline is primarily due to lower information technology infrastructure services revenue primarily from a large project in 2014 and non-recognition of revenue related to a customer experiencing financial difficulty, decreased telecommunications infrastructure and security services revenue as we exited the telecommunications government solutions business during 2014, as well as lower telephone directory publishing and printing revenue as the business was sold during the third quarter of 2015.
Cost of Other Revenue : The segment's cost of other revenue in fiscal 2015 decreased $15.2 million , or 16.5% , to $77.2 million from $92.4 million in fiscal 2014. The decrease was primarily a result of lower costs in our information technology infrastructure services primarily from reduced headcount and other cost reductions related to the decline in revenue, as well as in our telecommunications infrastructure and security services and telephone directory publishing and printing resulting from our exit from these businesses.
Selling, Administrative and Other Operating Costs : The segment's selling, administrative and other operating costs in fiscal 2015 decreased $4.7 million , or 25.2% , to $14.0 million from $18.7 million in fiscal 2014, primarily from reductions in our telecommunications infrastructure and security services and telephone directory publishing and printing resulting from our exit of these businesses.
Impairment Charges : In conjunction with the initiative to exit certain non-core operations, an assessment was performed of the telephone directory publishing and printing business in Uruguay. Consequently, the net assets of the business of $2.8 million were fully impaired.
Segment Operating Loss : The segment's operating loss increased $3.3 million in fiscal 2015 to $4.1 million from $0.8 million in fiscal 2014 primarily due to the impairment of the telephone directory publishing and printing net assets, as well as lower margins within our information technology infrastructure services business. These decreases were partially offset by lower selling, administrative and other operating costs in our telecommunications infrastructure and security services and telephone directory publishing and printing businesses.
Corporate and Other Expenses
Corporate General and Administrative Costs : Corporate general and administrative costs in fiscal 2015 increased $3.8 million , or 22.8% , to $20.5 million from $16.7 million in 2014 primarily from increased non-cash stock-based compensation provided to our new Board of Directors, costs incurred in connection with responding to activist shareholders and related Board of Directors search fees, as well as professional fees incurred in disposing non-core assets.
Corporate Restructuring Costs : Corporate restructuring costs of $2.4 million in fiscal 2015 included severance charges associated with the departure of our former Chief Executive Officer and Chief Financial Officer.
Restatement, Investigations and Remediation : Restatement, investigations and remediation costs incurred in fiscal 2014 were a result of financial and legal consulting for the completion of the financial audits for fiscal years 2011 through 2013.
Operating Income (Loss) : The Company reported an operating loss in fiscal 2015 of $12.8 million compared to operating income of $4.8 million in 2014. The decrease in operating results was primarily from the decrease in revenue and related margin, impairments within our Staffing and Other segments, an increase in our Corporate costs primarily from severance and related costs incurred with the departure of our former Chief Executive Officer and Chief Financial Officer, increased stock-based compensation, costs incurred in connection with responding to activist shareholders and related Board of Directors search fees, partially offset by a reduction of selling, administrative and other operating costs.
Other Income (Expense), net : Other expense in fiscal 2015 decreased $0.5 million , or 19.2%, to $2.4 million from $2.9 million in 2014, primarily related to a decrease in interest expense.
Income Tax Provision : Income tax provision was $4.6 million compared to $5.2 million in fiscal 2015 and 2014, respectively. The provision in both periods primarily related to locations outside of the United States.
25
Consolidated Results of Continuing Operations and Financial Highlights (Fiscal 2014 vs. Fiscal 2013)
Results of Continuing Operations by Segment (Fiscal 2014 vs. Fiscal 2013)
| Year ended November 2, 2014 |
| Year ended November 3, 2013 | ||||||||||||||||||||
(in thousands) | Total |
| Staffing Services |
| Other |
| Total |
| Staffing |
| Other | ||||||||||||
Net Revenue | $ | 1,710,028 | |
| $ | 1,599,046 | | | $ | 110,982 | |
| $ | 2,017,472 | |
| $ | 1,899,723 | | | $ | 117,749 | |
Expenses |
|
| |
| |
|
|
|
|
|
| ||||||||||||
Direct cost of staffing services revenue | 1,359,048 | |
| 1,359,048 | | | - | |
| 1,627,166 | |
| 1,627,166 | |
| - | | ||||||
Cost of other revenue | 92,440 | |
| - | | | 92,440 | |
| 94,519 | |
| - | |
| 94,519 | | ||||||
Selling, administrative and other operating costs | 231,285 | |
| 212,572 | | | 18,713 | |
| 265,513 | |
| 244,031 | |
| 21,482 | | ||||||
Restructuring costs | 2,010 | | | 1,431 | | | 579 | |
| 781 | |
| 781 | |
| - | | ||||||
Segment operating income (loss) | 25,245 | |
| 25,995 | |
| (750 | ) |
| 29,493 | |
| 27,745 | |
| 1,748 | | ||||||
Corporate general and administrative | 16,701 | |
|
|
|
|
| 11,917 | |
|
|
|
| ||||||||||
Corporate restructuring | 497 | |
|
|
|
|
| - | |
|
|
|
| ||||||||||
Restatement, investigations and remediation | 3,261 | |
|
|
|
|
| 24,828 | |
|
|
|
| ||||||||||
Operating income (loss) | 4,786 | |
|
|
|
|
| (7,252 | ) |
|
|
|
| ||||||||||
Other income (expense), net | (2,947 | ) |
|
|
|
|
| (2,569 | ) |
|
|
|
| ||||||||||
Income tax provision | 5,226 | |
|
|
|
|
| 2,922 | |
|
|
|
| ||||||||||
Net loss from continuing operations | $ | (3,387 | ) |
|
|
|
|
| $ | (12,743 | ) |
|
|
|
| ||||||||
Staffing Services
Net Revenue : The segment's net revenue in fiscal 2014 decreased $300.7 million , or 15.8%, to $1,599.0 million from $1,899.7 million in fiscal 2013. This decrease in revenue including the impact of fiscal 2014 consisting of 52 weeks while fiscal 2013 consisted of 53 weeks, was primarily the result of lower demand primarily at our large enterprise customers and our continuing initiative to reduce exposure to customers with unfavorable business terms.
Direct Cost of Staffing Services Revenue : Direct cost of Staffing Services revenue in fiscal 2014 decreased $268.2 million , or 16.5% , to $1,359.0 million from $1,627.2 million in fiscal 2013. This decrease was primarily the result of fewer contingent staff on assignment consistent with the related decrease in revenues and to a lesser extent by improved margins. Direct margin of Staffing Services revenue as a percent of staffing revenue in fiscal 2014 increased to 15.0% from 14.3% in fiscal 2013 primarily resulting from our initiative focusing on achieving acceptable operating income and exiting or reducing business levels with customers where profitability or business terms are unfavorable, and higher margins on our call center, games testing and other project-based revenue.
Selling, Administrative and Other Operating Costs : The segment's selling, administrative and other operating costs in fiscal 2014 decreased $31.4 million , or 12.9% , to $212.6 million from $244.0 million in fiscal 2013. The first quarter of fiscal 2013 included a $3.0 million indirect tax recovery related to multiple years. Adjusting for the indirect tax recovery, selling, administrative and other operating costs would have decreased $34.4 million , or 13.9%, primarily from lower recruiting and sales and marketing costs, lower vendor management system development costs resulting from the divestiture of Procurestaff in the first quarter of 2014, and lower managed service program administrative costs.
Restructuring Costs : Restructuring costs in fiscal 2014 were primarily comprised of workforce reductions resulting from the restructuring of our traditional staffing services and our divestiture of Procurestaff. Restructuring costs in fiscal 2013 were comprised of workforce reductions in our Staffing Services Segment in connection with our focus on achieving acceptable operating income from our traditional time and materials Staffing Services in North America and exiting or reducing business levels with customers where profitability or business terms are unfavorable
Segment Operating Income : The segment's operating income in fiscal 2014 decreased $1.7 million to $26.0 million from $27.7 million in fiscal 2013. This was the result of decreased revenue primarily at our large enterprise customers, lower costs resulting from the reorganization of our North American staffing operations and in response to the decline in traditional staffing revenues, partially offset by improved results in our call center, games testing and other project-based staffing, improved MSP results and lower costs as a result of the divestiture of Procurestaff. Operating income in 2014 of $26.0 million included $1.4 million of special items related to restructuring costs. Excluding the impact of this special item, segment operating income would have been $27.4 million on a Non-GAAP basis. Operating income in 2013 of $27.7 million included $2.7 million of special items that increased operating income related to $3.0 million of an indirect tax recovery related to multiple years and a
26
legal recovery of $0.5 million, partially offset by $0.8 million of restructuring costs. Excluding the impact of these special items, segment operating income would have been $25.0 million on a Non-GAAP basis.
Other
Net Revenue : The segment's net revenue in fiscal 2014 decreased $6.7 million , or 5.7% , to $111.0 million from $117.7 million in fiscal 2013. The decrease was due to lower publishing and printing revenue due to lower print orders and lower telecommunication infrastructure and security services revenue as we exited the government solutions business as reduced federal spending minimized the opportunity for growth, efficiencies and our ability to deliver profitability. These decreases were partially offset by higher information technology infrastructure services revenue driven primarily from a large non-recurring project and net expanded business with existing customers at billing rates that remained relatively consistent between the periods.
Cost of Other Revenue : The segment's cost of other revenue in fiscal 2014 decreased $2.1 million , or 2.2% , to $92.4 million from $94.5 million in fiscal 2013. The decrease was primarily due to lower costs of publishing and printing revenue and lower telecommunication infrastructure and security services costs commensurate with the related revenue decreases, offset by increased costs related to increased revenue at slightly lower margins for our information technology infrastructure services.
Selling, Administrative and Other Operating Costs : The segment's selling, administrative and other operating costs in fiscal 2014 decreased $2.8 million , or 12.9% , to $18.7 million from $21.5 million in fiscal 2013, primarily through lower administrative costs partially offset by higher selling costs associated with the higher information technology infrastructure services revenue.
Segment Operating Income (Loss) : The segment's operating results decreased $2.5 million in fiscal 2014 to a loss of $0.8 million from income of $1.7 million in fiscal 2013 primarily attributed to decreased results from our publishing and printing and telecommunication infrastructure and security services.
Corporate and Other Expenses
Corporate General and Administrative Costs : Corporate general and administrative costs in fiscal 2014 increased $4.8 million , or 40.1% , to $16.7 million from $11.9 million in fiscal 2013 primarily from audit fees included in 2014 results for the fiscal year 2013 audit whereas audit fees for the 2012 and 2011 results were included within restatement, investigations and remediations, $1.1 million in costs in the Company's workers' compensation program related to multiple years, $0.7 million related to an asset retirement obligation and $0.4 million related to a bonus paid to our former Chief Financial Officer for the filing of our Form 10-K for fiscal years 2011 and 2012.
Restatement, Investigations and Remediations : Restatement, investigations and remediation were comprised of financial and legal consulting, audit, and related costs and in fiscal 2014 amounted to $3.3 million compared to $24.8 million in fiscal 2013. The decreased costs were a result of completion of delayed filings during the first quarter of 2014.
Operating Income (Loss) : Operating results in fiscal 2014 improved $12.1 million to income of $4.8 million from a loss of $7.3 million in 2013. The increase was primarily the result of lower restatement, investigations and remediation costs of $21.6 million partially offset by the increase in Corporate general and administrative costs of $4.8 million . In addition, the Staffing Services segment operating income decreased $1.7 million to $26.0 million from $27.7 million in 2013 primarily from lower revenues although at higher direct margin rates, offset by a decrease in selling, administrative and other operating costs. This was primarily the result of our continuing initiative to reduce exposure to customers with unfavorable business terms, improved results in our call center, games testing and other project-based staffing, improved MSP results and lower costs as a result of the divestiture of Procurestaff.
Other Income (Expense), net : Other expense in fiscal 2014 increased $0.3 million , or 14.7% , to $2.9 million from $2.6 million in fiscal 2013, primarily related to increased interest expense and non-cash foreign exchange gains and losses on intercompany balances.
Income Tax Provision : Income tax provision in fiscal 2014 amounted to $5.2 million compared to $2.9 million in fiscal 2013, primarily related to locations outside of the United States.
27
Liquidity and Capital Resources
Our primary sources of liquidity are cash flows from operations and proceeds from our Financing Program. Borrowing capacity under this program is directly impacted by the level of accounts receivable which fluctuates during the year due to seasonality and other factors. Our business is subject to seasonality with fiscal first quarter billings typically the lowest due to the holiday season and generally increasing in the fiscal third and fourth quarters when our customers increase the use of contingent labor. Generally, the first and fourth quarters of our fiscal year are the strongest for operating cash flows.
Our operating cash flows consist primarily of collections of customer receivables offset by payments for payroll and related items for our contingent staff and in-house employees, federal, state, foreign and local taxes and trade payables. We generally provide customers with 30 - 45 day credit terms, with few extenuating exceptions to 60 days, while our payroll and certain taxes are paid weekly.
We manage our cash flow and related liquidity on a global basis, and we fund payroll, taxes and other working capital requirements using cash, supplemented as needed from short-term borrowings. Our weekly payroll payments inclusive of employment related taxes and payments to vendors approximates $20.0 million. We generally target minimum global liquidity to be 1.5 to 2.0 times our average weekly requirements. We also maintain minimum effective cash balances in foreign operations and use a multi-currency netting and overdraft facility for our European entities to further minimize overseas cash requirements. Surplus domestic cash is used primarily to pay down debt and reduce our leverage.
Overall liquidity improved as of November 1, 2015 versus November 2, 2014 as available borrowing capacity under our Financing Program increased from $38.9 million to $49.3 million primarily due to the addition of foreign originators under the Program (discussed further hereunder). We believe that our available cash and availability under our current Financing Program are sufficient to cover our cash needs for the foreseeable future.
Recent Initiatives to Improve Operating Income, Cash Flows and Liquidity
We continue to make progress on several initiatives undertaken to enhance our liquidity position and shareholder value. We actively manage our portfolio of business units. We have exited non-core businesses that were incurring losses and core businesses that were marginally profitable. During fiscal 2015, significant divestitures included the sale of our printing and publishing business in Uruguay and the sale of substantially all of the assets of our telecommunications, infrastructure and security services business. During the first quarter of 2016, we completed the sale of our staffing business in Uruguay. All of the above transactions netted nominal proceeds, however, we expect these transactions will be accretive to future operating cash flows.
During the fourth quarter of fiscal 2015, we converted the majority of our casualty program to a paid loss program where we received collateral of approximately $22.0 million for the converted policy years and issued a letter of credit against our Financing Program. We utilized a majority of the cash received to reduce our outstanding balance on our Financing Program. We are in discussions with third-parties for a sale-leaseback of our Orange, California facility. We have significant tax benefits including outstanding tax receivables of $17.6 million which we expect to collect within the next four to six months. We also have federal net operating loss carryforwards, which are fully reserved with a valuation allowance, of $133.6 million, capital loss carryforwards of $82.3 million and federal tax credits of $41.3 million which we will be able to utilize if our profitability improves.
In the first quarter of fiscal 2016, we implemented a cost reduction plan as part of our overall initiative to become more efficient, competitive and profitable. We estimate that we will incur restructuring charges of approximately $3.0 million throughout fiscal 2016, primarily resulting from a reduction in workforce in conjunction with facility consolidation and lease termination costs. We estimate that we will incur severance-related charges of $1.2 million in the first fiscal quarter of 2016 and the remainder throughout fiscal 2016. Cost savings will be used consistent with our ongoing strategic efforts to strengthen our operations.
Capital Allocation
In addition to our planned improvements in technology and overall processes which are anticipated to increase cash flows from operations over time, we have identified a number of capital allocation initiatives, which when executed, are expected to strengthen our balance sheet and increase our competitiveness in the marketplace during fiscal 2016. The timing
of these initiatives is highly dependent upon attaining the cash flow and profitability objectives outlined in our plan and the cash flow resulting from the completion of our liquidity initiatives. We also see this as an opportunity to demonstrate our
28
ongoing commitment to Volt shareholders as we continue to execute on our plan and return to sustainable profitability. Our capital allocation strategy includes the following elements:
• | Maintaining appropriate levels of working capital . Our business requires a certain level of cash resources to efficiently execute operations. Consistent with similar companies in our industry and operational capabilities, we estimate this amount to be 1.5 to 2.0 times our weekly cash distributions on a global basis and must accommodate seasonality and cyclical trends; |
• | Reinvesting in our business. We are executing a company-wide initiative to reinvest in our business including new information technology systems which will support our front-end recruitment and placement capabilities as well as increase efficiencies in our back-office financial suite. We are also investing in our sales and recruiting process and resources, which will enhance our ability to win in the marketplace; |
• | Deleveraging our balance sheet. By paying down our debt, we will strengthen our balance sheet, reduce interest costs and reduce risk going forward; |
• | Returning value to shareholders. Part of our capital allocation strategy in fiscal 2016 is to return value to our shareholders in connection with share buybacks through our existing share buyback program; and |
• | Acquiring value-added businesses. Identifying and acquiring companies which would be accretive to our operating income and that could leverage Volt's scale, infrastructure and capabilities. Strategic acquisitions would strengthen Volt in certain industry verticals or in specific geographic locations. |
The following table sets forth our cash and liquidity available levels at the end of our last five quarters and our most recent week ended:
Global Liquidity |
|
|
|
|
|
| ||||||||||||
(in thousands) | November 2, 2014 | February 1, 2015 | May 3, 2015 | August 2, 2015 | November 1, 2015 | January 8, 2016 | ||||||||||||
|
|
|
|
|
|
| ||||||||||||
Cash and cash equivalents (a) | $ | 6,723 | | $ | 13,778 | | $ | 6,070 | | $ | 12,332 | | $ | 10,188 | |
| ||
|
|
|
|
|
|
| ||||||||||||
Cash in banks | $ | 11,521 | | $ | 15,367 | | $ | 9,015 | | $ | 18,134 | | $ | 13,652 | | $ | 22,656 | |
Borrowing availability | 27,400 | | 15,300 | | 7,900 | | 8,900 | | 35,700 | | 30,400 | | ||||||
Available liquidity | $ | 38,921 | | $ | 30,667 | | $ | 16,915 | | $ | 27,034 | | $ | 49,352 | | $ | 53,056 | |
|
|
|
|
|
|
| ||||||||||||
(a) Per financial statements
Cash flows from operating, investing and financing activities, as reflected in our Consolidated Statements of Cash Flows, are summarized in the following table:
| For the year ended | ||||||||||
(in thousands) | November 1, 2015 |
| November 2, |
| November 3, | ||||||
Net cash provided by (used in) operating activities | $ | 43,324 | |
| $ | 34,422 | |
| $ | (12,270 | ) |
Net cash used in investing activities | (7,428 | ) |
| (1,281 | ) |
| (8,558 | ) | |||
Net cash provided by (used in) financing activities | (24,059 | ) |
| (18,360 | ) |
| 25,043 | | |||
Effect of exchange rate changes on cash and cash equivalents | (924 | ) |
| (386 | ) |
| 1,376 | | |||
Net cash used in discontinued operations | (7,237 | ) |
| (17,513 | ) |
| (19,563 | ) | |||
Net increase (decrease) in cash and cash equivalents | $ | 3,676 | |
| $ | (3,118 | ) |
| $ | (13,972 | ) |
29
Fiscal Year Ended November 1, 2015 Compared to the Fiscal Year Ended November 2, 2014
Cash Flows – Operating Activities
For the year ended November 1, 2015, net cash flows related to continuing operations provided by operating activities was $43.3 million , compared to $34.4 million ( $7.3 million used in connection with the restatement, investigations and remediation and $41.7 million provided by all other operating activities) for fiscal 2014, an increase in net cash provided of $8.9 million .
The cash related to continuing operations used in operating activities in fiscal 2015, exclusive of changes in operating assets and liabilities, was $3.4 million ; the 2015 net loss from continuing operations of $19.8 million included non-cash charges for depreciation and amortization of $6.8 million , impairment charges of $6.6 million and share-based compensation expense of $2.9 million . The cash provided by operating activities in fiscal 2014, exclusive of changes in operating assets and liabilities, was $8.9 million ; the 2014 net loss from continuing operations of $3.4 million included non-cash charges for depreciation and amortization of $9.3 million , a deferred tax provision of $2.3 million and share-based compensation expense of $1.2 million .
Changes in operating assets and liabilities in fiscal 2015 provided $46.7 million , principally due to a decrease in accounts receivable of $29.9 million , prepaid insurance and other assets of $23.8 million primarily due to a return of collateral on our casualty program and restricted cash related to customer contracts of $6.3 million , partially offset by a decrease in accounts payable of $13.0 million and a decrease in the level of accrued expenses of $2.8 million . Changes in operating assets and liabilities in fiscal 2014 provided $25.5 million in cash, net, principally due to a decrease in the level of accounts receivable of $33.3 million , prepaid insurance and other assets of $8.4 million , partially offset by a decrease in accrued expenses of $14.1 million , and income taxes of $2.6 million .
Cash Flows – Investing Activities
Cash used in investing activities in fiscal 2015 was $7.4 million , principally for the purchase of property, equipment and software totaling $8.6 million partially offset by net proceeds from sales of investments of $0.7 million and proceeds from disposals of $0.5 million . Cash used in investing activities in fiscal 2014 was $1.3 million , principally for the purchase of property, equipment and software totaling $5.3 million partially offset by proceeds from disposals of $3.1 million , and net proceeds from sales of investments of $0.9 million .
Cash Flows – Financing Activities
Net cash used in financing activities in fiscal 2015 was $24.1 million , compared to $18.4 million of cash used in financing activities in fiscal 2014. In fiscal 2015, the decrease in borrowings under the financing program and short-term credit facility totaled $28.5 million compared to a decrease of $38.6 million in fiscal 2014, in addition to purchasing treasury shares of $4.3 million . We also decreased our collateral pledged for the lines of credit by $10.4 million in fiscal 2015 compared to $21.3 million in fiscal 2014. In addition, debt issuance costs were $1.4 million in fiscal 2015 compared to $0.2 million in fiscal 2014.
Fiscal Year Ended November 2, 2014 Compared to the Fiscal Year Ended November 3, 2013
Cash Flows – Operating Activities
For the year ended November 3, 2014, net cash flows related to continuing operations provided by operating activities were $34.4 million ( $7.3 million used in connection with the restatement, investigations and remediation and $41.7 million provided by all other operating activities), compared to net cash used of $12.3 million ( $37.3 million used in connection with the restatement, investigations and remediation and $25.0 million provided by all other operating activities) for fiscal 2013, an increase in net cash provided of $46.7 million .
The cash related to continuing operations provided by operating activities in fiscal 2014, exclusive of changes in operating assets and liabilities, was $8.9 million ; the 2014 net loss from continuing operations of $3.4 million included non-cash charges for depreciation and amortization of $9.3 million , a deferred tax provision of $2.3 million and share-based compensation of $1.2 million . The cash used in operating activities in fiscal 2013, exclusive of changes in operating assets and liabilities, was $1.0 million ; the 2013 net loss from continuing operations of $12.7 million included non-cash charges for depreciation and amortization of $11.2 million .
Changes in operating assets and liabilities in fiscal 2014 provided $25.5 million in cash, net, principally due to a decrease in accounts receivable of $33.3 million and prepaid insurance and other assets of $8.4 million , partially offset by a decrease in the level of accrued expenses of $14.1 million and income taxes of $2.6 million . Changes in operating assets and liabilities in
30
fiscal 2013 resulted in a $11.2 million use of cash, net, principally due to a decrease in the level of accounts payable of $28.8 million , prepaid insurance and other of $9.7 million , deferred revenue of $7.8 million , income taxes of $6.7 million and accrued expenses of $6.0 million . These uses of cash were partially offset by a decrease in accounts receivable of $35.3 million and restricted cash of $10.8 million .
Cash Flows – Investing Activities
Cash used in investing activities in fiscal 2014 was $1.3 million , principally for the purchase of property, equipment and software totaling $5.3 million partially offset by proceeds from disposals of $3.1 million and net proceeds from sales of investments of $0.9 million . Cash used in investing activities in fiscal 2013 was $8.6 million , principally for the purchase of property, equipment and software totaling $9.2 million partially offset by proceeds from disposals of $0.3 million and the net proceeds from sales of investments of $0.4 million .
Cash Flows – Financing Activities
Net cash used in financing activities in fiscal 2014 was $18.4 million , compared to $25.0 million of cash provided by financing activities fiscal 2013. In fiscal 2014, the decrease in borrowings under the financing program and short-term credit facility totaled $38.6 million compared to an increase of $22.3 million in fiscal 2013. We also decreased our collateral pledged for the lines of credit by $21.3 million in fiscal 2014 compared to a decrease of $3.8 million in fiscal 2013.
Availability of Credit
At November 1, 2015, we had a financing program that provides for borrowing and issuance of letters of credit of up to an aggregate of $150.0 million. We have the ability to increase borrowings and issuance of letters of credit of up to $250.0 million subject to credit approval from PNC. At November 2, 2014, we had short-term credit facilities that provided for borrowings and issuance of letters of credit of up to an aggregate of $245.0 million, including our previous $200.0 million accounts receivable securitization program and our $45.0 million revolving credit agreement. At November 1, 2015 and November 2, 2014, we had outstanding borrowings of $100.0 million and $128.5 million , respectively, under various credit facilities and financing programs and bore a weighted average annual interest rate of 1.8% and 1.6% , respectively, which is inclusive of certain facility and program fees. At November 1, 2015, there was $35.7 million available under this program which is directly impacted by the level of accounts receivable which fluctuates during the year due to seasonality and other factors.
Financing Program
On August 1, 2015, we entered into a one -year, $150.0 million Financing Program with PNC, which expires on July 28, 2016, subject to early renewal or extension. The Financing Program is secured by receivables from certain Staffing Services businesses in the United States, Europe and Canada that are sold to a wholly-owned, consolidated, bankruptcy remote subsidiary. The bankruptcy remote subsidiary's sole business consists of the purchase of the receivables and subsequent granting of a security interest to PNC under the program, and its assets are available first to satisfy obligations to PNC and are not available to pay creditors of the Company's other legal entities. Borrowing capacity under the Financing Program is directly impacted by the level of accounts receivable which fluctuates during the year due to seasonality, business activity levels and other factors. The new Financing Program replaced our previous short-term financing program with PNC. The financing fees incurred will be amortized through July 2016 and the proceeds from the new program were used to satisfy the outstanding balance under the previous program.
The Financing Program has a feature under which the facility limit can be increased from $150.0 million up to $250.0 million subject to credit approval from PNC. Borrowings are priced based upon a fixed program rate plus the daily adjusted one-month LIBOR index, as defined. The program also contains a revolving credit provision under which proceeds can be drawn for a definitive tranche period of 30, 60, 90 or 180 days priced at the adjusted LIBOR index rate in effect for that period. In addition to United States dollars, drawings can be denominated in Canadian dollars, subject to a Canadian dollar $30.0 million limit, and British Pounds Sterling, subject to a £20.0 million limit. The new program also includes a letter of credit sublimit of $50.0 million . As of November 1, 2015, there were no foreign currency denominated borrowings, and the letter of credit participation for the Company's casualty insurance program was $25.1 million .
In addition to customary representations, warranties and affirmative and negative covenants, the program is subject to interest coverage and minimum liquidity covenants that were effective in the fourth quarter of fiscal year of 2015. As of November 1, 2015, we were in full compliance with all debt covenant requirements.
31
In January 2016, we amended our Financing Program with PNC to extend the termination date from July 28, 2016 to January 31, 2017. The interest coverage ratio covenant included in the previous agreement was eliminated and replaced with a modified liquidity level requirement. The minimum funding threshold was reduced from 60% to 40%. In addition, the new agreement's applicable pricing was increased from a LIBOR based rate plus 1.75% to a LIBOR based rate plus 1.90% on outstanding borrowings and the facility fee increased from 0.65% to 0.70%. As of November 1, 2015, our Financing Program was classified as long-term debt on our Consolidated Balance Sheet. However, at the end of our fiscal first quarter 2016, the Financing Program will be classified as short-term as the termination date is within twelve months of our first quarter 2016 balance sheet date.
Short-Term Credit Facility
We terminated our $45.0 million Short-Term Credit Facility with Bank of America, N.A., as Administrative Agent, effective June 8, 2015. The Facility was used primarily to hedge our net currency exposure in certain foreign subsidiaries. Borrowings required cash collateral covering 105% of certain baseline amounts, and the facility contained restrictive covenants which limited cash dividends, capital stock purchases and redemptions. At November 2, 2014, we had a foreign currency denominated loan equivalent of $8.5 million which bore a weighted average annual interest rate of 1.8% inclusive of the facility fee.
Share Repurchase Program
Our Board of Directors authorized a 1.5 million share buyback program in January 2015. Since the program's initiation, $4.3 million, or 340,800 shares, of common stock has been repurchased.
Off-Balance Sheet Arrangements
In October 2015, we issued a letter of credit of $25.1 million against our Financing Program for the casualty insurance program. As of November 1, 2015, no funds have been drawn on this letter of credit. There were no other off-balance sheet transactions, arrangements or other relationships with unconsolidated entities or other persons in 2015 and 2014 that would have affected our liquidity or the availability of or requirements for capital resources.
Contractual Obligations and Other Contingent Commitments
The contractual obligations presented in the tables below represent our estimates of future payments under fixed contractual obligations and commitments undertaken in the normal course of business. Change in our business needs, cancellation provisions, changing interest rates and other factors may result in actual payments differing from these estimates.
The following table summarizes our contractual cash obligations at November 1, 2015:
| Payments Due by Period | ||||||||||||||||||
(in thousands) | Total |
| Less Than 1 Year |
| 1-3 Years |
| 3-5 Years |
| After 5 Years | ||||||||||
Loan agreement (a) | $ | 7,295 | |
| $ | 982 | |
| $ | 2,221 | |
| $ | 2,615 | |
| $ | 1,477 | |
Interest on loan agreement | 1,965 | |
| 562 | |
| 866 | |
| 471 | |
| 66 | | |||||
Financing program | 100,000 | |
| - | |
| 100,000 | |
| - | |
| - | | |||||
Total Debt (b) | 107,295 | |
| 982 | |
| 102,221 | |
| 2,615 | |
| 1,477 | | |||||
Operating leases | 52,131 | |
| 13,884 | |
| 20,159 | |
| 11,120 | |
| 6,968 | | |||||
Standby letters of credit | 25,334 | |
| 25,334 | |
| - | |
| - | |
| - | | |||||
Other (c) | 14,415 | |
| 7,061 | |
| 4,004 | |
| 3,350 | |
| - | | |||||
Total Contractual Cash Obligations | $ | 199,175 | |
| $ | 47,261 | |
| $ | 126,384 | |
| $ | 17,085 | |
| $ | 8,445 | |
(a) | We are currently marketing our property in Orange, California for a sale-leaseback. |
(b) | Total debt excludes interest on loan agreement. |
(c) | In November 2015, we entered into a Master Subscription Agreement to upgrade our Customer/Candidate Relationship Management (CRM) and Applicant Tracking System (ATS) platforms for total fees of $8.4 million, payable over 5 years. |
Our liability for uncertain tax positions of $6.5 million as of November 1, 2015 is not reflected in the above contractual obligations table as we are not able to reasonably estimate the timing of payments in individual years.
32
Critical Accounting Policies and Estimates
Management's discussion and analysis of our financial position and results of operations are based upon our Consolidated Financial Statements, which are included in Item 8 of this report and have been prepared in accordance with accounting principles generally accepted in the United States. The preparation of these financial statements requires management to make estimates, judgments, assumptions and valuations that affect the reported amounts of assets, liabilities, revenues and expenses and related disclosures. While management believes that its estimates, judgments and assumptions are appropriate, significant differences in actual experience or significant changes in assumptions may materially affect our future results. Management believes the critical accounting policies and areas that require the most significant estimates, judgments, assumptions or valuations used in the preparation of our financial statements are those summarized below.
Revenue Recognition
We generate revenue from the following primary services: (1) Staffing, (2) Maintenance and Information Technology Infrastructure and (3) Telecommunication Infrastructure and Security Services.
Staffing Services
Revenue is primarily derived from supplying contingent staff to our customers or providing other services on a time and material basis. Contingent staff primarily consist of contingent workers working under a contract for a fixed period of time or on a specific customer project. Revenue is also derived from permanent placement services, which is generally recognized after placements are made and when the fees are not contingent upon any future event.
Reimbursable costs, including those related to travel and out-of-pocket expenses, are also included in net revenue, and equivalent amounts of reimbursable costs are included in Direct Cost of Staffing Services Revenue.
Under certain of our service arrangements, contingent staff are provided to customers through contracts involving other vendors or contractors. When we are the principal in the transaction and therefore the primary obligor for the contingent staff, we record the gross amount of the revenue and expense from the service arrangement. When we act only as an agent for the customer and we are not the primary obligor for the contingent staff, we record revenue net of vendor or contractor costs.
We generally are the primary obligor when we are responsible for the fulfillment of the services under the contract, even if the contingent workers are neither our employees nor directly contracted by us. Usually in these situations the contractual relationship with the vendors and contractors is exclusively with us and we bear customer credit risk and generally have latitude in establishing vendor pricing and have discretion in vendor or contractor selection.
We generally are not the primary obligor when we provide comprehensive administration of multiple vendors for customers that operate significant contingent workforces, referred to as managed service programs. We are considered an agent in these transactions if we do not have responsibility for the fulfillment of the services by the vendors or contractors (referred to as associate vendors). In such arrangements we are typically designated by our customers to be a facilitator of consolidated associate vendor billing and a processor of the payments to be made to the associate vendors on behalf of the customer. Usually in these situations the contractual relationship is between the customers, the associate vendors and us, with the associate vendors being the primary obligor and assuming the customer credit risk and we generally earn negotiated fixed mark-ups and do not have discretion in supplier selection.
Maintenance and Information Technology Infrastructure Services
Revenue from hardware maintenance, computer and network operations infrastructure services under fixed-price contracts and stand-alone post contract support ("PCS") is generally recognized ratably over the contract period, provided that all other revenue recognition criteria are met, and the cost associated with these contracts is recognized as incurred. For time and material contracts, the Company recognizes revenue and costs as services are rendered, provided that all other revenue recognition criteria are met.
Telecommunication Infrastructure and Security Services
Revenue from performing engineering and construction services is recognized either on the completed contract method for those contracts that are of a short-term nature, or on the percentage-of-completion method, measuring progress using the cost-to-cost method, provided that all other revenue recognition criteria are met. Known or anticipated losses on contracts are provided for in the period they become evident. Claims and change orders that are in the process of being negotiated with customers for additional work or changes in the scope of work are included in the estimated contract value when it is deemed probable that the claim or change order will result in additional contract revenue and such amount can be reliably estimated.
33
Goodwill
We perform our annual impairment test for goodwill during the second quarter of the fiscal year and when a triggering event occurs between annual impairment tests. In conducting our goodwill impairment testing, we compare the fair value of the reporting unit with goodwill to the carrying value, using various valuation techniques including income (discounted cash flow) and market approaches. Determining fair value requires significant judgment concerning the assumptions used in the valuation model, including discount rates, the amount and timing of expected future cash flows and growth rates, as well as relevant comparable company earnings multiples for the market-based approach including the determination of whether a premium or discount should be applied to those comparables.
Income Taxes
Income taxes are accounted for under the asset and liability method. Deferred tax assets and liabilities are recognized for the future tax consequences attributable to differences between the financial statement carrying amounts of existing assets and liabilities and their respective tax bases, as well as for operating loss and tax credit carryforwards. Deferred tax assets and liabilities are measured using current tax laws and rates in effect for the years in which those temporary differences are expected to be recovered or settled. The effect on deferred tax assets and liabilities of a change in tax rates is recognized in income in the period that includes the enactment date. We must then assess the likelihood that our deferred tax assets will be realized. If we do not believe that it is more likely than not that our deferred tax assets will be realized, a valuation allowance is established. When a valuation allowance is increased or decreased, a corresponding tax expense or benefit is recorded.
Accounting for income taxes involves uncertainty and judgment in how to interpret and apply tax laws and regulations within our annual tax filings. Such uncertainties may result in tax positions that may be challenged and overturned by a tax authority in the future which would result in additional tax liability, interest charges and possible penalties. Interest and penalties are classified as a component of income tax expense.
We recognize the effect of income tax positions only if those positions are more likely than not of being sustained. Recognized income tax positions are measured at the largest amount that is greater than 50% likely of being realized upon ultimate settlement. Changes in recognition or measurement are reflected in the period in which the change in estimate occurs.
Realization of deferred tax assets is dependent upon reversals of existing taxable temporary differences, taxable income in prior carryback years, and future taxable income. Significant weight is given to positive and negative evidence that is objectively verifiable. A company's three-year cumulative loss position is significant negative evidence in considering whether deferred tax assets are realizable and the accounting guidance restricts the amount of reliance we can place on projected taxable income to support the recovery of the deferred tax assets. A valuation allowance has been recognized due to the uncertainty of realization of our loss carryforwards and other deferred tax assets. Management believes that the remaining deferred tax assets are more likely than not to be realized based upon consideration of all positive and negative evidence, including scheduled reversal of deferred tax liabilities and tax planning strategies determined on a jurisdiction-by-jurisdiction basis.
Casualty Insurance Program
We purchase workers' compensation insurance through mandated participation in certain state funds, and the experience-rated premiums in these state plans relieve us of any additional liability. Liability for workers' compensation in all other states as well as automobile and general liability is insured under a retrospective experience-rated insurance program for losses exceeding specified deductible levels and we are self-insured for losses below the specified deductible limits.
We make payments to the insurance carrier based upon an estimate of the ultimate underlying exposure, such as the amount and type of labor utilized. The amounts are subsequently adjusted based on actual claims experience. The experience modification process includes establishing loss development factors, based on our historical claims experience as well as industry experience, and applying those factors to current claims information to derive an estimate of our ultimate claims liability. Adjustments to final paid amounts are determined as of a future date up to three or four years after the end of the respective policy year, using the level of claims paid and incurred. Under the insurance program, any additional losses incurred greater than the policy deductible limit arising from claims associated with an insurance policy are absorbed by the insurer and are not our responsibility.
During October 2015, we converted three of the four open policy years to a paid loss retro program secured by a letter of credit. Under this program, we will make payments based on actual claims paid instead of pre-funding an estimate of the ultimate loss exposure. We recognize expense and establish accruals for amounts estimated to fund incurred amounts up to the policy deductible, both reported and not yet reported, policy premiums and related legal and other costs. We develop estimates for losses incurred but not yet reported using actuarial principles and assumptions based on historical and projected claim
34
incidence patterns, claim size and the length of time over which we expect to make payments. Actuarial estimates are updated as loss experience develops, additional claims are reported or settled and new information becomes available. Any changes in estimates are reflected in operating results in the period in which the estimates are changed.
Medical Insurance Program
We are self-insured for a portion of our medical benefit programs for our employees. Eligible contingent staff on assignment with customers are offered medical benefits through a fully insured program administered through a third party. Employees contribute a portion of the cost of these medical benefit programs.
The liability for the self-insured medical benefits is limited on a per claimant basis through the purchase of stop-loss insurance. Our retained liability for the self-insured medical benefits is determined utilizing actuarial estimates of expected claims based on statistical analyses of historical data. Amounts contributed by employees and additional amounts necessary to fund the self-insured program administered by the third party are transferred to a 501(c)(9) employee welfare benefit trust. Accordingly, these amounts, other than the current liabilities for the employee contributions and expected claims not yet remitted to the trust, do not appear on our Consolidated Balance Sheets.
Legal Contingencies
We are subject to certain legal proceedings as well as demands, claims and threatened litigation that arise in the normal course of our business. If the potential loss from any claim or legal proceeding is considered probable and the amount can be reasonably estimated, a liability and an expense are recorded for the estimated loss. Significant judgment is required in both the determination of probability and the determination of whether an exposure is reasonably estimable. As additional information becomes available, we will revise the estimates.
New Accounting Standards
For additional information regarding new accounting guidance see our Note on Summary of Business and Significant Accounting Policies in our Consolidated Financial Statements.
ITEM 7A. | QUANTITATIVE AND QUALITATIVE DISCLOSURES ABOUT MARKET RISK |
Market risk is the potential economic gain or loss that may result from changes in market rates and prices. In the normal course of business, the Company's earnings, cash flows and financial position are exposed to market risks relating to the impact of interest rate changes, foreign currency exchange rate fluctuations and changes in the market value of financial instruments. We limit these risks through risk management policies and procedures, including the use of derivatives.
Interest Rate Risk
We centrally manage our debt and investment portfolios considering investment opportunities and risks, tax consequences and overall financing strategies. At November 1, 2015, we had cash and cash equivalents on which interest income is earned at variable rates. At November 1, 2015, we had a $150.0 million accounts receivable securitization program, which can be increased up to $250.0 million subject to credit approval from PNC, to provide additional liquidity to meet our short-term financing needs.
The interest rates on these borrowings and financings are variable and, therefore, interest and other expense and interest income are affected by the general level of U.S. and foreign interest rates. Based upon the current levels of cash invested, notes payable to banks and utilization of the securitization program, on a short-term basis, a hypothetical 1-percentage-point increase in interest rates would have increased net interest expense by $0.9 million in 2015 and a hypothetical 1-percentage-point decrease in interest rates would have decreased net interest expense by $1.0 million in 2015.
We have a term loan with borrowings at fixed interest rates, and our interest expense related to this borrowing is not affected by changes in interest rates in the near term. The fair value of the fixed rate term loan was approximately $8.0 million at November 1, 2015. The fair values were calculated by applying the appropriate fiscal year-end interest rates to our present streams of loan payments.
Foreign Currency Risk
We have operations in several foreign countries and conduct business in the local currency in these countries. As a result, we have risk associated with currency fluctuations as the value of foreign currencies fluctuates against the dollar, in particular the British Pound, Euro, Canadian Dollar and Indian Rupee. These fluctuations impact reported earnings.
35
Fluctuations in currency exchange rates also impact the U.S. dollar amount of our net investment in foreign operations. The assets and liabilities of our foreign subsidiaries are translated into U.S. dollars at the exchange rates in effect at the fiscal year-end balance sheet date. Income and expenses accounts are translated at an average exchange rate during the year which approximates the rates in effect at the transaction dates. The resulting translation adjustments are recorded in stockholders' equity as a component of accumulated other comprehensive income. The U.S. dollar strengthened relative to many foreign currencies as of November 1, 2015 compared to November 2, 2014. Consequently, stockholders' equity decreased by $1.6 million as a result of the foreign currency translation as of November 1, 2015.
To reduce exposure related to non-U.S. dollar denominated net investments and intercompany balances that may give rise to a foreign currency transaction gain or loss, we have entered into derivative and non-derivative financial instruments to hedge our net investment in certain foreign subsidiaries. We also may enter into forward foreign exchange contracts with third party banks to mitigate foreign currency risk. As of November 1, 2015 there were no foreign currency denominated borrowings that were used as economic hedges against the Company's net investment in certain foreign operations and intercompany balances and no outstanding derivative forward exchange contracts.
Based upon the current levels of net foreign assets, a hypothetical 10% devaluation of the U.S. dollar as compared to these currencies as of November 1, 2015 would result in an approximate $3.6 million positive translation adjustment recorded in other comprehensive income within stockholders' equity. Conversely, a hypothetical 10% appreciation of the U.S. dollar as compared to these currencies as of November 1, 2015 would result in an approximate $3.6 million negative translation adjustment recorded in other comprehensive income within stockholders' equity. We do not use derivative instruments for trading or other speculative purposes.
Equity Risk
Our investments are exposed to market risk as it relates to changes in the market value. We hold investments primarily in mutual funds for the benefit of participants in our non-qualified deferred compensation plan, and changes in the market value of these investments result in offsetting changes in our liability under the non-qualified deferred compensation plans as the employees realize the rewards and bear the risks of their investment selections. At November 1, 2015, the total market value of these investments was $4.8 million.
ITEM 8 . | FINANCIAL STATEMENTS AND SUPPLEMENTARY DATA |
Our financial statements and supplementary data are included at the end of this report beginning on page F-1. See the index appearing on the pages following this report.
ITEM 9 . | CHANGES IN AND DISAGREEMENTS WITH ACCOUNTANTS ON ACCOUNTING AND FINANCIAL DISCLOSURE |
None
36
ITEM 9A. | CONTROLS AND PROCEDURES |
Evaluation of Disclosure Controls and Procedures
Based on an evaluation under the supervision and with the participation of the Company's management, our Chief Executive Officer and Chief Financial Officer have concluded that the Company's disclosure controls and procedures as defined in Rules 13a-15(e) and 15d-15(e) under the Securities Exchange Act of 1934, as amended (the "Exchange Act") were effective as of November 1, 2015 to provide reasonable assurance that information required to be disclosed by the Company in reports that it files or submits under the Exchange Act is (i) recorded, processed, summarized and reported within the time periods specified in the Securities and Exchange Commission rules and forms and (ii) accumulated and communicated to the Company's management, including our Chief Executive Officer and Chief Financial Officer, to allow timely decisions regarding required disclosure.
Management's Annual Report on Internal Control over Financial Reporting
The Company's management is responsible for establishing and maintaining adequate internal control over financial reporting (as defined in Rule 13a-15(f) under the Exchange Act). Management conducted an assessment of the effectiveness of the Company's internal control over financial reporting based on the criteria set forth in Internal Control - Integrated Framework issued by the Committee of Sponsoring Organizations of the Treadway Commission (1992 framework). Based on the Company's assessment, management has concluded that its internal control over financial reporting was effective as of November 1, 2015 to provide reasonable assurance regarding the reliability of financial reporting and the preparation of financial statements in accordance with GAAP. The Company's independent registered public accounting firm, Ernst & Young LLP, has issued an audit report on the Company's internal control over financial reporting, which appears in this Form 10-K.
Changes in Internal Control Over Financial Reporting
There were no changes in our internal control over financial reporting during the quarter ended November 1, 2015 that materially affected, or are reasonably likely to materially affect, our internal control over financial reporting.
Inherent Limitations of Internal Control
Management, including the Company's Chief Executive Officer and Chief Financial Officer, does not expect that the Company's internal controls will prevent or detect all errors and all fraud. A control system, no matter how well designed and operated, can provide only reasonable, not absolute, assurance that the objectives of the control system are met. Further, the design of a control system must reflect the fact that there are resource constraints, and the benefits of controls must be considered relative to their costs. Because of the inherent limitations in all control systems, no evaluation of internal controls can provide absolute assurance that all control issues and instances of fraud, if any, have been detected. Also, any evaluation of the effectiveness of internal controls in future periods are subject to the risk that those internal controls may become inadequate because of changes in business conditions, or that the degree of compliance with the policies or procedures may deteriorate.
37
Report of Independent Registered Public Accounting Firm
The Board of Directors and Stockholders of Volt Information Sciences, Inc.
We have audited Volt Information Sciences, Inc. and subsidiaries' internal control over financial reporting as of November 1, 2015, based on criteria established in Internal Control-Integrated Framework issued by the Committee of Sponsoring Organizations of the Treadway Commission (1992 framework) (the COSO criteria). Volt Information Sciences, Inc. and subsidiaries' management is responsible for maintaining effective internal control over financial reporting, and for its assessment of the effectiveness of internal control over financial reporting included in the accompanying Management's Report on Internal Control Over Financial Reporting. Our responsibility is to express an opinion on the Company's internal control over financial reporting based on our audit.
We conducted our audit in accordance with the standards of the Public Company Accounting Oversight Board (United States). Those standards require that we plan and perform the audit to obtain reasonable assurance about whether effective internal control over financial reporting was maintained in all material respects. Our audit included obtaining an understanding of internal control over financial reporting, assessing the risk that a material weakness exists, testing and evaluating the design and operating effectiveness of internal control based on the assessed risk, and performing such other procedures as we considered necessary in the circumstances. We believe that our audit provides a reasonable basis for our opinion.
A company's internal control over financial reporting is a process designed to provide reasonable assurance regarding the reliability of financial reporting and the preparation of financial statements for external purposes in accordance with generally accepted accounting principles. A company's internal control over financial reporting includes those policies and procedures that (1) pertain to the maintenance of records that, in reasonable detail, accurately and fairly reflect the transactions and dispositions of the assets of the company; (2) provide reasonable assurance that transactions are recorded as necessary to permit preparation of financial statements in accordance with generally accepted accounting principles, and that receipts and expenditures of the company are being made only in accordance with authorizations of management and directors of the company; and (3) provide reasonable assurance regarding prevention or timely detection of unauthorized acquisition, use, or disposition of the company's assets that could have a material effect on the financial statements.
Because of its inherent limitations, internal control over financial reporting may not prevent or detect misstatements. Also, projections of any evaluation of effectiveness to future periods are subject to the risk that controls may become inadequate because of changes in conditions, or that the degree of compliance with the policies or procedures may deteriorate.
In our opinion, Volt Information Sciences, Inc. and subsidiaries, maintained in all material respects, effective internal control over financial reporting as of November 1, 2015, based on the COSO criteria.
We also have audited, in accordance with the standards of the Public Company Accounting Oversight Board (United States), the consolidated balance sheets of Volt Information Sciences, Inc. and subsidiaries as of November 1, 2015 and November 2, 2014, and the related consolidated statements of operations, comprehensive loss, stockholders' equity, and cash flows for each of the three years in the period ended November 1, 2015 of Volt Information Sciences, Inc. and subsidiaries and our report dated January 13, 2016 expressed an unqualified opinion thereon.
/s/ Ernst & Young LLP
New York, New York
January 13, 2016
38
ITEM 9B. | OTHER INFORMATION |
None.
PART III
ITEM 10. | DIRECTORS, EXECUTIVE OFFICERS AND CORPORATE GOVERNANCE |
The information required to be furnished pursuant to this item will be set forth under the captions "Proposal One: Election of Directors," "Executive Officers," "Corporate Governance," "Section 16(a) Beneficial Ownership Reporting Compliance" and "Miscellaneous - Available Information" in the Company's Proxy Statement for our 2016 Annual Meeting of Shareholders (the "Proxy Statement") or in an amendment to this Annual Report, which information is incorporated herein by reference.
ITEM 11. | EXECUTIVE COMPENSATION |
The information required to be furnished pursuant to this item is incorporated by reference from the information set forth under the caption "Executive Compensation" in the Proxy Statement or in an amendment to this Annual Report, which information is incorporated herein by reference.
ITEM 12. | SECURITY OWNERSHIP OF CERTAIN BENEFICIAL OWNERS AND MANAGEMENT AND RELATED STOCKHOLDER MATTERS |
The information required to be furnished pursuant to this item will be set forth under the caption "Security Ownership of Certain Beneficial Owners and Management" in the Proxy Statement or in an amendment to this Annual Report, which information is incorporated herein by reference.
ITEM 13. | CERTAIN RELATIONSHIPS AND RELATED TRANSACTIONS AND DIRECTOR INDEPENDENCE |
The information required to be furnished pursuant to this item will be set forth under the captions "Transactions With Related Persons" and "Corporate Governance - Director Independence" in the Proxy Statement or in an amendment to this Annual Report, which information is incorporated herein by reference.
ITEM 14. | PRINCIPAL ACCOUNTING FEES AND SERVICES |
The information required to be furnished pursuant to this item will be set forth under the caption "Principal Accountant Fees and Services" in the Proxy Statement or in an amendment to this Annual Report, which information is incorporated herein by reference.
39
PART IV
ITEM 15. | EXHIBITS, FINANCIAL STATEMENT SCHEDULES |
(a)(1) Financial Statements
The following documents are filed as a part of this report:
|
| Page No. | |
Report of Independent Registered Public Accounting Firm |
|
| F-1 |
Consolidated Statements of Operations |
|
| F-2 |
Consolidated Statements of Comprehensive Loss |
|
| F-3 |
Consolidated Balance Sheets |
|
| F-4 |
Consolidated Statements of Stockholders' Equity |
|
| F-5 |
Consolidated Statements of Cash Flows |
|
| F-6 |
Notes to Consolidated Financial Statements |
|
| F-7 |
(a)(2) Financial Statement Schedules
All schedules have been omitted because the required information is included in the Consolidated Financial Statements or the notes thereto, or because they are not required.
(b) Exhibits - The following exhibits are filed as part of, or incorporated by reference into, this report:
Exhibits |
| Description |
|
| |
2.1 |
| Membership Interest Purchase Agreement dated December 1, 2014, by and between VoltDelta, the Company and NewNet (incorporated by reference to Exhibit 2.1 to the Company's Current Report on Form 8-K filed December 5, 2014; File No. 001-09232) |
|
|
|
3.1 |
| Restated Certificate of Incorporation of the Company (incorporated by reference to Exhibit 3.1 to the Company's Annual Report on Form 10-K filed January 30, 1997; File No. 001-09232) |
|
|
|
3.2 |
| Certificate of Amendment to Certificate of Incorporation of the Company (incorporated by reference to Exhibit 99.1 to the Company's Current Report on Form 8-K filed April 11, 2007; File No. 001-09232) |
|
|
|
3.3 |
| Amended and Restated By-Laws of the Company, as amended through October 30, 2015 (incorporated by reference to Exhibit 3.2 to the Company's Current Report on Form 8-K filed November 4, 2015; File No. 001-9232) |
|
| |
10.1* |
| 2006 Incentive Stock Plan (incorporated by reference to Exhibit A to the Company's Proxy Statement filed February 27, 2007; File No. 001-09232) |
|
|
|
10.2* |
| Form of Restricted Stock Agreement for Non-Employee Directors (incorporated by reference to Exhibit 10.01 to the Company's Quarterly Report on Form 10-Q filed June 8, 2007; File No. 001-09232) |
|
|
|
10.3* |
| Form of Restricted Stock Grant Notice for Employees (incorporated by reference to Exhibit 10.4 to the Company's Annual Report on Form 10-K for the fiscal year ended October 31, 2010 filed April 9, 2013; File No. 001-09232) |
|
|
|
10.4* |
| Form of Restricted Stock Unit Agreement (Option 1) (incorporated by reference to Exhibit 10.1 to the Company's Current Report on Form 8-K filed December 26, 2007; File No. 001-09232) |
|
|
|
10.5* |
| Form of Restricted Stock Unit Agreement (Option 2) (incorporated by reference to Exhibit 10.2 to the Company's Current Report on Form 8-K filed December 26, 2007; File No. 001-09232) |
|
|
|
10.6* |
| Form of Non-Qualified Stock Option Agreement (incorporated by reference to Exhibit 10.3 to the Company's Current Report on Form 8-K filed December 26, 2007; File No. 001-09232) |
|
|
|
10.7* |
| Form of Non-Qualified Stock Option Agreement (incorporated by reference to Exhibit 99.1 to the Company's Current Report on Form 8-K filed April 13, 2009; File No. 001-09232) |
|
|
|
10.8* |
| Employment Agreement, dated May 1, 1987, by and between the Company and Jerome Shaw (incorporated by reference to Exhibit 19.02 to the Company's Quarterly Report on Form 10-Q for the quarter ended May 1, 1987; File No. 001-09232) |
|
|
|
10.9* |
| Amendment to Employment Agreement, dated January 3, 1989, by and between the Company and Jerome Shaw (incorporated by reference to Exhibit 10.4(a) to the Company's Annual Report on Form 10-K for the year ended October 28, 1989; File No. 001-09232) |
|
|
|
10.10* |
| Employment Agreement, dated December 26, 2012, by and between the Company and Ronald Kochman (incorporated by reference to Exhibit 10.1 to the Company's Current Report on Form 8-K filed December 28, 2012; File No. 001-09232) |
|
|
|
10.11* |
| Form of Indemnification Agreement (incorporated by reference to Exhibit 10.01 to the Company's Quarterly Report on Form 10-Q filed September 9, 2005; File No. 001-09232) |
|
|
|
10.12* |
| Employment Agreement, dated March 23, 2015, by and between the Company and Paul Tomkins (incorporated by reference to Exhibit 10.1 to the Company's Current Report on Form 8-K filed March 26, 2015; File No. 001-9232) |
|
| |
10.13* |
| Settlement Agreement (including Exhibits A and B), dated as of March 30, 2015, by and among the Company, Glacier Peak Capital LLC, Glacier Peak U.S. Value Fund, L.P. and John C. Rudolf (incorporated by reference to Exhibit 10.1 to the Company's Current Report on Form 8-K filed April 2, 2015; File No. 001-9232) |
|
| |
10.14* |
| Employment Agreement, dated March 30, 2015, by and between the Company and Bryan Berndt (incorporated by reference to Exhibit 10.1 to the Company's Current Report on Form 8-K filed April 9, 2015; File No. 001-9232) |
|
| |
10.15* |
| Separation Agreement dated June 25, 2015, by and between the Company and Ronald Kochman (incorporated by reference to Exhibit 10.1 to the Company's Current Report on Form 8-K filed July 1, 2015; File No. 001-9232) |
|
|
|
10.16* |
| Employment Agreement, dated June 25, 2015, by and between the Company and Michael Dean (incorporated by reference to Exhibit 10.2 to the Company's Current Report on Form 8-K filed July 1, 2015; File No. 001-9232) |
|
| |
10.17* |
| Receivables Financing Agreement, dated as of July 30, 2015, by and among Volt Funding Corp., as borrower, PNC Bank, National Association, as letter of credit bank and administrative agent, the persons from time to time party thereto as lenders and letter of credit participants, and the Company, as initial servicer (incorporated by reference to Exhibit 10.1 to the Company's Current Report on Form 8-K filed August 6, 2015; File No. 001-9232) |
|
| |
10.18* |
| Purchase and Sale Agreement, dated as of July 30, 2015, by and among P/S Partner Solutions, Ltd., VMC Consulting Corporation, the Company, and Volt Management Corp., as originators, the Company, as servicer, and Volt Funding Corp., as buyer (incorporated by reference to Exhibit 10.2 to the Company's Current Report on Form 8-K filed August 6, 2015; File No. 001-9232) |
|
| |
10.19* |
| Purchase and Sale Agreement, dated as of August 1, 2015, by and among Volt Europe Limited and Volt Consulting Group Limited, as originators, the Company, as servicer, PNC Bank, National Association, as administrative agent, and Volt Funding Corp., as buyer (incorporated by reference to Exhibit 10.3 to the Company's Current Report on Form 8-K filed August 6, 2015; File No. 001-9232) |
|
| |
10.20* |
| Purchase and Sale Agreement, dated as of July 31, 2015, by and among Volt Canada Inc., as originator, the Company, as servicer, and Volt Funding Corp., as buyer (incorporated by reference to Exhibit 10.4 to the Company's Current Report on Form 8-K filed August 6, 2015; File No. 001-9232) |
|
| |
10.21* |
| Employment Agreement, dated October 19, 2015, between the Company and Michael Dean (incorporated by reference to Exhibit 10.1 to the Company's Current Report on Form 8-K filed October 21, 2015; File No. 001-9232) |
|
|
|
10.22* |
| Form of Indemnification Agreement (incorporated by reference to Exhibit 10.4(b) to the Company's Annual Report on Form 10-K filed January 12, 2007; File No. 001-09232) |
|
|
|
10.23* |
| Separation Agreement and General Release, dated January 16, 2015, by and between the Company and James Whitney Mayhew (incorporated by reference to Exhibit 10.1 to the Company's Current Report on Form 8-K filed January 22, 2015; File No. 001-9232) |
|
|
|
10.24* |
| Amendment No. 1, dated as of January 5, 2016, to the Receivables Financing Agreement, dated as of July 30, 2015, by and among Volt Funding Corp., PNC Bank, National Association, as letter of credit bank and administrative agent, the persons from time to time partythereto as lenders and letter of credit participants, and the Company, as initial servicer (incorporated by reference o Exhibit 10.1 to the Company's Current Report on Form 8-K filed January 11, 2016; File No. 001-9232) |
|
|
|
21 |
| Subsidiaries of the Registrant |
|
| |
23 |
| Consent of Independent Registered Public Accounting Firm |
|
|
|
31.1 |
| Certification of Chief Executive Officer pursuant to Rule 13a-14(a) of the Securities Exchange Act of 1934 |
|
| |
31.2 |
| Certification of Chief Financial Officer pursuant to Rule 13a-14(a) of the Securities Exchange Act of 1934 |
|
| |
32.1 |
| Certification of Chief Executive Officer and Chief Financial Officer pursuant to Rule 13a-14(b) of the Securities Exchange Act of 1934 and 18 U.S.C. Section 1350 |
|
| |
101.INS |
| XBRL Instance Document. |
|
| |
101.SCH |
| XBRL Taxonomy Extension Schema Document. |
|
| |
101.CAL |
| XBRL Taxonomy Extension Calculation Linkbase Document. |
|
| |
101.DEF |
| XBRL Taxonomy Extension Definition Linkbase Document. |
|
| |
101.LAB |
| XBRL Taxonomy Extension Label Linkbase Document. |
|
| |
101.PRE |
| XBRL Taxonomy Extension Presentation Linkbase Document. |
* Management contracts and compensatory plans or arrangements required to be filed as an exhibit pursuant to Item 15(b) of Form 10-K.
40
SIGNATURES
Pursuant to the requirements of Section 13 or 15(d) of the Securities Exchange Act of 1934, as amended, the registrant has duly caused this Report to be signed on its behalf by the undersigned, thereunto duly authorized.
| VOLT INFORMATION SCIENCES, INC. | |||
|
|
|
| |
Date: January 13, 2016 | By: |
|
| /s/ Michael Dean |
|
|
|
| Michael Dean |
|
|
|
| President and Chief Executive Officer |
|
|
|
| |
Date: January 13, 2016 | By: |
|
| /s/ Paul Tomkins |
|
|
|
| Paul Tomkins |
|
|
|
| Senior Vice President and |
|
|
|
|
|
Date: January 13, 2016 | By: |
|
| /s/ Bryan Berndt |
|
|
|
| Bryan Berndt |
|
|
|
| Controller and Chief Accounting Officer |
Pursuant to the requirements of the Securities Exchange Act of 1934, as amended, this Report has been signed below by the following persons on behalf of the registrant and in the capacities and on the dates indicated.
Date: January 13, 2016 | By: |
|
| /s/ Michael Dean |
|
|
|
| Michael Dean |
|
|
|
| President and Chief Executive Officer |
|
|
|
| |
Date: January 13, 2016 | By: |
|
| /s/ James E. Boone |
|
|
|
| James E. Boone |
|
|
|
| Director |
|
|
|
| |
Date: January 13, 2016 | By: |
|
| /s/ Nick S. Cyprus |
|
|
|
| Nick S. Cyprus |
|
|
|
| Director |
|
|
|
| |
Date: January 13, 2016 | By: |
|
| /s/ Bruce G. Goodman |
|
|
|
| Bruce G. Goodman |
|
|
|
| Director |
|
|
|
| |
Date: January 13, 2016 | By: |
|
| /s/ Theresa A. Havell |
|
|
|
| Theresa A. Havell |
|
|
|
| Director |
|
|
|
| |
Date: January 13, 2016 | By: |
|
| /s/ Dana Messina |
|
|
|
| Dana Messina |
|
|
|
| Director |
|
|
|
| |
Date: January 13, 2016 | By: |
|
| /s/ John C. Rudolf |
|
|
|
| John C. Rudolf |
|
|
|
| Director |
|
|
|
| |
Date: January 13, 2016 | By: |
|
| /s/ Laurie Siegel |
|
|
|
| Laurie Siegel |
|
|
|
| Director |
41
VOLT INFORMATION SCIENCES, INC. AND SUBSIDIARIES
Report of Independent Registered Public Accounting Firm
The Board of Directors and Stockholders of Volt Information Sciences, Inc.
We have audited the accompanying consolidated balance sheets of Volt Information Sciences, Inc. and subsidiaries as of November 1, 2015 and November 2, 2014, and the related consolidated statements of operations, comprehensive loss, stockholders' equity, and cash flows for each of the three years in the period ended November 1, 2015. These financial statements are the responsibility of the Company's management. Our responsibility is to express an opinion on these financial statements based on our audits.
We conducted our audits in accordance with the standards of the Public Company Accounting Oversight Board (United States). Those standards require that we plan and perform the audit to obtain reasonable assurance about whether the financial statements are free of material misstatement. An audit includes examining, on a test basis, evidence supporting the amounts and disclosures in the financial statements. An audit also includes assessing the accounting principles used and significant estimates made by management, as well as evaluating the overall financial statement presentation. We believe that our audits provide a reasonable basis for our opinion.
In our opinion, the financial statements referred to above present fairly, in all material respects, the consolidated financial position of Volt Information Sciences, Inc. and subsidiaries at November 1, 2015 and November 2, 2014, and the consolidated results of their operations and their cash flows for each of the three years in the period ended November 1, 2015, in conformity with U.S. generally accepted accounting principles.
We also have audited, in accordance with the standards of the Public Company Accounting Oversight Board (United States), Volt Information Sciences, Inc. and subsidiaries' internal control over financial reporting as of November 1, 2015, based on criteria established in Internal Control-Integrated Framework issued by the Committee of Sponsoring Organizations of the Treadway Commission (1992 framework) and our report dated January 13, 2016 expressed an unqualified opinion thereon.
/s/ Ernst & Young LLP
New York, New York
January 13, 2016
F-1
VOLT INFORMATION SCIENCES, INC. AND SUBSIDIARIES
Consolidated Statements of Operations
(In thousands, except per share amounts)
| Year ended | ||||||||||
| November 1, |
| November 2, |
| November 3, | ||||||
REVENUE: |
|
|
|
|
| ||||||
Staffing services revenue | $ | 1,406,809 | |
| $ | 1,599,046 | |
| $ | 1,899,723 | |
Other revenue | 90,088 | |
| 110,982 | |
| 117,749 | | |||
NET REVENUE | 1,496,897 | |
| 1,710,028 | |
| 2,017,472 | | |||
EXPENSES: |
|
|
|
|
| ||||||
Direct cost of staffing services revenue | 1,192,992 | |
| 1,359,048 | |
| 1,627,166 | | |||
Cost of other revenue | 77,231 | |
| 92,440 | |
| 94,519 | | |||
Selling, administrative and other operating costs | 229,173 | |
| 247,986 | |
| 277,430 | | |||
Restructuring costs | 3,635 | |
| 2,507 | |
| 781 | | |||
Impairment charges | 6,626 | |
| - | |
| - | | |||
Restatement, investigations and remediation | - | |
| 3,261 | |
| 24,828 | | |||
TOTAL EXPENSES | 1,509,657 | |
| 1,705,242 | |
| 2,024,724 | | |||
OPERATING INCOME (LOSS) | (12,760 | ) |
| 4,786 | |
| (7,252 | ) | |||
OTHER INCOME (EXPENSE), NET: |
|
|
|
|
| ||||||
Interest income | 572 | |
| 267 | |
| 912 | | |||
Interest expense | (3,244 | ) |
| (3,530 | ) |
| (3,871 | ) | |||
Foreign exchange gain (loss), net | (249 | ) |
| 118 | |
| 369 | | |||
Other income (expense), net | 541 | |
| 198 | |
| 21 | | |||
TOTAL OTHER INCOME (EXPENSE), NET | (2,380 | ) |
| (2,947 | ) |
| (2,569 | ) | |||
INCOME (LOSS) FROM CONTINUING OPERATIONS BEFORE INCOME TAXES | (15,140 | ) |
| 1,839 | |
| (9,821 | ) | |||
Income tax provision | 4,646 | |
| 5,226 | |
| 2,922 | | |||
LOSS FROM CONTINUING OPERATIONS | (19,786 | ) |
| (3,387 | ) |
| (12,743 | ) | |||
LOSS FROM DISCONTINUED OPERATIONS, NET OF INCOME TAXES | (4,834 | ) |
| (15,601 | ) |
| (18,132 | ) | |||
NET LOSS | $ | (24,620 | ) |
| $ | (18,988 | ) |
| $ | (30,875 | ) |
PER SHARE DATA: |
|
|
|
|
| ||||||
Basic: |
|
|
|
|
| ||||||
Loss from continuing operations | $ | (0.95 | ) |
| $ | (0.16 | ) |
| $ | (0.61 | ) |
Loss from discontinued operations | (0.23 | ) |
| (0.75 | ) |
| (0.87 | ) | |||
Net loss | $ | (1.18 | ) |
| $ | (0.91 | ) |
| $ | (1.48 | ) |
Weighted average number of shares | 20,816 | |
| 20,863 | |
| 20,826 | | |||
Diluted: | |
|
|
|
| ||||||
Loss from continuing operations | $ | (0.95 | ) |
| $ | (0.16 | ) |
| $ | (0.61 | ) |
Loss from discontinued operations | (0.23 | ) |
| (0.75 | ) |
| (0.87 | ) | |||
Net loss | $ | (1.18 | ) |
| $ | (0.91 | ) |
| $ | (1.48 | ) |
Weighted average number of shares | 20,816 | |
| 20,863 | |
| 20,826 | | |||
The accompanying notes are an integral part of these consolidated financial statements.
F-2
VOLT INFORMATION SCIENCES, INC. AND SUBSIDIARIES
Consolidated Statements of Comprehensive Loss
(In thousands)
| Year ended | ||||||||||
| November 1, |
| November 2, |
| November 3, | ||||||
Net loss | $ | (24,620 | ) | | $ | (18,988 | ) | | $ | (30,875 | ) |
Other comprehensive loss: |
|
|
|
|
| ||||||
Foreign currency translation adjustments net of taxes of $0, $0, and $0, respectively | (1,606 | ) |
| (1,158 | ) |
| (2,531 | ) | |||
Unrealized gain on marketable securities net of taxes of $0, $0, and $0, respectively | 12 | |
| 1 | |
| 27 | | |||
Total other comprehensive loss | (1,594 | ) |
| (1,157 | ) |
| (2,504 | ) | |||
Comprehensive loss | $ | (26,214 | ) |
| $ | (20,145 | ) |
| $ | (33,379 | ) |
The accompanying notes are an integral part of these consolidated financial statements.
F-3
VOLT INFORMATION SCIENCES, INC. AND SUBSIDIARIES
Consolidated Balance Sheets
(In thousands, except share amounts)
| November 1, 2015 |
| November 2, 2014 | ||||
ASSETS |
|
|
| ||||
CURRENT ASSETS: |
|
|
| ||||
Cash and cash equivalents | $ | 10,188 | |
| $ | 6,723 | |
Restricted cash | 10,178 | |
| 26,893 | | ||
Short-term investments | 4,799 | |
| 5,543 | | ||
Trade accounts receivable, net of allowances of $960 and $865, respectively | 198,385 | |
| 230,951 | | ||
Recoverable income taxes | 17,583 | |
| 18,171 | | ||
Prepaid insurance | 7,108 | |
| 13,754 | | ||
Other current assets | 8,757 | |
| 11,115 | | ||
Assets held for sale | 22,943 | |
| 52,198 | | ||
TOTAL CURRENT ASSETS | 279,941 | |
| 365,348 | | ||
Prepaid insurance and other assets, excluding current portion | 16,355 | |
| 26,755 | | ||
Property, equipment and software, net | 24,095 | |
| 25,556 | | ||
Goodwill | 6,435 | |
| 6,673 | | ||
TOTAL ASSETS | $ | 326,826 | |
| $ | 424,332 | |
LIABILITIES AND STOCKHOLDERS' EQUITY |
|
|
| ||||
CURRENT LIABILITIES: | |
|
| ||||
Accrued compensation | $ | 29,548 | |
| $ | 37,671 | |
Accounts payable | 39,164 | |
| 54,316 | | ||
Accrued taxes other than income taxes | 22,719 | |
| 15,985 | | ||
Accrued insurance and other | 33,178 | |
| 37,822 | | ||
Deferred revenue | 1,213 | |
| 1,857 | | ||
Short-term borrowings, including current portion of long-term debt | 982 | |
| 129,417 | | ||
Income taxes payable | 1,658 | |
| - | | ||
Liabilities held for sale | 7,345 | |
| 28,387 | | ||
TOTAL CURRENT LIABILITIES | 135,807 | |
| 305,455 | | ||
Accrued insurance, excluding current portion | 10,474 | |
| 10,545 | | ||
Income taxes payable, excluding current portion | 6,516 | |
| 8,526 | | ||
Deferred income taxes | 3,225 | |
| 1,196 | | ||
Long-term debt, excluding current portion | 106,313 | |
| 7,216 | | ||
TOTAL LIABILITIES | 262,335 | |
| 332,938 | | ||
Commitments and contingencies | |
| | ||||
STOCKHOLDERS' EQUITY: |
|
|
| ||||
Preferred stock, par value $1.00; Authorized - 500,000 shares; Issued - none | - | |
| - | | ||
Common stock, par value $0.10; Authorized - 120,000,000 shares; Issued - 23,738,003 and 23,610,103, respectively; Outstanding - 20,801,080 and 20,922,796, respectively | 2,374 | |
| 2,361 | | ||
Paid-in capital | 75,803 | |
| 73,194 | | ||
Retained earnings | 38,034 | |
| 64,119 | | ||
Accumulated other comprehensive loss | (7,994 | ) |
| (6,400 | ) | ||
Treasury stock, at cost; 2,936,923 and 2,687,307 shares, respectively | (43,726 | ) |
| (41,880 | ) | ||
TOTAL STOCKHOLDERS' EQUITY | 64,491 | |
| 91,394 | | ||
TOTAL LIABILITIES AND STOCKHOLDERS' EQUITY | $ | 326,826 | |
| $ | 424,332 | |
The accompanying notes are an integral part of these consolidated financial statements.
F-4
VOLT INFORMATION SCIENCES, INC. AND SUBSIDIARIES
Consolidated Statements of Stockholders' Equity
(In thousands, except number of share data)
| Common Stock $0.10 Par Value |
|
|
|
|
|
|
|
|
|
| |||||||||||||||
| Shares |
| Amount |
| Paid-in Capital |
| Retained Earnings |
| Accumulated Other Comprehensive Loss |
| Treasury Stock |
| Total Stockholders' Equity | |||||||||||||
BALANCE AT OCTOBER 28, 2012 | 23,500,103 | |
| $ | 2,350 | |
| $ | 71,591 | |
| $ | 113,795 | |
| $ | (2,739 | ) |
| $ | (41,880 | ) |
| $ | 143,117 | |
Net loss | - | |
| - | |
| - | |
| (30,875 | ) |
| - | |
| - | |
| (30,875 | ) | ||||||
Share-based compensation expense | 36,666 | |
| 4 | |
| 412 | |
| - | |
| - | |
| - | |
| 416 | | ||||||
Other | - | |
| - | |
| - | |
| 87 | |
| - | |
| - | |
| 87 | | ||||||
Other comprehensive loss | - | |
| - | |
| - | |
| - | |
| (2,504 | ) |
| - | |
| (2,504 | ) | ||||||
BALANCE AT NOVEMBER 3, 2013 | 23,536,769 | |
| 2,354 | |
| 72,003 | |
| 83,007 | |
| (5,243 | ) |
| (41,880 | ) |
| 110,241 | | ||||||
Net loss | - | |
| - | |
| - | |
| (18,988 | ) |
| - | |
| - | |
| (18,988 | ) | ||||||
Share-based compensation expense | - | |
| - | |
| 1,198 | |
| - | |
| - | |
| - | |
| 1,198 | | ||||||
Issuance of common stock | 73,334 | |
| 7 | |
| (7 | ) |
| - | |
| - | |
| - | |
| - | | ||||||
Other | - | |
| - | |
| - | |
| 100 | |
| - | |
| - | |
| 100 | | ||||||
Other comprehensive loss | - | |
| - | |
| - | |
| - | |
| (1,157 | ) |
| - | |
| (1,157 | ) | ||||||
BALANCE AT NOVEMBER 2, 2014 | 23,610,103 | |
| 2,361 | |
| 73,194 | |
| 64,119 | |
| (6,400 | ) |
| (41,880 | ) |
| 91,394 | | ||||||
Net loss | - | |
| - | |
| - | |
| (24,620 | ) |
| - | |
| - | |
| (24,620 | ) | ||||||
Share-based compensation expense | - | |
| - | |
| 2,906 | |
| - | |
| - | |
| - | |
| 2,906 | | ||||||
Issuance of common stock | 127,900 | |
| 13 | |
| (297 | ) |
| (1,601 | ) |
| - | |
| 2,416 | |
| 531 | | ||||||
Share repurchases | - | |
| - | |
| - | |
| - | |
| - | |
| (4,262 | ) |
| (4,262 | ) | ||||||
Other | - | |
| - | |
| - | |
| 136 | |
| - | |
| - | |
| 136 | | ||||||
Other comprehensive loss | - | |
| - | |
| - | |
| - | |
| (1,594 | ) |
| - | |
| (1,594 | ) | ||||||
BALANCE AT NOVEMBER 1, 2015 | 23,738,003 | |
| $ | 2,374 | |
| $ | 75,803 | |
| $ | 38,034 | |
| $ | (7,994 | ) |
| $ | (43,726 | ) |
| $ | 64,491 | |
The accompanying notes are an integral part of these consolidated financial statements.
F-5
VOLT INFORMATION SCIENCES, INC. AND SUBSIDIARIES
Consolidated Statements of Cash Flows
(In thousands)
| Year ended | ||||||||||
| November 1, 2015 |
| November 2, 2014 |
| November 3, 2013 | ||||||
CASH FLOWS FROM OPERATING ACTIVITIES: |
|
|
|
|
| ||||||
Net loss | $ | (24,620 | ) |
| $ | (18,988 | ) |
| $ | (30,875 | ) |
Loss from discontinued operations, net of income taxes | (4,834 | ) |
| (15,601 | ) |
| (18,132 | ) | |||
Loss from continuing operations | (19,786 | ) |
| (3,387 | ) |
| (12,743 | ) | |||
Adjustments to reconcile net loss to cash provided by (used in) operating activities: |
|
|
|
|
| ||||||
Depreciation and amortization | 6,811 | |
| 9,323 | |
| 11,169 | | |||
Provisions (release) of doubtful accounts and sales allowances | 532 | |
| (132 | ) |
| 488 | | |||
Unrealized foreign currency exchange gain | (582 | ) |
| (408 | ) |
| (393 | ) | |||
Impairment charges | 6,626 | |
| - | |
| - | | |||
Loss (gain) on dispositions of property, equipment and software | (428 | ) |
| 55 | |
| (88 | ) | |||
Deferred income tax provision | 972 | |
| 2,288 | |
| 101 | | |||
Share-based compensation expense | 2,906 | |
| 1,198 | |
| 416 | | |||
Accretion of convertible note discount | (439 | ) |
| - | |
| - | | |||
Change in operating assets and liabilities: |
|
|
|
|
| ||||||
Trade accounts receivable | 29,864 | |
| 33,287 | |
| 35,301 | | |||
Restricted cash related to customer contracts | 6,279 | |
| (886 | ) |
| 10,775 | | |||
Prepaid insurance and other assets | 23,814 | |
| 8,358 | |
| (9,718 | ) | |||
Net assets held for sale | 1,396 | |
| 1,333 | |
| 1,819 | | |||
Accounts payable | (13,048 | ) |
| 607 | |
| (28,849 | ) | |||
Accrued expenses and other liabilities | (2,847 | ) |
| (14,058 | ) |
| (6,006 | ) | |||
Deferred revenue, net | 116 | |
| (539 | ) |
| (7,814 | ) | |||
Income taxes | 1,138 | |
| (2,617 | ) |
| (6,728 | ) | |||
Net cash provided by (used in) operating activities | 43,324 | |
| 34,422 | |
| (12,270 | ) | |||
CASH FLOWS FROM INVESTING ACTIVITIES: |
|
| |
|
| ||||||
Sales of investments | 1,304 | |
| 1,407 | |
| 2,251 | | |||
Purchases of investments | (645 | ) |
| (507 | ) |
| (1,894 | ) | |||
Proceeds from sales of property, equipment and software | 465 | |
| 3,086 | |
| 312 | | |||
Purchases of property, equipment, and software | (8,552 | ) |
| (5,267 | ) |
| (9,227 | ) | |||
Net cash used in investing activities | (7,428 | ) |
| (1,281 | ) |
| (8,558 | ) | |||
CASH FLOWS FROM FINANCING ACTIVITIES: |
|
|
|
|
| ||||||
Decrease in cash restricted as collateral for borrowings | 10,436 | |
| 21,349 | |
| 3,796 | | |||
Repayment of borrowings | (58,506 | ) |
| (68,637 | ) |
| (54,666 | ) | |||
Draw-down on borrowings | 30,000 | |
| 30,000 | |
| 77,000 | | |||
Repayment of long-term debt | (832 | ) |
| (839 | ) |
| (835 | ) | |||
Debt issuance costs | (1,426 | ) |
| (233 | ) |
| (252 | ) | |||
Proceeds from exercise of stock options | 531 | |
| - | |
| - | | |||
Purchases of common stock under repurchase program | (4,262 | ) |
| - | |
| - | | |||
Net cash provided by (used in) financing activities | (24,059 | ) |
| (18,360 | ) |
| 25,043 | | |||
Effect of exchange rate changes on cash and cash equivalents | (924 | ) |
| (386 | ) |
| 1,376 | | |||
CASH FLOWS FROM DISCONTINUED OPERATIONS: |
|
|
|
|
| ||||||
Cash flow from operating activities | (3,237 | ) |
| (16,735 | ) |
| (17,168 | ) | |||
Cash flow from investing activities | (4,000 | ) |
| (778 | ) |
| (2,395 | ) | |||
Net cash used in discontinued operations | (7,237 | ) |
| (17,513 | ) |
| (19,563 | ) | |||
Net increase (decrease) in cash and cash equivalents | 3,676 | |
| (3,118 | ) |
| (13,972 | ) | |||
Cash and cash equivalents, beginning of year | 6,723 | |
| 8,855 | |
| 22,026 | | |||
Change in cash from discontinued operations | (211 | ) |
| 986 | |
| 801 | | |||
Cash and cash equivalents, end of year | $ | 10,188 | |
| $ | 6,723 | |
| $ | 8,855 | |
Cash paid during the year: |
|
|
|
|
| ||||||
Interest expense | $ | 3,196 | |
| $ | 3,539 | |
| $ | 2,925 | |
Income taxes | $ | 3,315 | |
| $ | 4,948 | |
| $ | 10,557 | |
Supplemental disclosure of non-cash investing activity: |
|
|
|
|
| ||||||
Note receivable in exchange for Computer Systems segment net assets sold | $ | 8,363 | |
| $ | - | |
| $ | - | |
The accompanying notes are an integral part of these consolidated financial statements.
F-6
VOLT INFORMATION SCIENCES, INC. AND SUBSIDIARIES
Notes to Consolidated Financial Statements
As of November 1, 2015
NOTE 1: Summary of Business and Significant Accounting Policies
Volt Information Sciences, Inc., (the "Company," "Volt," "we," "our," or "us") is a global provider of staffing services (traditional time and materials-based as well as project-based), managed service programs, technology outsourcing services, information technology infrastructure services, and telecommunication infrastructure and security services, and telephone directory publishing and printing in Uruguay. Our staffing services consists of workforce solutions that include providing contingent workers, personnel recruitment services, and managed service programs supporting primarily professional administration, technical, information technology, light-industrial and engineering positions. Our managed service programs consist of managing the procurement and on-boarding of contingent workers from multiple providers. Our technology outsourcing services provide pre and post production development, testing, and customer support to companies in the mobile, gaming, and technology devices industries. In addition, we provide information technology infrastructure services which provides server, storage, network and desktop IT hardware maintenance, data center and network monitoring and operations. Our complementary businesses offer customized talent, technology and consulting solutions to a diverse client base. Volt services global industries including aerospace, automotive, banking and finance, consumer electronics, information technology, insurance, life sciences, manufacturing, media and entertainment, pharmaceutical, software, telecommunications, transportation, and utilities. The Company was incorporated in New York in 1957. The Company's stock is traded on the NYSE MKT under the symbol "VISI".
(a) | Fiscal Year |
The Company's fiscal year ends on the Sunday nearest October 31st. The 2015 and 2014 fiscal years consisted of 52 weeks, while the 2013 fiscal year consisted of 53 weeks. As a result, the fourth quarter of fiscal year 2013 included an additional week.
(b) | Consolidation |
The consolidated financial statements include the accounts of the Company and all subsidiaries over which the Company exercises control. All intercompany balances and transactions have been eliminated in consolidation. The Company accounts for investments over which it has significant influence but not a controlling financial interest using the equity method of accounting.
(c) | Use of Estimates |
The preparation of consolidated financial statements in conformity with accounting principles generally accepted in the United States requires management to make estimates and assumptions that affect the amounts reported in the financial statements and accompanying notes. On an ongoing basis, the Company evaluates its estimates, assumptions and judgments, including those related to revenue recognition, allowance for doubtful accounts, contract costing and reserves, casualty reserves, valuation of goodwill, intangible assets and other long-lived assets, business combinations, stock compensation, employee benefit plans, restructuring accruals, income taxes and related valuation allowances and loss contingencies. Actual results could differ from those estimates and changes in estimates are reflected in the period in which they become known.
(d) | Revenue Recognition |
Revenue is generally recognized when persuasive evidence of an arrangement exists, products have been delivered or services have been rendered, the fee is fixed or determinable, and collectability is reasonably assured. For arrangements within the scope of the multiple-deliverable guidance, a deliverable constitutes a separate unit of accounting when it has stand-alone value and there are no customer-negotiated refunds or return rights for the delivered elements. For multiple-element arrangements, composed only of hardware products and related services or only services, we allocate revenue to each element in an arrangement based on a selling price hierarchy. The selling price for a deliverable is based on its vendor-specific objective evidence ("VSOE") if applicable, third-party evidence ("TPE") if VSOE is not available, or estimated selling price ("ESP"), if neither VSOE nor TPE is available. Total transaction revenue is allocated to the multiple elements based on each element's relative selling price compared to the total selling price.
Services are sometimes provided despite a customer arrangement not yet being finalized. In these cases revenue is deferred until arrangements are finalized or in some cases until cash is received. The cumulative revenue deferred for each arrangement is recognized in the period the revenue recognition criteria are met. The following revenue recognition policies define the manner in which the Company accounts for specific transaction types:
F-7
VOLT INFORMATION SCIENCES, INC. AND SUBSIDIARIES
Notes to Consolidated Financial Statements
As of November 1, 2015
Staffing Services
Revenue is primarily derived from supplying contingent staff to the Company's customers or providing other services on a time and material basis. Contingent staff primarily consist of contingent workers working under a contract for a fixed period of time or on a specific customer project. Revenue is also derived from permanent placement services, which is generally recognized after placements are made and when the fees are not contingent upon any future event.
Reimbursable costs, including those related to travel and out-of-pocket expenses, are also included in Net Revenue, and equivalent amounts of reimbursable costs are included in Direct Cost of Staffing Services Revenue.
Under certain of the Company's service arrangements, contingent staff are provided to customers through contracts involving other vendors or contractors. When the Company is the principal in the transaction and therefore the primary obligor for the contingent staff, we record the gross amount of the revenue and expense from the service arrangement. When the Company acts only as an agent for the customer and is not the primary obligor for the contingent staff, we record revenue net of vendor or contractor costs.
The Company is generally the primary obligor when responsible for the fulfillment of the services under the contract, even if the contingent workers are neither employees of the Company nor directly contracted by the Company. Usually in these situations the contractual relationship with the vendors and contractors is exclusively with the Company and the Company bears customer credit risk and generally has latitude in establishing vendor pricing and has discretion in vendor or contractor selection.
The Company is generally not the primary obligor when we provide comprehensive administration of multiple vendors for customers that operate significant contingent workforces, referred to as managed service programs. The Company is considered an agent in these transactions if it does not have responsibility for the fulfillment of the services by the vendors or contractors (referred to as associate vendors). In such arrangements the Company is typically designated by its customers to be a facilitator of consolidated associate vendor billing and a processor of the payments to be made to the associate vendors on behalf of the customer. Usually in these situations the contractual relationship is between the customers, the associate vendors and the Company, with the associate vendors being the primary obligor and assuming the customer credit risk and the Company generally earning negotiated fixed mark-ups and not having discretion in supplier selection.
Maintenance and Information Technology Infrastructure Services
Revenue from hardware maintenance, computer and network operations infrastructure services under fixed-price contracts and stand-alone post-contract support ("PCS") is generally recognized ratably over the contract period, provided that all other revenue recognition criteria are met, and the cost associated with these contracts is recognized as incurred. For time and material contracts, the Company recognizes revenue and costs as services are rendered, provided that all other revenue recognition criteria are met.
Telecommunication Infrastructure and Security Services
Revenue from performing engineering and construction services is recognized either on the completed contract method for those contracts that are of a short-term nature, or on the percentage-of-completion method, measuring progress using the cost-to-cost method, provided that all other revenue recognition criteria are met. Known or anticipated losses on contracts are provided for in the period they become evident. Claims and change orders that are in the process of being negotiated with customers for additional work or changes in the scope of work are included in the estimated contract value when it is deemed probable that the claim or change order will result in additional contract revenue and such amount can be reliably estimated.
(e) | Expense Recognition |
Direct Cost of Staffing Services Revenue
Direct Cost of Staffing Services Revenue consists primarily of contingent worker payroll, related employment taxes and benefits, and the cost of facilities used by contingent workers in fulfilling assignments and projects for staffing services customers, including reimbursable costs. Indirect cost of staffing services revenue is included in Selling, Administrative and Other Operating Costs in the Consolidated Statements of Operations. The direct costs differ from the selling, administrative and other operating costs in that they arise specifically and directly from the actions of providing staffing services to customers.
F-8
VOLT INFORMATION SCIENCES, INC. AND SUBSIDIARIES
Notes to Consolidated Financial Statements
As of November 1, 2015
Cost of Other Revenue
Cost of Other Revenue consists of the direct and indirect cost of providing non-staffing services, which include payroll and related employment taxes, benefits, materials, and equipment costs.
Selling, Administrative and Other Operating Costs
Selling, Administrative and Other Operating Costs primarily relate to the Company's selling and administrative efforts as well as the indirect costs associated with providing staffing services.
Restatement, Investigations and Remediation
The Company previously restated its Consolidated Financial Statements for the fiscal year ended November 2, 2008, with the restated financial statements issued during fiscal year 2013. The costs incurred were comprised of financial and legal consulting, audit and related costs of the restatement, related investigations and completion of delayed filings during fiscal year 2014 required under SEC regulations.
(f) | Comprehensive Income (Loss) |
Comprehensive Income (Loss) is the net income (loss) of the Company combined with other changes in stockholders' equity not involving ownership interest changes. For the Company, such other changes include foreign currency translation and mark-to-market adjustments related to available-for-sale securities.
(g) | Cash and Cash Equivalents |
The Company considers all highly liquid investments with a maturity of three months or less when purchased to be cash equivalents.
(h) | Short-Term Investments and Related Deferred Compensation, Net |
The Company has a nonqualified deferred compensation and supplemental savings plan that permits eligible employees to defer a portion of their salary. The employee salary deferral is invested in short-term investments corresponding to the employees' investment selections, primarily mutual funds, which are held in a trust and are reported at current market prices. The liability associated with the nonqualified deferred compensation and supplemental savings plan consists of participant deferrals and earnings thereon, and is reflected as a current liability within Accrued Compensation in an amount equal to the fair value of the underlying short-term investments held in the plan. Changes in asset values result in offsetting changes in the liability as the employees realize the rewards and bear the risks of their investment selections.
(i) | Property, Equipment and Software, Net |
Property and equipment are stated at cost and depreciation is calculated on the straight-line method over the estimated useful lives of the assets. Costs for software that will be used for internal purposes and incurred during the application development stage are capitalized and amortized to expense over the estimated useful life of the underlying software. Training and maintenance costs are expensed as incurred.
Buildings | 25 to 32 years |
Machinery and Equipment | 3 to 15 years |
Leasehold improvements | Shorter of length of lease or life of the asset |
Software | 3 to 7 years |
Property, equipment and software are reviewed for impairment whenever events or changes in circumstances indicate that the carrying amount of an asset may not be recoverable or it is no longer probable that software development will be completed. If circumstances require a long-lived asset or asset group be reviewed for possible impairment, the Company first compares undiscounted cash flows expected to be generated by each asset or asset group to its carrying value. If the carrying value of the
F-9
VOLT INFORMATION SCIENCES, INC. AND SUBSIDIARIES
Notes to Consolidated Financial Statements
As of November 1, 2015
long-lived asset or asset group is not recoverable on an undiscounted cash flow basis, an impairment is recognized to the extent that the carrying value exceeds the fair value.
(j) | Goodwill |
Goodwill represents the future economic benefits arising from assets acquired in a business combination that are not individually identified and separately recognized. The Company applies the method of assessing goodwill for possible impairment permitted by Accounting Standards Update ("ASU") No. 2011-08, Intangibles – Goodwill and Other. The Company first assesses the qualitative factors for reporting units that carry goodwill. If the qualitative assessment results in a conclusion that it is more likely than not that the fair value of a reporting unit exceeds the carrying value, then no further testing is performed for that reporting unit.
When a qualitative assessment is not used, or if the qualitative assessment is not conclusive and it is necessary to calculate fair value of a reporting unit, then the impairment analysis for goodwill is performed at the reporting unit level using a two-step approach. The first step of the goodwill impairment test is used to identify potential impairment by comparing the fair value of a reporting unit with its carrying amount, including goodwill utilizing an enterprise-value based premise approach. If the fair value of the reporting unit exceeds its carrying value, step two does not need to be performed.
If the fair value of the reporting unit is less than its carrying value, an indication of goodwill impairment exists for the reporting unit and the entity must perform step two of the impairment test (measurement). Under step two, an impairment loss is recognized for any excess of the carrying amount of the reporting unit's goodwill over the implied fair value of that goodwill. The implied fair value of goodwill is determined by allocating the fair value of the reporting unit in a manner similar to a purchase price allocation and the residual fair value after this allocation is the implied fair value of the reporting unit goodwill. Fair value of the reporting unit is determined by using various valuation techniques including income (discounted cash flow), market and/or consideration of recent and similar purchase acquisition transactions.
The Company performs its annual impairment review of goodwill in its second fiscal quarter and when a triggering event occurs between annual impairment tests.
(k) | Income Taxes |
Income taxes are accounted for under the asset and liability method. Deferred tax assets and liabilities are recognized for the future tax consequences attributable to differences between the financial statement carrying amounts of existing assets and liabilities and their respective tax bases as well as for operating loss and tax credit carryforwards. Deferred tax assets and liabilities are measured using current tax laws and rates in effect for the years in which those temporary differences are expected to be recovered or settled. The effect on deferred tax assets and liabilities of a change in tax rates is recognized in income in the period that includes the enactment date. The Company must then assess the likelihood that its deferred tax assets will be realized. If the Company does not believe that it is more likely than not that its deferred tax assets will be realized, a valuation allowance is established. When a valuation allowance is increased or decreased, a corresponding tax expense or benefit is recorded.
Accounting for income taxes involves uncertainty and judgment in how to interpret and apply tax laws and regulations within the Company's annual tax filings. Such uncertainties may result in tax positions that may be challenged and overturned by a tax authority in the future, which would result in additional tax liability, interest charges and possible penalties. Interest and penalties are classified as a component of income tax expense.
The Company recognizes the effect of income tax positions only if those positions are more likely than not of being sustained. Recognized income tax positions are measured at the largest amount that is greater than 50% likely of being realized upon ultimate settlement. Changes in recognition or measurement are reflected in the period in which the change in estimate occurs.
(l) | Share-Based Compensation |
The Company recognizes all employee share-based compensation as a cost in the financial statements. Equity awards are measured at the grant date fair value of the award. The Company determines grant date fair value of stock option awards using the Black-Scholes option-pricing model and a Monte Carlo simulation. The fair value of restricted stock awards are determined using the closing price of the Company's common stock on the grant date. Expense is recognized over the requisite service period based on the number of options or shares expected to ultimately vest. Forfeitures are estimated at the date of grant and revised when actual or expected forfeiture activity differs materially from original estimates. If there are any modifications or
F-10
VOLT INFORMATION SCIENCES, INC. AND SUBSIDIARIES
Notes to Consolidated Financial Statements
As of November 1, 2015
cancellations of the underlying unvested awards, the Company may be required to accelerate any remaining unearned stock-based compensation cost or incur incremental cost.
Excess tax benefits of awards that are recognized in equity related to stock option exercises are reflected as financing cash inflows in the Consolidated Statement of Cash Flows.
(m) | Foreign Currency |
Assets and liabilities of non-U.S. subsidiaries that operate in a local currency environment, where that local currency is the functional currency, are translated to U.S. dollars at exchange rates in effect at the balance sheet date. Income and expense accounts are translated at average exchange rates during the year which approximate the rates in effect at the transaction dates. The resulting translation adjustments are directly recorded to a separate component of Accumulated Other Comprehensive Income (Loss). Gains and losses arising from intercompany foreign currency transactions that are of a long-term nature are reported in the same manner as translation adjustments. Gains and losses arising from intercompany foreign currency transactions that are not of a long-term nature and certain transactions of the Company's subsidiaries which are denominated in currencies other than the subsidiaries' functional currency are recognized as incurred in Foreign Exchange Gain (Loss), net in the Consolidated Statements of Operations.
(n) | Fair Value Measurement |
In accordance with Accounting Standards Codification ("ASC") 820, Fair Value Measurements , the Company utilizes valuation techniques that maximize the use of observable inputs and minimize the use of unobservable inputs to the extent possible. The Company determines fair value based on assumptions that market participants would use in pricing an asset or liability in the principal or most advantageous market. Fair value is defined as the amount that would be received to sell an asset or paid to transfer a liability in an orderly transaction between market participants at the measurement date. When considering market participant assumptions in fair value measurements, the following fair value hierarchy distinguishes between observable and unobservable inputs, which are categorized in one of the following levels:
Level 1: Quoted market prices in active markets for identical assets or liabilities.
Level 2: Quoted prices in active markets for similar assets and liabilities, quoted prices for identically similar assets or liabilities in markets that are not active and models for which all significant inputs are observable either directly or indirectly.
Level 3: Unobservable inputs reflecting the reporting entity's own assumptions or external inputs for inactive markets.
The Company uses this framework for measuring fair value and disclosures about fair value measurement. The Company uses fair value measurements in areas that include: the allocation of purchase price consideration to tangible and identifiable intangible assets; impairment testing for goodwill and long-lived assets; share-based compensation arrangements and financial instruments. The carrying amounts of the Company's financial instruments, which include cash, cash equivalents, restricted cash, accounts receivable, accounts payable, and short-term borrowings under the Company's credit facilities, approximated their fair values, due to the short-term nature of these instruments, and the fair value of the long-term debt is based on the interest rates the Company believes it could obtain for borrowings with similar terms.
The Company recognizes transfers between levels of the fair value hierarchy on the date of the event or change in circumstances that caused the transfer.
(o) | Legal and Other Contingencies |
The Company is involved in various demands, claims and actual and threatened litigation that arise in the normal course of business. If the potential loss from any claim or legal proceeding is considered probable and the amount can be reasonably estimated, a liability and an expense are recorded for the estimated loss. Significant judgment is required in both the determination of probability and the determination of whether an exposure is reasonably estimable. Actual expenses could differ from these estimates in subsequent periods as additional information becomes known.
(p) | Concentrations of Credit Risk |
Cash and cash equivalents are maintained with several financial institutions and deposits held with banks may exceed the amount of insurance provided on such deposits. Generally, these deposits may be redeemed upon demand and the Company
F-11
VOLT INFORMATION SCIENCES, INC. AND SUBSIDIARIES
Notes to Consolidated Financial Statements
As of November 1, 2015
mitigates its credit risk by spreading its deposits across multiple financial institutions and monitoring their respective risk profiles.
(q) | Restructuring Charges |
The Company accounts for restructuring activities in accordance with ASC 420, Exit or Disposal Cost Obligations. Under the guidance, for the cost of restructuring activities that do not constitute a discontinued operation, the liability for the current fair value of expected future costs associated with such restructuring activity is recognized in the period in which the liability is incurred. The costs of restructuring activities taken pursuant to a management approved restructuring plan are segregated.
(r) | Hedging Activities |
On a limited basis, the Company enters into derivative and nonderivative short-term foreign denominated debt instruments as an economic hedge of its net investment in certain foreign subsidiaries. All derivative instruments are recognized as either assets or liabilities at their respective fair values. For the nonderivative instruments, the Company measures the foreign denominated short-term borrowings based on period-end exchange rates. The Company does not designate and document these instruments as hedges under ASC 815, Derivatives and Hedging . As a result, gains and losses associated with these instruments are recognized in Foreign Exchange Gain (Loss), net in our Consolidated Statements of Operations.
(s) | Earnings (Loss) Per Share |
Basic earnings per share are calculated by dividing net earnings by the weighted-average number of common shares outstanding during the period. The diluted earnings per share computation includes the effect, if any, of shares that would be issuable upon the exercise of outstanding stock options and unvested restricted stock shares, reduced by the number of shares which are assumed to be purchased by the Company from the resulting proceeds at the average market price during the year, when such amounts are dilutive to the earnings per share calculation.
(t) | Treasury Stock |
The Company records treasury stock at the cost to acquire it and includes treasury stock as a component of Stockholders' Equity. In determining the cost of the treasury shares when either sold or issued, the Company uses the FIFO (first-in, first-out) method. If the proceeds from the sale of the treasury shares are greater than the cost of the shares sold, the excess proceeds are recorded as additional paid-in capital. If the proceeds from the sale of the treasury shares are less than the original cost of the shares sold, the excess cost first reduces any additional paid-in capital arising from previous sales of treasury shares for that class of stock, and any additional excess is recorded as a reduction of retained earnings.
(u) | Assets and Liabilities Held for Sale |
The Company classifies long-lived assets (disposal group) to be sold as held for sale in accordance with ASU 2014-08, Presentation Of Financial Statements (Topic 205) And Property, Plant, And Equipment (Topic 360): Reporting Discontinued Operations And Disclosures Of Disposals Of Components Of An Entity ("ASU 2014-08"), in the period in which all of the following criteria are met: management, having the authority to approve the action, commits to a plan to sell the asset (disposal group); the asset (disposal group) is available for immediate sale in its present condition subject only to terms that are usual and customary for sales of such assets (disposal group); an active program to locate a buyer and other actions required to complete the plan to sell the asset (disposal group) have been initiated; the sale of the asset (disposal group) is probable, and transfer of the asset (disposal group) is expected to qualify for recognition as a completed sale within one year , except if events or circumstances beyond our control extend the period of time required to sell the asset (disposal group) beyond one year; the asset (disposal group) is being actively marketed for sale at a price that is reasonable in relation to its current fair value; and actions required to complete the plan indicate that it is unlikely that significant changes to the plan will be made or that the plan will be withdrawn.
A long-lived asset (disposal group) that is classified as held for sale is initially measured at the lower of its carrying value or fair value less any costs to sell. Any loss resulting from this measurement is recognized in the period in which the held for sale criteria are met. Conversely, gains are not recognized on the sale of a long-lived asset (disposal group) until the date of sale.
The fair value of a long-lived asset (disposal group) less any costs to sell is assessed each reporting period it remains classified as held for sale and any subsequent changes are reported as an adjustment to the carrying value of the asset (disposal group), as long as the new carrying value does not exceed the carrying value of the asset at the time it was initially classified as held for
F-12
VOLT INFORMATION SCIENCES, INC. AND SUBSIDIARIES
Notes to Consolidated Financial Statements
As of November 1, 2015
sale. Upon determining that a long-lived asset (disposal group) meets the criteria to be classified as held for sale, the Company reports the assets and liabilities of the disposal group for all periods presented, if material, in the line items Assets Held for Sale and Liabilities Held for Sale, respectively, in the Consolidated Balance Sheets.
(v) | Discontinued Operations |
The results of operations of a component or a group of components of the Company that either has been disposed of or is classified as held for sale is reported in discontinued operations if the disposal represents a strategic shift that has (or will have) a major effect on the Company's operations and financial results. For any transaction expected to be structured as a sale of shares of an entity and not a sale of assets, the Company classifies the deferred taxes as part of Assets or Liabilities Held for Sale.
(w) | Reclassifications |
Certain reclassifications have been made to the prior year financial statements in order to conform to the current year's presentation.
(x) | New Accounting Pronouncements |
From time to time, new accounting pronouncements are issued by the Financial Accounting Standards Board ("FASB") or other standard setting bodies. Unless otherwise discussed, the Company believes that the impact of recently issued standards that are not yet effective will not have a material impact on its consolidated financial position or results of operations upon adoption.
New Accounting Standards Not Yet Adopted by the Company
In November 2015, the FASB issued ASU 2015-17, Income Taxes (Topic 740): Balance Sheet Classification of Deferred Taxes . The amendments in this update simplify the presentation of deferred income taxes and require that deferred tax liabilities and assets be classified as noncurrent in a classified statement of financial position. This update applies to all entities that present a classified statement of financial position. These amendments may be applied either prospectively to all deferred tax liabilities and assets or retrospectively to all periods presented. If the guidance is applied prospectively, disclosure is made in the first interim and first annual period of change, the nature of and reason for the change in accounting principle and a statement that prior periods were not retrospectively adjusted. If the guidance is applied retrospectively, disclosure is made in the first interim and first annual period of change, the nature of and reason for the change in accounting principle and quantitative information about the effects of the accounting change on prior periods. The amendments are effective for financial statements issued for annual periods beginning after December 15, 2016, and interim periods within those annual periods. Earlier application is permitted for all entities as of the beginning of an interim or annual reporting period.
In September 2015, the FASB issued ASU 2015-16, Business Combinations (Topic 805): Simplifying the Accounting for Measurement-Period Adjustments . The amendments in this update require that (1) an acquirer recognize adjustments to provisional amounts that are identified during the measurement period in the reporting period in which the adjustment amounts are determined, (2) the acquirer record, in the same period's financial statements, the effect on earnings of changes in depreciation, amortization, or other income effects, if any, as a result of the change to the provisional amounts, calculated as if the accounting had been completed at the acquisition date and (3) an entity presents separately on the face of the income statement or disclose in the notes the portion of the amount recorded in current-period earnings by line item that would have been recorded in previous reporting periods if the adjustment to the provisional amounts had been recognized as of the acquisition date.
In August 2015, FASB issued ASU 2015-15, Presentation and Subsequent Measurement of Debt Issuance Costs Associated with Line-of-Credit Arrangements . ASU 2015-15 clarifies the guidance in ASU 2015-03 , Simplifying the Presentation of Debt Issuance Costs, regarding presentation and subsequent measurement of debt issuance costs related to line-of-credit arrangements. The SEC Staff announced they would not object to an entity deferring and presenting debt issuance costs as an asset and subsequently amortizing the deferred debt issuance costs ratably over the term of the line-of-credit arrangement, regardless of whether there are any outstanding borrowings on the line-of-credit arrangement.
In June 2015, the FASB issued ASU No. 2015-10, Technical Corrections and Improvements. This ASU covers a wide range of Topics in the Codification. The amendments in this ASU represent changes to clarify the Codification, correct unintended application of guidance, or make minor improvements to the Codification that are not expected to have a significant effect on current accounting practice or create a significant administrative cost for most entities. The amendments that require transition
F-13
VOLT INFORMATION SCIENCES, INC. AND SUBSIDIARIES
Notes to Consolidated Financial Statements
As of November 1, 2015
guidance are effective for all entities for fiscal years, and interim periods within those fiscal years, beginning after December 15, 2015. Early adoption is permitted, including adoption in an interim period. All other amendments will be effective upon the issuance of this ASU.
In April 2015, the FASB issued ASU No. 2015-05, Customers' Accounting for Fees Paid in a Cloud Computing Arrangement . The ASU provides guidance in evaluating whether a cloud computing arrangement includes a software license. If a cloud computing arrangement includes a software license, then the software license element of the arrangement should be accounted for as an acquisition of a software license. If the arrangement does not contain a software license, it should be accounted for as a service contract. This ASU is effective for reporting periods beginning after December 15, 2015 and may be adopted either retrospectively or prospectively.
In April 2015, the FASB issued ASU No. 2015-03, Simplifying the Presentation of Debt Issuance Costs. The ASU requires that debt issuance costs related to a recognized liability be presented on the balance sheet as a direct reduction from the carrying amount of that debt liability, consistent with debt discounts. The recognition and measurement guidance for debt issuance costs are not affected. This ASU is effective for reporting periods beginning after December 15, 2015.
In February 2015, the FASB issued ASU No. 2015-02, Consolidation (Topic 810): Amendments to the Consolidation Analysis. The new consolidation standard changes the way reporting enterprises evaluate whether (a) they should consolidate limited partnerships and similar entities, (b) fees paid to a decision maker or service provider are variable interests in a variable interest entity ("VIE"), and (c) variable interests in a VIE held by related parties of the reporting enterprise require the reporting enterprise to consolidate the VIE. The guidance is effective for public business entities for annual and interim periods in fiscal years beginning after December 15, 2015. Early adoption is allowed, including early adoption in an interim period. A reporting entity may apply a modified retrospective approach by recording a cumulative-effect adjustment to equity as of the beginning of the fiscal year of adoption or may apply the amendments retrospectively.
In January 2015, the FASB issued ASU No. 2015-01, Income Statement - Extraordinary and Unusual Items (Subtopic 225-20): Simplifying Income Statement Presentation by Eliminating the Concept of Extraordinary Items. The new guidance eliminates the separate presentation of extraordinary items, net of tax and the related earnings per share, but does not affect the requirement to disclose material items that are unusual in nature or infrequently occurring. The ASU applies to all entities for fiscal years, and interim periods within those fiscal years, beginning after December 15, 2015. Entities have the option to apply the new guidance prospectively or retrospectively, and can choose early adoption.
In August 2014, the FASB issued ASU 2014-15, Presentation of Financial Statements - Going Concern (Subtopic 205-40): Disclosure of Uncertainties about an Entity's Ability to Continue as a Going Concern. This update provides guidance about management's responsibility to evaluate whether there is substantial doubt about an entity's ability to continue as a going concern. Specifically, the amendments (1) provide a definition of the term substantial doubt, (2) require an evaluation every reporting period including interim periods, (3) provide principles for considering the mitigating effect of management's plans, (4) require certain disclosures when substantial doubt is alleviated as a result of consideration of management's plans, (5) require an express statement and other disclosures when substantial doubt is not alleviated, and (6) require an assessment for a period of one year after the date that the financial statements are issued (or available to be issued). This ASU is effective for the annual period ending after December 15, 2016, with early adoption permitted.
In May 2014, the FASB issued ASU No. 2014-09, Revenue from Contracts with Customers (Topic 606) . Upon the effective date, the ASU replaces almost all existing revenue recognition guidance, including industry specific guidance, in generally accepted accounting principles. In August 2015, the FASB issued ASU 2015-14, Revenue from Contracts with Customers (Topic 606): Deferral of the Effective Date. The amendments in this update deferred the effective date for implementation of ASU 2014-09 by one year and are now effective for annual reporting periods beginning after December 15, 2017. Early application is permitted only as of annual reporting periods beginning after December 15, 2016 including interim reporting periods within that period. The Company is currently assessing the impact that the adoption of this standard will have on its consolidated financial statements and related disclosures upon implementation in the first quarter of fiscal year 2019.
NOTE 2: Discontinued Operations
On December 1, 2014, the Company completed the sale of its Computer Systems segment to NewNet Communication Technologies, LLC ("NewNet"), a Skyview Capital, LLC, portfolio company. The Company met all of the criteria to classify that segment's assets and liabilities as held for sale in the fourth quarter of fiscal year 2014. The results of the Computer
F-14
VOLT INFORMATION SCIENCES, INC. AND SUBSIDIARIES
Notes to Consolidated Financial Statements
As of November 1, 2015
Systems segment are presented as discontinued operations and excluded from continuing operations and from segment results for all periods presented.
The proceeds of the transaction are a $10.0 million note bearing interest at one half percent ( 0.5 percent) per year due in four years and convertible into a capital interest of up to 20% in NewNet. The Company may convert the note at any time and is entitled to receive early repayment in the event of certain events such as a change in control of NewNet. The proceeds are in exchange for the ownership of Volt Delta Resources, LLC and its operating subsidiaries, which comprise the Company's Computer Systems segment, and payment of $4.0 million by the Company during the first 45 days following the transaction. An additional payment will be made between the parties based on the comparison of the actual transaction date working capital amount to an expected working capital amount of $6.0 million (the contractually agreed upon working capital). The note was valued at $8.4 million on the transaction date which approximated fair value. The resulting discount is being amortized over four years with an effective interest rate of 5.1% .
As of November 1, 2015, the unamortized discount for the note is $1.3 million and the interest income resulting from the amortization for the twelve months ended November 1, 2015 was $0.4 million .
For the year ended November 1, 2015, the Company recognized a loss on disposal of $1.5 million . The total related costs associated with this transaction were $2.2 million comprised of $0.9 million in severance costs, $0.9 million of professional fees and $0.4 million of lease obligation costs. These costs are recorded in Discontinued Operations in the Consolidated Statements of Operations. As of November 1, 2015, $2.0 million has been paid and $0.2 million remains payable and is included in Accrued Insurance and Other in the Consolidated Balance Sheets.
F-15
VOLT INFORMATION SCIENCES, INC. AND SUBSIDIARIES
Notes to Consolidated Financial Statements
As of November 1, 2015
The following table reconciles the major classes of assets and liabilities classified as held for sale as part of discontinued operations in our Consolidated Balance Sheets (in thousands):
| November 1, 2015 | |
| November 2, 2014 | | ||
Assets included as part of discontinued operations |
|
|
| ||||
Cash and cash equivalents | $ | - | |
| $ | 282 | |
Trade accounts receivable, net | - | |
| 10,535 | | ||
Recoverable income taxes | - | |
| 921 | | ||
Prepaid insurance and other assets | - | |
| 9,251 | | ||
Property, equipment and software, net | - | |
| 3,231 | | ||
Total major classes of assets of discontinued operations - Computer Systems | - | |
| 24,220 | | ||
|
|
|
| ||||
Other assets included in the disposal group classified as held for sale - Maintech and Lakyfor, S.A. | 22,943 | |
| 27,978 | | ||
|
|
|
| ||||
Total assets of the disposal group classified as held for sale in the Consolidated Balance Sheets | $ | 22,943 | |
| $ | 52,198 | |
|
|
|
| ||||
Liabilities included as part of discontinued operations |
|
|
| ||||
Accrued compensation | $ | - | |
| $ | 2,272 | |
Accounts payable | - | |
| 992 | | ||
Accrued taxes other than income taxes | - | |
| 649 | | ||
Accrued insurance and other | - | |
| 5,794 | | ||
Deferred revenue | - | |
| 9,419 | | ||
Total major classes of liabilities of discontinued operations - Computer Systems | - | |
| 19,126 | | ||
|
|
|
| ||||
Other liabilities included in the disposal group classified as held for sale - Maintech and Lakyfor, S.A. | 7,345 | |
| 9,261 | | ||
|
|
|
| ||||
Total liabilities of the disposal group classified as held for sale in the Consolidated Balance Sheets | $ | 7,345 | |
| $ | 28,387 | |
Deferred tax assets of $6,842 are included in prepaid insurance and other assets as of November 2, 2014. Deferred tax liabilities of $3,834 are included in accrued insurance and other as of November 2, 2014.
F-16
VOLT INFORMATION SCIENCES, INC. AND SUBSIDIARIES
Notes to Consolidated Financial Statements
As of November 1, 2015
The following table reconciles the major line items in the Company's Consolidated Statements of Operations for discontinued operations (in thousands):
| Year Ended | ||||||||||
| November 1, 2015 | |
| November 2, 2014 | |
| November 3, 2013 | | |||
Loss from discontinued operations, net of income taxes |
|
|
|
|
| ||||||
Net revenue | $ | 4,708 | |
| $ | 59,369 | |
| $ | 73,465 | |
Cost of revenue | 5,730 | |
| 54,358 | |
| 65,680 | | |||
Selling, administrative and other operating costs | 1,388 | |
| 19,290 | |
| 24,314 | | |||
Other (income) expense, net | 731 | |
| 1,533 | |
| 4,056 | | |||
Pretax loss of discontinued operations | (3,141 | ) |
| (15,812 | ) |
| (20,585 | ) | |||
Loss on disposal of discontinued operations | (1,502 | ) |
| - | |
| - | | |||
Total loss from discontinued operations | (4,643 | ) |
| (15,812 | ) |
| (20,585 | ) | |||
Income tax provision (benefit) | 191 | |
| (211 | ) |
| (2,453 | ) | |||
Total loss from discontinued operations that is presented in the Consolidated Statements of Operations | $ | (4,834 | ) |
| $ | (15,601 | ) |
| $ | (18,132 | ) |
NOTE 3: Assets and Liabilities Held for Sale
In October 2015, the Company's Board of Directors approved a plan to sell the Company's information technology infrastructure services business ("Maintech") and staffing services business in Uruguay ("Lakyfor, S.A.").
Maintech met all of the criteria to classify its assets and liabilities as held for sale in the fourth quarter of fiscal year 2015. The potential disposal of Maintech does not represent a strategic shift that will have a major effect on the Company's operations and financial results and is, therefore, not classified as discontinued operations in accordance with ASU 2014-08. As part of the required evaluation under the held for sale guidance, the Company determined that the approximate fair value less costs to sell the operations exceeded the carrying value of the net assets and no impairment charge was recorded. At November 1, 2015, the Company expects a sale to take place within fiscal year 2016.
Lakyfor, S.A. met all of the criteria to classify its assets and liabilities as held for sale during the fourth quarter of fiscal year 2015. The potential disposal of Lakyfor, S.A. does not represent a strategic shift that will have a major effect on the Company's operations and financial results and is, therefore, not classified as discontinued operations in accordance with ASU 2014-08. As part of the required evaluation under the held for sale guidance, the Company determined that the approximate fair value less costs to sell the operations was significantly lower than the carrying value of the net assets and an impairment charge of $0.7 million was recorded. At November 1, 2015, the Company expects a sale to take place in the first quarter of fiscal year 2016.
F-17
VOLT INFORMATION SCIENCES, INC. AND SUBSIDIARIES
Notes to Consolidated Financial Statements
As of November 1, 2015
The following table reconciles the major classes of assets and liabilities classified as held for sale as part of continuing operations in our Consolidated Balance Sheets (in thousands):
| November 1, 2015 | |
| November 2, 2014 | | ||
Assets included as part of continuing operations |
|
|
| ||||
Cash and cash equivalents | $ | 1,537 | |
| $ | 2,382 | |
Trade accounts receivable, net | 15,671 | |
| 17,150 | | ||
Recoverable income taxes | 165 | |
| 140 | | ||
Prepaid insurance and other assets | 4,886 | |
| 6,009 | | ||
Property, equipment and software, net | 189 | |
| 748 | | ||
Purchased intangible assets | 495 | |
| 1,549 | | ||
Total major classes of assets as part of continuing operations - Maintech and Lakyfor, S.A. | 22,943 | |
| 27,978 | | ||
Other assets included as part of discontinued operations - Computer Systems | - | |
| 24,220 | | ||
Total assets of the disposal group classified as held for sale in the Consolidated Balance Sheets | $ | 22,943 | |
| $ | 52,198 | |
|
|
|
| ||||
Liabilities included as part of continuing operations |
|
|
| ||||
Accrued compensation | $ | 3,509 | |
| $ | 3,511 | |
Accounts payable | 1,387 | |
| 1,557 | | ||
Accrued taxes other than income taxes | 1,165 | |
| 1,114 | | ||
Accrued insurance and other | 523 | |
| 1,379 | | ||
Deferred revenue | 761 | |
| 1,700 | | ||
Total major classes of liabilities as part of continuing operations - Maintech and Lakyfor, S.A. | 7,345 | |
| 9,261 | | ||
Other liabilities included as part of discontinued operations - Computer Systems | - | |
| 19,126 | | ||
Total liabilities of the disposal group classified as held for sale in the Consolidated Balance Sheets | $ | 7,345 | |
| $ | 28,387 | |
NOTE 4: Restricted Cash
Restricted cash includes amounts related to requirements under certain contracts with managed service program customers for whom the Company manages the customers' contingent staffing requirements, including processing of associate vendor billings into single, combined customer billings and distribution of payments to associate vendors on behalf of customers, as well as minimum cash deposits required to be maintained as collateral associated with the Company's Short-Term Credit Facility through the first quarter of fiscal year 2015. Distribution of payments to associate vendors are generally made shortly after receipt of payment from customers, with undistributed amounts included in Restricted Cash and Accounts Payable between receipt and distribution of these amounts. Changes in restricted cash collateral for credit facilities are reflected in financing activities while changes in restricted cash under managed service programs are classified as an operating activity, as this cash is directly related to the operations of this business.
At November 1, 2015 and November 2, 2014 restricted cash included $9.3 million and $16.4 million , respectively, restricted for payment to associate vendors and $0.9 million and $0.1 million , respectively, restricted for other collaterized accounts. In addition, $10.4 million was restricted as collateral under the Short-Term Credit Facility at November 2, 2014.
F-18
NOTE 5: Fair Value of Financial Instruments
| November 1, 2015 |
| November 2, 2014 |
| Fair Value Hierarchy | ||||
Short-term investments | $ | 4,799 | |
| $ | 5,543 | |
| Level 1 |
Note receivable | 8,756 | |
| - | |
| Level 2 | ||
Total financial assets | $ | 13,555 | |
| $ | 5,543 | |
|
|
Deferred compensation plan liabilities | $ | 4,683 | |
| $ | 5,439 | |
| Level 1 |
Total financial liabilities | $ | 4,683 | |
| $ | 5,439 | |
|
|
Short-term investments also include available for sale securities of $0.1 million at November 1, 2015 and November 2, 2014.
The Company received proceeds from the sale of the Computer Systems segment in the form of a note receivable of $10.0 million from NewNet. The note was valued at $8.4 million on the transaction date based on an imputed interest rate of 5.0% that reflected the market rate for corporate bond yields of a non-speculative, medium credit-quality investment. The resulting discount is amortized over four years. As of November 1, 2015, there were no adjustments required.
The fair value of the deferred compensation plan liabilities is based on the fair value of the investments corresponding to the employees' investment selections, primarily in mutual funds, based on quoted prices in active markets for identical assets. The deferred compensation plan liabilities is recorded in Accrued Compensation in the Consolidated Balance Sheets.
The Company has a term loan with borrowings at a fixed interest rate, and our interest expense related to this borrowing is not affected by changes in interest rates in the near term. The fair value of the term loan was calculated by applying the appropriate fiscal year-end interest rates to our present streams of loan payments.
The following table presents the term loan measured at fair value (in thousands):
| November 1, 2015 |
|
| ||||||
| Carrying Amount |
| Estimated Fair Value |
| Fair Value Hierarchy | ||||
Long-Term Debt, including current portion | $ | 7,295 | |
| $ | 7,968 | |
| Level 2 |
|
|
|
|
|
| ||||
| November 2, 2014 |
|
| ||||||
Long-Term Debt, including current portion | $ | 8,127 | |
| $ | 9,012 | |
| Level 2 |
There have been no changes in the methodology used to fair value the financial instruments as well as no transfers between levels during the fiscal years ended November 1, 2015 and November 2, 2014.
NOTE 6: Trade Accounts Receivable
Trade accounts receivable includes both billed and unbilled amounts due from customers. Billed trade receivables generally do not bear interest and are recorded at the amount invoiced less amounts for which revenue has been deferred because customer arrangements are not finalized. Unbilled receivables represent accrued revenue earned and recognized on contracts for which billings have not yet been presented to the customer. At November 1, 2015 and November 2, 2014 trade accounts receivable included unbilled receivables of $14.5 million and $12.4 million , respectively.
The Company maintains an allowance for doubtful accounts for estimated losses inherent in its accounts receivable portfolio. In establishing the required allowance, management considers historical losses adjusted to take into account current market conditions, customers' financial condition, and current receivable aging and payment patterns. Additions to the allowance for doubtful accounts are recorded to Selling, Administrative and Other Operating Costs. The Company also maintains a sales allowance for specific customers related to volume discounts and billing disputes. The amount of the sales allowance is determined based on discount estimates and historical credits issued and additions to the sales allowance are recorded as a
F-19
VOLT INFORMATION SCIENCES, INC. AND SUBSIDIARIES
Notes to Consolidated Financial Statements
As of November 1, 2015
reduction to net revenue. Account balances are written off against the allowances when the Company believes it is probable the amount will not be received.
| Balance at beginning of year |
| Provision / (Release) |
| Deductions |
| Balance at end of year | ||||||||
Year Ended November 1, 2015: |
|
|
|
|
|
|
| ||||||||
Sales allowance | $ | 318 | |
| $ | 164 | |
| $ | - | |
| $ | 482 | |
Allowance for doubtful accounts | 547 | |
| 368 | |
| (437 | ) |
| 478 | | ||||
Total | $ | 865 | |
| $ | 532 | |
| $ | (437 | ) |
| $ | 960 | |
|
|
|
|
|
|
|
| ||||||||
| Balance at beginning of year |
| Provision / (Release) |
| Deductions |
| Balance at end of year | ||||||||
Year Ended November 2, 2014: |
|
|
|
|
|
|
| ||||||||
Sales allowance | $ | 319 | |
| $ | (1 | ) |
| $ | - | |
| $ | 318 | |
Allowance for doubtful accounts | 1,370 | |
| (130 | ) |
| (693 | ) |
| 547 | | ||||
Total | $ | 1,689 | |
| $ | (131 | ) |
| $ | (693 | ) |
| $ | 865 | |
NOTE 7: Property, Equipment and Software
| November 1, 2015 |
| November 2, 2014 | ||||
Land and buildings | $ | 22,475 | |
| $ | 23,306 | |
Machinery and equipment | 39,890 | |
| 66,228 | | ||
Leasehold improvements | 8,843 | |
| 9,948 | | ||
Less: Accumulated depreciation and amortization | (58,821 | ) |
| (86,217 | ) | ||
Property and equipment | 12,387 | |
| 13,265 | | ||
Software | 77,578 | |
| 76,796 | | ||
Less: Accumulated amortization | (65,870 | ) |
| (64,505 | ) | ||
Property, equipment, and software, net | $ | 24,095 | |
| $ | 25,556 | |
Depreciation and amortization expense totaled $6.8 million , $9.2 million and $10.9 million for the fiscal years ended 2015, 2014 and 2013, respectively. Depreciation and amortization is included in Direct Cost of Staffing Services Revenue, Cost of Other Revenue and Selling, Administrative and Other Operating Costs in the Consolidated Statements of Operations.
NOTE 8: Impairment and Restructuring Charges
Impairment of Net Assets
During fiscal 2015, in conjunction with the initiative to exit certain non-core operations, the telephone directory publishing and printing business in Uruguay met the criteria to be classified as held for sale. As part of the required evaluation under the held for sale guidance, the Company determined that the approximate fair value less costs to sell the operations was significantly lower than the carrying value of the net assets. Consequently, the net assets of the business of $2.8 million were fully impaired and were recorded as an impairment charge. On July 31, 2015, the Company completed the sale of our telephone directory publishing and printing business in Uruguay to affiliates of FCR Media Group.
F-20
VOLT INFORMATION SCIENCES, INC. AND SUBSIDIARIES
Notes to Consolidated Financial Statements
As of November 1, 2015
As previously disclosed in Footnote 3, an impairment charge of $0.7 million was recognized as a result of the required evaluation under the held for sale guidance related to the staffing reporting unit in Uruguay ("Lakyfor, S.A.").
Impairment of Property, Equipment and Software
In an effort to reduce operating costs, the Company is evaluating the efficiency of our current business delivery model, supply chain and back office support functions in light of existing and ongoing business requirements. The implementation of additional technology tools is expected to provide operating leverage and efficiencies. During the third quarter of fiscal year 2015, as a result of this evaluation, it was determined that $1.9 million of previously capitalized internally developed software within the Staffing segment was impaired as it was no longer expected to provide future value in light of the anticipated technology upgrade. The remaining book value of this asset was $0.7 million as of November 1, 2015 and is expected to be recovered from existing and future technology projects.
Impairment of Goodwill
The Company performs its annual impairment test for goodwill during the second quarter of the fiscal year and when a triggering event occurs between annual impairment tests. Goodwill impairment is determined using a two-step process. The first step of the goodwill impairment test is to identify potential impairment by comparing the fair value of a reporting unit with its net book value (or carrying amount), including goodwill. The second step of the goodwill impairment test compares the implied fair value of the reporting unit's goodwill with the carrying amount of that goodwill. If the carrying amount of the reporting unit's goodwill exceeds the implied fair value of that goodwill, an impairment loss is recognized in an amount equal to that excess.
Based on the result of the first step of the goodwill impairment analysis, the Company determined that the fair value of Lakyfor, S.A. was less than its carrying value as of May 3, 2015 and, as such, the Company applied the second step of the goodwill impairment test to this reporting unit. The fair value of the reporting unit was determined using an income approach. The income approach uses projections of estimated operating results and cash flows discounted using a weighted-average cost of capital. The approach uses management's best estimates of economic and market conditions over the projected period, including growth rates in sales, costs, estimates of future expected changes in operating margins and cash expenditures. Other significant estimates and assumptions include terminal value growth rates, future estimates of capital expenditures and changes in future working capital requirements. The Company determined that the ongoing value of the business based on historical and future levels would not support the carrying value of goodwill. Based on the result of the second step of the goodwill impairment analysis, the Company recorded a $1.0 million non-cash charge to reduce the entire carrying value of goodwill during the second quarter of fiscal year 2015.
As a result of changes in executive management and the establishment of significant strategic initiatives impacting Volt Europe's operations, the Company performed a Step 1 analysis of the goodwill impairment test in the fourth quarter of fiscal year 2015 to provide assurance that the unit's balance sheet reflects the current expectations for the unit. The Company utilized a combination of the Income and Market Approaches to estimate the Total Enterprise Value ("TEV") of Volt Europe. A discounted cashflow ("DCF") analysis was used for the income approach while the market approach consisted of a calculation of the fair value of the business enterprise of the reporting unit based on market multiples, as appropriate. Determining fair value requires significant judgment concerning the assumptions used in the valuation model, including discount rates, the amount and timing of expected future cash flows and, growth rates, as well as relevant comparable company earnings multiples for the market-based approach including the determination of whether a premium or discount should be applied to those comparables. The cash flows employed in the DCF analysis are based on management's most recent budgets and business plans and when applicable, various growth rates have been assumed for years beyond the current business plan periods. Any forecast contains a degree of uncertainty and modifications to these cash flows could significantly increase or decrease the fair value of a reporting unit. In determining which discount rate to utilize, management determines the appropriate weighted average cost of capital ("WACC"). Management considers many factors in selecting a WACC, including the market view of risk for each individual reporting unit, the appropriate capital structure and the appropriate borrowing rates for each reporting unit. The selection of a WACC is subjective and modification to this rate could significantly increase or decrease the fair value of a reporting unit. As a result of this Step 1 analysis of Volt Europe's goodwill, the TEV exceeded the carrying value indicating no impairment.
F-21
VOLT INFORMATION SCIENCES, INC. AND SUBSIDIARIES
Notes to Consolidated Financial Statements
As of November 1, 2015
| Staffing Services | ||||||
| 2015 |
| 2014 | ||||
Aggregate goodwill acquired | $ | 10,483 | |
| $ | 10,469 | |
Accumulated impairment losses | (3,733 | ) |
| (2,756 | ) | ||
Foreign currency translation adjustment | (315 | ) |
| 14 | | ||
Reclassified as held for sale 1 | - | |
| (1,054 | ) | ||
Goodwill, net of impairment losses | $ | 6,435 | |
| $ | 6,673 | |
1 Goodwill related to Lakyfor, SA was impaired in the second quarter of fiscal year 2015 prior to the determination as held for sale in the fourth quarter of fiscal year 2015.
Restructuring
From time to time, the Company has undertaken operational restructuring and other cost reduction actions to streamline processes and manage costs throughout various departments within the Company. For the years ended November 1, 2015, November 2, 2014 and November 3, 2013, restructuring charges were $3.6 million , $2.5 million and $0.8 million , respectively, related primarily to severance payments to executive management in fiscal 2015 and reductions in workforce in fiscal years 2015, 2014 and 2013.
NOTE 9: Accrued Insurance
(a) | Casualty Insurance Program |
Workers' compensation insurance is purchased through mandated participation in certain state funds, and the experience-rated premiums in these state plans relieve the Company of any additional liability. Liability for workers' compensation in all other states as well as automobile and general liability is insured under a retrospective experience-rated insurance program for losses exceeding specified deductible levels and the Company is self-insured for losses below the specified deductible limits.
The Company makes payments based upon an estimate of the ultimate underlying exposure, such as the amount and type of labor utilized. The amounts are subsequently adjusted based on actual claims experience. The experience modification process includes establishing loss development factors, based on the Company's historical claims experience as well as industry experience, and applying those factors to current claims information to derive an estimate of the Company's ultimate claims liability. Adjustments to final paid amounts are determined as of a future date, and depending on the policy year, up to three or four years after the end of the respective policy year, using actual claims paid and incurred. Under the insurance program, any losses incurred above the policy deductible limit arising from claims associated with an insurance policy are absorbed by the insurer and not the Company.
In October 2015, the Company converted three of the four open policy years to a paid loss retro program secured by a letter of credit against the Company's Financing Program of $25.1 million . Under this program, the Company will make payments based on actual claims paid instead of pre-funding an estimate of the ultimate loss exposure. The change from an incurred loss program to a paid loss program returned cash collateral of approximately $22.0 million to the Company for the converted policy years, which was treated as a source of net cash provided by operating activities.
The Company recognizes expense and establishes accruals for amounts estimated to be incurred up to the policy deductible, both reported and not yet reported, policy premiums and related legal and other costs. The Company develops estimates for losses incurred but not yet reported using actuarial principles and assumptions based on historical and projected claim incidence patterns, claim size and the length of time over which payments are expected to be made. Actuarial estimates are updated as loss experience develops, additional claims are reported or settled and new information becomes available. Any changes in estimates are reflected in operating results in the period in which the estimates are changed. Expense recognized by the Company under its casualty insurance program amounted to $14.4 million , $15.0 million and $15.5 million in fiscal years 2015, 2014 and 2013, respectively.
F-22
VOLT INFORMATION SCIENCES, INC. AND SUBSIDIARIES
Notes to Consolidated Financial Statements
As of November 1, 2015
(b) | Medical Insurance Programs |
The Company is self-insured for a portion of its medical benefit programs for its employees. Eligible contingent staff on assignment with customers are offered medical benefits through a fully insured program administered by a third-party. Employees contribute a portion of the cost of these medical benefit programs.
The liability for the self-insured medical benefits is limited on a per claimant basis through the purchase of stop-loss insurance. The Company's retained liability for the self-insured medical benefits is determined utilizing actuarial estimates of expected claims based on statistical analysis of historical data. Amounts contributed by employees and additional amounts necessary to fund the self-insured program administered by the third party are transferred to a 501(c)(9) employee welfare benefit trust. Accordingly, these amounts, other than the current liabilities for the employee contributions and expected claim amounts not yet remitted to the trust, do not appear on the Consolidated Balance Sheets of the Company. The Company records the expense associated with the expected losses, net of employee contributions, in Direct Cost of Staffing Services Revenue, Cost of Other Revenue, or Selling, Administrative and Other Operating Costs, depending on the employee's role. Expense recognized by the Company under its self-insured medical benefit programs amounted to $8.5 million , $12.0 million and $12.0 million in fiscal years 2015, 2014 and 2013, respectively.
NOTE 10: Income Taxes
Income (loss) from continuing operations before income taxes is derived from (in thousands):
| Year ended | ||||||||||
| November 1, 2015 |
| November 2, |
| November 3, | ||||||
U.S. Domestic | $ | (63,205 | ) |
| $ | (2,148 | ) |
| $ | (8,970 | ) |
International | 48,065 | |
| 3,987 | |
| (851 | ) | |||
Total | $ | (15,140 | ) |
| $ | 1,839 | |
| $ | (9,821 | ) |
| Year ended | ||||||||||
| November 1, |
| November 2, |
| November 3, | ||||||
Current: |
|
|
|
|
| ||||||
U.S. Federal | $ | 90 | |
| $ | (36 | ) |
| $ | (146 | ) |
U.S. State and local | (1,616 | ) |
| 978 | |
| (162 | ) | |||
International | 5,200 | |
| 1,996 | |
| 3,129 | | |||
Total current | $ | 3,674 | |
| $ | 2,938 | |
| $ | 2,821 | |
Deferred: |
|
|
|
|
| ||||||
U.S. Federal | $ | - | |
| $ | - | |
| $ | - | |
U.S. State and local | 634 | |
| 225 | |
| - | | |||
International | 338 | |
| 2,063 | |
| 101 | | |||
Total deferred | 972 | |
| 2,288 | |
| 101 | | |||
Income tax expense | $ | 4,646 | |
| $ | 5,226 | |
| $ | 2,922 | |
F-23
VOLT INFORMATION SCIENCES, INC. AND SUBSIDIARIES
Notes to Consolidated Financial Statements
As of November 1, 2015
The difference between the income tax provision on income (loss) and the amount computed at the U.S. federal statutory rate is due to (in thousands):
| Year ended | ||||||||||
| November 1, |
| November 2, |
| November 3, | ||||||
U.S. federal statutory rate | $ | (5,299 | ) |
| $ | 643 | |
| $ | (3,437 | ) |
U.S. State income tax, net of U.S. federal tax benefits | (1,435 | ) |
| 530 | |
| (1,336 | ) | |||
International permanent differences | (4,293 | ) |
| (489 | ) |
| 320 | | |||
International tax rate differentials | (7,046 | ) |
| 345 | |
| (364 | ) | |||
U.S. tax on international income | (1,118 | ) |
| 1,787 | |
| 554 | | |||
General business credits | (3,839 | ) |
| (5,642 | ) |
| (4,977 | ) | |||
Meals and entertainment | 531 | |
| 770 | |
| 941 | | |||
Other, net | 942 | |
| (294 | ) |
| 1,686 | | |||
Change in valuation allowance for dispositions | (4,237 | ) |
| - | |
| - | | |||
Change in valuation allowance for deferred tax assets | 30,440 | |
| 7,576 | |
| 9,535 | | |||
Total | $ | 4,646 | |
| $ | 5,226 | |
| $ | 2,922 | |
Deferred income taxes reflect the net tax effects of temporary differences between the carrying amounts of assets and liabilities for financial reporting purposes and the amounts used for income tax purposes, and also include operating loss carryforwards.
F-24
VOLT INFORMATION SCIENCES, INC. AND SUBSIDIARIES
Notes to Consolidated Financial Statements
As of November 1, 2015
| November 1, 2015 |
| November 2, 2014 | ||||
Deferred tax assets: |
|
|
| ||||
Net operating loss carryforwards | $ | 58,909 | |
| $ | 58,708 | |
Capital loss carryforwards | 31,411 | |
| - | | ||
U.S. federal tax credit carryforwards | 41,271 | |
| 35,364 | | ||
Purchased intangible assets | (49 | ) |
| 11,152 | | ||
Deferred income | - | |
| 3,482 | | ||
Compensation accruals | 5,653 | |
| 5,995 | | ||
Other, net | 6,413 | |
| 6,230 | | ||
Total deferred tax assets | 143,608 | |
| 120,931 | | ||
Less valuation allowance | (136,323 | ) |
| (108,403 | ) | ||
Deferred tax assets, net | $ | 7,285 | |
| $ | 12,528 | |
|
|
|
| ||||
Deferred tax liabilities: |
|
|
| ||||
Unremitted earnings from foreign subsidiaries | $ | 4,046 | |
| $ | 8,714 | |
Software development costs | 2,794 | |
| 175 | | ||
Accelerated tax depreciation and amortization | 741 | |
| 2,677 | | ||
Other, net | 1,225 | |
| 1,877 | | ||
Total deferred tax liabilities | $ | 8,806 | |
| $ | 13,443 | |
Net deferred tax asset (liability) | $ | (1,521 | ) |
| $ | (915 | ) |
|
|
|
| ||||
Balance sheet classification |
|
|
| ||||
Current assets | $ | 837 | |
| $ | 320 | |
Non-current assets | 1,107 | |
| 2,865 | | ||
Current liabilities | (240 | ) |
| (2,904 | ) | ||
Non-current liabilities | (3,225 | ) |
| (1,196 | ) | ||
Net deferred tax asset (liability) | $ | (1,521 | ) |
| $ | (915 | ) |
Current deferred tax assets are included in Other Current Assets, non-current deferred tax assets are included in Prepaid Insurance and Other Assets and current deferred tax liabilities are included in Accrued Insurance and Other in the Consolidated Balance Sheets.
At November 1, 2015, the Company has available unused U.S. federal net operating loss ("NOL") carryforwards of $133.6 million , U.S. state NOL carryforwards of $186.1 million , international NOL carryforwards of $9.6 million and capital loss carryforwards of $82.3 million . As of November 1, 2015, the U.S. federal NOL carryforwards will expire at various dates between 2031 and 2035, the U.S. state NOL carryforwards expire at various dates between 2020 and 2035, the international NOL carryforwards expire at various dates beginning 2016 with some indefinite and capital loss carryforwards expire in 2021. At November 1, 2015, the undistributed earnings of the Company's non-U.S. subsidiaries are not intended to be permanently invested outside of the U.S. and therefore U.S. deferred taxes have been provided.
A valuation allowance has been recognized due to the uncertainty of realization of the loss carryforwards and other deferred tax assets. Beginning in fiscal year 2010, the Company's cumulative U.S. domestic and certain non-U.S. results for each three -year period were a loss. Accordingly, the Company recorded a full valuation allowance against its net U.S. domestic and certain net non-U.S. deferred tax assets as a non-cash charge to income tax expense. The three-year cumulative loss continued in fiscal years 2013, 2014, and 2015 so the Company maintained a full valuation allowance against its net U.S. domestic and certain net non-U.S. deferred tax assets resulting in a total valuation allowance of $136.3 million and $108.4 million for fiscal 2015 and fiscal 2014, respectively. In reaching this conclusion, the Company considered the U.S. domestic demand and recent operating losses causing the Company to be in a three-year cumulative loss position . Management believes that the remaining deferred tax assets, primarily related to international locations, are more likely than not to be realized based upon consideration of all
F-25
VOLT INFORMATION SCIENCES, INC. AND SUBSIDIARIES
Notes to Consolidated Financial Statements
As of November 1, 2015
positive and negative evidence, including scheduled reversal of deferred tax liabilities and tax planning strategies determined on a jurisdiction by jurisdiction basis.
| November 1, 2015 |
| November 2, | ||||
Balance, beginning of year | $ | 7,329 | |
| $ | 8,459 | |
Decrease related to current year tax provisions | (411 | ) |
| (458 | ) | ||
Settlements | (879 | ) |
| - | | ||
Lapse of statute of limitations | (824 | ) |
| (672 | ) | ||
Total | $ | 5,215 | |
| $ | 7,329 | |
Of the total unrecognized tax benefits at November 1, 2015 and November 2, 2014, approximately $1.1 million and $2.8 million , respectively, would affect the Company's effective income tax rate, if and when recognized in future years. The amount accrued for related potential interest and penalties at November 1, 2015 and November 2, 2014 was $1.3 million and $2.2 million . The Company does not currently anticipate that its existing reserves related to uncertain tax positions as of November 1, 2015 will significantly increase or decrease in subsequent periods; however, various events could cause the Company's current expectations to change in the future.
The Company is subject to taxation at the federal, state and local level in the U.S. and in various international jurisdictions. With few exceptions, the Company is generally no longer subject to examination by the U.S. federal, state, local or non-U.S. income tax authorities for years before fiscal 2004. The Company is currently under examination by the IRS for U.S. Federal amended income tax returns for fiscal years 2004 – 2010 . The Company is currently under examination by the Canada Revenue Authority for tax years 2007 - 2010 . These audits are not expected to result in a material impact on the Company's financial statements.
United States - Federal | 2004-present |
United States - State | 2004-present |
Canada | 2007-present |
United Kingdom | 2011-present |
F-26
VOLT INFORMATION SCIENCES, INC. AND SUBSIDIARIES
Notes to Consolidated Financial Statements
As of November 1, 2015
NOTE 11: Debt
(a) | Credit Facilities |
At November 1, 2015 and November 2, 2014, the Company had outstanding borrowings of $100.0 million and $128.5 million , respectively, under various credit facilities.
i) Financing Program
On August 1, 2015, the Company entered into a one -year, $150.0 million Financing Program with PNC Bank, National Association ("PNC") which expires on July 28, 2016, subject to early renewal or extension. The Financing Program is secured by receivables from certain Staffing Services businesses in the United States, Europe and Canada that are sold to a wholly-owned, consolidated, bankruptcy remote subsidiary. The bankruptcy remote subsidiary's sole business consists of the purchase of the receivables and subsequent granting of a security interest to PNC under the program, and its assets are available first to satisfy obligations to PNC and are not available to pay creditors of the Company's other legal entities. Borrowing capacity under the Financing Program is directly impacted by the level of accounts receivable. At November 1, 2015, the accounts receivable borrowing base was $160.8 million . The new Financing Program replaced our previous short-term financing program with PNC. The financing fees incurred will be amortized through July 2016 and the proceeds from the new program were used to satisfy the outstanding balance under the previous program.
The Financing Program has a feature under which the facility limit can be increased from $150.0 million up to $250.0 million subject to credit approval from PNC. Borrowings are priced based upon a fixed program rate plus the daily adjusted one-month LIBOR index, as defined. The program also contains a revolving credit provision under which proceeds can be drawn for a definitive tranche period of 30, 60, 90 or 180 days priced at the adjusted LIBOR index rate in effect for that period. In addition to United States dollars, drawings can be denominated in Canadian dollars, subject to a Canadian dollar $30.0 million limit, and British Pounds Sterling, subject to a £20.0 million limit. The new program also includes a letter of credit sublimit of $50.0 million and minimum borrowing requirements. As of November 1, 2015, there were no foreign currency denominated borrowings, and the letter of credit participation for the Company's casualty insurance program was $25.1 million .
In addition to customary representations, warranties and affirmative and negative covenants, the program is subject to interest coverage and minimum liquidity covenants that were effective in the fourth quarter of fiscal year of 2015. The program is subject to termination under certain events including the default rate on receivables, as defined, exceeding a specified threshold or the rate of collections on receivables failing to meet a specified threshold. As of November 1, 2015, the Company was in full compliance with all debt covenant requirements.
The previous short-term financing program provided for a maximum facility limit of $200.0 million , with available borrowing based on eligible receivable levels, supported by a credit agreement secured by receivables from the staffing services business that were sold to a wholly-owned, consolidated, bankruptcy-remote subsidiary and are available first to satisfy the lender. Interest was charged based on a daily adjusted one-month LIBOR index, and the program was also subject to termination under standard events of default as defined.
At November 1, 2015 and November 2, 2014, the Company had outstanding borrowing under these programs of $100.0 million and $120.0 million , respectively, and bore a weighted average annual interest rate of 1.8% and 1.6% , respectively, which is inclusive of certain facility and program fees. At November 1, 2015, there was $35.7 million available under this program.
ii) Short-Term Credit Facility
The Company terminated its $45.0 million Short-Term Credit Facility with Bank of America, N.A., as Administrative Agent, effective June 8, 2015. The Facility was used primarily to hedge the Company's net currency exposure in certain foreign subsidiaries. Borrowings required cash collateral covering 105% of certain baseline amounts, and the facility contained restrictive covenants which limited the cash dividends, capital stock purchases and redemptions. At November 2, 2014, the Company had a foreign currency denominated loan equivalent of $8.5 million and bore a weighted average annual interest rate of 1.8% inclusive of the facility fee. The Company did not designate and document these instruments as hedges under ASC 815 Derivatives and Hedges, and as a result gains and losses associated with these instruments are included in Foreign Exchange Gain (Loss), net in the Consolidated Statements of Operations.
F-27
VOLT INFORMATION SCIENCES, INC. AND SUBSIDIARIES
Notes to Consolidated Financial Statements
As of November 1, 2015
(b) | Term Loan |
At November 1, 2015, the Company has $7.3 million outstanding under a twenty -year fully amortizing loan that matures on October 1, 2021, secured by a deed of trust on certain land and buildings, which bears interest at 8.2% per annum and requires principal and interest payments of $0.4 million per quarter.
| November 1, 2015 |
| November 2, 2014 | ||||
Financing program | $ | 100,000 | |
| $ | - | |
8.2% term loan | 7,295 | |
| 8,127 | | ||
| 107,295 | |
| 8,127 | | ||
Less: amounts due within one year | 982 | |
| 911 | | ||
Total long-term debt | $ | 106,313 | |
| $ | 7,216 | |
Fiscal year | Amount | ||
2016 | $ | 982 | |
2017 | 101,065 | | |
2018 | 1,156 | | |
2019 | 1,254 | | |
2020 | 1,361 | | |
Thereafter | 1,477 | | |
Total | $ | 107,295 | |
NOTE 12: Hedging
From time to time the Company enters into non-derivative financial instruments to hedge its net investment in certain foreign subsidiaries. During fiscal years 2014 through the third quarter of fiscal year 2015, the Company primarily used short-term foreign currency borrowings to hedge its net investments in certain foreign operations.
During fiscal 2015, the Company discontinued the use of short-term foreign currency borrowings for hedging. At November 2, 2014, the Company had outstanding $8.5 million of foreign currency denominated short-term borrowings used to hedge the Company's net investments in certain foreign subsidiaries which were fully satisfied during the first quarter of 2015. The Company does not designate and document these instruments as hedges under ASC 815, Derivatives and Hedging , and as a result gains and losses associated with these instruments are included in Foreign Exchange Gain (Loss), net in our Consolidated Statements of Operations. For fiscal years 2015, 2014 and 2013, net gains/(losses) on these borrowings and instruments of less than $0.1 million , $0.5 million and $0.1 million , respectively, were included in Foreign Exchange Gain (Loss), net in the Consolidated Statements of Operations.
NOTE 13: Stockholders' Equity
(a) Common Stock
Each outstanding share of common stock is entitled to one vote per share on all matters submitted to a vote by shareholders . Subject to the rights of any preferred stock which may from time to time be outstanding, the holders of outstanding shares of common stock are entitled to receive dividends and, upon liquidation or dissolution, are entitled to receive pro rata all assets legally available for distribution to stockholders. No dividends were declared or paid on the common stock during fiscal years 2015, 2014 or 2013. The holders of common stock have no preemptive or other subscription rights and there are no redemption or sinking fund provisions with respect to such shares. There is no preferred stock outstanding.
F-28
VOLT INFORMATION SCIENCES, INC. AND SUBSIDIARIES
Notes to Consolidated Financial Statements
As of November 1, 2015
(b) Treasury Stock
On January 14, 2015, the Board of Directors approved a new 36-month share repurchase program of up to 1,500,000 shares of the Company's common stock to begin on January 19, 2015, replacing a prior program. Such repurchases will be made through open market or private transactions. Share repurchases under the program will be subject to specified parameters and certain price and volume restraints and any repurchased shares will be held in treasury. The exact number and timing of share repurchases will depend upon market conditions and other factors.
In 2015, the Company repurchased 340,800 shares of common stock at an average purchase price of $12.50 per share for an aggregate amount of $4.3 million . As of November 1, 2015, the Company had 1,159,200 shares available for repurchase.
(c) | Comprehensive Income (Loss) |
| Foreign currency gains/(losses) |
| Unrealized gains/(losses) on securities |
| Accumulated other comprehensive income (loss) | ||||||
November 3, 2013 | $ | (5,207 | ) |
| $ | (36 | ) |
| $ | (5,243 | ) |
Net current period other comprehensive income (loss) | (1,158 | ) |
| 1 | |
| (1,157 | ) | |||
November 2, 2014 | $ | (6,365 | ) |
| $ | (35 | ) |
| $ | (6,400 | ) |
Other comprehensive income (loss) before reclassifications | (4,787 | ) |
| 12 | |
| (4,775 | ) | |||
Amounts reclassified from accumulated other comprehensive income (loss) | 3,181 | |
| - | |
| 3,181 | | |||
Current period other comprehensive income (loss) | (1,606 | ) |
| 12 | |
| (1,594 | ) | |||
November 1, 2015 | $ | (7,971 | ) |
| $ | (23 | ) |
| $ | (7,994 | ) |
The Company did not have any significant amounts reclassified out of Accumulated Other Comprehensive Income in 2014.
|
| Year Ended November 1, 2015 |
|
| ||
Foreign currency translation |
|
|
|
| ||
Sale of foreign subsidiaries |
| $ | (3,181 | ) |
|
|
Income tax provision (benefit) |
| - | |
|
| |
Total reclassifications, net of tax |
| $ | (3,181 | ) |
|
|
|
|
|
|
| ||
Details about Accumulated Other Comprehensive Loss Components |
| Amount Reclassified from Accumulated Other Comprehensive Loss |
| Affected Line Item in the Statement Where Net Loss is Presented | ||
Foreign currency translation |
|
|
|
| ||
Sale of foreign subsidiaries |
| $ | 3,181 | |
| Discontinued operations |
NOTE 14: Stock Compensation Plans
2006 Incentive Stock Plan
The shareholders of the Company approved the Volt Information Sciences, Inc. 2006 Incentive Stock Plan ("2006 Plan") in April 2007. The 2006 Plan permits the grant of Incentive Stock Options, Non-Qualified Stock Options, Restricted Stock and Restricted Stock Units related to the Company's common stock to employees and non-employee directors of the Company through September 6, 2016.
F-29
VOLT INFORMATION SCIENCES, INC. AND SUBSIDIARIES
Notes to Consolidated Financial Statements
As of November 1, 2015
The aggregate number of shares that may be issued pursuant to awards made under the 2006 Plan may not exceed 1,500,000 shares and the options will be granted at a price of no less than 100% of the fair market value of the Company's common stock at the date of grant. At November 1, 2015, there were 135,343 shares available for future grants under the 2006 Plan.
During fiscal 2015, the Company granted 393,528 stock options to purchase shares of the Company's common stock and 170,979 restricted share awards. The options expire seven years from the grant date. The weighted average fair value for the restricted shares at the grant date was $9.32 . Compensation expense for shares that were not immediately vested are recognized over the vesting period.
During fiscal 2014, the Company granted 340,000 stock options to purchase shares of the Company's common stock. If certain stock price targets are not met on or prior to July 3, 2017, these options will expire. The closing price for the Company's stock must be no less than certain market targets for ten consecutive trading days for the stock options to be exercisable. These options expire seven years from the grant date. In addition, the Company granted 15,000 shares of the Company's common stock as restricted stock awards. The weighted average fair value for these shares at the grant date was $9.24 . Compensation expense was recognized on the grant date since the shares vested immediately.
As of November 1, 2015, there was $0.2 million of total unrecognized compensation cost related stock options to be recognized over a derived service period of 1.9 years. Additionally, there was $0.2 million of total unrecognized compensation cost related to restricted shares to be recognized over a weighted average period of 1.1 years.
| Stock Options |
| Restricted Stock | |||||||||||||||||
2006 Plan | Number of shares |
| Weighted average exercise price |
| Weighted average contractual life |
| Aggregate Intrinsic Value |
| Number of shares |
| Weighted average grant date fair value | |||||||||
|
|
|
|
| (in years) |
| (in thousands) |
|
|
|
| |||||||||
Outstanding - October 28, 2012 | 537,950 | |
| $6.53 |
| 6.43 | |
| $ | 314 | |
| - | |
| $ | - | | ||
Granted | - | |
| - | |
| - | |
| - | |
| 110,000 | |
| 7.16 | | |||
Expired | (28,700 | ) |
| 6.39 | |
| - | |
| - | |
| - | |
| - | | |||
Forfeited | (25,100 | ) |
| 7.22 | |
| - | |
| - | |
| - | |
| - | | |||
Vested | - | |
| - | |
| - | |
| - | |
| (36,666 | ) |
| 6.25 | | |||
Outstanding - November 3, 2013 | 484,150 | |
| 6.50 | |
| 5.42 | |
| 1,041 | |
| 73,334 | |
| 7.61 | | |||
Granted | 340,000 | |
| 12.59 | |
| - | |
| - | |
| 15,000 | |
| 9.24 | | |||
Expired | (34,600 | ) |
| 6.39 | |
| - | |
| - | |
| - | |
| - | | |||
Forfeited | (25,400 | ) |
| 6.39 | |
| - | |
| - | |
| - | |
| - | | |||
Vested | - | |
| - | |
| - | |
| - | |
| (65,000 | ) |
| 7.97 | | |||
Outstanding - November 2, 2014 | 764,150 | |
| 9.22 | |
| 5.43 | |
| 776 | |
| 23,334 | |
| 7.68 | | |||
Granted | 393,528 | |
| 9.21 | |
| - | |
| - | |
| 170,979 | |
| 9.32 | | |||
Exercised | (83,264 | ) |
| 6.39 | |
| - | |
| - | |
| - | |
| - | | |||
Forfeited | (94,000 | ) |
| 12.49 | |
| - | |
| - | |
| - | |
| - | | |||
Vested | - | |
| - | |
| - | |
| - | |
| (144,154 | ) |
| 9.11 | | |||
Outstanding - November 1, 2015 | 980,414 | |
| $ | 9.14 | |
| 5.31 | |
| $ | 727 | |
| 50,159 | |
| $ | 9.17 | |
Unvested at November 1, 2015 | 86,803 | |
| $ | 8.98 | |
| 6.73 | |
| $ | 1 | |
| 50,159 | |
| $ | 9.17 | |
Vested and unexercisable at November 1, 2015 | 115,000 | |
| $ | 14.00 | |
| 5.67 | |
| $ | - | |
|
|
|
| |||
Exercisable at November 1, 2015 | 778,611 | |
| $ | 8.45 | |
| 5.10 | |
| $ | 727 | |
|
|
|
| |||
F-30
VOLT INFORMATION SCIENCES, INC. AND SUBSIDIARIES
Notes to Consolidated Financial Statements
As of November 1, 2015
Determining Fair Value
The Company estimates the fair value of each stock option grant using the Black-Scholes option-pricing model and Monte Carlo simulation when applicable. The Black-Scholes option pricing model requires estimates of key assumptions based on both historical information and management judgment regarding market factors and trends.
Expected volatility - We developed the expected volatility by using weighted average measures of the historical volatilities of the Company and its peer group of companies that were re-levered according to the Company's capital structure for a period equal to the expected life of the option.
Expected term - We derived our expected term assumption based on the key factors of each grant. The Company utilizes both the contractual term of an option and the simplified method, which results in an expected term based on the midpoint between the vesting date and contractual term of an option.
Risk-free interest rate - The rates are based on the average yield of a U.S. Treasury bond whose term was consistent with the expected life of the stock options.
Expected dividend yield - We have not paid and do not anticipate paying cash dividends on our shares of common stock; therefore, the expected dividend yield was assumed to be zero.
| November 1, 2015 | November 2, 2014 | ||||
Weighted-average fair value of stock option granted | $ | 2.97 | | $ | 3.21 | |
Expected volatility | 40.0 | % | 48.0 | % | ||
Expected term (in years) | 4.67 | | 7.00 | | ||
Risk-free interest rate | 1.53 | % | 2.25 | % | ||
Expected dividend yield | 0.0 | % | 0.0 | % | ||
| Year ended | ||||||||||
| November 1, 2015 |
| November 2, |
| November 3, | ||||||
2006 Stock Incentive Plan |
|
|
|
|
| ||||||
Selling, administrative and other operating costs | $ | 2,906 | |
| $ | 1,198 | |
| $ | 416 | |
Total | $ | 2,906 | |
| $ | 1,198 | |
| $ | 416 | |
F-31
VOLT INFORMATION SCIENCES, INC. AND SUBSIDIARIES
Notes to Consolidated Financial Statements
As of November 1, 2015
NOTE 15: Earnings (Loss) Per Share
| Year ended | ||||||||||
| November 1, 2015 |
| November 2, |
| November 3, | ||||||
Numerator |
|
|
|
|
| ||||||
Loss from continuing operations | $ | (19,786 | ) |
| $ | (3,387 | ) |
| $ | (12,743 | ) |
Loss from discontinued operations, net of income taxes | (4,834 | ) |
| (15,601 | ) |
| (18,132 | ) | |||
Net loss | $ | (24,620 | ) |
| $ | (18,988 | ) |
| $ | (30,875 | ) |
|
|
|
|
|
| ||||||
Denominator |
|
|
|
|
| ||||||
Basic weighted average number of shares | 20,816 | |
| 20,863 | |
| 20,826 | | |||
Dilutive weighted average number of shares | 20,816 | |
| 20,863 | |
| 20,826 | | |||
|
|
|
|
|
| ||||||
Per Share Data: |
|
|
|
|
| ||||||
Basic: |
|
|
|
|
| ||||||
Loss from continuing operations | $ | (0.95 | ) |
| $ | (0.16 | ) |
| $ | (0.61 | ) |
Loss from discontinued operations, net of income taxes | (0.23 | ) |
| (0.75 | ) |
| (0.87 | ) | |||
Net loss | $ | (1.18 | ) |
| $ | (0.91 | ) |
| $ | (1.48 | ) |
|
|
|
|
|
| ||||||
Diluted: |
|
|
|
|
| ||||||
Loss from continuing operations | $ | (0.95 | ) |
| $ | (0.16 | ) |
| $ | (0.61 | ) |
Loss from discontinued operations, net of income taxes | (0.23 | ) |
| (0.75 | ) |
| (0.87 | ) | |||
Net loss | $ | (1.18 | ) |
| $ | (0.91 | ) |
| $ | (1.48 | ) |
Options to purchase 980,414 , 764,150 and 491,650 shares of the Company's common stock were outstanding at November 1, 2015, November 2, 2014 and November 3, 2013, respectively. Additionally, there were 50,159 restricted shares outstanding at November 1, 2015, 15,000 restricted shares outstanding at November 2, 2014 and 73,334 restricted shares outstanding November 3, 2013. The options and restricted shares were not included in the computation of diluted loss per share in fiscal 2015, 2014 and 2013 because the effect of their inclusion would have been anti-dilutive as a result of the Company's net loss position in those fiscal years.
NOTE 16: Related Party Transactions
During fiscal years 2015, 2014 and 2013, the law firm of which Lloyd Frank, a former member of the Company's Board of Directors (until May 2015) is counsel, rendered services to the Company in the amount of $1.1 million , $1.2 million and $2.5 million , respectively. During fiscal years 2015, 2014 and 2013 the Company paid $0.1 million , $0.1 million and $0.1 million , respectively, to Michael Shaw, Ph.D., son of Jerry Shaw, Executive Officer, and brother of Steven Shaw, the Company's former Chief Executive Officer and Director, for services rendered to the Company. In addition, during fiscal 2015 the Company paid $0.1 million in connection with a settlement agreement dated March 30, 2015 with Glacier Peak Capital LLC and certain of its affiliates, an investment firm of which the President and Senior Portfolio Manager, John C. Rudolf, serves on the Company's Board of Directors.
F-32
VOLT INFORMATION SCIENCES, INC. AND SUBSIDIARIES
Notes to Consolidated Financial Statements
As of November 1, 2015
NOTE 17: Commitments and Contingencies
(a) | Leases |
Fiscal year: | Amount | | |
2016 | $ | 13,884 | |
2017 | 11,378 | | |
2018 | 8,781 | | |
2019 | 6,518 | | |
2020 | 4,602 | | |
Thereafter | 6,968 | | |
Many of the leases also require the Company to pay and contribute to property taxes, insurance and ordinary repairs and maintenance. The lease agreements, which expire at various dates through 2025 , may be subject in some cases to renewal options, early termination options or escalation clauses.
Rent expense for all operating leases for fiscal years 2015, 2014 and 2013 was $15.6 million , $16.2 million , and $15.0 million , respectively.
(b) | Legal Proceedings |
The Company is involved in various claims and legal actions arising in the ordinary course of business. The Company's loss contingencies not discussed elsewhere consist primarily of claims and legal actions arising in the normal course of business related to contingent worker employment matters in the Staffing Services segment. These matters are at varying stages of investigation, arbitration or adjudication. The Company has accrued for losses on individual matters that are both probable and reasonably estimable.
Estimates are based on currently available information and assumptions. Significant judgment is required in both the determination of probability and the determination of whether a matter is reasonably estimable. The Company's estimates may change and actual expenses could differ in the future as additional information becomes available.
NOTE 18: Subsequent Events
In November 2015, the Company implemented a cost reduction plan and estimates that it will incur restructuring charges of approximately $3.0 million throughout fiscal 2016, primarily resulting from a reduction in workforce in conjunction with facility consolidation and lease termination costs.
In December 2015, the Company completed the disposition of Lakyfor, S.A. for a nominal sale price.
In January 2016, the Company amended its Financing Program with PNC to extend the termination date from July 28, 2016 to January 31, 2017. The interest coverage ratio covenant included in the previous agreement was eliminated and replaced with a modified liquidity level requirement. The minimum funding threshold was reduced from 60% to 40% . In addition, the new agreement's applicable pricing was increased from a LIBOR based rate plus 1.75% to a LIBOR based rate plus 1.90% on outstanding borrowings and the facility fee increased from 0.65% to 0.70% . As of November 1, 2015, the Financing Program was classified as long-term debt on the Consolidated Balance Sheet. However, at the end of the Company's fiscal first quarter 2016, the Financing Program will be classified as short-term as the termination date is within twelve months of the Company's first quarter 2016 balance sheet date.
F-33
VOLT INFORMATION SCIENCES, INC. AND SUBSIDIARIES
Notes to Consolidated Financial Statements
As of November 1, 2015
NOTE 19: Segment Disclosures
The Company's operating segments are determined in accordance with the Company's internal management structure, which is based on operating activities. The Company is currently assessing potential changes to its reportable segments in fiscal 2016 based on the new management organization and the changes anticipated by implementing new business strategies, including the initiatives to exit non-strategic and non-core operations.
| For the year ended November 1, 2015 | ||||||||||
| Total |
| Staffing Services |
| Other | ||||||
Net Revenue | $ | 1,496,897 | |
| $ | 1,406,809 | |
| $ | 90,088 | |
Expenses |
|
|
|
|
| ||||||
Direct cost of staffing services revenue | 1,192,992 | |
| 1,192,992 | |
| - | | |||
Cost of other revenue | 77,231 | |
| - | |
| 77,231 | | |||
Selling, administrative and other operating costs | 208,657 | |
| 194,652 | |
| 14,005 | | |||
Restructuring costs | 1,193 | | | 1,102 | |
| 91 | | |||
Impairment charges | 6,626 | |
| 3,779 | |
| 2,847 | | |||
Segment operating income (loss) | 10,198 | |
| 14,284 | |
| (4,086 | ) | |||
Corporate general and administrative | 20,516 | |
|
|
|
| |||||
Corporate restructuring | 2,442 | |
|
|
|
| |||||
Operating loss | (12,760 | ) |
|
|
|
| |||||
Other income (expense), net | (2,380 | ) |
|
|
|
| |||||
Loss from continuing operations before income taxes | $ | (15,140 | ) |
|
|
|
| ||||
| For the year ended November 2, 2014 | ||||||||||
| Total |
| Staffing Services |
| Other | ||||||
Net Revenue | $ | 1,710,028 | |
| $ | 1,599,046 | |
| $ | 110,982 | |
Expenses |
|
|
|
|
| ||||||
Direct cost of staffing services revenue | 1,359,048 | |
| 1,359,048 | |
| - | | |||
Cost of other revenue | 92,440 | |
| - | |
| 92,440 | | |||
Selling, administrative and other operating costs | 231,285 | |
| 212,572 | |
| 18,713 | | |||
Restructuring costs | 2,010 | | | 1,431 | |
| 579 | | |||
Segment operating income (loss) | 25,245 | |
| 25,995 | |
| (750 | ) | |||
Corporate general and administrative | 16,701 | |
|
|
|
| |||||
Corporate restructuring | 497 | |
|
|
|
| |||||
Restatement, investigations and remediation | 3,261 | |
|
|
|
| |||||
Operating income | 4,786 | |
|
|
|
| |||||
Other income (expense), net | (2,947 | ) |
|
|
|
| |||||
Income from continuing operations before income taxes | $ | 1,839 | |
|
|
|
| ||||
F-34
VOLT INFORMATION SCIENCES, INC. AND SUBSIDIARIES
Notes to Consolidated Financial Statements
As of November 1, 2015
| For the year ended November 3, 2013 | ||||||||||
| Total |
| Staffing Services |
| Other | ||||||
Net Revenue | $ | 2,017,472 | |
| $ | 1,899,723 | |
| $ | 117,749 | |
Expenses |
|
|
|
|
| ||||||
Direct cost of staffing services revenue | 1,627,166 | |
| 1,627,166 | |
| - | | |||
Cost of other revenue | 94,519 | |
| - | |
| 94,519 | | |||
Selling, administrative and other operating costs | 265,513 | |
| 244,031 | |
| 21,482 | | |||
Restructuring costs | 781 | |
| 781 | |
| - | | |||
Segment operating income | 29,493 | |
| 27,745 | |
| 1,748 | | |||
Corporate general and administrative | 11,917 | |
|
|
|
| |||||
Corporate restructuring | - | |
|
|
|
| |||||
Restatement, investigation and remediation | 24,828 | |
|
|
|
| |||||
Operating loss | (7,252 | ) |
|
|
|
| |||||
Other income (expense), net | (2,569 | ) |
|
|
|
| |||||
Loss from continuing operations before income taxes | $ | (9,821 | ) |
|
|
|
| ||||
| November 1, 2015 |
| November 2, | ||||
Assets: |
|
|
| ||||
Staffing services | $ | 234,752 | |
| $ | 270,728 | |
Other | 1,067 | |
| 9,383 | | ||
Total segments | 235,819 | |
| 280,111 | | ||
Cash, investments and other corporate assets | 68,064 | |
| 92,023 | | ||
Held for sale | 22,943 | |
| 52,198 | | ||
Total Assets | $ | 326,826 | |
| $ | 424,332 | |
| Year ended | ||||||||||
| November 1, 2015 |
| November 2, |
| November 3, | ||||||
Net Revenue: |
|
|
|
|
| ||||||
Domestic | $ | 1,273,971 | |
| $ | 1,489,334 | |
| $ | 1,802,444 | |
International, principally Europe | 222,926 | |
| 220,694 | |
| 215,028 | | |||
Total Net Revenue | $ | 1,496,897 | |
| $ | 1,710,028 | |
| $ | 2,017,472 | |
| November 1, 2015 |
| November 2, | ||||
Long-Lived Assets: |
|
|
| ||||
Domestic | $ | 21,335 | |
| $ | 22,369 | |
International | 2,760 | |
| 3,187 | | ||
Total Long-Lived Assets | $ | 24,095 | |
| $ | 25,556 | |
F-35
VOLT INFORMATION SCIENCES, INC. AND SUBSIDIARIES
Notes to Consolidated Financial Statements
As of November 1, 2015
| Year ended | ||||||||||
| November 1, 2015 |
| November 2, |
| November 3, | ||||||
Capital Expenditures: |
|
|
|
|
| ||||||
Staffing services | $ | 8,325 | |
| $ | 4,855 | |
| $ | 8,133 | |
Other | 123 | |
| 205 | |
| 738 | | |||
Total segments | 8,448 | |
| 5,060 | |
| 8,871 | | |||
Corporate | 104 | |
| 207 | |
| 356 | | |||
Total Capital Expenditures | $ | 8,552 | |
| $ | 5,267 | |
| $ | 9,227 | |
|
|
|
|
|
| ||||||
Depreciation and Amortization: |
|
|
|
|
| ||||||
Staffing services | $ | 2,386 | |
| $ | 4,048 | |
| $ | 6,438 | |
Other | 340 | |
| 843 | |
| 1,569 | | |||
Total segments | 2,726 | |
| 4,891 | |
| 8,007 | | |||
Corporate | 4,085 | |
| 4,432 | |
| 3,162 | | |||
Total Depreciation and Amortization | $ | 6,811 | |
| $ | 9,323 | |
| $ | 11,169 | |
F-36
VOLT INFORMATION SCIENCES, INC. AND SUBSIDIARIES
Notes to Consolidated Financial Statements
As of November 1, 2015
NOTE 20: Quarterly Financial Information (unaudited)
The following tables present certain unaudited consolidated quarterly financial information for each quarter in the fiscal years ended November 1, 2015 and November 2, 2014.
| Three Months Ended |
| Year Ended | ||||||||||||||||
| February 1, 2015 |
| May 3, 2015 |
| August 2, 2015 |
| November 1, 2015 |
| November 1, 2015 | ||||||||||
| (unaudited) |
| (unaudited) |
| (unaudited) |
| (unaudited) |
|
| ||||||||||
REVENUE |
|
|
|
|
|
|
|
|
| ||||||||||
Staffing services | $ | 360,821 | |
| $ | 362,277 | |
| $ | 341,383 | |
| $ | 342,328 | |
| $ | 1,406,809 | |
Other revenue | 22,245 | |
| 22,912 | |
| 23,285 | |
| 21,646 | |
| 90,088 | | |||||
NET REVENUE | 383,066 | |
| 385,189 | |
| 364,668 | |
| 363,974 | |
| 1,496,897 | | |||||
EXPENSES |
|
|
|
|
|
|
|
|
| ||||||||||
Direct cost of staffing services revenue | 310,819 | |
| 305,116 | |
| 288,689 | |
| 288,368 | |
| 1,192,992 | | |||||
Cost of other revenue | 19,605 | |
| 19,909 | |
| 19,696 | |
| 18,021 | |
| 77,231 | | |||||
Selling, administrative and other operating costs | 58,989 | |
| 58,633 | |
| 56,890 | |
| 54,661 | |
| 229,173 | | |||||
Restructuring costs | 975 | |
| 251 | |
| 1,867 | |
| 542 | |
| 3,635 | | |||||
Impairment charges | - | |
| 5,374 | |
| 580 | |
| 672 | |
| 6,626 | | |||||
TOTAL EXPENSES | 390,388 | |
| 389,283 | |
| 367,722 | |
| 362,264 | |
| 1,509,657 | | |||||
OPERATING INCOME (LOSS) | (7,322 | ) |
| (4,094 | ) |
| (3,054 | ) |
| 1,710 | |
| (12,760 | ) | |||||
OTHER INCOME (EXPENSE) |
|
|
|
|
|
|
|
|
| ||||||||||
Interest income | 62 | |
| 261 | |
| 175 | |
| 74 | |
| 572 | | |||||
Interest expense | (696 | ) |
| (991 | ) |
| (746 | ) |
| (811 | ) |
| (3,244 | ) | |||||
Foreign exchange gain (loss), net | 437 | |
| (1,600 | ) |
| 1,010 | |
| (96 | ) |
| (249 | ) | |||||
Other income (expense), net | 98 | |
| 43 | |
| (178 | ) |
| 578 | |
| 541 | | |||||
INCOME (LOSS) FROM CONTINUING OPERATIONS BEFORE INCOME TAXES | (7,421 | ) |
| (6,381 | ) |
| (2,793 | ) |
| 1,455 | |
| (15,140 | ) | |||||
Income tax provision | 1,379 | |
| 532 | |
| 1,351 | |
| 1,384 | |
| 4,646 | | |||||
INCOME (LOSS) FROM CONTINUING OPERATIONS, NET OF INCOME TAXES | (8,800 | ) |
| (6,913 | ) |
| (4,144 | ) |
| 71 | |
| (19,786 | ) | |||||
LOSS FROM DISCONTINUED OPERATIONS, NET OF INCOME TAXES | (4,519 | ) |
| - | |
| - | |
| (315 | ) |
| (4,834 | ) | |||||
NET LOSS | $ | (13,319 | ) |
| $ | (6,913 | ) |
| $ | (4,144 | ) |
| $ | (244 | ) |
| $ | (24,620 | ) |
PER SHARE DATA: |
|
| |
|
|
|
|
|
| ||||||||||
Basic: |
|
|
|
|
|
|
|
|
| ||||||||||
Loss from continuing operations | $ | (0.42 | ) |
| $ | (0.33 | ) |
| $ | (0.20 | ) |
| $ | - | |
| $ | (0.95 | ) |
Loss from discontinued operations | (0.22 | ) |
| - | |
| - | |
| (0.01 | ) |
| (0.23 | ) | |||||
Net loss | $ | (0.64 | ) |
| $ | (0.33 | ) |
| $ | (0.20 | ) |
| $ | (0.01 | ) |
| $ | (1.18 | ) |
Weighted average number of shares | 20,930 | |
| 20,793 | |
| 20,741 | |
| 20,799 | |
| 20,816 | | |||||
Diluted: |
|
|
|
|
|
|
|
|
| ||||||||||
Loss from continuing operations | $ | (0.42 | ) |
| $ | (0.33 | ) |
| $ | (0.20 | ) |
| $ | - | |
| $ | (0.95 | ) |
Loss from discontinued operations | (0.22 | ) |
| - | |
| - | |
| (0.01 | ) |
| (0.23 | ) | |||||
Net loss | $ | (0.64 | ) |
| $ | (0.33 | ) |
| $ | (0.20 | ) |
| $ | (0.01 | ) |
| $ | (1.18 | ) |
Weighted average number of shares | 20,930 | |
| 20,793 | |
| 20,741 | |
| 20,930 | |
| 20,816 | | |||||
F-37
VOLT INFORMATION SCIENCES, INC. AND SUBSIDIARIES
Notes to Consolidated Financial Statements
As of November 1, 2015
| Three Months Ended |
| Year Ended | ||||||||||||||||
| February 2, |
| May 4, |
| August 3, |
| November 2, |
| November 2, | ||||||||||
| (unaudited) |
| (unaudited) |
| (unaudited) |
| (unaudited) |
|
| ||||||||||
REVENUE |
|
|
|
|
|
|
|
|
| ||||||||||
Staffing services | $ | 392,269 | |
| $ | 406,733 | |
| $ | 396,979 | |
| $ | 403,065 | |
| $ | 1,599,046 | |
Other revenue | 29,359 | |
| 29,347 | |
| 25,670 | |
| 26,606 | |
| 110,982 | | |||||
NET REVENUE | 421,628 | |
| 436,080 | |
| 422,649 | |
| 429,671 | |
| 1,710,028 | | |||||
EXPENSES |
|
|
|
|
|
|
|
|
| ||||||||||
Direct cost of staffing services revenue | 339,796 | |
| 344,922 | |
| 337,285 | |
| 337,045 | |
| 1,359,048 | | |||||
Cost of other revenue | 24,133 | |
| 24,066 | |
| 22,319 | |
| 21,922 | |
| 92,440 | | |||||
Selling, administrative and other operating costs | 65,599 | |
| 60,626 | |
| 57,831 | |
| 63,930 | |
| 247,986 | | |||||
Restructuring costs | 657 | |
| 999 | |
| 141 | |
| 710 | |
| 2,507 | | |||||
Restatement, investigations and remediation | 2,668 | |
| 593 | |
| - | |
| - | |
| 3,261 | | |||||
TOTAL EXPENSES | 432,853 | |
| 431,206 | |
| 417,576 | |
| 423,607 | |
| 1,705,242 | | |||||
OPERATING INCOME (LOSS) | (11,225 | ) |
| 4,874 | |
| 5,073 | |
| 6,064 | |
| 4,786 | | |||||
OTHER INCOME (EXPENSE) |
|
|
|
|
|
|
|
|
| ||||||||||
Interest income | 96 | |
| 126 | |
| 63 | |
| (18 | ) |
| 267 | | |||||
Interest expense | (956 | ) |
| (928 | ) |
| (851 | ) |
| (795 | ) |
| (3,530 | ) | |||||
Foreign exchange gain (loss), net | 388 | |
| (630 | ) |
| (134 | ) |
| 494 | |
| 118 | | |||||
Other income (expense), net | 62 | |
| 216 | |
| (8 | ) |
| (72 | ) |
| 198 | | |||||
INCOME (LOSS) FROM CONTINUING OPERATIONS BEFORE INCOME TAXES | (11,635 | ) |
| 3,658 | |
| 4,143 | |
| 5,673 | |
| 1,839 | | |||||
Income tax provision | 1,047 | |
| 2,277 | |
| 738 | |
| 1,164 | |
| 5,226 | | |||||
INCOME (LOSS) FROM CONTINUING OPERATIONS, NET OF INCOME TAXES | (12,682 | ) |
| 1,381 | |
| 3,405 | |
| 4,509 | |
| (3,387 | ) | |||||
LOSS FROM DISCONTINUED OPERATIONS, NET OF INCOME TAXES | (4,392 | ) |
| (4,876 | ) |
| (3,885 | ) |
| (2,448 | ) |
| (15,601 | ) | |||||
NET INCOME (LOSS) | $ | (17,074 | ) |
| $ | (3,495 | ) |
| $ | (480 | ) |
| $ | 2,061 | |
| $ | (18,988 | ) |
PER SHARE DATA: |
|
|
|
|
|
|
|
|
| ||||||||||
Basic: |
|
|
|
|
|
|
|
|
| ||||||||||
Income (loss) from continuing operations | $ | (0.61 | ) |
| $ | 0.07 | |
| $ | 0.16 | |
| $ | 0.22 | |
| $ | (0.16 | ) |
Loss from discontinued operations | (0.21 | ) |
| (0.23 | ) |
| (0.19 | ) |
| (0.12 | ) |
| (0.75 | ) | |||||
Net income (loss) | $ | (0.82 | ) |
| $ | (0.16 | ) |
| $ | (0.03 | ) |
| $ | 0.10 | |
| $ | (0.91 | ) |
Weighted average number of shares | 20,849 | |
| 20,861 | |
| 20,866 | |
| 20,874 | |
| 20,863 | | |||||
Diluted: |
|
|
|
|
|
|
|
|
| ||||||||||
Income (loss) from continuing operations | $ | (0.61 | ) |
| $ | 0.07 | |
| $ | 0.16 | |
| $ | 0.21 | |
| $ | (0.16 | ) |
Loss from discontinued operations | (0.21 | ) |
| (0.23 | ) |
| (0.18 | ) |
| (0.11 | ) |
| (0.75 | ) | |||||
Net income (loss) | $ | (0.82 | ) |
| $ | (0.16 | ) |
| $ | (0.02 | ) |
| $ | 0.10 | |
| $ | (0.91 | ) |
Weighted average number of shares | 20,849 | |
| 21,084 | |
| 21,072 | |
| 21,013 | |
| 20,863 | | |||||
F-38