UNITED STATES
SECURITIES AND EXCHANGE COMMISSION
Washington, DC 20549
FORM 10-K
| x | ANNUAL REPORT PURSUANT TO SECTION 13 OR 15(d) OF THE SECURITIES EXCHANGE ACT OF 1934 |
For the fiscal year ended January 31, 2016
| ¨ | TRANSITION REPORT PURSUANT TO SECTION 13 OR 15(d) OF THE SECURITIES EXCHANGE ACT OF 1934 |
For the transition period from to
Commission File No. 000-22754
URBAN OUTFITTERS, INC.
(Exact Name of Registrant as Specified in Its Charter)
| Pennsylvania | 23-2003332 | |
(State or Other Jurisdiction of Incorporation or Organization) | (I.R.S. Employer Identification No.) | |
| 5000 South Broad Street, Philadelphia, PA | 19112-1495 | |
| (Address of Principal Executive Offices) | (Zip Code) | |
Registrant's telephone number, including area code: (215) 454-5500
Securities registered pursuant to Section 12(b) of the Act:
Title of Each Class | Name of Exchange on Which Registered | |
| Common Shares, $.0001 par value | The NASDAQ Global Select Market LLC |
Securities registered pursuant to Section 12(g) of the Act: None
Indicate by checkmark if the registrant is a well-known seasoned issuer, as defined in Rule 405 of the Securities Act. Yes x No ¨
Indicate by checkmark if the registrant is not required to file reports pursuant to Section 13 or Section 15(d) of the Act. Yes ¨ No x
Indicate by checkmark whether the registrant (1) has filed all reports required to be filed by Section 13 or 15(d) of the Securities Exchange Act of 1934 during the preceding 12 months (or for such shorter period that the registrant was required to file such reports), and (2) has been subject to such filing requirements for the past 90 days. Yes x No ¨
Indicate by check mark whether the registrant has submitted electronically and posted on its corporate website, if any, every Interactive Data File required to be submitted and posted pursuant to Rule 405 of Regulation S-T during the preceding 12 months (or for such shorter period that the registrant was required to submit and post such files). Yes x No ¨
Indicate by checkmark if disclosure of delinquent filers pursuant to Item 405 of Regulation S-K is not contained herein, and will not be contained, to the best of Registrant's knowledge, in definitive proxy or information statements incorporated by reference in Part III of this Form 10-K or any amendment to this Form 10-K. x
Indicate by checkmark whether the registrant is a large accelerated filer, an accelerated filer, a non-accelerated filer, or a smaller reporting company. See the definitions of "large accelerated filer," "accelerated filer" and "smaller reporting company" in Rule 12b-2 of the Exchange Act.
| Large accelerated filer x | Accelerated filer ¨ | |
| Non-accelerated filer ¨ (Do not check if a smaller reporting company) | Smaller reporting company ¨ |
Indicate by a checkmark whether the registrant is a shell company (as defined in Rule 12b-2 of the Act). Yes ¨ No x
The aggregate market value of the voting and non-voting common equity held by non-affiliates computed by reference to the price at which the common equity was last sold, or the average bid and asked price of such common equity, as of the last business day of the registrant's most recently completed second fiscal quarter, was $3,014,925,747.
The number of shares outstanding of the registrant's common stock on March 24, 2016 was 117,401,220.
DOCUMENTS INCORPORATED BY REFERENCE
Certain information required by Items 10, 11, 12, 13 and 14 is incorporated by reference into Part III hereof from portions of the Proxy Statement for the registrant's 2016 Annual Meeting of Shareholders.
TABLE OF CONTENTS
| PART I | ||||||
| Item 1. | Business | 1 | ||||
| Item 1A. | Risk Factors | 10 | ||||
| Item 1B. | Unresolved Staff Comments | 18 | ||||
| Item 2. | Properties | 18 | ||||
| Item 3. | Legal Proceedings | 20 | ||||
| Item 4. | Mine Safety Disclosures | 20 | ||||
| PART II | ||||||
| Item 5. | Market for Registrant's Common Equity, Related Shareholder Matters and Issuer Purchases of Equity Securities | 21 | ||||
| Item 6. | Selected Financial Data | 24 | ||||
| Item 7. | Management's Discussion and Analysis of Financial Condition and Results of Operations | 25 | ||||
| Item 7A. | Quantitative and Qualitative Disclosures About Market Risk | 39 | ||||
| Item 8. | Financial Statements and Supplementary Data | 40 | ||||
| Item 9. | Changes in and Disagreements with Accountants on Accounting and Financial Disclosure | 40 | ||||
| Item 9A. | Controls and Procedures | 40 | ||||
| Item 9B. | Other Information | 41 | ||||
| PART III | ||||||
| Item 10. | Directors, Executive Officers and Corporate Governance | 44 | ||||
| Item 11. | Executive Compensation | 47 | ||||
| Item 12. | Security Ownership of Certain Beneficial Owners and Management and Related Shareholder Matters | 47 | ||||
| Item 13. | Certain Relationships and Related Transactions, and Director Independence | 47 | ||||
| Item 14. | Principal Accountant Fees and Services | 47 | ||||
| PART IV | ||||||
| Item 15. | Exhibits and Financial Statement Schedules | 48 | ||||
Signatures | 51 | |||||
INDEX TO CONSOLIDATED FINANCIAL STATEMENTS | F-1 | |||||
Certain matters contained in this filing with the United States Securities and Exchange Commission ("SEC") may contain forward-looking statements and are being made pursuant to the "safe harbor" provisions of the Private Securities Litigation Reform Act of 1995. When used in this Annual Report on Form 10-K, the words "project," "believe," "plan," "will," "anticipate," "expect" and similar expressions are intended to identify forward-looking statements, although not all forward-looking statements contain these identifying words. Any one, or all, of the following factors could cause actual financial results to differ materially from those financial results mentioned in the forward-looking statements: the difficulty in predicting and responding to shifts in fashion trends, changes in the level of competitive pricing and promotional activity and other industry factors, overall economic and market conditions and the resultant impact on consumer spending patterns, lowered levels of consumer confidence and higher levels of unemployment, lowered levels of consumer spending resulting from worldwide political and economic events, any effects of war, terrorism and civil unrest, natural disasters or severe weather conditions, increases in labor costs, availability of suitable retail space for expansion, timing of store openings, risks associated with international expansion, seasonal fluctuations in gross sales, the departure of one or more key senior executives, import risks, including potential disruptions and changes in duties, tariffs and quotas, the closing or disruption of, or any damage to, any of our distribution centers, our ability to protect our intellectual property rights, risks associated with internet sales, response to new store concepts, our ability to integrate acquisitions, failure of our manufacturers to comply with our social compliance program, changes in accounting standards and subjective assumptions, regulatory changes and legal matters and other risks identified in our filings with the SEC, including those set forth in Item 1A of this Annual Report on Form 10-K for the fiscal year ended January 31, 2016. We disclaim any intent or obligation to update forward-looking statements even if experience or future changes make it clear that actual results may differ materially from any projected results expressed or implied therein.
Unless the context otherwise requires, all references to "Urban Outfitters," the "Company," "we," "us," "our" or "our company" refer to Urban Outfitters, Inc., together with its subsidiaries.
PART I
Item 1. Business
General
We are a leading lifestyle specialty retail company that operates under the Urban Outfitters, Anthropologie, Free People, Terrain and Bhldn brands. We also operate a Wholesale segment under the Free People brand. We have over 45 years of experience creating and managing retail stores that offer highly differentiated collections of fashion apparel, accessories and home goods in inviting and dynamic store settings. Our core strategy is to provide unified environments that establish emotional bonds with the customer. In addition to our retail stores, we offer our products and market our brands directly to the consumer through our e-commerce websites, mobile applications and our catalogs. We have achieved compounded annual sales growth of approximately 9% over the past five years, with sales of approximately $3.4 billion during the fiscal year ended January 31, 2016.
We opened our first Urban Outfitters store in 1970 near the University of Pennsylvania campus in Philadelphia, Pennsylvania and were incorporated in Pennsylvania in 1976. The first Anthropologie store opened in a suburb of Philadelphia in October 1992. We started doing business in Europe in June 1998, with our first European Urban Outfitters store located in London. We opened our first Free
1
People store in the Garden State Plaza Mall in Paramus, New Jersey in November 2002. We opened our first Terrain garden center in Glen Mills, Pennsylvania in April 2008. We opened our first European Anthropologie store in London in October 2009. In August 2011, we opened our first Bhldn store in Houston, Texas.
In 1984 we established the Free People wholesale division to develop, in conjunction with Urban Outfitters, private label apparel lines of young women's casual wear that could be effectively sold at attractive prices in Urban Outfitters stores.
In February 2016, we acquired substantially all of the assets of the Vetri Family group of restaurants.
Our omni-channel strategy enhances our customers' brand experience by providing a seamless approach to the customer shopping experience. We have substantially integrated all available shopping channels, including stores, websites (online and through mobile devices) and catalogs. Our investments in areas such as marketing campaigns and technology advancements are designed to generate demand for the omni-channel and not the separate store or direct-to-consumer channels. Store sales are primarily fulfilled from that store's inventory, but may also be shipped from any of our fulfillment centers or from a different store location if an item is not available at the original store. Direct-to-consumer orders are primarily shipped to our customers through our fulfillment centers, but may also be shipped from any store, or a combination of fulfillment centers and stores depending on the availability of a particular item. Direct-to-consumer orders may also be picked up at a store location. Customers may also return certain merchandise purchased through direct-to-consumer channels at retail locations. As our customers continue to shop across multiple channels, we have adapted our approach towards meeting this demand. Due to the availability of like product in a variety of shopping channels, we now source these products utilizing single stock keeping units ("SKUs") based on the omni-channel demand rather than the demand of the separate channels. These and other technological capabilities allow us to better serve our customers and help us complete sales that otherwise may not have occurred due to out-of-stock positions. As a result of changing customer behavior and the substantial integration of the operations of our store and direct-to-consumer channels, we manage and analyze our performance based on a single omni-channel rather than separate channels and believe that the omni-channel results present the most meaningful and appropriate measure of our performance.
Our fiscal year ends on January 31. All references to our fiscal years refer to the fiscal years ended on January 31 in those years. For example, our fiscal 2016 ended on January 31, 2016.
Our annual report on Form 10-K, quarterly reports on Form 10-Q, current reports on Form 8-K and amendments to those reports filed with, or furnished to, the SEC pursuant to Section 13(a) or 15(d) of the Securities Exchange Act of 1934, as amended, are available free of charge on our investor relations website, www.urbanoutfittersinc.com , as soon as reasonably practicable after we electronically file such material with, or furnish such material to, the SEC. We will voluntarily provide electronic or paper copies (other than exhibits) of our filings free of charge upon written request. You may also obtain any materials we file with, or furnish to, the SEC on its website at www.sec.gov.
Retail Segment
Urban Outfitters. Urban Outfitters targets young adults aged 18 to 28 through its unique merchandise mix and compelling store and website environment. We have established a reputation
2
with these young adults, who are culturally sophisticated, self-expressive and concerned with acceptance by their peer group. The product offering includes women's and men's fashion apparel, intimates, footwear, beauty and accessories, home goods, activewear and gear, electronics, as well as an eclectic mix of apartment wares and gifts. Apartment wares range from rugs, pillows and shower curtains to books, candles and novelties. Stores average approximately 9,000 square feet of selling space. The brand offers an estimated 70,000 to 75,000 SKUs across the Retail segment. Our stores are located in large metropolitan areas, select university communities, specialty centers and enclosed malls. Our stores accommodate our customers' propensity not only to shop, but also to congregate with their peers.
As of January 31, 2016, we operated 240 Urban Outfitters stores, of which 179 were located in the United States, 18 were located in Canada and 43 were located in Europe. We plan to open approximately five Urban Outfitters stores, globally, in fiscal 2017. Urban Outfitters operates websites in North America and Europe that capture the spirit of the brand by offering a similar yet broader selection of merchandise as found in our stores. Urban Outfitters offers a catalog in Europe offering select merchandise, most of which is also available in our Urban Outfitters stores. Urban Outfitters' North American and European Retail segment net sales accounted for approximately 32.5% and 8.0% of consolidated net sales, respectively, for fiscal 2016.
Anthropologie Group. The Anthropologie Group consists of the Anthropologie, Bhldn and Terrain brands. We initially operated the Bhldn and Terrain brands as standalone concepts and opened two Bhldn stores and two Terrain garden centers. We ultimately determined that the Bhldn and Terrain brands were complementary to the Anthropologie brand and integrated those brands into the Anthropologie Group during fiscal 2015 and 2016, respectively.
The Anthropologie brand tailors its merchandise and inviting store environment to sophisticated and contemporary women aged 28 to 45. The Anthropologie brand's unique and eclectic product assortment includes women's casual apparel and accessories, intimates, shoes, beauty, home furnishings and a diverse array of gifts and decorative items. The home furnishings range from furniture, rugs, lighting and antiques to table top items, bedding and gifts. The brand offers registry services through our website and mobile applications and in all of our stores throughout the United States, allowing our customers to create gift registries for any occasion. The Anthropologie brand also offers catalogs in North America and Europe that market select merchandise, most of which is also available in our Anthropologie brand stores.
The Bhldn brand emphasizes every element that contributes to a wedding. The brand offers a curated collection of heirloom quality wedding gowns, bridesmaid frocks, party dresses, assorted jewelry, headpieces, footwear, lingerie and decorations. In addition to the two standalone Bhldn stores, we operate shop-within-shop locations within our Anthropologie brand stores that offer a comparable product assortment to our Bhldn stores and website.
The Terrain brand is designed to appeal to women and men interested in a creative, sophisticated outdoor living and gardening experience. Terrain's product offering includes lifestyle home and garden products combined with antiques, live plants, flowers, wellness products and accessories. Both Terrain garden centers also offer a full service restaurant and coffee bar.
As of January 31, 2016, we operated 218 Anthropologie Group stores, of which 197 were located in the United States, 12 were located in Canada and nine were located in Europe. Stores average
3
approximately 7,000 square feet of selling space. The Anthropologie Group offers an estimated 80,000 to 85,000 SKUs across the Retail segment. Our stores are located in specialty retail centers, upscale street locations and enclosed malls. We plan to open approximately ten Anthropologie Group stores, globally, in fiscal 2017. The Anthropologie Group operates websites in North America and Europe that capture the spirit of its brands by offering a similar yet broader selection of merchandise as found in our stores. The Anthropologie Group's North American and European Retail segment net sales accounted for approximately 40.2% and 1.6% of consolidated net sales, respectively, for fiscal 2016.
Free People. Our Free People retail stores primarily offer private label branded merchandise targeted to young contemporary women aged 25 to 30. Free People offers a unique merchandise mix of casual women's apparel, intimates, shoes, accessories, activewear, home products and gifts. Free People retail stores average approximately 1,800 square feet of selling space. The brand offers an estimated 20,000 to 25,000 SKUs across the Retail segment. Our stores are located in enclosed malls, upscale street locations and specialty retail centers. The retail channels of Free People expose both our wholesale accounts and retail customers to the full Free People product assortment and store environment.
As of January 31, 2016, we operated 114 Free People stores, of which 109 were located in the United States and five were located in Canada. We plan to open approximately 12 new Free People stores in fiscal 2017. Free People operates websites in North America, Europe and Asia that capture the spirit of the brand by offering a similar yet broader selection of merchandise as found in our stores, as well as substantially all of the Free People wholesale offerings. Free People also offers a catalog offering select merchandise, most of which is also available in our Free People stores. Free People's Retail segment net sales accounted for approximately 10.1% of consolidated net sales for fiscal 2016.
Wholesale Segment
The Free People wholesale division was established in 1984 to develop, in conjunction with Urban Outfitters, private label apparel lines of young women's casual wear that could be effectively sold at attractive prices in Urban Outfitters stores. In order to achieve minimum production lots, Free People wholesale began selling to other retailers throughout the United States. We distribute our Free People products in certain department stores using a shop-within-shop sales model. We believe that the shop-within-shop model allows for a more complete merchandising of our Free People products and will give us greater freedom in differentiating the presentation of our products and further strengthening of our brand image. During fiscal 2016, Free People's range of tops, bottoms, sweaters, dresses, intimates, shoes and activewear were sold through approximately 1,800 better department and specialty stores worldwide, including Macy's, Nordstrom, Bloomingdale's, Lord & Taylor, Selfridge's, and our own Free People stores. We monitor the styles and products that are popular with our wholesale customers to give us insight into current fashion trends, helping us to better serve our retail customers. Free People wholesale sales and showroom facilities are located in New York City, Los Angeles, Chicago and London. Free People's wholesale sales accounted for approximately 7.6% of consolidated net sales for fiscal 2016.
Store Environment
We create a unified environment in our stores that establishes an emotional bond with the customer. Every element of the environment is tailored to the aesthetic preferences of our target customers. Through creative design, much of the existing retail space is modified to incorporate a
4
mosaic of fixtures, finishes and revealed architectural details. In our stores, merchandise is integrated into a variety of creative vignettes and displays designed to offer our customers an entire look at a distinct lifestyle. This dynamic visual merchandising and display technique provides the connection among the store design, the merchandise and the customer. Essential components of the ambiance of each store may include playing music that appeals to our target customers, using unique signage and employing a staff that understands and identifies with the target customer.
Our Urban Outfitters, Anthropologie, and Free People stores are primarily located in upscale street locations, enclosed malls, and specialty retail centers. Our two Terrain garden centers are both free-standing locations. Our Bhldn stores are located in a specialty retail center and an upscale street location. We plan to implement a store location expansion strategy in fiscal 2017 similar to our strategy in fiscal 2016.
Buying and Design Operations
Maintaining a constant flow of fashionable merchandise for our Retail segment is critically important to our ongoing performance. We maintain our own buying groups that select and develop products to satisfy our target customers and provide us with the appropriate amount and timing of products offered. Merchandise managers may supervise several buyers and assistant buyers. Our buyers stay in touch with the evolving tastes of their target customers by shopping at major trade markets, attending national and regional trade shows and staying current with mass media influences, including social media, music, video, film, magazines and pop culture.
Merchandise
Our Urban Outfitters stores, websites and mobile applications offer a wide array of eclectic merchandise, including women's and men's fashion apparel, intimates, footwear, beauty and accessories, home goods, activewear and gear, electronics, as well as an eclectic mix of apartment wares and gifts. Our Anthropologie stores, websites, mobile applications and catalog product offerings include women's casual apparel and accessories, intimates, shoes, beauty, home furnishings and a diverse array of gifts and decorative items. Our Bhldn retail stores, shop-within-shop locations and website offer a curated collection of heirloom quality wedding gowns, bridesmaid frocks, party dresses, jewelry, headpieces, footwear, lingerie and decorations. Our Terrain garden centers and website product offerings include home furnishings and decorative items, garden products including live plants and flowers, outdoor living furnishings and entertainment products and a wide variety of gifts. Our Free People retail stores, websites, mobile applications and catalogs offer a showcase for casual women's apparel, intimates, shoes, accessories, activewear, home products and gifts. Our merchandise is continuously updated to appeal to our target customers' changing tastes and is supplied by a large number of domestic and foreign vendors, with new shipments of merchandise arriving at our stores and fulfillment centers almost daily.
The wide breadth of merchandise offered by our Retail segment includes a combination of national third-party brands, as well as exclusive merchandise developed and designed internally by our brands. This combination allows us to offer fashionable merchandise and to differentiate our product mix from that of traditional department stores, as well as that of other specialty and direct-to-consumer retailers. Merchandise designed and developed by our brands generally yields higher gross profit margins than third-party branded merchandise, and helps to keep our product offerings current and unique.
5
The ever-changing mix of products available to our customers allows us to adapt our merchandise to prevailing fashion trends, and together with the inviting atmosphere and experience of our stores and websites, encourages our core customers to visit our shopping channels frequently.
We select price points for our merchandise that are consistent with the spending patterns of our target customers. As such, our stores carry merchandise at a wide range of price points that may vary considerably within product categories.
Store Operations
We have organized our retail store operations by brand into geographic areas or districts that each have a district manager. District managers are responsible for several stores and monitor and supervise individual store managers. Each store manager is responsible for overseeing the daily operations of one of our stores. In addition to a store manager, the staff of a typical store includes a combination of some or all of the following positions: a visual manager, several department managers and full and part-time sales and visual staff. The staff of a typical Anthropologie store may also include a customer care manager who helps tailor the shopping experience to the needs of Anthropologie's target customers. The staff of a Bhldn location may also include a bridal and event manager, appointment stylist and a category specialist. A Terrain garden center may also include merchandise care and maintenance staff.
An essential requirement for the success of our stores is our ability to attract, train and retain talented, highly motivated store managers, visual managers and other key employees. In addition to management training programs for both newly hired and existing employees, we have a number of retention programs that offer qualitative and quantitative performance-based incentives to district-level managers, store managers and full-time sales associates.
Marketing and Promotion
We believe we have highly effective marketing tools in our websites, mobile applications, catalogs, email campaigns and social media. We refresh this media as frequently as daily to reflect the most cutting edge changes in fashion and culture. We also believe that highly visible store locations, broad merchandise selection and creative and visual presentation within our stores, on our websites and on our mobile applications are key enticements for customers to explore these channels and purchase merchandise. Consequently, we rely on these enticements, as well as the brand recognition created by our direct marketing activities, to draw customers to our omni-channel operations, rather than traditional forms of advertising such as print, radio and television media. Marketing activities for each of our retail store concepts may include special event promotions and a variety of public relations activities designed to create community awareness of our stores and products. We also are active in social media and blogs. We believe that the traditional method of a one-way communication to customers is no longer enough. We believe that by starting a conversation and interacting directly with our customers, most notably via Facebook, Twitter, Pinterest, Instagram and our own mobile applications, we are more effective at understanding and serving their fashion needs. We also believe that our blogs continue this conversation. Not only do our blogs allow us to communicate what inspires us, they allow our customers to tell us what inspires them. This fosters our relationships with our customers and encourages them to continue shopping with us.
During fiscal 2016, we circulated approximately 29.2 million catalogs across multiple brands. We plan for our catalog circulation to remain consistent in fiscal 2017.
6
Suppliers
To serve our target customers and to recognize changes in fashion trends and seasonality, we purchase merchandise from numerous foreign and domestic vendors. We also have arrangements with agents and third party manufacturers to produce our private label merchandise. To the extent that our vendors are located overseas or, in the case of third-party vendors, rely on overseas sources for a large portion of their merchandise, any event causing a disruption of imports, such as the imposition of increased security or regulatory requirements applicable to imported goods, war, public health concerns, acts of terrorism, natural disasters, port security considerations or labor disputes, financial or political instability in any of the countries in which merchandise we purchase is manufactured, trade restrictions in the form of tariffs or quotas, or both, disruption in the supply of fabrics or raw materials, increases in the cost of fuel or decreases in the value of the U.S. dollar relative to foreign currencies could adversely affect our business. During fiscal 2016, we purchased merchandise from approximately 5,000 vendors. No single vendor or manufacturer accounted for more than 10% of merchandise purchased during that time. While certain of our vendors have limited financial resources and production capabilities, we do not believe that the loss of any one vendor would have a material adverse effect on our business.
Company Operations
Distribution. We own a 291,000 square foot distribution facility in Gap, Pennsylvania that receives and distributes approximately half of our retail store merchandise in North America. We also lease a 214,500 square foot distribution center located in Reno, Nevada, that receives and distributes the remaining half of our retail store merchandise.
In June 2015, we opened a new 1,000,000 square foot fulfillment center in Gap, Pennsylvania, which we own and operate. Operations at the center include direct-to-consumer and wholesale fulfillment services, including inventory warehousing, receiving and customer shipping. We lease a 459,000 square foot fulfillment center in Trenton, South Carolina. This facility currently services a portion of our Wholesale segment customer orders and processes all of our Wholesale segment returns. In fiscal 2016, we transitioned all of the Retail segment fulfillment operations and a portion of the Wholesale segment operations from this location to our new facility in Gap, Pennsylvania. We plan to transition the remaining Wholesale segment operations to our new facility and close the Trenton facility when the lease expires in fiscal 2017.
We own a 463,000 square foot fulfillment center located in Reno, Nevada. This facility is used primarily to house and distribute merchandise to our western United States direct-to-consumer customers, significantly improving our fulfillment capability. The facility also includes a data center.
We lease distribution and fulfillment facilities each located in Rushden, England. Our 98,000 square foot distribution facility supports our entire European store base and our 142,000 square foot fulfillment facility supports our European direct-to-consumer channel. We believe both of these facilities will support our European operations for the next several years.
Information Systems. Very early in our growth, we recognized the need for high-quality information in order to manage merchandise planning, buying, inventory management and control functions. We invested in a retail software package that met our processing and reporting requirements. We utilize point-of-sale register systems connected by a secure data network to our
7
home offices. Additionally, our stores have mobile point-of-sale devices that have virtually the same functionality as our cash registers. These systems provide for register efficiencies, timely customer checkout and instant back office access to register information, as well as daily updates of sales, inventory data and price changes. Our direct-to-consumer channel, which includes our retail websites and catalogs, maintains separate software systems that manage the merchandise and customer information for our in-house customer contact center and fulfillment functions. Our Wholesale segment uses a separate software system for customer service, order entry, production planning and inventory management. We have a second fully redundant data center located in our Reno fulfillment center that functions as a disaster recovery site for our direct-to-consumer, data communication and other business critical systems.
Competition
Our Retail and Wholesale segments compete with individual and chain fashion specialty stores as well as department stores, both in stores and online, in highly competitive domestic and international markets. Our Retail segment competes on the basis of, among other things, the location of our stores; website, mobile application and catalog presentation; website design; the breadth, quality, style, price and availability of merchandise and the level of customer service offered. Although we believe that the eclectic mix of products and the unique store and website experiences offered by our Retail segment help differentiate us, it also means that our stores compete against a wide variety of smaller, independent specialty retailers, as well as department stores and national specialty chains. Many of our competitors have substantially greater name recognition as well as financial, marketing and other resources. Our Anthropologie, Free People and Bhldn stores also face competition from small boutiques that offer an individualized shopping experience similar to the one we strive to provide to our target customers. In addition, some of our third party vendors offer products directly to consumers and certain of our competitors.
Along with certain Retail segment competitive factors noted above, other key factors for our direct-to-consumer channel include the effectiveness of our merchandise delivery, website and mobile application availability and customer lists. Our direct-to-consumer channel competes against numerous websites and catalogs, which may have a greater volume of circulation and web traffic or more effective marketing through online media and social networking sites.
Our Wholesale segment competes with numerous wholesale companies on the basis of quality, price and fashion of our merchandise offerings. Many of our Wholesale segment competitors have a wider product distribution network. In addition, certain of our wholesale competitors have greater name recognition and greater financial, marketing and other resources than us.
Trademarks and Service Marks
We are the registered owner in the United States of certain service marks and trademarks, including, but not limited to "Urban Outfitters," "Anthropologie," "Free People," "Bhldn," "Terrain," "Vetri," "BDG," "Ecote," "FP Me," "Intimately Free People," "Pizzeria Vetri," "Pure + Good," "Urban Renewal," "Urbn.com," and "We The Free." Each mark is renewable indefinitely, contingent upon continued use at the time of renewal. In addition, we currently have pending registration applications with the U.S. Patent and Trademark Office covering certain other marks. We also own marks that have been registered in foreign countries, and have applications for marks pending in
8
additional foreign countries. We regard our marks as important to our business due to their name recognition with our customers. We are not aware of any valid claims of infringement or challenges to our right to use any of our marks in the United States.
Employees
As of January 31, 2016, we employed approximately 24,000 people, approximately 39% of whom were full-time employees. The number of part-time employees fluctuates depending on seasonal needs. Of our total employees, approximately 1% work in the Wholesale segment and the remaining 99% work in our Retail segment. None of our employees are covered by a collective bargaining agreement, and we believe that our relations with our employees are excellent.
Financial Information about Operations
We aggregate our operations into two reportable segments, the Retail segment and the Wholesale segment. See Note 15, "Segment Reporting," in the Notes to our Consolidated Financial Statements for additional information.
Financial Information about Geographical Areas
See Note 15, "Segment Reporting," in the Notes to our Consolidated Financial Statements for information regarding net sales and long-lived assets from domestic and foreign operations.
Seasonality
Our business is subject to seasonal fluctuations in net sales and operating income, with a more significant portion typically realized in the fourth quarter of each year reflecting the year-end holiday period. Historically, and consistent with the retail industry, this seasonality also impacts our working capital requirements, particularly with regard to inventory. See Item 7: Management's Discussion and Analysis of Financial Condition and Results of Operations-Seasonality and Quarterly Results for additional information.
9
Item 1A. Risk Factors
Our reportable segments are sensitive to economic conditions, consumer spending and other business factors.
We are subject to seasonal variations and face numerous business risk factors. Consumer purchases of discretionary retail items and specialty retail products, including our products, may decline during recessionary periods and also may decline at other times when disposable income is lower. A prolonged economic downturn could have a material adverse impact on our business, financial condition or results of operations. There is a risk that consumer sentiment may decline due to economic and/or geo-political factors, which could negatively impact our financial position and results of operations.
Our performance is subject to worldwide economic conditions and their impact on levels of consumer spending remains uncertain and may remain depressed for the foreseeable future. Some of the factors impacting discretionary consumer spending include general economic conditions, wages and employment, consumer debt, reductions in net worth based on severe market declines, residential real estate and mortgage markets, taxation, fuel and energy prices, interest rates, consumer confidence, political and economic crises and other macroeconomic factors. The current economy may continue to affect consumer purchases of our merchandise and adversely impact our results of operations and continued growth. The economic conditions may also affect the number of specialty retail businesses and their ability to purchase merchandise from our Wholesale segment. It is difficult to predict near term and/or future economic, capital and credit market conditions and what impact they will have on our business.
We rely heavily on our ability to identify changes in fashion.
Customer tastes and fashion trends are volatile and can change rapidly. Our success depends in part on our ability to effectively predict and respond to changing fashion tastes and consumer demands, and to translate market trends into appropriate, saleable product offerings. If we are unable to predict or respond to changing styles or trends successfully or misjudge the market for products or new product lines, our sales may be impacted and we may be faced with a substantial amount of unsold inventory or missed opportunities. In response, we may be forced to rely on additional markdowns or promotional sales to dispose of excess, slow-moving inventory, which could decrease our revenues or margins. Compared to our Retail segment, our Wholesale segment is more sensitive to changes in fashion trends because of longer lead times in the manufacturing and sale of its apparel. Our fashion decisions if unsuccessfully forecasted, constitute a material risk and may have an adverse effect on our financial condition and results of operations.
We may not be successful in expanding our business, opening new retail stores or extending our existing store leases.
Our growth strategy depends on our ability to open and operate new retail stores on a profitable basis. We also must be able to effectively extend our existing store leases. Our operating complexity will increase as our store base grows, and we may face challenges in managing our future growth. Such growth will require that we continue to expand and improve our operating capabilities, and expand, train and manage our employee base. We may be unable to hire and train a sufficient number of qualified personnel or successfully manage our growth.
10
Our expansion prospects also depend on a number of other factors, many of which are beyond our control, including, among other things, competition, the availability of financing for capital expenditures and working capital requirements and the availability of suitable sites for new store locations on acceptable lease terms. There can be no assurance that we will be able to achieve our store expansion goals, nor is there any assurance that our newly opened stores will achieve revenue or profitability levels comparable to those of our existing stores in the time periods estimated by us, or at all. If our stores fail to achieve, or are unable to sustain, acceptable revenue, profitability and cash flow levels, we may incur additional store asset impairment charges, significant costs associated with closing those stores or both, which could adversely affect our results of operations and financial condition.
We may not be successful expanding our business internationally.
Our current growth strategy includes plans to continue to open new stores, expand our digital marketing and grow our wholesale customer base internationally over the next several years against more established international competitors. International stores have different operational characteristics, including employment and labor, transportation, logistics, real estate and legal requirements. Furthermore, consumer demand and behavior, as well as tastes and purchasing trends may differ internationally, and as a result, sales of our merchandise may not be successful, or the margins on those sales may not be in line with those we anticipate. Additionally, our ability to conduct business internationally may be adversely impacted by political and economic risks, as well as the global economy. Any challenges that we encounter as we expand internationally may divert financial, operational and managerial resources from our existing operations, which could adversely impact our financial condition and results of operations.
In addition, we are increasingly exposed to foreign currency exchange rate risk with respect to our revenue, profits, assets and liabilities denominated in currencies other than the U.S. dollar. We currently do not utilize hedging instruments to mitigate these foreign currency risks. In the future, however we may initiate strategies to hedge certain foreign currency risks that may not succeed in offsetting all of the negative impact of foreign currency rate movements on our business and results of operations.
As we continue to expand our international operations, we are subject to certain U.S. laws, including the Foreign Corrupt Practices Act, as well as the laws of the foreign countries in which we operate. We are required to use all commercially reasonable efforts to ensure compliance with these laws. Violations of these laws could subject us to sanctions or other penalties that could negatively affect our reputation, business and operating results.
Existing and increased competition in the specialty retail and wholesale apparel industries may reduce our net revenues, profits and market share.
The specialty retail and wholesale apparel industries are each highly competitive. Our retail stores compete on the basis of, among other things, location, the breadth, quality, style, and availability of merchandise and the level of customer service offered and merchandise price. Our Anthropologie, Free People and Bhldn stores also face competition from small boutiques that offer an individualized shopping experience similar to the one we strive to provide to our target customers. Additionally, the internet and other new technologies facilitate competitive entry and comparison shopping in our Retail
11
segment. We strive to offer an omni-channel shopping experience for our customers and use social media and mobile applications as a way to interact with them to enhance their shopping experiences. Omni-channel retailing is constantly evolving and we must keep pace with changing customer expectations and new developments by our competitors. In addition, some of our third party vendors offer products directly to consumers and certain of our competitors. Our Wholesale segment competes with numerous wholesale companies based on the quality, fashion and price of its product offerings, many of whose products have a wider distribution. Many of our competitors have greater name recognition and greater financial, marketing and other resources than us. We cannot assure you that we will continue to be able to compete successfully against existing or future competitors. Due to difficult economic conditions our competitors may force a markdown or promotional sales environment which could impair our ability to achieve our historical profit margins. Our expansion into markets served by our competitors and entry of new competitors or expansion of existing competitors into our markets could have a material adverse effect on our business, financial condition and results of operations.
Our business depends on effective marketing and high customer traffic.
We have many initiatives in our marketing programs particularly with regard to our websites and mobile applications. If our competitors increase their spending on marketing, if our marketing expenses increase, if our marketing becomes less effective than that of our competitors, or if we do not adequately leverage technology and data analytics capabilities needed to generate concise competitive insight, we could experience a material adverse effect on our results of operations. A failure to sufficiently innovate or maintain adequate and effective marketing strategies could inhibit our ability to maintain brand relevance and drive increased sales.
We depend on key personnel and may not be able to retain or replace these employees or recruit additional qualified personnel, which would harm our business.
We believe that we have benefited substantially from the leadership and experience of our senior executives, including our co-founder, Chairman of the Board and Chief Executive Officer, Richard A. Hayne. The loss of the services of any of our senior executives could have a material adverse effect on our business and prospects, as we may not be able to find suitable management personnel to replace departing executives on a timely basis. In addition, if our senior executives do not fully integrate within the structure of our management team and core business, we may be adversely affected. We do not have an employment agreement with our Chief Executive Officer, or any other key personnel. In addition, as our business expands, we believe that our future success will depend greatly on our continued ability to attract and retain highly skilled and qualified personnel. There is a high level of competition for personnel in the retail industry. Our inability to meet our staffing requirements in the future could impair our ability to increase revenue and could otherwise harm our business.
Increases in labor costs, including wages, could adversely impact our operational results, financial condition, and results of operations.
Our retail store operations are subject to laws governing such matters as minimum wages, working conditions and overtime pay. As minimum wage rates increase or related laws and regulations change, we may need to increase not only the wage rates of our minimum wage employees, but also the wages paid to our other hourly or salaried employees as well. Any increase in the cost of our labor could have an adverse effect on our operating results, financial condition and results of operations. In
12
addition, wage actions by other retailers may require us to increase wage rates in order to attract and retain talented employees. Labor shortages and increased employee turnover could also increase our labor costs. This in turn could lead us to increase prices, which could adversely impact our sales. We are also subject to risks related to other store expenses and operational costs. Conversely, if competitive pressures or other factors prevent us from offsetting increased labor costs by increases in prices, our profitability may decline.
We could be materially and adversely affected if any of our distribution or fulfillment centers are damaged or closed or if their operations are diminished
We operate seven distribution and fulfillment facilities worldwide to support our Retail and Wholesale segments in the United States, Western Europe and Canada, including the fulfillment of catalog and website orders around the world. We also utilize a third-party distributor for certain home furnishings. The merchandise purchased for our United States and Canadian retail store operations is shipped directly to our distribution centers in Gap, Pennsylvania, and Reno, Nevada. Merchandise purchased for our direct-to-consumer operations is shipped directly to our fulfillment centers in Gap, Pennsylvania and Reno, Nevada. Merchandise purchased for our wholesale operations is shipped directly to our fulfillment centers in Trenton, South Carolina and Gap, Pennsylvania. The merchandise purchased for our Western Europe retail and direct-to-consumer operations is shipped to Rushden, England. Damage to, or disruption of the operations at, any of these facilities due to work stoppages, system failures, accidents, economic or weather conditions, natural disasters, demographic and population changes, as well as other unforeseen events and circumstances could have a material adverse effect on our financial condition, results of operations or cash flows. In addition, if any of our distribution or fulfillment centers were to close unexpectedly or operate significantly below historical efficiency levels for an extended period of time, the other centers may not be able to support the resulting additional volume demands. As a result, we could incur significantly higher costs and longer lead times associated with distributing our products to our stores and customers during the time it takes for us to re-open or replace the center.
We rely significantly on international sources of production.
We receive a substantial portion of our apparel and other merchandise from foreign sources, both purchased directly in foreign markets and indirectly through domestic vendors with foreign sources. To the extent that our vendors are located overseas or, in the case of third-party vendors, rely on overseas sources for a large portion of their products, any event causing a disruption of imports, including the imposition of increased security or regulatory requirements applicable to imported goods, war, public health concerns acts of terrorism and natural disasters could adversely affect our business. New initiatives may be proposed that may have an impact on the trading status of certain countries and may include retaliatory duties or other trade sanctions that, if enacted, could increase the cost of products purchased from suppliers in such countries or restrict the importation of products from such countries. If foreign sourced products become difficult or impossible to bring into the United States due to significant labor issues, such as strikes at any of our ports in the United States, and if we cannot obtain such merchandise from other sources at similar costs, our sales and profit margins may be adversely affected. The flow of products from our vendors could also be adversely affected by financial or political instability in any of the countries in which the products we purchase are manufactured, if the instability affects the production or export of merchandise from those countries. Moreover, in the event of a significant disruption in the supply of the fabrics or raw materials used by our vendors in the manufacture of our products, our vendors may not be able to locate alternative
13
suppliers of materials of comparable quality at an acceptable price, or at all. Trade restrictions in the form of tariffs or quotas, or both, applicable to the products we sell could also affect the importation of those products and could increase the cost and reduce the supply of products available to us. The cost of fuel is a significant component in transportation costs, therefore, increases in the petroleum products can adversely affect our gross margins. In addition, decreases in the value of the U.S. dollar relative to foreign currencies could increase the cost of products we purchase from overseas vendors.
Regulations related to "conflict minerals" will require us to incur additional expenses and could limit the supply and increase the cost of certain metals used in manufacturing our products.
The Dodd-Frank Wall Street Reform and Consumer Protection Act of 2010 contains provisions to improve transparency and accountability concerning the supply of minerals originating from the conflict zones of the Democratic Republic of Congo and adjoining countries. As a result, the SEC adopted new requirements for companies that manufacture products that contain certain minerals and metals, known as "conflict minerals," that are necessary to the functionality or production of products manufactured or contracted to be manufactured by public companies. We have developed a framework and management system and are currently performing due diligence on our supply chain. We have and expect to continue to incur additional costs to comply with these disclosure requirements, including costs related to determining the sources of the specified minerals used in our products, in addition to the cost of any changes to products, processes, or sources of supply as a consequence of such verification activities, which may adversely affect our business. In addition, the number of suppliers who provide "conflict-free" minerals may be limited, which may make it difficult to satisfy customers who require that all of the components of our products be certified as conflict-free, which could place us at a competitive disadvantage if we are unable to do so. There is also uncertainty relating to the requirements of the regulations as a result of ongoing litigation challenging the constitutionality of portions of the regulations. Most recently, we filed our annual Specialized Disclosure Report on Form SD with respect to these minerals on June 1, 2015, as required by the rules.
Our operating results fluctuate from period to period.
Our business experiences seasonal fluctuations in net sales and operating income, with a more significant portion of operating income typically realized in the fourth quarter of each year reflecting the year-end holiday period. Historically, and consistent with the retail industry, this seasonality also impacts our working capital requirements, particularly with regard to inventory. Any decrease in sales or margins during this period, or in the availability of working capital needed in the months preceding this period, could have a more material adverse effect on our business, financial condition and results of operations than in other periods. Seasonal fluctuations also affect our inventory levels, as we usually order merchandise in advance of peak selling periods and sometimes before new fashion trends are confirmed by customer purchases. We must carry a significant amount of inventory, especially before the holiday selling periods. If we are not successful in selling our inventory during this period, we may be forced to rely on markdowns or promotional sales to dispose of the inventory or we may not be able to sell the inventory at all, which could have a material adverse effect on our business, financial condition and results of operations.
We may be unable to protect our trademarks and other intellectual property rights.
We believe that our trademarks and service marks are important to our success and our competitive position due to their name recognition with our customers. We devote substantial
14
resources to the establishment and protection of our trademarks and service marks on a worldwide basis. We are not aware of any valid claims of infringement or challenges to our right to use any of our trademarks and service marks in the United States. Nevertheless, there can be no assurance that the actions we have taken to establish and protect our trademarks and service marks will be adequate to prevent imitation of our products by others or to prevent others from seeking to block sales of our products as a violation of the trademarks, service marks and intellectual property of others. Also, others may assert rights in, or ownership of, our trademarks and other intellectual property and we may not be able to successfully resolve these types of conflicts to our satisfaction. In addition, the laws of certain foreign countries may not protect proprietary rights to the same extent as do the laws of the United States.
War, terrorism, civil unrest or other violence may negatively impact availability of merchandise and/or otherwise adversely impact our business.
In the event of war, terrorism, civil unrest or other violence, our ability to obtain merchandise available for sale in our stores or on our websites may be negatively impacted. A substantial portion of our merchandise is imported from other countries, see "- We rely significantly on international sources of production." If commercial transportation is curtailed or substantially delayed, our business may be adversely impacted, as we may have difficulty shipping merchandise to our distribution and fulfillment centers and stores, as well as fulfilling catalog and website orders. Our stores are located in public areas where large numbers of people typically gather. Terrorist attacks, threats of terrorist attacks or civil unrest involving public areas could cause people not to visit areas where our stores are located. In addition, other types of violence in malls or in other public areas could lead to lower customer traffic in areas in which we operate stores. If any of these events were to occur, we may be required to suspend operations in some or all of our stores, which could have a material adverse impact on our business, financial condition and results of operations.
We may not be successful in introducing additional store concepts or brands.
We may, from time to time, seek to develop and introduce new concepts or brands in addition to our established brands. Our ability to succeed in the early stages of new concepts could require significant capital expenditures and management attention. Additionally, any new concept is subject to certain risks, including customer acceptance, competition, product differentiation, challenges relating to economies of scale in merchandise sourcing and the ability to attract and retain qualified personnel, including management and designers. There can be no assurance that we will be able to develop and grow these or any other new concepts to a point where they will become profitable, or generate positive cash flow. If we cannot successfully develop and grow these new concepts, our financial condition and results of operations may be adversely impacted.
We may develop new store concepts through acquisitions and we may not be successful in integrating those acquisitions.
Acquisitions involve numerous risks, including the diversion of our management's attention from other business concerns, the possibility that current operating and financial systems and controls may be inadequate to deal with our growth and the potential loss of key employees.
15
We also may encounter difficulties in integrating any businesses we may acquire with our existing operations. The success of these transactions depends on our ability to:
| • | successfully merge corporate cultures, operations and financial systems; |
| • | realize cost reduction synergies; and |
| • | as necessary, retain key personnel of acquired companies. |
In addition, there may be liabilities that we fail, or are unable, to discover in the course of performing due diligence investigations on any company that we may acquire, or have recently acquired. Also, there may be additional costs relating to acquisitions including, but not limited to, possible purchase price adjustments. Any of our rights to indemnification from sellers to us, even if obtained, may not be enforceable, collectible or sufficient in amount, scope or duration to fully offset the possible liabilities associated with the business or property acquired. Any such liabilities, individually or in the aggregate, could have a material adverse effect on our business and financial condition.
We rely on information technology systems and a material disruption or failure of such systems or technologies could adversely affect our business.
Our operations, in particular our direct-to-consumer sales, are subject to numerous risks, including reliance on third-party computer hardware/software, rapid technological change, diversion of sales from our stores, liability for online content, violations of state or federal laws, including those relating to online privacy, credit card fraud, risks related to the failure of the information technology systems that operate our websites, including computer viruses, telecommunications failures and electronic break-ins and similar disruptions. In addition, we regularly evaluate our information technology systems and have implemented modifications and/or upgrades to the information technology systems that support our business. Modifications include replacing legacy systems with successor systems, making changes to legacy systems or acquiring new systems with new functionality. There are inherent risks associated with replacing and modifying these systems, including inaccurate system information and system disruptions, which we may not be able to alleviate through testing, training, staging implementation and in-sourcing certain processes, or by securing appropriate commercial contracts with third-party vendors supplying such replacement and redundancy technologies. If our information systems or other technologies are damaged or cease to function properly, we may have to make a significant investment to fix or replace them, and we may suffer loss of critical data and interruptions or delays in our operations in the interim. Although we have not experienced any interruptions or shutdowns of our systems for any material length of time for the reasons described above, such disruptions could lead to delays in our business operations and, if significant, affect our sales and profitability.
If we are unable to safeguard against security breaches with respect to our information technology systems our business may be adversely affected.
During the course of business, we obtain and transmit confidential customer information through our information technology systems. The protection of customer, employee and Company data is critical. The regulatory environment surrounding information security and privacy is demanding, with the frequent imposition of new and changing requirements and heightened public awareness and scrutiny. While, to the best of our knowledge, we have not experienced any material misappropriation,
16
loss or other unauthorized disclosure of confidential or personally identifiable information as a result of a security breach or cyber attack, such a security breach or cyber attack could adversely affect our business and operations, including damaging our reputation and our relationships with our customers, employees and investors and exposing us to risks of litigation and liability. While we believe we are diligent in selecting vendors, systems and procedures to enable us to maintain the integrity of our systems, we recognize that there are inherent risks and we cannot assure that any future interruptions, shutdowns or unauthorized disclosures will not occur.
Manufacturers may not comply with our social compliance program requirements, which could adversely affect our reputation.
We have a manufacturer compliance program that is monitored on a regular basis by our buying offices. Our production facilities are either certified as in compliance with our program, or areas of improvement are identified and corrective follow-up action is taken. All manufacturers are required to follow applicable national labor laws, as well as international compliance standards regarding workplace safety, such as standards that require clean and safe working environments, clearly marked exits and paid overtime. We believe in protecting the safety and working rights of the people who manufacture the products we sell, while recognizing and respecting cultural and legal differences found throughout the world. We require our third party outside vendors to register through an online website and agree that they and their suppliers will abide by certain standards and conditions of employment. If our third party vendors fail to comply with our social compliance program, our reputation may be adversely affected.
Our results can be adversely affected by market disruptions.
Market disruptions due to severe weather conditions, natural disasters, health hazards, terrorist activities, financial crises, political crises or other major events or the prospect of these events can affect consumer spending and confidence levels which may result in financial losses or otherwise adversely affect our results or prospects in affected markets. The recovery we receive under any insurance we maintain for these purposes may be delayed or may be insufficient to fully offset our losses.
Changes in accounting standards and subjective assumptions, estimates and judgments by management related to complex accounting matters could significantly affect our financial results or financial condition.
Generally accepted accounting principles and related accounting pronouncements, implementation guidelines and interpretations with regard to a wide range of matters that are relevant to our business, including but not limited to revenue recognition, impairment of goodwill and intangible assets, inventory, income taxes and litigation, are highly complex and involve many subjective assumptions, estimates and judgments. Changes in these rules or their interpretation or changes in underlying assumptions, estimates or judgments could significantly change our reported or expected financial performance or financial condition.
We are subject to numerous regulations and legal matters that could adversely affect our business.
We are subject to customs, child labor, tax, employment, privacy, truth-in-advertising and other laws, including consumer protection regulations and zoning and occupancy ordinances that regulate
17
retailers generally and/or govern the importation, promotion and sale of merchandise and the operation of retail stores and distribution and fulfillment centers. Additional legal and regulatory requirements, and the fact that foreign laws occasionally conflict with domestic laws, have increased the complexity of the regulatory environment and the cost of compliance. If these laws change without our knowledge, or are violated by importers, designers, manufacturers or distributors, we could experience delays in shipments and receipt of products or be subject to fines or other penalties under the controlling regulations, any of which could adversely affect our business. Moreover, legal actions may be filed against us from time to time, including class actions. These actions may assert commercial, tort, intellectual property, customer, employment, data privacy, securities or other claims. We may also be impacted by litigation trends, including class action lawsuits involving consumers and shareholders, which could have a material adverse effect on our reputation, the market price of our common shares, or our results of operations, financial condition and cash flows.
Item 1B. Unresolved Staff Comments
We have no outstanding comments with the staff of the SEC.
Item 2. Properties
Since 2006, our home office has been located in several buildings on one campus in the historic core of the Philadelphia, Pennsylvania Navy Yard. The consolidated offices at the Navy Yard allow for an efficient operation of our Philadelphia-based offices and will help to support our growth needs for the foreseeable future. During fiscal 2015, we completed construction on a 93,000 square foot building which expanded our home offices to approximately 497,000 square feet. During fiscal 2014, we purchased a 122,000 square foot building in the Navy Yard, for future expansion. This building is leased to a third party through January 2017. In addition, we hold options that are available for at least the next ten years on several adjacent buildings that would allow for additional expansion if necessary.
During fiscal 2016, we entered into a lease agreement for approximately 8,000 square feet of office space in Los Angeles, California to support our design and production teams.
Our European home offices are located in London, England and consist of four leased properties totaling approximately 25,000 square feet. The leased properties have varying lease term expirations ranging from 2019 through 2024.
Our North American retail stores are supported by two distribution facilities. We own a 291,000 square foot distribution center in Gap, Pennsylvania, which supports approximately half of our retail stores. We lease a 214,500 square foot distribution facility in Reno, Nevada that supports the remaining half of our retail stores. The term of this operating lease is set to expire in June 2017 with Company options to renew for up to an additional ten years.
In fiscal 2016, we opened a new 1,000,000 square foot fulfillment center in Gap, Pennsylvania, which we own and operate. The new facility fulfills Retail segment customer orders and a portion of our Wholesale segment customer orders.
We lease a 459,000 square foot fulfillment center in Trenton, South Carolina. This facility currently services a portion of our Wholesale segment customer orders and processes all of our
18
Wholesale segment returns. In fiscal 2016, we transitioned all of the Retail segment fulfillment operations and a portion of the Wholesale segment operations from this location to our new facility in Gap, Pennsylvania. We plan to transition the remaining Wholesale segment operations to our new facility and close the Trenton facility when the lease expires in fiscal 2017.
We own a 463,000 square foot fulfillment center in Reno, Nevada that is used primarily to house and distribute merchandise to our western United States direct-to-consumer customers.
In fiscal 2014, we relocated our customer contact center to Martinez, Georgia. This leased facility consists of approximately 40,000 square feet and has a lease term expiring in fiscal 2019 with three five year renewal options.
We lease separate distribution and fulfillment centers in Rushden, England to support our retail and direct-to-consumer channels in Europe. The distribution center occupies approximately 98,000 square feet and the fulfillment center occupies approximately 142,000 square feet, which also includes our European customer contact center. The term of both of these leases are set to expire in September 2020.
Improvements in recent years, including those in fiscal 2016 described in Item 7: Management's Discussion and Analysis of Financial Condition and Results of Operations-Liquidity and Capital Resources, were necessary to adequately support our growth. We believe we may need to further expand the square footage of our home office to support our growth over the next several years. For more information on our distribution center properties, see Item 1: Business-Company Operations- Distribution . We believe that our facilities are well maintained and in good operating condition.
All of our stores are leased, well maintained and in good operating condition. Our retail stores are typically leased for a term of ten years with renewal options for an additional five to ten years. Total estimated selling square feet for stores open, under lease as of January 31, 2016, by Urban Outfitters, the Anthropologie Group and Free People was approximately 2,159,000, 1,517,000, and 203,000, respectively. The average store selling square feet is approximately 9,000 for Urban Outfitters, 7,000 for the Anthropologie Group and 1,800 for Free People. Selling square feet can sometimes change due to floor moves, use of staircases, cash register configuration and other factors.
The following table shows the location of each of our existing retail stores, as of January 31, 2016:
| Urban Outfitters | Anthropologie Group | Free People | Total | |||||||||||||
United States | 179 | 197 | 109 | 485 | ||||||||||||
Canada | 18 | 12 | 5 | 35 | ||||||||||||
Europe | 43 | 9 | - | 52 | ||||||||||||
|
|
|
|
|
|
|
| |||||||||
Global Total | 240 | 218 | 114 | 572 | ||||||||||||
|
|
|
|
|
|
|
| |||||||||
In addition to the stores listed above, Free People also operates wholesale sales and showroom facilities in New York City, London, Los Angeles and Chicago that are leased through 2017, 2018, 2019 and 2019, respectively.
19
Item 3. Legal Proceedings
We are party to various legal proceedings arising from normal business activities. Management believes that the ultimate resolution of these matters will not have a material adverse effect on our financial position, results of operations or cash flows.
Item 4. Mine Safety Disclosures
Not applicable.
20
PART II
Item 5. Market for Registrant's Common Equity, Related Shareholder Matters and Issuer Purchases of Equity Securities
Our common shares are traded on the NASDAQ Global Select Market under the symbol "URBN." The following table sets forth, for the periods indicated below, the reported high and low sale prices for our common shares as reported on the NASDAQ Global Select Market.
Market Information
| High | Low | |||||||
Fiscal 2016 | ||||||||
Quarter ended April 30, 2015 | $ | 47.25 | $ | 34.21 | ||||
Quarter ended July 31, 2015 | $ | 41.49 | $ | 32.12 | ||||
Quarter ended October 31, 2015 | $ | 33.32 | $ | 27.23 | ||||
Quarter ended January 31, 2016 | $ | 30.01 | $ | 19.26 | ||||
Fiscal 2015 | ||||||||
Quarter ended April 30, 2014 | $ | 38.84 | $ | 33.95 | ||||
Quarter ended July 31, 2014 | $ | 37.40 | $ | 32.23 | ||||
Quarter ended October 31, 2014 | $ | 40.67 | $ | 29.11 | ||||
Quarter ended January 31, 2015 | $ | 36.99 | $ | 27.89 | ||||
Holders of Record
On March 24, 2016 there were 111 holders of record of our common shares.
Dividend Policy
Our current credit facility includes certain limitations on the payment of cash dividends on our common shares. We have not paid any cash dividends since our initial public offering and do not anticipate paying any cash dividends on our common shares in the foreseeable future.
Securities Authorized for Issuance Under Equity Compensation Plans
All equity compensation plans have been approved by stockholders of the Company. See Note 9, "Share-Based Compensation," for details of the Company's equity compensation plans and outstanding awards.
21
Stock Performance
The following graph and table compares the cumulative total shareholder return on our common shares with the cumulative total return on the Standard and Poor's 500 Composite Stock Index and the Standard and Poor's 500 Apparel Retail Index for the period beginning January 31, 2011 and ending January 31, 2016, assuming the reinvestment of any dividends and assuming an initial investment of $100 in each. The comparisons in this table are required by the SEC and are not intended to forecast or be indicative of possible future performance of the common shares or the referenced indices.
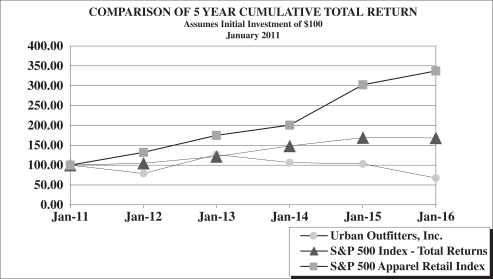
*$100 invested on 1/31/11 in stock or index, including reinvestment of dividends.
Fiscal years ending January 31.
| Base Period Jan-11 | INDEXED RETURNS Years Ended | |||||||||||||||||||||||
Company/Market/Peer Group | Jan-12 | Jan-13 | Jan-14 | Jan-15 | Jan-16 | |||||||||||||||||||
Urban Outfitters Inc. | $ | 100.00 | $ | 78.36 | $ | 126.56 | $ | 105.91 | $ | 103.08 | $ | 67.65 | ||||||||||||
S&P 500 | $ | 100.00 | $ | 104.22 | $ | 121.71 | $ | 147.90 | $ | 168.93 | $ | 167.80 | ||||||||||||
S&P 500 Apparel Retail | $ | 100.00 | $ | 131.87 | $ | 174.67 | $ | 200.34 | $ | 301.86 | $ | 336.69 | ||||||||||||
22
A summary of the repurchase of our common shares under the 2015 share repurchase program for the quarter ended January 31, 2016 is as follows:
| Total Number of Shares (or Units) Purchased | Average Price Paid per share (or Unit) | Total Number of Shares (or Units) Purchased as Part of Publicly Announced Plans or Programs | Maximum Number of Shares (or Units) that May Yet Be Purchased Under the Plans or Programs (1) | |||||||||||||
November 1, 2015 through November 30, 2015 | 3,151,080 | $ | 23.39 | 3,151,080 | 8,393,299 | |||||||||||
December 1, 2015 through December 31, 2015 | 1,073,540 | $ | 24.30 | 1,073,540 | 7,319,759 | |||||||||||
January 1, 2016 through January 31, 2016 | - | $ | - | - | 7,319,759 | |||||||||||
|
|
|
| |||||||||||||
Total | 4,224,620 | 4,224,620 | 7,319,759 | |||||||||||||
|
|
|
| |||||||||||||
| 1 | On February 23, 2015, the Company's Board of Directors authorized the repurchase of 20,000,000 shares under a share repurchase program. |
23
Item 6. Selected Financial Data
The following table sets forth selected consolidated income statement and balance sheet data for the periods indicated. The selected consolidated income statement and balance sheet data for each of the five fiscal years presented below is derived from our Consolidated Financial Statements. The data presented below should be read in conjunction with Item 7: Management's Discussion and Analysis of Financial Condition and Results of Operations and the Consolidated Financial Statements of the Company and the related notes thereto, which appear elsewhere in this Annual Report on Form 10-K. The results of operations for past accounting periods are not necessarily indicative of the results to be expected for any future accounting period.
| Fiscal Year Ended January 31, | ||||||||||||||||||||
| 2016 | 2015 | 2014 | 2013 | 2012 | ||||||||||||||||
| (in thousands, except share amounts and per share data) | ||||||||||||||||||||
Income Statement Data: | ||||||||||||||||||||
Net sales | $ | 3,445,134 | $ | 3,323,077 | $ | 3,086,608 | $ | 2,794,925 | $ | 2,473,801 | ||||||||||
Gross profit | 1,201,902 | 1,174,930 | 1,161,342 | 1,031,531 | 860,536 | |||||||||||||||
Income from operations | 353,579 | 365,385 | 426,831 | 374,285 | 284,725 | |||||||||||||||
Net income | 224,489 | 232,428 | 282,360 | 237,314 | 185,251 | |||||||||||||||
Net income per common share-basic | $ | 1.79 | $ | 1.70 | $ | 1.92 | $ | 1.63 | $ | 1.20 | ||||||||||
Weighted average common shares outstanding-basic | 125,232,499 | 136,651,899 | 147,014,869 | 145,253,691 | 154,025,589 | |||||||||||||||
Net income per common share-diluted | $ | 1.78 | $ | 1.68 | $ | 1.89 | $ | 1.62 | $ | 1.19 | ||||||||||
Weighted average common shares outstanding-diluted | 126,013,414 | 138,192,734 | 149,225,906 | 146,663,731 | 156,191,289 | |||||||||||||||
Balance Sheet Data: | ||||||||||||||||||||
Working capital | $ | 505,130 | $ | 455,377 | $ | 663,150 | $ | 622,089 | $ | 363,526 | ||||||||||
Total assets | 1,833,301 | 1,888,741 | 2,221,214 | 1,797,211 | 1,483,708 | |||||||||||||||
Total liabilities | 696,074 | 560,772 | 527,044 | 442,623 | 417,440 | |||||||||||||||
Total shareholders' equity | $ | 1,137,227 | $ | 1,327,969 | $ | 1,694,170 | $ | 1,354,588 | $ | 1,066,268 | ||||||||||
24
Item 7. Management's Discussion and Analysis of Financial Condition and Results of Operations
Overview
We operate two reportable segments: a leading lifestyle specialty Retail segment and a Wholesale segment. Our Retail segment consists of our Urban Outfitters, Anthropologie, Free People, Terrain and Bhldn brands, whose merchandise is sold directly to our customers through retail stores, websites, mobile applications, catalogs and customer contact centers. Our Wholesale segment consists of the Free People wholesale division that primarily designs, develops and markets young women's contemporary casual apparel and shoes through individual and chain specialty stores and department stores.
Our fiscal year ends on January 31. All references to our fiscal years refer to the fiscal years ended on January 31 in those years. For example, our fiscal year 2016 ended on January 31, 2016.
Retail Segment
Our omni-channel strategy enhances our customers' brand experience by providing a seamless approach to the customer shopping experience. We have substantially integrated all available shopping channels, including stores, websites (online and through mobile devices) and catalogs. Our investments in areas such as marketing campaigns and technology advancements are designed to generate demand for the omni-channel and not the separate store or direct-to-consumer channels. Store sales are primarily fulfilled from that store's inventory, but may also be shipped from any of our fulfillment centers or from a different store location if an item is not available at the original store. Direct-to-consumer orders are primarily shipped to our customers through our fulfillment centers, but may also be shipped from any store, or a combination of fulfillment centers and stores depending on the availability of particular items. Direct-to-consumer orders may also be picked up at a store location. As our customers continue to shop across multiple channels, we have adapted our approach towards meeting this demand. Due to the availability of like product in a variety of shopping channels, we now source these products utilizing single stock keeping units based on the omni-channel demand rather than the demand of the separate channels. These and other technological capabilities allow us to better serve our customers and help us complete sales that otherwise may not have occurred due to out-of-stock positions. As a result of changing customer behavior and the substantial integration of the operations of our store and direct-to-consumer channels, we manage and analyze our performance based on a single omni-channel rather than separate channels and believe that the omni-channel results present the most meaningful and appropriate measure of our performance.
Our comparable Retail segment net sales data is equal to the sum of our comparable store and comparable direct-to-consumer channel net sales. A store is considered to be comparable if it has been open at least twelve full months, unless it was materially expanded or remodeled within that year or was not otherwise operating at its full capacity within that year. A direct-to-consumer channel is considered to be comparable if it has been operational for at least twelve full months. There is no overlap between comparable store net sales and comparable direct-to-consumer net sales. Sales from stores and direct-to-consumer channels that do not fall within the definition of comparable store or channel are considered to be non-comparable. The effects of foreign currency translation are also considered non-comparable.
We monitor customer traffic and customer conversion rates at our stores, and customer sessions, average order value and conversion rates on our websites. We believe that changes in any of these
25
metrics may be caused by a response to our brands' fashion offerings, our marketing campaigns, circulation of our catalogs and an overall growth in brand recognition as we expand our store base.
As of January 31, 2016, we operated 240 Urban Outfitters stores of which 179 were located in the United States, 18 were located in Canada and 43 were located in Europe. During fiscal 2016, we opened four new Urban Outfitters stores, of which two were located in the United States and two were located in Canada, and we closed two stores in the United States. Total store selling square footage as of January 31, 2016 was 2.2 million and was flat as compared to the prior year. Urban Outfitters operates websites in North America and Europe that capture the spirit of the brand by offering a similar yet broader selection of merchandise as found in our stores. Urban Outfitters offers a catalog in Europe offering select merchandise, most of which is also available in our Urban Outfitters stores. Urban Outfitters targets young adults aged 18 to 28 through a unique merchandise mix, compelling store environment and websites. Urban Outfitters' product offering includes women's and men's fashion apparel, intimates, footwear, beauty and accessories, activewear and gear, electronics, as well as an eclectic mix of apartment wares and gifts. We plan to open additional stores over the next several years. Urban Outfitters' North American and European Retail segment net sales accounted for approximately 32.5% and 8.0% of consolidated net sales, respectively, for fiscal 2016, compared to 32.9% and 8.8%, respectively, for fiscal 2015.
The Anthropologie Group consists of the Anthropologie, Bhldn and Terrain brands. We initially operated the Bhldn and Terrain brands as standalone concepts and opened two Bhldn stores and two Terrain garden centers. We ultimately determined that the Bhldn and Terrain brands were complementary to the Anthropologie brand and integrated those brands with the Anthropologie brand during fiscal 2015 and 2016, respectively, to form the Anthropologie Group. As of January 31, 2016, we operated 218 Anthropologie Group stores, of which 197 were located in the United States, 12 were located in Canada and nine were located in Europe. During fiscal 2016, we opened 14 new Anthropologie Group stores, of which 12 were located in the United States and two were located in Europe, and we closed two stores in the United States. Total store selling square footage as of January 31, 2016 increased 4.7% over the prior year period to 1.5 million. The Anthropologie Group operates websites in North America and Europe that capture the spirit of our brands by offering a similar yet broader selection of merchandise as found in our stores. The Anthropologie brand offers registry services through our website and mobile applications and in all of our stores throughout the United States, allowing our customers to create gift registries for any occasion. The Anthropologie brand offers a catalog in North America and in Europe that markets select merchandise, most of which is also available in our Anthropologie brand stores. The Anthropologie brand tailors its merchandise to sophisticated and contemporary women aged 28 to 45. The Anthropologie brand's product assortment includes women's casual apparel and accessories, intimates, shoes, beauty, home furnishings and a diverse array of gifts and decorative items. The Bhldn brand offers a curated collection of heirloom quality wedding gowns, bridesmaid frocks, party dresses, assorted jewelry, headpieces, footwear, lingerie and decorations. The Terrain brand is designed to appeal to women and men interested in a creative and sophisticated outdoor living and gardening experience. Merchandise includes lifestyle home and garden products combined with antiques, live plants, flowers, wellness products and accessories. Both Terrain garden centers also offer a full service restaurant and coffee bar. We plan to open additional Anthropologie brand stores over the next several years, some of which will include Bhldn or Terrain shop-within-shop concepts. The Anthropologie Group's North American and European Retail segment net sales accounted for approximately 40.2% and 1.6% of consolidated net sales, respectively, for fiscal 2016, compared to 40.1% and 1.5%, respectively, for fiscal 2015.
26
As of January 31, 2016, we operated 114 Free People stores, of which 109 were located in the United States and five were located in Canada. During fiscal 2016, we opened 13 new Free People stores, of which 12 were located in the United States and one was located in Canada, and we closed one store located in the United States due to lease expiration. Total store selling square footage as of January 31, 2016, increased 27.8% over the prior year period to 203,000. Free People operates websites in North America, Europe and Asia that capture the spirit of the brand by offering a similar yet broader selection of merchandise as found in our stores, as well as substantially all of the Free People wholesale offerings. Free People also offers a catalog that markets select merchandise, most of which is also available in our Free People stores. Free People focuses its product offering on private label merchandise targeted to young contemporary women aged 25 to 30. Free People provides a unique merchandise mix of casual women's apparel, intimates, shoes, activewear, accessories, home products and gifts. We plan to open additional stores over the next several years. Free People's Retail segment net sales accounted for approximately 10.1% of consolidated net sales for fiscal 2016, compared to approximately 9.2% for fiscal 2015.
For all brands combined, we plan to open approximately 27 new stores during fiscal 2017, including five Urban Outfitters stores, ten Anthropologie Group stores and 12 Free People stores.
Wholesale Segment
Our Wholesale segment consists of the Free People wholesale division that designs, develops and markets young women's contemporary casual apparel. Free People's range of tops, bottoms, sweaters, dresses, intimates, shoes and activewear are sold through approximately 1,800 better department and specialty stores worldwide, and our own Free People stores. Our Wholesale segment net sales accounted for approximately 7.6% of consolidated net sales for fiscal 2016, compared to 6.8% for fiscal 2015.
Critical Accounting Policies and Estimates
Our Consolidated Financial Statements have been prepared in accordance with generally accepted accounting principles in the United States. These generally accepted accounting principles require management to make estimates and assumptions that affect the reported amounts of assets, liabilities, net sales and expenses during the reporting period.
Our senior management has reviewed the critical accounting policies and estimates with our Audit Committee. Our significant accounting policies are described in Note 2, "Summary of Significant Accounting Policies," in the Notes to our Consolidated Financial Statements. We believe that the following discussion addresses our critical accounting policies, which are those that are most important to the portrayal of our financial condition, results of operations and cash flows and require management's most difficult, subjective and complex judgments, often as a result of the need to make estimates about the effect of matters that are inherently uncertain. If actual results were to differ significantly from estimates made, the reported results could be materially affected. We are not currently aware of any reasonably likely events or circumstances that would cause our actual results to be materially different from our estimates.
27
Revenue Recognition
We recognize revenue in our Retail segment at the point-of-sale for merchandise the customer takes possession of at our store or when merchandise is shipped to the customer, in each case, net of estimated customer returns. Revenue is recognized by our Wholesale segment when merchandise is shipped to the customer, net of estimated customer returns. Revenue is presented on a net basis and does not include any tax assessed by a governmental or municipal authority. Payment for merchandise in our Retail segment is tendered by cash, check, credit card, debit card or gift card. Therefore, uncollectible accounts receivable for our Retail segment is negligible and primarily results from unauthorized credit card transactions. We maintain an allowance for doubtful accounts for the Wholesale segment accounts receivable, which we review on a regular basis and believe is sufficient to cover potential credit losses and billing adjustments.
We account for a gift card transaction by recording a liability at the time the gift card is issued to the customer in exchange for consideration from the customer. A liability is established and remains on our books until the card is redeemed by the customer, at which time we record the redemption of the card for merchandise as a sale, or when we determine the likelihood of redemption is remote. We determine the probability of the gift cards being redeemed to be remote based on historical redemption patterns. Revenues attributable to the reduction of gift card liabilities for which the likelihood of redemption becomes remote are included in sales and are not material. Our gift cards do not expire.
Sales Return Reserve
We record a reserve for estimated product returns where the sale has occurred during the period reported, but the return is likely to occur subsequent to the period reported. The reserve for estimated product returns is based on our most recent historical return trends. If the actual return rate is materially different than our estimate, sales returns would be adjusted in the future. As of January 31, 2016 and 2015, reserves for estimated sales returns totaled $24.4 million and $19.8 million, representing 3.5% and 3.5% of total liabilities, respectively.
Marketable Securities
All of our marketable securities as of January 31, 2016 and January 31, 2015 are classified as available-for-sale and are carried at fair value, which approximates amortized cost. Interest on these securities, as well as the amortization of discounts and premiums, is included in "Interest income" in the Consolidated Statements of Income. We record unrealized gains and losses on these securities (other than mutual funds, held in the rabbi trust for the Urban Outfitters, Inc. Non-qualified Deferred Compensation Plan (See Note 3, "Marketable Securities," in the Notes to Consolidated Financial Statements)) as a component of "Other comprehensive (loss) income" in the Consolidated Statements of Comprehensive Income and in "Accumulated other comprehensive loss" within "Shareholders' equity" until realized, except when we consider declines in value to be other than temporary. Other than temporary impairment losses related to credit losses are considered to be realized losses. Mutual funds held in the rabbi trust have been accounted for under the fair value option, which results in all unrealized gains and losses being recorded in "Interest income" in the Consolidated Statements of Income. When available-for-sale securities are sold, the cost of the securities is specifically identified and is used to determine the realized gain or loss. Securities classified as current assets have maturity dates of less than or equal to one year from the balance sheet date. Securities classified as non-current assets have maturity dates greater than one year from the balance sheet date.
28
Inventory
We value our inventory, which consists primarily of general consumer merchandise held for sale, at the lower of cost or market. Cost is determined on the first-in, first-out method and includes the cost of merchandise and import related costs, including freight, import taxes and agent commissions. A periodic review of inventory is performed in order to determine if inventory is properly stated at the lower of cost or market. Factors we consider in our review, such as future expected consumer demand and fashion trends, current aging, current and anticipated retail markdowns or wholesale discounts and class or type of inventory, are analyzed to determine estimated net realizable value. Criteria that we consider in our review of aging trends include average selling cycle and seasonality of merchandise, the historical rate at which merchandise has sold below cost during the prior twelve months and the value and nature of merchandise currently priced below original cost. A provision is recorded to reduce the cost of inventory to its estimated net realizable value, if appropriate. Any significant unanticipated changes in the factors noted above could have a significant impact on the value of our inventory and our reported operating results. Our estimates generally have been accurate and our reserve methods have been applied on a consistent basis. We expect the amount of our provision and related inventory to increase over time as we increase our sales. The majority of inventory at January 31, 2016, and 2015 consisted of finished goods. Raw materials and work-in-process were not material to the overall inventory value. Inventory as of January 31, 2016 and 2015 totaled $330.2 million and $358.2 million, representing 18.0% and 19.0% of total assets, respectively.
Long-Lived Assets
Our long-lived assets consist principally of store leasehold improvements, buildings, furniture and fixtures, and other operating equipment and are included in the "Property and equipment, net" line item in our Consolidated Balance Sheets. Store leasehold improvements are recorded at cost and are amortized using the straight-line method over the lesser of the applicable store lease term, including lease renewals which are reasonably assured, or the estimated useful life of the leasehold improvements. The typical initial lease term for our stores is ten years. Buildings are recorded at cost and are amortized using the straight-line method over 39 years. Furniture and fixtures are recorded at cost and are amortized using the straight-line method over their useful life, which is typically five years. Other operating equipment is recorded at cost and amortized using the straight-line method over its useful life, which is three to ten years. Net property and equipment as of January 31, 2016 and 2015 totaled $863.1 million and $889.2 million, representing 47.1% and 47.1% of total assets, respectively.
We have not historically encountered material early retirement charges related to our long-lived assets. The cost of assets sold or retired and the related accumulated depreciation or amortization is removed from the accounts with any resulting gain or loss included in net income. Maintenance and repairs are charged to expense as incurred. Major renovations or improvements that extend the service lives of our assets are capitalized over the lesser of the extension period, life of the improvement, or the remaining term of the lease.
Impairment of Long-lived Assets, Goodwill and Intangible Assets
We periodically review the carrying values of our long-lived assets whenever events or changes in circumstances indicate that the carrying value may not be recoverable. Events that result in an impairment review include plans to close a store, distribution or fulfillment center or a significant decrease in the operating results of a long-lived asset. Our retail stores are reviewed for impairment at
29
the store level, which is the lowest level at which individual cash flows can be identified. Newly opened stores may take time to generate positive operating and cash flow results. Factors such as store type (e.g., mall versus free-standing), store location (e.g., urban area versus college campus or suburb), current marketplace awareness of our brands, local customer demographic data and current fashion trends are all considered in determining the time frame required for a store to achieve positive financial results, which, in general, is assumed to be within three years from the date a store location has opened. In assessing an asset for potential impairment, we make estimates regarding future operating results, cash flows and estimated useful life. When events indicate that an asset may be impaired and the estimated undiscounted cash flows are less than the carrying amount of the asset, the impaired asset is adjusted to its estimated fair value and an impairment loss is recorded. We have not made any material changes in the methodology to assess and calculate impairment of long-lived assets in the past three fiscal years. During fiscal 2016, we recorded impairment charges for five retail stores, totaling $8.9 million, of which $7.4 million is in "Cost of sales" and $1.5 million is in "Selling, general and administrative expenses," in the Consolidated Statements of Income. During our assessment of current and future performance it was determined that these stores would not be able to generate sufficient cash flow over the expected remaining lease term to recover the carrying value of the respective store assets. Impairment charges for fiscal 2015 and 2014 were immaterial.
Accounting for Income Taxes
As part of the process of preparing our Consolidated Financial Statements, we are required to estimate our income taxes in each of the tax jurisdictions in which we operate. This process involves estimating our actual current tax obligations together with assessing temporary differences resulting from differing treatment of certain items for tax and accounting purposes, such as depreciation of property and equipment and valuation of inventories. These temporary differences result in deferred tax assets and liabilities, which are included within our Consolidated Balance Sheets. We then assess the likelihood that our deferred tax assets will be recovered from future taxable income. A valuation allowance is recognized if, based on the weight of available evidence, it is more-likely-than-not that some portion, or all, of the deferred tax asset will not be realized. In making such a determination, we consider all material available positive and negative evidence, including future reversals of existing taxable temporary differences, projected future taxable income, tax-planning strategies, and results of recent operations. Actual results could differ from this assessment if adequate taxable income is not generated in future periods. Net deferred tax assets as of January 31, 2016 and January 31, 2015 totaled $54.2 million and $68.7 million, representing 3.0% and 3.6% of total assets, respectively.
To the extent we believe that recovery of a deferred tax asset is at risk, we establish valuation allowances. To the extent we establish valuation allowances or increase the allowances in a period, we record additional income tax expense in the Consolidated Statements of Income. Valuation allowances were $6.6 million as of January 31, 2016 and $0.1 million as of January 31, 2015, respectively. Valuation allowances are based on evidence of our ability to generate sufficient taxable income in certain foreign and state jurisdictions. In the future, if enough evidence of our ability to generate sufficient future taxable income in these jurisdictions becomes apparent, we would be required to reduce our valuation allowances, resulting in a reduction in income tax expense in the Consolidated Statements of Income. On a quarterly basis, management evaluates the likelihood that we will realize the deferred tax assets and adjusts the valuation allowances, if appropriate.
We record uncertain tax positions on the basis of a two-step process whereby (1) we determine whether it is more-likely-than-not that the tax positions will be sustained on the basis of the technical
30
merits of the position and (2) for those tax positions that meet the more-likely-than-not recognition threshold, we recognize the largest amount of tax benefit that is more than 50 percent likely to be realized upon ultimate settlement with the related tax authority.
Our tax liability for uncertain tax positions contains uncertainties because we are required to make assumptions and to apply judgment to estimate the exposures associated with our various filing positions. Although we believe that the judgments and estimates discussed herein are reasonable, actual results may differ, and we may be exposed to income tax expenses or benefits that could be material.
We consider certain earnings of non-U.S. subsidiaries to be indefinitely invested outside the United States on the basis of estimates that future United States cash generation will be sufficient to meet future United States cash needs and our specific plans for reinvestment of those subsidiaries' earnings. Should we decide to repatriate the foreign earnings, we would need to adjust our income tax provision in the period we determined that the earnings will no longer be indefinitely invested outside the United States.
Accounting for Contingencies
From time to time, we are named as a defendant in legal actions arising from our normal business activities. We are required to record a reserve for estimated losses when information available prior to issuance of our financial statements indicates that it is probable that a liability has been incurred at the date of the financial statements and the amount of the loss can be reasonably estimated. Accounting for contingencies arising from contractual disputes or legal proceedings requires management to use its best judgment when estimating an accrual related to such contingencies. As additional information becomes known, our reserves for loss contingencies could fluctuate, thereby creating variability in our results of operations from period to period. Likewise, an actual loss arising from a loss contingency which significantly exceeds our reserve could have a material adverse impact on our operating results for the period in which such actual loss becomes known. We believe that our reserves adequately reflect the anticipated final outcome of any matter currently pending against us and the ultimate settlement of such matters will not materially affect our financial position or results of operations.
Share-Based Compensation
Accounting for share-based compensation requires measurement of compensation cost for all share-based awards at fair value on the date of grant and recognition of compensation over the service period, net of estimated forfeitures.
We use a lattice binomial pricing model to determine the fair value of our stock options and stock appreciation rights. This model uses assumptions including the risk-free rate of interest, expected volatility of our stock price and expected life of the awards. A Monte Carlo simulation, which utilizes similar assumptions, is used to determine the fair value of performance-based awards. We review our assumptions and the valuations provided by independent third-party valuation advisors in order to determine the fair value of share-based compensation awards at the date of grant. The assumptions used in calculating the fair value of these share-based payment awards represent our best estimates, but these estimates involve inherent uncertainties and the application of judgment. Changes in these assumptions can materially affect the fair value estimate.
31
Additionally, we make certain estimates about the number of awards which will become vested under performance-based incentive plans. We record expense for performance-based awards based on our current expectations of the probable number of awards that will ultimately vest. The estimation of awards that will ultimately vest requires judgment, and to the extent actual results or updated estimates differ from our current estimates, such amounts will be recorded as a cumulative adjustment in the period estimates are revised and could be materially different from share-based compensation expense recorded in prior periods.
We also estimate the expected forfeiture rate. We consider many factors when estimating expected forfeitures, including types of awards and historical experience. We revise our forfeiture rates, when necessary, in subsequent periods if actual forfeitures differ from those originally estimated. As a result, if the actual forfeiture rate is different from the estimate at the completion of the vesting period, the share-based compensation expense may not be comparable to amounts recorded in prior periods.
Results of Operations
As a Percentage of Net Sales
The following table sets forth, for the periods indicated, the percentage of our net sales represented by certain income statement data and the change in certain income statement data from period to period. This table should be read in conjunction with the discussion that follows:
| Fiscal Year Ended January 31, | ||||||||||||
| 2016 | 2015 | 2014 | ||||||||||
Net sales | 100.0 | % | 100.0 | % | 100.0 | % | ||||||
Cost of sales | 65.1 | 64.6 | 62.4 | |||||||||
|
|
|
|
|
| |||||||
Gross profit | 34.9 | 35.4 | 37.6 | |||||||||
Selling, general and administrative expenses | 24.6 | 24.4 | 23.8 | |||||||||
|
|
|
|
|
| |||||||
Income from operations | 10.3 | 11.0 | 13.8 | |||||||||
Interest income | - | 0.1 | 0.1 | |||||||||
Other expenses | (0.1 | ) | (0.2 | ) | - | |||||||
|
|
|
|
|
| |||||||
Income before income taxes | 10.2 | 10.9 | 13.9 | |||||||||
Income tax expense | 3.7 | 3.9 | 4.7 | |||||||||
|
|
|
|
|
| |||||||
Net income | 6.5 | % | 7.0 | % | 9.2 | % | ||||||
|
|
|
|
|
| |||||||
Period over Period Change: | ||||||||||||
Net sales | 3.7 | % | 7.7 | % | 10.4 | % | ||||||
Gross profit | 2.3 | % | 1.2 | % | 12.6 | % | ||||||
Income from operations | -3.2 | % | -14.4 | % | 14.0 | % | ||||||
Net income | -3.4 | % | -17.7 | % | 19.0 | % | ||||||
Fiscal 2016 Compared to Fiscal 2015
Net sales in fiscal 2016 increased by 3.7% to $3.4 billion, from $3.3 billion in fiscal 2015. The $122.1 million increase was attributable to a $87.7 million, or 2.8%, increase in Retail segment net
32
sales and a $34.4 million, or 15.2%, increase in Wholesale segment net sales. Retail segment net sales for fiscal 2016 accounted for 92.4% of total net sales compared to 93.2% of total net sales during fiscal 2015.
The growth in our Retail segment net sales during fiscal 2016 was due to an increase of $47.4 million, or 1.6%, in Retail segment comparable net sales, which includes our direct-to-consumer channel, and an increase of $40.3 million in non-comparable and new store net sales. Our total company comparable Retail segment net sales increase was comprised of increases of 9.0%, 1.4% and 0.4% at Free People, Urban Outfitters and Anthropologie Group, respectively. The increase in Retail segment comparable net sales was driven by continued growth in the direct-to-consumer channel which was partially offset by negative comparable store net sales. Direct-to-consumer net sales were driven by an increase in sessions, orders, average order value and conversion rate. The negative comparable store net sales resulted from a reduction in store traffic, transactions and units per transaction, which were partially offset by an increase in average unit selling price. The increase in net sales attributable to non-comparable and new stores was primarily the result of opening 69 new stores in fiscal 2016 and 2015 that were not in operation for the full comparable periods. Thus far during the first quarter of fiscal 2017, comparable Retail segment net sales are low single-digit positive which includes the benefit of a leap year.
The increase in Wholesale segment net sales during fiscal 2016, as compared to fiscal 2015, was due to increased sales at both department stores and specialty accounts. Wholesale sales growth was driven by an increase in units that was partially offset by a decrease in average unit selling price.
Gross profit percentage in fiscal 2016 decreased to 34.9% of net sales, from 35.4% of net sales in fiscal 2015. Gross profit increased to $1.20 billion in fiscal 2016 compared to $1.17 billion in fiscal 2015. The decrease in the gross profit percentage was primarily driven by higher delivery and fulfillment center expenses largely related to incremental costs associated with the Gap, Pennsylvania fulfillment center transition and increased direct-to-consumer sales penetration. The decrease in the gross profit percentage was additionally driven by impairment charges for five retail stores. Total inventory at January 31, 2016 decreased by $28.0 million, or 7.8%, to $330.2 million from $358.2 million at January 31, 2015. This decrease was primarily related to the decline in comparable Retail segment inventories, which decreased 6% at cost and 8% in units.
Selling, general and administrative expenses as a percentage of net sales increased during fiscal 2016 to 24.6% of net sales, compared to 24.4% of net sales for fiscal 2015. The increase was primarily due to increased marketing expenses to support our customer acquisition and retention efforts and an increase in technology related expenses used to support our omni-channel initiatives. Selling, general and administrative expenses increased by $38.8 million, or 4.8%, to $848.3 million, in fiscal 2016, from $809.5 million in fiscal 2015. The dollar increase versus the prior year was primarily related to increased marketing and technology expenses and the operating expenses of new stores.
Income from operations decreased to 10.3% of net sales, or $353.6 million, for fiscal 2016 compared to 11.0%, or $365.4 million, for fiscal 2015.
Our effective tax rate for fiscal 2016 was 35.9% of income before income taxes compared to 36.0% of income before income taxes in fiscal 2015. See Note 8, "Income Taxes," in the Notes to our Consolidated Financial Statements, for a reconciliation of the statutory U.S. federal income tax rate to our effective tax rate.
33
Fiscal 2015 Compared to Fiscal 2014
Net sales in fiscal 2015 increased by 7.7% to $3.3 billion, from $3.1 billion in fiscal 2014. The $236.5 million increase was attributable to a $188.3 million, or 6.5%, increase in Retail segment net sales and a $48.2 million, or 27.1%, increase in Wholesale segment net sales. Retail segment net sales for fiscal 2015 accounted for 93.2% of total net sales compared to 94.2% of total net sales during fiscal 2014.
The growth in Retail segment net sales during fiscal 2015 was driven by an increase of $144.7 million in non-comparable and new store net sales and an increase of $43.6 million, or 1.6%, in Retail segment comparable net sales, which includes our direct-to-consumer channel. Our total company comparable Retail segment net sales increase was comprised of increases of 19.2% and 5.8% at Free People and the Anthropologie Group, respectively, and was partially offset by a decrease of 5.6% at Urban Outfitters. The increase in Retail segment comparable net sales was driven by continued growth in the direct-to-consumer channel for all brands partially offset by negative comparable store net sales. Direct-to-consumer net sales were driven by an increase in sessions, orders, average order value and conversion rate. The negative comparable store net sales resulted from a reduction in transactions and units per transaction, which were partially offset by an increase in average unit selling price. The increase in net sales attributable to non-comparable and new stores was primarily the result of opening 76 new stores in fiscal 2015 and 2014 that were not in operation for the full comparable periods.
The increase in Wholesale segment net sales during fiscal 2015, as compared to fiscal 2014, was due to increased sales at both department stores and specialty accounts. Wholesale sales growth was driven by an increase in units that was partially offset by a decrease in average unit selling price.
Gross profit percentage in fiscal 2015 decreased to 35.4% of net sales, from 37.6% of net sales in fiscal 2014. Gross profit increased to $1.17 billion in fiscal 2015 compared to $1.16 billion in fiscal 2014. The decrease in gross profit percentage occurred primarily due to lower initial merchandise markups, store occupancy deleverage due to negative store comparable net sales and higher markdowns, which were primarily driven by the underperformance at the Urban Outfitters brand. Total inventories at January 31, 2015 increased by $47.0 million, or 15.1%, to $358.2 million from $311.2 million at January 31, 2014. This increase was primarily related to the acquisition of inventories to stock new and non-comparable stores and comparable Retail segment inventories. Comparable Retail segment inventories as of January 31, 2015 increased 6.5% at cost while decreasing 7.2% in units.
Selling, general and administrative expenses as a percentage of net sales increased during fiscal 2015 to 24.4% of net sales, compared to 23.8% of net sales for fiscal 2014. The increase was primarily due to increased marketing and technology expenses that were used to drive higher direct-to-consumer traffic. Selling, general and administrative expenses increased by $75.0 million, or 10.2%, to $809.5 million, in fiscal 2015, from $734.5 million in fiscal 2014. The dollar increase versus the prior year was primarily related to increased marketing and technology expenses and the operating expenses of new stores.
Income from operations decreased to 11.0% of net sales, or $365.4 million, for fiscal 2015 compared to 13.8%, or $426.8 million, for fiscal 2014.
Our effective tax rate for fiscal 2015 was 36.0% of income before income taxes compared to 34.0% of income before taxes in fiscal 2014. The increase in the effective tax rate is primarily due to
34
the recognition of a one-time federal rehabilitation credit in fiscal 2014 related to the expansion of the Company's home office and the release of foreign valuation allowances. See Note 8, "Income Taxes," in the Notes to our Consolidated Financial Statements, for a reconciliation of the statutory U.S. federal income tax rate to our effective tax rate.
Liquidity and Capital Resources
Cash, cash equivalents and marketable securities were $362.9 million as of January 31, 2016, as compared to $363.3 million as of January 31, 2015 and $890.3 million as of January 31, 2014. We generated $413.4 million in cash from operations, received $46.4 million in proceeds from stock option exercises and borrowed $150.0 million on our long-term debt facility to repurchase $465.3 million in common shares under the share repurchase programs and to invest $135.0 million in property and equipment. Our working capital was $505.1 million at January 31, 2016 compared to $455.4 million at January 31, 2015 and $663.2 million at January 31, 2014. The increase in working capital as compared to January 31, 2015 was primarily due to the net increase in cash, cash equivalents and current marketable securities.
During the last three years, we have satisfied our cash requirements primarily through our cash flow from operating activities. In fiscal 2016 we utilized borrowings on our long-term debt facility as an additional source of cash that were used for the repurchase of our common shares. Our primary uses of cash have been to repurchase common shares, open new stores, purchase inventory and expand our home offices and fulfillment facilities. We have also continued to invest in our omni-channel capabilities, technology and our international operations. Cash paid for property and equipment for fiscal 2016, 2015 and 2014 was $135.0 million, $229.8 million and $186.1 million, respectively, and was used primarily to expand our store base and home offices and increase our fulfillment capabilities.
Cash Flows from Operating Activities
Cash provided by operating activities for fiscal 2016 increased by $91.1 million to $413.4 million from $322.3 million in fiscal 2015. For both periods, our major source of cash from operations was merchandise sales and our primary use of cash was for the payment of operational costs. This increase in cash provided from operating activities was primarily due to lower inventory levels in fiscal 2016 as compared to fiscal 2015.
Cash Flows from Investing Activities
Cash used in investing activities during fiscal 2016 was $26.8 million, primarily related to purchases of marketable securities and property and equipment, partially offset by the sales and maturities of marketable securities.
Cash Flows from Financing Activities
Cash used in financing activities during fiscal 2016 was $272.8 million, primarily related to the repurchase of our common shares under the Board of Directors approved share repurchase programs, partially offset by net borrowings under our long-term debt facility.
35
Credit Facilities
On July 1, 2015, we entered into a five-year asset-based revolving Credit Agreement ("Credit Agreement") with certain lenders, including JPMorgan Chase Bank, N.A., as administrative agent, and J.P. Morgan Securities LLC and Wells Fargo Bank, National Association, as joint lead arrangers and co-book managers. The Credit Agreement replaced our unsecured $175.0 million revolving line of credit with Wells Fargo Bank, National Association, which was set to expire in March 2019.
The Credit Agreement provides senior secured revolving credit for loans and letters of credit up to $400.0 million (the "Credit Facility"), subject to a borrowing base that is comprised of our eligible accounts receivable and inventory. The Credit Facility includes a swing-line sub-facility, a multicurrency sub-facility and the option to expand the facility by up to $150.0 million. The funds available under the Credit Facility may be used for working capital and other general corporate purposes.
The Credit Facility provides for interest on borrowings, at our option, at either (i) adjusted LIBOR, CDOR or EURIBOR plus an applicable margin ranging from 1.125% to 1.625%, or (ii) an adjusted ABR plus an applicable margin ranging from 0.125% to 0.625%, each such rate depending on the level of availability under the Credit Facility and our adjusted leverage ratio. Interest is payable either monthly or quarterly depending on the type of borrowing. A commitment fee is payable quarterly, on the unused portion of the Credit Facility, based on our adjusted leverage ratio.
All obligations under the Credit Facility are unconditionally guaranteed by us and our domestic subsidiaries. The obligations under the Credit Facility are secured by a first-priority security interest in inventory, accounts receivable, and certain other assets of the borrowers and guarantors. The Credit Agreement contains customary representations and warranties, negative and affirmative covenants and provisions relating to events of default.
As of January 31, 2016, we were in compliance with all terms of the Credit Agreement, borrowings on the Credit Facility totaled $150.0 million and stand-by letters of credit outstanding were $13.8 million.
Additionally, we have borrowing agreements with two separate financial institutions under which we may borrow an aggregate of $130.0 million for the purposes of trade letter of credit issuances. The availability of any future borrowings under the trade letter of credit facilities is subject to acceptance by the respective financial institutions. As of January 31, 2016, we had outstanding trade letters of credit of $65.0 million, and available trade letters of credit of $65.0 million under these facilities.
Capital and Operating Expenditures
During fiscal 2017, we plan to construct and open approximately 27 new stores, expand certain existing stores, upgrade our systems, increase our investments in omni-channel marketing and purchase inventories for our Retail and Wholesale segments at levels appropriate to maintain our planned sales growth. We believe that our marketing, social media, merchandise expansion, website and mobile initiatives are a significant contributor to our Retail segment sales growth. During fiscal 2017, we plan to continue our investment in these initiatives for all brands. We anticipate our capital expenditures during fiscal 2017 to be approximately $160 million, all of which are expected to be
36
financed by cash flow from operating activities. We believe that our new store investments have the potential to generate positive cash flow within a year. We may also enter into one or more acquisitions or transactions related to the expansion of our brand offerings. We believe that our existing cash and cash equivalents, available credit facilities and future cash flows from operations will be sufficient to fund these initiatives.
Share Repurchases
On February 23, 2015, our Board of Directors authorized the repurchase of 20.0 million common shares under a share repurchase program. Under this authorization, during fiscal 2016, we repurchased and subsequently retired 12.7 million common shares at a total cost of $382.5 million for an average cost per share of $30.16, including commissions.
On May 27, 2014, our Board of Directors authorized the repurchase of 10.0 million common shares under a share repurchase program. Under this authorization, the Company repurchased and subsequently retired 7.7 million common shares at a total cost of $258.2 million during fiscal 2015. The average cost per share of these repurchases for fiscal 2015 was $33.45, including commissions. During fiscal 2016, we repurchased and subsequently retired 2.3 million shares at a total cost of $82.8 million at an average cost per share of $36.30, including commissions, which completed this authorization.
On August 27, 2013, our Board of Directors authorized the repurchase of 10.0 million common shares under a share repurchase program. We repurchased and subsequently retired all of the remaining 9.7 million outstanding common shares available under this authorization during the first quarter of fiscal 2015 at a total cost of $353.3 million for an average cost per share of $36.43, including commissions.
Contractual Obligations
The following table summarizes our contractual obligations as of January 31, 2016:
| Payments Due by Period (in thousands) | ||||||||||||||||||||
Description | Total Obligations | Less
Than One Year | One to Three Years | Three
to Five Years | More
Than Five Years | |||||||||||||||
Operating leases (1) | $ | 1,982,176 | $ | 272,255 | $ | 509,919 | $ | 427,776 | $ | 772,226 | ||||||||||
Purchase orders (2) | 407,833 | 407,833 | - | - | - | |||||||||||||||
Construction contracts (3) | 1,535 | 1,535 | - | - | - | |||||||||||||||
Tax contingencies (4) | 436 | 436 | - | - | - | |||||||||||||||
|
|
|
|
|
|
|
|
|
| |||||||||||
Total contractual obligations | $ | 2,391,980 | $ | 682,059 | $ | 509,919 | $ | 427,776 | $ | 772,226 | ||||||||||
|
|
|
|
|
|
|
|
|
| |||||||||||
| (1) | Includes store operating leases, which generally provide for payment of direct operating costs in addition to rent. The obligation amounts shown above only reflect our future minimum lease payments as the direct operating costs fluctuate over the term of the lease. Additionally, there are 26 locations where a percentage of sales are paid, in lieu of a fixed minimum rent, that are not reflected in the above table. Total rent expense related to these 26 locations was approximately $3,498 for fiscal 2016. It is common for the lease agreements for our European locations to allow |
37
for the landlord to adjust the minimum rental due to the current market rates multiple times during the lease term. The table above includes our current contractual payments for these locations. Amounts noted above include commitments for 37 executed leases for stores not opened as of January 31, 2016. |
| (2) | Our merchandise commitments are cancellable with no or limited recourse available to the vendor until the merchandise shipping date. |
| (3) | Includes construction contracts with contractors that are fully satisfied upon the completion of construction, which is typically within twelve months. |
| (4) | Tax contingencies include $436 that is classified as a current liability in the Company's Consolidated Balance Sheets as of January 31, 2016. Tax contingencies in the table above do not show an existing liability of $8,234 because we cannot reasonably estimate in which future periods these amounts will ultimately be settled. As a result, the $8,234 liability was classified as a non-current liability in the Company's Consolidated Balance Sheets as of January 31, 2016. |
Commercial Commitments
The following table summarizes our commercial commitments as of January 31, 2016:
| Amount of Commitment Per
Period (in thousands) | ||||||||||||||||||||
Description | Total Amounts Committed | Less Than One Year | One to Three Years | Three to Five Years | More Than Five Years | |||||||||||||||
Trade letters of credit (1) | $ | 65,047 | $ | 65,047 | $ | - | $ | - | $ | - | ||||||||||
Standby letters of credit (2) | 13,782 | 13,782 | - | - | - | |||||||||||||||
|
|
|
|
|
|
|
|
|
| |||||||||||
Total commercial commitments | $ | 78,829 | $ | 78,829 | $ | - | $ | - | $ | - | ||||||||||
|
|
|
|
|
|
|
|
|
| |||||||||||
| (1) | Consists primarily of outstanding letter of credit commitments in connection with import inventory purchases. |
| (2) | Consists primarily of standby letters of credit for customs, construction and insurance. |
Off-Balance Sheet Arrangements
As of and for the three fiscal years ended January 31, 2016, except for operating leases entered into in the normal course of business, we were not party to any material off-balance sheet arrangements that are reasonably likely to have a current or future effect on our financial condition, revenues, expenses, results of operations, liquidity, capital expenditures or capital resources.
Other Matters
Recently Issued Accounting Pronouncements
See Note 2, "Summary of Significant Accounting Policies -Recently Issued Accounting Pronouncements ," in the Notes to Consolidated Financial Statements included in this Annual Report on Form 10-K for a description of recently issued and adopted accounting pronouncements.
Seasonality and Quarterly Results
Our business experiences seasonal fluctuations in net sales and operating income, with a more significant portion typically realized in the fourth quarter of each year reflecting the year-end holiday
38
period. Historically, and consistent with the retail industry, the seasonality also impacts our working capital requirements, particularly with regard to inventory. The following tables set forth our net sales, gross profit, net income and net income per common share (basic and diluted) for each quarter during the last two fiscal years and the amount of such net sales and net income, respectively, as a percentage of annual net sales and annual net income. The unaudited financial information has been prepared in accordance with accounting principles generally accepted in the United States for interim financial information and with the instructions to Form 10-Q and Article 10 of Regulation S-X. In the opinion of management, all adjustments (consisting of normal recurring accruals) considered necessary for a fair presentation have been included.
| Fiscal 2016 Quarter Ended (1) | ||||||||||||||||
| April 30, 2015 | July 31, 2015 | Oct. 31, 2015 | Jan. 31, 2016 | |||||||||||||
| (dollars in thousands, except per share data) | ||||||||||||||||
Net sales | $ | 739,010 | $ | 867,460 | $ | 825,258 | $ | 1,013,406 | ||||||||
Gross profit | 246,421 | 318,105 | 288,188 | 349,188 | ||||||||||||
Net income | 32,776 | 66,841 | 51,994 | 72,878 | ||||||||||||
Net income per common share-basic | 0.25 | 0.52 | 0.42 | 0.61 | ||||||||||||
Net income per common share-diluted | 0.25 | 0.52 | 0.42 | 0.61 | ||||||||||||
As a Percentage of Fiscal Year: | ||||||||||||||||
Net sales | 22 | % | 25 | % | 24 | % | 29 | % | ||||||||
Net income | 15 | % | 30 | % | 23 | % | 32 | % | ||||||||
| Fiscal 2015 Quarter Ended (1) | ||||||||||||||||
| April 30, 2014 | July 31, 2014 | Oct. 31, 2014 | Jan. 31, 2015 | |||||||||||||
| (dollars in thousands, except per share data) | ||||||||||||||||
Net sales | $ | 686,310 | $ | 811,253 | $ | 814,470 | $ | 1,011,044 | ||||||||
Gross profit | 238,511 | 303,258 | 283,524 | 349,637 | ||||||||||||
Net income | 37,478 | 67,509 | 47,143 | 80,298 | ||||||||||||
Net income per common share-basic | 0.26 | 0.49 | 0.35 | 0.61 | ||||||||||||
Net income per common share-diluted | 0.26 | 0.49 | 0.35 | 0.60 | ||||||||||||
As a Percentage of Fiscal Year: | ||||||||||||||||
Net sales | 21 | % | 24 | % | 25 | % | 30 | % | ||||||||
Net income | 16 | % | 29 | % | 20 | % | 35 | % | ||||||||
| (1) | The sum of the quarterly per share amounts may not equal per share amounts reported for year-to-date periods due to changes in the number of weighted-average shares outstanding and the effects of rounding for each period. |
Item 7A. Quantitative and Qualitative Disclosures About Market Risk
We are exposed to the following types of market risks-fluctuations in the purchase price of merchandise, as well as other goods and services, the value of foreign currencies in relation to the U.S. dollar, and changes in interest rates. Due to our inventory turnover rate and our historical ability to pass through the impact of any generalized changes in our cost of goods to our customers through pricing adjustments, commodity and other product risks are not expected to be material. We purchase the majority of our merchandise in U.S. dollars, including a majority of the goods for our stores located in Canada and a portion of the goods for our stores located in Europe.
39
Our exposure to market risk for changes in foreign currencies is due to our financial statements being presented in U.S. dollars and our international subsidiaries transacting in currencies other than U.S. dollars. Fluctuations in exchange rates in effect during or at the end of the reporting period may affect the value of the reported amounts of revenues, expenses, assets and liabilities. As we expand our international operations, the potential impact of currency fluctuations increases.
Our exposure to market risk for changes in interest rates relates to our cash, cash equivalents and marketable securities and the Credit Facility. As of January 31, 2016 and 2015, our cash, cash equivalents and marketable securities consisted primarily of cash on hand and in banks, money market accounts, municipal and pre-refunded municipal bonds rated "BBB" or better, corporate bonds rated "BBB" or better, certificates of deposit, and mutual funds. Due to the short average maturity and conservative nature of our investment portfolio, we believe a 100 basis point change in interest rates would not have a material effect on the Consolidated Financial Statements. As the interest rates on a material portion of our cash, cash equivalents and marketable securities are variable, a change in interest rates earned on the cash, cash equivalents and marketable securities would impact interest income along with cash flows, but would not impact the fair market value of the related underlying instruments.
We are exposed to market risks relating to changes in interest rates on outstanding borrowings under our Credit Facility because these borrowings bear interest at variable rates. A 100 basis point change in our applicable interest rate would not have a material impact to interest expense for the year ended January 31, 2016.
Item 8. Financial Statements and Supplementary Data
The information required by this Item is incorporated by reference from Item 7: Management's Discussion and Analysis of Financial Condition and Results of Operations-Seasonality and Quarterly Results and from our Consolidated Financial Statements and related notes thereto.
Item 9. Changes in and Disagreements with Accountants on Accounting and Financial Disclosure
None.
Item 9A. Controls and Procedures
Evaluation of Disclosure Controls and Procedures
Management, including our Chief Executive Officer and Chief Financial Officer, evaluated the effectiveness of our disclosure controls and procedures as defined in Rules 13a-15(e) and 15d-15(e) of the Securities Exchange Act of 1934, as amended. Based on this review, the Chief Executive Officer and Chief Financial Officer concluded that the Company's disclosure controls and procedures were effective as of January 31, 2016.
Management's Annual Report on Internal Controls Over Financial Reporting
Our management is responsible for establishing and maintaining adequate internal control over financial reporting, as defined in the Securities Exchange Act Rule 13a-15(f). Our system of internal control is designed to provide reasonable, not absolute, assurance regarding the reliability of financial reporting and the preparation of financial statements for external purposes in accordance with generally accepted accounting principles.
40
Under the supervision and with the participation of our management, including our Chief Executive Officer and Chief Financial Officer, we conducted an evaluation of the effectiveness of our system of internal control over financial reporting based on the framework in Internal Control-Integrated Framework issued in 2013 by the Committee of Sponsoring Organizations of the Treadway Commission. Based on this evaluation, our management concluded that the Company's internal control over financial reporting was effective as of January 31, 2016.
The effectiveness of internal control over financial reporting as of January 31, 2016 was audited by Deloitte & Touche LLP, an independent registered public accounting firm, as stated in their report that is included on page 42 of this Annual Report on Form 10-K.
Changes in Internal Control Over Financial Reporting
There were no changes in the Company's internal control over financial reporting during the Company's fourth quarter of fiscal 2016 that have materially affected, or are reasonably likely to materially affect, the Company's internal control over financial reporting.
Item 9B. Other Information
None.
41
REPORT OF INDEPENDENT REGISTERED PUBLIC ACCOUNTING FIRM
To the Board of Directors and Shareholders of
Urban Outfitters, Inc.
Philadelphia, Pennsylvania
We have audited the internal control over financial reporting of Urban Outfitters, Inc. and subsidiaries (the "Company") as of January 31, 2016 based on criteria established in Internal Control-Integrated Framework (2013) issued by the Committee of Sponsoring Organizations of the Treadway Commission. The Company's management is responsible for maintaining effective internal control over financial reporting and for its assessment of the effectiveness of internal control over financial reporting, included in the accompanying Management's Annual Report on Internal Controls over Financial Reporting. Our responsibility is to express an opinion on the Company's internal control over financial reporting based on our audit.
We conducted our audit in accordance with the standards of the Public Company Accounting Oversight Board (United States). Those standards require that we plan and perform the audit to obtain reasonable assurance about whether effective internal control over financial reporting was maintained in all material respects. Our audit included obtaining an understanding of internal control over financial reporting, assessing the risk that a material weakness exists, testing and evaluating the design and operating effectiveness of internal control based on the assessed risk, and performing such other procedures as we considered necessary in the circumstances. We believe that our audit provides a reasonable basis for our opinion.
A company's internal control over financial reporting is a process designed by, or under the supervision of, the company's principal executive and principal financial officers, or persons performing similar functions, and effected by the company's board of directors, management, and other personnel to provide reasonable assurance regarding the reliability of financial reporting and the preparation of financial statements for external purposes in accordance with generally accepted accounting principles. A company's internal control over financial reporting includes those policies and procedures that (1) pertain to the maintenance of records that, in reasonable detail, accurately and fairly reflect the transactions and dispositions of the assets of the company; (2) provide reasonable assurance that transactions are recorded as necessary to permit preparation of financial statements in accordance with generally accepted accounting principles, and that receipts and expenditures of the company are being made only in accordance with authorizations of management and directors of the company; and (3) provide reasonable assurance regarding prevention or timely detection of unauthorized acquisition, use, or disposition of the company's assets that could have a material effect on the financial statements.
Because of the inherent limitations of internal control over financial reporting, including the possibility of collusion or improper management override of controls, material misstatements due to error or fraud may not be prevented or detected on a timely basis. Also, projections of any evaluation of the effectiveness of the internal control over financial reporting to future periods are subject to the risk that the controls may become inadequate because of changes in conditions, or that the degree of compliance with the policies or procedures may deteriorate.
42
In our opinion, the Company maintained, in all material respects, effective internal control over financial reporting as of January 31, 2016, based on the criteria established in Internal Control- Integrated Framework (2013) issued by the Committee of Sponsoring Organizations of the Treadway Commission.
We have also audited, in accordance with the standards of the Public Company Accounting Oversight Board (United States), the consolidated balance sheet of the Company as of January 31, 2016, and the related consolidated statements of income, comprehensive income, shareholders' equity, and cash flows for the year then ended and our report dated March 31, 2016 expressed an unqualified opinion on those consolidated financial statements.
/s/ DELOITTE & TOUCHE LLP
Philadelphia, Pennsylvania
March 31, 2016
43
PART III
Item 10. Directors, Executive Officers and Corporate Governance
The following table sets forth the name, age and position of each of our executive officers and directors:
Name | Age | Position | ||||
Richard A. Hayne | 68 | Chairman of the Board and Chief Executive Officer | ||||
Francis J. Conforti | 40 | Chief Financial Officer | ||||
Trish Donnelly | 49 | Chief Executive Officer, Urban Outfitters Group | ||||
Azeez Hayne | 39 | General Counsel and Corporate Secretary | ||||
Margaret A. Hayne (4) | 57 | President, Free People Brand, Chief Creative Officer and Director | ||||
Calvin Hollinger | 51 | Chief Operating Officer | ||||
David W. McCreight | 53 | President, Urban Outfitters, Inc., Chief Executive Officer of Anthropologie Group | ||||
Edward N. Antoian (2)(3)(4) | 60 | Director | ||||
Scott A. Belair (2)(3) | 68 | Director | ||||
Harry S. Cherken, Jr. (1) | 66 | Director | ||||
Elizabeth A. Lambert (1)(4) | 52 | Director | ||||
Joel S. Lawson III (2)(3) | 68 | Director | ||||
Robert H. Strouse (1)(3) | 67 | Director | ||||
| (1) | Member of the Nominating and Governance Committee. |
| (2) | Member of the Audit Committee. |
| (3) | Member of the Compensation and Leadership Development Committee. |
| (4) | Member of the Innovation Committee. |
Mr. R. Hayne co-founded Urban Outfitters in 1970. He has been Chairman of the Board of Directors since the Company's incorporation in 1976 and, until February 2016, also served as the Company's President. Mr. R. Hayne served as the Company's principal executive officer until 2007 and again beginning in January 2012. Margaret A. Hayne, President of Free People and Chief Creative Officer of Urban Outfitters, Inc., is Mr. R. Hayne's spouse. Mr. R. Hayne's long tenure leading the Company as Chairman of the Board of Directors, his tenure as principal executive officer, and his exceptional leadership skills make him uniquely qualified to serve as a director.
Mr. Conforti joined the Company in March 2007 as Director of Finance and SEC Reporting. After being promoted to Controller and then to Chief Accounting Officer, he was appointed Chief Financial Officer in April 2012. Prior to joining the Company, Mr. Conforti, a Certified Public Accountant, worked for AlliedBarton Security Services, LLC for five years, serving as Controller for three years. Mr. Conforti began his career at KPMG in 1998 where he held various audit roles.
Ms. Donnelly joined the Company in July 2014 as North American Brand President, Urban Outfitters Group and was promoted to Chief Executive Officer of Urban Outfitters Group in February 2016. Prior to joining the Company Ms. Donnelly served as President of Steven Alan from 2011-2014. Previously, Ms. Donnelly spent more than seven years at J. Crew as the Executive Vice President of J. Crew Direct. Ms. Donnelly began her career in various merchandising roles at Ralph Lauren.
44
Mr. A. Hayne joined the Company in February 2015 as Associate General Counsel and was appointed General Counsel and Corporate Secretary in June 2015. Before joining the Company, Mr. A. Hayne worked for Morgan Lewis & Bockius LLP, serving as a partner in their Labor & Employment Practice Group from October 2010 through January 2015. After graduating the University of Virginia School of Law in 2001, Mr. A. Hayne began his legal career in Pepper Hamilton LLP's Commercial Litigation department before moving to Morgan Lewis & Bockius LLP in July 2003. Richard A. Hayne, the Company's current Chairman and Chief Executive Officer, is Mr. A. Hayne's uncle.
Ms. Hayne joined the Company in August 1982. She is a 40-year veteran of the retail and wholesale industry and has served as President of Free People since March 2007 and as Chief Creative Officer of Urban Outfitters, Inc. since November 2013. Richard A. Hayne, the Company's current Chairman and Chief Executive Officer, is Ms. Hayne's spouse. As an employee of the Company for over 30 years and a director since 2013, Ms. Hayne brings a wealth of both Company-specific and industry-wide knowledge and experience to the Board of Directors.
Mr. Hollinger joined the Company in November 2004 as Chief Information Officer. He was subsequently promoted to Chief Administrative Officer and then assumed his current role of Chief Operating Officer in 2015. In his current role, he is responsible for overseeing the Company's information technology, logistics, construction and facilities, talent acquisition and executive development, compensation and customer contact center. Prior to joining the Company, Mr. Hollinger held various senior leadership roles at Gap Inc.
Mr. McCreight joined the Company in November 2011 as Chief Executive Officer of Anthropologie Group and was named President of Urban Outfitters, Inc. in February 2016. Previously, Mr. McCreight served as President of Under Armour from 2008-2010 and President of Lands' End from 2005-2008. Mr. McCreight also held the positions of Executive Vice-President and Senior Vice-President at Lands' End from 2003-2005. Mr. McCreight also served as Senior Vice-President of Disney Stores from 2001-2003. Previously, Mr. McCreight had been President of Smith & Hawken. His early merchant career exposed him to various merchant organizations and philosophies.
Mr. Antoian is a partner of and Chief Investment Officer for Zeke Capital Advisors, a financial advisory firm. He is also employed by Chartwell Investment Partners, an investment advisory firm, where he has worked since its inception in 1997. In addition, Mr. Antoian is the General Partner of Zeke, L.P., a privately offered long-short equity hedge fund. From 1984 until 1997, Mr. Antoian was the Senior Portfolio Manager of Delaware Management Co. Prior to that, Mr. Antoian worked at E.F. Hutton in Institutional Sales and as a certified public accountant for Price Waterhouse. Mr. Antoian holds an MBA in Finance and has financial and investment experience as a result of his experience as a CPA, financial advisor and portfolio manager. Mr. Antoian also serves as a director of a not-for-profit entity.
Mr. Belair co-founded Urban Outfitters in 1970 and has not been an employee since 1971, prior to incorporation of the Company in 1976. He has served as Principal of The ZAC Group, a financial advisory firm, since 1989. Previously, he was a managing director of Drexel Burnham Lambert Incorporated. Mr. Belair is also an advisory director of M&T Bank (NYSE: MTB) (formerly Hudson City Bancorp, Inc. and Hudson City Savings Bank). He holds an MBA degree and has financial and investment expertise, including financial reporting expertise, as a result of his significant experience as a CPA, financial advisor, and former chief financial officer in the financial services industry. As a
45
co-founder of the Company, Mr. Belair has been involved with the Company from its inception and accordingly has a comprehensive understanding of and perspective on its overall business and strategic direction.
Mr. Cherken has been a partner of the law firm of Drinker Biddle & Reath LLP in Philadelphia, Pennsylvania since 1984, is a former managing partner of that firm, and has served as Co-Chair of its Real Estate Group. As a real estate lawyer with over 39 years' experience representing public and private companies in the acquisition, construction, development, financing, leasing, management, consolidation, and disposition of commercial real estate, he has extensive experience with various types of real estate transactions and retail leases, including negotiating real estate transactions and leases on behalf of the Company nearly from its inception. Mr. Cherken also holds a Masters in Liberal Arts degree and serves as a trustee of various not-for-profit entities and academic institutions.
Ms. Lambert is the founder and a partner of Bunkhouse Group, LLC, a hospitality management company. In 2006, Ms. Lambert formed Bunkhouse Group, LLC to oversee a growing portfolio of eclectic hotels and coffee shops. Bunkhouse currently operates the Hotel San José, the Hotel Saint Cecilia, three Jo's Coffee shops, the Hotel Havana and El Cosmico, an 18-acre vintage trailer, tepee, tent hotel and event space. Prior to her experience as a hotelier, Ms. Lambert worked as a prosecutor in the New York County District Attorney's office and the Austin, Texas Attorney General's office. Currently, Ms. Lambert also serves on the Board of Directors of the National Council on Crime & Delinquency. Ms. Lambert's experience growing a design-centric and customer-focused hospitality company from the ground up gives her a unique perspective and set of skills to contribute to the Board of Directors.
Mr. Lawson is an independent consultant and private investor. From November 2001 until November 2003, he also served as Executive Director of M&A International Inc., a global organization of merger and acquisition advisory firms. From 1980 until November 2001, Mr. Lawson was Chief Executive Officer of Howard, Lawson & Co., an investment banking and corporate finance firm. Howard, Lawson & Co. became an indirect, wholly-owned subsidiary of FleetBoston Financial Corporation in March 2001. As the former Chief Executive Officer of an investment banking and corporate finance firm, Mr. Lawson has extensive experience in financial and investment matters, including financial reporting expertise. In addition, as the former Executive Director of a global organization of merger and acquisition advisory firms, he has specialized knowledge regarding mergers and acquisitions. He also holds an MBA degree and serves as a director of not-for-profit entities.
Mr. Strouse serves as President of Wind River Holdings, L.P., which oversees a diversified group of privately owned industrial and service businesses. Through his experience with this private investment company, Mr. Strouse brings to the Board of Directors experience in strategic planning, budgeting, talent recruitment and development, risk management and corporate development activities. Mr. Strouse is a former corporate lawyer whose practice, prior to 1998 when he joined Wind River, focused on mergers and acquisitions, corporate governance and SEC reporting. Mr. Strouse also serves as a director of a number of privately owned companies, including Conestoga Bank, and as a director of a not-for-profit entity.
Code of Conduct and Ethics
We have a written Code of Conduct and Ethics (the "Code") that applies to our directors and employees, including our Chief Executive Officer, Chief Financial Officer and Principal Accounting
46
Officer. The Code includes guidelines relating to compliance with laws, the ethical handling of actual or potential conflicts of interest, the use of corporate opportunities, protection and use of our confidential information, accepting gifts and business courtesies, compliance with anti-bribery and illegal payment laws, accurate financial reporting, and procedures for promoting compliance with, and reporting violations of, the Code. The Code is available on our website at www.urbanoutfittersinc.com . We intend to post any amendments to the Code and also to disclose any waivers (to the extent applicable to the Company's Chief Executive Officer, Chief Financial Officer or Principal Accounting Officer) on our website.
Section 16(a) Beneficial Ownership Reporting Compliance
Information required by this item is incorporated herein by reference from the Company's Proxy Statement for the 2016 Annual Meeting of Shareholders.
Other Information
Other information required by Item 10 relating to the Company's directors is incorporated herein by reference from the Company's Proxy Statement for the 2016 Annual Meeting of Shareholders.
Item 11. Executive Compensation
Information required by this item is incorporated herein by reference from the Company's Proxy Statement for the 2016 Annual Meeting of Shareholders.
Item 12. Security Ownership of Certain Beneficial Owners and Management and Related Shareholder Matters
Information required by this item is incorporated herein by reference from the Company's Proxy Statement for the 2016 Annual Meeting of Shareholders.
Item 13. Certain Relationships and Related Transactions, and Director Independence
Information required by this item is incorporated herein by reference from the Company's Proxy Statement for the 2016 Annual Meeting of Shareholders.
Item 14. Principal Accountant Fees and Services
Information required by this item is incorporated herein by reference from the Company's Proxy Statement for the 2016 Annual Meeting of Shareholders.
47
PART IV
Item 15. Exhibits and Financial Statement Schedules
(a) The following documents are filed as part of this Annual Report on Form 10-K:
(1) Financial Statements
Consolidated Financial Statements filed herewith are listed in the accompanying index on page F-1.
(2) Financial Statement Schedule
None
All other schedules are omitted because they are not applicable or not required, or because the required information is included in the Consolidated Financial Statements or notes thereto.
(3) Exhibits
The Exhibits listed below are filed as part of, or incorporated by reference into, this Annual Report on Form 10-K.
Exhibit Number | Description | |
| 3.1 | Amended and Restated Articles of Incorporation are incorporated by reference to Exhibit 3.1 of the Company's Quarterly Report on Form 10-Q (file no. 000-22754) filed on September 9, 2004. | |
| 3.2 | Amendment No. 1 to Amended and Restated Articles of Incorporation is incorporated by reference to Exhibit 3.2 of the Company's Quarterly Report on Form 10-Q (file no. 000-22754) filed on September 9, 2004. | |
| 3.3 | Amendment No. 2 to Amended and Restated Articles of Incorporation is incorporated by reference to Exhibit 3.1 of the Company's Current Report on Form 8-K filed on May 31, 2013. | |
| 3.4 | Second Amended and Restated By-laws are incorporated by reference to Exhibit 3.2 of the Company's Current Report on Form 8-K filed on December 3, 2012. | |
| 10.1* | Credit Agreement, dated July 1, 2015, by and among Urban Outfitters, Inc., its domestic subsidiaries, JPMorgan Chase Bank, N.A., as administrative agent, J.P. Morgan Securities LLC and Wells Fargo Bank, National Association, as joint lead arrangers and co-book managers, and certain other lenders party thereto. | |
| 10.2 | Pledge and Security Agreement, dated July 1, 2015, by and among Urban Outfitters, Inc., its domestic subsidiaries, and JPMorgan Chase Bank, N.A., in its capacity as administrative agent is incorporated by reference to Exhibit 10.2 of the Company's Quarterly Report on Form 10-Q filed on September 9, 2015. | |
48
Exhibit Number | Description | |
| 10.3+ | Urban Outfitters 2004 Stock Incentive Plan is incorporated by reference to Appendix B of the Company's Definitive Proxy Statement on Schedule 14A (file no. 000-22754) filed on April 26, 2004 and Amendment No. 1 to the Urban Outfitters 2004 Stock Incentive Plan is incorporated by reference to Appendix A of the Company's Definitive Proxy Statement on Schedule 14A (file no. 000-22754) filed on April 25, 2005. | |
| 10.4+ | Urban Outfitters 401(k) Savings Plan (formerly known as The Urban Outfitters, Inc. PROFIT SHARING FUND prior to July 1, 1999) is incorporated by reference to Exhibit 10.4 of the Company's Amendment No. 2 to the Registration Statement on Form S-1/A (file no. 033-69378) filed on November 3, 1993. | |
| 10.5+ | 2008 Stock Incentive Plan is incorporated by reference to Appendix B of the Company's Definitive Proxy Statement on Schedule 14A filed on April 2, 2013. | |
| 10.6+ | Urban Outfitters Executive Incentive Plan, as amended and restated effective February 1, 2010, is incorporated by reference to Appendix A of the Company's Definitive Proxy Statement on Schedule 14A filed on April 1, 2015. | |
| 10.7+ | Form of 2004 Plan-Non-Qualified Stock Option Agreement is incorporated by reference to Exhibit 99.1 of the Company's Current Report on Form 8-K (file no. 000-22754) filed on June 18, 2009. | |
| 10.8+ | Form of 2004 Plan-Non-Qualified Stock Option Agreement for Non-Employee Directors is incorporated by reference to Exhibit 99.2 of the Company's Current Report on Form 8-K (file no. 000-22754) filed on June 18, 2009. | |
| 10.9+ | Form of 2004 Plan-Incentive Stock Option Agreement is incorporated by reference to Exhibit 99.3 of the Company's Current Report on Form 8-K (file no. 000-22754) filed on June 18, 2009. | |
| 10.10+ | Form of 2004 Plan-Stock Appreciation Right Agreement is incorporated by reference to Exhibit 99.2 of the Company's Current Report on Form 8-K (file no. 000-22754) filed on September 7, 2010. | |
| 10.11+ | Form of 2004 Plan-Restricted Stock Unit Agreement is incorporated by reference to Exhibit 10.1 of the Company's Quarterly Report on Form 10-Q (file no. 000-22754) filed on December 10, 2010. | |
| 10.12+ | Form of 2008 Plan-Non-Qualified Stock Option Agreement is incorporated by reference to Exhibit 99.4 of the Company's Current Report on Form 8-K (file no. 000-22754) filed on June 18, 2009. | |
| 10.13+ | Form of 2008 Plan-Non-Qualified Stock Option Agreement for Non-Employee Directors is incorporated by reference to Exhibit 99.5 of the Company's Current Report on Form 8-K (file no. 000-22754) filed on June 18, 2009. | |
| 10.14+ | Form of 2008 Plan-Incentive Stock Option Agreement is incorporated by reference to Exhibit 99.6 of the Company's Current Report on Form 8-K (file no. 000-22754) filed on June 18, 2009. | |
| 10.15+ | Form of 2008 Plan-Performance Stock Unit Agreement is incorporated by reference to Exhibit 99.1 of the Company's Current Report on Form 8-K (file no. 000-22754) filed on September 7, 2010. | |
49
Exhibit Number | Description | |
| 10.16+ | Form of 2008 Plan-Restricted Stock Unit Agreement is incorporated by reference to Exhibit 10.2 of the Company's Quarterly Report on Form 10-Q (file no. 000-22754) filed on December 10, 2010. | |
| 10.17+ | Form of 2008 Plan-Performance/Restricted Stock Unit Agreement is incorporated by reference to Exhibit 10.2 to the Company's Quarterly Report on Form 10-Q filed on December 12, 2011. | |
| 10.18+ | Form of 2008 Plan-Stock Appreciation Right Agreement is incorporated by reference to Exhibit 10.3 to the Company's Quarterly Report on Form 10-Q filed on December 12, 2011. | |
| 21.1* | List of Subsidiaries. | |
| 23.1* | Consent of Deloitte & Touche LLP. | |
| 31.1* | Rule 13a-14(a)/15d-14(a) Certification of the Company's Principal Executive Officer. | |
| 31.2* | Rule 13a-14(a)/15d-14(a) Certification of the Company's Principal Financial Officer. | |
| 32.1** | Section 1350 Certification of the Company's Principal Executive Officer. | |
| 32.2** | Section 1350 Certification of the Company's Principal Financial Officer. | |
| 101.INS* | XBRL Instance Document | |
| 101.SCH* | XBRL Taxonomy Extension Schema | |
| 101.CAL* | XBRL Taxonomy Extension Calculation Linkbase | |
| 101.LAB* | XBRL Taxonomy Extension Label Linkbase | |
| 101.PRE* | XBRL Taxonomy Extension Presentation Linkbase | |
| 101.DEF* | XBRL Taxonomy Extension Definition Linkbase | |
| * | Filed herewith |
| ** | Furnished herewith |
| + | Compensatory plan |
50
SIGNATURES
Pursuant to the requirements of Section 13 or 15(d) of the Securities Exchange Act of 1934, the registrant has duly caused this report to be signed on its behalf by the undersigned, thereunto duly authorized.
| URBAN OUTFITTERS, INC. | ||||
| March 31, 2016 | By: | /s/ R ICHARD A. H AYNE | ||
| Richard A. Hayne | ||||
Chief Executive Officer (Principal Executive Officer) | ||||
Pursuant to the requirements of the Securities Exchange Act of 1934, this report has been signed below by the following persons on behalf of the registrant and in the capacities and on the dates indicated.
Signature | Title | Date | ||
/s/ R ICHARD A. H AYNE Richard A. Hayne (Principal Executive Officer) | Chairman of the Board and Chief Executive Officer | March 31, 2016 | ||
/s/ F RANCIS J. C ONFORTI Francis J. Conforti (Principal Accounting and Financial Officer) | Chief Financial Officer | March 31, 2016 | ||
/s/ E DWARD N. A NTOIAN Edward N. Antoian | Director | March 31, 2016 | ||
/s/ S COTT A. B ELAIR Scott A. Belair | Director | March 31, 2016 | ||
/s/ H ARRY S. C HERKEN , J R . Harry S. Cherken, Jr. | Director | March 31, 2016 | ||
/s/ M ARGARET A. H AYNE Margaret A. Hayne | Director | March 31, 2016 | ||
/s/ E LIZABETH A. L AMBERT Elizabeth A. Lambert | Director | March 31, 2016 | ||
/s/ J OEL S. L AWSON III Joel S. Lawson III | Director | March 31, 2016 | ||
/s/ R OBERT H. S TROUSE Robert H. Strouse | Director | March 31, 2016 | ||
51
URBAN OUTFITTERS, INC.
INDEX TO CONSOLIDATED FINANCIAL STATEMENTS
| Page | ||||
Report of Independent Registered Public Accounting Firm-Deloitte & Touche LLP | F-2 | |||
Consolidated Balance Sheets as of January 31, 2016 and January 31, 2015 | F-3 | |||
Consolidated Statements of Income for the fiscal years ended January 31, 2016, 2015 and 2014 | F-4 | |||
Consolidated Statements of Comprehensive Income for the fiscal years ended January 31, 2016, 2015 and 2014 | F-5 | |||
Consolidated Statements of Shareholders' Equity for the fiscal years ended January 31, 2016, 2015 and 2014 | F-6 | |||
Consolidated Statements of Cash Flows for the fiscal years ended January 31, 2016, 2015 and 2014 | F-7 | |||
Notes to Consolidated Financial Statements | F-8 | |||
F-1
REPORT OF INDEPENDENT REGISTERED PUBLIC ACCOUNTING FIRM
To the Board of Directors and Shareholders of
Urban Outfitters, Inc.
Philadelphia, Pennsylvania
We have audited the accompanying consolidated balance sheets of Urban Outfitters, Inc. and subsidiaries (the "Company") as of January 31, 2016 and 2015, and the related consolidated statements of income, comprehensive income, shareholders' equity, and cash flows for each of the three years in the period ended January 31, 2016. These financial statements are the responsibility of the Company's management. Our responsibility is to express an opinion on these financial statements based on our audits.
We conducted our audits in accordance with the standards of the Public Company Accounting Oversight Board (United States). Those standards require that we plan and perform the audit to obtain reasonable assurance about whether the financial statements are free of material misstatement. An audit includes examining, on a test basis, evidence supporting the amounts and disclosures in the financial statements. An audit also includes assessing the accounting principles used and significant estimates made by management, as well as evaluating the overall financial statement presentation. We believe that our audits provide a reasonable basis for our opinion.
In our opinion, such consolidated financial statements present fairly, in all material respects, the financial position of Urban Outfitters, Inc. and subsidiaries as of January 31, 2016 and 2015, and the results of their operations and their cash flows for each of the three years in the period ended January 31, 2016, in conformity with accounting principles generally accepted in the United States of America.
We have also audited, in accordance with the standards of the Public Company Accounting Oversight Board (United States), the Company's internal control over financial reporting as of January 31, 2016, based on the criteria established in Internal Control-Integrated Framework (2013) issued by the Committee of Sponsoring Organizations of the Treadway Commission and our report dated March 31, 2016, expressed an unqualified opinion on the Company's internal control over financial reporting.
/s/ DELOITTE & TOUCHE LLP
Philadelphia, Pennsylvania
March 31, 2016
F-2
URBAN OUTFITTERS, INC.
Consolidated Balance Sheets
(in thousands, except share and per share data)
| January 31, | January 31, | |||||||
| 2016 | 2015 | |||||||
| ASSETS | ||||||||
Current assets: | ||||||||
Cash and cash equivalents | $ | 265,276 | $ | 154,558 | ||||
Marketable securities | 61,061 | 104,246 | ||||||
Accounts receivable, net of allowance for doubtful accounts of $664 and $850, respectively | 75,723 | 70,458 | ||||||
Inventory | 330,223 | 358,237 | ||||||
Prepaid expenses and other current assets | 102,078 | 102,863 | ||||||
Deferred income taxes | - | 18,755 | ||||||
|
|
|
| |||||
Total current assets | 834,361 | 809,117 | ||||||
Property and equipment, net | 863,137 | 889,232 | ||||||
Marketable securities | 36,600 | 104,448 | ||||||
Deferred income taxes and other assets | 99,203 | 85,944 | ||||||
|
|
|
| |||||
Total Assets | $ | 1,833,301 | $ | 1,888,741 | ||||
|
|
|
| |||||
| LIABILITIES AND SHAREHOLDERS' EQUITY | ||||||||
Current liabilities: | ||||||||
Accounts payable | $ | 118,035 | $ | 156,090 | ||||
Accrued compensation | 41,474 | 45,007 | ||||||
Accrued expenses and other current liabilities | 169,722 | 152,643 | ||||||
|
|
|
| |||||
Total current liabilities | 329,231 | 353,740 | ||||||
Long-term debt | 150,000 | - | ||||||
Deferred rent and other liabilities | 216,843 | 207,032 | ||||||
|
|
|
| |||||
Total Liabilities | 696,074 | 560,772 | ||||||
|
|
|
| |||||
Commitments and contingencies (see Note 13) | ||||||||
Shareholders' equity: | ||||||||
Preferred shares; $.0001 par value, 10,000,000 shares authorized, none issued | - | - | ||||||
Common shares; $.0001 par value, 200,000,000 shares authorized, 117,321,120 and 130,502,864 shares issued and outstanding, respectively | 12 | 13 | ||||||
Additional paid-in-capital | - | - | ||||||
Retained earnings | 1,160,666 | 1,343,383 | ||||||
Accumulated other comprehensive loss | (23,451 | ) | (15,427 | ) | ||||
|
|
|
| |||||
Total Shareholders' Equity | 1,137,227 | 1,327,969 | ||||||
|
|
|
| |||||
Total Liabilities and Shareholders' Equity | $ | 1,833,301 | $ | 1,888,741 | ||||
|
|
|
| |||||
The accompanying notes are an integral part of these consolidated financial statements.
F-3
URBAN OUTFITTERS, INC.
Consolidated Statements of Income
(in thousands, except share and per share data)
| Fiscal Year Ended January 31, | ||||||||||||
| 2016 | 2015 | 2014 | ||||||||||
Net sales | $ | 3,445,134 | $ | 3,323,077 | $ | 3,086,608 | ||||||
Cost of sales | 2,243,232 | 2,148,147 | 1,925,266 | |||||||||
|
|
|
|
|
| |||||||
Gross profit | 1,201,902 | 1,174,930 | 1,161,342 | |||||||||
Selling, general and administrative expenses | 848,323 | 809,545 | 734,511 | |||||||||
|
|
|
|
|
| |||||||
Income from operations | 353,579 | 365,385 | 426,831 | |||||||||
Interest income | 943 | 2,319 | 2,713 | |||||||||
Other income | 958 | 580 | 1,088 | |||||||||
Other expenses | (5,449 | ) | (4,834 | ) | (3,114 | ) | ||||||
|
|
|
|
|
| |||||||
Income before income taxes | 350,031 | 363,450 | 427,518 | |||||||||
Income tax expense | 125,542 | 131,022 | 145,158 | |||||||||
|
|
|
|
|
| |||||||
Net income | $ | 224,489 | $ | 232,428 | $ | 282,360 | ||||||
|
|
|
|
|
| |||||||
Net income per common share: | ||||||||||||
Basic | $ | 1.79 | $ | 1.70 | $ | 1.92 | ||||||
|
|
|
|
|
| |||||||
Diluted | $ | 1.78 | $ | 1.68 | $ | 1.89 | ||||||
|
|
|
|
|
| |||||||
Weighted-average common shares outstanding: | ||||||||||||
Basic | 125,232,499 | 136,651,899 | 147,014,869 | |||||||||
|
|
|
|
|
| |||||||
Diluted | 126,013,414 | 138,192,734 | 149,225,906 | |||||||||
|
|
|
|
|
| |||||||
The accompanying notes are an integral part of these consolidated financial statements.
F-4
URBAN OUTFITTERS, INC.
Consolidated Statements of Comprehensive Income
(in thousands)
| Fiscal Year Ended January 31, | ||||||||||||
| 2016 | 2015 | 2014 | ||||||||||
Net income | $ | 224,489 | $ | 232,428 | $ | 282,360 | ||||||
Other comprehensive (loss) income: | ||||||||||||
Foreign currency translation | (7,963 | ) | (14,128 | ) | 7,194 | |||||||
Change in unrealized (losses) gains on marketable securities, net of tax | (61 | ) | (331 | ) | 620 | |||||||
|
|
|
|
|
| |||||||
Total other comprehensive (loss) income | (8,024 | ) | (14,459 | ) | 7,814 | |||||||
|
|
|
|
|
| |||||||
Comprehensive income | $ | 216,465 | $ | 217,969 | $ | 290,174 | ||||||
|
|
|
|
|
| |||||||
The accompanying notes are an integral part of these consolidated financial statements.
F-5
URBAN OUTFITTERS, INC.
Consolidated Statements of Shareholders' Equity
(in thousands, except share data)
Common Shares | Additional Paid-in Capital | Retained Earnings | Accumulated Other Compre- hensive Loss | Total | ||||||||||||||||||||
| Number of Shares | Par Value | |||||||||||||||||||||||
Balances as of January 31, 2013 | 146,015,767 | $ | 15 | $ | 48,276 | $ | 1,315,079 | $ | (8,782 | ) | $ | 1,354,588 | ||||||||||||
Comprehensive income | - | - | - | 282,360 | 7,814 | 290,174 | ||||||||||||||||||
Share-based compensation | - | - | 15,742 | - | - | 15,742 | ||||||||||||||||||
Stock options and awards | 1,603,628 | - | 35,218 | - | - | 35,218 | ||||||||||||||||||
Excess tax benefit from share-based awards | - | - | 9,540 | - | - | 9,540 | ||||||||||||||||||
Share repurchases | (309,820 | ) | - | (11,092 | ) | - | - | (11,092 | ) | |||||||||||||||
|
|
|
|
|
|
|
|
|
|
|
| |||||||||||||
Balances as of January 31, 2014 | 147,309,575 | $ | 15 | $ | 97,684 | $ | 1,597,439 | $ | (968 | ) | $ | 1,694,170 | ||||||||||||
Comprehensive income | - | - | - | 232,428 | (14,459 | ) | 217,969 | |||||||||||||||||
Share-based compensation | - | - | 16,736 | - | - | 16,736 | ||||||||||||||||||
Stock options and awards | 723,083 | - | 10,693 | - | - | 10,693 | ||||||||||||||||||
Excess tax benefit from share-based awards | - | - | 3,822 | - | - | 3,822 | ||||||||||||||||||
Share repurchases | (17,529,794 | ) | (2 | ) | (128,935 | ) | (486,484 | ) | - | (615,421 | ) | |||||||||||||
|
|
|
|
|
|
|
|
|
|
|
| |||||||||||||
Balances as of January 31, 2015 | 130,502,864 | $ | 13 | $ | - | $ | 1,343,383 | $ | (15,427 | ) | $ | 1,327,969 | ||||||||||||
Comprehensive income | - | - | - | 224,489 | (8,024 | ) | 216,465 | |||||||||||||||||
Share-based compensation | - | - | 15,623 | - | - | 15,623 | ||||||||||||||||||
Stock options and awards | 2,027,090 | - | 46,400 | - | - | 46,400 | ||||||||||||||||||
Excess tax benefit from share-based awards | - | - | 6,194 | - | - | 6,194 | ||||||||||||||||||
Share repurchases | (15,208,834 | ) | (1 | ) | (68,217 | ) | (407,206 | ) | - | (475,424 | ) | |||||||||||||
|
|
|
|
|
|
|
|
|
|
|
| |||||||||||||
Balances as of January 31, 2016 | 117,321,120 | $ | 12 | $ | - | $ | 1,160,666 | $ | (23,451 | ) | $ | 1,137,227 | ||||||||||||
|
|
|
|
|
|
|
|
|
|
|
| |||||||||||||
The accompanying notes are an integral part of these consolidated financial statements.
F-6
URBAN OUTFITTERS, INC.
Consolidated Statements of Cash Flows
(in thousands)
| Fiscal Year Ended January 31, | ||||||||||||
| 2016 | 2015 | 2014 | ||||||||||
Cash flows from operating activities: | ||||||||||||
Net income | $ | 224,489 | $ | 232,428 | $ | 282,360 | ||||||
Adjustments to reconcile net income to net cash provided by operating activities: | ||||||||||||
Depreciation and amortization | 142,722 | 138,110 | 132,664 | |||||||||
Provision (benefit) for deferred income taxes | 13,662 | (2,221 | ) | (28,505 | ) | |||||||
Excess tax benefits from stock option exercises | (6,194 | ) | (3,822 | ) | (9,540 | ) | ||||||
Share-based compensation expense | 15,623 | 16,736 | 15,742 | |||||||||
Impairment | 8,928 | - | - | |||||||||
Loss on disposition of property and equipment, net | 1,400 | 3,189 | 2,368 | |||||||||
Changes in assets and liabilities: | ||||||||||||
Receivables | (13,820 | ) | (18,393 | ) | (15,368 | ) | ||||||
Inventory | 26,739 | (68,992 | ) | (27,713 | ) | |||||||
Prepaid expenses and other assets | 3,811 | (23,257 | ) | 2,985 | ||||||||
Payables, accrued expenses and other liabilities | (3,940 | ) | 48,543 | 68,162 | ||||||||
|
|
|
|
|
| |||||||
Net cash provided by operating activities | 413,420 | 322,321 | 423,155 | |||||||||
|
|
|
|
|
| |||||||
Cash flows from investing activities: | ||||||||||||
Cash paid for property and equipment | (134,950 | ) | (229,804 | ) | (186,101 | ) | ||||||
Cash paid for marketable securities | (265,872 | ) | (405,659 | ) | (727,987 | ) | ||||||
Sales and maturities of marketable securities | 374,057 | 830,297 | 451,866 | |||||||||
|
|
|
|
|
| |||||||
Net cash (used in) provided by investing activities | (26,765 | ) | 194,834 | (462,222 | ) | |||||||
|
|
|
|
|
| |||||||
Cash flows from financing activities: | ||||||||||||
Borrowings under long-term debt | 291,612 | - | - | |||||||||
Repayments of long-term debt | (141,612 | ) | - | - | ||||||||
Proceeds from the exercise of stock options | 46,400 | 10,693 | 35,218 | |||||||||
Excess tax benefits from stock option exercises | 6,194 | 3,822 | 9,540 | |||||||||
Share repurchases related to share repurchase program | (465,304 | ) | (611,475 | ) | (10,695 | ) | ||||||
Share repurchases related to taxes for share-based awards | (10,120 | ) | (3,947 | ) | (397 | ) | ||||||
|
|
|
|
|
| |||||||
Net cash (used in) provided by financing activities | (272,830 | ) | (600,907 | ) | 33,666 | |||||||
|
|
|
|
|
| |||||||
Effect of exchange rate changes on cash and cash equivalents | (3,107 | ) | (3,748 | ) | 2,132 | |||||||
|
|
|
|
|
| |||||||
Increase (decrease) in cash and cash equivalents | 110,718 | (87,500 | ) | (3,269 | ) | |||||||
Cash and cash equivalents at beginning of period | 154,558 | 242,058 | 245,327 | |||||||||
|
|
|
|
|
| |||||||
Cash and cash equivalents at end of period | $ | 265,276 | $ | 154,558 | $ | 242,058 | ||||||
|
|
|
|
|
| |||||||
Supplemental cash flow information: | ||||||||||||
Cash paid during the year for: | ||||||||||||
Income taxes | $ | 99,359 | $ | 144,892 | $ | 159,628 | ||||||
|
|
|
|
|
| |||||||
Non-cash investing activities-Accrued capital expenditures | $ | 11,607 | $ | 18,771 | $ | 20,889 | ||||||
|
|
|
|
|
| |||||||
The accompanying notes are an integral part of these consolidated financial statements.
F-7
URBAN OUTFITTERS, INC.
NOTES TO CONSOLIDATED FINANCIAL STATEMENTS
(in thousands, except share and per share data)
1. Nature of Business
Urban Outfitters, Inc. (the "Company" or "Urban Outfitters"), which was founded in 1970, was incorporated in the Commonwealth of Pennsylvania in 1976. The principal business activity of the Company is the operation of a general consumer product retail and wholesale business selling to customers through various channels including retail stores, websites, catalogs and mobile applications. As of January 31, 2016 and 2015, the Company operated 572 and 546 stores, respectively. Stores located in the United States totaled 485 as of January 31, 2016 and 464 as of January 31, 2015. Operations in Europe and Canada included 52 stores and 35 stores as of January 31, 2016, respectively, and 50 stores and 32 stores as of January 31, 2015, respectively. In addition, the Company's Wholesale segment sold and distributed apparel to approximately 1,800 better department and specialty retailers worldwide.
2. Summary of Significant Accounting Policies
Fiscal Year-End
The Company operates on a fiscal year ending January 31 of each year. All references to fiscal years of the Company refer to the fiscal years ended on January 31 in those years. For example, the Company's fiscal 2016 ended on January 31, 2016.
Principles of Consolidation
The Consolidated Financial Statements include the accounts of the Company and all of its subsidiaries. All intercompany transactions and accounts have been eliminated in consolidation.
Use of Estimates
The preparation of financial statements, in conformity with accounting principles generally accepted in the United States, requires management to make estimates and assumptions that affect the reported amounts of assets, liabilities, net sales and expenses during the reporting period. Actual results could differ from those estimates.
Cash and Cash Equivalents
Cash and cash equivalents are defined as cash and short-term highly liquid investments with maturities of less than three months at the time of purchase. These short-term highly liquid investments are both readily convertible to known amounts of cash and so near their maturity that they present insignificant risk of changes in value because of changes in interest rates. As of January 31, 2016 and 2015, cash and cash equivalents included cash on hand, cash in banks, money market accounts and marketable securities with maturities of less than three months at the time of purchase.
F-8
URBAN OUTFITTERS, INC.
NOTES TO CONSOLIDATED FINANCIAL STATEMENTS-(Continued)
(in thousands, except share and per share data)
Marketable Securities
All of the Company's marketable securities as of January 31, 2016 and January 31, 2015 are classified as available-for-sale and are carried at fair value, which approximates amortized cost. Interest on these securities, as well as the amortization of discounts and premiums, is included in "Interest income" in the Consolidated Statements of Income. The Company records unrealized gains and losses on these securities (other than mutual funds held in the rabbi trust for the Urban Outfitters, Inc. Non-qualified Deferred Compensation Plan (See Note 3, "Marketable Securities")) as a component of "Other comprehensive (loss) income" in the Consolidated Statements of Comprehensive Income and in "Accumulated other comprehensive loss" within "Shareholders' equity" until realized, except when the Company considers declines in value to be other than temporary. Other than temporary impairment losses related to credit losses are considered to be realized losses. Mutual funds held in the rabbi trust have been accounted for under the fair value option, which results in all unrealized gains and losses being recorded in "Interest income" in the Consolidated Statements of Income. When available-for-sale securities are sold, the cost of the securities is specifically identified and is used to determine the realized gain or loss. Securities classified as current assets have maturity dates of less than or equal to one year from the balance sheet date. Securities classified as non-current assets have maturity dates greater than one year from the balance sheet date.
Accounts Receivable
Accounts receivable primarily consists of amounts due from our wholesale customers as well as credit card receivables outstanding with third-party credit card vendors. The activity of the allowance for doubtful accounts for the years ended January 31, 2016, 2015 and 2014 was as follows:
| Balance at beginning of year | Additions | Deductions | Balance at end of year | |||||||||||||
Year ended January 31, 2016 | $ | 850 | 6,578 | (6,764 | ) | $ | 664 | |||||||||
Year ended January 31, 2015 | $ | 1,711 | 4,666 | (5,527 | ) | $ | 850 | |||||||||
Year ended January 31, 2014 | $ | 1,681 | 4,400 | (4,370 | ) | $ | 1,711 | |||||||||
Inventory
Inventory, which consists primarily of general consumer merchandise held for sale, is valued at the lower of cost or market. Cost is determined on the first-in, first-out method and includes the cost of merchandise and import related costs, including freight, import taxes and agent commissions. A periodic review of inventory is performed in order to determine if inventory is properly stated at the lower of cost or market. Factors the Company considers in its review, such as future expected consumer demand and fashion trends, current aging, current and anticipated retail markdowns or wholesale discounts and class or type of inventory, are analyzed to determine estimated net realizable value. Criteria that the Company considers in its review of aging trends include average selling cycle and seasonality of merchandise, the historical rate at which merchandise has sold below cost during the prior twelve months and the value and nature of merchandise currently priced below original cost.
F-9
URBAN OUTFITTERS, INC.
NOTES TO CONSOLIDATED FINANCIAL STATEMENTS-(Continued)
(in thousands, except share and per share data)
A provision is recorded to reduce the cost of inventory to its estimated net realizable value, if appropriate. The majority of inventory at January 31, 2016 and 2015 consisted of finished goods. Raw materials and work-in-process were not material to the overall inventory value.
Property and Equipment
Property and equipment are stated at cost and primarily consist of store leasehold improvements, furniture and fixtures, buildings, and other operating equipment. Depreciation is computed using the straight-line method over the lesser of the lease term or useful life for leasehold improvements, five years for furniture and fixtures, 39 years for buildings and three to ten years for other operating equipment. Major renovations or improvements that extend the service lives of our assets are capitalized over the extension period or life of the improvement, whichever is less.
Impairment of Long-lived Assets, Goodwill and Intangible Assets
The Company periodically reviews the carrying values of its long-lived assets whenever events or changes in circumstances indicate that the carrying value may not be recoverable. Events that result in an impairment review include plans to close a store, distribution or fulfillment center or a significant decrease in the operating results of a long-lived asset. The Company's retail stores are reviewed for impairment at the store level, which is the lowest level at which individual cash flows can be identified. When events indicate that an asset may be impaired and the estimated undiscounted cash flows are less than the carrying amount of the asset, the impaired asset is adjusted to its estimated fair value and an impairment loss is recorded. During fiscal 2016, the Company recorded impairment charges for five retail stores, totaling $8,928, of which $7,429 is in "Cost of sales" and $1,499 is in "Selling, general and administrative expenses," in the Consolidated Statements of Income. During the Company's assessment of current and future performance it was determined that these stores would not be able to generate sufficient cash flow over the expected remaining lease term to recover the carrying value of the respective store assets. Impairment charges for fiscal 2015 and 2014 were immaterial.
Deferred Rent
Rent expense from leases is recorded on a straight-line basis over the lease period. The net excess of rent expense over the actual cash paid is recorded as deferred rent. In addition, certain store leases provide for contingent rentals when sales exceed specified break-point levels that are weighted based upon historical cyclicality. For leases where achievement of these levels is considered probable based on cumulative lease year revenue versus the established breakpoint at any given point in time, the Company accrues a contingent rent liability and a corresponding rent expense.
Operating Leases
The Company leases its retail stores under operating leases. Many of the lease agreements contain rent holidays, rent escalation clauses and contingent rent provisions or some combination of these items.
F-10
URBAN OUTFITTERS, INC.
NOTES TO CONSOLIDATED FINANCIAL STATEMENTS-(Continued)
(in thousands, except share and per share data)
The Company recognizes rent expense on a straight-line basis over the lease period commencing on the date that the premises are available from the landlord. The lease period includes the construction period required to make the leased space suitable for operating during which time the Company is not permitted to occupy the space. For purposes of calculating straight-line rent expense, the commencement date of the lease term reflects the date the Company takes possession of the building for initial construction and setup. The Company receives certain lease incentives, tenant improvement allowances, in conjunction with entering into operating leases. Tenant improvement allowances are recorded as deferred rent on the Consolidated Balance Sheets and are amortized on a straight-line basis as a reduction of rent expense over the term of the related lease on the Consolidated Statements of Income.
Revenue Recognition
The Company recognizes revenue in the Retail segment at the point-of-sale for merchandise the customer takes possession of at the store or when merchandise is shipped to the customer, in each case, net of estimated customer returns. Revenue is recognized by the Company's Wholesale segment when merchandise is shipped to the customer, net of estimated customer returns. Revenue is presented on a net basis and does not include any tax assessed by a governmental or municipal authority. Payment for merchandise in the Company's Retail segment is tendered by cash, check, credit card, debit card or gift card. Uncollectible accounts receivable for the Retail segment is negligible and primarily results from unauthorized credit card transactions. The Company maintains an allowance for doubtful accounts for its Wholesale segment accounts receivable, which management reviews on a regular basis and believes is sufficient to cover potential credit losses and billing adjustments.
The Company accounts for a gift card transaction by recording a liability at the time the gift card is issued to the customer in exchange for consideration from the customer. A liability is established and remains on the Company's books until the card is redeemed by the customer, at which time the Company records the redemption of the card for merchandise as a sale, or when it is determined the likelihood of redemption is remote. The Company determines the probability of the gift cards being redeemed to be remote based on historical redemption patterns. Revenues attributable to the reduction of gift card liabilities for which the likelihood of redemption becomes remote are included in sales and are not material. The Company's gift cards do not expire.
F-11
URBAN OUTFITTERS, INC.
NOTES TO CONSOLIDATED FINANCIAL STATEMENTS-(Continued)
(in thousands, except share and per share data)
Sales Return Reserve
The Company records a reserve for estimated product returns where the sale has occurred during the period reported, but the return is likely to occur subsequent to the period reported. The reserve for estimated product returns is based on the Company's most recent historical return trends. If the actual return rate is materially different than the Company's estimate, sales returns would be adjusted in the future. The activity of the sales returns reserve for the years ended January 31, 2016, 2015 and 2014 was as follows:
| Balance at beginning of year | Additions | Deductions | Balance at end of year | |||||||||||||
Year ended January 31, 2016 | $ | 19,804 | 96,707 | (92,126 | ) | $ | 24,385 | |||||||||
Year ended January 31, 2015 | $ | 17,089 | 80,390 | (77,675 | ) | $ | 19,804 | |||||||||
Year ended January 31, 2014 | $ | 14,448 | 64,313 | (61,672 | ) | $ | 17,089 | |||||||||
Cost of Sales
Cost of sales includes the following: the cost of merchandise; merchandise markdowns; obsolescence and shrink provisions; store occupancy costs including rent and depreciation; delivery expense; inbound and outbound freight; customs related taxes and duties; inventory acquisition and purchasing costs; design costs; warehousing and handling costs and other inventory acquisition related costs.
Selling, General and Administrative Expenses
Selling, general and administrative expenses includes expenses such as: direct selling and selling supervisory expenses; marketing expenses; various corporate expenses such as information systems, finance, loss prevention, talent acquisition, home office and executive management expenses; share-based compensation expense; and other associated general expenses.
Shipping and Handling Revenues and Costs
The Company includes shipping and handling revenues in net sales and shipping and handling costs in cost of sales. The Company's shipping and handling revenues consist of amounts billed to customers for shipping and handling merchandise. Shipping and handling costs include shipping supplies, related labor costs and third-party shipping costs.
Advertising
The Company expenses the costs of advertising when the advertising occurs, except for direct-to-consumer advertising, which is capitalized and amortized over its expected period of future benefit. Advertising costs primarily relate to our Retail segment marketing expenses which are comprised of web marketing, catalog printing, paper, postage and other costs related to production of photographic
F-12
URBAN OUTFITTERS, INC.
NOTES TO CONSOLIDATED FINANCIAL STATEMENTS-(Continued)
(in thousands, except share and per share data)
images used in our catalogs and on our websites and mobile applications. The catalog printing, paper, postage and other costs are amortized over the period in which the customer responds to the marketing material determined based on historical customer response trends to a similar season's advertisement. Amortization rates are reviewed on a regular basis during the fiscal year and may be adjusted if the predicted customer response appears materially different than the historical response rate. The Company has the ability to measure the response rate to direct marketing early in the course of the advertisement based on its customers' reference to a specific catalog or by product placed and sold. The average amortization period for a catalog and related items are typically one to two months. If there is no expected future benefit, the cost of advertising is expensed when incurred. Advertising costs reported as prepaid expenses were $3,724 and $2,146 as of January 31, 2016 and 2015, respectively. Advertising expenses were $114,104, $103,882 and $91,615 for fiscal 2016, 2015 and 2014, respectively.
Store Opening Costs
The Company expenses all store opening and organization costs as incurred, including travel, training, recruiting, salaries and other operating costs, and are included in "Selling, general and administrative expenses" in the Consolidated Statements of Income.
Website Development Costs
The Company capitalizes applicable costs incurred during the application and infrastructure development stage and expenses costs incurred during the planning and operating stage. During fiscal 2016, 2015 and 2014, the Company did not capitalize any internally generated internal-use software development costs because substantially all costs were incurred during the planning and operating stages, and costs incurred during the application and infrastructure development stage were not material.
Income Taxes
The Company utilizes a balance sheet approach to provide for income taxes. Under this method, deferred tax assets and liabilities are recognized for the expected future tax consequences of net operating loss carryforwards and temporary differences between the carrying amounts and the tax bases of assets and liabilities. Investment tax credits or grants are accounted for in the period earned. The Company files a consolidated United States federal income tax return (see Note 8, "Income Taxes," for a further discussion of income taxes). The effect of a change in tax rates on deferred tax assets and liabilities is recognized in income in the period that includes the enactment date.
Net Income Per Common Share
Basic net income per common share is computed by dividing net income by the weighted-average number of common shares outstanding. Diluted net income per common share is computed by dividing net income by the weighted-average number of common shares and common share equivalents
F-13
URBAN OUTFITTERS, INC.
NOTES TO CONSOLIDATED FINANCIAL STATEMENTS-(Continued)
(in thousands, except share and per share data)
outstanding. Common share equivalents include the effect of stock options, stock appreciation rights ("SAR's"), restricted stock units ("RSU's") and performance stock units ("PSU's").
Comprehensive Income and Accumulated Other Comprehensive Loss
Comprehensive income is comprised of two subsets-net income and other comprehensive income/loss. Amounts included in accumulated other comprehensive loss relate to foreign currency translation adjustments and unrealized gains or losses on marketable securities. The foreign currency translation adjustments are not adjusted for income taxes because these adjustments relate to non-U.S. subsidiaries for which foreign earnings have been designated as permanently reinvested. Accumulated other comprehensive loss consisted of foreign currency translation losses of ($23,479) and ($15,516) as of January 31, 2016 and January 31, 2015, respectively, and unrealized gains, net of tax, on marketable securities of $28 and $89 as of January 31, 2016 and January 31, 2015, respectively. The tax effect of the unrealized (losses) on marketable securities recorded in comprehensive loss was $36, $201 and $378 during fiscal 2016, 2015 and 2014, respectively. Gross realized gains and losses are included in "Other income" in the Consolidated Statements of Income and were not material to the Company's Consolidated Financial Statements for all three years presented.
Foreign Currency
The financial statements of the Company's foreign operations are translated into U.S. dollars. Assets and liabilities are translated at current exchange rates as of the balance sheet date, equity accounts at historical exchange rates, while income statement accounts are translated at the average rates in effect during the year. Translation adjustments are not included in determining net income, but are included in "Accumulated other comprehensive loss" within "Shareholders' equity." Remeasurement gains and losses included in operating results for fiscal years 2016, 2015 and 2014 were not material.
Concentration of Credit Risk
Financial instruments that potentially subject the Company to concentrations of credit risk consist principally of cash, cash equivalents, marketable securities and accounts receivable. The Company manages the credit risk associated with cash, cash equivalents and marketable securities by investing in high-quality securities held with reputable trustees and, by policy, limiting the amount of credit exposure to any one issuer or issue, as well as providing limitations on investment maturities. The Company's investment policy requires that its cash, cash equivalents and marketable securities are invested in corporate and municipal bonds rated "BBB" or better, commercial paper and federally insured or guaranteed investment vehicles such as certificates of deposit, United States treasury bills and federal government agencies. Receivables from third-party credit cards are processed by financial institutions, which are monitored for financial stability. The Company regularly evaluates the financial condition of its Wholesale segment customers. The Company's allowance for doubtful accounts reflects current market conditions and management's assessment regarding the collectability of its accounts receivable. The Company maintains cash accounts that, at times, may exceed federally
F-14
URBAN OUTFITTERS, INC.
NOTES TO CONSOLIDATED FINANCIAL STATEMENTS-(Continued)
(in thousands, except share and per share data)
insured limits. The Company has not experienced any losses from maintaining cash accounts in excess of such limits. Management believes that it is not exposed to any significant risks related to its cash accounts.
Commitments and Contingencies
From time to time, the Company is named as a defendant in legal actions arising from normal business activities. The Company records a reserve for estimated losses when information available prior to issuance of the financial statements indicates that it is probable that a liability has been incurred at the date of the financial statements and the amount of the loss can be reasonably estimated.
Recently Issued Accounting Pronouncements
In February 2016, the Financial Accounting Standards Board ("FASB") issued an accounting standards update that amends the existing accounting standards for lease accounting. This update requires lessees to recognize a right-of-use asset and lease liability for all leases with terms of more than twelve months. Lessees are permitted to make an accounting policy election to not recognize the asset and liability for leases with a term of twelve months or less. The update does not significantly change the lessees' recognition, measurement and presentation of expenses and cash flows from the previous accounting standard. The update will be effective for the Company on February 1, 2019 and early adoption of the update is permitted. The update requires a modified retrospective transition approach, which includes a number of practical expedients. The Company is currently assessing the potential effects this update may have on its consolidated financial statements and related disclosures.
In November 2015, the FASB issued an accounting standards update that requires companies to classify all deferred tax assets and liabilities as noncurrent on the balance sheet rather than separating deferred taxes into current and noncurrent amounts. The Company elected to early adopt this update and prospectively applied the update to deferred tax assets and liabilities as of January 31, 2016. The adoption of this standard did not have a material impact on the Company's consolidated financial statements and related disclosures.
In July 2015, the FASB issued an accounting standards update that clarifies the measurement of inventory. The update applies to entities which utilize the first-in, first-out ("FIFO") and average cost methods of measuring inventory and states that an entity should measure inventory at the lower of cost and net realizable value. Net realizable value represents the estimated selling price less costs associated with completion, disposal and transportation. The update will be effective for the Company on February 1, 2017 and early adoption is permitted. The update is to be adopted on a prospective basis. The Company is currently assessing the potential effects this update may have on its consolidated financial statements and related disclosures.
In April 2015, the FASB issued an accounting standards update that clarifies the circumstances in which a customer would account for a cloud computing arrangement as a license of internal-use
F-15
URBAN OUTFITTERS, INC.
NOTES TO CONSOLIDATED FINANCIAL STATEMENTS-(Continued)
(in thousands, except share and per share data)
software. The update will be effective for the Company on February 1, 2016. The update allows for either retrospective or prospective adoption for all new transactions entered into or materially modified after the date of the adoption. The Company has performed an assessment of its cloud computing arrangements and determined that the potential effects this update has are immaterial to its consolidated financial statements and related disclosures.
In May 2014, the FASB issued an accounting standards update that clarifies the principles for recognizing revenue from contracts with customers. The update outlines a single comprehensive model for entities to use in accounting for revenue arising from contracts with customers and supersedes most current revenue recognition guidance, including industry-specific guidance. The update states that an entity should recognize revenue to depict the transfer of promised goods or services to customers in the amount that reflects the consideration to which the entity expects to be entitled in exchange for those goods and services. Entities are required to apply the following steps when recognizing revenue under the update: (1) identify the contract(s) with a customer; (2) identify the performance obligation in the contract; (3) determine the transaction price; (4) allocate the transaction price to the performance obligations in the contract; and (5) recognize revenue when (or as) the entity satisfies a performance obligation. The update allows for a "full retrospective" adoption, meaning the update is applied to all periods presented, or a "modified retrospective" adoption, meaning the update is applied only to the most current periods presented in the financial statements. In August 2015, the FASB issued an accounting standards update which approved a one-year deferral of the effective date that allows the Company to defer the effective date to February 1, 2018, but still permits the Company to adopt the update as of the original February 1, 2017 effective date. The Company is currently evaluating the adoption method to apply and the impact that the update will have on its consolidated financial statements and related disclosures.
F-16
URBAN OUTFITTERS, INC.
NOTES TO CONSOLIDATED FINANCIAL STATEMENTS-(Continued)
(in thousands, except share and per share data)
3. Marketable Securities
During all periods shown, marketable securities are classified as available-for-sale. The amortized cost, gross unrealized gains (losses) and fair values of available-for-sale securities by major security type and class of security as of January 31, 2016 and 2015 are as follows:
| Amortized | Unrealized | Unrealized | Fair | |||||||||||||
| Cost | Gains | (Losses) | Value | |||||||||||||
As of January 31, 2016 | ||||||||||||||||
Short-term Investments: | ||||||||||||||||
Corporate bonds | $ | 33,885 | $ | 10 | $ | (25 | ) | $ | 33,870 | |||||||
Municipal and pre-refunded municipal bonds | 26,243 | 33 | - | 26,276 | ||||||||||||
Certificates of deposit | 915 | - | - | 915 | ||||||||||||
|
|
|
|
|
|
|
| |||||||||
| 61,043 | 43 | (25 | ) | 61,061 | ||||||||||||
|
|
|
|
|
|
|
| |||||||||
Long-term Investments: | ||||||||||||||||
Corporate bonds | 12,227 | 9 | (35 | ) | 12,201 | |||||||||||
Municipal and pre-refunded municipal bonds | 18,028 | 58 | (2 | ) | 18,084 | |||||||||||
Mutual funds, held in rabbi trust | 4,604 | 6 | (247 | ) | 4,363 | |||||||||||
Certificates of deposit | 1,952 | - | - | 1,952 | ||||||||||||
|
|
|
|
|
|
|
| |||||||||
| 36,811 | 73 | (284 | ) | 36,600 | ||||||||||||
|
|
|
|
|
|
|
| |||||||||
| $ | 97,854 | $ | 116 | $ | (309 | ) | $ | 97,661 | ||||||||
|
|
|
|
|
|
|
| |||||||||
As of January 31, 2015 | ||||||||||||||||
Short-term Investments: | ||||||||||||||||
Corporate bonds | $ | 56,594 | $ | 20 | $ | (24 | ) | $ | 56,590 | |||||||
Municipal and pre-refunded municipal bonds | 30,509 | 41 | (2 | ) | 30,548 | |||||||||||
Certificates of deposit | 11,127 | 5 | - | 11,132 | ||||||||||||
Treasury bills | 2,033 | 3 | - | 2,036 | ||||||||||||
Commercial paper | 3,938 | 2 | - | 3,940 | ||||||||||||
|
|
|
|
|
|
|
| |||||||||
| 104,201 | 71 | (26 | ) | 104,246 | ||||||||||||
|
|
|
|
|
|
|
| |||||||||
Long-term Investments: | ||||||||||||||||
Corporate bonds | 46,754 | 22 | (40 | ) | 46,736 | |||||||||||
Municipal and pre-refunded municipal bonds | 42,840 | 113 | (6 | ) | 42,947 | |||||||||||
Mutual funds, held in rabbi trust | 3,816 | 16 | (54 | ) | 3,778 | |||||||||||
Certificates of deposit | 3,066 | - | - | 3,066 | ||||||||||||
Treasury bills | 7,111 | 9 | - | 7,120 | ||||||||||||
Federal government agencies | 799 | 2 | - | 801 | ||||||||||||
|
|
|
|
|
|
|
| |||||||||
| 104,386 | 162 | (100 | ) | 104,448 | ||||||||||||
|
|
|
|
|
|
|
| |||||||||
| $ | 208,587 | $ | 233 | $ | (126 | ) | $ | 208,694 | ||||||||
|
|
|
|
|
|
|
| |||||||||
F-17
URBAN OUTFITTERS, INC.
NOTES TO CONSOLIDATED FINANCIAL STATEMENTS-(Continued)
(in thousands, except share and per share data)
Proceeds from the sales and maturities of available-for-sale securities were $374,057, $830,297 and $451,866 in fiscal 2016, 2015 and 2014, respectively. The Company included in "Interest income," in the Consolidated Statements of Income, a net realized gain of $43 during fiscal 2016, a net realized gain of $237 during fiscal 2015 and a net realized loss of $101 during fiscal 2014. Amortization of discounts and premiums, net, resulted in a reduction of "Interest income" of $3,841, $6,696 and $10,932 for fiscal years 2016, 2015 and 2014, respectively. Mutual funds represent assets held in an irrevocable rabbi trust for the Company's Non-qualified Deferred Compensation Plan ("NQDC"). These assets are a source of funds to match the funding obligations to participants in the NQDC but are subject to the Company's general creditors. The Company elected the fair value option for financial assets for the mutual funds held in the rabbi trust resulting in all unrealized gains and losses being recorded in "Interest income" in the Consolidated Statements of Income.
The following tables show the gross unrealized losses and fair value of the Company's marketable securities with unrealized losses that are not deemed to be other-than-temporarily impaired aggregated by the length of time that individual securities have been in a continuous unrealized loss position, at January 31, 2016 and January 31, 2015, respectively.
| January 31, 2016 | ||||||||||||||||||||||||
| Less Than 12 Months | 12 Months or Greater | Total | ||||||||||||||||||||||
Description of Securities | Fair Value | Unrealized Losses | Fair Value | Unrealized Losses | Fair Value | Unrealized Losses | ||||||||||||||||||
Corporate bonds | $ | 30,745 | $ | (54 | ) | $ | 1,098 | $ | (6 | ) | $ | 31,843 | $ | (60 | ) | |||||||||
Municipal and pre-refunded municipal bonds | 997 | (2 | ) | 434 | - | 1,431 | (2 | ) | ||||||||||||||||
Mutual funds, held in rabbi trust | 4,363 | (247 | ) | - | - | 4,363 | (247 | ) | ||||||||||||||||
|
|
|
|
|
|
|
|
|
|
|
| |||||||||||||
Total | $ | 36,105 | $ | (303 | ) | $ | 1,532 | $ | (6 | ) | $ | 37,637 | $ | (309 | ) | |||||||||
|
|
|
|
|
|
|
|
|
|
|
| |||||||||||||
| January 31, 2015 | ||||||||||||||||||||||||
| Less Than 12 Months | 12 Months or Greater | Total | ||||||||||||||||||||||
Description of Securities | Fair Value | Unrealized Losses | Fair Value | Unrealized Losses | Fair Value | Unrealized Losses | ||||||||||||||||||
Corporate bonds | $ | 55,384 | $ | (63 | ) | $ | 383 | $ | (1 | ) | $ | 55,767 | $ | (64 | ) | |||||||||
Municipal and pre-refunded municipal bonds | 4,672 | (8 | ) | - | - | 4,672 | (8 | ) | ||||||||||||||||
Mutual funds, held in rabbi trust | 3,778 | (54 | ) | - | - | 3,778 | (54 | ) | ||||||||||||||||
Certificates of deposit | 1,600 | - | - | - | 1,600 | - | ||||||||||||||||||
Commercial paper | 747 | - | - | - | 747 | - | ||||||||||||||||||
|
|
|
|
|
|
|
|
|
|
|
| |||||||||||||
Total | $ | 66,181 | $ | (125 | ) | $ | 383 | $ | (1 | ) | $ | 66,564 | $ | (126 | ) | |||||||||
|
|
|
|
|
|
|
|
|
|
|
| |||||||||||||
As of January 31, 2016 and 2015, there were a total of 84 and 172 securities with unrealized loss positions within the Company's portfolio, respectively.
F-18
URBAN OUTFITTERS, INC.
NOTES TO CONSOLIDATED FINANCIAL STATEMENTS-(Continued)
(in thousands, except share and per share data)
4. Fair Value
The Company utilizes a hierarchy that prioritizes fair value measurements based on the types of inputs used for the various valuation techniques (market approach, income approach and cost approach that relate to its financial assets and financial liabilities). The levels of the hierarchy are described as follows:
| • | Level 1: Observable inputs such as quoted prices in active markets for identical assets or liabilities. |
| • | Level 2: Inputs other than quoted prices that are observable for the asset or liability, either directly or indirectly; these include quoted prices for similar assets or liabilities in active markets and quoted prices for identical or similar assets or liabilities in markets that are not active. |
| • | Level 3: Unobservable inputs that reflect the Company's own assumptions. |
Management's assessment of the significance of a particular input to the fair value measurement requires judgment and may affect the valuation of financial assets and liabilities and their placement within the fair value hierarchy. The Company's financial assets that are accounted for at fair value on a recurring basis are presented in the tables below:
| Marketable Securities Fair Value as of | ||||||||||||||||
| January 31, 2016 | ||||||||||||||||
| Level 1 | Level 2 | Level 3 | Total | |||||||||||||
Assets: | ||||||||||||||||
Corporate bonds | $ | 46,071 | $ | - | $ | - | $ | 46,071 | ||||||||
Municipal and pre-refunded municipal bonds | - | 44,360 | - | 44,360 | ||||||||||||
Mutual funds, held in rabbi trust | 4,363 | - | - | 4,363 | ||||||||||||
Certificates of deposit | - | 2,867 | - | 2,867 | ||||||||||||
|
|
|
|
|
|
|
| |||||||||
| $ | 50,434 | $ | 47,227 | $ | - | $ | 97,661 | |||||||||
|
|
|
|
|
|
|
| |||||||||
| Marketable Securities Fair Value as of | ||||||||||||||||
| January 31, 2015 | ||||||||||||||||
| Level 1 | Level 2 | Level 3 | Total | |||||||||||||
Assets: | ||||||||||||||||
Corporate bonds | $ | 103,326 | $ | - | $ | - | $ | 103,326 | ||||||||
Municipal and pre-refunded municipal bonds | - | 73,495 | - | 73,495 | ||||||||||||
Mutual funds, held in rabbi trust | 3,778 | - | - | 3,778 | ||||||||||||
Certificates of deposit | - | 14,198 | - | 14,198 | ||||||||||||
Treasury bills | 9,156 | - | - | 9,156 | ||||||||||||
Commercial paper | - | 3,940 | - | 3,940 | ||||||||||||
Federal government agencies | 801 | - | - | 801 | ||||||||||||
|
|
|
|
|
|
|
| |||||||||
| $ | 117,061 | $ | 91,633 | $ | - | $ | 208,694 | |||||||||
|
|
|
|
|
|
|
| |||||||||
F-19
URBAN OUTFITTERS, INC.
NOTES TO CONSOLIDATED FINANCIAL STATEMENTS-(Continued)
(in thousands, except share and per share data)
Financial assets
Level 1 assets consist of financial instruments whose value has been based on inputs that use, as their basis, readily observable market data that are actively quoted and are validated through external sources, including third-party pricing services and brokers.
Level 2 assets consist of financial instruments whose value has been based on quoted prices for similar assets and liabilities in active markets as well as quoted prices for identical or similar assets or liabilities in markets that are not active.
Level 3 assets consist of financial instruments where there has been no active market. The Company held no Level 3 financial instruments as of January 31, 2016 and January 31, 2015.
The fair value of cash and cash equivalents (Level 1) approximates carrying value since cash and cash equivalents consist of short-term highly liquid investments with maturities of less than three months at the time of purchase. As of January 31, 2016 and 2015, cash and cash equivalents included cash on hand, cash in banks, money market accounts and marketable securities with maturities of less than three months at the time of purchase. The fair value of debt approximates its carrying value as it is all variable rate debt.
Non-financial assets
The Company's non-financial assets, primarily consisting of property and equipment, are periodically tested for impairment whenever events or changes in circumstances indicate that the carrying value may not be recoverable.
The fair value of the non-financial assets was determined using a discounted cash-flow model that utilized Level 3 inputs. The Company's retail stores are reviewed for impairment at the store level, which is the lowest level at which individual cash flows can be identified. In calculating future cash flows, the Company makes estimates regarding future operating results based on its experience and knowledge of market factors in which the store is located. During 2016, the Company determined that certain long-lived assets at the Company's retail stores were unable to recover their carrying value. These assets were written down to a fair value resulting in an impairment charge of $8,928. Impairment amounts in 2015 and 2014 were immaterial.
F-20
URBAN OUTFITTERS, INC.
NOTES TO CONSOLIDATED FINANCIAL STATEMENTS-(Continued)
(in thousands, except share and per share data)
5. Property and Equipment
Property and equipment is summarized as follows:
| January 31, | ||||||||
| 2016 | 2015 | |||||||
Land | $ | 15,197 | $ | 15,197 | ||||
Buildings | 294,674 | 239,115 | ||||||
Furniture and fixtures | 424,681 | 410,265 | ||||||
Leasehold improvements | 860,577 | 794,995 | ||||||
Other operating equipment | 249,969 | 180,397 | ||||||
Construction-in-progress | 44,763 | 182,595 | ||||||
|
|
|
| |||||
| 1,889,861 | 1,822,564 | |||||||
Accumulated depreciation | (1,026,724 | ) | (933,332 | ) | ||||
|
|
|
| |||||
Total | $ | 863,137 | $ | 889,232 | ||||
|
|
|
| |||||
Depreciation expense for property and equipment in fiscal 2016, 2015 and 2014 was $138,881, $131,414 and $121,732, respectively.
6. Accrued Expenses and Other Current Liabilities
Accrued expenses and other current liabilities consist of the following:
| January 31, | ||||||||
| 2016 | 2015 | |||||||
Gift certificates and merchandise credits | $ | 51,549 | $ | 47,943 | ||||
Sales return reserves | 24,385 | 19,804 | ||||||
Accrued sales taxes | 17,145 | 12,171 | ||||||
Accrued construction | 11,595 | 18,717 | ||||||
Accrued rents and estimated property taxes | 10,411 | 11,121 | ||||||
Other current liabilities | 54,637 | 42,887 | ||||||
|
|
|
| |||||
Total | $ | 169,722 | $ | 152,643 | ||||
|
|
|
| |||||
7. Debt
On July 1, 2015, the Company and its domestic subsidiaries entered into a five-year asset-based revolving Credit Agreement ("Credit Agreement") with certain lenders, including JPMorgan Chase Bank, N.A., as administrative agent, and J.P. Morgan Securities LLC and Wells Fargo Bank, National Association, as joint lead arrangers and co-book managers. The Credit Agreement replaced the Company's unsecured $175,000 revolving line of credit with Wells Fargo Bank, National Association, which was set to expire in March 2019.
F-21
URBAN OUTFITTERS, INC.
NOTES TO CONSOLIDATED FINANCIAL STATEMENTS-(Continued)
(in thousands, except share and per share data)
The Credit Agreement provides senior secured revolving credit for loans and letters of credit up to $400,000 (the "Credit Facility"), subject to a borrowing base that is comprised of the Company's eligible accounts receivable and inventory. The Credit Facility includes a swing-line sub-facility, a multicurrency sub-facility and the option to expand the facility by up to $150,000.
The Credit Facility provides for interest on borrowings, at the Company's option, at either (i) adjusted LIBOR, CDOR or EURIBOR plus an applicable margin ranging from 1.125% to 1.625%, or (ii) an adjusted ABR plus an applicable margin ranging from 0.125% to 0.625%, each such rate depending on the level of availability under the Credit Facility and the Company's adjusted leverage ratio. Interest is payable either monthly or quarterly depending on the type of borrowing. A commitment fee is payable quarterly on the unused portion of the Credit Facility based on the Company's adjusted leverage ratio.
All obligations under the Credit Facility are unconditionally guaranteed by the Company and its domestic subsidiaries. The obligations under the Credit Facility are secured by a first-priority security interest in inventory, accounts receivable, and certain other assets of the borrowers and guarantors. The Credit Agreement contains customary representations and warranties, negative and affirmative covenants and provisions relating to events of default.
As of January 31, 2016, the Company was in compliance with all terms of the Credit Agreement, borrowings on the Credit Facility totaled approximately $150,000 and stand-by letters of credit outstanding were $13,782.
Additionally, the Company has borrowing agreements with two separate financial institutions under which the Company may borrow an aggregate of $130,000 for the purposes of trade letter of credit issuances. The availability of any future borrowings under the trade letter of credit facilities is subject to acceptance by the respective financial institutions. As of January 31, 2016, the Company had outstanding trade letters of credit of $65,047, and available trade letters of credit of $64,953 under these facilities.
8. Income Taxes
The components of income before income taxes are as follows:
| Fiscal Year Ended January 31, | ||||||||||||
| 2016 | 2015 | 2014 | ||||||||||
Domestic | $ | 323,906 | $ | 328,479 | $ | 375,793 | ||||||
Foreign | 26,125 | 34,971 | 51,725 | |||||||||
|
|
|
|
|
| |||||||
| $ | 350,031 | $ | 363,450 | $ | 427,518 | |||||||
|
|
|
|
|
| |||||||
F-22
URBAN OUTFITTERS, INC.
NOTES TO CONSOLIDATED FINANCIAL STATEMENTS-(Continued)
(in thousands, except share and per share data)
The components of the provision for income tax expense/(benefit) are as follows:
| Fiscal Year Ended January 31, | ||||||||||||
| 2016 | 2015 | 2014 | ||||||||||
Current: | ||||||||||||
Federal | $ | 84,274 | $ | 109,978 | $ | 139,848 | ||||||
State | 21,391 | 19,665 | 20,530 | |||||||||
Foreign | 6,215 | 3,600 | 13,285 | |||||||||
|
|
|
|
|
| |||||||
| $ | 111,880 | $ | 133,243 | $ | 173,663 | |||||||
|
|
|
|
|
| |||||||
Deferred: | ||||||||||||
Federal | $ | 13,985 | $ | (3,295 | ) | $ | (15,171 | ) | ||||
State | (1,218 | ) | 1,372 | (6,225 | ) | |||||||
Foreign | 895 | (298 | ) | (7,109 | ) | |||||||
|
|
|
|
|
| |||||||
| 13,662 | (2,221 | ) | (28,505 | ) | ||||||||
|
|
|
|
|
| |||||||
| $ | 125,542 | $ | 131,022 | $ | 145,158 | |||||||
|
|
|
|
|
| |||||||
The following table reflects the differences between the statutory U.S. federal income tax rate and the Company's effective tax rate:
| Fiscal Year Ended January 31, | ||||||||||||
| 2016 | 2015 | 2014 | ||||||||||
Expected provision at statutory U.S. federal tax rate | 35.0 | % | 35.0 | % | 35.0 | % | ||||||
State and local income taxes, net of federal tax benefit | 3.7 | 3.7 | 2.2 | |||||||||
Foreign taxes | (2.0 | ) | (2.4 | ) | (2.7 | ) | ||||||
Federal rehabilitation tax credit | (1.9 | ) | 0.0 | (0.6 | ) | |||||||
Other | 1.1 | (0.3 | ) | 0.1 | ||||||||
|
|
|
|
|
| |||||||
Effective tax rate | 35.9 | % | 36.0 | % | 34.0 | % | ||||||
|
|
|
|
|
| |||||||
F-23
URBAN OUTFITTERS, INC.
NOTES TO CONSOLIDATED FINANCIAL STATEMENTS-(Continued)
(in thousands, except share and per share data)
The significant components of deferred tax assets and liabilities as of January 31, 2016 and 2015 are as follows:
| January 31, | ||||||||
| 2016 | 2015 | |||||||
Deferred tax liabilities: | ||||||||
Prepaid expense | $ | (4,645 | ) | $ | (3,732 | ) | ||
Depreciation | (66,936 | ) | (51,774 | ) | ||||
Other temporary differences | (2,604 | ) | (1,728 | ) | ||||
|
|
|
| |||||
Gross deferred tax liabilities | (74,185 | ) | (57,234 | ) | ||||
|
|
|
| |||||
Deferred tax assets: | ||||||||
Deferred rent | 72,253 | 70,023 | ||||||
Inventory | 11,031 | 8,137 | ||||||
Accounts receivable | 3,953 | 2,844 | ||||||
Net operating loss carryforwards | 4,941 | 4,003 | ||||||
Tax uncertainties | 2,972 | 3,363 | ||||||
Accrued salaries and benefits | 27,660 | 31,747 | ||||||
Income tax credits | 4,287 | 114 | ||||||
Other temporary differences | 7,896 | 5,725 | ||||||
|
|
|
| |||||
Gross deferred tax assets, before valuation allowances | 134,993 | 125,956 | ||||||
|
|
|
| |||||
Valuation allowances | (6,560 | ) | (45 | ) | ||||
|
|
|
| |||||
Net deferred tax assets | $ | 54,248 | $ | 68,677 | ||||
|
|
|
| |||||
Net deferred tax assets are attributed to the jurisdictions in which the Company operates. As of January 31, 2016 and 2015, respectively, $28,249 and $43,330 were attributable to U.S. federal, $17,391 and $16,097 were attributed to state jurisdictions and $8,608 and $9,250 were attributed to foreign jurisdictions.
As of January 31, 2016, certain non-U.S. subsidiaries of the Company had net operating loss carryforwards for tax purposes of approximately $244 that expire from 2017 through 2033 and approximately $19,735 that do not expire. Certain U.S. subsidiaries of the Company had state net operating loss and credit carryforwards for tax purposes of approximately $868 that expire from 2017 through 2027 and $6,524 that expire from 2017 to 2031. As of January 31, 2016, the Company had a full valuation allowance for certain foreign net operating loss carryforwards and a partial valuation allowance against state credit carryforwards where it was uncertain the carryforwards would be utilized. The Company had no valuation allowance for certain other foreign and state net operating loss carryforwards where management believes it is more-likely-than-not the tax benefit of these carryforwards will be realized. In November 2015, the FASB issued an accounting standards update that requires companies to classify all deferred tax assets and liabilities as noncurrent on the balance sheet rather than separating deferred taxes into current and noncurrent amounts. The Company elected to early adopt this update and prospectively applied the update to deferred tax assets and liabilities as of January 31, 2016. As of January 31, 2016 and 2015, the non-current portion of net deferred tax assets aggregated $54,248 and $49,922, respectively.
F-24
URBAN OUTFITTERS, INC.
NOTES TO CONSOLIDATED FINANCIAL STATEMENTS-(Continued)
(in thousands, except share and per share data)
The cumulative amount of the Company's share of undistributed earnings of non-U.S. subsidiaries for which no deferred taxes have been provided was $255,467 as of January 31, 2016. These earnings are deemed to be permanently re-invested to finance growth programs. It is not practical to estimate the income tax liability that might be incurred if such earnings were remitted to the United States.
A reconciliation of the beginning and ending balances of the total amounts of gross unrecognized tax benefits is as follows:
| January 31, | ||||||||||||
Tax Benefit Reconciliation | 2016 | 2015 | 2014 | |||||||||
Balance at the beginning of the period | $ | 6,889 | $ | 4,835 | $ | 7,895 | ||||||
Increases in tax positions for prior years | 4,053 | 2,518 | 1,026 | |||||||||
Decreases in tax positions for prior years | (891 | ) | (12 | ) | (305 | ) | ||||||
Increases in tax positions for current year | 274 | 352 | 521 | |||||||||
Settlements | (1,590 | ) | (620 | ) | (3,190 | ) | ||||||
Lapse in statute of limitations | (897 | ) | (184 | ) | (1,112 | ) | ||||||
|
|
|
|
|
| |||||||
Balance at the end of the period | $ | 7,838 | $ | 6,889 | $ | 4,835 | ||||||
|
|
|
|
|
| |||||||
The total amount of net unrecognized tax benefits that, if recognized, would impact the Company's effective tax rate were $5,698 and $4,952 as of January 31, 2016 and 2015, respectively. The Company accrues interest and penalties related to unrecognized tax benefits in income tax expense in the Consolidated Statements of Income, which is consistent with the recognition of these items in prior reporting periods. During the years ended January 31, 2016, 2015 and 2014, the Company recognized expense/(benefit) of ($686), $408 and ($1,922), respectively, related to interest and penalties. The Company accrued $800 and $1,486 for the payment of interest and penalties as of January 31, 2016 and 2015, respectively.
The Company files income tax returns in the U.S. federal jurisdiction and various state and foreign jurisdictions. Certain federal, foreign and state jurisdictions are subject to audit from fiscal 2006 to 2015. It is possible that a state or foreign examination may be resolved within twelve months. Due to the potential for resolution of federal and foreign audit and state examinations, and the expiration of various statutes of limitation, it is possible that the Company's gross unrecognized tax benefits balance may change within the next twelve months by a range of zero to $1,103.
9. Share-Based Compensation
The Company's 2008 Stock Incentive Plan can authorize up to 10,000,000 common shares, which can be granted as RSU's, unrestricted shares, incentive stock options, nonqualified stock options, PSU's or SAR's. Awards under this plan generally expire seven or ten years from the date of grant, thirty days after termination of employment or six months after the date of death or termination due to disability of the grantee. As of January 31, 2016, there were 4,040,821 common shares available to grant under the 2008 Stock Incentive Plan.
F-25
URBAN OUTFITTERS, INC.
NOTES TO CONSOLIDATED FINANCIAL STATEMENTS-(Continued)
(in thousands, except share and per share data)
A lattice binomial pricing model ("the Model") was used to estimate the fair value of stock options and SAR's. The Model allows for assumptions such as the risk-free rate of interest, volatility and exercise rate to vary over time reflecting a more realistic pattern of economic and behavioral occurrences. The Company uses historical data on exercise timing to determine the expected life assumption. The risk-free rate of interest for periods within the contractual life of the award is based on U.S. Government Securities Treasury Constant Maturities over the expected term of the equity instrument. The expected volatility is based on a weighted-average of the implied volatility and the Company's most recent historical volatility.
Based on the Company's historical experience, it has assumed an annualized forfeiture rate of 5% for its unvested share-based awards granted during the fiscal years ended January 31, 2016, 2015 and 2014. For share-based awards granted in previous years that remain unvested, an annualized forfeiture rate of 5% has been assumed. The Company will record additional expense if the actual forfeiture rate is lower than it estimated, and will record a recovery of prior expense if the actual forfeiture is higher than estimated.
Share-based compensation expense, included in "Selling, general and administrative expenses" in the Consolidated Statements of Income, for the fiscal years ended January 31, 2016, 2015 and 2014 was as follows:
| Fiscal Year Ended January 31, | ||||||||||||
| 2016 | 2015 | 2014 | ||||||||||
Stock Options | $ | 841 | $ | 1,377 | $ | 2,621 | ||||||
Stock Appreciation Rights | 1,295 | 2,244 | 2,918 | |||||||||
Performance Stock Units (1)(2) | 13,464 | 12,991 | 9,956 | |||||||||
Restricted Stock Units | 23 | 124 | 247 | |||||||||
|
|
|
|
|
| |||||||
Total | $ | 15,623 | $ | 16,736 | $ | 15,742 | ||||||
|
|
|
|
|
| |||||||
| (1) | Includes the reversal of $967 of previously recognized compensation expense in fiscal 2016, related to 50,004 PSU's that will not vest as the achievement of the related performance target is not probable. |
| (2) | Includes the reversal of $1,396 of previously recognized compensation expense in fiscal 2015, related to 163,336 PSU's that will not vest as the achievement of the related performance target is not probable. |
The total tax benefit associated with share-based compensation expense for the fiscal years ended January 31, 2016, 2015 and 2014 was $6,182, $6,367 and $5,976, respectively. The tax benefit realized from share-based compensation for the fiscal years ended January 31, 2016, 2015, and 2014 was $14,512, $5,813, and $10,611, respectively.
Stock Options
The Company may grant stock options which generally vest over a period of one to three years. Stock options become exercisable over the vesting period in installments determined by the Company,
F-26
URBAN OUTFITTERS, INC.
NOTES TO CONSOLIDATED FINANCIAL STATEMENTS-(Continued)
(in thousands, except share and per share data)
which can vary depending upon each individual grant. Stock options granted to non-employee directors generally vest over a period of one year. The following weighted-average assumptions were used in the Model to estimate the fair value of stock options at the date of grant:
| Fiscal Year Ended January 31, | ||||||||||||
| 2016 | 2015 | 2014 | ||||||||||
Expected life, in years | 3.5 | 3.4 | 3.5 | |||||||||
Risk-free interest rate | 1.2 | % | 1.1 | % | 0.6 | % | ||||||
Volatility | 32.5 | % | 33.0 | % | 36.0 | % | ||||||
Dividend rate | - | - | - | |||||||||
The following table summarizes the Company's stock option activity for the fiscal year ended January 31, 2016:
| Shares | Weighted- Average Exercise Price | Weighted- Average Contractual Terms (years) | Aggregate Intrinsic Value | |||||||||||||
Awards outstanding at beginning of year | 2,464,390 | $ | 32.69 | 1.6 | $ | 8,547 | ||||||||||
Granted | 120,000 | 38.09 | ||||||||||||||
Exercised | (1,416,990 | ) | 32.75 | |||||||||||||
Forfeited or Expired | (217,025 | ) | 33.24 | |||||||||||||
|
| |||||||||||||||
Awards outstanding at end of year | 950,375 | 33.17 | 2.9 | $ | 307 | |||||||||||
Awards outstanding expected to vest | 944,375 | 33.17 | 2.9 | $ | 292 | |||||||||||
|
| |||||||||||||||
Awards exercisable at end of year | 830,375 | $ | 32.46 | 2.9 | $ | 307 | ||||||||||
|
| |||||||||||||||
The following table summarizes other information related to stock options during the years ended January 31, 2016, 2015 and 2014:
| Fiscal Year Ended January 31, | ||||||||||||
| 2016 | 2015 | 2014 | ||||||||||
Weighted-average grant date fair value-per share | $ | 7.46 | $ | 7.02 | $ | 9.67 | ||||||
Intrinsic value of awards exercised | $ | 14,193 | $ | 4,852 | $ | 30,450 | ||||||
Net cash proceeds from the exercise of stock options | $ | 46,400 | $ | 10,693 | $ | 35,218 | ||||||
Total unrecognized compensation cost of stock options granted but not yet vested, as of January 31, 2016, was $286, which is expected to be recognized over the weighted-average period of 0.3 year.
F-27
URBAN OUTFITTERS, INC.
NOTES TO CONSOLIDATED FINANCIAL STATEMENTS-(Continued)
(in thousands, except share and per share data)
Stock Appreciation Rights
The Company may grant SAR's which generally vest over a five year period. Each vested SAR entitles the holder the right to the differential between the value of the Company's common share price at the date of exercise and the value of the Company's common share price at the date of grant. There were no SAR's granted during the fiscal years ended January 31, 2016 and 2015. The following weighted-average assumptions were used in the Model to estimate the fair value of SAR's at the date of grant:
| Fiscal Year Ended January 31, | ||||||||||||
| 2016 | 2015 | 2014 | ||||||||||
Expected life, in years | - | - | 5.6 | |||||||||
Risk-free interest rate | - | - | 1.0 | % | ||||||||
Volatility | - | - | 46.0 | % | ||||||||
Dividend rate | - | - | - | |||||||||
The following table summarizes the Company's SAR activity for the fiscal year ended January 31, 2016:
| Awards | Weighted- Average Exercise Price | Weighted- Average Remaining Contractual Term (years) | Aggregate Intrinsic Value | |||||||||||||
Awards outstanding at beginning of year | 893,408 | $ | 30.89 | 4.6 | $ | 3,990 | ||||||||||
Granted | - | - | ||||||||||||||
Exercised | (520,358 | ) | 29.68 | |||||||||||||
Forfeited or Expired | (68,950 | ) | (36.25 | ) | ||||||||||||
|
| |||||||||||||||
Awards outstanding at end of year | 304,100 | 31.74 | 3.5 | $ | - | |||||||||||
Awards outstanding expected to vest | 302,687 | 31.74 | 3.5 | $ | - | |||||||||||
|
| |||||||||||||||
Awards exercisable at end of year | 224,180 | $ | 31.25 | 3.5 | $ | - | ||||||||||
|
| |||||||||||||||
The following table summarizes other information related to SAR's during the years ended January 31, 2016, 2015 and 2014:
| Fiscal Year Ended January 31, | ||||||||||||
| 2016 | 2015 | 2014 | ||||||||||
Weighted-average grant date fair value-per share | $ | - | $ | - | $ | 14.11 | ||||||
Intrinsic value of awards exercised | $ | 7,386 | $ | 654 | $ | 848 | ||||||
Total unrecognized compensation cost of SAR's granted, but not yet vested, as of January 31, 2016, was $379, which is expected to be recognized over the weighted-average period of 1.6 years.
F-28
URBAN OUTFITTERS, INC.
NOTES TO CONSOLIDATED FINANCIAL STATEMENTS-(Continued)
(in thousands, except share and per share data)
Performance Stock Units
The Company may grant PSU's which vest based on the achievement of various company performance targets and external market conditions. The fair value of the PSU's are determined using a Monte Carlo simulation. This model uses assumptions including the risk free interest rate, expected volatility of the Company's stock price and expected life of the awards. The Company makes certain estimates about the number of awards which will vest. Once the Company determines that it is probable that the performance targets will be met, compensation expense is recorded for these awards. If any of these performance targets are not met, the awards are forfeited. Each PSU is equal to one common share with varying maximum award value limitations. PSU's typically vest over a five year period.
The following table summarizes the Company's PSU activity for the fiscal year ended January 31, 2016:
| Shares | Weighted- Average Fair Value | |||||||
Non-vested awards outstanding at beginning of year | 3,992,209 | $ | 21.32 | |||||
Granted | 1,471,000 | 18.94 | ||||||
Vested | (435,996 | ) | 17.58 | |||||
Forfeited | (843,915 | ) | 22.72 | |||||
|
| |||||||
Non-vested awards outstanding at end of year | 4,183,298 | $ | 20.64 | |||||
|
| |||||||
The weighted-average grant date fair value of PSU's awarded during the fiscal years ended January 31, 2016, 2015 and 2014 was $18.94, $23.40 and $25.13, per share, respectively. Unrecognized compensation cost related to unvested PSU's as of January 31, 2016 was $44,682, which is expected to be recognized over a weighted-average period of 3.0 years.
Restricted Stock Units
The Company may grant RSU's which vest based on the achievement of specified service and external market conditions. RSU's typically vest over a three to five year period.
F-29
URBAN OUTFITTERS, INC.
NOTES TO CONSOLIDATED FINANCIAL STATEMENTS-(Continued)
(in thousands, except share and per share data)
The following table summarizes the Company's RSU activity for the fiscal year ended January 31, 2016:
| Shares | Weighted- Average Fair Value | |||||||
Non-vested awards outstanding at beginning of year | 5,000 | $ | 39.06 | |||||
Granted | - | - | ||||||
Vested | (5,000 | ) | 39.06 | |||||
Forfeited | - | - | ||||||
|
| |||||||
Non-vested awards outstanding at end of year | - | $ | - | |||||
|
| |||||||
There were no RSU's granted during the fiscal year ended January 31, 2016 and January 31, 2015. The weighted-average grant date fair value of RSU's awarded during the fiscal year ended January 31, 2014 was $39.06 per share. No RSU's vested during the fiscal year ended January 31, 2014. There were no unrecognized compensation costs related to unvested RSU's as of January 31, 2016.
10. Shareholders' Equity
On February 23, 2015, the Company's Board of Directors authorized the repurchase of 20,000,000 common shares under a share repurchase program. Under this authorization, the Company repurchased and subsequently retired a total of 12,680,241 common shares for a total cost of $382,478 during fiscal 2016. The average cost per share of these repurchases for fiscal 2016 was $30.16, including commissions.
On May 27, 2014, the Company's Board of Directors authorized the repurchase of 10,000,000 common shares under a share repurchase program. Under this authorization, the Company repurchased and subsequently retired 7,718,531 common shares at a total cost of $258,160 during fiscal 2015. The average cost per share of these repurchases for fiscal 2015 was $33.45, including commissions. During fiscal 2016, the Company repurchased and subsequently retired 2,281,469 shares at a total cost of $82,826, which completed this authorization. The average cost per share of these repurchases for fiscal 2016 was $36.30, including commissions.
On August 27, 2013, the Company's Board of Directors authorized the repurchase of 10,000,000 common shares under a share repurchase program. The Company repurchased and subsequently retired all of the remaining 9,699,700 outstanding common shares available under this authorization during the first quarter of fiscal 2015 at a total cost of $353,315 for an average cost per share of $36.43, including commissions.
F-30
URBAN OUTFITTERS, INC.
NOTES TO CONSOLIDATED FINANCIAL STATEMENTS-(Continued)
(in thousands, except share and per share data)
In addition to the common shares repurchased under the share repurchase programs, during the fiscal years ended January 31, 2016 and January 31, 2015 the Company acquired and subsequently retired 247,124 and 111,563 common shares at a total cost of $10,120 and $3,947, respectively, from employees to meet minimum statutory tax withholding requirements.
As a result of the share repurchase activity during fiscal 2016, the Company reduced the balance of additional paid-in-capital to zero with subsequent share repurchase activity recorded as a reduction of retained earnings of $407,206.
11. Other Comprehensive Income (Loss) and Accumulated Other Comprehensive Income (Loss)
The following tables present the change in "Accumulated other comprehensive income (loss)," by component, net of tax, for the fiscal years ended January 31, 2016 and 2015, respectively:
| Fiscal Year Ended January 31, 2016 | ||||||||||||
| Foreign Currency Translation | Unrealized Gains and (Losses) on Available-for- Sale Securities | Total | ||||||||||
Beginning Balance | $ | (15,516 | ) | $ | 89 | $ | (15,427 | ) | ||||
Other comprehensive income (loss) before reclassifications | (7,963 | ) | (104 | ) | (8,067 | ) | ||||||
Amounts reclassified from accumulated other comprehensive income (loss) | - | 43 | 43 | |||||||||
|
|
|
|
|
| |||||||
Net current-period total other comprehensive income/(loss) | (7,963 | ) | (61 | ) | (8,024 | ) | ||||||
|
|
|
|
|
| |||||||
Ending Balance | $ | (23,479 | ) | $ | 28 | $ | (23,451 | ) | ||||
|
|
|
|
|
| |||||||
| Fiscal Year Ended January 31, 2015 | ||||||||||||
| Foreign Currency Translation | Unrealized Gains and (Losses) on Available-for- Sale Securities | Total | ||||||||||
Beginning Balance | $ | (1,388 | ) | $ | 420 | $ | (968 | ) | ||||
Other comprehensive income (loss) before reclassifications | (14,128 | ) | (568 | ) | (14,696 | ) | ||||||
Amounts reclassified from accumulated other comprehensive income (loss) | - | 237 | 237 | |||||||||
|
|
|
|
|
| |||||||
Net current-period total other comprehensive income/(loss) | (14,128 | ) | (331 | ) | (14,459 | ) | ||||||
|
|
|
|
|
| |||||||
Ending Balance | $ | (15,516 | ) | $ | 89 | $ | (15,427 | ) | ||||
|
|
|
|
|
| |||||||
F-31
URBAN OUTFITTERS, INC.
NOTES TO CONSOLIDATED FINANCIAL STATEMENTS-(Continued)
(in thousands, except share and per share data)
All unrealized gains and losses on available-for-sale securities reclassified from accumulated other comprehensive loss were recorded in "Interest income" in the Consolidated Statements of Income.
12. Net Income Per Common Share
The following is a reconciliation of the weighted-average common shares outstanding used for the computation of basic and diluted net income per common share:
| Fiscal Year Ended January 31, | ||||||||||||
| 2016 | 2015 | 2014 | ||||||||||
Basic weighted-average common shares outstanding | 125,232,499 | 136,651,899 | 147,014,869 | |||||||||
Effect of dilutive options, stock appreciation rights, restricted stock units and performance stock units | 780,915 | 1,540,835 | 2,211,037 | |||||||||
|
|
|
|
|
| |||||||
Diluted weighted-average shares outstanding | 126,013,414 | 138,192,734 | 149,225,906 | |||||||||
|
|
|
|
|
| |||||||
For the fiscal years ended January 31, 2016, 2015 and 2014, awards to purchase 692,942 common shares ranging in price from $25.60 to $46.02, 1,015,895 common shares ranging in price from $35.12 to $46.02 and 151,625 common shares ranging in price from $37.65 to $46.02, respectively, were excluded from the calculation of diluted net income per common share because the impact would be anti-dilutive.
As of January 31, 2016 and 2015, 2,957,573 and 2,216,899 contingently issuable awards, respectively, were excluded from the calculation of diluted net income per common share as they did not meet certain performance criteria.
13. Commitments and Contingencies
Leases
The Company leases its stores, certain fulfillment and distribution facilities, and offices under non-cancelable operating leases. The following is a schedule by year of the future minimum lease payments for operating leases with original terms in excess of one year:
Fiscal Year | ||||
2017 | $ | 272,255 | ||
2018 | 263,876 | |||
2019 | 246,043 | |||
2020 | 228,091 | |||
2021 | 199,685 | |||
Thereafter | 772,226 | |||
|
| |||
Total minimum lease payments | $ | 1,982,176 | ||
|
| |||
F-32
URBAN OUTFITTERS, INC.
NOTES TO CONSOLIDATED FINANCIAL STATEMENTS-(Continued)
(in thousands, except share and per share data)
Amounts noted above include commitments for 37 executed leases for stores not opened as of January 31, 2016. The majority of our leases allow for renewal options between five and ten years upon expiration of the initial lease term. The store leases generally provide for payment of direct operating costs including real estate taxes. Certain store leases provide for contingent rentals when sales exceed specified levels, in lieu of a fixed minimum rent, that are not reflected in the above table. Additionally, the Company has entered into store leases that require a percentage of total sales to be paid to landlords in lieu of minimum rent.
Rent expense consisted of the following:
| Fiscal Year Ended January 31, | ||||||||||||
| 2016 | 2015 | 2014 | ||||||||||
Minimum and percentage rentals | $ | 245,474 | $ | 234,982 | $ | 205,759 | ||||||
Contingent rentals | 2,704 | 3,901 | 5,542 | |||||||||
|
|
|
|
|
| |||||||
Total | $ | 248,178 | $ | 238,883 | $ | 211,301 | ||||||
|
|
|
|
|
| |||||||
The Company also has commitments for unfulfilled purchase orders for merchandise ordered from our vendors in the normal course of business, which are satisfied within twelve months, of $407,833. The majority of the Company's merchandise commitments are cancellable with no or limited recourse available to the vendor until the merchandise shipping date. The Company also has commitments related to contracts with construction contractors, fully satisfied upon the completion of construction, which is typically within twelve months, of $1,535.
Benefit Plans
Full and part-time U.S. based employees who are at least 18 years of age are eligible after three months of employment to participate in the Urban Outfitters 401(k) Savings Plan (the "Plan"). Under the Plan, employees can defer 1% to 25% of compensation as defined. The Company makes matching contributions in cash of $0.25 per employee contribution dollar on the first 6% of the employee contribution. The employees' contribution is 100% vested while the Company's matching contribution vests at 20% per year of employee service. The Company's contributions were $2,121, $1,708 and $1,770 for fiscal years 2016, 2015 and 2014, respectively.
The NQDC provides certain employees who are limited in their participation under the Plan the opportunity to defer compensation as defined within the NQDC. The Company's matching contributions are calculated to provide $0.25 per employee contribution dollar on the first 6% of total compensation deferred under the combination of both the Plan and the NQDC. Employee contributions are 100% vested on the contribution date and the Company's matching contribution is 100% vested upon crediting to participants' accounts on an annual basis. The Company made a matching contribution of $105, $100 and $0 during fiscal years 2016, 2015 and 2014, respectively. The NQDC obligation was $4,363 and $3,778 as of January 31, 2016 and 2015, respectively. The Company has purchased investments to fund the NQDC obligation. The investments had an aggregate market value of $4,363 and $3,778 as of January 31, 2016 and 2015, respectively, and are included in "Marketable securities" in the Consolidated Balance Sheets (see Note 3, "Marketable Securities").
F-33
URBAN OUTFITTERS, INC.
NOTES TO CONSOLIDATED FINANCIAL STATEMENTS-(Continued)
(in thousands, except share and per share data)
Contingencies
The Company is party to various legal proceedings arising from normal business activities. Management believes that the ultimate resolution of these matters will not have a material adverse effect on the Company's financial position, results of operations or cash flows.
14. Related Party Transactions
Drinker Biddle & Reath LLP ("DBR"), a law firm, provided general legal services to the Company. Fees paid to DBR during fiscal 2016, 2015 and 2014 were $2,493, $2,752 and $2,637, respectively. Harry S. Cherken, Jr., a director of the Company, is a partner at DBR. Amounts due to DBR as of January 31, 2016 and 2015 were approximately $217 and $203, respectively.
The McDevitt Company, a real estate company, acted as a broker in substantially all of the Company's new real estate transactions during fiscal 2016 in the United States. The Company has not paid any compensation to The McDevitt Company, but the Company has been advised that The McDevitt Company has received commissions from other parties to such transactions. Wade L. McDevitt is the brother-in-law of Scott Belair, one of the Company's directors, and is the president and the sole shareholder of The McDevitt Company. Mr. McDevitt's wife, Wendy McDevitt, is an employee of the Company. In addition, Mr. McDevitt owns McDevitt Corporation Limited, a United Kingdom entity, and McDevitt Netherlands BV, a Dutch entity. During fiscal 2016, 2015 and 2014, the Company paid real estate commissions of $422, $295 and $518, respectively, to West Street Consultancy Limited, a United Kingdom entity owned by an employee of McDevitt Corporation Limited. The Company also paid commissions of $24, $300 and $562 during fiscal 2016, 2015 and 2014, respectively, to McDevitt Netherlands BV. The Company has been advised that West Street Consultancy Limited has entered into an arrangement to share a portion of its commissions with McDevitt Corporation Limited.
The Addis Group ("Addis"), an insurance brokerage and risk management consulting company, acted as the Company's commercial insurance broker and risk management consultant for the years ended January 31, 2016, 2015 and 2014. The Company has not paid any compensation to Addis for such services, but has been advised that Addis has received commissions from other parties to such transactions. Addis merged into BB&T Insurance Services ("BB&T") in August 2015. Scott Addis, the brother-in-law of Richard A. Hayne and Margaret A. Hayne, was President of Addis until December 31, 2015. There were no amounts due to or from Addis or BB&T as of January 31, 2016 and January 31, 2015.
15. Segment Reporting
The Company is a global retailer of lifestyle-oriented general merchandise with two reportable segments-"Retail" and "Wholesale." The Company's Retail segment consists of the aggregation of its five brands operating through 572 stores under the retail names "Urban Outfitters," "Anthropologie," "Free People," "Terrain" and "Bhldn" and includes their direct-to-consumer
F-34
URBAN OUTFITTERS, INC.
NOTES TO CONSOLIDATED FINANCIAL STATEMENTS-(Continued)
(in thousands, except share and per share data)
channels. Urban Outfitters, the Anthropologie Group, and Free People, including their retail stores and direct-to-consumer channels, are each considered an operating segment. Net sales from the Retail segment accounted for approximately 92.4%, 93.2% and 94.2% of total consolidated net sales for the fiscal years ended January 31, 2016, 2015 and 2014, respectively. The remaining net sales are derived from the Company's Wholesale segment that distributes apparel to its Retail segment and to approximately 1,800 better department and specialty retailers worldwide.
The Company has aggregated its brands into the Retail segment based upon their shared management, customer base and economic characteristics. Reporting in this format provides management with the financial information necessary to evaluate the success of the segments and the overall business. The Company evaluates the performance of the segments based on the net sales and pre-tax income from operations (excluding intercompany charges) of the segment. Corporate expenses include expenses incurred and directed by the corporate office that are not allocated to segments. The principal identifiable assets for each reporting segment are inventory and property and equipment.
Other assets are comprised primarily of general corporate assets, which principally consist of cash and cash equivalents, marketable securities, deferred taxes and prepaid expenses, which are typically not allocated to the Company's segments. The Company accounts for intersegment sales and transfers as if the sales and transfers were made to third parties making similar volume purchases.
The Company's omni-channel strategy enhances its customers' brand experience by providing a seamless approach to the customer shopping experience. The Company has substantially integrated all available shopping channels, including stores, websites (online and through mobile devices) and catalogs. The Company's investments in areas such as marketing campaigns and technology advancements are designed to generate demand for the omni-channel and not the separate store or direct-to-consumer channels. Store sales are primarily fulfilled from that store's inventory, but may also be shipped from any of the Company's fulfillment centers or from a different store location if an item is not available at the original store. Direct-to-consumer orders are primarily shipped to the Company's customers through its fulfillment centers, but may also be shipped from any store, or a combination of fulfillment centers and stores depending on the availability of a particular item. Direct-to-consumer orders may also be picked up at a store location. Customers may also return certain merchandise purchased through direct-to-consumer channels at retail locations. As the Company's customers continue to shop across multiple channels, the Company has adapted its approach towards meeting this demand. Due to the availability of like product in a variety of shopping channels, the Company now sources these products utilizing single stock keeping units based on the omni-channel demand rather than the demand of the separate channels. These and other technological capabilities allow the Company to better serve its customers and help it to complete a sale that otherwise may not have occurred due to out-of-stock positions. As a result of changing customer behavior and the substantial integration of the operations of the Company's store and direct-to-consumer channels, the Company manages and analyzes its performance based on a single omni-channel rather than separate channels and believes that the omni-channel results present the most meaningful and appropriate measure of the Company's performance.
F-35
URBAN OUTFITTERS, INC.
NOTES TO CONSOLIDATED FINANCIAL STATEMENTS-(Continued)
(in thousands, except share and per share data)
The accounting policies of the reportable segments are the same as the policies described in Note 2, "Summary of Significant Accounting Policies." Both the Retail and Wholesale segments are highly diversified. No one customer constitutes more than 10% of the Company's total consolidated net sales. A summary of the information about the Company's operations by segment is as follows:
| Fiscal Year | ||||||||||||
| 2016 | 2015 | 2014 | ||||||||||
Net sales | ||||||||||||
Retail operations | $ | 3,184,955 | $ | 3,097,274 | $ | 2,908,981 | ||||||
Wholesale operations | 273,603 | 237,491 | 185,792 | |||||||||
Intersegment elimination | (13,424 | ) | (11,688 | ) | (8,165 | ) | ||||||
|
|
|
|
|
| |||||||
Total net sales | $ | 3,445,134 | $ | 3,323,077 | $ | 3,086,608 | ||||||
|
|
|
|
|
| |||||||
Income from operations | ||||||||||||
Retail operations | $ | 342,885 | $ | 354,326 | $ | 414,734 | ||||||
Wholesale operations | 54,444 | 55,403 | 42,191 | |||||||||
Intersegment elimination | (1,096 | ) | (1,079 | ) | (837 | ) | ||||||
|
|
|
|
|
| |||||||
Total segment operating income | 396,233 | 408,650 | 456,088 | |||||||||
General corporate expenses | (42,654 | ) | (43,265 | ) | (29,257 | ) | ||||||
|
|
|
|
|
| |||||||
Total income from operations | $ | 353,579 | $ | 365,385 | $ | 426,831 | ||||||
|
|
|
|
|
| |||||||
Depreciation expense for property and equipment | ||||||||||||
Retail operations | $ | 137,963 | $ | 130,383 | $ | 120,960 | ||||||
Wholesale operations | 918 | 1,031 | 772 | |||||||||
|
|
|
|
|
| |||||||
Total depreciation expense for property and equipment | $ | 138,881 | $ | 131,414 | $ | 121,732 | ||||||
|
|
|
|
|
| |||||||
Inventory | ||||||||||||
Retail operations | $ | 289,170 | $ | 314,940 | ||||||||
Wholesale operations | 41,053 | 43,297 | ||||||||||
|
|
|
| |||||||||
Total inventory | $ | 330,223 | $ | 358,237 | ||||||||
|
|
|
| |||||||||
Property and equipment, net | ||||||||||||
Retail operations | $ | 859,277 | $ | 885,200 | ||||||||
Wholesale operations | 3,860 | 4,032 | ||||||||||
|
|
|
| |||||||||
Total property and equipment, net | $ | 863,137 | $ | 889,232 | ||||||||
|
|
|
| |||||||||
Cash paid for property and equipment | ||||||||||||
Retail operations | $ | 134,627 | $ | 228,682 | $ | 184,255 | ||||||
Wholesale operations | 323 | 1,122 | 1,846 | |||||||||
|
|
|
|
|
| |||||||
Total cash paid for property and equipment | $ | 134,950 | $ | 229,804 | $ | 186,101 | ||||||
|
|
|
|
|
| |||||||
F-36
URBAN OUTFITTERS, INC.
NOTES TO CONSOLIDATED FINANCIAL STATEMENTS-(Continued)
(in thousands, except share and per share data)
The Company has foreign operations in Europe and Canada. Revenues and long-lived assets, based upon the Company's domestic and foreign operations, are as follows:
| Fiscal Year | ||||||||||||
| 2016 | 2015 | 2014 | ||||||||||
Net Sales | ||||||||||||
Domestic operations | $ | 3,005,595 | $ | 2,870,140 | $ | 2,685,042 | ||||||
Foreign operations | 439,539 | 452,937 | 401,566 | |||||||||
|
|
|
|
|
| |||||||
Total net sales | $ | 3,445,134 | $ | 3,323,077 | $ | 3,086,608 | ||||||
|
|
|
|
|
| |||||||
Property and equipment, net | ||||||||||||
Domestic operations | $ | 742,171 | $ | 745,504 | ||||||||
Foreign operations | 120,966 | 143,728 | ||||||||||
|
|
|
| |||||||||
Total property and equipment, net | $ | 863,137 | $ | 889,232 | ||||||||
|
|
|
| |||||||||
F-37