UNITED STATES
SECURITIES AND EXCHANGE COMMISSION
Washington, D.C. 20549
Form 10-K
FOR ANNUAL AND TRANSITION REPORTS
PURSUANT TO SECTIONS 13 OR 15(d) OF THE
SECURITIES EXCHANGE ACT OF 1934
(Mark One)
x | ANNUAL REPORT PURSUANT TO SECTION 13 OR 15(d) OF THE SECURITIES EXCHANGE ACT OF 1934 |
For the fiscal year ended December 31, 2017
or
¨ | TRANSITION REPORT PURSUANT TO SECTION 13 OR 15(d) OF THE SECURITIES EXCHANGE ACT OF 1934 |
For the transition period from to
Commission file number 001-15451
____________________________________

United Parcel Service, Inc.
Delaware |
| 58-2480149 |
(State or Other Jurisdiction of Incorporation or Organization) |
| (I.R.S. Employer Identification No.) |
55 Glenlake Parkway, N.E. Atlanta, Georgia |
| 30328 |
(Address of Principal Executive Offices) |
| (Zip Code) |
(404) 828-6000
(Registrant's telephone number, including area code)
_______________________________
Securities registered pursuant to Section 12(b) of the Act:
Title of Each Class |
| Name of Each Exchange on Which Registered |
Class B common stock, par value $.01 per share |
| New York Stock Exchange |
Floating-Rate Senior Notes due 2020 |
| New York Stock Exchange |
1.625% Senior Notes due 2025 |
| New York Stock Exchange |
1% Senior Notes due 2028 |
| New York Stock Exchange |
0.375% Senior Notes due 2023 |
| New York Stock Exchange |
1.500% Senior Notes due 2032 |
| New York Stock Exchange |
_________________________________
Securities registered pursuant to Section 12(g) of the Act:
Class A common stock, par value $.01 per share
(Title of Class)
Indicate by check mark if the registrant is a well-known seasoned issuer, as defined in Rule 405 of the Securities Act. Yes x No ¨
Indicate by check mark if the registrant is not required to file reports pursuant to Section 13 or Section 15(d) of the Exchange Act. Yes ¨ No x
Indicate by check mark whether the registrant: (1) has filed all reports required to be filed by Section 13 or 15(d) of the Securities Exchange Act of 1934 during the preceding 12 months (or for such shorter period that the registrant was required to file such reports), and (2) has been subject to such filing requirements for the past 90 days. Yes x No ¨
Indicate by check mark whether the registrant has submitted electronically and posted on its corporate Web site, if any, every Interactive Data File required to be submitted and posted pursuant to Rule 405 of Regulation S-T during the preceding 12 months (or for such shorter period that the registrant was required to submit and post such files). Yes x No ¨
Indicate by check mark if disclosure of delinquent filers pursuant to Item 405 of Regulation S-K is not contained herein, and will not be contained, to the best of registrant's knowledge, in definitive proxy or information statements incorporated by reference in Part III of this Form 10-K or any amendment to this Form 10-K. x
Indicate by check mark whether the registrant is a large accelerated filer, an accelerated filer, a non-accelerated filer or a smaller reporting company. See definition of "accelerated filer", "large accelerated filer", "smaller reporting company" and "emerging growth company" in Rule 12b-2 of the Exchange Act. Check one:
Large accelerated filer x |
| Accelerated filer ¨ |
| Non-accelerated filer ¨ |
| Smaller reporting company ¨ |
| Emerging growth company ¨ |
If an emerging growth company, indicate by check mark if the registrant has elected not to use the extended transition period for complying with any new or revised financial accounting standards provided pursuant to Section 13(a) of the Exchange Act. ¨
Indicate by check mark whether the registrant is a shell company (as defined in Rule 12b-2 of the Exchange Act). Yes ¨ No x
The aggregate market value of the class B common stock held by non-affiliates of the registrant was $76,094,649,311 as of June 30, 2017 . The registrant's class A common stock is not listed on a national securities exchange or traded in an organized over-the-counter market, but each share of the registrant's class A common stock is convertible into one share of the registrant's class B common stock.
As of February 8, 2018 , there were 173,362,905 outstanding shares of class A common stock and 688,251,874 outstanding shares of class B common stock.
DOCUMENTS INCORPORATED BY REFERENCE
Portions of the registrant's definitive proxy statement for its annual meeting of shareowners scheduled for May 10, 2018 are incorporated by reference into Part III of this report.
UNITED PARCEL SERVICE, INC.
ANNUAL REPORT ON FORM 10-K
TABLE OF CONTENTS
| PART I |
|
Item 1. | Business | 1 |
| Overview | 1 |
| Strategy | 1 |
| Reporting Segments and Products & Services | 2 |
| Our People | 5 |
| Competition | 5 |
| Competitive Strengths | 6 |
| Government Regulation | 6 |
| Where You Can Find More Information | 8 |
Item 1A. | Risk Factors | 9 |
Item 1B. | Unresolved Staff Comments | 16 |
Item 2. | Properties | 16 |
| Operating Facilities | 16 |
| Fleet | 17 |
Item 3. | Legal Proceedings | 17 |
Item 4. | Mine Safety Disclosures | 17 |
| PART II |
|
Item 5. | Market for Registrant's Common Equity, Related Stockholder Matters and Issuer Purchases of Equity Securities | 18 |
| Shareowner Return Performance Graph | 19 |
Item 6. | Selected Financial Data | 20 |
Item 7. | Management's Discussion and Analysis of Financial Condition and Results of Operations | 21 |
| Overview | 21 |
| Items Affecting Comparability | 22 |
| U.S. Domestic Package Operations | 25 |
| International Package Operations | 30 |
| Supply Chain & Freight Operations | 34 |
| Operating Expenses | 38 |
| Investment Income and Interest Expense | 42 |
| Income Tax Expense | 43 |
| Liquidity and Capital Resources | 46 |
| Collective Bargaining Agreements | 52 |
| New Accounting Pronouncements | 52 |
| Critical Accounting Policies and Estimates | 53 |
Item 7A. | Quantitative and Qualitative Disclosures about Market Risk | 59 |
Item 8. | Financial Statements and Supplementary Data | 61 |
Item 9. | Changes in and Disagreements with Accountants on Accounting and Financial Disclosure | 126 |
Item 9A. | Controls and Procedures | 126 |
Item 9B. | Other Information | 128 |
| PART III |
|
Item 10. | Directors, Executive Officers and Corporate Governance | 129 |
Item 11. | Executive Compensation | 130 |
Item 12. | Security Ownership of Certain Beneficial Owners and Management and Related Stockholder Matters | 130 |
Item 13. | Certain Relationships and Related Transactions, and Director Independence | 130 |
Item 14. | Principal Accounting Fees and Services | 130 |
| PART IV |
|
Item 15. | Exhibits and Financial Statement Schedules | 131 |
Item 16. | Form 10-K Summary | 131 |
PART I
Cautionary Statement About Forward-Looking Statements
This report includes certain "forward-looking statements" within the meaning of the Private Securities Litigation Reform Act of 1995. Statements in the future tense, and all statements accompanied by terms such as "believe," "project," "expect," "estimate," "assume," "intend," "anticipate," "target," "plan" and variations thereof and similar terms, are intended to be forward-looking statements. We intend that all forward-looking statements we make will be subject to safe harbor protection of the federal securities laws pursuant to Section 27A of the Securities Act of 1933 and Section 21E of the Securities Exchange Act of 1934.
Our disclosure and analysis in this report, in our Annual Report to Shareholders and in our other filings with the Securities and Exchange Commission ("SEC") contain forward-looking statements regarding our intent, belief and current expectations about our strategic direction, prospects and future results. From time to time, we also provide forward-looking statements in other materials we release as well as oral forward-looking statements. Such statements give our current expectations or forecasts of future events; they do not relate strictly to historical or current facts. Management believes that these forward-looking statements are reasonable as and when made. However, caution should be taken not to place undue reliance on any such forward-looking statements because such statements speak only as of the date when made.
Forward-looking statements are subject to certain risks and uncertainties that could cause actual results to differ materially from our historical experience and our present expectations or anticipated results. These risks and uncertainties are described in Part I, "Item 1A. Risk Factors" and may also be described from time to time in our future reports filed with the SEC. You should consider the limitations on, and risks associated with, forward-looking statements and not unduly rely on the accuracy of predictions contained in such forward-looking statements. We do not undertake any obligation to update forward-looking statements to reflect events, circumstances, changes in expectations or the occurrence of unanticipated events after the date of those statements.
Item 1. | Business |
Overview
United Parcel Service, Inc. ("UPS") was founded in 1907 as a private messenger and delivery service in Seattle, Washington. Today, we are the world's largest package delivery company, a leader in the U.S. less-than-truckload industry and a premier provider of global supply chain management solutions. We deliver packages each business day for 1.5 million shipping customers to 9.0 million receivers ("consignees") in over 220 countries and territories. In 2017 , we delivered an average of 20.0 million pieces per day, or a total of 5.1 billion packages. Total revenue in 2017 was $ 65.872 billion .
We serve the global market for logistics services, which includes transportation, distribution, contract logistics, ground freight, ocean freight, air freight, customs brokerage, insurance and financing. We have three segments: U.S. Domestic Package, International Package and Supply Chain & Freight, all of which are described below. For financial information concerning our segments and geographic regions, refer to note 12 of our audited consolidated financial statements.
Strategy
Our market strategy is to provide customers with advanced logistics solutions made possible by a broad portfolio of differentiated services and capabilities expertly assembled and integrated into our customers' businesses. This approach, supported by our efficient and globally balanced multimodal network, enables us to deliver value to our customers and thereby build lasting partnerships with them.
Customers leverage our broad portfolio of logistics capabilities comprised of: our balanced global presence in North America, Europe, Middle East, Africa, Asia Pacific and Latin America; reliability; industry-leading technologies and solutions expertise for competitive advantage in markets where they choose to compete. We continue to invest to expand our integrated global network and service portfolio. In 2017, we formed and received approval for a joint venture with SF Express, China's leading small package company, which will ultimately provide millions of potential customers in China with improved access to buyers and sellers around the world. We acquired Freightex, Ltd. ("Freightex") to extend our platform-based freight transportation capabilities into both the U.K. and European markets. The acquisition of Eirpost Group Unlimited Company ("Nightline") vaulted UPS to a leading market position in Ireland. We added shipping centers and healthcare and distribution facilities in Mexico, Colombia and India. In 2017, we also acquired STTAS Global Holdings, Inc. ("Sandler & Travis Trade Advisory Services" or "STTAS"), the world's largest dedicated global trade compliance management company.
1
We are increasing our capital expenditures to meet increasing global demand. Within our facilities, we are expanding automated capacity, driving greater efficiencies and providing additional network flexibilities. We also continue to invest in our air network capacity through aircraft acquisitions. In 2017, we announced investments in four new regional facilities in the Indianapolis, Phoenix, Salt Lake City and Dallas areas, with the previously announced regional facility in Atlanta, Georgia continuing to move toward completion.
We have a long history of sound financial management and our consolidated balance sheet reflects financial strength. Cash generation is a significant strength of UPS, giving us ample capacity to service our obligations and allowing for distributions to shareowners, reinvestment in our business and the pursuit of growth opportunities.
Reporting segments and products & services
Global Small Package
Our global small package operations provide time-definite delivery services for express letters, documents, small packages and palletized freight via air and ground services. We serve more than 220 countries and territories around the world along with domestic delivery service in over 50 countries. We handle packages that weigh up to 150 pounds and are up to 165 inches in combined length and girth as well as palletized shipments weighing more than 150 pounds. All of our package services are supported by numerous shipping, visibility and billing technologies.
We handle all levels of service (air, ground, domestic, international, commercial and residential) through one global integrated pickup and delivery network. We combine all packages within our network, unless dictated by specific service commitments. This enables one UPS driver to pick up customers' shipments for any of our services at the same scheduled time each day. Compared to companies with single service network designs, our integrated network uniquely provides operational and capital efficiencies while being more environmentally friendly.
We offer same-day pickup of air and ground packages upon request. Customers can schedule pickups for one to five days a week, based on their specific needs. Additionally, our wholly-owned and partnered global network offers more than 150,000 entry points where customers can tender a package to us at a location or time convenient to them. This combined network includes UPS drivers who can accept packages provided to them, UPS drop boxes, UPS Access Point locations, The UPS Store locations, authorized shipping outlets and commercial counters, alliance locations and customer centers attached to UPS facilities. Some of these locations offer a full array of services, including pickup, delivery and packing options, while others are drop-off locations only.
The continued growth of online and mobile shopping has increased our customers' needs for efficient and reliable returns, resulting in our development of a robust selection of returns services that are available in more than 145 countries. The portfolio provides a range of cost-effective label options and a vast network of consumer drop points, as well as a selection of return technologies that promote efficiency and a friction-free consumer experience. These options vary based on customer need and country and include solutions such as UPS Returns ® , as well as more-specialized services such as UPS Returns ® Exchange. Our technologies promote systems integration, client ease of use and visibility of inbound merchandise, which help reduce costs and improve efficiency of our merchants' reverse logistics processes. The newly launched UPS Returns ® Manager is an excellent example of this value.
We operate one of the largest airlines in the world, with global operations centered at our Worldport hub in Louisville, Kentucky. Worldport sort capacity has expanded over the years due to volume growth and centralization efforts. Our European air hub is located in Cologne, Germany, and we maintain Asia Pacific air hubs in Shanghai, China; Shenzhen, China and Hong Kong. Our regional air hub in Canada is located in Hamilton, Ontario and our regional air hub for Latin America and the Caribbean is in Miami, Florida.
Our U.S. regional air hubs in Dallas, Texas; Ontario, California; Philadelphia, Pennsylvania and Rockford, Illinois support Worldport. This network design creates cost-effective package processing in our most technology-enabled facilities, which allows us to use fewer, larger and more fuel-efficient aircraft. Our U.S. ground fleet serves all business and residential zip codes in the contiguous U.S.
2
U.S. Domestic Package reporting segment
We are a leader in time-definite, money-back guaranteed, small package delivery services in the U.S. We offer a full spectrum of U.S. domestic guaranteed ground and air package transportation services.
• | Customers can select from same day, next day, two day and three day delivery alternatives. UPS's Air portfolio offers options enabling customers to specify a time-of-day guarantee for their delivery (e.g., by 8:00 A.M., 10:30 A.M., noon, end of day, etc.). |
• | Customers can also leverage our extensive ground network to ship using our day-definite guaranteed ground service that serves every U.S. business and residential address. We deliver more ground packages in the U.S. than any other carrier, with average daily package volume of 14.1 million , most within one to three business days. |
• | We also offer UPS SurePost, an economy residential ground service for customers with non-urgent, lightweight residential shipments. UPS SurePost is a contractual residential ground service that combines the consistency and reliability of the UPS Ground network with final delivery often provided by the U.S. Postal Service. We utilize our operational technology to identify multiple package delivery opportunities and redirect UPS SurePost packages for final delivery, improving time in transit, customer service and operational efficiency. |
International Package reporting segment
Our International Package reporting segment includes small package operations in Europe, Asia Pacific, Canada and Latin America, and the Indian sub-continent, Middle East and Africa ("ISMEA"). We offer a wide selection of guaranteed day and time-definite international shipping services. We offer more guaranteed time-definite express options (Express Plus, Express and Express Saver) than any other carrier.
• | In 2017, we continued expansion of our Express time-definite portfolios: |
◦ | We expanded UPS WorldWide Express to five new countries around the globe. |
◦ | UPS Express now reaches 124 countries with guaranteed mid-day delivery and 56 countries with guaranteed morning delivery with Express Plus. |
◦ | Express Saver reaches 220 countries and territories with guaranteed end-of-day delivery. |
◦ | Express Freight Midday is available from all 67 WorldWide Express Freight origin countries to 35 destination countries. |
• | For international package shipments that do not require Express services, UPS Worldwide Expedited offers a reliable, deferred, guaranteed day-definite service option. The service is available from more than 80 origin countries to more than 220 countries and territories. |
• | For cross-border ground package delivery, we offer UPS Standard delivery services within Europe, between the U.S. and Canada and between the U.S. and Mexico. |
Europe, our largest region outside of the U.S., accounts for approximately half of international revenue and is one of the primary drivers of our growth. To accommodate the strong potential for growth in small package exports, we made a series of enhancements to both our ground and air networks that help reduce transit time by one to two days and will result in improved exporting opportunities for customers in Europe. These expansions and enhancements are part of our commitment to invest nearly $2 billion in our European infrastructure.
Asia Pacific remains a strategic market due to growth rates in intra-Asia trade and the expanding Chinese economy. To capitalize on these opportunities, we are bringing faster time-in-transit to customers focused on intra-Asia trade and reducing transit time from Asia to the U.S. and Europe. Through added flight frequencies, we provide our customers the ability to ship next day to more places in the U.S. and Europe - guaranteed - than any other express carrier. We serve more than 40 Asia Pacific countries and territories through more than two dozen alliances with local delivery companies that supplement company-owned operations. Our new joint venture with SF Express combines SF's extensive Chinese network with UPS's delivery capabilities in the U.S. and Europe to increase our market presence and help provide Chinese enterprises with greater global access.
Additional international highlights include several air network enhancements, improving time in transit and better addressing growing markets. A new direct flight from the U.S. to Dubai improves time in transit to key destinations in the ISMEA region for shippers throughout the U.S., Canada and the Americas. Europe added flight segments in Lithuania, Poland and Spain, while a dedicated chartered flight from Cologne to Casablanca continues our investment strategy in Morocco, an emerging market.
3
Supply Chain & Freight segment
The Supply Chain & Freight segment consists of our forwarding and logistics services, truckload freight brokerage, dedicated contract carriage truckload services, less-than-truckload ("LTL") services and our financial offerings through UPS Capital. Supply chain complexity creates demand for a global service offering that incorporates transportation, distribution and international trade and brokerage services, with complementary financial and information services. Outsourcing of non-core logistics activity is a strategy more and more companies are pursuing. With increased competition and growth opportunities in new markets, businesses require flexible and responsive supply chains to support their business strategies. We meet this demand by offering a broad array of supply chain services in more than 200 countries and territories.
Freight Forwarding
We are one of the largest U.S. domestic air freight carriers and among the top international air freight forwarders globally. We offer a portfolio of guaranteed and non-guaranteed global air freight services. Additionally, as one of the world's leading non-vessel operating common carriers, we provide ocean freight full-container load, less-than-container load and multimodal transportation services between most major ports around the world.
Truckload Freight Brokerage
In 2015, we acquired Coyote Logistics Midco, Inc. ("Coyote"), a U.S.-based truckload freight brokerage company. We successfully integrated this large-scale truckload freight brokerage and transportation management services operation into our Supply Chain & Freight segment and have seen significant synergies in the areas of purchased transportation, backhaul utilization, technology systems and industry best practices. Coyote's access to our UPS fleet, combined with its broad carrier network, has created a customized capacity solution for all markets, customers and situations. Moreover, Coyote creates access to UPS services (such as air freight, customs brokerage and global freight forwarding) for its customer base.
In January 2017, UPS acquired U.K.-based freight brokerage firm, Freightex. The acquisition of Freightex adds a full-scale truckload brokerage and transportation management solution to UPS's European portfolio, creating a one-stop shop for shippers throughout Europe with freight ranging from parcel to full truckload. The combination of Coyote's technology and business model with Freightex's market knowledge and established customer and carrier base complements UPS's North American truckload brokerage business, as many international shippers know and trust the Coyote truckload product.
Global Logistics and Distribution
We provide value-added logistics services to customers through our global network of company-owned and leased distribution centers and field stocking locations. We leverage a global network of more than 900 facilities in more than 100 countries around the globe to ensure products and parts are in the right place, at the right time.
Our distribution centers are strategically located near UPS air and ground transportation hubs for rapid delivery to consumer and business markets. In 2017, UPS began piloting a new integrated transportation-fulfillment solution for small business e-commerce merchants, enabling them to rapidly expand and grow their offerings without additional capital investment.
UPS Post Sales relies on central and field stocking sites to support installed and delivered equipment and devices. In 2017, we integrated UPS Access Point locations into our network, offering greater flexibility, more convenience and improved service for our customers. We also began piloting GPS tracking capabilities and are converting our primary transportation couriers across the U.S. and Canada, which will continue in 2018.
Since its acquisition in late 2016, Maze 1 Limited ("Marken") has served as the clinical trials logistics subsidiary of UPS. Marken strengthened its position as the only patient-centric supply chain organization 100 percent dedicated to the pharmaceutical and life sciences industries. Marken expanded into new facilities, acquiring Touchdown International Logistics Co., Ltd. in Taiwan, and launching a new hybrid service that leverages the strength and reach of UPS's global network. The focus in 2017 was on accelerating revenue growth through new business wins and realizing cost synergies in areas such as IT purchasing, air transportation and insurance premiums.
UPS Express Critical provides urgent, secure transportation for time-sensitive and high-value goods. The service complements UPS's core parcel and air freight services. It includes same-day, next-flight-out and door-to-door ground services, including specialized charter and hand-carry services for both lightweight and heavyweight shipments. In 2017, UPS focused on serving fast-growing industries such as life sciences and aerospace and we will continue this focus in 2018.
4
UPS Freight
UPS Freight offers regional, inter-regional and long-haul LTL services in all 50 states, Canada, Puerto Rico, Guam, the U.S. Virgin Islands and Mexico. UPS Freight provides reliable LTL service backed by a day-definite, on-time guarantee at no additional cost. UPS Freight also provides dedicated contract carriage truckload services to select clients. Additionally, user friendly shipping, visibility and billing technology offerings, including UPS WorldShip ® , Quantum View and UPS Billing Center, allow freight customers to create electronic bills of lading, monitor shipment progress and reconcile shipping charges.
Customs Brokerage
We are among the world's largest customs brokers by both the number of shipments processed annually and by the number of dedicated brokerage employees worldwide. In addition to customs clearance services, we also provide trade management and consulting services. In 2017, we acquired STTAS, the world's largest dedicated global trade compliance management company. STTAS will help us reach our vision of becoming the global broker of choice by expanding the depth of services we provide, as well as our geographic coverage.
UPS Capital
UPS Capital provides financial, insurance and payment services to leverage cash and help protect companies from risk in their supply chains. With services available in more than 21 countries, UPS Capital and its affiliates support all aspects of the order-to-cash cycle, including financing inventory warehoused overseas, insuring shipments and providing payment solutions. The UPS Capital suite of insurance services, trade finance and payment solutions helps customers protect their assets and keeps their businesses running smoothly. With the acquisitions of Parcel Pro™ and the Insured Parcel Services business of G4S International Logistics in 2015, UPS Capital now offers insured transportation of high value goods including loose stones, finished jewelry and wristwatches.
Our People
The strength of our company is our people, working together with a common purpose. We had more than 454,000 employees (excluding temporary seasonal employees) as of December 31, 2017 , of which 374,000 are in the U.S. and 80,000 are located internationally. Our global workforce includes approximately 81,000 management employees (40% of whom are part-time) and 373,000 hourly employees (49% of whom are part-time).
As of December 31, 2017 , we had approximately 280,000 employees employed under a national master agreement and various supplemental agreements with local unions affiliated with the International Brotherhood of Teamsters ("Teamsters"). During 2014, the Teamsters ratified a national master agreement with UPS that will expire on July 31, 2018.
We have approximately 2,700 pilots who are employed under a collective bargaining agreement with the Independent Pilots Association ("IPA"), which runs through September 1, 2021. The economic provisions in the agreement included pay increases, signing bonuses and enhanced pension benefits.
Our airline mechanics are covered by a collective bargaining agreement with Teamsters Local 2727, which became amendable November 1, 2013. We are currently in negotiations with Teamsters Local 2727. In addition, approximately 3,100 of our auto and maintenance mechanics who are not employed under agreements with the Teamsters are employed under collective bargaining agreements with the International Association of Machinists and Aerospace Workers ("IAM") that will expire on July 31, 2019.
Competition
UPS is a global leader in logistics. We offer a broad array of services in the package and freight delivery industry and compete with many different local, regional, national and international logistics providers. Our competitors include worldwide postal services, various motor carriers, express companies, freight forwarders, air couriers and others, including startups that combine technology with crowdsourcing to focus on local market needs. Through our supply chain service offerings, we compete with a number of providers in the supply chain, financial services and information technology industries.
5
Competitive Strengths
Our competitive strengths include:
Global Network. We believe that our integrated global ground and air network is the most extensive in the industry. We provide all types of package services (air, ground, domestic, international, commercial and residential) through a single pickup and delivery service network. We also have extensive air freight, ocean freight, ground freight and logistics networks that provide additional capabilities in the global transportation and logistics market. Our sophisticated engineering systems allow us to optimize our network efficiency and asset utilization on a daily basis.
Global Presence. We serve more than 220 countries and territories around the world. We have a significant presence in all of the world's major economies.
Cutting-Edge Technology. We are a global leader in developing technology that helps our customers enhance their shipping and logistics business processes to lower costs, improve service and increase efficiency.
Technology powers virtually every service we offer and every operation we perform. Customer need drives our technology offerings. We offer a variety of online service options that enable our customers to integrate UPS functionality into their own businesses not only to send, manage and track their shipments conveniently, but also to provide their customers with better information services. We provide the infrastructure for an internet presence that extends to tens of thousands of customers who have integrated UPS tools directly into their own websites.
Broad Portfolio of Services. Our portfolio of services helps customers choose the delivery option that is most appropriate for their requirements. Increasingly, our customers benefit from business solutions that integrate many UPS services beyond package delivery. For example, our supply chain services – such as freight forwarding, truckload brokerage, customs brokerage, order fulfillment and returns management – help improve the efficiency of the supply chain management process.
Customer Relationships. We focus on building and maintaining long-term customer relationships. We serve 1.5 million shipping customers and 9.0 million delivery customers daily. Cross selling small package, supply chain and freight services across our customer base is an important growth mechanism for UPS.
Brand Equity. We have built a leading and trusted brand that stands for quality service, reliability and service innovation. The distinctive appearance of our vehicles and the professional courtesy of our drivers are major contributors to our brand equity.
Distinctive Culture. We believe that the dedication of our employees comes in large part from our distinctive "employee-owner" concept. Our employee stock ownership tradition dates back to 1927, when our founders, who believed that employee stock ownership was a vital foundation for successful business, first offered stock to employees. To encourage employee stock ownership, we maintain several stock-based compensation programs.
Financial Strength. Our financial strength gives us the resources to achieve global scale; to invest in employee development, technology, transportation equipment and facilities; to pursue strategic opportunities that facilitate our growth; to service our obligations and to return value to our shareowners in the form of dividends, share repurchases and steady share growth.
Government regulation
We are subject to numerous laws and regulations in connection with our package and non-package businesses in the countries in which we operate. Certain of these laws and regulations are summarized below.
Air Operations
The U.S. Department of Transportation ("DOT"), the Federal Aviation Administration ("FAA") and the U.S. Department of Homeland Security, through the Transportation Security Administration ("TSA"), have regulatory authority over United Parcel Service Co.'s ("UPS Airlines") air transportation services. The Federal Aviation Act of 1958, as amended, is the statutory basis for DOT and FAA authority and the Aviation and Transportation Security Act of 2001, as amended, is the basis for TSA aviation security authority.
6
The DOT's authority primarily relates to economic aspects of air transportation, such as insurance requirements, discriminatory pricing, non-competitive practices, interlocking relations and cooperative agreements. The DOT also regulates, subject to the authority of the President of the United States, international routes, fares, rates and practices and is authorized to investigate and take action against discriminatory treatment of U.S. air carriers abroad. International operating rights for U.S. airlines are usually subject to bilateral agreements between the U.S. and foreign governments or, in the absence of such agreements, by principles of reciprocity. We are also subject to current and potential aviation regulations imposed by foreign governments in the countries in which we operate, including registration and license requirements and security regulations. UPS Airlines has international route operating rights granted by the DOT and we may apply for additional authorities when those operating rights are available and are required for the efficient operation of our international network. The efficiency and flexibility of our international air transportation network is dependent on DOT and foreign government regulations and operating restrictions.
The FAA's authority primarily relates to safety aspects of air transportation, including aircraft operating procedures, transportation of hazardous materials, record keeping standards and maintenance activities and personnel. In 1988, the FAA granted us an operating certificate, which remains in effect so long as we meet the safety and operational requirements of the applicable FAA regulations. In addition, we are subject to non-U.S. government regulation of aviation rights involving non-U.S. jurisdictions and non-U.S. customs regulation.
UPS aircraft maintenance programs and procedures, including aircraft inspection and repair at periodic intervals, are approved for all aircraft under FAA regulations. The future cost of repairs pursuant to these programs may fluctuate according to aircraft condition, age and the enactment of additional FAA regulatory requirements.
The TSA regulates various security aspects of air cargo transportation in a manner consistent with the TSA mission statement to "protect the Nation's transportation systems to ensure freedom of movement for people and commerce." UPS Airlines, and specified airport and off-airport locations, are regulated under TSA regulations applicable to the transportation of cargo in an air network. In addition, personnel, facilities and procedures involved in air cargo transportation must comply with TSA regulations.
UPS Airlines, along with a number of other domestic airlines, participates in the Civil Reserve Air Fleet ("CRAF") program. Our participation in the CRAF program allows the U.S. Department of Defense ("DOD") to requisition specified UPS Airlines wide-body aircraft for military use during a national defense emergency. The DOD compensates us for the use of aircraft under the CRAF program. In addition, participation in CRAF entitles UPS Airlines to bid for military cargo charter operations.
Ground Operations
Our ground transportation of packages in the U.S. is subject to regulation by the DOT and its agency, the Federal Motor Carrier Safety Administration (the "FMCSA") and the states' jurisdiction with respect to the regulation of operations, safety, insurance and hazardous materials. We also must comply with the safety and fitness regulations promulgated by the FMCSA, including those relating to drug and alcohol testing and hours of service for drivers. We are subject to similar regulation in many non-U.S. jurisdictions.
The Postal Reorganization Act of 1970 created the U.S. Postal Service as an independent establishment of the executive branch of the federal government, and created the Postal Rate Commission, an independent agency, to recommend postal rates. The Postal Accountability and Enhancement Act of 2006 amended the 1970 Act to give the re-named Postal Regulatory Commission revised oversight authority over many aspects of the Postal Service, including postal rates, product offerings and service standards. We sometimes participate in the proceedings before the Postal Regulatory Commission in an attempt to secure fair postal rates for competitive services.
Our ground operations are subject to compliance with various cargo-security and transportation regulations issued by the U.S. Department of Homeland Security, including regulation by the TSA.
Customs
We are subject to the customs laws in the countries in which we operate, regarding the import and export of shipments, including those related to the filing of documents on behalf of client importers and exporters. Our activities, including customs brokerage and freight forwarding, are subject to regulation by the Bureau of Customs and Border Protection, the TSA, the U.S. Federal Maritime Commission and the DOT.
7
Environmental
We are subject to federal, state and local environmental laws and regulations across all of our business units. These laws and regulations cover a variety of processes, including, but not limited to: proper storage, handling and disposal of waste materials; appropriately managing wastewater and stormwater; monitoring and maintaining the integrity of underground storage tanks; complying with laws regarding clean air, including those governing emissions; protecting against and appropriately responding to spills and releases and communicating the presence of reportable quantities of hazardous materials to local responders. We have established site- and activity-specific environmental compliance and pollution prevention programs to address our environmental responsibilities and remain compliant. In addition, we have created numerous programs which seek to minimize waste and prevent pollution within our operations.
Pursuant to the Federal Aviation Act, the FAA, with the assistance of the Environmental Protection Agency ("EPA"), is authorized to establish standards governing aircraft noise. Our aircraft fleet is in compliance with current noise standards of the federal aviation regulations. Our international operations are also subject to noise regulations in certain countries in which we operate.
Communications
Because of our extensive use of radio and other communication facilities in our aircraft and ground transportation operations, we are subject to the Federal Communications Act of 1934, as amended. Additionally, the Federal Communications Commission regulates and licenses our activities pertaining to satellite communications.
Where You Can Find More Information
We maintain a website at www.ups.com . Our annual report on Form 10-K, quarterly reports on Form 10-Q, current reports on Form 8-K and any amendments to those reports filed or furnished pursuant to Section 13(a) of the Securities Exchange Act of 1934 are made available through our website www.investors.ups.com as soon as reasonably practical after we electronically file or furnish the reports to the SEC. However, information on these websites is not incorporated by reference into this report or any other report filed with or furnished to the SEC.
We have adopted a written Code of Business Conduct that applies to all of our directors, officers and employees, including our principal executive officer and senior financial officers. It is available in the governance section of our investor relations website, located at www.investors.ups.com . In the event that we make changes in, or provide waivers from, the provisions of the Code of Business Conduct that the SEC requires us to disclose, we intend to disclose these events in the governance section of our investor relations website.
Our Corporate Governance Guidelines and the Charters for our Audit Committee, Compensation Committee, Executive Committee, Risk Committee and Nominating and Corporate Governance Committee are also available in the governance section of our investor relations website.
Our sustainability report, which describes our activities that support our commitment to acting responsibly and contributing to society, is available at www.sustainability.ups.com . We provide the addresses to our internet sites solely for the information of investors. We do not intend for any addresses to be active links or to otherwise incorporate the contents of any website into this report.
8
Item 1A. | Risk Factors |
You should carefully consider the following factors, which could materially affect our business, financial condition or results of operations. You should read these Risk Factors in conjunction with "Management's Discussion and Analysis of Financial Condition and Results of Operations" in Item 7 and our Consolidated Financial Statements and related notes in Item 8.
General economic conditions, both in the U.S. and internationally, may adversely affect our results of operations.
We conduct operations in over 220 countries and territories. Our U.S. and international operations are subject to normal cycles affecting the economy in general, as well as the local economic environments in which we operate. The factors that create cyclical changes to the economy and to our business are beyond our control, may adversely impact our credit rating and it may be difficult for us to adjust our business model to mitigate the impact of these factors. In particular, our business is affected by levels of industrial production, consumer spending and retail activity and our business, financial position and results of operations could be materially affected by adverse developments in these aspects of the economy. The United Kingdom's vote to leave the European Union could result in economic uncertainty and instability, resulting in fewer goods being transported globally.
We face significant competition which could adversely affect our business, financial position and results of operations.
We face significant competition on a local, regional, national and international basis. Our competitors include the postal services of the U.S. and other nations, various motor carriers, express companies, freight forwarders, air couriers and others. Competition may also come from other sources in the future. Some of our competitors have cost and organizational structures that differ from ours and may offer services and pricing terms that we may not be willing or able to offer. If we are unable to timely and appropriately respond to competitive pressures, our business, financial position and results of operations could be adversely affected.
The transportation industry continues to consolidate and competition remains strong. As a result of consolidation, our competitors may increase their market share and improve their financial capacity, and may strengthen their competitive positions. Business combinations could also result in competitors providing a wider variety of services and products at competitive prices, which could adversely affect our financial performance.
Changes in our relationships with our significant customers, including the loss or reduction in business from one or more of them, could have an adverse impact on us.
No single customer accounts for 10% or more of our consolidated revenue. We do not believe the loss of any single customer would materially impair our overall financial condition or results of operations; however, collectively, some of our large customers might account for a relatively significant portion of the growth in revenue in a particular quarter or year. These customers can drive the growth in revenue for particular services based on factors such as: new customer product launches; trends in the e-commerce industry, such as the seasonality associated with the fourth quarter holiday season; business mergers and acquisitions and the overall fast growth of a customer's underlying business. These customers could choose to divert all or a portion of their business with us to one of our competitors, demand pricing concessions for our services, require us to provide enhanced services that increase our costs, or develop their own shipping and distribution capabilities. If these factors drove some of our large customers to cancel all or a portion of their business relationships with us, it could materially impact the growth in our business and the ability to meet our current and long-term financial forecasts.
Our business is subject to complex and stringent regulation in the U.S. and internationally.
We are subject to complex and stringent aviation, transportation, environmental, security, labor, employment and other governmental laws, regulations and policies, both in the U.S. and in the other countries in which we operate. In addition, our business is impacted by laws, regulations and policies that affect global trade, including tariff and trade policies, export requirements, taxes, monetary policies and other restrictions and charges. Changes in laws, regulations and policies and the related interpretations may alter the landscape in which we do business and may affect our costs of doing business. The impact of new laws, regulations and policies cannot be predicted. Compliance with new laws and regulations may increase our operating costs or require significant capital expenditures. Any failure to comply with applicable laws or regulations in the U.S. or in any of the countries in which we operate could result in substantial fines or possible revocation of our authority to conduct our operations, which could adversely affect our financial performance.
9
Increased security requirements could impose substantial costs on us and we could be the target of an attack or have a security breach.
As a result of concerns about global terrorism and homeland security, governments around the world have adopted or may adopt stricter security requirements that will result in increased operating costs for businesses in the transportation industry. These requirements may change periodically as a result of regulatory and legislative requirements and in response to evolving threats. We cannot determine the effect that these new requirements will have on our cost structure or our operating results, and these rules or other future security requirements may increase our costs of operations and reduce operating efficiencies. Regardless of our compliance with security requirements or the steps we take to secure our facilities or fleet, we could be the target of an attack or security breaches could occur, which could adversely affect our operations or our reputation.
We are subject to increasingly stringent regulations related to climate change, and new regulations could materially increase our operating costs.
Concern over climate change, including the impact of global warming, has led to significant legislative and regulatory efforts, particularly internationally but also in the United States, to limit greenhouse gas ("GHG") emissions. State and local governments also are increasingly considering GHG regulation. The possibility of increased regulation of GHG emissions potentially exposes our transportation and logistics businesses to significant new taxes, fees and other costs. Compliance with such potential regulation or the associated potential costs is further complicated by the fact that various countries and regions are following different approaches to the regulation of climate change.
We are subject to international regulation of GHG emissions. For example, in 2009 the European Commission approved the extension to the airline industry of the European Union Emissions Trading Scheme ("ETS") for GHG emissions. Under this decision, all of our flights operating within the European Union are covered by the ETS requirements, and we are required annually to purchase emission allowances in an amount exceeding the number of free allowances allocated to us under the ETS. Similarly, in 2016, the International Civil Aviation Organization ("ICAO") passed a resolution adopting the Carbon Offsetting and Reduction Scheme for International Aviation ("CORSIA"), which is a global, market-based emissions offset program to encourage carbon-neutral growth beyond 2020. A pilot phase is scheduled to begin in 2021 in which countries may voluntarily participate, and full mandatory participation is scheduled to begin in 2027. ICAO continues to develop details regarding implementation, but compliance with CORSIA will increase our operating costs.
In the U.S., Congress in the past several years has considered various bills that would regulate GHG emissions, but these bills so far have not received sufficient Congressional support for enactment. Nevertheless, some form of federal climate change legislation is possible in the future. Even in the absence of such legislation, the Environmental Protection Agency ("EPA"), spurred by judicial interpretation of the Clean Air Act, could determine to regulate GHG emissions, especially aircraft or diesel engine emissions, and this could impose substantial costs on us.
In August 2017, the U.S. announced its intention to withdraw from the Paris climate accord, an agreement among 196 countries to reduce GHG emissions, and the effect of that withdrawal on future U.S. policy regarding GHG emissions, on CORSIA and on other GHG regulation is uncertain. Nevertheless, the extent to which other countries implement that agreement could have an adverse direct or indirect effect on our business.
We may face additional regulations regarding GHG emissions internationally and in the United States. Potential costs to us of increased regulation regarding GHG emissions, especially aircraft or diesel engine emissions, include an increase in the cost of the fuel and other energy we purchase and capital costs associated with updating or replacing our aircraft or vehicles prematurely. However, until the timing, scope and extent of any future regulation becomes known, we cannot predict its effect on our cost structure or our operating results. It is reasonably possible that such regulation could significantly increase our operating expenses if we are unable to pass such costs along to our customers. Moreover, even without such regulation, increased awareness and any adverse publicity in the global marketplace about the GHGs emitted by companies in the airline and transportation industries could harm our reputation and reduce customer demand for our services, especially our air services.
10
Strikes, work stoppages and slowdowns by our employees could adversely affect our business, financial position and results of operations.
A significant number of our employees are employed under a national master agreement and various supplemental agreements with local unions affiliated with the Teamsters. In addition, our airline pilots, airline mechanics, ground mechanics and certain other employees are employed under other collective bargaining agreements. Strikes, work stoppages and slowdowns by our employees could adversely affect our ability to meet our customers' needs, and customers may do more business with competitors if they believe that such actions or threatened actions may adversely affect our ability to provide services. We may face a permanent loss of customers if we are unable to provide uninterrupted service, and this could adversely affect our business, financial position and results of operations. The terms of future collective bargaining agreements also may affect our competitive position and results of operations.
We are exposed to the effects of changing prices of energy, including gasoline, diesel and jet fuel, and interruptions in supplies of these commodities.
Changing fuel and energy costs may have a significant impact on our operations. We require significant quantities of fuel for our aircraft and delivery vehicles and are exposed to the risk associated with variations in the market price for petroleum products, including gasoline, diesel and jet fuel. We mitigate our exposure to changing fuel prices through our indexed fuel surcharges and we may also enter into hedging transactions from time to time. If we are unable to maintain or increase our fuel surcharges, higher fuel costs could adversely impact our operating results. Even if we are able to offset the cost of fuel with our surcharges, high fuel surcharges may result in a mix shift from our higher-yielding air products to lower-yielding ground products or an overall reduction in volume. There can be no assurance that our hedging transactions will be effective to protect us from changes in fuel prices. Moreover, we could experience a disruption in energy supplies, including our supply of gasoline, diesel and jet fuel, as a result of war, actions by producers or other factors beyond our control, which could have an adverse effect on our business.
Changes in exchange rates or interest rates may have an adverse effect on our results.
We conduct business across the globe with a significant portion of our revenue derived from operations outside the United States. Our operations in international markets are affected by changes in the exchange rates for local currencies, and in particular the Euro, British Pound Sterling, Canadian Dollar, Chinese Renminbi and Hong Kong Dollar .
We are exposed to changes in interest rates, primarily on our short-term debt and that portion of our long-term debt that carries floating interest rates. The impact of a 100-basis-point change in interest rates affecting our debt is discussed in the "Quantitative and Qualitative Disclosures about Market Risk" section of this report. Additionally, changes in interest rates impact the valuation of our pension and postretirement benefit obligations and the related benefit cost recognized in the income statement. The impact of changes in interest rates on our pension and postretirement benefit obligations and costs is discussed further in the "Critical Accounting Policies and Estimates" section of this report.
We monitor and manage our exposures to changes in currency exchange rates and interest rates, and make use of derivative instruments to mitigate the impact of changes in these rates on our financial position and results of operations; however, changes in exchange rates and interest rates cannot always be predicted or hedged.
If we are unable to maintain our brand image and corporate reputation, our business may suffer.
Our success depends in part on our ability to maintain the image of the UPS brand and our reputation for providing excellent service to our customers. Service quality issues, actual or perceived, even when false or unfounded, could tarnish the image of our brand and may cause customers to use other companies. Also, adverse publicity surrounding labor relations, environmental concerns, security matters, political activities and the like, or attempts to connect our company to these sorts of issues, either in the United States or other countries in which we operate, could negatively affect our overall reputation and acceptance of our services by customers. Damage to our reputation and loss of brand equity could reduce demand for our services and thus have an adverse effect on our business, financial position and results of operations, and could require additional resources to rebuild our reputation and restore the value of our brand.
11
A significant data breach or IT system disruption could adversely affect our business, financial results, or reputation, and we may be required to increase our spending on data and system security.
We rely heavily on information technology networks and systems, including the Internet, to manage or support a wide variety of important business processes and activities throughout our operations. For example, we rely on information technology to receive package level information in advance of physical receipt of packages, to track items that move through our delivery systems, to efficiently plan deliveries, to execute billing processes, and to track and report financial and operational data. Our franchised center locations and businesses we have acquired also are reliant on the use of information technology systems to manage their business processes and activities.
In addition, the provision of service to our customers and the operation of our networks and systems involve the storage and transmission of significant amounts of proprietary information and sensitive or confidential data, including personal information of customers, employees and others. To conduct our operations, we regularly move data across national borders, and consequently we are subject to a variety of continuously evolving and developing laws and regulations in the United States and abroad regarding privacy, data protection and data security. The scope of the laws that may be applicable to us is often uncertain and may be conflicting, particularly with respect to foreign laws. For example, the European Union's General Data Protection Regulation ("GDPR"), which greatly increases the jurisdictional reach of European Union law and adds a broad array of requirements for handling personal data, including the public disclosure of significant data breaches, becomes effective in May 2018. Other countries have enacted or are enacting data localization laws that require data to stay within their borders. All of these evolving compliance and operational requirements impose significant costs that are likely to increase over time.
Our information technology systems (as well as those of our franchisees and acquired businesses) may be susceptible to damage, disruptions or shutdowns due to failures during the process of upgrading or replacing software, databases or components thereof, power outages, hardware failures, computer viruses, cyber-attacks, ransomware attacks, malware attacks, malicious employees or other insiders, telecommunications failures, human errors or catastrophic events. Hackers, foreign governments, cyber-terrorists and cyber-criminals, acting individually or in coordinated groups, may launch distributed denial of service attacks or other coordinated attacks that may cause service outages, gain inappropriate or block legitimate access to systems or information, or result in other interruptions in our business. In addition, breaches in security could expose us, our customers and franchisees, or the individuals affected, to a risk of loss or misuse of proprietary information and sensitive or confidential data, including personal information of customers, employees and others. The techniques used to obtain unauthorized access, disable or degrade service or sabotage systems change frequently, may be difficult to detect for a long time and often are not recognized until launched against a target. As a result, we may be unable to anticipate these techniques or to implement adequate preventative measures.
We also depend on and interact with the information technology networks and systems of third-parties for many aspects of our business operations, including our customers and franchisees and service providers such as cloud service providers and third-party delivery services. These third parties may have access to information we maintain about our company, operations, customers, employees and vendors, or operating systems that are critical to or can significantly impact our business operations. Like us, these third-parties are subject to risks imposed by data breaches and cyber-attacks and other events or actions that could damage, disrupt or close down their networks or systems. Security processes, protocols and standards that we have implemented and contractual provisions requiring security measures that we may have sought to impose on such third-parties may not be sufficient or effective at preventing such events, which could result in unauthorized access to, or disruptions or denials of access to, or misuse of, information or systems that are important to our business, including proprietary information, sensitive or confidential data, and other information about our operations, customers, employees and suppliers, including personal information.
Any of these events that impact our information technology networks or systems, or those of acquired businesses, franchisees, customers, service providers or other third-parties, could result in disruptions in our operations, the loss of existing or potential customers, damage to our brand and reputation, regulatory scrutiny, and litigation and potential liability for the company. Among other consequences, our customers' confidence in our ability to protect data and systems and to provide services consistent with their expectations could be impacted, further disrupting our operations. Similarly, an actual or alleged failure to comply with applicable U.S. or foreign data protection regulations or other data protection standards may expose us to litigation, fines, sanctions or other penalties.
12
We have invested and continue to invest in technology security initiatives, information technology risk management and disaster recovery plans. The cost and operational consequences of implementing, maintaining and enhancing further data or system protection measures could increase significantly to overcome increasingly intense, complex and sophisticated global cyber threats. Despite our best efforts, we are not fully insulated from data breaches and system disruptions. For example, in August 2014, a broad-based malware intrusion targeting retailers throughout the U.S. was discovered and subsequently eradicated at approximately 1% of our franchisees' locations. While the impact of this cyber-attack, including the costs associated with investigation and remediation activities, was not material to our business and our financial results, there is no assurance that such impacts will not be material in the future, and our efforts to deter, identify, mitigate and/or eliminate future breaches may require significant additional effort and expense and may not be successful.
Severe weather or other natural or manmade disasters could adversely affect our business.
Severe weather conditions and other natural or manmade disasters, including storms, floods, fires or earthquakes, epidemics or pandemics, conflicts or unrest, or terrorist attacks, may result in decreased revenues, as our customers reduce their shipments, or increased costs to operate our business, which could have an adverse effect on our results of operations for a quarter or year. Any such event affecting one of our major facilities could result in a significant interruption in or disruption of our business.
We make significant capital investments in our business of which a significant portion is tied to projected volume levels.
We require significant capital investments in our business consisting of aircraft, vehicles, technology, facilities and sorting and other types of equipment to support both our existing business and anticipated growth. Forecasting projected volume involves many factors which are subject to uncertainty, such as general economic trends, changes in governmental regulation and competition. If we do not accurately forecast our future capital investment needs, we could have excess capacity or insufficient capacity, either of which would negatively affect our revenues and profitability. In addition to forecasting our capital investment requirements, we adjust other elements of our operations and cost structure in response to adverse economic conditions; however, these adjustments may not be sufficient to allow us to maintain our operating margins in a weak economy.
We derive a significant portion of our revenues from our international operations and are subject to the risks of doing business in international markets.
We have significant international operations, and while the geographical diversity of our international operations helps ensure that we are not overly reliant on a single region or country, we are continually exposed to changing economic, political and social developments that are beyond our control. Emerging markets are typically more volatile than those in the developed world, and any broad-based downturn in these markets could reduce our revenues and adversely affect our business, financial position and results of operations. We are subject to many laws governing our international operations, including those that prohibit improper payments to government officials and commercial customers, and restrict where we can do business, our shipments to certain countries and the information that we can provide to non-U.S. governments.
We are subject to changes in markets and our business plans that have resulted, and may in the future result, in substantial write-downs of the carrying value of our assets, thereby reducing our net income.
Our regular review of the carrying value of our assets has resulted, from time to time, in significant impairments, and we may in the future be required to recognize additional impairment charges. Changes in business strategy, government regulations, or economic or market conditions have resulted and may result in further substantial impairments of our intangible, fixed or other assets at any time in the future. In addition, we have been and may be required in the future to recognize increased depreciation and amortization charges if we determine that the useful lives of our fixed assets or intangible assets are shorter than we originally estimated. Such changes could reduce our net income.
Employee health and retiree health and pension benefit costs represent a significant expense to us.
Our expenses relating to employee health and retiree health and pension benefits are significant. In recent years, we have experienced significant increases in some of these costs, largely as a result of economic factors beyond our control, including, in particular, ongoing increases in healthcare costs well in excess of the rate of inflation and historically low discount rates that we use to value our benefit plan obligations. Continually increasing healthcare costs, volatility in investment returns and discount rates, as well as changes in laws, regulations and assumptions used to calculate retiree health and pension benefit expenses, may adversely affect our business, financial position, results of operations or require significant contributions to our benefit plans. The national master agreement with the IBT includes changes that are designed to mitigate certain of these healthcare expenses, but there can be no assurance that our efforts will be successful or that the failure or success of these efforts will not adversely affect our business, financial position, results of operations or liquidity.
13
We participate in a number of trustee-managed multiemployer pension and health and welfare plans for employees covered under collective bargaining agreements. As part of the overall collective bargaining process for wage and benefit levels, we have agreed to contribute certain amounts to the multiemployer benefit plans during the contract period. The multiemployer benefit plans set benefit levels and are responsible for benefit delivery to participants. Future contribution amounts to multiemployer benefit plans will be determined only through collective bargaining, and we have no additional legal or constructive obligation to increase contributions beyond the agreed-upon amounts (except potential surcharges under the Pension Protection Act of 2006 in the event that a plan enters critical status, and our contributions are not sufficient to satisfy any rehabilitation plan funding schedule). In future collective bargaining negotiations, we could agree to make significantly higher future contributions to improve the funded status of one or more of these plans. The funded status of these multiemployer plans is impacted by various factors, including investment performance, healthcare inflation, changes in demographics and changes in participant benefit levels. At this time, we are unable to determine the amount of additional future contributions, if any, or whether any material adverse effect on our financial condition, results of operations or liquidity could result from our participation in these plans.
In addition to our on-going multiemployer pension plan obligations, we may have additional exposure with respect to benefits earned in the Central States Pension Fund (the "CSPF"). UPS was a contributing employer to the CSPF until 2007 when we withdrew from the plan and fully funded our allocable share of unfunded vested benefits by paying a $6.1 billion withdrawal liability. Under a collective bargaining agreement with the International Brotherhood of Teamsters ("IBT"), UPS agreed to provide coordinating benefits in the UPS/IBT Full Time Employee Pension Plan ("UPS/IBT Plan") for UPS participants whose last employer was UPS and who had not retired as of January 1, 2008 ("the UPS Transfer Group") in the event that benefits are lawfully reduced by the CSPF in the future consistent with the terms of our withdrawal agreement with the CSPF.
In December 2014, Congress passed the Multiemployer Pension Reform Act ("MPRA"), which for the first time ever allowed multiemployer pension plans to reduce benefit payments to retirees, subject to specific guidelines in the statute and government approval. In September 2015, the CSPF submitted a proposed pension benefit reduction plan to the U.S. Department of the Treasury under the MPRA. The CSPF plan proposed to reduce retirement benefits to the CSPF participants, including the UPS Transfer Group. We vigorously challenged the proposed benefit reduction plan because we believed that it did not comply with the law and that the CSPF failed to comply with its contractual obligation to obtain our consent to reduce benefits to the UPS Transfer Group under the terms of the withdrawal agreement with the CSPF. On May 6, 2016, the U.S. Department of the Treasury rejected the proposed plan submitted by the CSPF, stating that it failed to satisfy a number of requirements set forth in the MPRA.
The CSPF has asserted that it will become insolvent in 2025, which could lead to the reduction of retirement benefits. Although there are numerous factors that could affect the CSPF's funding status, if the CSPF were to become insolvent as they have projected, UPS may be required to provide coordinating benefits, thereby increasing the current projected benefit obligation for the UPS/IBT Plan by approximately $ 4 billion. The CSPF has said that it believes a legislative solution to its funding status is necessary, and we expect that the CSPF will continue to explore options to avoid insolvency.
The potential obligation to pay coordinating benefits from the UPS/IBT Plan is subject to a number of significant uncertainties, including actions that may be taken by the CSPF, the federal government or others. These actions include whether the CSPF will submit a revised pension benefit reduction plan or otherwise seek federal government assistance, the extent to which benefits are paid by the Pension Benefit Guaranty Corporation, our ability to successfully defend our legal positions as well as the effect of discount rates, CSPF asset returns and various other actuarial assumptions.
We account for this potential obligation under Accounting Standards Codification Topic 715- Compensation- Retirement Benefits ("ASC 715"). Under ASC 715 we are required to provide a best estimate of various actuarial assumptions, including the eventual outcome of this matter, in measuring our pension benefit obligation at the December 31st measurement date. While we currently believe the most likely solution to this matter and the broader systemic problems facing multiemployer pension plans is intervention by the federal government, ASC 715 does not permit anticipation of changes in law in making a best estimate of pension liabilities. Our best estimate as of the measurement date of December 31, 2017 does not incorporate this solution. However, if a future change in law resulted in an obligation to provide coordinating benefits under the UPS/IBT Plan, it may be a significant event, and may require us to remeasure the plan assets and projected benefit obligation of the UPS/IBT Plan at the date the law is enacted.
14
Our best estimate of the next most likely outcome to resolve the CSPF's solvency concerns is that the CSPF will submit another benefit suspension application under the MPRA to forestall insolvency without reducing benefits to the UPS Transfer Group. If the CSPF attempts to reduce benefits for the UPS Transfer Group under a MPRA filing, we would be in a strong legal position to prevent that from occurring given that these benefits cannot be reduced without our consent and such a reduction, without first exhausting reductions to other groups in the CSPF, would be contrary to the statute. Accordingly, our best estimate as of the measurement date of December 31, 2017 is that there is no liability to be recognized for additional coordinating benefits of the UPS/IBT Plan. However, the projected benefit obligation could materially increase as the uncertainties are resolved. We will continue to assess the impact of these uncertainties on the projected benefit obligation of the UPS/IBT Plan in accordance with ASC 715.
We may have additional tax liabilities.
We are subject to income taxes in the U.S. and many foreign jurisdictions. Significant judgment is required in determining our worldwide provision for income taxes. In the course of our business, there are many transactions and calculations where the ultimate tax determination is uncertain. For example, compliance with the 2017 United States Tax Cut and Jobs Act (the "Tax Act") may require the collection of information not regularly produced within our company, the use of provisional estimates in our financial statements, and the exercise of significant judgment in accounting for its provisions. Many aspects of the Tax Act are unclear and may not be clarified for some time. As regulations and guidance evolve with respect to the Tax Act, and as we gather more information and perform more analysis, our results may differ from previous estimates and may materially affect our financial position.
We regularly are under audit by tax authorities in different jurisdictions. Economic and political pressures to increase tax revenue in various jurisdictions may make resolving tax disputes favorably more difficult. Although we believe our tax estimates are reasonable, the final determination of tax audits and any related litigation in the jurisdictions where we are subject to taxation could be materially different from our historical income tax provisions and accruals. In addition, changes in U.S. federal and state or international tax laws applicable to corporate multinationals, other fundamental law changes currently being considered by many countries, including in the U.S., and changes in taxing jurisdictions' administrative interpretations, decisions, policies and positions may materially adversely impact our tax expense and cash flows.
We may be subject to various claims and lawsuits that could result in significant expenditures.
The nature of our business exposes us to the potential for various claims and litigation related to labor and employment, personal injury, property damage, business practices, environmental liability and other matters. Any material litigation or a catastrophic accident or series of accidents could have a material adverse effect on our business, financial position and results of operations.
We may not realize the anticipated benefits of acquisitions, joint ventures or strategic alliances.
As part of our business strategy, we may acquire businesses and form joint ventures or strategic alliances. Whether we realize the anticipated benefits from these transactions depends, in part, upon the successful integration between the businesses involved, the performance of the underlying operations, capabilities or technologies and the management of the acquired operations. Accordingly, our financial results could be adversely affected by our failure to effectively integrate the acquired operations, unanticipated performance issues, transaction-related charges or charges for impairment of long-term assets that we acquire.
Insurance and claims expenses could have a material adverse effect on our business, financial condition and results of operations.
We have a combination of both self-insurance and high-deductible insurance programs for the risks arising out of the services we provide and the nature of our global operations, including claims exposure resulting from cargo loss, personal injury, property damage, aircraft and related liabilities, business interruption and workers' compensation. Workers' compensation, automobile and general liabilities are determined using actuarial estimates of the aggregate liability for claims incurred and an estimate of incurred but not reported claims, on an undiscounted basis. Our accruals for insurance reserves reflect certain actuarial assumptions and management judgments, which are subject to a high degree of variability. If the number or severity of claims for which we are retaining risk increases, our financial condition and results of operations could be adversely affected. If we lose our ability to self-insure these risks, our insurance costs could materially increase and we may find it difficult to obtain adequate levels of insurance coverage.
15
Item 1B. | Unresolved Staff Comments |
Not applicable.
Item 2. | Properties |
Operating Facilities
We own our headquarters, which is located in Atlanta, Georgia and consists of about 745,000 square feet of office space, and our UPS Supply Chain Solutions group's headquarters, which is located in Alpharetta, Georgia and consists of about 310,000 square feet of office space.
Our primary information technology operations are consolidated in a 444,000 square foot owned facility, the Ramapo Ridge facility, in Mahwah, New Jersey. Our information technology headquarters is located in Parsippany, New Jersey, consisting of about 200,000 square feet of office space. We also own a 175,000 square foot facility in Alpharetta, Georgia, which serves as a backup to the main information technology operations facility in New Jersey. This facility provides production functions and backup capacity in the event that a power outage or other disaster incapacitates the main data center. It also helps to meet our internal communication needs.
We own or lease over 1,000 package operating facilities in the U.S., with approximately 68 million square feet of floor space. The smaller of these facilities have vehicles and drivers stationed for the pickup and delivery of packages, and capacity to sort and transfer packages. The larger of these facilities also service our vehicles and equipment, and employ specialized mechanical installations for the sorting and handling of packages. We own or lease approximately 800 facilities that support our international package operations, with approximately 20 million square feet of floor space.
In addition, we own or lease more than 500 facilities, with approximately 34 million square feet of floor space, that support our freight forwarding and logistics operations. We own and operate a logistics campus consisting of approximately 4 million square feet in Louisville, Kentucky.
We own or lease approximately 200 UPS Freight service centers with approximately 6 million square feet of floor space. The main offices of UPS Freight are located in Richmond, Virginia and consist of about 217,000 square feet of office space.
Our aircraft are operated in a hub and spoke pattern in the U.S., with our principal air hub, known as Worldport, located in Louisville, Kentucky. The Worldport facility consists of over 5 million square feet and includes high speed conveyor and computer control systems.
We also own or lease regional air hubs globally, with over 4 million square feet of floor space. Our U.S. regional air hubs are located in Dallas, Texas; Ontario, California; Philadelphia, Pennsylvania and Rockford, Illinois. These hubs house facilities for the sorting, transfer and delivery of packages. Our European air hub is located in Cologne, Germany, and we maintain Asia Pacific air hubs in Shanghai, China; Shenzhen, China and Hong Kong. Our regional air hub in Canada is located in Hamilton, Ontario, and our regional air hub for Latin America and the Caribbean is in Miami, Florida.
In 2017, we announced seven new buildings and one expansion that total more than 5 million square feet. We believe that our facilities are adequate to support our current operations.
16
Fleet
Aircraft
The following table shows information about our aircraft fleet as of December 31, 2017 :
Description | Owned and Capital Leases |
| Short-term Leased or Chartered From Others |
| On Order |
| Under Option | ||||
Boeing 757-200F | 75 | |
| - | |
| - | |
| - | |
Boeing 767-300ERF | 59 | |
| - | |
| - | |
| - | |
Boeing 767-300BCF | 2 | |
| - | |
| 1 | |
| - | |
Airbus A300-600F | 52 | |
| - | |
| - | |
| - | |
Boeing MD-11F | 37 | |
| - | |
| - | |
| - | |
Boeing 747-400F | 11 | |
| - | |
| - | |
| - | |
Boeing 747-400BCF | 2 | |
| - | |
| - | |
| - | |
Boeing 747-8F | 3 | |
| - | |
| 11 | |
| 14 | |
Other | - | |
| 340 | |
| - | |
| - | |
Total | 241 | |
| 340 | |
| 12 | |
| 14 | |
On February 1, 2018, we announced an order for 14 Boeing 747-8 freighters previously under option and four new Boeing 767 aircraft to be delivered between 2019 and 2022.
Vehicles
We operate a global ground fleet of approximately 119,000 package cars, vans, tractors and motorcycles. Our ground support fleet consists of 35,000 pieces of equipment designed specifically to support our aircraft fleet, ranging from non-powered container dollies and racks to powered aircraft main deck loaders and cargo tractors. We also have 45,000 containers used to transport cargo in our aircraft.
Item 3. | Legal Proceedings |
For a discussion of legal proceedings affecting us and our subsidiaries, please see note 4 to the audited consolidated financial statements for a discussion of pension related matters and note 9 for a discussion of judicial proceedings and other matters arising from the conduct of our business activities.
Item 4. | Mine Safety Disclosures |
Not applicable.
17
PART II
Item 5. | Market for Registrant's Common Equity, Related Stockholder Matters and Issuer Purchases of Equity Securities |
Our class A common stock is not listed on a national securities exchange or traded in an organized over-the-counter market, but each share of our class A common stock is convertible into one share of our class B common stock.
The following is a summary of our class B common stock price activity and dividend information for 2017 and 2016 . Our class B common stock is listed on the New York Stock Exchange under the symbol "UPS".
| High |
| Low |
| Close |
| Dividends Declared | ||||||||
2017: |
|
|
|
|
|
|
| ||||||||
First Quarter | $ | 118.19 | |
| $ | 103.23 | |
| $ | 107.30 | |
| $ | 0.83 | |
Second Quarter | $ | 111.55 | |
| $ | 102.12 | |
| $ | 110.59 | |
| $ | 0.83 | |
Third Quarter | $ | 120.42 | |
| $ | 106.98 | |
| $ | 120.09 | |
| $ | 0.83 | |
Fourth Quarter | $ | 125.16 | |
| $ | 111.30 | |
| $ | 119.15 | |
| $ | 0.83 | |
2016: |
|
|
|
|
|
|
| ||||||||
First Quarter | $ | 106.10 | |
| $ | 88.70 | |
| $ | 105.47 | |
| $ | 0.78 | |
Second Quarter | $ | 107.72 | |
| $ | 100.66 | |
| $ | 107.72 | |
| $ | 0.78 | |
Third Quarter | $ | 111.50 | |
| $ | 106.86 | |
| $ | 109.36 | |
| $ | 0.78 | |
Fourth Quarter | $ | 120.16 | |
| $ | 106.84 | |
| $ | 114.64 | |
| $ | 0.78 | |
As of February 8, 2018 , there were 154,033 and 18,863 shareowners of record of class A and class B common stock, respectively.
Our practice has been to pay dividends on a quarterly basis. The declaration of dividends is subject to the discretion of the Board of Directors and will depend on various factors, including our net income, financial condition, cash requirements, future prospects and other relevant factors.
On February 8, 2018 , our Board declared a dividend of $ 0.91 per share, which is payable on March 7, 2018 to shareowners of record on February 20, 2018 . This represents a 10% increase from the previous $0.83 quarterly dividend in 2017.
A summary of repurchases of our class A and class B common stock during the fourth quarter of 2017 is as follows (in millions, except per share amounts):
| Total Number of Shares Purchased (1) |
| Total Number of Shares Purchased as Part of Publicly Announced Program |
| Average Price Paid Per Share |
| Approximate Dollar Value of Shares that May Yet be Purchased Under the Program (as of month-end) | ||||||
October 1-October 31 | 1.3 | |
| 1.3 | |
| $ | 119.28 | |
| $ | 4,644 | |
November 1-November 30 | 1.2 | |
| 1.2 | |
| 123.47 | |
| 4,490 | | ||
December 1-December 31 | 1.3 | |
| 1.3 | |
| 119.50 | |
| 4,339 | | ||
Total October 1-December 31 | 3.8 | |
| 3.8 | |
| $ | 120.71 | |
|
| ||
(1) | Includes shares repurchased through our publicly announced share repurchase program and shares tendered to pay the exercise price and tax withholding on employee stock options. |
In May 2016 , the Board of Directors approved a share repurchase authorization of $ 8.0 billion, which replaced an authorization previously announced in 2013 . The new share repurchase authorization has no expiration date. We anticipate repurchasing approximately $ 1.0 billion of shares in 2018 .
18
Shareowner Return Performance Graph
The following performance graph and related information shall not be deemed "soliciting material" or to be "filed" with the SEC, nor shall such information be incorporated by reference into any future filing under the Securities Act of 1933 or Securities Exchange Act of 1934, each as amended, except to the extent that the Company specifically incorporates such information by reference into such filing.
The following graph shows a five-year comparison of cumulative total shareowners' returns for our class B common stock, the Standard & Poor's 500 Index and the Dow Jones Transportation Average. The comparison of the total cumulative return on investment, which is the change in the quarterly stock price plus reinvested dividends for each of the quarterly periods, assumes that $100 was invested on December 31, 2012 in the Standard & Poor's 500 Index, the Dow Jones Transportation Average and our class B common stock.
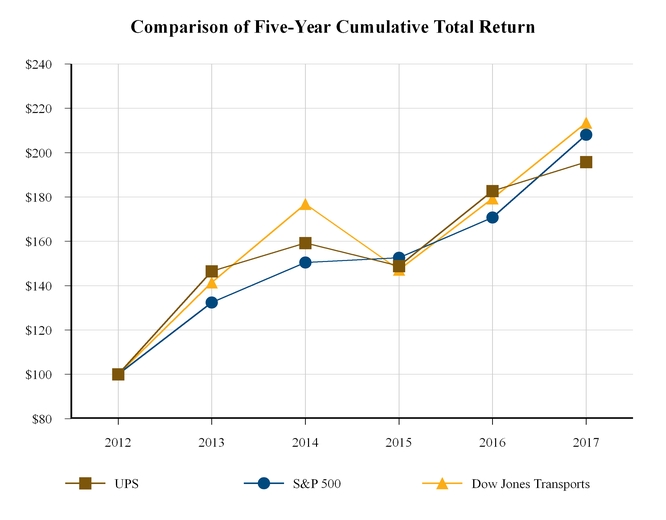
| 12/31/2012 | |
| 12/31/2013 | |
| 12/31/2014 | |
| 12/31/2015 | |
| 12/31/2016 | |
| 12/31/2017 | | ||||||
United Parcel Service, Inc. | $ | 100.00 | |
| $ | 146.54 | |
| $ | 159.23 | |
| $ | 148.89 | |
| $ | 182.70 | |
| $ | 195.75 | |
Standard & Poor's 500 Index | $ | 100.00 | |
| $ | 132.38 | |
| $ | 150.49 | |
| $ | 152.55 | |
| $ | 170.79 | |
| $ | 208.06 | |
Dow Jones Transportation Average | $ | 100.00 | |
| $ | 141.38 | |
| $ | 176.83 | |
| $ | 147.19 | |
| $ | 179.37 | |
| $ | 213.49 | |
19
Item 6. | Selected Financial Data |
The following table sets forth selected financial data for each of the five years in the period ended December 31, 2017 (in millions, except per share amounts). This financial data should be read together with our consolidated financial statements and related notes, Management's Discussion and Analysis of Financial Condition and Results of Operations, including the Items Affecting Comparability section, and other financial data appearing elsewhere in this report.
| Years Ended December 31, | ||||||||||||||||||
| 2017 |
| 2016 |
| 2015 |
| 2014 |
| 2013 | ||||||||||
Selected Income Statement Data |
|
|
|
|
|
|
|
|
| ||||||||||
Revenue: |
|
|
|
|
|
|
|
|
| ||||||||||
U.S. Domestic Package | $ | 40,764 | |
| $ | 38,301 | |
| $ | 36,747 | |
| $ | 35,851 | |
| $ | 34,074 | |
International Package | 13,338 | |
| 12,350 | |
| 12,149 | |
| 12,988 | |
| 12,429 | | |||||
Supply Chain & Freight | 11,770 | |
| 10,255 | |
| 9,467 | |
| 9,393 | |
| 8,935 | | |||||
Total Revenue | 65,872 | |
| 60,906 | |
| 58,363 | |
| 58,232 | |
| 55,438 | | |||||
Operating Expenses: |
|
|
|
|
|
|
|
|
| ||||||||||
Compensation and benefits | 34,588 | |
| 34,770 | |
| 31,028 | |
| 32,045 | |
| 28,557 | | |||||
Other | 23,755 | |
| 20,669 | |
| 19,667 | |
| 21,219 | |
| 19,847 | | |||||
Total Operating Expenses | 58,343 | |
| 55,439 | |
| 50,695 | |
| 53,264 | |
| 48,404 | | |||||
Operating Profit: |
|
|
|
|
|
|
|
|
| ||||||||||
U.S. Domestic Package | 4,280 | |
| 3,017 | |
| 4,767 | |
| 2,859 | |
| 4,603 | | |||||
International Package | 2,464 | |
| 2,044 | |
| 2,137 | |
| 1,677 | |
| 1,757 | | |||||
Supply Chain and Freight | 785 | |
| 406 | |
| 764 | |
| 432 | |
| 674 | | |||||
Total Operating Profit | 7,529 | |
| 5,467 | |
| 7,668 | |
| 4,968 | |
| 7,034 | | |||||
Other Income and (Expense): |
|
|
|
|
|
|
|
|
| ||||||||||
Investment income | 72 | |
| 50 | |
| 15 | |
| 22 | |
| 20 | | |||||
Interest expense | (453 | ) |
| (381 | ) |
| (341 | ) |
| (353 | ) |
| (380 | ) | |||||
Income Before Income Taxes | 7,148 | |
| 5,136 | |
| 7,342 | |
| 4,637 | |
| 6,674 | | |||||
Income Tax Expense | 2,238 | |
| 1,705 | |
| 2,498 | |
| 1,605 | |
| 2,302 | | |||||
Net Income | $ | 4,910 | |
| $ | 3,431 | |
| $ | 4,844 | |
| $ | 3,032 | |
| $ | 4,372 | |
Per Share Amounts: |
|
|
|
|
|
|
|
|
| ||||||||||
Basic Earnings Per Share | $ | 5.64 | |
| $ | 3.89 | |
| $ | 5.38 | |
| $ | 3.31 | |
| $ | 4.65 | |
Diluted Earnings Per Share | $ | 5.61 | |
| $ | 3.87 | |
| $ | 5.35 | |
| $ | 3.28 | |
| $ | 4.61 | |
Dividends Declared Per Share | $ | 3.32 | |
| $ | 3.12 | |
| $ | 2.92 | |
| $ | 2.68 | |
| $ | 2.48 | |
Weighted Average Shares Outstanding: |
|
|
|
|
|
|
|
|
| ||||||||||
Basic | 871 | |
| 883 | |
| 901 | |
| 916 | |
| 940 | | |||||
Diluted | 875 | |
| 887 | |
| 906 | |
| 924 | |
| 948 | | |||||
|
|
|
|
|
|
|
|
|
| ||||||||||
| As of December 31, | ||||||||||||||||||
| 2017 |
| 2016 |
| 2015 |
| 2014 |
| 2013 | ||||||||||
Selected Balance Sheet Data: |
|
|
|
|
|
|
|
|
| ||||||||||
Cash and marketable securities | $ | 4,069 | |
| $ | 4,567 | |
| $ | 4,726 | |
| $ | 3,283 | |
| $ | 5,245 | |
Total assets | 45,403 | |
| 40,377 | |
| 38,311 | |
| 35,440 | |
| 35,553 | | |||||
Long-term debt | 20,278 | |
| 12,394 | |
| 11,316 | |
| 9,856 | |
| 10,824 | | |||||
Shareowners' equity | 1,030 | |
| 429 | |
| 2,491 | |
| 2,158 | |
| 6,488 | | |||||
20
Item 7. | Management's Discussion and Analysis of Financial Condition and Results of Operations |
Overview
We produced solid growth and operating results in 2017 across all operating segments. In 2017, consolidated revenue increased 8.2% to $65.872 billion , up from $60.906 billion in 2016. Revenue for 2017 increased in all segments and major product categories, due to shipment growth, yield expansion and benefits recognized from our network investments and portfolio initiatives. While operating profits were positively impacted by these growth factors discussed above, they were partially offset by impacts from natural disasters, capacity constraints due to volume surges in the fourth quarter of 2017, operating costs associated with facility construction and the deployment of Saturday operations in our U.S. Domestic Package segment.
Operating profit for 2017 was up 37.7% to $7.529 billion , driven by strong performance in all segments and a $1.851 billion reduction in the pension mark-to-market charges.
Average daily package volume increased 4.9% in 2017. We reported 2017 net income of $4.910 billion and diluted earnings per share of $5.61 , compared to 2016 net income of $3.431 billion and diluted earnings per share of $3.87 .
Our consolidated results are presented in the table below:
| Year Ended December 31, |
| % Change | ||||||||||||||
| 2017 |
| 2016 |
| 2015 |
| 2017/ 2016 |
| 2016/ 2015 | ||||||||
Revenue (in millions) | $ | 65,872 | |
| $ | 60,906 | |
| $ | 58,363 | |
| 8.2 | % |
| 4.4 | % |
Operating Expenses (in millions) | 58,343 | |
| 55,439 | |
| 50,695 | |
| 5.2 | % |
| 9.4 | % | |||
Operating Profit (in millions) | $ | 7,529 | |
| $ | 5,467 | |
| $ | 7,668 | |
| 37.7 | % |
| (28.7 | )% |
Operating Margin | 11.4 | % |
| 9.0 | % |
| 13.1 | % |
|
|
|
| |||||
Average Daily Package Volume (in thousands) | 20,030 | |
| 19,090 | |
| 18,324 | |
| 4.9 | % |
| 4.2 | % | |||
Average Revenue Per Piece | $ | 10.53 | |
| $ | 10.30 | |
| $ | 10.37 | |
| 2.2 | % |
| (0.7 | )% |
Net Income (in millions) | $ | 4,910 | |
| $ | 3,431 | |
| $ | 4,844 | |
| 43.1 | % |
| (29.2 | )% |
Basic Earnings Per Share | $ | 5.64 | |
| $ | 3.89 | |
| $ | 5.38 | |
| 45.0 | % |
| (27.7 | )% |
Diluted Earnings Per Share | $ | 5.61 | |
| $ | 3.87 | |
| $ | 5.35 | |
| 45.0 | % |
| (27.7 | )% |
21
UNITED PARCEL SERVICE, INC. AND SUBSIDIARIES
MANAGEMENT'S DISCUSSION AND ANALYSIS OF FINANCIAL CONDITION AND
RESULTS OF OPERATIONS
Items Affecting Comparability
The results and discussions that follow are reflective of how our executive management monitors the performance of our reporting segments. We supplement the reporting of our financial information determined under generally accepted accounting principles ("GAAP") with certain non-GAAP financial measures, including "adjusted" compensation and benefits, operating expenses, operating profit, operating margin, income tax expense and effective tax rate. These adjustments reflect the non-comparable items discussed below. We believe that these adjusted measures provide meaningful information to assist investors and analysts in understanding our financial results and assessing our prospects for future performance. We believe these adjusted financial measures are important indicators of our recurring results of operations because they exclude items that may not be indicative of, or are unrelated to, our underlying results of operations and provide a useful baseline for analyzing trends in our underlying businesses. Additionally, these adjusted financial measures are used internally by management for the determination of incentive compensation awards, business unit operating performance analysis and business unit resource allocation.
Non-GAAP financial measures should be considered in addition to, and not as an alternative for, our reported results prepared in accordance with GAAP. Our non-GAAP financial information does not represent a comprehensive basis of accounting. Therefore, our non-GAAP financial information may not be comparable to similarly titled measures reported by other companies.
We supplement the reporting of our revenue, revenue per piece and operating profit with similar non-GAAP measures that exclude the period-over-period impact of foreign currency exchange rate changes and hedging activities. We believe currency-neutral revenue, revenue per piece and operating profit information allows users of our financial statements to understand growth trends in our products and results. We evaluate the performance of our International Package and Supply Chain & Freight businesses on a currency-neutral basis.
Currency-neutral revenue, revenue per piece and operating profit are calculated by dividing current period reported U.S. dollar revenue, revenue per piece and operating profit by the current period average exchange rates to derive current period local currency revenue, revenue per piece and operating profit. The derived current period local currency revenue, revenue per piece and operating profit are then multiplied by the average foreign exchange rates used to translate the comparable results for each month in the prior year period (including the period over period impact of foreign currency revenue hedging activities). The difference between the current period reported U.S. dollar revenue, revenue per piece and operating profit and the derived current period U.S. dollar revenue, revenue per piece and operating profit is the period over period impact of currency fluctuations.
The year-over-year comparisons of our financial results are affected by the following items (in millions):
| Year Ended December 31, | ||||||||||
Non-GAAP Adjustments | 2017 |
| 2016 |
| 2015 | ||||||
Operating Expenses: |
|
|
|
|
| ||||||
Defined Benefit Plans Mark-to-Market Charges | $ | 800 | |
| $ | 2,651 | |
| $ | 118 | |
Total Adjustments to Operating Expenses | 800 | |
| 2,651 | |
| 118 | | |||
Income Tax Benefit from the Mark-to-Market Charges | (193 | ) |
| (978 | ) |
| (39 | ) | |||
Income Tax Benefit from the Tax Cuts and Jobs Act and Other Non-U.S. Tax Law Changes | (258 | ) |
| - | |
| - | | |||
Total Adjustments to Net Income | $ | 349 | |
| $ | 1,673 | |
| $ | 79 | |
These items have been excluded from comparisons of "adjusted" compensation and benefits, operating expenses, operating profit, operating margin, income tax expense and effective tax rate in the discussion that follows. The income tax effects of the mark-to-market charges are calculated by multiplying the statutory tax rates applicable in each tax jurisdiction, including the U.S. federal jurisdiction and various U.S. state and non-U.S. jurisdictions, by the adjustments. The blended average of the applicable statutory tax rates in 2017 , 2016 and 2015 were 24.1%, 36.9% and 33.1%, respectively.
22
UNITED PARCEL SERVICE, INC. AND SUBSIDIARIES
MANAGEMENT'S DISCUSSION AND ANALYSIS OF FINANCIAL CONDITION AND
RESULTS OF OPERATIONS
Defined Benefit Plans Mark-to-Market Charges
We recognize changes in the fair value of plan assets and net actuarial gains and losses in excess of a 10% corridor for our pension and postretirement defined benefit plans immediately as part of net periodic benefit cost. We supplement the presentation of our operating profit and operating margin with "adjusted" measures that exclude the impact of the portion of net periodic benefit cost represented by the gains and losses recognized in excess of the 10% corridor and the related income tax effects.
The adjustments made to exclude these mark-to-market adjustments utilize the expected return on plan assets ($2.956, $2.580 and $2.567 billion for 2017 , 2016 and 2015 , respectively) and the discount rates used for determining net periodic benefit cost. The non-adjusted net periodic benefit cost reflects the actual return on plan assets ($4.811 billion, $1.846 billion and $110 million for 2017 , 2016 and 2015 , respectively) and the discount rates used for measuring the projected benefit obligation as summarized in the table below. We believe excluding these mark-to-market charges from our adjusted results provides important supplemental information that reflects the anticipated long-term cost of our defined benefit plans and provides a benchmark for historical defined benefit cost trends that may provide a useful comparison of year-to-year financial performance without considering the short-term impact of changes in market interest rates, equity prices and similar factors.
In 2017 , we recognized pre-tax mark-to-market losses in compensation and benefits expense of $800 million on our pension and postretirement defined benefit plans related to the remeasurement of plan assets and liabilities recognized outside of a 10% corridor. These charges impacted our U.S. Domestic Package segment ($637 million), International Package segment ($35 million) and Supply Chain & Freight segment ($128 million).
In 2016 , we recognized pre-tax mark-to-market losses in compensation and benefits expense of $2.651 billion on our pension and postretirement defined benefit plans related to the remeasurement of plan assets and liabilities recognized outside of a 10% corridor. These charges impacted our U.S. Domestic Package segment ($1.908 billion), International Package segment ($425 million) and Supply Chain & Freight segment ($318 million).
In 2015 , we recognized pre-tax mark-to-market losses in compensation and benefits expense of $118 million on our pension and postretirement defined benefit plans related to the remeasurement of plan assets and liabilities recognized outside of a 10% corridor. These charges impacted our U.S. Domestic Package segment ($62 million), International Package segment ($44 million) and Supply Chain & Freight segment ($12 million).
The table below indicates the amounts associated with each component of the pre-tax mark-to-market losses, as well as the weighted-average actuarial assumptions used to determine our net periodic benefit costs, for each year:
|
| Year Ended December 31, | ||||||||||
Components of mark-to-market gain (loss) (in millions): |
| 2017 |
| 2016 |
| 2015 | ||||||
Discount rates |
| $ | (2,288 | ) |
| $ | (1,953 | ) |
| $ | 1,624 | |
Return on assets |
| 1,525 | |
| (732 | ) |
| (1,550 | ) | |||
Demographic and assumption changes |
| (37 | ) |
| 34 | |
| (133 | ) | |||
Reclassification of prior year unrecognized benefit cost |
| - | |
| - | |
| (59 | ) | |||
Total mark-to-market gain (loss) |
| $ | (800 | ) |
| $ | (2,651 | ) |
| $ | (118 | ) |
|
|
|
|
|
|
| ||||||
|
| Year Ended December 31, | ||||||||||
Weighted-average actuarial assumptions used to determine net periodic benefit cost: |
| 2017 |
| 2016 |
| 2015 | ||||||
Expected rate of return on plan assets |
| 8.65 | % |
| 8.65 | % |
| 8.66 | % | |||
Actual rate of return on plan assets |
| 14.25 | % |
| 6.06 | % |
| 0.37 | % | |||
Discount rate used for net periodic benefit cost |
| 4.34 | % |
| 4.81 | % |
| 4.36 | % | |||
Discount rate at measurement date |
| 3.81 | % |
| 4.34 | % |
| 4.81 | % | |||
The $800 million, $2.651 billion and $118 million pre-tax mark-to-market losses for the years ended December 31, 2017 , 2016 and 2015 , respectively, were comprised of the following components:
2017 - $800 million pre-tax mark-to-market loss:
23
UNITED PARCEL SERVICE, INC. AND SUBSIDIARIES
MANAGEMENT'S DISCUSSION AND ANALYSIS OF FINANCIAL CONDITION AND
RESULTS OF OPERATIONS
• | Discount Rates ($2.288 billion pre-tax loss): The weighted-average discount rate for our pension and postretirement medical plans decreased from 4.34% at December 31, 2016 to 3.81% at December 31, 2017, primarily due to both a decline in U.S. treasury yields and a decrease in credit spreads on AA-rated corporate bonds in 2017. |
• | Return on Assets ($1.525 billion pre-tax gain): In 2017, the actual 14.25% rate of return on plan assets exceeded our expected rate of return of 8.65%, primarily due to strong global equity and U.S. bond markets. |
• | Demographic and Assumption Changes ($37 million pre-tax loss): This represents the difference between actual and estimated participant data and demographic factors, including items such as healthcare cost trends, compensation rate increases and rates of termination, retirement and mortality. |
2016 - $2.651 billion pre-tax mark-to-market loss:
• | Discount Rates ($1.953 billion pre-tax loss): The weighted-average discount rate for our pension and postretirement medical plans decreased from 4.81% at December 31, 2015 to 4.34% at December 31, 2016 , primarily due to a decrease in credit spreads on AA-rated corporate bonds in 2016 . |
• | Return on Assets ($732 million pre-tax loss): In 2016, the actual 6.06% rate of return on plan assets fell short of our expected rate of return of 8.65%, primarily due to weak bond markets. |
• | Demographic and Assumption Changes ($34 million pre-tax gain): This represents the difference between actual and estimated participant data and demographic factors, including items such as healthcare cost trends, compensation rate increases and rates of termination, retirement and mortality. |
2015 - $118 million pre-tax mark-to-market loss:
• | Discount Rates ($1.624 billion pre-tax gain): The weighted-average discount rate for our pension and postretirement medical plans increased from 4.36% at December 31, 2014 to 4.81% at December 31, 2015 , primarily due to an increase in U.S. treasury yields and credit spreads on AA-rated corporate bonds in 2015 . |
• | Return on Assets ($1.550 billion pre-tax loss): In 2015, the actual 0.37% rate of return on plan assets fell short of our expected rate of return of 8.66%, primarily due to weak global equity markets. |
• | Demographic and Assumption Changes ($133 million pre-tax loss): This represents the difference between actual and estimated participant data and demographic factors, including items such as healthcare cost trends, compensation rate increases and rates of termination, retirement and mortality. |
• | Reclassification of Prior Year Unrecognized Benefit Cost ($59 million pre-tax loss): Our mark-to-market accounting policy requires recognition of gains and losses in excess of a corridor equal to 10% of the plans' projected benefit obligations (or fair value of the plans' assets, if greater). The decrease in certain plans' projected benefit obligations resulted in a lower corridor, which required recognition of prior year unrecognized benefit costs for some of our plans. |
Income Tax Benefit from the Tax Cuts and Jobs Act
We supplement the presentation of our income tax expense and effective tax rate with "adjusted" measures that exclude the impact of the income tax benefit from the Tax Cuts and Jobs Act (the "Tax Act") described in the "Income Tax Expense" section of Management's Discussion and Analysis and note 13 to the audited consolidated financial statements. We believe income tax expense and the effective tax rate excluding the tax benefit is useful in evaluating our ongoing operating performance for the current period to that of other periods presented. The estimates are based on our initial analysis and interpretations of the Tax Act.
Expense Allocations
Certain operating expenses are allocated between our reporting segments using activity-based costing methods. These activity-based costing methods require us to make estimates that impact the amount of each expense category that is attributed to each segment. Changes in these estimates will directly impact the amount of expense allocated to each segment, and therefore the operating profit of each reporting segment. Our allocation methodologies are refined periodically, as necessary, to reflect changes in our businesses. There were no significant changes in our expense allocation methodologies during 2017 , 2016 or 2015 .
24
UNITED PARCEL SERVICE, INC. AND SUBSIDIARIES
MANAGEMENT'S DISCUSSION AND ANALYSIS OF FINANCIAL CONDITION AND
RESULTS OF OPERATIONS
U.S. Domestic Package Operations
| Year Ended December 31, |
| % Change | ||||||||||||||
| 2017 |
| 2016 |
| 2015 |
| 2017/ 2016 |
| 2016/ 2015 | ||||||||
Average Daily Package Volume (in thousands): |
|
|
|
|
|
|
|
|
| ||||||||
Next Day Air | 1,460 | |
| 1,379 | |
| 1,316 | |
| 5.9 | % |
| 4.8 | % | |||
Deferred | 1,400 | |
| 1,351 | |
| 1,313 | |
| 3.6 | % |
| 2.9 | % | |||
Ground | 14,061 | |
| 13,515 | |
| 12,969 | |
| 4.0 | % |
| 4.2 | % | |||
Total Avg. Daily Package Volume | 16,921 | |
| 16,245 | |
| 15,598 | |
| 4.2 | % |
| 4.1 | % | |||
Average Revenue Per Piece: |
|
|
|
|
|
|
|
|
| ||||||||
Next Day Air | $ | 19.11 | |
| $ | 19.20 | |
| $ | 19.66 | |
| (0.5 | )% |
| (2.3 | )% |
Deferred | 12.43 | |
| 11.85 | |
| 11.70 | |
| 4.9 | % |
| 1.3 | % | |||
Ground | 8.19 | |
| 7.97 | |
| 7.98 | |
| 2.8 | % |
| (0.1 | )% | |||
Total Avg. Revenue Per Piece | $ | 9.48 | |
| $ | 9.25 | |
| $ | 9.28 | |
| 2.5 | % |
| (0.3 | )% |
Operating Days in Period | 254 | |
| 255 | |
| 254 | |
|
|
|
| |||||
Revenue (in millions): |
|
|
|
|
|
|
|
|
| ||||||||
Next Day Air | $ | 7,088 | |
| $ | 6,752 | |
| $ | 6,570 | |
| 5.0 | % |
| 2.8 | % |
Deferred | 4,421 | |
| 4,082 | |
| 3,903 | |
| 8.3 | % |
| 4.6 | % | |||
Ground | 29,255 | |
| 27,467 | |
| 26,274 | |
| 6.5 | % |
| 4.5 | % | |||
Total Revenue | $ | 40,764 | |
| $ | 38,301 | |
| $ | 36,747 | |
| 6.4 | % |
| 4.2 | % |
Operating Expenses (in millions): |
|
|
|
|
|
|
|
|
| ||||||||
Operating Expenses | $ | 36,484 | |
| $ | 35,284 | |
| $ | 31,980 | |
| 3.4 | % |
| 10.3 | % |
Defined Benefit Plans Mark-to-Market Charges | (637 | ) |
| (1,908 | ) |
| (62 | ) |
|
|
|
| |||||
Adjusted Operating Expenses | $ | 35,847 | |
| $ | 33,376 | |
| $ | 31,918 | |
| 7.4 | % |
| 4.6 | % |
Operating Profit (in millions) and Operating Margin: |
|
|
|
|
|
|
|
|
| ||||||||
Operating Profit | $ | 4,280 | |
| $ | 3,017 | |
| $ | 4,767 | |
| 41.9 | % |
| (36.7 | )% |
Adjusted Operating Profit | $ | 4,917 | |
| $ | 4,925 | |
| $ | 4,829 | |
| (0.2 | )% |
| 2.0 | % |
Operating Margin | 10.5 | % |
| 7.9 | % |
| 13.0 | % |
|
|
|
| |||||
Adjusted Operating Margin | 12.1 | % |
| 12.9 | % |
| 13.1 | % |
|
|
|
| |||||
Revenue
The change in overall revenue was impacted by the following factors for the years ended December 31, 2017 and 2016 , compared with the corresponding prior year periods:
| Volume |
| Rates / Product Mix |
| Fuel Surcharge |
| Total Revenue Change | ||||
Revenue Change Drivers: |
|
|
|
|
|
|
| ||||
2017/ 2016 | 3.8 | % |
| 1.7 | % |
| 0.9 | % |
| 6.4 | % |
2016/ 2015 | 4.6 | % |
| 0.2 | % |
| (0.6 | )% |
| 4.2 | % |
25
UNITED PARCEL SERVICE, INC. AND SUBSIDIARIES
MANAGEMENT'S DISCUSSION AND ANALYSIS OF FINANCIAL CONDITION AND
RESULTS OF OPERATIONS
Volume
2017 compared to 2016
Our overall volume increased across all products in 2017, largely due to continued growth in overall retail sales, of which e-commerce continues to represent a larger percentage of the total growth. Business-to-consumer shipments, which represented more than 50% of total U.S. Domestic Package volume, grew 9.3% for the year, which drove increases in both air and ground shipments. Business-to-business shipments decreased slightly in 2017 compared to 2016 largely due to declines in volume in professional services, as a result of increased digitization, and high tech industries.
Among our air products, volume increased in 2017 for our Next Day Air and Deferred services. Solid air volume growth continued for those products most aligned with business-to-consumer shipping, including our residential Next Day Air, Next Day Air Saver and Three Day Select package products, as consumers continue to demand faster options. This growth was slightly offset by a decline in Next Day Air letter volume, largely due to declines in the professional services industry as a result of continued growth in digitization.
The increase in ground volume in 2017 was driven by growth in residential ground and SurePost volume, which benefited from continued e-commerce demand. Business-to-business shipments decreased slightly due to adverse weather conditions in third quarter 2017 however this decrease was partially offset by an increase in our return shipping services.
2016 compared to 2015
Our total volume increased across all products in 2016, largely due to continued growth in e-commerce and overall retail sales and the impact of one additional operating day. Business-to-consumer shipments, which represented more than 48% of total U.S. Domestic Package volume, grew nearly 9% for the year and 11.5% in the fourth quarter, which drove increases in both air and ground shipments. Business-to-business volume remained flat in 2016 due to revenue management initiatives and the overall slowing of the industrial manufacturing sector, offset by increased volume from the retail industry, including the use of our solutions for omni-channel (including ship-from-store and ship-to-store models) and returns shipping.
Next Day Air volume increased 5.2% in 2016, due to strong growth in e-commerce. We also experienced increased volume for our deferred air services in 2016, particularly for those products most aligned with business-to-consumer shipping, such as our residential Second Day Air Package and Three Day Select products partially offset by decreases in our business-to-business deferred air volume.
The increase in ground volume in 2016 was driven by growth in residential ground and SurePost volume while business-to-business shipments remained flat. Accelerating growth in e-commerce drove demand for our SurePost service, with volume increasing 19% in 2016.
Rates and Product Mix
2017 compared to 2016
Overall revenue per piece increased 2.5% in 2017, and was impacted by changes in base rates, customer and product mix and fuel surcharge rates.
Revenue per piece for ground and air products was positively impacted by a base rate increase on December 26, 2016. UPS Ground rates and UPS Air services rates increased an average net 4.9%. Effective January 8, 2017, we changed the dimensional weight calculation for packages subject to UPS daily rates. On June 19, 2017, we announced a new peak charge applicable during selected weeks in November and December 2017 for U.S. Residential, Large Packages and packages Over Maximum Limits. The new charge is designed to enable UPS to continue to offset some of the additional expenses incurred during significant volume surges. Additionally on October 25, 2017, we announced an average 4.9% base rate increase effective December 24, 2017 for UPS Ground and UPS Air services.
In the first quarter of 2017, we began our expanded Saturday ground operations to several metropolitan areas in the U.S. As of December 2017, Saturday service is available in approximately 4,700 cities and towns in the U.S. covering approximately 50% of the population. A Saturday pickup stop charge went into effect on May 1, 2017 and varies depending on the pickup service selected.
26
UNITED PARCEL SERVICE, INC. AND SUBSIDIARIES
MANAGEMENT'S DISCUSSION AND ANALYSIS OF FINANCIAL CONDITION AND
RESULTS OF OPERATIONS
Revenue per piece for our Next Day Air services decreased in 2017 compared with 2016. The decrease in Next Day Air revenue per piece was primarily driven by a shift in product mix, as our lower yielding products experienced much larger volume growth than our higher yielding products. This shift was offset slightly by an increase in the average billable weight per piece. Revenue per piece of our deferred air services increased in 2017 compared with 2016. Deferred revenue per piece increased primarily due to an increase in average billable weight per piece, but was partially offset by an unfavorable shift in product mix. All products were positively impacted by higher fuel surcharge rates for 2017.
Ground revenue per piece increased in 2017, primarily due to base rate increases, higher fuel surcharge rates and an increase in average billable weight per piece. These factors were partially offset by changes in product mix, as we experienced faster volume growth in our SurePost product.
2016 compared to 2015
Overall revenue per piece decreased 0.3% in 2016, and was impacted by changes in base rates, customer and product mix and fuel surcharge rates.
Ground revenue per piece decreased in 2016, primarily due to customer and product mix changes, which adversely impacted revenue per piece as a greater portion of volume in 2016, relative to 2015, came from residential customers and lighter-weight shipments as SurePost volume surged. Additionally, lower fuel surcharge rates contributed to the decline. These drivers more than offset the rate actions taken since the fourth quarter of 2015.
Revenue per piece for Next Day Air products declined in 2016, while our deferred air products increased. All products were negatively impacted by lower fuel surcharge rates. The Next Day Air revenue per piece decline was caused by a shift in customer and product mix as well as an increase in lighter-weight packages. We experienced relatively stronger growth in our lighter-weight business-to-consumer shipments, particularly our Next Day Air Saver product, which have lower average yields than our heavier-weight commercial shipments. Customer mix also adversely impacted Next Day Air revenue per piece, due to faster volume growth among our larger customers, which have a lower average yield than our small and middle-market customers. Deferred revenue per piece increased primarily due to heavier-weight packages partially offset by product mix.
Revenue per piece for ground and air products was positively impacted by a base rate increase on December 28, 2015. UPS Ground rates and accessorial charges increased an average net 4.9%, while UPS Air services and accessorial charges increased an average net 5.2%. The surcharge increased for Over Maximum Packages and the index tables for the Ground and Air fuel surcharges were adjusted effective November 2, 2015. A charge for UPS's Third-Party Billing Service was implemented, effective January 4, 2016. Additionally, the dimensions of ground packages incurring the UPS Additional Handling charge were changed effective June 6, 2016.
Fuel Surcharges
UPS applies a fuel surcharge on our domestic air and ground services. The air fuel surcharge is based on the U.S. Department of Energy's ("DOE") Gulf Coast spot price for a gallon of kerosene-type jet fuel, while the ground fuel surcharge is based on the DOE's On-Highway Diesel Fuel Price. Based on published rates, the average fuel surcharge rates for domestic air and ground products were as follows:
| Year Ended December 31, |
| % Point Change | |||||||||||
| 2017 |
| 2016 |
| 2015 |
| 2017/ 2016 |
| 2016/ 2015 | |||||
Next Day Air / Deferred | 5.2 | % |
| 3.6 | % |
| 4.8 | % |
| 1.6 | % |
| (1.2 | )% |
Ground | 5.6 | % |
| 4.9 | % |
| 5.5 | % |
| 0.7 | % |
| (0.6 | )% |
Effective February 6, 2017, the U.S. fuel surcharge rates are reset weekly instead of monthly. In addition, the price indices have moved from a two month to a two week lag.
Total domestic fuel surcharge revenue increased by $347 million in 2017 as a result of higher fuel surcharge rates caused by an increase in jet and diesel fuel prices, as well as an overall increase in package volume. In addition to the factors above, fuel surcharge revenue was positively impacted by changes to the fuel surcharge calculation, as rates and price indices are updated more frequently to better align with prevailing market rates. In 2016, total fuel surcharge revenue decreased by $219 million as a result of lower fuel surcharge rates caused by declining jet and diesel fuel prices, partially offset by the overall increase in package volume for the period.
27
UNITED PARCEL SERVICE, INC. AND SUBSIDIARIES
MANAGEMENT'S DISCUSSION AND ANALYSIS OF FINANCIAL CONDITION AND
RESULTS OF OPERATIONS
Operating Expenses
2017 compared to 2016
Operating expenses for the period increased $1.2 billion, which included a $1.3 billion decrease in mark-to-market pension charges. Excluding the impact of the defined benefit plan mark-to-market charges, adjusted operating expenses for the segment increased $2.5 billion in 2017, primarily due to pickup and delivery costs (up $1.0 billion), the cost of operating our domestic integrated air and ground network (up $922 million), the costs of package sorting (up $246 million) and accessorials and indirect operating costs (up $279 million). These increases were driven primarily by overall volume growth in 2017. Adjusted operating expenses were impacted by several factors:
• | We incurred higher employee compensation, largely resulting from volume growth, an increase in average daily union labor hours (up 6.5%), growth in the overall size of the workforce and an increase in wage rates. |
• | Employee benefit costs increased, largely due to increased employee healthcare, partially offset by a decrease in pension expense and workers' compensation expense. |
• | We incurred higher fuel expense in 2017 primarily due to higher fuel prices and increased volume which resulted in higher fuel usage (increase in aircraft block hours of 7.0% and package delivery miles driven of 4.1%). |
• | We incurred higher costs associated with outside contract carriers, primarily due to volume growth (including SurePost), higher fuel surcharges passed to us by carriers and general rate increases. |
Total cost per piece decreased 0.3% in 2017 compared to 2016 and was primarily impacted by a 380 basis point decrease due to the defined benefit plan mark-to-market charge offset by the cost increases described previously. The increased expenses in 2017 were also driven by: capacity constraints due to volume surges in the fourth quarter of 2017, start-up costs of several investments underway to further expand and modernize our air and ground networks, and the costs of implementing Saturday operations. Costs were further impacted by rising fuel prices. In order to contain costs, we continually adjust our air and ground networks to better match higher volume levels. In addition, we continue to deploy and utilize technology to increase package sorting and delivery productivity.
2016 compared to 2015
Operating expenses for the period increased $3.3 billion, which included a $1.8 billion increase in mark-to-market pension charges. Excluding the impact of the defined benefit plan mark-to-market charges, adjusted operating expenses for the segment increased $1.5 billion in 2016, primarily due to pickup and delivery costs (up $814 million), the cost of operating our domestic integrated air and ground transportation network (up $282 million), the costs of package sorting (up $181 million) and accessorials and indirect operating costs (up $180 million). Adjusted operating expenses were impacted by several factors:
• | We incurred higher employee compensation, largely resulting from an increase in average daily union labor hours (up 4.2%) and growth in the overall size of the workforce partially offset by lower wage rates. |
• | Employee benefit costs increased, largely due to increased employee healthcare, pension expense and workers' compensation expense. |
• | We incurred lower fuel expense in 2016 primarily due to lower fuel prices and an increase in average miles per gallon. This was partially offset by higher fuel usage (due to an increase in aircraft block hours and vehicle miles driven.) |
• | We incurred higher expenses for purchased transportation due to higher volume, partially offset by lower fuel surcharge rates passed to us from third-party carriers. |
Total cost per piece increased 5.5% in 2016 compared to 2015 and was primarily impacted by a 540 basis point increase due to the defined benefit plan mark-to-market charge and the cost increases described previously. These increases were partially offset by the continued deployment of ORION, which has contained the growth of average daily vehicle miles driven, and the increased redirect of SurePost volume to optimize delivery density on UPS vehicles, which has reduced the delivery costs for business-to-consumer shipments.
28
UNITED PARCEL SERVICE, INC. AND SUBSIDIARIES
MANAGEMENT'S DISCUSSION AND ANALYSIS OF FINANCIAL CONDITION AND
RESULTS OF OPERATIONS
Operating Profit and Margin
2017 compared to 2016
Operating profit increased $1.3 billion in 2017 compared with 2016, primarily due to a $1.3 billion decrease in mark-to-market pension charges to operating expense. Operating margin increased 260 basis points to 10.5%. Adjusted operating profit decreased $8 million in 2017 compared with 2016, while the adjusted operating margin decreased 80 basis points to 12.1%. Operating profit was negatively impacted by an increase in continued investments in new buildings and new strategic investments including deployment of Saturday operations. There was an adverse impact from higher purchased transportation costs due to volume surges in the fourth quarter 2017 and from fuel as expense increased at a faster pace than fuel surcharge revenue.
2016 compared to 2015
Operating profit decreased $1.8 billion in 2016 compared with 2015, primarily due to a $1.8 billion increase in mark-to-market pension charges to operating expense. Operating margin decreased 510 basis points to 7.9%. Adjusted operating profit increased $96 million in 2016 compared with 2015, while the adjusted operating margin decreased 20 basis points to 12.9%. Revenue growth from increased volume and enhanced productivity through the continued deployment of ORION technology resulted in higher operating profit, but was offset by an unfavorable shift in customer and product mix, especially in the fourth quarter. The net impact of fuel also negatively impacted operating profit as fuel surcharge revenue decreased faster than fuel expense.
29
UNITED PARCEL SERVICE, INC. AND SUBSIDIARIES
MANAGEMENT'S DISCUSSION AND ANALYSIS OF FINANCIAL CONDITION AND
RESULTS OF OPERATIONS
International Package Operations
| Year Ended December 31, |
| % Change | ||||||||||||||||
| 2017 |
| 2016 |
| 2015 |
| 2017/ 2016 |
| 2016/ 2015 | ||||||||||
Average Daily Package Volume (in thousands): |
|
|
|
|
|
|
|
|
| ||||||||||
Domestic | 1,714 | |
| 1,635 | |
| 1,575 | |
| 4.8 | % |
| 3.8 | % | |||||
Export | 1,395 | |
| 1,210 | |
| 1,151 | |
| 15.3 | % |
| 5.1 | % | |||||
Total Avg. Daily Package Volume | 3,109 | |
| 2,845 | |
| 2,726 | |
| 9.3 | % |
| 4.4 | % | |||||
Average Revenue Per Piece: |
|
|
|
|
|
|
|
|
| ||||||||||
Domestic | $ | 6.08 | |
| $ | 5.85 | |
| $ | 6.06 | |
| 3.9 | % |
| (3.5 | )% | ||
Export | 28.69 | |
| 30.38 | |
| 31.10 | |
| (5.6 | )% |
| (2.3 | )% | |||||
Total Avg. Revenue Per Piece | $ | 16.22 | |
| $ | 16.29 | |
| $ | 16.63 | |
| (0.4 | )% |
| (2.0 | )% | ||
Operating Days in Period | 254 | |
| 255 | |
| 254 | |
|
|
|
| |||||||
Revenue (in millions): |
|
|
|
|
|
|
|
|
| ||||||||||
Domestic | $ | 2,645 | |
| $ | 2,441 | |
| $ | 2,425 | |
| 8.4 | % |
| 0.7 | % | ||
Export | 10,167 | |
| 9,374 | |
| 9,092 | |
| 8.5 | % |
| 3.1 | % | |||||
Cargo & Other | 526 | |
| 535 | |
| 632 | |
| (1.7 | )% |
| (15.3 | )% | |||||
Total Revenue | $ | 13,338 | |
| $ | 12,350 | |
| $ | 12,149 | |
| 8.0 | % |
| 1.7 | % | ||
Operating Expenses (in millions): |
|
|
|
|
|
|
|
|
| ||||||||||
Operating Expenses | $ | 10,874 | |
| $ | 10,306 | |
| $ | 10,012 | |
| 5.5 | % |
| 2.9 | % | ||
Defined Benefit Plan Mark-to-Market Charges | (35 | ) |
| (425 | ) |
| (44 | ) |
|
|
|
| |||||||
Adjusted Operating Expenses | $ | 10,839 | |
| $ | 9,881 | |
| $ | 9,968 | |
| 9.7 | % |
| (0.9 | )% | ||
Operating Profit (in millions) and Operating Margin: |
|
|
|
|
|
|
|
|
| ||||||||||
Operating Profit | $ | 2,464 | |
| $ | 2,044 | |
| $ | 2,137 | |
| 20.5 | % |
| (4.4 | )% | ||
Adjusted Operating Profit | $ | 2,499 | |
| $ | 2,469 | |
| $ | 2,181 | |
| 1.2 | % |
| 13.2 | % | ||
Operating Margin | 18.5 | % |
| 16.6 | % |
| 17.6 | % |
|
|
|
| |||||||
Adjusted Operating Margin | 18.7 | % |
| 20.0 | % |
| 18.0 | % |
|
|
|
| |||||||
Currency Translation Benefit / (Cost)-(in millions)*: |
|
|
|
|
|
|
|
|
| ||||||||||
Revenue |
|
|
|
|
|
| $ | (325 | ) |
| $ | (138 | ) | ||||||
Operating Expenses |
|
|
|
|
|
| (50 | ) |
| 146 | | ||||||||
Operating Profit |
|
|
|
|
|
| $ | (375 | ) |
| $ | 8 | | ||||||
* | Net of currency hedging; amount represents the change compared to the prior year. |
Revenue
The change in overall revenue was impacted by the following factors for the years ended December 31, 2017 and 2016 , compared with the corresponding prior year periods:
| Volume |
| Rates / Product Mix |
| Fuel Surcharge |
| Currency |
| Total Revenue Change | |||||
Revenue Change Drivers: |
|
|
|
|
|
|
|
|
| |||||
2017/ 2016 | 8.9 | % |
| (0.9 | )% |
| 2.6 | % |
| (2.6 | )% |
| 8.0 | % |
2016/ 2015 | 4.8 | % |
| (1.2 | )% |
| (0.8 | )% |
| (1.1 | )% |
| 1.7 | % |
30
UNITED PARCEL SERVICE, INC. AND SUBSIDIARIES
MANAGEMENT'S DISCUSSION AND ANALYSIS OF FINANCIAL CONDITION AND
RESULTS OF OPERATIONS
Volume
2017 compared to 2016
Our overall average daily volume increased in 2017, largely due to continued strength in business-to-consumer volume, as well as strong demand from several sectors including retail, industrial manufacturing, high-tech and healthcare.
We continued to experience export volume growth in 2017. The growth was mainly driven by our European, Asian and U.S. operations, which experienced increases in volume to major trade lanes of the world. European export volume increased in 2017, with growth in all trade lanes. Asia export volume also increased in 2017, with particular strength in Asia-to-U.S., Asia-to-Americas and intra-Asia trade lanes. Export volume into the U.S. grew in all trade lanes, led by Europe and the Americas. Export volume growth was strong across all major products, with a continued shift towards our premium express products, such as Worldwide Express and Transborder Express services.
The increase in domestic growth in 2017 was primarily due to growth in Turkey, Germany, France, Italy and U.K.
2016 compared to 2015
Our overall average daily volume increased in 2016, largely due to continued strength in business-to-consumer volume, as well as strong demand from several sectors including retail, industrial manufacturing, high-tech and healthcare.
We continued to experience export volume growth in 2016. The growth was mainly driven by our European and Asian operations, which experienced increases in volume to all regions of the world. European export volume increased in 2016, with particular strength in the Europe-to-U.S. and intra-Europe trade lanes. Asia export volume also increased in 2016, with growth in all trade lanes. However, U.S. export volume declined largely due to the impact of the stronger U.S. Dollar. Export volume growth was distributed across all products led by our Worldwide Express product.
The increase in domestic volume in 2016 was primarily due to growth in Italy, France, Turkey and Mexico.
Rates and Product Mix
2017 compared to 2016
Total average revenue per piece decreased 0.4% in 2017, impacted by a 250 basis point reduction from currency and a shift in product mix. These factors were partially offset by an increase in fuel surcharge rates as well as an increase in base rates.
On December 26, 2016, we implemented an average 4.9% net increase in base and accessorial rates for international shipments originating in the United States. Rate changes for shipments originating outside the U.S. are made throughout the year and vary by geographic markets. Effective September 17, 2017, a peak surcharge was applied to any shipment originating from China or Hong Kong to the United States for certain service levels during the peak period. The surcharge was applied as a rate per pound based upon the billable weight of the shipment. Additionally, on October 25, 2017, we announced an average 4.9% net increase in base and accessorial rates for international shipping originating in the United States; changes became effective on December 24, 2017.
Export revenue per piece decreased 5.6% in 2017, impacted by a 320 basis point reduction from currency and product mix. This was partially offset by an increase in fuel surcharges, an increase in base rates and strong volume growth in premium products.
Domestic revenue per piece increased 3.9% in 2017, impacted by a 50 basis point increase from currency, increase in base rates and higher fuel surcharges.
2016 compared to 2015
Total average revenue per piece decreased 2.0% in 2016, impacted by a 110 basis point reduction from currency as well as lower fuel surcharge rates. These factors were partially offset by an increase in base rates, lower discounts and a shift in product mix as the growth in premium products continued to exceed the growth in our standard products.
31
UNITED PARCEL SERVICE, INC. AND SUBSIDIARIES
MANAGEMENT'S DISCUSSION AND ANALYSIS OF FINANCIAL CONDITION AND
RESULTS OF OPERATIONS
On December 28, 2015, we implemented an average 5.2% net increase in base and accessorial rates for international shipments originating in the United States (Worldwide Express, Worldwide Saver, UPS Worldwide Expedited and UPS International Standard service). On November 2, 2015, the surcharge increased for Over Maximum Packages and the tables for Ground, Air and International fuel surcharges were adjusted. Rate changes for shipments originating outside the U.S. are made throughout the year and vary by geographic market.
Export revenue per piece decreased 2.3% in 2016, impacted by a 50 basis point reduction from currency as well as lower fuel surcharge rates. These factors were partially offset by an increase in base rates, lower discounts and favorable package weight and characteristics.
Domestic revenue per piece decreased 3.5% in 2016, impacted by a 380 basis point reduction from currency as well as lower fuel surcharge rates. These factors were partially offset by an increase in base rates.
Fuel Surcharges
We maintain fuel surcharges on our international air and ground services. The fuel surcharges for international air products originating inside or outside the United States are indexed to the DOE's Gulf Coast spot price for a gallon of kerosene-type jet fuel, while the fuel surcharges for ground products originating outside the United States are indexed to fuel prices in the international region or country where the shipment takes place.
Total international fuel surcharge revenue increased by $325 million in 2017, primarily due to volume increases, higher fuel prices and pricing changes made to base freight rates and to the fuel surcharge indices from a two month lag to a two week lag. Total international fuel surcharge revenue decreased by $119 million in 2016, primarily due to price reductions in the fuel surcharge indices; however, this was partially offset by an increase in volume and changes in mix.
Operating Expenses
2017 compared to 2016
Overall operating expenses increased by $568 million, which included a $390 million decrease in mark-to-market pension charges. Excluding the impact of the defined benefit plan mark-to-market charges, adjusted operating expenses for the segment increased $958 million in 2017 primarily due to increased volumes, higher fuel usage and currency fluctuations.
Operating expenses were impacted by changes in the cost of operating our international integrated air and ground network, which increased $418 million, as well as pickup and delivery costs, which increased $280 million. The increase in network costs was largely driven by volume growth in our Express products, which drove a 3.0% increase in aircraft block hours and higher fuel usage. Additionally, the increase in pickup and delivery costs is due to increased volume. Operating expenses were also impacted in 2017 by a $260 million increase in indirect overhead and package sorting costs and other costs.
2016 compared to 2015
Overall operating expenses increased by $294 million, which included a $381 million increase in mark-to-market pension charges. Excluding the impact of the defined benefit plan mark-to-market charges, adjusted operating expenses for the segment decreased $87 million in 2016 primarily due to currency exchange rate movements and lower fuel expense.
Operating expenses were impacted by changes in the cost of operating our international integrated air and ground network, which decreased $40 million, as well as pickup and delivery costs, which decreased $143 million. The decreases in network and pickup and delivery costs were largely due to the impact of currency exchange rate movements and lower fuel expense. Network cost reductions were somewhat offset by an increase in aircraft block hours (up 1.2% in 2016), driven by a 5.1% increase in international export volume and continuing air product service enhancements.
Operating expenses were also impacted in 2016 by a $96 million increase in indirect overhead, package sorting costs and other gains and losses. The total cost per piece for the segment decreased 1.8% in 2016.
32
UNITED PARCEL SERVICE, INC. AND SUBSIDIARIES
MANAGEMENT'S DISCUSSION AND ANALYSIS OF FINANCIAL CONDITION AND
RESULTS OF OPERATIONS
Operating Profit and Margin
2017 compared to 2016
Operating profit increased $420 million in 2017 compared with 2016, which included a $390 million decrease in operating expenses due to mark-to-market pension adjustments. Operating margin increased 190 basis points to 18.5%. Adjusted operating profit increased by $30 million in 2017, while the adjusted operating margin decreased 130 basis points to 18.7%. Operating margin was affected by negative currency exchange movements due to volatility of both hedged and unhedged currencies. Included in adjusted operating profit is a $375 million decrease due to currency.
2016 compared to 2015
Operating profit decreased $93 million in 2016 compared with 2015, which included a $381 million increase in operating expenses due to mark-to-market pension adjustments. Operating margin decreased 100 basis points to 16.6%. Adjusted operating profit increased by $288 million in 2016, while the adjusted operating margin increased 200 basis points to 20.0%. Operating profit and margin were positively affected by several factors including base rate increases, modifications to the fuel surcharge indices and currency exchange rate movements (including currency hedging gains).
33
UNITED PARCEL SERVICE, INC. AND SUBSIDIARIES
MANAGEMENT'S DISCUSSION AND ANALYSIS OF FINANCIAL CONDITION AND
RESULTS OF OPERATIONS
Supply Chain & Freight Operations
| Year Ended December 31, |
| % Change | ||||||||||||||||
| 2017 |
| 2016 |
| 2015 |
| 2017/ 2016 |
| 2016/ 2015 | ||||||||||
Freight LTL Statistics: |
|
|
|
|
|
|
|
|
| ||||||||||
Revenue (in millions) | $ | 2,596 | |
| $ | 2,384 | |
| $ | 2,479 | |
| 8.9 | % |
| (3.8 | )% | ||
Revenue Per Hundredweight | $ | 24.08 | |
| $ | 23.44 | |
| $ | 22.94 | |
| 2.7 | % |
| 2.2 | % | ||
Shipments (in thousands) | 10,203 | |
| 9,954 | |
| 10,433 | |
| 2.5 | % |
| (4.6 | )% | |||||
Shipments Per Day (in thousands) | 40.5 | |
| 39.3 | |
| 41.2 | |
| 3.1 | % |
| (4.6 | )% | |||||
Gross Weight Hauled (in millions of lbs) | 10,782 | |
| 10,167 | |
| 10,808 | |
| 6.0 | % |
| (5.9 | )% | |||||
Weight Per Shipment (in lbs) | 1,057 | |
| 1,021 | |
| 1,036 | |
| 3.5 | % |
| (1.4 | )% | |||||
Operating Days in Period | 252 | |
| 253 | |
| 253 | |
|
|
|
| |||||||
Revenue (in millions): |
|
|
|
|
|
|
|
|
| ||||||||||
Forwarding and Logistics | $ | 7,981 | |
| $ | 6,793 | |
| $ | 5,900 | |
| 17.5 | % |
| 15.1 | % | ||
Freight | 2,998 | |
| 2,736 | |
| 2,881 | |
| 9.6 | % |
| (5.0 | )% | |||||
Other | 791 | |
| 726 | |
| 686 | |
| 9.0 | % |
| 5.8 | % | |||||
Total Revenue | $ | 11,770 | |
| $ | 10,255 | |
| $ | 9,467 | |
| 14.8 | % |
| 8.3 | % | ||
Operating Expenses (in millions): |
|
|
|
|
|
|
|
|
| ||||||||||
Operating Expenses | $ | 10,985 | |
| $ | 9,849 | |
| $ | 8,703 | |
| 11.5 | % |
| 13.2 | % | ||
Defined Benefit Plans Mark-to-Market Charges | (128 | ) |
| (318 | ) |
| (12 | ) |
|
|
| | |||||||
Adjusted Operating Expenses | $ | 10,857 | |
| $ | 9,531 | |
| $ | 8,691 | |
| 13.9 | % |
| 9.7 | % | ||
Operating Profit (in millions) and Operating Margins: |
|
|
|
|
|
|
|
|
| ||||||||||
Operating Profit | $ | 785 | |
| $ | 406 | |
| $ | 764 | |
| 93.3 | % |
| (46.9 | )% | ||
Adjusted Operating Profit | $ | 913 | |
| $ | 724 | |
| $ | 776 | |
| 26.1 | % |
| (6.7 | )% | ||
Operating Margin | 6.7 | % |
| 4.0 | % |
| 8.1 | % |
|
|
|
| |||||||
Adjusted Operating Margin | 7.8 | % |
| 7.1 | % |
| 8.2 | % |
|
|
|
| |||||||
Currency Translation Benefit / (Cost)-(in millions)*: |
|
|
|
|
|
|
|
|
| ||||||||||
Revenue |
|
|
|
|
|
| $ | 10 | |
| $ | (56 | ) | ||||||
Operating Expenses |
|
|
|
|
|
| (12 | ) |
| 59 | | ||||||||
Operating Profit |
|
|
|
|
|
| $ | (2 | ) |
| $ | 3 | | ||||||
* | Amount represents the change compared to the prior year. |
In December 2016, we acquired Marken, a global provider of supply chain solutions to the life sciences industry and leader in clinical trials, material storage and distribution. Marken's financial results are included in the above table within Forwarding and Logistics from the date of the acquisition and have impacted the year-over-year comparability of revenue, operating expenses and operating profit for the years ended December 31, 2017 and 2016.
In August 2015, we acquired Coyote, a truckload freight brokerage company. Coyote's financial results are included in the above table within Forwarding and Logistics from the date of the acquisition, which has impacted the year-over-year comparability of revenue, operating expenses and operating profit for the years ended December 31, 2016 and 2015.
34
UNITED PARCEL SERVICE, INC. AND SUBSIDIARIES
MANAGEMENT'S DISCUSSION AND ANALYSIS OF FINANCIAL CONDITION AND
RESULTS OF OPERATIONS
Revenue
2017 compared to 2016
Total revenue for the Supply Chain & Freight segment increased $1.515 billion in 2017 compared to 2016 .
Forwarding and Logistics revenue increased $1.188 billion in 2017 compared with 2016 , primarily due to increased truckload brokerage freight volume movement and tonnage increases in our international air freight and North American air freight forwarding businesses. The volume and tonnage increases were driven by improving overall market demand. Revenue for our logistics products increased in 2017 due to growth in mail services, healthcare, retail and aerospace solutions, offset by declines among our high tech customers. Additionally, the Marken acquisition on December 21, 2016 contributed to the increase in revenue. Revenue was positively impacted by currency exchange rate movements.
UPS Freight revenue increased $262 million in 2017 compared to 2016 , driven by increases in shipments and weight per shipment. These increases were impacted by an overall improvement in market demand and customer mix. LTL revenue per hundredweight increased slightly as LTL base rate increases, averaging 4.9%, took effect September 19, 2016. Additionally, effective June 26, 2017, LTL base rates increased by an additional 4.9% for certain shipments in the U.S., Canada and Mexico. Fuel surcharge revenue also increased $70 million due to changes in overall LTL shipment volume and diesel fuel prices.
Revenue for the other businesses within Supply Chain & Freight increased $65 million in 2017 due to revenue growth at UPS Capital Corporation and UPS Customer Solutions, as well as service contracts with the U.S. Postal Service.
2016 compared to 2015
Total revenue for the Supply Chain & Freight segment increased $788 million in 2016 compared to 2015.
Forwarding and Logistics revenue increased $893 million in 2016 compared with 2015, primarily due to the Coyote acquisition midway through the third quarter of 2015, offset by a combination of volume and tonnage declines in our North American air freight and international air freight businesses (impacted by management focus to reduce lower-yielding accounts and softer market conditions). Additionally, revenue was adversely impacted by currency exchange rate movements and lower fuel surcharge rates (due to declining fuel prices). Revenue for our logistics products increased in 2016 as there was growth in our mail services and retail, aerospace, healthcare and automotive solutions.
UPS Freight revenue decreased $145 million in 2016 compared with 2015, driven by lower tonnage (down 5.9% from 2015) and a $73 million decrease in fuel surcharge revenue due to lower diesel fuel prices. The decline in shipments and the reduction in the weight per shipment were impacted by revenue management initiatives, an overall decline in market demand and customer mix. LTL revenue per hundredweight increased as LTL base rate increases averaging 4.9% took effect on October 26, 2015 and September 19, 2016.
Revenue for the other businesses within Supply Chain & Freight increased $40 million in 2016 d ue to revenue growth at UPS Capital Corporation, UPS Customer Solutions and The UPS Store.
Operating Expenses
2017 compared to 2016
Supply Chain & Freight operating expenses for the period increased $1.136 billion , which includes a $190 million decrease in mark-to-market pension charges.
Forwarding and Logistics operating expenses increased $927 million , largely due to increased purchased transportation expenses and the acquisition of Marken in 2016. This was offset by operating efficiencies, a decrease in the mark-to-market pension charges in 2017 compared to 2016 and the receipt of a $20 million favorable legal settlement in the second quarter of 2017. Purchased transportation expense increased by $949 million compared to 2016 due to increased truckload brokerage freight movement, the acquisition of Marken in 2016, and the resulting increased fuel surcharges passed to us from outside transportation providers. Increased tonnage and third-party air carrier procurement rates in our North American and international air freight forwarding businesses, and increased volume and rates for mail services, also contributed to increased purchased transportation expenses.
35
UNITED PARCEL SERVICE, INC. AND SUBSIDIARIES
MANAGEMENT'S DISCUSSION AND ANALYSIS OF FINANCIAL CONDITION AND
RESULTS OF OPERATIONS
UPS Freight operating expenses increased $196 million in 2017 compared with 2016 . The increase in operating expense was largely due to costs associated with operating our linehaul network ( $120 million ) and increases in pickup and delivery costs ( $79 million ). The network costs and pickup and delivery expenses were driven by higher fuel cost and higher expense for outside transportation carriers (largely due to LTL volume growth and fuel surcharges passed to us by outside carriers). Total cost per LTL shipment increased 4.7% in 2017 compared to 2016. Operating expenses related to our casualty self-insurance reserves also increased in 2017 compared with 2016 .
Other expenses for the other businesses within Supply Chain & Freight increased $13 million in 2017 compared with 2016 primarily due to UPS Capital, UPS Customer Solutions and service contracts with the U.S. Postal Service, slightly offset by decreases in The UPS Store.
2016 compared to 2015
Supply Chain & Freight operating expenses for the period increased $1.146 billion, which included a $306 million increase in mark-to-market pension charges. Forwarding and Logistics operating expenses increased $910 million, largely due to the acquisition of Coyote during the third quarter of 2015 and the increase in mark-to-market pension adjustment, partially offset by the impact of currency exchange rate movements and lower fuel expense. Purchased transportation expense increased by $862 million compared to 2015 largely due to the acquisition of Coyote. These increases were partially offset by a combination of lower volume and tonnage in our North American air freight and international air freight forwarding businesses, lower buy rates due to softer market conditions and the impact of currency exchange rates.
UPS Freight operating expenses decreased $103 million in 2016 compared with 2015, primarily as a result of decreases in our network costs ($58 million) and pickup and delivery costs ($34 million), offset in part by the increased mark-to-market pension charges. The declines in network costs and pickup and delivery expenses were driven by a reduction in fuel expense and expense for outside transportation carriers (due to lower LTL volume and fuel surcharges passed to us by outside carriers). Total cost per LTL shipment increased by 2.7% compared with 2015 due to operating expenses declining at a faster rate than the reduction in tonnage and shipments.
Other expenses for the other businesses within Supply Chain & Freight increased $33 million in 2016 compared with 2015 primarily due to UPS Capital, UPS Customer Solutions and The UPS Store.
Operating Profit and Margin
2017 compared to 2016
Supply Chain & Freight operating profit increased $379 million in 2017 compared with 2016 , which includes a $190 million decrease in the mark-to-market pension charges. Operating margin increased 270 basis points to 6.7% , while the adjusted operating margin increased 70 basis points to 7.8% .
Operating profit for Forwarding and Logistics increased $261 million in 2017 compared with 2016 . Operating profit and margins for the North American air freight business increased in 2017 due to an increase in volume, slightly offset by higher transportation expenses. Operating profit and margins in our international air freight forwarding business increased due to volume increases and higher revenue per kilo, slightly offset by higher rates at which we procure capacity from third-party air carriers. Operating profit for the logistics units improved from 2017 compared to 2016, due to strong performance in the U.S. as well as within our mail services. Additionally, the Marken acquisition in 2016 contributed to the increase in operating profit.
UPS Freight operating profit increased $66 million in 2017 compared with 2016 , as increased volume and prices were partially offset by increased purchased transportation costs.
The combined operating profit for all of our other businesses in this segment increased $52 million in 2017 , primarily due to higher operating profit at UPS Capital, UPS Customer Solutions and The UPS Store, as well as service contracts with the U.S. Postal Service.
36
UNITED PARCEL SERVICE, INC. AND SUBSIDIARIES
MANAGEMENT'S DISCUSSION AND ANALYSIS OF FINANCIAL CONDITION AND
RESULTS OF OPERATIONS
2016 compared to 2015
Supply Chain & Freight operating profit decreased $358 million in 2016 compared with 2015, which includes a $306 million increase in the mark-to-market pension adjustments. Operating margin decreased 410 basis points to 4.0% , while the adjusted operating margin decreased 110 basis points to 7.1% .
Operating profit for Forwarding and Logistics, which includes Coyote, decreased $17 million in 2016 compared with 2015. Operating results for the North American air freight and international air freight forwarding businesses declined, as buy and sell spreads for capacity decreased. Profitability in ocean freight slightly declined due to margin compression from soft market conditions. Operating profit for the logistics unit increased slightly in 2016 compared to 2015.
Operating profit for the freight unit decreased $42 million in 2016 compared with 2015, as a decline in tonnage and increase in pension costs more than offset the increased LTL revenue per hundredweight realized during the year.
The combined operating profit for all of our other businesses in this segment increased $7 million in 2016, primarily due to higher operating profit at UPS Capital, UPS Customer Solutions and The UPS Store.
37
UNITED PARCEL SERVICE, INC. AND SUBSIDIARIES
MANAGEMENT'S DISCUSSION AND ANALYSIS OF FINANCIAL CONDITION AND
RESULTS OF OPERATIONS
Operating Expenses
| Year Ended December 31, |
| % Change | ||||||||||||||||
| 2017 |
| 2016 |
| 2015 |
| 2017/ 2016 |
| 2016/ 2015 | ||||||||||
Operating Expenses (in millions): |
|
|
|
|
|
|
|
|
| ||||||||||
Compensation and Benefits: | $ | 34,588 | |
| $ | 34,770 | |
| $ | 31,028 | |
| (0.5 | )% |
| 12.1 | % | ||
Defined Benefit Plans Mark-to-Market Charges | (800 | ) |
| (2,651 | ) |
| (118 | ) |
|
|
|
| |||||||
Adjusted Compensation and Benefits | 33,788 | |
| 32,119 | |
| 30,910 | |
| 5.2 | % |
| 3.9 | % | |||||
|
|
|
|
|
|
|
|
|
| ||||||||||
Repairs and Maintenance | 1,600 | |
| 1,538 | |
| 1,400 | |
| 4.0 | % |
| 9.9 | % | |||||
Depreciation and Amortization | 2,282 | |
| 2,224 | |
| 2,084 | |
| 2.6 | % |
| 6.7 | % | |||||
Purchased Transportation | 10,989 | |
| 9,129 | |
| 8,043 | |
| 20.4 | % |
| 13.5 | % | |||||
Fuel | 2,690 | |
| 2,118 | |
| 2,482 | |
| 27.0 | % |
| (14.7 | )% | |||||
Other Occupancy | 1,155 | |
| 1,037 | |
| 1,022 | |
| 11.4 | % |
| 1.5 | % | |||||
|
|
|
|
|
|
|
|
|
| ||||||||||
Other Expenses | 5,039 | |
| 4,623 | |
| 4,636 | |
| 9.0 | % |
| (0.3 | )% | |||||
|
|
|
|
|
|
|
|
|
| ||||||||||
Total Operating Expenses | $ | 58,343 | |
| $ | 55,439 | |
| $ | 50,695 | |
| 5.2 | % |
| 9.4 | % | ||
Adjusted Total Operating Expenses | $ | 57,543 | |
| $ | 52,788 | |
| $ | 50,577 | |
| 9.0 | % |
| 4.4 | % | ||
|
|
|
|
|
|
|
|
|
| ||||||||||
Currency Translation Cost / (Benefit)* |
|
|
|
|
|
| $ | 62 | |
| $ | (205 | ) | ||||||
* | Amount represents the change compared to the prior year. |
Compensation and Benefits
2017 compared to 2016
Total compensation and benefits decreased $182 million in 2017 compared to 2016. Excluding the impact of the defined benefit plans mark-to-market charges, adjusted compensation and benefits expense increased $1.669 billion in 2017.
Employee payroll costs increased $1.295 billion in 2017 compared with 2016, largely due to higher U.S. domestic hourly and management compensation costs. Total compensation costs increased 6.5%, while consolidated average daily volume growth was 4.9%. U.S. domestic compensation costs for hourly employees increased largely due to fourth quarter 2017 seasonal staffing increases resulting from a 5.4% volume growth, contractual union wage increases, headcount increases, wage rate adjustments for part time workers and a 6.5% increase in average daily union labor hours. Compensation costs for management employees increased primarily due to merit salary increases and growth in the overall size of the workforce.
Benefits expense decreased $1.477 billion in 2017 compared to 2016, primarily due to the following factors:
• | Pension costs decreased $1.869 billion in 2017 compared to 2016, primarily due to a $1.851 billion decrease in defined benefit plans mark-to-market charges. Additionally, expenses decreased due to higher asset returns in company sponsored plans as a result of discretionary contributions. This decrease was offset by additional expense for multiemployer pension plans, which were impacted by contractual contribution rate increases and an overall increase in size of workforce. |
• | Health and welfare costs increased $229 million in 2017, largely due to increased contributions to multiemployer plans resulting from contractual contribution rate increases and an overall increase in the size of the workforce. |
• | Vacation, holiday, excused absence, payroll tax and other expenses increased $226 million in 2017 due to salary increases and growth in the overall size of the workforce. |
38
UNITED PARCEL SERVICE, INC. AND SUBSIDIARIES
MANAGEMENT'S DISCUSSION AND ANALYSIS OF FINANCIAL CONDITION AND
RESULTS OF OPERATIONS
• | Workers' compensation expense decreased $63 million in 2017 as we experienced more favorable actuarial adjustments. This decrease was partially offset by increases in work hours, medical trends and wage increases. Insurance reserves are established for estimates of the loss that we will ultimately incur on reported workers' compensation claims, as well as estimates of claims that have been incurred but not reported, and take into account a number of factors, including our history of claim losses, payroll growth and the impact of safety improvement initiatives. |
2016 compared to 2015
Total compensation and benefits increased $3.742 billion in 2016 compared to 2015. Excluding the impact of the defined benefit plans mark-to-market charges, adjusted compensation and benefits expense increased $1.209 billion in 2016.
Employee payroll costs increased $609 million in 2016 compared with 2015, largely due to higher U.S. domestic hourly and management compensation costs and the acquisition of Coyote during the third quarter of 2015. Total compensation costs increased 3.2%, while consolidated average daily volume growth was 4.2%. U.S. domestic compensation costs for hourly employees increased largely due to increased headcount, contractual union wage increases and a 4.2% increase in average daily union labor hours. Compensation costs for management employees increased primarily due to merit salary increases and growth in the overall size of the workforce, partially offset by lower incentive compensation.
Benefits expense increased $3.133 billion in 2016 compared to 2015, primarily due to increased pension costs, health and welfare costs, workers' compensation expenses, vacation, holiday and excused absence expenses and payroll taxes. These factors are discussed further as follows:
• | Pension costs increased $2.634 billion in 2016 compared to 2015, primarily due to $2.533 billion in defined benefit plans mark-to-market charges. Additionally, expenses increased for multiemployer pension plans due to increased contribution rates and headcount. |
• | Health and welfare costs increased $277 million in 2016, largely due to increased contributions to multiemployer plans resulting from contractual contribution rate increases and an overall increase in the size of the workforce. |
• | Vacation, holiday, excused absence and payroll tax expense increased $125 million in 2016, due to salary increases and growth in the overall size of the workforce. |
• | Workers' compensation expense increased $96 million in 2016. Insurance reserves are established for estimates of the loss that we will ultimately incur on reported workers' compensation claims, as well as estimates of claims that have been incurred but not reported, and take into account a number of factors, including our history of claim losses, payroll growth and the impact of safety improvement initiatives. In 2015, we experienced more favorable actuarial adjustments, resulting in increased expense in 2016. |
Repairs and Maintenance
2017 compared to 2016
The $62 million increase in repairs and maintenance expense in 2017 was primarily due to repairs and maintenance of our transportation equipment resulting from growth in the size of our vehicle fleet and routine repairs to buildings and facilities.
2016 compared to 2015
The $138 million increase in repairs and maintenance expense in 2016 was primarily due to an increase in airframe and aircraft engine maintenance resulting from increased air volume and increased vehicle maintenance costs in our global package and freight operations, primarily due to the growth in the size of our vehicle fleet.
39
UNITED PARCEL SERVICE, INC. AND SUBSIDIARIES
MANAGEMENT'S DISCUSSION AND ANALYSIS OF FINANCIAL CONDITION AND
RESULTS OF OPERATIONS
Depreciation and Amortization
2017 compared to 2016
Depreciation and amortization expense increased $58 million in 2017 compared with 2016, primarily due to the following factors: (1) depreciation expense on vehicles increased due to an overall increase in the size of our vehicle fleet in our U.S. Domestic Package and UPS Freight operations, (2) depreciation expense for buildings and facilities increased due to the opening of new facilities and facility automation and capacity expansion projects and (3) amortization expense of intangible assets increased in conjunction with the Marken acquisition. These factors were largely offset by a decrease in amortization expense related to longer lived internally developed capitalized software.
2016 compared to 2015
Depreciation and amortization expense increased $140 million in 2016 compared with 2015, primarily due to the following factors: (1) depreciation expense for buildings and facilities increased due to leasehold improvements and purchases of new equipment; (2) increase in amortization expense largely due to new internally developed capitalized software, as well as intangible assets resulting from business acquisitions and (3) depreciation expense on vehicles increased due to the replacement of older, fully-depreciated vehicles, technology upgrades on new vehicles and an overall increase in the size of our vehicle fleet in our U.S. Domestic Package and UPS Freight operations.
Purchased Transportation
2017 compared to 2016
The $1.860 billion increase in purchased transportation expense charged to us by third-party air, rail, ocean and truck carriers in 2017 was primarily driven by the following factors:
• | Expense for our forwarding and logistics business increased $949 million in 2017, primarily due to increased truckload brokerage freight loads per day and the resulting increased fuel surcharges passed to us from outside transportation providers; increased volume and rates for mail services and increased tonnage in our North American and international air freight forwarding businesses. Additionally, purchased transportation expense increased due to the acquisition of Marken in December 2016. |
• | U.S. Domestic Package expense increased $421 million in 2017, primarily due to increased volume (including SurePost), higher rates and higher fuel surcharges passed to us from outside contract carriers. |
• | International Package expense increased $270 million in 2017, primarily due to the increased usage of third-party carriers (due to higher volume); higher fuel surcharges passed to us from outside transportation providers and an unfavorable impact of currency exchange rate movements. |
• | UPS Freight expense increased $163 million in 2017, due to an increase in LTL shipments and higher fuel surcharges passed to us from outside transportation providers. |
2016 compared to 2015
The $1.086 billion increase in purchased transportation expense charged to us by third-party air, ocean and truck carriers in 2016 was driven by several factors:
• | Expense for our forwarding and logistics business increased $840 million in 2016, primarily due to the acquisition of Coyote and increased volume and rates for mail services; these items were partially offset by a combination of decreased volume and tonnage in our North American air freight and international air freight forwarding business, lower buy rates in international air freight due to softer market conditions and the impact of foreign currency exchange rates. |
• | U.S. Domestic Package expense increased $130 million in 2016, primarily due to increased volume and rates, partially offset by lower fuel surcharges passed to us from rail carriers and outside contract carriers. |
• | International Package expense increased $112 million in 2016, primarily due to increased usage of third-party carriers; this was partially offset by the impact of currency exchange rate movements as well as lower fuel surcharges passed to us from outside transportation providers. |
• | UPS Freight expense decreased $18 million in 2016, largely due to decreased LTL shipments and the resulting decreased use of, and lower fuel surcharges passed to us from, outside transportation carriers. |
40
UNITED PARCEL SERVICE, INC. AND SUBSIDIARIES
MANAGEMENT'S DISCUSSION AND ANALYSIS OF FINANCIAL CONDITION AND
RESULTS OF OPERATIONS
Fuel
2017 compared to 2016
The $572 million increase in fuel expense in 2017 was primarily due to higher jet fuel, diesel and unleaded gasoline prices, which increased fuel expense by $419 million. Additionally, increased alternative fuel costs and fuel consumption increased expense by $170 million primarily due to volume increases, which resulted in higher total aircraft block hours and Domestic Package delivery miles driven. These increases were partially offset by increased fuel efficiency.
2016 compared to 2015
The $364 million decrease in fuel expense in 2016 was primarily due to lower jet fuel, diesel and unleaded gasoline prices, which decreased fuel expense by $461 million. The lower fuel prices were partially offset by increased fuel consumption, primarily due to increases in total aircraft block hours and Domestic Package delivery stops (due to higher volume), which increased expense by $97 million and lower alternative fuel and tax credits.
Other Occupancy
2017 compared to 2016
The $118 million increase in other occupancy expense in 2017 was largely due to higher facility rent expense driven by new facilities, higher utilities and property taxes at our operating facilities.
2016 compared to 2015
The $15 million increase in other occupancy expense in 2016 was largely due to higher facility rent expense, partially offset by lower utilities and snow removal costs at our operating facilities.
Other Expenses
2017 compared to 2016
The $416 million increase in other expenses in 2017 was caused by a number of factors:
• | Auto liability insurance expense increased $75 million due to increased miles driven, medical trend rates and severity experience trends. |
• | Transportation equipment rental increased $60 million driven by growth in package volume. |
The remaining $280 million increase is comprised of increases in several other expense categories, including outside professional services, merchandise protection, computer and plant supplies and air cargo handling, partially offset by a decrease in advertising expense.
2016 compared to 2015
The $13 million decrease in other expenses in 2016 was largely due to a decrease in overall auto liability insurance, offset by an increase in outside professional services.
41
UNITED PARCEL SERVICE, INC. AND SUBSIDIARIES
MANAGEMENT'S DISCUSSION AND ANALYSIS OF FINANCIAL CONDITION AND
RESULTS OF OPERATIONS
Investment Income and Interest Expense
The following table sets forth investment income and interest expense for the years ended December 31, 2017 , 2016 and 2015 (in millions):
| Year Ended December 31, |
| % Change | ||||||||||||||
| 2017 |
| 2016 |
| 2015 |
| 2017/ 2016 |
| 2016/ 2015 | ||||||||
Investment Income and Other | $ | 72 | |
| $ | 50 | |
| $ | 15 | |
| 44.0 | % |
| NA | |
Interest Expense | $ | (453 | ) |
| $ | (381 | ) |
| $ | (341 | ) |
| 18.9 | % |
| 11.7 | % |
Investment Income and Other
2017 compared to 2016
The growth in investment income and other in 2017 as compared to 2016 was primarily due to higher interest income from invested assets and the continued decrease in losses from fair value adjustments on real estate partnerships partially offset by foreign currency exchange rate movements.
2016 compared to 2015
The growth in investment income and other in 2016 as compared to 2015 was primarily due to a decrease in losses from fair value adjustments on real estate partnerships, higher interest income and unrealized gains on investments and a benefit from foreign currency exchange rate movements.
Interest Expense
2017 compared to 2016
Interest expense increased in 2017 as compared to 2016 primarily due to the issuance of long-term CAD Senior Notes, Euro Senior Notes and USD Senior Notes and higher effective interest rates on senior notes.
2016 compared to 2015
Interest expense increased in 2016 as compared to 2015 primarily due to an increase in average outstanding commercial paper balances, an increase in long-term debt and higher effective interest rates on senior notes.
42
UNITED PARCEL SERVICE, INC. AND SUBSIDIARIES
MANAGEMENT'S DISCUSSION AND ANALYSIS OF FINANCIAL CONDITION AND
RESULTS OF OPERATIONS
Income Tax Expense
The following table sets forth income tax expense and our effective tax rate for the years ended December 31, 2017 , 2016 and 2015 (in millions):
| Year Ended December 31, |
| % Change | ||||||||||||||
| 2017 |
| 2016 |
| 2015 |
| 2017/ 2016 |
| 2016/ 2015 | ||||||||
Income Tax Expense: | $ | 2,238 | |
| $ | 1,705 | |
| $ | 2,498 | |
| 31.3 | % |
| (31.7 | )% |
Income Tax Impact of: |
|
|
|
|
|
|
|
|
| ||||||||
Defined Benefit Plans Mark-to-Market Charge | 193 | |
| 978 | |
| 39 | |
|
|
|
| |||||
Income Tax Benefit from the Tax Cuts and Jobs Act and Other Non-U.S. Tax Law Changes | 258 | |
| - | |
| - | |
|
|
|
| |||||
Adjusted Income Tax Expense | $ | 2,689 | |
| $ | 2,683 | |
| $ | 2,537 | |
| 0.2 | % |
| 5.8 | % |
Effective Tax Rate | 31.3 | % |
| 33.2 | % |
| 34.0 | % |
|
|
|
| |||||
Adjusted Effective Tax Rate | 33.8 | % |
| 34.5 | % |
| 34.0 | % |
|
|
|
| |||||
Our effective tax rate is affected by recurring factors, such as statutory tax rates in the jurisdictions we operate in and the relative amounts of taxable income we earn in those jurisdictions. It is also affected by discrete items that may occur in any given year but may not be consistent from year to year.
Our effective tax rate decreased to 31.3% in 2017 , compared with 33.2% in 2016 and 34.0% in 2015, primarily due to the effects of the following discrete tax items and recurring factors:
Tax Cuts and Jobs Act
On December 22, 2017, the United States enacted into law the Tax Act. The Tax Act makes broad and complex changes to the U.S. tax code, including a permanent corporate rate reduction to 21% and a transition to a territorial international system effective in 2018. Going forward, we expect a lower future effective tax rate than we have reported in recent years. Applying the lower corporate tax rate will lower our overall income tax expense, which will impact net income and cash flows. Benefits from the lower tax rate will allow us to fund strategic initiatives for our customers, employees and shareowners. The Tax Act also includes provisions that affect 2017, including: (1) requiring a one-time transition tax on certain unrepatriated earnings of foreign subsidiaries ("Transition Tax") that is payable over eight years; (2) requiring a remeasurement of all U.S. deferred tax assets and liabilities to the newly enacted corporate tax rate of 21% and (3) providing for additional first-year depreciation that allows full expensing of qualified property placed into service after September 27, 2017.
In late December 2017, the SEC staff issued SAB 118, which provides guidance on accounting for the tax effects of the Tax Act. SAB 118 provides a measurement period that should not extend beyond one year from the Tax Act enactment date for companies to complete the related accounting under U.S. GAAP. If a company's accounting for certain income tax effects of the Tax Act is incomplete, but it is able to determine a reasonable estimate, it must record a provisional estimate in the financial statements. Accordingly, we have recorded provisional estimates related to our Transition Tax liability, our change in indefinite reinvestment assertion for certain foreign subsidiaries and the remeasurement of our U.S. net deferred tax liabilities.
To calculate the amount of the Transition Tax, we must determine, in addition to other factors, the amount of post-1986 earnings and profits ("E&P") of the foreign subsidiaries as well as the amount of non-U.S. income taxes paid on such earnings. We are able to make a reasonable estimate of the Transition Tax and recorded a provisional liability of $310 million; however, there are certain factors that could impact our provisional estimate.
First, several of our foreign subsidiaries have a fiscal year-end, and E&P for these subsidiaries cannot be precisely calculated until their fiscal years conclude during 2018. Second, we continue to gather additional information needed to precisely estimate the impact of the Transition Tax on our U.S. state and local tax liabilities given the complexity of the relevant state laws. Finally, we expect additional regulatory guidance and technical clarifications from the U.S. Department of the Treasury and Internal Revenue Service within the next 12 months that could change our provisional estimate of the Transition Tax.
43
UNITED PARCEL SERVICE, INC. AND SUBSIDIARIES
MANAGEMENT'S DISCUSSION AND ANALYSIS OF FINANCIAL CONDITION AND
RESULTS OF OPERATIONS
As the U.S. has moved to a territorial system, we have also changed our indefinite reinvestment assertion with respect to the earnings of certain foreign subsidiaries. As a result, we have recorded a provisional deferred tax liability and corresponding increase to deferred tax expense of $24 million. There are certain factors, discussed above with regard to the Transition Tax, which could also impact our provisional estimate for the change in indefinite reinvestment assertion. For all other foreign subsidiaries, we continue to assert that these earnings are indefinitely reinvested. We will continue to evaluate our indefinite reinvestment assertion for all foreign subsidiaries in light of the Tax Act, and our provisional estimate is subject to change.
For our net U.S. deferred tax liabilities, we have recorded a provisional decrease of $606 million with a corresponding reduction to deferred tax expense of $606 million for the year ended December 31, 2017. While we are able to make a reasonable estimate of the impact of the reduction in the corporate rate, it may be affected by other analyses related to the Tax Act, including, but not limited to, completing the analysis of our 2017 capital expenditures that qualify for full expensing and the state tax effect of adjustments made to federal temporary differences.
Other 2017 Discrete Items
In the fourth quarter of 2017, we recognized an income tax benefit of $193 million related to pre-tax mark-to-market losses of $800 million on our pension and postretirement defined benefit plans. This income tax benefit was generated at a lower average statutory tax rate than the 2017 U.S. federal statutory tax rate due to future tax rate changes enacted by the Tax Act and differences between U.S. and foreign statutory rates, which was partially offset by the effect of U.S. state and local taxes.
In the fourth quarter of 2017, tax law changes were enacted in certain non-U.S. jurisdictions in which we operate. As a result, we have recorded a decrease to our foreign net deferred tax assets of $14 million with a corresponding net increase to deferred tax expense of $14 million for the year ended December 31, 2017.
In the first quarter of 2017, we adopted a new accounting standard that requires the recognition of excess tax benefits related to share-based compensation in income tax expense, which resulted in tax benefits for the year ended December 31, 2017 of $71 million and reduced our effective tax rate by 1.0%.
2016 Discrete Items
In the fourth quarter of 2016, we recognized an income tax benefit of $978 million related to pre-tax mark-to-market losses of $2,651,000,000.000 billion on our pension and postretirement defined benefit plans. This income tax benefit was generated at a higher average statutory tax rate than the U.S. federal statutory tax rate because it included the effect of U.S. state and local taxes.
2015 Discrete Items
During the third quarter of 2015 and after the filing of our annual federal tax returns, we reconciled our deferred tax balances and identified adjustments to be made with respect to prior years' deferred tax balances. The adjustments resulted in a reduction of income tax expense of $ 66 million.
In connection with our acquisition of Coyote Logistics in 2015, we distributed $ 500 million of cash held by a Canadian subsidiary to its U.S. parent during the fourth quarter of 2015. As a result of the distribution, we recorded additional net income tax expense of $ 28 million.
In the fourth quarter of 2015, we recognized an income tax benefit of $ 39 million related to pre-tax mark-to-market losses of $ 118 million on our pension and postretirement defined benefit plans. This income tax benefit was generated at a lower average statutory tax rate than our U.S. federal statutory tax rate because it was due, in part, to non-U.S. benefit plans.
Other favorable rate impacting items in 2015 include: resolution of several U.S. state and local tax matters; the extension of favorable U.S. federal tax provisions associated with the Protecting Americans from Tax Hikes Act of 2015 related to research and development tax credits and work opportunity tax credits; and the execution of two bilateral advance pricing agreements. These agreements established intercompany transfer pricing arrangements between the U.S. and certain non-U.S. jurisdictions related to our small package operations for tax years 2010 through 2019.
44
UNITED PARCEL SERVICE, INC. AND SUBSIDIARIES
MANAGEMENT'S DISCUSSION AND ANALYSIS OF FINANCIAL CONDITION AND
RESULTS OF OPERATIONS
As described in the Items Affecting Comparability section, certain items have been excluded from comparisons of "adjusted" income taxes in the discussion that follows.
Our adjusted effective tax rate decreased to 33.8% in 2017 from 34.5% in 2016 primarily due to favorable discrete tax adjustments related to recognition of excess tax benefits related to share-based compensation in income tax expense.
Our adjusted effective tax rate increased to 34.5% in 2016 from 34.0% in 2015 primarily due to a decrease in favorable discrete tax adjustments relative to 2015 partially offset by favorable changes in the proportion of our taxable income in certain U.S. and non-U.S. jurisdictions relative to total pre-tax income.
45
UNITED PARCEL SERVICE, INC. AND SUBSIDIARIES
MANAGEMENT'S DISCUSSION AND ANALYSIS OF FINANCIAL CONDITION AND
RESULTS OF OPERATIONS
Liquidity and Capital Resources
As of December 31, 2017 , we had $ 4.069 billion in cash, cash equivalents and marketable securities. We believe that our current cash position, access to the long-term debt capital markets and cash flow generated from operations should be adequate not only for operating requirements but also to enable us to complete our capital expenditure programs and to fund dividend payments, share repurchases and long-term debt payments through the next several years. In addition, we have funds available from our commercial paper program and the ability to obtain alternative sources of financing. We regularly evaluate opportunities to optimize our capital structure, including through issuances of debt to refinance existing debt and to fund ongoing cash needs.
Cash Flows From Operating Activities
The following is a summary of the significant sources (uses) of cash from operating activities (amounts in millions):
| 2017 |
| 2016 |
| 2015 | ||||||
Net Income | $ | 4,910 | |
| $ | 3,431 | |
| $ | 4,844 | |
Non-cash operating activities (1) | 5,776 | |
| 6,444 | |
| 4,122 | | |||
Pension and postretirement plan contributions (UPS-sponsored plans) | (7,794 | ) |
| (2,668 | ) |
| (1,229 | ) | |||
Hedge margin receivables and payables | (732 | ) |
| (142 | ) |
| 170 | | |||
Income tax receivables and payables | (550 | ) |
| (505 | ) |
| (6 | ) | |||
Changes in working capital and other non-current assets and liabilities | (178 | ) |
| (62 | ) |
| (418 | ) | |||
Other operating activities | 47 | |
| (25 | ) |
| (53 | ) | |||
Net cash from operating activities | $ | 1,479 | |
| $ | 6,473 | |
| $ | 7,430 | |
(1) | Represents depreciation and amortization, gains and losses on derivative transactions and foreign exchange, deferred income taxes, provisions for uncollectible accounts, pension and postretirement benefit expense, stock compensation expense and other non-cash items. |
Cash from operating activities remained strong throughout 2015 to 2017. Most of the variability in operating cash flows during the 2015 to 2017 time period relates to the funding of our company-sponsored pension and postretirement benefit plans (and related cash tax deductions). Except for discretionary or accelerated fundings of our plans, contributions to our company-sponsored pension plans have largely varied based on whether any minimum funding requirements are present for individual pension plans.
• | We made discretionary contributions to our three primary company-sponsored U.S. pension plans totaling $7.291, $2.461 and $1.030 billion in 2017, 2016 and 2015, respectively. |
• | The remaining contributions from 2015 to 2017 were largely due to contributions to our international pension plans and U.S. postretirement medical benefit plans. |
Apart from the transactions described above, operating cash flow was impacted by changes in our working capital position, payments for income taxes and changes in hedge margin payables and receivables. Cash payments for income taxes were $1.559 , $2.064 and $1.913 billion for 2017, 2016 and 2015, respectively, and were primarily impacted by the timing of current tax deductions. The net hedge margin collateral (paid)/received from derivative counterparties was $(732), $(142) and $170 million during 2017, 2016 and 2015, respectively, due to settlements and changes in the fair value of the derivative contracts used in our currency and interest rate hedging programs.
As of December 31, 2017 , the total of our worldwide holdings of cash, cash equivalents and marketable securities were $ 4.069 billion , of which approximately $1.800 billion was held by foreign subsidiaries. The amount of cash, cash equivalents and marketable securities held by our U.S. and foreign subsidiaries fluctuates throughout the year due to a variety of factors, including the timing of cash receipts and disbursements in the normal course of business. Cash provided by operating activities in the U.S. continues to be our primary source of funds to finance domestic operating needs, capital expenditures, share repurchases and dividend payments to shareowners. As a result of the Tax Act, all cash, cash equivalents and marketable securities held by foreign subsidiaries are generally available for distribution to the U.S. without any U.S. federal income taxes. Any such distributions may be subject to foreign withholding and U.S. state taxes. When amounts earned by foreign subsidiaries are expected to be indefinitely reinvested, no accrual for taxes is provided.
46
UNITED PARCEL SERVICE, INC. AND SUBSIDIARIES
MANAGEMENT'S DISCUSSION AND ANALYSIS OF FINANCIAL CONDITION AND
RESULTS OF OPERATIONS
Cash Flows From Investing Activities
Our primary sources (uses) of cash for investing activities were as follows (amounts in millions):
| 2017 |
| 2016 |
| 2015 | ||||||
Net cash used in investing activities | $ | (4,975 | ) |
| $ | (2,566 | ) |
| $ | (5,309 | ) |
Capital Expenditures: |
|
|
|
|
| ||||||
Buildings, facilities and plant equipment | $ | (2,954 | ) |
| $ | (1,316 | ) |
| $ | (996 | ) |
Aircraft and parts | (789 | ) |
| (350 | ) |
| (27 | ) | |||
Vehicles | (924 | ) |
| (864 | ) |
| (936 | ) | |||
Information technology | (560 | ) |
| (435 | ) |
| (420 | ) | |||
Total Capital Expenditures: | $ | (5,227 | ) |
| $ | (2,965 | ) |
| $ | (2,379 | ) |
Capital Expenditures as a % of Revenue | 7.9 | % |
| 4.9 | % |
| 4.1 | % | |||
Other Investing Activities: |
|
|
|
|
| ||||||
Proceeds from disposals of property, plant and equipment | $ | 24 | |
| $ | 88 | |
| $ | 26 | |
Net decrease in finance receivables | $ | 5 | |
| $ | 9 | |
| $ | 5 | |
Net (purchases), sales of marketable securities | $ | 356 | |
| $ | 908 | |
| $ | (1,027 | ) |
Cash paid for business acquisitions | $ | (134 | ) |
| $ | (547 | ) |
| $ | (1,904 | ) |
Other investing activities | $ | 1 | |
| $ | (59 | ) |
| $ | (30 | ) |
We have commitments for the purchase of aircraft, vehicles, equipment and real estate to provide for the replacement of existing capacity and anticipated future growth. We generally fund our capital expenditures with our cash from operations. Future capital spending for anticipated growth and replacement assets will depend on a variety of factors, including economic and industry conditions. We anticipate that our capital expenditures for 2018 will be approximately $6.5 to $7.0 billion.
Capital expenditures on buildings, facilities and plant equipment increased in 2017 compared to the 2015 to 2016 periods in our U.S. and international package businesses, largely due to several facility automation and capacity expansion projects. Capital spending on aircraft increased in 2017 compared to the 2015 to 2016 periods due to contract deposits on open aircraft orders and final payments for new Boeing 747-8F cargo aircraft and previously owned Boeing 767-300 cargo aircraft. Capital spending on vehicles increased in 2017 in our U.S. and international package businesses, largely due to growth in our business and the timing of vehicle replacements. Capital spending on information technology increased in 2017 compared to the 2015 to 2016 periods due to further development of our smart logistics network, technology enhancements and capitalized software projects.
The proceeds from the disposal of property, plant and equipment in the 2015 to 2017 periods were largely due to vehicle retirements in 2017, insurance recoveries in 2016 and real estate sales in 2015. The net decline in finance receivables in 2017 was primarily due to growth in our cargo finance products, partially offset by loan principal paydowns in our business credit portfolio. The net change in finance receivables in the 2016 and 2015 periods was primarily due to customer paydowns and loan sales activity, primarily in our commercial lending, asset-based lending and leasing portfolios. The purchases and sales of marketable securities are largely determined by liquidity needs and the periodic rebalancing of investment types and will fluctuate from period to period.
Cash paid for business acquisitions in the 2015 to 2017 periods was primarily related to the acquisitions of Poltraf Sp. z.o.o., Parcel Pro, Inc. and Coyote in 2015; Marken in 2016 and Freightex, Nightline and STTAS in 2017.
Other investing activities are impacted by changes in our non-current investments and restricted cash balances, capital contributions into certain investment partnerships and various other items. In 2017, 2016 and 2015, we increased the non-current investments and restricted cash balance associated with our self-insurance requirements by $ 4 , $3 and $0 million, respectively.
47
UNITED PARCEL SERVICE, INC. AND SUBSIDIARIES
MANAGEMENT'S DISCUSSION AND ANALYSIS OF FINANCIAL CONDITION AND
RESULTS OF OPERATIONS
Cash Flows From Financing Activities
Our primary sources (uses) of cash for financing activities were as follows (amounts in millions, except per share data):
| 2017 |
| 2016 |
| 2015 | ||||||
Net cash used in financing activities | $ | 3,287 | |
| $ | (3,140 | ) |
| $ | (1,565 | ) |
Share Repurchases: |
|
|
|
|
| ||||||
Cash expended for shares repurchased | $ | (1,813 | ) |
| $ | (2,678 | ) |
| $ | (2,702 | ) |
Number of shares repurchased | (16.1 | ) |
| (25.4 | ) |
| (26.8 | ) | |||
Shares outstanding at year-end | 859 | |
| 868 | |
| 886 | | |||
Percent reduction in shares outstanding | (1.0 | )% |
| (2.0 | )% |
| (2.1 | )% | |||
Dividends: |
|
|
|
|
| ||||||
Dividends declared per share | $ | 3.32 | |
| $ | 3.12 | |
| $ | 2.92 | |
Cash expended for dividend payments | $ | (2,771 | ) |
| $ | (2,643 | ) |
| $ | (2,525 | ) |
Borrowings: |
|
|
|
|
| ||||||
Net borrowings (repayments) of debt principal | $ | 7,827 | |
| $ | 2,034 | |
| $ | 3,588 | |
Other Financing Activities: |
|
|
|
|
| ||||||
Cash received for common stock issuances | $ | 247 | |
| $ | 245 | |
| $ | 249 | |
Other financing activities | $ | (203 | ) |
| $ | (98 | ) |
| $ | (175 | ) |
Capitalization: |
|
|
|
|
| ||||||
Total debt outstanding at year-end | $ | 24,289 | |
| $ | 16,075 | |
| $ | 14,334 | |
Total shareowners' equity at year-end | 1,030 | |
| 429 | |
| 2,491 | | |||
Total capitalization | $ | 25,319 | |
| $ | 16,504 | |
| $ | 16,825 | |
For the years ended December 31, 2017 , 2016 and 2015 , we repurchased a total of 16.1 , 25.2 and 26.8 million shares of class A and class B common stock for $ 1.816 , $ 2.680 and $ 2.711 billion, respectively ($ 1.813 , $ 2.678 and $ 2.702 billion in repurchases for 2017 , 2016 and 2015 , respectively, are reported on the cash flow statement due to the timing of settlements). During the first quarter of 2016, we also exercised a capped call option that we entered in 2015 for which we received 0.2 million UPS class B shares. The $25 million premium payment for this capped call option reduced shareowners' equity in 2015.
In May 2016 , the Board of Directors approved a share repurchase authorization of $ 8.0 billion, which replaced an authorization previously announced in 2013. The share repurchase authorization has no expiration date. As of December 31, 2017 , we had $ 4.339 billion of this share repurchase authorization remaining.
Share repurchases may take the form of accelerated share repurchases, open market purchases, or other such methods as we deem appropriate. The timing of our share repurchases will depend upon market conditions. Unless terminated earlier by the resolution of our Board, the program will expire when we have purchased all shares authorized for repurchase under the program. We anticipate repurchasing approximately $ 1.0 billion of shares in 2018 .
The declaration of dividends is subject to the discretion of the Board of Directors and will depend on various factors, including our net income, financial condition, cash requirements, future prospects and other relevant factors. We expect to continue the practice of paying regular cash dividends. In February 2018, we increased our quarterly dividend payment from $0.83 to $ 0.91 per share, a 10% increase.
48
UNITED PARCEL SERVICE, INC. AND SUBSIDIARIES
MANAGEMENT'S DISCUSSION AND ANALYSIS OF FINANCIAL CONDITION AND
RESULTS OF OPERATIONS
| Principal Amount in USD | ||
2017 |
| ||
Fixed-rate senior notes: |
| ||
2.050% senior notes | $ | 700 | |
2.350% senior notes | 600 | | |
2.500% senior notes | 1,000 | | |
2.800% senior notes | 500 | | |
3.050% senior notes | 1,000 | | |
3.750% senior notes | 1,150 | | |
Floating-rate senior notes (multiple issuances) | 1,461 | | |
Euro senior notes: |
| ||
0.375% senior notes (€700) | 815 | | |
1.500% senior notes (€500) | 582 | | |
Canadian senior notes: |
| ||
2.125% senior notes (C$750) | 547 | | |
Total | $ | 8,355 | |
| Principal Amount in USD | ||
2016 |
| ||
Fixed-rate senior notes: |
| ||
2.400% senior notes | $ | 500 | |
3.400% senior notes | 500 | | |
Floating-rate senior notes (multiple issuances) | 226 | | |
Euro senior notes: |
| ||
1.000% senior notes (€500) | 549 | | |
Total | $ | 1,775 | |
| Principal Amount in USD | ||
2015 |
| ||
Facility notes and bonds | $ | 100 | |
Floating-rate senior notes (multiple issuances) | 144 | | |
Euro senior notes: |
| ||
1.625% senior notes (€700) | 765 | | |
Floating-rate senior notes (€500) | 547 | | |
Total | $ | 1,556 | |
The remaining debt issuances for the 2015 to 2017 periods consisted primarily of commercial paper.
Repayment of debt in 2017 consisted primarily of the maturity of our $375 million fixed-rate senior notes that matured on October 1, 2017. In 2016, there were no repayments of fixed-rate senior notes or floating-rate senior notes. Repayments of debt in 2015 consisted primarily of the maturity of our $100 million facility bonds associated with our Philadelphia, Pennsylvania airport facilities. The remaining repayments of debt during the 2015 through 2017 time period included paydowns of commercial paper and scheduled principal payments on our capitalized lease obligations. We consider the overall fixed and floating interest rate mix of our portfolio and the related overall cost of borrowing when planning for future issuances and non-scheduled repayments of debt.
49
UNITED PARCEL SERVICE, INC. AND SUBSIDIARIES
MANAGEMENT'S DISCUSSION AND ANALYSIS OF FINANCIAL CONDITION AND
RESULTS OF OPERATIONS
The amount of commercial paper outstanding fluctuates throughout the year based on daily liquidity needs. The following is a summary of our commercial paper program (amount in millions):
| Functional currency outstanding balance at year-end |
| Outstanding balance at year-end ($) |
| Average balance outstanding |
| Average balance outstanding ($) |
| Average interest rate | |||||||||
2017 |
|
|
|
|
|
|
|
|
| |||||||||
USD | $ | 2,458 | |
| $ | 2,458 | |
| $ | 2,163 | |
| $ | 2,163 | |
| 0.88 | % |
EUR | € | 622 | |
| $ | 745 | |
| € | 941 | |
| $ | 1,062 | |
| (0.39 | )% |
Total |
|
| $ | 3,203 | |
|
|
|
|
|
| |||||||
| Functional currency outstanding balance at year-end |
| Outstanding balance at year-end ($) |
| Average balance outstanding |
| Average balance outstanding ($) |
| Average interest rate | |||||||||
2016 |
|
|
|
|
|
|
|
|
| |||||||||
USD | $ | 2,406 | |
| $ | 2,406 | |
| $ | 1,838 | |
| $ | 1,838 | |
| 0.44 | % |
EUR | € | 801 | |
| $ | 844 | |
| € | 776 | |
| $ | 817 | |
| (0.28 | )% |
GBP | £ | - | |
| $ | - | |
| £ | 94 | |
| $ | 116 | |
| 0.50 | % |
Total |
|
| $ | 3,250 | |
|
|
|
|
|
| |||||||
| Functional currency outstanding balance at year-end |
| Outstanding balance at year-end ($) |
| Average balance outstanding |
| Average balance outstanding ($) |
| Average interest rate | |||||||||
2015 |
|
|
|
|
|
|
|
|
| |||||||||
USD | $ | 2,279 | |
| $ | 2,279 | |
| $ | 2,159 | |
| $ | 2,159 | |
| 0.13 | % |
EUR | € | 310 | |
| $ | 339 | |
| € | 10 | |
| $ | 11 | |
| (0.09 | )% |
GBP | £ | 234 | |
| $ | 347 | |
| £ | 241 | |
| $ | 368 | |
| 0.50 | % |
Total |
|
| $ | 2,965 | |
|
|
|
|
|
| |||||||
The variation in cash received from common stock issuances was primarily due to the level of stock option exercises by employees in the 2015 through 2017 period.
The cash outflows in other financing activities were impacted by several factors, primarily the repurchase of shares to satisfy tax withholding obligations on vested employee stock awards of $247, $167 and $217 million for 2017 , 2016 and 2015 , respectively. Net cash inflows (outflows) from the premium payments and settlements of capped call options for the purchase of UPS class B shares were $54 million in both 2017 and 2016, and $(17) million for 2015.
Sources of Credit
See note 8 to the audited consolidated financial statements for a discussion of our available credit and debt covenants.
Guarantees and Other Off-Balance Sheet Arrangements
We do not have guarantees or other off-balance sheet financing arrangements, including variable interest entities, which we believe could have a material impact on financial condition or liquidity.
50
UNITED PARCEL SERVICE, INC. AND SUBSIDIARIES
MANAGEMENT'S DISCUSSION AND ANALYSIS OF FINANCIAL CONDITION AND
RESULTS OF OPERATIONS
Contractual Commitments
We have contractual obligations and commitments in the form of capital leases, operating leases, debt obligations, purchase commitments and certain other liabilities. We intend to satisfy these obligations through the use of cash flow from operations. The following table summarizes the expected cash outflow to satisfy our contractual obligations and commitments as of December 31, 2017 (in millions):
Commitment Type | 2018 |
| 2019 |
| 2020 |
| 2021 |
| 2022 |
| After 2022 |
| Total | ||||||||||||||
Capital Leases | $ | 81 | |
| $ | 79 | |
| $ | 69 | |
| $ | 49 | |
| $ | 45 | |
| $ | 500 | |
| $ | 823 | |
Operating Leases | 398 | |
| 305 | |
| 239 | |
| 186 | |
| 138 | |
| 371 | |
| 1,637 | | |||||||
Debt Principal | 3,960 | |
| 1,009 | |
| 1,024 | |
| 2,551 | |
| 2,000 | |
| 13,342 | |
| 23,886 | | |||||||
Debt Interest | 578 | |
| 544 | |
| 510 | |
| 475 | |
| 433 | |
| 5,604 | |
| 8,144 | | |||||||
Purchase Commitments (1) | 3,789 | |
| 2,462 | |
| 2,428 | |
| 1,926 | |
| 323 | |
| 13 | |
| 10,941 | | |||||||
Tax Act Repatriation Liability | 23 | |
| 25 | |
| 25 | |
| 25 | |
| 25 | |
| 187 | |
| 310 | | |||||||
Pension Funding | - | |
| - | |
| - | |
| - | |
| - | |
| - | |
| - | | |||||||
Other Liabilities | 5 | |
| - | |
| - | |
| - | |
| - | |
| - | |
| 5 | | |||||||
Total | $ | 8,834 | |
| $ | 4,424 | |
| $ | 4,295 | |
| $ | 5,212 | |
| $ | 2,964 | |
| $ | 20,017 | |
| $ | 45,746 | |
(1) Purchase commitments include our announcement on February 1, 2018 for 14 new Boeing 747-8 freighters and four new Boeing 767 aircraft.
Our capital lease obligations relate primarily to leases on aircraft. Capital leases, operating leases and purchase commitments, as well as our debt principal obligations, are discussed further in note 8 to our consolidated financial statements. The amount of interest on our debt was calculated as the contractual interest payments due on our fixed-rate debt, in addition to interest on variable rate debt that was calculated based on interest rates as of December 31, 2017 . The calculations of debt interest take into account the effect of interest rate swap agreements. For debt denominated in a foreign currency, the U.S. Dollar equivalent principal amount of the debt at the end of the year was used as the basis to calculate future interest payments.
Purchase commitments represent contractual agreements to purchase assets, goods or services that are legally binding, including contracts for aircraft, construction of new or expanded facilities and orders for technology equipment and vehicles. As of December 31, 2017 , we had firm commitments to purchase 14 new Boeing 747-8F cargo aircraft. The 14 aircraft are to be delivered between 2017 and 2020. On February 1, 2018, we announced an order for 14 additional Boeing 747-8 freighters previously under option and four new Boeing 767 aircraft to be delivered between 2019 and 2022.
On December 22, 2017, the United States enacted into law the Tax Act requiring a one-time transition tax on certain unrepatriated earnings of foreign subsidiaries. Companies may elect to pay the tax over eight years based on an installment schedule outlined in the Tax Act. We intend to make this election and have reflected our estimated transition tax due by year as a contractual obligation.
There are no anticipated required minimum cash contributions to our qualified U.S. pension plans (these plans are discussed further in note 4 to the audited consolidated financial statements). The amount of any minimum funding requirement, as applicable, for these plans could change significantly in future periods, depending on many factors, including future plan asset returns, discount rates and changes to pension plan funding regulations. A decline in discount rates or a sustained significant decline in the world equity or bond markets could result in our domestic pension plans being subject to significantly higher minimum funding requirements. Actual contributions made in future years could materially differ and consequently required minimum contributions beyond 2020 cannot be reasonably estimated.
As discussed in note 5 to the audited consolidated financial statements, we are not currently subject to any minimum contributions or surcharges with respect to the multiemployer pension and health and welfare plans in which we participate. Contribution rates to these multiemployer pension and health and welfare plans are established through the collective bargaining process. As we are not subject to any minimum contribution levels, we have not included any amounts in the contractual commitments table with respect to these multiemployer plans.
51
UNITED PARCEL SERVICE, INC. AND SUBSIDIARIES
MANAGEMENT'S DISCUSSION AND ANALYSIS OF FINANCIAL CONDITION AND
RESULTS OF OPERATIONS
The contractual payments due for "other liabilities" primarily include commitment payments related to our investment in certain partnerships.
The table above does not include approximately $ 212 million of liabilities for uncertain tax positions because we are uncertain if or when such amounts will ultimately be settled in cash. Uncertain tax positions are further discussed in note 13 to the consolidated financial statements.
As of December 31, 2017 , we had outstanding letters of credit totaling approximately $ 1.084 billion issued in connection with our self-insurance reserves and other routine business requirements. We also issue surety bonds as an alternative to letters of credit in certain instances, and as of December 31, 2017 , we had $ 932 million of surety bonds written. As of December 31, 2017 , we had unfunded loan commitments totaling $ 137 million associated with UPS Capital.
We believe that funds from operations and borrowing programs will provide adequate sources of liquidity and capital resources to meet our expected long-term needs for the operation of our business, including anticipated capital expenditures, for the foreseeable future.
Contingencies
See note 4 to the audited consolidated financial statements for a discussion of pension related matters and note 9 for a discussion of judicial proceedings and other matters arising from the conduct of our business activities.
Collective Bargaining Agreements
Status of Collective Bargaining Agreements
As of December 31, 2017 , we had approximately 280,000 employees employed under a national master agreement and various supplemental agreements with local unions affiliated with the Teamsters. These agreements run through July 31, 2018.
We have approximately 2,700 pilots who are employed under a collective bargaining agreement with the Independent Pilots Association ("IPA"), which runs through September 1, 2021.
Our airline mechanics are covered by a collective bargaining agreement with Teamsters Local 2727, which became amendable November 1, 2013. We are currently in negotiations with Teamsters Local 2727. In addition, approximately 3,100 of our auto and maintenance mechanics who are not employed under agreements with the Teamsters are employed under collective bargaining agreements with the International Association of Machinists and Aerospace Workers ("IAM") that will expire on July 31, 2019.
Multiemployer Benefit Plans
We contribute to a number of multiemployer defined benefit and health and welfare plans under terms of collective bargaining agreements that cover our union represented employees. Our current collective bargaining agreements set forth the annual contribution increases allotted to the plans that we participate in, and we are in compliance with these contribution rates. These limitations will remain in effect throughout the terms of the existing collective bargaining agreements.
New Accounting Pronouncements
Recently Adopted Accounting Standards
See note 1 to the audited consolidated financial statements for a discussion of recently adopted accounting standards.
Accounting Standards Issued But Not Yet Effective
See note 1 to the audited consolidated financial statements for a discussion of accounting standards issued, but not yet effective.
52
UNITED PARCEL SERVICE, INC. AND SUBSIDIARIES
MANAGEMENT'S DISCUSSION AND ANALYSIS OF FINANCIAL CONDITION AND
RESULTS OF OPERATIONS
Critical Accounting Policies and Estimates
Our discussion and analysis of our financial condition and results of operations are based on our consolidated financial statements, which are prepared in accordance with accounting principles generally accepted in the United States of America. As indicated in note 1 to our consolidated financial statements, the amounts of assets, liabilities, revenue and expenses reported in our financial statements are affected by estimates and judgments that are necessary to comply with generally accepted accounting principles. We base our estimates on prior experience and other assumptions that we consider reasonable to our circumstances. Actual results could differ from our estimates, which would affect the related amounts reported in our consolidated financial statements. While estimates and judgments are applied in arriving at many reported amounts, we believe that the following matters may involve a higher degree of judgment and complexity.
Contingencies
As discussed in note 9 to our consolidated financial statements, we are involved in various legal proceedings and contingencies. The events that may impact our contingent liabilities are often unique and generally are not predictable. At the time a contingency is identified, we consider all relevant facts as part of our evaluation. We record a liability for a loss when the loss is probable of occurring and reasonably estimable. Events may arise that were not anticipated and the outcome of a contingency may result in a loss to us that differs from our previously estimated liability. These factors could result in a material difference between estimated and actual operating results. Contingent losses that are probable and estimable, excluding those related to income taxes and self-insurance which are discussed further below, were not material to our financial position or results of operations as of, and for the year ended, December 31, 2017 . In addition, we have certain contingent liabilities that have not been recognized as of December 31, 2017 , because a loss is not reasonably estimable.
Goodwill and Intangible Impairment
We perform impairment testing of goodwill for each of our reporting units on an annual basis. In our U.S. Domestic Package and International Package reporting segments, we have the following reporting units: Europe, Asia, Americas and ISMEA (Indian Subcontinent, Middle East and Africa). In our Supply Chain & Freight segment we have the following reporting units: Forwarding, Logistics, UPS Mail Innovations, UPS Freight, The UPS Store, UPS Capital, Marken and Coyote Logistics. During the third quarter of 2017, we changed the measurement date of our annual goodwill impairment testing from October 1st to July 1st. This change better aligns the timing of the goodwill impairment test with our long-term business planning process. The change was not material to our consolidated financial statements as it did not result in the delay, acceleration or avoidance of an impairment charge. Our annual goodwill impairment testing date is July 1 st for each reporting unit owned at the testing date. In assessing goodwill for impairment, we initially evaluate qualitative factors to determine if it is more likely than not that the fair value of a reporting unit is less than its carrying amount. If the qualitative assessment is not conclusive and it is necessary to calculate the fair value of a reporting unit, then we utilize a two-step process to test goodwill for impairment. First, a comparison of the fair value of the applicable reporting unit with the aggregate carrying value, including goodwill, is performed. If the carrying amount of a reporting unit exceeds the reporting unit's fair value, we perform the second step of the goodwill impairment test to determine the amount of impairment loss. The second step includes comparing the implied fair value of the affected reporting unit's goodwill with the carrying value of that goodwill.
We primarily determine the fair value of our reporting units using a discounted cash flow model ("DCF model") and supplement this with observable valuation multiples for comparable companies, as appropriate. The completion of the DCF model requires that we make a number of significant assumptions to produce an estimate of future cash flows. These assumptions include projections of future revenue, costs, capital expenditures and working capital changes. In addition, we make assumptions about the estimated cost of capital and other relevant variables, as required, in estimating the fair value of our reporting units. The projections that we use in our DCF model are updated annually and will change over time based on the historical performance and changing business conditions for each of our reporting units. The determination of whether goodwill is impaired involves a significant level of judgment in these assumptions, and changes in our business strategy, government regulations, or economic or market conditions could significantly impact these judgments. We routinely monitor market conditions and other factors to determine if interim impairment tests are necessary. If impairment indicators are present in future periods, the resulting impairment charges could have a material impact on our results of operations.
53
UNITED PARCEL SERVICE, INC. AND SUBSIDIARIES
MANAGEMENT'S DISCUSSION AND ANALYSIS OF FINANCIAL CONDITION AND
RESULTS OF OPERATIONS
None of the reporting units incurred any goodwill impairment charges in 2017 , 2016 or 2015 . Changes in our forecasts could cause carrying values of our reporting units to exceed their fair values in future periods, potentially resulting in a goodwill impairment charge. During the year, management monitored the actual performance of the business relative to the fair value assumptions used during our annual goodwill impairment test. For the periods presented, no triggering events were identified that required an interim impairment test. Based on most recent tests, the fair value of all our reporting units substantially exceed their carrying value.
A trade name with a carrying value of $200 million and licenses with a carrying value of $ 5 million as of December 31, 2017 are considered to be indefinite-lived intangibles, and therefore are not amortized. Impairment tests for indefinite-lived intangibles are performed on an annual basis. We determined that the income approach, specifically the relief from royalty method, is the most appropriate valuation method for the trade name. The estimated fair value of the trade name is compared to the carrying value of the asset. If the carrying value of the trade name exceeds its estimated fair value, an impairment charge is recognized for the amount by which the carrying amount of the asset exceeds its fair value. This valuation approach requires that we make a number of assumptions to estimate fair value. These assumptions include projections of future revenues, market royalty rates, tax rates, discount rates and other relevant variables. The projections we use in the model are updated annually and will change over time based on the historical performance and changing business conditions.
All of our remaining recorded intangible assets are deemed to be finite-lived intangibles, and are thus amortized over their estimated useful lives. Impairment tests for these intangible assets are only performed when a triggering event occurs that indicates that the carrying value of the intangible may not be recoverable based on the undiscounted future cash flows of the intangible. If the carrying amount of the intangible is determined not to be recoverable, a write-down to fair value is recorded. Fair values are determined based on a DCF model. If impairment indicators are present in future periods, the resulting impairment charges could have a material impact on our results of operations. There were no impairments of any indefinite-lived or finite-lived intangible assets in 2017 , 2016 or 2015 .
Self-Insurance Accruals
We self-insure costs associated with workers' compensation claims, automotive liability, health and welfare and general business liabilities, up to certain limits. Insurance reserves are established for estimates of the loss that we will ultimately incur on reported claims, as well as estimates of claims that have been incurred but not yet reported. Recorded balances are based on reserve levels, which incorporate historical loss experience and judgments about the present and expected levels of cost per claim. Trends in actual experience are a significant factor in the determination of such reserves. We believe our estimated reserves for such claims are adequate, but actual experience in claim frequency and/or severity could materially differ from our estimates and affect our results of operations.
Workers' compensation, automobile liability and general liability insurance claims may take several years to completely settle. Consequently, actuarial estimates are required to project the ultimate cost that will be incurred to fully resolve the claims. A number of factors can affect the actual cost of a claim, including the length of time the claim remains open, trends in healthcare costs and the results of related litigation. Furthermore, claims may emerge in future years for events that occurred in a prior year at a rate that differs from previous actuarial projections. Changes in state legislation with respect to workers' compensation can affect the adequacy of our self-insurance accruals. All of these factors can result in revisions to prior actuarial projections and produce a material difference between estimated and actual operating results. Prior to 2017, outside actuarial studies were performed semi-annually and we used the studies to estimate the liability in intervening quarters. Beginning in 2017, outside actuarial studies are now performed quarterly as we believe this provides us with better quarterly estimates of our outstanding workers' compensation liability.
We sponsor a number of health and welfare insurance plans for our employees. These liabilities and related expenses are based on estimates of the number of employees and eligible dependents covered under the plans, anticipated medical usage by participants and overall trends in medical costs and inflation. Actual experience may differ from these estimates and, therefore, produce a material difference between estimated and actual operating results.
54
UNITED PARCEL SERVICE, INC. AND SUBSIDIARIES
MANAGEMENT'S DISCUSSION AND ANALYSIS OF FINANCIAL CONDITION AND
RESULTS OF OPERATIONS
Pension and Postretirement Medical Benefits
Our pension and other postretirement benefit costs are calculated using various actuarial assumptions and methodologies. These assumptions include discount rates, healthcare cost trend rates, inflation, compensation increase rates, expected returns on plan assets, mortality rates and other factors. The assumptions utilized in recording the obligations under our plans represent our best estimates, and we believe that they are reasonable, based on information as to historical experience and performance as well as other factors that might cause future expectations to differ from past trends.
Differences in actual experience or changes in assumptions may affect our pension and other postretirement obligations and future expense. The primary factors contributing to actuarial gains and losses each year are (1) changes in the discount rate used to value pension and postretirement benefit obligations as of the measurement date, (2) differences between the expected and the actual return on plan assets, (3) changes in demographic assumptions including mortality, (4) participant experience different from demographic assumptions and (5) changes in coordinating benefits with plans not sponsored by UPS.
We recognize changes in the fair value of plan assets and net actuarial gains or losses in excess of a corridor (defined as 10% of the greater of the fair value of plan assets or the plans' projected benefit obligations) in pension expense annually at December 31st each year. The remaining components of pension expense (herein referred to as "ongoing net periodic benefit cost"), primarily service and interest costs and the expected return on plan assets, are reported on a quarterly basis.
The following sensitivity analysis shows the impact of a 25 basis point change in the assumed discount rate, return on assets, and healthcare cost trend rate for our pension and postretirement benefit plans, and the resulting increase (decrease) on our obligations and expense as of, and for the year ended, December 31, 2017 (in millions).
Pension Plans | 25 Basis Point Increase |
| 25 Basis Point Decrease | ||||
Discount Rate: |
|
|
| ||||
Effect on ongoing net periodic benefit cost | $ | (49 | ) |
| $ | 50 | |
Effect on net periodic benefit cost for amounts recognized outside the 10% corridor | (616 | ) |
| 1,492 | | ||
Effect on projected benefit obligation | (1,883 | ) |
| 2,007 | | ||
Return on Assets: |
|
|
| ||||
Effect on ongoing net periodic benefit cost (1) | (84 | ) |
| 84 | | ||
Effect on net periodic benefit cost for amounts recognized outside the 10% corridor (2) | (37 | ) |
| 37 | | ||
|
|
|
| ||||
Postretirement Medical Plans |
|
|
| ||||
Discount Rate: |
|
|
| ||||
Effect on ongoing net periodic benefit cost | 3 | |
| (3 | ) | ||
Effect on net periodic benefit cost for amounts recognized outside the 10% corridor | (11 | ) |
| 13 | | ||
Effect on accumulated postretirement benefit obligation | (62 | ) |
| 73 | | ||
Healthcare Cost Trend Rate: |
|
|
| ||||
Effect on ongoing net periodic benefit cost | 1 | |
| (1 | ) | ||
Effect on net periodic benefit cost for amounts recognized outside the 10% corridor | 10 | |
| (10 | ) | ||
Effect on accumulated postretirement benefit obligation | 16 | |
| (17 | ) | ||
(1) | Amount calculated based on 25 basis point increase / decrease in the expected return on assets. |
(2) | Amount calculated based on 25 basis point increase / decrease in the actual return on assets. |
55
UNITED PARCEL SERVICE, INC. AND SUBSIDIARIES
MANAGEMENT'S DISCUSSION AND ANALYSIS OF FINANCIAL CONDITION AND
RESULTS OF OPERATIONS
Pension Backstop
UPS was a contributing employer to the Central States Pension Fund ("CSPF") until 2007 when we withdrew from the plan and fully funded our allocable share of unfunded vested benefits by paying a $6.1 billion withdrawal liability. Under a collective bargaining agreement with the International Brotherhood of Teamsters ("IBT"), UPS agreed to provide coordinating benefits in the UPS/IBT Full Time Employee Pension Plan ("UPS/IBT Plan") for UPS participants whose last employer was UPS and who had not retired as of January 1, 2008 ("the UPS Transfer Group") in the event that benefits are lawfully reduced by the CSPF in the future consistent with the terms of our withdrawal agreement with the CSPF.
In December 2014, Congress passed the Multiemployer Pension Reform Act ("MPRA") which for the first time ever allowed multiemployer pension plans to reduce benefit payments to retirees, subject to specific guidelines in the statute and government approval. In September 2015, the CSPF submitted a proposed pension benefit reduction plan to the U.S. Department of the Treasury under the MPRA. The CSPF plan proposed to reduce retirement benefits to the CSPF participants, including the UPS Transfer Group. We vigorously challenged the proposed benefit reduction plan because we believed that it did not comply with the law and the CSPF failed to comply with its contractual obligation to obtain our consent to reduce benefits to the UPS Transfer Group under the terms of the withdrawal agreement with the CSPF. On May 6, 2016, the U.S. Department of the Treasury rejected the proposed plan submitted by the CSPF, stating that it failed to satisfy a number of requirements set forth in the MPRA.
The CSPF has asserted that it will become insolvent in 2025, which could lead to the reduction of retirement benefits. Although there are numerous factors that could affect the CSPF's funding status, if the CSPF were to become insolvent as they have projected, UPS may be required to provide coordinating benefits, thereby increasing the current projected benefit obligation for the UPS/IBT Plan by approximately $ 4 billion. The CSPF has said that it believes a legislative solution to its funding status is necessary, and we expect that the CSPF will continue to explore options to avoid insolvency.
The potential obligation to pay coordinating benefits from the UPS/IBT Plan is subject to a number of significant uncertainties, including actions that may be taken by the CSPF, the federal government or others. These actions include whether the CSPF will submit a revised pension benefit reduction plan or otherwise seek federal government assistance, the extent to which benefits are paid by the Pension Benefit Guaranty Corporation, our ability to successfully defend our legal positions as well as the effect of discount rates, CSPF asset returns and various other actuarial assumptions.
We account for this potential obligation under Accounting Standards Codification Topic 715- Compensation- Retirement Benefits ("ASC 715"). Under ASC 715 we are required to provide a best estimate of various actuarial assumptions, including the eventual outcome of this matter, in measuring our pension benefit obligation at the December 31st measurement date. While we currently believe the most likely solution to this matter and the broader systemic problems facing multiemployer pension plans is intervention by the federal government, ASC 715 does not permit anticipation of changes in law in making a best estimate of pension liabilities. Our best estimate as of the measurement date of December 31, 2017, does not incorporate this solution. However, if a future change in law resulted in an obligation to provide coordinating benefits under the UPS/IBT Plan, it may be a significant event, and may require us to remeasure the plan assets and projected benefit obligation of the UPS/IBT Plan at the date the law is enacted.
Our best estimate of the next most likely outcome to resolve the CSPF's solvency concerns is that the CSPF will submit another benefit suspension application under the MPRA to forestall insolvency without reducing benefits to the UPS Transfer Group. If the CSPF attempts to reduce benefits for the UPS Transfer Group under a MPRA filing, we would be in a strong legal position to prevent that from occurring given that these benefits cannot be reduced without our consent and such a reduction, without first exhausting reductions to other groups in the CSPF, would be contrary to the statute. Accordingly, our best estimate as of the measurement date of December 31, 2017, is that there is no liability to be recognized for additional coordinating benefits of the UPS/IBT Plan. However, the projected benefit obligation could materially increase as the uncertainties are resolved. We will continue to assess the impact of these uncertainties on the projected benefit obligation of the UPS/IBT Plan in accordance with ASC 715.
56
UNITED PARCEL SERVICE, INC. AND SUBSIDIARIES
MANAGEMENT'S DISCUSSION AND ANALYSIS OF FINANCIAL CONDITION AND
RESULTS OF OPERATIONS
Depreciation, Residual Value and Impairment of Fixed Assets
As of December 31, 2017 , we had $ 22.118 billion of net fixed assets, the most significant category of which is aircraft. In accounting for fixed assets, we make estimates about the expected useful lives and the expected residual values of the assets, and the potential for impairment based on the fair values of the assets and the cash flows generated by these assets.
In estimating the lives and expected residual values of aircraft, we have relied upon actual experience with the same or similar aircraft types. Subsequent revisions to these estimates could be caused by changes to our maintenance program, changes in the utilization of the aircraft, governmental regulations on aging aircraft and changing market prices of new and used aircraft of the same or similar types. We periodically evaluate these estimates and assumptions, and adjust the estimates and assumptions as necessary. Adjustments to the expected lives and residual values are accounted for on a prospective basis through depreciation expense. In estimating cash flows, we project future volume levels for our different air express products in all geographic regions in which we do business. Adverse changes in these volume forecasts, or a shortfall of our actual volume compared with our projections, could result in our current aircraft capacity exceeding current or projected demand. This situation could lead to an excess of a particular aircraft, resulting in an aircraft impairment charge or a reduction of the expected life of an aircraft (thus resulting in increased depreciation expense).
We review long-lived assets for impairment when circumstances indicate the carrying amount of an asset may not be recoverable based on the undiscounted future cash flows of the asset. If the carrying amount of the asset is determined not to be recoverable, a write-down to fair value is recorded. Fair values are determined based on quoted market values, discounted cash flows or external appraisals, as appropriate. We review long-lived assets for impairment at the individual asset or the asset group level for which the lowest level of independent cash flows can be identified. The circumstances that would indicate potential impairment may include, but are not limited to, a significant change in the extent to which an asset is utilized and operating or cash flow losses associated with the use of the asset.
There were no impairment charges on our property, plant and equipment during 2017 , 2016 and 2015 .
Fair Value Measurements
In the normal course of business, we hold and issue financial instruments that contain elements of market risk, including derivatives, marketable securities, finance receivables, pension assets, other investments and debt. Certain of these financial instruments are required to be recorded at fair value, principally derivatives, marketable securities, pension assets and certain other investments. Fair values are based on listed market prices, when such prices are available. To the extent that listed market prices are not available, fair value is determined based on other relevant factors, including dealer price quotations. Certain financial instruments, including over-the-counter derivative instruments, are valued using pricing models that consider, among other factors, contractual and market prices, correlations, time value, credit spreads and yield curve volatility factors. Changes in the fixed income, foreign exchange and commodity markets will impact our estimates of fair value in the future, potentially affecting our results of operations. A quantitative sensitivity analysis of our exposure to changes in commodity prices, foreign currency exchange rates and interest rates is presented in the "Quantitative and Qualitative Disclosures about Market Risk" section of this report.
We allocate the fair value of purchase consideration to the tangible assets acquired, liabilities assumed and intangible assets acquired based on their estimated fair values. The excess of the fair value of purchase consideration over the fair values of these identifiable assets and liabilities is recorded as goodwill. Such valuations require management to make significant estimates and assumptions, especially with respect to intangible assets. Significant estimates in valuing certain intangible assets include, but are not limited to, future expected cash flows from acquired customers, technology and trade names from a market participant perspective, useful lives and discount rates. Management's estimates of fair value are based upon assumptions believed to be reasonable, but which are inherently uncertain and unpredictable and, as a result, actual results may differ from estimates. During the measurement period, which is one year from the acquisition date, we may record adjustments to the assets acquired and liabilities assumed, with the corresponding offset to goodwill. Upon the conclusion of the measurement period, any subsequent adjustments are recorded to earnings.
57
UNITED PARCEL SERVICE, INC. AND SUBSIDIARIES
MANAGEMENT'S DISCUSSION AND ANALYSIS OF FINANCIAL CONDITION AND
RESULTS OF OPERATIONS
Income Taxes
We make certain estimates and judgments in determining income tax expense for financial statement purposes. These estimates and judgments occur in the calculation of income by legal entity and jurisdiction, tax credits, benefits, and deductions, and in the calculation of deferred tax assets and liabilities, which arise from differences in the timing of recognition of revenue and expense for tax and financial statement purposes, as well as tax, interest and penalties related to uncertain tax positions. Significant changes to these estimates may result in an increase or decrease to our tax provision in a subsequent period.
We assess the likelihood that we will be able to recover our deferred tax assets. If recovery is not likely, we must increase our provision for taxes by recording a valuation allowance against the deferred tax assets that we estimate will not ultimately be recoverable. We believe that we will ultimately recover a substantial majority of the deferred tax assets recorded on our consolidated balance sheets. However, should there be a change in our ability to recover our deferred tax assets, our tax provision would increase in the period in which we determined that the recovery was not likely.
The calculation of our tax liabilities involves dealing with uncertainties in the application of complex tax regulations. We recognize liabilities for uncertain tax positions based on a two-step process. The first step is to evaluate the tax position for recognition by determining if the weight of available evidence indicates that it is more likely than not that the position will be sustained on audit, including resolution of related appeals or litigation processes, if any. Once it is determined that the position meets the recognition threshold, the second step requires us to estimate and measure the largest amount of tax benefit that is more likely than not to be realized upon ultimate settlement. The difference between the amount of recognizable tax benefit and the total amount of tax benefit from positions filed or to be filed with the tax authorities is recorded as a liability for uncertain tax benefits. It is inherently difficult and subjective to estimate such amounts, as we have to determine the probability of various possible outcomes. We reevaluate uncertain tax positions on a quarterly basis. This evaluation is based on factors including, but not limited to, changes in facts or circumstances, changes in tax law, effectively settled issues under audit, and new audit activity. Such a change in recognition or measurement could result in the recognition of a tax benefit or an additional charge to the tax provision.
See note 13 to the audited consolidated financial statements for a discussion of impacts of the Tax Act.
58
UNITED PARCEL SERVICE, INC. AND SUBSIDIARIES
MANAGEMENT'S DISCUSSION AND ANALYSIS OF FINANCIAL CONDITION AND
RESULTS OF OPERATIONS
Item 7A. | Quantitative and Qualitative Disclosures about Market Risk |
We are exposed to market risk from changes in certain commodity prices, foreign currency exchange rates and interest rates. All of these market risks arise in the normal course of business, as we do not engage in speculative trading activities. In order to manage the risk arising from these exposures, we utilize a variety of commodity, foreign exchange and interest rate forward contracts, options and swaps. A discussion of our accounting policies for derivative instruments and further disclosures are provided in note 15 to the consolidated financial statements.
Commodity Price Risk
We are exposed to changes in the prices of refined fuels, principally jet-A, diesel and unleaded gasoline, as well as changes in the price of natural gas. Currently, the fuel surcharges that we apply to our domestic and international package and LTL services are the primary means of reducing the risk of adverse fuel price changes. In order to mitigate the impact of fuel surcharges imposed on us by outside carriers, we regularly adjust the rates we charge for our freight brokerage, inter-modal and truckload services. Additionally, we periodically use a combination of option, forward and futures contracts to provide partial protection from changing fuel and energy prices. As of December 31, 2017 and 2016 , however, we had no commodity contracts outstanding.
Foreign Currency Exchange Risk
We have foreign currency risks related to our revenue, operating expenses and financing transactions in currencies other than the local currencies in which we operate. We are exposed to currency risk from the potential changes in functional currency values of our foreign currency-denominated assets, liabilities and cash flows. Our most significant foreign currency exposures relate to the Euro, British Pound Sterling, Canadian Dollar, Chinese Renminbi and Hong Kong Dollar. We use forwards as well as a combination of purchased and written options to hedge forecasted cash flow currency exposures. These derivative instruments generally cover forecasted foreign currency exposures for periods of 12 to 48 months. We also utilize forward contracts to hedge portions of our anticipated cash settlements of intercompany transactions subject to foreign currency remeasurement.
Interest Rate Risk
We have issued debt instruments, including debt associated with capital leases, that accrue expense at fixed and floating rates of interest. We use a combination of interest rate swaps as part of our program to manage the fixed and floating interest rate mix of our total debt portfolio and related overall cost of borrowing. The notional amount, interest payment and maturity dates of the swaps match the terms of the associated debt. We also utilize forward starting swaps and similar instruments to lock in all or a portion of the borrowing cost of anticipated debt issuances. Our floating-rate debt and interest rate swaps subject us to risk resulting from changes in short-term (primarily LIBOR) interest rates.
We also are subject to interest rate risk with respect to our pension and postretirement benefit obligations, as changes in interest rates will effectively increase or decrease our liabilities associated with these benefit plans, which also results in changes to the amount of pension and postretirement benefit expense recognized in future periods.
We have investments in debt securities, as well as cash-equivalent instruments, some of which accrue income at variable rates of interest. Additionally, we hold a portfolio of finance receivables that accrue income at fixed and floating rates of interest.
Sensitivity Analysis
The following analysis provides quantitative information regarding our exposure to foreign currency exchange risk, interest rate risk and equity price risk embedded in our existing financial instruments. We utilize valuation models to evaluate the sensitivity of the fair value of financial instruments with exposure to market risk that assume instantaneous, parallel shifts in exchange rates, interest rate yield curves and commodity and equity prices. For options and instruments with non-linear returns, models appropriate to the instrument are utilized to determine the impact of market shifts.
59
UNITED PARCEL SERVICE, INC. AND SUBSIDIARIES
MANAGEMENT'S DISCUSSION AND ANALYSIS OF FINANCIAL CONDITION AND
RESULTS OF OPERATIONS
There are certain limitations inherent in the sensitivity analyses presented, primarily due to the assumption that exchange rates change in a parallel fashion and that interest rates change instantaneously. In addition, the analyses are unable to reflect the complex market reactions that normally would arise from the market shifts modeled. While this is our best estimate of the impact of the specified interest rate scenarios, these estimates should not be viewed as forecasts. We adjust the fixed and floating interest rate mix of our interest rate sensitive assets and liabilities in response to changes in market conditions. Additionally, changes in the fair value of foreign currency derivatives and commodity derivatives are offset by changes in the cash flows of the underlying hedged foreign currency and commodity transactions.
| Shock-Test Result As of December 31, | ||||||
(in millions) | 2017 |
| 2016 | ||||
Change in Fair Value: |
|
|
| ||||
Currency Derivatives (1) | $ | (447 | ) |
| $ | (437 | ) |
Change in Annual Interest Expense: |
|
|
| ||||
Variable Rate Debt (2) | $ | 51 | |
| $ | 49 | |
Interest Rate Derivatives (2) | $ | 55 | |
| $ | 58 | |
Change in Annual Interest Income: |
|
|
| ||||
Marketable Securities (3) | $ | 2 | |
| $ | - | |
(1) | The potential change in fair value from a hypothetical 10% weakening of the U.S. Dollar against local currency exchange rates across all maturities. |
(2) | The potential change in annual interest expense resulting from a hypothetical 100 basis point increase in short-term interest rates, applied to our variable rate debt and swap instruments (excluding hedges of anticipated debt issuances). |
(3) | The potential change in interest income resulting from a hypothetical 100 basis point increase in short-term interest rates, applied to our variable rate investment holdings. |
The sensitivity of our pension and postretirement benefit obligations to changes in interest rates is quantified in "Critical Accounting Policies and Estimates". The sensitivity in the fair value and interest income of our finance receivables due to changes in interest rates was not material as of December 31, 2017 and 2016 .
60
Item 8. | Financial Statements and Supplementary Data |
Table of Contents
|
|
Report of Independent Registered Public Accounting Firm | 62 |
Consolidated Balance Sheets | 63 |
Statements of Consolidated Income | 64 |
Statements of Consolidated Comprehensive Income | 64 |
Statements of Consolidated Cash Flows | 65 |
Notes to Consolidated Financial Statements | 66 |
Note 1-Summary of Accounting Policies | 66 |
Note 2-Cash and Investments | 73 |
Note 3-Property, Plant and Equipment | 78 |
Note 4-Company-Sponsored Employee Benefit Plans | 78 |
Note 5-Multiemployer Employee Benefit Plans | 89 |
Note 6-Goodwill and Intangible Assets | 93 |
Note 7-Business Acquisitions | 95 |
Note 8-Debt and Financing Arrangements | 96 |
Note 9-Legal Proceedings and Contingencies | 102 |
Note 10-Shareowners' Equity | 104 |
Note 11-Stock-Based Compensation | 107 |
Note 12-Segment and Geographic Information | 111 |
Note 13-Income Taxes | 114 |
Note 14-Earnings Per Share | 119 |
Note 15-Derivative Instruments and Risk Management | 119 |
Note 16-Quarterly Information (Unaudited) | 125 |
61
Report of Independent Registered Public Accounting Firm
Board of Directors and Shareowners
United Parcel Service, Inc.
Atlanta, Georgia
Opinion on the Financial Statements
We have audited the accompanying consolidated balance sheets of United Parcel Service, Inc. and subsidiaries (the "Company") as of December 31, 2017 and 2016 , the related consolidated statements of income, comprehensive income, and cash flows for each of the three years in the period ended December 31, 2017 , and the related notes (collectively referred to as the "financial statements"). In our opinion, the financial statements present fairly, in all material respects, the financial position of the Company as of December 31, 2017 and 2016 , and the results of its operations and its cash flows for each of the three years in the period ended December 31, 2017 , in conformity with accounting principles generally accepted in the United States of America.
We have also audited, in accordance with the standards of the Public Company Accounting Oversight Board (United States) ("PCAOB"), the Company's internal control over financial reporting as of December 31, 2017 , based on criteria established in Internal Control - Integrated Framework (2013) issued by the Committee of Sponsoring Organizations of the Treadway Commission and our report dated February 21, 2018 , expressed an unqualified opinion on the Company's internal control over financial reporting.
Basis for Opinion
These financial statements are the responsibility of the Company's management. Our responsibility is to express an opinion on the Company's financial statements based on our audits. We are a public accounting firm registered with the PCAOB and are required to be independent with respect to the Company in accordance with the U.S. federal securities laws and the applicable rules and regulations of the Securities and Exchange Commission and the PCAOB.
We conducted our audits in accordance with the standards of the PCAOB. Those standards require that we plan and perform the audit to obtain reasonable assurance about whether the financial statements are free of material misstatement, whether due to error or fraud. Our audits included performing procedures to assess the risks of material misstatement of the financial statements, whether due to error or fraud, and performing procedures that respond to those risks. Such procedures included examining, on a test basis, evidence regarding the amounts and disclosures in the financial statements. Our audits also included evaluating the accounting principles used and significant estimates made by management, as well as evaluating the overall presentation of the financial statements. We believe that our audits provide a reasonable basis for our opinion.
/s/ Deloitte & Touche LLP
Atlanta, Georgia
February 21, 2018
We have served as the Company's auditor since 1969.
62
UNITED PARCEL SERVICE, INC. AND SUBSIDIARIES
CONSOLIDATED BALANCE SHEETS
(In millions)
| December 31, | ||||||
| 2017 |
| 2016 | ||||
ASSETS |
|
|
| ||||
Current Assets: |
|
|
| ||||
Cash and cash equivalents | $ | 3,320 | |
| $ | 3,476 | |
Marketable securities | 749 | |
| 1,091 | | ||
Accounts receivable, net | 8,773 | |
| 7,695 | | ||
Current income taxes receivable | 1,573 | |
| 633 | | ||
Other current assets | 1,133 | |
| 954 | | ||
Total Current Assets | 15,548 | |
| 13,849 | | ||
Property, Plant and Equipment, Net | 22,118 | |
| 18,800 | | ||
Goodwill | 3,872 | |
| 3,757 | | ||
Intangible Assets, Net | 1,964 | |
| 1,758 | | ||
Investments and Restricted Cash | 483 | |
| 476 | | ||
Deferred Income Tax Assets | 265 | |
| 591 | | ||
Other Non-Current Assets | 1,153 | |
| 1,146 | | ||
Total Assets | $ | 45,403 | |
| $ | 40,377 | |
LIABILITIES AND SHAREOWNERS' EQUITY |
|
|
| ||||
Current Liabilities: |
|
|
| ||||
Current maturities of long-term debt and commercial paper | $ | 4,011 | |
| $ | 3,681 | |
Accounts payable | 3,872 | |
| 3,042 | | ||
Accrued wages and withholdings | 2,521 | |
| 2,317 | | ||
Hedge margin liabilities | 17 | |
| 575 | | ||
Self-insurance reserves | 705 | |
| 670 | | ||
Accrued group welfare and retirement plan contributions | 677 | |
| 598 | | ||
Other current liabilities | 905 | |
| 847 | | ||
Total Current Liabilities | 12,708 | |
| 11,730 | | ||
Long-Term Debt | 20,278 | |
| 12,394 | | ||
Pension and Postretirement Benefit Obligations | 7,061 | |
| 12,694 | | ||
Deferred Income Tax Liabilities | 757 | |
| 112 | | ||
Self-Insurance Reserves | 1,765 | |
| 1,794 | | ||
Other Non-Current Liabilities | 1,804 | |
| 1,224 | | ||
Shareowners' Equity: |
|
|
| ||||
Class A common stock (173 and 180 shares issued in 2017 and 2016) | 2 | |
| 2 | | ||
Class B common stock (687 and 689 shares issued in 2017 and 2016) | 7 | |
| 7 | | ||
Additional paid-in capital | - | |
| - | | ||
Retained earnings | 5,858 | |
| 4,879 | | ||
Accumulated other comprehensive loss | (4,867 | ) |
| (4,483 | ) | ||
Deferred compensation obligations | 37 | |
| 45 | | ||
Less: Treasury stock (1 share in 2017 and 2016) | (37 | ) |
| (45 | ) | ||
Total Equity for Controlling Interests | 1,000 | |
| 405 | | ||
Noncontrolling Interests | 30 | |
| 24 | | ||
Total Shareowners' Equity | 1,030 | |
| 429 | | ||
Total Liabilities and Shareowners' Equity | $ | 45,403 | |
| $ | 40,377 | |
See notes to consolidated financial statements.
63
UNITED PARCEL SERVICE, INC. AND SUBSIDIARIES
STATEMENTS OF CONSOLIDATED INCOME
(In millions, except per share amounts)
| Years Ended December 31, | ||||||||||
| 2017 |
| 2016 |
| 2015 | ||||||
Revenue | $ | 65,872 | |
| $ | 60,906 | |
| $ | 58,363 | |
Operating Expenses: |
|
|
|
|
| ||||||
Compensation and benefits | 34,588 | |
| 34,770 | |
| 31,028 | | |||
Repairs and maintenance | 1,600 | |
| 1,538 | |
| 1,400 | | |||
Depreciation and amortization | 2,282 | |
| 2,224 | |
| 2,084 | | |||
Purchased transportation | 10,989 | |
| 9,129 | |
| 8,043 | | |||
Fuel | 2,690 | |
| 2,118 | |
| 2,482 | | |||
Other occupancy | 1,155 | |
| 1,037 | |
| 1,022 | | |||
Other expenses | 5,039 | |
| 4,623 | |
| 4,636 | | |||
Total Operating Expenses | 58,343 | |
| 55,439 | |
| 50,695 | | |||
Operating Profit | 7,529 | |
| 5,467 | |
| 7,668 | | |||
Other Income and (Expense): |
|
|
|
|
| ||||||
Investment income and other | 72 | |
| 50 | |
| 15 | | |||
Interest expense | (453 | ) |
| (381 | ) |
| (341 | ) | |||
Total Other Income and (Expense) | (381 | ) |
| (331 | ) |
| (326 | ) | |||
Income Before Income Taxes | 7,148 | |
| 5,136 | |
| 7,342 | | |||
Income Tax Expense | 2,238 | |
| 1,705 | |
| 2,498 | | |||
Net Income | $ | 4,910 | |
| $ | 3,431 | |
| $ | 4,844 | |
Basic Earnings Per Share | $ | 5.64 | |
| $ | 3.89 | |
| $ | 5.38 | |
Diluted Earnings Per Share | $ | 5.61 | |
| $ | 3.87 | |
| $ | 5.35 | |
STATEMENTS OF CONSOLIDATED COMPREHENSIVE INCOME (LOSS)
(In millions)
| Years Ended December 31, | ||||||||||
| 2017 |
| 2016 |
| 2015 | ||||||
Net Income | $ | 4,910 | |
| $ | 3,431 | |
| $ | 4,844 | |
Change in foreign currency translation adjustment, net of tax | 86 | |
| (119 | ) |
| (440 | ) | |||
Change in unrealized gain (loss) on marketable securities, net of tax | (1 | ) |
| - | |
| (1 | ) | |||
Change in unrealized gain (loss) on cash flow hedges, net of tax | (321 | ) |
| (112 | ) |
| 6 | | |||
Change in unrecognized pension and postretirement benefit costs, net of tax | (148 | ) |
| (712 | ) |
| 489 | | |||
Comprehensive Income (Loss) | $ | 4,526 | |
| $ | 2,488 | |
| $ | 4,898 | |
See notes to consolidated financial statements.
64
UNITED PARCEL SERVICE, INC. AND SUBSIDIARIES
STATEMENTS OF CONSOLIDATED CASH FLOWS
(In millions)
| Years Ended December 31, | ||||||||||
| 2017 |
| 2016 |
| 2015 | ||||||
Cash Flows From Operating Activities: |
|
|
|
|
| ||||||
Net income | $ | 4,910 | |
| $ | 3,431 | |
| $ | 4,844 | |
Adjustments to reconcile net income to net cash from operating activities: |
|
|
|
|
| ||||||
Depreciation and amortization | 2,282 | |
| 2,224 | |
| 2,084 | | |||
Pension and postretirement benefit expense | 1,643 | |
| 3,725 | |
| 1,189 | | |||
Pension and postretirement benefit contributions | (7,794 | ) |
| (2,668 | ) |
| (1,229 | ) | |||
Self-insurance reserves | - | |
| (21 | ) |
| (80 | ) | |||
Deferred tax expense | 1,230 | |
| 123 | |
| 540 | | |||
Stock compensation expense | 584 | |
| 591 | |
| 574 | | |||
Other (gains) losses | 37 | |
| (198 | ) |
| (185 | ) | |||
Changes in assets and liabilities, net of effect of acquisitions: |
|
|
|
|
| ||||||
Accounts receivable | (1,022 | ) |
| (704 | ) |
| (452 | ) | |||
Other assets | (982 | ) |
| (14 | ) |
| 414 | | |||
Accounts payable | 592 | |
| 461 | |
| (147 | ) | |||
Accrued wages and withholdings | 193 | |
| 109 | |
| (63 | ) | |||
Other liabilities | (241 | ) |
| (561 | ) |
| (6 | ) | |||
Other operating activities | 47 | |
| (25 | ) |
| (53 | ) | |||
Net cash from operating activities | 1,479 | |
| 6,473 | |
| 7,430 | | |||
Cash Flows From Investing Activities: |
|
|
|
|
| ||||||
Capital expenditures | (5,227 | ) |
| (2,965 | ) |
| (2,379 | ) | |||
Proceeds from disposals of property, plant and equipment | 24 | |
| 88 | |
| 26 | | |||
Purchases of marketable securities | (1,634 | ) |
| (4,816 | ) |
| (7,415 | ) | |||
Sales and maturities of marketable securities | 1,990 | |
| 5,724 | |
| 6,388 | | |||
Net decrease in finance receivables | 5 | |
| 9 | |
| 5 | | |||
Cash paid for business acquisitions | (134 | ) |
| (547 | ) |
| (1,904 | ) | |||
Other investing activities | 1 | |
| (59 | ) |
| (30 | ) | |||
Net cash used in investing activities | (4,975 | ) |
| (2,566 | ) |
| (5,309 | ) | |||
Cash Flows From Financing Activities: |
|
|
|
|
| ||||||
Net change in short-term debt | (250 | ) |
| (88 | ) |
| 2,529 | | |||
Proceeds from long-term borrowings | 12,016 | |
| 5,927 | |
| 3,783 | | |||
Repayments of long-term borrowings | (3,939 | ) |
| (3,805 | ) |
| (2,724 | ) | |||
Purchases of common stock | (1,813 | ) |
| (2,678 | ) |
| (2,702 | ) | |||
Issuances of common stock | 247 | |
| 245 | |
| 249 | | |||
Dividends | (2,771 | ) |
| (2,643 | ) |
| (2,525 | ) | |||
Other financing activities | (203 | ) |
| (98 | ) |
| (175 | ) | |||
Net cash from (used in) financing activities | 3,287 | |
| (3,140 | ) |
| (1,565 | ) | |||
Effect Of Exchange Rate Changes On Cash And Cash Equivalents | 53 | |
| (21 | ) |
| (117 | ) | |||
Net Increase (Decrease) In Cash And Cash Equivalents | (156 | ) |
| 746 | |
| 439 | | |||
Cash And Cash Equivalents: |
|
|
|
|
| ||||||
Beginning of period | 3,476 | |
| 2,730 | |
| 2,291 | | |||
End of period | $ | 3,320 | |
| $ | 3,476 | |
| $ | 2,730 | |
Cash Paid During The Period For: |
|
|
|
|
| ||||||
Interest (net of amount capitalized) | $ | 428 | |
| $ | 373 | |
| $ | 345 | |
Income taxes (net of refunds and overpayments) | $ | 1,559 | |
| $ | 2,064 | |
| $ | 1,913 | |
See notes to consolidated financial statements.
65
UNITED PARCEL SERVICE, INC. AND SUBSIDIARIES
NOTES TO CONSOLIDATED FINANCIAL STATEMENTS
NOTE 1. SUMMARY OF ACCOUNTING POLICIES
Basis of Financial Statements and Business Activities
The accompanying consolidated financial statements have been prepared in accordance with accounting principles generally accepted in the United States ("GAAP"), and include the accounts of United Parcel Service, Inc., and all of its consolidated subsidiaries (collectively "UPS" or the "Company"). All intercompany balances and transactions have been eliminated.
UPS concentrates its operations in the field of transportation services, primarily domestic and international letter and package delivery. Through our Supply Chain & Freight subsidiaries, we are also a global provider of specialized transportation, logistics and financial services.
Use of Estimates
The preparation of our consolidated financial statements requires the use of estimates and assumptions that affect the reported amounts of assets and liabilities, the reported amounts of revenues and expenses and the disclosure of contingencies. Estimates have been prepared on the basis of the most current and best information, and actual results could differ materially from those estimates.
Revenue Recognition
U.S. Domestic and International Package Operations -Revenue is recognized upon delivery of a letter or package.
Forwarding and Logistics -Freight forwarding revenue and the expense related to the transportation of freight are recognized at the time the services are completed. Truckload freight brokerage revenue and related transportation costs are recognized upon delivery of the shipment by a third-party carrier. Logistics and distribution revenue is recognized upon performance of the service provided. Customs brokerage revenue is recognized upon completing documents necessary for customs entry purposes.
UPS Freight -Revenue is recognized upon delivery of a less-than-truckload ("LTL") or truckload ("TL") shipment.
In our transportation businesses, we utilize independent contractors and third-party carriers in the performance of some transportation services. In situations where we act as principal party to the transaction, we recognize revenue on a gross basis; in circumstances where we act as an agent, we recognize revenue net of the cost of the purchased transportation.
Financial Services -Income on loans and direct finance leases is recognized on the effective interest method. Accrual of interest income is suspended at the earlier of the time at which collection of an account becomes doubtful or the account becomes 90 days delinquent. Income on operating leases is recognized on the straight-line method over the terms of the underlying leases.
Cash and Cash Equivalents
Cash and cash equivalents consist of highly liquid investments that are readily convertible into cash. We consider securities with maturities of three months or less, when purchased, to be cash equivalents. The carrying amount of these securities approximates fair value because of the short-term maturity of these instruments.
Investments
Marketable securities are either classified as trading or available-for-sale securities and are carried at fair value. Unrealized gains and losses on trading securities are reported as investment income and other on the statements of consolidated income. Unrealized gains and losses on available-for-sale securities are reported as accumulated other comprehensive income ("AOCI"), a separate component of shareowners' equity. The amortized cost of debt securities is adjusted for amortization of premiums and accretion of discounts to maturity. Such amortization and accretion is included in investment income and other, along with interest and dividends. The cost of securities sold is based on the specific identification method; realized gains and losses resulting from such sales are included in investment income and other.
66
UNITED PARCEL SERVICE, INC. AND SUBSIDIARIES
NOTES TO CONSOLIDATED FINANCIAL STATEMENTS
We periodically review our available-for-sale investments for indications of other-than-temporary impairment considering many factors, including the extent and duration to which a security's fair value has been less than its cost, overall economic and market conditions and the financial condition and specific prospects for the issuer. Impairment of available-for-sale securities results in a charge to income when a market decline below cost is other-than-temporary.
Accounts Receivable
Losses on accounts receivable are recognized when they are incurred, which requires us to make our best estimate of the probable losses inherent in our customer receivables at each balance sheet date. These estimates require consideration of historical loss experience, adjusted for current conditions, trends in customer payment frequency and judgments about the probable effects of relevant observable data, including present economic conditions and the financial health of specific customers and market sectors. Our risk management process includes standards and policies for reviewing major account exposures and concentrations of risk.
Our total allowance for doubtful accounts as of December 31, 2017 and 2016 was $ 104 and $ 102 million, respectively. Our total provision for doubtful accounts charged to expense during the years ended December 31, 2017 , 2016 and 2015 was $ 133 , $ 116 and $ 121 million, respectively.
Inventories
Fuel and other materials and supplies inventories are recognized as inventory when purchased, and then charged to expense when used in our operations. Jet fuel, diesel and unleaded gasoline inventories are valued at the lower of average cost or market. Total inventories were $ 404 and $ 342 million as of December 31, 2017 and 2016 , respectively, and are included in "other current assets" on the consolidated balance sheets.
Property, Plant and Equipment
Property, plant and equipment are carried at cost. Depreciation and amortization are provided by the straight-line method over the estimated useful lives of the assets, which are as follows: Vehicles- 3 to 15 years; Aircraft- 12 to 30 years; Buildings- 20 to 40 years; Leasehold Improvements-lesser of asset useful life or lease term; Plant Equipment- 3 to 20 years; Technology Equipment- 3 to 5 years. The costs of major airframe and engine overhauls, as well as routine maintenance and repairs, are charged to expense as incurred.
Interest incurred during the construction period of certain property, plant and equipment is capitalized until the underlying assets are placed in service, at which time amortization of the capitalized interest begins, straight-line, over the estimated useful lives of the related assets. Capitalized interest was $ 49 , $ 14 and $ 13 million for 2017 , 2016 , and 2015 , respectively.
We review long-lived assets for impairment when circumstances indicate the carrying amount of an asset may not be recoverable based on the undiscounted future cash flows of the asset. If the carrying amount of the asset is determined not to be recoverable, a write-down to fair value is recorded. Fair values are determined based on quoted market values, discounted cash flows, or external appraisals, as appropriate. We review long-lived assets for impairment at the individual asset or the asset group level for which the lowest level of independent cash flows can be identified.
Goodwill and Intangible Assets
Costs of purchased businesses in excess of net identifiable assets acquired (goodwill), and indefinite-lived intangible assets are tested for impairment at least annually, unless changes in circumstances indicate an impairment may have occurred sooner. We are required to test goodwill on a "reporting unit" basis. A reporting unit is the operating segment unless, for businesses within that operating segment, discrete financial information is prepared and regularly reviewed by management, in which case such a component business is the reporting unit.
During the third quarter of 2017, we changed the measurement date of our annual goodwill impairment test from October 1st to July 1st. This change better aligns the timing of the goodwill impairment test with our long-term business planning process. The change was not material to our consolidated financial statements as it did not result in the delay, acceleration or avoidance of an impairment charge.
67
UNITED PARCEL SERVICE, INC. AND SUBSIDIARIES
NOTES TO CONSOLIDATED FINANCIAL STATEMENTS
In assessing goodwill for impairment, we initially evaluate qualitative factors to determine if it is more likely than not that the fair value of a reporting unit is less than its carrying amount. We consider several factors, including macroeconomic conditions, industry and market conditions, overall financial performance of the reporting unit, changes in management, strategy or customers and relevant reporting unit-specific events such as a change in the carrying amount of net assets, a more likely than not expectation of selling or disposing all, or a portion, of a reporting unit, and the testing for recoverability of a significant asset group within a reporting unit. If this qualitative assessment results in a conclusion that it is more likely than not that the fair value of a reporting unit exceeds the carrying value, then no further testing is performed for that reporting unit.
If the qualitative assessment is not conclusive and it is necessary to calculate the fair value of a reporting unit, then we utilize a two-step process to test goodwill for impairment. First, a comparison of the fair value of the applicable reporting unit with the aggregate carrying value, including goodwill, is performed. If the carrying amount of a reporting unit exceeds its calculated fair value, then the second step is performed, and an impairment charge is recognized for the amount, if any, by which the carrying amount of goodwill exceeds its implied fair value. We primarily determine the fair value of our reporting units using a discounted cash flow model and supplement this with observable valuation multiples for comparable companies, as appropriate.
A trade name with a carrying value of $200 million and licenses with a carrying value of $ 5 million as of December 31, 2017 are considered to be indefinite-lived intangibles, and therefore are not amortized. Indefinite-lived intangible assets are reviewed for impairment at least annually. We determined that the income approach, specifically the relief from royalty method, is the most appropriate valuation method to estimate the fair value of the trade name. The estimated fair value of the trade name is compared to the carrying value of the asset. If the carrying value of the trade name exceeds its estimated fair value, an impairment charge is recognized for the amount by which the carrying amount of the asset exceeds its fair value.
Finite-lived intangible assets, including trademarks, licenses, patents, customer lists, non-compete agreements and franchise rights are amortized on a straight-line basis over the estimated useful lives of the assets, which range from 2 to 22 years. Capitalized software is generally amortized over 7 years.
Self-Insurance Accruals
We self-insure costs associated with workers' compensation claims, automotive liability, health and welfare and general business liabilities, up to certain limits. Insurance reserves are established for estimates of the loss that we will ultimately incur on reported claims, as well as estimates of claims that have been incurred but not yet reported. Recorded balances are based on reserve levels, which incorporate historical loss experience and judgments about the present and expected levels of cost per claim. Trends in actual experience are a significant factor in the determination of such reserves.
Workers' compensation, automobile liability and general liability insurance claims may take several years to completely settle. Consequently, actuarial estimates are required to project the ultimate cost that will be incurred to fully resolve the claims. A number of factors can affect the actual cost of a claim, including the length of time the claim remains open, trends in healthcare costs and the results of related litigation. Furthermore, claims may emerge in future years for events that occurred in a prior year at a rate that differs from previous actuarial projections. Changes in state legislation with respect to workers' compensation can affect the adequacy of our self-insurance accruals. All of these factors can result in revisions to prior actuarial projections and produce a material difference between estimated and actual operating results. Prior to 2017, outside actuarial studies were performed semi-annually and we used the studies to estimate the liability in intervening quarters. Beginning in 2017, outside actuarial studies are now performed quarterly as we believe this provides us with better quarterly estimates of our outstanding workers' compensation liability.
We sponsor a number of health and welfare insurance plans for our employees. These liabilities and related expenses are based on estimates of the number of employees and eligible dependents covered under the plans, anticipated medical usage by participants and overall trends in medical costs and inflation.
Pension and Postretirement Benefits
We incur certain employment-related expenses associated with pension and postretirement medical benefits. These pension and postretirement medical benefit costs for company-sponsored benefit plans are calculated using various actuarial assumptions and methodologies, including discount rates, expected returns on plan assets, healthcare cost trend rates, inflation, compensation increase rates, mortality rates and coordination of benefits with plans not sponsored by UPS. Actuarial assumptions are reviewed on an annual basis, unless circumstances require an interim remeasurement for any of our plans.
68
UNITED PARCEL SERVICE, INC. AND SUBSIDIARIES
NOTES TO CONSOLIDATED FINANCIAL STATEMENTS
We recognize changes in the fair value of plan assets and net actuarial gains or losses in excess of a corridor (defined as 10% of the greater of the fair value of plan assets or the plans' projected benefit obligations) in pension expense annually at December 31st each year. The remaining components of pension expense, primarily service and interest costs and the expected return on plan assets, are recorded on a quarterly basis.
Effective July 1, 2016, the UPS Retirement Plan was closed to new non-union participants. For eligible employees hired after July 1, 2016, UPS contributes annually to a defined contribution plan. We recognize expense for the required contribution quarterly, and we recognize a liability for any contributions due and unpaid (included in "other current liabilities").
During June 2017, we amended the UPS Retirement Plan and Excess Coordinating Plans to cease accrual of additional benefits for future service for non-union participants effective January 1, 2023. We remeasured plan assets and pension benefit obligations compensation for the affected pension plans as of June 30, 2017 to recognize the impact of this change.
We participate in a number of trustee-managed multiemployer pension and health and welfare plans for employees covered under collective bargaining agreements. Our contributions to these plans are determined in accordance with the respective collective bargaining agreements. We recognize expense for the contractually required contribution for each period, and we recognize a liability for any contributions due and unpaid (included in "other current liabilities").
Income Taxes
Income taxes are accounted for on an asset and liability approach that requires the recognition of deferred tax assets and liabilities for the expected future tax consequences of events that have been recognized in our consolidated financial statements or tax returns. In estimating future tax consequences, we generally consider all expected future events other than proposed changes in the tax law or rates. Valuation allowances are provided if it is more likely than not that a deferred tax asset will not be realized.
We recognize liabilities for uncertain tax positions based on a two-step process. The first step is to evaluate the tax position for recognition by determining if the weight of available evidence indicates that it is more likely than not that the position will be sustained on audit, including resolution of related appeals or litigation processes, if any. Once it is determined that the position meets the recognition threshold, the second step requires us to estimate and measure the largest amount of tax benefit that is more likely than not to be realized upon ultimate settlement. The difference between the amount of recognizable tax benefit and the total amount of tax benefit from positions filed or to be filed with the tax authorities is recorded as a liability for uncertain tax benefits. It is inherently difficult and subjective to estimate such amounts, as we have to determine the probability of various possible outcomes. We reevaluate uncertain tax positions on a quarterly basis. This evaluation is based on factors including, but not limited to, changes in facts or circumstances, changes in tax law, effectively settled issues under audit and new audit atctivity. Such a change in recognition or measurement could result in the recognition of a tax benefit or an additional charge to the tax provision.
In January 2018, the FASB released guidance on the accounting for tax on the global intangible low-taxed income ("GILTI") provisions of the Tax Cuts and Jobs Act (the "Tax Act"). The GILTI provisions impose a tax on foreign income in excess of a deemed return on tangible assets of foreign corporations. The guidance indicates that either accounting for deferred taxes related to GILTI inclusions or treating any taxes on GILTI inclusions as period costs are both acceptable methods subject to an accounting policy election. We elect to treat any potential GILTI inclusions as period costs.
Foreign Currency Translation and Remeasurement
We translate the results of operations of our foreign subsidiaries using average exchange rates during each period, whereas balance sheet accounts are translated using exchange rates at the end of each period. Balance sheet currency translation adjustments are recorded in AOCI. Pre-tax foreign currency transaction gains from remeasurement, net of hedging, included in other operating expenses, investment income and interest expense were $ 3 , $ 5 and $ 7 million in 2017 , 2016 and 2015 , respectively.
69
UNITED PARCEL SERVICE, INC. AND SUBSIDIARIES
NOTES TO CONSOLIDATED FINANCIAL STATEMENTS
Stock-Based Compensation
All share-based awards to employees are measured based on their fair values and expensed over the period during which an employee is required to provide service in exchange for the award (the vesting period), less estimated forfeitures. We issue employee share-based awards under the UPS Incentive Compensation Plan that are subject to specific vesting conditions; including service conditions, where the awards cliff vest or vest ratably over a three or five year period (the "nominal vesting period") or at the date the employee retires (as defined by the plan), if earlier. Compensation cost is generally recognized immediately for awards granted to retirement-eligible employees, or over the period from the grant date to the date retirement eligibility is achieved, if that is expected to occur during the nominal vesting period. We estimate forfeiture rates based on historical rates of forfeitures for awards with similar characteristics, historical rates of employee turnover and the nature and terms of the vesting conditions of the awards. We reevaluate our forfeiture rates on an annual basis.
Fair Value Measurements
Our financial assets and liabilities measured at fair value on a recurring basis have been categorized based upon a fair value hierarchy. Level 1 inputs utilize quoted prices in active markets for identical assets or liabilities. Level 2 inputs are based on other observable market data, such as quoted prices for similar assets and liabilities, and inputs other than quoted prices that are observable, such as interest rates and yield curves. Level 3 inputs are developed from unobservable data reflecting our own assumptions, and include situations where there is little or no market activity for the asset or liability.
Certain non-financial assets and liabilities are measured at fair value on a nonrecurring basis, including property, plant, and equipment, goodwill and intangible assets. These assets are not measured at fair value on a recurring basis; however, they are subject to fair value adjustments in certain circumstances, such as when there is evidence of an impairment. A general description of the valuation methodologies used for assets and liabilities measured at fair value, including the general classification of such assets and liabilities pursuant to the valuation hierarchy, is included in each footnote with fair value measurements present.
We allocate the fair value of purchase consideration to the tangible assets acquired, liabilities assumed and intangible assets acquired based on their estimated fair values. The excess of the fair value of purchase consideration over the fair values of these identifiable assets and liabilities is recorded as goodwill. Such valuations require management to make significant estimates and assumptions, especially with respect to intangible assets. Significant estimates in valuing certain intangible assets include, but are not limited to, future expected cash flows from acquired customers, acquired technology and trade names from a market participant perspective, useful lives and discount rates. Management's estimates of fair value are based upon assumptions believed to be reasonable, but which are inherently uncertain and unpredictable and, as a result, actual results may differ from estimates. During the measurement period, which is one year from the acquisition date, we may record adjustments to the assets acquired and liabilities assumed, with the corresponding offset to goodwill. Upon the conclusion of the measurement period, any subsequent adjustments are recorded to earnings.
Derivative Instruments
All financial derivative instruments are recorded on our consolidated balance sheets at fair value. Derivatives not designated as hedges must be adjusted to fair value through income. If a derivative is designated as a hedge, changes in its fair value that are considered to be effective, as defined, either (depending on the nature of the hedge) offset the change in fair value of the hedged assets, liabilities or firm commitments through income, or are recorded in AOCI until the hedged item is recorded in income. Any portion of a change in a hedge's fair value that is considered to be ineffective, or is excluded from the measurement of effectiveness, is recorded immediately in income.
Adoption of New Accounting Standards
In March 2016, the Financial Accounting Standards Board ("FASB") issued an accounting standards update that simplifies the income tax accounting and cash flow presentation related to share-based compensation by requiring the recognition of all excess tax benefits and deficiencies directly on the income statement and classification as cash flows from operating activities on the statement of cash flows. This new guidance became effective for us in the first quarter of 2017 and we adopted the statements of consolidated cash flows presentation on a prospective basis. The impact to income tax expense in 2017 in the statements of consolidated income was a benefit of $71 million . Additionally, we have elected to continue estimating forfeitures expected to occur to determine the amount of compensation cost to be recognized each period.
70
UNITED PARCEL SERVICE, INC. AND SUBSIDIARIES
NOTES TO CONSOLIDATED FINANCIAL STATEMENTS
In September 2015, the FASB issued an accounting standards update that simplifies the accounting for measurement-period adjustments related to business combinations. This update removes the requirement to retrospectively apply adjustments made to estimated amounts recognized in a business combination. This update permits the purchaser to adjust the estimated amounts in the reporting period in which the adjustment amounts are determined. This new guidance would have become effective for us in the first quarter of 2016; however, we elected to early adopt this standard in the third quarter of 2015. This accounting standards update did not have a material impact on our consolidated financial position or results of operations.
Accounting Standards Issued But Not Yet Effective
In February 2018, the FASB issued an accounting standards update that allows a reclassification from AOCI to retained earnings for stranded tax effects resulting from the Tax Act. The guidance will generally be applied either in the period of adoption or retrospectively to each period (or periods) in which the effect of the change in the U.S. federal corporate income tax rate in the Tax Act is recognized. The update becomes effective for us in the first quarter of 2019, but early adoption is permitted. We are currently evaluating this update to determine the full impact of its adoption.
In August 2017, the FASB issued an accounting standards update to enhance recognition of the economic results of hedging activities in the financial statements. In addition, this update makes certain targeted improvements to simplify the application of the hedge accounting guidance and increase transparency regarding the scope and results of hedging activities. The guidance will generally be applied prospectively and becomes effective for us in the first quarter of 2019, but early adoption is permitted. We are currently evaluating this update to determine the full impact of its adoption but do not expect this accounting standards update to have a material impact on our consolidated financial position, results of operations or cash flows.
In May 2017, the FASB issued an accounting standards update to provide clarity and reduce complexity on when to apply modification accounting to existing share-based payment awards. The guidance will be applied prospectively. We adopted this standard on January 1, 2018. This accounting standards update does not have a material impact on our consolidated financial position, results of operations or cash flows.
In March 2017, the FASB issued an accounting standards update to require the premium on callable debt securities to be amortized to the earliest call date. The amortization period for callable debt securities purchased at a discount would not be impacted by the proposed update. Under current GAAP, premiums on callable debt securities are generally amortized over the contractual life of the security. Only in cases when an entity has a large number of similar securities is it allowed to consider estimates of principal prepayments. Amortization of the premium over the contractual life of the instrument can result in losses being recorded for the unamortized premium if the issuer exercises the call feature prior to maturity. The standard will be effective for us in the first quarter of 2019, but early adoption is permitted. We are currently evaluating this update to determine the full impact of its adoption but do not expect this accounting standards update to have a material impact on our consolidated financial position, results of operations or cash flows.
In March 2017, the FASB issued an accounting standards update to improve the presentation of net periodic pension cost and net periodic postretirement benefit cost. The update requires employers to report the current service cost component in the same line item as other compensation costs arising from services rendered by employees during the period. The other components of net benefit cost are required to be presented separately from service cost and outside of income from operations. In accordance with the update, only the service cost component will be eligible for capitalization. The guidance in this update will be applied retrospectively for the presentation of service cost and other components of net benefit cost, and prospectively for the capitalization of the service cost component in assets. We adopted this standard on January 1, 2018. As a result of this update, the net amount of interest cost, prior service cost, expected return on plan assets and the actuarial gain (loss) in excess of the 10% corridor will be presented as other income (expense). For the years ended December 31, 2017 , 2016 and 2015 , non-service cost components amounted to an $11 million expense, a $2.236 billion expense, and a $420 million benefit, respectively, which were recognized in "Compensation and benefits" on the statements of consolidated income. After adoption, the non-service cost components will be recognized in "Other Income and (Expense)" on the statements of consolidated income.
In January 2017, the FASB issued an accounting standards update to simplify the accounting for goodwill impairment. The update removes Step 2 of the goodwill impairment test, which requires a hypothetical purchase price allocation. A goodwill impairment will now be the amount by which a reporting unit's carrying value exceeds its fair value, not to exceed the carrying amount of goodwill. The standard will be effective for us in the first quarter of 2020, but early adoption is permitted. We are currently evaluating this update to determine the full impact of its adoption but do not expect this accounting standards update to have a material impact on our consolidated financial position, results of operations or cash flows.
71
UNITED PARCEL SERVICE, INC. AND SUBSIDIARIES
NOTES TO CONSOLIDATED FINANCIAL STATEMENTS
In November 2016, the FASB issued an accounting standards update that is intended to reduce diversity in practice by adding or clarifying guidance on classification and presentation of changes in restricted cash on the statement of cash flows. The guidance in this update will be applied retrospectively. We adopted this standard on January 1, 2018. As a result of this update, restricted cash will be included within cash and cash equivalents on our statements of consolidated cash flows. As of December 31, 2017 and 2016, we had $449 and $ 445 million, respectively, in investments and restricted cash primarily associated with our self-insurance requirements.
In August 2016, the FASB issued an accounting standards update that addresses the classification and presentation of specific cash flow issues that currently result in diverse practices. The guidance also clarifies how the predominance principle should be applied when cash receipts and cash payments have aspects of more than one class of cash flows. The guidance will be applied retrospectively. We adopted this standard on January 1, 2018. We have evaluated the impact of this standard on our statements of consolidated cash flows, and have determined that this standard does not have a material impact.
In February 2016, the FASB issued an accounting standards update that requires lessees to recognize a right-of-use asset and lease liability on the balance sheet for all leases with terms beyond twelve months. Although the distinction between operating and finance leases will continue to exist under the new standard, the recognition and measurement of expenses and cash flows will not change significantly from the current treatment. This new guidance requires modified retrospective application and becomes effective for us in the first quarter of 2019, but early adoption is permitted. We are currently evaluating this update to determine the full impact of its adoption on our consolidated financial position, results of operations, cash flows and related disclosures, as well as the impact of adoption on policies, practices and systems. As of December 31, 2017, we have $ 1.637 billion of future minimum operating lease commitments that are not currently recognized on our consolidated balance sheet (see note 8 ). Therefore, we expect material changes to our consolidated balance sheets.
In January 2016, the FASB issued an accounting standards update which addresses certain aspects of the recognition, measurement, presentation and disclosure of financial instruments. We adopted this standard on January 1, 2018. This accounting standards update does not have a material impact on our consolidated financial position, results of operations or cash flows.
In May 2014, the FASB issued an accounting standards update that changes the revenue recognition for companies that enter into contracts with customers to transfer goods or services. The standard is a comprehensive new revenue recognition model that requires revenue to be recognized in a manner depicting the transfer of goods or services to a customer at an amount that reflects the consideration expected to be received in exchange for those goods or services. The FASB has also issued a number of updates to this standard. We adopted the standard on January 1, 2018. Companies may use either a full retrospective or a modified retrospective approach to adopt this standard. We adopted the standard using a full retrospective approach.
We have determined that revenue recognition will be accelerated for the transportation businesses as the standard requires revenue to be recognized as control is transferred to the customer over time rather than upon delivery. We have determined that the impact of this change to the statements of consolidated income is not material.
The standard also requires us to evaluate whether our businesses promise to transfer services to the customer itself (as a principal) or to arrange for services to be provided by another party (as an agent). To make that determination, the standard uses a control model rather than the risks-and-rewards model in current GAAP. Based on our evaluation of the control model, we determined that certain Supply Chain & Freight businesses act as the principal rather than the agent within their revenue arrangements. This change will require the affected businesses to report transportation revenue gross of associated purchased transportation costs rather than net of such amounts within the statements of consolidated income. This change will result in reclassifications of approximately $709 and $720 million from contra-revenue to operating expenses on the statements of consolidated income for the periods ended December 31, 2017 and 2016, respectively.
In addition to completing our review of contracts and quantifying the impacts on the consolidated financial statements, we have analyzed our internal control over financial reporting framework and determined that there will be new controls added around contract inception and contract modifications, as well as periodic reviews of material contracts. In addition, we have reviewed the impacts of this standard on our footnote disclosures for periods subsequent to January 1, 2018. We have determined that the adoption of this standard will result in several additional disclosures, including but not limited to additional information around our performance obligations, the timing of revenue recognition, remaining performance obligations at period end, contract assets and liabilities and significant judgments made that impact the amount and timing of revenue from our contracts with customers.
72
UNITED PARCEL SERVICE, INC. AND SUBSIDIARIES
NOTES TO CONSOLIDATED FINANCIAL STATEMENTS
NOTE 2. CASH AND INVESTMENTS
| Cost |
| Unrealized Gains |
| Unrealized Losses |
| Estimated Fair Value | ||||||||
2017 |
|
|
|
|
|
|
| ||||||||
Current trading marketable securities: |
|
|
|
|
|
|
| ||||||||
Corporate debt securities | $ | 75 | |
| $ | - | |
| $ | - | |
| $ | 75 | |
Carbon credit investments (1) | 77 | |
| 16 | |
| - | |
| 93 | | ||||
Total trading marketable securities | 152 | |
| 16 | |
| - | |
| 168 | | ||||
|
|
|
|
|
|
|
| ||||||||
Current available-for-sale marketable securities: |
|
|
|
|
|
|
| ||||||||
U.S. government and agency debt securities | 286 | |
| - | |
| (3 | ) |
| 283 | | ||||
Mortgage and asset-backed debt securities | 86 | |
| - | |
| - | |
| 86 | | ||||
Corporate debt securities | 201 | |
| 1 | |
| (1 | ) |
| 201 | | ||||
Equity securities | 2 | |
| - | |
| - | |
| 2 | | ||||
Non-U.S. government debt securities | 9 | |
| - | |
| - | |
| 9 | | ||||
Total available-for-sale marketable securities | 584 | |
| 1 | |
| (4 | ) |
| 581 | | ||||
|
|
|
|
|
|
|
| ||||||||
Total current marketable securities | $ | 736 | |
| $ | 17 | |
| $ | (4 | ) |
| $ | 749 | |
|
|
|
|
|
|
|
| ||||||||
| Cost |
| Unrealized Gains |
| Unrealized Losses |
| Estimated Fair Value | ||||||||
2016 |
|
|
|
|
|
|
| ||||||||
Current trading marketable securities: |
|
|
|
|
|
|
| ||||||||
Corporate debt securities | $ | 427 | |
| $ | - | |
| $ | - | |
| $ | 427 | |
Carbon credit investments (1) | 80 | |
| 10 | |
| - | |
| 90 | | ||||
Total trading marketable securities | 507 | |
| 10 | |
| - | |
| 517 | | ||||
|
|
|
|
|
|
|
| ||||||||
Current available-for-sale marketable securities: |
|
|
|
|
|
|
| ||||||||
U.S. government and agency debt securities | 314 | |
| - | |
| (2 | ) |
| 312 | | ||||
Mortgage and asset-backed debt securities | 90 | |
| 1 | |
| - | |
| 91 | | ||||
Corporate debt securities | 167 | |
| - | |
| (1 | ) |
| 166 | | ||||
Equity securities | 2 | |
| - | |
| - | |
| 2 | | ||||
Non-U.S. government debt securities | 3 | |
| - | |
| - | |
| 3 | | ||||
Total available-for-sale marketable securities | 576 | |
| 1 | |
| (3 | ) |
| 574 | | ||||
|
|
|
|
|
|
|
| ||||||||
Total current marketable securities | $ | 1,083 | |
| $ | 11 | |
| $ | (3 | ) |
| $ | 1,091 | |
|
|
|
|
|
|
|
| ||||||||
(1) These investments are hedged with forward contracts that are not designated in hedging relationships. See note 15 for offsetting statement of consolidated income impact. | |||||||||||||||
Total current marketable securities that were pledged as collateral for our self-insurance requirements had an estimated fair value of $ 579 and $ 572 million at December 31, 2017 and 2016 , respectively.
The gross realized gains on sales of available-for-sale securities totaled $ 0 , $ 1 and $ 1 million in 2017 , 2016 , and 2015 , respectively. The gross realized losses on sales of available-for-sale securities totaled $ 2 , $ 1 and $ 1 million in 2017 , 2016 , and 2015 , respectively.
There were no material impairment losses recognized on marketable securities during 2017 , 2016 or 2015 .
73
UNITED PARCEL SERVICE, INC. AND SUBSIDIARIES
NOTES TO CONSOLIDATED FINANCIAL STATEMENTS
Investment Other-Than-Temporary Impairments
We have concluded that no material other-than-temporary impairment losses existed as of December 31, 2017 . In making this determination, we considered the financial condition and prospects of the issuer, the magnitude of the losses compared with the investments' cost, the probability that we will be unable to collect all amounts due according to the contractual terms of the security, the credit rating of the security and our ability and intent to hold these investments until the anticipated recovery in market value occurs.
Unrealized Losses
The following table presents the age of gross unrealized losses and fair value by investment category for all securities in a loss position as of December 31, 2017 (in millions):
| Less Than 12 Months |
| 12 Months or More |
| Total | ||||||||||||||||||
| Fair Value |
| Unrealized Losses |
| Fair Value |
| Unrealized Losses |
| Fair Value |
| Unrealized Losses | ||||||||||||
U.S. government and agency debt securities | $ | 183 | |
| $ | (2 | ) |
| $ | 90 | |
| $ | (1 | ) |
| $ | 273 | |
| $ | (3 | ) |
Mortgage and asset-backed debt securities | 36 | |
| - | |
| 25 | |
| - | |
| 61 | |
| - | | ||||||
Corporate debt securities | 101 | |
| (1 | ) |
| 70 | |
| - | |
| 171 | |
| (1 | ) | ||||||
Non-U.S. government debt securities | 8 | |
| - | |
| - | |
| - | |
| 8 | |
| - | | ||||||
Total marketable securities | $ | 328 | |
| $ | (3 | ) |
| $ | 185 | |
| $ | (1 | ) |
| $ | 513 | |
| $ | (4 | ) |
The unrealized losses for the corporate debt securities and U.S. government and agency debt securities are primarily due to changes in market interest rates. We have both the intent and ability to hold the securities contained in the previous table for a time necessary to recover the cost basis.
Maturity Information
The amortized cost and estimated fair value of marketable securities at December 31, 2017 , by contractual maturity, are shown below (in millions). Actual maturities may differ from contractual maturities because the issuers of the securities may have the right to prepay obligations without prepayment penalties.
| Cost |
| Estimated Fair Value | ||||
Due in one year or less | $ | 112 | |
| $ | 112 | |
Due after one year through three years | 453 | |
| 449 | | ||
Due after three years through five years | 21 | |
| 21 | | ||
Due after five years | 73 | |
| 74 | | ||
| 659 | |
| 656 | | ||
Equity and carbon credit investment securities | 77 | |
| 93 | | ||
| $ | 736 | |
| $ | 749 | |
74
UNITED PARCEL SERVICE, INC. AND SUBSIDIARIES
NOTES TO CONSOLIDATED FINANCIAL STATEMENTS
Non-Current Investments and Restricted Cash
Investments and Restricted Cash are primarily associated with our self-insurance requirements. We entered into an escrow agreement with an insurance carrier to guarantee our self-insurance obligations. This agreement requires us to provide collateral to the insurance carrier, which is invested in money market funds and corporate and municipal bonds. Collateral provided is reflected in "other investing activities" in the statements of consolidated cash flows. At December 31, 2017 and 2016 , we had $449 and $ 445 million in self-insurance investments and restricted cash, respectively.
We held a $19 and $ 18 million investment in a variable life insurance policy to fund benefits for the UPS Excess Coordinating Benefit Plan at December 31, 2017 and 2016 , respectively. The quarterly change in investment fair value is recognized in "investment income and other" on the statements of consolidated income. Additionally, we held escrowed cash related to the acquisition and disposition of certain assets, primarily real estate, of $ 15 and $ 13 million at December 31, 2017 and 2016 , respectively.
The amounts described above are classified as "investments and restricted cash" in the consolidated balance sheets.
Fair Value Measurements
Marketable securities utilizing Level 1 inputs include active exchange-traded equity securities and equity index funds, and most U.S. Government debt securities, as these securities all have quoted prices in active markets. Marketable securities utilizing Level 2 inputs include asset-backed securities, corporate bonds and municipal bonds. These securities are valued using market corroborated pricing, matrix pricing or other models that utilize observable inputs such as yield curves.
We maintain holdings in certain investment partnerships that are measured at fair value utilizing Level 3 inputs (classified as "other non-current investments" in the tables below, and as "other non-current assets" in the consolidated balance sheets). These partnership holdings do not have quoted prices, nor can they be valued using inputs based on observable market data. These investments are valued internally using a discounted cash flow model with two significant inputs: (1) the after-tax cash flow projections for each partnership, and (2) a risk-adjusted discount rate consistent with the duration of the expected cash flows for each partnership. The weighted-average discount rates used to value these investments were 7.56% and 8.06% as of December 31, 2017 and 2016 , respectively. These inputs and the resulting fair values are updated on a quarterly basis.
75
UNITED PARCEL SERVICE, INC. AND SUBSIDIARIES
NOTES TO CONSOLIDATED FINANCIAL STATEMENTS
| Quoted Prices in Active Markets for Identical Assets (Level 1) |
| Significant Other Observable Inputs (Level 2) |
| Significant Unobservable Inputs (Level 3) |
| Total | ||||||||
2017 |
|
|
|
|
|
|
| ||||||||
Marketable securities: |
|
|
|
|
|
|
| ||||||||
U.S. government and agency debt securities | $ | 283 | |
| $ | - | |
| $ | - | |
| $ | 283 | |
Mortgage and asset-backed debt securities | - | |
| 86 | |
| - | |
| 86 | | ||||
Corporate debt securities | - | |
| 276 | |
| - | |
| 276 | | ||||
Equity securities | - | |
| 2 | |
| - | |
| 2 | | ||||
Non-U.S. government debt securities | - | |
| 9 | |
| - | |
| 9 | | ||||
Carbon credit investments | 93 | |
| - | |
| - | |
| 93 | | ||||
Total marketable securities | 376 | |
| 373 | |
| - | |
| 749 | | ||||
Other non-current investments | 19 | |
| - | |
| 6 | |
| 25 | | ||||
Total | $ | 395 | |
| $ | 373 | |
| $ | 6 | |
| $ | 774 | |
|
|
|
|
|
|
|
| ||||||||
| Quoted Prices in Active Markets for Identical Assets (Level 1) |
| Significant Other Observable Inputs (Level 2) |
| Significant Unobservable Inputs (Level 3) |
| Total | ||||||||
2016 |
|
|
|
|
|
|
| ||||||||
Marketable securities: |
|
|
|
|
|
|
| ||||||||
U.S. government and agency debt securities | $ | 312 | |
| $ | - | |
| $ | - | |
| $ | 312 | |
Mortgage and asset-backed debt securities | - | |
| 91 | |
| - | |
| 91 | | ||||
Corporate debt securities | - | |
| 593 | |
| - | |
| 593 | | ||||
Equity securities | - | |
| 2 | |
| - | |
| 2 | | ||||
Non-U.S. government debt securities | - | |
| 3 | |
| - | |
| 3 | | ||||
Carbon credit investments | 90 | |
| - | |
| - | |
| 90 | | ||||
Total marketable securities | 402 | |
| 689 | |
| - | |
| 1,091 | | ||||
Other non-current investments | 18 | |
| - | |
| 13 | |
| 31 | | ||||
Total | $ | 420 | |
| $ | 689 | |
| $ | 13 | |
| $ | 1,122 | |
76
UNITED PARCEL SERVICE, INC. AND SUBSIDIARIES
NOTES TO CONSOLIDATED FINANCIAL STATEMENTS
The following table presents the changes in the above Level 3 instruments measured on a recurring basis for the years ended December 31, 2017 and 2016 (in millions).
| Marketable Securities |
| Other Investments |
| Total | ||||||
Balance on January 1, 2016 | $ | - | |
| $ | 32 | |
| $ | 32 | |
Transfers into (out of) Level 3 | - | |
| - | |
| - | | |||
Net realized and unrealized gains (losses): |
|
|
|
|
| ||||||
Included in earnings (in investment income) | - | |
| (19 | ) |
| (19 | ) | |||
Included in accumulated other comprehensive income (pre-tax) | - | |
| - | |
| - | | |||
Purchases | - | |
| - | |
| - | | |||
Settlements | - | |
| - | |
| - | | |||
Balance on December 31, 2016 | $ | - | |
| $ | 13 | |
| $ | 13 | |
Transfers into (out of) Level 3 | - | |
| - | |
| - | | |||
Net realized and unrealized gains (losses): |
|
|
|
|
| ||||||
Included in earnings (in investment income) | - | |
| (7 | ) |
| (7 | ) | |||
Included in accumulated other comprehensive income (pre-tax) | - | |
| - | |
| - | | |||
Purchases | - | |
| - | |
| - | | |||
Settlements | - | |
| - | |
| - | | |||
Balance on December 31, 2017 | $ | - | |
| $ | 6 | |
| $ | 6 | |
77
UNITED PARCEL SERVICE, INC. AND SUBSIDIARIES
NOTES TO CONSOLIDATED FINANCIAL STATEMENTS
NOTE 3. PROPERTY, PLANT AND EQUIPMENT
Property, plant and equipment, including both owned assets as well as assets subject to capital leases, consists of the following as of December 31, 2017 and 2016 (in millions):
| 2017 |
| 2016 | ||||
Vehicles | $ | 9,365 | |
| $ | 8,638 | |
Aircraft | 16,248 | |
| 15,653 | | ||
Land | 1,582 | |
| 1,397 | | ||
Buildings | 4,035 | |
| 3,439 | | ||
Building and leasehold improvements | 3,934 | |
| 3,612 | | ||
Plant equipment | 9,387 | |
| 8,430 | | ||
Technology equipment | 1,907 | |
| 1,741 | | ||
Equipment under operating leases | 29 | |
| 29 | | ||
Construction-in-progress | 2,239 | |
| 735 | | ||
| 48,726 | |
| 43,674 | | ||
Less: Accumulated depreciation and amortization | (26,608 | ) |
| (24,874 | ) | ||
| $ | 22,118 | |
| $ | 18,800 | |
We continually monitor our aircraft fleet utilization in light of current and projected volume levels, aircraft fuel prices and other factors. Additionally, we monitor our other property, plant and equipment categories for any indicators that the carrying value of the assets may not be recoverable. No impairment charges on property, plant and equipment were recorded in 2017 , 2016 or 2015 .
NOTE 4. COMPANY-SPONSORED EMPLOYEE BENEFIT PLANS
We sponsor various retirement and pension plans, including defined benefit and defined contribution plans which cover our employees worldwide.
U.S. Pension Benefits
In the U.S. we maintain the following single-employer defined benefit pension plans: the UPS Retirement Plan, the UPS Pension Plan, the UPS/IBT Full-Time Employee Pension Plan and the UPS Excess Coordinating Benefit Plan, a non-qualified plan.
The UPS Retirement Plan is noncontributory and includes substantially all eligible employees of participating domestic subsidiaries who are not members of a collective bargaining unit, as well as certain employees covered by a collective bargaining agreement. This plan generally provides for retirement benefits based on average compensation levels earned by employees prior to retirement. Benefits payable under this plan are subject to maximum compensation limits and the annual benefit limits for a tax-qualified defined benefit plan as prescribed by the Internal Revenue Service ("IRS").
The UPS Pension Plan is noncontributory and includes certain eligible employees of participating domestic subsidiaries and members of collective bargaining units that elect to participate in the plan. This plan generally provides for retirement benefits based on service credits earned by employees prior to retirement.
The UPS/IBT Full-Time Employee Pension Plan is noncontributory and includes employees that were previously members of the Central States Pension Fund, a multiemployer pension plan, in addition to other eligible employees who are covered under certain collective bargaining agreements. This plan generally provides for retirement benefits based on service credits earned by employees prior to retirement.
The UPS Excess Coordinating Benefit Plan is a non-qualified plan that provides benefits to certain participants in the UPS Retirement Plan for amounts that exceed the benefit limits described above.
78
UNITED PARCEL SERVICE, INC. AND SUBSIDIARIES
NOTES TO CONSOLIDATED FINANCIAL STATEMENTS
In the year ended December 31, 2017, we amended the UPS Retirement Plan and the UPS Excess Coordinating Benefit Plan to cease accruals of additional benefits for future service and compensation for non-union participants effective January 1, 2023. We remeasured plan assets and pension benefit obligations for the affected pension plans as of June 30, 2017, resulting in a net actuarial gain of $ 569 million. This reflected a curtailment gain of $ 1.525 billion resulting from the benefit plan changes that was partially offset by net actuarial losses of $ 956 million, driven by a reduction of approximately 32 basis points in the discount rate compared to December 31, 2016, offset by actual asset returns approximately 275 basis points above our expected return as of the remeasurement date. The net curtailment gain reduced the actuarial loss recorded in "Accumulated other comprehensive loss" in the equity section of the consolidated balance sheet. As actuarial losses were within the corridor (defined as 10% of the greater of the fair value of plan assets and the plan's projected benefit obligation), there was no impact to the statement of consolidated income as a result of this remeasurement.
The UPS Retirement Plan was closed to new non-union participants effective July 1, 2016. The Company amended the UPS 401(k) Savings Plan so that employees who previously would have been eligible for participation in the UPS Retirement Plan receive, in addition to current benefits under the UPS 401(k) Savings Plan, a UPS Retirement Contribution. For employees eligible to receive the Retirement Contribution, UPS will contribute 3% to 8% of eligible pay to the UPS 401(k) Savings Plan based on years of vesting service and business unit. Contributions will be made annually in cash to the accounts of participants who are employed on December 31st of each calendar year.
During the fourth quarter of 2016, certain former U.S. employees were offered the option to receive a one-time payment of their vested pension benefit. Approximately 22,000 participants accepted this option, accelerating $ 685 million in benefit payments during 2016 while reducing the number of participants who are due future payments from U.S. pension plans. As the cost of these settlements did not exceed the plans' service cost and interest cost for the year, the impact of the settlement was not recognized in earnings.
International Pension Benefits
We also sponsor various defined benefit plans covering certain of our international employees. The majority of our international obligations are for defined benefit plans in Canada and the United Kingdom. In addition, many of our international employees are covered by government-sponsored retirement and pension plans. We are not directly responsible for providing benefits to participants of government-sponsored plans.
U.S. Postretirement Medical Benefits
We also sponsor postretirement medical plans in the U.S. that provide healthcare benefits to our retirees who meet certain eligibility requirements and who are not otherwise covered by multiemployer plans. Generally, this includes employees with at least 10 years of service who have reached age 55 and employees who are eligible for postretirement medical benefits from a Company-sponsored plan pursuant to collective bargaining agreements. We have the right to modify or terminate certain of these plans. These benefits have been provided to certain retirees on a noncontributory basis; however, in many cases, retirees are required to contribute all or a portion of the total cost of the coverage.
Defined Contribution Plans
We also sponsor several defined contribution plans for all employees not covered under collective bargaining agreements, and for certain employees covered under collective bargaining agreements. The Company matches, in shares of UPS common stock or cash, a portion of the participating employees' contributions. Matching contributions charged to expense were $ 119 , $ 111 and $ 104 million for 2017 , 2016 and 2015 , respectively.
Effective June 23, 2017, the Company amended the UPS 401(k) Savings Plan so that non-union employees who currently participate in the UPS Retirement Plan will, in addition to current benefits under the UPS 401(k) Savings Plan, earn a UPS Retirement Contribution beginning January 1, 2023. UPS will contribute 5% to 8% of eligible compensation to the UPS 401(k) Savings Plan based on years of vesting service. The amendment also provides for transition contributions for certain participants. There was no impact to the statement of consolidated income for the year ended December 31, 2017 as a result of this change.
As noted above, effective July 1, 2016, the UPS 401(k) Savings Plan was amended so that newly hired employees who previously would have been eligible for participation in the UPS Retirement Plan began receiving a UPS Retirement Contribution. Contributions associated with this amendment charged to expense were $23 and $4 million for 2017 and 2016 respectively.
79
UNITED PARCEL SERVICE, INC. AND SUBSIDIARIES
NOTES TO CONSOLIDATED FINANCIAL STATEMENTS
Contributions are also made to defined contribution money purchase plans under certain collective bargaining agreements. Amounts charged to expense were $ 91 , $ 82 and $ 83 million for 2017 , 2016 and 2015 , respectively.
Net Periodic Benefit Cost
Information about net periodic benefit cost for the company-sponsored pension and postretirement defined benefit plans is as follows (in millions):
| U.S. Pension Benefits |
| U.S. Postretirement Medical Benefits |
| International Pension Benefits | ||||||||||||||||||||||||||||||
| 2017 |
| 2016 |
| 2015 |
| 2017 |
| 2016 |
| 2015 |
| 2017 |
| 2016 |
| 2015 | ||||||||||||||||||
Net Periodic Benefit Cost: |
|
|
|
|
|
|
|
|
|
|
|
|
|
|
|
|
| ||||||||||||||||||
Service cost | $ | 1,543 | |
| $ | 1,412 | |
| $ | 1,527 | |
| $ | 29 | |
| $ | 28 | |
| $ | 34 | |
| $ | 60 | |
| $ | 49 | |
| $ | 48 | |
Interest cost | 1,813 | |
| 1,828 | |
| 1,694 | |
| 112 | |
| 124 | |
| 117 | |
| 40 | |
| 41 | |
| 44 | | |||||||||
Expected return on assets | (2,883 | ) |
| (2,516 | ) |
| (2,489 | ) |
| (7 | ) |
| (6 | ) |
| (17 | ) |
| (66 | ) |
| (58 | ) |
| (61 | ) | |||||||||
Amortization of prior service cost | 192 | |
| 166 | |
| 168 | |
| 7 | |
| 5 | |
| 5 | |
| 1 | |
| 1 | |
| 1 | | |||||||||
Actuarial (gain) loss | 729 | |
| 2,520 | |
| 70 | |
| 53 | |
| 17 | |
| 17 | |
| 18 | |
| 114 | |
| 31 | | |||||||||
Curtailment and settlement loss | - | |
| - | |
| - | |
| - | |
| - | |
| - | |
| 2 | |
| - | |
| - | | |||||||||
Net periodic benefit cost | $ | 1,394 | |
| $ | 3,410 | |
| $ | 970 | |
| $ | 194 | |
| $ | 168 | |
| $ | 156 | |
| $ | 55 | |
| $ | 147 | |
| $ | 63 | |
Actuarial Assumptions
The table below provides the weighted-average actuarial assumptions used to determine the net periodic benefit cost.
| U.S. Pension Benefits |
| U.S. Postretirement Medical Benefits |
| International Pension Benefits | |||||||||||||||||||||
| 2017 |
| 2016 |
| 2015 |
| 2017 |
| 2016 |
| 2015 |
| 2017 |
| 2016 |
| 2015 | |||||||||
Discount rate | 4.41 | % |
| 4.86 | % |
| 4.40 | % |
| 4.23 | % |
| 4.79 | % |
| 4.18 | % |
| 2.75 | % |
| 3.51 | % |
| 3.56 | % |
Rate of compensation increase | 4.27 | % |
| 4.29 | % |
| 4.29 | % |
| N/A | |
| N/A | |
| N/A | |
| 3.17 | % |
| 3.04 | % |
| 3.08 | % |
Expected return on assets | 8.75 | % |
| 8.75 | % |
| 8.75 | % |
| 8.75 | % |
| 8.75 | % |
| 8.75 | % |
| 5.65 | % |
| 5.73 | % |
| 6.03 | % |
The table below provides the weighted-average actuarial assumptions used to determine the benefit obligations of our plans.
| U.S. Pension Benefits |
| U.S. Postretirement Medical Benefits |
| International Pension Benefits | ||||||||||||
| 2017 |
| 2016 |
| 2017 |
| 2016 |
| 2017 |
| 2016 | ||||||
Discount rate | 3.84 | % |
| 4.41 | % |
| 3.82 | % |
| 4.23 | % |
| 2.78 | % |
| 2.75 | % |
Rate of compensation increase | 4.25 | % |
| 4.27 | % |
| N/A | |
| N/A | |
| 3.23 | % |
| 3.17 | % |
A discount rate is used to determine the present value of our future benefit obligations. To determine the discount rate for our U.S. pension and postretirement benefit plans, we use a bond matching approach to select specific bonds that would satisfy our projected benefit payments. We believe the bond matching approach reflects the process we would employ to settle our pension and postretirement benefit obligations. For our international plans, the discount rate is determined by matching the expected cash flows of a sample plan of similar duration to a yield curve based on long-term, high quality fixed income debt instruments available as of the measurement date. These assumptions are updated each measurement date, which is typically annually.
As of December 31, 2017 , the impact of each basis point change in the discount rate on the projected benefit obligation of the pension and postretirement medical benefit plans is as follows (in millions):
| Increase (Decrease) in the Projected Benefit Obligation | ||||||
| Pension Benefits |
| Postretirement Medical Benefits | ||||
One basis point increase in discount rate | $ | (75 | ) |
| $ | (2 | ) |
One basis point decrease in discount rate | $ | 80 | |
| $ | 3 | |
80
UNITED PARCEL SERVICE, INC. AND SUBSIDIARIES
NOTES TO CONSOLIDATED FINANCIAL STATEMENTS
The Society of Actuaries ("SOA") published mortality tables and improvement scales are used in developing the best estimate of mortality for U.S. plans. In October 2016, the SOA published an updated improvement scale which reduced expected mortality improvements from previously published scales. Based on our perspective of future longevity, we updated the mortality assumptions to incorporate this updated scale for purposes of measuring pension and other postretirement benefit obligations.
Assumptions for the expected return on plan assets are used to determine a component of net periodic benefit cost for the fiscal year. The assumption for our U.S. plans is developed using a long-term projection of returns for each asset class. Our asset allocation targets are reviewed and, if necessary, updated taking into consideration plan changes, funded status and actual performance. The expected return for each asset class is a function of passive, long-term capital market assumptions and excess returns generated from active management. The capital market assumptions used are provided by independent investment advisors, while excess return assumptions are supported by historical performance, fund mandates and investment expectations.
For plans outside the U.S., consideration is given to local market expectations of long-term returns. Strategic asset allocations are determined by plan based on the nature of liabilities and considering the demographic composition of the plan participants.
Actuarial Assumptions - Central States Pension Fund
UPS was a contributing employer to the Central States Pension Fund ("CSPF") until 2007 when we withdrew from the plan and fully funded our allocable share of unfunded vested benefits by paying a $ 6.1 billion withdrawal liability. Under a collective bargaining agreement with the International Brotherhood of Teamsters ("IBT"), UPS agreed to provide coordinating benefits in the UPS/IBT Full-Time Employee Pension Plan ("UPS/IBT Plan") for UPS participants whose last employer was UPS and who had not retired as of January 1, 2008 ("the UPS Transfer Group") in the event that benefits are lawfully reduced by the CSPF in the future consistent with the terms of our withdrawal agreement with the CSPF.
In December 2014, Congress passed the Multiemployer Pension Reform Act ("MPRA"), which for the first time ever allowed multiemployer pension plans to reduce benefit payments to retirees, subject to specific guidelines in the statute and government approval. In September 2015, the CSPF submitted a proposed pension benefit reduction plan to the U.S. Department of the Treasury under the MPRA. The CSPF plan proposed to reduce retirement benefits to the CSPF participants, including the UPS Transfer Group. We vigorously challenged the proposed benefit reduction plan because we believed that it did not comply with the law and that the CSPF failed to comply with its contractual obligation to obtain our consent to reduce benefits to the UPS Transfer Group under the terms of the withdrawal agreement with the CSPF. On May 6, 2016, the U.S. Department of the Treasury rejected the proposed plan submitted by the CSPF, stating that it failed to satisfy a number of requirements set forth in the MPRA.
The CSPF has asserted that it will become insolvent in 2025, which could lead to the reduction of retirement benefits. Although there are numerous factors that could affect the CSPF's funding status, if the CSPF were to become insolvent as they have projected, UPS may be required to provide coordinating benefits, thereby increasing the current projected benefit obligation for the UPS/IBT Plan by approximately $ 4 billion. The CSPF has said that it believes a legislative solution to its funding status is necessary, and we expect that the CSPF will continue to explore options to avoid insolvency.
The potential obligation to pay coordinating benefits from the UPS/IBT Plan is subject to a number of significant uncertainties, including actions that may be taken by the CSPF, the federal government or others. These actions include whether the CSPF will submit a revised pension benefit reduction plan or otherwise seek federal government assistance, the extent to which benefits are paid by the Pension Benefit Guaranty Corporation, our ability to successfully defend our legal positions as well as the effect of discount rates, CSPF asset returns and various other actuarial assumptions.
We account for this potential obligation under Accounting Standards Codification Topic 715- Compensation- Retirement Benefits ("ASC 715"). Under ASC 715 we are required to provide a best estimate of various actuarial assumptions, including the eventual outcome of this matter, in measuring our pension benefit obligation at the December 31st measurement date. While we currently believe the most likely solution to this matter and the broader systemic problems facing multiemployer pension plans is intervention by the federal government, ASC 715 does not permit anticipation of changes in law in making a best estimate of pension liabilities. Our best estimate as of the measurement date of December 31, 2017, does not incorporate this solution. However, if a future change in law resulted in an obligation to provide coordinating benefits under the UPS/IBT Plan, it may be a significant event, and may require us to remeasure the plan assets and projected benefit obligation of the UPS/IBT Plan at the date the law is enacted.
81
UNITED PARCEL SERVICE, INC. AND SUBSIDIARIES
NOTES TO CONSOLIDATED FINANCIAL STATEMENTS
Our best estimate of the next most likely outcome to resolve the CSPF's solvency concerns is that the CSPF will submit another benefit suspension application under the MPRA to forestall insolvency without reducing benefits to the UPS Transfer Group. If the CSPF attempts to reduce benefits for the UPS Transfer Group under a MPRA filing, we would be in a strong legal position to prevent that from occurring given that these benefits cannot be reduced without our consent and such a reduction, without first exhausting reductions to other groups in the CSPF, would be contrary to the statute. Accordingly, our best estimate as of the measurement date of December 31, 2017, is that there is no liability to be recognized for additional coordinating benefits of the UPS/IBT Plan. However, the projected benefit obligation could materially increase as the uncertainties are resolved. We will continue to assess the impact of these uncertainties on the projected benefit obligation of the UPS/IBT Plan in accordance with ASC 715.
Other Actuarial Assumptions
Healthcare cost trends are used to project future postretirement medical benefits payable from our plans. For year-end 2017 U.S. plan obligations, future postretirement medical benefit costs were forecasted assuming an initial annual rate of increase of 6.5% , decreasing to 4.5% by the year 2022 and with consistent annual increases at that ultimate level thereafter.
Assumed healthcare cost trends can have a significant effect on the amounts reported for our postretirement medical plans. A one percent change in assumed healthcare cost trend rates would have had the following effects on 2017 results (in millions):
| 1% Increase |
| 1% Decrease | ||||
Effect on total of service cost and interest cost | $ | 3 | |
| $ | (3 | ) |
Effect on postretirement benefit obligation | $ | 65 | |
| $ | (71 | ) |
Funded Status
The following table discloses the funded status of our plans and the amounts recognized in our consolidated balance sheets as of December 31 st (in millions):
| U.S. Pension Benefits |
| U.S. Postretirement Medical Benefits |
| International Pension Benefits | ||||||||||||||||||
| 2017 |
| 2016 |
| 2017 |
| 2016 |
| 2017 |
| 2016 | ||||||||||||
Funded Status: |
|
|
|
|
|
|
|
|
|
|
| ||||||||||||
Fair value of plan assets | $ | 41,932 | |
| $ | 31,215 | |
| $ | 183 | |
| $ | 15 | |
| $ | 1,333 | |
| $ | 1,092 | |
Benefit obligation | (45,847 | ) |
| (41,069 | ) |
| (2,792 | ) |
| (2,730 | ) |
| (1,651 | ) |
| (1,425 | ) | ||||||
Funded status recognized at December 31 | $ | (3,915 | ) |
| $ | (9,854 | ) |
| $ | (2,609 | ) |
| $ | (2,715 | ) |
| $ | (318 | ) |
| $ | (333 | ) |
Funded Status Recognized in our Balance Sheet: |
|
|
|
|
|
|
|
|
|
|
| ||||||||||||
Other non-current assets | $ | 284 | |
| $ | - | |
| $ | - | |
| $ | - | |
| $ | 35 | |
| $ | 28 | |
Other current liabilities | (18 | ) |
| (17 | ) |
| (77 | ) |
| (216 | ) |
| (5 | ) |
| (3 | ) | ||||||
Pension and postretirement benefit obligations | (4,181 | ) |
| (9,837 | ) |
| (2,532 | ) |
| (2,499 | ) |
| (348 | ) |
| (358 | ) | ||||||
Net liability at December 31 | $ | (3,915 | ) |
| $ | (9,854 | ) |
| $ | (2,609 | ) |
| $ | (2,715 | ) |
| $ | (318 | ) |
| $ | (333 | ) |
Amounts Recognized in AOCI: |
|
|
|
|
|
|
|
|
|
|
| ||||||||||||
Unrecognized net prior service cost | $ | (880 | ) |
| $ | (1,074 | ) |
| $ | (29 | ) |
| $ | (36 | ) |
| $ | (2 | ) |
| $ | (3 | ) |
Unrecognized net actuarial gain (loss) | (4,277 | ) |
| (4,107 | ) |
| (195 | ) |
| (80 | ) |
| (126 | ) |
| (150 | ) | ||||||
Gross unrecognized cost at December 31 | (5,157 | ) |
| (5,181 | ) |
| (224 | ) |
| (116 | ) |
| (128 | ) |
| (153 | ) | ||||||
Deferred tax assets (liabilities) at December 31 | 1,840 | |
| 1,948 | |
| 69 | |
| 44 | |
| 31 | |
| 37 | | ||||||
Net unrecognized cost at December 31 | $ | (3,317 | ) |
| $ | (3,233 | ) |
| $ | (155 | ) |
| $ | (72 | ) |
| $ | (97 | ) |
| $ | (116 | ) |
The accumulated benefit obligation for our pension plans as of the measurement dates in 2017 and 2016 was $ 45.776 and $ 39.488 billion, respectively.
Benefit payments under the pension plans include $ 22 million paid from employer assets in 2017 and in 2016 . Benefit payments (net of participant contributions) under the postretirement medical benefit plans include $ 93 and $ 98 million paid from employer assets in 2017 and 2016 , respectively. Such benefit payments from employer assets are also categorized as employer contributions.
82
UNITED PARCEL SERVICE, INC. AND SUBSIDIARIES
NOTES TO CONSOLIDATED FINANCIAL STATEMENTS
At December 31, 2017 and 2016 , the projected benefit obligation, the accumulated benefit obligation and the fair value of plan assets for pension plans with benefit obligations in excess of plan assets were as follows (in millions):
| Projected Benefit Obligation Exceeds the Fair Value of Plan Assets |
| Accumulated Benefit Obligation Exceeds the Fair Value of Plan Assets | ||||||||||||
2017 |
| 2016 |
| 2017 |
| 2016 | |||||||||
U.S. Pension Benefits: |
|
|
|
|
|
|
| ||||||||
Projected benefit obligation | $ | 37,113 | |
| $ | 41,069 | |
| $ | 37,113 | |
| $ | 41,069 | |
Accumulated benefit obligation | 35,538 | |
| 38,194 | |
| 35,538 | |
| 38,194 | | ||||
Fair value of plan assets | 32,914 | |
| 31,215 | |
| 32,914 | |
| 31,215 | | ||||
International Pension Benefits: |
|
|
|
|
|
|
| ||||||||
Projected benefit obligation | $ | 1,138 | |
| $ | 1,370 | |
| $ | 647 | |
| $ | 1,365 | |
Accumulated benefit obligation | 992 | |
| 1,238 | |
| 549 | |
| 1,234 | | ||||
Fair value of plan assets | 798 | |
| 1,020 | |
| 342 | |
| 1,016 | | ||||
The accumulated postretirement benefit obligation exceeds plan assets for all of our U.S. postretirement medical benefit plans.
83
UNITED PARCEL SERVICE, INC. AND SUBSIDIARIES
NOTES TO CONSOLIDATED FINANCIAL STATEMENTS
Benefit Obligations and Fair Value of Plan Assets
| U.S. Pension Benefits |
| U.S. Postretirement Medical Benefits |
| International Pension Benefits | ||||||||||||||||||
| 2017 |
| 2016 |
| 2017 |
| 2016 |
| 2017 |
| 2016 | ||||||||||||
Benefit Obligations: |
|
|
|
|
|
|
|
|
|
|
| ||||||||||||
Projected benefit obligation at beginning of year | $ | 41,069 | |
| $ | 36,846 | |
| $ | 2,730 | |
| $ | 2,673 | |
| $ | 1,425 | |
| $ | 1,219 | |
Service cost | 1,543 | |
| 1,412 | |
| 29 | |
| 28 | |
| 60 | |
| 49 | | ||||||
Interest cost | 1,813 | |
| 1,828 | |
| 112 | |
| 124 | |
| 40 | |
| 41 | | ||||||
Gross benefits paid | (1,309 | ) |
| (1,885 | ) |
| (264 | ) |
| (264 | ) |
| (32 | ) |
| (28 | ) | ||||||
Plan participants' contributions | - | |
| - | |
| 26 | |
| 27 | |
| 3 | |
| 3 | | ||||||
Plan amendments (1) | - | |
| 285 | |
| - | |
| 15 | |
| - | |
| - | | ||||||
Actuarial (gain)/loss | 4,256 | |
| 2,583 | |
| 159 | |
| 126 | |
| 26 | |
| 208 | | ||||||
Foreign currency exchange rate changes | - | |
| - | |
| - | |
| - | |
| 129 | |
| (67 | ) | ||||||
Curtailments and settlements | (1,525 | ) |
| - | |
| - | |
| - | |
| (3 | ) |
| (3 | ) | ||||||
Other | - | |
| - | |
| - | |
| 1 | |
| 3 | |
| 3 | | ||||||
Projected benefit obligation at end of year | $ | 45,847 | |
| $ | 41,069 | |
| $ | 2,792 | |
| $ | 2,730 | |
| $ | 1,651 | |
| $ | 1,425 | |
|
|
|
|
|
|
|
|
|
|
|
| ||||||||||||
(1) Resulting from a new labor contract with the Independent Pilots Association. | |||||||||||||||||||||||
|
|
|
|
|
| ||||||||||||||||||
| U.S. Pension Benefits |
| U.S. Postretirement Medical Benefits |
| International Pension Benefits | ||||||||||||||||||
| 2017 |
| 2016 |
| 2017 |
| 2016 |
| 2017 |
| 2016 | ||||||||||||
Fair Value of Plan Assets: |
|
|
|
|
|
|
|
|
|
|
| ||||||||||||
Fair value of plan assets at beginning of year | $ | 31,215 | |
| $ | 28,887 | |
| $ | 15 | |
| $ | 130 | |
| $ | 1,092 | |
| $ | 1,014 | |
Actual return on plan assets | 4,717 | |
| 1,735 | |
| (2 | ) |
| 3 | |
| 96 | |
| 108 | | ||||||
Employer contributions | 7,309 | |
| 2,478 | |
| 408 | |
| 119 | |
| 77 | |
| 71 | | ||||||
Plan participants' contributions | - | |
| - | |
| 26 | |
| 27 | |
| 3 | |
| 3 | | ||||||
Gross benefits paid | (1,309 | ) |
| (1,885 | ) |
| (264 | ) |
| (264 | ) |
| (32 | ) |
| (28 | ) | ||||||
Foreign currency exchange rate changes | - | |
| - | |
| - | |
| - | |
| 100 | |
| (73 | ) | ||||||
Curtailments and settlements | - | |
| - | |
| - | |
| - | |
| (3 | ) |
| (3 | ) | ||||||
Fair value of plan assets at end of year | $ | 41,932 | |
| $ | 31,215 | |
| $ | 183 | |
| $ | 15 | |
| $ | 1,333 | |
| $ | 1,092 | |
Pension and Postretirement Plan Assets
Under the governance of plan trustees, the investment committee establishes investment guidelines and strategies and regularly monitors the performance of investments and investment managers. The investment guidelines address items such as establishing appropriate governance provisions; defining investment objectives; determining strategic asset allocation; monitoring and reporting the investments on a regular basis; appointing/dismissing investment managers, custodians, consultants and advisors; risk management; determining/defining the mandates for investment managers; rebalancing of assets and determining investment restrictions/prohibited investments.
Pension assets are invested in accordance with applicable laws and regulations. The primary long-term investment objectives for pension assets are to: (1) provide for a reasonable amount of long-term growth of capital given prudent levels of risk exposure while minimizing permanent loss of capital; (2) generate investment results that meet or exceed the long-term rate of return assumption for the plans and (3) match the duration of the liabilities and assets of the plans to reduce the need for large employer contributions in the future. In furtherance of these objectives, investment managers are engaged to actively manage assets within the guidelines and strategies set forth by the Investment Committee. Active managers are monitored regularly and their performance is compared to applicable benchmarks.
84
UNITED PARCEL SERVICE, INC. AND SUBSIDIARIES
NOTES TO CONSOLIDATED FINANCIAL STATEMENTS
Fair Value Measurements
Pension assets utilizing Level 1 inputs include equity investments, corporate debt instruments and U.S. government securities. Fair values were determined by closing prices for those securities traded on national stock exchanges, while securities traded in the over-the-counter market and listed securities for which no sale was reported on the valuation date are valued at the mean between the last reported bid and asked prices.
Level 2 assets include certain bonds that are valued based on yields currently available on comparable securities of other issues with similar credit ratings; mortgage-backed securities that are valued based on cash flow and yield models using acceptable modeling and pricing conventions; and certain investments that are pooled with other investments in a commingled fund. We value our investments in commingled funds by taking the percentage ownership of the underlying assets, each of which has a readily determinable fair value.
Fair value estimates for certain investments are based on unobservable inputs that are not corroborated by observable market data and are thus classified as Level 3.
Investments that do not have a readily determinable fair value, and which provide a net asset value ("NAV" or its equivalent) developed consistent with FASB measurement principles, are valued using NAV as a practical expedient. These investments are not classified in Levels 1, 2, or 3 of the fair value hierarchy, but are included in the totals in the tables shown below. These investments include hedge funds, risk parity funds, real estate investments, private debt and private equity funds. Investments in hedge funds are valued using reported NAVs as of December 31st. These assets are primarily invested in a portfolio of diversified, direct investments and funds of hedge funds. Real estate investments, private debt and private equity funds are valued using fair values per the most recent partnership audited financial reports, adjusted, as appropriate, for any lag between the date of the financial reports and December 31st. The fair values may, due to the inherent uncertainty of valuation for those alternative investments, differ significantly from the values that would have been used had a ready market for the alternative investments existed, and any differences could be material. These investments are described further below:
• | Hedge Funds: Plan assets are invested in hedge funds that pursue multiple strategies to diversify risk and reduce volatility. Most of these hedge funds allow redemptions either quarterly or semi-annually after a two to three month notice period, while others allow for redemption after only a brief notification period with no restriction on redemption frequency. No unfunded commitments existed with respect to hedge funds as of December 31, 2017 . |
• | Risk Parity Funds: Plan assets are invested in risk parity strategies in order to provide diversification and balance risk/return objectives. These strategies reflect a multi-asset class balanced risk approach generally consisting of equity, interest rates, credit and commodities. These funds allow for monthly redemptions with only a brief notification period. No unfunded commitments existed with respect to risk parity funds as of December 31, 2017 . |
• | Real Estate, Private Debt and Private Equity Funds: Plan assets are invested in limited partnership interests in various private equity, private debt and real estate funds. Limited provision exists for the redemption of these interests by the limited partners that invest in these funds until the end of the term of the partnerships, typically ranging between 10 and 15 years from the date of inception. An active secondary market exists for similar partnership interests, although no particular value (discount or premium) can be guaranteed. At December 31, 2017 , unfunded commitments to such limited partnerships totaling approximately $ 2.546 billion are expected to be contributed over the remaining investment period, typically ranging between three and six years. |
85
UNITED PARCEL SERVICE, INC. AND SUBSIDIARIES
NOTES TO CONSOLIDATED FINANCIAL STATEMENTS
| Total Assets (1) |
| Level 1 |
| Level 2 |
| Level 3 |
| Percentage of Plan Assets |
| Target Allocation | |||||||||
Asset Category (U.S. Plans): |
|
|
|
|
|
|
|
|
|
|
| |||||||||
Cash and cash equivalents (2) | $ | 5,725 | |
| $ | 5,292 | |
| $ | 433 | |
| $ | - | |
| 13.6 | % |
| 0-5 |
Equity Securities: |
|
|
|
|
|
|
|
|
|
|
| |||||||||
U.S. Large Cap | 5,924 | |
| 3,121 | |
| 2,803 | |
| - | |
|
|
|
| |||||
U.S. Small Cap | 591 | |
| 421 | |
| 170 | |
| - | |
|
|
|
| |||||
Emerging Markets | 2,101 | |
| 1,669 | |
| 432 | |
| - | |
|
|
|
| |||||
Global Equity | 2,817 | |
| 2,400 | |
| 417 | |
| - | |
|
|
|
| |||||
International Equity | 4,791 | |
| 2,950 | |
| 1,841 | |
| - | |
|
|
|
| |||||
Total Equity Securities | 16,224 | |
| 10,561 | |
| 5,663 | |
| - | |
| 38.5 | |
| 35-55 | ||||
Fixed Income Securities: |
|
|
|
|
|
|
|
|
|
|
| |||||||||
U.S. Government Securities | 7,695 | |
| 7,323 | |
| 372 | |
| - | |
|
|
|
| |||||
Corporate Bonds | 3,865 | |
| - | |
| 3,857 | |
| 8 | |
|
|
|
| |||||
Global Bonds | 53 | |
| - | |
| 53 | |
| - | |
|
|
|
| |||||
Municipal Bonds | 21 | |
| - | |
| 21 | |
| - | |
|
|
|
| |||||
Total Fixed Income Securities | 11,634 | |
| 7,323 | |
| 4,303 | |
| 8 | |
| 27.6 | |
| 25-35 | ||||
Other Investments: |
|
|
|
|
|
|
|
|
|
|
| |||||||||
Hedge Funds | 2,910 | |
| - | |
| 1,031 | |
| - | |
| 6.9 | |
| 5-15 | ||||
Private Equity | 2,107 | |
| - | |
| - | |
| - | |
| 5.0 | |
| 1-10 | ||||
Private Debt | 953 | |
| - | |
| 237 | |
| - | |
| 2.3 | |
| 1-10 | ||||
Real Estate | 2,031 | |
| 157 | |
| 139 | |
| - | |
| 4.8 | |
| 1-10 | ||||
Structured Products (3) | 172 | |
| - | |
| 172 | |
| - | |
| 0.4 | |
| 0-5 | ||||
Risk Parity Funds | 359 | |
| - | |
| - | |
| | |
| 0.9 | |
| 1-10 | ||||
Total U.S. Plan Assets | $ | 42,115 | |
| $ | 23,333 | |
| $ | 11,978 | |
| $ | 8 | |
| 100.0 | % |
|
|
Asset Category (International Plans): |
|
|
|
|
|
|
|
|
|
|
| |||||||||
Cash and cash equivalents | $ | 78 | |
| $ | 43 | |
| $ | 35 | |
| | |
| 5.8 | |
| 0-10 | |
Equity Securities: |
|
|
|
|
|
|
|
|
|
|
| |||||||||
Local Markets Equity | 213 | |
| - | |
| 213 | |
| | |
|
|
|
| |||||
U.S. Equity | 30 | |
| - | |
| 30 | |
| | |
|
|
|
| |||||
Emerging Markets | 38 | |
| 38 | |
| - | |
| | |
|
|
|
| |||||
International / Global Equity | 356 | |
| 166 | |
| 190 | |
| | |
|
|
|
| |||||
Total Equity Securities | 637 | |
| 204 | |
| 433 | |
| - | |
| 47.7 | |
| 30-60 | ||||
Fixed Income Securities: |
|
|
|
|
|
|
|
|
|
|
| |||||||||
Local Government Bonds | 103 | |
| 25 | |
| 78 | |
| | |
|
|
|
| |||||
Corporate Bonds | 198 | |
| 59 | |
| 139 | |
| | |
|
|
|
| |||||
Total Fixed Income Securities | 301 | |
| 84 | |
| 217 | |
| - | |
| 22.6 | |
| 25-50 | ||||
Other Investments: |
|
|
|
|
|
|
|
|
|
|
| |||||||||
Real Estate | 124 | |
| - | |
| 79 | |
| | |
| 9.3 | |
| 5-10 | ||||
Other | 193 | |
| - | |
| 184 | |
| | |
| 14.6 | |
| 0-20 | ||||
Total International Plan Assets | $ | 1,333 | |
| $ | 331 | |
| $ | 948 | |
| $ | - | |
| 100.0 | % |
|
|
Total Plan Assets | $ | 43,448 | |
| $ | 23,664 | |
| $ | 12,926 | |
| $ | 8 | |
|
|
|
| |
(1) Certain investments that are measured at fair value using the NAV per share (or its equivalent) practical expedient have not been classified in the fair value hierarchy but are included in the category totals.
(2) Includes $5 billion in contributions made in December 2017 that had not yet been invested according to the targeted allocation.
(3) Represents mortgage and asset-backed securities.
86
UNITED PARCEL SERVICE, INC. AND SUBSIDIARIES
NOTES TO CONSOLIDATED FINANCIAL STATEMENTS
| Total Assets (1) |
| Level 1 |
| Level 2 |
| Level 3 |
| Percentage of Plan Assets |
| Target Allocation | |||||||||
Asset Category (U.S. Plans): |
|
|
|
|
|
|
|
|
|
|
| |||||||||
Cash and cash equivalents | $ | 304 | |
| $ | 102 | |
| $ | 202 | |
| $ | - | |
| 1.0 | % |
| 0-5 |
Equity Securities: |
|
|
|
|
|
|
|
|
|
|
| |||||||||
U.S. Large Cap | 4,883 | |
| 2,327 | |
| 2,556 | |
| - | |
|
|
|
| |||||
U.S. Small Cap | 542 | |
| 393 | |
| 149 | |
| - | |
|
|
|
| |||||
Emerging Markets | 1,396 | |
| 1,236 | |
| 160 | |
| - | |
|
|
|
| |||||
Global Equity | 2,603 | |
| 2,555 | |
| 48 | |
| - | |
|
|
|
| |||||
International Equity | 3,026 | |
| 2,197 | |
| 829 | |
| - | |
|
|
|
| |||||
Total Equity Securities | 12,450 | |
| 8,708 | |
| 3,742 | |
| - | |
| 39.9 | |
| 35-55 | ||||
Fixed Income Securities: |
|
|
|
|
|
|
|
|
|
|
| |||||||||
U.S. Government Securities | 6,173 | |
| 5,821 | |
| 352 | |
| - | |
|
|
|
| |||||
Corporate Bonds | 4,492 | |
| - | |
| 4,492 | |
| - | |
|
|
|
| |||||
Global Bonds | 161 | |
| - | |
| 59 | |
| - | |
|
|
|
| |||||
Municipal Bonds | 24 | |
| - | |
| 24 | |
| - | |
|
|
|
| |||||
Total Fixed Income Securities | 10,850 | |
| 5,821 | |
| 4,927 | |
| - | |
| 34.6 | |
| 25-35 | ||||
Other Investments: |
|
|
|
|
|
|
|
|
|
|
| |||||||||
Hedge Funds | 2,867 | |
| - | |
| 763 | |
| - | |
| 9.2 | |
| 5-15 | ||||
Private Equity | 1,716 | |
| - | |
| - | |
| - | |
| 5.5 | |
| 1-10 | ||||
Private Debt | 496 | |
| - | |
| - | |
| - | |
| 1.6 | |
| 1-10 | ||||
Real Estate | 1,734 | |
| 122 | |
| 144 | |
| - | |
| 5.6 | |
| 1-10 | ||||
Structured Products (2) | 492 | |
| - | |
| 492 | |
| - | |
| 1.6 | |
| 0-5 | ||||
Risk Parity Funds | 321 | |
| - | |
| - | |
| - | |
| 1.0 | |
| 1-10 | ||||
Total U.S. Plan Assets | $ | 31,230 | |
| $ | 14,753 | |
| $ | 10,270 | |
| $ | - | |
| 100.0 | % |
|
|
Asset Category (International Plans): |
|
|
|
|
|
|
|
|
|
|
| |||||||||
Cash and cash equivalents | $ | 54 | |
| $ | 37 | |
| $ | 17 | |
| - | |
| 4.9 | |
| 0-15 | |
Equity Securities: |
|
|
|
|
|
|
|
|
|
|
| |||||||||
Local Markets Equity | 188 | |
| - | |
| 188 | |
| - | |
|
|
|
| |||||
U.S. Equity | 20 | |
| - | |
| 20 | |
| - | |
|
|
|
| |||||
Emerging Markets | 26 | |
| 26 | |
| - | |
| - | |
|
|
|
| |||||
International / Global Equity | 288 | |
| 141 | |
| 147 | |
| - | |
|
|
|
| |||||
Total Equity Securities | 522 | |
| 167 | |
| 355 | |
| - | |
| 47.7 | |
| 50-65 | ||||
Fixed Income Securities: |
|
|
|
|
|
|
|
|
|
|
| |||||||||
Local Government Bonds | 84 | |
| 22 | |
| 62 | |
| - | |
|
|
|
| |||||
Corporate Bonds | 158 | |
| 51 | |
| 107 | |
| - | |
|
|
|
| |||||
Total Fixed Income Securities | 242 | |
| 73 | |
| 169 | |
| - | |
| 22.2 | |
| 15-35 | ||||
Other Investments: |
|
|
|
|
|
|
|
|
|
|
| |||||||||
Real Estate | 93 | |
| - | |
| 57 | |
| - | |
| 8.5 | |
| 0-17 | ||||
Other | 181 | |
| - | |
| 175 | |
| - | |
| 16.7 | |
| 0-20 | ||||
Total International Plan Assets | $ | 1,092 | |
| $ | 277 | |
| $ | 773 | |
| $ | - | |
| 100.0 | % |
|
|
Total Plan Assets | $ | 32,322 | |
| $ | 15,030 | |
| $ | 11,043 | |
| $ | - | |
|
|
|
| |
(1) Certain investments that are measured at fair value using the NAV per share (or its equivalent) practical expedient have not been classified in the fair value hierarchy but are included in the category totals.
(2) Represents mortgage and asset-backed securities.
87
UNITED PARCEL SERVICE, INC. AND SUBSIDIARIES
NOTES TO CONSOLIDATED FINANCIAL STATEMENTS
The following table presents the changes in the Level 3 instruments measured on a recurring basis for the years ended December 31, 2017 and 2016 (in millions).
| Corporate Bonds |
| Other |
| Total | ||||||
Balance on January 1, 2016 | $ | 6 | |
| $ | 49 | |
| $ | 55 | |
Actual Return on Assets: |
|
|
|
|
| ||||||
Assets Held at End of Year | - | |
| - | |
| - | | |||
Assets Sold During the Year | - | |
| (49 | ) |
| (49 | ) | |||
Purchases | - | |
| - | |
| - | | |||
Sales | (6 | ) |
| - | |
| (6 | ) | |||
Transfers Into (Out of) Level 3 | - | |
| - | |
| - | | |||
Balance on December 31, 2016 | $ | - | |
| $ | - | |
| $ | - | |
Actual Return on Assets: |
|
|
|
|
| ||||||
Assets Held at End of Year | - | |
| - | |
| - | | |||
Assets Sold During the Year | - | |
| - | |
| - | | |||
Purchases | 9 | |
| - | |
| 9 | | |||
Sales | (1 | ) |
| - | |
| (1 | ) | |||
Transfers Into (Out of) Level 3 | - | |
| - | |
| - | | |||
Balance on December 31, 2017 | $ | 8 | |
| $ | - | |
| $ | 8 | |
There were no UPS class A or B shares of common stock directly held in plan assets as of December 31, 2017 or December 31, 2016 .
Accumulated Other Comprehensive Income
The estimated amounts of prior service cost in AOCI expected to be amortized and recognized as a component of net periodic benefit cost in 2018 are as follows (in millions):
| U.S. Pension Benefits |
| U.S. Postretirement Medical Benefits |
| International Pension Benefits | ||||||
Prior service cost | $ | 193 | |
| $ | 7 | |
| $ | 1 | |
88
UNITED PARCEL SERVICE, INC. AND SUBSIDIARIES
NOTES TO CONSOLIDATED FINANCIAL STATEMENTS
Expected Cash Flows
Information about expected cash flows for the pension and postretirement benefit plans is as follows (in millions):
| U.S. Pension Benefits |
| U.S. Postretirement Medical Benefits |
| International Pension Benefits | ||||||
Expected Employer Contributions: |
|
|
|
|
| ||||||
2018 to plan trusts | $ | - | |
| $ | - | |
| $ | 75 | |
2018 to plan participants | 19 | |
| 78 | |
| 5 | | |||
Expected Benefit Payments: |
|
|
|
|
| ||||||
2018 | $ | 1,294 | |
| $ | 237 | |
| $ | 24 | |
2019 | 1,418 | |
| 239 | |
| 27 | | |||
2020 | 1,551 | |
| 237 | |
| 30 | | |||
2021 | 1,691 | |
| 231 | |
| 36 | | |||
2022 | 1,836 | |
| 222 | |
| 41 | | |||
2023 - 2027 | 11,358 | |
| 967 | |
| 286 | | |||
Our funding policy for U.S. plans is to contribute amounts annually that are at least equal to the amounts required by applicable laws and regulations, or to directly fund payments to plan participants, as applicable. International plans will be funded in accordance with local regulations. Additional discretionary contributions may be made when deemed appropriate to meet the long-term obligations of the plans. Expected benefit payments for pensions will be primarily paid from plan trusts. Expected benefit payments for postretirement medical benefits will be paid from plan trusts and corporate assets.
NOTE 5. MULTIEMPLOYER EMPLOYEE BENEFIT PLANS
We contribute to a number of multiemployer defined benefit plans under the terms of collective bargaining agreements that cover our union-represented employees. These plans generally provide for retirement, death and/or termination benefits for eligible employees within the applicable collective bargaining units, based on specific eligibility/participation requirements, vesting periods and benefit formulas. The risks of participating in these multiemployer plans are different from single-employer plans in the following aspects:
• | Assets contributed to a multiemployer plan by one employer may be used to provide benefits to employees of other participating employers. |
• | If we negotiate to cease participating in a multiemployer plan, we may be required to pay that plan an amount based on our allocable share of its underfunded status, referred to as a "withdrawal liability". However, cessation of participation in a multiemployer plan and subsequent payment of any withdrawal liability is subject to the collective bargaining process. |
• | If any of the multiemployer pension plans in which we participate enter critical status, and our contributions are not sufficient to satisfy any rehabilitation plan funding schedule, we could be required under the Pension Protection Act of 2006 to make additional surcharge contributions to the multiemployer pension plan in the amount of five to ten percent of the existing contributions required by our labor agreement. Such surcharges would cease upon the ratification of a new collective bargaining agreement, and could not recur unless a plan re-entered critical status at a later date. |
The discussion that follows sets forth the financial impact on our results of operations and cash flows for the years ended December 31, 2017 , 2016 and 2015 , from our participation in multiemployer benefit plans. As part of the overall collective bargaining process for wage and benefit levels, we have agreed to contribute certain amounts to the multiemployer benefit plans during the contract period. The multiemployer benefit plans set benefit levels and are responsible for benefit delivery to participants. Future contribution amounts to multiemployer benefit plans are determined only through collective bargaining, and we have no additional legal or constructive obligation to increase contributions beyond the agreed-upon amounts (except potential surcharges under the Pension Protection Act of 2006 as described above).
The number of employees covered by our multiemployer pension plans has remained consistent over the past three years, and there have been no significant changes that affect the comparability of 2017 , 2016 and 2015 contributions. We recognize expense for the contractually-required contribution for each period, and we recognize a liability for any contributions due and unpaid at the end of a reporting period.
89
UNITED PARCEL SERVICE, INC. AND SUBSIDIARIES
NOTES TO CONSOLIDATED FINANCIAL STATEMENTS
Status of Collective Bargaining Agreements
As of December 31, 2017 , we had approximately 280,000 employees employed under a national master agreement and various supplemental agreements with local unions affiliated with the Teamsters. These agreements run through July 31, 2018. We have approximately 2,700 pilots who are employed under a collective bargaining agreement with the Independent Pilots Association ("IPA"), which runs through September 1, 2021. Our airline mechanics are covered by a collective bargaining agreement with Teamsters Local 2727, which became amendable November 1, 2013. We are currently in negotiations with Teamsters Local 2727. In addition, approximately 3,100 of our auto and maintenance mechanics who are not employed under agreements with the Teamsters are employed under collective bargaining agreements with the International Association of Machinists and Aerospace Workers ("IAM") that will expire on July 31, 2019.
Multiemployer Pension Plans
The following table outlines our participation in multiemployer pension plans for the periods ended December 31, 2017 , 2016 and 2015 , and sets forth our calendar year contributions and accruals for each plan. The "EIN/Pension Plan Number" column provides the Employer Identification Number ("EIN") and the three-digit plan number. The most recent Pension Protection Act zone status available in 2017 and 2016 relates to the plans' two most recent fiscal year-ends. The zone status is based on information that we received from the plans' administrators and is certified by each plan's actuary. Plans certified in the red zone are generally less than 65% funded, plans certified in the orange zone are both less than 80% funded and have an accumulated funding deficiency or are expected to have a deficiency in any of the next six plan years, plans certified in the yellow zone are less than 80% funded, and plans certified in the green zone are at least 80% funded. The "FIP/RP Status Pending/Implemented" column indicates whether a financial improvement plan ("FIP") for yellow/orange zone plans, or a rehabilitation plan ("RP") for red zone plans, is either pending or has been implemented. As of December 31, 2017 , all plans that have either a FIP or RP requirement have had the respective plan implemented.
Our collectively-bargained contributions satisfy the requirements of all implemented FIPs and RPs and do not currently require the payment of any surcharges. In addition, minimum contributions outside of the agreed upon contractual rates are not required. For the plans detailed in the following table, the expiration date of the associated collective bargaining agreements is July 31, 2018 , with the exception of the Automotive Industries Pension Plan and the IAM National Pension Fund / National Pension Plan which both have a July 31, 2019 expiration date. For all plans detailed in the following table, we provided more than 5% of the total plan contributions from all employers for 2017 , 2016 and 2015 (as disclosed in the annual filing with the Department of Labor for each respective plan).
90
UNITED PARCEL SERVICE, INC. AND SUBSIDIARIES
NOTES TO CONSOLIDATED FINANCIAL STATEMENTS
Certain plans have been aggregated in the "all other multiemployer pension plans" line in the following table, as the contributions to each of these individual plans are not material.
| EIN / Pension Plan |
| Pension Protection Act Zone Status |
| FIP / RP Status Pending / |
| (in millions) UPS Contributions and Accruals |
| Surcharge | ||||||||||||
Pension Fund | Number |
| 2017 |
| 2016 |
| Implemented |
| 2017 |
| 2016 |
| 2015 |
| Imposed | ||||||
Alaska Teamster-Employer Pension Plan | 92-6003463-024 |
| Red |
| Red |
| Yes/Implemented |
| $ | 5 | |
| $ | 5 | |
| $ | 5 | |
| No |
Automotive Industries Pension Plan | 94-1133245-001 |
| Red |
| Red |
| Yes/Implemented |
| 5 | |
| 4 | |
| 4 | |
| No | |||
Central Pennsylvania Teamsters Defined Benefit Plan | 23-6262789-001 |
| Green |
| Green |
| No |
| 40 | |
| 38 | |
| 36 | |
| No | |||
Eastern Shore Teamsters Pension Fund | 52-0904953-001 |
| Green |
| Green |
| No |
| 5 | |
| 5 | |
| 4 | |
| No | |||
Employer-Teamsters Local Nos. 175 & 505 Pension Trust Fund | 55-6021850-001 |
| Red |
| Red |
| Yes/Implemented |
| 12 | |
| 11 | |
| 11 | |
| No | |||
Hagerstown Motor Carriers and Teamsters Pension Fund | 52-6045424-001 |
| Red |
| Red |
| Yes/Implemented |
| 8 | |
| 7 | |
| 7 | |
| No | |||
I.A.M. National Pension Fund / National Pension Plan | 51-6031295-002 |
| Green |
| Green |
| No |
| 35 | |
| 31 | |
| 29 | |
| No | |||
International Brotherhood of Teamsters Union Local No. 710 Pension Fund | 36-2377656-001 |
| Green |
| Green |
| No |
| 118 | |
| 107 | |
| 106 | |
| No | |||
Local 705, International Brotherhood of Teamsters Pension Plan | 36-6492502-001 |
| Yellow |
| Red |
| Yes/Implemented |
| 93 | |
| 88 | |
| 91 | |
| No | |||
Local 804 I.B.T. & Local 447 I.A.M.-UPS Multiemployer Retirement Plan | 51-6117726-001 |
| Yellow |
| Red |
| Yes/Implemented |
| 110 | |
| 103 | |
| 97 | |
| No | |||
Milwaukee Drivers Pension Trust Fund | 39-6045229-001 |
| Green |
| Green |
| No |
| 38 | |
| 36 | |
| 35 | |
| No | |||
New England Teamsters & Trucking Industry Pension Fund | 04-6372430-001 |
| Red |
| Red |
| Yes/Implemented |
| 114 | |
| 114 | |
| 110 | |
| No | |||
New York State Teamsters Conference Pension and Retirement Fund | 16-6063585-074 |
| Red |
| Red |
| Yes/Implemented |
| 100 | |
| 91 | |
| 86 | |
| No | |||
Teamster Pension Fund of Philadelphia and Vicinity | 23-1511735-001 |
| Yellow |
| Yellow |
| Yes/Implemented |
| 60 | |
| 56 | |
| 53 | |
| No | |||
Teamsters Joint Council No. 83 of Virginia Pension Fund | 54-6097996-001 |
| Green |
| Yellow |
| No |
| 64 | |
| 61 | |
| 57 | |
| No | |||
Teamsters Local 639-Employers Pension Trust | 53-0237142-001 |
| Green |
| Green |
| No |
| 55 | |
| 51 | |
| 48 | |
| No | |||
Teamsters Negotiated Pension Plan | 43-6196083-001 |
| Green |
| Green |
| No |
| 32 | |
| 31 | |
| 30 | |
| No | |||
Truck Drivers and Helpers Local Union No. 355 Retirement Pension Plan | 52-6043608-001 |
| Green |
| Yellow |
| No |
| 20 | |
| 19 | |
| 17 | |
| No | |||
United Parcel Service, Inc.-Local 177, I.B.T. Multiemployer Retirement Plan | 13-1426500-419 |
| Red |
| Red |
| Yes/Implemented |
| 88 | |
| 83 | |
| 83 | |
| No | |||
Western Conference of Teamsters Pension Plan | 91-6145047-001 |
| Green |
| Green |
| No |
| 772 | |
| 694 | |
| 646 | |
| No | |||
Western Pennsylvania Teamsters and Employers Pension Fund | 25-6029946-001 |
| Red |
| Red |
| Yes/Implemented |
| 30 | |
| 28 | |
| 26 | |
| No | |||
All Other Multiemployer Pension Plans |
|
|
|
|
|
|
|
| 66 | |
| 56 | |
| 42 | |
|
| |||
|
|
|
|
|
|
| Total Contributions |
| $ | 1,870 | |
| $ | 1,719 | |
| $ | 1,623 | |
|
|
Agreement with the New England Teamsters and Trucking Industry Pension Fund
In 2012, we reached an agreement with the New England Teamsters and Trucking Industry Pension Fund ("NETTI Fund"), a multiemployer pension plan in which UPS is a participant, to restructure the pension liabilities for approximately 10,200 UPS employees represented by the Teamsters. As of December 31, 2017 and 2016 , we had $ 859 and $ 866 million, respectively, recognized in "other non-current liabilities" on our consolidated balance sheets representing the remaining balance of the NETTI Fund withdrawal liability. Based on the borrowing rates currently available to the Company for long-term financing of a similar maturity, the fair value of the NETTI Fund withdrawal liability as of December 31, 2017 and 2016 was $ 921 and $861 million . We utilized Level 2 inputs in the fair value hierarchy of valuation techniques to determine the fair value of this liability.
91
UNITED PARCEL SERVICE, INC. AND SUBSIDIARIES
NOTES TO CONSOLIDATED FINANCIAL STATEMENTS
Multiemployer Health and Welfare Plans
We also contribute to several multiemployer health and welfare plans that cover both active and retired employees. Healthcare benefits are provided to participants who meet certain eligibility requirements as covered under the applicable collective bargaining unit. The following table sets forth our calendar year plan contributions and accruals. Certain plans have been aggregated in the "all other multiemployer health and welfare plans" line in the table, as the contributions to each of these individual plans are not material.
| (in millions) UPS Contributions and Accruals | ||||||||||
Health and Welfare Fund | 2017 |
| 2016 |
| 2015 | ||||||
Central States, South East & South West Areas Health and Welfare Fund | $ | 2,366 | |
| $ | 2,268 | |
| $ | 2,081 | |
Teamsters Western Region & Local 177 Health Care Plan | 605 | |
| 571 | |
| 515 | | |||
Health & Welfare Insurance Fund Teamsters Local 653 | 7 | |
| 6 | |
| 6 | | |||
Bay Area Delivery Drivers | 37 | |
| 35 | |
| 34 | | |||
Central Pennsylvania Teamsters Health & Pension Fund | 27 | |
| 25 | |
| 23 | | |||
Delta Health Systems-East Bay Drayage Drivers | 29 | |
| 27 | |
| 27 | | |||
Employer-Teamster Local Nos. 175 & 505 | 11 | |
| 11 | |
| 10 | | |||
Joint Council #83 Health & Welfare Fund | 37 | |
| 33 | |
| 28 | | |||
Local 191 Teamsters Health Fund | 13 | |
| 12 | |
| 11 | | |||
Local 401 Teamsters Health & Welfare Fund | 9 | |
| 8 | |
| 7 | | |||
Local 804 Welfare Trust Fund | 84 | |
| 79 | |
| 75 | | |||
Milwaukee Drivers Pension Trust Fund-Milwaukee Drivers Health and Welfare Trust Fund | 38 | |
| 36 | |
| 34 | | |||
Montana Teamster Employers Trust | 8 | |
| 8 | |
| 7 | | |||
New York State Teamsters Health & Hospital Fund | 59 | |
| 56 | |
| 53 | | |||
North Coast Benefit Trust | 11 | |
| 8 | |
| 8 | | |||
Northern California General Teamsters (DELTA) | 132 | |
| 116 | |
| 108 | | |||
Northern New England Benefit Trust | 50 | |
| 47 | |
| 42 | | |||
Oregon / Teamster Employers Trust | 38 | |
| 34 | |
| 31 | | |||
Teamsters 170 Health & Welfare Fund | 17 | |
| 16 | |
| 15 | | |||
Teamsters Benefit Trust | 46 | |
| 43 | |
| 36 | | |||
Teamsters Local 251 Health & Insurance Plan | 15 | |
| 14 | |
| 13 | | |||
Teamsters Local 404 Health & Insurance Plan | 8 | |
| 7 | |
| 7 | | |||
Teamsters Local 638 Health Fund | 43 | |
| 40 | |
| 39 | | |||
Teamsters Local 639-Employers Health & Pension Trust Funds | 27 | |
| 27 | |
| 26 | | |||
Teamsters Local 671 Health Services & Insurance Plan | 17 | |
| 17 | |
| 15 | | |||
Teamsters Union 25 Health Services & Insurance Plan | 52 | |
| 50 | |
| 46 | | |||
Teamsters Union Local 677 Health Services & Insurance Plan | 11 | |
| 10 | |
| 10 | | |||
Truck Drivers and Helpers Local 355 Baltimore Area Health & Welfare Fund | 16 | |
| 16 | |
| 15 | | |||
Utah-Idaho Teamsters Security Fund | 29 | |
| 26 | |
| 25 | | |||
Washington Teamsters Welfare Trust | 52 | |
| 47 | |
| 44 | | |||
All Other Multiemployer Health and Welfare Plans | 78 | |
| 68 | |
| 95 | | |||
Total Contributions | $ | 3,972 | |
| $ | 3,761 | |
| $ | 3,486 | |
92
UNITED PARCEL SERVICE, INC. AND SUBSIDIARIES
NOTES TO CONSOLIDATED FINANCIAL STATEMENTS
NOTE 6. GOODWILL AND INTANGIBLE ASSETS
The following table indicates the allocation of goodwill by segment (in millions):
| U.S. Domestic Package |
| International Package |
| Supply Chain & Freight |
| Consolidated | ||||||||
Balance on January 1, 2016 | $ | 715 | |
| $ | 425 | |
| $ | 2,279 | |
| $ | 3,419 | |
Acquired | - | |
| - | |
| 359 | |
| 359 | | ||||
Currency / Other | - | |
| (18 | ) |
| (3 | ) |
| (21 | ) | ||||
Balance on December 31, 2016 | $ | 715 | |
| $ | 407 | |
| $ | 2,635 | |
| $ | 3,757 | |
Acquired | - | |
| 18 | |
| 54 | |
| 72 | | ||||
Currency / Other | - | |
| 10 | |
| 33 | |
| 43 | | ||||
Balance on December 31, 2017 | $ | 715 | |
| $ | 435 | |
| $ | 2,722 | |
| $ | 3,872 | |
2017 Goodwill Activity
The goodwill acquired in the Supply Chain & Freight segment is primarily related to our January 2017 acquisition of Freightex Ltd. ("Freightex") and our November 2017 acquisition of STTAS Global Holdings, Inc ("Sandler & Travis Trade Advisory Services" or "STTAS"). The remaining goodwill acquired in the Supply Chain & Freight segment was related to other, smaller acquisitions immaterial to our consolidated financial position or results of operations.
The goodwill acquired in the International Package segment is related to our June 2017 acquisition of Eirpost Group Unlimited Company ("Nightline").
The remaining change in goodwill for both the Supply Chain & Freight and the International Package segments was due to immaterial purchase accounting adjustments and the impact of changes in the value of the U.S. Dollar on the translation of non-U.S. Dollar goodwill balances.
2016 Goodwill Activity
The goodwill acquired in the Supply Chain & Freight segment was related to our December 2016 acquisition of Maze 1 Limited ("Marken").
The remaining change in goodwill for both the Supply Chain & Freight and the International Package segments was due to immaterial purchase accounting adjustments and the impact of changes in the value of the U.S. Dollar on the translation of non-U.S. Dollar goodwill balances.
The estimates of the fair value of assets acquired and liabilities assumed are subject to change based on the completion of purchase accounting. The purchase price allocation for acquired companies can be modified for up to one year from the date of acquisition. See note 7 for further discussion of these acquisitions.
Goodwill Impairment and Annual Assessment Date Change
During the third quarter of 2017, we changed the measurement date of our annual goodwill impairment test from October 1st to July 1st. This change better aligns the timing of the goodwill impairment test with our long-term business planning process. The change was not material to our consolidated financial statements as it did not result in the delay, acceleration or avoidance of an impairment charge.
We completed our annual goodwill impairment valuation, as of July 1st, on a reporting unit basis which we own at the testing date. For the periods presented, no triggering events were identified that required an interim impairment test.
U.S. Domestic Package is our largest reporting segment. In our International Package reporting segment, we have the following reporting units: Europe, Asia, Americas and ISMEA (Indian Subcontinent, Middle East and Africa). In our Supply Chain & Freight segment we have the following reporting units: Forwarding, Logistics, UPS Mail Innovations, UPS Freight, The UPS Store, UPS Capital, Marken and Coyote Logistics.
93
UNITED PARCEL SERVICE, INC. AND SUBSIDIARIES
NOTES TO CONSOLIDATED FINANCIAL STATEMENTS
In assessing our goodwill for impairment, we initially evaluate qualitative factors to determine if it is more likely than not that the fair value of a reporting unit is less than its carrying amount. If the qualitative assessment is not conclusive and it is necessary to calculate the fair value of a reporting unit, then we utilize a two-step process to test goodwill for impairment. First, a comparison of the fair value of the applicable reporting unit with the aggregate carrying value, including goodwill, is performed. We primarily determine the fair value of our reporting units using a discounted cash flow model, and supplement this with observable valuation multiples for comparable companies, as applicable. If the carrying amount of a reporting unit exceeds the reporting unit's fair value, we perform the second step of the goodwill impairment test to determine the amount of impairment loss. The second step includes comparing the implied fair value of the affected reporting unit's goodwill with the carrying value of that goodwill.
In 2017, we utilized a qualitative assessment to determine that it was more likely than not that the reporting unit fair value exceeded the carrying value for our U.S. Domestic Package, Europe Package, Asia Package, Americas Package, ISMEA Package, Forwarding, UPS Mail Innovations, The UPS Store and UPS Capital reporting units. For the remaining reporting units owned at the annual goodwill impairment testing date, we utilized the two-step process to test goodwill for impairment. We did not have any goodwill impairment charges in 2017 , 2016 or 2015 . Cumulatively, our Supply Chain & Freight segment has recorded $ 622 million of goodwill impairment charges, while our International and U.S. Domestic Package segments have not recorded any goodwill impairment charges.
Intangible Assets
The following is a summary of intangible assets at December 31, 2017 and 2016 (in millions):
| Gross Carrying Amount |
| Accumulated Amortization |
| Net Carrying Value |
| Weighted- Average Amortization Period (in years) | ||||||
December 31, 2017 |
|
|
|
|
|
|
| ||||||
Capitalized software | $ | 3,273 | |
| $ | (2,310 | ) |
| $ | 963 | |
| 6.9 |
Licenses | 114 | |
| (10 | ) |
| 104 | |
| 3.9 | |||
Franchise rights | 144 | |
| (97 | ) |
| 47 | |
| 20.0 | |||
Customer relationships | 776 | |
| (160 | ) |
| 616 | |
| 10.8 | |||
Trade name | 200 | |
| - | |
| 200 | |
| NA | |||
Trademarks, patents and other | 71 | |
| (37 | ) |
| 34 | |
| 5.4 | |||
Total Intangible Assets | $ | 4,578 | |
| $ | (2,614 | ) |
| $ | 1,964 | |
| 7.9 |
December 31, 2016 |
|
|
|
|
|
|
| ||||||
Capitalized software | $ | 2,933 | |
| $ | (2,157 | ) |
| $ | 776 | |
|
|
Licenses | 131 | |
| (70 | ) |
| 61 | |
|
| |||
Franchise rights | 128 | |
| (90 | ) |
| 38 | |
|
| |||
Customer relationships | 724 | |
| (85 | ) |
| 639 | |
|
| |||
Trade name | 200 | |
| - | |
| 200 | |
|
| |||
Trademarks, patents and other | 67 | |
| (23 | ) |
| 44 | |
|
| |||
Total Intangible Assets | $ | 4,183 | |
| $ | (2,425 | ) |
| $ | 1,758 | |
|
|
A trade name and licenses with a carrying value of $200 and $ 5 million, respectively, as of December 31, 2017 are deemed to be indefinite-lived intangible assets, and therefore are not amortized. Impairment tests for indefinite-lived intangible assets are performed on an annual basis. All of our other recorded intangible assets are deemed to be finite-lived intangibles, and are thus amortized over their estimated useful lives. Impairment tests for these intangible assets are only performed when a triggering event occurs that may indicate that the carrying value of the intangible may not be recoverable. There was a $ 7 million impairment of a finite-lived intangible asset and no impairment of finite-lived and indefinite-lived intangible assets in 2017 and 2016 , respectively.
Amortization of intangible assets was $ 287 , $ 321 and $ 261 million during 2017 , 2016 and 2015 , respectively. Expected amortization of finite-lived intangible assets recorded as of December 31, 2017 for the next five years is as follows (in millions): 2018 -$ 367 ; 2019 -$ 328 ; 2020 -$ 287 ; 2021 -$ 232 ; 2022 -$ 180 . Amortization expense in future periods will be affected by business acquisitions, software development, licensing agreements, franchise rights purchases and other factors.
94
UNITED PARCEL SERVICE, INC. AND SUBSIDIARIES
NOTES TO CONSOLIDATED FINANCIAL STATEMENTS
NOTE 7. BUSINESS ACQUISITIONS
In January 2017, we acquired Freightex Ltd. ("Freightex"), a U.K.-based asset-light provider of truckload, less-than-truckload and specialized over-the-road services, which was added to our Supply Chain & Freight segment. In June 2017, we acquired Eirpost Group Unlimited Company ("Nightline"), an Ireland-based express delivery and logistics company, which was added to our International Package reporting segment. In November 2017, we acquired STTAS, a global trade compliance management company, which was added to our Supply Chain & Freight segment. These acquisitions were funded with cash from operations and were not material to our consolidated financial position or results of operations.
In December 2016, we acquired Marken, a global provider of supply chain solutions to the life sciences industry and leader in clinical trials, material storage and distribution, for approximately $570 million. The purchase price allocation was completed in the fourth quarter of 2017 and there were no material changes to our estimated fair values of assets acquired and liabilities assumed. The financial results of Marken are included in the Supply Chain & Freight segment from the date of acquisition.
The following table summarizes the fair values of the Marken assets acquired and liabilities assumed at the acquisition date (in millions):
Marken Assets Acquired and (Liabilities) Assumed |
| ||
Cash and cash equivalents | $ | 26 | |
Accounts receivable | 34 | | |
Other current assets | 6 | | |
Deferred tax assets | 35 | | |
Property, plant, and equipment | 7 | | |
Goodwill | 319 | | |
Intangible assets | 238 | | |
Accounts payable and other current liabilities | (29 | ) | |
Deferred tax liabilities | (66 | ) | |
Total purchase price | $ | 570 | |
The goodwill recognized of approximately $ 319 million is attributable to synergies anticipated from future growth of Marken. None of the goodwill is deductible for income tax purposes.
The intangible assets acquired of approximately $ 238 million primarily consist of $219 million of customer relationships (amortized over 12 years ), $10 million of trade name (amortized over 3 years ), $8 million of capitalized software (amortized over 3 - 5 years) and a $1 million agent network (amortized over 4 years ). The carrying value of working capital approximates fair value.
We recognized approximately $8 million of acquisition related costs that were expensed in 2016. These costs are included in "other expenses" within the statements of consolidated income.
95
UNITED PARCEL SERVICE, INC. AND SUBSIDIARIES
NOTES TO CONSOLIDATED FINANCIAL STATEMENTS
NOTE 8. DEBT AND FINANCING ARRANGEMENTS
The following table sets forth the principal amount, maturity or range of maturities, as well as the carrying value of our debt obligations, as of December 31, 2017 and 2016 (in millions). The carrying value of these debt obligations can differ from the principal amount due to the impact of unamortized discounts or premiums and valuation adjustments resulting from interest rate swap hedging relationships.
| Principal |
|
|
| Carrying Value | ||||||||
| Amount |
| Maturity |
| 2017 |
| 2016 | ||||||
Commercial paper | $ | 3,203 | |
| 2018 |
| $ | 3,203 | |
| $ | 3,250 | |
Fixed-rate senior notes: |
|
|
|
|
|
|
| ||||||
1.125% senior notes | 375 | |
| 2017 |
| - | |
| 374 | | |||
5.500% senior notes | 750 | |
| 2018 |
| 751 | |
| 769 | | |||
5.125% senior notes | 1,000 | |
| 2019 |
| 1,019 | |
| 1,043 | | |||
3.125% senior notes | 1,500 | |
| 2021 |
| 1,549 | |
| 1,584 | | |||
2.050% senior notes | 700 | |
| 2021 |
| 696 | |
| - | | |||
2.450% senior notes | 1,000 | |
| 2022 |
| 979 | |
| 986 | | |||
2.350% senior notes | 600 | |
| 2022 |
| 597 | |
| - | | |||
2.500% senior notes | 1,000 | |
| 2023 |
| 992 | |
| - | | |||
2.800% senior notes | 500 | |
| 2024 |
| 495 | |
| - | | |||
2.400% senior notes | 500 | |
| 2026 |
| 497 | |
| 497 | | |||
3.050% senior notes | 1,000 | |
| 2027 |
| 990 | |
| - | | |||
6.200% senior notes | 1,500 | |
| 2038 |
| 1,482 | |
| 1,481 | | |||
4.875% senior notes | 500 | |
| 2040 |
| 489 | |
| 489 | | |||
3.625% senior notes | 375 | |
| 2042 |
| 368 | |
| 367 | | |||
3.400% senior notes | 500 | |
| 2046 |
| 491 | |
| 491 | | |||
3.750% senior notes | 1,150 | |
| 2047 |
| 1,135 | |
| - | | |||
Floating-rate senior notes: |
|
|
|
|
|
|
| ||||||
Floating-rate senior notes | 350 | |
| 2021 |
| 348 | |
| - | | |||
Floating-rate senior notes | 400 | |
| 2022 |
| 398 | |
| - | | |||
Floating-rate senior notes | 500 | |
| 2023 |
| 496 | |
| - | | |||
Floating-rate senior notes | 1,043 | |
| 2049-2067 |
| 1,032 | |
| 824 | | |||
8.375% Debentures: |
|
|
|
|
|
|
| ||||||
8.375% debentures | 424 | |
| 2020 |
| 447 | |
| 461 | | |||
8.375% debentures | 276 | |
| 2030 |
| 282 | |
| 282 | | |||
Pound Sterling Notes: |
|
|
|
|
|
|
| ||||||
5.500% notes | 90 | |
| 2031 |
| 84 | |
| 76 | | |||
5.125% notes | 614 | |
| 2050 |
| 586 | |
| 535 | | |||
Euro Senior Notes: |
|
|
|
|
|
|
| ||||||
0.375% senior notes | 839 | |
| 2023 |
| 832 | |
| - | | |||
1.625% senior notes | 839 | |
| 2025 |
| 833 | |
| 732 | | |||
1.000% senior notes | 599 | |
| 2028 |
| 595 | |
| 523 | | |||
1.500% senior notes | 599 | |
| 2032 |
| 594 | |
| - | | |||
Floating-rate senior notes | 599 | |
| 2020 |
| 598 | |
| 525 | | |||
Canadian senior notes: |
|
|
|
|
|
|
| ||||||
2.125% senior notes | 597 | |
| 2024 |
| 593 | |
| - | | |||
Capital lease obligations | 500 | |
| 2018– 3005 |
| 500 | |
| 447 | | |||
Facility notes and bonds | 320 | |
| 2029 – 2045 |
| 319 | |
| 319 | | |||
Other debt | 19 | |
| 2018 – 2022 |
| 19 | |
| 20 | | |||
Total debt | $ | 24,761 | |
|
|
| 24,289 | |
| 16,075 | | ||
Less: current maturities |
|
|
|
| (4,011 | ) |
| (3,681 | ) | ||||
Long-term debt |
|
|
|
| $ | 20,278 | |
| $ | 12,394 | | ||
96
UNITED PARCEL SERVICE, INC. AND SUBSIDIARIES
NOTES TO CONSOLIDATED FINANCIAL STATEMENTS
Debt Issuances
On May 16, 2017 we issued U.S. senior rate notes. These senior notes consist of two separate series, as follows:
• | Two series of notes, in the principal amounts of $ 600 and $ 400 million, were issued. These notes bear interest at a 2.350% fixed rate and at three-month LIBOR plus 38 basis points, respectively, and mature May 2022. Interest on the fixed-rate senior notes is payable semi-annually, beginning November 2017. Interest on the floating-rate senior notes is payable quarterly beginning August 2017. The 2.350% notes are callable at our option at a redemption price equal to the greater of 100% of the principal amount, or the sum of the present values of the remaining scheduled payments of principal and interest thereon discounted to the redemption date on a semi-annual basis at the discount rate of the treasury rate plus 10 basis points and accrued interest. The floating-rate senior notes are not callable. |
On May 18, 2017 we issued Canadian senior notes. These senior notes consist of a single series as follows:
• | Notes in the principal amount of C$ 750 million ($ 547 million), which bear interest at a 2.125% fixed interest rate and mature May 2024. Interest on the notes is payable semi-annually beginning November 2017. The notes are callable at our option, in whole or in part at the Government of Canada yield plus 21.5 basis points, and on or after the par call date, at par value. |
On November 8, 2017, we issued Euro senior rate notes. These senior notes consist of two separate series, as follows:
• | Two series of notes, in the principal amount of €700 million ( $815 million ) and €500 million ( $582 million ) were issued. These notes bear interest at 0.375% and 1.500% fixed rates, respectively, and mature November 2023 and November 2032, respectively. Interest on these notes is payable annually, beginning in November 2018. The notes are callable at our option at a redemption price equal to the greater of 100% of the principal amount, or the sum of the present values of the remaining scheduled payments of principal and interest thereon discounted to the date of redemption at a benchmark comparable government bond yield plus 10 and 20 basis points, respectively, and accrued interest. |
On November 9, 2017, we issued U.S. senior rate notes. These senior notes consist of seven separate series, as follows:
• | Notes in the principal amount of $ 350 million, which bear interest at three-month LIBOR plus 15 basis points and mature April 2021. Interest on the notes is payable quarterly beginning April 2018. These notes are not callable. |
• | Notes in the principal amount of $ 500 million, which bear interest at three-month LIBOR plus 45 basis points and mature April 2023. Interest on the notes is payable quarterly beginning April 2018. These notes are not callable. |
• | Notes in the principal amount of $ 700 million, which bear interest at a 2.050% fixed rate and mature April 2021. Interest on the fixed-rate senior notes is payable semi-annually, beginning April 2018. These notes are callable at our option at a redemption price equal to the greater of 100% of the principal amount, or the sum of the present values of the remaining scheduled payments of principal and interest thereon discounted to the redemption date on a semi-annual basis at the discount rate of the treasury rate plus 10 basis points and accrued interest. |
• | Notes in the principal amount of $ 1 billion, which bear interest at a 2.500% fixed interest rate and mature April 2023. Interest on the fixed-rate senior notes is payable semi-annually, beginning April 2018. These notes are callable at our option at a redemption price equal to the greater of 100% of the principal amount, or the sum of the present values of the remaining scheduled payments of principal and interest thereon discounted to the redemption date on a semi-annual basis at the discount rate of the treasury rate plus 10 basis points plus accrued interest. If called within the one month prior to maturity, the redemption price is equal to 100% of the principal amount plus accrued and unpaid interest, if any, to, but excluding the redemption date. |
• | Notes in the principal amount of $ 500 million, which bear interest at a 2.800% fixed interest rate and mature November 2024. Interest on the fixed-rate senior notes is payable semi-annually, beginning May 2018. These notes are callable at our option at a redemption price equal to the greater of 100% of the principal amount, or the sum of the present values of the remaining scheduled payments of principal and interest thereon discounted to the redemption date on a semi-annual basis at the discount rate of the treasury rate plus 10 basis points plus accrued interest. If called within the two months prior to maturity, the redemption price is equal to 100% of the principal amount plus accrued and unpaid interest, if any, to, but excluding the redemption date. |
97
UNITED PARCEL SERVICE, INC. AND SUBSIDIARIES
NOTES TO CONSOLIDATED FINANCIAL STATEMENTS
• | Notes in the principal amount of $ 1 billion, which bear interest at a 3.050% fixed interest rate and mature November 2027. Interest on the fixed-rate senior notes is payable semi-annually, beginning May 2018. These notes are callable at our option at a redemption price equal to the greater of 100% of the principal amount, or the sum of the present values of the remaining scheduled payments of principal and interest thereon discounted to the redemption date on a semi-annual basis at the discount rate of the treasury rate plus 15 basis points plus accrued interest. If called within the three months prior to maturity, the redemption price is equal to 100% of the principal amount plus accrued and unpaid interest, if any, to, but excluding the redemption date. |
• | Notes in the principal amount of $ 1.15 billion, which bear interest at a 3.750% fixed interest rate and mature November 2047. Interest on the fixed-rate senior notes is payable semi-annually, beginning May 2018. These notes are callable at our option at a redemption price equal to the greater of 100% of the principal amount, or the sum of the present values of the remaining scheduled payments of principal and interest thereon discounted to the redemption date on a semi-annual basis at the discount rate of the treasury rate plus 15 basis points plus accrued interest. If called within the six months prior to maturity, the redemption price is equal to 100% of the principal amount plus accrued and unpaid interest, if any, to, but excluding the redemption date. |
Commercial Paper
We are authorized to borrow up to $ 10.0 billion under a U.S. commercial paper program and € 5.0 billion (in a variety of currencies) under a European commercial paper program. We had the following amounts outstanding under these programs as of December 31, 2017: $ 2.458 billion with an average interest rate of 1.350% and €622 million ( $745 million ) with an average interest rate of -0.41% . The amount of commercial paper outstanding under these programs in 2018 is expected to fluctuate.
Fixed-Rate Senior Notes
We have completed several offerings of fixed-rate senior notes. All of the notes pay interest semi-annually, and allow for redemption of the notes by UPS at any time by paying the greater of the principal amount or a "make-whole" amount, plus accrued interest. We subsequently entered into interest rate swaps on several of these notes, which effectively converted the fixed interest rates on the notes to variable LIBOR-based interest rates. The average interest rate payable on these notes, including the impact of the interest rate swaps, for 2017 and 2016 , respectively, were as follows:
| Principal |
|
|
| Average Effective Interest Rate | ||||||
| Value |
| Maturity |
| 2017 |
| 2016 | ||||
1.125% senior notes | $ | 375 | |
| 2017 |
| 1.51 | % |
| 1.04 | % |
5.50% senior notes | $ | 750 | |
| 2018 |
| 3.45 | % |
| 2.94 | % |
5.125% senior notes | $ | 1,000 | |
| 2019 |
| 2.98 | % |
| 2.49 | % |
3.125% senior notes | $ | 1,500 | |
| 2021 |
| 1.34 | % |
| 1.40 | % |
2.45% senior notes | $ | 1,000 | |
| 2022 |
| 1.78 | % |
| 1.26 | % |
On October 1, 2017, our $ 375 million 1.125% senior notes matured and were repaid in full.
8.375 % Debentures
The 8.375 % debentures consist of two separate tranches, as follows:
• | $ 276 million of the debentures have a maturity of April 1, 2030 . These debentures have an 8.375% interest rate until April 1, 2020 , and, thereafter, the interest rate will be 7.62% for the final 10 years. These debentures are redeemable in whole or in part at our option at any time. The redemption price is equal to the greater of 100% of the principal amount and accrued interest, or the sum of the present values of the remaining scheduled payout of principal and interest thereon discounted to the date of redemption (at a benchmark treasury yield plus five basis points) plus accrued interest. |
• | $ 424 million of the debentures have a maturity of April 1, 2020 . These debentures are not subject to redemption prior to maturity. |
Interest is payable semi-annually in April and October for both tranches and neither tranche is subject to sinking fund requirements. We subsequently entered into interest rate swaps on the 2020 debentures, which effectively converted the fixed interest rates on the debentures to variable LIBOR-based interest rates. The average interest rate payable on the 2020 debentures, including the impact of the interest rate swaps, for 2017 and 2016 was 5.95% and 5.43% , respectively.
98
UNITED PARCEL SERVICE, INC. AND SUBSIDIARIES
NOTES TO CONSOLIDATED FINANCIAL STATEMENTS
Floating-Rate Senior Notes
The floating-rate senior notes with principal amounts totaling $ 1.043 billion, bear interest at either one or three-month LIBOR, less a spread ranging from 30 to 45 basis points. The average interest rate for 2017 and 2016 was 0.74% and 0.21% , respectively. These notes are callable at various times after 30 years at a stated percentage of par value, and putable by the note holders at various times after one year at a stated percentage of par value. The notes have maturities ranging from 2049 through 2067 . We classified the floating-rate senior notes that are putable by the note holder as a long-term liability, due to our intent and ability to refinance the debt if the put option is exercised by the note holder.
In March and November 2017, we issued floating-rate senior notes in the principal amounts of $ 147 and $ 64 million, respectively, which are included in the $ 1.043 billion floating-rate senior notes described above. These notes will bear interest at three-month LIBOR less 30 and 35 basis points, respectively and mature in 2067.
The remaining three floating-rate senior notes in the principal amounts of $ 350 , $ 400 and $ 500 million, bear interest at three-month LIBOR, plus a spread ranging from 15 to 45 basis points. The average interest rate for 2017 and 2016 was 0.50% and 0.0% , respectively. These notes are not callable. The notes have maturities ranging from 2021 through 2023 . We classified the floating-rate senior notes that are putable by the note holder as a long-term liability, due to our intent and ability to refinance the debt if the put option is exercised by the note holder.
Capital Lease Obligations
We have certain property, plant and equipment subject to capital leases. Some of the obligations associated with these capital leases have been legally defeased. The recorded value of our property, plant and equipment subject to capital leases is as follows as of December 31 (in millions):
| 2017 |
| 2016 | ||||
Vehicles | $ | 70 | |
| $ | 68 | |
Aircraft | 2,291 | |
| 2,291 | | ||
Buildings | 285 | |
| 190 | | ||
Accumulated amortization | (990 | ) |
| (896 | ) | ||
Property, plant and equipment subject to capital leases | $ | 1,656 | |
| $ | 1,653 | |
These capital lease obligations have principal payments due at various dates from 2018 through 3005 .
Facility Notes and Bonds
We have entered into agreements with certain municipalities to finance the construction of, or improvements to, facilities that support our U.S. Domestic Package and Supply Chain & Freight operations in the United States. These facilities are located around airport properties in Louisville, Kentucky; Dallas, Texas; and Philadelphia, Pennsylvania. Under these arrangements, we enter into a lease or loan agreement that covers the debt service obligations on the bonds issued by the municipalities, as follows:
• | Bonds with a principal balance of $ 149 million issued by the Louisville Regional Airport Authority associated with our Worldport facility in Louisville, Kentucky. The bonds, which are due in January 2029 , bear interest at a variable rate, and the average interest rates for 2017 and 2016 were 0.83% and 0.37% , respectively. |
• | Bonds with a principal balance of $ 42 million and due in November 2036 issued by the Louisville Regional Airport Authority associated with our air freight facility in Louisville, Kentucky. The bonds bear interest at a variable rate, and the average interest rates for 2017 and 2016 were 0.80% and 0.36% , respectively. |
• | Bonds with a principal balance of $ 29 million issued by the Dallas / Fort Worth International Airport Facility Improvement Corporation associated with our Dallas, Texas airport facilities. The bonds are due in May 2032 and bear interest at a variable rate, however the variable cash flows on the obligation have been swapped to a fixed 5.11% . |
• | In September 2015 , we entered into an agreement with the Delaware County, Pennsylvania Industrial Development Authority, associated with our Philadelphia, Pennsylvania airport facilities, for bonds issued with a principal balance of $100 million. These bonds, which are due September 2045, bear interest at a variable rate. The average interest rate for 2017 and 2016 was 0.78% and 0.40% , respectively. |
99
UNITED PARCEL SERVICE, INC. AND SUBSIDIARIES
NOTES TO CONSOLIDATED FINANCIAL STATEMENTS
Pound Sterling Notes
The Pound Sterling notes consist of two separate tranches, as follows:
• | Notes with a principal amount of £66 million accrue interest at a 5.50% fixed rate, and are due in February 2031 . These notes are not callable. |
• | Notes with a principal amount of £ 455 million accrue interest at a 5.125% fixed rate, and are due in February 2050 . These notes are callable at our option at a redemption price equal to the greater of 100% of the principal amount and accrued interest, or the sum of the present values of the remaining scheduled payout of principal and interest thereon discounted to the date of redemption at a benchmark U.K. government bond yield plus 15 basis points and accrued interest. |
Euro Senior Notes
The remaining euro senior notes consist of three separate issuances, as follows:
• | Notes in the principal amount of € 500 million accrue interest at a 1% fixed rate and are due in November 2028. Interest is payable annually on the notes, commencing in November 2017. These notes are callable at our option at a redemption price equal to the greater of 100% of the principal amounts, or the sum of the present values of the remaining schedule payments of principal and interest thereon discounted to the date of redemption at a benchmark comparable German government bond yield plus 15 basis points and accrued interest. |
• | Notes with a principal amount of €500 million accrue interest at a variable rate equal to three-month EURIBOR plus 43 basis points and are due in July 2020. Interest is payable quarterly on the notes, commencing in April 2016. These notes are not callable. The senior notes bear interest at a variable rate, and the average interest rates for 2017 and 2016 were 0.10% and 0.19% , respectively. |
• | Notes with a principal amount of €700 million accrue interest at a 1.625% fixed rate and are due in November 2025. Interest is payable annually on the notes, commencing in November 2016. These notes are callable at our option at a redemption price equal to the greater of 100% of the principal amount, or the sum of the present values of the remaining scheduled payout of principal and interest thereon discounted to the date of redemption at a benchmark German government bond yield plus 20 basis points and accrued interest. |
Contractual Commitments
We lease certain aircraft, facilities, land, equipment and vehicles under operating leases, which expire at various dates through 2040 . Certain of the leases contain escalation clauses and renewal or purchase options. Rent expense related to our operating leases was $ 804 , $ 686 and $ 669 million for 2017 , 2016 and 2015 , respectively.
The following table sets forth the aggregate minimum lease payments under capital and operating leases, the aggregate annual principal payments due under our long-term debt and the aggregate amounts expected to be spent for purchase commitments (in millions).
Year | Capital Leases |
| Operating Leases |
| Debt Principal |
| Purchase Commitments (1) | ||||||||
2018 | $ | 81 | |
| $ | 398 | |
| $ | 3,960 | |
| $ | 3,789 | |
2019 | 79 | |
| 305 | |
| 1,009 | |
| 2,462 | | ||||
2020 | 69 | |
| 239 | |
| 1,024 | |
| 2,428 | | ||||
2021 | 49 | |
| 186 | |
| 2,551 | |
| 1,926 | | ||||
2022 | 45 | |
| 138 | |
| 2,000 | |
| 323 | | ||||
After 2022 | 500 | |
| 371 | |
| 13,342 | |
| 13 | | ||||
Total | 823 | |
| $ | 1,637 | |
| $ | 23,886 | |
| $ | 10,941 | | |
Less: imputed interest | (323 | ) |
|
|
|
|
|
| |||||||
Present value of minimum capitalized lease payments | 500 | |
|
|
|
|
|
| |||||||
Less: current portion | (51 | ) |
|
|
|
|
|
| |||||||
Long-term capitalized lease obligations | $ | 449 | |
|
|
|
|
|
| ||||||
100
UNITED PARCEL SERVICE, INC. AND SUBSIDIARIES
NOTES TO CONSOLIDATED FINANCIAL STATEMENTS
As of December 31, 2017 , we had outstanding letters of credit totaling approximately $ 1.084 billion issued in connection with our self-insurance reserves and other routine business requirements. We also issue surety bonds as an alternative to letters of credit in certain instances, and as of December 31, 2017 , we had $ 932 million of surety bonds written.
Available Credit
We maintain two credit agreements with a consortium of banks. One of these agreements provides revolving credit facilities of $ 1.5 billion, and expires on March 23, 2018 . Generally, amounts outstanding under this facility bear interest at a periodic fixed rate equal to LIBOR for the applicable interest period and currency denomination, plus an applicable margin. Alternatively, a fluctuating rate of interest equal to the highest of (1) JPMorgan Chase Bank's publicly announced prime rate, (2) the Federal Funds effective rate plus 0.50% , and (3) LIBOR for a one month interest period plus 1.00% , plus an applicable margin, may be used at our discretion. In each case, the applicable margin for advances bearing interest based on LIBOR is a percentage determined by quotations from Markit Group Ltd. for our 1 -year credit default swap spread, subject to a minimum rate of 0.10% and a maximum rate of 0.75% . The applicable margin for advances bearing interest based on the prime rate is 1.00% below the applicable margin for LIBOR advances (but not lower than 0.00% ). We are also able to request advances under this facility based on competitive bids for the applicable interest rate. There were no amounts outstanding under this facility as of December 31, 2017 .
The second agreement provides revolving credit facilities of $ 3.0 billion, and expires on March 24, 2022 . Generally, amounts outstanding under this facility bear interest at a periodic fixed rate equal to LIBOR for the applicable interest period and currency denomination, plus an applicable margin. Alternatively, a fluctuating rate of interest equal to the highest of (1) JPMorgan Chase Bank's publicly announced prime rate, (2) the Federal Funds effective rate plus 0.50% , and (3) LIBOR for a one month interest period plus 1.00% , plus an applicable margin, may be used at our discretion. In each case, the applicable margin for advances bearing interest based on LIBOR is a percentage determined by quotations from Markit Group Ltd. for our 1-year credit default swap spread, interpolated for a period from the date of determination of such credit default swap spread in connection with a new interest period until the latest maturity date of this facility then in effect (but not less than a period of one year). The minimum applicable margin rate is 0.10% and the maximum applicable margin rate is 0.75% per annum. The applicable margin for advances bearing interest based on the prime rate is 1.00% below the applicable margin for LIBOR advances (but not less than 0.00% ). We are also able to request advances under this facility based on competitive bids. There were no amounts outstanding under this facility as of December 31, 2017 .
Debt Covenants
Our existing debt instruments and credit facilities subject us to certain financial covenants. As of December 31, 2017 and for all prior periods presented, we have satisfied these financial covenants. These covenants limit the amount of secured indebtedness that we may incur, and limit the amount of attributable debt in sale-leaseback transactions, to 10% of net tangible assets. As of December 31, 2017 , 10% of net tangible assets is equivalent to $ 2.686 billion ; however, we have no covered sale-leaseback transactions or secured indebtedness outstanding. We do not expect these covenants to have a material impact on our financial condition or liquidity.
Fair Value of Debt
Based on the borrowing rates currently available to the Company for long-term debt with similar terms and maturities, the fair value of long-term debt, including current maturities, is approximately $25.206 and $ 17.134 billion as of December 31, 2017 and 2016 , respectively. We utilized Level 2 inputs in the fair value hierarchy of valuation techniques to determine the fair value of all of our debt instruments.
101
UNITED PARCEL SERVICE, INC. AND SUBSIDIARIES
NOTES TO CONSOLIDATED FINANCIAL STATEMENTS
NOTE 9. LEGAL PROCEEDINGS AND CONTINGENCIES
We are involved in a number of judicial proceedings and other matters arising from the conduct of our business activities.
Although there can be no assurance as to the ultimate outcome, we have generally denied, or believe we have a meritorious defense and will deny, liability in all litigation pending against us, including (except as otherwise noted herein) the matters described below, and we intend to defend vigorously each case. We have accrued for legal claims when, and to the extent that, amounts associated with the claims become probable and can be reasonably estimated. The actual costs of resolving legal claims may be substantially higher or lower than the amounts accrued for those claims.
For those matters as to which we are not able to estimate a possible loss or range of loss, we are not able to determine whether the loss will have a material adverse effect on our business, financial condition or results of operations or liquidity. For matters in this category, we have indicated in the descriptions that follow the reasons that we are unable to estimate the possible loss or range of loss.
Judicial Proceedings
We are a defendant in a number of lawsuits filed in state and federal courts containing various class action allegations under state wage-and-hour laws. At this time, we do not believe that any loss associated with these matters would have a material adverse effect on our financial condition, results of operations or liquidity.
UPS and our subsidiary The UPS Store, Inc. are defendants in Morgate v. The UPS Store, Inc. et al., an action in the Los Angeles Superior Court brought on behalf of a certified class of all franchisees who chose to rebrand their Mail Boxes Etc. franchises to The UPS Store in March 2003. Plaintiff alleges that UPS and The UPS Store, Inc. misrepresented and omitted facts to the class about the market tests that were conducted before offering the class the choice of whether to rebrand to The UPS Store. Defendants' motion to decertify the class was granted in August 2017. The plaintiff has filed a notice of appeal, and further proceedings in the trial court are stayed pending resolution by the California Court of Appeal. There are multiple factors that prevent us from being able to estimate the amount of loss, if any, that may result from the remaining aspects of this case, including: (1) we are vigorously defending ourselves and believe we have a number of meritorious legal defenses; (2) it remains uncertain what evidence of damages, if any, plaintiffs will be able to present; and (3) plaintiff's notice of appeal is pending. Accordingly, at this time, we are not able to estimate a possible loss or range of loss that may result from this matter or to determine whether such loss, if any, would have a material adverse effect on our financial condition, results of operations or liquidity.
In AFMS LLC v. UPS and FedEx Corporation, a lawsuit filed in federal court in the Central District of California in August 2010, the plaintiff asserts that UPS and FedEx violated U.S. antitrust law by conspiring to refuse to negotiate with third-party negotiators retained by shippers and by individually imposing policies that prevent shippers from using such negotiators. The Court granted summary judgment motions filed by UPS and FedEx, entered judgment in favor of UPS and FedEx, and dismissed the case. Plaintiff appealed to the Court of Appeals for the Ninth Circuit. In August 2017, the Ninth Circuit affirmed the District Court's order dismissing the case. AFMS filed a petition for rehearing in September 2017, which was denied. AFMS filed a Petition for Writ of Certiorari in the Supreme Court in January 29, 2018. The Antitrust Division of the U.S. Department of Justice ("DOJ") opened a civil investigation of our policies and practices for dealing with third-party negotiators. We have cooperated with this investigation, although the DOJ has not communicated with us for over five years. We deny any liability with respect to these matters and intend to vigorously defend ourselves in the event that any of these proceedings were to continue. There are multiple factors that prevent us from being able to estimate the amount of loss, if any, that may result from these matters including: (1) the DOJ investigation may be pending and (2) AFMS filed a petition for discretionary review by the U.S. Supreme Court. Accordingly, at this time, we are not able to estimate a possible loss or range of loss that may result from these matters or to determine whether such loss, if any, would have a material adverse effect on our financial condition, results of operations or liquidity.
We are a defendant in Ryan Wright and Julia Zislin v. United Parcel Service Canada Ltd., an action brought on behalf of a certified class of customers in the Superior Court of Justice in Ontario, Canada. Plaintiffs filed suit in February 2007, alleging inadequate disclosure concerning the existence and cost of brokerage services provided by us under applicable provincial consumer protection legislation and infringement of interest restriction provisions under the Criminal Code of Canada. Partial summary judgment was granted to us and the plaintiffs by the Ontario motions court in August 2011, when it dismissed plaintiffs' complaint under the Criminal Code and granted plaintiffs' complaint of inadequate disclosure. We appealed the Court's decision pertaining to inadequate disclosure in September 2011. In October 2017, we reached an agreement in principle to resolve the case for an immaterial amount. Final resolution of this matter is subject to the negotiation, execution and delivery of a settlement agreement and court approval.
102
UNITED PARCEL SERVICE, INC. AND SUBSIDIARIES
NOTES TO CONSOLIDATED FINANCIAL STATEMENTS
In February 2015, the State and City of New York filed suit against UPS in the U.S. District Court for the Southern District of New York, arising from alleged shipments of cigarettes to New York State and City residents. The complaint asserted claims under various federal and state laws. The complaint also included a claim that UPS violated the Assurance of Discontinuance it entered into with the New York Attorney General in 2005 concerning cigarette deliveries. On March 24, 2017, the District Court issued an opinion and order finding liability against UPS on each of the plaintiffs' causes of action. On May 25, 2017, the District Court issued a corrected opinion and order on liability and an order awarding the plaintiffs damages of $9.4 million and penalties of $237.6 million . An accrual of $9.4 million with respect to the damages awarded by the court is included on our consolidated balance sheet at December 31, 2017 . We estimate that the amount of losses could be up to $247 million , plus interest; however, the amount of penalties ultimately payable, if any, is subject to a variety of complex factors and potential outcomes that remain to be determined in future legal proceedings. Consequently, we are unable to reasonably estimate a likely amount of loss within that range. We strongly disagree with the District Court's analysis and conclusions, and have appealed to the United States Court of Appeals for the Second Circuit. UPS filed its opening brief with the Appellate Court in October 2017.
Other Matters
In October 2015, the DOJ informed us of an industry-wide inquiry into the transportation of mail under the United States Postal Service ("USPS") International Commercial Air contracts. In October 2017, we received a Civil Investigative Demand seeking certain information relating to our contracts. The DOJ has indicated it is investigating potential violations of the False Claims Act or other statutes. We are cooperating with the DOJ. The Company is unable to predict what action, if any, might be taken in the future by any government authorities as a result of their investigation. Accordingly, at this time, we are not able to estimate a possible loss or range of loss that may result from this matter or to determine whether such loss, if any, would have a material adverse effect on our financial condition, results of operations or liquidity.
In August 2016, Spain's National Markets and Competition Commission ("CNMC") opened an investigation into 10 companies in the commercial delivery and parcel industry, including UPS, related to alleged nonaggression agreements to allocate customers. In May 2017, UPS received a Statement of Objections issued by the CNMC. In July 2017, UPS received a Decision Proposal from the CNMC. These documents do not prejudge the final decision (which is subject to appeal) as to facts or law. There are multiple factors that prevent us from being able to estimate the amount of loss, if any, that may result from this matter, including: (1) we are vigorously defending ourselves and believe that we have a number of meritorious legal defenses; and (2) there are unresolved questions of law and fact that could be important to the ultimate resolution of this matter. Accordingly, at this time, we are not able to estimate a possible loss or range of loss that may result from this matter or to determine whether such loss, if any, would have a material adverse effect on our financial condition, results of operations or liquidity.
We are a defendant in various other lawsuits that arose in the normal course of business. We do not believe that the eventual resolution of these other lawsuits (either individually or in the aggregate), including any reasonably possible losses in excess of current accruals, will have a material adverse effect on our financial condition, results of operations or liquidity.
103
UNITED PARCEL SERVICE, INC. AND SUBSIDIARIES
NOTES TO CONSOLIDATED FINANCIAL STATEMENTS
NOTE 10. SHAREOWNERS' EQUITY
Capital Stock, Additional Paid-In Capital and Retained Earnings
We maintain two classes of common stock, which are distinguished from each other by their respective voting rights. Class A shares of UPS are entitled to 10 votes per share, whereas class B shares are entitled to one vote per share. Class A shares are primarily held by UPS employees and retirees, as well as trusts and descendants of the Company's founders, and these shares are fully convertible into class B shares at any time. Class B shares are publicly traded on the New York Stock Exchange ("NYSE") under the symbol "UPS". Class A and B shares both have a $ 0.01 par value, and as of December 31, 2017 , there were 4.6 billion class A shares and 5.6 billion class B shares authorized to be issued. Additionally, there are 200 million preferred shares authorized to be issued, with a par value of $ 0.01 per share; as of December 31, 2017 , no preferred shares had been issued.
The following is a rollforward of our common stock, additional paid-in capital and retained earnings accounts (in millions, except per share amounts):
| 2017 |
| 2016 |
| 2015 | |||||||||||||||
| Shares |
| Dollars |
| Shares |
| Dollars |
| Shares |
| Dollars | |||||||||
Class A Common Stock: |
|
|
|
|
|
|
|
|
|
|
| |||||||||
Balance at beginning of year | 180 | |
| $ | 2 | |
| 194 | |
| $ | 2 | |
| 201 | |
| $ | 2 | |
Common stock purchases | (4 | ) |
| - | |
| (4 | ) |
| - | |
| (4 | ) |
| - | | |||
Stock award plans | 4 | |
| - | |
| 5 | |
| - | |
| 5 | |
| - | | |||
Common stock issuances | 3 | |
| - | |
| 2 | |
| - | |
| 3 | |
| - | | |||
Conversions of class A to class B common stock | (10 | ) |
| - | |
| (17 | ) |
| - | |
| (11 | ) |
| - | | |||
Class A shares issued at end of year | 173 | |
| $ | 2 | |
| 180 | |
| $ | 2 | |
| 194 | |
| $ | 2 | |
Class B Common Stock: |
|
|
|
|
|
|
|
|
|
|
| |||||||||
Balance at beginning of year | 689 | |
| $ | 7 | |
| 693 | |
| $ | 7 | |
| 705 | |
| $ | 7 | |
Common stock purchases | (12 | ) |
| - | |
| (21 | ) |
| - | |
| (23 | ) |
| - | | |||
Conversions of class A to class B common stock | 10 | |
| - | |
| 17 | |
| - | |
| 11 | |
| - | | |||
Class B shares issued at end of year | 687 | |
| $ | 7 | |
| 689 | |
| $ | 7 | |
| 693 | |
| $ | 7 | |
Additional Paid-In Capital: |
|
|
|
|
|
|
|
|
|
|
| |||||||||
Balance at beginning of year |
|
| $ | - | |
|
|
| $ | - | |
|
|
| $ | - | | |||
Stock award plans |
|
| 396 | |
|
|
| 541 | |
|
|
| 492 | | ||||||
Common stock purchases |
|
| (813 | ) |
|
|
| (898 | ) |
|
|
| (791 | ) | ||||||
Common stock issuances |
|
| 363 | |
|
|
| 303 | |
|
|
| 316 | | ||||||
Option premiums received (paid) |
|
| 54 | |
|
|
| 54 | |
|
|
| (17 | ) | ||||||
Balance at end of year |
|
| $ | - | |
|
|
| $ | - | |
|
|
| $ | - | | |||
Retained Earnings: |
|
|
|
|
|
|
|
|
|
|
| |||||||||
Balance at beginning of year |
|
| $ | 4,879 | |
|
|
| $ | 6,001 | |
|
|
| $ | 5,726 | | |||
Net income attributable to controlling interests |
|
| 4,910 | |
|
|
| 3,431 | |
|
|
| 4,844 | | ||||||
Dividends ($3.32, $3.12, and $2.92 per share) |
|
| (2,928 | ) |
|
|
| (2,771 | ) |
|
|
| (2,649 | ) | ||||||
Common stock purchases |
|
| (1,003 | ) |
|
|
| (1,782 | ) |
|
|
| (1,920 | ) | ||||||
Balance at end of year |
|
| $ | 5,858 | |
|
|
| $ | 4,879 | |
|
|
| $ | 6,001 | | |||
For the years ended December 31, 2017 , 2016 and 2015 , we repurchased a total of 16.1 , 25.2 and 26.8 million shares of class A and class B common stock for $ 1.816 , $ 2.680 and $ 2.711 billion, respectively ($ 1.813 , $ 2.678 and $ 2.702 billion in repurchases for 2017 , 2016 and 2015 , respectively, are reported on the cash flow statement due to the timing of settlements). During the first quarter of 2016, we also exercised a capped call option that we entered in 2015 for which we received 0.2 million UPS class B shares. The $25 million premium payment for this capped call option reduced shareowners' equity in 2015. In total, shares repurchased and received the twelve months ended December 31, 2016 were 25.4 million shares for $ 2.705 billion. In May 2016 , the Board of Directors approved a new share repurchase authorization of $ 8.0 billion, which replaced an authorization previously announced in 2013 . This new share repurchase authorization has no expiration date. As of December 31, 2017 , we had $ 4.339 billion of this share repurchase authorization remaining.
104
UNITED PARCEL SERVICE, INC. AND SUBSIDIARIES
NOTES TO CONSOLIDATED FINANCIAL STATEMENTS
From time to time, we enter into share repurchase programs with large financial institutions to assist in our buyback of company stock. These programs allow us to repurchase our shares at a price below the weighted average UPS share price for a given period. During the fourth quarter of 2016, we entered into an accelerated share repurchase program, which allowed us to repurchase $ 300 million of shares ( 2.6 million shares). The program was completed in December 2016 .
In order to lower the average cost of acquiring shares in our ongoing share repurchase program, we periodically enter into structured repurchase agreements involving the use of capped call options for the purchase of UPS class B shares. We pay a fixed sum of cash upon execution of each agreement in exchange for the right to receive either a pre-determined amount of cash or stock. Upon expiration of each agreement, if the closing market price of our common stock is above the pre-determined price, we will have our initial investment returned with a premium in either cash or shares (at our election). If the closing market price of our common stock is at or below the pre-determined price, we will receive the number of shares specified in the agreement. We received net premiums of $54 and $ 54 million during 2017 and 2016 , respectively, related to entering into and settling capped call options for the purchase of class B shares. As of December 31, 2017 , we had outstanding options for the purchase of 0.5 million shares with an average strike price of $101.91 per share that will settle in the first quarter of 2018 .
Accumulated Other Comprehensive Income (Loss)
We incur activity in AOCI for unrealized holding gains and losses on available-for-sale securities, foreign currency translation adjustments, unrealized gains and losses from derivatives that qualify as hedges of cash flows and unrecognized pension and postretirement benefit costs. The activity in AOCI is as follows (in millions):
| 2017 |
| 2016 |
| 2015 | ||||||
Foreign Currency Translation Gain (Loss), Net of Tax: |
|
|
|
|
| ||||||
Balance at beginning of year | $ | (1,016 | ) |
| $ | (897 | ) |
| $ | (457 | ) |
Translation adjustment (net of tax effect of $(161), $32 and $0) | 86 | |
| (119 | ) |
| (440 | ) | |||
Balance at end of year | (930 | ) |
| (1,016 | ) |
| (897 | ) | |||
Unrealized Gain (Loss) on Marketable Securities, Net of Tax: |
|
|
|
|
| ||||||
Balance at beginning of year | (1 | ) |
| (1 | ) |
| - | | |||
Current period changes in fair value (net of tax effect of $(1), $0 and $(1)) | (2 | ) |
| - | |
| (1 | ) | |||
Reclassification to earnings (net of tax effect of $1, $0 and $0) | 1 | |
| - | |
| - | | |||
Balance at end of year | (2 | ) |
| (1 | ) |
| (1 | ) | |||
Unrealized Gain (Loss) on Cash Flow Hedges, Net of Tax: |
|
|
|
|
| ||||||
Balance at beginning of year | (45 | ) |
| 67 | |
| 61 | | |||
Current period changes in fair value (net of tax effect of $(190), $75 and $103) | (316 | ) |
| 124 | |
| 171 | | |||
Reclassification to earnings (net of tax effect of $(3), $(142) and $(99)) | (5 | ) |
| (236 | ) |
| (165 | ) | |||
Balance at end of year | (366 | ) |
| (45 | ) |
| 67 | | |||
Unrecognized Pension and Postretirement Benefit Costs, Net of Tax: |
|
|
|
|
| ||||||
Balance at beginning of year | (3,421 | ) |
| (2,709 | ) |
| (3,198 | ) | |||
Reclassification to earnings (net of tax effect of $269, $1,040 and $97) | 731 | |
| 1,783 | |
| 195 | | |||
Net actuarial gain (loss) and prior service cost resulting from remeasurements of plan assets and liabilities (net of tax effect of $(180), $(1,460) and $197) | (879 | ) |
| (2,495 | ) |
| 294 | | |||
Balance at end of year | (3,569 | ) |
| (3,421 | ) |
| (2,709 | ) | |||
Accumulated other comprehensive income (loss) at end of year | $ | (4,867 | ) |
| $ | (4,483 | ) |
| $ | (3,540 | ) |
105
UNITED PARCEL SERVICE, INC. AND SUBSIDIARIES
NOTES TO CONSOLIDATED FINANCIAL STATEMENTS
Detail of the gains (losses) reclassified from AOCI to the statements of consolidated income for the years ended December 31, 2017 , 2016 and 2015 is as follows (in millions):
| 2017 Amount Reclassified from AOCI |
| 2016 Amount Reclassified from AOCI |
| 2015 Amount Reclassified from AOCI |
| Affected Line Item in the Income Statement | ||||||
Unrealized Gain (Loss) on Marketable Securities: |
|
|
|
|
|
| |||||||
Realized gain (loss) on sale of securities | (2 | ) |
| - | |
| - | |
| Investment income | |||
Income tax (expense) benefit | 1 | |
| - | |
| - | |
| Income tax expense | |||
Impact on net income | (1 | ) |
| - | |
| - | |
| Net income | |||
Unrealized Gain (Loss) on Cash Flow Hedges: |
|
|
|
|
|
|
| ||||||
Interest rate contracts | (27 | ) |
| (26 | ) |
| (24 | ) |
| Interest expense | |||
Foreign exchange contracts | - | |
| - | |
| (25 | ) |
| Interest expense | |||
Foreign exchange contracts | 35 | |
| 404 | |
| 313 | |
| Revenue | |||
Income tax (expense) benefit | (3 | ) |
| (142 | ) |
| (99 | ) |
| Income tax expense | |||
Impact on net income | 5 | |
| 236 | |
| 165 | |
| Net income | |||
Unrecognized Pension and Postretirement Benefit Costs: |
|
|
|
|
|
| |||||||
Prior service costs | (200 | ) |
| (172 | ) |
| (174 | ) |
| Compensation and benefits | |||
Remeasurement of benefit obligation | (800 | ) |
| (2,651 | ) |
| (118 | ) |
| Compensation and benefits | |||
Income tax (expense) benefit | 269 | |
| 1,040 | |
| 97 | |
| Income tax expense | |||
Impact on net income | (731 | ) |
| (1,783 | ) |
| (195 | ) |
| Net income | |||
|
|
|
|
|
|
|
| ||||||
Total amount reclassified for the period | $ | (727 | ) |
| $ | (1,547 | ) |
| $ | (30 | ) |
| Net income |
Deferred Compensation Obligations and Treasury Stock
We maintain a deferred compensation plan whereby certain employees were previously able to elect to defer the gains on stock option exercises by deferring the shares received upon exercise into a rabbi trust. The shares held in this trust are classified as treasury stock, and the liability to participating employees is classified as "deferred compensation obligations" in the shareowners' equity section of the consolidated balance sheets. The number of shares needed to settle the liability for deferred compensation obligations is included in the denominator in both the basic and diluted earnings per share calculations. Employees are generally no longer able to defer the gains from stock options exercised subsequent to December 31, 2004 .
Activity in the deferred compensation program for the years ended December 31, 2017 , 2016 and 2015 is as follows (in millions):
| 2017 |
| 2016 |
| 2015 | |||||||||||||||
| Shares |
| Dollars |
| Shares |
| Dollars |
| Shares |
| Dollars | |||||||||
Deferred Compensation Obligations: |
|
|
|
|
|
|
|
|
|
|
| |||||||||
Balance at beginning of year |
|
| $ | 45 | |
|
|
| $ | 51 | |
|
|
| $ | 59 | | |||
Reinvested dividends |
|
| 2 | |
|
|
| 3 | |
|
|
| 3 | | ||||||
Benefit payments |
|
| (10 | ) |
|
|
| (9 | ) |
|
|
| (11 | ) | ||||||
Balance at end of year |
|
| $ | 37 | |
|
|
| $ | 45 | |
|
|
| $ | 51 | | |||
Treasury Stock: |
|
|
|
|
|
|
|
|
|
|
| |||||||||
Balance at beginning of year | (1 | ) |
| $ | (45 | ) |
| (1 | ) |
| $ | (51 | ) |
| (1 | ) |
| $ | (59 | ) |
Reinvested dividends | - | |
| (2 | ) |
| - | |
| (3 | ) |
| - | |
| (3 | ) | |||
Benefit payments | - | |
| 10 | |
| - | |
| 9 | |
| - | |
| 11 | | |||
Balance at end of year | (1 | ) |
| $ | (37 | ) |
| (1 | ) |
| $ | (45 | ) |
| (1 | ) |
| $ | (51 | ) |
106
UNITED PARCEL SERVICE, INC. AND SUBSIDIARIES
NOTES TO CONSOLIDATED FINANCIAL STATEMENTS
Noncontrolling Interests
We have noncontrolling interests in certain consolidated subsidiaries in our International Package and Supply Chain & Freight segments. Noncontrolling interests increased $ 6 and $ 3 million for the years ended December 31, 2017 and 2016 , respectively.
NOTE 11. STOCK-BASED COMPENSATION
The UPS Incentive Compensation Plan permits the grant of non-qualified and incentive stock options, stock appreciation rights, restricted stock and stock units, and restricted performance shares and units to eligible employees. The number of shares reserved for issuance under the Incentive Compensation Plan is 27 million. Each share issued pursuant to restricted stock units and restricted performance units (collectively referred to as "Restricted Units"), stock options and other permitted awards will reduce the share reserve by one share. We had 12 million shares available to be issued under the Incentive Compensation Plan as of December 31, 2017 .
The primary compensation programs offered under the UPS Incentive Compensation Plan include the UPS Management Incentive Award program, the Coyote Restricted Stock Award, the UPS Long-Term Incentive Performance Award program and the UPS Stock Option program. These awards are discussed in the following paragraphs. The total expense recognized in our income statement under all stock compensation award programs was $584 , $591 and $ 574 million during 2017 , 2016 and 2015 , respectively. The associated income tax benefit recognized in our income statement was $ 227 , $ 219 and $ 215 million during 2017 , 2016 and 2015 , respectively. The cash income tax benefit received from the exercise of stock options and the lapsing of Restricted Units was $ 276 , $ 207 and $ 252 million during 2017 , 2016 and 2015 , respectively.
Management Incentive Award Program ("MIP")
Non-executive management earning the right to receive the Management Incentive Award are determined annually by the Salary Committee, which is comprised of executive officers of UPS. Awards granted to executive officers are determined annually by the Compensation Committee of the UPS Board of Directors. Our Management Incentive Award program provides, with certain exceptions, that one-half to two-thirds of the annual Management Incentive Award will be made in Restricted Units (depending upon the level of management involved). The other one-third to one-half of the award is electable in the form of cash or unrestricted shares of class A common stock, and is fully vested at the time of grant.
Upon vesting, Restricted Units result in the issuance of the equivalent number of UPS class A common shares after required tax withholdings. Except in the case of death, Restricted Units granted for our Management Incentive Award vest over a five -year period with approximately 20% of the award vesting at each anniversary date of the grant. The entire grant (less estimated forfeitures) is expensed on a straight-line basis over the requisite service period (except in the case of death, disability or retirement, in which case immediate expensing occurs). All Restricted Units granted are subject to earlier cancellation or vesting under certain conditions. Dividends earned on Restricted Units are reinvested in additional Restricted Units at each dividend payable date.
Coyote Restricted Stock Award
In August 2015 we acquired Coyote, a U.S.-based truckload freight brokerage company. During the third quarter of 2015, we granted Restricted Units to certain eligible Coyote management employees. The vesting of Restricted Units granted under this award will vary between one and four years with an equal number of restricted units vesting at each anniversary date (except in the case of death, in which case immediate vesting occurs). The entire grant is expensed on a straight-line basis over the requisite service period (except in the case of death, disability or retirement, in which case immediate expensing occurs).
Long-Term Incentive Performance Award granted prior to 2014
We award Restricted Units in conjunction with our Long-Term Incentive Performance Award program to certain eligible employees. The Restricted Units ultimately granted under the Long-Term Incentive Performance Award program were based upon the achievement of certain performance measures, including growth in consolidated revenue and operating return on invested capital during the performance award cycle, and other measures, including the achievement of an adjusted earnings per share target over the entire three-year performance award cycle. The last award granted under this program fully vested in the first quarter of 2016.
107
UNITED PARCEL SERVICE, INC. AND SUBSIDIARIES
NOTES TO CONSOLIDATED FINANCIAL STATEMENTS
As of December 31, 2017 , we had the following Restricted Units outstanding, including reinvested dividends, that were granted under our Management Incentive Award program and the Coyote Restricted Stock Award:
| Shares (in thousands) |
| Weighted-Average Grant Date Fair Value |
| Weighted-Average Remaining Contractual Term (in years) |
| Aggregate Intrinsic Value (in millions) | |||||
Nonvested at January 1, 2017 | 11,475 | |
| $ | 94.32 | |
|
|
|
| ||
Vested | (5,100 | ) |
| 90.71 | |
|
|
|
| |||
Granted | 3,927 | |
| 105.62 | |
|
|
|
| |||
Reinvested Dividends | 332 | |
| N/A | |
|
|
|
| |||
Forfeited / Expired | (163 | ) |
| 99.70 | |
|
|
|
| |||
Nonvested at December 31, 2017 | 10,471 | |
| $ | 99.16 | |
| 1.38 |
| $ | 1,248 | |
Restricted Units Expected to Vest | 10,325 | |
| $ | 99.20 | |
| 1.38 |
| $ | 1,230 | |
The fair value of each Restricted Unit is the NYSE closing price of class B common stock on the date of grant. The weighted-average grant date fair value of Restricted Units granted during 2017 , 2016 and 2015 was $ 105.62 , $ 97.04 and $ 100.63 , respectively. The total fair value of Restricted Units vested was $ 534 , $ 445 and $ 564 million in 2017 , 2016 and 2015 , respectively. As of December 31, 2017 , there was $ 475 million of total unrecognized compensation cost related to nonvested Restricted Units. That cost is expected to be recognized over a weighted-average period of three years and one month.
Long-Term Incentive Performance Award Program granted after 2013
We award Restricted Units in conjunction with our Long-Term Incentive Performance Award program to certain eligible employees. Beginning with the Long-Term Incentive Performance grant in 2014, the performance targets are equally-weighted among consolidated operating return on invested capital, growth in currency-constant consolidated revenue and total shareowner return relative ("RTSR") to a peer group of companies. The Restricted Units granted under this award vest at the end of a three -year period (except in the case of death, in which case immediate vesting occurs on a prorated basis. In the case of disability and retirement, vesting occurs at the end of the three-year period on a prorated basis). The number of Restricted Units earned will be based on the percentage achievement of the performance targets set forth on the grant date. The range of percentage achievement can vary from 0% to 200% of the target award.
For the two-thirds of the award related to consolidated operating return on invested capital and growth in currency-constant consolidated revenue, we recognize the grant date fair value of these units (less estimated forfeitures) as compensation expense ratably over the vesting period, based on the number of awards expected to be earned. The remaining one-third of the award related to RTSR is valued using a Monte Carlo model. This portion of the award is recognized as compensation expense (less estimated forfeitures) ratably over the vesting period.
The weighted-average assumptions used, by year, and the calculated weighted-average fair values of the RTSR portion of the grants, are as follows:
| 2017 |
| 2016 |
| 2015 | ||||||
Risk-free interest rate | 1.46 | % |
| 1.00 | % |
| 0.89 | % | |||
Expected volatility | 16.59 | % |
| 16.46 | % |
| 15.53 | % | |||
Weighted-average fair value of units granted | $ | 119.29 | |
| $ | 136.18 | |
| $ | 63.64 | |
Share payout | 113.55 | % |
| 129.08 | % |
| 65.86 | % | |||
There is no expected dividend yield as units earn dividend equivalents.
108
UNITED PARCEL SERVICE, INC. AND SUBSIDIARIES
NOTES TO CONSOLIDATED FINANCIAL STATEMENTS
As of December 31, 2017 , we had the following Restricted Units outstanding, including reinvested dividends, that were granted under our Long-Term Incentive Performance Award program:
| Shares (in thousands) |
| Weighted-Average Grant Date Fair Value |
| Weighted-Average Remaining Contractual Term (in years) |
| Aggregate Intrinsic Value (in millions) | |||||
Nonvested at January 1, 2017 | 1,683 | |
| $ | 101.36 | |
|
|
|
| ||
Vested | (839 | ) |
| 97.11 | |
|
|
|
| |||
Granted | 958 | |
| 105.65 | |
|
|
|
| |||
Reinvested Dividends | 73 | |
| N/A | |
|
|
|
| |||
Forfeited / Expired | (88 | ) |
| 103.87 | |
|
|
|
| |||
Nonvested at December 31, 2017 | 1,787 | |
| $ | 105.58 | |
| 1.53 |
| $ | 213 | |
Performance Units Expected to Vest | 1,699 | |
| $ | 105.72 | |
| 1.54 |
| $ | 202 | |
The fair value of each Restricted Unit is the NYSE closing price of class B common stock on the date of grant. The weighted-average grant date fair value of Restricted Units granted during 2017 , 2016 and 2015 was $105.65 , $105.50 and $ 96.64 , respectively. The total fair value of Restricted Units vested was $ 71 , $ 13 and $ 5 million in 2017 , 2016 and 2015 , respectively. As of December 31, 2017 , there was $ 100 million of total unrecognized compensation cost related to nonvested Restricted Units. That cost is expected to be recognized over a weighted-average period of one year and nine months.
Non-qualified Stock Options
We maintain fixed stock option plans, under which options are granted to purchase shares of UPS class A common stock. Stock options granted in connection with the UPS Incentive Compensation Plan must have an exercise price at least equal to the NYSE closing price of UPS class B common stock on the date the option is granted.
Executive officers and certain senior managers receive a non-qualified stock option grant annually, in which the value granted is determined as a percentage of salary. Options granted generally vest over a five -year period with approximately 20% of the award vesting at each anniversary date of the grant. All options granted are subject to earlier cancellation or vesting under certain conditions. The options granted will expire ten years after the date of the grant. Option holders may exercise their options via the tender of cash or class A common stock and new class A shares are issued upon exercise.
| Shares (in thousands) |
| Weighted-Average Exercise Price |
| Weighted-Average Remaining Contractual Term (in years) |
| Aggregate Intrinsic Value (in millions) | |||||
Outstanding at January 1, 2017 | 1,828 | |
| $ | 80.45 | |
|
|
|
| ||
Exercised | (802 | ) |
| 71.57 | |
|
|
|
| |||
Granted | 272 | |
| 106.87 | |
|
|
|
| |||
Forfeited / Expired | (7 | ) |
| 70.90 | |
|
|
|
| |||
Outstanding at December 31, 2017 | 1,291 | |
| $ | 91.58 | |
| 6.30 |
| $ | 36 | |
Options Vested and Expected to Vest | 1,291 | |
| $ | 91.58 | |
| 6.30 |
| $ | 36 | |
Exercisable at December 31, 2017 | 757 | |
| $ | 83.28 | |
| 4.80 |
| $ | 27 | |
The fair value of each option grant is estimated using the Black-Scholes option pricing model. The weighted-average assumptions used, by year, and the calculated weighted-average fair values of options, are as follows:
| 2017 |
| 2016 |
| 2015 | ||||||
Expected dividend yield | 2.89 | % |
| 2.95 | % |
| 2.63 | % | |||
Risk-free interest rate | 2.15 | % |
| 1.62 | % |
| 2.07 | % | |||
Expected life in years | 7.5 | |
| 7.5 | |
| 7.5 | | |||
Expected volatility | 17.81 | % |
| 22.40 | % |
| 20.61 | % | |||
Weighted-average fair value of options granted | $ | 14.70 | |
| $ | 16.46 | |
| $ | 18.07 | |
109
UNITED PARCEL SERVICE, INC. AND SUBSIDIARIES
NOTES TO CONSOLIDATED FINANCIAL STATEMENTS
Expected volatilities are based on the historical returns on our stock and the implied volatility of our publicly-traded options. The expected dividend yield is based on the recent historical dividend yields for our stock, taking into account changes in dividend policy. The risk-free interest rate is based on the term structure of interest rates at the time of the option grant. The expected life represents an estimate of the period of time options are expected to remain outstanding, and we have relied upon a combination of the observed exercise behavior of our prior grants with similar characteristics, the vesting schedule of the grants and an index of peer companies with similar grant characteristics in estimating this variable.
We received cash of $ 41 , $ 72 and $ 56 million during 2017 , 2016 and 2015 , respectively, from option holders resulting from the exercise of stock options. The total intrinsic value of options exercised during 2017 , 2016 and 2015 was $22 , $24 and $31 million, respectively. As of December 31, 2017 , there was $ 1 million of total unrecognized compensation cost related to nonvested options. That cost is expected to be recognized over a weighted-average period of three years and six months.
The following table summarizes information about stock options outstanding and exercisable at December 31, 2017 :
| Options Outstanding |
| Options Exercisable | ||||||||||||
Exercise Price Range | Shares (in thousands) |
| Weighted-Average Remaining Contractual Term (in years) |
| Weighted-Average Exercise Price |
| Shares (in thousands) |
| Weighted-Average Exercise Price | ||||||
$55.01 - $70.00 | 131 | |
| 1.89 |
| $ | 61.97 | |
| 131 | |
| $ | 61.97 | |
$70.01 - $80.00 | 223 | |
| 3.30 |
| 75.12 | |
| 223 | |
| 75.12 | | ||
$80.01 - $90.00 | 141 | |
| 5.17 |
| 82.88 | |
| 127 | |
| 82.87 | | ||
$90.01 - $110.00 | 796 | |
| 8.07 |
| 102.59 | |
| 276 | |
| 100.11 | | ||
| 1,291 | |
| 6.30 |
| $ | 91.58 | |
| 757 | |
| $ | 83.28 | |
Discounted Employee Stock Purchase Plan
We maintain an employee stock purchase plan for all eligible employees. Under this plan, shares of UPS class A common stock may be purchased at quarterly intervals at 95% of the NYSE closing price of UPS class B common stock on the last day of each quarterly period. Employees purchased 0.9 , 0.9 and 0.9 million shares at average prices of $108.98 , $99.27 and $95.41 per share during 2017 , 2016 and 2015 , respectively. This plan is not considered to be compensatory, and therefore no compensation cost is measured for the employees' purchase rights.
110
UNITED PARCEL SERVICE, INC. AND SUBSIDIARIES
NOTES TO CONSOLIDATED FINANCIAL STATEMENTS
NOTE 12. SEGMENT AND GEOGRAPHIC INFORMATION
We report our operations in three segments: U.S. Domestic Package operations, International Package operations and Supply Chain & Freight operations. Package operations represent our most significant business and are broken down into regional operations around the world. Regional operations managers are responsible for both domestic and export products within their geographic area.
U.S. Domestic Package
Domestic Package operations include the time-definite delivery of letters, documents and packages throughout the United States.
International Package
International Package operations include delivery to more than 220 countries and territories worldwide, including shipments wholly outside the United States, as well as shipments with either origin or destination outside the United States. Our International Package reporting segment includes the operations of our Europe, Asia, Americas and ISMEA operating segments.
Supply Chain & Freight
Supply Chain & Freight includes our Forwarding, Logistics, Coyote, Marken, UPS Mail Innovations, UPS Freight and other aggregated business units. Our Forwarding, Logistics and UPS Mail Innovations units provide services in more than 200 countries and territories worldwide and include international air and ocean freight forwarding, customs brokerage, distribution and post-sales services, mail and consulting services. UPS Freight offers a variety of LTL and TL services to customers in North America. Coyote offers truckload brokerage services primarily in the United States. Marken is a global provider of supply chain solutions to the life sciences industry. Other aggregated business units within this segment include The UPS Store and UPS Capital.
In evaluating financial performance, we focus on operating profit as a segment's measure of profit or loss. Operating profit is before investment income and other, interest expense and income taxes. The accounting policies of the segments are the same as those described in the "Items Affecting Comparability" section of Management's Discussion and Analysis, with certain expenses allocated between the segments using activity-based costing methods. Unallocated assets are comprised primarily of cash, marketable securities and certain investment partnerships.
111
UNITED PARCEL SERVICE, INC. AND SUBSIDIARIES
NOTES TO CONSOLIDATED FINANCIAL STATEMENTS
| 2017 |
| 2016 |
| 2015 | ||||||
Revenue: |
|
|
|
|
| ||||||
U.S. Domestic Package | $ | 40,764 | |
| $ | 38,301 | |
| $ | 36,747 | |
International Package | 13,338 | |
| 12,350 | |
| 12,149 | | |||
Supply Chain & Freight | 11,770 | |
| 10,255 | |
| 9,467 | | |||
Consolidated | $ | 65,872 | |
| $ | 60,906 | |
| $ | 58,363 | |
Operating Profit: |
|
|
|
|
| ||||||
U.S. Domestic Package | $ | 4,280 | |
| $ | 3,017 | |
| $ | 4,767 | |
International Package | 2,464 | |
| 2,044 | |
| 2,137 | | |||
Supply Chain & Freight | 785 | |
| 406 | |
| 764 | | |||
Consolidated | $ | 7,529 | |
| $ | 5,467 | |
| $ | 7,668 | |
Assets: |
|
|
|
|
| ||||||
U.S. Domestic Package | $ | 27,121 | |
| $ | 23,191 | |
| $ | 21,701 | |
International Package | 8,544 | |
| 8,193 | |
| 7,858 | | |||
Supply Chain & Freight | 8,241 | |
| 7,806 | |
| 7,728 | | |||
Unallocated | 1,497 | |
| 1,187 | |
| 1,024 | | |||
Consolidated | $ | 45,403 | |
| $ | 40,377 | |
| $ | 38,311 | |
Depreciation and Amortization Expense: |
|
|
|
|
| ||||||
U.S. Domestic Package | $ | 1,479 | |
| $ | 1,479 | |
| $ | 1,408 | |
International Package | 509 | |
| 491 | |
| 475 | | |||
Supply Chain & Freight | 294 | |
| 254 | |
| 201 | | |||
Consolidated | $ | 2,282 | |
| $ | 2,224 | |
| $ | 2,084 | |
Revenue by product type for the years ended December 31, 2017 , 2016 and 2015 is as follows (in millions):
| 2017 |
| 2016 |
| 2015 | ||||||
U.S. Domestic Package: |
|
|
|
|
| ||||||
Next Day Air | $ | 7,088 | |
| $ | 6,752 | |
| $ | 6,570 | |
Deferred | 4,421 | |
| 4,082 | |
| 3,903 | | |||
Ground | 29,255 | |
| 27,467 | |
| 26,274 | | |||
Total U.S. Domestic Package | 40,764 | |
| 38,301 | |
| 36,747 | | |||
International Package: |
|
|
|
|
| ||||||
Domestic | 2,645 | |
| 2,441 | |
| 2,425 | | |||
Export | 10,167 | |
| 9,374 | |
| 9,092 | | |||
Cargo | 526 | |
| 535 | |
| 632 | | |||
Total International Package | 13,338 | |
| 12,350 | |
| 12,149 | | |||
Supply Chain & Freight: |
|
|
|
|
| ||||||
Forwarding and Logistics | 7,981 | |
| 6,793 | |
| 5,900 | | |||
Freight | 2,998 | |
| 2,736 | |
| 2,881 | | |||
Other | 791 | |
| 726 | |
| 686 | | |||
Total Supply Chain & Freight | 11,770 | |
| 10,255 | |
| 9,467 | | |||
Consolidated | $ | 65,872 | |
| $ | 60,906 | |
| $ | 58,363 | |
112
UNITED PARCEL SERVICE, INC. AND SUBSIDIARIES
NOTES TO CONSOLIDATED FINANCIAL STATEMENTS
Geographic information for the years ended December 31, 2017 , 2016 and 2015 is as follows (in millions):
| 2017 |
| 2016 |
| 2015 | ||||||
United States: |
|
|
|
|
| ||||||
Revenue | $ | 51,936 | |
| $ | 48,013 | |
| $ | 45,309 | |
Long-lived assets | $ | 22,638 | |
| $ | 19,253 | |
| $ | 18,196 | |
International: |
|
|
|
|
| ||||||
Revenue | $ | 13,936 | |
| $ | 12,893 | |
| $ | 13,054 | |
Long-lived assets | $ | 6,382 | |
| $ | 5,898 | |
| $ | 5,828 | |
Consolidated: |
|
|
|
|
| ||||||
Revenue | $ | 65,872 | |
| $ | 60,906 | |
| $ | 58,363 | |
Long-lived assets | $ | 29,020 | |
| $ | 25,151 | |
| $ | 24,024 | |
Long-lived assets include property, plant and equipment, pension and postretirement benefit assets, long-term investments, goodwill and intangible assets.
No countries outside of the United States, nor any individual customers, provided 10% or more of consolidated revenue for the years ended December 31, 2017 , 2016 or 2015 .
113
UNITED PARCEL SERVICE, INC. AND SUBSIDIARIES
NOTES TO CONSOLIDATED FINANCIAL STATEMENTS
NOTE 13. INCOME TAXES
The income tax expense (benefit) for the years ended December 31, 2017 , 2016 and 2015 consists of the following (in millions):
| 2017 |
| 2016 |
| 2015 | ||||||
Current: |
|
|
|
|
| ||||||
U.S. Federal | $ | 671 | |
| $ | 1,338 | |
| $ | 1,634 | |
U.S. State and Local | 49 | |
| 67 | |
| 88 | | |||
Non-U.S. | 288 | |
| 177 | |
| 236 | | |||
Total Current | 1,008 | |
| 1,582 | |
| 1,958 | | |||
Deferred: |
|
|
|
|
| ||||||
U.S. Federal | 1,121 | |
| 103 | |
| 469 | | |||
U.S. State and Local | 118 | |
| 31 | |
| 65 | | |||
Non-U.S. | (9 | ) |
| (11 | ) |
| 6 | | |||
Total Deferred | 1,230 | |
| 123 | |
| 540 | | |||
Total Income Tax Expense | $ | 2,238 | |
| $ | 1,705 | |
| $ | 2,498 | |
Income before income taxes includes the following components (in millions):
| 2017 |
| 2016 |
| 2015 | ||||||
United States | $ | 5,998 | |
| $ | 4,322 | |
| $ | 6,348 | |
Non-U.S. | 1,150 | |
| 814 | |
| 994 | | |||
Total Income Before Income Taxes: | $ | 7,148 | |
| $ | 5,136 | |
| $ | 7,342 | |
A reconciliation of the statutory federal income tax rate to the effective income tax rate for the years ended December 31, 2017 , 2016 and 2015 consists of the following:
| 2017 |
| 2016 |
| 2015 | |||
Statutory U.S. federal income tax rate | 35.0 | % |
| 35.0 | % |
| 35.0 | % |
U.S. state and local income taxes (net of federal benefit) | 1.5 | |
| 1.5 | |
| 1.7 | |
Non-U.S. tax rate differential | (2.0 | ) |
| (2.4 | ) |
| (1.2 | ) |
Nondeductible/nontaxable items | (0.1 | ) |
| 0.8 | |
| 0.2 | |
U.S. federal tax credits | (1.8 | ) |
| (1.2 | ) |
| (1.3 | ) |
Income tax benefit from the Tax Cuts and Jobs Act and other non-U.S. tax law changes | (3.6 | ) |
| - | |
| - | |
Defined benefit plans mark-to-market charge tax rate differential (1) | 1.5 | |
| - | |
| - | |
Other | 0.8 | |
| (0.5 | ) |
| (0.4 | ) |
Effective income tax rate | 31.3 | % |
| 33.2 | % |
| 34.0 | % |
(1) Impact of applying Tax Act corporate rate enacted of 21% versus 35%
Our effective tax rate is affected by recurring factors, such as statutory tax rates in the jurisdictions we operate in and the relative amounts of taxable income we earn in those jurisdictions. It is also affected by discrete items that may occur in any given year, but may not be consistent from year to year.
Our effective tax rate decreased to 31.3% in 2017 , compared with 33.2% in 2016 and 34.0% in 2015, primarily due to the effects of the aforementioned recurring factors and the following discrete tax items:
114
UNITED PARCEL SERVICE, INC. AND SUBSIDIARIES
NOTES TO CONSOLIDATED FINANCIAL STATEMENTS
Tax Cuts and Jobs Act
On December 22, 2017, the United States enacted into law the Tax Act. The Tax Act makes broad and complex changes to the U.S. tax code, including a permanent corporate rate reduction to 21% and a transition to a territorial international system effective in 2018. The Tax Act also includes provisions that affect 2017, including: (1) requiring a one-time transition tax on certain unrepatriated earnings of foreign subsidiaries ("Transition Tax") that is payable over eight years; (2) requiring a remeasurement of all U.S. deferred tax assets and liabilities to the newly enacted corporate tax rate of 21% ; and (3) providing for additional first-year depreciation that allows full expensing of qualified property placed into service after September 27, 2017.
In late December 2017, the SEC staff issued SAB 118, which provides guidance on accounting for the tax effects of the Tax Act. SAB 118 provides a measurement period that should not extend beyond one year from the Tax Act enactment date for companies to complete the related accounting under U.S. GAAP. If a company's accounting for certain income tax effects of the Tax Act is incomplete, but it is able to determine a reasonable estimate, it must record a provisional estimate in the financial statements. Accordingly, we have recorded provisional estimates related to our Transition Tax liability, our change in indefinite reinvestment assertion for certain foreign subsidiaries and the remeasurement of our U.S. net deferred tax liabilities.
To calculate the amount of the Transition Tax, we must determine, in addition to other factors, the amount of post-1986 earnings and profits ("E&P") of the foreign subsidiaries as well as the amount of non-U.S. income taxes paid on such earnings. We are able to make a reasonable estimate of the Transition Tax and recorded a provisional liability of $ 310 million; however, there are certain factors that could impact our provisional estimate.
First, several of our foreign subsidiaries have a fiscal year-end, and E&P for these subsidiaries cannot be precisely calculated until their fiscal years conclude during 2018. Second, we continue to gather additional information needed to precisely estimate the impact of the Transition Tax on our U.S. state and local tax liabilities given the complexity of the relevant state laws. Finally, we expect additional regulatory guidance and technical clarifications from the U.S. Department of the Treasury and Internal Revenue Service within the next 12 months that could change our provisional estimate of the Transition Tax.
Undistributed E&P of our foreign subsidiaries amounted to $5.002 billion at December 31, 2017. As the U.S. has moved to a territorial system, we have changed our indefinite reinvestment assertion with respect to the earnings of certain foreign subsidiaries. As a result, we have recorded a provisional deferred tax liability and corresponding increase to deferred tax expense of $24 million. There are certain factors, discussed above with regard to the Transition Tax, which could also impact our provisional estimate for the change in indefinite reinvestment assertion. For all other foreign subsidiaries, we continue to assert that these earnings are indefinitely reinvested. $1.335 billion of the undistributed E&P of our foreign subsidiaries is considered to be indefinitely reinvested and, accordingly, no deferred income taxes have been provided thereon. Upon distribution of those earnings in the form of dividends or otherwise, we would be subject to U.S. state and local taxes and withholding taxes payable in various jurisdictions. Determination of the amount of unrecognized deferred income tax liability is not practicable because of the complexities associated with its hypothetical calculation. We will continue to evaluate our indefinite reinvestment assertion for all foreign subsidiaries in light of the Tax Act, and our provisional estimate is subject to change.
For our net U.S. deferred tax liabilities, we have recorded a provisional decrease of $ 606 million with a corresponding reduction to deferred tax expense of $ 606 million for the year ended December 31, 2017. While we are able to make a reasonable estimate of the impact of the reduction in corporate rate, it may be affected by other analyses related to the Tax Act, including, but not limited to, completing the analysis of our 2017 capital expenditures that qualify for full expensing and the state tax effect of adjustments made to federal temporary differences.
Other 2017 Discrete Items
In the fourth quarter of 2017, we recognized an income tax benefit of $ 193 million related to pre-tax mark-to-market losses of $ 800 million on our pension and postretirement defined benefit plans.This income tax benefit was generated at a lower average statutory tax rate than the 2017 U.S. federal statutory tax rate due to future tax rate changes enacted by the Tax Act and differences between U.S. and foreign statutory rates, which was partially offset by the effect of U.S. state and local taxes.
In the fourth quarter of 2017, tax law changes were enacted in certain non-U.S. jurisdictions in which we operate. As a result, we have recorded a decrease to our foreign net deferred tax assets of $ 14 million with a corresponding net increase to deferred tax expense of $ 14 million for the year ended December 31, 2017.
115
UNITED PARCEL SERVICE, INC. AND SUBSIDIARIES
NOTES TO CONSOLIDATED FINANCIAL STATEMENTS
In the first quarter of 2017, we adopted a new accounting standard that requires the recognition of excess tax benefits related to share-based compensation in income tax expense, which resulted in tax benefits for the year ended December 31, 2017 of $71 million and reduced our effective tax rate by 1.0% .
2016 Discrete Items
In the fourth quarter of 2016, we recognized an income tax benefit of $978 million related to pre-tax mark-to-market losses of $2.651 billion on our pension and postretirement defined benefit plans. This income tax benefit was generated at a higher average statutory tax rate than the U.S. federal statutory tax rate because it included the effect of U.S. state and local taxes.
2015 Discrete Items
During the third quarter of 2015 and after the filing of our annual federal tax returns, we reconciled our deferred tax balances and identified adjustments to be made with respect to prior years' deferred tax balances. The adjustments resulted in a reduction of income tax expense of $ 66 million.
In connection with our acquisition of Coyote Logistics in 2015, we distributed $ 500 million of cash held by a Canadian subsidiary to its U.S. parent during the fourth quarter of 2015. As a result of the distribution, we recorded additional net income tax expense of $ 28 million.
In the fourth quarter of 2015, we recognized an income tax benefit of $ 39 million related to pre-tax mark-to-market losses of $ 118 million on our pension and postretirement defined benefit plans. This income tax benefit was generated at a lower average statutory tax rate than our U.S. federal statutory tax rate because it was due, in part, to non-U.S. benefit plans.
Other favorable rate impacting items in 2015 include: resolution of several U.S. state and local tax matters; the extension of favorable U.S. federal tax provisions associated with the Protecting Americans from Tax Hikes Act of 2015 related to research and development tax credits and work opportunity tax credits; and the execution of two bilateral advance pricing agreements. These agreements established intercompany transfer pricing arrangements between the U.S. and certain non-U.S. jurisdictions related to our small package operations for tax years 2010 through 2019.
Other Items
Beginning in 2012, we were granted a tax incentive for certain of our non-U.S. operations, which is effective through December 31, 2021. The tax incentive is conditional upon our meeting specific employment and investment thresholds. The impact of this tax incentive decreased non-U.S. tax expense by $ 24 million ($ 0.03 per share), $ 21 million ($ 0.02 per share) and $ 25 million ($ 0.03 per share) for 2017 , 2016 , and 2015 , respectively.
116
UNITED PARCEL SERVICE, INC. AND SUBSIDIARIES
NOTES TO CONSOLIDATED FINANCIAL STATEMENTS
Deferred income tax assets and liabilities are comprised of the following at December 31, 2017 and 2016 (in millions):
| 2017 |
| 2016 | ||||
Fixed assets and capitalized software | $ | (3,288 | ) |
| $ | (4,782 | ) |
Other | (535 | ) |
| (756 | ) | ||
Deferred tax liabilities | (3,823 | ) |
| (5,538 | ) | ||
|
|
|
| ||||
Pension and postretirement benefits | 1,877 | |
| 4,236 | | ||
Loss and credit carryforwards | 323 | |
| 229 | | ||
Insurance reserves | 449 | |
| 733 | | ||
Stock compensation | 182 | |
| 297 | | ||
Other | 626 | |
| 681 | | ||
Deferred tax assets | 3,457 | |
| 6,176 | | ||
Deferred tax assets valuation allowance | (126 | ) |
| (159 | ) | ||
Deferred tax asset (net of valuation allowance) | 3,331 | |
| 6,017 | | ||
|
|
|
| ||||
Net deferred tax asset (liability) | $ | (492 | ) |
| $ | 479 | |
|
|
|
| ||||
Amounts recognized in the consolidated balance sheets: |
|
|
| ||||
Deferred tax assets | $ | 265 | |
| $ | 591 | |
Deferred tax liabilities | (757 | ) |
| (112 | ) | ||
Net deferred tax asset (liability) | $ | (492 | ) |
| $ | 479 | |
The valuation allowance changed by $ (33) , $ (38) and $ (11) million during the years ended December 31, 2017 , 2016 and 2015 , respectively.
We have a U.S. federal capital loss carryforward of $ 34 million as of December 31, 2017, $ 32 million of which expires on December 31, 2021 and the remainder of which expires on December 31, 2022. In addition, we have U.S. state and local operating loss and credit carryforwards as follows (in millions):
| 2017 |
| 2016 | ||||
U.S. state and local operating loss carryforwards | $ | 1,215 | |
| $ | 603 | |
U.S. state and local credit carryforwards | $ | 83 | |
| $ | 70 | |
The U.S. state and local operating loss carryforwards expire at varying dates through 2037 . The U.S. state and local credits can be carried forward for periods ranging from one year to indefinitely. We also have non-U.S. loss carryforwards of $ 728 million as of December 31, 2017 , the majority of which may be carried forward indefinitely . As indicated in the table above, we have established a valuation allowance for certain non-U.S. and state carryforwards, due to the uncertainty resulting from a lack of previous taxable income within the applicable tax jurisdictions.
117
UNITED PARCEL SERVICE, INC. AND SUBSIDIARIES
NOTES TO CONSOLIDATED FINANCIAL STATEMENTS
The following table summarizes the activity related to our unrecognized tax benefits (in millions):
| Tax |
| Interest |
| Penalties | ||||||
Balance at January 1, 2015 | $ | 172 | |
| $ | 42 | |
| $ | 3 | |
Additions for tax positions of the current year | 24 | |
| - | |
| - | | |||
Additions for tax positions of prior years | 45 | |
| 21 | |
| 3 | | |||
Reductions for tax positions of prior years for: |
|
|
|
|
| ||||||
Changes based on facts and circumstances | (85 | ) |
| (8 | ) |
| - | | |||
Settlements during the period | (6 | ) |
| (2 | ) |
| - | | |||
Lapses of applicable statute of limitations | (2 | ) |
| - | |
| - | | |||
Balance at December 31, 2015 | 148 | |
| 53 | |
| 6 | | |||
Additions for tax positions of the current year | 17 | |
| - | |
| - | | |||
Additions for tax positions of prior years | 20 | |
| 10 | |
| - | | |||
Reductions for tax positions of prior years for: |
|
|
|
|
| ||||||
Changes based on facts and circumstances | (41 | ) |
| (13 | ) |
| - | | |||
Settlements during the period | - | |
| - | |
| - | | |||
Lapses of applicable statute of limitations | - | |
| - | |
| - | | |||
Balance at December 31, 2016 | 144 | |
| 50 | |
| 6 | | |||
Additions for tax positions of the current year | 16 | |
| - | |
| - | | |||
Additions for tax positions of prior years | 33 | |
| 14 | |
| 3 | | |||
Reductions for tax positions of prior years for: |
|
|
|
|
| ||||||
Changes based on facts and circumstances | (24 | ) |
| (18 | ) |
| - | | |||
Settlements during the period | (6 | ) |
| (3 | ) |
| - | | |||
Lapses of applicable statute of limitations | (3 | ) |
| - | |
| - | | |||
Balance at December 31, 2017 | $ | 160 | |
| $ | 43 | |
| $ | 9 | |
The total amount of gross unrecognized tax benefits as of December 31, 2017 , 2016 and 2015 that, if recognized, would affect the effective tax rate were $ 159 , $ 142 and $ 147 million, respectively. Our continuing policy is to recognize interest and penalties associated with income tax matters as a component of income tax expense.
We file income tax returns in the U.S. federal jurisdiction, most U.S. state and local jurisdictions, and many non-U.S. jurisdictions. We have substantially resolved all U.S. federal income tax matters for tax years prior to 2014 .
A number of years may elapse before an uncertain tax position is audited and ultimately settled. It is difficult to predict the ultimate outcome or the timing of resolution for uncertain tax positions. It is reasonably possible that the amount of unrecognized tax benefits could significantly increase or decrease within the next twelve months. Items that may cause changes to unrecognized tax benefits include the timing of interest deductions and the allocation of income and expense between tax jurisdictions. These changes could result from the settlement of ongoing litigation, the completion of ongoing examinations, the expiration of the statute of limitations or other unforeseen circumstances. At this time, an estimate of the range of the reasonably possible change cannot be made.
118
UNITED PARCEL SERVICE, INC. AND SUBSIDIARIES
NOTES TO CONSOLIDATED FINANCIAL STATEMENTS
NOTE 14. EARNINGS PER SHARE
The earnings per share amounts are the same for class A and class B common shares as the holders of each class are legally entitled to equal per share distributions whether through dividends or in liquidation.
The following table sets forth the computation of basic and diluted earnings per share (in millions, except per share amounts):
| 2017 |
| 2016 |
| 2015 | ||||||
Numerator: |
|
|
|
|
| ||||||
Net income attributable to common shareowners | $ | 4,910 | |
| $ | 3,431 | |
| $ | 4,844 | |
Denominator: |
|
|
|
|
| ||||||
Weighted-average shares | 865 | |
| 878 | |
| 896 | | |||
Deferred compensation obligations | 1 | |
| 1 | |
| 1 | | |||
Vested portion of restricted shares | 5 | |
| 4 | |
| 4 | | |||
Denominator for basic earnings per share | 871 | |
| 883 | |
| 901 | | |||
Effect of Dilutive Securities: |
|
|
|
|
| ||||||
Restricted performance units | 3 | |
| 3 | |
| 4 | | |||
Stock options | 1 | |
| 1 | |
| 1 | | |||
Denominator for diluted earnings per share | 875 | |
| 887 | |
| 906 | | |||
Basic Earnings Per Share | $ | 5.64 | |
| $ | 3.89 | |
| $ | 5.38 | |
Diluted Earnings Per Share | $ | 5.61 | |
| $ | 3.87 | |
| $ | 5.35 | |
Diluted earnings per share for the years ended December 31, 2017 , 2016 and 2015 exclude the effect of 0.1 , 0.2 and 0.2 million shares, respectively, of common stock that may be issued upon the exercise of employee stock options because such effect would be antidilutive.
NOTE 15. DERIVATIVE INSTRUMENTS AND RISK MANAGEMENT
Risk Management Policies
We are exposed to market risk, primarily related to foreign exchange rates, commodity prices and interest rates. These exposures are actively monitored by management. To manage the volatility relating to certain of these exposures, we enter into a variety of derivative financial instruments. Our objective is to reduce, where it is deemed appropriate to do so, fluctuations in earnings and cash flows associated with changes in foreign currency rates, commodity prices and interest rates. It is our policy and practice to use derivative financial instruments only to the extent necessary to manage exposures. As we use price sensitive instruments to hedge a certain portion of our existing and anticipated transactions, we expect that any loss in value for those instruments generally would be offset by increases in the value of those hedged transactions. We do not hold or issue derivative financial instruments for trading or speculative purposes.
Credit Risk Management
The forward contracts, swaps and options discussed below contain an element of risk that the counterparties may be unable to meet the terms of the agreements. However, we minimize such risk exposures for these instruments by limiting the counterparties to banks and financial institutions that meet established credit guidelines and by monitoring counterparty credit risk to prevent concentrations of credit risk with any single counterparty.
We have agreements with all of our active counterparties (covering the majority of our derivative positions) containing early termination rights and/or zero threshold bilateral collateral provisions whereby cash is required based on the net fair value of derivatives associated with those counterparties. Events such as a counterparty credit rating downgrade (depending on the ultimate rating level) could also allow us to take additional protective measures such as the early termination of trades. At December 31, 2017 and 2016 , we held cash collateral of $ 17 and $ 575 million, respectively, under these agreements; this collateral is included in "cash and cash equivalents" on the consolidated balance sheets and its use by UPS is not restricted.
119
UNITED PARCEL SERVICE, INC. AND SUBSIDIARIES
NOTES TO CONSOLIDATED FINANCIAL STATEMENTS
In connection with the agreements described above, we could also be required to provide additional collateral or terminate transactions with certain counterparties in the event of a downgrade of our credit rating. The amount of collateral required would be determined by the net fair value of the associated derivatives with each counterparty. At December 31, 2017 and 2016 , $174 and $0 million, respectively, of additional collateral was required to be posted with our counterparties. In addition, the aggregate fair value of instruments not covered by the zero threshold bilateral collateral provisions that were in a net liability position was $ 16 million at December 31, 2017 .
We have not historically incurred, and do not expect to incur in the future, any losses as a result of counterparty default.
Accounting Policy for Derivative Instruments
We recognize all derivative instruments as assets or liabilities in the consolidated balance sheets at fair value. The accounting for changes in the fair value of a derivative instrument depends on whether it has been designated and qualifies as part of a hedging relationship and, further, on the type of hedging relationship. For those derivative instruments that are designated and qualify as hedging instruments, a company must designate the derivative, based upon the exposure being hedged, as a cash flow hedge, a fair value hedge or a hedge of a net investment in a foreign operation.
A cash flow hedge refers to hedging the exposure to variability in expected future cash flows that is attributable to a particular risk. For derivative instruments that are designated and qualify as a cash flow hedge, the effective portion of the gain or loss on the derivative instrument is reported as a component of AOCI, and reclassified into earnings in the same period during which the hedged transaction affects earnings. The remaining gain or loss on the derivative instrument in excess of the cumulative change in the present value of future cash flows of the hedged item, or hedge components excluded from the assessment of effectiveness, are recognized in the statements of consolidated income during the current period.
A fair value hedge refers to hedging the exposure to changes in the fair value of an existing asset or liability on the consolidated balance sheets that is attributable to a particular risk. For derivative instruments that are designated and qualify as a fair value hedge, the gain or loss on the derivative instrument is recognized in the statements of consolidated income during the current period, as well as the offsetting gain or loss on the hedged item.
A net investment hedge refers to the use of cross currency swaps, forward contracts or foreign currency denominated debt to hedge portions of our net investments in foreign operations. For hedges that meet the effectiveness requirements, the net gains or losses attributable to changes in spot exchange rates are recorded in the cumulative translation adjustment within AOCI. The remainder of the change in value of such instruments is recorded in earnings.
Types of Hedges
Commodity Risk Management
Currently, the fuel surcharges that we apply to our domestic, international package and LTL services are the primary means of reducing the risk of adverse fuel price changes on our business. In order to mitigate the impact of fuel surcharges imposed on us by outside carriers, we regularly adjust the rates we charge for our freight brokerage, inter-modal and truckload services. We periodically enter into option and future contracts on energy commodity products to manage the price risk associated with forecasted transactions involving refined fuels, principally jet-A, diesel and unleaded gasoline. The objective of the hedges is to reduce the variability of cash flows, due to changing fuel prices, associated with the forecasted transactions involving those products. We have designated and account for these contracts as cash flow hedges of the underlying forecasted transactions involving these fuel products and, therefore, the resulting gains and losses from these hedges are recognized as a component of fuel expense or revenue when the underlying transactions occur.
Foreign Currency Risk Management
To protect against the reduction in value of forecasted foreign currency cash flows from our international package business, we maintain a foreign currency cash flow hedging program. Our most significant foreign currency exposures relate to the Euro, British Pound Sterling, Canadian Dollar, Chinese Renminbi and Hong Kong Dollar . We hedge portions of our forecasted revenue denominated in foreign currencies with foreign currency option and forward contracts. We have designated and account for these contracts as cash flow hedges of anticipated foreign currency denominated revenue and, therefore, the resulting gains and losses from these hedges are recognized as a component of international package revenue when the underlying sales transactions occur.
120
UNITED PARCEL SERVICE, INC. AND SUBSIDIARIES
NOTES TO CONSOLIDATED FINANCIAL STATEMENTS
We also hedge portions of our anticipated cash settlements of intercompany transactions subject to foreign currency remeasurement using foreign currency forward contracts. We have designated and account for these contracts as cash flow hedges of forecasted foreign currency denominated transactions, and therefore the resulting gains and losses from these hedges are recognized as a component of investment income and other when the underlying transactions are subject to currency remeasurement.
We hedge our net investment in certain foreign operations with foreign currency denominated debt instruments. The use of foreign denominated debt as the hedging instrument allows the debt to be remeasured to cumulative translation adjustment within AOCI to offset the translation risk from those investments. Any ineffective portion of net investment hedges is recognized as a component of investment income and other. Balances in the cumulative translation adjustment account remain until the sale or liquidation of the foreign entity.
Interest Rate Risk Management
Our indebtedness under our various financing arrangements creates interest rate risk. We use a combination of derivative instruments as part of our program to manage the fixed and floating interest rate mix of our total debt portfolio and related overall cost of borrowing. The notional amount, interest payment date and maturity date of the swaps match the terms of the associated debt being hedged. Interest rate swaps allow us to maintain a target range of floating-rate debt within our capital structure.
We have designated and account for the majority of our interest rate swaps that convert fixed-rate interest payments into floating-rate interest payments as hedges of the fair value of the associated debt instruments. Therefore, the gains and losses resulting from fair value adjustments to the interest rate swaps and fair value adjustments to the associated debt instruments are recorded to interest expense in the period in which the gains and losses occur. We have designated and account for interest rate swaps that convert floating-rate interest payments into fixed-rate interest payments as cash flow hedges of the forecasted payment obligations. The gains and losses resulting from fair value adjustments to the interest rate swaps are recorded to AOCI.
We periodically hedge the forecasted fixed-coupon interest payments associated with anticipated debt offerings, using forward starting interest rate swaps, interest rate locks or similar derivatives. These agreements effectively lock a portion of our interest rate exposure between the time the agreement is entered into and the date when the debt offering is completed, thereby mitigating the impact of interest rate changes on future interest expense. These derivatives are settled commensurate with the issuance of the debt, and any gain or loss upon settlement is amortized as an adjustment to the effective interest yield on the debt.
Outstanding Positions
The notional amounts of our outstanding derivative positions were as follows as of December 31, 2017 and 2016 (in millions):
|
|
| 2017 |
| 2016 | ||
Currency Hedges: |
|
|
|
|
| ||
Euro | EUR |
| 4,942 | |
| 3,702 | |
British Pound Sterling | GBP |
| 1,736 | |
| 1,380 | |
Canadian Dollar | CAD |
| 1,259 | |
| 1,053 | |
Indian Rupee | INR |
| - | |
| 76 | |
Mexican Peso | MXN |
| 169 | |
| - | |
Japanese Yen | JPY |
| - | |
| 3,972 | |
Singapore Dollar | SGD |
| 11 | |
| 32 | |
|
|
|
|
|
| ||
Interest Rate Hedges: |
|
|
|
|
| ||
Fixed to Floating Interest Rate Swaps | USD |
| 5,424 | |
| 5,799 | |
Floating to Fixed Interest Rate Swaps | USD |
| 778 | |
| 778 | |
|
|
|
|
|
| ||
Investment Market Price Hedges: |
|
|
|
|
| ||
Marketable Securities | EUR |
| 64 | |
| 76 | |
As of December 31, 2017 , we had no outstanding commodity hedge positions.
121
UNITED PARCEL SERVICE, INC. AND SUBSIDIARIES
NOTES TO CONSOLIDATED FINANCIAL STATEMENTS
Balance Sheet Recognition
The following table indicates the location on the consolidated balance sheets in which our derivative assets and liabilities have been recognized, and the related fair values of those derivatives as of December 31, 2017 and 2016 (in millions). The table is segregated between those derivative instruments that qualify and are designated as hedging instruments and those that are not, as well as by type of contract and whether the derivative is in an asset or liability position.
We have master netting arrangements with substantially all of our counterparties giving us the right of offset for our derivative positions. However, we have not elected to offset the fair value positions of the derivative contracts recorded on our consolidated balance sheets. The columns labeled "net amounts if right of offset had been applied" indicate the potential net fair value positions by type of contract and location on the consolidated balance sheets had we elected to apply the right of offset.
|
|
| Gross Amounts Presented in |
| Net Amounts if Right of | ||||||||||||
Asset Derivatives | Balance Sheet Location |
| 2017 |
| 2016 |
| 2017 |
| 2016 | ||||||||
Derivatives Designated As Hedges: |
|
|
|
|
|
|
|
|
| ||||||||
Foreign exchange contracts | Other current assets |
| $ | 2 | |
| $ | 176 | |
| $ | - | |
| $ | 176 | |
Interest rate contracts | Other current assets |
| 1 | |
| - | |
| 1 | |
| - | | ||||
Foreign exchange contracts | Other non-current assets |
| 1 | |
| 131 | |
| - | |
| 126 | | ||||
Interest rate contracts | Other non-current assets |
| 59 | |
| 137 | |
| 43 | |
| 119 | | ||||
Derivatives Not Designated As Hedges: |
|
|
|
|
|
|
|
|
| ||||||||
Foreign exchange contracts | Other current assets |
| 18 | |
| 1 | |
| 17 | |
| 1 | | ||||
Interest rate contracts | Other non-current assets |
| 26 | |
| 42 | |
| 26 | |
| 40 | | ||||
Total Asset Derivatives |
|
| $ | 107 | |
| $ | 487 | |
| $ | 87 | |
| $ | 462 | |
|
|
| Gross Amounts Presented in Consolidated Balance Sheets |
| Net Amounts if Right of Offset had been Applied | ||||||||||||
Liability Derivatives | Balance Sheet Location |
| 2017 |
| 2016 |
| 2017 |
| 2016 | ||||||||
Derivatives Designated As Hedges: |
|
|
|
|
|
|
|
|
| ||||||||
Foreign exchange contracts | Other current liabilities |
| $ | 93 | |
| $ | - | |
| $ | 91 | |
| $ | - | |
Interest rate contracts | Other current liabilities |
| - | |
| 1 | |
| - | |
| 1 | | ||||
Foreign exchange contracts | Other non-current liabilities |
| 194 | |
| 6 | |
| 193 | |
| 1 | | ||||
Interest rate contracts | Other non-current liabilities |
| 28 | |
| 21 | |
| 12 | |
| 3 | | ||||
Derivatives Not Designated As Hedges: |
|
|
|
|
|
|
|
|
| ||||||||
Foreign exchange contracts | Other current liabilities |
| 1 | |
| - | |
| - | |
| - | | ||||
Investment market price contracts | Other current liabilities |
| 16 | |
| 10 | |
| 16 | |
| 10 | | ||||
Interest rate contracts | Other non-current liabilities |
| - | |
| 7 | |
| | |
| 5 | | ||||
Total Liability Derivatives |
|
| $ | 332 | |
| $ | 45 | |
| $ | 312 | |
| $ | 20 | |
122
UNITED PARCEL SERVICE, INC. AND SUBSIDIARIES
NOTES TO CONSOLIDATED FINANCIAL STATEMENTS
Income Statement and AOCI Recognition
The following table indicates the amount of gains and losses that have been recognized in AOCI within "unrealized gain (loss) on cash flow hedges" for the years ended December 31, 2017 and 2016 for those derivatives designated as cash flow hedges (in millions):
Derivative Instruments in Cash Flow Hedging Relationships |
| Amount of Gain (Loss) Recognized in AOCI on Derivative (Effective Portion) | ||||||
| 2017 |
| 2016 | |||||
Interest rate contracts |
| $ | - | |
| $ | 1 | |
Foreign exchange contracts |
| (506 | ) |
| 198 | | ||
Total |
| $ | (506 | ) |
| $ | 199 | |
As of December 31, 2017 , $ 150 million of pre-tax losses related to cash flow hedges that are currently deferred in AOCI are expected to be reclassified to income over the 12 month period ended December 31, 2018 . The actual amounts that will be reclassified to income over the next 12 months will vary from this amount as a result of changes in market conditions. The maximum term over which we are hedging exposures to the variability of cash flow is 15 years.
The amount of ineffectiveness recognized in income on derivative instruments designated in cash flow hedging relationships was immaterial for the years ended December 31, 2017 , 2016 and 2015 .
Non-derivative Instruments in Net Investment Hedging Relationships |
| Amount of Gain (Loss) Recognized in AOCI on | ||||||
| 2017 |
| 2016 | |||||
Foreign denominated debt |
| $ | (428 | ) |
| $ | 119 | |
Total |
| $ | (428 | ) |
| $ | 119 | |
The amount of ineffectiveness recognized in income on non-derivative instruments designated in net investment hedging relationships was immaterial for the years ended December 31, 2017 , 2016 and 2015 .
The following table indicates the amount and location in the statements of consolidated income in which derivative gains and losses, as well as the associated gains and losses on the underlying exposure, have been recognized for those derivatives designated as fair value hedges for the years ended December 31, 2017 and 2016 (in millions):
Derivative Instruments in Fair Value Hedging Relationships |
| Location of Gain (Loss) Recognized in Income |
| Amount of Gain (Loss) Recognized in Income |
| Hedged Items in Fair Value Hedging Relationships |
| Location of Gain (Loss) Recognized in Income |
| Amount of Gain (Loss) Recognized in Income | ||||||||||||
|
| 2017 |
| 2016 |
|
|
| 2017 |
| 2016 | ||||||||||||
Interest rate contracts |
| Interest Expense |
| $ | (84 | ) |
| $ | (71 | ) |
| Fixed-Rate Debt and Capital Leases |
| Interest Expense |
| $ | 84 | |
| $ | 71 | |
Additionally, we maintain some interest rate swaps, foreign currency forwards, investment market price forwards and commodity contracts that are not designated as hedges. These interest rate swap contracts are intended to provide an economic hedge of portions of our outstanding debt. These foreign exchange forward contracts are intended to provide an economic offset to foreign currency remeasurement risks for certain assets and liabilities in our consolidated balance sheets. These investment market price forward contracts are intended to provide an economic offset to fair value fluctuations of certain investments in marketable securities.
We also periodically terminate interest rate swaps and foreign currency options by entering into offsetting swap and foreign currency positions with different counterparties. As part of this process, we de-designate our original swap and foreign currency contracts. These transactions provide an economic offset that effectively eliminates the impact of changes in market valuation.
123
UNITED PARCEL SERVICE, INC. AND SUBSIDIARIES
NOTES TO CONSOLIDATED FINANCIAL STATEMENTS
The following is a summary of the amounts recorded in the statements of consolidated income related to fair value changes and settlements of these foreign currency forwards, interest rate swaps, investment market price and commodity contracts not designated as hedges for the years ended December 31, 2017 and 2016 (in millions):
Derivative Instruments Not Designated in Hedging Relationships |
| Location of Gain (Loss) Recognized in Income |
| Amount of Gain (Loss) Recognized in Income | ||||||
|
| 2017 |
| 2016 | ||||||
Foreign exchange contracts |
| Investment income and other |
| $ | 60 | |
| $ | (145 | ) |
Investment market price contracts |
| Investment income and other |
| (5 | ) |
| (5 | ) | ||
Interest rate contracts |
| Interest Expense |
| (9 | ) |
| (8 | ) | ||
Total |
|
|
| $ | 46 | |
| $ | (158 | ) |
Fair Value Measurements
Our foreign currency, interest rate and investment market price derivatives are largely comprised of over-the-counter derivatives, which are primarily valued using pricing models that rely on market observable inputs such as yield curves, currency exchange rates and commodity forward prices, and therefore are classified as Level 2. The fair values of our derivative assets and liabilities as of December 31, 2017 and 2016 by hedge type are as follows (in millions):
|
| Quoted Prices in Active Markets for Identical Assets (Level 1) |
| Significant Other Observable Inputs (Level 2) |
| Significant Unobservable Inputs (Level 3) |
| Total | ||||||||
2017 |
|
|
|
|
|
|
|
| ||||||||
Assets: |
|
|
|
|
|
|
|
| ||||||||
Foreign Exchange Contracts |
| $ | - | |
| $ | 21 | |
| $ | - | |
| $ | 21 | |
Interest Rate Contracts |
| - | |
| 86 | |
| - | |
| 86 | | ||||
Total |
| $ | - | |
| $ | 107 | |
| $ | - | |
| $ | 107 | |
Liabilities: |
|
|
|
|
|
|
|
| ||||||||
Foreign Exchange Contracts |
| $ | - | |
| $ | 288 | |
| $ | - | |
| $ | 288 | |
Investment Market Price Contracts |
| - | |
| 16 | |
| - | |
| 16 | | ||||
Interest Rate Contracts |
| - | |
| 28 | |
| - | |
| 28 | | ||||
Total |
| $ | - | |
| $ | 332 | |
| $ | - | |
| $ | 332 | |
|
|
|
|
|
|
|
|
| ||||||||
|
| Quoted Prices in Active Markets for Identical Assets (Level 1) |
| Significant Other Observable Inputs (Level 2) |
| Significant Unobservable Inputs (Level 3) |
| Total | ||||||||
2016 |
|
|
|
|
|
|
|
| ||||||||
Assets: |
|
|
|
|
|
|
|
| ||||||||
Foreign Exchange Contracts |
| $ | - | |
| $ | 308 | |
| $ | - | |
| $ | 308 | |
Interest Rate Contracts |
| - | |
| 179 | |
| - | |
| 179 | | ||||
Total |
| $ | - | |
| $ | 487 | |
| $ | - | |
| $ | 487 | |
Liabilities: |
|
|
|
|
|
|
|
| ||||||||
Foreign Exchange Contracts |
| $ | - | |
| $ | 6 | |
| $ | - | |
| $ | 6 | |
Investment Market Price Contracts |
| - | |
| 10 | |
| - | |
| 10 | | ||||
Interest Rate Contracts |
| - | |
| 29 | |
| - | |
| 29 | | ||||
Total |
| $ | - | |
| $ | 45 | |
| $ | - | |
| $ | 45 | |
124
UNITED PARCEL SERVICE, INC. AND SUBSIDIARIES
NOTES TO CONSOLIDATED FINANCIAL STATEMENTS
NOTE 16. QUARTERLY INFORMATION (UNAUDITED)
Our revenue, segment operating profit (loss), net income (loss), basic and diluted earnings per share on a quarterly basis are presented below (in millions, except per share amounts):
| First Quarter |
| Second Quarter |
| Third Quarter |
| Fourth Quarter | ||||||||||||||||||||||||
| 2017 |
| 2016 |
| 2017 |
| 2016 |
| 2017 |
| 2016 |
| 2017 |
| 2016 | ||||||||||||||||
Revenue: |
|
|
|
|
|
|
|
|
|
|
|
|
|
|
| ||||||||||||||||
U.S. Domestic Package | $ | 9,535 | |
| $ | 9,084 | |
| $ | 9,745 | |
| $ | 9,015 | |
| $ | 9,649 | |
| $ | 9,289 | |
| $ | 11,835 | |
| $ | 10,913 | |
International Package | 3,058 | |
| 2,914 | |
| 3,163 | |
| 3,077 | |
| 3,364 | |
| 3,024 | |
| 3,753 | |
| 3,335 | | ||||||||
Supply Chain & Freight | 2,722 | |
| 2,420 | |
| 2,842 | |
| 2,537 | |
| 2,965 | |
| 2,615 | |
| 3,241 | |
| 2,683 | | ||||||||
Total revenue | 15,315 | |
| 14,418 | |
| 15,750 | |
| 14,629 | |
| 15,978 | |
| 14,928 | |
| 18,829 | |
| 16,931 | | ||||||||
Operating Profit (Loss): |
|
|
|
|
|
|
|
|
|
|
|
|
|
|
| ||||||||||||||||
U.S. Domestic Package | 1,076 | |
| 1,102 | |
| 1,395 | |
| 1,233 | |
| 1,182 | |
| 1,252 | |
| 627 | |
| (570 | ) | ||||||||
International Package | 529 | |
| 574 | |
| 583 | |
| 613 | |
| 627 | |
| 576 | |
| 725 | |
| 281 | | ||||||||
Supply Chain & Freight | 179 | |
| 147 | |
| 238 | |
| 192 | |
| 226 | |
| 206 | |
| 142 | |
| (139 | ) | ||||||||
Total operating profit (loss) | 1,784 | |
| 1,823 | |
| 2,216 | |
| 2,038 | |
| 2,035 | |
| 2,034 | |
| 1,494 | |
| (428 | ) | ||||||||
Net Income (Loss) | $ | 1,158 | |
| $ | 1,131 | |
| $ | 1,384 | |
| $ | 1,269 | |
| $ | 1,264 | |
| $ | 1,270 | |
| $ | 1,104 | |
| $ | (239 | ) |
Net Income (Loss) Per Share: |
|
|
|
|
|
|
|
|
|
|
|
|
|
|
| ||||||||||||||||
Basic | $ | 1.32 | |
| $ | 1.27 | |
| $ | 1.59 | |
| $ | 1.43 | |
| $ | 1.45 | |
| $ | 1.44 | |
| $ | 1.27 | |
| $ | (0.27 | ) |
Diluted | $ | 1.32 | |
| $ | 1.27 | |
| $ | 1.58 | |
| $ | 1.43 | |
| $ | 1.45 | |
| $ | 1.44 | |
| $ | 1.27 | |
| $ | (0.27 | ) |
Operating profit for the quarter ended December 31, 2017 was impacted by a mark-to-market loss of $800 million on our pension and postretirement benefit plans related to the remeasurement of plan assets and liabilities recognized outside of a 10% corridor (allocated as follows-U.S. Domestic Package $637 million , International Package $35 million , and Supply Chain & Freight $128 million ). Net income for the quarter ended December 31, 2017 includes an income tax benefit of $258 million attributable to the 2017 Tax Act. These items reduced fourth quarter net income by $349 million and basic and diluted earnings per share by $0.41 and $0.40 , respectively.
Operating profit for the quarter ended December 31, 2016 was impacted by a mark-to-market loss of $ 2.651 billion on our pension and postretirement benefit plans related to the remeasurement of plan assets and liabilities recognized outside of a 10% corridor (allocated as follows-U.S. Domestic Package $ 1.908 billion, International Package $ 425 million and Supply Chain & Freight $ 318 million). This loss reduced fourth quarter net income by $ 1.673 billion, and basic and diluted earnings per share by $ 1.91 .
125
Item 9. | Changes in and Disagreements with Accountants on Accounting and Financial Disclosure |
None.
Item 9A. Controls and Procedures
Evaluation of Disclosure Controls and Procedures:
As of the end of the period covered by this report, management, including our Chief Executive Officer and Chief Financial Officer, evaluated the effectiveness of the design and operation of our disclosure controls and procedures and internal controls over financial reporting. Based upon, and as of the date of, the evaluation, our Chief Executive Officer and Chief Financial Officer concluded that the disclosure controls and procedures were effective to ensure that information required to be disclosed in the reports we file and submit under the Exchange Act is recorded, processed, summarized and reported as and when required and is accumulated and communicated to our management, including the Chief Executive Officer and Chief Financial Officer, as appropriate to allow timely decisions regarding required disclosure.
Changes in Internal Control:
There were no changes in the Company's internal controls over financial reporting during the quarter ended December 31, 2017 that have materially affected, or are reasonably likely to materially affect, the Company's internal control over financial reporting.
Management's Report on Internal Control Over Financial Reporting:
UPS management is responsible for establishing and maintaining adequate internal controls over financial reporting for United Parcel Service, Inc. and its subsidiaries (the "Company"). Based on the criteria for effective internal control over financial reporting established in Internal Control-Integrated Framework (2013) issued by the Committee of Sponsoring Organizations of the Treadway Commission, management has assessed the Company's internal control over financial reporting as effective as of December 31, 2017 . The independent registered public accounting firm of Deloitte & Touche LLP, as auditors of the consolidated balance sheets of United Parcel Service, Inc. and its subsidiaries as of December 31, 2017 and the related statements of consolidated income, consolidated comprehensive income and consolidated cash flows for the year ended December 31, 2017 , has issued an attestation report on the Company's internal control over financial reporting, which is included herein.
126
Report of Independent Registered Public Accounting Firm
Board of Directors and Shareowners
United Parcel Service, Inc.
Atlanta, Georgia
Opinion on Internal Control over Financial Reporting
We have audited the internal control over financial reporting of United Parcel Service, Inc. and subsidiaries (the "Company") as of December 31, 2017, based on criteria established in Internal Control-Integrated Framework (2013) issued by the Committee of Sponsoring Organizations of the Treadway Commission ("COSO"). In our opinion, the Company maintained, in all material respects, effective internal control over financial reporting as of December 31, 2017, based on criteria established in Internal Control - Integrated Framework (2013) issued by COSO.
We have also audited, in accordance with the standards of the Public Company Accounting Oversight Board (United States) ("PCAOB"), the consolidated financial statements as of and for the year ended December 31, 2017, of the Company and our report dated February 21, 2018, expressed an unqualified opinion on those financial statements.
Basis for Opinion
The Company's management is responsible for maintaining effective internal control over financial reporting and for its assessment of the effectiveness of internal control over financial reporting, included in the accompanying Management's Report on Internal Control over Financial Reporting. Our responsibility is to express an opinion on the Company's internal control over financial reporting based on our audit. We are a public accounting firm registered with the PCAOB and are required to be independent with respect to the Company in accordance with the U.S. federal securities laws and the applicable rules and regulations of the Securities and Exchange Commission and the PCAOB.
We conducted our audit in accordance with the standards of the PCAOB. Those standards require that we plan and perform the audit to obtain reasonable assurance about whether effective internal control over financial reporting was maintained in all material respects. Our audit included obtaining an understanding of internal control over financial reporting, assessing the risk that a material weakness exists, testing and evaluating the design and operating effectiveness of internal control based on the assessed risk, and performing such other procedures as we considered necessary in the circumstances. We believe that our audit provides a reasonable basis for our opinion.
Definition and Limitations of Internal Control over Financial Reporting
A company's internal control over financial reporting is a process designed to provide reasonable assurance regarding the reliability of financial reporting and the preparation of financial statements for external purposes in accordance with generally accepted accounting principles. A company's internal control over financial reporting includes those policies and procedures that (1) pertain to the maintenance of records that, in reasonable detail, accurately and fairly reflect the transactions and dispositions of the assets of the company; (2) provide reasonable assurance that transactions are recorded as necessary to permit preparation of financial statements in accordance with generally accepted accounting principles, and that receipts and expenditures of the company are being made only in accordance with authorizations of management and directors of the company; and (3) provide reasonable assurance regarding prevention or timely detection of unauthorized acquisition, use, or disposition of the company's assets that could have a material effect on the financial statements.
Because of its inherent limitations, internal control over financial reporting may not prevent or detect misstatements. Also, projections of any evaluation of effectiveness to future periods are subject to the risk that controls may become inadequate because of changes in conditions, or that the degree of compliance with the policies or procedures may deteriorate.
/s/ Deloitte & Touche LLP
Atlanta, Georgia
February 21, 2018
127
Item 9B. | Other Information |
None.
PART III
128
Item 10. | Directors, Executive Officers and Corporate Governance |
Name and Office |
| Age |
| Principal Occupation and Employment For the Last Five Years | |
David P. Abney Chairman and Chief Executive Officer |
| 62 | |
| Chief Executive Officer (2014 - present), Chairman (2016 - present) Senior Vice President and Chief Operating Officer (2007 - 2014). |
James J. Barber, Jr. Senior Vice President and President, UPS International |
| 57 | |
| President, UPS International (2013 - present), Chief Operating Officer, UPS Europe, Middle East and Africa (2010 - 2013). |
Norman M. Brothers, Jr. Senior Vice President, General Counsel and Corporate Secretary |
| 50 | |
| Senior Vice President, General Counsel and Corporate Secretary (2016 - present), Corporate Legal Department Manager (2014 - 2016), Vice President, Corporate Legal (2004 - 2014). |
Alan Gershenhorn Senior Vice President, Chief Commercial Officer |
| 59 | |
| Executive Vice President and Chief Commercial Officer (2014 - present), Senior Vice President, Worldwide Sales, Marketing and Strategy (2011 - 2014). |
Myron A. Gray Senior Vice President and President, United States Operations |
| 60 | |
| President, United States Operations (2014 - present), Senior Vice President, United States Operations (2009 - 2014). |
Kate M. Gutmann Senior Vice President, Chief Sales and Solutions Officer |
| 49 | |
| Chief Sales and Solutions Officer; Senior Vice President The UPS Store and UPS Capital (2017 - present), Senior Vice President, Worldwide Sales and Solutions (2014 - 2017), President, Worldwide Sales (2011 - 2014). |
Teri P. McClure Senior Vice President, Chief Human Resources Officer, Labor Relations |
| 54 | |
| Chief Human Resources Officer and Senior Vice President, Labor (2016 - present), Chief Legal, Communications and Human Resources Officer (2015 - 2016), Senior Vice President of Legal, Compliance and Public Affairs, General Counsel and Corporate Secretary (2006 -2014). |
Richard N. Peretz Senior Vice President, Chief Financial Officer and Treasurer |
| 56 | |
| Chief Financial Officer (2015 - present), Corporate Controller and Treasurer (2014-2015), Corporate Controller (2013 - 2015), Vice President of Corporate Finance and Accounting (2008 - 2013). |
Juan R. Perez Senior Vice President, Chief Information Officer |
| 51 | |
| Chief Information Officer and Engineering Officer (2017 - present), Chief Information Officer (2016 - 2017), Vice President, Information Services (2011 - 2016). |
Scott A. Price Senior Vice President, Chief Transformation Officer |
| 56 | |
| Chief Transformation Officer (2017 - present), Walmart International Executive Vice President of Global Leverage (2017), Walmart Asia President and Chief Executive Officer (2009 - 2017). |
Mark R. Wallace Senior Vice President, Global Engineering and Sustainability |
| 55 | |
| Senior Vice President, Global Engineering and Sustainability (2015 - present), President, Global Logistics & Distribution (2013 - 2015), Corporate U.S. Engineering Coordinator (2012 - 2013). |
129
Information about our directors is presented under the caption "Your Board of Directors" in our definitive Proxy Statement for the Annual Meeting of Shareowners to be held on May 10, 2018 and is incorporated herein by reference.
Information about our Audit Committee is presented under the caption "Your Board of Directors - Committees of the Board of Directors" and "Audit Committee Matters" in our definitive Proxy Statement for the Annual Meeting of Shareowners to be held on May 10, 2018 and is incorporated herein by reference.
Information about our Code of Business Conduct is presented under the caption "Where You Can Find More Information" in Part I, Item 1 of this report.
Information about our compliance with Section 16 of the Exchange Act of 1934, as amended, is presented under the caption "Ownership of Our Securities - Section 16(a) Beneficial Ownership Reporting Compliance" in our definitive Proxy Statement for the Annual Meeting of Shareowners to be held on May 10, 2018 and is incorporated herein by reference.
Item 11. | Executive Compensation |
Information about our board and executive compensation is presented under the captions "Your Board of Directors - Director Compensation" and "Executive Compensation" in our definitive Proxy Statement for the Annual Meeting of Shareowners to be held on May 10, 2018 and is incorporated herein by reference.
Item 12. | Security Ownership of Certain Beneficial Owners and Management and Related Stockholder Matters |
Information about security ownership is presented under the caption "Ownership of Our Securities - Securities Ownership of Certain Beneficial Owners and Management" in our definitive Proxy Statement for the Annual Meeting of Shareowners to be held on May 10, 2018 and is incorporated herein by reference.
Information about our equity compensation plans is presented under the caption "Executive Compensation - Equity Compensation Plans" in our definitive Proxy Statement for the Annual Meeting of Shareowners to be held on May 10, 2018 and is incorporated herein by reference.
Item 13. | Certain Relationships and Related Transactions, and Director Independence |
Information about transactions with related persons is presented under the caption "Corporate Governance - Conflicts of Interest and Related Person Transactions" in our definitive Proxy Statement for the Annual Meeting of Shareowners to be held on May 10, 2018 and is incorporated herein by reference.
Information about director independence is presented under the caption "Corporate Governance - Director Independence" in our definitive Proxy Statement for the Annual Meeting of Shareowners to be held on May 10, 2018 and is incorporated herein by reference.
Item 14. | Principal Accounting Fees and Services |
Information about aggregate fees billed to us by our principal accountant is presented under the caption "Audit Committee Matters - Principal Accounting Firm Fees" in our definitive Proxy Statement for the Annual Meetings of Shareowners to be held on May 10, 2018 and is incorporated herein by reference.
130
PART IV
Item 15. | Exhibits and Financial Statement Schedules |
(a) Documents filed as a part of this report:
1. Financial Statements .
See Item 8 for the financial statements filed with this report.
2. Financial Statement Schedules .
None.
3. Exhibits .
See the Exhibit Index below for a list of the exhibits incorporated by reference into or filed with this report.
(b) Exhibits Required To Be Filed
See Item 15(a)1 above
(c) Financial Statement Schedules Required To Be Filed
See Item 15(a) 2 above
Item 16. | Form 10-K Summary |
None
EXHIBIT INDEX
Exhibit No. |
| Description |
|
|
|
3.1 | - | Form of Restated Certificate of Incorporation of United Parcel Service, Inc. (incorporated by reference to Exhibit 3.2 to Form 8-K filed on May 12, 2010). |
|
|
|
3.2 | - | Amended and Restated Bylaws of United Parcel Service, Inc. as of November 17, 2017 (incorporated by reference to Exhibit 3.1 to Form 8-K, filed on November 17, 2017). |
|
|
|
4.1 | - | Indenture relating to 8 3/8% Debentures due April 1, 2020 (incorporated by reference to Exhibit 4(c) to Registration Statement No. 33-32481, filed December 7, 1989) (1) . |
|
|
|
4.2 | - | Indenture dated as of December 18, 1997 (incorporated by reference to Exhibit T-3C to Form T-3 filed December 18, 1997). |
|
|
|
4.3 | - | Indenture dated as of January 26, 1999 (incorporated by reference to Exhibit 4.1 to Pre-Effective Amendment No. 1 to Form S-3 (No. 333-08369), filed on January 26, 1999). |
|
|
|
4.4 | - | Supplemental Indenture dated as of March 27, 2000 to Indenture dated January 26, 1999 (incorporated by reference to Exhibit 4.2 to Post-Effective Amendment No. 1 to Form S-3 (No. 333-08369-01), filed on March 15, 2000). |
|
|
|
4.5 | - | Second Supplemental Indenture dated as of September 21, 2001 to Indenture dated January 26, 1999 (incorporated by reference to Exhibit 4 to Form 10-Q for the Quarter Ended September 30, 2001). |
|
|
|
4.6 | - | Indenture dated as of August 26, 2003 (incorporated by reference to Exhibit 4.1 to Form S-3 (No. 333-108272), filed on August 27, 2003). |
|
|
|
4.7 | - | First Supplemental Indenture dated as of November 15, 2013 to Indenture dated as of August 26, 2003 (incorporated by reference to Exhibit 4.2 to Form S-3ASR (No. 333-192369) filed on November 15, 2013). |
|
|
|
4.8 | - | Form of Second Supplemental Indenture dated as of May 18, 2017 (incorporated by reference to Exhibit 4.1 to Form 8-K filed on May 18, 2017). |
|
|
|
4.9 | - | Form of Note for 5.50% Senior Notes due January 15, 2018 (incorporated by reference to Exhibit 4.2 to Form 8-K filed on January 15, 2008). |
|
|
|
4.10 | - | Form of Note for 6.20% Senior Notes due January 15, 2038 (incorporated by reference to Exhibit 4.3 to Form 8-K filed on January 15, 2008). |
|
|
|
131
4.11 | - | Form of Note for 5.125% Senior Notes due April 1, 2019 (incorporated by reference to Exhibit 4.2 to Form 8-K filed on March 24, 2009). |
|
|
|
4.12 | - | Form of Note for 3.125% Senior Notes due January 15, 2021 (incorporated by reference to Exhibit 4.1 to Form 8-K filed on November 12, 2010). |
|
|
|
4.13 | - | Form of Note for 4.875% Senior Notes due November 15, 2040 (incorporated by reference to Exhibit 4.2 to Form 8-K filed on November 12, 2010). |
|
|
|
4.14 | - | Form of Note for 1.125% Senior Notes due October 1, 2017 (incorporated by reference to Exhibit 4.1 to Form 8-K filed on September 27, 2012). |
|
|
|
4.15 | - | Form of Note for 2.450% Senior Notes due October 1, 2022 (incorporated by reference to Exhibit 4.2 to Form 8-K filed on September 27, 2012). |
|
|
|
4.16 | - | Form of Note for 3.625% Senior Notes due October 1, 2042 (incorporated by reference to Exhibit 4.3 to Form 8-K filed on September 27, 2012). |
|
|
|
4.17 | - | Form of Note for Floating Rate Senior Notes due December 15, 2064 (incorporated by reference to Exhibit 4.3 to Form 8-K filed on December 15, 2014). |
|
|
|
4.18 | - | Form of Note for Floating Rate Senior Notes due September 15, 2065 (incorporated by reference to Exhibit 4.1 to Form 8-K filed on September 17, 2015). |
|
|
|
4.19 | - | Form of Note for Floating Rate Senior Notes due July 15, 2020 (incorporated by reference to Exhibit 4.1 and Exhibit 4.2 to Form 8-K filed on November 20, 2015). |
|
|
|
4.20 | - | Form of Note for 1.625% Senior Notes due November 15, 2025 (incorporated by reference to Exhibit 4.1 and Exhibit 4.2 to Form 8-K filed on November 20, 2015). |
|
|
|
4.21 | - | Form of Note for Floating Rate Senior Notes due September 15, 2065 (incorporated by reference to Exhibit 4.1 to Form 8-K filed on December 15, 2015). |
|
|
|
4.22 | - | Form of Note for Floating Rate Senior Notes due March 15, 2066 (incorporated by reference to Exhibit 4.1 to Form 8-K filed on April 1, 2016). |
|
|
|
4.23 | - | Form of Note for Floating Rate Senior Notes due March 15, 2066 (incorporated by reference to Exhibit 4.1 to Form 8-K filed on June 15, 2016). |
|
|
|
4.24 | - | Form of Note for Floating Rate Senior Notes due March 15, 2066 (incorporated by reference to Exhibit 4.1 to Form 8-K filed on August 24, 2016). |
|
|
|
4.25 | - | Form of Note for 2.40% Senior Notes Due November 2026 (incorporated by reference to Exhibit 4.2 to Form 8-K filed on October 24, 2016). |
|
|
|
4.26 | - | Form of Note for 3.40% Senior Notes Due November 2046 (incorporated by reference to Exhibit 4.3 to Form 8-K filed on October 24, 2016). |
|
|
|
4.27 | - | Form of Note for 1.00% Senior Notes Due November 2028 (incorporated by reference to Exhibit 4.1 to Form 8-K filed on October 24, 2016). |
|
|
|
4.28 | - | Form of Note for Floating Rate Senior Notes due March 15, 2067 (incorporated by reference to Exhibit 4.1 to Form 8-K filed on March 31, 2017). |
|
|
|
4.29 | - | Form of Note for Floating Rate Senior Notes due May 16, 2022 (incorporated by reference to Exhibit 4.1 to Form 8-K filed on May 16, 2017). |
|
|
|
4.30 | - | Form of Note 2.350% Senior Noted due May 16, 2022 (incorporated by reference to Exhibit 4.2 to Form 8-K filed on May 16, 2017) . |
|
|
|
4.31 | - | Form of Note for 2.125% Senior Notes due May 21, 2024 (incorporated by reference to Exhibit 4.2 to Form 8-K filed on May 18, 2017). |
|
|
|
4.32 | - | Form of Note 0.375% Senior Notes due November 15, 2023 (incorporated by reference to Exhibit 4.1 to Form 8-K filed on November 13, 2017). |
|
|
|
4.33 | - | Form of Note 1.500% Senior Notes due November 15, 2032 (incorporated by reference to Exhibit 4.2 to Form 8-K filed on November 13, 2017). |
|
|
|
4.34 | - | Form of Note for Floating Rate Senior Notes due April 1, 2021 (incorporated by reference to Exhibit 4.1 to Form 8-K filed on November 14, 2017). |
|
|
|
132
4.35 | - | Form of Note for Floating Rate Senior Notes due April 1, 2023 (incorporated by reference to Exhibit 4.2 to Form 8-K filed on November 14, 2017). |
|
|
|
4.36 | - | Form of Note 2.050% Senior Notes due April 1, 2021 (incorporated by reference to Exhibit 4.3 to Form 8-K filed on November 14, 2017). |
|
|
|
4.37 | - | Form of Note 2.500% Senior Notes due April 1, 2023 (incorporated by reference to Exhibit 4.4 to Form 8-K filed on November 14, 2017). |
|
|
|
4.38 | - | Form of Note 2.800% Senior Notes due November 15, 2024 (incorporated by reference to Exhibit 4.5 to Form 8-K filed on November 14, 2017). |
|
|
|
4.39 | - | Form of Note 3.050% Senior Notes due November 15, 2027 (incorporated by reference to Exhibit 4.6 to Form 8-K filed on November 14, 2017). |
|
|
|
4.40 | - | Form of Note 3.750% Senior Notes due November 15, 2047 (incorporated by reference to Exhibit 4.7 to Form 8-K filed on November 14, 2017). |
|
|
|
4.41 | - | Form of Note for Floating Rate Senior Notes due November 15, 2067 (incorporated by reference to Exhibit 4.8 to Form 8-K filed on November 14, 2017). |
|
|
|
10.1 | - | Amendment No. 1 to UPS Retirement Plan, as Amended and Restated, effective as of June 30, 2016 (incorporated by reference to Exhibit 10.1 to Form 10-Q for the Quarter Ended June 30, 2016). |
|
|
|
10.1(a) | - | Amendment Four to the Amended and Restated UPS Retirement Plan effective June 23, 2017 (incorporated by reference to Exhibit 10.2 to Form 8-K filed on June 27, 2017). |
10.2 | - | UPS 401(k) Savings Plan, Amendment and Restatement effective as of July 1, 2016 (incorporated by reference to Exhibit 10.2 to Form 10-Q for the Quarter Ended September 30, 2016). |
10.2(a) | - | Amended and Restated UPS 401(k) Savings Plan effective January 1, 2017 (incorporated by references to Exhibit 10.1 to 8-K filed on June 27, 2017). |
|
|
|
10.3 | - | Amended and Restated UPS Restoration Savings Plan effective January 1, 2017 (incorporated by reference to Exhibit 10.3 to Form 8-K filed on June 27, 2017). |
|
|
|
10.4 | - | Amendment One to the UPS Excess Coordinating Benefit Plan effective June 23, 2017 (incorporated by reference to Exhibit 10.4 to Form 8-K filed on June 27, 2017). |
|
|
|
10.5 | - | UPS Excess Coordinating Benefit Plan, as Amended and Restated, effective as of January 1, 2012 (incorporated by reference to Exhibit 10.5 to the 2012 Annual Report on Form 10-K). |
|
|
|
10.6 | - | United Parcel Service, Inc. 2012 Omnibus Incentive Compensation Plan (incorporated by reference to Annex II to the Definitive Proxy Statement, filed on March 12, 2012). |
|
|
|
10.6(a) | - | Form of Long-Term Incentive Performance Award Agreement (incorporated by reference to Exhibit 10.3 to the Quarterly Report on Form 10-Q for the quarter ended March 31, 2011). |
|
|
|
10.6(b) | - | Form of Non-Management Director Restricted Stock Unit Award (incorporated by reference to Exhibit 10.2 to the Quarterly Report on Form 10-Q for the quarter ended March 31, 2010). |
|
|
|
10.6(c) | - | UPS Management Incentive Program Terms and Conditions effective as of January 1, 2011 (incorporated by reference to Exhibit 10.10(3) to the 2010 Annual Report on Form 10-K). |
|
|
|
10.6(d) | - | UPS Stock Option Program Terms and Conditions effective as of January 1, 2012 (incorporated by reference to Exhibit 10.7(4) to the 2011 Annual Report on Form 10-K). |
|
|
|
10.6(e) | - | UPS Long-Term Incentive Performance Program Terms and Conditions effective as of January 1, 2012 (incorporated by reference to Exhibit 10.7(5) to the 2011 Annual Report on Form 10-K). |
|
|
|
10.7 | - | Form of UPS Deferred Compensation Plan (incorporated by reference to Exhibit 10.11 to the 2010 Annual Report on Form 10-K). |
|
|
|
10.7(a) | - | Amendment No. 1 to the UPS Deferred Compensation Plan (incorporated by reference to Exhibit 10.7(1) to the 2012 Annual Report on Form 10-K). |
|
|
|
10.8 | - | United Parcel Service, Inc. Nonqualified Employee Stock Purchase Plan (incorporated by reference to Exhibit 99.1 to the registration statement on Form S-8 (No. 333-34054), filed on April 5, 2000). |
|
|
|
10.9 | - | Discounted Employee Stock Purchase Plan, as Amended and Restated, effective October 1, 2002. |
|
|
|
133
10.9(a) | - | Amendment No. 1 to the Discounted Employee Stock Purchase Plan (incorporated by reference to Exhibit 10.12(1) to the 2005 Annual Report on Form 10-K). |
|
|
|
10.9(b) | - | Amendment No. 2 to the Discounted Employee Stock Purchase Plan (incorporated by reference to Exhibit 10.13(2) to the 2009 Annual Report on Form 10-K). |
|
|
|
10.9(c) | - | Amendment No. 3 to the Discounted Employee Stock Purchase Plan (incorporated by reference to Exhibit 10.9(3) to the 2012 Annual Report on Form 10-K). |
|
|
|
10.10 | - | 2015 Omnibus Incentive Compensation Plan (incorporated by reference to Annex A to the Definitive Proxy Statement filed on March 24, 2015). |
|
|
|
11 | - | Statement regarding Computation of per Share Earnings (incorporated by reference to note 14 to Part I, Item 8 "Financial Statements and Supplementary Data" of this Annual Report on Form 10-K). |
|
|
|
†12 | - | Ratio of Earnings to Fixed Charges. |
|
|
|
†21 | - | Subsidiaries of the Registrant. |
|
|
|
†23 | - | Consent of Deloitte & Touche LLP. |
|
|
|
†31.1 | - | Certificate of the Chief Executive Officer Pursuant to Rule 13a-14(a), as adopted pursuant to Section 302 of the Sarbanes-Oxley Act of 2002. |
|
|
|
†31.2 | - | Certificate of the Chief Financial Officer Pursuant to Rule 13a-14(a), as adopted pursuant to Section 302 of the Sarbanes-Oxley Act of 2002. |
|
|
|
†32.1 | - | Certification of the Chief Executive Officer Pursuant to 18 U.S.C. Section 1350, as Adopted Pursuant to Section 906 of the Sarbanes-Oxley Act of 2002. |
|
|
|
†32.2 | - | Certification of the Chief Financial Officer Pursuant to 18 U.S.C. Section 1350, as Adopted Pursuant to Section 906 of the Sarbanes-Oxley Act of 2002. |
|
|
|
†101 | - | The following financial information from the Annual Report on Form 10-K for the year ended December 31, 2017, formatted in XBRL (Extensible Business Reporting Language): (i) the Consolidated Balance Sheets, (ii) the Consolidated Statements of Income, (iii) the Consolidated Statements of Comprehensive Income, (iv) the Consolidated Statements of Cash Flows and (v) the Notes to the Consolidated Financial Statements. |
__________________________
† | Filed herewith. |
(1) | Filed in paper format. |
134
SIGNATURES
Pursuant to the requirements of Section 13 or 15(d) of the Securities Exchange Act of 1934, United Parcel Service, Inc. has duly caused this report to be signed on its behalf by the undersigned, thereunto duly authorized.
UNITED PARCEL SERVICE, INC. | ||
(REGISTRANT) | ||
|
|
|
By: |
| / S / DAVID P. ABNEY |
|
| David P. Abney |
|
| Chairman and Chief Executive Officer |
Date: February 21, 2018
Pursuant to the requirements of the Securities Exchange Act of 1934, this report has been signed below by the following persons on behalf of the Registrant and in the capacities and on the dates indicated.
Signature |
| Title |
| Date |
|
|
|
|
|
/ S / D AVID P. A BNEY |
| Chairman, Chief Executive Officer and Director (Principal Executive Officer) |
| February 21, 2018 |
David P. Abney |
|
|
|
|
|
|
|
|
|
/ S / R ODNEY C. A DKINS |
| Director |
| February 21, 2018 |
Rodney C. Adkins |
|
|
|
|
|
|
|
|
|
/ S / M ICHAEL J. B URNS |
| Director |
| February 21, 2018 |
Michael J. Burns |
|
|
|
|
|
|
|
|
|
/ S / W ILLIAM R. J OHNSON |
| Director |
| February 21, 2018 |
William R. Johnson |
|
|
|
|
|
|
|
|
|
/ S / Dr. C ANDACE K ENDLE |
| Director |
| February 21, 2018 |
Candace Kendle |
|
|
|
|
|
|
|
|
|
/ S / A NN M. L IVERMORE |
| Director |
| February 21, 2018 |
Ann M. Livermore |
|
|
|
|
|
|
|
|
|
/ S / R UDY H.P. M ARKHAM |
| Director |
| February 21, 2018 |
Rudy H. P. Markham |
|
|
|
|
|
|
|
|
|
/ S / F RANCK J. M OISON |
| Director |
| February 21, 2018 |
Franck J. Moison |
|
|
|
|
|
|
|
|
|
/ S / R ICHARD N. P ERETZ |
| Senior Vice President, Chief Financial Officer and Treasurer |
| February 21, 2018 |
Richard N. Peretz |
| (Principal Financial and Accounting Officer) |
|
|
|
|
|
|
|
/ S / C LARK T. R ANDT , J R . |
| Director |
| February 21, 2018 |
Clark T. Randt, Jr. |
|
|
|
|
|
|
|
|
|
/ S / J OHN T. S TANKEY |
| Director |
| February 21, 2018 |
John T. Stankey |
|
|
|
|
|
|
|
|
|
/ S / C AROL B. T OMÉ |
| Director |
| February 21, 2018 |
Carol B. Tomé |
|
|
|
|
|
|
|
|
|
/S/ K EVIN M. W ARSH |
| Director |
| February 21, 2018 |
Kevin M. Warsh |
|
|
|
|
135