
UNITED STATES
SECURITIES AND EXCHANGE COMMISSION
Washington, D. C. 20549
FORM 10-K
ANNUAL REPORT PURSUANT TO SECTION 13 OR 15(d)
OF THE SECURITIES EXCHANGE ACT OF 1934
For the Fiscal Year Ended June 30, 2013
Commission File Number 1-7635
TWIN DISC, INCORPORATED
(Exact Name of Registrant as Specified in its Charter)
Wisconsin | 39-0667110 |
(State or Other Jurisdiction of Incorporation or Organization) | (I.R.S. Employer Identification Number) |
1328 Racine Street, Racine, Wisconsin | 53403 |
(Address of Principal Executive Office) | (Zip Code) |
Registrant's Telephone Number, including area code: | (262) 638-4000 |
Securities registered pursuant to Section 12(b) of the Act:
Title of each class | Name of each exchange on which registered: |
Common stock, no par | The NASDAQ Stock Market LLC |
Preferred stock purchase rights | The NASDAQ Stock Market LLC |
Securities registered pursuant to Section 12(g) of the Act:
None
(Title of Class)
Indicate by check mark if the registrant is a well-known seasoned issuer, as defined in Rule 405 of the Securities Act.
YES [ ] NO [ √ ]
Indicate by check mark if the registrant is not required to file reports pursuant to Section 13 or Section 15(d) of the Act.
YES [ ] NO [ √ ]
Indicate by check mark whether the registrant (1) has filed all reports required to be filed by Section 13 or 15(d) of the Securities Exchange Act of 1934 during the preceding 12 months (or for such shorter period that the registrant was required to file such reports), and (2) has been subject to such filing requirements for the past 90 days.
YES [√ ] NO [ ]
Indicate by check mark whether the registrant has submitted electronically and posted on its corporate Web site, if any, every Interactive Data File required to be submitted and posted pursuant to Rule 405 of Regulation S-T (§232.405 of this chapter) during the preceding 12 months (or for such shorter period that the registrant was required to submit and post such files)YES [√ ] NO [ ]
Indicate by check mark if disclosure of delinquent filers pursuant to Item 405 of Regulation S-K is not contained herein, and will not be contained, to the best of the registrant's knowledge, in definitive proxy or information statements incorporated by reference in Part III of this Form 10-K or any amendment to this Form 10-K [ √ ].
Indicate by check mark whether the registrant is a large accelerated filer, an accelerated filer, a non-accelerated filer, or a smaller reporting company (as defined in Rule 12b-2 of the Exchange Act).
Large Accelerated Filer [ ] Accelerated Filer [ √ ] Non-accelerated Filer [ ] Smaller reporting company [ ]
1
Table of Contents
Indicate by check mark whether the registrant is a shell company (as defined in Rule 12b-2 of the Act).
YES [ ] NO [ √ ]
At December 28, 2012, the last business day of the registrant's second fiscal quarter, the aggregate market value of the common stock held by non-affiliates of the registrant was $140,548,703. Determination of stock ownership by affiliates was made solely for the purpose of responding to this requirement and registrant is not bound by this determination for any other purpose.
At August 16, 2013, the registrant had 11,255,519 shares of its common stock outstanding.
DOCUMENTS INCORPORATED BY REFERENCE:
Portions of the Proxy Statement for the Annual Meeting of Shareholders to be held October 18, 2013, which will be filed pursuant to Regulation 14A not later than 120 days after the end of the fiscal year covered by this report, are incorporated by reference into Part III.
2
Table of Contents
TABLE OF CONTENTS
TWIN DISC, INC. - FORM 10-K
FOR THE YEAR ENDED JUNE 30, 2013
PART I. | |||
Item 1. | Business. | 4 | |
Item 1A. | Risk Factors. | 5 | |
Item 1B. | Unresolved Staff Comments. | 8 | |
Item 2. | Properties. | 8 | |
Item 3. | Legal Proceedings. | 8 | |
Item 4. | Mine Safety Disclosure. | 8 | |
Executive Officers of the Registrant. | 9 | ||
PART II. | |||
Item 5. | Market for the Registrant's Common Stock and Related Stockholder Matters. | 10 | |
Item 6. | Selected Financial Data. | 11 | |
Item 7. | Management's Discussion and Analysis of Financial Condition and Results of Operations. | 11 | |
Item 7(a). | Quantitative and Qualitative Disclosure About Market Risk. | 26 | |
Item 8. | Financial Statements and Supplementary Data. | 27 | |
Item 9. | Change In and Disagreements With Accountants on Accounting and Financial Disclosure. | 27 | |
Item 9(a). | Controls and Procedures. | 27 | |
Item 9(b). | Other Information. | 28 | |
PART III. | |||
Item 10. | Directors and Executive Officers of the Registrant. | 28 | |
Item 11. | Executive Compensation. | 29 | |
Item 12. | Security Ownership of Certain Beneficial Owners and Management. | 29 | |
Item 13. | Certain Relationships and Related Transactions, Director Independence. | 29 | |
Item 14. | Principal Accounting Fees and Services. | 29 | |
PART IV. | |||
Item 15. | Exhibits, Financial Statement Schedules. | 30 | |
Signatures. | 55 | ||
Exhibit Index. | 56 | ||
3
Table of Contents
PART I
Item 1. Business
Twin Disc was incorporated under the laws of the state of Wisconsin in 1918. Twin Disc designs, manufactures and sells marine and heavy duty off-highway power transmission equipment. Products offered include: marine transmissions, surface drives, propellers and boat management systems as well as power-shift transmissions, hydraulic torque converters, power take-offs, industrial clutches and controls systems. The Company sells its products to customers primarily in the pleasure craft, commercial and military marine markets as well as in the energy and natural resources, government and industrial markets. The Company's worldwide sales to both domestic and foreign customers are transacted through a direct sales force and a distributor network. The products described above have accounted for more than 90% of revenues in each of the last three fiscal years.
Most of the Company's products are machined from cast iron, forgings, cast aluminum and bar steel which generally are available from multiple sources and which are believed to be in adequate supply.
The Company has pursued a policy of applying for patents in both the United States and certain foreign countries on inventions made in the course of its development work for which commercial applications are considered probable. The Company regards its patents collectively as important but does not consider its business dependent upon any one of such patents.
The business is not considered to be seasonal except to the extent that employee vacations are taken mainly in the months of July and August, curtailing production during that period.
The Company's products receive direct widespread competition, including from divisions of other larger independent manufacturers. The Company also competes for business with parts manufacturing divisions of some of its major customers. The primary competitive factors for the Company's products are design, technology, performance, price, service and availability. The Company's top ten customers accounted for approximately 45% of the Company's consolidated net sales during the year ended June 30, 2013. There was one customer, Sewart Supply, Inc., an authorized distributor of the Company, that accounted for 10% or more of consolidated net sales in fiscal 2013.
Unfilled open orders for the next six months of $66,765,000 at June 30, 2013 compares to $98,746,000 at June 30, 2012. The Company saw a decline in orders by oil and gas customers for its 8500 series transmission as current demand has softened for new high-horsepower rigs due to the North American natural gas supply overhang and lower prices. Since orders are subject to cancellation and rescheduling by the customer, the six-month order backlog is considered more representative of operating conditions than total backlog. However, as procurement and manufacturing "lead times" change, the backlog will increase or decrease, and thus it does not necessarily provide a valid indicator of the shipping rate. Cancellations are generally the result of rescheduling activity and do not represent a material change in backlog.
Management recognizes that there are attendant risks that foreign governments may place restrictions on dividend payments and other movements of money, but these risks are considered minimal due to the political relations the United States maintains with the countries in which the Company operates or the relatively low investment within individual countries. No material portion of the Company's business is subject to renegotiation of profits or termination of contracts at the election of the Government.
Engineering and development costs include research and development expenses for new product development and major improvements to existing products, and other costs for ongoing efforts to refine existing products. Research and development costs charged to operations totaled $3,058,000, $2,657,000 and $2,475,000 in fiscal 2013, 2012 and 2011, respectively. Total engineering and development costs were $9,396,000, $9,508,000 and $8,776,000 in fiscal 2013, 2012 and 2011, respectively.
4
Table of Contents
Compliance with federal, state and local provisions regulating the discharge of materials into the environment, or otherwise relating to the protection of the environment, is not anticipated to have a material effect on capital expenditures, earnings or the competitive position of the Company.
The number of persons employed by the Company at June 30, 2013 was 990.
A summary of financial data by segment and geographic area for the years ended June 30, 2013, 2012 and 2011 appears in Note J to the consolidated financial statements.
The Company's internet website address is www.twindisc.com. The Company makes available free of charge (other than an investor's own internet access charges) through its website the Company's Annual Report on Form 10-K, quarterly reports on Form 10-Q and current reports on Form 8-K, and amendments to those reports, as soon as reasonably practicable after it electronically files such material with, or furnishes such material to, the United States Securities and Exchange Commission. In addition, the Company makes available, through its website, important corporate governance materials. This information is also available from the Company upon request. The Company is not including the information contained on or available through its website as a part of, or incorporating such information by reference into, this Annual Report on Form 10-K.
Item 1A. Risk Factors
The Company's business involves risk. The following information about these risks should be considered carefully together with other information contained in this report. The risks described below are not the only risks the Company faces. Additional risks not currently known, deemed immaterial or that could apply to any issuer may also result in adverse results for the Company's business.
As a global company, we are subject to currency fluctuations and any significant movement between the U.S. Dollar and the Euro, in particular, could have an adverse effect on our profitability. Although the Company's financial results are reported in U.S. Dollars, a significant portion of our sales and operating costs are realized in Euros and other foreign currencies. The Company's profitability is affected by movements of the U.S. Dollar against the Euro and the other currencies in which we generate revenues and incur expenses. Significant long-term fluctuations in relative currency values, in particular a significant change in the relative values of the U.S. Dollar or Euro, could have an adverse effect on our profitability and financial condition.
Certain of the Company's products are directly or indirectly used in oil exploration and oil drilling, and are thus dependent upon the strength of those markets and oil prices. In recent years, the Company has seen a significant growth in the sales of its products that are used in oil and energy related markets. The growth in these markets has been spurred by the rise in oil prices and the global demand for oil. In addition, there has been a substantial increase in capital investment by companies in these markets. In fiscal 2009, a significant decrease in oil prices, the demand for oil and capital investment in the oil and energy markets had an adverse effect on the sales of these products and ultimately on the Company's profitability. While this market recovered to historically high levels in fiscal 2011 and 2012, the Company has experienced a softening in demand through fiscal 2013. The cyclical nature of the global oil and gas market presents the ongoing possibility of a severe cutback in demand, which would create a significant adverse effect on the sales of these products and ultimately on the Company's profitability.
Many of the Company's product markets are cyclical in nature or are otherwise sensitive to volatile or variable factors. A downturn or weakness in overall economic activity or fluctuations in those other factors could have a material adverse effect on the Company's overall financial performance . Historically, sales of many of the products that the Company manufactures and sells have been subject to cyclical variations caused by changes in general economic conditions and other factors. In particular, the Company sells its products to customers primarily in the pleasure craft, commercial and military marine markets, as well as in the energy and natural resources,
5
Table of Contents
government and industrial markets. The demand for the products may be impacted by the strength of the economy generally, governmental spending and appropriations, including security and defense outlays, fuel prices, interest rates, as well as many other factors. Adverse economic and other conditions may cause the Company's customers to forego or otherwise postpone purchases in favor of repairing existing equipment.
In the event of an increase in the global demand for steel, the Company could be adversely affected if it experiences shortages of raw castings and forgings used in the manufacturing of its products. With the continued development of certain developing economies, in particular China and India, the global demand for steel has risen significantly in recent years. The Company selects its suppliers based on a number of criteria, and we expect that they will be able to support our growing needs. However, there can be no assurance that a significant increase in demand, capacity constraints or other issues experienced by the Company's suppliers will not result in shortages or delays in their supply of raw materials to the Company. If the Company were to experience a significant or prolonged shortage of critical components from any of its suppliers, particularly those who are sole sources, and could not procure the components from other sources, the Company would be unable to meet its production schedules for some of its key products and would miss product delivery dates which would adversely affect our sales, profitability and relationships with our customers.
If the Company were to lose business with any key customers, the Company's business would be adversely affected. Although there was only one customer, Sewart Supply, Inc., that accounted for 10% or more of consolidated net sales in fiscal 2013, deterioration of a business relationship with one or more of the Company's significant customers would cause its sales and profitability to be adversely affected.
The Company continues to face the prospect of increasing commodity costs, including steel, other raw materials and energy that could have an adverse effect on future profitability. To date, the Company has been successful with offsetting the effects of increased commodity costs through cost reduction programs and pricing actions. However, if material prices were to continue to increase at a rate that could not be recouped through product pricing, it could potentially have an adverse effect on our future profitability.
The termination of relationships with the Company's suppliers, or the inability of such suppliers to perform, could disrupt its business and have an adverse effect on its ability to manufacture and deliver products. The Company relies on raw materials, component parts, and services supplied by outside third parties. If a supplier of significant raw materials, component parts or services were to terminate its relationship with the Company, or otherwise cease supplying raw materials, component parts, or services consistent with past practice, the Company's ability to meet its obligations to its customers may be affected. Such a disruption with respect to numerous products, or with respect to a few significant products, could have an adverse effect on the Company's profitability and financial condition.
A significant design, manufacturing or supplier quality issue could result in recalls or other actions by the Company that could adversely affect profitability. As a manufacturer of highly engineered products, the performance, reliability and productivity of the Company's products is one of its competitive advantages. While the Company prides itself on putting in place procedures to ensure the quality and performance of its products and suppliers, a significant quality or product issue, whether due to design, performance, manufacturing or supplier quality issue, could lead to warranty actions, scrapping of raw materials, finished goods or returned products, the deterioration in a customer relationship, or other action that could adversely affect warranty and quality costs, future sales and profitability.
The Company faces risks associated with its international sales and operations that could adversely affect its business, results of operations or financial condition. Sales to customers outside the United States approximated 55% of our consolidated net sales for fiscal 2013. We have international manufacturing operations in Belgium, Italy, India and Switzerland. In addition, we have international distribution operations in Singapore, China, Australia, Japan, Italy, India and Canada. Our international sales and operations are subject to a number of risks, including:
6
Table of Contents
Þ | currency exchange rate fluctuations |
Þ | export and import duties, changes to import and export regulations, and restrictions on the transfer of funds |
Þ | problems with the transportation or delivery of our products |
Þ | issues arising from cultural or language differences and labor unrest |
Þ | longer payment cycles and greater difficulty in collecting accounts receivables |
Þ | compliance with trade and other laws in a variety of jurisdictions |
Þ | changes in tax law |
These factors could adversely affect our business, results of operations or financial condition.
A material disruption at the Company's manufacturing facilities in Racine, Wisconsin could adversely affect its ability to generate sales and meet customer demand. The majority of the Company's manufacturing, based on fiscal 2013's sales, came from its two facilities in Racine, Wisconsin. If operations at these facilities were to be disrupted as a result of significant equipment failures, natural disasters, power outages, fires, explosions, adverse weather conditions or other reasons, the Company's business and results of operations could be adversely affected. Interruptions in production would increase costs and reduce sales. Any interruption in production capability could require the Company to make substantial capital expenditures to remedy the situation, which could negatively affect its profitability and financial condition. The Company maintains property damage insurance which it believes to be adequate to provide for reconstruction of its facilities and equipment, as well as business interruption insurance to mitigate losses resulting from any production interruption or shutdown caused by an insured loss. However, any recovery under this insurance policy may not offset the lost sales or increased costs that may be experienced during the disruption of operations. Lost sales may not be recoverable under the policy and long-term business disruptions could result in a loss of customers. If this were to occur, future sales levels and costs of doing business, and therefore profitability, could be adversely affected.
Any failure to meet our debt obligations and satisfy financial covenants could adversely affect our business and financial condition. Beginning in 2008 and continuing into 2010, general worldwide economic conditions experienced a downturn due to the combined effects of the subprime lending crisis, general credit market crisis, collateral effects on the finance and banking industries, slower economic activity, decreased consumer confidence, reduced corporate profits and capital spending, adverse business conditions and liquidity concerns. While some recovery was seen in 2011 through 2013, these conditions made it difficult for customers, vendors and the Company to accurately forecast and plan future business activities, and caused U.S. and foreign businesses to slow spending on products, which delayed and lengthened sales cycles. These conditions led to declining revenues in several of the Company's divisions in fiscal 2009 and 2010. The Company's revolving credit facilities and senior notes agreement require it to maintain specified quarterly financial covenants such as a minimum consolidated net worth amount, a minimum EBITDA, as defined, for the most recent four fiscal quarters of $11,000,000 and a funded debt to EBITDA ratio of 3.0 or less. At June 30, 2013, the Company was in compliance with these financial covenants. Based on its annual financial plan, the Company believes that it will generate sufficient EBITDA levels throughout fiscal 2014 in order to maintain compliance with its financial covenants. However, as with all forward-looking information, there can be no assurance that the Company will achieve the planned results in future periods especially due to the significant uncertainties flowing from the current economic environment. If the Company is not able to achieve these objectives and to meet the required covenants under the agreements, the Company may require forbearance from its existing lenders in the form of waivers and/or amendments of its credit facilities or be required to arrange alternative financing. Failure to obtain relief from covenant violations or to obtain alternative financing, if necessary, would have a material adverse impact on the Company.
The Company may experience negative or unforeseen tax consequences. The Company reviews the probability of the realization of our net deferred tax assets each period based on forecasts of taxable income in both the U.S. and foreign jurisdictions. This review uses historical results, projected future operating results based upon approved
7
Table of Contents
business plans, eligible carryforward periods, tax planning opportunities and other relevant considerations. Adverse changes in the profitability and financial outlook in the U.S. or foreign jurisdictions may require the creation of a valuation allowance to reduce our net deferred tax assets. Such changes could result in material non-cash expenses in the period in which the changes are made and could have a material adverse impact on the Company's results of operations and financial condition.
Item 1B. Unresolved Staff Comments
None.
Item 2. Properties
Manufacturing Segment
The Company owns two manufacturing, assembly and office facilities in Racine, Wisconsin, U.S.A., one in Nivelles, Belgium, two in Decima, Italy and one in Novazzano, Switzerland. The aggregate floor space of these six plants approximates 767,000 square feet. One of the Racine facilities includes office space, which includes the Company's corporate headquarters. The Company leases additional manufacturing, assembly and office facilities in Italy (Limite sull'Arno) and India (outsourcing office in Chennai and manufacturing facility in Kancheepuram).
Distribution Segment
The Company also has operations in the following locations, all of which are leased and are used for sales offices, warehousing and light assembly or product service:
Jacksonville, Florida, U.S.A. | Burnaby, British Columbia, Canada |
Medley, Florida, U.S.A. | Limite sull'Arno, Italy |
Tampa, Florida, U.S.A. | Brisbane, Queensland, Australia |
Coburg, Oregon, U.S.A. | Perth, Western Australia, Australia |
Kent, Washington, U.S.A. | Singapore |
Chesapeake, Virginia, U.S.A. | Shanghai, China |
Rock Hill, South Carolina, U.S.A. | Guangzhou, China |
Edmonton, Alberta, Canada |
The Company believes its properties are well maintained and adequate for its present and anticipated needs.
Item 3. Legal Proceedings
Twin Disc is a defendant in several product liability or related claims of which the ultimate outcome and liability to the Company, if any, are not presently determinable. Management believes that the final disposition of such litigation will not have a material impact on the Company's results of operations, financial position or statement of cash flows.
Item 4. Mine Safety Disclosures
Not applicable.
8
Table of Contents
Executive Officers of the Registrant
Pursuant to General Instruction G(3) of Form 10-K, the following list is included as an unnumbered Item in Part I of this Report in lieu of being included in the Proxy Statement for the Annual Meeting of Shareholders to be held on October 18, 2013.
Name | Age | Position |
Michael E. Batten | 73 | Chairman and Chief Executive Officer |
John H. Batten | 48 | President and Chief Operating Officer |
Christopher J. Eperjesy | 45 | Vice President – Finance, Chief Financial Officer and Treasurer |
James E. Feiertag | 56 | Executive Vice President |
Dean J. Bratel | 49 | Vice President - Americas |
Denise L. Wilcox | 56 | Vice President - Human Resources |
Jeffrey S. Knutson | 48 | Corporate Controller and Secretary |
Officers are elected annually by the Board of Directors at the Board meeting held in conjunction with each Annual Meeting of the Shareholders. Each officer holds office until a successor is duly elected, or until he/she resigns or is removed from office.
Michael E. Batten, Chairman and Chief Executive Officer. Mr. Batten has been employed with the Company since 1970, and was named Chairman and Chief Executive Officer in 1991. Mr. M. Batten will step down from his position as Chief Executive Officer of the Company effective November 1, 2013, and will retire from the employment of the Company effective December 31, 2013. After that date, Mr. M. Batten will continue to serve as non-executive Chairman of the Board of Directors.
John H. Batten, President and Chief Operating Officer. Effective July 1, 2008, Mr. Batten was named President and Chief Operating Officer. Prior to this promotion, Mr. Batten served as Executive Vice President since November 2004, Vice President and General Manager – Marine and Propulsion since October 2001 and Commercial Manager – Marine and Propulsion since 1998. Mr. Batten joined Twin Disc in 1996 as an Application Engineer. Mr. Batten is the son of Mr. Michael Batten. Effective November 1, 2013, J. Batten will become President – Chief Executive Officer of the Company.
Christopher J. Eperjesy, Vice President – Finance, Chief Financial Officer and Treasurer. Mr. Eperjesy joined the Company in his current role in November 2002. Prior to joining Twin Disc, Mr. Eperjesy was Divisional Vice President – Financial Planning & Analysis for Kmart Corporation since 2001, and Senior Manager – Corporate Finance with DaimlerChrysler AG since 1999.
James E. Feiertag, Executive Vice President. Mr. Feiertag was appointed to his present position in October 2001. Prior to being promoted, he served as Vice President – Manufacturing since joining the Company in November 2000. Prior to joining Twin Disc, Mr. Feiertag was the Vice President of Manufacturing for the Drives and Systems Group of Rockwell Automation since 1999.
Dean J. Bratel, Vice President - Americas. Mr. Bratel was promoted to his current role in June 2013 after serving as Vice President – Engineering (since November 2004), Director of Corporate Engineering (since January 2003), Chief Engineer (since October 2001) and Engineering Manager (since December 1999). Mr. Bratel joined Twin Disc in 1987.
9
Table of Contents
Jeffrey S. Knutson, Corporate Controller and Secretary. Mr. Knutson was appointed Corporate Secretary in June 2013, and has been Corporate Controller since his appointment in October 2005 after joining the Company in February 2005 as Controller of North American Operations. Prior to joining Twin Disc, Mr. Knutson held Operational Controller positions with Tower Automotive (since August 2002) and Rexnord Corporation (since November 1998).
PART II
Item 5. Market for the Registrant's Common Stock and Related Stockholder Matters
The Company's common stock is traded on the NASDAQ Global Select Market under the symbol TWIN. The price information below represents the high and low sales prices from July 1, 2011 through June 30, 2013:
Fiscal Year Ended 6/30/13 | Fiscal Year Ended 6/30/12 | |||||
Quarter | High | Low | Dividend | High | Low | Dividend |
First Quarter | $22.41 | $17.88 | $0.09 | $42.82 | $25.72 | $0.08 |
Second Quarter | 18.27 | 13.70 | 0.09 | 47.39 | 23.08 | 0.08 |
Third Quarter | 27.72 | 16.92 | 0.09 | 40.51 | 26.00 | 0.09 |
Fourth Quarter | 26.02 | 20.58 | 0.09 | 26.97 | 16.55 | 0.09 |
For information regarding the Company's equity-based compensation plans, see the discussion under Item 12 of this report. As of August 16, 2013, shareholders of record numbered 617. The closing price of Twin Disc common stock as of August 16, 2013 was $26.18.
Issuer Purchases of Equity Securities
Period | (a) Total Number of Shares Purchased | (b) Average Price Paid per Share | (c) Total Number of Shares Purchased as Part of Publicly Announced Plans or Programs | (d) Maximum Number of Shares that May Yet Be Purchased Under the Plans or Programs |
March 30, 2013 – April 26, 2013 | 0 | NA | 0 | 315,000 |
April 27, 2013 – May 31, 2013 | 0 | NA | 0 | 315,000 |
June1, 2013 - June 30, 2013 | 0 | NA | 0 | 315,000 |
Total | 0 | NA | 0 | 315,000 |
On February 1, 2008, the Board of Directors authorized the purchase of up to 500,000 shares of Common Stock at market values, of which 250,000 shares were purchased during fiscal 2009 and 125,000 shares were purchased during fiscal 2012. On July 27, 2012, the Board of Directors authorized the purchase of an additional 375,000 shares of Common Stock at market values. This authorization has no expiration. During the second quarter of fiscal 2013, the Company purchased 185,000 shares under this authorization.
10
Table of Contents
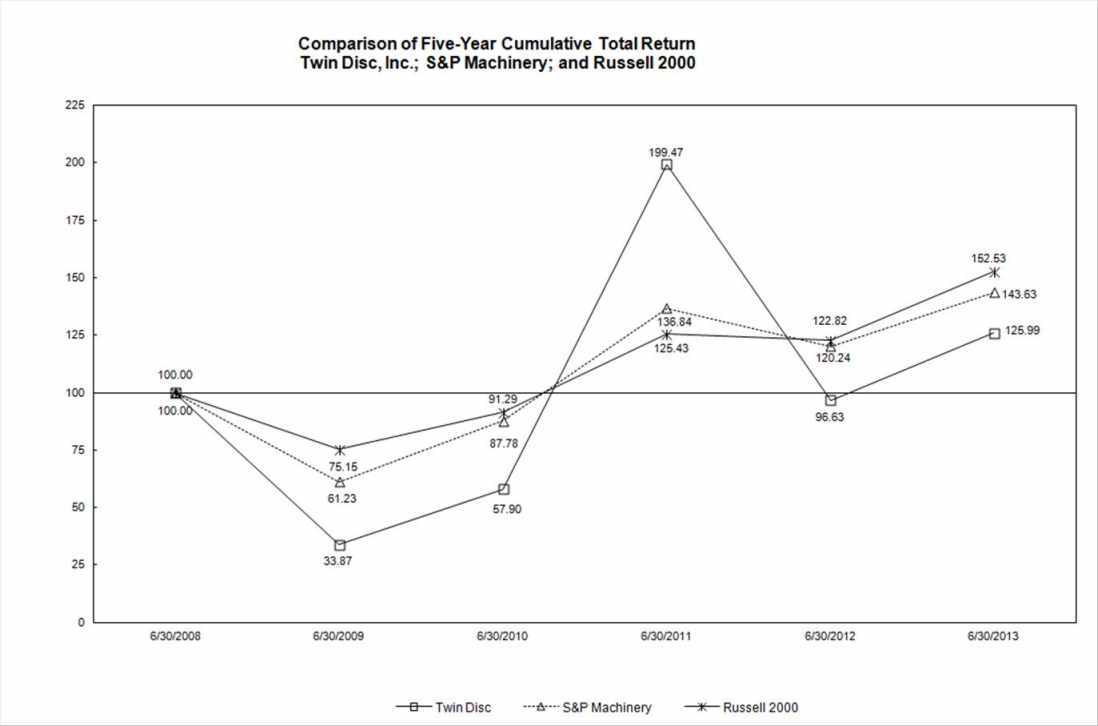
Performance Graph
The following table compares total shareholder return over the last five fiscal years to the Standard & Poor's 500 Machinery (Industrial) Index and the Russell 2000 index. The S&P 500 Machinery (Industrial) Index consists of a broad range of manufacturers. The Russell 2000 Index consists of a broad range of 2,000 companies. The Company believes, because of the similarity of its business with those companies contained in the S&P 500 Machinery (Industrial) Index, that comparison of shareholder return with this index is appropriate. Total return values for the Corporation's common stock, the S&P 500 Machinery (Industrial) Index and the Russell 2000 Index were calculated based upon an assumption of a $100 investment on June 30, 2008 and based upon cumulative total return values assuming reinvestment of dividends on a quarterly basis.
Item 6. Selected Financial Data
Financial Highlights
(in thousands, except per share amounts)
Fiscal Years Ended June 30, | |||||
Statement of Operations Data : | 2013 | 2012 | 2011 | 2010 | 2009 |
Net sales | $285,282 | $355,870 | $310,393 | $227,534 | $295,618 |
Net earnings attributable to Twin Disc | 3,882 | 26,743 | 17,997 | 597 | 11,502 |
Basic earnings per share attributable to Twin Disc common shareholders | 0.34 | 2.34 | 1.59 | 0.05 | 1.04 |
Diluted earnings per share attributable to Twin Disc common shareholders | 0.34 | 2.31 | 1.57 | 0.05 | 1.03 |
Dividends per share | 0.36 | 0.34 | 0.30 | 0.28 | 0.28 |
Balance Sheet Data (at end of period):
Total assets | $285,458 | $303,832 | $309,120 | $259,056 | $290,008 |
Total long-term debt | 23,472 | 28,401 | 25,784 | 27,211 | 46,348 |
Note: Certain amounts in the 2012 and prior have been revised. See Note A of the Notes to the consolidated financial statements for further discussion.
Item 7. Management's Discussion and Analysis of Financial Condition and Results of Operations
Note on Forward-Looking Statements
Statements in this report (including but not limited to certain statements in Items 1, 3 and 7) and in other Company communications that are not historical facts are forward-looking statements, which are based on management's current expectations. These statements involve risks and uncertainties that could cause actual results to differ materially from what appears here.
Forward-looking statements include the Company's description of plans and objectives for future operations and assumptions behind those plans. The words "anticipates," "believes," "intends," "estimates," and "expects," or similar anticipatory expressions, usually identify forward-looking statements. In addition, goals established by the Company should not be viewed as guarantees or promises of future performance. There can be no assurance the Company will be successful in achieving its goals.
In addition to the assumptions and information referred to specifically in the forward-looking statements, other factors, including, but not limited to those factors discussed under Item 1A, Risk Factors, could cause actual results to be materially different from what is presented in any forward looking statements.
Results of Operations
(In thousands)
2013 | % | 2012 | % | 2011 | % | |
Net sales | $285,282 | $355,870 | $310,393 | |||
Cost of goods sold | 205,257 | 234,238 | 202,710 | |||
Gross profit | 80,025 | 28.1 | 121,632 | 34.2 | 107,683 | 34.7 |
Marketing, engineering and administrative expenses | 67,899 | 23.8 | 73,091 | 20.5 | 72,967 | 23.5 |
Restructuring of operations | 708 | 0.2 | - | 0.0 | - | 0.0 |
Impairment charge | 1,405 | 0.5 | 3,670 | 1.0 | - | 0.0 |
Earnings from operations | $10,013 | 3.5 | $44,871 | 12.6 | $34,716 | 11.2 |
Note: Certain amounts in the fiscal 2012 and 2011 figures have been revised. See Note A of the Notes to the consolidated financial statements for further discussion.
Fiscal 2013 Compared to Fiscal 2012
11
Table of Contents
Net Sales
Net sales for fiscal 2013 decreased 19.8%, or $70.6 million, to $285.3 million from a record $355.9 million in fiscal 2012. Compared to fiscal 2012, on average, the euro and Swiss franc weakened against the U.S. dollar. The net translation effect of this on foreign operations was to decrease revenues by approximately $4.0 million versus the prior year, before eliminations. The decrease in sales continued to primarily be driven by lower demand from customers in the pressure pumping sector of the North American oil and gas market. Offsetting weakness in this market was higher demand from customers in the North American and Asian commercial marine markets. Sales to customers serving the global mega yacht market remained at historical lows, while demand remained steady for equipment used in the airport rescue and fire fighting (ARFF), and military markets. Sales to customers in China increased approximately 46% in fiscal 2013 to $29.1 million, representing 10.2% of total fiscal 2013 sales.
In fiscal 2013, sales at our manufacturing segment were down 24.5% versus the prior fiscal year. Compared to fiscal 2012, on average, the euro and Swiss franc weakened against the U.S. dollar. The net translation effect of this on foreign manufacturing operations was to decrease revenues for the manufacturing segment by approximately $2.8 million versus the prior year, before eliminations. In fiscal 2013, our U.S. manufacturing operation saw a decrease of roughly 29% in sales versus fiscal 2012. The primary driver for this decrease was the decrease in shipments of transmissions and related products for the North American oil and gas markets. This was only partially offset by an increase in commercial marine transmission shipments. The Company's Italian manufacturing operations, which have been adversely impacted by the softness in the European mega yacht and industrial markets, experienced a 12.5% decrease compared to the prior fiscal year. Approximately one-third of this decrease can be attributed to unfavorable foreign currency translation, with the majority of the remaining decrease due to continued softness and timing of shipments to the Italian mega yacht market. The Company's Belgian manufacturing operation, which also continued to be adversely impacted by the softness in the global mega yacht market, saw an approximately 15% decrease in sales versus the prior fiscal year. The Company's Swiss manufacturing operation, which supplies customized propellers for the global mega yacht and patrol boat markets, experienced an 11.1% decrease in sales.
In fiscal 2013, our distribution segment experienced a slight increase of roughly 1% in sales compared to fiscal 2012. The Company's distribution operations in Singapore continued to experience record shipments for marine transmission products for use in various commercial applications. This operation saw a 33.1% increase in sales versus the prior fiscal year. In fiscal 2013, approximately 45% of this operation's sales were to customers in China. The Company's distribution operation in the Northwest of the United States and Southwest of Canada experienced a 46% decrease in sales due to continued softness in the Canadian oil and gas market. The Company's distribution operation in Italy, which provides boat accessories and propulsion systems for the pleasure craft market, continued to experience historic lows due to continued weakness in the global pleasure craft and mega yacht markets. The Company's distribution operation in Australia, which provides boat accessories, propulsion and marine transmission systems for the pleasure craft market, saw a decrease in sales of just over 16%.
Net sales for the Company's largest product market, marine transmission and propulsion systems, were up 11.4% compared to the prior fiscal year. The majority of the growth was experienced in the first half of fiscal 2013 as the Company experienced increased demand in the global commercial marine market, which more than offset continued weakness in the global pleasure craft market. Sales of the Company's boat management systems manufactured at our Italian operation and servicing the global mega yacht market were down approximately 30% versus the prior fiscal year, as the European mega yacht market continued to experience softness in demand. In the off-highway transmission market, the year-over-year decrease of just over 50% can be attributed primarily to decreased North American sales of transmission systems for the oil and gas markets. In addition, demand for transmission systems for the military market and vehicular transmissions remained steady. The decrease experienced in the Company's industrial products of roughly 11% was due to decreased sales into the agriculture, mining and general industrial markets, primarily in the North American and Italian markets, as well as decreased activity related to oil field markets.
12
Table of Contents
Geographically, sales to the U.S. and Canada represented roughly 49% of consolidated sales for fiscal 2013 compared to 59% in fiscal 2012. This decrease was primarily driven by the softness of the North American pressure pumping market in fiscal 2013, only partially offset by growing demand in the U.S. gulf region for commercial marine transmission systems. Fiscal 2013 proved to be another milestone year for our global sales, as China became our second largest end market, after the U.S. Overall sales into the Asian Pacific market represented approximately 27% of sales in fiscal 2013, compared to just over 18% in fiscal 2012. See Note J of the Notes to the consolidated financial statements for more information on the Company's business segments and foreign operations.
The elimination for net intra-segment and inter-segment sales decreased $8.0 million, or 8.1%, from $98.7 million in fiscal 2012 to $90.7 million in fiscal 2013. Year-over-year changes in foreign exchange rates had a net unfavorable impact of $0.6 million on net intra-segment and inter-segment sales.
Gross Profit
In fiscal 2013, gross profit decreased $41.6 million, or 34.2%, to $80.0 million. Gross profit as a percentage of sales decreased 610 basis points in fiscal 2013 to 28.1%, compared to 34.2% in fiscal 2012. The table below summarizes the gross profit trend by quarter for fiscal years 2013 and 2012:
1 st Qtr | 2 nd Qtr | 3 rd Qtr | 4 th Qtr | Year | |
Gross Profit: | |||||
($ millions) | |||||
2013 | $19.4 | $22.3 | $17.7 | $20.6 | $80.0 |
2012 | $30.8 | $29.6 | $33.1 | $28.2 | $121.6 |
% of Sales: | |||||
2013 | 28.2% | 30.8% | 25.9% | 27.2% | 28.1% |
2012 | 37.8% | 35.6% | 34.6% | 29.4% | 34.2% |
There were a number of factors that impacted the Company's overall gross margin rate in fiscal 2013. Gross margin for the year was unfavorably impacted by lower volumes, unfavorable product mix, higher domestic pension expense, higher warranty expense and unfavorable manufacturing absorption. The Company estimates the net unfavorable impact of lower volumes on gross margin in fiscal 2013 was approximately $33.7 million. The unfavorable shift in product mix related to the softening experienced in the Company's oil and gas transmission business had an estimated unfavorable impact of $7.6 million. Domestic pension expense included in cost of goods sold increased from $0.2 million in fiscal 2012 to $1.3 million in fiscal 2013. In addition, warranty expense increased by $1.3 million from $3.6 million in fiscal 2012 to $4.9 in fiscal 2013 (for additional information on the Company's warranty expense, see Note F of the Notes to the consolidated financial statements).
Marketing, Engineering and Administrative (ME&A) Expenses
Marketing, engineering, and administrative (ME&A) expenses decreased by $5.2 million, or 7%, to $67.9 million in fiscal 2013. As a percentage of sales, ME&A expenses increased by 330 basis points to 23.8% in fiscal 2013, compared to 20.5% in fiscal 2012. The table below summarizes significant changes in certain ME&A expenses for the fiscal year:
Fiscal Year Ended | Increase/ | ||
$ thousands – (Income)/Expense | June 30, 2013 | June 30, 2012 | (Decrease) |
Stock-Based Compensation | $ 2,681 | $ 1,642 | $ 1,039 |
Domestic Pension Expense Incentive/Bonus Expense | 596 493 | 121 5,013 | 475 (4,520) |
(3,006) | |||
Foreign Currency Translation | (913) | ||
(3,919) | |||
All Other, Net | (1,273) | ||
$ (5,192) | |||
The year-over-year net remaining decrease in ME&A expenses of $1.3 million for the year primarily relates to efforts to control global ME&A expenses in light of the current softness in demand experienced in certain of the Company's markets.
Restructuring of Operations
During the fourth quarter of fiscal 2013, the Company recorded a pre-tax restructuring charge of $0.7 million related to a workforce reduction at its Belgian operation and the elimination of a Corporate officer position. The Belgian charge consisted of the minimum legal indemnity for 22 manufacturing employees, as negotiations with the workforce were ongoing as of June 30, 2013. Subsequently, negotiations were completed in July 2013, resulting in an additional restructuring charge of approximately $1.1 million to be recorded in the first quarter of fiscal 2014. During fiscal 2013, the Company made no cash payments, resulting in an accrual balance at June 30, 2013 of $0.7 million.
Impairment Charge
In connection with preparing its financial statements for fiscal 2013, the Company recorded an impairment charge of $1.4 million, or $0.12 per diluted share, which represents the remaining intangibles and fixed assets of its Italian distribution entity for which the Company committed to a plan to exit the distribution agreement and entered negotiations to sell the inventory back to the parent supplier. This decision triggered an impairment review of the long lived assets at this entity, resulting in the impairment charge of $1.4 million representing a complete impairment of the remaining intangibles ($1.3 million) and fixed assets ($0.1 million) for this entity. In the prior year, the Company took an impairment charge of $3.7 million, or $0.32 per diluted share, for the write-down of goodwill at an Italian manufacturing operation due to softness in the Italian mega yacht market.
Interest Expense
Interest expense of $1.4 million for the fiscal 2013 was down slightly versus fiscal 2012. Total interest on the Company's $40 million revolving credit facility ("revolver") decreased 6% to $0.4 million in fiscal 2013. The decrease can be attributed to an overall decrease in the average borrowings year-over-year and a lower interest rate on the revolver. The average borrowing on the revolver, computed monthly, decreased to $19.8 million in fiscal 2013, compared to $20.4 million in the prior fiscal year. The interest rate on the revolver decreased from a range of 1.74% to 2.09% in the prior fiscal year to a range of 1.70% to 1.84% in the current year. The interest expense on the Company's $25 million Senior Note decreased $0.2 million, or 21%, at a fixed rate of 6.05%, to $0.8 million, due to a lower remaining principal balance.
Other, Net
For the fiscal 2013 full year, Other, net declined by $0.7 million due primarily to unfavorable exchange movements related to the Euro, Canadian dollar and Swiss franc.
Income Taxes
The effective tax rate for the twelve months of fiscal 2013 was 54.0 percent, which is significantly higher than the
13
Table of Contents
prior year rate of 39.8 percent. Both years were impacted by non-deductible losses in certain foreign jurisdictions that are subject to a valuation allowance, as well as non-deductible impairment charges. Adjusting for these non-deductible items, the fiscal 2013 rate would have been 35.0 percent compared to 33.3 percent for fiscal 2012. The effective rate for the fiscal 2013 fourth quarter was 89.2 percent compared to 76.6 percent for the same period last fiscal year. Adjusting both for these non-deductible items results in rates of 30.0 percent for the fiscal 2013 fourth quarter and 37.8 percent for the fiscal 2012 fourth quarter. The fiscal 2013 fourth quarter rate was favorably impacted by a favorable change in Italian tax law of $0.4 million.
The Company maintains valuation allowances when it is more likely than not that all or a portion of a deferred tax asset will not be realized. Changes in valuation allowances from period to period are included in the tax provision in the period of change. In determining whether a valuation allowance is required, the Company takes into account such factors as prior earnings history, expected future earnings, carry-back and carry-forward periods, and tax strategies that could potentially enhance the likelihood of realization of a deferred tax asset. During fiscal 2013, the Company continued to incur operating losses in certain foreign jurisdictions where the loss carryforward period is unlimited. The Company has evaluated the realizability of the net deferred tax assets related to these jurisdictions and concluded that based primarily upon recent losses in these jurisdictions and failure to achieve targeted levels of improvement, a full valuation allowance continues to be necessary. Therefore, the company recorded a net reduction in valuation allowance of $0.1 million. Management believes that it is more likely than not that the results of future operations will generate sufficient taxable income and foreign source income to realize the remaining deferred tax assets.
Order Rates
As of June 30, 2013, the Company's backlog of orders scheduled for shipment during the next six months (six-month backlog) was $66.8 million, or approximately 32% lower than the six-month backlog of $98.7 million as of June 30, 2012. The decrease in backlog is primarily a result of decreased orders by North American oil and gas customers for the Company's 8500 series transmission as rig operators adjust to the natural gas supply overhang and lower prices.
Fiscal 2012 Compared to Fiscal 2011
Net Sales
Net sales increased $45.5 million, or 14.7%, in fiscal 2012. The year-over-year movement in foreign exchange rates resulted in a net favorable translation effect on sales of $0.4 million in fiscal 2012 compared to fiscal 2011.
In fiscal 2012, sales for our worldwide manufacturing operations, before eliminating intra-segment and inter-segment sales, were higher by $57.5 million, or 21.5%, than in the prior fiscal year. Year-over-year changes in foreign exchange rates had a net unfavorable impact on sales of $0.6 million. In fiscal 2012, our domestic manufacturing operation saw continued growth, with a 25.9% increase in sales versus fiscal 2011. The primary driver for this increase was the sale of transmissions and related products for the North American and Asian oil and gas markets as well as increased commercial marine transmission shipments. The Company's Italian manufacturing operations, which continued to be adversely impacted by the softness in the European mega yacht market in fiscal 2012, experienced a 4.1% decrease in sales compared to the prior fiscal year. The Company's Belgian manufacturing operation saw a 28.4% increase in sales versus the prior year, although it continued to be adversely impacted by the softness in the global mega yacht market. The Company's Swiss manufacturing operation, which supplies customized propellers for the global mega yacht and patrol boat markets, experienced a 10.7% decrease in sales compared to the prior fiscal year, primarily due to the impact of continued softness in the global mega yacht market as well as the timing of shipments for the patrol boat market.
Our distribution segment, buoyed by strong demand in Asia and the global oil and gas markets, experienced a slight
14
Table of Contents
increase of $0.9 million, or 0.7%, in sales in fiscal 2012 compared to fiscal 2011's record results. Compared to fiscal 2011, on average, the Asian currencies strengthened against the U.S. Dollar. The net translation effect of this on foreign distribution operations was to increase revenues for the distribution segment by approximately $1.5 million versus the prior year, before eliminations. The Company's distribution operations in Singapore continued to experience strong demand for marine transmission products for use in various commercial applications as well as growing demand in the Asia pressure pumping market. This operation saw a 3.2% increase in sales versus the same period a year ago, and set a new sales record. The Company's distribution operation in the Northwest of the United States and Southwest of Canada experienced a 1% decline from fiscal 2011's record levels, and continued to benefit from the strength in the Canadian oil and gas market through most of fiscal 2012. The Company's distribution operation in Italy, which provides boat accessories and propulsion systems for the pleasure craft market, saw an increase in sales of 41.3% after several years of decline due to continued weakness in the Italian mega yacht market. The Company's distribution operation in Australia, which provides boat accessories, propulsion and marine transmission systems for the pleasure craft market, saw an increase in sales of 6.3%, due to improving market conditions, including sales of components parts for the Company's new Express Joystick System® that were shipped in fiscal 2012. The Company's joint venture in Japan, which sells large marine transmissions for commercial applications throughout Asia, experienced a decrease of nearly 25% in sales in fiscal 2012 compared to fiscal 2011. As reported in the Company's second fiscal quarter's results, this decrease was primarily a result of the impact of the Japanese tsunami on this operation, as our joint venture partner's production facility was impacted by power shortages as well as delayed shipments from suppliers. These issues were substantially resolved in the second fiscal quarter.
Net sales for the Company's largest product market, marine transmission and propulsion systems, were up 8% compared to the prior fiscal year. The majority of the growth was experienced in the second half of fiscal 2012 as the Company experienced increased demand in the global commercial marine market, which more than offset continued weakness in the global pleasure craft market. Sales of the Company's boat management systems manufactured at our Italian operation and servicing the global mega yacht market, were down approximately 14% versus the prior fiscal year, as the European mega yacht market continued to experience softness in demand. In the off-highway transmission market, the year-over-year increase of just over 20% can be attributed primarily to increased sales of the 8500 and 7500 series transmission systems for the oil and gas markets. In addition, sales of transmission systems for the military market and vehicular transmissions were up double-digit percentages versus the prior fiscal year. The increase experienced in the Company's industrial products of roughly 34% was due to increased sales into the agriculture, mining and general industrial markets, primarily in the North American and Italian markets, as well as increased activity related to oil field markets.
Geographically, sales to the U.S. and Canada represented roughly 59% of consolidated sales for fiscal 2012 compared to 55% in fiscal 2011. This growth was primarily driven by the strength of the North American pressure pumping market through the first three fiscal quarters of fiscal 2012 as well as growing demand in the U.S. gulf region for commercial marine transmission systems in the second half of the fiscal year. Fiscal 2012 proved to be a milestone year for our global sales, as Asia became our second largest end market, surpassing Europe. In particular, the Company experienced triple-digit growth in sales to the Chinese market. See Note J for more information on the Company's business segments and foreign operations.
The elimination for net intra-segment and inter-segment sales increased $12.9 million, or 15.1%, from $85.8 million in fiscal 2011 to $98.7 million in fiscal 2012. Year-over-year changes in foreign exchange rates had a net unfavorable impact of $0.5 million on net intra-segment and inter-segment sales.
Gross Profit
In fiscal 2012, gross profit increased $13.9 million, or 13.0%, to $121.6 million. Gross profit as a percentage of sales decreased 50 basis points in fiscal 2012 to 34.2%, compared to 34.7% in fiscal 2011. The table below summarizes the gross profit trend by quarter for fiscal years 2012 and 2011:
15
Table of Contents
1 st Qtr | 2 nd Qtr | 3 rd Qtr | 4 th Qtr | Year | |
Gross Profit: | |||||
($ millions) | |||||
2012 | $30.8 | $29.6 | $33.1 | $28.2 | $121.6 |
2011 | $20.0 | $23.8 | $27.8 | $36.1 | $107.7 |
% of Sales: | |||||
2012 | 37.8% | 35.6% | 34.6% | 29.4% | 34.2% |
2011 | 32.6% | 31.6% | 36.3% | 37.1% | 34.7% |
There were a number of factors that impacted the Company's overall gross margin rate in fiscal 2012. Gross margin for the year was favorably impacted by higher volumes, favorable product mix and lower domestic pension expense, partially offset by higher material costs and surcharges, and unfavorable manufacturing absorption primarily in the fiscal fourth quarter. The Company estimates the net favorable impact of higher volumes on gross margin in fiscal 2012 was approximately $21.7 million. The favorable shift in product mix related to the Company's oil and gas transmission business had an estimated impact of $2.0 million. Domestic pension expense included in cost of goods sold decreased from $1.9 million in fiscal 2011 to $0.2 million in fiscal 2012. In addition, warranty expense as a percentage of sales decreased from 1.27% in fiscal 2011 to 1.02% in fiscal 2012 (for additional information on the Company's warranty expense, see Note F of the Notes to the Consolidated Financial Statements). The decrease in warranty expense as a percentage of sales can be attributed to an increase in volume and an overall reduction in specific warranty campaigns. In addition, the year-over-year movement in foreign exchange rates, primarily driven by movements in the Euro and Asian currencies, resulted in a net favorable translation effect on gross profit of $0.8 million in fiscal 2012 compared to fiscal 2011.
Marketing, Engineering and Administrative (ME&A) Expenses
Marketing, engineering, and administrative (ME&A) expenses remained relatively flat at $73.1 million in fiscal 2012. As a percentage of sales, ME&A expenses decreased by 300 basis points to 20.5% in fiscal 2012, compared to 23.5% in fiscal 2011. The table below summarizes significant changes in certain ME&A expenses for the fiscal year:
Fiscal Year Ended | Increase/ | ||
$ thousands – (Income)/Expense | June 30, 2012 | June 30, 2011 | (Decrease) |
Stock-Based Compensation | $ 1,642 | $ 6,148 | $ (4,506) |
Severance Domestic Pension Expense Incentive/Bonus Expense | 684 121 5,013 | - 975 4,964 | 684 (854) 49 |
(4,627) | |||
Foreign Currency Translation | 342 | ||
(4,285) | |||
All Other, Net | 4,409 | ||
$ 124 | |||
The net remaining increase in ME&A expenses for the year of $4.4 million was primarily driven by wage inflation and additional headcount, higher benefit costs, increased travel, higher project related expenses and a continued emphasis on the Company's product development program.
Impairment Charge
The Company conducted its annual assessment for goodwill impairment in the fourth quarter of fiscal 2012 by
16
Table of Contents
applying a fair value based test using discounted cash flow analyses, in accordance with ASC 350-10, "Intangibles – Goodwill and Other." The result of this assessment identified that one of the Company's reporting units goodwill was fully impaired, necessitating a charge of $3.7 million. The impairment was due to a declining outlook in the global pleasure craft/megayacht market, the continued weakened European economy and few signs of significant near-term recovery in the markets served by this reporting unit. These factors were identified as the Company conducted its annual budget review process during the fourth fiscal quarter, and the Company concluded that the impairment charge was necessary in connection with the preparation of the year end financial statements during the fourth fiscal quarter. This impairment charge was not deductible for tax purposes. The fair value of the goodwill for the remaining reporting units exceeds the respective carrying values.
Interest Expense
Interest expense decreased by $0.2 million, or 14.2%, in fiscal 2012. Total interest on the Company's $40 million revolving credit facility ("revolver") remained relatively flat at $0.4 million in fiscal 2012. The average borrowing on the revolver, computed monthly, increased to $20.4 million in fiscal 2012, compared to $9.9 million in fiscal 2011. In fiscal 2011, the interest rate on the revolver remained flat at 4.00%, the rate floor, for the first eleven months of the fiscal year. In the fourth fiscal quarter of fiscal 2011, the Company entered into an amended revolver agreement that eliminated the rate floor. As of June 30, 2012, the rate on the revolver was 1.74%. Interest expense for the Company's $25 million Senior Notes, which carry a fixed interest rate of 6.05%, decreased by $0.2 million to $1.0 million in fiscal 2012 due to a lower average outstanding balance during the fiscal year.
Other, Net
For the fiscal 2012 full year, Other, net improved by $2.3 million to a current year income due primarily to favorable exchange movements relative to the Euro, Swiss Franc, Canadian Dollar and Japanese Yen.
Income Taxes
The effective tax rate for the fourth quarter of fiscal 2012 was 76.6 percent, significantly higher than the prior year fourth quarter rate of 46.7 percent. The primary factor increasing the fiscal 2012 rate was the impact of a non-deductible impairment charge of $3.7 million, which increased the effective rate by approximately 32 percentage points. The remaining rate increase was due to a combination of reduced foreign tax credits, elimination of the R&D tax credit and additional impact of the valuation allowance related to the Company's Belgian facility. The effective tax rate for fiscal 2012 was 39.8 percent, slightly lower than the prior year rate of 43.4 percent.
The Company maintains valuation allowances when it is more likely than not that all or a portion of a deferred tax asset will not be realized. Changes in valuation allowances from period to period are included in the tax provision in the period of change. In determining whether a valuation allowance is required, the Company takes into account such factors as prior earnings history, expected future earnings, carry-back and carry-forward periods, and tax strategies that could potentially enhance the likelihood of realization of a deferred tax asset. During fiscal 2012, the Company continued to incur operating losses in certain foreign jurisdictions where the loss carryforward period is unlimited. The Company has evaluated the realizability of the net deferred tax assets related to these jurisdictions and concluded that based primarily upon continuing losses in these jurisdictions and failure to achieve targeted levels of improvement, a full valuation allowance continues to be necessary. Therefore, the Company recorded an additional valuation allowance of $1.1 million. Management believes that it is more likely than not that the results of future operations will generate sufficient taxable income and foreign source income to realize the remaining deferred tax assets.
Order Rates
17
Table of Contents
As of June 30, 2012, the Company's backlog of orders scheduled for shipment during the next six months (six-month backlog) was $98.7 million, or approximately 33% lower than the six-month backlog of $146.9 million as of June 30, 2011. The decrease in backlog is primarily a result of decreased orders by North American oil and gas customers for the Company's 8500 series transmission as rig operators adjust to the natural gas supply overhang and lower prices. In fiscal 2012, the Company began to accept orders and ship units of its new 7500 series transmission for the oil and gas market. Partially offsetting the slowdown in the North American pressure pumping market, the Company saw modest growth in the six-month backlog for commercial marine transmissions for both the U.S. Gulf Region and Asia.
Liquidity and Capital Resources
Fiscal Years 2013, 2012 and 2011
The net cash provided by operating activities in fiscal 2013 totaled $24.5 million, an increase of $10.0 million, or approximately 70%, versus fiscal 2012. The increase was driven by a decrease in working capital, primarily accounts receivable, partially offset by lower net earnings. Adjusted for the impact of foreign currency translation, net inventory decreased by $0.2 million. From the end of the fiscal third quarter, inventory decreased approximately $10 million. The majority of the net decrease in inventory came at the Company's North American manufacturing and Asian distribution operations. This decrease was driven by strong shipments to the Company's global commercial marine transmission and Asian oil and gas markets. Net inventory as a percentage of the six-month backlog increased from 104.5% as of June 30, 2012 to 153.9% as of June 30, 2013. The decrease in trade accounts receivable was a result of lower sales in the second half of fiscal 2013 compared to the same period in fiscal 2012, $144.2 million versus $191.6 million, respectively. The decrease in trade accounts payable was due to a reduction in purchasing activity related to a significant decrease in inventory in the fourth quarter of fiscal 2013 ($10.2 million).
The net cash provided by operating activities in fiscal 2012 totaled $14.4 million, an increase of $0.6 million, or 4%, versus fiscal 2011. The slight increase was driven by a 39% increase in net earnings to $26.1 million largely offset by an increase in working capital. Adjusted for the impact of foreign currency translation, net inventory increased $9.6 million. The majority of the net increase in inventory came at the Company's North American manufacturing and distribution operations. This increase was driven by strong demand for the Company's commercial marine transmissions as well as inventory to serve the Company's North American and Asian oil and gas markets. Net inventory as a percentage of the six-month backlog increased from 67.4% as of June 30, 2011 to 104.5% as of June 30, 2012. The increase in trade accounts receivable was a result of higher sales in the second half of fiscal 2012 compared to the same period in fiscal 2011, $191.6 million versus $173.9 million, respectively. The decrease in trade accounts payable was due to a reduction in purchasing activity related to significant decrease in inventory in the fourth quarter of fiscal 2012 ($14.6 million) compared to an increase in inventory in the fourth quarter of fiscal 2011 ($5.8 million).
The net cash provided by operating activities in fiscal 2011 totaled $13.9 million, a decrease of $21.3 million, or 61%, versus fiscal 2010. The net decrease was driven by a net increase in working capital, primarily due to increases in net inventories and trade accounts receivable balances, partially offset by a net increase in trade accounts payable and an increase in net earnings of $18.2 million. The majority of the net increase in inventory came at the Company's North American manufacturing and distribution operations. This increase was driven by strong demand for the Company's 8500 series transmission for the oil and gas market as well as a build-up of inventory in anticipation of the demand for the Company's new 7500 series transmission. Net inventory as a percentage of the six-month backlog decreased from 86.2% as of June 30, 2010 to 67.4% as of June 30, 2011. The increase in trade accounts receivable was a result of higher sales in the second half of fiscal 2011 compared to the same period in fiscal 2010.
The net cash used for investing activities in fiscal 2013 of $6.5 million consisted primarily of capital expenditures for
18
Table of Contents
machinery and equipment at our US, Indian and Belgian manufacturing operations. In fiscal 2013, the Company spent $6.6 million for capital expenditures, down from $13.7 million and $12.0 million in fiscal years 2012 and 2011, respectively.
The net cash used for investing activities in fiscal 2012 of $13.9 million consisted primarily of capital expenditures for machinery and equipment at our US and Belgian manufacturing operations. In fiscal 2012, the Company spent $13.7 million for capital expenditures, up from $12.0 million and $4.5 million in fiscal years 2011 and 2010, respectively.
The net cash used for investing activities in fiscal 2011 of $12.0 million consisted primarily of capital expenditures for machinery and equipment at our US and Belgian manufacturing operations. In fiscal 2011, the Company spent $12.0 million for capital expenditures, up from $4.5 million and $8.9 million in fiscal years 2010 and 2009, respectively.
In fiscal 2013, the net cash used by financing activities of $12.4 million consisted primarily of the acquisition of treasury stock of $3.1 million, under a Board-authorized stock repurchase program, dividends paid to shareholders of the Company of $4.1 million and payments of long-term debt of $4.9 million. During the second quarter of fiscal 2013, the Company purchased 185,000 shares under this authorization, at an average price of $16.59 per share for a total cost of $3.1 million. The Company has 315,000 shares remaining under its authorized stock repurchase plan.
In fiscal 2012, the net cash used by financing activities of $3.5 million consisted primarily of the acquisition of treasury stock of $2.4 million, under a Board authorized stock repurchase program, and dividends paid to shareholders of the Company of $3.9 million, partially offset by proceeds from long-term debt of $2.6 million. On February 1, 2008, the Board of Directors authorized the purchase of 500,000 shares of Common Stock at market values. In fiscal 2012, the Company purchased 125,000 shares of its outstanding common stock at an average price of $19.40 per share for a total cost of $2.4 million.
In fiscal 2011, the net cash used by financing activities of $4.2 million consisted primarily of payments on long-term debt of $1.4 million and dividends paid to shareholders of the Company of $3.4 million.
Future Liquidity and Capital Resources
The Company has a $40,000,000 revolving loan agreement with BMO Harris Bank, N.A. ("BMO"). The Company originally entered into this revolving loan agreement in December 2002 with M&I Marshall & Ilsley Bank, predecessor to BMO. At that time, the revolving loan agreement was for $20,000,000 and had an expiration date of October 31, 2005. Through a series of amendments, the last of which was agreed to during the fourth quarter of fiscal 2011, the total commitment was increased to $40,000,000 and the term was extended to May 31, 2015. This agreement contains certain covenants, including restrictions on investments, acquisitions and indebtedness. Financial covenants include a minimum consolidated adjusted net worth, minimum EBITDA for the most recent four fiscal quarters of $11,000,000 at June 30, 2013, and a maximum total funded debt to EBITDA ratio of 3.0 at June 30, 2013. As of June 30, 2013, the Company was in compliance with these financial covenants with a four quarter EBITDA total of $21,141,000 and a funded debt to EBITDA ratio of 1.28. The minimum adjusted net worth covenant fluctuates based upon actual earnings and the Company's compliance with that covenant is based on the Company's shareholders' equity as adjusted by certain pension accounting items. As of June 30, 2013 the minimum adjusted equity requirement was $119,390,000 compared to an actual result of $176,504,000 after all required adjustments. The outstanding balance of $16,300,000 and $17,550,000 at June 30, 2013 and June 30, 2012, respectively, is classified as long-term debt. In accordance with the loan agreement as amended, the Company can borrow at LIBOR plus an additional "Add-On," between 1.5% and 2.5%, depending on the Company's Total Funded Debt to EBITDA ratio. The rate was 1.84% and 1.74% at June 30, 2013 and June 30, 2012, respectively.
On April 10, 2006, the Company entered into a Note Agreement (the "Note Agreement") with The Prudential Insurance
19
Table of Contents
Company of America and certain other entities (collectively, "Purchasers"). Pursuant to the Note Agreement, Purchasers acquired, in the aggregate, $25,000,000 in 6.05% Senior Notes due April 10, 2016 (the "Notes"). The Notes mature and become due and payable in full on April 10, 2016 (the "Payment Date"). Prior to the Payment Date, the Company is obligated to make quarterly payments of interest during the term of the Notes, plus prepayments of principal of $3,571,429 on April 10 of each year from 2010 to 2015, inclusive. The outstanding balance was $10,714,286 and $14,285,714 at June 30, 2013 and June 30, 2012, respectively. Of the outstanding balance, $3,571,429 was classified as a current maturity of long-term debt at June 30, 2013 and June 30, 2012, respectively. The remaining $7,142,857 is classified as long-term debt. The Company also has the option of making additional prepayments subject to certain limitations, including the payment of a Yield-Maintenance Amount as defined in the Note Agreement. In addition, the Company will be required to make an offer to purchase the Notes upon a Change of Control, and any such offer must include the payment of a Yield-Maintenance Amount. The Note Agreement includes certain financial covenants which are identical to those associated with the revolving loan agreement discussed above. The Note Agreement also includes certain restrictive covenants that limit, among other things, the incurrence of additional indebtedness and the disposition of assets outside the ordinary course of business. The Note Agreement provides that it shall automatically include any covenants or events of default not previously included in the Note Agreement to the extent such covenants or events of default are granted to any other lender of an amount in excess of $1,000,000. Following an Event of Default, each Purchaser may accelerate all amounts outstanding under the Notes held by such party. As of June 30, 2013, the Company was in compliance with these financial covenants.
On November 19, 2012, the Company and its wholly-owned subsidiary Twin Disc International, S.A. entered into a multi-currency revolving Credit Agreement with Wells Fargo Bank, National Association. Pursuant to the Credit Agreement, the Company may, from time to time, enter into revolving credit loans in amounts not to exceed, in the aggregate, Wells Fargo's revolving credit commitment of $15,000,000. In general, outstanding revolving credit loans (other than foreign currency loans) will bear interest at one of the following rates, as selected by the Company: (1) a "Base Rate," which is equal to the highest of (i) the prime rate; (ii) the federal funds rate plus 0.50%; or (iii) LIBOR plus 1.00%; or (2) a "LIBOR Rate" (which is equal to LIBOR divided by the difference between 1.00 and the Eurodollar Reserve Percentage (as defined in the Credit Agreement)) plus 1.50%. Outstanding revolving credit loans that are foreign currency loans will bear interest at the LIBOR Rate plus 1.50%, plus an additional "Mandatory Cost," which is designed to compensate Wells Fargo for the cost of compliance with the requirements of the Bank of England and/or the Financial Services Authority, or the requirements of the European Central Bank. In addition to principal and interest payments, the Borrowers will be responsible for paying monthly commitment fees equal to .25% of the unused revolving credit commitment. The Company has the option of making additional prepayments subject to certain limitations. The Credit Agreement includes financial covenants regarding minimum net worth, minimum EBITDA for the most recent four fiscal quarters of $11,000,000, and a maximum total funded debt to EBITDA ratio of 3.0:1. The Credit Agreement also includes certain restrictive covenants that limit, among other things, certain investments, acquisitions and indebtedness. The Credit Agreement provides that it shall automatically include any covenants or events of default not previously included in the Credit Agreement to the extent such covenants or events of default are granted to any other lender of an amount in excess of $1,000,000. The Credit Agreement also includes customary events of default, including events of default under the BMO agreement or the Prudential Note Agreement. Following an event of default, Wells Fargo may accelerate all amounts outstanding under any revolving credit notes or the Credit Agreement. The Credit Agreement is scheduled to expire on May 31, 2015. As of June 30, 2013, there were no borrowings under the Credit Agreement. As of June 30, 2013, the Company was in compliance with these financial covenants.
Four quarter EBITDA, total funded debt, and adjusted net worth are non-GAAP measures, and are included herein for the purpose of disclosing the status of the Company's compliance with the four quarter EBITDA, total funded debt to four quarter EBITDA ratio, and adjusted net worth covenants described above. In accordance with the Company's revolving loan agreements and the Note Agreement:
· | "Four quarter EBITDA" is defined as "the sum of (i) Net Income plus, to the extent deducted in the calculation of Net Income, (ii) interest expense, (iii) depreciation and amortization expense, and (iv) income tax expense;" and |
20
Table of Contents
|
· | "Total funded debt" is defined as "(i) all Indebtedness for borrowed money (including without limitation, Indebtedness evidenced by promissory notes, bonds, debentures and similar interest-bearing instruments), plus (ii) all purchase money Indebtedness, plus (iii) the principal portion of capital lease obligations, plus (iv) the maximum amount which is available to be drawn under letters of credit then outstanding, all as determined for the Company and its consolidated Subsidiaries as of the date of determination, without duplication, and in accordance with generally accepted accounting principles applied on a consistent basis." |
· | "Total funded debt to four quarter EBITDA" is defined as the ratio of total funded debt to four quarter EBITDA calculated in accordance with the above definitions. |
· | "Adjusted net worth" means the Company's reported shareholder equity, excluding adjustments that result from (i) changes to the assumptions used by the Company in determining its pension liabilities or (ii) changes in the market value of plan assets up to an aggregate amount of adjustments equal to $34,000,000 ("Permitted Benefit Plan Adjustments") for purposes of computing net worth at any time. |
The Company's total funded debt as of June 30, 2013 and June 30, 2012 was equal to the total debt reported on the Company's June 30, 2013 and June 30, 2012 Consolidated Balance Sheet, and therefore no reconciliation is included herein. The following table sets forth the reconciliation of the Company's reported Net Earnings to the calculation of four quarter EBITDA for the four quarters ended June 30, 2013:
Four Quarter EBITDA Reconciliation | |
Net Earnings Attributable to Twin Disc | $ 3,882,000 |
Depreciation & Amortization | 10,838,000 |
Interest Expense | 1,435,000 |
Income Taxes | 4,986,000 |
Four Quarter EBITDA | $ 21,141,000 |
Total Funded Debt to Four Quarter EBITDA | |
Total Funded Debt | $ 27,153,000 |
Divided by: Four Quarter EBITDA | 21,141,000 |
Total Funded Debt to Four Quarter EBITDA | 1.28 |
The following table sets forth the reconciliation of the Company's reported shareholders' equity to the calculation of adjusted net worth for the quarter ended June 30, 2013:
Total Twin Disc Shareholders' Equity | $142,504,000 |
Permitted Benefit Plan Adjustments | 34,000,000 |
Adjusted Net Worth | $176,504,000 |
As of June 30, 2013, the Company was in compliance with all of the covenants described above. As of June 30, 2013, the Company's backlog of orders scheduled for shipment during the next six months (six-month backlog) was $66.8 million, or approximately 32% lower than the six-month backlog of $98.7 million as of June 30, 2012. In spite of the decrease in order backlog driven primarily by the decline in the North American oil and gas market, as rig operators adjust to the natural gas supply overhang and lower prices, the Company does not expect to violate any of its financial covenants in fiscal 2014. The current margin surrounding ongoing compliance with the above covenants, in particular, minimum EBITDA for the most recent four fiscal quarters and total funded debt to EBITDA, are not expected to decrease significantly in fiscal 2014. Based on its annual financial plan, the Company believes it is well positioned to generate sufficient EBITDA levels throughout fiscal 2014 in order to maintain compliance with the above covenants. However, as with all forward-looking information, there can be no assurance that the Company will achieve the planned results in future periods due to the uncertainties in certain of its markets.
21
Table of Contents
Please see the factors discussed under Item 1A, Risk Factors, of this Form 10-K for further discussion of this topic.
The Company's balance sheet remains very strong, there are no off-balance-sheet arrangements other than the operating leases listed below, and we continue to have sufficient liquidity for near-term needs. The Company had $23.7 million of available borrowings on our $40 million revolving loan agreement as of June 30, 2013 as well as $15 million available under its multi-currency revolver agreement with Wells Fargo Bank. The Company expects to continue to generate enough cash from operations to meet our operating and investing needs. As of June 30, 2013, the Company also had cash of $20.7 million, primarily at its overseas operations. These funds, with some restrictions and tax implications, are available for repatriation as deemed necessary by the Company. In fiscal 2014, the Company expects to contribute $2.6 million to its defined benefit pension plans, the minimum contributions required. However, if the Company elects to make voluntary contributions in fiscal 2014, it intends to do so using cash from operations and, if necessary, from available borrowings under existing credit facilities.
Net working capital decreased $5.6 million, or approximately 4.3%, in fiscal 2013, and the current ratio increased from 2.9 at June 30, 2012 to 3.0 at June 30, 2013. The decrease in net working capital was primarily driven by a decrease in accounts receivable as a result of a significant decrease in sales in fiscal 2013, partially offset by a decrease in trade accounts payable due to the significant reduction in inventory in the fourth fiscal quarter of 2013.
Twin Disc expects capital expenditures to be approximately $15 million in fiscal 2014. These anticipated expenditures reflect the Company's plans to continue investing in modern equipment and facilities, its global sourcing program and new products as well as expanding capacity at facilities around the world.
Management believes that available cash, the credit facility, cash generated from future operations, existing lines of credit and potential access to debt markets will be adequate to fund Twin Disc's capital requirements for the foreseeable future.
Off Balance Sheet Arrangements and Contractual Obligations
The Company had no off-balance sheet arrangements, other than operating leases, as of June 30, 2013 and 2012.
The Company has obligations under non-cancelable operating lease contracts and loan and senior note agreements for certain future payments. A summary of those commitments follows (in thousands):
Contractual Obligations |
Total |
Less than 1 Year |
1-3 Years |
3-5 Years |
After 5 Years |
Revolving loan borrowing |
$16,300 |
$ - |
$ 16,300 |
$ - |
$ - |
Long-term debt |
$10,853 |
$ 3,681 |
$ 7,145 |
$ - |
$ 27 |
Operating leases |
$ 8,409 |
$ 3,079 |
$ 3,293 |
$ 2,021 |
$ 16 |
The table above does not include accrued interest of approximately $179,000 related to the revolving loan borrowing. The table above also does not include tax liabilities for unrecognized tax benefits totaling $1,556,000, excluding related interest and penalties, as the timing of their resolution cannot be estimated. See Note N of the Notes to the consolidated financial statements for disclosures surrounding uncertain income tax positions.
22
Table of Contents
Other Matters
Critical Accounting Policies
The preparation of this Annual Report requires management's judgment to make estimates and assumptions that affect the reported amounts of assets and liabilities, disclosure of contingent assets and liabilities at the dates of the financial statements, and the reported amounts of revenues and expenses during the reporting period. There can be no assurance that actual results will not differ from those estimates.
The Company's significant accounting policies are described in Note A to the consolidated financial statements. Not all of these significant accounting policies require management to make difficult, subjective, or complex judgments or estimates. However, the policies management considers most critical to understanding and evaluating our reported financial results are the following:
Accounts Receivable
Twin Disc performs ongoing credit evaluations of our customers and adjusts credit limits based on payment history and the customer's credit-worthiness as determined by review of current credit information. We continuously monitor collections and payments from our customers and maintain a provision for estimated credit losses based upon our historical experience and any specific customer-collection issues. In addition, senior management reviews the accounts receivable aging on a monthly basis to determine if any receivable balances may be uncollectible. Although our accounts receivable are dispersed among a large customer base, a significant change in the liquidity or financial position of any one of our largest customers could have a material adverse impact on the collectibility of our accounts receivable and future operating results.
Inventory
Inventories are valued at the lower of cost or market. Cost has been determined by the last-in, first-out (LIFO) method for the majority of the inventories located in the United States, and by the first-in, first-out (FIFO) method for all other inventories. Management specifically identifies obsolete products and analyzes historical usage, forecasted production based on future orders, demand forecasts, and economic trends when evaluating the adequacy of the reserve for excess and obsolete inventory. The adjustments to the reserve are estimates that could vary significantly, either favorably or unfavorably, from the actual requirements if future economic conditions, customer demand or competitive conditions differ from expectations.
Goodwill
In conformity with U.S. GAAP, goodwill is tested for impairment annually or more frequently if events or changes in circumstances indicate that an impairment might exist. The Company performs impairment reviews for its four reporting units using a fair-value method based on management's judgments and assumptions or third party valuations. The Company is subject to financial statement risk to the extent the carrying amount of a reporting unit exceeds its fair value. Based upon the goodwill impairment review completed at the end of fiscal 2013, it was determined that the fair value for each of the reporting units significantly exceeded the carrying value and therefore goodwill was not impaired.
In determining the fair value of our reporting units, management is required to make estimates of future operating
23
Table of Contents
results, including growth rates, and a weighted-average cost of capital that reflects current market conditions, among others. Our development of future operating results incorporates management's best estimates of current and future economic and market conditions which are derived from a review of past results, current results and approved business plans. Many of the factors used in assessing fair value are outside the control of management, and these assumptions and estimates can change in future periods. While the Company believes its judgments and assumptions were reasonable, different assumptions, economic factors and/or market indicators could materially change the estimated fair values of the Company's reporting units and, therefore, impairment charges could be required in the future.
The following are key assumptions to our discounted cash flow model:
Business Projections – We make assumptions about the level of sales for each fiscal year including expected growth, if any. This assumption drives our planning for volumes, mix, and pricing. We also make assumptions about our cost levels (e.g., capacity utilization, cost performance, etc.). These assumptions are key inputs for developing our cash flow projections. These projections are derived using our internal business plans that are reviewed annually during the annual budget process.
Discount Rates – When measuring a possible impairment, future cash flows are discounted at a rate that is consistent with a weighted average cost of capital for a potential market participant. The weighted average cost of capital is an estimate of the overall after-tax rate of return required by equity and debt holders of a business enterprise. There are a number of assumptions that management makes when calculating the appropriate discount rate, including the targeted leverage ratio.
Long Lived Assets
The Company reviews long-lived assets for impairment whenever events or changes in business circumstances indicate that the carrying amount of the assets may not be fully recoverable. For property, plant and equipment and other long-lived assets, excluding indefinite-lived intangible assets, the Company performs undiscounted operating cash flow analyses to determine if an impairment exists. If an impairment is determined to exist, any related impairment loss is calculated based on fair value. Fair value is primarily determined using discounted cash flow analyses; however, other methods may be used to substantiate the discounted cash flow analyses, including third party valuations when necessary. Refer to Note G of the Notes to the consolidated financial statements for discussion of the impairment recorded in fiscal 2013.
Warranty
Twin Disc engages in extensive product quality programs and processes, including actively monitoring and evaluating the quality of its suppliers. However, its warranty obligation is affected by product failure rates, the extent of the market affected by the failure and the expense involved in satisfactorily addressing the situation. The warranty reserve is established based on our best estimate of the amounts necessary to settle future and existing claims on products sold as of the balance sheet date. When evaluating the adequacy of the reserve for warranty costs, management takes into consideration the term of the warranty coverage, historical claim rates and costs of repair, knowledge of the type and volume of new products and economic trends. While we believe the warranty reserve is adequate and that the judgment applied is appropriate, such amounts estimated to be due and payable in the future could differ materially from what actually transpires.
Pension and Other Postretirement Benefit Plans
The Company provides a wide range of benefits to employees and retired employees, including pensions and postretirement health care coverage. Plan assets and obligations are recorded annually based on the Company's
24
Table of Contents
measurement date utilizing various actuarial assumptions such as discount rates, expected return on plan assets, compensation increases, retirement and mortality tables, and health care cost trend rates as of that date. The approach used to determine the annual assumptions are as follows:
· | Discount Rate – based on the Aon Hewitt AA Above Median Curve at June 30, 2013 as applied to the expected payouts from the pension plans. This yield curve is made up of Corporate Bonds rated AA or better. |
· | Expected Return on Plan Assets – based on the expected long-term average rate of return on assets in the pension funds, which is reflective of the current and projected asset mix of the funds and considers historical returns earned on the funds. |
· | Compensation Increase – reflect the long-term actual experience, the near-term outlook and assumed inflation. |
· | Retirement and Mortality Rates – based upon the IRS Generational Mortality Table for Annuitants and Non-Annuitants for fiscal 2011, 2012 and 2013. |
· | Health Care Cost Trend Rates – developed based upon historical cost data, near-term outlook and an assessment of likely long-term trends. |
Measurements of net periodic benefit cost are based on the assumptions used for the previous year-end measurements of assets and obligations. The Company reviews its actuarial assumptions on an annual basis and makes modifications to the assumptions when appropriate. As required by U.S. GAAP, the effects of the modifications are recorded currently or amortized over future periods. Based on information provided by its independent actuaries and other relevant sources, the Company believes that the assumptions used are reasonable; however, changes in these assumptions could impact the Company's financial position, results of operations or cash flows.
Income Taxes
The Company accounts for income taxes in accordance with ASC Topic 740, "Income Taxes." Deferred tax assets and liabilities are recognized for the future tax consequences attributable to differences between financial statement carrying amounts of existing assets and liabilities and their respective tax bases and operating loss and tax credit carryforwards. Deferred tax assets and liabilities are measured using enacted tax rates expected to apply to taxable income in the years in which those temporary differences are expected to be recovered or settled. The Company maintains valuation allowances when it is more likely than not that all or a portion of a deferred tax asset will not be realized. In determining whether a valuation allowance is required, the Company takes into account such factors as prior earnings history, expected future earnings, carry-back and carry-forward periods, and tax strategies that could potentially enhance the likelihood of realization of a deferred tax asset. During fiscal 2013, the Company concluded that it was more likely than not that certain net deferred tax assets in foreign jurisdictions would not be realized, resulting in the recording of a valuation allowance totaling $3,724,000.
Recently Issued Accounting Standards
In July 2013, the Financial Accounting Standards Board ("FASB") issued guidance designed to clarify the financial statement presentation requirements of an unrecognized tax benefit when a net operating loss carryforward, a similar tax loss, or a tax credit carryforward exists. This guidance is effective for reporting periods beginning after December 15, 2013 (the Company's third quarter of fiscal 2014), and is not expected to have a material impact on the Company's financial statements.
In February 2013, the FASB issued guidance designed to improve the transparency in reporting amounts that are reclassified out of accumulated other comprehensive income into net income. This new guidance will require presentation of the effects on the line items of net income of significant amounts reclassified out of accumulated other comprehensive income and a cross-reference to other disclosure currently required for the reclassification items. The amended guidance is effective for reporting periods beginning after December 15, 2012 (the Company's third quarter of fiscal 2013). See Note M of the Notes to the consolidated financial statements for the additional disclosures required by this new guidance.
25
Table of Contents
In July 2012, the FASB issued amended guidance that simplifies how entities test indefinite-lived intangible assets other than goodwill for impairment. After an assessment of certain qualitative factors, if it is determined to be more likely than not that an indefinite-lived asset is impaired, entities must perform the quantitative impairment test. Otherwise, the quantitative test is optional. The amended guidance is effective for annual and interim impairment tests performed for fiscal years beginning after September 15, 2012 (the Company's fiscal 2014), with early adoption permitted. The adoption of this guidance is not expected to have a material impact on the Company's financial results.
In September 2011, the FASB issued a standards update that is intended to simplify how entities test goodwill for impairment. This update permits an entity to first assess qualitative factors to determine whether it is "more likely than not" that the fair value of a reporting unit is less than its carrying amount as a basis for determining whether it is necessary to perform the two-step goodwill impairment test described in Topic 350 "Intangibles-Goodwill and Other." This update is effective for annual and interim goodwill impairment tests performed for fiscal years beginning after December 15, 2011 (the Company's fiscal 2013). This standards update did not have a material impact on the Company's financial statements.
Item 7(a). Quantit ative and Qualitative Disclosure About Market Risk
The Company is exposed to market risks from changes in interest rates, commodities and foreign currency exchange rates. To reduce such risks, the Company selectively uses financial instruments and other proactive management techniques. All hedging transactions are authorized and executed pursuant to clearly defined policies and procedures, which prohibit the use of financial instruments for trading or speculative purposes. Discussion of the Company's accounting policies and further disclosure relating to financial instruments is included in Note A to the consolidated financial statements.
Interest rate risk - The Company's earnings exposure related to adverse movements of interest rates is primarily derived from outstanding floating rate debt instruments that are indexed to the LIBOR interest rate. The Company currently has a $40 million revolving loan agreement, which is due to expire on May 31, 2015. In accordance with the loan agreement as amended, the Company borrows at LIBOR plus an additional "Add-On," between 1.5% and 2.5%, depending on the Company's Total Funded Debt to EBITDA ratio . Due to the relative stability of interest rates, the Company did not utilize any financial instruments at June 30, 2013 to manage interest rate risk exposure. A 10 percent increase or decrease in the applicable interest rate would result in a change in pretax interest expense of approximately $30,000.
Commodity price risk - The Company is exposed to fluctuation in market prices for such commodities as steel and aluminum. The Company does not utilize commodity price hedges to manage commodity price risk exposure. Direct material cost as a percent of total cost of goods sold was 55.6% for fiscal 2013.
Currency risk - The Company has exposure to foreign currency exchange fluctuations. Approximately twenty two percent of the Company's revenues in the year ended June 30, 2013 were denominated in currencies other than the U.S. Dollar. Of that total, approximately seventy percent was denominated in Euros with the balance comprised of Japanese Yen, Indian Rupee, Swiss Franc and the Australian and Singapore Dollars. The Company does not hedge the translation exposure represented by the net assets of its foreign subsidiaries. Foreign currency translation adjustments are recorded as a component of shareholders' equity. Forward foreign exchange contracts are used to hedge the currency fluctuations on significant transactions denominated in foreign currencies.
Derivative financial instruments - The Company has written policies and procedures that place all financial instruments under the direction of the Company corporate treasury department and restrict derivative transactions to
26
Table of Contents
those intended for hedging purposes. The use of financial instruments for trading purposes is prohibited. The Company uses financial instruments to manage the market risk from changes in foreign exchange rates.
Periodically, the Company enters into forward exchange contracts to reduce the earnings and cash flow impact of non-functional currency denominated receivables and payables. These contracts are highly effective in hedging the cash flows attributable to changes in currency exchange rates. Gains and losses resulting from these contracts offset the foreign exchange gains or losses on the underlying assets and liabilities being hedged. The maturities of the forward exchange contracts generally coincide with the settlement dates of the related transactions. Gains and losses on these contracts are recorded in Other Income (Expense), net in the Consolidated Statement of Operations and Comprehensive Income as the changes in the fair value of the contracts are recognized and generally offset the gains and losses on the hedged items in the same period. The primary currency to which the Company was exposed in fiscal 2013 and 2012 was the Euro. At June 30, 2013 and 2012, the Company had no outstanding forward exchange contracts.
Item 8. Financial Statements and Supplementary Data
See Consolidated Financial Statements and Financial Statement Schedule.
Sales and Earnings by Quarter - Unaudited (in thousands, except per share amounts)
The data in the following table reflects the impact of the revision recorded in the second quarter of fiscal 2013 associated with errors identified related to the reserve for uncertain tax positions. See Note A of the Notes to the consolidated financial statements for additional discussion of this revision.
2013 | 1st Qtr. | 2nd Qtr. | 3rd Qtr. | 4th Qtr. | Year |
Net sales | $68,793 | $72,325 | $68,232 | $75,932 | $285,282 |
Gross profit | 19,416 | 22,311 | 17,674 | 20,624 | 80,025 |
Net earnings (loss) attributable | |||||
to Twin Disc – as reported | 1,251 | 3,360 | (757) | 48 | 3,902 |
Revision | (20 ) | - | - | - | (20) |
Net earnings (loss) attributable | |||||
to Twin Disc – as revised | 1,231 | 3,360 | (757) | 48 | 3,882 |
Basic earnings (loss) per share | |||||
attributable to Twin Disc | |||||
common shareholders – as reported | 0.11 | 0.30 | (0.07) | 0.00 | 0.34 |
Revision | - | - | - | - | - |
Basic earnings (loss) per share | |||||
attributable to Twin Disc | |||||
common shareholders – as revised | 0.11 | 0.30 | (0.07) | 0.00 | 0.34 |
Diluted earnings (loss) per share | |||||
attributable to Twin Disc | |||||
common shareholders – as reported | 0.11 | 0.29 | (0.07) | 0.00 | 0.34 |
Revision | - | - | - | - | - |
Diluted earnings (loss) per share | |||||
attributable to Twin Disc | |||||
common shareholders – as revised | 0.11 | 0.29 | (0.07) | 0.00 | 0.34 |
Dividends per share | 0.09 | 0.09 | 0.09 | 0.09 | 0.36 |
2012 | 1st Qtr. | 2nd Qtr. | 3rd Qtr. | 4th Qtr. | Year |
Net sales | $81,330 | $82,941 | $95,490 | $96,109 | $355,870 |
Gross profit | 30,768 | 29,562 | 33,056 | 28,246 | 121,632 |
Net earnings attributable | |||||
to Twin Disc – as reported | 9,581 | 5,857 | 9,393 | 1,281 | 26,112 |
Revision | 75 | (17 ) | 591 | (18) | 631 |
Net earnings attributable | |||||
to Twin Disc – as revised | 9,656 | 5,840 | 9,984 | 1,263 | 26,743 |
Basic earnings per share | |||||
attributable to Twin Disc | |||||
common shareholders – as reported | 0.84 | 0.51 | 0.82 | 0.11 | 2.29 |
Revision | 0.01 | - | 0.05 | - | 0.05 |
Basic earnings per share | |||||
attributable to Twin Disc | |||||
common shareholders – as revised | 0.85 | 0.51 | 0.87 | 0.11 | 2.34 |
Diluted earnings per share | |||||
attributable to Twin Disc | |||||
common shareholders – as reported | 0.83 | 0.51 | 0.81 | 0.11 | 2.26 |
Revision | 0.01 | (0.01) | 0.05 | - | 0.05 |
Diluted earnings per share | |||||
attributable to Twin Disc | |||||
common shareholders – as revised | 0.84 | 0.50 | 0.86 | 0.11 | 2.31 |
Dividends per share | 0.08 | 0.08 | 0.09 | 0.09 | 0.34 |
Item 9. Change in and Disagreements with Accountants on Accounting and Financial Disclosure
None.
Item 9(a). Controls and Procedures
Conclusion Regarding Disclosure Controls and Procedures
As required by Rules 13a-15 and 15d-15 of the Securities Exchange Act of 1934, as of the end of the period covered by this report and under the supervision and with the participation of management, including the Chief Executive Officer and the Chief Financial Officer, the Company has evaluated the effectiveness of the design and operation of its disclosure controls and procedures. Based on such evaluation, the Chief Executive Officer and Chief Financial Officer have concluded that such disclosure controls and procedures are effective to provide reasonable assurance that information required to be disclosed by the Company in the reports it files or submits under the Exchange Act is recorded, processed, summarized and reported within the time periods specified in the Securities and Exchange Commission rules and forms, and to provide reasonable assurance that information required to be disclosed by the Company in the reports it files or submits under the Exchange Act is accumulated and communicated to the Company's management, including its principal executive and principal financial officers, as appropriate, to allow timely decisions regarding disclosure.
Management's Report on Internal Control Over Financial Reporting
Management of the Company is responsible for establishing and maintaining adequate internal control over financial reporting. The Company's internal control over financial reporting is designed to provide reasonable assurance regarding the reliability of financial reporting and the preparation of financial statements for external purposes in accordance with generally accepted accounting principles. The Company's internal control over financial reporting includes those policies and procedures that:
27
Table of Contents
pertain to the maintenance of records that, in reasonable detail, accurately and fairly reflect the transactions and dispositions of the Company,
1. | provide reasonable assurance that transactions are recorded as necessary to permit preparation of financial statements in accordance with generally accepted accounting principles, and that receipts and expenditures of the Company are being made only in accordance with authorizations of management and directors of the Company, and |
2. | provide reasonable assurance regarding prevention or timely detection of unauthorized acquisition, use or disposition of the Company's assets that could have a material effect on financial statements. |
Because of its inherent limitations, internal control over financial reporting may not prevent or detect misstatements. Also, projections of any evaluation of the effectiveness to future periods are subject to the risk that controls may become inadequate because of changes in conditions, or that the degree of compliance with the policies and procedures included in such controls may deteriorate.
The Company conducted an evaluation of the effectiveness of our internal control over financial reporting based upon the framework in Internal Control – Integrated Framework issued by the Committee of Sponsoring Organizations of the Treadway Commission (COSO). Based upon such evaluation, our management concluded that our internal control over financial reporting was effective as of June 30, 2013.
PricewaterhouseCoopers LLP, an independent registered public accounting firm, has audited the Company's internal control over financial reporting as of June 30, 2013, as stated in their report which appears herein.
Changes in Internal Control Over Financial Reporting
During the fourth quarter of fiscal 2013, there have not been any changes in the Company's internal control over financial reporting that have materially affected, or are reasonably likely to materially affect, the Company's internal control over financial reporting.
Item 9(b). Other Information
Not applicable.
PART III
Item 10. Directors and Executive Officers of the Registrant
For information with respect to the executive officers of the Registrant, see "Executive Officers of the Registrant" at the end of Part I of this report.
For information with respect to the Directors of the Registrant, see "Election of Directors" in the Proxy Statement for the Annual Meeting of Shareholders to be held October 18, 2013, which is incorporated into this report by reference.
For information with respect to compliance with Section 16(a) of the Securities Exchange Act of 1934, see "Section 16(a) Beneficial Ownership Reporting Compliance" in the Proxy Statement for the Annual Meeting of Shareholders to be held October 18, 2013, which is incorporated into this report by reference.
For information with respect to the Company's Code of Ethics, see "Guidelines for Business Conduct and Ethics" in the Proxy Statement for the Annual Meeting of Shareholders to be held October 18, 2013, which is incorporated into this report by reference. The Company's Code of Ethics, entitled, "Guidelines for Business Conduct and Ethics," is included on the Company's website, www.twindisc.com. If the Company makes any substantive amendment to the Code of Ethics, or grants a waiver from a provision of the Code of Ethics for its Chief Executive Officer, Chief
28
Table of Contents
Financial Officer, Chief Accounting Officer or Controller (or any person performing similar functions), it intends to disclose the nature of such amendment on its website within four business days of the amendment or waiver in lieu of filing a Form 8-K with the SEC.
For information with respect to procedures by which shareholders may recommend nominees to the Company's Board of Directors, see "Director Committee Functions: Nominating and Governance Committee" in the Proxy Statement for the Annual Meeting of Shareholders to be held October 18, 2013, which is incorporated into this report by reference. There were no changes to these procedures since the Company's last disclosure relating to these procedures.
For information with respect to the Audit Committee Financial Expert, see "Director Committee Functions: Audit Committee" in the Proxy Statement for the Annual Meeting of Shareholders to be held October 18, 2013, which is incorporated into this report by reference.
For information with respect to the Audit Committee Disclosure, see "Director Committee Functions: Audit Committee" in the Proxy Statement for the Annual Meeting of Shareholders to be held October 18, 2013, which is incorporated into this report by reference.
For information with respect to the Audit Committee Membership, see "Director Committee Functions: Committee Membership" in the Proxy Statement for the Annual Meeting of Shareholders to be held October 18, 2013, which is incorporated into this report by reference.
Item 11. Executive Compensation
The information set forth under the captions "Executive Compensation," "Director Compensation," "Compensation Committee Interlocks and Insider Participation," and "Compensation Committee Report," in the Proxy Statement for the Annual Meeting of Shareholders to be held on October 18, 2013, is incorporated into this report by reference. Discussion in the Proxy Statement under the captions "Compensation Committee Report" is incorporated by reference but shall not be deemed "soliciting material" or to be "filed" as part of this report.
Item 12. Security Ownership of Certain Beneficial Owners and Management
Security ownership of certain beneficial owners and management is set forth in the Proxy Statement for the Annual Meeting of Shareholders to be held on October 18, 2013 under the captions "Principal Shareholders" and "Directors and Executive Officers" and incorporated into this report by reference.
For information regarding securities authorized for issuance under equity compensation plans of the Company, see "Equity Compensation Plan Information" in the Proxy Statement for the Annual Meeting of Shareholders to be held on October 18, 2013, which incorporated into this report by reference.
There are no arrangements known to the Registrant, the operation of which may at a subsequent date result in a change in control of the Registrant.
Item 13. Certain Relationships and Related Transactions, Director Independence
For information with respect to transactions with related persons and policies for the review, approval or ratification of such transactions, see "Corporate Governance – Review, Approval or Ratification of Transactions with Related Persons" in the Proxy Statement for the Annual Meeting of Shareholders to be held October 18, 2013, which is incorporated into this report by reference.
For information with respect to director independence, see "Corporate Governance – Board Independence" in the Proxy Statement for the Annual Meeting of Shareholders to be held October 18, 2013, which is incorporated into this report by reference.
Item 14. Principal Accounting Fees and Services
The Company incorporates by reference the information contained in the Proxy Statement for the Annual Meeting of Shareholders to be held October 18, 2013 under the heading "Fees to Independent Registered Public Accounting Firm."
29
Table of Contents
PART IV
Item 15. Exhibits, Financial Statement Schedules
(a)(1) Consolidated Financial Statements
See "Index to Consolidated Financial Statements and Financial Statement Schedule", the Report of Independent Registered Public Accounting Firm and the Consolidated Financial Statements, all of which are incorporated by reference.
(a)(2) Consolidated Financial Statement Schedule
See "Index to Consolidated Financial Statements and Financial Statement Schedule", and the Consolidated Financial Statement Schedule, all of which are incorporated by reference.
(a)(3) Exhibits. See Exhibit Index included as the last page of this form, which is incorporated by reference.
30
Table of Contents
INDEX TO CONSOLIDATED FINANCIAL STATEMENTS AND
FINANCIAL STATEMENT SCHEDULE
INDEX TO CONSOLIDATED FINANCIAL STATEMENTS | Page |
Report of Independent Registered Public Accounting Firm | 32 |
Consolidated Balance Sheets as of June 30, 2013 and 2012 | 33 |
Consolidated Statements of Operations and Comprehensive Income for the years | |
ended June 30, 2013, 2012 and 2011 | 34 |
Consolidated Statements of Cash Flows for the years ended June 30, 2013, 2012 and 2011 | 35 |
Consolidated Statements of Changes in Equity for the years ended June 30, 2013, 2012 and 2011 | 36 |
Notes to Consolidated Financial Statements | 37-53 |
INDEX TO FINANCIAL STATEMENT SCHEDULE | |
Schedule II - Valuation and Qualifying Accounts | 54 |
Schedules, other than those listed, are omitted for the reason that they are inapplicable, are not required, or the information required is shown in the financial statements or the related notes.
31
Table of Contents
Report of Independent Registered Public Accounting Firm
To the Board of Directors and Shareholders of Twin Disc, Incorporated:
In our opinion, the consolidated financial statements listed in the index appearing under Item 15(a)(1) present fairly, in all material respects, the financial position of Twin Disc, Incorporated and its subsidiaries at June 30, 2013 and June 30, 2012, and the results of their operations and their cash flows for each of the three years in the period ended June 30, 2013 in conformity with accounting principles generally accepted in the United States of America. In addition, in our opinion, the financial statement schedule listed in the index appearing under Item 15(a)(2) presents fairly, in all material respects, the information set forth therein when read in conjunction with the related consolidated financial statements. Also in our opinion, the Company maintained, in all material respects, effective internal control over financial reporting as of June 30, 2013, based on criteria established in Internal Control - Integrated Framework issued by the Committee of Sponsoring Organizations of the Treadway Commission (COSO). The Company's management is responsible for these financial statements and financial statement schedule, for maintaining effective internal control over financial reporting and for its assessment of the effectiveness of internal control over financial reporting , included in Management's Report on Internal Control Over Financial Reporting appearing under Item 9(a) . Our responsibility is to express opinions on these financial statements, on the financial statement schedule, and on the Company's internal control over financial reporting based on our integrated audits. We conducted our audits in accordance with the standards of the Public Company Accounting Oversight Board (United States). Those standards require that we plan and perform the audits to obtain reasonable assurance about whether the financial statements are free of material misstatement and whether effective internal control over financial reporting was maintained in all material respects. Our audits of the financial statements included examining, on a test basis, evidence supporting the amounts and disclosures in the financial statements, assessing the accounting principles used and significant estimates made by management, and evaluating the overall financial statement presentation. Our audit of internal control over financial reporting included obtaining an understanding of internal control over financial reporting, assessing the risk that a material weakness exists, and testing and evaluating the design and operating effectiveness of internal control based on the assessed risk. Our audits also included performing such other procedures as we considered necessary in the circumstances. We believe that our audits provide a reasonable basis for our opinions.
A company's internal control over financial reporting is a process designed to provide reasonable assurance regarding the reliability of financial reporting and the preparation of financial statements for external purposes in accordance with generally accepted accounting principles. A company's internal control over financial reporting includes those policies and procedures that (i) pertain to the maintenance of records that, in reasonable detail, accurately and fairly reflect the transactions and dispositions of the assets of the company; (ii) provide reasonable assurance that transactions are recorded as necessary to permit preparation of financial statements in accordance with generally accepted accounting principles, and that receipts and expenditures of the company are being made only in accordance with authorizations of management and directors of the company; and (iii) provide reasonable assurance regarding prevention or timely detection of unauthorized acquisition, use, or disposition of the company's assets that could have a material effect on the financial statements.
Because of its inherent limitations, internal control over financial reporting may not prevent or detect misstatements. Also, projections of any evaluation of effectiveness to future periods are subject to the risk that controls may become inadequate because of changes in conditions, or that the degree of compliance with the policies or procedures may deteriorate.
/s/ PricewaterhouseCoopers LLP
Milwaukee, Wisconsin
September 13, 2013
32
Table of Contents
TWIN DISC, INCORPORATED AND SUBSIDIARIES
CONSOLIDATED BALANCE SHEETS
June 30, 2013 and 2012
(In thousands, except share amounts)
2013 | 2012 | |||||||
ASSETS | ||||||||
Current assets: | ||||||||
Cash | $ | 20,724 | $ | 15,701 | ||||
Trade accounts receivable, net | 46,331 | 63,438 | ||||||
Inventories | 102,774 | 103,178 | ||||||
Deferred income taxes | 5,280 | 3,745 | ||||||
Other | 13,363 | 11,099 | ||||||
Total current assets | 188,472 | 197,161 | ||||||
Property, plant and equipment, net | 62,315 | 66,356 | ||||||
Goodwill, net | 13,232 | 13,116 | ||||||
Deferred income taxes | 7,614 | 14,335 | ||||||
Intangible assets, net | 3,149 | 4,996 | ||||||
Other assets | 10,676 | 7,868 | ||||||
| $ | 285,458 | $ | 303,832 | |||||
LIABILITIES and EQUITY | ||||||||
Current liabilities: | ||||||||
Short-term borrowings and current maturities of long-term debt | $ | 3,681 | $ | 3,744 | ||||
Accounts payable | 20,651 | 23,550 | ||||||
Accrued liabilities | 39,171 | 39,331 | ||||||
Total current liabilities | 63,503 | 66,625 | ||||||
Long-term debt | 23,472 | 28,401 | ||||||
Accrued retirement benefits | 48,290 | 64,009 | ||||||
Deferred income taxes | 2,925 | 3,340 | ||||||
Other long-term liabilities | 3,706 | 4,948 | ||||||
| 141,896 | 167,323 | |||||||
Twin Disc shareholders' equity: | ||||||||
Preferred shares authorized: 200,000; | ||||||||
issued: none; no par value | - | - | ||||||
Common shares authorized: 30,000,000; | ||||||||
issued: 13,099,468; no par value | 13,183 | 12,759 | ||||||
Retained earnings | 184,110 | 184,306 | ||||||
Accumulated other comprehensive loss | (25,899 | ) | (34,797 | ) | ||||
| 171,394 | 162,268 | |||||||
Less treasury stock, at cost (1,886,516 and 1,794,981 shares, respectively) | 28,890 | 26,781 | ||||||
Total Twin Disc shareholders' equity | 142,504 | 135,487 | ||||||
Noncontrolling interest | 1,058 | 1,022 | ||||||
Total equity | 143,562 | 136,509 | ||||||
| $ | 285,458 | $ | 303,832 | |||||
The notes to consolidated financial statements are an integral part of these statements.
33
Table of Contents
TWIN DISC, INCORPORATED AND SUBSIDIARIES
CONSOLIDATED STATEMENTS OF OPERATIONS AND COMPREHENSIVE INCOME
For the years ended June 30, 2013, 2012 and 2011
(In thousands, except per share data)
2013 | 2012 | 2011 | ||||||||||
Net sales | $ | 285,282 | $ | 355,870 | $ | 310,393 | ||||||
Cost of goods sold | 205,257 | 234,238 | 202,710 | |||||||||
Gross profit | 80,025 | 121,632 | 107,683 | |||||||||
Marketing, engineering and administrative expenses | 67,899 | 73,091 | 72,967 | |||||||||
Restructuring of operations | 708 | - | - | |||||||||
Impairment charge | 1,405 | 3,670 | - | |||||||||
Earnings from operations | 10,013 | 44,871 | 34,716 | |||||||||
Other income (expense): | ||||||||||||
Interest income | 102 | 95 | 98 | |||||||||
Interest expense | (1,435 | ) | (1,475 | ) | (1,719 | ) | ||||||
Other, net | 557 | 1,265 | (1,066 | ) | ||||||||
| (776 | ) | (115 | ) | (2,687 | ) | |||||||
Earnings before income taxes and noncontrolling interest | 9,237 | 44,756 | 32,029 | |||||||||
Income taxes | 4,986 | 17,815 | 13,897 | |||||||||
Net earnings | 4,251 | 26,941 | 18,132 | |||||||||
Less: Net earnings attributable to noncontrolling interest | (369 | ) | (198 | ) | (135 | ) | ||||||
Net earnings attributable to Twin Disc | $ | 3,882 | $ | 26,743 | $ | 17,997 | ||||||
Earnings per share data: | ||||||||||||
Basic earnings per share attributable to Twin Disc common shareholders | $ | 0.34 | $ | 2.34 | $ | 1.59 | ||||||
Diluted earnings per share attributable to Twin Disc common shareholders | 0.34 | 2.31 | 1.57 | |||||||||
Weighted average shares outstanding data: | ||||||||||||
Basic shares outstanding | 11,304 | 11,410 | 11,319 | |||||||||
Dilutive stock awards | 73 | 146 | 144 | |||||||||
Diluted shares outstanding | 11,377 | 11,556 | 11,463 | |||||||||
Comprehensive income: | ||||||||||||
Net earnings | $ | 4,251 | $ | 26,941 | $ | 18,132 | ||||||
Foreign currency translation adjustment | 447 | (11,738 | ) | 19,272 | ||||||||
Benefit plan adjustments, net of income taxes of $4,163, | ||||||||||||
($6,769) and $6,036, respectively | 8,322 | (11,690 | ) | 11,506 | ||||||||
Comprehensive income | 13,020 | 3,513 | 48,910 | |||||||||
Comprehensive earnings attributable to noncontrolling interest | (369 | ) | (198 | ) | (135 | ) | ||||||
Comprehensive income attributable to Twin Disc | $ | 12,651 | $ | 3,315 | $ | 48,775 | ||||||
The notes to consolidated financial statements are an integral part of these statements.
34
Table of Contents
TWIN DISC, INCORPORATED AND SUBSIDIARIES
CONSOLIDATED STATEMENTS OF CASH FLOWS
For the years ended June 30, 2013, 2012 and 2011
(In thousands)
2013 | 2012 | 2011 | ||||||||||
Cash flows from operating activities : | ||||||||||||
Net earnings | $ | 4,251 | $ | 26,941 | $ | 18,132 | ||||||
Adjustments to reconcile net earnings to net | ||||||||||||
cash provided by operating activities: | ||||||||||||
Depreciation and amortization | 10,838 | 10,756 | 9,904 | |||||||||
Loss on sale of plant assets | 287 | 315 | 120 | |||||||||
Impairment charge | 1,405 | 3,670 | - | |||||||||
Stock compensation expense | 2,681 | 1,642 | 6,148 | |||||||||
Restructuring of operations | 708 | - | - | |||||||||
Provision for deferred income taxes | 687 | 7,486 | 1,354 | |||||||||
Changes in operating assets and liabilities: | ||||||||||||
Trade accounts receivable, net | 17,636 | (5,982 | ) | (13,605 | ) | |||||||
Inventories, net | 176 | (9,563 | ) | (17,258 | ) | |||||||
Other assets | (3,136 | ) | (915 | ) | (1,736 | ) | ||||||
Accounts payable | (2,457 | ) | (13,279 | ) | 11,839 | |||||||
Accrued liabilities | (4,969 | ) | (2,904 | ) | 7,546 | |||||||
Accrued/prepaid retirement benefits | (3,631 | ) | (3,723 | ) | (8,584 | ) | ||||||
Net cash provided by operating activities | 24,476 | 14,444 | 13,860 | |||||||||
Cash flows from investing activities : | ||||||||||||
Proceeds from sale of plant assets | 315 | 116 | 296 | |||||||||
Capital expenditures | (6,582 | ) | (13,733 | ) | (12,028 | ) | ||||||
Other, net | (231 | ) | (293 | ) | (293 | ) | ||||||
Net cash used by investing activities | (6,498 | ) | (13,910 | ) | (12,025 | ) | ||||||
Cash flows from financing activities : | ||||||||||||
Proceeds from notes payable | 32 | 3 | 84 | |||||||||
Payments of notes payable | (96 | ) | (145 | ) | (83 | ) | ||||||
(Payments of) proceeds from long-term debt | (4,932 | ) | 2,590 | (1,405 | ) | |||||||
Proceeds from exercise of stock options | 189 | 169 | 322 | |||||||||
Acquisition of treasury stock | (3,069 | ) | (2,425 | ) | - | |||||||
Dividends paid to shareholders | (4,078 | ) | (3,886 | ) | (3,411 | ) | ||||||
Dividends paid to noncontrolling interest | (204 | ) | (131 | ) | (138 | ) | ||||||
Excess tax benefits from stock compensation | 1,451 | 535 | 317 | |||||||||
Other | (1,700 | ) | (184 | ) | 136 | |||||||
Net cash used by financing activities | (12,407 | ) | (3,474 | ) | (4,178 | ) | ||||||
Effect of exchange rate changes on cash | (548 | ) | (1,526 | ) | 3,488 | |||||||
Net change in cash | 5,023 | (4,466 | ) | 1,145 | ||||||||
Cash: | ||||||||||||
Beginning of year | 15,701 | 20,167 | 19,022 | |||||||||
End of year | $ | 20,724 | $ | 15,701 | $ | 20,167 | ||||||
Supplemental cash flow information: | ||||||||||||
Cash paid during the year for: | ||||||||||||
Interest | $ | 1,536 | $ | 1,507 | $ | 1,520 | ||||||
Income taxes | 2,545 | 13,629 | 10,453 | |||||||||
The notes to consolidated financial statements are an integral part of these statements.
35
Table of Contents
TWIN DISC, INCORPORATED AND SUBSIDIARIES
CONSOLIDATED STATEMENTS OF CHANGES IN EQUITY
For the years ended June 30, 2013, 2012 and 2011
(In thousands)
Twin Disc, Inc. Shareholders' Equity | ||||||
Accumulated | ||||||
Other | Non- | |||||
Common | Retained | Comprehensive | Treasury | Controlling | Total | |
Stock | Earnings | Income (Loss) | Stock | Interest | Equity | |
Balance at June 30, 2010 | $10,667 | $146,863 | ($42,048) | ($27,597) | $859 | $88,744 |
Net earnings | 17,997 | 135 | 18,132 | |||
Translation adjustments | 19,159 | 113 | 19,272 | |||
Benefit plan adjustments, net of tax | 11,506 | 11,506 | ||||
Cash dividends | (3,411) | (138) | (3,549) | |||
Compensation expense and windfall | ||||||
tax benefits | 2,219 | 2,219 | ||||
Shares (acquired) issued, net | (2,023) | 2,345 | 322 | |||
Balance at June 30, 2011 | 10,863 | 161,449 | (11,383) | (25,252) | 969 | 136,646 |
Net earnings |
26,743 |
198 |
26,941 | |||
Translation adjustments | (11,724) | (14) | (11,738) | |||
Benefit plan adjustments, net of tax | (11,690) | (11,690) | ||||
Cash dividends | (3,886) | (131) | (4,017) | |||
Compensation expense and windfall | ||||||
tax benefits | 2,808 | 2,808 | ||||
Shares (acquired) issued, net | (912) | (1,529) | (2,441) | |||
Balance at June 30, 2012 | 12,759 | 184,306 | (34,797) | (26,781) | 1,022 | 136,509 |
Net earnings | 3,882 | 369 | 4,251 | |||
Translation adjustments | 576 | (129) | 447 | |||
Benefit plan adjustments, net of tax | 8,322 | 8,322 | ||||
Cash dividends | (4,078) | (204) | (4,282) | |||
Compensation expense and windfall | ||||||
tax benefits | 2,894 | 2,894 | ||||
Shares (acquired) issued, net | (2,470) | (2,109) | (4,579) | |||
Balance at June 30, 2013 | $13,183 | $184,110 | ($25,899) | ($28,890) | $1,058 | $143,562 |
The notes to consolidated financial statements are an integral part of these statements.
36
Table of Contents
TWIN DISC, INCORPORATED AND SUBSIDIARIES
NOTES TO CONSOLIDATED FINANCIAL STATEMENTS
A. SIGNIFICANT ACCOUNTING POLICIES
The following is a summary of the significant accounting policies followed in the preparation of these financial statements:
Consolidation Principles --The consolidated financial statements include the accounts of Twin Disc, Incorporated and its wholly and partially owned domestic and foreign subsidiaries. Certain foreign subsidiaries are included based on fiscal years ending May 31, to facilitate prompt reporting of consolidated accounts. The Company also has a controlling interest in a Japanese joint venture, which is consolidated based upon a fiscal year ending March 31. All significant intercompany transactions have been eliminated.
Translation of Foreign Currencies --The financial statements of the Company's non-U.S. subsidiaries are translated using the current exchange rate for assets and liabilities and the weighted-average exchange rate for the year for revenues and expenses. The resulting translation adjustments are recorded as a component of accumulated other comprehensive loss, which is included in equity. Gains and losses from foreign currency transactions are included in earnings. Included in other income (expense) are foreign currency transaction gains (losses) of $642,000, $1,103,000 and ($1,141,000) in fiscal 2013, 2012 and 2011, respectively.
Receivables --Trade accounts receivable are stated net of an allowance for doubtful accounts of $2,884,000 and $2,194,000 at June 30, 2013 and 2012, respectively. The Company records an allowance for doubtful accounts provision for certain customers where a risk of default has been specifically identified as well as provisions determined on a general basis when it is believed that some default is probable and estimable but not yet clearly associated with a specific customer. The assessment of likelihood of customer default is based on a variety of factors, including the length of time the receivables are past due, the historical collection experience and existing economic conditions. Various factors may adversely impact our customer's ability to access sufficient liquidity and capital to fund their operations and render the Company's estimation of customer defaults inherently uncertain. While the Company believes current allowances for doubtful accounts are adequate, it is possible that these factors may cause higher levels of customer defaults and bad debt expense in future periods.
Fair Value of Financial Instruments --The carrying amount reported in the consolidated balance sheets for cash, trade accounts receivable, accounts payable and short term borrowings approximate fair value because of the immediate short-term maturity of these financial instruments . If measured at fair value, cash would be classified as Level 1 and all other items listed above would be classified as Level 2 in the fair value hierarchy, as described in Note M. The fair value of the Company's 6.05% Senior Notes due April 10, 2016 was approximately $11,536,000 and $15,768,000 at June 30, 2013 and 2012, respectively. The fair value of the Senior Notes is estimated by discounting the future cash flows at rates offered to the Company for similar debt instruments of comparable maturities. This rate was represented by the US Treasury Three-Year Yield Curve Rate (0.66% and 0.41% for fiscal 2013 and 2012, respectively), plus the current add-on related to the Company's revolving loan agreement (1.65% and 1.50% for fiscal 2013 and 2012, respectively) resulting in a total rate of 2.31% and 1.91% for fiscal 2013 and 2012, respectively. See Note G, "Debt" for the related book value of this debt instrument. The Company's revolving loan agreement approximates fair value at June 30, 2013. If measured at fair value in the financial statements, long-term debt (including the current portion) would be classified as Level 2 in the fair value hierarchy, as described in Note M.
Derivative Financial Instruments - - The Company has written policies and procedures that place all financial instruments under the direction of the Company's corporate treasury and restricts all derivative transactions to those intended for hedging purposes. The use of financial instruments for trading purposes is prohibited. The Company uses financial instruments to manage the market risk from changes in foreign exchange rates.
Periodically, the Company enters into forward exchange contracts to reduce the earnings and cash flow impact of non-functional currency denominated receivables and payables. These contracts are highly effective in hedging the cash flows attributable to changes in currency exchange rates. Gains and losses resulting from these contracts offset the foreign exchange gains or losses on the underlying assets and liabilities being hedged. The maturities of the forward exchange contracts generally coincide with the settlement dates of the related transactions. Gains and losses
37
Table of Contents
on these contracts are recorded in other income (expense) as the changes in the fair value of the contracts are recognized and generally offset the gains and losses on the hedged items in the same period. The primary currency to which the Company was exposed in fiscal 2013 and 2012 was the Euro. At June 30, 2013 and 2012, the Company had no outstanding forward exchange contracts.
Inventories --Inventories are valued at the lower of cost or market. Cost has been determined by the last-in, first-out (LIFO) method for the majority of inventories located in the United States, and by the first-in, first-out (FIFO) method for all other inventories. Management specifically identifies obsolete products and analyzes historical usage, forecasted production based on future orders, demand forecasts, and economic trends, among others, when evaluating the adequacy of the reserve for excess and obsolete inventory.
Property, Plant and Equipment and Depreciation --Assets are stated at cost. Expenditures for maintenance, repairs and minor renewals are charged against earnings as incurred. Expenditures for major renewals and betterments are capitalized and depreciated. Depreciation is provided on the straight-line method over the estimated useful lives of the assets for financial reporting and on accelerated methods for income tax purposes. The lives assigned to buildings and related improvements range from 10 to 40 years, and the lives assigned to machinery and equipment range from 5 to 15 years. Upon disposal of property, plant and equipment, the cost of the asset and the related accumulated depreciation are removed from the accounts and the resulting gain or loss is reflected in earnings. Fully depreciated assets are not removed from the accounts until physically disposed.
Impairment of Long-lived Assets --The Company reviews long-lived assets for impairment whenever events or changes in business circumstances indicate that the carrying amount of the assets may not be fully recoverable. For property, plant and equipment and other long-lived assets, excluding indefinite-lived intangible assets, the Company performs undiscounted operating cash flow analyses to determine if an impairment exists. If an impairment is determined to exist, any related impairment loss is calculated based on fair value. Fair value is primarily determined using discounted cash flow analyses; however, other methods may be used to substantiate the discounted cash flow analyses, including third party valuations when necessary. Refer to Note G for discussion of the impairment charge recorded in fiscal 2013.
Revenue Recognition --Revenue is recognized by the Company when all of the following criteria are met: persuasive evidence of an arrangement exists; delivery has occurred and ownership has transferred to the customer; the price to the customer is fixed or determinable; and collectability is reasonably assured. Revenue is recognized at the time product is shipped to the customer, except for certain domestic shipments to overseas customers where revenue is recognized upon receipt by the customer. A significant portion of our consolidated net sales is transacted through a third party distribution network. Sales to third party distributors are subject to the revenue recognition criteria described above. Goods sold to third party distributors are subject to an annual return policy, for which a provision is made at the time of shipment based upon historical experience.
Goodwill and Other Intangibles -- Goodwill and other indefinite-lived intangible assets, primarily tradenames, are tested for impairment at least annually on the last day of the Company's fiscal year and more frequently if an event occurs which indicates the asset may be impaired in accordance with the Accounting Standards Codification ("ASC") Topic 350-10, "Intangibles – Goodwill and Other." If applicable, goodwill and other indefinite-lived intangible assets not subject to amortization have been assigned to reporting units for purposes of impairment testing based upon the relative fair value of the asset to each reporting unit.
A significant amount of judgment is involved in determining if an indicator of impairment has occurred. Such indicators may include, among others: a significant decline in expected future cash flows; a sustained, significant decline in the Company's stock price and market capitalization; a significant adverse change in legal factors or in the business climate; unanticipated competition; the testing for recoverability of a significant asset group within a reporting unit; and slower growth rates. Any adverse change in these factors could have a significant impact on the recoverability of these assets and could have a material impact on the Company's consolidated financial statements.
Impairment of goodwill is measured according to a two step approach. In the first step, the fair value of a reporting unit, as defined, is compared to the carrying value of the reporting unit, including goodwill. The fair value is primarily determined using discounted cash flow analyses; however, other methods may be used to substantiate the discounted cash flow analyses, including third party valuations. For purposes of the June 30, 2013 impairment analysis, the Company has utilized discounted cash flow analyses. If the carrying amount exceeds the fair value, the second step of the goodwill impairment test is performed to measure the amount of the impairment loss, if any. In the second step, the implied value of the goodwill is estimated as the fair value of the reporting unit less the fair
38
Table of Contents
value of all other tangible and identifiable intangible assets of the reporting unit. If the carrying amount of the goodwill exceeds the implied fair value of the goodwill, an impairment loss is recognized in an amount equal to that excess, not to exceed the carrying amount of the goodwill.
Based upon the goodwill impairment review completed in conjunction with the preparation of the annual financial statements at the end of fiscal 2013, which incorporates management's best estimates of economic and market conditions over the projected period and a weighted-average cost of capital that reflects current market conditions, it was determined that the fair value of goodwill for each of the reporting units significantly exceeded the carrying value and therefore goodwill was not impaired.
The fair value of the Company's other intangible assets with indefinite lives, primarily tradenames, is estimated using the relief-from-royalty method, which requires assumptions related to projected revenues; assumed royalty rates that could be payable if the Company did not own the asset; and a discount rate. The Company completed the impairment testing of indefinite-lived intangibles as of June 30, 2013 and concluded there were no impairments.
Changes in circumstances, existing at the measurement date or at other times in the future, or in the numerous estimates associated with management's judgments, assumptions and estimates made in assessing the fair value of goodwill and other indefinite-lived intangibles, could result in an impairment charge in the future. The Company will continue to monitor all significant estimates and impairment indicators, and will perform interim impairment reviews as necessary.
Any cost incurred to extend or renew the term of an indefinite lived intangible asset are expensed as incurred.
Deferred Taxes --The Company recognizes deferred tax liabilities and assets for the expected future income tax consequences of events that have been recognized in the Company's financial statements. Under this method, deferred tax liabilities and assets are determined based on the temporary differences between the financial statement carrying amounts and the tax bases of assets and liabilities using enacted tax rates in effect in the years in which temporary differences are expected to reverse. Valuation allowances are provided for deferred tax assets where it is considered more likely than not that the Company will not realize the benefit of such assets.
Management Estimates-- The preparation of financial statements in conformity with generally accepted accounting principles requires management to make estimates and assumptions that affect the reported amounts of assets and liabilities and disclosure of contingent liabilities at the dates of the financial statements and the reported amounts of revenues and expenses during the reporting periods. Actual amounts could differ from those estimates.
Shipping and Handling Fees and Costs --The Company records revenue from shipping and handling costs in net sales. The cost associated with shipping and handling of products is reflected in cost of goods sold.
Reclassification --Certain amounts in the 2012 in the notes to the consolidated financial statements have been reclassified to conform to the presentation in the fiscal 2013 financial statements. Specifically, $478,000 has been reclassified from Building to Land in Note C.
Revision of Prior Period Financial Statements
During the second quarter of fiscal 2013, the Company identified errors related to its reserve for uncertain tax positions that affected prior periods beginning in the year ended June 30, 2007 and subsequent periods through September 28, 2012. In evaluating whether the Company's previously issued consolidated financial statements were materially misstated, the Company considered the guidance in ASC Topic 250, Accounting Changes and Error Corrections and ASC Topic 250-10-S99-1, Assessing Materiality. The Company concluded this error was not material individually or in the aggregate to any of the prior reporting periods. However, the cumulative error would be material in the year ended June 30, 2013, if the entire correction was recorded in the second quarter of fiscal 2013. As such, the revision for this correction to the applicable prior periods is reflected in the financial information herein. As a result of correcting the errors related to its reserve for uncertain tax positions, net earnings attributable to Twin Disc was decreased by $69,000 and $50,000 in fiscal 2012 and 2011, respectively. The cumulative impact of this error correction prior to fiscal 2011 was to reduce shareholders' equity at June 30, 2010 by $658,000. In addition to recording this correcting adjustment, the Company recorded other adjustments to prior period amounts to correct other immaterial out-of-period adjustments related to income taxes, including those that had been previously disclosed. As a result of correcting these other immaterial out-of-period adjustments, net earnings attributable to Twin Disc was increased by $700,000 in fiscal 2012 and decreased by $783,000 in fiscal 2011. The cumulative
39
Table of Contents
impact of these other immaterial out-of-period adjustments prior to fiscal 2011 was to increase shareholders' equity at June 30, 2010 by $83,000.
The impacts of these revisions are shown in the following tables (in ‘000's):
As of and for the period ended June 30, 2011 | As of and for the period ended June 30, 2012 | |||||||
Reported | Adjustment | Revised | Reported | Adjustment | Revised | |||
Revised consolidated balance sheet amounts | ||||||||
Accrued liabilities | $41,673 | $700 | $42,373 | $ - | $ - | $ - | ||
Total current liabilities | 83,960 | 700 | 84,660 | - | - | - | ||
Other long term liabilities | 7,089 | 708 | 7,797 | 4,171 | 777 | 4,948 | ||
Total liabilities | 171,066 | 1,408 | 172,474 | 166,546 | 777 | 167,323 | ||
Retained earnings | 162,857 | (1,408) | 161,449 | 185,083 | (777) | 184,306 | ||
Total equity | 138,054 | (1,408) | 136,646 | 137,286 | (777) | 136,509 | ||
Revised consolidated statement of comprehensive income (loss) amounts | ||||||||
Income taxes | $13,064 | $833 | $13,897 | $18,446 | $(631) | $17,815 | ||
Net earnings | 18,965 | (833) | 18,132 | 26,310 | 631 | 26,941 | ||
Net earnings attributable to Twin Disc | 18,830 | (833) | 17,997 | 26,112 | 631 | 26,743 | ||
Basic earnings per share | 1.66 | (0.07) | 1.59 | 2.29 | 0.05 | 2.34 | ||
Diluted earnings per share | 1.64 | (0.07) | 1.57 | 2.26 | 0.05 | 2.31 | ||
Comprehensive income (loss) | 49,743 | (833) | 48,910 | 2,882 | 631 | 3,513 | ||
Comprehensive income (loss) attributable to Twin Disc | 49,608 | (833) | 48,775 | 2,684 | 631 | 3,315 | ||
Revised consolidated statement of cash flows amounts | ||||||||
Net earnings | $18,965 | $(833) | $18,132 | $26,310 | $631 | $26,941 | ||
Accrued liabilities | 6,713 | 833 | 7,546 | (2,273) | (631) | (2,904) | ||
Recently Issued Accounting Standards
In July 2013, the Financial Accounting Standards Board ("FASB") issued guidance designed to clarify the financial statement presentation requirements of an unrecognized tax benefit when a net operating loss carryforward, a similar tax loss, or a tax credit carryforward exists. This guidance is effective for reporting periods beginning after December 15, 2013 (the Company's third quarter of fiscal 2014), and is not expected to have a material impact on the Company's financial statements.
In February 2013, the FASB issued guidance designed to improve the transparency in reporting amounts that are reclassified out of accumulated other comprehensive income into net income. This new guidance will require presentation of the effects on the line items of net income of significant amounts reclassified out of accumulated other comprehensive income and a cross-reference to other disclosure currently required for the reclassification items. The amended guidance is effective for reporting periods beginning after December 15, 2012 (the Company's third quarter of fiscal 2013). See Note M for the additional disclosures required by this new guidance.
In July 2012, the FASB issued amended guidance that simplifies how entities test indefinite-lived intangible assets other than goodwill for impairment. After an assessment of certain qualitative factors, if it is determined to be more likely than not that an indefinite-lived asset is impaired, entities must perform the quantitative impairment test.
40
Table of Contents
Otherwise, the quantitative test is optional. The amended guidance is effective for annual and interim impairment tests performed for fiscal years beginning after September 15, 2012 (the Company's fiscal 2014), with early adoption permitted. The adoption of this guidance is not expected to have a material impact on the Company's financial results.
In September 2011, the FASB issued a standards update that is intended to simplify how entities test goodwill for impairment. This update permits an entity to first assess qualitative factors to determine whether it is "more likely than not" that the fair value of a reporting unit is less than its carrying amount as a basis for determining whether it is necessary to perform the two-step goodwill impairment test described in ASC Topic 350 "Intangibles-Goodwill and Other." This update is effective for annual and interim goodwill impairment tests performed for fiscal years beginning after December 15, 2011 (the Company's fiscal 2013). This standards update did not have a material impact on the Company's financial statements.
B. INVENTORIES
The major classes of inventories at June 30 were as follows (in thousands):
2013 | 2012 | |
Finished parts | $ 68,594 | $ 62,909 |
Work-in-process | 11,880 | 16,608 |
Raw materials | 22,300 | 23,661 |
$102,774 | $103,178 |
Inventories stated on a LIFO basis represent approximately 30% and 33% of total inventories at June 30, 2013 and 2012, respectively. The approximate current cost of the LIFO inventories exceeded the LIFO cost by $25,101,000 and $23,970,000 at June 30, 2013 and 2012, respectively. The Company had reserves for inventory obsolescence of $7,122,000 and $6,728,000 at June 30, 2013 and 2012, respectively.
C. PROPERTY, PLANT AND EQUIPMENT
Property, plant and equipment at June 30 were as follows (in thousands):
2013 | 2012 | |
Land | $ 4,977 | $ 4,673 |
Buildings | 42,712 | 41,992 |
Machinery and equipment | 138,223 | 139,908 |
185,912 | 186,573 | |
Less: accumulated depreciation | 123,597 | 120,217 |
$ 62,315 | $ 66,356 |
Depreciation expense for the years ended June 30, 2013, 2012 and 2011 was $10,120,000, $9,947,000 and $9,110,000, respectively.
D. GOODWILL AND OTHER INTANGIBLES
The changes in the carrying amount of goodwill, substantially all of which is allocated to the manufacturing segment, for the years ended June 30, 2013 and 2012 were as follows (in thousands):
Balance at June 30, 2011 | $17,871 | |
Impairment charge | (3,670) | |
Translation adjustment | (1,085) | |
Balance at June 30, 2012 | 13,116 | |
Translation adjustment | 116 | |
Balance at June 30, 2013 | $13,232 |
41
Table of Contents
The Company conducted its annual assessment for goodwill impairment in the fourth quarter of fiscal 2012 by applying a fair value based test using discounted cash flow analyses, in accordance with ASC 350-10, "Intangibles – Goodwill and Other." The inputs utilized in the discounted cash flow analysis used to measure the fair value of goodwill are considered Level 3 in the fair value hierarchy. The result of this assessment identified that one of the Company's reporting units goodwill was fully impaired, necessitating a non-cash charge of $3,670,000. The impairment was due to a declining outlook in the global pleasure craft/mega yacht market, the weakened European economy, few signs of significant near-term recovery in the markets served by this reporting unit and the heightened economic risk profile of this Italian reporting unit as of June 30, 2012. These factors were identified as the Company conducted its annual budget review process during the fourth fiscal quarter, and the Company concluded that the impairment charge was necessary in connection with the preparation of the year end financial statements. The fair value of the goodwill for the remaining reporting units significantly exceeds the respective carrying values.
At June 30, the following acquired intangible assets have defined useful lives and are subject to amortization (in thousands):
2013 | 2012 | |
Licensing agreements | $ 3,015 | $ 3,015 |
Non-compete agreements | 2,050 | 2,050 |
Other | 5,991 | 5,991 |
11,056 | 11,056 | |
Accumulated amortization | (9,301) | (8,583) |
Impairment charge | (1,277) | - |
Translation adjustment | 546 | 469 |
Total | $1,024 | $ 2,942 |
During the fourth quarter of fiscal 2013, the Company committed to a plan and entered negotiations to exit the distribution agreement and sell the inventory of its Italian distributor back to the parent supplier. This decision triggered an impairment review of the long lived assets at this entity, resulting in an impairment charge of $1,405,000, representing a complete impairment of the remaining intangibles ($1,277,000) and fixed assets ($128,000) for this entity. The impairment charge was determined by deriving the fair value of the asset group utilizing a discounted cash flow model. Significant inputs to this model include the discount rate, sales projections and profitability estimates. These inputs would be considered Level 3 in the fair value hierarchy.
The weighted average remaining useful life of the intangible assets included in the table above is approximately 7 years.
Intangible amortization expense for the years ended June 30, 2013, 2012 and 2011 was $718,000, $809,000 and $794,000, respectively. Estimated intangible amortization expense for each of the next five fiscal years is as follows (in thousands):
Fiscal Year | |
2014 | $ 363 |
2015 | 147 |
2016 | 64 |
2017 | 60 |
2018 | 60 |
Thereafter | 330 |
$1,024 |
The gross carrying amount of the Company's intangible assets that have indefinite lives and are not subject to amortization as of June 30, 2013 and 2012 are $2,125,000 and $2,054,000, respectively. These assets are comprised of acquired tradenames.
42
Table of Contents
E. ACCRUED LIABILITIES
Accrued liabilities at June 30 were as follows (in thousands):
2013 | 2012 | |
Salaries and wages | $ 9,513 | $16,190 |
Retirement benefits | 3,973 | 4,163 |
Warranty | 3,910 | 3,764 |
Customer advances/deferred revenue | 7,234 | 4,206 |
Accrued income tax | 2,541 | 584 |
Distributor rebate | 3,636 | 2,682 |
Other | 8,364 | 7,742 |
$39,171 | $39,331 |
F. WARRANTY
The Company warrants all assembled products and parts (except component products or parts on which written warranties are issued by the respective manufacturers thereof and are furnished to the original customer, as to which the Company makes no warranty and assumes no liability) against defective materials or workmanship. Such warranty generally extends from periods ranging from 12 months to 24 months. The Company engages in extensive product quality programs and processes, including actively monitoring and evaluating the quality of its suppliers. However, its warranty obligation is affected by product failure rates, the number of units affected by the failure and the expense involved in satisfactorily addressing the situation. The warranty reserve is established based on our best estimate of the amounts necessary to settle future and existing claims on products sold as of the balance sheet date. When evaluating the adequacy of the reserve for warranty costs, management takes into consideration the term of the warranty coverage, historical claim rates and costs of repair, knowledge of the type and volume of new products and economic trends. While we believe the warranty reserve is adequate and that the judgment applied is appropriate, such amounts estimated to be due and payable in the future could differ materially from what actually transpires. The following is a listing of the activity in the warranty reserve during the years ended June 30 (in thousands):
2013 | 2012 | |
Reserve balance, July 1 | $5,745 | $6,022 |
Current period expense | 4,864 | 3,633 |
Payments or credits to customers | (4,953) | (3,623) |
Translation adjustment | 45 | (287) |
Reserve balance, June 30 | $5,701 | $5,745 |
The current portion of the warranty accrual ($3,910,000 and $3,764,000 for fiscal 2013 and 2012, respectively) is reflected in accrued liabilities, while the long-term portion ($1,791,000 and $1,981,000 for fiscal 2013 and 2012, respectively) is included in other long-term liabilities on the Consolidated Balance Sheets.
G. DEBT
Notes Payable :
Notes payable consists of amounts borrowed under unsecured line of credit agreements. These lines of credit may be withdrawn at the option of the banks. The following is aggregate borrowing information at June 30 (in thousands):
2013 | 2012 | |
Available credit lines | $18,072 | $3,495 |
Unused credit lines | 18,072 | 3,495 |
Outstanding credit lines | - | - |
Notes payable-other | - | - |
Total notes payable | $ - | $ - |
Weighted-average interest | ||
rates on credit lines | 2.1% | 2.9% |
Long-term Debt :
Long-term debt consisted of the following at June 30 (in thousands):
2013 | 2012 | |
Revolving loan agreement | $16,300 | $17,550 |
10-year unsecured senior notes | 10,714 | 14,286 |
Secured long-term debt | 44 | 66 |
Capital lease obligations | - | 7 |
Other long-term debt | 95 | 236 |
Subtotal | 27,153 | 32,145 |
Less: current maturities | (3,681 ) | (3,744 ) |
Total long-term debt | $23,472 | $28,401 |
The Company has a revolving loan agreement with BMO Harris Bank NA (BMO), successor by merger toM&I Marshall & Ilsley Bank. During the fourth quarter of fiscal 2011, the total commitment was increased to $40,000,000 from $35,000,000 and the term was extended to May 31, 2015. The outstanding balance of $16,300,000 and $17,550,000 at June 30, 2013 and 2012, respectively, is classified as long-term debt. In accordance with the loan agreement , as amended, the Company can borrow at LIBOR plus an additional "Add-On," between 1.5% and 2.5%, depending on the Company's total funded debt to EBITDA ratio. The rate was 1.84% and 1.74% at June 30, 2013 and 2012, respectively. This agreement contains certain covenants, including restrictions on investments, acquisitions and indebtedness. Financial covenants include a minimum consolidated net worth amount, as defined, a minimum EBITDA for the most recent four fiscal quarters, and a maximum total funded debt to EBITDA ratio. As of June 30, 2013, the Company was in compliance with these financial covenants.
On April 10, 2006, the Company entered into a Note Agreement (the "Note Agreement") with The Prudential Insurance Company of America and certain other entities (collectively, "Purchasers"). Pursuant to the Note Agreement, Purchasers acquired, in the aggregate, $25,000,000 in 6.05% Senior Notes due April 10, 2016 (the "Notes"). The Notes mature and become due and payable in full on April 10, 2016 (the "Payment Date"). Prior to the Payment Date, the Company is obligated to make quarterly payments of interest during the term of the Notes, plus prepayments of principal of $3,571,429 on April 10 of each year from 2010 to 2015, inclusive. The Company also has the option of making additional prepayments subject to certain limitations, including the payment of a Yield-Maintenance Amount as defined in the Note Agreement. In addition, the Company will be required to make an offer to purchase the Notes upon a Change of Control, as defined in the Note Agreement, and any such offer must include the payment of a Yield-Maintenance Amount. The Note Agreement includes certain financial covenants which are identical to those associated with the revolving loan agreement discussed above. As of June 30, 2013, the Company was in compliance with these financial covenants. The Note Agreement also includes certain restrictive covenants that limit, among other things, the incurrence of additional indebtedness and the disposition of assets outside the ordinary course of business. The Note Agreement provides that it shall automatically include any covenants or events of default not previously included in the Note Agreement to the extent such covenants or events of default are granted to any other lender of an amount in excess of $1,000,000. Following an Event of Default, each Purchaser may accelerate all amounts outstanding under the Notes held by such party.
On November 19, 2012, the Company and its wholly-owned subsidiary Twin Disc International, S.A. entered into a multi-currency revolving Credit Agreement with Wells Fargo Bank, National Association. Pursuant to the Credit Agreement, the Company may, from time to time, enter into revolving credit loans in amounts not to exceed, in the aggregate, Wells Fargo's revolving credit commitment of $15,000,000. In general, outstanding revolving credit loans (other than foreign currency loans) will bear interest at one of the following rates, as selected by the Company: (1) a "Base Rate," which is equal to the highest of (i) the prime rate; (ii) the federal funds rate plus 0.50%; or (iii) LIBOR plus 1.00%; or (2) a "LIBOR Rate" (which is equal to LIBOR divided by the difference between 1.00 and the Eurodollar Reserve Percentage (as defined in the Credit Agreement)) plus 1.50%. Outstanding revolving credit loans that are
43
Table of Contents
foreign currency loans will bear interest at the LIBOR Rate plus 1.50%, plus an additional "Mandatory Cost," which is designed to compensate Wells Fargo for the cost of compliance with the requirements of the Bank of England and/or the Financial Services Authority, or the requirements of the European Central Bank. In addition to principal and interest payments, the Borrowers will be responsible for paying monthly commitment fees equal to .25% of the unused revolving credit commitment. The Company has the option of making additional prepayments subject to certain limitations. The Credit Agreement includes financial covenants regarding minimum net worth, minimum EBITDA for the most recent four fiscal quarters of $11,000,000, and a maximum total funded debt to EBITDA ratio of 3.0:1. As of June 30, 2013, the Company was in compliance with these financial covenants. The Credit Agreement also includes certain restrictive covenants that limit, among other things, certain investments, acquisitions and indebtedness. The Credit Agreement provides that it shall automatically include any covenants or events of default not previously included in the Credit Agreement to the extent such covenants or events of default are granted to any other lender of an amount in excess of $1,000,000. The Credit Agreement also includes customary events of default, including events of default under the BMO agreement or the Prudential Note Agreement. Following an event of default, Wells Fargo may accelerate all amounts outstanding under any revolving credit notes or the Credit Agreement. The Credit Agreement is scheduled to expire on May 31, 2015. As of June 30, 2013, there were no borrowings under the Credit Agreement.
The aggregate scheduled maturities of outstanding long-term debt obligations in subsequent years are as follows (in thousands):
Fiscal Year | |
2014 | $ 3,681 |
2015 | 19,873 |
2016 | 3,571 |
2017 | - |
2018 | - |
Thereafter | 28 |
$27,153 |
H. LEASE COMMITMENTS
Approximate future minimum rental commitments under noncancellable operating leases are as follows (in thousands):
Fiscal Year | |
2014 | $ 3,079 |
2015 | 1,901 |
2016 | 1,392 |
2017 | 1,341 |
2018 | 680 |
Thereafter | 16 |
$ 8,409 |
Total rent expense for operating leases approximated $3,863,000, $3,657,000 and $4,103,000 in fiscal 2013, 2012 and 2011, respectively.
I. SHAREHOLDERS' EQUITY
The total number of shares of common stock outstanding at June 30, 2013, 2012 and 2011 was 11,212,952, 11,304,487 and 11,359,894, respectively. At June 30, 2013, 2012 and 2011, treasury stock consisted of 1,886,516, 1,794,981 and 1,739,574 shares of common stock, respectively. The Company issued 123,997, 69,593 and 161,668 shares of treasury stock in fiscal 2013, 2012 and 2011, respectively, to fulfill its obligations under the stock option plans and restricted stock grants. The Company also recorded a forfeiture of 30,532 shares of previously issued restricted stock in the fourth quarter of fiscal 2013. The difference between the cost of treasury shares and the option price is recorded in common stock.
On February 1, 2008, the Board of Directors authorized the purchase of 500,000 shares of common stock at market values. In fiscal 2009, the Company purchased 250,000 shares of its outstanding common stock at an average price of $7.25 per share for a total cost of $1,812,500. In fiscal 2012, the Company purchased 125,000 shares of its
44
Table of Contents
outstanding common stock at an average price of $19.40 per share for a total cost of $2,425,000. On July 27, 2012, the Board of Directors authorized the purchase of an additional 375,000 shares of common stock at market values. This authorization has no expiration. In fiscal 2013, the Company purchased 185,000 shares of its outstanding common stock at an average price of $16.59 per share for a total cost of $3,068,652.
Cash dividends per share were $0.36, $0.34 and $0.30 in fiscal 2013, 2012 and 2011, respectively.
Effective June 30, 2008, the Company's Board of Directors established a Shareholder Rights Plan and distributed to shareholders one preferred stock purchase right (a "Right') for each outstanding share of common stock. This Shareholder Rights Plan was amended on May 1, 2012. Under certain circumstances, a Right can be exercised to purchase one four-hundredth of a share of Series A Junior Preferred Stock at an exercise price of $125, subject to certain anti-dilution adjustments. The Rights will become exercisable on the earlier of: (i) ten business days following a public announcement that a person or group of affiliated or associated persons (an "Acquiring Person") has acquired, or obtained the right to acquire from shareholders, beneficial ownership of 20% or more of the outstanding Company's common stock (or 30% or more in the case of any person or group which currently owns 20% or more of the shares or who shall become the beneficial owner of 20% or more of the shares as a result of any transfer by reason of the death of or by gift from any other person who is an affiliate or an associate of such existing holder or by succeeding such a person as trustee of a trust existing on the Record Date ("Existing Holder")) or (ii) ten business days following the commencement of a tender offer or exchange offer that would result in a person or group beneficially owning 20% or more of such outstanding Common Stock (or 30% or more for an Existing Holder), as such periods may be extended pursuant to the Rights Agreement. In the event that any person or group becomes an Acquiring Person, each holder of a Right shall thereafter have the right to receive, upon exercise, in lieu of Preferred Stock, common stock of the Company having a value equal to two times the exercise price of the Right. However, Rights are not exercisable as described in this paragraph until such time as the Rights are no longer redeemable by the Company as set forth below. Notwithstanding any of the foregoing, if any person becomes an Acquiring Person all Rights that are, or (under certain circumstances specified in the Rights Agreement) were, beneficially owned by an Acquiring Person will become null and void.
The Rights will expire at the close of business on June 30, 2018, unless earlier redeemed or exchanged by the Company. At any time before a person becomes an Acquiring Person, the Company may redeem the Rights in whole, but not in part, at a price of $.01 per Right, appropriately adjusted to reflect any stock split, stock dividend or similar transaction occurring after the date hereof. Immediately upon the action of the Board of Directors ordering redemption of the Rights, the Rights will terminate and the only right of the holders of Rights will be to receive the $.01 redemption price.
The Company is authorized to issue 200,000 shares of preferred stock, none of which have been issued. The Company has designated 150,000 shares of the preferred stock for the purpose of the Shareholder Rights Plan.
The components of accumulated other comprehensive loss included in equity as of June 30, 2013 and 2012 are as follows (in thousands):
2013 | 2012 | |
Translation adjustments | $ 16,949 | $ 16,373 |
Benefit plan adjustments, net of income taxes | ||
of $25,242 and $29,404, respectively | (42,848 ) | (51,170 ) |
Accumulated other comprehensive loss | $(25,899 ) | $(34,797) |
J. BUSINESS SEGMENTS AND FOREIGN OPERATIONS
The Company and its subsidiaries are engaged in the manufacture and sale of marine and heavy duty off-highway power transmission equipment. Principal products include marine transmissions, surface drives, propellers and boat management systems, as well as power-shift transmissions, hydraulic torque converters, power take-offs, industrial clutches and controls systems. The Company sells to both domestic and foreign customers in a variety of market areas, principally pleasure craft, commercial and military marine markets, as well as in the energy and natural resources, government and industrial markets.
Net sales by product group is summarized as follows (in thousands):
2013 | 2012 | 2011 | |
Industrial | $ 48,110 | $ 54,062 | $ 40,279 |
Land based transmissions | 68,535 | 146,686 | 121,735 |
Marine and propulsion systems | 162,823 | 151,407 | 145,842 |
Other | 5,814 | 3,715 | 2,537 |
Total | $285,282 | $355,870 | $310,393 |
Industrial products include clutches, power take-offs and pump drives sold to the agriculture, recycling, construction and oil and gas markets. The land based transmission products include applications for oilfield and natural gas, military and airport rescue and fire fighting. The marine and propulsion systems include marine transmission, controls, surface drives, propellers and boat management systems for the global commercial, pleasure craft and patrol boat markets. Other products includes non-Twin Disc manufactured product sold through our Company-owned distribution entities.
The Company has two reportable segments: manufacturing and distribution. These segments are managed separately because each provides different services and requires different technology and marketing strategies. The accounting practices of the segments are the same as those described in the summary of significant accounting policies. Transfers among segments are at established inter-company selling prices. Management evaluates the performance of its segments based on net earnings.
Information about the Company's segments is summarized as follows (in thousands):
Manufacturing | Distribution | Total | |
2013 | |||
Net sales | $245,592 | $130,360 | $375,952 |
Intra-segment sales | 16,140 | 15,127 | 31,267 |
Inter-segment sales | 55,746 | 3,657 | 59,403 |
Interest income | 479 | 19 | 498 |
Interest expense | 3,248 | 62 | 3,310 |
Income taxes | 5,112 | 1,630 | 6,742 |
Depreciation and amortization | 8,817 | 497 | 9,314 |
Net earnings attributable to Twin Disc | 10,141 | 5,840 | 15,981 |
Assets | 258,617 | 56,965 | 315,582 |
Expenditures for segment assets | 5,705 | 349 | 6,054 |
2012 | |||
Net sales | $325,174 | $129,411 | $454,585 |
Intra-segment sales | 16,189 | 7,672 | 23,861 |
Inter-segment sales | 71,134 | 3,720 | 74,854 |
Interest income | 688 | 39 | 727 |
Interest expense | 3,798 | 64 | 3,862 |
Income taxes | 19,444 | 2,460 | 21,904 |
Depreciation and amortization | 8,373 | 871 | 9,244 |
Net earnings attributable to Twin Disc | 29,572 | 7,196 | 36,768 |
Assets | 272,098 | 58,275 | 330,373 |
Expenditures for segment assets | 11,821 | 1,158 | 12,979 |
2011 | |||
Net sales | $267,630 | $128,559 | $396,189 |
Intra-segment sales | 12,712 | 13,289 | 26,001 |
Inter-segment sales | 56,159 | 3,636 | 59,795 |
Interest income | 856 | 34 | 890 |
Interest expense | 4,168 | 66 | 4,234 |
Income taxes | 19,398 | 3,233 | 22,631 |
Depreciation and amortization | 7,605 | 834 | 8,439 |
Net earnings attributable to Twin Disc | 25,150 | 6,759 | 31,909 |
Assets | 271,454 | 54,028 | 325,482 |
Expenditures for segment assets | 11,293 | 334 | 11,627 |
The following is a reconciliation of reportable segment net sales, net earnings and assets to the Company's consolidated totals (in thousands):
2013 | 2012 | 2011 | |
Net sales : | |||
Total net sales from reportable segments | $375,952 | $454,585 | $396,189 |
Elimination of inter-company sales | (90,670 ) | (98,715 ) | (85,796 ) |
Total consolidated net sales | $285,282 | $355,870 | $310,393 |
Net earnings attributable to Twin Disc: | |||
Total net earnings from | |||
reportable segments | $ 15,981 | $ 36,768 | $ 31,909 |
Other corporate expenses | (12,099) | (10,025 ) | (13,912 ) |
Total consolidated net earnings | |||
attributable to Twin Disc | $ 3,882 | $ 26,743 | $ 17,997 |
Assets | |||
Total assets for reportable segments | $315,582 | $330,373 | |
Corporate assets and eliminations | (30,124 ) | (26,541) | |
Total consolidated assets | $285,458 | $303,832 | |
Other significant items (in thousands): | |||
Segment | Consolidated | ||
Totals | Adjustments | Totals | |
2013 | |||
Interest income | $ 498 | $ (396) | $ 102 |
Interest expense | 3,310 | (1,875) | 1,435 |
Income taxes | 6,742 | (1,756) | 4,986 |
Depreciation and amortization | 9,314 | 1,524 | 10,838 |
Expenditures for segment assets | 6,054 | 528 | 6,582 |
2012 | |||
Interest income | $ 727 | $ (632) | $ 95 |
Interest expense | 3,862 | (2,387) | 1,475 |
Income taxes | 21,904 | (4,089) | 17,815 |
Depreciation and amortization | 9,244 | 1,512 | 10,756 |
Expenditures for segment assets | 12,979 | 754 | 13,733 |
2011 | |||
Interest income | $ 890 | $ (792) | $ 98 |
Interest expense | 4,234 | (2,515) | 1,719 |
Income taxes | 22,631 | (8,734) | 13,897 |
Depreciation and amortization | 8,439 | 1,465 | 9,904 |
Expenditures for segment assets | 11,627 | 401 | 12,028 |
All adjustments represent inter-company eliminations and corporate amounts.
Geographic information about the Company is summarized as follows (in thousands):
2013 | 2012 | 2011 | |
Net sales | |||
United States | $127,844 | $165,658 | $127,469 |
China | 29,119 | 19,955 | 9,041 |
Italy | 19,140 | 27,075 | 32,063 |
Canada | 10,846 | 44,889 | 44,659 |
Other countries | 98,333 | 98,293 | 97,161 |
Total | $285,282 | $355,870 | $310,393 |
Net sales by geographic region are based on product shipment destination. | |||
2013 | 2012 | ||
Long-lived assets | |||
United States | $ 51,618 | $ 53,083 | |
Switzerland | 7,964 | 8,278 | |
Belgium | 7,262 | 7,372 | |
Italy | 3,817 | 4,438 | |
Other countries | 2,330 | 1,053 | |
Total | $ 72,991 | $ 74,224 | |
One customer, Sewart Supply, Inc. (a distributor of Twin Disc), accounted for approximately 11% of consolidated net sales in fiscal 2013. There were no customers that accounted for 10% or more of consolidated net sales in fiscal 2012 or fiscal 2011.
K. STOCK-BASED COMPENSATION
During fiscal 2011, the Company adopted the Twin Disc, Incorporated 2010 Stock Incentive Plan for Non-Employee Directors (the "Directors' Plan"), a plan to grant non-employee directors equity based awards up to 250,000 shares of common stock, and the Twin Disc, Incorporated 2010 Long-Term Incentive Compensation Plan (the "Incentive Plan"), a plan under which officers and key employees may be granted equity based awards up to 650,000 shares of common stock. The Directors' Plan may grant options to purchase shares of common stock, at the discretion of the board, to non-employee directors who are elected or reelected to the board, or who continue to serve on the board. Such options carry an exercise price equal to the fair market value of the Company's common stock as of the date of grant, vest immediately, and expire ten years after the date of grant. Options granted under the Incentive Plan are determined to be non-qualified or incentive stock options as of the date of grant, and may carry a vesting schedule. For options under the Incentive Plan that are intended to qualify as incentive stock options, if the optionee owns more than 10% of the total combined voting power of the Company's stock, the price will not be less than 110% of the grant date fair market value and the options expire five years after the date of grant. There were no incentive options granted to a greater than 10% shareholder during the years presented. There were no options outstanding under the Directors' Plan and the Incentive Plan as of June 30, 2013 and 2012.
The Company has 21,600 non-qualified stock options outstanding as of June 30, 2013 under the Twin Disc, Incorporated Plan for Non-Employee Directors and Twin Disc, Incorporated 2004 Stock Incentive Plans. The 2004 plans were terminated during 2011, except options then outstanding will remain so until exercised or until they expire.
Shares available for future options as of June 30 were as follows:
2013 | 2012 | |
2010 Long-Term Incentive Compensation Plan | 541,476 | 600,831 |
2010 Stock Incentive Plan for Non-employee Directors | 204,988 | 223,726 |
Stock option transactions under the plans during 2013 were as follows:
Weighted | Weighted Average | Aggregate | ||
Average | Remaining Contractual | Intrinsic | ||
2013 | Price | Life (years) | Value | |
Non-qualified stock options: | ||||
Options outstanding | ||||
at beginning of year | 65,600 | $ 7.30 | ||
Granted | - | - | ||
Canceled/expired | (8,000) | 3.61 | ||
Exercised | (36,000) | 3.57 | ||
Options outstanding at June 30 | 21,600 | $ 14.88 | 4.94 | $202,776 |
Options price range | ||||
($5.73 - $7.19) | ||||
Number of shares | 2,400 | |||
Weighted average price | $ 6.23 | |||
Weighted average remaining life | 2.00 years | |||
Options price range | ||||
($10.01 - $27.55) | ||||
Number of shares | 19,200 | |||
Weighted average price | $ 15.96 | |||
Weighted average remaining life | 5.31 years | |||
The Company accounts for stock based compensation in accordance with ASC Topic 718-10, "Compensation – Stock Compensation." In addition, the Company computes its windfall tax pool using the shortcut method. ASC Topic 718-10 requires the Company to expense the cost of employee services received in exchange for an award of equity instruments using the fair-value-based method. All options were 100% vested at the adoption of this statement.
During fiscal 2013, 2012 and 2011 the Company granted no non-qualified stock options. As a result, no compensation cost has been recognized in the Consolidated Statements of Operations and Comprehensive Income for fiscal 2013, 2012 and 2011, respectively.
The total intrinsic value of options exercised during the years ended June 30, 2013, 2012 and 2011 was approximately $539,000, $1,002,000 and $630,000, respectively.
In fiscal 2013, 2012 and 2011, the Company granted a target number of 28,255, 15,449 and 98,358 performance stock unit awards, respectively, to various employees of the Company, including executive officers. The performance stock unit awards granted in fiscal 2013 will vest if the Company achieves a specified target objective relating to consolidated economic profit (as defined in the Performance Stock Unit Award Grant Agreement) in the cumulative three fiscal year period ending June 30, 2015. The performance stock unit awards granted in fiscal 2013 are subject to adjustment if the Company's economic profit for the period falls below or exceeds the specified target objective, and the maximum number of performance stock units that can be awarded if the target objective is exceeded is 33,322. Based upon actual results to date and the low probability of achieving the threshold performance levels, the Company is not accruing the performance stock unit awards granted in fiscal 2013 and has reversed previously recognized expenses related to these awards during the second quarter of fiscal 2013. The performance stock unit awards granted in fiscal 2012 will vest if the Company achieves a specified target objective relating to consolidated economic profit (as defined in the Performance Stock Unit Award Grant Agreement) in the cumulative three fiscal year period ending June 30, 2014. The performance stock unit awards granted in fiscal 2012 are subject to adjustment if the Company's economic profit for the period falls below or exceeds the specified target objective, and the maximum number of performance stock units that can be awarded if the target objective is exceeded is 18,233. Based upon actual results to date and the low probability of achieving the threshold performance levels, the Company is not accruing the performance stock unit awards granted in fiscal 2012 and has reversed previously recognized expenses related to these awards during the second quarter of fiscal 2013. The performance stock unit awards granted in fiscal 2011 are subject to adjustment if the Company's economic profit for
45
Table of Contents
the period falls below or exceeds the specified target objective, and the maximum number of performance stock units that can be awarded if the target objective is exceeded is 118,030. Based upon actual results to date, the Company is accruing the performance stock unit awards granted in fiscal 2011 at the maximum level. There were 16,811, 133,479 and 316,698 unvested performance stock unit awards outstanding at June 30, 2013, 2012 and 2011, respectively. The weighted average grant date fair value of the unvested awards at June 30, 2013 was $28.90. The performance stock unit awards are remeasured at fair-value based upon the Company's stock price at the end of each reporting period. The fair-value of the stock unit awards are expensed over the performance period for the shares that are expected to ultimately vest. The compensation expense (income) for the year ended June 30, 2013, 2012 and 2011 related to the performance stock unit award grants, approximated $1,238,000, $(631,000) and $4,246,000, respectively. At June 30, 2013, the Company had $397,000 of unrecognized compensation expense related to the unvested shares that would vest if the specified target objective was achieved for the fiscal 2013 and 2012 awards. The total fair value of performance stock unit awards vested in fiscal 2013, 2012 and 2011 was $2,787,000, $2,068,000 and $0, respectively. The performance stock unit awards are cash based, and are thus recorded as a liability on the Company's Consolidated Balance Sheets. As of June 30, 2013, these awards are included in "Accrued liabilities" ($2,787,000) due to the awards having a performance period ending in less than one year. As of June 30, 2012, these awards are included in "Accrued liabilities" ($2,068,000) and "Other long-term liabilities" ($1,547,000) due to a portion of the awards having performance periods ending in less than one year, with the others all exceeding one year.
In fiscal 2013, 2012 and 2011, the Company granted a target number of 28,535, 15,335 and 72,546 performance stock awards, respectively, to various employees of the Company, including executive officers. The performance stock awards granted in fiscal 2013 will vest if the Company achieves a specified target objective relating to consolidated economic profit (as defined in the Performance Stock Award Grant Agreement) in the cumulative three fiscal year period ending June 30, 2015. The performance stock awards granted in fiscal 2013 are subject to adjustment if the Company's economic profit for the period falls below or exceeds the specified target objective, and the maximum number of performance shares that can be awarded if the target objective is exceeded is 32,880. Based upon actual results to date and the low probability of achieving the threshold performance levels, the Company is not accruing the performance stock awards granted in fiscal 2013 and has reversed previously recognized expenses related to these awards during the second quarter of fiscal 2013. The performance stock awards granted in fiscal 2012 will vest if the Company achieves a specified target objective relating to consolidated economic profit (as defined in the Performance Stock Award Grant Agreement) in the cumulative three fiscal year period ending June 30, 2014. The performance stock awards granted in fiscal 2012 are subject to adjustment if the Company's economic profit for the period falls below or exceeds the specified target objective, and the maximum number of performance shares that can be awarded if the target objective is exceeded is 17,688. Based upon actual results to date and the low probability of achieving the threshold performance levels, the Company is not accruing the performance stock awards granted in fiscal 2012 and has reversed previously recognized expenses related to these awards during the second quarter of fiscal 2013. The performance stock awards granted in fiscal 2011 are subject to adjustment if the Company's economic profit for the period falls below or exceeds the specified target objective, and the maximum number of performance shares that can be awarded if the target objective is exceeded is 87,055. Based upon actual results to date, the Company is accruing the performance stock awards granted in fiscal 2011 at the maximum level. There were 40,231, 102,391 and 242,563 unvested performance stock awards outstanding at June 30, 2013, 2012 and 2011, respectively. The fair value of the stock awards (on the date of grant) is expensed over the performance period for the shares that are expected to ultimately vest. The compensation expense for the year ended June 30, 2013, 2012 and 2011, related to performance stock awards, approximated $209,000, $838,000 and $876,000, respectively. The weighted average grant date fair value of the unvested awards at June 30, 2013 was $26.16. At June 30, 2013, the Company had $1,052,000 of unrecognized compensation expense related to the unvested shares that would vest if the specified target objective was achieved for the fiscal 2013 and 2012 awards. The total fair value of performance stock awards vested in fiscal 2013, 2012 and 2011 was $2,055,000, $1,671,000 and $0, respectively.
In addition to the performance shares mentioned above, the Company has unvested restricted stock outstanding that will vest if certain service conditions are fulfilled. The fair value of the restricted stock grants is recorded as compensation over the vesting period, which is generally 1 to 3 years. During fiscal 2013, 2012 and 2011, the Company granted 83,729, 43,620 and 119,268 service based restricted shares, respectively, to employees and non-employee directors in each year. A total of 30,532 shares of restricted stock were forfeited during fiscal 2013. There were 186,469, 250,323 and 237,691 unvested shares outstanding at June 30, 2013, 2012 and 2011, respectively. Compensation expense of $1,234,000, $1,435,000 and $1,026,000 was recognized during the year ended June 30, 2013, 2012 and 2011, respectively, related to these service-based awards. The total fair value of restricted stock grants vested in fiscal 2013, 2012 and 2011 was $2,177,000, $977,000 and $133,000, respectively.
46
Table of Contents
As of June 30, 2013, the Company had $1,097,000 of unrecognized compensation expense related to restricted stock which will be recognized over the next three years.
L. ENGINEERING AND DEVELOPMENT COSTS
Engineering and development costs include research and development expenses for new products, development and major improvements to existing products, and other costs for ongoing efforts to refine existing products. Research and development costs charged to operations totaled $3,058,000, $2,657,000 and $2,475,000 in fiscal 2013, 2012 and 2011, respectively. Total engineering and development costs were $9,396,000, $9,508,000 and $8,776,000 in fiscal 2013, 2012 and 2011, respectively.
M. PENSION AND OTHER POSTRETIREMENT BENEFIT PLANS
The Company has non-contributory, qualified defined benefit pension plans covering substantially all domestic employees hired prior to October 1, 2003, and certain foreign employees. Domestic plan benefits are based on years of service, and, for salaried employees, on average compensation for benefits earned prior to January 1, 1997, and on a cash balance plan for benefits earned after January 1, 1997. The Company's funding policy for the plans covering domestic employees is to contribute an actuarially determined amount which falls between the minimum and maximum amount that can be deducted for federal income tax purposes.
On June 3, 2009, the Company announced it would freeze future accruals under the domestic defined benefit pension plans effective August 1, 2009.
In addition, the Company has unfunded, non-qualified retirement plans for certain management employees and Directors. In the case of management employees, benefits are based either on final average compensation or on an annual credit to a bookkeeping account, intended to restore the benefits that would have been earned under the qualified plans, but for the earnings limitations under the Internal Revenue Code. In the case of Directors, benefits are based on years of service on the Board. All benefits vest upon retirement from the Company.
In addition to providing pension benefits, the Company provides other postretirement benefits, including healthcare and life insurance benefits for certain domestic retirees. All employees retiring after December 31, 1992, and electing to continue healthcare coverage through the Company's group plan, are required to pay 100% of the premium cost.
The measurement date for the Company's pension and postretirement benefit plans in fiscal 2013 and 2012 was June 30.
Obligations and Funded Status
47
Table of Contents
The following table sets forth the Company's defined benefit pension plans' and other postretirement benefit plans' funded status and the amounts recognized in the Company's balance sheets and statement of operations and comprehensive income as of June 30 (in thousands):
Other | ||||
Pension | Postretirement | |||
Benefits | Benefits | |||
2013 | 2012 | 2013 | 2012 | |
Change in benefit obligation: | ||||
Benefit obligation, beginning of year | $133,261 | $126,514 | $19,645 | $ 20,571 |
Service cost | 367 | 292 | 34 | 41 |
Interest cost | 5,399 | 6,231 | 766 | 985 |
Actuarial (gain) loss | (4,123) | 9,082 | (938) | 161 |
Contributions by plan participants | 162 | 182 | 677 | - |
Benefits paid | (9,220 ) | (9,040 ) | (2,445 ) | (2,113 ) |
Benefit obligation, end of year | $125,846 | $133,261 | $ 17,739 | $ 19,645 |
Change in plan assets: | ||||
Fair value of assets, beginning of year | $ 88,775 | $ 97,530 | $ - | $ - |
Actual return on plan assets | 10,500 | (4,077) | - | - |
Employer contribution | 4,506 | 4,180 | 1,768 | 2,113 |
Contributions by plan participants | 162 | 182 | 677 | - |
Benefits paid | (9,220 ) | (9,040 ) | (2,445 ) | (2,113 ) |
Fair value of assets, end of year | $ 94,723 | $ 88,775 | $ - | $ - |
Funded status | $(31,123 ) | $(44,486 ) | $(17,739 ) | $(19,645 ) |
Amounts recognized in the balance sheet consist of: | ||||
Other assets - noncurrent | $ 566 | $ 411 | $ - | $ - |
Accrued liabilities - current | (389) | (113) | (2,470) | (2,862) |
Accrued retirement benefits - noncurrent | (31,300) | (44,784) | (15,269 ) | (16,783 ) |
Net amount recognized | $(31,123) | $(44,486) | $(17,739 ) | $(19,645 ) |
Amounts recognized in accumulated other comprehensive loss consist of (net of tax): | ||||
Net transition obligation | $ 345 | $ 369 | $ - | $ - |
Actuarial net loss | 38,933 | 46,163 | 3,570 | 4,549 |
Net amount recognized | $ 39,278 | $ 46,532 | $ 3,570 | $ 4,549 |
The amounts in accumulated other comprehensive loss that are expected to be recognized as components of net periodic benefit cost during the next fiscal year for the qualified domestic defined benefit and other postretirement benefit plans are as follows (in thousands):
Other | ||
Pension | Postretirement | |
Benefits | Benefits | |
Net transition obligation | $ 36 | $ - |
Actuarial net loss | 2,889 | 602 |
Net amount to be recognized | $2,925 | $ 602 |
The accumulated benefit obligation for all defined benefit pension plans was approximately $125,846,000 and $133,261,000 at June 30, 2013 and 2012, respectively.
Information for pension plans with an accumulated benefit obligation in excess of plan assets (in thousands) :
June 30 | ||
2013 | 2012 | |
Projected and accumulated benefit obligation | $123,933 | $131,369 |
Fair value of plan assets | 92,244 | 86,472 |
Components of Net Periodic Benefit Cost (in thousands):
Pension Benefits | |||
2013 | 2012 | 2011 | |
Service cost | $ 367 | $ 292 | $ 198 |
Interest cost | 5,399 | 6,231 | 6,324 |
Expected return on plan assets | (6,382) | (7,766) | (6,096) |
Settlement loss | 5 | 11 | 23 |
Amortization of transition obligation | 35 | 34 | - |
Amortization of actuarial net loss | 3,357 | 2,319 | 3,118 |
Net periodic benefit cost | $ 2,781 | $1,121 | $3,567 |
Other Postretirement Benefits | |||
2013 | 2012 | 2011 | |
Service cost | $ 34 | $ 41 | $ 32 |
Interest cost | 766 | 985 | 1,096 |
Amortization of prior service cost | - | (508) | (678) |
Amortization of actuarial net loss | 792 | 929 | 1,124 |
Net periodic benefit cost | $1,592 | $1,447 | $ 1,574 |
Other Changes in Plan Assets and Benefit Obligations Recognized in Other Comprehensive Income for Fiscal 2013 (Pre-tax, in thousands):
Pension | Other Postretirement Benefits | |
Net gain | $ (8,357) | $ (938) |
Amortization of prior service benefit | - | - |
Amortization of transition asset | (35) | - |
Amortization of net (loss) gain | (3,357 ) | (792) |
Total recognized in other comprehensive income | (11,749) | (1,730) |
Net periodic benefit cost | 2,781 | 1,592 |
Total recognized in net periodic benefit cost and | ||
other comprehensive income | $ (8,968) | $ (138) |
Additional Information
Assumptions (as of June 30, 2013 and 2012)
Other | ||||
Pension Benefits | Postretirement Benefits | |||
Weighted average assumptions used | ||||
to determine benefit obligations | ||||
at June 30 | ||||
2013 | 2012 | 2013 | 2012 | |
Discount rate | 4.35% | 4.20% | 3.99% | 4.20% |
Expected return on plan assets | 7.41% | 7.50% | ||
Weighted average assumptions used | ||||
to determine net periodic benefit | ||||
cost for years ended June 30 | ||||
Other | ||||||
Pension Benefits | Postretirement Benefits | |||||
2013 | 2012 | 2011 | 2013 | 2012 | 2011 | |
Discount rate | 4.20% | 5.16% | 5.09% | 4.20% | 5.16% | 5.09% |
Expected return on plan assets | 7.50% | 8.50% | 8.50% | |||
The assumed weighted-average healthcare cost trend rate was 7.5% in 2013, grading down to 5% in 2017. A 1% increase in the assumed health care cost trend would increase the accumulated postretirement benefit obligation by approximately $406,000 and the service and interest cost by approximately $17,000. A 1% decrease in the assumed health care cost trend would decrease the accumulated postretirement benefit obligation by approximately $365,000 and the service and interest cost by approximately $15,000.
Plan Assets
The Company's Pension Committee ("Committee") oversees investment matters related to the Company's funded benefit plans. The Committee works with external actuaries and investment consultants on an ongoing basis to establish and monitor investment strategies and target asset allocations. The overall objective of the Committee's investment strategy is to earn a rate of return over time to satisfy the benefit obligations of the pension plans and to maintain sufficient liquidity to pay benefits and address other cash requirements of the pension plans. The Committee has established an Investment Policy Statement which provides written documentation of the Company's expectations regarding its investment programs for the pension plans, establishes objectives and guidelines for the investment of the plan assets consistent with the Company's financial and benefit-related goals, and outlines criteria
48
Table of Contents
and procedures for the ongoing evaluation of the investment program. The Company employs a total return on investment approach whereby a mix of investments among several asset classes are used to maximize long-term return of plan assets while avoiding excessive risk. Investment risk is measured and monitored on an ongoing basis through quarterly investment portfolio reviews, and annual liability measurements.
The Company's pension plan weighted-average asset allocations at June 30, 2013 and 2012 by asset category are as follows:
Target | June 30 | ||
Asset Category | Allocation | 2013 | 2012 |
Equity securities | 65% | 64% | 64% |
Debt securities | 25% | 26% | 25% |
Real estate | 10% | 10% | 11% |
100% | 100% | 100% | |
Due to market conditions and other factors, actual asset allocation may vary from the target allocation outlined above. The domestic pension plans held 98,211 shares of Company stock with a fair market value of $2,327,601 (2.5 percent of total plan assets) at June 30, 2013 and 98,211 shares with a fair market value of $1,815,921 (2.2 percent of total plan assets) at June 30, 2012.
The plans have a long-term return assumption of 7.50%. This rate was derived based upon historical experience and forward-looking return expectations for major asset class categories.
Fair value is defined as the price that would be received on the sale of an asset or paid to transfer a liability in an orderly transaction between market participants at the measurement date. The inputs used to measure fair value are classified into the following hierarchy:
Level I | Unadjusted quoted prices in active markets for identical instruments |
Level II | Unadjusted quoted prices in active markets for similar instruments, or |
Unadjusted quoted prices for identical or similar instruments in markets that are not active, or | |
Other inputs that are observable in the market or can be corroborated by observable market data | |
Level III | Use of one or more significant unobservable inputs |
The following table presents plan assets using the fair value hierarchy as of June 30, 2013 (in thousands):
Total | Level I | Level II | Level III | |
Cash and cash equivalents | $ 2,376 | $ 2,376 | $ - | $ - |
Equity securities: | ||||
U.S. (a) | 28,334 | 28,334 | - | - |
International (b) | 15,409 | 9,315 | 6,094 | - |
Fixed income (c) | 20,935 | 7,240 | 13,695 | - |
Annuity contracts | 5,819 | - | - | 5,819 |
Real estate | 8,697 | - | 5,685 | 3,012 |
Other (d) | 13,153 | - | - | 13,153 |
Total | $94,723 | $47,265 | $25,474 | $21,984 |
(a) U.S. equity securities include companies that are well diversified by industry sector and equity style (i.e., growth and value strategies). Investments are primarily in large capitalization stocks and, to a lesser extent, mid- and small-cap stocks.
(b) International equities are invested in companies that are traded on exchanges outside the U.S. and are well diversified by industry sector, country, capitalization and equity style (i.e., growth and value strategies). Certain
49
Table of Contents
assets are invested in international commingled equity funds. The vast majority of the investments are made in companies in developed markets with a smaller percentage in emerging markets.
(c) Fixed income consists of corporate bonds with investment grade BBB or better from diversified industries, as well as government debt securities.
(d) Other consists of hedged equity.
The valuation methodologies used for the Company's pension plans' investments measured at fair value are as follows:
Common stock and traded mutual funds – valued at the closing price reported on the active market on which the individual securities are traded.
Common collective trusts and other mutual funds – valued at the net asset value ("NAV") as determined by the custodian of the fund. The NAV is based on the fair value of the underlying assets owned by the fund, minus its liabilities, divided by the number of units outstanding.
The following table presents a reconciliation of the fair value measurements using significant unobservable inputs (Level III) as of June 30, 2013 (in thousands):
Annuity | |||
Contracts | Real Estate | Other | |
Balance – June 30, 2012 | $ 5,333 | $ 5,324 | $11,988 |
Actual return on plan assets: | |||
Relating to assets still held at reporting date | 298 | 391 | 1,165 |
Relating to assets sold during the period | - | - | - |
Purchases, sales and settlements, net | 188 | (2,518) | - |
Transfers in and/or out of Level III | - | (185) | - |
Balance – June 30, 2013 | $ 5,819 | $ 3,012 | $ 13,153 |
Cash Flows
Contributions
The Company expects to contribute $2,643,000 to its defined benefit pension plans in fiscal 2014.
Estimated Future Benefit Payments
The following benefit payments, which reflect expected future service, as appropriate, are expected to be paid (in thousands):
Other Postretirement Benefits | ||||
Pension | Gross | Part D | Net Benefit | |
Benefits | Benefits | Reimbursement | Payments | |
2014 | $10,336 | $2,469 | $ - | $2,469 |
2015 | 9,672 | 2,173 | - | 2,173 |
2016 | 9,491 | 1,846 | - | 1,846 |
2017 | 9,203 | 1,739 | - | 1,739 |
2018 | 10,534 | 1,605 | - | 1,605 |
Years 2019- 2023 | 41,895 | 6,095 | - | 6,095 |
The Company sponsors defined contribution plans covering substantially all domestic employees and certain foreign employees. These plans provide for employer contributions based primarily on employee participation. The total expense under the plans was $2,074,000, $2,411,000 and $2,469,000 in fiscal 2013, 2012 and 2011, respectively.
50
Table of Contents
N. INCOME TAXES
United States and foreign earnings before income taxes and minority interest were as follows (in thousands):
2013 | 2012 | 2011 | |
United States | $3,935 | $43,335 | $27,914 |
Foreign | 5,302 | 1,421 | 4,115 |
$9,237 | $44,756 | $32,029 |
The provision (benefit) for income taxes is comprised of the following (in thousands):
2013 | 2012 | 2011 | |
Currently payable: | |||
Federal | $1,745 | $7,310 | $8,837 |
State | (234) | 188 | 373 |
Foreign | 2,788 | 2,831 | 3,333 |
4,299 | 10,329 | 12,543 | |
Deferred: | |||
Federal | 1,122 | 7,653 | (315) |
State | 439 | 662 | (97) |
Foreign | (874) | (829) | 1,766 |
687 | 7,486 | 1,354 | |
$4,986 | $17,815 | $13,897 |
The components of the net deferred tax asset as of June 30 are summarized in the table below (in thousands).
2013 | 2012 | |
Deferred tax assets: | ||
Retirement plans and employee benefits | $20,675 | $25,316 |
State net operating loss and other state credit carryforwards | 91 | 14 |
Inventory | 1,421 | 1,283 |
Reserves | 2,388 | 2,016 |
Research & development capitalization | - | 63 |
Foreign NOL carryforwards | 4,311 | 4,359 |
Accruals | 822 | 543 |
Other assets | 98 | 96 |
29,806 | 33,690 | |
Deferred tax liabilities: | ||
Property, plant and equipment | 10,295 | 8,780 |
Intangibles | 5,595 | 5,869 |
Other liabilities | 439 | 490 |
16,329 | 15,139 | |
Valuation Allowance | (3,724) | (3,811) |
Total net deferred tax assets | $ 9,753 | $ 14,740 |
Note: $216,000 of this net deferred tax position is included in Accrued Liabilities.
The Company maintains valuation allowances when it is more likely than not that all or a portion of a deferred tax asset will not be realized. Changes in valuation allowances from period to period are included in the tax provision in the period of change. In determining whether a valuation allowance is required, the Company takes into account such factors as prior earnings history, expected future earnings, carry-back and carry-forward periods, and tax strategies that could potentially enhance the likelihood of realization of a deferred tax asset. During fiscal 2013, the Company continued to incur operating losses in certain foreign jurisdictions where the loss carryforward period is unlimited. The Company has evaluated the realizability of the net deferred tax assets related to these jurisdictions and concluded that based primarily upon continuing losses in these jurisdictions and failure to achieve targeted levels
51
Table of Contents
of improvement, a full valuation allowance continues to be necessary. Therefore, the Company recorded a net reduction in valuation allowance of $87,000. Management believes that it is more likely than not that the results of future operations will generate sufficient taxable income and foreign source income to realize the remaining deferred tax assets.
Following is a reconciliation of the applicable U.S. federal income taxes to the actual income taxes reflected in the statements of operations (in thousands):
2013 | 2012 | 2011 | |
| |||
U.S. federal income tax at 35% | $3,104 | $15,595 | $11,163 |
Increases (reductions) in tax resulting from: | |||
Foreign tax items | 88 | 169 | 1,119 |
State taxes | 296 | 797 | 129 |
Valuation allowance | 1,216 | 1,060 | 2,491 |
Change in prior year estimate | (526) | (215) | (157) |
Research & development tax credits | 309 | 96 | (387) |
Section 199 deduction | (84) | (908) | (735) |
Goodwill impairment | - | 1,292 | - |
Other, net | 583 | ( 71) | 274 |
$ 4,986 | $17,815 | $13,897 |
The Company has not provided additional U.S. income taxes on cumulative earnings of consolidated foreign subsidiaries that are considered to be reinvested indefinitely. The Company reaffirms its position that these earnings remain permanently invested, and has no plans to repatriate funds to the U.S. for the foreseeable future. These earnings relate to ongoing operations and were approximately $17.8 million at June 30, 2013. Such earnings could become taxable upon the sale or liquidation of these foreign subsidiaries or upon dividend repatriation. It is not practicable to estimate the amount of unrecognized withholding taxes and deferred tax liability on such earnings. The Company's intent is for such earnings to be reinvested by the subsidiaries or to be repatriated only when it would be tax effective through the utilization of foreign tax credits.
Annually, we file income tax returns in various taxing jurisdictions inside and outside the United States. In general, the tax years that remain subject to examination are 2009 through 2013 for our major operations in Italy, Belgium and Japan. The tax years open to examination in the U.S. are for years subsequent to fiscal 2011.
The Company has approximately $1.556 million of unrecognized tax benefits as of June 30, 2013, which, if recognized would impact the effective tax rate. During the fiscal year the amount of unrecognized tax benefits increased primarily due to the tax positions taken during the fiscal year partially offset by the settlement of an IRS examination. The Company's policy is to accrue interest and penalties related to unrecognized tax benefits in income tax expense.
Below is a reconciliation of beginning and ending amount of unrecognized tax benefits (in thousands):
June 30, 2013 | June 30, 2012 | |
Unrecognized tax benefits, beginning of year | $1,163 | $1,431 |
Additions based on tax positions related to the prior year | 351 | - |
Additions based on tax positions related to the current year | 361 | 132 |
Reductions based on tax positions related to the prior year | - | - |
Subtractions due to statutes closing | (40) | (50) |
Settlements with taxing authorities | (279) | (350) |
Unrecognized tax benefits, end of year | $1,556 | $1,163 |
Substantially all of the Company's unrecognized tax benefits as of June 30, 2013, if recognized, would affect the effective tax rate. As of June 30, 2013 and 2012, the amounts accrued for interest and penalties totaled $296,000 and $41,000, respectively, and are not included in the reconciliation above.
52
Table of Contents
O. CONTINGENCIES
The Company is involved in litigation of which the ultimate outcome and liability to the Company, if any, are not presently determinable. Management believes that final disposition of such litigation will not have a material impact on the Company's results of operations or financial position.
P. RESTRUCTURING OF OPERATIONS
During the fourth quarter of fiscal 2013, the Company recorded a pre-tax restructuring charge of $708,000 related to a workforce reduction at its Belgian operation and the elimination of a Corporate officer position. The Belgian charge consisted of the minimum legal indemnity for 22 manufacturing employees, as negotiations with the workforce were ongoing as of June 30, 2013. Subsequently, negotiations were completed in July 2013, resulting in an additional restructuring charge of approximately $1,077,000 to be recorded in the first quarter of fiscal 2014. During fiscal 2013, the Company made no cash payments, resulting in an accrual balance at June 30, 2013 of $708,000.
53
Table of Contents
TWIN DISC, INCORPORATED AND SUBSIDIARIES
SCHEDULE II - VALUATION AND QUALIFYING ACCOUNTS
for the years ended June 30, 2013, 2012 and 2011 (in thousands)
-----------Additions---------- | |||||
Balance at | Charged to | Balance at | |||
Beginning | Costs and | Net | End of | ||
Description | of Period | Expenses | Acquired | Deductions (1) | Period |
2013: | |||||
Allowance for losses on | |||||
accounts receivable | $2,194 | $1,385 | $ - | $ 695 | $2,884 |
Deferred tax valuation | |||||
allowance | $3,811 | $1,112 | $ - | $1,199 (2) | $3,724 |
2012: | |||||
Allowance for losses on | |||||
accounts receivable | $2,093 | $ 549 | $ - | $ 448 | $2,194 |
Deferred tax valuation | |||||
allowance | $2,751 | $1,060 | $ - | $ - | $3,811 |
2011: | |||||
Allowance for losses on | |||||
accounts receivable | $1,792 | $1,078 | $ - | $ 777 | $2,093 |
Deferred tax valuation | |||||
allowance | $ 260 | $2,751 | $ - | $ 260 | $2,751 |
(1) Activity primarily represents amounts written-off during the year, along with other adjustments (primarily foreign currency translation adjustments).
(2) Represents adjustments resulting from foreign tax audits.
54
Table of Contents
SIGNATURES
Pursuant to the requirements of Section 13 or 15(d) of the Securities Exchange Act of 1934, the Registrant has duly caused this Report to be signed on its behalf by the undersigned, thereunto duly authorized.
September 13, 2013 | TWIN DISC, INCORPORATED |
By: /s/ MICHAEL E. BATTEN | |
Michael E. Batten | |
Chairman and Chief Executive Officer |
Pursuant to the requirements of the Securities Exchange Act of 1934, this Report has been signed below by the following persons on behalf of the registrant and in the capacities and on the dates indicated.
September 13, 2013 | By: /s/ MICHAEL E. BATTEN |
Michael E. Batten | |
Chairman, Chief Executive Officer and Director | |
September 13, 2013 | By: /s/ JOHN H. BATTEN |
John H. Batten | |
President, Chief Operating Officer and Director | |
September 13, 2013 | By: /s/ CHRISTOPHER J. EPERJESY |
Christopher J. Eperjesy | |
Vice President-Finance, Chief Financial Officer and Treasurer | |
September 13, 2013 | By: /s/ JEFFREY S. KNUTSON |
Jeffrey S. Knutson | |
Corporate Controller and Secretary (Chief Accounting Officer) | |
September 13, 2013 | Michael Doar, Director |
Malcolm F. Moore, Director | |
David B. Rayburn, Director | |
Michael C. Smiley, Director | |
Harold M. Stratton II, Director | |
David R. Zimmer, Director | |
By: /s/ JEFFREY S. KNUTSON | |
Jeffrey S. Knutson | |
Corporate Controller and Secretary (Attorney in Fact) |
55
Table of Contents
EXHIBIT INDEX
TWIN DISC, INCORPORATED
10-K for Year Ended June 30, 2013
Exhibit | Description | Included Herewith |
3a) | Restated Articles of Incorporation of Twin Disc, Incorporated (Incorporated by reference to Exhibit 3.1 of the Company's Form 8-K dated December 6, 2007). File No. 001-07635. | |
3b) | Restated Bylaws of Twin Disc, Incorporated, as amended through January 19, 2010 (Incorporated by reference to Exhibit 3.1 of the Company's Form 8-K dated January 21, 2010). File No. 001-07635. | |
4a) | Description of Shareholder Rights Plan and Form of Rights Agreement dated as of December 20, 2007 by and between the Company and Mellon Investor Services, LLC, as Rights Agent, with Form of Rights Certificate (Incorporated by reference to Item 3.03 and Exhibit 4 of the Company's Form 8-K dated December 20, 2007). File No. 001-07635. | |
4b) | First Amendment to Rights Agreement, effective as of May 1, 2012, between Twin Disc, Incorporated and Computershare Shareowner Services, LLC (Incorporated by reference to Exhibit 4.1 of the Company's Form 8-K dated May 1, 2012). File No. 001-07635.
| |
Exhibit 10 | Material Contracts | Included Herewith |
a) |
Director Tenure and Retirement Policy (Incorporated by reference to Exhibit 10a of the Company's Form 10-K/A filed September 19, 2011 for the year ended June 30, 2011). File No. 001-07635. | |
b) | The 2004 Stock Incentive Plan as amended (Incorporated by reference to Exhibit B of the Proxy Statement for the Annual Meeting of Shareholders held on October 20, 2006). File No. 001-07635. | |
c) | The 2004 Stock Incentive Plan for Non-Employee Directors as amended (Incorporated by reference to Exhibit 99 of the Company's Form 10-K for the year ended June 30, 2007). File No. 001-07635. | |
d) | The 2010 Long-Term Incentive Compensation Plan (Incorporated by reference to Appendix A of the Proxy Statement for the Annual Meeting of Shareholders held on October 15, 2010). File No. 001-07635. | |
e) | The 2010 Stock Incentive Plan for Non-Employee Directors (Incorporated by reference to Appendix B of the Proxy Statement for the Annual Meeting of Shareholders held on October 15, 2010). File No. 001-07635. | |
f) | Form of Performance Stock Award Grant Agreement for award of performance shares on July 28, 2011 (Incorporated by reference to Exhibit 10.1 of the Company's Form 8-K dated August 3, 2011). File No. 001-07635. | |
g) | Form of Performance Stock Unit Award Agreement for award of performance stock units on July 28, 2011 (Incorporated by reference to Exhibit 10.2 of the Company's Form 8-K dated August 3, 2011). File No. 001-07635. | |
h) | Form of Amendment to of Performance Stock Award Grant Agreement for award of performance shares on July 28, 2011 | X |
i) | Form of Amendment to of Performance Stock Unit Award Agreement for award of performance stock units on July 28, 2011 | X |
j) | Form of Restricted Stock Grant Agreement for restricted stock grants on July 28, 2011 (Incorporated by reference to Exhibit 10.3 of the Company's Form 8-K dated August 3, 2011). File No. 001-07635. | |
k) | Form of Performance Stock Award Grant Agreement for award of performance shares on July 26, 2012 (Incorporated by reference to Exhibit 10.1 of the Company's Form 8-K dated August 1, 2012). File No. 001-07635. | |
l) | Form of Performance Stock Unit Award Agreement for award of performance stock units on July 26, 2012 (Incorporated by reference to Exhibit 10.2 of the Company's Form 8-K dated August 1, 2012). File No. 001-07635. | |
m) | Form of Restricted Stock Grant Agreement for restricted stock grants on July 26, 2012 (Incorporated by reference to Exhibit 10.3 of the Company's Form 8-K dated August 1, 2012). File No. 001-07635. | |
n) | Form of Performance Stock Award Grant Agreement for award of performance shares on July 25, 2013 (Incorporated by reference to Exhibit 10.1 of the Company's Form 8-K dated July 31, 2013). File No. 001-07635. | |
o) | Form of Performance Stock Unit Award Agreement for award of performance stock units on July 25, 2013 (Incorporated by reference to Exhibit 10.2 of the Company's Form 8-K dated July 31, 2013). File No. 001-07635. | |
p) | Form of Restricted Stock Grant Agreement for restricted stock grants on July 25, 2013 (Incorporated by reference to Exhibit 10.3 of the Company's Form 8-K dated July 31, 2013). File No. 001-07635. | |
q) | Twin Disc, Incorporated Supplemental Executive Retirement Plan, amended and restated as of July 29, 2010 (Incorporated by reference to Exhibit 10.4 of the Company's Form 8-K dated August 4, 2010). File No. 001-07635. | |
r) | Forms of Change in Control Severance Agreements (Incorporated by reference to Exhibits 10.3, 10.4 and 10.5 of the Company's Form 8-K dated August 2, 2007). File No. 001-07635. | |
s) | Form of Indemnity Agreement (Incorporated by reference to Exhibit 10.5 of the Company's Form 8-K dated August 2, 2005). File No. 001-07635. | |
t) | Amended and Restated Loan Agreement for $40,000,000 Revolving Credit Dated May 13, 2011 (Incorporated by reference to Exhibit 10.1 of the Company's Form 8-K Dated May 13, 2011). File No. 001-07635. | |
u) | Consent and Waiver to Amended and Restated Loan Agreement for $40,000,000 Revolving Credit | X |
v) | Note Agreement for $25,000,000 of 6.05% Senior Notes due April 10, 2016 (Incorporated by reference to Exhibit 4.1 of the Company's Form 8-K dated April 12, 2006). File No. 001-07635. | |
w) | Amendment 1 to Note Agreement for 6.05% Senior Notes (Incorporated by reference to Exhibit 10p of the Company's Form 10-K for the year ended June 30, 2007). File No. 001-07635. | |
x) | Amendment 2 to Note Agreement for 6.05% Senior Notes (Incorporated by reference to Exhibit 10q of the Company's Form 10-K for the year ended June 30, 2007). File No. 001-07635. | |
y) | Amendment 3 to Note Agreement for 6.05% Senior Notes (Incorporated by reference to Exhibit 10w of the Company's Forms 10-K and 10-K/A for the year ended June 30, 2009). File No. 001-07635. | |
z) | Amendment 4 to Note Agreement for 6.05% Senior Notes (Incorporated by reference to Exhibit 10x of the Company's Forms 10-K and 10-K/A for the year ended June 30, 2009). File No. 001-07635. | |
aa) | Amendment 5 to Note Agreement for 6.05% Senior Notes. (Incorporated by reference to Exhibit 10ff of the Company's Form 10-K for the year ended June 30, 2011). File No. 001-07635. | |
bb) | Amendment 6 to Note Agreement for 6.05% Senior Notes. | X |
cc) | Amendment 7 to Note Agreement for 6.05% Senior Notes. | X |
dd) | Credit Agreement Between Twin Disc, Incorporated, Twin Disc International S.A., and Wells Fargo Bank, National Association, Dated November 19, 2012 (Incorporated by reference to Exhibit 10.1 of the Company's Form 8-K dated November 26, 2012). File No. 001-07635. |
Exhibit | Description | Included Herewith |
21 | Subsidiaries of the Registrant | X |
23 | Consent of Independent Registered Public Accounting Firm | X |
24 | Power of Attorney | X |
31a | Certification | X |
31b | Certification | X |
32a | Certification pursuant to 18 U.S.C. Section 1350 | X |
32b | Certification pursuant to 18 U.S.C. Section 1350 | X |
56
Table of Contents