UNITED STATES
SECURITIES AND EXCHANGE COMMISSION
Washington, D.C. 20549
FORM 10-K
(Mark One)
x | ANNUAL REPORT PURSUANT TO SECTION 13 OR 15(d) OF THE SECURITIES EXCHANGE ACT OF 1934 |
For the fiscal year ended December 31, 2015
OR
¨ | TRANSITION REPORT PURSUANT TO SECTION 13 OR 15(d) OF THE SECURITIES EXCHANGE ACT OF 1934 |
For the transition period from to
Commission File Number: 001-34756
Tesla Motors, Inc.
(Exact name of registrant as specified in its charter)
Delaware |
| 91-2197729 |
(State or other jurisdiction of incorporation or organization) |
| (I.R.S. Employer Identification No.) |
|
|
|
3500 Deer Creek Road Palo Alto, California |
| 94304 |
(Address of principal executive offices) |
| (Zip Code) |
(650) 681-5000
(Registrant's telephone number, including area code)
Securities registered pursuant to Section 12(b) of the Act:
Title of each class |
| Name of each exchange on which registered |
Common Stock, $0.001 par value |
| The NASDAQ Stock Market LLC |
Securities registered pursuant to Section 12(g) of the Act:
None
Indicate by check mark whether the registrant is a well-known seasoned issuer, as defined in Rule 405 of the Securities Act. Yes x No ¨
Indicate by check mark if the registrant is not required to file reports pursuant to Section 13 or 15(d) of the Act. Yes ¨ No x
Indicate by check mark whether the registrant (1) has filed all reports required to be filed by Section 13 or 15(d) of the Securities Exchange Act of 1934 ("Exchange Act") during the preceding 12 months (or for such shorter period that the registrant was required to file such reports), and (2) has been subject to such filing requirements for the past 90 days. Yes x No ¨
Indicate by check mark whether the registrant has submitted electronically and posted on its corporate Web site, if any, every Interactive Data File required to be submitted and posted pursuant to Rule 405 of Regulation S-T during the preceding 12 months (or for such shorter period that the registrant was required to submit and post such files). Yes x No ¨
Indicate by check mark if disclosure of delinquent filers pursuant to Item 405 of Regulation S-K (§229.405 of this chapter) is not contained herein, and will not be contained, to the best of registrant's knowledge, in definitive proxy or information statements incorporated by reference in Part III of this Form 10-K or any amendment to this Form 10-K. ¨
Indicate by check mark whether the registrant is a large accelerated filer, an accelerated filer, a non-accelerated filer or a smaller reporting company. See the definitions of "large accelerated filer," "accelerated filer," and "smaller reporting company" in Rule 12b-2 of the Exchange Act:
Large accelerated filer |
| x |
| Accelerated filer |
| ¨ |
|
|
|
| |||
Non-accelerated filer |
| ¨ (Do not check if a smaller reporting company) |
| Smaller reporting company |
| ¨ |
Indicate by check mark whether the registrant is a shell company (as defined in Rule 12b-2 of the Exchange Act). Yes ¨ No x
The aggregate market value of voting stock held by non-affiliates of the registrant, as of June 30, 2015, the last day of registrant's most recently completed second fiscal quarter, was $26,340,519,416 (based on the closing price for shares of the registrant's Common Stock as reported by the NASDAQ Global Select Market on June 30, 2015). Shares of Common Stock held by each executive officer, director, and holder of 5% or more of the outstanding Common Stock have been excluded in that such persons may be deemed to be affiliates. This determination of affiliate status is not necessarily a conclusive determination for other purposes.
As of January 31, 2016, there were 132,056,338 shares of the registrant's Common Stock outstanding.
DOCUMENTS INCORPORATED BY REFERENCE
Portions of the registrant's Proxy Statement for the 2015 Annual Meeting of Stockholders are incorporated herein by reference in Part III of this Annual Report on Form 10-K to the extent stated herein. Such proxy statement will be filed with the Securities and Exchange Commission within 120 days of the registrant's fiscal year ended December 31, 2015.
TESLA MOTORS, INC.
ANNUAL REPORT ON FORM 10-K FOR THE YEAR ENDED DECEMBER 31, 2015
INDEX
|
|
|
| Page |
PART I. |
|
| ||
|
|
|
|
|
Item 1. |
| Business |
| 4 |
Item 1A. |
| Risk Factors |
| 13 |
Item 1B. |
| Unresolved Staff Comments |
| 27 |
Item 2. |
| Properties |
| 28 |
Item 3. |
| Legal Proceedings |
| 28 |
Item 4. |
| Mine Safety Disclosures |
| 28 |
|
|
| ||
PART II. |
|
| ||
|
|
|
| |
Item 5. |
| Market for Registrant's Common Equity, Related Stockholder Matters and Issuer Purchases of Equity Securities |
| 29 |
Item 6. |
| Selected Financial Data |
| 31 |
Item 7. |
| Management's Discussion and Analysis of Financial Condition and Results of Operations |
| 32 |
Item 7A. |
| Quantitative and Qualitative Disclosures About Market Risk |
| 43 |
Item 8. |
| Financial Statements and Supplementary Data |
| 45 |
Item 9. |
| Changes in and Disagreements with Accountants on Accounting and Financial Disclosure |
| 74 |
Item 9A. |
| Controls and Procedures |
| 74 |
Item 9B. |
| Other Information |
| 74 |
|
|
| ||
PART III. |
|
| ||
|
|
|
| |
Item 10. |
| Directors, Executive Officers and Corporate Governance |
| 75 |
Item 11. |
| Executive Compensation |
| 75 |
Item 12. |
| Security Ownership of Certain Beneficial Owners and Management and Related Stockholder Matters |
| 75 |
Item 13. |
| Certain Relationships and Related Transactions, and Director Independence |
| 75 |
Item 14. |
| Principal Accountant Fees and Services |
| 75 |
|
|
|
| |
PART IV. |
|
| ||
|
|
|
| |
Item 15. |
| Exhibits and Financial Statement Schedules |
| 75 |
|
|
| ||
Signatures |
| 82 | ||
2
Forward-Looking Statements
The discussions in this Annual Report on Form 10-K contain forward-looking statements reflecting our current expectations that involve risks and uncertainties. These forward-looking statements include, but are not limited to, statements concerning our strategy, future operations, future financial position, future revenues, projected costs, profitability, expected cost reductions, capital adequacy, expectations regarding demand and acceptance for our technologies, growth opportunities and trends in the market in which we operate, prospects and plans and objectives of management. The words "anticipates", "believes", "estimates", "expects", "intends", "may", "plans", "projects", "will", "would" and similar expressions are intended to identify forward-looking statements, although not all forward-looking statements contain these identifying words. We may not actually achieve the plans, intentions or expectations disclosed in our forward-looking statements and you should not place undue reliance on our forward-looking statements. Actual results or events could differ materially from the plans, intentions and expectations disclosed in the forward-looking statements that we make. These forward-looking statements involve risks and uncertainties that could cause our actual results to differ materially from those in the forward-looking statements, including, without limitation, the risks set forth in Part I, Item 1A, "Risk Factors" in this Annual Report on Form 10-K and in our other filings with the Securities and Exchange Commission. We do not assume any obligation to update any forward-looking statements.
3
P ART I
I TEM 1. | BUSINESS |
Overview
We design, develop, manufacture and sell high-performance fully electric vehicles and energy storage products. We have established our own network of vehicle sales and service centers and Supercharger stations globally to accelerate the widespread adoption of electric vehicles. Our vehicles, electric vehicle engineering expertise, and business model differentiates us from incumbent automobile manufacturers.
We currently produce and sell two fully electric vehicles, the Model S sedan and the Model X sport utility vehicle (SUV). Both vehicles offer exceptional performance, functionality and attractive styling. We commenced deliveries of Model S in June 2012 and as of December 31, 2015 we have delivered over 107,000 new Model S vehicles worldwide. We have continued to improve Model S by introducing performance, all-wheel drive dual motor, and autopilot options, as well as free over-the-air software updates.
We commenced customer deliveries of Model X in the third quarter of 2015. This unique vehicle offers exceptional safety, seating for seven people, all-wheel drive, and our autopilot functionality. We are currently ramping production and deliveries of Model X in the United States and plan to offer it in Europe and Asia in 2016.
After the Model X, our goal is to introduce the Model 3, a lower priced sedan designed for the mass market. We intend to unveil Model 3 in the first quarter of 2016 and start production and deliveries in late 2017.
The commercial production of fully electric vehicles that meets consumers' range and performance expectations requires substantial design, engineering, and integration work on almost every system of our vehicles. Our design and vehicle engineering capabilities, combined with the technical advancements of our powertrain system, have enabled us to design and develop electric vehicles that we believe overcome the design, styling, and performance issues that have historically limited broad consumer adoption of electric vehicles. As a result, our customers enjoy several benefits, including:
| · | Long Range and Recharging Flexibility. Our vehicles offer ranges that significantly exceed those of any other commercially available electric vehicle. In addition, our vehicles incorporate our proprietary on-board charging system, permitting recharging from almost any available electrical outlet. Our vehicles also offer fast charging capability from our Supercharger network. We believe the long-range and charging flexibility of our vehicles will help reduce consumer anxiety over range, alleviate the need for expensive, large-scale charging infrastructure, and differentiate our vehicles as compared to those of our competitors. |
| · | High-Performance Without Compromised Design or Functionality. Our vehicles deliver unparalleled driving experiences with instantaneous and sustained acceleration through an extended range of speed. In addition, our vehicles provide best in class storage in the trunk and hood while offering design and performance comparable to, or better than, other premium vehicles. |
| · | Energy Efficiency and Cost of Ownership. Our vehicles offer consumers an attractive cost of ownership when compared to similar internal combustion engine or hybrid electric vehicles. Using only an electric powertrain enables us to create more energy efficient vehicles that are mechanically simpler than currently available hybrid or internal combustion engine vehicles. The cost to fuel our vehicles is less compared to internal combustion vehicles. We also expect our electric vehicles will have lower relative maintenance costs than hybrid, plug-in hybrid, or internal combustion engine vehicles due to fewer moving parts and the absence of certain components, including oil, oil filters, spark plugs and engine valves. Additionally, government incentives that are currently available can reduce the cost of ownership even further. |
We sell our vehicles through our own sales and service network which we are continuing to grow globally. We believe the benefits we receive from distribution ownership will enable us to improve the overall customer experience, the speed of product development and the capital efficiency of our business. We are also continuing to build our network of Superchargers in the United States, Europe and Asia to provide fast charging that enables convenient long distance travel.
In addition to developing our own vehicles, we sell energy storage products. We recently announced the next generation of our energy storage products, the 7 kWh and 10 kWh Powerwall for residential applications and the 100 kWh Powerpack for commercial and industrial applications. We began production and deliveries of these products, which we market under the Tesla Energy brand, in the third quarter of 2015.
We manufacture our products primarily at our facilities in Fremont, California, Lathrop, California, Tilburg, Netherlands and at our Gigafactory near Reno, Nevada. We are currently using battery packs manufactured at the Gigafactory for our energy storage products, and will do so for our vehicles in the future.
Our Vehicles and Products
We currently design, develop, manufacture and sell fully electric vehicles and energy storage products.
4
Model S
Model S is a fully electric, four-door, five-adult passenger sedan that offers compelling range and performance with zero tailpipe emissions. Model S offers a range on a single charge of up to 288 miles as determined using the United States EPA's combined two-cycle city/highway test. We offer performance and all-wheel drive dual motor system options. The performance version of our All-Wheel Drive Dual Motor Model S accelerates from 0 to 60 miles per hour in 2.8 seconds with the Ludicrous speed upgrade.
Model S offers a unique combination of functionality, convenience, safety and styling without compromising performance and energy efficiency. With the battery pack in the floor of the vehicle and the motor and gearbox in line with the rear axle, our single motor Model S provides best in class storage space. Model S is also available with premium luxury features, including a 17 inch touch screen driver interface, our advanced autopilot system with both active safety and convenience features, and over-the-air software updates. We believe the combination of performance, safety, styling, convenience and energy efficiency of Model S positions it as a compelling alternative to other vehicles in the luxury and performance segments.
Model X
Model X is a sport utility vehicle that offers exceptional functionality with high performance features such as our fully electric, all-wheel drive dual motor system and our autopilot system. Model X provides up to 257 miles of range on a single charge, and can accelerate from 0 to 60 as quickly as 3.2 seconds with the Ludicrous speed upgrade. Model X seats seven adults and incorporates a unique falcon wing door system for superior access to the second and third seating rows. Although the National Highway Traffic Safety Administration has not yet conducted crash testing on Model X, based on our internal testing, we expect Model X to receive the highest safety rating in every category. We began customer deliveries of Model X in the third quarter of 2015 in the United States. After its initial launch in the United States, Model X will be sold in all the markets where Model S is available including in Asia and Europe.
Model 3
We have also publicly announced our intent to develop a third generation electric vehicle, called Model 3, to be produced at the Tesla Factory. We intend to offer this vehicle at a lower price point and expect to produce it at higher volumes than our Model S or Model X. We plan to unveil Model 3 in March of 2016 and expect to start production and deliveries of this vehicle in late 2017.
Energy Storage Applications
Using the energy management technologies and manufacturing processes developed for our vehicle powertrain systems, we have developed energy storage products for use in homes, commercial sites and utilities. The applications for these battery systems include backup power, peak demand reduction, demand response and wholesale electric market services. We began selling our home systems in 2013 and our commercial and utility systems in 2014. We recently announced the next generation of our energy storage products under the Tesla Energy brand.
The Tesla Energy product portfolio will include energy storage products with a wide range of applications, from use in single homes to use in larger utility-scale projects. Tesla Powerwall is a rechargeable lithium-ion battery designed to store energy at a residential and small commercial level for load shifting, backup power and self-consumption of solar power generation. Powerwall is available in storage sizes of 10kWh, optimized for backup applications, or 7kWh, optimized for daily use applications. In addition, we offer a 100 kWh Powerpack for peak shaving, load shifting and demand response for commercial customers and for renewable firming and a variety of grid services for utilities. For utility scale systems, 100kWh battery blocks can be grouped together to offer installation of over 10MWh. We began production of our Tesla Energy products at the Gigafactory in the fourth quarter of 2015.
Technology
Our core competencies are powertrain engineering, vehicle engineering, innovative manufacturing and energy storage. Our core intellectual property resides not only within our electric powertrain, but also within our ability to design a vehicle that utilizes the unique advantages of an electric powertrain and the latest advancements in consumer technologies. Our powertrain consists of our battery pack, power electronics, motor, gearbox and control software. We designed our powertrain originally for our first vehicle, the Tesla Roadster, and commercialized improvements into vehicles manufactured by Daimler and Toyota, and ultimately into the Model S and Model X. Today, we offer several powertrain variants for the Model S and Model X that incorporate years of research and development performed since the original design. In addition, we have designed our vehicles to incorporate the latest advances in consumer technologies, such as mobile computing, sensing, displays, and connectivity. Further evolution of our technology continues for Model 3, which we plan to offer at significantly lower price. In addition, advancements originally commercialized in our vehicles are being leveraged for our storage applications.
5
Battery Pack
We design our battery packs to achieve high energy density at a low cost while also maintaining safety, reliability and long life. Our proprietary technology includes systems for high density energy storage, cooling, safety, charge balancing, structural durability, and electronics management. We have also pioneered advanced manufacturing techniques to manufacture large volumes of battery packs with high quality and low costs.
We have significant expertise in the safety and management systems needed to use lithium-ion cells in the automotive environment, and have actively worked with lithium-ion cell suppliers to further optimize cell designs to increase overall performance. These advancements have enabled us to improve cost and performance of our batteries over time. For example, in 2015 alone, we upgraded the battery of our lowest range Model S from 60 kWh to 70 kWh, and our highest range Model S to 90 kWh.
Our engineering and manufacturing efforts have been performed with a longer-term goal of building a foundation for further development. For instance, we have designed our battery pack to permit flexibility with respect to battery cell chemistry and form factor. In so doing, we can leverage the substantial investments and advancements being made globally by battery cell manufacturers to continue to improve cost. We maintain extensive testing and R&D capabilities at the individual cell level, the full battery-pack level, and other critical battery pack systems. As a result, we have built an expansive body of knowledge on lithium-ion cell vendors, chemistry types, and performance characteristics. We believe that the flexibility of our designs, combined with our research and real-world performance data, will enable us to continue to evaluate new battery cells as they become commercially viable, and thereby optimize battery pack system performance and cost for our current and future vehicles.
Power Electronics
The power electronics in our electric vehicle powertrain govern the flow of high voltage electrical current throughout the vehicle. The power electronics have two primary functions, powering our electric motor to generate torque while driving and delivering energy into the battery pack while charging.
The first function is accomplished through the drive inverter, which converts direct current (DC) from the battery pack into alternating current (AC) to drive our induction motors. The drive inverter also provides "regenerative braking" functionality, which captures energy from the wheels to charge the battery pack when needed. Tesla has developed a family of drive inverter designs that are customized to its proprietary motor designs to most efficiently meet the demands of each of our vehicles. The primary technological advantages to our designs include the ability to drive large amounts of current in a small physical package.
The second function, charging the battery pack, is accomplished by the charger, which converts alternating current (usually from a wall outlet or other electricity source) into direct current that can be accepted by the battery. Tesla vehicles can recharge on a wide variety of electricity sources due to the design of this charger, from a common household outlet to high power circuits meant for more industrial uses. In most markets, Tesla vehicles come with a Mobile Connector that allows for multiple different charging services to be used. In many markets, Tesla offers a Tesla Wall Connector that can be set up to provide higher power charging than the Mobile Connectors.
On the road, customers can also charge using our Supercharger network or at a variety of destinations that have deployed our charging equipment. In addition, Model S vehicles can charge at a variety of public charging stations around the world, either natively or through a suite of adapters. This flexibility in charging provides customers with additional mobility, while also allowing them to conveniently charge the vehicle overnight at home.
Dual Motor Powertrain
In October of 2014, we launched the initial version of our dual motor powertrain, which uses two electric motors to provide greater efficiency, performance, and range in an all-wheel drive configuration. Conventional all-wheel drive vehicles distribute power to the wheels from a single engine driving a complex mechanical transmission system. By contrast, Tesla's dual motor powertrain digitally and independently controls torque to the front and rear wheels. The almost instantaneous response of the motors, combined with low centers of gravity provides drivers with controlled performance and increased traction control.
Vehicle Control and Infotainment Software
The performance and safety systems of our vehicles and their battery packs require sophisticated control software. There are numerous processors in our vehicles to control these functions, and we write custom firmware for many of these processors. The flow of electricity between the battery pack and the motor must be tightly controlled in order to deliver the performance and behavior expected in the vehicle. For example, software algorithms enable the vehicle to mimic the "creep" feeling which drivers expect from an internal combustion engine vehicle without having to apply pressure on the accelerator. Similar algorithms control traction, vehicle stability and the sustained acceleration and regenerative braking of the vehicle. Software also is used extensively to monitor the charge state of each of the cells of the battery pack and to manage all of its safety systems. Drivers use the information and control systems in our vehicles to optimize performance, customize vehicle behavior, manage charging modes and times and control all infotainment functions. We develop almost all of this software, including most of the user interfaces, internally.
6
Autopilot Systems
We have developed an expertise in vehicle autopilot systems, including auto-steering, traffic aware cruise control, lane changing, automated parking, driver warning systems and automated braking functions. In October of 2014, we began equipping all Model S vehicles with hardware to allow for the incremental introduction of autopilot technology. Our autopilot systems relieve our drivers of the most tedious and potentially dangerous aspects of road travel. Although the driver is ultimately responsible for controlling the vehicle, our system provides safety and convenience functionality that allows our customers to rely on it much like the system that airplane pilots use when conditions permit. Our autopilot system leverages an advanced set of hardware including a forward radar, a forward-looking camera, 12 long-range ultrasonic sensors, and a high-precision digitally controlled electric assist braking system. This hardware suite, along with over-the-air firmware updates and field data feedback loops from the onboard camera, radar, ultrasonics, and GPS, enables the system to continually learn and improve its performance.
Vehicle Design and Engineering
In addition to the design, development and production of the powertrain, we have created significant in-house capabilities in the design and engineering of electric vehicles and electric vehicle components and systems. We design and engineer bodies, chassis, interiors, heating and cooling and low voltage electrical systems in house and to a lesser extent in conjunction with our suppliers. Our team has core competencies in computer aided design and crash test simulations which we expect to reduce the product development time of new models.
Additionally, our team has expertise in lightweight materials, a very important characteristic for electric vehicles given the impact of mass on range. Model S and Model X are built with a lightweight aluminum body and chassis which incorporates a variety of materials and production methods that help optimize the weight of the vehicle.
Vehicle Sales and Marketing
Company-Owned Stores and Galleries
We market and sell cars directly to consumers through an international network of company-owned stores and galleries. Our Tesla stores and galleries are highly visible, premium outlets in major metropolitan markets, some of which combine retail sales and service. We have also found that opening a service center in a new geographic area can increase demand. As a result, we have complemented our store strategy with sales facilities and personnel in service centers to more rapidly expand our retail footprint. We refer to these as "Service Plus" locations. Including all of our stores, galleries, Service Plus and service facilities, we operated 208 locations around the world as of December 31, 2015.
We own our sales and service network because the traditional franchised distribution and service model is not viable for a business like ours. In our company-owned network, our customers deal directly with our own Tesla-employed sales and service staff, creating a differentiated buying experience from the buying experience consumers have with franchised automobile dealers and service centers. We believe we will also be able to better control costs of inventory, manage warranty service and pricing, maintain and strengthen the Tesla brand, and obtain rapid customer feedback.
Tesla Supercharger Network
We are building a network of up to 120 kW fast charging equipment, each called a Tesla Supercharger, throughout North America, Europe and Asia for fast charging of Tesla vehicles. Our Supercharger network is a strategic corporate initiative designed to remove a barrier to the broader adoption of electric vehicles caused by the perception of limited vehicle range and to provide fast charging to enable long-distance travel. The Tesla Supercharger is an industrial grade, high speed charger designed to replenish 170 miles of range in the battery pack in as little as 30 minutes. Supercharger stations typically have between four to ten Superchargers and are strategically placed primarily along well-travelled highways to allow Model S and Model X owners to enjoy long distance travel with convenient, minimal stops. As of December 31, 2015, we had 584 Supercharger stations open in North America, Europe, and Asia. We are planning to continue to expand the Supercharger network in the United States, Europe and Asia.
Destination Charging
We are working with a wide variety of hospitality locations, including hotels and popular destinations, to offer an additional charging option for our customers. These destination charging partners deploy our wall connectors and provide charging to Model S owners that patronize their businesses. As of December 31, 2015, over 1,800 locations around the world had more than 3,100 Tesla wall connectors installed.
Orders and Reservations
We typically carry a very limited inventory of our vehicles at our Tesla stores. The vast majority of our customers customize their vehicle by placing an order with us via the Internet. To begin production or make a reservation, we require an initial payment which is collected once the customer has selected the vehicle specifications and has entered into a purchase agreement. We require all remaining payment of the purchase price of the vehicle upon delivery of the vehicle to the customer.
7
Marketing
Our principal marketing goals are to:
| · | generate demand for our vehicles and drive leads to our sales teams; |
| · | build long-term brand awareness and manage corporate reputation; |
| · | manage our existing customer base to create loyalty and customer referrals, including through our referral programs; and |
| · | enable customer input into the product development process. |
Historically, we have been able to generate significant media coverage of our company and our vehicles, and we believe we will continue to do so. To date, media coverage and word of mouth have been the primary drivers of our sales leads and have helped us achieve sales without traditional advertising and at relatively low marketing costs.
Vehicle Service and Warranty
Service
We provide service for our electric vehicles at our company-owned service centers, at our Service Plus locations or, in certain areas for an additional charge, through Tesla Ranger mobile technicians who provide services that do not require a vehicle lift. We owned and operated 118 service locations as of December 31, 2015. We are continuing our plan to build a number of additional service centers in several markets worldwide.
Our vehicles are designed with the capability to wirelessly upload the data to us via an on-board system with cellular connectivity, allowing us to diagnose and remedy many problems before ever looking at the vehicle. When maintenance or service is required, a customer can schedule service by contacting one of our Tesla service centers. Our Tesla Rangers, or mobile service team, can also perform an array of services from the convenience of a customer's home or other remote location.
Our company-owned service centers enable our technicians to work closely with our engineers and research and development teams in Silicon Valley to identify problems, find solutions, and incorporate improvements faster than incumbent automobile manufacturers.
New Vehicle Limited Warranty, Maintenance and Extended Service Plans
We provide a four year or 50,000 mile New Vehicle Limited Warranty with every new vehicle, subject to separate limited warranties for the supplemental restraint system and battery. For the battery and drive unit on our current new vehicles, we offer an eight year, infinite mile warranty, although the battery's charging capacity is not covered.
In addition to the New Vehicle Limited Warranty, we offer a comprehensive maintenance program for every new vehicle, which includes plans covering prepaid maintenance for up to eight years or up to 100,000 miles and an Extended Service plan. The maintenance plans cover annual inspections and the replacement of wear and tear parts, excluding tires and the battery. The Extended Service plan covers the repair or replacement of vehicle parts for up to an additional four years or up to an additional 50,000 miles after the New Vehicle Limited Warranty.
Our New Vehicle Limited Warranty and Extended Service plans are subject to certain limitations, exclusions or separate warranties, including on certain wear items, such as tires, brake pads, paint and general appearance, and battery performance, and are intended to cover parts and labor to repair defects in material or workmanship in the body, chassis, suspension, interior, electronic systems, battery, powertrain and brake system. In addition, all prepaid maintenance and Extended Service plans must be purchased within a specified period of time after vehicle purchase or warranty expiration.
Financial Services
We offer loans and leases for our vehicles in North America, Europe and Asia primarily through various financial institutions. We also offer financing arrangements directly through our local subsidiaries in certain areas of the United States, Germany, Canada and the UK. We intend to broaden our financial services offerings during the next few years.
Certain of our financing programs provide customers with a resale value guarantee under which those customers have the option of selling their vehicle back to us at a preset future date, generally during the period of 36 to 39 months following delivery for a pre-determined resale value . This structure allows the customer to enjoy the benefits of vehicle ownership without concern for resale value. We introduced this program in North America in 2013 and expanded it to selected European and APAC markets in 2014 and 2015. In certain markets, we also offer residual value guarantees to financial institutions which may obligate us to repurchase the vehicles for a pre-determined price.
8
Manufacturing
We conduct vehicle manufacturing and assembly operations at our facilities in Fremont, California; Lathrop, California; and Tilburg, Netherlands. We are also building a cell and battery manufacturing facility, the Tesla Gigafactory, outside of Reno, Nevada.
The Tesla Factory in Fremont, CA and Manufacturing Facility in Lathrop, CA
We manufacture the Model S and Model X and certain components that are critical to our intellectual property and quality standards at the Tesla Factory. The Tesla Factory contains several manufacturing operations, including stamping, machining, casting, plastics, body assembly, paint operations, seat assembly, final vehicle assembly and end-of-line testing. In addition, we manufacture lithium-ion battery packs, electric motors, gearboxes and components for our vehicles at the Tesla Factory. Several major component systems of our vehicles are purchased from suppliers; however we have a high level of vertical integration in our manufacturing processes at the Tesla Factory. We machine various aluminum components at our facility in Lathrop, California and are nearing completion of a site expansion to include an aluminum castings operation.
We have completed significant investments to increase our production capacity and to begin production of the Model X at the Tesla Factory. This includes the completion and launch of the first phase of a new high volume paint shop, our second body assembly shop, two new stamping lines, a seat assembly facility, and an expansion of the battery pack and drive unit production lines.
We plan to produce Model S, Model X and Model 3 at the Tesla Factory. In some areas of the Tesla Factory, we have designed our investments with flexibility to accommodate multiple products. For example, our new high volume paint shop and new stamping lines can support all three vehicles. Our final vehicle assembly line is producing the Model S and the Model X while certain powertrain components are shared between the Model S and Model X. Over the course of 2016, we plan to make significant additional investments at the Tesla Factory in order to be able to start production and deliveries of Model 3, in late 2017. These include a new body assembly shop and Model 3 final vehicle assembly.
The Netherlands
Our European headquarters and manufacturing facilities are located in Amsterdam and Tilburg. The entities through which these facilities are operated hold the rights to manufacture and distribute all Tesla products to customers in all markets outside of the United States and provide corporate oversight functions for European sales, service, and administrative functions. Our operations in Tilburg include final assembly, testing and quality control for vehicles delivered within the European Union, a parts distribution warehouse for service centers throughout Europe, a center for remanufacturing work and a customer service center.
The Gigafactory outside of Reno, Nevada
We are developing the Gigafactory as a facility where we work together with our suppliers to integrate battery material, cell, module and battery pack production in one location. We plan to use the battery packs manufactured at the Gigafactory for our vehicles and for our Tesla Energy applications. We broke ground on the Gigafactory in June 2014 and began assembling our Tesla Energy products in the first portion of the facility in the fourth quarter of 2015.
We currently expect to produce cells at the Gigafactory beginning in 2016 for use initially in our Tesla Energy products and later for our vehicles. The Gigafactory is currently expected to attain full production capacity in 2020, which is anticipated to be sufficient for the production of approximately 500,000 vehicles annually as well as for the production of our energy storage products. By that time, we expect battery pack production capacity to reach 50 GWh. Of this, we expect to build 35 GWh of cell production capacity at the Gigafactory and purchase 15 GWh of cells from other manufacturers.
We believe that the Gigafactory will allow us to achieve a significant reduction in the cost of our battery packs once we are in volume production with Model 3. The total capital expenditures associated with the Gigafactory through 2020 are expected to be $4 to $5 billion, of which approximately $2 billion is expected to come from Tesla. Panasonic has agreed to partner with us on the Gigafactory with investments in production equipment that it will use to manufacture and supply us with battery cells. We have a supply agreement with Panasonic that, among other things, allows us to purchase a minimum of 1.8 billion lithium-ion battery cells at preferential prices that we intend to purchase from 2014 through 2017. We have agreed to prepare and provide the land, buildings and utilities, invest in production equipment for battery module and pack production and be responsible for the overall management of the Gigafactory.
Supply Chain
Our vehicles use over 3,000 purchased parts which we source globally from over 350 suppliers. We have developed close relationships with several key suppliers particularly in the procurement of cells and certain other key system parts. While we obtain components from multiple sources in some cases, similar to other automobile manufacturers, many of the components used in our vehicles are purchased by us from a single source. In addition, while several sources of the battery cell we have selected for our battery packs are available, we have currently fully qualified only one cell for the battery packs we use in our production vehicles. We are working to fully qualify additional cells from other manufacturers.
9
We use various raw materials in our business including aluminum, steel, cobalt, nickel and copper. The prices for these raw materials fluctuate depending on market conditions and global d emand for these materials. We believe that we have adequate supplies or sources of availability of the raw materials necessary to meet our manufacturing and supply requirements.
Governmental Programs, Incentives and Regulations
California Alternative Energy and Advanced Transportation Financing Authority Tax Incentives
We have entered into agreements in 2012, 2013, and 2015 with the California Alternative Energy and Advanced Transportation Financing Authority (CAEATFA) that each provide multi-year sales tax exclusions on purchases of manufacturing equipment that will be used for specific purposes including the expansion and ongoing development of Model S, Model X and future electric vehicles and expansion of electric vehicle powertrain production in California. We estimate the combined tax savings under these agreements will be approximately $98 million, of which $56 million has been realized as of December 31, 2015.
Nevada Tax Incentives
In connection with the construction of the Gigafactory in Nevada, we have entered into agreements with the State of Nevada and Storey County in Nevada that will provide abatements for sales and use taxes, real and personal property taxes, and employer excise taxes, discounts to the base tariff energy rates, and transferable tax credits. These incentives will be available for the applicable periods beginning on October 17, 2014 and ending on June 30, 2034, subject to capital investments by Tesla and its partners for the Gigafactory of at least $3.5 billion in the aggregate on or before June 30, 2024, and certain other conditions specified in the agreements. If we do not satisfy one or more conditions under the agreements, Tesla will be required to repay to the respective taxing authorities the amounts of the tax incentives incurred, plus interest.
Tesla Regulatory Credits
In connection with the production, delivery, and placement into service of our zero emission vehicles in global markets, we have earned and will continue to earn various tradable regulatory credits that can be sold to other manufacturers.
Under California's Zero-Emission Vehicle Regulations and those of states that have adopted the California standards, vehicle manufacturers are required to ensure that a portion of the vehicles delivered for sale in those states during each model year are zero-emission vehicles and partial zero-emission vehicles. Currently, the states of Arizona, California, Connecticut, Maine, Maryland, Massachusetts, New Jersey, New Mexico, New York, Oregon, Rhode Island and Vermont have such laws in effect. These laws provide that a manufacturer may earn credits, referred to as ZEV credits, if they produce more zero-emission vehicles than the minimum quantity required by those laws. Those manufacturers with a surplus of credits may sell the excess credits to other manufacturers who can then apply such credits to comply with the regulatory requirements, including making up for deficits. As a manufacturer solely of zero-emission vehicles, we have no minimum requirement, and therefore earn ZEV credits on each vehicle delivered and placed into service in such states. We have entered into agreements with other automobile manufacturers to sell the ZEV credits that we earn. Recently, California passed amendments to the ZEV mandate that would require, starting in 2018, all large-volume manufacturers (those manufacturers selling 20,000 or more vehicles in California in 2018) to increase the number of zero emission vehicles sold, such that 15.4% of each manufacturers' fleet must be made of zero emission vehicles by 2025. All states that have adopted the California program will amend their programs to conform to the new California standards.
Additionally, under the Environmental Protection Agency's (EPA) national greenhouse gas (GHG) emission standards and similar standards adopted by the Canadian government, car and truck manufacturers are required to meet fleet-wide average carbon dioxide emissions standards. Manufacturers who fail to meet such standards have a deficit in their emission profile. Manufacturers whose fleet wide average performs better than such standards may earn credits. Manufacturers may sell excess credits to other manufacturers, who can use the credits to comply with these regulatory requirements. As a manufacturer solely of zero emission vehicles, we earn the full amount of GHG credits established by the standards on each vehicle sold. We have contracted with another automobile manufacturer to sell all earned credits.
Under the National Highway Traffic Safety Administration's (NHTSA) Corporate Average Fuel Economy (CAFE) standards, car and truck manufacturers are required to meet fleet-wide average fuel economy standards. Manufacturers that fail to meet such standards have a deficit in their fuel economy profile. Manufacturers whose fleet-wide average performs better than such standards may earn credits. Manufacturers may sell excess credits to other manufacturers, who can use such credits to comply with these regulatory requirements. We have entered into agreements to sell the credits that we earn.
Regulation-Vehicle Safety and Testing
Our vehicles are subject to, and comply with or are otherwise exempt from, numerous regulatory requirements established by NHTSA, including all applicable United States Federal Motor Vehicle Safety Standards (FMVSS). Model S and Model X fully comply with all FMVSSs without the need for any exemptions.
10
As a manufacturer, we must self-certify that our vehicles meet all applicable FMVSS, as well as the NHTSA bumper standard, or otherwise are exempt, before the vehicles can be imported or sold in the United Sta tes. Numerous FMVSS apply to our vehicles, such as crash-worthiness requirements, crash avoidance requirements, and electric vehicle requirements. We are also required to comply with other federal laws administered by NHTSA, including the CAFE standards, T heft Prevention Act requirements, consumer information labeling requirements, Early Warning Reporting requirements regarding warranty claims, field reports, death and injury reports and foreign recalls, and owner's manual requirements.
The Automobile Information and Disclosure Act requires manufacturers of motor vehicles to disclose certain information regarding the manufacturer's suggested retail price, optional equipment and pricing. In addition, the Act allows inclusion of city and highway fuel economy ratings, as determined by EPA, as well as crash test ratings as determined by NHTSA if such tests are conducted.
Our vehicles sold in outside of the U.S. are subject to foreign safety testing regulations. Many of those regulations are different from the federal motor vehicle safety standards applicable in the United States and may require redesign and/or retesting.
Regulation-Battery Safety and Testing
Our battery pack conforms to mandatory regulations that govern transport of "dangerous goods", defined to include lithium-ion batteries, which may present a risk in transportation. The regulations vary by mode of shipping transportation, such as by ocean vessel, rail, truck, or air. We have completed the applicable transportation tests for our battery packs, demonstrating our compliance with applicable regulations.
We use lithium metal oxide cells in our high voltage battery packs. The cells do not contain any lead, mercury, cadmium, other hazardous materials, heavy metals, or toxic materials. Our battery packs include certain packaging materials that contain trace amounts of hazardous chemicals whose use, storage, and disposal is regulated under federal law. We currently have an agreement with a third party battery recycling company to recycle our battery packs. If a customer wishes to dispose of a battery pack from one of our vehicles, we anticipate accepting the depleted battery from the customer without any additional charge.
Automobile Manufacturer and Dealer Regulation
State laws regulate the manufacture, distribution, and sale of automobiles, and generally require motor vehicle manufacturers and dealers to be licensed in order to sell vehicles directly to consumers in the state. As we open additional Tesla stores and service centers, we secure dealer licenses (or their equivalent) and engage in sales activities to sell our vehicles directly to consumers. A few states, such as Texas and Michigan, do not permit automobile manufacturers to be licensed as dealers or to act in the capacity of a dealer, or otherwise restrict a manufacturer's ability to deliver or service vehicles. To sell vehicles to residents of states where we are not licensed as a dealer, we generally conduct the sale out of the state via the internet, phone or mail. In such states, we have opened "galleries" that serve an educational purpose and are not retail locations.
As we expand our retail footprint in the United States, some automobile dealer trade associations have both challenged the legality of our operations in court and used administrative and legislative processes to attempt to prohibit or limit our ability to operate existing stores or expand to new locations. Although we have thus far prevailed in every lawsuit brought by dealer associations, we expect that the dealer associations will continue to mount challenges to our business model. In addition, we expect the dealer associations to actively lobby state licensing agencies and legislators to interpret existing laws or enact new laws in ways not favorable to Tesla's ownership and operation of its own retail and service locations.
While we have analyzed the principal laws in the US, EU, China, Japan, UK, and Australia relating to our distribution model and believe we comply with such laws, we have not performed a complete analysis of all jurisdictions in which we may sell vehicles. Accordingly, there may be laws in certain jurisdictions that may restrict our sales and service operations.
Competition
The worldwide automotive market, particularly for alternative fuel vehicles, is highly competitive today and we expect it will become even more so in the future as we introduce additional, lower priced vehicles such as our Model 3.
We believe the primary competitive factors in our markets include but are not limited to:
| · | technological innovation; |
| · | product quality and safety; |
| · | service options; |
| · | product performance; |
| · | design and styling; |
| · | brand perception; |
11
| · | product price; and |
| · | manufacturing efficiency. |
We believe that our vehicles compete in the market both based on their traditional segment classification as well as based on their propulsion technology. For example, Model S competes primarily in the extremely competitive premium sedan market with internal combustion vehicles from more established automobile manufacturers, including Audi, BMW, Lexus and Mercedes. Our vehicles also compete with vehicles propelled by alternative fuels, principally electricity.
Many established and new automobile manufacturers have entered or have announced plans to enter the alternative fuel vehicle market. Overall, we believe these announcements and vehicle introductions promote the development of the alternative fuel vehicle market by highlighting the attractiveness of alternative fuel vehicles, particularly those fueled by electricity, relative to the internal combustion vehicle. BMW, Daimler, Nissan, Fiat, Ford and Mitsubishi, among others, have electric vehicles available today. Moreover, Porsche, Lexus, Audi, Volkswagen and Volvo, as well as a number of prospective automobile manufacturers, are also developing electric vehicles. Electric vehicles have also already been brought to market in China and other foreign countries and we expect a number of those manufacturers to enter the United States market as well. In addition, several manufacturers, including General Motors, Toyota, Ford, and Honda, are each selling hybrid vehicles, and certain of these manufacturers have announced plug-in versions of their hybrid vehicles.
The market for energy storage products is also highly competitive. Established companies as well as emerging companies have introduced products that are similar to our product portfolio. For instance, there are several companies providing individual components of energy storage systems (such as cells, battery modules, and power electronics) as well as others providing integrated systems.
Most of our current and potential competitors in both the automotive and energy storage markets have significantly greater resources than we do, may be able to devote greater resources to the manufacture, sale and support of their products, and have other advantages. We believe our exclusive focus on electric vehicles, electric vehicle components and energy storage products, as well as our history of vehicle development and production, however, are the basis on which we can compete in the global automotive market in spite of the challenges posed by our competition.
Intellectual Property
As part of our business, we seek to protect our intellectual property rights in various ways, including through trademarks, copyrights, trade secrets, including know-how, patents, patent applications, employee and third party nondisclosure agreements, intellectual property licenses and other contractual rights. Additionally, consistent with our mission to accelerate the advent of sustainable transport, we announced a patent policy in which we irrevocably pledged that we will not initiate a lawsuit against any party for infringing our patents through activity relating to electric vehicles or related equipment for so long as such party is acting in good faith. We made this pledge in order to encourage the advancement of a common, rapidly-evolving platform for electric vehicles, thereby benefiting ourselves, other companies making electric vehicles, and the world.
Segment Information
We operate as one reportable segment which is the design, development, manufacturing and sales of electric vehicles.
Employees
As of December 31, 2015, we had 13,058 full-time employees. To date, we have not experienced any work stoppages, and we consider our relationship with our employees to be good.
Available Information
We file or furnish periodic reports and amendments thereto, including our Annual Reports on Form 10-K, our Quarterly Reports on Form 10-Q and Current Reports on Form 8-K; proxy statements and other information with the Securities and Exchange Commission (SEC). Such reports, amendments, proxy statements and other information may be obtained by visiting the Public Reference Room of the SEC at 100 F Street, NE, Washington, D.C. 20549. Information on the operation of the Public Reference Room can be obtained by calling the SEC at 1-800-SEC-0330. In addition, the SEC maintains a website ( www.sec.gov ) that contains reports, proxy and information statements, and other information regarding issuers that file electronically. Our reports, amendments thereto, proxy statements and other information are also made available, free of charge, on our investor relations website at ir.teslamotors.com as soon as reasonably practicable after we electronically file or furnish such information with the SEC. The information posted on our website is not incorporated by reference into this Annual Report on Form 10-K.
12
I TEM 1A. | RISK FACTORS |
You should carefully consider the risks described below together with the other information set forth in this report, which could materially affect our business, financial condition and future results. The risks described below are not the only risks facing our company. Risks and uncertainties not currently known to us or that we currently deem to be immaterial also may materially adversely affect our business, financial condition and operating results.
Risks Related to Our Business and Industry
We may experience significant delays or other complications in the design, manufacture, launch and production ramp of new vehicles such as Model X and future vehicles such as Model 3, which could harm our brand, business, prospects, financial condition and operating results.
We may experience significant delays or other complications in bringing to market and ramping production of new vehicles, such as Model X. While we commenced Model X deliveries late in the third quarter of 2015, we have only recently begun manufacturing Model X vehicles, and various factors could result in delays in its production ramp, including the capacity of our suppliers to deliver us components at the timing and volumes we require and production limitations that are needed to maintain our quality production standards. In addition, since Model X shares certain production facilities with the Model S, the volume or efficiency of Model S production may be impacted if the ramp of Model X is not as efficient as we plan.
We have experienced delays or other complications in connection with new vehicle models in the past, such as production ramp delays for Model S in 2012 and the All-Wheel Drive Dual Motor Model S, and the launch of Model X. Any significant additional delay or other complication in the ramp of Model X or the development, manufacture, launch and production ramp of our future vehicles, including complications associated with expanding our production capacity, supply chain or regulatory approvals, could materially damage our brand, business, prospects, financial condition and operating results.
The complexity in our business continues to grow as we introduce new products and variants.
We have limited experience simultaneously designing, testing, manufacturing, upgrading, adapting and selling our electric vehicles as well as limited experience allocating our available resources among the design and production of multiple vehicles, such as Model S, Model X and Model 3, and the variants thereof. In the past, when we have added complexity to our production line, we have occasionally experienced unexpected delays. Similar problems may occur in the future as we simultaneously produce Model X and Model S vehicles, as well as future vehicles and Tesla Energy products.
We may be unable to meet our production and delivery plans for Model S and Model X, both of which could harm our business and prospects.
We have significantly increased vehicle production and deliveries, and our plans call for significant increases in vehicle production and deliveries going forward. Our ability to further increase vehicle production, including the ramp of Model X production, will depend upon a number of factors, including our ability to use new manufacturing processes as planned while maintaining our desired quality levels, our suppliers' ability to deliver sufficient volumes of quality parts to us in a timely manner, and carefully but efficiently making design and production changes to ensure consistently high quality. Certain suppliers have historically experienced delays in meeting our demand or have sought to renegotiate the terms of the supply arrangements, and we continue to focus on supplier capabilities and constraints. While our plans call for us to significantly increase vehicle production and deliveries in a short amount of time, we may be unable to do so. Any delays or disruption in our production of Model S and Model X in line with our plans could materially damage our brand, business, prospects, financial condition and operating results.
In addition, we have introduced a number of new manufacturing technologies and techniques for our vehicles, such as aluminum spot welding systems and high-speed blow forming of certain difficult to stamp vehicle parts. Our vehicles also have unique design features, such as a 17 inch display screen, retractable exterior door handles, and all-new dual motor and autopilot hardware introduced in Model S and falcon-wing doors and other unique features introduced in Model X, each of which poses different manufacturing challenges.
Concurrent with the significant increase in our planned vehicle production levels, we will also need to continue to significantly increase deliveries of our vehicles. We have limited experience in delivering a high volume of vehicles, and we may face difficulties meeting our delivery and growth plans into both existing markets as well as new markets into which we expand. If we are unable to ramp up to meet our delivery goals globally, this could have a material adverse effect on our business, prospects, financial condition and operating results.
Finally, detailed long-term testing of quality, reliability and durability of our vehicles is ongoing, and in the case of Model X vehicles has only recently commenced, and any negative results from such testing could cause production or delivery delays or cost increases.
13
Our long-term success will be dependent upon our ability to achieve market acceptance of our vehi cles, including Model S and Model X, and new vehicle models such as Model 3.
There is no guarantee that Model S, Model X or our future vehicles such as Model 3 will continue to be successfully accepted by the general public, especially in the long-term. Although we have successfully grown demand for Model S to date and have seen strong initial demand for Model X, and we believe that we will be able to continue to grow demand for these vehicles, there is no guarantee that future demand for Model S or Model X will meet our expectations.
Additionally, we have limited experience in introducing new vehicles. Although our reservation conversion rate for Model X has been strong, we have only recently commenced production and deliveries of Model X. To the extent that we are not able to build Model X in accordance with consumer expectations, customers may cancel their reservations and our future sales could be harmed.
While we believe that there will continue to be separate and strong demand for both Model S and Model X, we have limited experience in selling multiple vehicle models at the same time. Although we believe that each of our vehicles and their variants meet a distinct segment of the automotive market, if our vehicles end up competing with one another in the market, then our ability to sell each vehicle model at planned quantities or prices may be impacted.
Beyond Model X, we have announced our intent to develop Model 3, which we intend to offer at a lower price point and to produce at high volumes. We have not yet finalized the design, engineering or material and component sourcing plans for Model 3. If we are not successful in bringing it to market at the expected price point and the expected volume, our operating results may suffer. Additionally, while we expect Model 3 to be an extremely popular vehicle, we do not know what long-term demand for Model 3 will be and whether it will meet our expectations. Furthermore, the market for vehicles in the price range we expect for Model 3 is larger, but more competitive, than the markets for Model S and Model X.
Problems or delays in bringing the Gigafactory online and operating it in line with our expectations could negatively affect the production and profitability of our products, such as Model 3 or Tesla Energy products.
To lower the cost of cell production and produce cells in high volume, we intend to integrate the production of lithium-ion cells and finished battery packs for our vehicles, including Model 3, and Tesla Energy products at our new Gigafactory. We have limited experience in building a factory, and no direct experience in the production of lithium-ion cells. Also, the cost and complexity of building and operating the Gigafactory could exceed our current expectations and the Gigafactory may take longer to bring online for lithium-ion cell and battery pack production than we anticipate. If we are unable to build the Gigafactory in a timely manner to produce high volumes of quality lithium-ion cells at reasonable prices, our ability to supply battery packs to our vehicle and other products according to our schedule and/or at a price that allows us to sell them profitably and in the quantities we estimate could be constrained. Any such problems or delays with the Gigafactory could negatively affect our brand and harm our business, prospects, financial condition and operating results.
If our vehicles or vehicles that contain our powertrains fail to perform as expected, our ability to develop, market and sell our electric vehicles could be harmed.
If our vehicles or vehicles that contain our powertrains were to contain defects in design and manufacture that cause them not to perform as expected or that require repair, our ability to develop, market and sell our vehicles could be harmed. For example, the operation of our vehicles is highly dependent on software, which is inherently complex and could conceivably contain defects and errors. Issues that have historically been experienced by customers include those related to the software for the 17 inch display screen, the panoramic roof and the 12 volt battery in the Model S. Although we attempt to remedy any issues we observe in our vehicles as effectively and as rapidly as possible, such efforts may not be timely, may hamper production or may not be up to the satisfaction of our customers. While we have performed extensive internal testing, we currently have a limited frame of reference by which to evaluate the long-term performance of our battery packs, powertrains, vehicles and Tesla Energy products. There can be no assurance that we will be able to detect and fix any defects in our products prior to their sale to consumers.
Any vehicle product defects or any other failure of our vehicles to perform as expected could harm our reputation and result in delivery delays, product recalls, product liability claims, significant warranty and other expenses, and could have a material adverse impact on our business, financial condition, operating results and prospects. Our Model X vehicles have not yet been evaluated by NHTSA for its 5-Star Safety Ratings, and while based on our internal testing we expect to obtain comparable ratings to those achieved by Model S, there is no assurance this will occur.
We are dependent on our suppliers, the majority of which are single source suppliers, and the inability of these suppliers to continue to deliver, or their refusal to deliver, necessary components of our vehicles in a timely manner at prices, quality levels, and volumes acceptable to us would have a material adverse effect on our financial condition and operating results.
Model S and Model X contain numerous purchased parts which we source globally from hundreds of direct suppliers, the majority of whom are currently single source suppliers despite efforts to qualify and obtain components from multiple sources whenever possible. Furthermore, we do not maintain long-term agreements with a number of our suppliers.
14
While we may be able to establish alternate supply relationships or engineer replacement components for our single sour ce components, we may be unable to do so in the short term, or at all, at prices or costs that are favorable to us. In particular, while we believe that we will be able to secure alternate sources of supply for most of our single sourced components in a re latively short time frame, qualifying alternate suppliers or developing our own replacements for certain highly customized components of our vehicles may be time consuming, costly and may force us to make additional modifications to a vehicle's design.
This limited supply chain exposes us to multiple potential sources of delivery failure or component shortages for the production of our vehicles and powertrain components. We may experience delays due to supply chain disruptions with respect to Model S, Model X, Model 3 and any other future vehicle we may produce, such as those we experienced in 2012 in connection with our slower-than-anticipated Model S ramp. In addition, our currently ongoing transition from low to high volume production tooling for Model X may take longer than expected which may adversely impact our short-term financial results.
Changes in business conditions, labor issues, wars, governmental changes, natural disasters such as the March 2011 earthquakes in Japan and other factors beyond our control or which we do not presently anticipate, could also affect our suppliers' ability to deliver components to us on a timely basis. Furthermore, if we experience significantly increased demand, or need to replace certain existing suppliers, there can be no assurance that additional supplies of component parts will be available when required on terms that are favorable to us, or that any supplier would allocate sufficient supplies to us in order to meet our requirements or fill our orders in a timely manner, or that we could engineer replacement components ourselves.
Changes in our supply chain have resulted in the past, and may result in the future, in increased cost. We have also experienced cost increases from certain of our suppliers in order to meet our quality targets and development timelines as well as due to design changes that we made, and we may experience similar cost increases in the future. Additionally, we are negotiating with existing suppliers for cost reductions, seeking new and less expensive suppliers for certain parts, and attempting to redesign certain parts to make them less expensive to produce. If we are unsuccessful in our efforts to control and reduce supplier costs, our operating results will suffer.
Finally, in October 2013, we entered into an amendment to our existing supply agreement with Panasonic Corporation in order to address our anticipated short- to medium-term lithium-ion battery cell needs. While we expect that this supply agreement, as amended, will provide us with sufficient cells for the next few years, we may not be able to meet our long-term needs, including for Model 3 and other programs we may introduce, without securing additional suppliers or other sources for cells. We have signed an agreement with Panasonic to be our partner in the Gigafactory and be responsible for, among other things, manufacturing cells from there for use in our products. If we encounter unexpected difficulties with our current suppliers, including Panasonic, and if we are unable to fill these needs from other suppliers, we could experience production delays, which could have a material adverse effect on our financial condition and operating results.
Our future growth is dependent upon consumers' willingness to adopt electric vehicles.
Our growth is highly dependent upon the adoption by consumers of alternative fuel vehicles in general and electric vehicles in particular. If the market for electric vehicles does not develop as we expect, or develops more slowly than we expect, our business, prospects, financial condition and operating results will be harmed. The market for alternative fuel vehicles is relatively new, rapidly evolving, and subject to numerous external factors, such as:
| · | p erceptions about electric vehicle quality, safety, performance, cost, and the convenience of charging; |
| · | perceptions about the limited range over which electric vehicles may be driven on a single battery charge; |
| · | the availability of other types of alternative fuel vehicles, including plug-in hybrid electric vehicles, improvements in the fuel economy of the internal combustion engine; |
| · | volatility in the cost of oil and gasoline; |
| · | government regulations and economic incentives; |
| · | and access to charging facilities. |
If we fail to manage future growth effectively as we rapidly grow our company, especially internationally, we may not be able to produce, market, sell and service our vehicles successfully.
Any failure to manage our growth effectively could materially and adversely affect our business, prospects, operating results and financial condition. We continue to expand our operations significantly internationally, particularly in Asia. Our future operating results depend to a large extent on our ability to manage this expansion and growth successfully. Risks that we face in undertaking this global expansion include controlling expenses; establishing sufficient sales, service and Supercharger facilities in a timely manner; adapting our products to meet local requirements; implementing the required infrastructure, systems and processes; and finding and hiring a significant number of additional personnel, including manufacturing personnel, design personnel, engineers and service technicians.
15
If we are unable to adequately reduce the manufacturing costs of Model S, control manufacturing costs for Model X, or otherwise control the costs associated with operating our business, our financial condition and operating results will suffer.
As we have gradually ramped production of Model S, manufacturing costs per vehicle have decreased. While we expect ongoing cost reductions to be realized by both us and our suppliers, there is no guarantee we will be able to achieve sufficient cost savings to reach our gross margin and profitability goals. We incur significant costs related to procuring the raw materials required to manufacture our vehicles, assembling vehicles and compensating our personnel. We may also incur substantial costs or cost overruns in increasing the production capability of our Model S, Model X and powertrain manufacturing facilities. Furthermore, if we are unable to produce Model X pursuant to our plan due to cost overruns or other unexpected costs, we may not be able to meet our gross margin and other financial targets.
Furthermore, many of the factors that impact our operating costs are beyond our control, such as potential increases in the costs of our raw materials and components, such as lithium-ion battery cells or aluminum used to produce body panels. If we are unable to keep our operating costs aligned with the level of revenues we generate, our operating results, business and prospects will be harmed.
We may fail to meet our publicly announced guidance or other expectations about our business, which would cause our stock price to decline.
We occasionally provide guidance regarding our expected financial and business performance, such as projections regarding sales and production, as well as anticipated future revenues, gross margins, profitability and cash flows. Correctly identifying key factors affecting business conditions and predicting future events is inherently an uncertain process and our guidance may not ultimately be accurate. Our guidance is based on certain assumptions such as those relating to anticipated production and sales volumes and average sales prices, supplier and commodity costs, and planned cost reductions. If our guidance is not accurate or varies from actual results due to our inability to meet our assumptions or the impact on our financial performance that could occur as a result of various risks and uncertainties, the market value of our common stock could decline significantly.
Our vehicles make use of lithium-ion battery cells, which have been observed to catch fire or vent smoke and flame, and such events have raised concerns, and future events may lead to additional concerns, about the batteries used in automotive applications.
The battery packs that we produce make use of lithium-ion cells. On rare occasions, lithium-ion cells can rapidly release the energy they contain by venting smoke and flames in a manner that can ignite nearby materials as well as other lithium-ion cells.
While we have designed the battery pack to passively contain any single cell's release of energy without spreading to neighboring cells. There can be no assurance that a field or testing failure of our vehicles or other battery packs that we produce will not occur, which could subject us to lawsuits, product recalls, or redesign efforts, all of which would be time consuming and expensive. Also, negative public perceptions regarding the suitability of lithium-ion cells for automotive applications or any future incident involving lithium-ion cells such as a vehicle or other fire, even if such incident does not involve our vehicles, could seriously harm our business.
In addition, we store a significant number of lithium-ion cells at our manufacturing facility. Any mishandling of battery cells may cause disruption to the operation of our facilities. While we have implemented safety procedures related to the handling of the cells, there can be no assurance that a safety issue or fire related to the cells would not disrupt our operations. Such damage or injury would likely lead to adverse publicity and potentially a safety recall. Moreover, any failure of a competitor's electric vehicle may cause indirect adverse publicity for us and our electric vehicles. Such adverse publicity would negatively affect our brand and harm our business, prospects, financial condition and operating results.
We are exposed to fluctuations in currency exchange rates, which could negatively affect our financial results
Our revenues and costs denominated in foreign currencies are not completely matched. As we have increased Model S deliveries in markets outside of the United States, we have much higher revenues than costs denominated in other currencies such as the euro, Norwegian kroner, Chinese yuan and Canadian dollar. The recent strengthening of the U.S. dollar therefore has reduced, and any further strengthening of the U.S. dollar would tend to further reduce our revenues as measured in U.S. dollars. In addition, a portion of our costs and expenses have been, and we anticipate will continue to be, denominated in foreign currencies, including the Japanese yen. If we do not have fully offsetting revenues in these currencies and if the value of the U.S. dollar depreciates significantly against these currencies, our costs as measured in U.S. dollars as a percent of our revenues will correspondingly increase and our margins will suffer. As a result, our operating results could be adversely affected.
16
Our resale value guarantee and leasing programs expose us to the risk that the resale values of vehicles returned to us are lower than our estimates and may result in lower revenues, gross margin, profitab ility and liquidity.
We offer resale value guarantees to many of our customers, under which such customers may sell their vehicles back to us at certain points in time at pre-determined resale values. Customers can lease our vehicles through both leasing partners and from us directly, through our captive finance companies. The resale values of any vehicles resold or returned to us pursuant to these programs may be lower than our estimates, which are based on a limited secondary market for our vehicles. If the volume of vehicles returned to us is higher than our estimates and/or we are not able to resell them, timely or at all, our liquidity could be negatively impacted. In cases where customers retain their vehicles past the guarantee period, our gross margin will be negatively impacted as all remaining revenues and costs related to the vehicle will be recognized at no gross profit.
We apply lease accounting on sales of vehicles with a resale value guarantee and on leases made directly by us. Under lease accounting, we recognize the associated revenues and costs of the vehicle sale over time rather than fully upfront at vehicle delivery. As a result, these programs generate lower revenues in the period the car is delivered and higher gross margins during the period of the resale value guarantee as compared to purchases in which the resale value guarantee does not apply. A higher than anticipated uptake under these programs could therefore have an adverse impact on our near term revenues and operating results. Moreover, unlike the resale value guarantee program or programs with leasing partners which do not impact our cash flows and liquidity at the time of vehicle delivery, under a lease held directly by us, we may receive only a very small portion of the total vehicle purchase price at the time of lease, followed by a stream of payments over the term of the lease. To the extent we expand our leasing program without securing external financing or business partners to support such expansion, our cash flow and liquidity could also be negatively impacted.
If we fail to effectively manage the residual, financing and credit risks related to our direct Tesla leasing programs our business may suffer.
We offer financing arrangements through our local subsidiaries in the United States, Canada, Germany and the UK, including leasing directly through certain of those subsidiaries. The profitability of the leasing program depends on our ability to accurately project residual values, secure adequate financing and/or business partners to fund and grow this program, and manage customer credit risk. If actual residual values of our vehicles are below our estimates, we may suffer lower profitability or potentially have losses. If we are unable to adequately fund our leasing program with either internal funds or external financing sources, we may be unable to grow our sales. Additionally, if we do not properly screen customers for their creditworthiness, we may be exposed to excessive credit risks and associated losses. Furthermore, if our leasing business grows substantially, our business may suffer if we cannot effectively manage the greater levels of residual and credit risks resulting from growth. Finally, if we do not successfully monitor and comply with applicable national, state and/or local financial regulations and consumer protection laws governing lease transactions, we may become subject to enforcement actions or penalties, either of which may harm our business.
Increases in costs, disruption of supply or shortage of raw materials, in particular lithium-ion cells, could harm our business.
We may experience increases in the cost or a sustained interruption in the supply or shortage of raw materials. Any such increase or supply interruption could materially and negatively impact our business, prospects, financial condition and operating results. We use various raw materials in our business including aluminum, steel, nickel and copper. The prices for these raw materials fluctuate depending on market conditions and global demand for these materials and could adversely affect our business and operating results. For instance, we are exposed to multiple risks relating to lithium-ion cells. These risks include:
| · | the inability or unwillingness of current battery manufacturers to build or operate battery cell manufacturing plants to supply the numbers of lithium-ion cells we require; |
| · | disruption in the supply of cells due to quality issues or recalls by battery cell manufacturers; |
| · | an increase in the cost of raw materials used in the cells; and |
| · | fluctuations in the value of the Japanese yen against the U.S. dollar as our battery cell purchases are currently denominated in Japanese yen. |
Our business is dependent on the continued supply of battery cells for the battery packs used in our vehicles and energy storage products. While we believe several sources of the battery cells are available for such battery packs, we have fully qualified only a very limited number of suppliers for the cells used in such battery packs and have very limited flexibility in changing cell suppliers. In particular, we have fully qualified only one supplier for the cells used in battery packs for our production vehicles. Any disruption in the supply of battery cells from such vendors could disrupt production of our vehicles and of the battery packs we produce for other automobile manufacturers until such time as a different supplier is fully qualified. Furthermore, fluctuations or shortages in petroleum and other economic conditions may cause us to experience significant increases in freight charges and raw material costs. Substantial increases in the prices for our raw materials or prices charged to us, such as those charged by our battery cell manufacturers, would increase our operating costs, and could reduce our margins if we cannot recoup the increased costs through increased vehicle prices. Any attempts to increase vehicle prices in response to increased raw material costs could result in cancellations of vehicle orders and reservations and therefore materially and adversely affect our brand, image, business, prospects and operating results.
17
We may become subject to product liability claims, which could harm our financial condition and liquidity if we are not able to successfully defend or insure ag ainst such claims.
Product liability claims could harm our business, prospects, operating results and financial condition. The automobile industry experiences significant product liability claims and we face inherent risk of exposure to claims in the event our vehicles do not perform as expected resulting in personal injury or death. We also may face claims related to any misuse or failures of our new autopilot technology. A successful product liability claim against us with respect to any aspect of our vehicles could require us to pay a substantial monetary award. Our risks in this area are particularly pronounced given the limited number of vehicles delivered to date and limited field experience of those vehicles. Moreover, a product liability claim could generate substantial negative publicity about our vehicles and business and would have material adverse effect on our brand, business, prospects and operating results. We self-insure against the risk of product liability claims, meaning that any product liability claims will have to be paid from company funds, not by insurance.
The automotive market is highly competitive, and we may not be successful in competing in this industry. We currently face competition from new and established U.S. and international competitors and expect to face competition from others in the future, including competition from companies with new technology.
The worldwide automotive market, particularly for alternative fuel vehicles, is highly competitive today and we expect it will become even more so in the future. Many established and new automobile manufacturers have entered or have announced plans to enter the alternative fuel vehicle market. For example, BMW, Daimler, Nissan and many other large companies have announced or are also reported to be developing electric vehicles. In addition, several manufacturers, including General Motors, Toyota, Ford and Honda, are selling hybrid vehicles, including plug-in hybrid vehicles. Most of our current and potential competitors have significantly greater financial, technical, manufacturing, marketing and other resources than we do and may be able to devote greater resources to the design, development, manufacturing, distribution, promotion, sale and support of their products. Virtually all of our competitors have more extensive customer bases and broader customer and industry relationships than we do and almost all of these companies have longer operating histories and greater name recognition than we do. Increased competition could result in lower vehicle unit sales, price reductions, revenue shortfalls, loss of customers and loss of market share, which could harm our business, prospects, financial condition and operating results.
Demand in the automobile industry is volatile, which may lead to lower vehicle unit sales and adversely affect our operating results.
Volatility of demand in the automobile industry may materially and adversely affect our business, prospects, operating results and financial condition. The markets in which we currently compete and plan to compete in the future have been subject to considerable volatility in demand in recent periods, including recent softening of the premium sedan category. As a low volume vehicle producer, we have less financial resources than more established automobile manufacturers to withstand changes in the market and disruptions in demand. Volatility in demand may lead to lower vehicle unit sales and increased inventory, which may result in further downward price pressure and adversely affect our business, prospects, financial condition and operating results. These effects may have a more pronounced impact on our business given our relatively smaller scale and financial resources as compared to many incumbent automobile manufacturers.
If we are unable to establish and maintain confidence in our long-term business prospects among consumers, analysts and within our industry, then our financial condition, operating results, business prospects and stock price may suffer materially.
Consumers may be less likely to purchase our vehicles now if they are not convinced that our business will succeed or that our operations will continue for many years. Similarly, suppliers and other third parties will be less likely to invest time and resources in developing business relationships with us if they are not convinced that our business will succeed. Accordingly, in order to build and maintain our business, we must maintain confidence among customers, suppliers, analysts and other parties in our liquidity and long-term business prospects. Maintaining such confidence may be particularly complicated by certain factors, such as our limited operating history, unfamiliarity with our products, competition and uncertainty regarding the future of electric vehicles. Many of these factors are largely outside our control, and any negative perceptions about our long-term business prospects, even if exaggerated or unfounded, would likely harm our business and make it more difficult to raise additional funds if needed.
Our vehicles have unique servicing requirements, and we are using a different service model from the one typically used in the automobile industry. If we are unable to address the service requirements of our existing and future customers, our business will be materially and adversely affected.
Servicing electric vehicles is different than servicing vehicles with internal combustion engines and requires specialized skills, including high voltage training and servicing techniques. If we are unable to satisfactorily service our vehicles, our ability to generate customer loyalty, grow our business and sell additional vehicles could be impaired.
18
We service our vehicles through our company-owned Tesla service cen ters, certain of our stores, and through our mobile service technicians known as the Tesla Rangers. We will need to open new standalone service centers in locations around the world and hire and train significant numbers of new employees to staff these ser vice centers and act as Tesla Rangers in order to successfully maintain our fleet of delivered vehicles. If we do not continue to adequately address the service requirements of our customers to their satisfaction, particularly as the volume of vehicles we are able to deliver annually increases, our business would be harmed.
Our plan to expand our network of Tesla stores, service centers and Superchargers will require significant cash investments and management resources and may not meet our expectations with respect to additional sales of our electric vehicles. In addition, we may not be able to open stores or service centers in certain states or Superchargers in desired locations.
Our plan to expand our network of Tesla stores, service centers and Superchargers will require significant cash investments and management resources and may not meet our expectations with respect to additional sales of our vehicles. This ongoing global expansion may not have the desired effect of increasing sales and expanding our brand presence to the degree we are anticipating. We will also need to ensure we are in compliance with any regulatory requirements applicable to the sale and service of our vehicles in those jurisdictions, which could take considerable time and expense. If we experience any delays in expanding our network of Tesla stores, service centers and Superchargers, this could lead to a decrease in sales of our vehicles and could negatively impact our business, prospects, financial condition and operating results.
We face risks associated with our international operations and expansion, including unfavorable regulatory, political, tax and labor conditions and establishing ourselves in new markets, all of which could harm our business.
We currently have international operations and subsidiaries in various countries and jurisdictions that are subject to the legal, political, regulatory and social requirements and economic conditions in these jurisdictions. Additionally, as part of our growth strategy, we will continue to expand our sales, service and Supercharger locations internationally. We have limited experience, however, selling and servicing our products internationally, as well as limited experience installing and operating Superchargers internationally. Furthermore, international expansion requires us to make significant expenditures, including the establishment of local operating entities, hiring of local employees and establishing facilities in advance of generating any revenue.
We are subject to a number of risks associated with international business activities that may increase our costs, impact our ability to sell our electric vehicles and require significant management attention. These risks include conforming our vehicles to various international regulatory and safety requirements, difficulty in establishing, staffing and managing foreign operations, challenges in attracting customers, foreign government taxes, regulations and permit requirements, our ability to enforce our contractual rights; trade restrictions, customs regulations, tariffs and price or exchange controls, and preferences of foreign nations for domestically produced vehicles.
Additionally, as we have expanded into new international markets, we historically faced challenges with ensuring that our charging equipment works successfully with the charging infrastructure in such markets, including in Norway and China. If customers experience problems with the way our charging equipment works with the local charging infrastructure, or we are unable to adapt our equipment to resolve such problems, then the viability and acceptance of our vehicles in such markets could be materially and adversely affected. If we fail to successfully address these risks, our business, prospects, operating results and financial condition could be materially harmed.
The unavailability, reduction or elimination of government and economic incentives in the U.S. and abroad supporting the development and adoption of electric vehicles could have some impact on demand for our vehicles.
We currently benefit from certain government and economic incentives supporting the development and adoption of electric vehicles. In the United States and abroad, such incentives include, among other things, tax credits or rebates that encourage the purchase of electric vehicles. In Norway, for example, the purchase of electric vehicles is not currently subject to import taxes, taxes on non-recurring vehicle fees, the 25% value added tax or the purchase taxes that apply to the purchase of gas-powered vehicles. Notably, the quantum of incentive programs promoting electric vehicles is a tiny fraction of the amount of incentives that are provided to gas-powered vehicles through the oil and gas industries, notwithstanding that the former promotes social good while the latter contributes to significant social harm. Nevertheless, even the limited benefits from such programs could be reduced, eliminated or exhausted. For example, on January 1, 2016, a previously available incentive in Denmark that favored the purchase of electric vehicles expired and was replaced with a newly phased-in incentive that is less generous than the incentive that it replaced. In certain circumstances, there is pressure from the oil and gas lobby or related special interests to bring about such developments, which could have some negative impact on demand for our vehicles.
19
Our strategic relationships with third parties, such as Panasonic, are subject to various risks which could adversely affect our business and future prospects.
Our strategic relationships with third parties, such as Panasonic which supplies us with battery cells for use in Model S and Model X and which is our strategic partner in the Gigafactory, pose various risks to us, including potential loss of access to important technology and parts for producing, servicing and supporting our products, potential loss of business and adverse publicity. Moreover, factors that may not be within our partners' control, such as materials pricing, may impact our ability to realize the goals of certain strategic relationships, such as cost and gross margin targets. In addition, these third parties may not perform as expected under our agreements with them, such as with respect to quality of production parts and timeliness of their deliveries, and we may have disagreements or disputes with these third parties. The occurrence of any of the foregoing could adversely affect our business, prospects, financial condition and operating results.
If we are unable to attract and/or retain key employees and hire qualified personnel, our ability to compete could be harmed.
The loss of the services of any of our key employees could disrupt our operations, delay the development and introduction of our vehicles and services, and negatively impact our business, prospects and operating results. In particular, we are highly dependent on the services of Elon Musk, our Chief Executive Officer, and JB Straubel, our Chief Technical Officer.
None of our key employees is bound by an employment agreement for any specific term and we may not be able to successfully attract and retain senior leadership necessary to grow our business. Our future success depends upon our ability to attract and retain executive officers and other key technology, sales, marketing, engineering, manufacturing and support personnel and any failure to do so could adversely impact our business, prospects, financial condition and operating results.
Key talent may leave Tesla due to various factors, such as a very competitive labor market for talented individuals with automotive experience. Currently in California, there is increasing competition for talented individuals with the specialized knowledge of electric vehicles, software engineers, manufacturing engineers and other skilled employees and this competition affects both our ability to retain key employees and hire new ones. Our continued success depends upon our continued ability to hire new employees in a timely manner and retain current employees. Additionally, we compete with both mature and prosperous companies that have far greater financial resources than we do and start-ups and emerging companies that promise short-term growth opportunities. Any difficulties in retaining current employees or recruiting new ones would have an adverse effect on our performance.
We are highly dependent on the services of Elon Musk, our Chief Executive Officer.
We are highly dependent on the services of Elon Musk, our Chief Executive Officer, Product Architect, Chairman of our Board of Directors and largest stockholder. Although Mr. Musk spends significant time with Tesla and is highly active in our management, he does not devote his full time and attention to Tesla. Mr. Musk also currently serves as Chief Executive Officer and Chief Technical Officer of Space Exploration Technologies, a developer and manufacturer of space launch vehicles, and Chairman of SolarCity, a solar provider.
We are subject to various environmental and safety laws and regulations that could impose substantial costs upon us and negatively impact our ability to operate our manufacturing facilities.
As an automobile manufacturer, we are subject to complex environmental, health and safety laws and regulations at numerous levels, including laws relating to the use, handling, storage, disposal and human exposure to hazardous materials, both in the United States and abroad. The costs of compliance, including remediating contamination if any is found on our properties, and of any changes to our operations mandated by new laws or amendments to existing laws may be significant. We may also face unexpected delays in obtaining the necessary permits and approvals required by such laws in connection with our manufacturing facilities, which would hinder our operation of these facilities. Such costs and delays may adversely impact our business prospects and operating results. Furthermore, any violations of these laws may result in substantial fines and penalties, remediation costs, third party damages, or a suspension or cessation of our operations.
Our business may be adversely affected by any disruptions caused by union activities.
Although none of our employees is currently represented by a labor union, it is common for employees at automobile companies to belong to a union, which can result in higher employee costs and increased risk of work stoppages. Although we work diligently to provide the best possible work environment for our employees, they may still decide to join or seek recognition to form a labor union, or we may be required to become a union signatory. Furthermore, we are directly or indirectly dependent upon companies with unionized work forces, such as parts suppliers and trucking and freight companies, and work stoppages or strikes organized by such unions could have a material adverse impact on our business, financial condition or operating results. If a work stoppage occurs, it could delay the manufacture and sale of our products and have a material adverse effect on our business, prospects, operating results or financial condition.
20
We are subject to substantial regulation, which is evolving, and unfavorable changes or failure by us to comp ly with these regulations could substantially harm our business and operating results.
Motor vehicles are subject to substantial regulation under international, federal, state, and local laws. We incur significant costs in complying with these regulations, and may be required to incur additional costs to comply with any changes to such regulations. Also, we are subject to laws and regulations applicable to the import, sale and service of automobiles internationally. For example, we are required to meet vehicle-specific safety standards that are often materially different from U.S. requirements, thus resulting in additional investment into the vehicles and systems to ensure regulatory compliance. This process necessitates that foreign regulatory official's review and certify our vehicles prior to market entry. In addition, we must comply with regulations applicable to vehicles after they enter the market, including foreign reporting requirements and recall management systems.
Additionally, we recently released a vehicle software update that delivers a range of new Autopilot features that relieve drivers of the most tedious and potentially dangerous aspects of road travel. As Autopilot is a completely new feature that U.S. and foreign regulators have limited experience with, there is a risk that regulators could take actions impacting whether and how our customers are able to use our vehicles equipped for Autopilot, which could adversely affect our business.
We are subject to various privacy and consumer protection laws.
Our privacy policy is posted on our website, and any failure by us or our vendor or other business partners to comply with it or with federal, state or international privacy, data protection or security laws or regulations could result in regulatory or litigation-related actions against us, legal liability, fines, damages and other costs. Although we take steps to protect the security of our customers' personal information, we may be required to expend significant resources to comply with data breach requirements if third parties improperly obtain and use the personal information of our customers or we otherwise experience a data loss with respect to customers' personal information. A major breach of our network security and systems could have negative consequences for our business and future prospects, including possible fines, penalties and damages, reduced customer demand for our vehicles, and harm to our reputation and brand.
We may be compelled to undertake product recalls or take other actions, which could adversely affect our brand image and financial performance.
Any product recall in the future may result in adverse publicity, damage our brand and adversely affect our business, prospects, operating results and financial condition. We previously experienced product recalls in May 2009, October 2010, June 2013 and November 2015, none of which was related to our electric powertrain or that resulted in a vehicle crash or personal injury reported to us. In April 2009, we determined that a condition caused by insufficient torqueing of the rear inner hub flange bolt existed in some of our Tesla Roadsters, as a result of a missed process during the manufacture of the Tesla Roadster glider. In October 2010, we initiated a product recall after the 12 volt, low voltage auxiliary cable in a single vehicle chafed against the edge of a carbon fiber panel in the vehicle causing a short, smoke and possible fire behind the right front headlamp of the vehicle. In June 2013, we initiated a recall of slightly more than one thousand Model S vehicles to inspect and repair rear seat strikers that may have been compromised during the assembly process. Rear seat strikers are used to retain the rear seat backs in an upright position. Failure of this component may have resulted in collapse of the rear seat back during a crash. In November 2015, we initiated a recall after we discovered a single customer-owned Model S with a front seat belt that was not properly connected to the outboard lap pretensioner. Furthermore, in January 2014, we implemented a firmware update to address issues with certain Universal Mobile Connector NEMA 14-50 adapters, which are part of the charging units and are not part of the vehicles themselves, potentially overheating during charging. In the future, we may at various times, voluntarily or involuntarily, initiate a recall if any of our vehicles or our electric powertrain components that we provide to other OEMs, including any systems or parts sourced from our suppliers, prove to be defective or noncompliant with applicable federal motor vehicle safety standards. Such recalls, whether voluntary or involuntary or caused by systems or components engineered or manufactured by us or our suppliers, involve significant expense and diversion of management attention and other resources, and could adversely affect our brand image in our target markets, as well as our business, prospects, financial condition and results of operations.
Our current and future warranty reserves may be insufficient to cover future warranty claims which could adversely affect our financial performance.
If our warranty reserves are inadequate to cover future warranty claims on our vehicles, our business, prospects, financial condition and operating results could be materially and adversely affected. Warranty reserves include management's best estimate of the projected costs to repair or to replace items under warranty. These estimates are based on actual claims incurred to-date and an estimate of the nature, frequency and costs of future claims. These estimates are inherently uncertain and changes to our historical or projected experience may cause material changes to our warranty reserves in the future. Subject to separate limited warranties for the supplemental restraint system and battery, we provide a four year or 50,000 mile New Vehicle Limited Warranty for the purchasers of new Model S and Model X vehicles. The New Vehicle Limited Warranty for Model S and Model X also covers the drive unit for eight years and the battery for a period of eight years or 125,000 miles or unlimited miles, depending on the size of the vehicle's battery, although the battery's charging capacity is not covered under the New Vehicle Limited Warranty or any Extended Service plan.
21
In addition, customers h ave the opportunity to purchase an Extended Service plan for the period after the end of the New Vehicle Limited Warranty for Model S and Model X to cover additional services for an additional four years or 50,000 miles, provided it is purchased within a s pecified period of time. The New Vehicle Limited Warranty and Extended Service plans for the Model S and Model X are subject to certain limitations, exclusions or separate warranties, including certain wear items, such as tires, brake pads, paint and gener al appearance, and battery performance, and is intended to cover parts and labor to repair defects in material or workmanship in the vehicle including the body, chassis, suspension, interior, electronic systems, powertrain and brake system. Additionally, i n 2013, as part of our ongoing efforts to improve the customer ownership experience, we expanded the battery pack warranty and also eliminated the annual service requirement that was needed to keep the New Vehicle Limited Warranty in effect. Should this ch ange in warranty coverage lead to an increase in warranty claims, we may need to record additional warranty reserves, which would negatively affect our profitability.
We are currently expanding and improving our information technology systems and use security measures designed to protect our systems against breaches and cyber-attacks. If these efforts are not successful, our business and operations could be disrupted and our operating results and reputation could be harmed.
We are currently expanding and improving our information technology systems, including implementing new internally developed systems, to assist us in the management of our business. In particular, our volume production of multiple vehicles necessitates continued development, maintenance and improvement of our information technology systems in the U.S. and abroad, which include product data management, procurement, inventory management, production planning and execution, sales, service and logistics, dealer management, financial, tax and regulatory compliance systems. The implementation, maintenance and improvement of these systems require significant management time, support and cost. Moreover, there are inherent risks associated with developing, improving and expanding our core systems as well as implementing new systems, including the disruption of our data management, procurement, manufacturing execution, finance, supply chain and sales and service processes. These risks may affect our ability to manage our data and inventory, procure parts or supplies or manufacture, sell, deliver and service vehicles, or achieve and maintain compliance with, or realize available benefits under, tax laws and other applicable regulations. We also maintain information technology measures designed to protect us against system security risks, data breaches and cyber-attacks.
We cannot be sure that these systems or their required functionality will be effectively implemented, maintained or expanded as planned. If we do not successfully implement, maintain or expand these systems as planned, our operations may be disrupted, our ability to accurately and/or timely report our financial results could be impaired, and deficiencies may arise in our internal control over financial reporting, which may impact our ability to certify our financial results. Moreover, our proprietary information could be compromised and our reputation may be adversely affected. If these systems or their functionality do not operate as we expect them to, we may be required to expend significant resources to make corrections or find alternative sources for performing these functions.
Our insurance strategy may not be adequate to protect us from all business risks.
We may be subject, in the ordinary course of business, to losses resulting from products liability, accidents, acts of God and other claims against us, for which we may have no insurance coverage. While we currently maintain general liability, automobile, property, workers' compensation, and directors' and officers' insurance policies, as a general matter, we do not maintain as much insurance coverage as many other companies do, and in some cases, we do not maintain any at all. Additionally, the policies that we do have may include significant deductibles, and we cannot be certain that our insurance coverage will be sufficient to cover all future claims against us. A loss that is uninsured or which exceeds policy limits may require us to pay substantial amounts, which could adversely affect our financial condition and operating results.
Our financial results may vary significantly from period-to-period due to fluctuations in our operating costs.
We expect our period-to-period operating results to vary based on our operating costs which we anticipate will increase significantly in future periods as we, among other things, design, develop and manufacture Model 3, Tesla Energy products and other future products, increase the production capacity at our manufacturing facilities to produce vehicles at higher volumes, including ramping up the production of Model X, develop the Gigafactory, open new Tesla service centers with maintenance and repair capabilities, open new Supercharger locations, increase our sales and marketing activities, and increase our general and administrative functions to support our growing operations. As a result of these factors, we believe that quarter-to-quarter comparisons of our operating results, especially in the short-term, are not necessarily meaningful and that these comparisons cannot be relied upon as indicators of future performance. Moreover, our operating results may not meet expectations of equity research analysts or investors. If any of this occurs, the trading price of our stock could fall substantially, either suddenly or over time.
22
Any u nauthorized control or manipulation of our vehicles' systems could result in loss of confidence in us and our vehicles and harm our business.
Our vehicles contain complex information technology systems. For example, our vehicles are designed with built-in data connectivity to accept and install periodic remote updates from us to improve or update the functionality of our vehicles. We have designed, implemented and tested security measures intended to prevent unauthorized access to our information technology networks, our vehicles and their systems. However, hackers have reportedly attempted, and may attempt in the future, to gain unauthorized access to modify, alter and use such networks, vehicles and systems to gain control of, or to change, our vehicles' functionality, user interface and performance characteristics, or to gain access to data stored in or generated by the vehicle. We encourage reporting of potential vulnerabilities in the security of our vehicles via our security vulnerability reporting policy, and we aim to remedy any reported and verified vulnerabilities. Accordingly, we have received reports of potential vulnerabilities in the past and have attempted to remedy them. However, there can be no assurance that vulnerabilities will not be identified in the future, or that our remediation efforts are or will be successful.
Any unauthorized access to or control of our vehicles or their systems or any loss of data could result in legal claims or proceedings. In addition, regardless of their veracity, reports of unauthorized access to our vehicles, their systems or data, as well as other factors that may result in the perception that our vehicles, their systems or data are capable of being "hacked," could negatively affect our brand and harm our business, prospects, financial condition and operating results.
If we had a desire or need to raise additional funds and could not do so, our operations and prospects could be negatively affected
We expect that our principal sources of liquidity will provide us adequate liquidity based on our current plans. However, if the costs for developing, manufacturing and delivering our current or future vehicles exceed our expectations or if we incur any significant unplanned expenses or embark on or accelerate new significant strategic investments, such as the Gigafactory, we may need to raise additional funds. We need sufficient capital to fund our ongoing operations, continue research and development projects, including those for our planned Model 3 vehicle, establish sales and service centers, build and deploy Superchargers and to make the investments in tooling and manufacturing capital required to introduce new vehicles. If we cannot raise additional funds on favorable terms or at all when we need them, our financial condition, results of operations, business and prospects could be materially adversely affected.
We may face regulatory limitations on our ability to sell vehicles directly which could materially and adversely affect our ability to sell our electric vehicles.
We sell our vehicles from our Tesla stores as well as over the internet. We may not be able to sell our vehicles through this sales model in each state in the United States as some states have laws that may be interpreted to impose limitations on this sales model, including laws that prohibit manufacturers from selling vehicles directly to consumers without the use of an independent dealership or without a physical presence in the state. In certain states in which we are not able to obtain dealer licenses, we have worked with state regulators to open galleries, which are not full retail locations.
The application of these state laws to our operations continues to be difficult to predict. Laws in some states have limited our ability to obtain dealer licenses from state motor vehicle regulators and may continue to do so.
In addition, decisions by regulators permitting us to sell vehicles may be subject to challenges as to whether such decisions comply with applicable state motor vehicle industry laws. For example, vehicle dealer associations in New York, Ohio, Georgia and Massachusetts have filed lawsuits to revoke dealer licenses issued to us. These lawsuits have been dismissed, and in one court decision, the Supreme Court of Massachusetts held that state franchise laws like the one in Massachusetts do not restrict a manufacturer, like Tesla, that does not use franchised dealers from selling its vehicles directly to consumers. Such results have reinforced our continuing belief that state laws were not designed to prevent our distribution model. A similar lawsuit has been filed in Missouri. Possible additional challenges in other states, if successful, could restrict or prohibit our ability to sell our vehicles to residents in such states. In some states, there have also been regulatory and legislative efforts by vehicle dealer associations to propose bills and regulations that, if enacted, would prevent us from obtaining dealer licenses in their states given our current sales model. Other states, such as New Jersey, New York, Ohio and Pennsylvania, have passed legislation that clarifies our ability to operate, but at the same time limits the number of dealer licenses we can obtain or stores that we can operate.
Internationally, there may be laws in jurisdictions we have not yet entered or laws we are unaware of in jurisdictions we have entered that may restrict our sales or other business practices. Even for those jurisdictions we have analyzed, the laws in this area can be complex, difficult to interpret and may change over time.
23
We may need to defend ourselves against patent or trademark infringement claims, which may be time-consuming and would cause us to incur substantial costs.
Companies, organizations or individuals, including our competitors, may hold or obtain patents, trademarks or other proprietary rights that would prevent, limit or interfere with our ability to make, use, develop, sell or market our vehicles or components, which could make it more difficult for us to operate our business. From time to time, we may receive communications from holders of patents or trademarks regarding their proprietary rights. Companies holding patents or other intellectual property rights may bring suits alleging infringement of such rights or otherwise assert their rights and urge us to take licenses. In addition, if we are determined to have infringed upon a third party's intellectual property rights, we may be required to do one or more of the following:
| · | cease selling, incorporating certain components into, or using vehicles or offering goods or services that incorporate or use the challenged intellectual property; |
| · | pay substantial damages; |
| · | seek a license from the holder of the infringed intellectual property right, which license may not be available on reasonable terms or at all; |
| · | redesign our vehicles or other goods or services; or |
| · | establish and maintain alternative branding for our products and services. |
In the event of a successful claim of infringement against us and our failure or inability to obtain a license to the infringed technology or other intellectual property right, our business, prospects, operating results and financial condition could be materially adversely affected. In addition, any litigation or claims, whether or not valid, could result in substantial costs, negative publicity and diversion of resources and management attention.
Our patent applications may not result in issued patents, which may have a material adverse effect on our ability to prevent others from interfering with our commercialization of our products.
The status of patents involves complex legal and factual questions and the breadth and effectiveness of patented claims is uncertain. We cannot be certain that we are the first creator of inventions covered by pending patent applications or the first to file patent applications on these inventions, nor can we be certain that our pending patent applications will result in issued patents or that any of our issued patents will afford sufficient protection against someone creating a knockoff of our products, or as a defensive portfolio against a competitor who claims that we are infringing its patents. In addition, patent applications filed in foreign countries are subject to laws, rules and procedures that differ from those of the United States, and thus we cannot be certain that foreign patent applications will result in issued patents in those foreign jurisdictions or that such patents can be effectively enforced, even if they relate to patents issued in the U.S. In addition, others may obtain patents that we need to take a license to or design around, either of which would increase costs and may adversely affect our business, prospects, financial condition and operating results.
Our trademark applications in certain countries remain subject to outstanding opposition proceedings.
We have filed trade and service mark applications for our Tesla marks in various countries in which we currently sell and plan to sell our products and services. Certain of our applications are subject to outstanding opposition proceedings brought by owners or applicants alleging prior applications for or use of similar marks, or refusals issued by trademark offices citing prior applications or registrations for allegedly similar marks. If we cannot resolve these oppositions and refusals and thereby secure registered rights in these countries, the value of the marks representing our exclusive brand name in these countries will be diluted. In addition, there is a risk that the prior rights owners could in the future take actions to challenge our use of the Tesla marks in these countries. Such actions could have a severe impact on our position in these countries and may inhibit our ability to use the Tesla marks in these countries. If we were prevented from using the Tesla marks in any or all of these countries, we would need to expend significant additional financial and marketing resources on establishing an alternative brand identity in these markets.
Our facilities or operations could be damaged or adversely affected as a result of disasters.
Our corporate headquarters and primary manufacturing facilities are all located in Northern California, a region known for seismic activity. If major disasters such as earthquakes or other events occur, or our information system or communications network breaks down or operates improperly, our headquarters and production facilities may be seriously damaged, or we may have to stop or delay production and shipment of our products. We may incur expenses relating to such damages, which could have a material adverse impact on our business, operating results and financial condition.
24
Servicing our indebtedness requires a significant amount of cash, and we may not have sufficient cash flow from our business to pay our substanti al debt.
We have incurred $3.0 billion in aggregate principal amount of convertible senior notes issued in registered public offerings. Under certain circumstances relating to the reported trading price of our common stock, the holders of our convertible senior notes may convert their notes at their option, upon which we would be obligated to deliver cash payments and/or shares of our common stock to the converting holders. Currently, holders of an aggregate $660.0 million tranche of notes have the right to convert their notes. Moreover, holders of the notes have the right to require us to repurchase their notes upon the occurrence of a fundamental change with respect to us. In addition, we have a senior secured asset-based revolving credit facility (the Credit Facility), under which we had $135 million of borrowings as of December 31, 2015.
Our ability to make scheduled payments of principal when due, to make periodic interest payments or to make other payments pursuant to the terms of our indebtedness, such as with respect to our convertible senior notes upon their conversion or upon demand following a fundamental change, depends on our future performance, which is subject to economic, financial, competitive and other factors beyond our control. Our business may not continue to generate cash flow from operations in the future sufficient to satisfy these obligations or obligations under any future indebtedness we may incur and to make necessary capital expenditures. If we are unable to generate such cash flow, we may be required to adopt one or more alternatives, such as reducing or delaying investments or capital expenditures, selling assets, refinancing or obtaining additional equity capital on terms that may be onerous or highly dilutive. Our ability to refinance our existing or any future indebtedness will depend on the capital markets and our financial condition at such time. In addition, our ability to make required payments under our indebtedness may be limited by law, by regulatory authority or by agreements governing our future indebtedness. We may not be able to engage in any of these activities or engage in these activities on desirable terms or at all, which could result in a default on our existing or future indebtedness. Furthermore, any repayment of any of our existing or future indebtedness prior to their scheduled maturity could have a material adverse effect on our business, results of operations and financial condition.
Our debt agreements contain covenant restrictions that may limit our ability to operate our business.
The terms of our Credit Facility contain, and any of our other future debt agreements may contain, covenant restrictions that limit our ability to operate our business, including restrictions on our ability to, among other things, incur additional debt or issue guarantees, create liens and make certain voluntary prepayments of specified debt. In addition, under certain circumstances we are required to comply with a fixed charge coverage ratio.
As a result of these covenants, our ability to respond to changes in business and economic conditions and to obtain additional financing, if needed, may be restricted, and we may be prevented from engaging in transactions that might otherwise be beneficial to us. In addition, our failure to comply with our debt covenants could result in a default under our debt agreements, which could permit the holders to accelerate our obligation to repay the debt. If any of our debt is accelerated, we may not have sufficient funds available to repay it.
We may still incur substantially more debt or take other actions, which would intensify the risks discussed immediately above.
We and our subsidiaries may, subject to the limitations in the terms of our Credit Facility, incur additional debt, secure existing or future debt, recapitalize our debt or take a number of other actions that are not limited by the terms of the indenture governing our convertible senior notes that could have the effect of diminishing our ability to make payments on the notes when due.
The classification of our convertible senior notes may have a material effect on our reported financial results.
As described in the Risk Factor " Servicing our indebtedness requires a significant amount of cash, and we may not have sufficient cash flow from our business to pay our substantial debt," our convertible senior notes have been historically, and may become in the future, convertible at the option of their holders prior to their scheduled terms under certain circumstances. Even if holders do not elect to convert their notes, the notes become convertible prior to their scheduled maturity dates, we would be required to reclassify such notes and the related debt issuance costs as current liabilities and certain portions of our equity outside of equity to mezzanine equity, which would have an adverse impact on our reported financial results for such quarter, and could have an adverse impact on the market price of our common stock.
25
Risks Related to the Ownership of our Common Stock
The trading price of our common stock is likely to continue to be volatile.
The trading price of our common stock has been highly volatile and could continue to be subject to wide fluctuations in response to various factors, some of which are beyond our control. Our common stock has experienced an intra-day trading high of $286.65 per share and a low of $141.05 per share over the last 52 weeks. The stock market in general, and the market for technology companies in particular, has experienced extreme price and volume fluctuations that have often been unrelated or disproportionate to the operating performance of those companies. Broad market and industry factors may seriously affect the market price of companies' stock, including ours, regardless of actual operating performance. In addition, in the past, following periods of volatility in the overall market and the market price of a particular company's securities, securities class action litigation has often been instituted against these companies. For example, a shareholder litigation like this was filed against us in 2013. While the trial court dismissed the plaintiffs' complaint with prejudice, this litigation (if the trial court's order is successfully appealed) or others like it could result in substantial costs and a diversion of our management's attention and resources.
Conversion of our convertible senior notes may dilute the ownership interest of existing stockholders, including holders who had previously converted their notes, or may otherwise depress the price of our common stock.
The conversion of some or all of our convertible senior notes will dilute the ownership interests of existing stockholders to the extent we deliver shares upon conversion of any of the notes. As described in the Risk Factor " Servicing our indebtedness requires a significant amount of cash, and we may not have sufficient cash flow from our business to pay our substantial debt," our convertible senior notes have been historically, and may become in the future, convertible at the option of their holders prior to their scheduled terms under certain circumstances. Any sales in the public market of the common stock issuable upon such conversion could adversely affect prevailing market prices of our common stock. In addition, the existence of the notes may encourage short selling by market participants because the conversion of the notes could be used to satisfy short positions, or anticipated conversion of the notes into shares of our common stock could depress the price of our common stock.
The convertible note hedge and warrant transactions we entered into in connection with the issuance of our convertible senior notes may affect the value of the notes and our common stock.
In connection with each issuance of our convertible senior notes, we entered into convertible note hedge transactions with the hedge counterparties. The convertible note hedge transactions cover, subject to customary anti-dilution adjustments, the number of shares of our common stock that initially underlay the applicable notes. The convertible note hedge transactions are expected to reduce the potential dilution and/or offset potential cash payments we are required to make in excess of the principal amount upon conversion of the applicable notes. We also entered into warrant transactions with the hedge counterparties relating to the same number of shares of our common stock, subject to customary anti-dilution adjustments. However, the warrant transactions could separately have a dilutive effect on our common stock to the extent that the market price per share of our common stock exceeds the applicable strike price of the warrants on the applicable expiration dates.
In addition, the hedge counterparties or their affiliates may modify their hedge positions by entering into or unwinding various derivatives with respect to our common stock and/or purchasing or selling our common stock or other securities of ours in secondary market transactions prior to the maturity of the applicable notes (and are likely to do so during any observation period related to a conversion of notes). This activity could also cause or prevent an increase or a decrease in the market price of our common stock or the notes.
We do not make any representation or prediction as to the direction or magnitude of any potential effect that the transactions described above may have on the prices of the notes or the shares of our common stock. In addition, we do not make any representation that the hedge counterparties have engaged or will engage in these transactions or that these transactions, once commenced, will not be discontinued without notice.
Mr. Musk borrowed funds from affiliates of certain underwriters in our public offerings and/or private placements and has pledged shares of our common stock to secure these borrowings. The forced sale of these shares pursuant to a margin call could cause our stock price to decline and negatively impact our business.
Beginning in June 2011, banking institutions that are affiliated with certain underwriters of our completed public offerings of common stock and our convertible senior notes made extensions of credit to Elon Musk and the Elon Musk Revocable Trust dated July 22, 2003, or the Trust, a portion of which Mr. Musk used to purchase shares of common stock in our public offerings in May 2013 and August 2015 and private placements in June 2011 and June 2013. We are not a party to these loans, which are full recourse against Mr. Musk and the Trust and are secured by pledges of a portion of the Tesla common stock currently owned by Mr. Musk and the Trust and other shares of capital stock of unrelated entities owned by Mr. Musk and the Trust.
26
If the price of our common stock declines, Mr. Musk may be forced by one or more of the banking institutions to provide additional collater al for the loans or to sell shares of Tesla common stock in order to remain within the margin limitations imposed under the terms of his loans. The loans between these banking institutions on the one hand, and Mr. Musk and the Trust on the other hand, proh ibit the non-pledged shares currently owned by Mr. Musk and the Trust from being pledged to secure any other loans. These factors may limit Mr. Musk's ability to either pledge additional shares of Tesla common stock or sell shares of Tesla common stock as a means to avoid or satisfy a margin call with respect to his pledged Tesla common stock in the event of a decline in our stock price that is large enough to trigger a margin call. Any sales of common stock following a margin call that is not satisfied may cause the price of our common stock to decline further.
Anti-takeover provisions contained in our certificate of incorporation and bylaws, the provisions of Delaware law, and the terms of our convertible senior notes could impair a takeover attempt.
Our certificate of incorporation, bylaws, Delaware law and the terms of our convertible senior notes contain provisions which could have the effect of rendering more difficult, delaying or preventing an acquisition deemed undesirable by our board of directors. Our corporate governance documents include provisions:
| · | creating a classified board of directors whose members serve staggered three-year terms; |
| · | authorizing "blank check" preferred stock, which could be issued by the board without stockholder approval and may contain voting, liquidation, dividend and other rights superior to our common stock; |
| · | limiting the liability of, and providing indemnification to, our directors and officers; |
| · | limiting the ability of our stockholders to call and bring business before special meetings; |
| · | requiring advance notice of stockholder proposals for business to be conducted at meetings of our stockholders and for nominations of candidates for election to our board of directors; |
| · | controlling the procedures for the conduct and scheduling of board and stockholder meetings; and |
| · | providing the board of directors with the express power to postpone previously scheduled annual meetings and to cancel previously scheduled special meetings. |
As a Delaware corporation, we are also subject to provisions of Delaware law, including Section 203 of the Delaware General Corporation law, which prevents some stockholders holding more than 15% of our outstanding common stock from engaging in certain business combinations without approval of the holders of substantially all of our outstanding common stock.
Any provision of our certificate of incorporation or bylaws or Delaware law that has the effect of delaying or deterring a change in control could limit the opportunity for our stockholders to receive a premium for their shares of our common stock, and could also affect the price that some investors are willing to pay for our common stock.
In addition, the terms of the convertible senior notes require us to repurchase the notes in the event of a fundamental change. A takeover of our company would trigger an option of the holders of the notes to require us to repurchase the notes. This may have the effect of delaying or preventing a takeover of our company that would otherwise be beneficial to our stockholders.
I TEM 1B. | UNRESOLVED STAFF COMMENTS |
None.
27
I TEM 2. | PROPERTIES |
The following table sets forth the location, approximate size and primary use of our principal leased and owned facilities:
Location |
| Approximate Size (Building) in Square Feet |
|
| Primary Use |
| Lease Expiration Date | |
Fremont, California |
|
| 5,400,000 |
|
| Manufacturing, administration, engineering services, parts warehousing, and vehicle service |
| Owned building |
Palo Alto, California |
|
| 350,000 |
|
| Corporate headquarters, administration, engineering services and powertrain development services |
| January 2020 |
Tilburg, Netherlands |
|
| 499,710 |
|
| Administration, engineering services, powertrain development services, parts warehousing, final vehicle assembly and vehicle service |
| November 2023 |
Lathrop, California |
|
| 430,770 |
|
| Manufacturing |
| Owned building (1) |
Fremont, California |
|
| 302,400 |
|
| Sales, marketing and services center |
| March 2028 |
Fremont, California |
|
| 506,490 |
|
| Administration, sales and marketing services |
| August 2025 |
Amsterdam, Netherlands |
|
| 71,142 |
|
| Administration |
| February 2024 |
Hawthorne, California |
|
| 132,250 |
|
| Vehicle engineering and design services |
| December 2022 |
Beijing, China |
|
| 8,190 |
|
| Administration, sales and marketing services |
| November 2017 |
(1) | As of December 31, 2014, the Lathrop property was subject to a lease agreement. In January 2015, Tesla exercised its option to purchase the Lathrop property under the terms of the lease agreement. |
In addition to the properties included in the table above, we also lease a large number of properties in North America, Europe and Asia for our retail and service locations as well as Supercharger sites.
We currently intend to add new facilities or expand our existing facilities as we add employees and expand our network of stores and galleries, service locations and Supercharger sites. We believe that suitable additional or alternative space will be available in the future on commercially reasonable terms to accommodate our foreseeable future expansion.
I TEM 3. | LEGAL PROCEEDINGS |
See Item 8 of Part II, Financial Statements and Supplementary Data-Note 13- Commitments and Contingencies .
I TEM 4. | MINE SAFETY DISCLOSURES |
Not applicable.
28
P ART II
I TEM 5. | MARKET FOR REGISTRANT'S COMMON EQUITY, RELATED STOCKHOLDER MATTERS AND ISSUER PURCHASES OF EQUITY SECURITIES |
Market Information
Our common stock has traded on The NASDAQ Global Select Market under the symbol "TSLA" since it began trading on June 29, 2010. Our initial public offering was priced at $17.00 per share on June 28, 2010. The following table sets forth, for the time period indicated, the high and low closing sales price of our common stock as reported on The NASDAQ Global Select Market.
|
| 2015 |
|
| 2014 |
| ||||||||||
|
| High |
|
| Low |
|
| High |
|
| Low |
| ||||
First Quarter |
| $ | 225.48 |
|
| $ | 181.40 |
|
| $ | 254.84 |
|
| $ | 139.34 |
|
Second Quarter |
|
| 271.41 |
|
|
| 186.05 |
|
|
| 240.06 |
|
|
| 178.59 |
|
Third Quarter |
|
| 286.65 |
|
|
| 195.00 |
|
|
| 286.04 |
|
|
| 215.40 |
|
Fourth Quarter |
|
| 249.84 |
|
|
| 202.00 |
|
|
| 260.62 |
|
|
| 197.81 |
|
Holders
As of January 31, 2016, there were 836 holders of record of our common stock. A substantially greater number of holders of our common stock are "street name" or beneficial holders, whose shares are held by banks, brokers and other financial institutions.
Dividend Policy
We have never declared or paid cash dividends on our common stock. We currently do not anticipate paying any cash dividends in the foreseeable future. Any future determination to declare cash dividends will be made at the discretion of our board of directors, subject to applicable laws, and will depend on our financial condition, results of operations, capital requirements, general business conditions and other factors that our board of directors may deem relevant.
29
Stock Performance Graph
This performance graph shall not be deemed "filed" for purposes of Section 18 of the Securities Exchange Act of 1934, as amended (the Exchange Act), or incorporated by reference into any filing of Tesla Motors, Inc. under the Securities Act of 1933, as amended, or the Exchange Act, except as shall be expressly set forth by specific reference in such filing.
The following graph shows a comparison from January 31, 2011 through December 31, 2015, of the cumulative total return for our common stock, the NASDAQ Composite Index, and a group of all public companies sharing the same SIC code as us which is SIC code 3711, "Motor Vehicles and Passenger Car Bodies" (Motor Vehicles and Passenger Car Bodies Public Company Group). Such returns are based on historical results and are not intended to suggest future performance. Data for The NASDAQ Composite Index and the Motor Vehicles and Passenger Car Bodies Public Company Group assumes an investment of $100 on January 31, 2011 and reinvestment of dividends. We have never declared or paid cash dividends on our capital stock nor do we anticipate paying any such cash dividends in the foreseeable future.
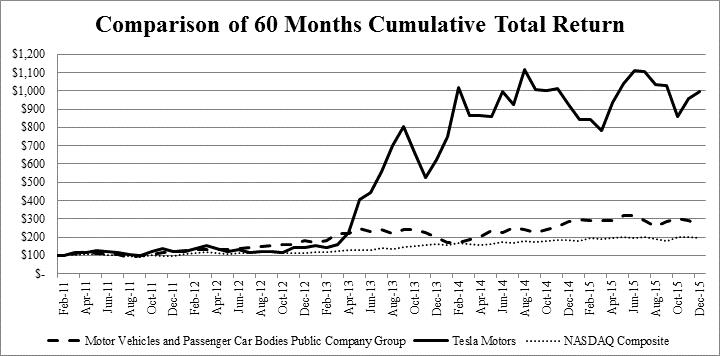
Unregistered Sales of Equity Securities
None.
Purchases of Equity Securities by the Issuer and Affiliated Purchasers
None.
30
I TEM 6. | SELECTED CONSOLIDATED FINANCIAL DATA |
The following selected consolidated financial data should be read in conjunction with "Management's Discussion and Analysis of Financial Condition and Results of Operations" and our consolidated financial statements and the related notes included elsewhere in this Annual Report on Form 10-K.
|
| Year Ended December 31, |
| |||||||||||||||||
|
| 2015 |
|
| 2014 |
|
| 2013 |
|
| 2012 |
|
| 2011 |
| |||||
|
| (in thousands, except per share data) |
| |||||||||||||||||
Consolidated Statements of Operations Data: |
|
|
|
|
|
|
|
|
|
|
|
|
|
|
|
|
|
|
|
|
Total revenues |
| $ | 4,046,025 |
|
| $ | 3,198,356 |
|
| $ | 2,013,496 |
|
| $ | 413,256 |
|
| $ | 204,242 |
|
Gross profit |
|
| 923,503 |
|
|
| 881,671 |
|
|
| 456,262 |
|
|
| 30,067 |
|
|
| 61,595 |
|
Loss from operations |
|
| (716,629 | ) |
|
| (186,689 | ) |
|
| (61,283 | ) |
|
| (394,283 | ) |
|
| (251,488 | ) |
Net loss |
| $ | (888,663 | ) |
| $ | (294,040 | ) |
| $ | (74,014 | ) |
| $ | (396,213 | ) |
| $ | (254,411 | ) |
Net loss per share of common stock, basic and diluted (1) |
| $ | (6.93 | ) |
| $ | (2.36 | ) |
| $ | (0.62 | ) |
| $ | (3.69 | ) |
| $ | (2.53 | ) |
Weighted average shares used in computing net loss per share of common stock, basic and diluted (1) |
|
| 128,202 |
|
|
| 124,539 |
|
|
| 119,421 |
|
|
| 107,349 |
|
|
| 100,389 |
|
(1) | Diluted net loss per share of common stock is computed excluding common stock subject to repurchase, and, if dilutive, potential shares of common stock outstanding during the period. Potential shares of common stock consist of stock options to purchase shares of our common stock, the conversion of our convertible senior notes (using the treasury stock method), warrants to purchase shares of our common stock issued in connection with our 2018 Notes, 2019 Notes, and 2021 Notes (using the treasury stock method), warrants to purchase shares of our convertible preferred stock (using the treasury stock method) and the conversion of our convertible preferred stock and convertible notes payable (using the if-converted method). For purposes of these calculations, potential shares of common stock have been excluded from the calculation of diluted net loss per share of common stock as their effect is antidilutive since we generated a net loss in each period. |
|
| As of December 31, |
| |||||||||||||||||
|
| 2015 |
|
| 2014 |
|
| 2013 |
|
| 2012 |
|
| 2011 |
| |||||
Consolidated Balance Sheet Data: |
|
|
|
|
|
|
|
|
|
|
|
|
|
|
|
|
|
|
|
|
Working capital (deficit) (3) |
| $ | (24,706 | ) |
| $ | 1,072,907 |
|
| $ | 585,665 |
|
| $ | (14,340 | ) |
| $ | 181,499 |
|
Total assets |
|
| 8,092,460 |
|
|
| 5,830,667 |
|
|
| 2,411,816 |
|
|
| 1,114,190 |
|
|
| 713,448 |
|
Total long-term obligations (1)(2) |
|
| 4,145,197 |
|
|
| 2,753,595 |
|
|
| 1,069,535 |
|
|
| 450,382 |
|
|
| 298,064 |
|
(1) | In May 2013, we issued $660.0 million aggregate principal amount of 2018 Notes in a public offering. In accordance with accounting guidance on embedded conversion features, we valued and bifurcated the conversion option associated with the 2018 Notes from the host debt instrument and initially recorded the conversion option of $82.8 million in equity. During the fourth quarter of 2015, the closing price of our common stock exceeded 130% of the applicable conversion price of our 2018 Notes on at least 20 of the last 30 consecutive trading days of the quarter; therefore, holders of 2018 Notes may convert their notes during the first quarter of 2016. As such, we classified the $617.7 million carrying value of our 2018 Notes as current liabilities on our condensed consolidated balance sheet as of December 31, 2015. In March 2014, we issued $800.0 million principal amount of 0.25% convertible senior notes due 2019 (2019 Notes) and $1.20 billion principal amount of 1.25% convertible senior notes due 2021 (2021 Notes) in a public offering. In April 2014, we issued an additional $120.0 million aggregate principal amount of 2019 Notes and $180.0 million aggregate principal amount of 2021 Notes, pursuant to the exercise in full of the overallotment options of the underwriters of our March 2014 public offering. In accordance with accounting guidance on embedded conversion features, we valued and bifurcated the conversion option associated with the notes from the host debt instrument and recorded the conversion option of $188.1 million for the 2019 Notes and $369.4 million for the 2021 Notes in stockholders' equity as of December 31, 2014 |
(2) | As of August 31, 2012, we had fully drawn down our $465.0 million under our DOE loan facility. In May 2013, we used a portion of the Notes offering proceeds to repay all outstanding loan amounts under the DOE Loan Facility. |
(3) | In November 2015, the FASB issued Accounting Standards Update No. 2015-17, Income Taxes (Topic 740): Balance Sheet Classification of Deferred Taxes (ASU 2015-17), which simplifies the presentation of deferred income taxes by requiring that deferred tax assets and liabilities be classified as noncurrent on the balance sheet. We have retrospectively adopted this standard and reclassified all of our current deferred tax assets to noncurrent deferred tax assets on our consolidated balance sheets data for all periods presented. As a result of the reclassifications, certain noncurrent deferred tax liabilities were netted with noncurrent deferred tax assets for all periods presented. |
31
I TEM 7. | MANAGEMENT'S DISCUSSION AND ANALYSIS OF FINANCIAL CONDITION AND RESULTS OF OPERATIONS |
The following discussion and analysis should be read in conjunction with our consolidated financial statements and the related notes that appear elsewhere in this Annual Report on Form 10-K.
Overview and 2015 Highlights
We design, develop, manufacture, and sell high-performance fully electric vehicles, and energy storage products. We are currently producing and selling our Model S sedan and our Model X sport utility vehicle. Since the introduction of Model S in June 2012, we have enhanced our vehicle offerings with all-wheel drive capability, autopilot options, and free over-the-air software updates. We commenced customer deliveries of our Model X in September 2015 and are currently ramping production. We have delivered over 107,000 vehicles through December 31, 2015. We intend to unveil Model 3, a lower priced sedan designed for the mass market, in the first quarter of 2016 and expect to commence production and deliveries of this vehicle in late 2017.
In addition to our automotive products, we recently announced the next generation of our energy storage products, the 7 kWh and 10 kWh Powerwall for residential applications and the 100 kWh Powerpack for commercial and industrial applications. We began production and deliveries of these products, which we will sell under the Tesla Energy brand, in the third quarter of 2015. We transitioned the production of these products from the Fremont Factory to the Gigafactory during Q4 2015.
Our primary source of revenue is from the sale of our vehicles. During the year ended December 31, 2015, we recognized total revenues of $4.05 billion, an increase of $847.7 million over total revenues of $3.20 billion for the year ended December 31, 2014, primarily driven by growth of Model S deliveries worldwide. Gross margin for the year ended December 31, 2015 was 22.8%, a decrease from 27.6% for the year ended December 31, 2014.
We continue to increase our sales and service footprint worldwide and expand our Supercharging and destination charging networks. With the continued global expansion of our customer support and Supercharger infrastructure, selling, general and administrative expenses were $922.2 million for the year ended December 31, 2015, compared to $603.7 million for the year ended December 30, 2014.
Management Opportunities, Challenges and Risks
Vehicle Orders, Production and Deliveries
We are currently producing and selling both the Model S sedan and the Model X sport utility vehicle. We have broadened the appeal of Model S by introducing new variants that improve range, performance, and value. For those wanting a more affordable car, we introduced Model S 70 with a starting price of only $70,000 before incentives and fuel savings. Our new 90kWh battery pack option enables almost 300 miles of range at 65 mph. Finally, for our performance enthusiasts, the new Ludicrous mode option improves 0 to 60 mph acceleration to 2.8 seconds. The introduction of Model X now provides customers with a performance electric vehicle option in the sport utility segment for the first time. Similar to Model S, we expect to introduce new versions and functionality for the Model X over time. Overall, we expect that demand for our vehicles will continue to increase worldwide as more people drive and become aware of our vehicles, as we grow our customer sales and service infrastructure, and as we continue to develop our products.
We have been increasing our production activities and expect to continue to do so. In August 2014, we began a significant production capacity increase at the Tesla Factory by transitioning to our new final assembly line and upgrading our body center. These production capacity increases continued into 2015, with further investments including building a new paint shop, a new body shop for Model X, and additional stamping capacity. We expect our annual production will increase considerably each year for the next several years. In addition, scaling our deliveries means that we will have an increasing number of cars in-transit, therefore production will exceed deliveries.
During 2015, we achieved significant efficiencies in Model S production and produced 14,037 vehicles in the fourth quarter of 2015. We began production of Model X in the third quarter of 2015. We plan to deliver 80,000 to 90,000 new Model S and Model X vehicles in 2016.
32
In addition to expanding our vehicle production, we expect to continue to lower the cost of manufacturing our vehicles over the next several quarters. We expect that this trend will contribute to improved au tomotive gross margin over time, excluding the impact of foreign currency movements. Significant cost improvements for Model S were achieved in 2014 and 2015 relating to material cost reductions from both engineering and commercial actions, and manufacturing efficiencies, excluding the impact of newly introduced Model S variants and Model X. However, during our product introductions over the last few years, we incurred ma nufacturing inefficiencies which negatively impacted our gross margin. We expect that automotive gross margin should increase during 2016 due to cost reductions for Model S and improving margin on Model X as our manufacturing effici ency improves for that v ehicle, supporting our plan to be profitable for the fourth quarter of 2016. I f we are not able to achieve the planned cost reductions from our various cost savings and process improvement initiatives or ramp Model X efficiently, our ability to reach our g ross margin goals would be negatively affected in the short-term.
To support our planned vehicle growth in 2016, we plan to continue expanding stores and service infrastructure worldwide, provide more timely service in areas with a high concentration of Tesla customers, and continue expanding our Supercharger and destination charger network. Since we now offer our vehicles in many countries throughout North America, Europe and Asia, our expansion will primarily occur in geographic areas in which we already have a presence. We expect our long-term sales outside of North America will be almost half of our worldwide automotive revenue. As compared to markets in the United States, we have relatively limited experience in international markets, and thus we may face difficulties meeting our future international expansion plans. If we experience unexpected difficulties or delays in finding and opening desirable locations for stores and service centers, we may not be able to meet our delivery plans.
Trends in Cash Flow, Capital Expenditures and Operating Expenses
We expect to see a net increase in cash and cash equivalents for the full-year 2016. We plan to fund about $1.5 billion in capital expenditures without accessing any outside capital other than our existing sources that support our leasing and finished goods inventory. We plan to invest in equipment to support cell production at the Gigafactory, begin installation of Model 3 vehicle production machinery, open about 80 retail locations and service centers, and energize about 300 new Supercharger locations.
Our operating expenses are expected to grow by about 20% in 2016 as compared to 2015, driven primarily by the expansion of our retail and service centers as well as increases in general and administrative costs to support the growth of the business. We expect sales, general and administrative expenses to decline over time as a percentage of revenue as we focus on increasing operational efficiency while continuing to expand our customer and corporate infrastructure. Over time, we also expect total operating expenses to decrease as a percentage of revenue.
As of December 31, 2015 and December 31, 2014, the net book value of our Supercharger network was $339.2 million and $107.8 million and as of December 31, 2015 included 584 locations globally. We plan to continue investing in our Supercharger network for the foreseeable future, including in North America, Europe and Asia and expect such spending to be a minimal portion of total capital spending during 2016. During 2016, this investment will grow our Supercharger network by about 50%. We allocate Supercharger related expenses to cost of automotive revenues and selling, general, and administrative expenses. These costs were immaterial for all periods presented.
Customer Financing Options
We offer loans and leases in North America, Europe and Asia primarily through various financial institutions. We offer a resale value guarantee in connection with certain loans offered by financial institutions and as of December 31, 2015 had approximately 18,400 vehicles under this program. We expanded this program to selected European and Asian markets during the first half of 2015. Resale value guarantees available for exercise within the next 12 months total $136.8 million in value and relate to 3,017 vehicles.
Vehicle deliveries with the resale value guarantee do not impact our near-term cash flows and liquidity, since we receive the full amount of cash for the vehicle sales price at delivery. However, this program requires the deferral of revenues and costs into future periods as they are considered leases for accounting purposes.
While we do not assume any credit risk related to the customer, if a customer exercises the option to return the vehicle to us, we are exposed to liquidity risk that the resale value of vehicles under these programs may be lower than our guarantee, or the volume of vehicles returned to us may be higher than our estimates, or we may be unable to resell the used cars in a timely manner, all of which could adversely impact our cash flows. Alternatively, in cases where customers retain their vehicles past the expiration of the guarantee period, the remaining deferred revenues and costs will be recognized at no gross profit.
Based on current market demand for our cars, we estimate the resale prices for our vehicles will continue to be above our resale value guarantee amounts. Should market values of our vehicles or customer demand decrease, these estimates may be impacted materially.
33
We currently offer leases in the U. S. directly from our captive financing entity, as well as through a leasing partner. Leasing through Tesl a Finance is now available in 39 states and the District of Columbia. We also offer financing arrangements through e ntities in Canada, Germany and UK. As of December 3 1 , 2015, we ha d leased approximately 3, 660 vehicles throu gh our captive financing entities in the U.S. and Germany and approximately 6,73 0 vehicles through our leasing partner. Le asing through both our captive financing entities and our leasing partner exposes us to residual value risk and will adversely impact our near-term operating results by requiring the deferral of revenues and costs into future periods under lease accounting. In addition, for leas es off ered directly from our captive financing entities (but not for those offered through our bank partner), we will not receive the full amount of the cash for the vehicle price at delivery and will assume customer credit risk. We plan to continue expand ing our leasing offerings.
The Gigafactory
We are developing the Gigafactory as a facility where we work together with our suppliers to integrate production of battery material, cells, modules and battery packs in one location. We broke ground on the Gigafactory in June 2014 and began assembling our Tesla Energy products in the first portion of the facility in the fourth quarter of 2015. We currently expect to produce cells at this site beginning in 2016 for use initially in our Tesla Energy products and later for our vehicles. Over the next few years, we will continue to invest in the expansion of additional Tesla Energy production capacity.
We continue to invest in construction of the building and utilities at the Gigafactory and in production equipment for battery, module and pack production. We will be responsible for the overall management of the Gigafactory and will engage with partners who have significant experience in battery cell and material production. Panasonic has agreed to partner with us on the Gigafactory with investments in production equipment that it will use to manufacture and supply us with battery cells. Under our arrangement with Panasonic, we plan to purchase the full output from their production equipment at negotiated prices. As these terms convey a right to use the production related assets as defined within ASC 840 – Leases , we will consider these leased assets beginning with the start of cell production in 2016.
Given the size and complexity of this undertaking, the cost of building and operating the Gigafactory could exceed our current expectations, we may have difficulty signing up additional partners, and the Gigafactory may take longer to bring online than we anticipate.
Critical Accounting Policies and Estimates
Our consolidated financial statements are prepared in accordance with accounting principles generally accepted in the United States. The preparation of these consolidated financial statements requires us to make estimates and assumptions that affect the reported amounts of assets, liabilities, revenues, costs and expenses and related disclosures. We base our estimates on historical experience, as appropriate, and on various other assumptions that we believe to be reasonable under the circumstances. Changes in the accounting estimates are reasonably likely to occur from period to period. Accordingly, actual results could differ significantly from the estimates made by our management. We evaluate our estimates and assumptions on an ongoing basis. To the extent that there are material differences between these estimates and actual results, our future financial statement presentation, financial condition, results of operations and cash flows will be affected. We believe that the following critical accounting policies involve a greater degree of judgment and complexity than our other accounting policies. Accordingly, these are the policies we believe are the most critical to understanding and evaluating our consolidated financial condition and results of operations.
Revenue Recognition
We recognize revenue for products and services when: (i) a persuasive evidence of an arrangement exists; (ii) delivery has occurred and there are no uncertainties regarding customer acceptance; (iii) pricing or fees are fixed or determinable; and (iv) collection is reasonably assured.
Vehicle sales include standard features, customer selected options and accessories, and specific other elements that meet the definition of a deliverable under multiple-element accounting guidance including free internet connectivity, access to our Supercharger network, and future over the air software updates. These deliverables are valued on a stand-alone basis and we recognize their revenue over our performance period, which is generally the eight-year life of the vehicle, except for internet connectivity which is over the free four year period. If we sell a deliverable separately, we use that pricing to determine its fair value; otherwise, we use our best estimated selling price by considering costs used to develop and deliver the service, third party pricing of similar options, and other information which may be available.
34
Vehicle sales to customers with a residual value guarantee
We offer resale value guarantees or similar buy-back terms to all customers who purchase vehicles and who finance their vehicle through one of our specified banking partners. Under this program, customers have the option of selling their vehicle back to us during the guarantee period for a pre-determined resale value. Guarantee periods generally range from 36 to 39 months. Although we receive full payment for the vehicle sales price at the time of delivery, we are required to account for these as operating leases. The amount of sale proceeds equal to the residual value guarantee is deferred until the guarantee expires or is exercised. The remaining sale proceeds are deferred and recognized on a straight line basis over the stated guarantee period. The guarantee period expires at the earlier of the end of the guarantee period or the pay-off of the initial loan. We capitalize the cost of these vehicles to leased vehicles on our Consolidated Balance Sheets and depreciate their value, less salvage value, to cost of automotive revenue over the same period.
In cases when customer retains ownership of the vehicle at the end of the guarantee period, the resale value guarantee liability and any remaining deferred revenue balances related to the vehicle are settled to automotive revenue and the net book value of the leased vehicle is expensed to costs of automotive revenue. In cases when customers return the vehicle back to us during the guarantee period, we purchase the vehicle from the customer at an amount equal to the resale value guarantee and settle any remaining deferred balances to automotive revenue and we reclassify the net book value of the vehicle on our balance sheet to pre-owned vehicle inventory. As of December 31, 2015, $136.8 million of guarantees are exercisable by customers within the next twelve months.
Vehicle sales to leasing partners with a residual value guarantee
In the fourth quarter of 2014, we also began offering residual value guarantees in connection with automobile sales to certain bank leasing partners. As we have guaranteed the value of these vehicles and as the vehicles are leased to end-customers, we account for these transactions as interest bearing collateralized borrowings as required under ASC 840 - Leases . Under this program, cash is received for the full price of the vehicle and is recorded within resale value guarantee for the long-term portion and deferred revenue for the current portion. We accrete the deferred revenue amount to automotive revenue on a straight line basis over the guarantee period and accrue interest expense based on our borrowing rate. We capitalize vehicles under this program to leased vehicles on our Consolidated Balance Sheets and record depreciation from these vehicles to cost of automotive revenues during the period the vehicle is under a lease arrangement. Cash received for these vehicles, net of revenue recognized during the period, is classified as collateralized lease borrowings within cash flows from financing activities in our Consolidated Statements of Cash Flows.
At the end of the lease term, we settle our liability in cash by either purchasing the vehicle from the leasing partner for the residual value guarantee amount, or paying a shortfall to the guarantee amount the leasing partner may realize on the sale of the vehicle. Any remaining balances within deferred revenue and resale value guarantee will be settled to automotive revenue. In cases where the bank retains ownership of the vehicle after the end of our guarantee period, we expense the net value of the leased vehicle to costs of automotive revenue. The maximum cash we could be required to pay under this program, assuming we repurchase of all vehicles under this program is $348.2 million at December 31, 2015.
As of December 31, 2015 and December 31, 2014, we had $527.5 million and $16.7 million of such borrowings recorded in the resale value guarantee liability and $120.5 million and $3.9 million recorded in deferred revenue liability.
At least annually, we assess the estimated market values of vehicles under our resale value guarantee program to determine if we have sustained a loss on any of these contracts. As we accumulate more data related to the resale values of our vehicles or as market conditions change, there may be significant changes to their estimated values.
Direct Vehicle Leasing Program
We offer a vehicle leasing program in certain locations in the United States, Canada and Germany. Qualifying customers are permitted to lease a vehicle directly from Tesla for 36 or 48 months. At the end of the lease term, customers have the option of either returning the vehicle to us or purchasing if for a pre-determined residual value. We account for these leasing transactions as operating leases and recognize leasing revenues over the contractual term and record the depreciation of these vehicles to cost of automotive revenues. As of December 31, 2015 and December 31, 2014, we had deferred $25.8 million and $9.4 million of lease-related upfront payments which will be recognized on a straight-line basis over the contractual term of the individual leases. Lease revenues are recorded in automotive revenue and for the year ended December 31, 2015 and December 31, 2014, we recognized $41.2 million and $4.4 million
Maintenance and Service Plans
We offer a prepaid maintenance program for our vehicles, which includes plans covering maintenance for up to eight years or up to 100,000 miles, provided these services are purchased within a specified period of time. The maintenance plans cover annual inspections and the replacement of wear and tear parts, excluding tires and the battery. Payments collected in advance of the performance of service are initially recorded in deferred revenues on the consolidated balance sheets and recognized in automotive sales as we fulfill our performance obligations.
35
We also offer an extended service plan, which covers the repair or replacement of vehicle parts for an additional four years or up to an additional 50,000 miles, after the end of our initial New Vehicl e Limited Warranty, provided they are purchased within a specified period of time. Payments collected in advance of the performance of service are initially recorded in deferred revenues on the consolidated balance sheets and recognized in automotive sales ratably over the service coverage periods.
Inventory Valuation
Inventories are stated at the lower of cost or market. Cost is computed using standard cost, which approximates actual cost on a first-in, first-out basis. We record inventory write-downs for excess or obsolete inventories based upon assumptions about on current and future demand forecasts. If our inventory on hand is in excess of our future demand forecast, the excess amounts are written off.
We also review inventory to determine whether its carrying value exceeds the net amount realizable upon the ultimate sale of the inventory. This requires us to determine the estimated selling price of our vehicles less the estimated cost to convert inventory on hand into a finished product. Once inventory is written-down, a new, lower-cost basis for that inventory is established and subsequent changes in facts and circumstances do not result in the restoration or increase in that newly established cost basis.
Should our estimates of future selling prices or production costs change, additional and potentially material increases to this reserve may be required. A small change in our estimates may result in a material charge to our reported financial results.
Warranties
We provide a manufacturer's warranty on all vehicles, production powertrain components and systems, and Tesla Energy products we sell. At the time of delivery, we accrue for a manufacturer's warranty which includes our best estimate of the projected costs to repair or to replace items under warranty. These estimates are based on actual claims incurred to-date and an estimate of the nature, frequency and costs of future claims.
These estimates are inherently uncertain and changes to our historical or projected warranty experience may cause material changes to our warranty reserve in the future. The portion of the warranty provision expected to be incurred within 12 months is classified as a current liability.
Our warranty reserves do not include projected warranty costs associated with our vehicles accounted for as operating leases or collateralized debt arrangements. Costs to repair these vehicles are expensed as incurred. Warranty expense is recorded as a component of cost of automotive revenue.
Stock-Based Compensation
We use the fair value method of accounting for our stock options and restricted stock units (RSUs) granted to employees and our Employee Stock Purchase Plan (ESPP) to measure the cost of employee services received in exchange for the stock-based awards. The fair value of stock options and ESPP are estimated on the grant date and offering date using the Black-Scholes option-pricing model. The fair value of RSUs is measured on the grant date based on the closing fair market value of our common stock. The resulting cost is recognized over the period during which an employee is required to provide service in exchange for the awards, usually the vesting period which is generally four years for stock options and RSUs and six months for the ESPP. Stock-based compensation expense is recognized on a straight-line basis, net of estimated forfeitures.
The Black-Scholes option-pricing model requires inputs such as the risk-free interest rate, expected term and expected volatility. Further, the forfeiture rate also affects the amount of aggregate compensation. These inputs are subjective and generally require significant judgment.
We estimate our forfeiture rate based on an analysis of our actual forfeiture experience and will continue to evaluate the appropriateness of the forfeiture rate based on actual forfeiture experience, analysis of employee turnover behavior and other factors. Quarterly changes in the estimated forfeiture rate can have a significant effect on reported stock-based compensation expense, as the cumulative effect of adjusting the rate for all expense amortization is recognized in the period the forfeiture estimate is changed. If a revised forfeiture rate is higher than the previously estimated forfeiture rate, an adjustment is made that will result in a decrease to the stock-based compensation expense recognized in the consolidated financial statements. If a revised forfeiture rate is lower than the previously estimated forfeiture rate, an adjustment is made that will result in an increase to the stock-based compensation expense recognized in the consolidated financial statements.
As we accumulate additional employee stock-based awards data over time and as we incorporate market data related to our common stock, we may calculate significantly different volatilities, expected lives and forfeiture rates, which could materially impact the valuation of our stock-based awards and the stock-based compensation expense that we will recognize in future periods. Stock-based compensation expense is recorded in our cost of revenues, research and development expenses, and selling, general and administrative expenses.
36
In August 2012, our Board of Directors granted 5,27 4,901 stock options to our CEO (2012 CEO Grant). The 2012 CEO Grant consists of ten vesting tranches with a vesting schedule based entirely on the attainment of both performance conditions and market conditions, assuming continued employment and service t o us through each vesting date.
Each of the vesting tranches requires a combination of one of the ten pre-determined performance milestones outlined below and an incremental increase in our market capitalization of $4.0 billion, as compared to the initial market capitalization of $3.2 billion measured at the time of the 2012 CEO Grant.
| · | Successful completion of the Model X Alpha Prototype; |
| · | Successful completion of the Model X Beta Prototype; |
| · | Completion of the first Model X Production Vehicle; |
| · | Successful completion of the Model 3 Alpha Prototype; |
| · | Successful completion of the Model 3 Beta Prototype; |
| · | Completion of the first Model 3 Production Vehicle; |
| · | Gross margin of 30% or more for four consecutive quarters; |
| · | Aggregate vehicle production of 100,000 vehicles; |
| · | Aggregate vehicle production of 200,000 vehicles; and |
| · | Aggregate vehicle production of 300,000 vehicles. |
The term of the 2012 CEO Grant is ten years, so any tranches that remain unvested at the expiration of the 2012 CEO Grant will be forfeited. In addition, unvested options will be forfeited if our CEO is no longer in that role, whether for cause or otherwise.
We measured the fair value of the 2012 CEO Grant using a Monte Carlo simulation approach with the following assumptions: risk-free interest rate of 1.65%, expected term of ten years, expected volatility of 55% and dividend yield of 0%.
Stock-based compensation expense associated with the 2012 CEO Grant is recognized for each pair of performance and market conditions over the longer of the expected achievement period of the performance and market conditions, beginning at the point in time that the relevant performance condition is considered probable of being met.
As of December 31, 2015, the market conditions for seven vesting tranches and the following performance milestones were achieved and approved by our Board of Directors, and therefore four of ten tranches of the 2012 CEO Grant were vested as of such date:
| · | Successful completion of the Model X Alpha Prototype |
| · | Successful completion of the Model X Beta Prototype; and |
| · | Completion of the first Model X Production Vehicle |
| · | Aggregate vehicle production of 100,000 vehicles |
As of December 31, 2015 the following two performance milestones were considered probable of achievement:
| · | Successful completion of the Model 3 Alpha Prototype; and |
| · | Successful completion of the Model 3 Beta Prototype |
As the above three performance milestones were considered probable of achievement, we recorded stock-based compensation expense of $10.6 million, $25.0 million and $14.5 million for the years ended December 31, 2015, 2014 and 2013.
Additionally, no cash compensation has ever been received by our CEO for his services to the Company.
Income Taxes
We are subject to federal and state taxes in the United States in many foreign jurisdictions. Significant judgment is required in determining our provision for income taxes, our deferred tax assets and liabilities and any valuation allowance recorded against our net deferred tax assets. We make these estimates and judgments about our future taxable income that are based on assumptions that are consistent with our future plans. Tax laws, regulations, and administrative practices may be subject to change due to economic or political conditions including fundamental changes to the tax laws applicable to corporate multinationals. The U.S., many countries in the European Union, and a number of other countries are actively considering changes in this regard. As of December 31, 2015, we had recorded a full valuation allowance on our net U.S. deferred tax assets because we expect that it is more likely than not that our U.S. deferred tax assets will not be realized in the foreseeable future. Should the actual amounts differ from our estimates, the amount of our valuation allowance could be materially impacted.
37
Furthermore, significant judgment is required in evaluating our tax positions. In the ordinary course of business, there are many transactions and calculations for which the ultimate tax settlement is uncertain. As a result, we recognize th e effect of this uncertainty on our tax attributes based on our estimates of the eventual outcome. These effects are recognized when, despite our belief that our tax return positions are supportable, we believe that it is more likely than not that those po sitions may not be fully sustained upon review by tax authorities. We are required to file income tax returns in the United States and various foreign jurisdictions, which requires us to interpret the applicable tax laws and regulations in effect in such j urisdictions. Such returns are subject to audit by the various federal, state and foreign taxing authorities, who may disagree with respect to our tax positions. We believe that our consideration is adequate for all open audit years based on our assessment of many factors, including past experience and interpretations of tax law. We review and update our estimates in light of changing facts and circumstances, such as the closing of a tax audit, the lapse of a statute of limitations or a change in estimate. To the extent that the final tax outcome of these matters differs from our expectations, such differences may impact income tax expense in the period in which such determination is made. The eventual impact on our income tax expense depends in part if we s till have a valuation allowance recorded against our deferred tax assets in the period that such determination is made.
Results of Operations
Revenues
Automotive revenue includes revenues related to deliveries of new Model S and Model X vehicles, including internet connectivity, Supercharging access, and over the air software updates, as well as sales of regulatory credits to other automotive manufacturers, amortization of revenue for cars sold with resale value guarantees, and vehicle leasing revenue.
Services and other revenue consists of repair and maintenance services, service plans and merchandise, sales of pre-owned Tesla vehicles, sales of electric vehicle powertrain components and systems to other manufacturers, Tesla Energy products, and net sales of non-Tesla vehicle trade-ins.
Automotive revenue during the years ended December 31, 2015, 2014, and 2013 were $3.74 billion, $3.00 billion, and $1.92 billion. The increase was primarily driven by the ramp in vehicle deliveries. For the years ended December 31, 2015, 2014, and 2013 automotive revenue includes $309.4 million, $132.6 million and $33.5 million from the accretion of the deferred revenues from our resale value guarantee and other similar programs, as well as Tesla leasing.
Service and other revenue during the years ended December 31, 2015, 2014, and 2013 were $305.0 million, $191.3 million, and $91.6 million, related primarily to increases in pre-owned vehicle sales and maintenance service revenue in all years, and increased powertrain sales in 2014 as compared to 2013.
Cost of Revenues and Gross Profit
Cost of automotive revenues includes direct parts, material and labor costs, manufacturing overhead, including amortized tooling costs, shipping and logistic costs, vehicle internet connectivity costs, allocations of electricity and infrastructure costs related to our Supercharger network, and reserves for estimated warranty expenses. Cost of revenues also includes adjustments to warranty expense and charges to write down the carrying value of our inventory when it exceeds its estimated net realizable value and to provide for on-hand inventory that is either obsolete or is in excess of forecasted demand.
Cost of automotive revenues for the year ended December 31, 2015, 2014, and 2013 were $2.82 billion, $2.15 billion, and $1.48 billion. The increase in cost of automotive revenues was driven primarily by increased Model S deliveries. For the years ended December 31, 2015, 2014, and 2013, we recognized $172.4 million, $84.5, and $21.1 million in cost of automotive revenues related to cars accounted for as operating leases.
Cost of services and other revenue includes direct parts, material and labor costs for repair and maintenance services, allocations of service center overhead costs, pre-owned Tesla vehicle sales, sales of our powertrain components, and costs related to the production and sale of Tesla Energy products. For the years ended December 31, 2015, 2014, and 2013 costs of services and other revenue were $299.2 million, $170.9 million, and $73.9 million. The increase in cost of services and other revenues was driven primarily by greater pre-owned vehicle sales and increased maintenance and repair services in all years, and increased powertrain sales to Daimler in 2014 as compared to 2013.
38
Gross profit for the years ended December 31, 2015, 2014, and 2013 were $923.5 million, $881.7 million and $456.3 million Gross ma rgin for the years ended December 31, 2015, 2014, and 2013 were 22.8%, 27.6%, and 22.7%. The lower margin in 2015 as compared to 2014 was primarily due to product and regional mix shift, as a greater percentage of sales were derived from vehicle models wit h lower average selling prices, and increased manufacturing costs related to the ramp in production of the small drive unit for dual motor Model S vehicles and start of Model X production , obsolete inventory and lower ZEV credits revenue. This margin decre ase was partially offset by an increasing amount of revenues from vehicles accounted for as leases including direct lease vehicles and those under our resale value guarantee programs which have a significantly higher gross margin and from material cost sav ings. Services and other gross margin were also down year over year, primarily driven by a planned price reduction for powertrain sales to Daimler. The increase in gross profit from 2013 to 2014 was primarily due to manufacturing and supply chain efficien cies as well as component cost reductions and higher regulatory credit sales, partially offset by manufacturing inefficiencies associated with transitioning to our new final assembly line and launch of All-Wheel Drive Dual Motor Model S.
Research and Development Expenses
Research and development (R&D) expenses consist primarily of personnel costs for our teams in engineering and research, supply chain, quality, manufacturing engineering and manufacturing test organizations, prototyping expense, contract and professional services and amortized equipment expense.
R&D expenses for the year ended December 31, 2015 were $717.9 million, an increase from $464.7 million for the year ended December 31, 2014. The increase in R&D expenses consisted primarily of a $93.9 million increase in expensed materials primarily to support our Model X development and Model S improvements, a $75.9 million increase in employee compensation expenses, a $30.6 million increase in facilities and depreciation costs, a $20.1 million increase in costs related to Model X, Autopilot and dual motor powertrain engineering, design and testing activities and a $22.8 million increase in stock-based compensation expense related to increased headcount and increasing values of awards granted.
R&D expenses for the year ended December 31, 2014 were $464.7 million, an increase from $232.0 million for the year ended December 31, 2013. The increase in R&D expenses consisted primarily of an $85.3 million increase in employee compensation expenses, a $60.7 million increase in expensed materials primarily to support our Model X, dual motor powertrain and right-hand drive Model S development, a $50.9 million increase in costs related to Model X, dual motor powertrain and right-hand drive Model S engineering, design and testing activities, a $28.1 million increase in stock-based compensation expense related to increased headcount and increasing values of awards granted, a $4.1 million increase in office, information technology and facilities-related costs and a $3.3 million increase in shipping charges for Model X, dual motor powertrain and right-hand drive Model S development.
Selling, General and Administrative Expenses
Selling, general and administrative (SG&A) expenses consist primarily of personnel and facilities costs related to our Tesla retail and service stores, marketing, sales, executive, finance, human resources, information technology and legal organizations, settlements and fees for professional and contract services supporting these functions.
SG&A expenses for the year ended December 31, 2015 were $922.2 million, an increase from $603.7 million for the year ended December 31, 2014. SG&A expenses increased primarily from higher headcount and facility costs, including stock based compensation, to support an expanded retail, service and Supercharger footprint as well as the general growth of the business. The increase in our SG&A expenses consisted primarily of a $138.4 million increase in employee compensation expenses related to higher sales, service and marketing headcount to support sales activities worldwide and higher general and administrative headcount to support the expansion of the business, $126.1 million increase in office, information technology and facilities-related costs to support the growth of our business as well as sales and marketing activities to handle our expanding market presence, a $41.8 million increase in professional and outside services costs, and a $12.2 million increase in stock based compensation.
SG&A expenses for the year ended December 31, 2014 were $603.7 million, an increase from $285.6 million for the year ended December 31, 2013. SG&A expenses increased primarily from higher headcount and facility costs to support an expanded retail, service and Supercharger footprint as well as the general growth of the business. The $318.1 million increase in our SG&A expenses consisted primarily of a $141.1 million increase in employee compensation expenses related to higher sales, service and marketing headcount to support sales activities worldwide and higher general and administrative headcount to support the expansion of the business, a $135.9 million increase in office, information technology and facilities-related costs to support the growth of our business as well as sales and marketing activities to handle our expanding market presence, a $35.8 million increase in stock-based compensation expense related to additional headcount and increasing value of awards granted and a $27.2 million increase in professional and outside services costs.
Interest Expense
Interest expense for the years ended December 31, 2015, 2014, and 2013 was $118.9 million, $100.9 million, and $32.9 million. The increase in interest expense is primarily due to the issuance of $920.0 million aggregate principal amount of 2019 Notes and $1.38 billion aggregate principal amount of 2021 Notes during the first half of 2014.
39
Other Income (Expense), Net
Other income (expense), net, consists primarily of foreign exchange gains and losses related to our foreign currency-denominated monetary assets and liabilities and the change in the fair value of our DOE common stock warrant liability. Our foreign exchange gains and losses will vary depending upon movements in the underlying foreign currency exchange rates. Prior to the expiration of the DOE warrant in May 2013, the DOE warrant had been carried at its estimated fair value with changes in its fair value reflected in other income (expense), net.
Other income (expense), net, for the years ended December 31, 2015, 2014, and 2013 was ($41.7) million, $1.8 million and $22.6 million. Fluctuations in other income (expense) from 2014 to 2015 are primarily the result of gains (losses) from foreign currency exchange of ($45.6) million and $2.0 million for the years ended December 31, 2015 and 2014. Foreign currency losses during 2015 related primarily to changes in the exchange rates of euro, Norwegian krone, Canadian dollars, and Chinese yuan. Other income, net of $22.6 million in 2013 was primarily due to the reduction in fair value of our DOE common stock warrant liability of $10.7 million during the year. Other income, net, also includes the favorable foreign currency exchange impact from our foreign currency-denominated liabilities during the year ended December 31, 2013, especially related to the Japanese yen.
Provision for Income Taxes
Our provision for income taxes for the years ended December 31, 2015, 2014, and 2013 was $13.0 million, $9.4 million, and $2.6 million. The increases in the provision for income taxes were due primarily to the increase in taxable income in our international jurisdictions.
Liquidity and Capital Resources
As of December 31, 2015, we had $1.20 billion in principal sources of liquidity available from our cash and cash equivalents including $297.8 million of money market funds. Amounts held in foreign currencies had a US dollar equivalent of $535.6 million as of December 31, 2015, and consisted primarily of euro, Danish krone, Norwegian krone, Swedish krone, Canadian dollars, euro, and Japanese yen.
Sources of cash are predominately from our deliveries of vehicles, as well as customer deposits, sales of regulatory credits, proceeds from financing activities, Tesla Energy products, and repair and maintenance services. We expect that our current sources of liquidity, including cash and cash equivalents, together with our current projections of cash flow from operating activities, will provide us with adequate liquidity over the next 12 months based on our current plans. These cash flows enable us to fund our ongoing operations, research and development projects for our planned Model 3, and certain other future products; purchase tooling and manufacturing equipment required to continue to ramp up production of Model X and Model S; construct our Gigafactory; and establish and expand our retail stores, service centers and Supercharger network. We currently anticipate making aggregate capital expenditures of about $1.5 billion in 2016.
In 2015, we entered into a senior secured asset-based revolving credit agreement with a syndicate of banks under which we currently have total commitments of up to $1 billion. The Credit Agreement provides for a senior secured asset-based revolving credit facility, which we may draw upon as needed, subject to certain conditions. Borrowed funds bear interest, at the Company's option, at an annual rate of (a) 1% plus LIBOR or (b) the highest of (i) the federal funds rate plus 0.50%, (ii) the lenders "prime rate" or (iii) 1% plus LIBOR. In February 2016, we amended the Credit Agreement and increased the availability and the commitments under the Credit Agreement from $750.0 million to $1.0 billion. As of December 31, 2015, borrowings under the Credit Facility of $135.0 million were used to repay all borrowings under and terminate a secured asset based line of credit we used to support our direct leasing program.
When market conditions are favorable, we may evaluate alternatives to pursue liquidity options to fund capital intensive initiatives. Should prevailing economic, financial, business or other factors adversely affect our ability to meet our operating cash requirements, we could be required to obtain funding though traditional or alternative sources of financing. We cannot be certain that additional funds would be available to us on favorable terms when required, or at all.
Summary of Cash Flows
|
| Year Ended December 31, |
| |||||||||
|
| 2015 |
|
| 2014 |
|
| 2013 |
| |||
Net cash provided by (used in) operating activities |
| $ | (524,499 | ) |
| $ | (57,337 | ) |
| $ | 264,804 |
|
Net cash used in investing activities |
|
| (1,673,551 | ) |
|
| (990,444 | ) |
|
| (249,417 | ) |
Net cash provided by financing activities |
|
| 1,523,523 |
|
|
| 2,143,130 |
|
|
| 635,422 |
|
40
Cash Flows from Operating Activities
Our cash flows from operating activities are significantly affected by our cash investments to support the growth of our business in areas such as manufacturing, research and development and selling, general and administrative. Our operating cash flows are also affected by our working capital needs to support growth and fluctuations in inventory, personnel related expenditures, accounts payable and other current assets and liabilities.
Our operating cash inflows include cash from sales of our vehicles, customer deposits for Model S and Model X, sales of regulatory credits, cash from the provision of development services, and sales of powertrain components and systems. These cash inflows are offset by payments we make to our suppliers for production materials and parts used in our manufacturing process, employee compensation, operating leases and interest expense on our financings.
Cash provided by (used in) operating activities was ($524.5) million, ($57.3) million and $264.8 in 2015, 2014 and 2013. The decrease in operating cash flows in 2015 as compared to 2014 was due to an increase in overall inventory to support growth, and increase in operating lease vehicles, partially offset by proceeds from sales, and higher operating expenses in R&D and SG&A.
The decrease in operating cash flows in 2014 as compared to 2013 was due to an increase in finished goods inventory primarily due to cars whose delivery slipped from Q4 of 2014 to the following year, an increase in raw material inventory balances at year end necessary to meet our planned production requirements for Model S in Q1 of the following year, higher operating expenses in R&D and SG&A, and use of cash for vehicles directly leased by us, partially offset by increased cash receipts from customer payments on vehicle sales, including an increase in customer deposits.
Customer Deposits
We collect deposits from customers at the time they place an order for a vehicle and, in some locations, at certain additional milestones up to the point of delivery. Customer deposit amounts and timing vary depending on the vehicle model and country of delivery. Customer deposits are fully refundable up to the point the vehicle is placed into the production cycle. Amounts are included in current liabilities until refunded or until they are applied to a customer's purchase balance at time of delivery. As of December 31, 2015, we held $283.4 million in customer deposits.
Cash Flows from Investing Activities
Cash flows from investing activities primarily relate to capital expenditures to support our growth in operations, including investments in Model S manufacturing equipment and tooling and our stores, service centers and Supercharger network infrastructure. Cash used in investing activities was $1.67 billion, $990.4 million and $249.4 million in 2015, 2014 and 2013. Cash flows from investing activities and variability between each year related primarily to capital expenditures, which were $1.63 billion, $969.9 million, and $264.2 million in 2015, 2014, and 2013. Expenditures in all years consisted primarily of purchases of capital equipment, tooling, and facilities to support our Model S and Model X manufacturing.
In 2014, we began construction of our Gigafactory facility in Nevada. Tesla's contribution to total capital expenditures are expected to be about $2.0 billion over the next 5 years. In 2015, we used cash of $220.0 million towards the construction of the first stage of this project and expect to spend up to $250 million over the next 12 months.
Cash Flows from Financing Activities
Net cash provided by financing activities was $1.52 billion, $2.14 billion and $635.4 million in 2015, 2014 and 2013. Cash flows from financing activities during the twelve months ended December 31, 2015 consisted primarily of $738.3 million net proceeds from August 2015 public offering of 3,099,173 shares of common stock and $568.7 received from vehicle sales to our bank leasing partners. The decrease in cash provided from financing in 2015 as compared to 2014 was primarily due to $2.1 billion net proceeds received in 2014 from issuance of our 2019 and 2021 Notes.
The increase in cash provided from financing in 2014 as compared to 2013 was primarily due to $2.1 billion net proceeds from the issuance of our 2019 and 2021 Notes, including the associated hedge and warrant transactions, representing a $1.5 billion increase in debt financing as compared to 2013. Cash flows from financing in 2013 that did not recur in 2014 included proceeds of $415.0 million from the issuance of common stock in public and private offerings and $452.3 million used to repay our DOE loans.
0.25% and 1.25% Convertible Senior Notes and Bond Hedge and Warrant Transactions
In 2014, we issued $920.0 million principal amount of 0.25% convertible senior notes due 2019 (2019 Notes) and $1.38 billion principal amount of 1.25% convertible senior notes due 2021 (2021 Notes) in a public offering. The total net proceeds from these offerings, after deducting transaction costs, were approximately $905.8 million from the 2019 Notes and $1.36 billion from the 2021 Notes. The interest rates are fixed at 0.25% and 1.25% per annum for the 2019 and 2021 Notes, and are payable semi-annually in arrears on March 1 and September 1 of each year, commencing on September 1, 2014.
41
In connection with the offering of these notes in 2014, we purchased convertible note hedges for $603.4 million in aggregate and sold warrants for $389.2 million in aggregate. Taken together, the pur chase of the convertible note hedges and the sale of warrants are intended to offset any actual dilution from the conversion of the 2019 Notes and 2021 Notes.
During the fourth quarter of 2015, the closing price of our common stock did not meet or exceed 130% of the applicable conversion price of our 2019 Notes and 2021 Notes on at least 20 of the last 30 consecutive trading days of the quarter; furthermore, no other conditions allowing holders of these notes to convert have been met as of December 31, 2015. Therefore, the 2019 Notes and 2021 Notes are not convertible during the first quarter of 2016 and are classified as long-term debt. Should the closing price conditions be met in the first quarter of 2016 or a future quarter, the 2019 Notes and/or the 2021 Notes will be convertible at their holders' option during the immediately following quarter.
1.50% Convertible Senior Notes and Bond Hedge and Warrant Transactions
In May 2013, we issued $660.0 million aggregate principal amount of 1.50% convertible senior notes due 2018 (the Notes) in a public offering. The net proceeds from the offering, after deducting transaction costs, were approximately $648.0 million. The interest under the Notes is fixed at 1.50% per annum and is payable semi-annually in arrears on June 1 and December 1 of each year, commencing on December 1, 2013.
In connection with the offering of the 2018 Notes, we purchased convertible note hedges for $177.5 million in aggregate and sold warrants for $120.3 million in aggregate. Taken together, the purchase of the convertible note hedges and the sale of warrants are intended to offset any actual dilution from the conversion of the 2018 Notes.
During the fourth quarter of 2015, the closing price of our common stock exceeded 130% of the applicable conversion price of our 2018 Notes on at least 20 of the last 30 consecutive trading days of the quarter; therefore, holders of 2018 Notes may convert their notes during the first quarter of 2016. As such, we classified the $617.7 million carrying value of our 2018 Notes as current liabilities and classified $42.1 million, representing the difference between the aggregate principal of our 2018 Notes of $659.8 million and the carrying value of 2018 Notes, as mezzanine equity on our consolidated balance sheet as of December 31, 2015. Similarly, debt issuance costs were classified as other current assets as of December 31, 2015. Should the closing price conditions be met in the first quarter of 2016 or a future quarter, the 2018 Notes will be convertible at their holders' option during the immediately following quarter.
For more information on the 2018 Notes, 2019 Notes, and 2021 Notes see Part II - Item 8 - Financial Statements and Supplementary Data, Note 8 - Convertible Notes and Long-Term Debt Obligations .
Common Stock Offering and Concurrent Private Placement
Concurrent with the execution of the 2018 Notes and related transactions in May 2013, we also completed a public offering of common stock and sold a total of 3,902,862 shares of our common stock for total cash proceeds of approximately $355.1 million (which includes 487,857 shares or $45.0 million sold to our Chief Executive Officer (CEO)), net of underwriting discounts and offering costs. We also sold 596,272 shares of our common stock to our CEO and received total cash proceeds of $55.0 million in a private placement at the public offering price.
In August 2015, we completed a public offering of common stock and sold a total of 3,099,173 shares of our common stock for total cash proceeds of approximately $738.3 million (which includes 82,645 shares or $20.0 million sold to Elon Musk, our Chief Executive Officer (CEO)), net of underwriting discounts and offering costs.
Contractual Obligations
We are party to contractual obligations involving commitments to make payments to third parties, including certain debt financing arrangements and leases, primarily for stores, service centers, certain manufacturing and corporate offices. These also include, as part of our normal business practices, contracts with suppliers for purchases of certain raw materials, components, and services to facilitate adequate supply of these materials and services and capacity reservation contracts. We have the following contractual obligations, including firm purchase obligations. A purchase obligation is defined as an agreement to purchase goods or services that is enforceable and legally binding on us and that specifies all significant terms. For obligations with cancellation provisions, the amounts included in the table below were limited to the non-cancelable portion of the agreement terms. The expected timing of payments of the obligations in the preceding table is estimated based on current information. Timing of payments and actual amounts paid may be different, depending on the time of receipt of goods or services, or changes to agreed-upon amounts for some obligations. Open purchase orders are generally cancellable in full or in part at our discretion and are therefore not considered firm purchase obligations.
42
The following table sets forth, as of December 31, 2015 certain significant obligations that will affect our future liquidity (in thousands):
|
| Year Ended December 31, |
| |||||||||||||||||||||
|
| Total |
|
| 2016 |
|
| 2017 |
|
| 2018 |
|
| 2019 |
|
| 2020 and thereafter |
| ||||||
Operating lease obligations |
| $ | 570,864 |
|
| $ | 88,629 |
|
| $ | 86,661 |
|
| $ | 78,531 |
|
| $ | 69,013 |
|
| $ | 248,030 |
|
Capital lease obligations, including interest |
|
| 34,679 |
|
|
| 16,758 |
|
|
| 11,321 |
|
|
| 5,488 |
|
|
| 1,112 |
|
|
| - |
|
Purchase obligations (1)(2) |
|
| 549,716 |
|
|
| 537,719 |
|
|
| 11,997 |
|
|
|
|
|
|
| - |
|
|
| - |
|
2018 Notes, including interest (3) |
|
| 684,537 |
|
|
| 684,537 |
|
|
| - |
|
|
| - |
|
|
| - |
|
|
| - |
|
2019 Notes, including interest |
|
| 928,050 |
|
|
| 2,300 |
|
|
| 2,300 |
|
|
| 2,300 |
|
|
| 1,150 |
|
|
| 920,000 |
|
2021 Notes, including interest |
|
| 1,474,875 |
|
|
| 17,250 |
|
|
| 17,250 |
|
|
| 17,250 |
|
|
| 17,250 |
|
|
| 1,405,875 |
|
Total |
| $ | 4,242,721 |
|
| $ | 1,347,193 |
|
| $ | 129,529 |
|
| $ | 103,569 |
|
| $ | 88,525 |
|
| $ | 2,573,905 |
|
(1) | Amounts do not include future cash payments for purchase obligations which were recorded in Accounts payable or Accrued liabilities at December 31, 2015. |
(2) | These totals represent aggregate purchase commitments with all vendors. Some of the commitments included are our agreements with Panasonic Corporation, to the extent quantities and timing of such purchases are fixed. Should we terminate the Panasonic contracts prior to purchasing certain minimum quantities, we would owe an additional $57 million under the terms of the agreement as of December 31, 2015. |
(3) | During the fourth quarter of 2015, the closing price of our common stock exceeded 130% of the applicable conversion price of our 2018 Notes on at least 20 of the last 30 consecutive trading days of the quarter; therefore, holders of 2018 Notes may convert their notes during the first quarter of 2016. As such, we classified the $617.7 million carrying value of our 2018 Notes as current liabilities on our condensed consolidated balance sheet as of December 31, 2015 and have included related contractual payments in the 2016 category in the table above. |
Off-Balance Sheet Arrangements
During the periods presented, we did not have relationships with unconsolidated entities or financial partnerships, such as entities often referred to as structured finance or special purpose entities, which would have been established for the purpose of facilitating off-balance sheet arrangements or other contractually narrow or limited purposes.
ITEM 7A. | QUANTITATIVE AND QUALITATIVE DISCLOSURES ABOUT MARKET RISK |
Foreign Currency Risk
We transact business globally in multiple currencies. Our international revenues, as well as costs and expenses denominated in foreign currencies, expose us to the risk of fluctuations in foreign currency exchange rates against the functional currencies of our foreign subsidiaries and against the U.S. dollar. Upon consolidation, as foreign exchange rates vary, revenues and expenses may be significantly impacted and we may record significant gains or losses on the remeasurement of monetary assets and liabilities, including intercompany balances. As of December 31, 2015, our largest currency exposures are from the euro, Chinese yuan, Norwegian and Danish krona, Canadian dollar, Swiss franc, British pound, and Japanese yen. We recorded foreign exchange losses of $45.6 million in other income (expense), net, for the year ended December 31, 2015 related the impact of changes in exchange rates on foreign currency denominated monetary assets and liabilities.
We considered the historical trends in currency exchange rates and determined that it was reasonably possible that adverse changes in exchange rates of 10% for all currencies could be experienced in the near term. These reasonably possible adverse changes in exchange rates of 10% were applied to total monetary assets and liabilities denominated in currencies other than the local currencies as of December 31, 2015 to compute the adverse impact these changes would have had on our income before income taxes in the near term. These changes would have resulted in an adverse impact on income before income taxes of approximately $189.2 million, recorded to other income (expense), net, principally from intercompany and cash balances.
43
In November 2015, we implemented a program to hedge the foreign currency exposure risk related to certain forecasted inventory purchases denominated in Japanese yen. The derivative instruments we use are foreign currency forward contracts and are designated as cash flow hedges with maturity dates of 12 months or less. We do not enter into derivative contracts for trading or speculative purposes. We document each hedge relationship a nd assess its initial effectiveness at the inception of the hedge contract and we measure its ongoing effectiveness on a quarterly basis using regression analysis. During the term of an effective hedge contract, we record gains and losses within accumulate d other comprehensive loss. We reclassify these gains or losses to costs of automotive sales in the period the related finished goods inventory is sold or over the depreciation period for those sales accounted for as leases. Although our contracts are cons idered effective hedges, we may experience small amounts of ineffectiveness due to timing differences between our actual inventory purchases and the settlement date of the related foreign currency forward contracts. We have recorded zero amount of ineffect iveness within other income (expense), net in our Consolidated Statements of Operations, as of December 31, 2015. As o f December 31, 2015 we had recorded a gain of $7.3 million to AOCI related to our foreign currency cash flow hedges. If t he U.S. dollar ha d strengthened by 10% as of December 31, 2015, the amount recorded in accumulated AOCI related to our foreign exchange contracts before tax ef fect would have been a loss of approximately $21.1 million.
Interest Rate Risk
We had cash and cash equivalents totaling $1.20 billion as of December 31, 2015. A significant portion of our cash and cash equivalents were invested in money market funds. Cash and cash equivalents are held for working capital purposes. We do not enter into investments for trading or speculative purposes. We believe that we do not have any material exposure to changes in the fair value as a result of changes in interest rates due to the short term nature of our cash equivalents.
As of December 31, 2015, we had $2.96 billion aggregate principal amount of convertible senior notes outstanding, which are fixed rate instruments. Therefore, our results of operations are not subject to fluctuations in interest rates. However, the fair value of our debt will fluctuate with movements of interest rates, increasing in periods of declining rates of interest and declining in periods of increasing rates of interest. Based upon quoted market prices and Level 2 inputs, the fair value of our total debt was $3.4 billion as of December 31, 2015.
44
I TEM 8. | FINANCIAL STATEMENTS AND SUPPLEMENTARY DATA |
Index to Consolidated Financial Statements
|
| Page |
Report of Independent Registered Public Accounting Firm |
| 46 |
Consolidated Balance Sheets |
| 47 |
Consolidated Statements of Operations |
| 48 |
Consolidated Statements of Comprehensive Loss |
| 49 |
Consolidated Statements of Stockholders' Equity |
| 50 |
Consolidated Statements of Cash Flows |
| 51 |
Notes to Consolidated Financial Statements |
| 52 |
45
R eport of Independent Registered Public Accounting Firm
To the Board of Directors and Stockholders of Tesla Motors, Inc.
In our opinion, the accompanying consolidated balance sheets and the related consolidated statements of operations, of comprehensive loss, of stockholders' equity and of cash flows present fairly, in all material respects, the financial position of Tesla Motors, Inc. and its subsidiaries at December 31, 2015 and December 31, 2014, and the results of their operations and their cash flows for each of the three years in the period ended December 31, 2015 in conformity with accounting principles generally accepted in the United States of America. Also in our opinion, the Company maintained, in all material respects, effective internal control over financial reporting as of December 31, 2015, based on criteria established in Internal Control - Integrated Framework (2013) issued by the Committee of Sponsoring Organizations of the Treadway Commission (COSO). The Company's management is responsible for these financial statements, for maintaining effective internal control over financial reporting and for its assessment of the effectiveness of internal control over financial reporting, included in Management's Report on Internal Control over Financial Reporting appearing under Item 9A. Our responsibility is to express opinions on these financial statements and on the Company's internal control over financial reporting based on our integrated audits. We conducted our audits in accordance with the standards of the Public Company Accounting Oversight Board (United States). Those standards require that we plan and perform the audits to obtain reasonable assurance about whether the financial statements are free of material misstatement and whether effective internal control over financial reporting was maintained in all material respects. Our audits of the financial statements included examining, on a test basis, evidence supporting the amounts and disclosures in the financial statements, assessing the accounting principles used and significant estimates made by management, and evaluating the overall financial statement presentation. Our audit of internal control over financial reporting included obtaining an understanding of internal control over financial reporting, assessing the risk that a material weakness exists, and testing and evaluating the design and operating effectiveness of internal control based on the assessed risk. Our audits also included performing such other procedures as we considered necessary in the circumstances. We believe that our audits provide a reasonable basis for our opinions.
A company's internal control over financial reporting is a process designed to provide reasonable assurance regarding the reliability of financial reporting and the preparation of financial statements for external purposes in accordance with generally accepted accounting principles. A company's internal control over financial reporting includes those policies and procedures that (i) pertain to the maintenance of records that, in reasonable detail, accurately and fairly reflect the transactions and dispositions of the assets of the company; (ii) provide reasonable assurance that transactions are recorded as necessary to permit preparation of financial statements in accordance with generally accepted accounting principles, and that receipts and expenditures of the company are being made only in accordance with authorizations of management and directors of the company; and (iii) provide reasonable assurance regarding prevention or timely detection of unauthorized acquisition, use, or disposition of the company's assets that could have a material effect on the financial statements.
Because of its inherent limitations, internal control over financial reporting may not prevent or detect misstatements. Also, projections of any evaluation of effectiveness to future periods are subject to the risk that controls may become inadequate because of changes in conditions, or that the degree of compliance with the policies or procedures may deteriorate.
/s/ PricewaterhouseCoopers LLP
San Jose, California
February 24, 2016
46
Tesla Motors, Inc.
Consolidated Balance Sheets
(in thousands)
|
| December 31, |
|
| December 31, |
| ||
|
| 2015 |
|
| 2014 |
| ||
Assets |
|
|
|
|
|
|
|
|
Current assets |
|
|
|
|
|
|
|
|
Cash and cash equivalents |
| $ | 1,196,908 |
|
| $ | 1,905,713 |
|
Restricted cash and marketable securities |
|
| 22,628 |
|
|
| 17,947 |
|
Accounts receivable |
|
| 168,965 |
|
|
| 226,604 |
|
Inventory |
|
| 1,277,838 |
|
|
| 953,675 |
|
Prepaid expenses and other current assets |
|
| 125,229 |
|
|
| 76,134 |
|
Total current assets |
|
| 2,791,568 |
|
|
| 3,180,073 |
|
Operating lease vehicles, net |
|
| 1,791,403 |
|
|
| 766,744 |
|
Property, plant and equipment, net |
|
| 3,403,334 |
|
|
| 1,829,267 |
|
Restricted cash |
|
| 31,522 |
|
|
| 11,374 |
|
Other assets |
|
| 74,633 |
|
|
| 43,209 |
|
Total assets |
| $ | 8,092,460 |
|
| $ | 5,830,667 |
|
Liabilities and Stockholders' Equity |
|
|
|
|
|
|
|
|
Current liabilities |
|
|
|
|
|
|
|
|
Accounts payable |
| $ | 916,148 |
|
| $ | 777,946 |
|
Accrued liabilities |
|
| 422,798 |
|
|
| 268,883 |
|
Deferred revenue |
|
| 423,961 |
|
|
| 191,651 |
|
Resale value guarantees |
|
| 136,831 |
|
|
| - |
|
Customer deposits |
|
| 283,370 |
|
|
| 257,587 |
|
Long-term debt and capital leases |
|
| 633,166 |
|
|
| 611,099 |
|
Total current liabilities |
|
| 2,816,274 |
|
|
| 2,107,166 |
|
|
|
|
|
|
|
|
|
|
Deferred revenue |
|
| 446,105 |
|
|
| 292,271 |
|
Long-term debt and capital leases |
|
| 2,040,375 |
|
|
| 1,818,785 |
|
Resale value guarantee |
|
| 1,293,741 |
|
|
| 487,879 |
|
Other long-term liabilities |
|
| 364,976 |
|
|
| 154,660 |
|
Total liabilities |
|
| 6,961,471 |
|
|
| 4,860,761 |
|
|
|
|
|
|
|
|
|
|
Convertible senior notes (Notes 8) |
|
| 42,045 |
|
|
| 58,196 |
|
Stockholders' equity: |
|
|
|
|
|
|
|
|
Preferred stock; $0.001 par value; 100,000 shares authorized; no shares issued and outstanding |
|
| - |
|
|
| - |
|
Common stock; $0.001 par value; 2,000,000 shares authorized as of December 31, 2015 and 2014, respectively; 131,425 and 125,688 shares issued and outstanding as of December 31, 2015 and 2014, respectively |
|
| 131 |
|
|
| 126 |
|
Additional paid-in capital |
|
| 3,414,692 |
|
|
| 2,345,266 |
|
Accumulated other comprehensive loss |
|
| (3,556 | ) |
|
| (22 | ) |
Accumulated deficit |
|
| (2,322,323 | ) |
|
| (1,433,660 | ) |
Total stockholders' equity |
|
| 1,088,944 |
|
|
| 911,710 |
|
Total liabilities and stockholders' equity |
| $ | 8,092,460 |
|
| $ | 5,830,667 |
|
The accompanying notes are an integral part of these consolidated financial statements.
47
Tesla Motors, Inc.
Consolidated Statements of Operations
(in thousands, except per share data)
|
| Year Ended December 31, |
| |||||||||
|
| 2015 |
|
| 2014 |
|
| 2013 |
| |||
Revenues |
|
|
|
|
|
|
|
|
|
|
|
|
Automotive |
| $ | 3,740,973 |
|
| $ | 3,007,012 |
|
| $ | 1,921,877 |
|
Services and other |
|
| 305,052 |
|
|
| 191,344 |
|
|
| 91,619 |
|
Total revenues |
|
| 4,046,025 |
|
|
| 3,198,356 |
|
|
| 2,013,496 |
|
Cost of revenues |
|
|
|
|
|
|
|
|
|
|
|
|
Automotive |
|
| 2,823,302 |
|
|
| 2,145,749 |
|
|
| 1,483,321 |
|
Services and other |
|
| 299,220 |
|
|
| 170,936 |
|
|
| 73,913 |
|
Total cost of revenues |
|
| 3,122,522 |
|
|
| 2,316,685 |
|
|
| 1,557,234 |
|
Gross profit |
|
| 923,503 |
|
|
| 881,671 |
|
|
| 456,262 |
|
Operating expenses |
|
|
|
|
|
|
|
|
|
|
|
|
Research and development |
|
| 717,900 |
|
|
| 464,700 |
|
|
| 231,976 |
|
Selling, general and administrative |
|
| 922,232 |
|
|
| 603,660 |
|
|
| 285,569 |
|
Total operating expenses |
|
| 1,640,132 |
|
|
| 1,068,360 |
|
|
| 517,545 |
|
Loss from operations |
|
| (716,629 | ) |
|
| (186,689 | ) |
|
| (61,283 | ) |
Interest income |
|
| 1,508 |
|
|
| 1,126 |
|
|
| 189 |
|
Interest expense |
|
| (118,851 | ) |
|
| (100,886 | ) |
|
| (32,934 | ) |
Other income (expense), net |
|
| (41,652 | ) |
|
| 1,813 |
|
|
| 22,602 |
|
Loss before income taxes |
|
| (875,624 | ) |
|
| (284,636 | ) |
|
| (71,426 | ) |
Provision for income taxes |
|
| 13,039 |
|
|
| 9,404 |
|
|
| 2,588 |
|
Net loss |
| $ | (888,663 | ) |
| $ | (294,040 | ) |
| $ | (74,014 | ) |
Net loss per share of common stock, basic and diluted |
| $ | (6.93 | ) |
| $ | (2.36 | ) |
| $ | (0.62 | ) |
Weighted average shares used in computing net loss per share of common stock, basic and diluted |
|
| 128,202 |
|
|
| 124,539 |
|
|
| 119,421 |
|
The accompanying notes are an integral part of these consolidated financial statements.
48
Tesla Motors, Inc.
Consolidated Statements of Comprehensive Loss
(in thousands)
|
| Year Ended December 31, |
| |||||||||
|
| 2015 |
|
| 2014 |
|
| 2013 |
| |||
Net loss |
| $ | (888,663 | ) |
| $ | (294,040 | ) |
| $ | (74,014 | ) |
Other comprehensive income (loss), net of tax: |
|
|
|
|
|
|
|
|
|
|
|
|
Unrealized gain (loss) on derivatives and short-term marketable securities |
|
| 7,465 |
|
|
| (22 | ) |
|
| - |
|
Foreign currency translation adjustment |
|
| (10,999 | ) |
|
| - |
|
|
| - |
|
Other comprehensive income (loss) |
|
| (3,534 | ) |
|
| (22 | ) |
|
| - |
|
Comprehensive loss |
| $ | (892,197 | ) |
| $ | (294,062 | ) |
| $ | (74,014 | ) |
The accompanying notes are an integral part of these consolidated financial statements.
49
Tesla Motors, Inc.
Consolidated Statements of Stockholders' Equity
(in thousands, except per share data)
|
|
|
|
|
|
|
|
|
|
|
|
|
|
|
|
|
| Accumulated |
|
|
|
|
| |
|
| Common Stock |
|
| Additional |
|
|
|
|
|
| Other |
|
| Total |
| ||||||||
|
|
|
|
| Paid-In |
|
| Accumulated |
|
| Comprehensive |
|
| Stockholders' |
| |||||||||
|
| Shares |
|
| Amount |
|
| Capital |
|
| Deficit |
|
| Loss |
|
| Equity |
| ||||||
Balance as of December 31, 2012 |
|
| 114,214 |
|
| $ | 115 |
|
| $ | 1,190,191 |
|
| $ | (1,065,606 | ) |
|
| - |
|
| $ | 124,700 |
|
Issuance of common stock in May 2013 public offering at $92.20 per share, net of issuance costs of $6,367 |
|
| 3,903 |
|
|
| 3 |
|
|
| 353,629 |
|
|
| - |
|
|
| - |
|
|
| 353,632 |
|
Issuance of common stock in May 2013 concurrent private placements at $92.20 per share |
|
| 596 |
|
|
| 1 |
|
|
| 55,000 |
|
|
| - |
|
|
| - |
|
|
| 55,001 |
|
Conversion feature of convertible senior notes due 2018 |
|
| - |
|
|
| - |
|
|
| 82,842 |
|
|
| - |
|
|
| - |
|
|
| 82,842 |
|
Purchase of bond hedges |
|
| - |
|
|
| - |
|
|
| (177,540 | ) |
|
| - |
|
|
| - |
|
|
| (177,540 | ) |
Sales of warrant |
|
| - |
|
|
| - |
|
|
| 120,318 |
|
|
| - |
|
|
| - |
|
|
| 120,318 |
|
Issuance of common stock upon exercise of stock options |
|
| 3,853 |
|
|
| 3 |
|
|
| 82,570 |
|
|
| - |
|
|
| - |
|
|
| 82,573 |
|
Issuance of common stock upon release of restricted stock units, net of shares withheld for employee taxes |
|
| 6 |
|
|
| - |
|
|
| (1,116 | ) |
|
| - |
|
|
| - |
|
|
| (1,116 | ) |
Issuance of common stock under employee stock purchase plan |
|
| 519 |
|
|
| 1 |
|
|
| 13,848 |
|
|
| - |
|
|
| - |
|
|
| 13,849 |
|
Stock-based compensation |
|
| - |
|
|
| - |
|
|
| 86,875 |
|
|
| - |
|
|
| - |
|
|
| 86,875 |
|
Net loss |
|
| - |
|
|
| - |
|
|
| - |
|
|
| (74,014 | ) |
|
| - |
|
|
| (74,014 | ) |
Balance as of December 31, 2013 |
|
| 123,091 |
|
|
| 123 |
|
|
| 1,806,617 |
|
|
| (1,139,620 | ) |
|
| - |
|
|
| 667,120 |
|
Conversion feature of convertible senior notes due 2019 and 2021 |
|
| - |
|
|
| - |
|
|
| 548,603 |
|
|
| - |
|
|
| - |
|
|
| 548,603 |
|
Purchase of bond hedges |
|
| - |
|
|
| - |
|
|
| (603,428 | ) |
|
| - |
|
|
| - |
|
|
| (603,428 | ) |
Sales of warrant |
|
| - |
|
|
| - |
|
|
| 389,160 |
|
|
| - |
|
|
| - |
|
|
| 389,160 |
|
Reclass from equity to mezzanine equity |
|
| - |
|
|
| - |
|
|
| (58,199 | ) |
|
| - |
|
|
| - |
|
|
| (58,199 | ) |
Issuance of common stock upon exercise of stock options |
|
| 2,267 |
|
|
| 2 |
|
|
| 72,053 |
|
|
| - |
|
|
| - |
|
|
| 72,055 |
|
Issuance of common stock upon release of restricted stock units, net of shares withheld for employee taxes |
|
| 166 |
|
|
| 1 |
|
|
| (190 | ) |
|
| - |
|
|
| - |
|
|
| (189 | ) |
Issuance of common stock under employee stock purchase plan |
|
| 164 |
|
|
| - |
|
|
| 28,571 |
|
|
| - |
|
|
| - |
|
|
| 28,571 |
|
Stock-based compensation |
|
| - |
|
|
| - |
|
|
| 162,079 |
|
|
| - |
|
|
| - |
|
|
| 162,079 |
|
Comprehensive loss: |
|
|
|
|
|
|
|
|
|
|
|
|
|
|
|
|
|
|
|
|
|
|
|
|
Net loss |
|
|
|
|
|
|
|
|
|
|
|
|
|
| (294,040 | ) |
|
|
|
|
|
| (294,040 | ) |
Other comprehensive loss |
|
| - |
|
|
| - |
|
|
| - |
|
|
| - |
|
|
| (22 | ) |
|
| (22 | ) |
Balance as of December 31, 2014 |
|
| 125,688 |
|
| $ | 126 |
|
| $ | 2,345,266 |
|
| $ | (1,433,660 | ) |
| $ | (22 | ) |
| $ | 911,710 |
|
Conversion feature of convertible senior notes due 2018 |
|
|
|
|
|
|
|
|
|
| 16,150 |
|
|
|
|
|
|
|
|
|
|
| 16,150 |
|
Conversion feature of convertible senior notes due 2019 and 2021 |
|
|
|
|
|
|
|
|
|
|
|
|
|
|
|
|
|
|
|
|
|
|
|
|
Issuance of common stock in August 2015 secondary public offering at $242 per share, net of issuance costs of $11,122 |
|
| 3,099 |
|
|
| 3 |
|
|
| 738,405 |
|
|
|
|
|
|
|
|
|
|
| 738,408 |
|
Issuance of common stock upon exercise of stock options |
|
| 2,012 |
|
|
| 2 |
|
|
| 68,999 |
|
|
| - |
|
|
| - |
|
|
| 69,001 |
|
Issuance of common stock upon release of restricted stock units, net of shares withheld for employee taxes |
|
| 405 |
|
|
| - |
|
|
| (4 | ) |
|
| - |
|
|
| - |
|
|
| (4 | ) |
Issuance of common stock under employee stock purchase plan |
|
| 221 |
|
|
| - |
|
|
| 37,538 |
|
|
| - |
|
|
| - |
|
|
| 37,538 |
|
Stock-based compensation |
|
| - |
|
|
| - |
|
|
| 208,338 |
|
|
| - |
|
|
| - |
|
|
| 208,338 |
|
Comprehensive loss: |
|
|
|
|
|
|
|
|
|
|
|
|
|
|
|
|
|
|
|
|
|
|
|
|
Net loss |
|
|
|
|
|
|
|
|
|
|
|
|
|
| (888,663 | ) |
|
|
|
|
|
| (888,663 | ) |
Other comprehensive loss |
|
| - |
|
|
| - |
|
|
| - |
|
|
| - |
|
|
| (3,534 | ) |
|
| (3,534 | ) |
Balance as of December 31, 2015 |
|
| 131,425 |
|
| $ | 131 |
|
| $ | 3,414,692 |
|
| $ | (2,322,323 | ) |
| $ | (3,556 | ) |
| $ | 1,088,944 |
|
The accompanying notes are an integral part of these consolidated financial statements.
50
Tesla Motors, Inc.
Consolidated Statements of Cash Flows
(in thousands)
|
| Year Ended December 31, |
| |||||||||
|
| 2015 |
|
| 2014 |
|
| 2013 |
| |||
Cash Flows From Operating Activities |
|
|
|
|
|
|
|
|
|
|
|
|
Net loss |
| $ | (888,663 | ) |
| $ | (294,040 | ) |
| $ | (74,014 | ) |
Adjustments to reconcile net loss to net cash provided by (used in) operating activities: |
|
|
|
|
|
|
|
|
|
|
|
|
Depreciation and amortization |
|
| 422,590 |
|
|
| 231,931 |
|
|
| 106,083 |
|
Stock-based compensation |
|
| 197,999 |
|
|
| 156,496 |
|
|
| 80,737 |
|
Amortization of discount on convertible debt |
|
| 72,063 |
|
|
| 69,734 |
|
|
| 9,143 |
|
Inventory write-downs |
|
| 44,940 |
|
|
| 15,609 |
|
|
| 8,918 |
|
Amortization of Department of Energy (DOE) loan origination costs |
|
| - |
|
|
| - |
|
|
| 5,558 |
|
Change in fair value of DOE warrant liability |
|
| - |
|
|
| - |
|
|
| (10,692 | ) |
Fixed asset disposal |
|
| 37,723 |
|
|
| 14,178 |
|
|
| 1,796 |
|
Other non-cash operating activities |
|
| 26,373 |
|
|
| 7,471 |
|
|
| 1,815 |
|
Foreign currency transaction (gain) loss |
|
| 55,765 |
|
|
| (1,891 | ) |
|
| (13,498 | ) |
Changes in operating assets and liabilities |
|
|
|
|
|
|
|
|
|
|
|
|
Accounts receivable |
|
| 46,267 |
|
|
| (183,658 | ) |
|
| (21,705 | ) |
Inventories and operating lease vehicles |
|
| (1,573,860 | ) |
|
| (1,050,264 | ) |
|
| (460,561 | ) |
Prepaid expenses and other current assets |
|
| (29,595 | ) |
|
| (60,637 | ) |
|
| (17,533 | ) |
Other assets |
|
| (24,362 | ) |
|
| (4,493 | ) |
|
| (434 | ) |
Accounts payable and accrued liabilities |
|
| 263,345 |
|
|
| 414,856 |
|
|
| 87,413 |
|
Deferred revenue |
|
| 322,203 |
|
|
| 209,681 |
|
|
| 268,098 |
|
Customer deposits |
|
| 36,721 |
|
|
| 106,230 |
|
|
| 24,354 |
|
Resale value guarantee |
|
| 442,295 |
|
|
| 249,492 |
|
|
| 236,299 |
|
Other long-term liabilities |
|
| 23,697 |
|
|
| 61,968 |
|
|
| 33,027 |
|
Net cash provided by (used in) operating activities |
|
| (524,499 | ) |
|
| (57,337 | ) |
|
| 264,804 |
|
Cash Flows From Investing Activities |
|
|
|
|
|
|
|
|
|
|
|
|
Purchases of property and equipment excluding capital leases |
|
| (1,634,850 | ) |
|
| (969,885 | ) |
|
| (264,224 | ) |
Withdrawals out of our dedicated DOE account, net |
|
| - |
|
|
| - |
|
|
| 14,752 |
|
(Increase) decrease in other restricted cash |
|
| (26,441 | ) |
|
| (3,849 | ) |
|
| 55 |
|
Purchases of short-term marketable securities |
|
| - |
|
|
| (205,841 | ) |
|
| - |
|
Maturities of short-term marketable securities |
|
| - |
|
|
| 189,131 |
|
|
| - |
|
Business acquisition |
|
| (12,260 | ) |
|
| - |
|
|
| - |
|
Net cash used in investing activities |
|
| (1,673,551 | ) |
|
| (990,444 | ) |
|
| (249,417 | ) |
Cash Flows From Financing Activities |
|
|
|
|
|
|
|
|
|
|
|
|
Proceeds from issuance of convertible and other debt |
|
| 318,972 |
|
|
| 2,300,000 |
|
|
| 660,000 |
|
Proceeds from issuance of common stock in public offering |
|
| 730,000 |
|
|
| - |
|
|
| 360,000 |
|
Proceeds from issuance of warrants |
|
| - |
|
|
| 389,160 |
|
|
| 120,318 |
|
Proceeds from exercise of stock options and other stock issuances |
|
| 106,611 |
|
|
| 100,455 |
|
|
| 95,307 |
|
Proceeds from issuance of common stock in private placement |
|
| 20,000 |
|
|
| - |
|
|
| 55,000 |
|
Principal payments on DOE loans |
|
| - |
|
|
| - |
|
|
| (452,337 | ) |
Purchase of convertible note hedges |
|
| - |
|
|
| (603,428 | ) |
|
| (177,540 | ) |
Common stock and convertible debt issuance costs |
|
| (17,025 | ) |
|
| (35,149 | ) |
|
| (16,901 | ) |
Principal payments on capital leases and other debt |
|
| (203,780 | ) |
|
| (11,179 | ) |
|
| (8,425 | ) |
Collateralized lease borrowing |
|
| 568,745 |
|
|
| 3,271 |
|
|
| - |
|
Net cash provided by financing activities |
|
| 1,523,523 |
|
|
| 2,143,130 |
|
|
| 635,422 |
|
Effect of exchange rate changes on cash and cash equivalents |
|
| (34,278 | ) |
|
| (35,525 | ) |
|
| (6,810 | ) |
Net increase (decrease) in cash and cash equivalents |
|
| (708,805 | ) |
|
| 1,059,824 |
|
|
| 643,999 |
|
Cash and cash equivalents at beginning of period |
|
| 1,905,713 |
|
|
| 845,889 |
|
|
| 201,890 |
|
Cash and cash equivalents at end of period |
| $ | 1,196,908 |
|
| $ | 1,905,713 |
|
| $ | 845,889 |
|
Supplemental Disclosures |
|
|
|
|
|
|
|
|
|
|
|
|
Interest paid |
| $ | 32,060 |
|
| $ | 20,539 |
|
| $ | 9,041 |
|
Income taxes paid |
|
| 9,461 |
|
|
| 3,120 |
|
|
| 257 |
|
Supplemental noncash investing activities |
|
|
|
|
|
|
|
|
|
|
|
|
Acquisition of property and equipment included in accounts payable and accrued liabilities |
|
| 267,334 |
|
|
| 254,393 |
|
|
| 38,789 |
|
Estimated fair market value of facilities under build-to-suit lease |
|
| 174,749 |
|
|
| 50,076 |
|
|
| - |
|
The accompanying notes are an integral part of these consolidated financial statements.
51
Tesla Motors, Inc.
Notes to Consolidated Financial Statements
Note 1 - Overview of the Company
Tesla Motors, Inc. (Tesla, we, us or our) was incorporated in the state of Delaware on July 1, 2003. We design, develop, manufacture, and sell high-performance fully electric vehicles, and stationary energy storage products. We have wholly-owned subsidiaries in North America, Europe and Asia. The primary purpose of these subsidiaries is to market, manufacture, sell and/or service our vehicles.
Note 2 - Summary of Significant Accounting Policies
Basis of Consolidation
The consolidated financial statements include the accounts of Tesla and its wholly owned subsidiaries. Inter-company balances and transactions between consolidated entities have been eliminated.
Use of Estimates
The preparation of financial statements in conformity with accounting principles generally accepted in the United States of America requires management to make estimates and assumptions that affect the reported amounts of assets and liabilities and disclosure of contingent liabilities and accompanying notes. Estimates are used for, but not limited to, determining the selling price of products and services in multiple element revenue arrangements and determining the amortization period of these elements, residual value of operating lease vehicles, inventory valuation, warranties, fair value of financial instruments, depreciable lives of property and equipment, inputs used to value stock-based compensation including volatility, lives of stock option awards and forfeiture rates, income taxes, and contingencies. Actual results could differ from those estimates.
Recent Accounting Pronouncements
In May 2014, the Financial Accounting Standards Board issued an accounting update which amends the existing accounting standards for revenue recognition. The new guidance provides a new model to determine when and over what period revenue is recognized. Under this new model, revenue is recognized as goods or services are delivered in an amount that reflects the consideration we expect to collect. The guidance is effective for fiscal years beginning after December 15, 2017; early adoption is permitted for periods beginning after December 15, 2016. The new standard is required to either be applied retrospectively to each prior reporting period presented or retrospectively with the cumulative effect of initially applying it recognized at the date of initial application. We have not yet selected a transition method and are evaluating the impact of adopting it.
In April 2015, the FASB issued new authoritative accounting guidance on simplifying the presentation of debt issuance costs, which requires that debt issuance costs related to a recognized debt liability be presented in the balance sheet as a direct deduction from the carrying amount of that debt liability, consistent with debt discounts. We did not adopt this standard during 2015; however, the impact to the our Consolidated Balance Sheet as of December 31, 2015 would have been a $10.7 million reduction in prepaid expenses and other current assets, a $18.7 million reduction in other assets, and a corresponding reduction in the aggregate carrying value of the Company's long term debt liabilities.
In November 2015, the FASB issued Accounting Standards Update No. 2015-17, Income Taxes (Topic 740): Balance Sheet Classification of Deferred Taxes (ASU 2015-17), which simplifies the presentation of deferred income taxes by requiring that deferred tax assets and liabilities be classified as non-current. We have retrospectively adopted this standard as of December 31, 2015, and as a result we reclassified $18.6 million of current deferred tax assets to non-current and netted $18.6 million non-current deferred tax liabilities against our non-current deferred tax assets as of December 31, 2014.
Revenue Recognition
We recognize revenue for products and services when: (i) a persuasive evidence of an arrangement exists; (ii) delivery has occurred and there are no uncertainties regarding customer acceptance; (iii) pricing or fees are fixed or determinable; and (iv) collection is reasonably assured.
Vehicle sales include standard features, customer selected options and accessories, and specific other elements that meet the definition of a deliverable under multiple-element accounting guidance including free internet connectivity, free access to our Supercharger network, and future over the air software updates. These deliverables are valued on a stand-alone basis and we recognize their revenue over our performance period, which is generally the eight-year life of the vehicle, except for internet connectivity which is over the free four year period. If we sell a deliverable separately, we use that pricing to determine its fair value; otherwise, we use our best estimated selling price by considering costs used to develop and deliver the service, third party pricing of similar options, and other information which may be available.
52
At the time of revenue recognition, we record a reserve against revenue for estimated future product returns. Such estimates are based on historical experience and are immaterial in all periods presented.
Vehicle sales to customers with a residual value guarantee
We offer resale value guarantees or similar buy-back terms to all customers who purchase vehicles and who finance their vehicle through one of our specified commercial banking partners. Under this program, customers have the option of selling their vehicle back to us during the guarantee period for a pre-determined resale value. Guarantee periods generally range from 36 to 39 months. Although we receive full payment for the vehicle sales price at the time of delivery, we are required to account for these transactions as operating leases. The amount of sale proceeds equal to the residual value guarantee is deferred until the guarantee expires or is exercised. The remaining sale proceeds are deferred and recognized on a straight line basis over the stated guarantee period. The guarantee period expires at the earlier of the end of the guarantee period or the pay-off of the initial loan. We capitalize the cost of these vehicles to leased vehicles on our Consolidated Balance Sheets and depreciate their value, less salvage value, to cost of automotive revenue over the same period.
In cases when customer retains ownership of the vehicle at the end of the guarantee period, the resale value guarantee liability and any remaining deferred revenue balances related to the vehicle are settled to automotive revenue and the net book value of the leased vehicle is expensed to costs of automotive revenue. In cases when customers return the vehicle back to us during the guarantee period, we purchase the vehicle form the customer in an amount equal to the resale value guarantee and settle any remaining deferred balances to automotive revenue and we reclassify the net book value of the vehicle on our balance sheet to pre-owned vehicle inventory. As of December 31, 2015, $136.8 million of guarantees are exercisable by customers within the next twelve months.
Vehicle sales to leasing partners with a residual value guarantee
In the fourth quarter of 2014, we also began offering residual value guarantees in connection with automobile sales to certain bank leasing partners. As we have guaranteed the value of these vehicles and as the vehicles are leased to end-customers, we account for these transactions as interest bearing collateralized borrowings as required under ASC 840 - Leases . Under this program, cash is received for the full price of the vehicle and is recorded within resale value guarantee for the long-term portion and deferred revenue for the current portion. We accrete the deferred revenue amount to automotive revenue on a straight line basis over the guarantee period and accrue interest expense based on our borrowing rate. We capitalize vehicles under this program to leased vehicles on our Consolidated Balance Sheets and we record depreciation from these vehicles to cost of automotive revenues during the period the vehicle is under a lease arrangement. Cash received for these vehicles, net of revenue recognized during the period, is classified as collateralized lease borrowings within cash flows from financing activities in our Consolidated Statements of Cash Flows.
At the end of the lease term, we settle our liability in cash by either purchasing the vehicle from the leasing partner for the residual value guarantee amount, or paying a shortfall to the guarantee amount the leasing partner may realize on the sale of the vehicle. Any remaining balances within deferred revenue and resale value guarantee will be settled to automotive revenue. In cases where the bank retains ownership of the vehicle after the end of our guarantee period, we expense the net value of the leased vehicle to costs of automotive revenue . The maximum cash we could be required to pay under this program, should we decide to repurchase all vehicles is $348.2 million at December 31, 2015.
As of December 31, 2015 and December 31, 2014, we had $527.5 million and $16.7 million of such borrowings recorded in the resale value guarantee liability and $120.5 million and $3.9 million recorded in deferred revenue liability.
At least annually, we assess the estimated market values of vehicles under our resale value guarantee program to determine if we have sustained a loss on any of these contracts. As we accumulate more data related to the resale values of our vehicles or as market conditions change, there may be significant changes to their estimated values.
53
Activity related to our resale value guarantee program consisted of the following for the period presented (in thousands):
|
| Year ended |
|
| Year ended |
| ||
|
| December 31, 2015 |
|
| December 31, 2014 |
| ||
Operating Lease Vehicles |
|
|
|
|
|
|
|
|
Operating lease vehicles-beginning of period |
| $ | 684,590 |
|
| $ | 376,979 |
|
Net increase in operating lease vehicles |
|
| 1,047,220 |
|
|
| 380,627 |
|
Depreciation expense recorded in cost of automotive revenues |
|
| (130,355 | ) |
|
| (63,105 | ) |
Additional depreciation expense recorded in cost of automotive revenues as a result of early cancellation of resale value guarantee |
|
| (21,487 | ) |
|
| (9,251 | ) |
Increases to inventory from vehicles returned under our trade- in program |
|
| (23,439 | ) |
|
| (660 | ) |
Operating lease vehicles-end of period |
| $ | 1,556,529 |
|
| $ | 684,590 |
|
|
|
|
|
|
|
|
|
|
Deferred Revenue |
|
|
|
|
|
|
|
|
Deferred revenue-beginning of period |
| $ | 381,096 |
|
| $ | 230,856 |
|
Net increase in deferred revenue from new vehicle deliveries and reclassification of collateralized borrowing from long- term to short-term |
|
| 553,765 |
|
|
| 280,542 |
|
Amortization of deferred revenue and short-term collateralized borrowing recorded in automotive revenue |
|
| (229,624 | ) |
|
| (118,570 | ) |
Additional revenue recorded in automotive revenue as a result of early cancellation of resale value guarantee |
|
| (12,352 | ) |
|
| (9,590 | ) |
Recognition of deferred revenue resulting from return of vehicle under trade-in program |
|
| (13,753 | ) |
|
| (2,142 | ) |
Deferred revenue-end of period |
| $ | 679,132 |
|
| $ | 381,096 |
|
Resale Value Guarantee |
|
|
|
|
|
|
|
|
Resale value guarantee liability-beginning of period |
| $ | 487,880 |
|
| $ | 236,298 |
|
Net increase in resale value guarantee |
|
| 1,013,733 |
|
|
| 262,526 |
|
Reclassification from long-term to short-term collateralized borrowing |
|
| (29,612 | ) |
|
| - |
|
Additional revenue recorded in automotive revenue as a result of early cancellation of resale value guarantee |
|
| (11,042 | ) |
|
| (8,557 | ) |
Release of resale value guarantee resulting from return of vehicle under trade-in program |
|
| (30,386 | ) |
|
| (2,387 | ) |
Resale value guarantee liability-end of period |
| $ | 1,430,573 |
|
| $ | 487,880 |
|
Direct Vehicle Leasing Program
In April 2014, we began offering a leasing program in the United States, and subsequently began to offer similar programs in Canada and Germany. Qualifying customers are permitted to lease a vehicle directly from a local Tesla subsidiary for 36 or 48 months. At the end of the lease term, customers have the option of either returning the vehicle to us or purchasing it for a pre-determined residual value. We account for these leasing transactions as operating leases and recognize leasing revenues over the contractual term and record the depreciation of these vehicles to cost of automotive revenues. As of December 31, 2015 and December 31, 2014, we had deferred $25.8 million and $9.4 million of lease-related upfront payments which will be recognized on a straight-line basis over the contractual term of the individual leases. Lease revenues are recorded in automotive revenue and for the year ended December 31, 2015 and December 31, 2014, we recognized $41.2 million and $4.4 million.
Regulatory Credits
California and certain other states have laws in place requiring vehicle manufacturers to ensure that a portion of the vehicles delivered for sale in that state during each model year are zero emission vehicles. These laws and regulations provide that a manufacturer of zero emission vehicles may earn regulatory credits (ZEV credits) and may sell excess credits to other manufacturers who apply such credits to comply with these regulatory requirements. Similar regulations exist at the federal level that require compliance related to greenhouse gas emissions and also allow for the sale of excess credits by one manufacturer to other manufacturers. As a manufacturer solely of zero emission vehicles, we have earned emission credits, such as ZEV and GHG credits on vehicles, and we expect to continue to earn these credits in the future. We enter into contractual agreements with third parties to purchase our regulatory credits.
54
We recognize revenue on the sale of these credits at the time legal title to the credits is transf erred to the purchasing party. Revenue from the sale of regulatory credits totaled $168.7 million, $216.3 million, and $194.4 million for the years ended December 31, 2015, 2014 and 2013.
Additionally we have entered into agreements with the State of Nevada and Storey County in Nevada that will provide abatements for sales and use taxes, real and personal property taxes, and employer excise taxes, discounts to the base tariff energy rates, and transferable tax credits. These incentives will be available for the applicable periods beginning on October 17, 2014 and ending on June 30, 2034, subject to capital investments by Tesla and its partners for the Gigafactory of at least $3.5 billion in the aggregate on or before June 30, 2024, and certain other conditions specified in the agreements. If we do not satisfy one or more conditions under the agreement, Tesla will be required to repay to the respective taxing authorities the amounts of the tax incentives incurred, plus interest. As of December 31, 2015, we have earned $19.9 million of transferable tax credits under these agreements. We record these credits as earned when we have evidence there is a market for their sale. Credits are applied as a cost offset to either employee expense or to capital assets, depending on the source of the credits. Credits earned from employee hires or capital spending by our partners at the Gigafactory are recorded to other income (expense), net.
Maintenance and Service Plans
We offer a prepaid maintenance program for Model S, which includes plans covering maintenance for up to eight years or up to 100,000 miles, provided these services are purchased within a specified period of time. The maintenance plans cover annual inspections and the replacement of wear and tear parts, excluding tires and the battery. Payments collected in advance of the performance of service are initially recorded in deferred revenues on the consolidated balance sheets and recognized in automotive sales as we fulfill our performance obligations.
We also offer an extended service plan, which covers the repair or replacement of Model S parts for an additional four years or up to an additional 50,000 miles, after the end of our initial New Vehicle Limited Warranty, provided they are purchased within a specified period of time. Payments collected in advance of the performance of service are initially recorded in deferred revenues on the consolidated balance sheets and recognized in automotive sales ratably over the service coverage periods.
As of December 31, 2015 and 2014, we had deferred $53.6 million and $39.7 million related to our maintenance and service plans. During the years ended December 31, 2015 and 2014, we recognized revenue of $4.5 million and $3.0 million related to these plans.
Cash and Cash Equivalents
All highly liquid investments with an original maturity of three months or less at the date of purchase are considered to be cash equivalents. We currently invest our cash primarily in money market funds.
Marketable Securities
Marketable securities are comprised of commercial paper and corporate debt and are all designated as available-for-sale and reported at estimated fair value, with unrealized gains and losses recorded in accumulated other comprehensive loss which is included within stockholders' equity. Realized gains and losses on the sale of available-for-sale marketable securities are recorded in other income (expense), net. The cost of available-for-sale marketable securities sold is based on the specific identification method. Interest, dividends, amortization and accretion of purchase premiums and discounts on our marketable securities are included in other income (expense), net. Available-for-sale marketable securities with maturities greater than three months at the date of purchase and remaining maturities of one year or less are classified as short-term marketable securities. Where temporary declines in fair value exist, we have the ability and the intent to hold these securities for a period of time sufficient to allow for any anticipated recovery in fair value.
When held, we regularly review all of our marketable securities for other-than-temporary declines in fair value. The review includes but is not limited to (i) the consideration of the cause of the impairment, (ii) the creditworthiness of the security issuers, (iii) the length of time a security is in an unrealized loss position, and (iv) our ability to hold the security for a period of time sufficient to allow for any anticipated recovery in fair value.
Restricted Cash and Deposits
We maintain certain cash amounts restricted as to withdrawal or use. Current and noncurrent restricted cash as of December 31, 2015 was comprised primarily of cash as collateral related to our sales to lease partners with a residual value guarantee and for letters of credit including for our real estate leases, and insurance policies. In December 2015, we settled and closed our Warehouse Facility and removed restrictions on cash related to that arrangement.
55
Accounts Receivable and Allowance for Doubtful Accounts
Accounts receivable primarily include amounts related to sales of powertrain systems, receivables from financial institutions and leasing companies offering various financing products to our customers, regulatory credits to other automotive manufacturers, and from maintenance services on vehicles owned by leasing companies. We provide an allowance against amounts receivable to the amount we reasonably believe will be collected.
We typically do not carry accounts receivable related to our vehicle and related sales as customer payments are due prior to vehicle delivery, except for the amounts due from commercial financial institutions for approved financing arrangements between our customers and the financial institutions.
Concentration of Risk
Credit Risk
Financial instruments that potentially subject us to a concentration of credit risk consist of cash, cash equivalents, restricted cash and accounts receivable. Our cash equivalents are primarily invested in money market funds with high credit quality financial institutions in the United States. At times, these deposits and securities may be in excess of insured limits. We invest cash not required for use in operations in high credit quality securities based on our investment policy. Our investment policy provides guidelines and limits regarding credit quality, investment concentration, investment type, and maturity that we believe will provide liquidity while reducing risk of loss of capital. Our investments are currently of a short-term nature and include commercial paper and U.S. treasury bills.
As of December 31, 2015 and 2014, our accounts receivable were derived primarily from sales of regulatory credits, as well as funds to be received from financial institutions and leasing companies offering various financing products to our customers, the development and sales of powertrain components and systems to OEMs. Accounts receivable also included amounts to be received from commercial financial institutions for approved financing arrangements between our customers and financial institutions.
The following summarizes the accounts receivable from our customers in excess of 10% of our total accounts receivable:
|
| December 31, |
|
| December 31, |
| ||
|
| 2015 |
|
| 2014 |
| ||
Customer A |
|
| 15 | % |
|
| 7 | % |
Customer B |
|
| 8 | % |
|
| 14 | % |
Customer C |
|
| 6 | % |
|
| 13 | % |
Customer D |
|
| - |
|
|
| 19 | % |
Supply Risk
Although there may be multiple suppliers available, many of the components used in our vehicles are purchased by us from a single source. If these single source suppliers fail to satisfy our requirements on a timely basis at competitive prices, we could suffer manufacturing delays, a possible loss of revenues, or incur higher cost of sales, any of which could adversely affect our operating results.
Inventories and Inventory Valuation
Inventories are stated at the lower of cost or market. Cost is computed using standard cost, which approximates actual cost on a first-in, first-out basis. We record inventory write-downs for excess or obsolete inventories based on current and future demand forecasts. If our inventory on hand is in excess of our future demand forecast, the excess amounts are written off.
We also review inventory to determine whether its carrying value exceeds the net amount realizable upon the ultimate sale of the inventory. This requires us to determine the estimated selling price of our vehicles less the estimated cost to convert inventory on hand into a finished product. Once inventory is written-down, a new, lower-cost basis for that inventory is established and subsequent changes in facts and circumstances do not result in the restoration or increase in that newly established cost basis.
Should our estimates of future selling prices or production costs change, additional and potentially material increases to this reserve may be required. A small change in our estimates may result in a material change to our reported financial results.
56
Property, Plant and Equipment
Property, plant and equipment are recognized at cost less accumulated depreciation. Depreciation is generally computed using the straight-line method over the estimated useful lives of the related assets as follows:
Machinery, equipment and office furniture |
| 3 to 12 years |
Building and building improvements |
| 30 years |
Computer equipment and software |
| 3 years |
Depreciation for tooling is computed using the units-of-production method whereby capitalized costs are amortized over the total estimated productive life of the related assets. As of December 31, 2015, the estimated productive life for tooling was 250,000 vehicles based on our current estimates of production.
Leasehold improvements are amortized on a straight-line basis over the shorter of their estimated useful lives or the term of the related lease.
Upon the retirement or sale of our property, plant and equipment, the cost and related accumulated depreciation are removed from the balance sheet and the resulting gain or loss is reflected in operations. Maintenance and repair expenditures are expensed as incurred, while major improvements that increase the functionality, output or expected life of the asset are capitalized and depreciated ratably to expense over the identified useful life. Land is not depreciated.
Interest expense on outstanding debt is capitalized during the period of significant capital asset construction. Capitalized interest on construction in progress is included in property, plant and equipment, and is amortized over the life of the related assets.
Operating Lease Vehicles
Vehicles delivered under our resale value guarantee program, vehicles that are leased as part of our leasing programs as well as any vehicles that are sold with a significant buy-back guarantee are classified as operating lease vehicles as the related revenue transactions are treated as operating leases. Operating lease vehicles are recorded at cost less accumulated depreciation. Depreciation is computed using the straight-line method over the expected operating lease term. The total cost of operating lease vehicles recorded in the Consolidated Balance Sheets as of December 31, 2015 and 2014 was $2.0 billion and $849.8 million. Accumulated depreciation related to leased vehicles as of December 31, 2015 and 2014 was $216.5 million and $83.1 million.
Long-lived Assets
We evaluate our long-lived assets, including intangible assets, for indicators of possible impairment when events or changes in circumstances indicate the carrying amount of an asset (or asset group) may not be recoverable. Impairment exists if the carrying amounts of such assets exceed the estimates of future net undiscounted cash flows expected to be generated by such assets. Should impairment exist, the impairment loss would be measured based on the excess carrying value of the asset over the asset's estimated fair value. We did not record any material impairment losses on our long-lived assets in 2015 and 2014.
Research and Development Costs
Research and development costs are expensed as incurred. Research and development expenses consist primarily of payroll, benefits and stock-based compensation of those employees engaged in research, design and development activities, costs related to design tools, license expenses related to intellectual property, supplies and services, depreciation and other occupancy costs.
Marketing and Promotion Costs
Marketing and sales promotion costs are expensed as incurred. During the years ended December 31, 2015, 2014 and 2013, advertising, promotion and related marketing expenses were $58.3 million, $48.9 million and $9.0 million.
Transportation Costs
Amounts billed to customers related to shipping and handling are classified as automotive revenue, and related transportation costs are included in cost of automotive revenues.
Income Taxes
Income taxes are computed using the asset and liability method, under which deferred tax assets and liabilities are determined based on the difference between the financial statement and tax bases of assets and liabilities using enacted tax rates in effect for the year in which the differences are expected to affect taxable income. Valuation allowances are established when necessary to reduce deferred tax assets to the amount expected to be realized.
57
We record liabilities related to uncertain tax positions when, despite our belief t hat our tax return positions are supportable, we believe that it is more likely than not that those positions may not be fully sustained upon review by tax authorities. Accrued interest and penalties related to unrecognized tax benefits are classified as i ncome tax expense.
Stock-based Compensation
We recognize compensation expense for costs related to all share-based payments, including stock options, restricted stock units (RSUs) and our employee stock purchase plan (the ESPP). The fair value of stock options and the ESPP are estimated on the grant date and offering date using an option pricing model, respectively. The fair value of RSUs is measured on the grant date based on the closing fair market value of our common stock. Stock-based compensation expense is recognized on a straight-line basis over the requisite service period, net of estimated forfeitures.
We account for equity instruments issued to non-employees based on the fair value of the awards. The fair value of the awards granted to non-employees is re-measured as the awards vest and the resulting change in fair value, if any, is recognized in the consolidated statements of operations during the period the related services are rendered.
For performance-based awards, stock-based compensation expense is recognized over the expected performance achievement period of individual performance milestones when the achievement of each individual performance milestone becomes probable.
For performance-based awards with a vesting schedule based entirely on the attainment of both performance and market conditions, the stock-based compensation expense is recognized for each pair of performance and market conditions over the longer of the expected achievement period of the performance and market conditions, beginning at the point in time that the relevant performance condition is considered probable of being met (see Note 10 – Equity Incentive Plans ).
Foreign Currency
We determine the functional and reporting currency of each of our international subsidiaries and their operating divisions based on the primary currency in which they operate. In cases where the functional currency is not the US dollar, we will recognize a cumulative translation adjustment created by the different rates we apply to retained earnings, including current period income or loss, and the balance sheet. For each subsidiary, we apply a monthly average functional currency rate to their income or loss and the month end functional currency rate to translate the balance sheet.
Beginning January 1, 2015, the functional currency of each of our foreign subsidiaries changed to their local country's currency. This change was based on the culmination of facts and circumstances that have developed as we expanded our foreign operations over the past year. The adjustment of $10.0 million attributable to the current rate translation of non-monetary assets as of the date of the change is included in accumulated other comprehensive loss on our consolidated balance sheet.
Foreign currency transaction gains and losses are a result of the effect of exchange rate changes on transactions denominated in currencies other than the functional currency. Transaction gains and losses are recognized in other income (expense), net, in the consolidated statements of operations. For the year ended December 31, 2015, 2014, and 2013 we recorded foreign currency transaction gains (loss) of ($45.6) million, $2.0 million and $11.9 million.
Derivative Financial Instruments
In November 2015, we implemented a program to hedge the foreign currency exposure risk related to certain forecasted inventory purchases denominated in Japanese yen. The derivative instruments we use are foreign currency forward contracts and are designated as cash flow hedges with maturity dates of 12 months or less. We do not enter into derivative contracts for trading or speculative purposes (See Note 3 - Financial Instruments ).
The bank counterparties in all contracts expose Tesla to credit-related losses in the event of their nonperformance. However, to mitigate that risk, Tesla only contracts with counterparties who meet the Company's minimum requirements under its counterparty risk assessment process. Tesla monitors ratings, credit spreads, and potential downgrades on at least a quarterly basis. Based on our on-going assessment of counterparty risk, the Company will adjust its exposure to various counterparties. We generally enter into master netting arrangements, which reduce credit risk by permitting net settlement of transactions with the same counterparty. However, we do not have any master netting arrangements in place with collateral features.
Comprehensive Loss
Comprehensive loss is comprised of net loss and other comprehensive income (loss). Other comprehensive income (loss) consists of unrealized gains and losses on derivatives, our available-for-sale marketable securities, and foreign currency translation adjustment that have been excluded from the determination of net loss.
58
Warranties
We provide a manufacturer's warranty on all vehicles, production powertrain components and systems, and Tesla Energy products we sell. We accrue a manufacturer's warranty reserve which includes our best estimate of the projected costs to repair or to replace items under warranty. These estimates are based on actual claims incurred to-date and an estimate of the nature, frequency and costs of future claims. These estimates are inherently uncertain and changes to our historical or projected warranty experience may cause material changes to our warranty reserve in the future. The portion of the warranty provision expected to be incurred within 12 months is classified as current within accrued liabilities, while the remaining amount is classified as long-term within other long-term liabilities.
Accrued warranty activity consisted of the following for the periods presented (in thousands):
|
| Year Ended December 31, |
| |||||||||
|
| 2015 |
|
| 2014 |
|
| 2013 |
| |||
Accrued warranty-beginning of period |
| $ | 129,043 |
|
| $ | 53,182 |
|
| $ | 13,013 |
|
Warranty costs incurred |
|
| (52,760 | ) |
|
| (39,903 | ) |
|
| (19,160 | ) |
Net changes in liability for pre-existing warranties, including expirations |
|
| 1,470 |
|
|
| 18,599 |
|
|
| (2,072 | ) |
Provision for warranty |
|
| 103,001 |
|
|
| 97,165 |
|
|
| 61,401 |
|
Accrued warranty-end of period |
| $ | 180,754 |
|
| $ | 129,043 |
|
| $ | 53,182 |
|
Our warranty reserves do not include projected warranty costs associated with our vehicles accounted for as operating leases or collateralized debt arrangements. Costs to repair these vehicles are expensed as incurred. For the twelve months ended December 31, 2015, and December 31, 2014 warranty costs incurred for vehicles accounted for as operating leases or collateralized debt arrangements were $9.5 million and $7.1 million. Warranty expense is recorded as a component of cost of automotive revenue.
Net Loss per Share of Common Stock
Our basic and diluted net loss per share of common stock is calculated by dividing net loss by the weighted-average shares of common stock outstanding for the period. Potentially dilutive shares, which are based on the number of shares underlying outstanding stock options and warrants as well as our Notes, are not included when their effect is antidilutive.
The following table presents the potential weighted common shares outstanding that were excluded from the computation of basic and diluted net loss per share of common stock for the periods, related to the following securities:
|
| Year Ended December 31, |
| |||||||||
|
| 2015 |
|
| 2014 |
|
| 2013 |
| |||
Employee share based awards |
|
| 15,592,736 |
|
|
| 14,729,749 |
|
|
| 13,904,875 |
|
Convertible senior notes |
|
| 2,431,265 |
|
|
| 2,344,998 |
|
|
| 411,560 |
|
Warrants issued May 2013 |
|
| 1,049,791 |
|
|
| 921,985 |
|
|
| - |
|
DOE warrant |
|
| - |
|
|
| - |
|
|
| 1,061,439 |
|
Since we expect to settle the principal amount of our outstanding convertible senior notes in cash, we use the treasury stock method for calculating any potential dilutive effect of the conversion spread on diluted net income per share, if applicable. The conversion spread will have a dilutive impact on diluted net income per share of common stock when the average market price of our common stock for a given period exceeds the conversion price of $124.52, $359.87, and $359.87 per share for the 2018 Notes, 2019 Notes and 2021 Notes.
Note 3 - Financial Instruments
Fair Value Measurements
The carrying values of our financial instruments including cash equivalents, marketable securities, accounts receivable and accounts payable approximate their fair value due to their short-term nature. As a basis for determining the fair value of certain of our assets and liabilities, we established a three-tier fair value hierarchy which prioritizes the inputs used in measuring fair value as follows: (Level I) observable inputs such as quoted prices in active markets; (Level II) inputs other than the quoted prices in active markets that are observable either directly or indirectly; and (Level III) unobservable inputs in which there is little or no market data which requires us to develop our own assumptions. This hierarchy requires us to use observable market data, when available, and to minimize the use of unobservable inputs when determining fair value. Our financial assets that are measured at fair value on a recurring basis consist of cash equivalents and marketable securities.
59
All o f our cash equivalents and current restricted cash, which are comprised primarily of money market funds, are classified within Level I of the fair value hierarchy because they are valued using quoted market prices or market prices for similar securities. O ur restricted short-term marketable securities are classified within Level I of the fair value hierarchy .
As of December 31, 2015 and 2014, the fair value hierarchy for our financial assets and financial liabilities that are carried at fair value was as follows (in thousands), and unrealized gains (losses) on financial assets presented in the table below for all periods presented were less than $1.0 million:
| December 31, 2015 |
|
| December 31, 2014 |
| ||||||||||||||||||||||||||
| Fair Value |
|
| Level I |
|
| Level II |
|
| Level III |
|
| Fair Value |
|
| Level I |
|
| Level II |
|
| Level III |
| ||||||||
Money market funds | $ | 297,810 |
|
| $ | 297,810 |
|
| $ | - |
|
| $ | - |
|
| $ | 1,275,346 |
|
| $ | 1,275,346 |
|
| $ | - |
|
| $ | - |
|
U.S. treasury bills |
| 16,664 |
|
|
| 16,664 |
|
|
| - |
|
|
| - |
|
|
| 16,673 |
|
|
| 16,673 |
|
|
| - |
|
|
| - |
|
Total | $ | 314,474 |
|
| $ | 314,474 |
|
| $ | - |
|
| $ | - |
|
| $ | 1,292,019 |
|
| $ | 1,292,019 |
|
| $ | - |
|
| $ | - |
|
As of December 31, 2015, the estimated fair value of our 2018 Notes, 2019 Notes, and 2021 Notes was $1.29 billion (par value $659.8 million), $864.8 million (par value $920.0 million), and $1.27 billion (par value $1.38 billion). As of December 31, 2014 the estimated fair value of our 2018 Notes, 2019 Notes, and 2021 Notes was $1.22 billion (par value $659.8 million), $852.2 million (par value $920.0 million), and $1.25 billion (par value $1.38 billion). These fair values represent Level II valuations. When determining the estimated fair value of our long-term debt, we used a commonly accepted valuation methodology and market-based risk measurements that are indirectly observable, such as credit risk. As of December 31, 2015, the $135.0 million carrying value of our Credit Agreement liability approximates the fair value of the borrowings based upon the borrowing rate available to us for debt with similar terms and consideration of credit and default risk using Level II inputs.
Derivative Financial Instruments
In November 2015, we implemented a program to hedge the foreign currency exposure risk related to certain forecasted inventory purchases denominated in Japanese yen. The derivative instruments we use are foreign currency forward contracts and are designated as cash flow hedges with maturity dates of 12 months or less. We do not enter into derivative contracts for trading or speculative purposes.
We document each hedge relationship and assess its initial effectiveness at the inception of the hedge contract and we measure its ongoing effectiveness on a quarterly basis using regression analysis. During the term of an effective hedge contract, we record gains and losses within accumulated other comprehensive loss. We reclassify these gains or losses to costs of automotive sales in the period the related finished goods inventory is sold or over the depreciation period for those sales accounted for as leases. Although our contracts are considered effective hedges, we may experience small amounts of ineffectiveness due to timing differences between our actual inventory purchases and the settlement date of the related foreign currency forward contracts. We have recorded zero amount of ineffectiveness within other income (expense), net in our Consolidated Statements of Operations, as of December 31, 2015.
The net notional amount of these contracts was $322.6 million at December 31, 2015. Outstanding contracts are recognized as either assets or liabilities on the Consolidated Balance Sheet at fair value within other assets or within accrued liabilities, depending on our net position. The net gain of $7.3 million in accumulated other comprehensive loss as of December 31, 2015 is expected to be recognized to the cost basis of finished goods inventory in the next twelve months. The total fair values of foreign currency contracts designated as cash flow hedges as of December 31, 2015 is $7.3 million and was determined using Level II inputs and recorded in prepaid expenses and other current assets on our Consolidated Balance Sheets. No amounts have been reclassified to finished goods inventory as of December 31, 2015.
Note 4 - Inventory
As of December 31, 2015 and 2014, our inventory consisted of the following (in thousands):
|
| December 31, |
|
| December 31, |
| ||
|
| 2015 |
|
| 2014 |
| ||
Raw materials |
| $ | 528,935 |
|
| $ | 392,292 |
|
Work in process |
|
| 163,830 |
|
|
| 56,114 |
|
Finished goods |
|
| 476,512 |
|
|
| 397,318 |
|
Service parts |
|
| 108,561 |
|
|
| 107,951 |
|
Total |
| $ | 1,277,838 |
|
| $ | 953,675 |
|
Finished goods inventory includes vehicles in transit to fulfill customer orders, new vehicles available for immediate sale at our retail and service center locations, and pre-owned Tesla vehicles. The increase in finished goods inventory was primarily due to customer orders that were in transit for delivery at year end.
60
We write down inventory as a result of excess and obsolete inventories, or when we believe that the net realizable value of inventories is less than the carrying value. During the years e nded December 31, 2015, 2014 and 2013, we recorded write-downs of $44.9 million, $15.6 million and $8.9 million in cost of automotive sales.
Note 5 - Property, Plant and Equipment
As of December 31, 2015 and 2014, our property, plant and equipment, net, consisted of the following (in thousands):
|
| December 31, |
|
| December 31, |
| ||
|
| 2015 |
|
| 2014 |
| ||
Machinery, equipment and office furniture |
| $ | 1,694,910 |
|
| $ | 720,746 |
|
Tooling |
|
| 550,902 |
|
|
| 295,906 |
|
Leasehold improvements |
|
| 338,392 |
|
|
| 230,270 |
|
Building and building improvements |
|
| 461,303 |
|
|
| 154,362 |
|
Land |
|
| 60,234 |
|
|
| 49,478 |
|
Computer equipment and software |
|
| 175,512 |
|
|
| 98,970 |
|
Construction in progress |
|
| 693,207 |
|
|
| 572,125 |
|
|
|
| 3,974,460 |
|
|
| 2,121,857 |
|
Less: Accumulated depreciation and amortization |
|
| (571,126 | ) |
|
| (292,590 | ) |
Total |
| $ | 3,403,334 |
|
| $ | 1,829,267 |
|
Construction in progress is comprised primarily of tooling and equipment related to the manufacturing of our Model S and Model X vehicles, Gigafactory construction, and related capitalized interest. Completed assets are transferred to their respective asset class and depreciation begins when the asset is ready for its intended use. Interest expense on outstanding debt is capitalized during the period of significant capital asset construction. Capitalized interest on construction in progress is included in property, plant and equipment, and is amortized over the life of the related assets. During the years ended December 31, 2015 and 2014, we capitalized $41.5 million and $12.8 million of interest expense.
We are sometimes involved in construction at our leased facilities primarily related to retail stores, service centers, and certain manufacturing facilities. In accordance with Accounting Standards Codification 840, Leases, for build-to-suit lease arrangements where we are involved in the construction of structural improvements prior to the commencement of the lease or take some level of construction risk, we are considered the owner of the assets and land during the construction period. Accordingly, upon commencement of our construction activities, we record a construction in progress asset and a corresponding financing liability. Once the construction is completed, if the lease meets certain "sale-leaseback" criteria, we will remove the asset and related financial obligation from the balance sheet and treat the building lease as an operating lease. If upon completion of construction, the project does not meet the "sale-leaseback" criteria, the leased property will be treated as a capital lease and included in building and building improvements in the table above. As of December 31, 2015 and December 31, 2014, the table above includes $206.1 million and $52.4 million of build-to-suit assets. As of December 31, 2015 and December 31, 2014, corresponding financing obligations of $1.3 million and $21.0 million are recorded in accrued liabilities and $201.3 million and $31.4 million are recorded in other long-term liabilities.
Depreciation and amortization expense during the years ended December 31, 2015, 2014 and 2013 were $278.7 million, $155.9 million and $83.9 million. Total property and equipment assets under capital lease as of December 31, 2015 and 2014 were $58.1 million and $33.4 million. Accumulated depreciation related to assets under capital lease as of these dates were $22.7 million and $12.8 million.
We have acquired land for the site of our Gigafactory and construction activities are ongoing for which we have incurred $317.5 million and $106.6 million of costs as of December 31, 2015 and 2014.
Note 6 - Accrued Liabilities
As of December 31, 2015 and 2014, our accrued liabilities consisted of the following (in thousands):
|
| December 31, |
|
| December 31, |
| ||
|
| 2015 |
|
| 2014 |
| ||
Taxes payable |
| $ | 101,206 |
|
| $ | 71,229 |
|
Accrued purchases |
|
| 140,540 |
|
|
| 68,547 |
|
Payroll and related costs |
|
| 86,859 |
|
|
| 54,492 |
|
Warranty and other |
|
| 94,193 |
|
|
| 74,615 |
|
Total |
| $ | 422,798 |
|
| $ | 268,883 |
|
61
Taxes payable includes v alue a dded t ax, sales tax, property tax, and income tax payables.
Accrued purchases reflect liabilities related to the construction of the Gigafactory, and engineering design and testing accruals. As these services are invoiced, this balance will reduce and accounts payable will increase.
Note 7 - Customer Deposits
Customer deposits include cash payments from customers at the time they place an order for a vehicle and additional payments up to the point of delivery including the fair value of customer trade-in vehicles that are applicable toward a new vehicle purchase. Customer deposit amounts and timing vary depending on the vehicle model and country of delivery. Customer deposits are fully refundable up to the point the vehicle is placed into the production cycle. Customer deposits are included in current liabilities until refunded or until they are applied to a customer's purchase balance at time of delivery.
As of December 31, 2015 and 2014, we held $283.4 million and $257.6 million in customer deposits.
Note 8 - Convertible Notes and Long-term Debt Obligations
0.25% and 1.25% Convertible Senior Notes and Bond Hedge and Warrant Transactions
In March 2014, we issued $800.0 million principal amount of 0.25% convertible senior notes due 2019 (2019 Notes) and $1.20 billion principal amount of 1.25% convertible senior notes due 2021 (2021 Notes) in a public offering. In April 2014, we issued an additional $120.0 million aggregate principal amount of 2019 Notes and $180.0 million aggregate principal amount of 2021 Notes, pursuant to the exercise in full of the overallotment options of the underwriters of our March 2014 public offering. The total net proceeds from these offerings, after deducting transaction costs, were approximately $905.8 million from 2019 Notes and $1.36 billion from 2021 Notes. We incurred $14.2 million and $21.4 million of debt issuance costs in connection with the 2019 Notes and the 2021 Notes, which we initially recorded in other assets and are amortizing to interest expense using the effective interest method over the contractual terms of these notes. The interest rates are fixed at 0.25% and 1.25% per annum and are payable semi-annually in arrears on March 1 and September 1 of each year, commencing on September 1, 2014.
Each $1,000 of principal of these notes will initially be convertible into 2.7788 shares of our common stock, which is equivalent to an initial conversion price of approximately $359.87 per share, subject to adjustment upon the occurrence of specified events. Holders of these notes may convert their notes at their option on or after December 1, 2018 for the 2019 Notes and on or after December 1, 2020 for the 2021 Notes. Further, holders of these notes may convert their notes at their option prior to the respective dates above, only under the following circumstances: (1) during any fiscal quarter beginning after the fiscal quarter ending June 30, 2014, if the last reported sale price of our common stock for at least 20 trading days (whether or not consecutive) during the last 30 consecutive trading days of immediately preceding fiscal quarter is greater than or equal to 130% of the conversion price of the applicable notes on each applicable trading day; (2) during the five business day period following any five consecutive trading day period in which the trading price for the applicable notes is less than 98% of the average of the closing sale price of our common stock for each day during such five trading day period; or (3) if we make specified distributions to holders of our common stock or if specified corporate transactions occur. Upon conversion of the 2019 Notes, we would pay or deliver as applicable, cash, shares of our common stock or a combination of cash and shares of our common stock, at our election. Upon conversion of the 2021 Notes, we would pay the holders in cash for the principal amount and, if applicable, shares of our common stock (subject to our right to deliver cash in lieu of all or a portion of such shares of our common stock) based on a daily conversion value. If a fundamental change occurs prior to the maturity date, holders of these notes may require us to repurchase all or a portion of their notes for cash at a repurchase price equal to 100% of the principal amount of the notes, plus any accrued and unpaid interest. In addition, if specific corporate events occur prior to the applicable maturity date, we will increase the conversion rate for a holder who elects to convert their notes in connection with such a corporate event in certain circumstances. During the fourth quarter of 2015, the closing price of our common stock did not meet or exceed 130% of the applicable conversion price of our 2019 Notes and 2021 Notes on at least 20 of the last 30 consecutive trading days of the quarter; furthermore, no other conditions allowing holders of these notes to convert have been met as of December 31, 2015. Therefore, the 2019 Notes and 2021 Notes are not convertible during the first quarter of 2016 and are classified as long-term debt. Should the closing price conditions be met in the first quarter of 2015 or a future quarter, the 2019 and/or the 2021 Notes will be convertible at their holders' option during the immediately following quarter. As of December 31, 2015, the if-converted value of the 2019 Notes and 2021 Notes did not exceed the principal value of those notes.
In accordance with accounting guidance on embedded conversion features, we valued and bifurcated the conversion option associated with the notes from the respective host debt instrument and initially recorded the conversion option of $188.1 million for the 2019 Notes and $369.4 million for the 2021 Notes in stockholders' equity. The resulting debt discounts on the 2019 Notes and 2021 Notes are being amortized to interest expense at an effective interest rate of 4.89% and 5.96%, respectively, over the contractual terms of the notes.
62
In connection with the offering of these notes in March 2014, we entered into convertible note hedge transactions whereby we have the option to purchase initially (subject to adjustment for certain specified events) a total o f approximately 5.6 million shares of our common stock at a price of approximately $359.87 per share. The total cost of the convertible note hedge transactions was $524.7 million. In addition, we sold warrants whereby the holders of the warrants have the o ption to purchase initially (subject to adjustment for certain specified events) a total of approximately 2.2 million shares of our common stock at a price of $512.66 for the 2019 Notes and a total of approximately 3.3 million shares of our common stock at a price of $560.64 per share for 2021 Notes. We received $338.4 million in cash proceeds from the sale of these warrants. Similarly, in connection with the issuance of additional notes in April 2014, we entered into convertible note hedge transactions and paid an aggregate $78.7 million. In addition, we sold warrants to purchase (subject to adjustment for certain specified events) a total of approximately 0.3 million shares of our common stock at a strike price of $512.66 per share for the warrants relatin g to 2019 Notes, and a total of approximately 0.5 million shares of our common stock at a strike price of $560.64 per share for the warrants relating to 2021 Notes. We received aggregate proceeds of approximately $50.8 million from the sale of the warrants . Taken together, the purchase of the convertible note hedges and the sale of warrants are intended to offset any actual dilution from the conversion of these notes and to effectively increase the overall conversion price from $359.87 to $512.66 per share in the case of warrants relating to 2019 Notes and from $359.87 to $560.64 in the case of warrants relating to 2021 Notes. As these transactions meet certain accounting criteria, the convertible note hedges and warrants are recorded in stockholders' equity and are not accounted for as derivatives. The net cost incurred in connection with the convertible note hedge and warrant transactions was recorded as a reduction to additional paid-in capital on the consolidated balance sheet as of December 31, 2015.
1.50% Convertible Senior Notes and Bond Hedge and Warrant Transactions
In May 2013, we issued $660.0 million aggregate principal amount of 2018 Notes in a public offering. The net proceeds from the offering, after deducting transaction costs, were approximately $648.0 million. We incurred $12.0 million of debt issuance costs in connection with the issuance of the 2018 Notes which we recorded in other assets and are amortizing to interest expense using the effective interest method over the contractual term of the 2018 Notes. The interest under the 2018 Notes is fixed at 1.50% per annum and is payable semi-annually in arrears on June 1 and December 1 of each year, commencing on December 1, 2013.
Each $1,000 of principal of the 2018 Notes will initially be convertible into 8.0306 shares of our common stock, which is equivalent to an initial conversion price of approximately $124.52 per share, subject to adjustment upon the occurrence of specified events. Holders of the 2018 Notes may convert their 2018 Notes at their option on or after March 1, 2018. Further, holders of the 2018 Notes may convert their 2018 Notes at their option prior to March 1, 2018, only under the following circumstances: (1) during any fiscal quarter beginning after the fiscal quarter ending September 30, 2013, if the last reported sale price of our common stock for at least 20 trading days (whether or not consecutive) during the last 30 consecutive trading days of the immediately preceding fiscal quarter is greater than or equal to 130% of the conversion price on each applicable trading day; (2) during the five business day period following any five consecutive trading day period in which the trading price for the 2018 Notes is less than 98% of the average of the closing sale price of our common stock for each day during such five trading day period; or (3) if we make specified distributions to holders of our common stock or if specified corporate transactions occur. Upon conversion, we would pay the holders in cash for the principal amount of the 2018 Notes and, if applicable, shares of our common stock (subject to our right to deliver cash in lieu of all or a portion of such shares of our common stock) based on a calculated daily conversion value. If a fundamental change occurs prior to the maturity date, holders of the 2018 Notes may require us to repurchase all or a portion of their 2018 Notes for cash at a repurchase price equal to 100% of the principal amount of the 2018 Notes, plus any accrued and unpaid interest. In addition, if specific corporate events occur prior to the maturity date, we will increase the conversion rate for a holder who elects to convert its 2018 Notes in connection with such a corporate event in certain circumstances.
In accordance with accounting guidance on embedded conversion features, we valued and bifurcated the conversion option associated with the 2018 Notes from the host debt instrument and recorded the conversion option of $82.8 million in stockholders' equity. The resulting debt discount on the 2018 Notes is being amortized to interest expense at an effective interest rate of 4.29% over the contractual term of the 2018 Notes.
In connection with the offering of the 2018 Notes, we entered into convertible note hedge transactions whereby we have the option to purchase initially (subject to certain specified events) a total of approximately 5.3 million shares of our common stock at a price of approximately $124.52 per share. The cost of the convertible note hedge transactions was $177.5 million. In addition, we sold warrants whereby the holders of the warrants have the option to purchase initially (subject to certain specified events) a total of approximately 5.3 million shares of our common stock at a price of $184.48 per share. We received $120.3 million in cash proceeds from the sale of these warrants. Taken together, the purchase of the convertible note hedges and the sale of warrants are intended to offset any actual dilution from the conversion of the 2018 Notes and to effectively increase the overall conversion price from $124.52 to $184.48 per share. As these transactions meet certain accounting criteria, the convertible note hedges and warrants are recorded in stockholders' equity and are not accounted for as derivatives. The net cost incurred in connection with the convertible note hedge and warrant transactions was recorded as a reduction to additional paid-in capital on the consolidated balance sheet as of December 31, 2015.
63
During the fourth quarter of 2015, the closing price of our common stock exceeded 130% of the applicable conversion price of our 2018 Notes on at least 20 of the last 30 consecutive trading days of the quarter; therefore, holders of 2018 Notes may convert their notes during the first quarter of 2016. As such, we classified the $617.7 million carrying value of our 2018 Notes as current liabilities and classified $42.1 million, representing the difference between the aggregate principal of our 2018 Notes of $659.8 million and the carrying value of 2018 Notes, as mezzanine equity on our consolidated balance sheet as of December 31, 2015. Similarly, debt issuance costs were classified as other current assets as of December 31, 2015. Should the closing price conditions be met in the first quarter of 2016 or a future quarter, 2018 Notes will be convertible at their holders' option during the immediately following quarter.
Convertible Senior Notes Carrying Value and Interest Expense
In accordance with accounting guidance on embedded conversion features, we valued and bifurcated the conversion option associated with the Notes from the respective host debt instrument and initially recorded the conversion option for the 2018 Notes, 2019 Notes, and 2021 Notes in stockholders' equity. The resulting debt discounts on the 2018 Notes, 2019 Notes, and 2021 Notes are being amortized to interest expense at the effective interest rate over the contractual terms of the Notes.
|
| December 31, 2015 |
|
| December 31, 2014 |
| ||||||||||||||||||
|
| 2018 Notes |
|
| 2019 Notes |
|
| 2021 Notes |
|
| 2018 Notes |
|
| 2019 Notes |
|
| 2021 Notes |
| ||||||
|
| (in thousands, except years and percentages) |
| |||||||||||||||||||||
Carrying value |
| $ | 617,716 |
|
| $ | 795,405 |
|
| $ | 1,092,748 |
|
| $ | 601,566 |
|
| $ | 759,891 |
|
| $ | 1,046,627 |
|
Unamortized discount |
|
| 42,045 |
|
|
| 124,595 |
|
|
| 287,252 |
|
|
| 58,196 |
|
|
| 160,109 |
|
|
| 333,373 |
|
Principal amount |
| $ | 659,761 |
|
| $ | 920,000 |
|
| $ | 1,380,000 |
|
| $ | 659,762 |
|
| $ | 920,000 |
|
| $ | 1,380,000 |
|
Remaining amortization period (years) |
|
| 2.4 |
|
|
| 3.2 |
|
|
| 5.2 |
|
|
|
|
|
|
|
|
|
|
|
|
|
Effective interest rate on liability component |
|
| 4.29 | % |
|
| 4.89 | % |
|
| 5.96 | % |
|
|
|
|
|
|
|
|
|
|
|
|
Carrying amount of equity component |
| $ | 82,800 |
|
| $ | 188,100 |
|
| $ | 369,400 |
|
|
|
|
|
|
|
|
|
|
|
|
|
If converted value in excess of par value |
| $ | 611,898 |
|
|
|
|
|
|
|
|
|
|
|
|
|
|
|
|
|
|
|
|
|
Full Repayment of Department of Energy Loan Facility
On January 20, 2010, we entered into a loan facility with the Federal Financing Bank (FFB), and the DOE, pursuant to the Advanced Technology Vehicles Manufacturing (ATVM) Incentive Program. In May 2013, in connection with the closing of our offerings of common stock and Notes, we paid $451.8 million to settle all outstanding loan amounts of $441.0 million, including principal and interest, as well as an early repayment penalty of $10.8 million which was recorded in interest expense for the year ended December 31, 2013. Upon termination of the DOE Loan Facility, $29.3 million held in this dedicated account was released by the DOE.
As a result of our repayment of all outstanding principal and interest under the DOE Loan Facility and the termination of the DOE Loan Facility in May 2013, the DOE warrant expired. As such, we recognized other income for the change in the fair value of the DOE warrant in the amount of $10.7 million for the year ended December 31, 2013. Additionally, we amortized all remaining unamortized debt issuance costs of $5.8 million related to the DOE Loan Facility to interest expense for the year ended December 31, 2013.
Warehouse line of credit
In March 2015, we entered into a loan and security agreement (the "Warehouse Facility") for a secured asset based line of credit for a principal amount up to $100 million. In June 2015, we amended the Warehouse Facility for an additional principal amount of $50 million, for a total of up to $150 million. Obligations under the Warehouse Facility were secured by certain of our lease contracts with Tesla directly and the related leased vehicles. In connection with the Warehouse Facility, we sold the beneficial interest in such lease contracts and related vehicles to a wholly owned special purpose entity that is the borrower in the Warehouse Facility, which pledged such beneficial interest in the underlying assets to the third-party lender under the Warehouse Facility. Borrowings under the Warehouse Facility are generally limited to up to 72% of the net present value of the remaining lease payments and the residual vehicle values under eligible lease contracts.
Interest was payable monthly on amounts borrowed under the Warehouse Facility at a variable rate of LIBOR plus 1.65% and on undrawn amounts at a rate of 0.5%. The Warehouse facility would have matured in March 2017, at which time all outstanding borrowing would become due. Prior to that date, principal payments were due in the amount that the borrowing limit decreased below our outstanding principal balance. As of December 31, 2015, we had repaid all borrowings under the Warehouse Facility and terminated it.
64
Asset-Based Credit Agreement
In June 2015, we entered into a senior secured asset-based revolving credit agreement (the "Credit Agreement") with a syndicate of banks, which we amended as of November 3, 2015. The Credit Agreement provides for a senior secured asset-based revolving credit facility (the "Credit Facility"), which we may draw upon as needed. In October, lenders increased their total funding commitments to us under the Credit Facility by up to an additional $250.0 million, subject to certain conditions, for total commitments up to $750 million. In addition, the Credit Agreement provides for a $200.0 million letter of credit sub-facility and a $40.0 million swing-line loan sub-facility. The Credit Agreement is collateralized by a pledge of certain of our accounts receivable, inventory, and equipment, and availability under the Credit Agreement is based on the value of such assets, as reduced by certain reserves. In February 2016, we amended the Credit Agreement and increased the availability and the commitments under the Credit Agreement from $750.0 million to $1.0 billion.
Borrowed funds bear interest, at our option, at an annual rate of (a) 1% plus LIBOR or (b) the highest of (i) the federal funds rate plus 0.50%, (ii) the lenders "prime rate" or (iii) 1% plus LIBOR. The fee for undrawn amounts is 0.25% per annum. Interest is payable quarterly. The Credit Agreement terminates, and all outstanding loans become due and payable, in June 2020. As of December 31, 2015, we had $135.0 million borrowings under the Credit Facility.
We are required to meet various covenants, including meeting certain reporting requirements, such as the completion and presentation of audited consolidated financial statements for our borrowings. As of December 31, 2015 we were in compliance with all covenants contained in the Credit Agreement.
Pledged Assets
As of December 31, 2015 and 2014, we have pledged or restricted $1.43 billion and $29.3 million principally from finished goods and raw materials inventory, as well as certain property and equipment, direct lease vehicles, receivables and cash as collateral for letters of credit including our Asset-based credit arrangement, real estate leases, and insurance policies.
Interest Expense
The following table presents the aggregate amount of interest expense recognized on the Warehouse Facility, Credit Agreement, 2018 Notes, 2019 Notes, and 2021 Notes relating to the contractual interest coupon and amortization of the debt issuance costs and debt discount.
|
| 2015 |
|
| 2014 |
|
| 2013 |
| |||
Contractual interest coupon |
| $ | 32,061 |
|
| $ | 26,019 |
|
| $ | 5,938 |
|
Amortization of debt issuance costs |
|
| 8,102 |
|
|
| 5,288 |
|
|
| 1,207 |
|
Amortization of debt discount |
|
| 97,786 |
|
|
| 79,479 |
|
|
| 9,143 |
|
Total |
| $ | 137,949 |
|
| $ | 110,786 |
|
| $ | 16,288 |
|
Note 9 - Common Stock
In October 2012, we completed a follow-on offering of common stock in which we sold a total of 7,964,601 shares of our common stock and received cash proceeds of $222.1 million (which included 35,398 shares or $1.0 million sold to our CEO) from this transaction, net of underwriting discounts and offering costs.
In May 2013, we completed a public offering of common stock and sold a total of 3,902,862 shares of our common stock for total cash proceeds of approximately $355.1 million (which included 487,857 shares or $45.0 million sold to our CEO), net of underwriting discounts and offering costs. We also sold 596,272 shares of our common stock to our CEO and received total cash proceeds of $55.0 million in a private placement at the public offering price. Concurrent with these equity transactions, we also issued $660.0 million principal amount of 1.50% convertible senior notes in a public offering and received total cash proceeds of approximately $648.0 million, net of underwriting discounts and offering costs (see Note 8 – Convertible Notes and Long-Term Debt Obligations ).
In August 2015, we completed a public offering of common stock and sold a total of 3,099,173 shares of our common stock for total cash proceeds of approximately $738.3 million (which includes 82,645 shares or $20.0 million sold to our CEO, net of underwriting discounts and offering costs.
65
Note 10 - Equity Incentive Plans
In July 2003, we adopted the 2003 Equity Incentive Plan. Concurrent with the effectiveness of our registration statement on Form S-1 on June 28, 2010, we adopted the 2010 Equity Incentive Plan (the Plan) and all remaining common shares reserved for future grant or issuance under the 2003 Equity Incentive Plan were added to the 2010 Equity Incentive Plan. The Plan provides for the granting of stock options, RSUs and stock purchase rights to our employees, directors and consultants. Options granted under the Plan may be either incentive options or nonqualified stock options. Incentive stock options may be granted only to our employees including officers and directors. Nonqualified stock options and stock purchase rights may be granted to our employees and consultants. Generally, our stock options and RSUs vest over four years and are exercisable over a period not to exceed the contractual term of ten years from the date the stock options are granted. Continued vesting typically terminates when the employment or consulting relationship ends. As of December 31, 2015, 22,454,854 shares of common stock were reserved for issuance under the Plan.
The following table summarizes stock option and RSU activity under the Plan:
|
|
|
|
|
| Outstanding Stock Options |
|
| Outstanding RSUs |
| ||||||||||
|
|
|
|
|
|
|
|
|
|
|
|
|
|
|
|
|
| Weighted |
| |
|
|
|
|
|
|
|
|
|
| Weighted |
|
|
|
|
|
| Average Grant |
| ||
|
| Shares Available |
|
| Number of |
|
| Average |
|
| Number |
|
| Date Fair |
| |||||
|
| for Grant |
|
| Options |
|
| Exercise Price |
|
| of RSUs |
|
| Value |
| |||||
Balance, December 31, 2012 |
|
| 469,531 |
|
|
| 25,007,776 |
|
|
| 21.20 |
|
|
| - |
|
|
| - |
|
Additional options reserved |
|
| 3,426,428 |
|
|
| - |
|
|
|
|
|
|
| - |
|
|
| - |
|
Granted |
|
| (3,345,899 | ) |
|
| 2,643,821 |
|
|
| 74.17 |
|
|
| 702,078 |
|
|
| 155.51 |
|
Exercised |
|
| - |
|
|
| (3,852,673 | ) |
|
| 21.42 |
|
|
| - |
|
|
| - |
|
Cancelled |
|
| 1,170,445 |
|
|
| (1,157,982 | ) |
|
| 36.47 |
|
|
| (12,463 | ) |
|
| 154.92 |
|
Released |
|
| - |
|
|
| - |
|
|
| - |
|
|
| (12,031 | ) |
|
| 160.98 |
|
Balance, December 31, 2013 |
|
| 1,720,505 |
|
|
| 22,640,942 |
|
|
| 26.70 |
|
|
| 677,584 |
|
|
| 155.41 |
|
Additional options reserved |
|
| 3,077,274 |
|
|
| - |
|
|
|
|
|
|
| - |
|
|
| - |
|
Granted |
|
| (2,525,246 | ) |
|
| 1,432,171 |
|
|
| 181.56 |
|
|
| 1,093,075 |
|
|
| 223.66 |
|
Exercised |
|
| - |
|
|
| (2,266,697 | ) |
|
| 31.80 |
|
|
| - |
|
|
| - |
|
Cancelled |
|
| 556,765 |
|
|
| (433,456 | ) |
|
| 56.25 |
|
|
| (123,309 | ) |
|
| 187.90 |
|
Released |
|
| - |
|
|
| - |
|
|
| - |
|
|
| (167,240 | ) |
|
| 155.70 |
|
Traded for taxes |
|
| 6,786 |
|
|
| - |
|
|
| - |
|
|
| - |
|
|
| - |
|
Balance, December 31, 2014 |
|
| 2,836,084 |
|
|
| 21,372,960 |
|
| $ | 35.93 |
|
|
| 1,480,110 |
|
| $ | 203.08 |
|
Granted |
|
| (2,728,110 | ) |
|
| 1,102,190 |
|
| $ | 243.22 |
|
|
| 1,625,920 |
|
| $ | 229.54 |
|
Exercised |
|
| - |
|
|
| (2,012,646 | ) |
|
| 34.32 |
|
|
| - |
|
|
| - |
|
Cancelled |
|
| 708,797 |
|
|
| (447,324 | ) |
|
| 96.70 |
|
|
| (261,473 | ) |
|
| 211.66 |
|
Released |
|
| - |
|
|
| - |
|
|
| - |
|
|
| (404,883 | ) |
|
| 233.30 |
|
Traded for taxes |
|
| 14 |
|
|
| - |
|
|
| - |
|
|
| - |
|
|
|
|
|
Balance, December 31, 2015 |
|
| 816,785 |
|
|
| 20,015,180 |
|
| $ | 46.14 |
|
|
| 2,439,674 |
|
| $ | 219.90 |
|
Additional information regarding all stock options outstanding and exercisable as of December 31, 2015 is summarized below:
|
| Options Outstanding |
|
| Options Exercisable |
| ||||||||||||||||||
|
|
|
|
|
|
|
|
|
| Weighted |
|
|
|
|
|
|
|
|
|
| Weighted |
| ||
|
|
|
|
|
|
|
|
|
| Average |
|
|
|
|
|
|
|
|
|
| Average |
| ||
|
|
|
|
|
| Weighted |
|
| Remaining |
|
|
|
|
|
| Weighted |
|
| Remaining |
| ||||
|
|
|
|
|
| Average |
|
| Contractual |
|
|
|
|
|
| Average |
|
| Contractual |
| ||||
|
|
|
|
|
| Exercise |
|
| Life (in |
|
|
|
|
|
| Exercise |
|
| Life (in |
| ||||
Range of Exercise Price |
| Number |
|
| Price |
|
| years) |
|
| Number |
|
| Price |
|
| years) |
| ||||||
$2.70 - $6.15 |
|
| 195,706 |
|
| $ | 3.05 |
|
|
|
|
|
|
| 195,706 |
|
| $ | 3.05 |
|
|
|
|
|
$6.63 - $6.63 |
|
| 6,915,441 |
|
|
| 6.63 |
|
|
|
|
|
|
| 6,915,142 |
|
|
| 6.63 |
|
|
|
|
|
$9.96 - $30.06 |
|
| 2,049,342 |
|
|
| 25.13 |
|
|
|
|
|
|
| 1,917,003 |
|
|
| 24.89 |
|
|
|
|
|
$30.08 - $31.07 |
|
| 294,030 |
|
|
| 30.77 |
|
|
|
|
|
|
| 236,557 |
|
|
| 30.70 |
|
|
|
|
|
$31.17 - $31.17 |
|
| 5,517,405 |
|
|
| 31.17 |
|
|
|
|
|
|
| 2,279,381 |
|
|
| 31.17 |
|
|
|
|
|
$31.49 - $41.83 |
|
| 2,007,717 |
|
|
| 34.28 |
|
|
|
|
|
|
| 1,531,818 |
|
|
| 33.60 |
|
|
|
|
|
$87.80 - $241.93 |
|
| 2,238,944 |
|
|
| 165.32 |
|
|
|
|
|
|
| 648,292 |
|
|
| 146.31 |
|
|
|
|
|
$250.69 - $261.89 |
|
| 736,616 |
|
|
| 257.36 |
|
|
|
|
|
|
| 96,232 |
|
|
| 259.50 |
|
|
|
|
|
$262.16 - $262.16 |
|
| 44,012 |
|
|
| 262.16 |
|
|
|
|
|
|
| - |
|
|
| - |
|
|
|
|
|
$282.11 - $282.11 |
|
| 15,967 |
|
|
| 282.11 |
|
|
|
|
|
|
| 5,500 |
|
|
| 282.11 |
|
|
|
|
|
|
|
| 20,015,180 |
|
| $ | 46.13 |
|
|
| 4.55 |
|
|
| 13,825,631 |
|
| $ | 24.98 |
|
|
| 3.36 |
|
66
Additional information regarding all stock options outstanding and exercisable as of December 31, 2014 is summarized below:
|
| Options Outstanding |
|
| Options Exercisable |
| ||||||||||||||||||
|
|
|
|
|
|
|
|
|
| Weighted |
|
|
|
|
|
|
|
|
|
| Weighted |
| ||
|
|
|
|
|
|
|
|
|
| Average |
|
|
|
|
|
|
|
|
|
| Average |
| ||
|
|
|
|
|
| Weighted |
|
| Remaining |
|
|
|
|
|
| Weighted |
|
| Remaining |
| ||||
|
|
|
|
|
| Average |
|
| Contractual |
|
|
|
|
|
| Average |
|
| Contractual |
| ||||
|
|
|
|
|
| Exercise |
|
| Life (in |
|
|
|
|
|
| Exercise |
|
| Life (in |
| ||||
Range of Exercise Price |
| Number |
|
| Price |
|
| years) |
|
| Number |
|
| Price |
|
| years) |
| ||||||
$2.70 - $6.15 |
|
| 329,072 |
|
| $ | 3.13 |
|
|
|
|
|
|
| 327,696 |
|
| $ | 3.13 |
|
|
|
|
|
$6.63 - $6.63 |
|
| 7,030,489 |
|
|
| 6.63 |
|
|
|
|
|
|
| 7,029,293 |
|
|
| 6.63 |
|
|
|
|
|
$9.96 - $28.45 |
|
| 2,183,386 |
|
|
| 23.87 |
|
|
|
|
|
|
| 1,779,133 |
|
|
| 23.19 |
|
|
|
|
|
$29.12 - $31.07 |
|
| 1,105,021 |
|
|
| 30.00 |
|
|
|
|
|
|
| 606,484 |
|
|
| 30.00 |
|
|
|
|
|
$31.17 - $31.17 |
|
| 5,611,130 |
|
|
| 31.17 |
|
|
|
|
|
|
| 663,860 |
|
|
| 31.17 |
|
|
|
|
|
$31.49 - $38.42 |
|
| 2,376,417 |
|
|
| 33.25 |
|
|
|
|
|
|
| 1,167,109 |
|
|
| 32.82 |
|
|
|
|
|
$39.10 - $179.72 |
|
| 2,140,496 |
|
|
| 111.51 |
|
|
|
|
|
|
| 379,519 |
|
|
| 94.50 |
|
|
|
|
|
$184.67 - $259.32 |
|
| 498,658 |
|
|
| 233.06 |
|
|
|
|
|
|
| 84 |
|
|
| 198.09 |
|
|
|
|
|
$259.94 - $259.94 |
|
| 72,333 |
|
|
| 259.94 |
|
|
|
|
|
|
| 4,332 |
|
|
| 259.94 |
|
|
|
|
|
$282.11 - $282.11 |
|
| 25,958 |
|
|
| 282.11 |
|
|
|
|
|
|
| - |
|
|
| - |
|
|
|
|
|
|
|
| 21,372,960 |
|
|
| 35.93 |
|
|
| 5.48 |
|
|
| 11,957,510 |
|
|
| 12.37 |
|
|
| 3.63 |
|
The aggregate intrinsic value represents the total pretax intrinsic value (i.e., the difference between our common stock price and the exercise price, multiplied by the number of in-the-money options) that would have been received by the option holders had all option holders exercised their options. The aggregate intrinsic value of options outstanding as of December 31, 2015 and 2014 was $3.90 billion and $4.00 billion. The intrinsic value of options exercisable was $2.98 billion and $2.46 billion, and the intrinsic value of options vested and expected to vest was $3.90 billion and $4.00 billion as of December 31, 2015 and 2014. The total intrinsic value of options exercised was $395.6 million and $446.9 million for the years ended December 31, 2015 and 2014. The aggregate intrinsic value of RSUs outstanding as of December 31, 2015 and December 31, 2014 was $585.7 million and $329.2 million.
Fair Value Adoption
We utilize the fair value method in recognizing stock-based compensation expense. Under the fair value method, we estimated the fair value of each option award and the ESPP on the grant date generally using the Black-Scholes option pricing model and the weighted average assumptions noted in the following table.
|
| Year Ended December 31, |
| |||||||||
|
| 2015 |
|
| 2014 |
|
| 2013 |
| |||
Risk-free interest rate: |
|
|
|
|
|
|
|
|
|
|
|
|
Stock options |
|
| 1.6 | % |
|
| 1.9 | % |
|
| 1.3 | % |
ESPP |
|
| 0.3 | % |
|
| 0.1 | % |
|
| 0.1 | % |
Expected term (in years): |
|
|
|
|
|
|
|
|
|
|
|
|
Stock options |
|
| 5.4 |
|
|
| 6.0 |
|
|
| 6.1 |
|
ESPP |
|
| 0.5 |
|
|
| 0.5 |
|
|
| 0.5 |
|
Expected volatility: |
|
|
|
|
|
|
|
|
|
|
|
|
Stock options |
|
| 48 | % |
|
| 55 | % |
|
| 57 | % |
ESPP |
|
| 42 | % |
|
| 46 | % |
|
| 43 | % |
Dividend yield: |
|
|
|
|
|
|
|
|
|
|
|
|
Stock options |
|
| 0.0 | % |
|
| 0.0 | % |
|
| 0.0 | % |
ESPP |
|
| 0.0 | % |
|
| 0.0 | % |
|
| 0.0 | % |
The risk-free interest rate that we use is based on the United States Treasury yield in effect at the time of grant for zero coupon United States Treasury notes with maturities approximating each grant's expected life. Given our limited history with employee grants, we use the "simplified" method in estimating the expected term for our employee grants. The "simplified" method, as permitted by the SEC, is calculated as the average of the time-to-vesting and the contractual life of the options.
67
Beginning in 2015 our expected volatility is derived from our implied volatility on publicly traded options of our common stock and the historical volatility of our common stock. Prior to 2015 , o ur expected volatility was derived from our implied volatility on publicly traded options of our common stock and the historical volatilities of several unrelated public companies within industries related to our business, including the automotive OEM, automotive retail, automotive parts and battery technology industries, becaus e we had limited trading history on our common stock. When making the selections of our peer companies within industries related to our business to be used in the volatility calculation, we also considered the stage of development, size and financial lever age of potential comparable companies. Our historical volatility and implied volatility are weighted based on certain qualitative factors and combined to produce a single volatility factor.
The weighted-average grant-date fair value for option awards granted during the years ended December 31, 2015, 2014 and 2013 was $108.28, $94.01 and $40.72 per share. The weighted-average grant-date fair value for ESPP granted during the years ended December 31, 2015, 2014 and 2013 was $58.77, $74.07 and $19.22 per share. The fair value of RSUs is measured on the grant date based on the closing fair market value of our common stock.
Performance-Based Stock Options
In 2014, to create incentives for continued long term success beyond the Model S program and to closely align executive pay with our stockholders' interests in the achievement of significant milestones by our company, the Compensation Committee of our Board of Directors granted stock options to certain employees to purchase an aggregate 1,073,000 shares of our common stock. Each such grant consists of four vesting tranches with a vesting schedule based entirely on the attainment of future performance milestones, assuming continued employment and service to us through each vesting date.
| · | 1/4th of the shares subject to the options are scheduled to vest upon completion of the first Model X Production Vehicle; |
| · | 1/4th of the shares subject to the options are scheduled to vest upon achieving aggregate vehicle production of 100,000 vehicles in a trailing 12-month period; |
| · | 1/4th of the shares subject to the options are scheduled to vest upon completion of the first Gen III Production Vehicle; and |
| · | 1/4th of the shares subject to the options are scheduled to vest upon achievement of annualized gross margin of greater than 30.0% in any three years |
As of December 31, 2015, the following performance milestone were achieved and approved by our Board of Directors.
| · | Completion of the first Model X Production Vehicle |
We begin recording stock-based compensation expense as each milestone becomes probable. As of December 31, 2015, we had unrecognized compensation expense of $68.7 million for those performance milestones that were not considered probable of achievement. For the years ended December 31, 2015 and 2014, we recorded stock-based compensation expense of $10.4 million and $10.7 million related to this grant.
2012 CEO Grant
In August 2012, our Board of Directors granted 5,274,901 stock options to our CEO (2012 CEO Grant). The 2012 CEO Grant consists of ten vesting tranches with a vesting schedule based entirely on the attainment of both performance conditions and market conditions, assuming continued employment and service to us through each vesting date.
Each of the vesting tranches requires a combination of one of the ten pre-determined performance milestones outlined below and an incremental increase in our market capitalization of $4.0 billion, as compared to the initial market capitalization of $3.2 billion measured at the time of the 2012 CEO Grant.
| · | Successful completion of the Model X Alpha Prototype; |
| · | Successful completion of the Model X Beta Prototype; |
| · | Completion of the first Model X Production Vehicle; |
| · | Successful completion of the Model 3 Alpha Prototype; |
| · | Successful completion of the Model 3 Beta Prototype; |
| · | Completion of the first Model 3 Production Vehicle; |
| · | Gross margin of 30% or more for four consecutive quarters; |
| · | Aggregate vehicle production of 100,000 vehicles; |
| · | Aggregate vehicle production of 200,000 vehicles; and |
| · | Aggregate vehicle production of 300,000 vehicles. |
68
The term of the 2012 CEO Grant is ten years, so any tranches that remain unvested at the expiration of the 2012 CEO Grant will be forfeited. In addition, unvested options will be forfeited if our CEO is no longer in that role, whether for cause or otherwise.
We measured the fair value of the 2012 CEO Grant using a Monte Carlo simulation approach with the following assumptions: risk-free interest rate of 1.65%, expected term of ten years, expected volatility of 55% and dividend yield of 0%.
Stock-based compensation expense associated with the 2012 CEO Grant is recognized for each pair of performance and market conditions over the longer of the expected achievement period of the performance and market conditions, beginning at the point in time that the relevant performance condition is considered probable of being met.
As of December 31, 2015, the market conditions for seven vesting tranches and the following performance milestones were achieved and approved by our Board of Directors, and therefore four of ten tranches of the 2012 CEO Grant were vested as of such date:
| · | Successful completion of the Model X Alpha Prototype |
| · | Successful completion of the Model X Beta Prototype; and |
| · | Completion of the first Model X Production Vehicle |
| · | Aggregate vehicle production of 100,000 vehicles |
As of December 31, 2015, the following two performance milestones were considered probable of achievement:
| · | Successful completion of the Model 3 Alpha Prototype; and |
| · | Successful completion of the Model 3 Beta Prototype |
We begin recording stock-based compensation expense as each milestone becomes probable. As of December 31, 2015, we had $1.7 million of total unrecognized compensation expense for those performance milestones that were considered probable of achievement and will be recognized over a weighted-average period of 0.7 years. As of December 31, 2015, we had unrecognized compensation expense of $25.1 million for those performance milestones that were not considered probable of achievement. For the years ended December 31 2015, 2014, and 2013, we recorded stock-based compensation expense of $10.6 million, $25.0 million and $14.5 million.
No cash compensation has ever been received by our CEO for his services to the company.
Summary Stock Based Compensation Information
The following table summarizes the stock-based compensation expense by line item in the consolidated statements of operations (in thousands):
|
| Year Ended December 31, |
| |||||||||
|
| 2015 |
|
| 2014 |
|
| 2013 |
| |||
Cost of sales |
| $ | 19,244 |
|
| $ | 17,454 |
|
| $ | 9,071 |
|
Research and development |
|
| 89,309 |
|
|
| 62,601 |
|
|
| 35,494 |
|
Selling, general and administrative |
|
| 89,446 |
|
|
| 76,441 |
|
|
| 39,090 |
|
Total |
| $ | 197,999 |
|
| $ | 156,496 |
|
| $ | 83,655 |
|
We realized no income tax benefit from stock option exercises in each of the periods presented due to recurring losses and valuation allowances.
As of December 31, 2015, we had $518.2 million of total unrecognized compensation expense, net, of estimated forfeitures, related to non-performance awards that will be recognized over a weighted-average period of 3.4 years.
Employee Stock Purchase Plan
Employees are eligible to purchase common stock through payroll deductions of up to 15% of their eligible compensation, subject to any plan limitations. The purchase price of the shares on each purchase date is equal to 85% of the lower of the fair market value of our common stock on the first and last trading days of each six-month offering period. During the years ended December 31, 2015, 2014 and 2013, 220,571, 163,600 and 518,743 shares were issued under the ESPP for $37.5 million, $28.6 million and $13.8 million, respectively. A total of 3,615,749 shares of common stock have been reserved for issuance under the ESPP, and there were 2,115,851 shares available for issuance under the ESPP as of December 31, 2015.
69
Note 11 - Income Taxes
A provision for income taxes of $13.0 million, $9.4 million and $2.6 million has been recognized for the years ended December 31, 2015, 2014 and 2013 related primarily to our subsidiaries located outside of the United States. Our loss before provision for income taxes for the years ended December 31, 2015, 2014 and 2013 were as follows (in thousands):
|
| Year Ended December 31, |
| |||||||||
|
| 2015 |
|
| 2014 |
|
| 2013 |
| |||
Domestic |
| $ | 415,694 |
|
| $ | 60,451 |
|
| $ | 75,279 |
|
International |
|
| 459,930 |
|
|
| 224,185 |
|
|
| (3,853 | ) |
Loss before income taxes |
| $ | 875,624 |
|
| $ | 284,636 |
|
| $ | 71,426 |
|
The components of the provision for income taxes for the years ended December 31, 2015, 2014 and 2013, consisted of the following (in thousands):
|
| Year Ended December 31, |
| |||||||||
|
| 2015 |
|
| 2014 |
|
| 2013 |
| |||
Current: |
|
|
|
|
|
|
|
|
|
|
|
|
Federal |
| $ | - |
|
| $ | - |
|
| $ | - |
|
State |
|
| 525 |
|
|
| 257 |
|
|
| 178 |
|
Foreign |
|
| 10,342 |
|
|
| 9,203 |
|
|
| 2,349 |
|
Total current |
|
| 10,867 |
|
|
| 9,460 |
|
|
| 2,527 |
|
Deferred: |
|
|
|
|
|
|
|
|
|
|
|
|
Federal |
|
| - |
|
|
| - |
|
|
| - |
|
State |
|
| - |
|
|
| - |
|
|
| - |
|
Foreign |
|
| 2,172 |
|
|
| (56 | ) |
|
| 61 |
|
Total deferred |
|
| 2,172 |
|
|
| (56 | ) |
|
| 61 |
|
Total provision for income taxes |
| $ | 13,039 |
|
| $ | 9,404 |
|
| $ | 2,588 |
|
Deferred tax assets (liabilities) as of December 31, 2015 and 2014 consisted of the following (in thousands):
|
| December 31, |
|
| December 31, |
| ||
|
| 2015 |
|
| 2014 |
| ||
Deferred tax assets: |
|
|
|
|
|
|
|
|
Net operating loss carry-forwards |
| $ | 447,824 |
|
| $ | 276,916 |
|
Research and development credits |
|
| 73,068 |
|
|
| 46,486 |
|
Other tax credits |
|
| 30,079 |
|
|
| 12,750 |
|
Deferred revenue |
|
| 111,559 |
|
|
| 75,823 |
|
Inventory and warranty reserves |
|
| 60,663 |
|
|
| 53,546 |
|
Depreciation and amortization |
|
| 66 |
|
|
| 68 |
|
Stock-based compensation |
|
| 71,009 |
|
|
| 50,918 |
|
Convertible debt |
|
| 35,073 |
|
|
| 45,118 |
|
Accruals and others |
|
| 29,547 |
|
|
| 49,225 |
|
Total deferred tax assets |
|
| 858,888 |
|
|
| 610,850 |
|
Valuation allowance |
|
| (668,419 | ) |
|
| (524,394 | ) |
Deferred tax assets, net of valuation allowance |
|
| 190,469 |
|
|
| 86,456 |
|
Deferred tax liabilities: |
|
|
|
|
|
|
|
|
Depreciation and amortization |
|
| (188,240 | ) |
|
| (86,298 | ) |
Other |
|
| (4,309 | ) |
|
| - |
|
Total deferred tax liabilities |
|
| (192,549 | ) |
|
| (86,298 | ) |
Deferred tax assets, net of valuation allowance and deferred tax liabilities |
| $ | (2,080 | ) |
| $ | 158 |
|
70
Reconciliation of statutory federal income taxes to our effective taxes for the years ended December 31, 2015, 2014 and 2013 is as follows (in thousands):
|
| Year Ended December 31, |
| |||||||||
|
| 2015 |
|
| 2014 |
|
| 2013 |
| |||
Tax at statutory federal rate |
| $ | (306,470 | ) |
| $ | (99,622 | ) |
| $ | (25,001 | ) |
State tax, net of federal benefit |
|
| 525 |
|
|
| 257 |
|
|
| 178 |
|
Nondeductible expenses |
|
| 16,711 |
|
|
| 15,238 |
|
|
| 733 |
|
Foreign income rate differential |
|
| 172,259 |
|
|
| 86,734 |
|
|
| (253 | ) |
U.S. tax credits |
|
| (43,911 | ) |
|
| (26,895 | ) |
|
| (6,682 | ) |
Other reconciling items |
|
| 1,232 |
|
|
| 877 |
|
|
| 1,317 |
|
Change in valuation allowance |
|
| 172,693 |
|
|
| 32,815 |
|
|
| 32,296 |
|
Provision for income taxes |
| $ | 13,039 |
|
| $ | 9,404 |
|
| $ | 2,588 |
|
As of December 31, 2015, we recorded a valuation allowance of $668.4 million for the portion of the deferred tax asset that we do not expect to be realized. The valuation on our net deferred taxes increased by $144.0 million during the year ended December 31, 2015, primarily due to additional U.S. deferred tax assets incurred in the current year that cannot be realized. Management believes that based on the available information, it is more likely than not that the U.S. deferred tax assets will not be realized, such that a full valuation allowance is required against all U.S. deferred tax assets. The Company has net $3.3 million of deferred tax assets in foreign jurisdictions which it believes are more-likely-than-not to be fully realized given the expectation of future earnings in these jurisdictions.
As of December 31, 2015, we had approximately $2.14 billion of federal and $1.36 billion of state net operating loss carry-forwards available to offset future taxable income, which will begin to expire for federal in 2024 and 2019 for state purposes. The portion of net operating loss carryforwards related to stock options is approximately $867.2 million and $379.8 million for federal and state purposes, respectively, of which the tax benefits will be credited to additional paid-in capital when realized. We have research and development tax credits of approximately $58.6 million and $62.0 million for federal and state income tax purposes, respectively. If not utilized, the federal carry-forwards will expire in various amounts beginning in 2019. However, the state research and development tax credits can be carried forward indefinitely. In addition, we have other general business tax credits of approximately $29.9 million for federal income tax purposes, which will begin to expire in 2034.
No deferred tax liability has been recognized for the remittance of any undistributed foreign earnings to the United States since the Company has no material amount of undistributed foreign earnings outside of our U.S. tax jurisdiction as of December 31, 2015.
Federal and state laws can impose substantial restrictions on the utilization of net operating loss and tax credit carry-forwards in the event of an "ownership change," as defined in Section 382 of the Internal Revenue Code. We determined that no significant limitation would be placed on the utilization of our net operating loss and tax credit carry-forwards due to any prior ownership changes.
Uncertain Tax Positions
The aggregate changes in the balance of our gross unrecognized tax benefits during the years ended December 31, 2015, 2014 and 2013 were as follows (in thousands):
December 31, 2012 |
|
| 18,070 |
|
Decreases in balances related to prior year tax positions |
|
| (7,802 | ) |
Increases in balances related to current year tax positions |
|
| 3,102 |
|
December 31, 2013 |
|
| 13,370 |
|
Increase in balances related to prior year tax positions |
|
| 56 |
|
Increases in balances related to current year tax positions |
|
| 27,951 |
|
December 31, 2014 |
|
| 41,377 |
|
Increase in balances related to prior year tax positions |
|
| 6,626 |
|
Increases in balances related to current year tax positions |
|
| 51,124 |
|
December 31, 2015 |
| $ | 99,127 |
|
71
Accrued interest and penalties related to unrecognized tax benefits are classified as income tax expense and was immaterial. As of December 31, 2015, unrecognized tax benefits of $95.7 million, if recognized, would not affect our effective tax rate as the tax benefits would increase a d eferred tax asset which is currently fully offset with a full valuation allowance. We do not anticipate that the amount of existing unrecognized tax benefits will significantly increase or decrease within the next 12 months. We file income tax returns in t he United States, California, and other states and foreign jurisdictions. Tax years 2003 to 2014 remain subject to examination for federal purposes, and tax years 2003 to 2014 remain subject to examination for California purposes. All net operating losses and tax credits generated to date are subject to adjustment for U.S. federal and California purposes. Tax years 2007 to 2014 remain open for examination in other U.S. state and foreign jurisdictions.
The United States Tax Court has issued a decision in Altera Corp v. Commissioner related to the treatment of share-based compensation expense in a cost-sharing arrangement. As this decision can be overturned upon appeal, we have not recorded any impact as of December 31, 2015. In addition, any potential tax benefits would increase a deferred tax asset which is currently offset with a full valuation allowance.
Note 12 - Information about Geographic Areas
We operate as one reportable segment which is the design, development, manufacturing and sales of electric vehicles, and stationary energy storage products.
The following tables set forth total revenues and long-lived assets by geographic area (in thousands).
Total Revenues
|
| Year Ended December 31, |
| |||||||||
|
| 2015 |
|
| 2014 |
|
| 2013 |
| |||
United States |
| $ | 1,957,397 |
|
| $ | 1,471,643 |
|
| $ | 1,479,166 |
|
China |
|
| 318,513 |
|
|
| 477,082 |
|
|
| - |
|
Norway |
|
| 356,419 |
|
|
| 412,198 |
|
|
| 217,070 |
|
Other |
|
| 1,413,696 |
|
|
| 837,433 |
|
|
| 317,260 |
|
Total |
| $ | 4,046,025 |
|
| $ | 3,198,356 |
|
| $ | 2,013,496 |
|
Long-lived Assets
|
| December 31, |
|
| December 31, |
| ||
|
| 2015 |
|
| 2014 |
| ||
United States |
| $ | 4,585,521 |
|
| $ | 2,452,219 |
|
International |
|
| 609,216 |
|
|
| 143,792 |
|
Total |
| $ | 5,194,737 |
|
| $ | 2,596,011 |
|
Note 13 - Commitments and Contingencies
Operating Leases
Our corporate headquarters and powertrain production operations are based in Palo Alto, California where we have leased a facility consisting of 350,000 square feet. This lease expires in January 2020. We lease a 203,772 square feet manufacturing facility in Tilburg, Netherlands through November 2023. We also lease a number of properties in North America, Europe and Asia for our office, retail and service locations as well as Supercharger sites under non-cancelable operating leases with various expiration dates through December 2030.
Included within Operating Leases commitments in the table below are payments due under operating leases that have been accounted for as build-to-suit arrangements and are included in property, plant, and equipment in our Consolidated Balance Sheets.
Rent expense for the years ended December 31, 2015, 2014 and 2013 was $68.2 million, $46.3 million and $21.5 million.
Capital Leases
We have entered into various agreements to lease equipment under capital leases over terms between 36 and 60 months. The equipment under the leases are collateral for the lease obligations and are included within property, plant and equipment, net on the Consolidated Balance Sheets under the categories of computer equipment and software and office furniture and equipment.
72
Future minimum commitments for leases as of December 31, 2015 are as follows (in thousands):
|
| Operating |
|
| Capital |
| ||
|
| Leases |
|
| Leases |
| ||
2016 |
| $ | 88,629 |
|
| $ | 16,758 |
|
2017 |
|
| 86,661 |
|
|
| 11,321 |
|
2018 |
|
| 78,531 |
|
|
| 5,488 |
|
2019 |
|
| 69,013 |
|
|
| 1,112 |
|
2020 and thereafter |
|
| 248,030 |
|
|
| - |
|
Total minimum lease payments |
|
| 570,864 |
|
|
| 34,679 |
|
Less: Amounts representing interest not yet incurred |
|
|
|
|
|
| 2,006 |
|
Present value of capital lease obligations |
|
|
|
|
|
| 32,673 |
|
Less: Current portion |
|
|
|
|
|
| 15,451 |
|
Long-term portion of capital lease obligations |
|
|
|
|
| $ | 17,222 |
|
Environmental Liabilities
In connection with our Tesla Factory located in Fremont, California, we are obligated to pay for the remediation of certain environmental conditions existing at the time we purchased the property from New United Motor Manufacturing, Inc. (NUMMI). Tesla is responsible for the first $15 million of remediation costs and any costs in excess of $30 million or costs incurred after the ten-year anniversary of closing. NUMMI is responsible for remediation costs between $15 million and $30 million for up to 10 years from the closing date. Through December 31, 2015, we have paid $6.94 million for remediation costs incurred related to the Fremont facility, effectively settling our accrued obligation and as of December 31, 2015, we have no accrued amounts remaining. As of December 31, 2014, we accrued a total of $4.0 million related to these environmental liabilities.
Legal Proceedings
From time to time, we are subject to various legal proceedings that arise from the normal course of business activities. In addition, from time to time, third parties may assert intellectual property infringement claims against us in the form of letters and other forms of communication. If an unfavorable ruling were to occur, there exists the possibility of a material adverse impact on our results of operations, prospects, cash flows, financial position and brand.
In November 2013, a putative securities class action lawsuit was filed against Tesla in U.S. District Court, Northern District of California, alleging violations of, and seeking remedies pursuant to, Sections 10(b) and 20(a) of the Securities Exchange Act of 1934 and Rule 10b-5. The complaint, made claims against Tesla and our CEO, Elon Musk, sought damages and attorney's fees on the basis of allegations that, among other things, Tesla and Mr. Musk made false and/or misleading representations and omissions, including with respect to the safety of Model S. This case was brought on behalf of a putative class consisting of certain persons who purchased Tesla's securities between August 19, 2013 and November 17, 2013. On September 26, 2014, the trial court, upon the motion of Tesla and Mr. Musk, dismissed the complaint with prejudice, and thereafter issued a formal written order to that effect. The plaintiffs have appealed from the trial court's order, and that appeal is pending.
Note 14 - Quarterly Results of Operations (Unaudited)
The following table includes selected quarterly results of operations data for the years ended December 31, 2015 and 2014 (in thousands, except per share data):
|
| Three months ended |
| |||||||||||||
|
| March 31 |
|
| June 30 |
|
| September 30 |
|
| December 31 |
| ||||
2015 |
|
|
|
|
|
|
|
|
|
|
|
|
|
|
|
|
Total revenues |
| $ | 939,880 |
|
| $ | 954,976 |
|
| $ | 936,789 |
|
| $ | 1,214,379 |
|
Gross profit |
|
| 260,073 |
|
|
| 213,370 |
|
|
| 231,496 |
|
|
| 218,564 |
|
Net loss |
|
| (154,181 | ) |
|
| (184,227 | ) |
|
| (229,858 | ) |
|
| (320,397 | ) |
Net loss per share, basic |
|
| (1.22 | ) |
|
| (1.45 | ) |
|
| (1.78 | ) |
|
| (2.44 | ) |
Net income (loss) per share, diluted |
|
| (1.22 | ) |
|
| (1.45 | ) |
|
| (1.78 | ) |
|
| (2.44 | ) |
2014 |
|
|
|
|
|
|
|
|
|
|
|
|
|
|
|
|
Total revenues |
| $ | 620,542 |
|
| $ | 769,349 |
|
| $ | 851,804 |
|
| $ | 956,661 |
|
Gross profit |
|
| 155,128 |
|
|
| 212,995 |
|
|
| 251,851 |
|
|
| 261,697 |
|
Net income (loss) |
|
| (49,800 | ) |
|
| (61,900 | ) |
|
| (74,708 | ) |
|
| (107,630 | ) |
Net income (loss) per share, basic |
|
| (0.40 | ) |
|
| (0.50 | ) |
|
| (0.60 | ) |
|
| (0.86 | ) |
Net income (loss) per share, diluted |
|
| (0.40 | ) |
|
| (0.50 | ) |
|
| (0.60 | ) |
|
| (0.86 | ) |
73
Net loss per share, basic and diluted for the four quarters of each fiscal year may not sum to the total for the year because of the different numbers of shares outstanding during each period.
I TEM 9. | CHANGES IN AND DISAGREEMENTS WITH ACCOUNTANTS ON ACCOUNTING AND FINANCIAL DISCLOSURE |
Not applicable.
I TEM 9A. | CONTROLS AND PROCEDURES |
Evaluation of Disclosure Controls and Procedures
We conducted an evaluation as of December 31, 2015, under the supervision and with the participation of our management, including our Chief Executive Officer and Chief Financial Officer, of the effectiveness of the design and operation of our disclosure controls and procedures. Based upon that evaluation, our Chief Executive Officer and Chief Financial Officer concluded that, as of December 31, 2015, our disclosure controls and procedures were effective to provide reasonable assurance.
Management's Report on Internal Control over Financial Reporting
Our management is responsible for establishing and maintaining adequate internal control over financial reporting. Internal control over financial reporting is a process designed by, or under the supervision of, our Chief Executive Officer and Chief Financial Officer to provide reasonable assurance regarding the reliability of financial reporting and the preparation of financial statements for external purposes in accordance with generally accepted accounting principles and includes those policies and procedures that (1) pertain to the maintenance of records that in reasonable detail accurately and fairly reflect the transactions and dispositions of our assets; (2) provide reasonable assurance that transactions are recorded as necessary to permit preparation of financial statements in accordance with generally accepted accounting principles, and that our receipts and expenditures are being made only in accordance with authorizations of our management and directors; and (3) provide reasonable assurance regarding prevention or timely detection of unauthorized acquisition, use or disposition of our assets that could have a material effect on the financial statements.
Under the supervision and with the participation of our management, including our Chief Executive Officer and Chief Financial Officer, we conducted an evaluation of the effectiveness of our internal control over financial reporting based on criteria established in "Internal Control-Integrated Framework (2013)" issued by the Committee of Sponsoring Organizations of the Treadway Commission (COSO). Our management concluded that our internal control over financial reporting was effective as of December 31, 2015.
Our independent registered public accounting firm, PricewaterhouseCoopers LLP, has audited the effectiveness of our internal control over financial reporting as of December 31, 2015 as stated in their report which is included herein.
Limitations on the Effectiveness of Controls
Because of inherent limitations, internal control over financial reporting may not prevent or detect misstatements and projections of any evaluation of effectiveness to future periods are subject to the risk that controls may become inadequate because of changes in conditions, or that the degree of compliance with the policies or procedures may deteriorate.
Changes in Internal Control over Financial Reporting
There was no change in our internal control over financial reporting which occurred during the fourth fiscal quarter of the year ended December 31, 2015 which has materially affected, or is reasonably likely to materially affect, our internal control over financial reporting.
I TEM 9B. | OTHER INFORMATION |
None
74
P ART III
I TEM 10. | DIRECTORS, EXECUTIVE OFFICERS AND CORPORATE GOVERNANCE |
The information required by this Item 10 of Form 10-K will be included in our 2016 Proxy Statement to be filed with the SEC in connection with the solicitation of proxies for our 2016 Annual Meeting of Stockholders (2016 Proxy Statement) and is incorporated herein by reference. The 2016 Proxy Statement will be filed with the SEC within 120 days after the end of the fiscal year to which this report relates.
I TEM 11. | EXECUTIVE COMPENSATION |
The information required by this Item 11 of Form 10-K will be included in our 2016 Proxy Statement and is incorporated herein by reference.
I TEM 12. | SECURITY OWNERSHIP OF CERTAIN BENEFICIAL OWNERS AND MANAGEMENT AND RELATED STOCKHOLDER MATTERS |
The information required by this Item 12 of Form 10-K will be included in our 2016 Proxy Statement and is incorporated herein by reference.
I TEM 13. | CERTAIN RELATIONSHIPS AND RELATED TRANSACTIONS, AND DIRECTOR INDEPENDENCE |
The information required by this Item 13 of Form 10-K will be included in our 2016 Proxy Statement and is incorporated herein by reference.
I TEM 14. | PRINCIPAL ACCOUNTANT FEES AND SERVICES |
The information required by this Item 14 of Form 10-K will be included in our 2016 Proxy Statement and is incorporated herein by reference.
I TEM 15. | EXHIBITS AND FINANCIAL STATEMENT SCHEDULES |
1. | Financial Statements. See "Index to Consolidated Financial Statements" in Part II, Item 8 of this Annual Report on Form 10-K. |
2. | All financial statement schedules have been omitted, since the required information is not applicable or is not present in amounts sufficient to require submission of the schedule, or because the information required is included in the consolidated financial statements and notes thereto. |
3. | Exhibits. The exhibits listed in the accompanying "Index to Exhibits" are filed or incorporated by reference as part of this Annual Report on Form 10-K. |
75
INDEX TO EXHIBITS
Exhibit Number |
|
|
| Incorporated by Reference |
| Filed Herewith | ||||||
| Exhibit Description |
| Form |
| File No. |
| Exhibit |
| Filing Date |
| ||
3.1 |
|
Amended and Restated Certificate of Incorporation of the Registrant |
|
S-1 |
|
333-164593 |
|
3.1 |
|
January 29, 2010 |
|
|
3.2 |
|
Amended and Restated Bylaws of the Registrant |
|
8-K |
|
333-164593 |
|
3.2 |
|
June 8, 2012 |
|
|
4.1 |
|
Specimen common stock certificate of the Registrant |
|
S-1/A |
|
333-164593 |
|
4.1 |
|
May 27, 2010 |
|
|
4.2 |
|
Fifth Amended and Restated Investors' Rights Agreement, dated as of August 31, 2009, between Registrant and certain holders of the Registrant's capital stock named therein |
|
S-1 |
|
333-164593 |
|
4.2 |
|
January 29, 2010 |
|
|
4.2A |
|
Amendment to Fifth Amended and Restated Investors' Rights Agreement, dated as of May 20, 2010, between Registrant and certain holders of the Registrant's capital stock named therein |
|
S-1/A |
|
333-164593 |
|
4.2A |
|
May 27, 2010 |
|
|
4.2B |
|
Amendment to Fifth Amended and Restated Investors' Rights Agreement between Registrant, Toyota Motor Corporation and certain holders of the Registrant's capital stock named therein |
|
S-1/A |
|
333-164593 |
|
4.2B |
|
May 27, 2010 |
|
|
4.2C |
|
Amendment to Fifth Amended and Restated Investor's Rights Agreement, dated as of June 14, 2010, between Registrant and certain holders of the Registrant's capital stock named therein |
|
S-1/A |
|
333-164593 |
|
4.2C |
|
June 15, 2010 |
|
|
4.2D |
|
Amendment to Fifth Amended and Restated Investor's Rights Agreement, dated as of November 2, 2010, between Registrant and certain holders of the Registrant's capital stock named therein |
|
8-K |
|
001-34756 |
|
4.1 |
|
November 4, 2010 |
|
|
4.2E |
|
Waiver to Fifth Amended and Restated Investor's Rights Agreement, dated as of May 25, 2011, between Registrant and certain holders of the Registrant's capital stock named therein |
|
S-1/A |
|
333-174466 |
|
4.2E |
|
June 2, 2011 |
|
|
4.2F |
|
Amendment to Fifth Amended and Restated Investor's Rights Agreement, dated as of May 30, 2011, between Registrant and certain holders of the Registrant's capital stock named therein |
|
8-K |
|
001-34756 |
|
4.1 |
|
June 1, 2011 |
|
|
4.2G |
|
Sixth Amendment to Fifth Amended and Restated Investors' Rights Agreement, dated as of May 15, 2013 among the Registrant, the Elon Musk Revocable Trust dated July 22, 2003 and certain other holders of the capital stock of the Registrant named therein. |
|
8-K |
|
001-34756 |
|
4.1 |
|
May 20, 2013 |
|
|
76
Exhibit Number |
|
|
| Incorporated by Reference |
| Filed Herewith | ||||||
| Exhibit Description |
| Form |
| File No. |
| Exhibit |
| Filing Date |
| ||
4.2H |
|
Waiver to Fifth Amended and Restated Investor's Rights Agreement, dated as of May 14, 2013, between the Registrant and certain holders of the capital stock of the Registrant named therein. |
|
8-K |
|
001-34756 |
|
4.2 |
|
May 20, 2013 |
|
|
4.2I |
|
Waiver to Fifth Amended and Restated Investor's Rights Agreement, dated as of August 13, 2015, between the Registrant and certain holders of the capital stock of the Registrant named therein. |
|
8-K |
|
001-34756 |
|
4.1 |
|
August 19, 2015 |
|
|
4.3 |
|
Indenture, dated as of May 22, 2013, by and between the Registrant and U.S. Bank National Association. |
|
8-K |
|
001-34756 |
|
4.1 |
|
May 22, 2013 |
|
|
4.4 |
|
First Supplemental Indenture, dated as of May 22, 2013, by and between the Registrant and U.S. Bank National Association. |
|
8-K |
|
001-34756 |
|
4.2 |
|
May 22, 2013 |
|
|
4.5 |
|
Form of 1.50% Convertible Senior Note Due June 1, 2018 (included in Exhibit 4.4). |
|
8-K |
|
001-34756 |
|
4.3 |
|
May 22, 2013 |
|
|
4.6 |
|
Second Supplemental Indenture, dated as of March 5, 2014, by and between the Registrant and U.S. Bank National Association. |
|
8-K |
|
001-34756 |
|
4.2 |
|
March 5, 2014 |
|
|
4.7 |
|
Form of 0.25% Convertible Senior Note Due March 1, 2019 (included in Exhibit 4.6). |
|
8-K |
|
001-34756 |
|
4.3 |
|
March 5, 2014 |
|
|
4.8 |
|
Third Supplemental Indenture, dated as of March 5, 2014, by and between the Registrant and U.S. Bank National Association. |
|
8-K |
|
001-34756 |
|
4.4 |
|
March 5, 2014 |
|
|
4.9 |
|
Form of 1.25% Convertible Senior Note Due March 1, 2021 (included in Exhibit 4.8). |
|
8-K |
|
001-34756 |
|
4.5 |
|
March 5, 2014 |
|
|
10.1** |
|
Form of Indemnification Agreement between the Registrant and its directors and officers |
|
S-1/A |
|
333-164593 |
|
10.1 |
|
June 15, 2010 |
|
|
10.2** |
|
2003 Equity Incentive Plan |
|
S-1/A |
|
333-164593 |
|
10.2 |
|
May 27, 2010 |
|
|
10.3** |
|
Form of Stock Option Agreement under 2003 Equity Incentive Plan |
|
S-1 |
|
333-164593 |
|
10.3 |
|
January 29, 2010 |
|
|
10.3A** |
|
Grant Notice and Stock Option Agreement between the Registrant and Elon Musk |
|
S-1/A |
|
333-164593 |
|
10.3A |
|
March 29, 2010 |
|
|
10.4** |
|
Amended and Restated 2010 Equity Incentive Plan, effective as of April 10, 2014 |
|
14A |
|
333-164593 |
|
Appendix A |
|
April 24, 2014 |
|
|
10.5** |
|
Form of Stock Option Agreement under 2010 Equity Incentive Plan |
|
S-1/A |
|
333-164593 |
|
10.5 |
|
March 29, 2010 |
|
|
77
Exhibit Number |
|
|
| Incorporated by Reference |
| Filed Herewith | ||||||
| Exhibit Description |
| Form |
| File No. |
| Exhibit |
| Filing Date |
| ||
10.6** |
|
Form of Restricted Stock Unit Award Agreement under 2010 Equity Incentive Plan |
|
S-1/A |
|
333-164593 |
|
10.6 |
|
March 29, 2010 |
|
|
10.7** |
|
Amended and Restated 2010 Employee Stock Purchase Plan, effective as of August 3, 2011. |
|
- |
|
- |
|
- |
|
- |
|
X |
10.8** |
|
Offer Letter between the Registrant and Elon Musk dated October 13, 2008 |
|
S-1 |
|
333-164593 |
|
10.9 |
|
January 29, 2010 |
|
|
10.9** |
|
Offer Letter between the Registrant and Deepak Ahuja dated June 13, 2008, and amended June 4, 2009 |
|
S-1 |
|
333-164593 |
|
10.10 |
|
January 29, 2010 |
|
|
10.10** |
|
Relocation Agreement between the Registrant and Deepak Ahuja effective October 31, 2008 and amended June 4, 2009 |
|
S-1 |
|
333-164593 |
|
10.11 |
|
January 29, 2010 |
|
|
10.11** |
|
Offer Letter between the Registrant and Jeffrey B. Straubel dated May 6, 2004 |
|
S-1 |
|
333-164593 |
|
10.12 |
|
January 29, 2010 |
|
|
10.12** |
|
Offer Letter between the Registrant and Jason Wheeler dated October 8, 2015. |
|
- |
|
- |
|
- |
|
- |
|
X |
10.13 |
|
Commercial Lease between the Registrant and The Board of Trustees of The Leland Stanford Jr. University dated August 6, 2009 |
|
S-1 |
|
333-164593 |
|
10.22 |
|
January 29, 2010 |
|
|
10.14 |
|
Letter Agreement between the Registrant and New United Motor Manufacturing, Inc. dated May 26, 2010 |
|
S-1/A |
|
333-164593 |
|
10.45 |
|
May 27, 2010 |
|
|
10.14A |
|
Amendment No. 1 to the Letter Agreement between the Registrant and New United Motor Manufacturing, Inc. dated June 15, 2010 |
|
10-Q |
|
001-34756 |
|
10.3 |
|
November 12, 2010 |
|
|
10.14B |
|
Amendment No. 2 to the Letter Agreement between the Registrant and New United Motor Manufacturing, Inc. dated October 1, 2010 |
|
10-Q |
|
001-34756 |
|
10.4 |
|
November 12, 2010 |
|
|
10.14C |
|
Amendment No. 3 to the Letter Agreement between the Registrant and New United Motor Manufacturing, Inc. dated October 8, 2010 |
|
10-Q |
|
001-34756 |
|
10.5 |
|
November 12, 2010 |
|
|
10.14D |
|
Amendment No. 4 to the Letter Agreement between the Registrant and New United Motor Manufacturing, Inc. dated October 13, 2010 |
|
10-Q |
|
001-34756 |
|
10.6 |
|
November 12, 2010 |
|
|
10.14E |
|
Amendment No. 5 to the Letter Agreement between the Registrant and New United Motor Manufacturing, Inc. dated October 15, 2010 |
|
10-Q |
|
001-34756 |
|
10.7 |
|
November 12, 2010 |
|
|
10.14F† |
|
Amendment No. 6 to the Letter Agreement between the Registrant and New United Motor Manufacturing, Inc. dated October 19, 2010 |
|
10-Q |
|
001-34756 |
|
10.8 |
|
November 12, 2010 |
|
|
78
Exhibit Number |
|
|
| Incorporated by Reference |
| Filed Herewith | ||||||
| Exhibit Description |
| Form |
| File No. |
| Exhibit |
| Filing Date |
| ||
10.15 |
|
Sale and Purchase Agreement between Registrant and New United Motor Manufacturing, Inc., dated August 13, 2010 |
|
10-Q |
|
001-34756 |
|
10.1 |
|
November 12, 2010 |
|
|
10.15A |
|
Addendum No. 1to the Sale and Purchase Agreement between Registrant and New United Motor Manufacturing, Inc., dated September 23, 2010 |
|
10-Q |
|
001-34756 |
|
10.2 |
|
November 12, 2010 |
|
|
10.16† |
|
Supply Agreement between Panasonic Corporation and the Registrant dated October 5, 2011 |
|
10-K |
|
-001-34756 |
|
10.50 |
|
February 27, 2012 |
|
|
10.16A† |
|
Amendment No. 1 to Supply Agreement between Panasonic Corporation and the Registrant dated October 29, 2013 |
|
10-K |
|
001-34756 |
|
10.35A |
|
February 26, 2014 |
|
|
10.17 |
|
Form of Call Option Confirmation relating to 1.50% Convertible Senior Note Due June 1, 2018. |
|
8-K |
|
001-34756 |
|
10.1 |
|
May 22, 2013 |
|
|
10.18 |
|
Form of Warrant Confirmation relating to 1.50% Convertible Senior Note Due June 1, 2018. |
|
8-K |
|
001-34756 |
|
10.2 |
|
May 22, 2013 |
|
|
10.19 |
|
Indemnification Agreement, dated as of February 27, 2014, by and between the Registrant and J.P. Morgan Securities LLC. |
|
8-K |
|
001-34756 |
|
10.1 |
|
March 5, 2014 |
|
|
10.20 |
|
Form of Call Option Confirmation relating to 0.25% Convertible Senior Notes Due March 1, 2019. |
|
8-K |
|
001-34756 |
|
10.2 |
|
March 5, 2014 |
|
|
10.21 |
|
Form of Call Option Confirmation relating to 1.25% Convertible Senior Notes Due March 1, 2021. |
|
8-K |
|
001-34756 |
|
10.3 |
|
March 5, 2014 |
|
|
10.22 |
|
Form of Warrant Confirmation relating to 0.25% Convertible Senior Notes Due March 1, 2019. |
|
8-K |
|
001-34756 |
|
10.4 |
|
March 5, 2014 |
|
|
10.23 |
|
Form of Warrant Confirmation relating to 1.25% Convertible Senior Notes Due March 1, 2021. |
|
8-K |
|
001-34756 |
|
10.5 |
|
March 5, 2014 |
|
|
10.24 |
|
Agreement between Panasonic Corporation and the Registrant dated July 31, 2014. |
|
10-Q |
|
001-34756 |
|
10.1 |
|
November 7, 2014 |
|
|
10.25 † |
|
General Terms and Conditions between Panasonic Corporation and the Registrant dated October 1, 2014. |
|
10-Q |
|
001-34756 |
|
10.2 |
|
November 7, 2014 |
|
|
10.25A |
|
Letter Agreement, dated as of February 24, 2015, regarding addition of co-party to General Terms and Conditions, Production Pricing Agreement and Investment Letter Agreement between Panasonic Corporation and the Registrant. |
|
- |
|
- |
|
- |
|
- |
|
X |
10.26 † |
|
Production Pricing Agreement between Panasonic Corporation and the Registrant dated October 1, 2014. |
|
10-Q |
|
001-34756 |
|
10.3 |
|
November 7, 2014 |
|
|
79
Exhibit Number |
|
|
| Incorporated by Reference |
| Filed Herewith | ||||||
| Exhibit Description |
| Form |
| File No. |
| Exhibit |
| Filing Date |
| ||
10.27 † |
|
Investment Letter Agreement between Panasonic Corporation and the Registrant dated October 1, 2014. |
|
10-Q |
|
001-34756 |
|
10.4 |
|
November 7, 2014 |
|
|
10.28 |
|
ABL Credit Agreement, dated as of June 10, 2015, by and among the Registrant, Tesla Motors Netherlands B.V., certain of the Registrant's and Tesla Motors Netherlands B.V.'s direct or indirect subsidiaries from time to time party thereto, as borrowers, Wells Fargo Bank, National Association, as documentation agent, JPMorgan Chase Bank, N.A., Goldman Sachs Bank USA, Morgan Stanley Senior Funding Inc. and Bank of America, N.A., as syndication agents, the lenders from time to time party thereto, and Deutsche Bank AG New York Branch, as administrative agent and collateral agent. |
|
8-K |
|
001-34756 |
|
10.1 |
|
June 12, 2015 |
|
|
10.28A |
|
First Amendment, dated as of November 3, 2015, to ABL Credit Agreement, dated as of June 10, 2015, by and among the Registrant, Tesla Motors Netherlands B.V., certain of the Registrant's and Tesla Motors Netherlands B.V.'s direct or indirect subsidiaries from time to time party thereto, as borrowers, and the documentation agent, syndication agents, administrative agent, collateral agent and lenders from time to time party thereto. |
|
10-Q |
|
001-34756 |
|
10.1 |
|
November 5, 2015 |
|
|
10.28B |
|
Second Amendment, dated as of December 31, 2015, to ABL Credit Agreement, dated as of June 10, 2015, by and among the Registrant, Tesla Motors Netherlands B.V., certain of the Registrant's and Tesla Motors Netherlands B.V.'s direct or indirect subsidiaries from time to time party thereto, as borrowers, and the documentation agent, syndication agents, administrative agent, collateral agent and lenders from time to time party thereto. |
|
- |
|
- |
|
- |
|
- |
|
X |
10.28C |
|
Third Amendment, dated as of February 9, 2016, to ABL Credit Agreement, dated as of June 10, 2015, by and among the Registrant, Tesla Motors Netherlands B.V., certain of the Registrant's and Tesla Motors Netherlands B.V.'s direct or indirect subsidiaries from time to time party thereto, as borrowers, and the documentation agent, syndication agents, administrative agent, collateral agent and lenders from time to time party thereto. |
|
- |
|
- |
|
- |
|
- |
|
X |
80
Exhibit Number |
|
|
| Incorporated by Reference |
| Filed Herewith | ||||||
| Exhibit Description |
| Form |
| File No. |
| Exhibit |
| Filing Date |
| ||
10.29 † |
|
Agreement for Tax Abatement and Incentives, dated as of May 7, 2015, by and between Tesla Motors, Inc. and the State of Nevada, acting by and through the Nevada Governor's Office of Economic Development |
|
10-Q |
|
001-34756 |
|
10.1 |
|
August 7, 2015 |
|
|
|
|
|
|
|
|
|
|
|
|
|
|
|
12.1 |
| Statement regarding Computation of Ratio of Earnings to Fixed Charges |
| - |
| - |
| - |
| - |
| X |
|
|
|
|
|
|
|
|
|
|
|
|
|
21.1 |
| List of Subsidiaries of the Registrant |
| - |
| - |
| - |
| - |
| X |
|
|
|
|
|
|
|
|
|
|
|
|
|
23.1 |
| Consent of PricewaterhouseCoopers LLP, Independent Registered Public Accounting Firm |
| - |
| - |
| - |
| - |
| X |
|
|
|
|
|
|
|
|
|
|
|
|
|
31.1 |
| Rule 13a-14(a) / 15(d)-14(a) Certification of Principal Executive Officer |
| - |
| - |
| - |
| - |
| X |
|
|
|
|
|
|
|
|
|
|
|
|
|
31.2 |
| Rule 13a-14(a) / 15(d)-14(a) Certification of Principal Financial Officer |
| - |
| - |
| - |
| - |
| X |
|
|
|
|
|
|
|
|
|
|
|
|
|
32.1* |
| Section 1350 Certifications |
| - |
| - |
| - |
| - |
|
|
|
|
|
|
|
|
|
|
|
|
|
|
|
101.INS |
| XBRL Instance Document |
|
|
|
|
|
|
|
|
|
|
|
|
|
|
|
|
|
|
|
|
|
|
|
101.SCH |
| XBRL Taxonomy Extension Schema Document |
|
|
|
|
|
|
|
|
|
|
|
|
|
|
|
|
|
|
|
|
|
|
|
101.CAL |
| XBRL Taxonomy Extension Calculation Linkbase Document. |
|
|
|
|
|
|
|
|
|
|
|
|
|
|
|
|
|
|
|
|
|
|
|
101.DEF |
| XBRL Taxonomy Extension Definition Linkbase Document |
|
|
|
|
|
|
|
|
|
|
|
|
|
|
|
|
|
|
|
|
|
|
|
101.LAB |
| XBRL Taxonomy Extension Label Linkbase Document |
|
|
|
|
|
|
|
|
|
|
|
|
|
|
|
|
|
|
|
|
|
|
|
101.PRE |
| XBRL Taxonomy Extension Presentation Linkbase Document |
|
|
|
|
|
|
|
|
|
|
* | Furnished herewith |
** | Indicates a management contract or compensatory plan or arrangement. |
† | Confidential treatment has been requested for portions of this exhibit |
81
S IGNATURES
Pursuant to the requirements of Section 13 or 15(d) the Securities Exchange Act of 1934, the registrant has duly caused this report to be signed on its behalf by the undersigned, thereunto duly authorized.
|
|
| Tesla Motors, Inc. |
|
|
|
|
Date: February 24, 2016 |
|
| /s/ Elon Musk |
|
|
| Elon Musk |
|
|
| Chief Executive Officer |
|
|
| (Principal Executive Officer) |
Pursuant to the requirements of the Securities Exchange Act of 1934, this report has been signed below by the following persons on behalf of the registrant and in the capacities and on the dates indicated.
Signature |
| Title |
| Date |
|
|
|
|
|
/s/ Elon Musk |
| Chief Executive Officer and Director (Principal |
| February 24, 2016 |
Elon Musk |
| Executive Officer) |
|
|
|
|
|
|
|
/s/ Jason Wheeler |
| Chief Financial Officer (Principal Financial Officer |
| February 24, 2016 |
Jason Wheeler |
| and Principal Accounting Officer) |
|
|
|
|
|
|
|
/s/ Brad W. Buss |
| Director |
| February 24, 2016 |
Brad W. Buss |
|
|
|
|
|
|
|
|
|
/s/ Robyn Denholm |
| Director |
| February 24, 2016 |
Robyn Denholm |
|
|
|
|
|
|
|
|
|
/s/ Ira Ehrenpreis |
| Director |
| February 24, 2016 |
Ira Ehrenpreis |
|
|
|
|
|
|
|
|
|
/s/ Antonio J. Gracias |
| Director |
| February 24, 2016 |
Antonio J. Gracias |
|
|
|
|
|
|
|
|
|
/s/ Stephen T. Jurvetson |
| Director |
| February 24, 2016 |
Stephen T. Jurvetson |
|
|
|
|
|
|
|
|
|
/s/ Kimbal Musk |
| Director |
| February 24, 2016 |
Kimbal Musk |
|
|
|
|
82