UNITED STATES | |
SECURITIES AND EXCHANGE COMMISSION | |
Washington, D.C. 20549 | |
| |
FORM 10-K | |
| |
[X] | ANNUAL REPORT PURSUANT TO SECTION 13 OR 15(d) OF THE SECURITIES EXCHANGE ACT OF 1934 |
| |
| For the Fiscal Year Ended September 30, 2014 OR |
| |
[ ] | TRANSITION REPORT PURSUANT TO SECTION 13 OR 15(d) OF THE SECURITIES EXCHANGE ACT OF 1934 |
| |
Commission File Number: 0-23333 | |
| |
TIMBERLAND BANCORP, INC. | |
(Exact name of registrant as specified in its charter) | |
Washington |
| 91-1863696 |
(State or other jurisdiction of incorporation or organization) |
| (I.R.S. Employer Identification Number) |
|
|
|
624 Simpson Avenue, Hoquiam, Washington |
| 98550 |
(Address of principal executive offices) |
| (Zip Code) |
|
|
|
Registrant's telephone number, including area code: |
| (360) 533-4747 |
|
|
|
Securities registered pursuant to Section 12(b) of the Act: |
|
|
|
|
|
Common Stock, par value $.01 per share |
| The Nasdaq Stock Market LLC |
(Title of Each Class) |
| (Name of Each Exchange on Which Registered) |
|
|
|
Securities registered pursuant to Section 12(g) of the Act: |
| None |
Indicate by check mark if the registrant is a well-known seasoned issuer, as defined in Rule 405 of the Securities Act. YES NO X
Indicate by check mark if the registrant is not required to file reports pursuant to Section 13 of Section 15(d) of the Act. YES NO X
Indicate by check mark whether the registrant (1) has filed all reports required to be filed by Section 13 or 15(d) of the Securities Exchange Act of 1934 during the preceding 12 months (or for such shorter period that the registrant was required to file such reports), and (2) has been subject to such filing requirements for the past 90 days. YES X NO
Indicate by check mark whether the registrant has submitted electronically and posted on its corporate Web site, if any, every Interactive Data File required to be submitted and posted pursuant to Rule 405 of Regulation S-T (§232.405 of this chapter) during the preceding 12 months (or for such shorter period that the registrant was required to submit and post such files) YES X NO
Indicate by check mark if disclosure of delinquent filers pursuant to Item 405 of Regulation S-K (§229.405 of this chapter) is not contained herein, and will not be contained, to the best of registrant's knowledge, in definitive proxy or information statements incorporated by reference in Part III of this Form 10-K or any amendment to this Form 10-K. X
| Large accelerated filer | Accelerated filer |
| Non-accelerated filer | Smaller reporting company X |
Indicate by check mark whether the registrant is a shell company (as defined in Rule 12b-2 of the Act). YES NO X
As of November 30, 2014, the registrant had 7,052,036 shares of common stock issued and outstanding. The aggregate market value of the common stock held by nonaffiliates of the registrant, based on the closing sales price of the registrant's common stock as quoted on the NASDAQ Global Market on March 31, 2014, was $71.4 million (6,670,537 shares at $10.70). For purposes of this calculation, common stock held by officers and directors of the registrant was excluded.
DOCUMENTS INCORPORATED BY REFERENCE
1. Portions of Definitive Proxy Statement for the 2015 Annual Meeting of Stockholders (Part III).
TIMBERLAND BANCORP, INC.
2014 ANNUAL REPORT ON FORM 10-K
TABLE OF CONTENTS
PART I . | Page | |||
| Item 1. | Business |
| |
|
|
| General | 3 |
|
|
| Corporate Overview | 3 |
|
|
| Market Area | 4 |
|
|
| Lending Activities | 5 |
|
|
| Investment Activities | 21 |
|
|
| Deposit Activities and Other Sources of Funds | 22 |
|
|
| Bank Owned Life Insurance | 25 |
|
|
| How We Are Regulated | 25 |
|
|
| Taxation | 33 |
|
|
| Competition | 33 |
|
|
| Subsidiary Activities | 33 |
|
|
| Personnel | 33 |
|
|
| Executive Officers of the Registrant | 33 |
| Item 1A. | Risk Factors | 34 | |
| Item 1B. | Unresolved Staff Comments | 45 | |
| Item 2. | Properties | 45 | |
| Item 3. | Legal Proceedings | 46 | |
| Item 4. | Mine Safety Disclosures | 46 | |
PART II. |
| |||
| Item 5. | Market for Registrant's Common Equity, Related Stockholder Matters and Issuer Purchases of Equity Securities | 47 | |
| Item 6. | Selected Financial Data | 49 | |
| Item 7. | Management's Discussion and Analysis of Financial Condition and Results of Operations | 51 | |
|
|
| General | 51 |
|
|
| Special Note Regarding Forward-Looking Statements | 51 |
|
|
| Critical Accounting Policies and Estimates | 52 |
|
|
| New Accounting Pronouncements | 53 |
|
|
| Operating Strategy | 53 |
|
|
| Market Risk and Asset and Liability Management | 55 |
|
|
| Comparison of Financial Condition at September 30, 2014 and September 30, 2013 | 56 |
|
|
| Comparison of Operating Results for Years Ended September 30, 2014 and 2013 | 58 |
|
|
| Comparison of Operating Results for Years Ended September 30, 2013 and 2012 | 60 |
|
|
| Average Balances, Interest and Average Yields/Cost | 62 |
|
|
| Rate/Volume Analysis | 64 |
|
|
| Liquidity and Capital Resources | 64 |
|
|
| Effect of Inflation and Changing Prices | 65 |
| Item 7A. | Quantitative and Qualitative Disclosures About Market Risk | 66 | |
| Item 8. | Financial Statements and Supplementary Data | 66 | |
| Item 9. | Changes in and Disagreements With Accountants on Accounting and Financial Disclosure | 125 | |
| Item 9A. | Controls and Procedures | 125 | |
| Item 9B. | Other Information | 126 | |
PART III. | 126 | |||
| Item 10. | Directors, Executive Officers and Corporate Governance | 126 | |
| Item 11. | Executive Compensation | 126 | |
| Item 12. | Security Ownership of Certain Beneficial Owners and Management and Related Stockholder Matters | 126 | |
| Item 13. | Certain Relationships and Related Transactions, and Director Independence | 127 | |
| Item 14. | Principal Accounting Fees and Services | 127 | |
PART IV. |
| |||
| Item 15. | Exhibits and Financial Statement Schedules | 128 | |
As used throughout this report, the terms "we," "our," or "us," refer to Timberland Bancorp, Inc. and its consolidated subsidiary, unless the context otherwise requires.
2
PART I
Item 1. Business
General
Timberland Bancorp, Inc. ("Timberland Bancorp", or the "Company"), a Washington corporation, was organized on September 8, 1997 for the purpose of becoming the holding company for Timberland Savings Bank, SSB ("Bank") upon the Bank's conversion from a Washington-chartered mutual savings bank to a Washington-chartered stock savings bank ("Conversion"). The Conversion was completed on January 12, 1998 through the sale and issuance of 13,225,000 shares of common stock by the Company. At September 30, 2014 , on a consolidated basis, the Company had total assets of $745.6 million , total deposits of $ 615.1 million and total shareholders' equity of $ 82.8 million . The Company's business activities generally are limited to passive investment activities and oversight of its investment in the Bank. Accordingly, the information set forth in this report, including consolidated financial statements and related data, relates primarily to the Bank and its subsidiary, Timberland Service Corporation.
The Bank was established in 1915 as "Southwest Washington Savings and Loan Association." In 1935, the Bank converted from a state-chartered mutual savings and loan association to a federally chartered mutual savings and loan association, and in 1972, changed its name to "Timberland Federal Savings and Loan Association." In 1990, the Bank converted to a federally chartered mutual savings bank under the name "Timberland Savings Bank, FSB." In 1991, the Bank converted to a Washington-chartered mutual savings bank and changed its name to "Timberland Savings Bank, SSB." On December 29, 2000, the Bank changed its name to "Timberland Bank." The Bank's deposits are insured up to applicable legal limits by the Federal Deposit Insurance Corporation ("FDIC"). The Bank has been a member of the Federal Home Loan Bank ("FHLB") System since 1937. The Bank is regulated by the Washington Department of Financial Institutions, Division of Banks ("Division" or "DFI") and the FDIC.
The Bank is a community-oriented bank which has traditionally offered a variety of savings products to its retail customers while concentrating its lending activities on real estate mortgage loans and commercial business loans. Lending activities have historically been focused primarily on the origination of loans secured by real estate, including construction and land development, one- to four-family residential, multi-family, commercial real estate and land loans. During the past several years, the Bank adjusted its lending strategy and began reducing its exposure to speculative construction and land development lending.
The Company maintains a website at www.timberlandbank.com . The information contained on that website is not included as a part of, or incorporated by reference into, this Annual Report on Form 10-K. Other than an investor's own internet access charges, the Company makes available free of charge through that website the Company's Annual Report on Form 10-K, quarterly reports on Form 10-Q and current reports on Form 8-K, and amendments to these reports, as soon as reasonably practicable after these materials have been electronically filed with, or furnished to, the Securities and Exchange Commission ("SEC").
Corporate Overview
Preferred Stock Received in the Troubled Asset Relief Program ("TARP") Capital Purchase Program ("CPP"). On December 23, 2008, the Company received $16.64 million from the U.S. Treasury Department ("Treasury") as a part of the Treasury's CPP, which was established as part of the TARP. The Company sold 16,641 shares of Fixed Rate Cumulative Perpetual Preferred Stock, Series A ("Series A Preferred Stock"), with a liquidation value of $1,000 per share and a related warrant to purchase 370,899 shares of the Company's common stock at an exercise price of $6.73 per share (subject to anti-dilution adjustments) at any time through December 23, 2018. The Series A Preferred Stock paid a 5.0% dividend through December 20, 2013, the date of its redemption.
On November 13, 2012, the Company's outstanding 16,641 shares of Series A Preferred Stock were sold by the Treasury as part of its efforts to manage and recover its investments under the TARP. While the sale of these preferred shares to new owners did not result in any proceeds to the Company and did not change the Company's capital position or accounting for these shares, it did eliminate restrictions put in place by the Treasury on TARP recipients.
On June 12, 2013, the Treasury sold, to private investors, the warrant to purchase 370,899 shares of the Company's common stock. The sale of the warrant to new owners did not result in any proceeds to the Company and did not change the Company's capital position or accounting for the warrant.
During the year ended September 30, 2013, the Company purchased and retired 4,576 shares of its Series A Preferred Stock for $4.32 million; a $255,000 discount from the liquidation value. The discount from the liquidation value on the repurchased shares was recorded as an increase to retained earnings and included in net income to common shareholders in the computation
3
of net income per common share. On December 20, 2013, the Company redeemed the remaining 12,065 shares of its Series A Preferred Stock at the liquidation value of $12.07 million.
Market Area
The Bank considers Grays Harbor, Pierce, Thurston, Kitsap, King and Lewis counties, Washington as its primary market areas. The Bank conducts operations from:
• | its main office in Hoquiam (Grays Harbor County); |
• | five branch offices in Grays Harbor County (Ocean Shores, Montesano, Elma, and two branches in Aberdeen); |
• | five branch offices in Pierce County (Edgewood, Puyallup, Spanaway, Tacoma, and Gig Harbor); |
• | five branch offices in Thurston County (Olympia, Yelm, Tumwater, and two branches in Lacey); |
• | two branch offices in Kitsap County (Poulsbo and Silverdale); |
• | a branch office in King County (Auburn); and |
• | three branch offices in Lewis County (Winlock, Toledo and Chehalis). |
For additional information, see "Item 2. Properties."
Hoquiam, with a population of approximately 8,500 , is located in Grays Harbor County which is situated along Washington State's central Pacific coast. Hoquiam is located approximately 110 miles southwest of Seattle and 145 miles northwest of Portland, Oregon.
The Bank considers its primary market area to include six sub-markets: primarily rural Grays Harbor County with its historical dependence on the timber and fishing industries; Thurston and Kitsap counties with their dependence on state and federal government; Pierce and King counties with their broadly diversified economic bases; and Lewis County with its dependence on retail trade, manufacturing, industrial services and local government. Each of these markets presents operating risks to the Bank. The Bank's expansion into Pierce, Thurston, Kitsap, King and Lewis counties represents the Bank's strategy to diversify its primary market area to become less reliant on the economy of Grays Harbor County.
Grays Harbor County has a population of 71,000 according to the U.S. Census Bureau 2013 estimates and a median family income of $58,300 according to 2014 estimates from the Department of Housing and Urban Development ("HUD"). The economic base in Grays Harbor County has been historically dependent on the timber and fishing industries. Other industries that support the economic base are tourism, agriculture, shipping, transportation and technology. According to the Washington State Employment Security Department, the unemployment rate in Grays Harbor County decreased to 8.8% at September 30, 2014 from 11.0% at September 30, 2013 . The median price of a resale home in Grays Harbor County for the quarter ended September 30, 2014 increased 0.9% to $128,100 from $126,900 for the comparable prior year period. The number of home sales increased 0.7% for the quarter ended September 30, 2014 compared to the same quarter one year earlier. The Bank has six branches (including its home office) located throughout the county. The downturn in Grays Harbor County's economy and the decline in real estate values since 2008 have had a negative effect on the Bank's profitability in this market area.
Pierce County is the second most populous county in the state and has a population of 820,000 according to the U.S. Census Bureau 2013 estimates. The county's median family income is $67,000 according to 2014 HUD estimates. The economy in Pierce County is diversified with the presence of military related government employment (Joint Base Lewis-McChord), transportation and shipping employment (Port of Tacoma), and aerospace related employment (Boeing). According to the Washington State Employment Security Department, the unemployment rate for the Pierce County area decreased to 6.0% at September 30, 2014 from 7.7% at September 30, 2013 . The median price of a resale home in Pierce County for the quarter ended September 30, 2014 increased 3.0% to $235,200 from $228,300 for the comparable prior year period. The number of home sales decreased 1.2% for the quarter ended September 30, 2014 compared to the same quarter one year earlier. The Bank has five branches in Pierce County and these branches have historically been responsible for a substantial portion of the Bank's construction lending activities. The downturn in Pierce County's economy and the decline in real estate values since 2008 have had a negative effect on the Bank's profitability in this market area.
Thurston County has a population of 262,000 according to the U.S. Census Bureau 2013 estimates and a median family income of $74,200 according to 2014 HUD estimates. Thurston County is home of Washington State's capital (Olympia) and its economic base is largely driven by state government related employment. According to the Washington State Employment Security
4
Department, the unemployment rate for the Thurston County area decreased to 5.4% at September 30, 2014 from 6.7% at September 30, 2013 . The median price of a resale home in Thurston County for the quarter ended September 30, 2014 increased 4.6% to $238,700 from $228,300 for the same quarter one year earlier. The number of home sales increased 8.8% for the quarter ended September 30, 2014 compared to the same quarter one year earlier. The Bank has five branches in Thurston County. This county has historically had a stable economic base primarily attributable to the state government presence; however the downturn in Thurston County's economy and the decline in real estate values since 2008 have had a negative effect on the Bank's profitability in this market area.
Kitsap County has a population of 254,000 according to the U.S. Census Bureau 2013 estimates and a median family income of $74,000 according to 2014 HUD estimates. The Bank has two branches in Kitsap County. The economic base of Kitsap County is largely supported by military related government employment through the United States Navy. According to the Washington State Employment Security Department, the unemployment rate for the Kitsap County area decreased to 5.3% at September 30, 2014 from 6.4% at September 30, 2013 . The median price of a resale home in Kitsap County for the quarter ended September 30, 2014 increased 1.0% to $250,700 from $248,200 , for the same quarter one year earlier. The number of home sales increased 2.5% for the quarter ended September 30, 2014 compared to the same quarter one year earlier. The downturn in Kitsap County's economy and the decline in real estate values since 2008 have had a negative effect on the Bank's profitability in this market area.
King County is the most populous county in the state and has a population of 2.0 million according to the U.S. Census Bureau 2013 estimates. The Bank has one branch in King County. The county's median family income is $88,200 according to 2014 HUD estimates. King County's economic base is diversified with many industries including shipping, transportation, aerospace (Boeing), computer technology and biotech industries. According to the Washington State Employment Security Department, the unemployment rate for the King County area decreased to 4.8% at September 30, 2014 from 5.6% at September 30, 2013 . The median price of a resale home in King County for the quarter ended September 30, 2014 increased 5.5% to $462,100 from $438,000 , for the same quarter one year earlier. The number of home sales decreased 7.6% for the quarter ended September 30, 2014 compared to the same quarter one year earlier.
Lewis County has a population of 75,000 according to the U.S. Census Bureau 2013 estimates and a median family income of $58,300 according to 2014 HUD estimates. The economic base in Lewis County is supported by manufacturing, retail trade, local government and industrial services. According to the Washington State Employment Security Department, the unemployment rate in Lewis County decreased to 8.3% at September 30, 2014 from 10.5% at September 30, 2013 . The median price of a resale home in Lewis County for the quarter ended September 30, 2014 increased 9.0% to $160,000 from $146,800 , for the same quarter one year earlier. The number of home sales increased 6.3% for the quarter ended September 30, 2014 compared to the same quarter one year earlier. The Bank currently has three branches located in Lewis County. The downturn in Lewis County's economy and the decline in real estate values since 2008 have had a negative effect on the Bank's profitability in this market area.
Lending Activities
General. Historically, the principal lending activity of the Bank has consisted of the origination of loans secured by first mortgages on owner-occupied, one- to four-family residences, or by commercial real estate and loans for the construction of one- to four-family residences. During the past several years, the Bank adjusted its lending strategy and began reducing its exposure to speculative construction and land development lending as well as land loans. The Bank's net loans receivable, including loans held for sale, totaled $565.8 million at September 30, 2014 , representing 75.9% of consolidated total assets, and at that date commercial real estate, construction and land development loans (including undisbursed loans in process), and land loans were $392.4 million , or 64.6% , of total loans. Construction and land development loans, land loans and commercial real estate loans typically have higher rates of return than one- to four-family loans; however, they also present a higher degree of risk. See "-Lending Activities - Commercial Real Estate Lending," "- Lending Activities - Construction and Land Development Lending" and "- Lending Activities - Land Lending."
The Bank's internal loan policy limits the maximum amount of loans to one borrower to 20% of its capital plus surplus. According to the Washington Administrative Code, capital and surplus are defined as a bank's Tier 1 capital, Tier 2 capital and the balance of a bank's allowance for loan losses not included in the bank's Tier 2 capital as reported in the bank's call report. At September 30, 2014 , the maximum amount which the Bank could have lent to any one borrower and the borrower's related entities was approximately $17.3 million under this policy. At September 30, 2014 , the largest amount outstanding to any one borrower and the borrower's related entities was $15.5 million which was secured by commercial buildings located in Pierce and Kitsap counties. These loans were all performing according to their loan repaymen t terms at September 30, 2014 . The next largest amount outstanding to any one borrower and the borrower's related entities wa s $8.3 million. These loans were secured by commercial buildings located in Thurston County and were performing according to their loan repayment terms at September 30, 2014.
5
Loan Portfolio Analysis. The following table sets forth the composition of the Bank's loan portfolio by type of loan as of the dates indicated.
| At September 30, | |||||||||||||||||||||||||||||||||
| 2014 |
| 2013 |
| 2012 |
| 2011 |
| 2010 | |||||||||||||||||||||||||
| Amount |
| Percent |
| Amount |
| Percent |
| Amount |
| Percent |
| Amount |
| Percent |
| Amount |
| Percent | |||||||||||||||
| (Dollars in thousands) | |||||||||||||||||||||||||||||||||
Mortgage Loans: |
|
|
|
|
|
|
|
|
|
|
|
|
|
|
|
|
|
|
| |||||||||||||||
One- to four-family(1) | $ | 98,534 | |
| 16.22 | % |
| $ | 104,298 | |
| 18.00 | % |
| $ | 106,979 | |
| 18.82 | % |
| $ | 114,680 | |
| 20.47 | % |
| $ | 121,014 | |
| 21.65 | % |
Multi-family | 46,206 | |
| 7.61 | |
| 51,108 | |
| 8.82 | |
| 47,521 | |
| 8.36 | |
| 30,982 | |
| 5.53 | |
| 32,267 | |
| 5.77 | | |||||
Commercial | 294,354 | |
| 48.47 | |
| 291,297 | |
| 50.27 | |
| 256,254 | |
| 45.08 | |
| 246,037 | |
| 43.92 | |
| 208,002 | |
| 37.21 | | |||||
Construction and land development | 68,479 | |
| 11.28 | |
| 45,136 | |
| 7.79 | |
| 56,406 | |
| 9.92 | |
| 52,484 | |
| 9.37 | |
| 69,271 | |
| 12.39 | | |||||
Land | 29,589 | |
| 4.87 | |
| 31,144 | |
| 5.37 | |
| 39,655 | |
| 6.98 | |
| 49,236 | |
| 8.79 | |
| 62,999 | |
| 11.27 | | |||||
Total mortgage loans | 537,162 | |
| 88.45 | |
| 522,983 | |
| 90.25 | |
| 506,815 | |
| 89.16 | |
| 493,419 | |
| 88.08 | |
| 493,553 | |
| 88.29 | | |||||
|
|
|
|
|
|
|
|
|
|
|
|
|
|
|
|
|
|
|
| |||||||||||||||
Consumer Loans: |
| |
|
| |
|
| |
|
| |
|
| |
|
| |
|
| |
|
| |
|
| |
|
| | |||||
Home equity and second mortgage | 34,921 | |
| 5.75 | |
| 33,014 | |
| 5.70 | |
| 32,814 | |
| 5.77 | |
| 36,008 | |
| 6.43 | |
| 38,418 | |
| 6.87 | | |||||
Other | 4,699 | |
| 0.77 | |
| 5,981 | |
| 1.03 | |
| 6,183 | |
| 1.10 | |
| 8,240 | |
| 1.47 | |
| 9,086 | |
| 1.62 | | |||||
Total consumer loans | 39,620 | |
| 6.52 | |
| 38,995 | |
| 6.73 | |
| 38,997 | |
| 6.87 | |
| 44,248 | |
| 7.90 | |
| 47,504 | |
| 8.49 | | |||||
Commercial business loans | 30,559 | |
| 5.03 | |
| 17,499 | |
| 3.02 | |
| 22,588 | |
| 3.97 | |
| 22,510 | |
| 4.02 | |
| 17,979 | |
| 3.22 | | |||||
Total loans | 607,341 | |
| 100.00 | % |
| 579,477 | |
| 100.00 | % |
| 568,400 | |
| 100.00 | % |
| 560,177 | |
| 100.00 | % |
| 559,036 | |
| 100.00 | % | |||||
|
|
|
|
|
|
|
|
|
|
|
|
|
|
|
|
|
|
|
| |||||||||||||||
Less: |
| |
|
| |
|
| |
|
| |
|
| |
|
| |
|
| |
|
| |
|
| |
|
| | |||||
Undisbursed portion of construction loans in process | (29,416 | ) |
|
| |
| (18,527 | ) |
|
| |
| (16,325 | ) |
|
| |
| (18,265 | ) |
|
| |
| (17,952 | ) |
|
| | |||||
Deferred loan origination fees | (1,746 | ) |
|
| |
| (1,710 | ) |
|
| |
| (1,770 | ) |
|
| |
| (1,942 | ) |
|
| |
| (2,229 | ) |
|
| | |||||
Allowance for loan losses | (10,427 | ) |
|
| |
| (11,136 | ) |
|
| |
| (11,825 | ) |
|
| |
| (11,946 | ) |
|
| |
| (11,264 | ) |
|
| | |||||
Total loans receivable, net | $ | 565,752 | |
|
| |
| $ | 548,104 | |
|
| |
| $ | 538,480 | |
|
| |
| $ | 528,024 | |
|
| |
| $ | 527,591 | |
|
| |
______________
(1) | Includes loans held-for-sale of $899,000 , $1.9 million , $1.4 million, $4.0 million and $3.0 million at September 30, 2014 , 2013 , 2012 , 2011 and 2010 , respectively. |
6
Residential One- to Four-Family Lending . At September 30, 2014 , $98.5 million , or 16.2% , of the Bank's loan portfolio consisted of loans secured by one- to four-family residences. The Bank originates both fixed-rate loans and adjustable-rate loans.
Generally, one- to four-family fixed-rate loans and five and seven year balloon reset loans (which are loans that are originated with a fixed interest rate for the initial five or seven years, and thereafter incur one interest rate change in which the new rate remains in effect for the remainder of the loan term) are originated to meet the requirements for sale in the secondary market to the Federal Home Loan Mortgage Corporation ("Freddie Mac"). From time to time, however, a portion of these fixed-rate loans and five and seven year balloon reset loans, may be retained in the loan portfolio to meet the Bank's asset/liability management objectives. The Bank uses an automated underwriting program, which preliminarily qualifies a loan as conforming to Freddie Mac underwriting standards when the loan is originated. At September 30, 2014 , $37.7 million, or 38.3% , o f the Bank's one- to four-family loan portfolio consisted of fixed-rate and five and seven year balloon reset mortgage loans.
The Bank also offers adjustable-rate mortgage ("ARM") loans. All of the Bank's ARM loans are retained in its loan portfolio. The Bank offers several ARM products which adjust annually after an initial period ranging from one to five years and are typically subject to a limitation on the annual interest rate increase of 2% and an overall limitation of 6%. These ARM products generally are priced utilizing the weekly average yield on one year U.S. Treasury securities adjusted to a constant maturity of one year plus a margin of 2.88% to 4.00%. The Bank also offers ARM loans tied to the prime rate or to the London Inter-Bank Offered Rate ("LIBOR") indices which typically do not have periodic, or lifetime adjustment limits. Loans tied to these indices normally have margins ranging up to 3.5% . ARM loans held in the Bank's portfolio do not permit negative amortization of principal. Borrower demand for ARM loans versus fixed-rate mortgage loans is a function of the level of interest rates, the expectations of changes in the level of interest rates and the difference between the initial interest rates and fees charged for each type of loan. The relative amount of fixed-rate mortgage loans and ARM loans that can be originated at any time is largely determined by the demand for each in a competitive environment. At September 30, 2014 , $60.8 million, or 61.7%, of the Bank's one- to four- family loan portfolio consisted of ARM loans.
A portion of the Bank's ARM loans are "non-conforming" because they do not satisfy acreage limits, or various other requirements imposed by Freddie Mac. Some of these loans are also originated to meet the needs of borrowers who cannot otherwise satisfy Freddie Mac credit requirements because of personal and financial reasons ( i.e. , divorce, bankruptcy, length of time employed, etc.), and other aspects, which do not conform to Freddie Mac's guidelines. Such borrowers may have higher debt-to-income ratios, or the loans are secured by unique properties in rural markets for which there are no sales of comparable properties to support the value according to secondary market requirements. These loans are known as non-conforming loans and the Bank may require additional collateral or lower loan-to-value ratios to reduce the risk of these loans. The Bank believes that these loans satisfy a need in its local market area. As a result, subject to market conditions, the Bank intends to continue to originate these types of loans.
The retention of ARM loans in the Bank's loan portfolio helps reduce the Bank's exposure to changes in interest rates. There are, however, unquantifiable credit risks resulting from the potential of increased interest to be paid by the customer as a result of increases in interest rates. It is possible that during periods of rising interest rates the risk of default on ARM loans may increase as a result of repricing and the increased costs to the borrower. The Bank attempts to reduce the potential for delinquencies and defaults on ARM loans by qualifying the borrower based on the borrower's ability to repay the ARM loan assuming that the maximum interest rate that could be charged at the first adjustment period remains constant during the loan term. Another consideration is that although ARM loans allow the Bank to increase the sensitivity of its asset base due to changes in the interest rates, the extent of this interest sensitivity is limited by the periodic and lifetime interest rate adjustment limits. Because of these considerations, the Bank has no assurance that yield increases on ARM loans will be sufficient to offset increases in the Bank's cost of funds.
While fixed-rate, single-family residential mortgage loans are normally originated with 15 to 30 year terms, these loans typically remain outstanding for substantially shorter periods because borrowers often prepay their loans in full upon sale of the property pledged as security or upon refinancing the original loan. In addition, substantially all mortgage loans in the Bank's loan portfolio contain due-on-sale clauses providing that the Bank may declare the unpaid amount due and payable upon the sale of the property securing the loan. Typically, the Bank enforces these due-on-sale clauses to the extent permitted by law and as business judgment dictates. Thus, average loan maturity is a function of, among other factors, the level of purchase and sale activity in the real estate market, prevailing interest rates and the interest rates received on outstanding loans.
The Bank requires that fire and extended coverage casualty insurance be maintained on the collateral for all of its real estate secured loans and flood insurance, if appropriate.
7
The Bank's lending policies generally limit the maximum loan-to-value ratio on mortgage loans secured by owner-occupied properties to 95% of the lesser of the appraised value or the purchase price. However, the Bank usually obtains private mortgage insurance ("PMI") on the portion of the principal amount that exceeds 80% of the appraised value of the security property. The maximum loan-to-value ratio on mortgage loans secured by non-owner-occupied properties is generally 80% (90% for loans originated for sale in the secondary market to Freddie Mac). At September 30, 2014 , 21 one- to four-family loans totaling $4.4 million were on non-accrual status. See "- Lending Activities - Non-performing Loans and Delinquencies."
Construction and Land Development Lending. Prompted by unfavorable economic conditions in its primary market area in the 1980s, the Bank sought to establish a market niche and, as a result, began originating construction loans outside of Grays Harbor County. In recent periods, construction lending activities have been primarily in the Pierce, King, Thurston, Grays Harbor, and Kitsap County markets and as a result of the current economic environment, the Bank has sharply curtailed speculative construction and eliminated land development lending. At September 30, 2014 , the Bank's construction and land development loans totaled $68.5 million or 11.28% of the Bank's total loan portfolio.
The Bank currently originates three types of residential construction loans: (i) custom construction loans, (ii) owner/builder construction loans and (iii) speculative construction loans (on a limited basis). The Bank believes that its computer tracking system has enabled it to establish processing and disbursement procedures to meet the needs of its borrowers while reducing many of the risks inherent with construction lending. The Bank also originates construction loans for the development of multi-family and commercial properties. Our construction loans generally provide for the payment of interest only during the construction phase.
At September 30, 2014 and 2013, the composition of the Bank's construction and land development loan portfolio was as follows:
| At September 30, | ||||||||||||
| 2014 |
| 2013 | ||||||||||
| Outstanding Balance |
| Percent of Total |
| Outstanding Balance |
| Percent of Total | ||||||
| (Dollars in thousands) | ||||||||||||
Custom and owner/builder | $ | 59,752 | |
| 87.26 | % |
| $ | 40,811 | |
| 90.42 | % |
Speculative one-to four-family | 2,577 | |
| 3.76 | |
| 1,428 | |
| 3.16 | | ||
Multi-family (including condominium) | 2,840 | |
| 4.15 | |
| 143 | |
| 0.32 | | ||
Commercial real estate | 3,310 | |
| 4.83 | |
| 2,239 | |
| 4.96 | | ||
Land development | - | |
| - | |
| 515 | |
| 1.14 | | ||
Total | $ | 68,479 | |
| 100.00 | % |
| $ | 45,136 | |
| 100.00 | % |
Custom construction loans are made to home builders who, at the time of construction, have a signed contract with a home buyer who has a commitment to purchase the finished home. Custom construction loans are generally originated for a term of six to 12 months, with fixed interest rates currently ranging from 4.50% to 9.00% and with loan-to-value ratios of 80 % of the appraised estimated value of the completed property or sales price, whichever is less.
Owner/builder construction loans are originated to home owners rather than home builders and are typically converted to or refinanced into permanent loans at the completion of construction. The construction phase of an owner/builder construction loan generally lasts up to 12 months with fixed interest rates currently ranging from 4.50% to 9.00%, and with loan-to-value ratios of 80% (or up to 95% with PMI) of the appraised estimated value of the completed property. At the completion of construction, the loan is converted to or refinanced into either a fixed-rate mortgage loan, which conforms to secondary market standards, or an ARM loan for retention in the Bank's portfolio. At September 30, 2014, custom and owner/builder construction loans totaled $59.8 million , or 87.3% , of the total construction and land development loan portfolio. At September 30, 2014 , the largest outstanding custom and owner/builder construction loan had an outstanding balance of $1.5 million (including $14,000 of undisbursed loans in process) and was performing according to its repayment terms.
Speculative one-to four-family construction loans are made to home builders and are termed "speculative" because the home builder does not have, at the time of loan origination, a signed contract with a home buyer who has a commitment for permanent financing with either the Bank or another lender for the finished home. The home buyer may be identified either during or after the construction period, with the risk that the builder will have to debt service the speculative construction loan and finance real estate taxes and other carrying costs of the completed home for a significant time after the completion of construction until the home buyer is identified and a sale is consummated. Historically, the Bank has originated loans to approximately 50 builders
8
located in the Bank's primary market areas, each of which generally would have one to eight speculative loans outstanding from the Bank during a 12 month period. Rather than originating lines of credit to home builders to construct several homes at once, the Bank generally originates and underwrites a separate loan for each home. Speculative construction loans are generally originated for a term of 12 months, with current rates averagin g 6.00%, an d with a loan-to-value ratio of no more than 80% of the appraised estimated value of the completed property. The Bank is currently originating speculative construction loans on a limited basis. At September 30, 2014 , speculative construction loans totaled $2.6 million , or 3.8% , of the total construction and land development loan portfolio. At September 30, 2014 the largest aggregate outstanding balance to one borrower for speculative construction loans, totaled $458,000 (including $450,000 of undisbursed loans in process) and was comprised of two loans that were perform ing according to their repayment terms.
The Bank historically originated loans to real estate developers with whom it had established relationships for the purpose of developing residential subdivisions (i.e . , installing roads, sewers, water and other utilities; generally with ten to 50 lots). The Bank is not currently originating any new land development loans and at September 30, 2014 , the Bank had no la nd development loans outstanding. Land development loans were secured by a lien on the property and typically were made for a period of two to five years with fixed or variable interest rates, and were made with loan-to-value ratios generally not exceeding 75%. Land development loans were generally structured so that the Bank was repaid in full upon the sale by the borrower of approximately 80% of the subdivision lots. In addition, in the case of a corporate borrower, the Bank also generally obtained personal guarantees from corporate principals and reviewed their personal financial statements.
Land development loans secured by land under development involve greater risks than one- to four-family residential mortgage loans because these loans are advanced upon the predicted future value of the developed property upon completion. If the estimate of the future value proves to be inaccurate, in the event of default and foreclosure the Bank may be confronted with a property the value of which is insufficient to assure full repayment. The Bank has historically attempted to minimize this risk by generally limiting the maximum loan-to-value ratio on land loans to 75% of the estimated developed value of the secured property.
The Bank also provides construction financing for multi-family and commercial properties. At September 30, 2014, these loans amounted to $6.2 million , or 9.0% of construction and land development loans. These loans are typically secured by condominiums, apartment buildings, mini-storage facilities, office buildings, hotels and retail rental space predominantly located in the Bank's primary market area. At September 30, 2014 , the largest outstanding multi-family construction loan was secured by an apartment building project in Pierce County and had a balance of $ 2.4 million (including $2.3 million of undisbursed construction loan proceeds) and was performing according to its repayment terms . At September 30, 2014 , the largest outstanding commercial real estate construction loan had a balance of $1.4 million . T his loan was secured by a mixed use building being constructed in Thurston County and was performing according to its repayment terms.
All construction loans must be approved by a member of one of the Bank's Loan Committees or the Bank's Board of Directors, or in the case of one- to four-family construction loans meeting Freddie Mac guidelines, by a qualified Bank underwriter. See "- Lending Activities - Loan Solicitation and Processing." Prior to preliminary approval of any construction loan application, an independent fee appraiser inspects the site and the Bank reviews the existing or proposed improvements, identifies the market for the proposed project and analyzes the pro-forma data and assumptions on the project. In the case of a speculative or custom construction loan, the Bank reviews the experience and expertise of the builder. After preliminary approval has been given, the application is processed, which includes obtaining credit reports, financial statements and tax returns on the borrowers and guarantors, an independent appraisal of the project, and any other expert reports necessary to evaluate the proposed project. In the event of cost overruns, the Bank generally requires that the borrower increase the funds available for construction by depositing its own funds into a secured savings account, the proceeds of which are used to pay construction costs.
Loan disbursements during the construction period are made to the builder, materials supplier or subcontractor, based on a line item budget. Periodic on-site inspections are made by qualified independent inspectors to document the reasonableness of draw requests. For most builders, the Bank disburses loan funds by providing vouchers to borrowers, which when used by the borrower to purchase supplies are submitted by the supplier to the Bank for payment.
The Bank originates construction loan applications primarily through customer referrals, contacts in the business community and occasionally real estate brokers seeking financing for their clients.
Construction lending affords the Bank the opportunity to achieve higher interest rates and fees with shorter terms to maturity than does its single-family permanent mortgage lending. Construction lending, however, is generally considered to involve a higher degree of risk than single-family permanent mortgage lending because of the inherent difficulty in estimating both a property's value at completion of the project and the estimated cost of the project. The nature of these loans is such that they are generally more difficult to evaluate and monitor. If the estimate of construction cost proves to be inaccurate, the Bank
9
may be required to advance funds beyond the amount originally committed to permit completion of the project. If the estimate of value upon completion proves to be inaccurate, the borrower may be confronted with a project whose value is insufficient to assure full repayment and the Bank may incur a loss. Projects may also be jeopardized by disagreements between borrowers and builders and by the failure of builders to pay subcontractors. Loans to builders to construct homes for which no purchaser has been identified carry more risk because the payoff for the loan depends on the builder's ability to sell the property prior to the time that the construction loan is due. The Bank has sought to address these risks by adhering to strict underwriting policies, disbursement procedures, and monitoring practices. The Bank's construction loans are primarily secured by properties in its primary market area, and changes in the local and state economies and real estate markets have adversely affected the Bank's construction loan portfolio.
Multi-Family Lending. At September 30, 2014 , the Bank had $46.2 million , or 7.6% of the Bank's total loan portfolio, secured by multi-family dwelling units (more than four units) located primarily in the Bank's primary market area. Multi-family loans are generally originated with variable rates of interest ranging from 2.00% to 3.50% over the one-year constant maturity U.S. Treasury Bill Index or a matched term FHLB advance, with principal and interest payments fully amortizing over terms of up to 30 years. At September 30, 2014 the Bank's largest multi-family loan had an outstanding principal balance of $7.9 mil lion and was secured by an apartment building located in Thurston County. At September 30, 2014 , this loan was performing according to its restructured repayment terms.
The maximum loan-to-value ratio for multi-family loans is generally limited to not more than 80%. The Bank generally requests its multi-family loan borrowers with loan balances in excess of $750,000 to submit financial statements and rent rolls on the properties securing such loans. The Bank also inspects such properties annually. The Bank generally imposes a minimum debt coverage ratio of approximately 1.20 for loans secured by multi-family properties.
Multi-family mortgage lending affords the Bank an opportunity to receive interest at rates higher than those generally available from one- to four- family residential lending. However, loans secured by multi-family properties usually are greater in amount, more difficult to evaluate and monitor and, therefore, may involve a greater degree of risk than one- to four-family residential mortgage loans. Because payments on loans secured by multi-family properties are often dependent on the successful operation and management of the properties, repayment of such loans may be affected by adverse conditions in the real estate market or the economy. The Bank seeks to minimize these risks by scrutinizing the financial condition of the borrower, the quality of the collateral and the management of the property securing the loan. If the borrower is other than an individual, the Bank also generally obtains personal guarantees from the principals based on a review of personal financial statements.
Commercial Real Estate Lending . Commercial real estate loans totaled $294.4 million , or 48.5% of the total loan portfolio at September 30, 2014 . The Bank originates commercial real estate loans generally at variable interest rates with principal and interest payments fully amortizing over terms of up to 30 years. These loans are secured by properties, such as restaurants, motels, mini-storage facilities, office buildings and retail/wholesale facilities, located in the Bank's primary market area. At September 30, 2014 , the largest commercial real estate loan was secured by an office building in Grays Harbor County and had a balance of $6.2 million and was performing according to its repayment terms. At September 30, 2014 , three commercial real estate loans totaling $ 1.5 million were on non-accrual status. See "- Lending Activities - Non-performing Loans and Delinquencies."
The Bank typically requires appraisals of properties securing commercial real estate loans. For loans that are less than $250,000, the Bank may use the tax assessed value and a property inspection in lieu of an appraisal. Appraisals are performed by independent appraisers designated by the Bank. The Bank considers the quality and location of the real estate, the credit history of the borrower, the cash flow of the project and the quality of management involved with the property. The Bank generally imposes a minimum debt coverage ratio of approximately 1.20 for originated loans secured by income producing commercial properties. Loan-to-value ratios on commercial real estate loans are generally limited to not more than 80%. If the borrower is other than an individual, the Bank also generally obtains personal guarantees from the principals based on a review of personal financial statements.
Commercial real estate lending affords the Bank an opportunity to receive interest at rates higher than those generally available from one- to four-family residential lending. However, loans secured by such properties usually are greater in amount, more difficult to evaluate and monitor and, therefore, involve a greater degree of risk than one- to four-family residential mortgage loans. Because payments on loans secured by commercial properties often depend upon the successful operation and management of the properties, repayment of these loans may be affected by adverse conditions in the real estate market or the economy. The Bank seeks to minimize these risks by generally limiting the maximum loan-to-value ratio to 80% and scrutinizing the financial condition of the borrower, the quality of the collateral and the management of the property securing the loan. The Bank also generally requests annual financial information and rent rolls on the subject property from the borrowers on loans over $750,000.
10
Land Lending . The Bank has historically originated loans for the acquisition of land upon which the purchaser can then build or make improvements necessary to build or to sell as improved lots. Currently the Bank is originating land loans on a limited basis. At September 30, 2014 , land loans totaled $29.6 million , or 4.9% of the Bank's total loan portfolio as compared to $31.1 million , or 5.4% of the Bank's total loan portfolio at September 30, 2013 . Land loans originated by the Bank generally have maturities of five to ten years. The largest land loan is secured by land in Grays Harbor County, had an outstanding balance of $3.7 million and was on non-accrual status at September 30, 2014 . At September 30, 2014 , nine land loans totaling $4.6 million were on non-accrual status. See "- Lending Activities - Non-performing Loans and Delinquencies."
Loans secured by undeveloped land or improved lots involve greater risks than one- to four-family residential mortgage loans because these loans are more difficult to evaluate. If the estimate of value proves to be inaccurate, in the event of default and foreclosure the Bank may be confronted with a property the value of which is insufficient to assure full repayment. The Bank attempts to minimize this risk by generally limiting the maximum loan-to-value ratio on land loans to 75%.
Consumer Lending. Consumer loans generally have shorter terms to maturity and higher interest rates than mortgage loans. Consumer loans include home equity lines of credit, second mortgage loans, savings account loans, automobile loans, boat loans, motorcycle loans, recreational vehicle loans and unsecured loans. Consumer loans are made with both fixed and variable interest rates and with varying terms. At September 30, 2014 , consumer loans amounted to $39.6 million , or 6.5% , of the Bank's total loan portfolio.
At September 30, 2014 , the largest component of the consumer loan portfolio consisted of second mortgage loans and home equity lines of credit, which totaled $34.9 million , or 5.7% of the Bank's total loan portfolio. Home equity lines of credit and second mortgage loans are made for purposes such as the improvement of residential properties, debt consolidation and education expenses, among others. The majority of these loans are made to existing customers and are secured by a first or second mortgage on residential property. The loan-to-value ratio is typically 80% or less, when taking into account both the first and second mortgage loans. Second mortgage loans typically carry fixed interest rates with a fixed payment over a term between five and 15 years. Home equity lines of credit are generally made at interest rates tied to the prime rate or the 26 week Treasury Bill. Second mortgage loans and home equity lines of credit have greater credit risk than one- to four-family residential mortgage loans because they are generally secured by mortgages subordinated to the existing first mortgage on the property, which may or may not be held by the Bank.
Consumer loans entail greater risk than do residential mortgage loans, particularly in the case of consumer loans that are unsecured or secured by rapidly depreciating assets such as automobiles. In such cases, any repossessed collateral for a defaulted consumer loan may not provide an adequate source of repayment of the outstanding loan balance as a result of the greater likelihood of damage, loss or depreciation. The remaining deficiency often does not warrant further substantial collection efforts against the borrower beyond obtaining a deficiency judgment. In addition, consumer loan collections are dependent on the borrower's continuing financial stability, and are more likely to be adversely affected by job loss, divorce, illness or personal bankruptcy. Furthermore, the application of various federal and state laws, including federal and state bankruptcy and insolvency laws, may limit the amount that can be recovered on such loans. The Bank believes that these risks are not as prevalent in the case of the Bank's consumer loan portfolio because a large percentage of the portfolio consists of second mortgage loans and home equity lines of credit that are underwritten in a manner such that they result in credit risk that is substantially similar to one- to four-family residential mortgage loans. At September 30, 2014 , consumer loans totaling $501,000 were on non-accrual status. See "- Lending Activities - Non-performing Loans and Delinquencies."
Commercial Business Lending . Commercial business loans totaled $30.6 million , or 5.0% of the loan portfolio at September 30, 2014 . Commercial business loans are generally secured by business equipment, accounts receivable, inventory or other property and are made at variable rates of interest equal to a negotiated margin above the prime rate. The Bank also generally obtains personal guarantees from the principals based on a review of personal financial statements. The largest commercial business loan had an outstanding balance of $2.0 million at September 30, 2014 and was performing according to its repayment terms. At September 30, 2014 , all commercial business loans were performing according to their repayment terms. See "- Lending Activities - Non-performing Loans and Delinquencies."
Commercial business lending generally involves greater risk than residential mortgage lending and involves risks that are different from those associated with residential and commercial real estate lending. Real estate lending is generally considered to be collateral based lending with loan amounts based on predetermined loan to collateral values and liquidation of the underlying real estate collateral is viewed as the primary source of repayment in the event of borrower default. Although commercial business loans are often collateralized by equipment, inventory, accounts receivable or other business assets, the liquidation of collateral in the event of a borrower default is often an insufficient source of repayment because accounts receivable may be uncollectible and inventories and equipment may be obsolete or of limited use, among other things. Accordingly, the repayment of a commercial
11
business loan depends primarily on the creditworthiness of the borrower (and any guarantors), while liquidation of collateral is a secondary and often insufficient source of repayment.
Loan Maturity. The following table sets forth certain information at September 30, 2014 regarding the dollar amount of loans maturing in the Bank's portfolio based on their contractual terms to maturity, but does not include scheduled payments or potential prepayments. Loans having no stated maturity and overdrafts are reported as due in one year or less.
| Within 1 Year |
| After 1 Year Through 3 Years |
| After 3 Years Through 5 Years |
| After 5 Years Through 10 Years |
| After 10 Years |
| Total | ||||||||||||
|
|
| (In thousands) | ||||||||||||||||||||
Mortgage loans: |
|
|
|
|
|
|
|
|
|
|
| ||||||||||||
One- to four-family (1) | $ | 2,941 | |
| $ | 2,790 | |
| $ | 2,511 | |
| $ | 10,923 | |
| $ | 79,369 | |
| $ | 98,534 | |
Multi-family | 3,592 | |
| 1,471 | |
| 13,979 | |
| 26,400 | |
| 764 | |
| 46,206 | | ||||||
Commercial | 13,134 | |
| 38,910 | |
| 59,367 | |
| 171,205 | |
| 11,738 | |
| 294,354 | | ||||||
Construction and land development (2) | 68,479 | |
| - | |
| - | |
| - | |
| - | |
| 68,479 | | ||||||
Land | 9,722 | |
| 11,044 | |
| 5,292 | |
| 2,664 | |
| 867 | |
| 29,589 | | ||||||
Consumer loans: |
|
|
|
|
|
|
|
|
|
|
| ||||||||||||
Home equity and second mortgage | 4,690 | |
| 4,061 | |
| 3,782 | |
| 11,858 | |
| 10,530 | |
| 34,921 | | ||||||
Other | 1,236 | |
| 393 | |
| 294 | |
| 906 | |
| 1,870 | |
| 4,699 | | ||||||
Commercial business loans | 5,395 | |
| 12,362 | |
| 6,050 | |
| 5,737 | |
| 1,015 | |
| 30,559 | | ||||||
Total | $ | 109,189 | |
| $ | 71,031 | |
| $ | 91,275 | |
| $ | 229,693 | |
| $ | 106,153 | |
| 607,341 | | |
Less: |
| |
|
| |
|
| |
|
| |
|
| |
|
| | ||||||
Undisbursed portion of construction loans in process |
| |
|
| |
|
| |
|
| |
|
| |
| (29,416 | ) | ||||||
Deferred loan origination fees |
| |
|
| |
|
| |
|
| |
|
| |
| (1,746 | ) | ||||||
Allowance for loan losses |
| |
|
| |
|
| |
|
| |
|
| |
| (10,427 | ) | ||||||
Loans receivable, net |
| |
|
| |
|
| |
|
| |
|
| |
| $ | 565,752 | | |||||
_____________
(1) | Includes $899,000 of loans held-for-sale. |
(2) | Includes construction/permanent loans that convert to permanent mortgage loans once construction is completed. |
The following table sets forth the dollar amount of all loans due after one year from September 30, 2014 , which have fixed interest rates and have floating or adjustable interest rates.
| Fixed Rates |
| Floating or Adjustable Rates |
| Total | ||||||
| (In thousands) | ||||||||||
Mortgage loans: |
|
|
|
|
| ||||||
One- to four-family (1) | $ | 35,068 | |
| $ | 60,525 | |
| $ | 95,593 | |
Multi-family | 1,328 | |
| 41,286 | |
| 42,614 | | |||
Commercial | 54,557 | |
| 226,663 | |
| 281,220 | | |||
Land | 11,631 | |
| 8,236 | |
| 19,867 | | |||
Consumer loans: |
| |
|
|
|
| | ||||
Home equity and second mortgage | 13,658 | |
| 16,573 | |
| 30,231 | | |||
Other | 3,281 | |
| 182 | |
| 3,463 | | |||
Commercial business loans | 13,656 | |
| 11,508 | |
| 25,164 | | |||
Total | $ | 133,179 | |
| $ | 364,973 | |
| $ | 498,152 | |
_____________
(1) | Includes $899,000 of loans held-for-sale. |
12
Scheduled contractual principal repayments of loans do not reflect the actual life of these assets. The average life of loans is substantially less than their contractual terms because of prepayments. In addition, due-on-sale clauses on loans generally give the Bank the right to declare loans immediately due and payable in the event, among other things, that the borrower sells the real property subject to the mortgage and the loan is not repaid. The average life of mortgage loans tends to increase when current mortgage loan interest rates are substantially higher than interest rates on existing mortgage loans and, conversely, decrease when interest rates on existing mortgage loans are substantially higher than current mortgage loan interest rates.
Loan Solicitation and Processing. Loan originations are obtained from a variety of sources, including walk-in customers, and referrals from builders and realtors. Upon receipt of a loan application from a prospective borrower, a credit report and other data are obtained to verify specific information relating to the loan applicant's employment, income and credit standing. An appraisal of the real estate offered as collateral generally is undertaken by a certified appraiser retained by the Bank.
Loan applications are initiated by loan officers and are required to be approved by an authorized loan underwriter, one of the Bank's Loan Committees or the Bank's Board of Directors. The Bank's Consumer Loan Committee consists of two underwriters, each of whom can approve one- to four-family mortgage loans and other consumer loans up to and including the current Freddie Mac single-family limit. Certain consumer loans up to and including $25,000 may be approved by individual loan officers and the Bank's Consumer Lending Department Manager and Loan Supervisor may approve consumer loans up to and including $75,000. The Bank's Commercial Loan Committee, which consists of the Bank's President, Chief Credit Administrator, Executive Vice President of Lending and Regional Manager of Community Lending, may approve commercial real estate loans and commercial business loans up to and including $1.5 million. The Bank's President, Chief Credit Administrator and Executive Vice President of Lending also have individual lending authority for loans up to and including $750,000. The Bank's Board Loan Committee, which consists of two rotating non-employee Directors and the Bank's President, may approve loans up to and including $3.0 million. Loans in excess of $3.0 million, as well as loans of any amount granted to a single borrower whose aggregate loans exceed $3.0 million, must be approved by the Bank's Board of Directors.
Loan Originations, Purchases and Sales . During the years ended September 30, 2014 , 2013 and 2012, the Bank's total gross loan originations were $185.8 million , $217.8 million and $228.3 million , respectively. Periodically, the Bank purchases participation interests in construction, commercial real estate, and multi-family loans, secured by properties generally located in Washington State, from other lenders. These purchases are underwritten to the Bank's underwriting guidelines and are without recourse to the seller other than for fraud. During the years ended September 30, 2014 , 2013 and 2012, the Bank purchased loan participation interests of $1.9 million, $43,000 and $2.0 million, respectively. See "- Lending Activities - Construction and Land Development Lending" and "- Lending Activities - Multi-Family Lending."
Consistent with its asset/liability management strategy, the Bank's policy generally is to retain in its portfolio all ARM loans originated and to sell fixed rate one- to four-family mortgage loans in the secondary market to Freddie Mac; however, from time to time, a portion of fixed-rate loans may be retained in the Bank's portfolio to meet its asset-liability objectives. Loans sold in the secondary market are generally sold on a servicing retained basis. At September 30, 2014 , the Bank's loan servicing portfolio, which is not included in the Company's consolidated financial statements, totaled $327.6 million.
The Bank also periodically sells participation interests in construction and land development loans, commercial real estate loans, and land loans to other lenders. These sales are usually made to avoid concentrations in a particular loan type or concentrations to a particular borrower. During the year ended September 30, 2014 the Bank did not sell any loan participation interests. During the 2013 and 2012 fiscal years the Bank sold loan participation interests to other lenders of $4.3 million and $3.6 million, respectively.
13
The following table shows total loans originated, purchased, sold and repaid during the periods indicated.
| Year Ended September 30, | ||||||||||
| 2014 |
| 2013 |
| 2012 | ||||||
Loans originated: | (In thousands) | ||||||||||
Mortgage loans: |
|
|
|
|
| ||||||
One- to four-family | $ | 44,015 | |
| $ | 104,879 | |
| $ | 103,887 | |
Multi-family | 701 | |
| 7,530 | |
| 20,882 | | |||
Commercial | 45,215 | |
| 50,314 | |
| 48,450 | | |||
Construction and land development | 61,246 | |
| 38,491 | |
| 39,907 | | |||
Land | 4,174 | |
| 1,853 | |
| 1,858 | | |||
Consumer | 13,143 | |
| 11,237 | |
| 8,856 | | |||
Commercial business loans | 17,273 | |
| 3,499 | |
| 4,415 | | |||
Total loans originated | 185,767 | |
| 217,803 | |
| 228,255 | | |||
|
|
|
|
|
| ||||||
Loans purchased: |
| |
|
| |
|
| | |||
Mortgage loans: |
| |
|
| |
|
| | |||
Commercial | 1,911 | |
| - | |
| - | | |||
Multi-family | - | |
| 43 | |
| 56 | | |||
Commercial business | - | |
| - | |
| 1,955 | | |||
Total loans purchased | 1,911 | |
| 43 | |
| 2,011 | | |||
Total loans originated and purchased | 187,678 | |
| 217,846 | |
| 230,266 | | |||
|
|
|
|
|
| ||||||
Loans sold: |
| |
|
| |
|
| | |||
Partial loans sold | - | |
| (4,263 | ) |
| (3,600 | ) | |||
Whole loans sold | (33,345 | ) |
| (89,352 | ) |
| (97,357 | ) | |||
Total loans sold | (33,345 | ) |
| (93,615 | ) |
| (100,957 | ) | |||
|
|
|
|
|
| ||||||
Loan principal repayments | (126,469 | ) |
| (113,154 | ) |
| (121,086 | ) | |||
Other items, net | (10,216 | ) |
| (1,453 | ) |
| 2,233 | | |||
Net increase in loans receivable | $ | 17,648 | |
| $ | 9,624 | |
| $ | 10,456 | |
Loan Origination Fees . The Bank receives loan origination fees on many of its mortgage loans and commercial business loans. Loan fees are a percentage of the loan which are charged to the borrower for funding the loan. The amount of fees charged by the Bank is generally up to 2.0% of the loan amount. Current accounting principles generally accepted in the United States of America require fees received and certain loan origination costs for originating loans to be deferred and amortized into interest income over the contractual life of the loan. Net deferred fees or costs associated with loans that are prepaid are recognized as income/expense at the time of prepayment. Unamortized deferred loan origination fees totaled $1.7 million at September 30, 2014 .
Non-performing Loans and Delinquencies. The Bank assesses late fees or penalty charges on delinquent loans of approximately 5% of the monthly loan payment amount. A majority of loan payments are due on the first day of the month; however, the borrower is given a 15 day grace period to make the loan payment. When a mortgage loan borrower fails to make a required payment when due, the Bank institutes collection procedures. A notice is mailed to the borrower 16 days after the date the payment is due. Attempts to contact the borrower by telephone generally begin on or before the 30 th day of delinquency. If a satisfactory response is not obtained, continuous follow-up contacts are attempted until the loan has been brought current. Before the 90th day of delinquency, attempts are made to establish (i) the cause of the delinquency, (ii) whether the cause is temporary, (iii) the attitude of the borrower toward repaying the debt, and (iv) a mutually satisfactory arrangement for curing the default.
If the borrower is chronically delinquent and all reasonable means of obtaining payment on time have been exhausted, foreclosure is initiated according to the terms of the security instrument and applicable law. Interest income on loans in foreclosure is reduced by the full amount of accrued and uncollected interest.
14
When a consumer loan borrower or commercial business borrower fails to make a required payment on a loan by the payment due date, the Bank institutes similar collection procedures as for its mortgage loan borrowers. All loans becoming 90 days or more past due are placed on non-accrual status, with any accrued interest reversed against interest income, unless they are well secured and in the process of collection.
The Bank's Board of Directors is informed monthly as to the status of loans that are delinquent by more than 30 days, and the status of all foreclosed and repossessed property owned by the Bank.
The following table sets forth information with respect to the Company's non-performing assets at the dates indicated.
| At September 30, | ||||||||||||||||||
| 2014 |
| 2013 |
| 2012 |
| 2011 |
| 2010 | ||||||||||
Loans accounted for on a non-accrual basis: | (Dollars in thousands) | ||||||||||||||||||
Mortgage loans: |
|
|
|
|
|
|
|
|
| ||||||||||
One- to four-family | $ | 4,376 | |
| $ | 6,985 | |
| $ | 3,382 | |
| $ | 2,150 | |
| $ | 3,691 | |
Multi-Family | - | |
| - | |
| 1,449 | |
| - | |
| - | | |||||
Commercial | 1,468 | |
| 3,435 | |
| 6,049 | |
| 6,571 | |
| 7,252 | | |||||
Construction and land development | - | |
| 659 | |
| 1,570 | |
| 3,522 | |
| 7,609 | | |||||
Land | 4,564 | |
| 2,146 | |
| 8,613 | |
| 8,935 | |
| 5,460 | | |||||
Consumer loans | 501 | |
| 385 | |
| 268 | |
| 367 | |
| 806 | | |||||
Commercial business loans | - | |
| - | |
| - | |
| 44 | |
| 46 | | |||||
|
|
|
|
|
|
|
|
|
| ||||||||||
Total | 10,909 | |
| 13,610 | |
| 21,331 | |
| 21,589 | |
| 24,864 | | |||||
|
|
|
|
|
|
|
|
|
| ||||||||||
Accruing loans which are contractually past due 90 days or more | 812 | |
| 436 | |
| 1,198 | |
| 1,754 | |
| 1,325 | | |||||
|
|
|
|
|
|
|
|
|
| ||||||||||
Total of non-accrual and 90 days past due loans | 11,721 | |
| 14,046 | |
| 22,529 | |
| 23,343 | |
| 26,189 | | |||||
|
|
|
|
|
|
|
|
|
| ||||||||||
Non-accrual investment securities | 1,101 | |
| 2,187 | |
| 2,442 | |
| 2,796 | |
| 3,390 | | |||||
|
|
|
|
|
|
|
|
|
| ||||||||||
Other real estate owned and other repossessed assets | 9,092 | |
| 11,720 | |
| 13,302 | |
| 10,811 | |
| 11,519 | | |||||
Total non-performing assets (1) | $ | 21,914 | |
| $ | 27,953 | |
| $ | 38,273 | |
| $ | 36,950 | |
| $ | 41,098 | |
|
|
|
|
|
|
|
|
|
| ||||||||||
Troubled debt restructured loans on accrual status (2) | $ | 16,804 | |
| $ | 18,573 | |
| $ | 13,410 | |
| $ | 18,166 | |
| $ | 8,995 | |
|
| |
|
| |
|
| |
|
| |
|
| | |||||
Non-accrual and 90 days or more past due loans as a percentage of loans receivable, net | 2.03 | % |
| 2.51 | % |
| 4.09 | % |
| 4.32 | % |
| 4.86 | % | |||||
|
| |
|
| |
|
| |
|
| |
|
| | |||||
Non-accrual and 90 days or more past due loans as a percentage of total assets | 1.57 | % |
| 1.88 | % |
| 3.06 | % |
| 3.16 | % |
| 3.53 | % | |||||
|
|
|
|
|
|
|
|
|
| ||||||||||
Non-performing assets as a percentage of total assets | 2.94 | % |
| 3.75 | % |
| 5.19 | % |
| 5.01 | % |
| 5.53 | % | |||||
|
|
|
|
|
|
|
|
|
| ||||||||||
Loans receivable, net (3) | $ | 576,179 | |
| $ | 559,240 | |
| $ | 550,305 | |
| $ | 539,970 | |
| $ | 538,855 | |
Total assets | $ | 745,565 | |
| $ | 745,648 | |
| $ | 736,954 | |
| $ | 738,224 | |
| $ | 742,687 | |
_______________
(1) | Does not include troubled debt restructured loans on accrual status. |
(2) | Does not include troubled debt restructured loans totaling $2.3 million , $4.0 million , $10.1 million, $7.4 million and $7.4 million reported as non-accrual loans at September 30, 2014 , 2013 , 2012 , 2011 and 2010 , respectively. |
(3) | Includes loans held-for-sale and is before the allowance for loan losses. |
15
The Bank's non-accrual loans decreased by $2.7 million to $10.9 million at September 30, 2014 from $13.6 million at September 30, 2013 , primarily as a result of a $2.6 million decrease in one- to four-family loans, a $2.0 million decrease in commercial real estate loans, and a $659,000 decrease in construction and land development loans on non-accrual status . These decreases were partially offset by a $2.4 million increase in land loans on non-accrual status, due to a single $3.7 m illion land loan secured by land in Grays Harbor County and which is also the Company's largest non-performing loan at September 30, 2014 . A discussion of our largest non-performing loans is set forth below under "Asset Classification."
Additional interest income which would have been recorded for the year ended September 30, 2014 had non-accruing loans been current in accordance with their original terms totaled $ 3.6 mil lion.
Other Real Estate Owned and Other Repossessed Assets. Real estate acquired by the Bank as a result of foreclosure or by deed-in-lieu of foreclosure is classified as other real estate owned ("OREO") until sold. When property is acquired, it is recorded at the estimated fair market value less es timat ed costs to sell. At September 30, 2014 , the Bank had $9.1 million of OREO and other repossessed assets consisti ng of 40 individual properties, a decrease of $2.6 million from $11.7 million at September 30, 2013 . T he OREO properties consisted of 21 land parcels totaling $3.8 million , four commercial real estate properties totaling $2.2 million , one multi-family property of $142,000 and 14 single family homes totaling $2.9 million . The largest OREO property at September 30, 2014 was a land development property with a balance of $1.2 m illion located in Lewis County.
Restructured Loans. Under accounting principles generally accepted in the United States of America, the Bank is required to account for certain loan modifications or restructurings as "troubled debt restructurings" or "troubled debt restructured loans." In general, the modification or restructuring of a debt constitutes a troubled debt restructuring if the Bank for economic or legal reasons related to the borrower's financial difficulties grants a concession to the borrower that the Bank would not otherwise consider. Debt restructuring or loan modifications for a borrower does not necessarily always constitute troubled debt restructuring, however, and troubled debt restructurings do not necessarily result in non-accrual loans. Troubled debt restructured loans are classified as non-performing loans unless they have been performing in accordance with modified terms for a period of least six months. The Bank had troubled debt restructured loans at September 30, 2014 and 2013, totaling $19.1 million and $22.6 million, respectively, of which $ 2.3 million and $4.0 million, respectively, were on non-accrual status. The allowance for loan losses allocated to troubled debt restructured loans at September 30, 2014 and 2013 was $973,000 and $2.4 million, respectively.
Impaired Loans. A loan is considered impaired when it is probable the Bank will be unable to collect all contractual principal and interest payments due in accordance with the original or modified terms of the loan agreement. To determine specific valuation allowances, impaired loans are measured based on the estimated fair value of the collateral less estimated cost to sell if the loan is considered collateral dependent. Impaired loans not considered to be collateral dependent are measured based on the present value of expected future cash flows.
The categories of non-accrual loans and impaired loans overlap, although they are not identical. The Bank considers all circumstances regarding the loan and borrower on an individual basis when determining whether an impaired loan should be placed on non-accrual status, such as the financial strength of the borrower, the collateral value, reasons for delay, payment record, the amount past due and the number of days past due. At September 30, 2014 , the Bank had $ 33.5 m illion in impaired loans. For additional information on impaired loans, see Note 4 of the Notes to the Consolidated Financial Statements included in Item 8 of this Annual Report on Form 10-K.
Other Loans of Concern. Loans not reflected in the table above as non-performing, but where known information about possible credit problems of borrowers causes management to have doubts as to the ability of the borrower to comply with present repayment terms and that may result in disclosure of such loans as non-performing assets in the future are commonly referred to as "other loans of concern" or "potential problem loans." The amount included in potential problem loans results from an evaluation, on a loan-by-loan basis, of loans classified as "substandard" and "special mention," as those terms are defined under "Asset Classification" below. The amount of potential problem loans (not included in the table above as non-performing) was $33.4 million at September 30, 2014 . The vast majority of these loans are collateralized by real estate. See "- Asset Classification" below for additional information regarding our problem loans.
Asset Classification. Applicable regulations require that each insured institution review and classify its assets on a regular basis. In addition, in connection with examinations of insured institutions, regulatory examiners have authority to identify problem assets and, if appropriate, require them to be classified. There are three classifications for problem assets: substandard, doubtful and loss. Substandard loans are classified as those loans that are inadequately protected by the current net worth, and paying capacity of the obligor, or of the collateral pledged. Assets classified as substandard have a well-defined weakness, or weaknesses that jeopardize the repayment of the debt. If the weakness, or weaknesses are not corrected there is the distinct possibility that some loss will be sustained. Doubtful assets have the weaknesses of substandard assets with the additional characteristic that the weaknesses make collection or liquidation in full on the basis of currently existing facts, conditions and
16
values questionable, and there is a high possibility of loss. An asset classified as loss is considered uncollectible and of such little value that continuance as an asset of the Bank is not warranted. When the Bank classifies problem assets as either substandard or doubtful, it is required to establish allowances for loan losses in an amount deemed prudent by management. These allowances represent loss allowances which have been established to recognize the inherent risk associated with lending activities and the risks associated with particular problem assets. When the Bank classifies problem assets as loss, it charges off the balance of the asset against the allowance for loan losses. Assets which do not currently expose the Bank to sufficient risk to warrant classification in one of the aforementioned categories but possess weaknesses are designated by the Bank as special mention. The Bank's determination of the classification of its assets and the amount of its valuation allowances is subject to review by the FDIC and the Division which can require the establishment of additional loss allowances.
Special mention loans are defined as those credits deemed by management to have some potential weakness that deserve management's close attention. If left uncorrected these potential weaknesses may result in the deterioration of the payment prospects of the loan. Assets in this category are not adversely classified and currently do not expose the Bank to sufficient risk to warrant a substandard classification.
The aggregate amounts of the Bank's classified and special mention loans (as determined by the Bank), and of the Bank's allowances for loan losses at the dates indicated, were as follows:
| At September 30, | ||||||||||
| 2014 |
| 2013 |
| 2012 | ||||||
| (In thousands) | ||||||||||
Loss | $ | - | |
| $ | - | |
| $ | - | |
Doubtful | - | |
| - | |
| - | | |||
Substandard (1)(2) | 18,056 | |
| 27,978 | |
| 33,082 | | |||
Special mention (1) | 27,106 | |
| 22,916 | |
| 32,944 | | |||
Total classified and special mention loans | $ | 45,162 | |
| $ | 50,894 | |
| $ | 66,026 | |
|
|
|
|
|
| ||||||
Allowance for loan losses | $ | 10,427 | |
| $ | 11,136 | |
| $ | 11,825 | |
_____________
(1) | For further information concerning the change in classified assets, see "- Lending Activities - Non-performing Loans and Delinquencies." |
(2) | Includes non-performing loans. |
Loans classified as special mention increased by $4.2 million to $27.1 million at September 30, 2014 from $22.9 million at September 30, 2013, primarily as a result of loans being upgraded from substandard to special mention during the year ended September 30, 2014 . Eleven individual loans comprised $21.8 million, or 80.6%, of the $27.1 million in loans classified as special mention at September 30, 2014. They include six commercial real estate loans totaling $14.2 million, three multi-family loans totaling $5.7 million and two land loans totaling $1.9 million. All of these loans were current and paying in accordance with their required loan repayment terms at September 30, 2014, except for one commercial real estate loan with a balance of $812,000 that was 90 days past due and still accruing interest.
Loans classified as substandard decreas ed by $9.9 mi llion to $18.1 million at September 30, 2014 from $28.0 million at September 30, 2013 . At September 30, 2014 , 51 lo ans were classified as substandard compared to 84 loans at September 30, 2013 . Of the $18.1 million in loans classified as substandard at September 30, 2014 , $10.9 million were on non-accrual status. The largest loan classified as substandard at September 30, 2014 had a balance of $3.7 million and was secured by ocean front land in Grays Harbor County. This loan was on non-accrual status at September 30, 2014 . The next largest loan classified as substandard at September 30, 2014 had a balance of $2.4 million and was secured by a mini-storage facility in King County. This loan was performing according to its restructured loan repayment terms at September 30, 2014 .
Allowance for Loan Losses. The allowance for loan losses is maintained to absorb estimated losses in the loan portfolio. The Bank has established a comprehensive methodology for the determination of provisions for loan losses that takes into consideration the need for an overall general valuation allowance. The Bank's methodology for assessing the adequacy of its allowance for loan losses is based on its historic loss experience for various loan segments; adjusted for changes in economic conditions, delinquency rates, and other factors. Using these loss estimate factors, management develops a range of probable loss for each loan category. Certain individual loans for which full collectibility may not be assured are evaluated individually with loss exposure based on estimated discounted cash flows or net realizable collateral values. The total estimated range of loss based
17
on these two components of the analysis is compared to the loan loss allowance balance. Based on this review, management will adjust the allowance as necessary.
In originating loans, the Bank recognizes that losses will be experienced and that the risk of loss will vary with, among other things, the type of loan being made, the creditworthiness of the borrower over the term of the loan, general economic conditions and, in the case of a secured loan, the quality of the security for the loan. The Bank increases its allowance for loan losses by charging provisions for loan losses against the Bank's operations.
The Board of Directors reviews the adequacy of the allowance for loan losses at least quarterly based on management's assessment of current economic conditions, past loss and collection experience, and risk characteristics of the loan portfolio.
At September 30, 2014 , the Bank's allowance for loan losses total ed $10.4 million . The Bank's allowance for loan losses as a percentage of total loans receivable and non-performing loans was 1.81% and 88.96%, respectively, at September 30, 2014 and 1.99% and 79.28%, respectively, at September 30, 2013.
Management believes that the amount maintained in the allowance is adequate to absorb probable losses in the portfolio. Although management believes that it uses the best information available to make its determinations, future adjustments to the allowance for loan losses may be necessary and results of operations could be significantly and adversely affected if circumstances differ substantially from the assumptions used in making the determinations.
While the Bank believes it has established its existing allowance for loan losses in accordance with accounting principles generally accepted in the United States of America, there can be no assurance that regulators, in reviewing the Bank's loan portfolio, will not request the Bank to increase significantly its allowance for loan losses. In addition, because future events affecting borrowers and collateral cannot be predicted with certainty, there can be no assurance that the existing allowance for loan losses is adequate or that substantial increases will not be necessary should the quality of any loans deteriorate as a result of the factors discussed above. Any material increase in the allowance for loan losses may adversely affect the Bank's financial condition and results of operations.
18
The following table sets forth an analysis of the Bank's allowance for loan losses for the periods indicated.
| Year Ended September 30, | ||||||||||||||||||||||
| 2014 |
| 2013 |
| 2012 |
| 2011 |
| 2010 | ||||||||||||||
| (Dollars in thousands) | ||||||||||||||||||||||
Allowance at beginning of year | $ | 11,136 | |
| $ | 11,825 | |
| $ | 11,946 | |
| $ | 11,264 | |
| $ | 14,172 | | ||||
Provision for loan losses | - | |
| 2,925 | |
| 3,500 | |
| 6,758 | |
| 10,550 | | |||||||||
|
|
|
|
|
|
|
|
|
| ||||||||||||||
Recoveries : |
| |
|
| |
|
| |
|
| |
|
| | |||||||||
Mortgage loans: |
| |
|
| |
|
| |
|
| |
|
| | |||||||||
One- to four-family | 194 | |
| 95 | |
| 74 | |
| 151 | |
| - | | |||||||||
Multi-family | - | |
| - | |
| 14 | |
| 41 | |
| - | | |||||||||
Commercial | 4 | |
| 55 | |
| - | |
| - | |
| 13 | | |||||||||
Construction | 538 | |
| 172 | |
| 505 | |
| 109 | |
| 104 | | |||||||||
Land | 418 | |
| 54 | |
| 97 | |
| 46 | |
| 153 | | |||||||||
Consumer loans: |
| |
|
| |
|
| |
|
| |
|
| | |||||||||
Home equity and second mortgage | 7 | |
| 5 | |
| 14 | |
| 42 | |
| 86 | | |||||||||
Other | 2 | |
| - | |
| - | |
| 2 | |
| 6 | | |||||||||
Commercial business loans | 24 | |
| 105 | |
| 2 | |
| 1 | |
| - | | |||||||||
Total recoveries | 1,187 | |
| 486 | |
| 706 | |
| 392 | |
| 362 | | |||||||||
|
|
|
|
|
|
|
|
|
| ||||||||||||||
Charge-offs : |
| |
|
| |
|
| |
|
| |
|
| | |||||||||
Mortgage loans: |
| |
|
| |
|
| |
|
| |
|
| | |||||||||
One- to four-family | 1,106 | |
| 769 | |
| 276 | |
| 543 | |
| 200 | | |||||||||
Multi-family | - | |
| - | |
| 14 | |
| - | |
| - | | |||||||||
Commercial | 463 | |
| 667 | |
| 1,215 | |
| 47 | |
| 1,888 | | |||||||||
Construction | - | |
| 159 | |
| 885 | |
| 3,972 | |
| 8,012 | | |||||||||
Land | 260 | |
| 2,307 | |
| 1,251 | |
| 1,704 | |
| 3,285 | | |||||||||
Consumer loans: |
| |
|
| |
|
| |
|
| |
|
| | |||||||||
Home equity and second mortgage | 47 | |
| 184 | |
| 232 | |
| 150 | |
| 399 | | |||||||||
Other | 6 | |
| 14 | |
| 24 | |
| 30 | |
| 36 | | |||||||||
Commercial business loans | 14 | |
| - | |
| 430 | |
| 22 | |
| - | | |||||||||
Total charge-offs | 1,896 | |
| 4,100 | |
| 4,327 | |
| 6,468 | |
| 13,820 | | |||||||||
Net charge-offs | 709 | |
| 3,614 | |
| 3,621 | |
| 6,076 | |
| 13,458 | | |||||||||
|
|
|
|
|
|
|
|
|
| ||||||||||||||
Allowance at end of year | $ | 10,427 | | - | | $ | 11,136 | | - | | $ | 11,825 | | - | | $ | 11,946 | | - | | $ | 11,264 | |
|
|
|
|
|
|
|
|
|
| ||||||||||||||
Allowance for loan losses as a percentage of total loans receivable (net) outstanding at the end of the year (1) | 1.81 | % |
| 1.99 | % |
| 2.15 | % |
| 2.21 | % |
| 2.09 | % | |||||||||
|
| |
|
| |
|
| |
|
|
|
| | ||||||||||
Net charge-offs as a percentage of average loans outstanding during the year | 0.12 | % |
| 0.65 | % |
| 0.66 | % |
| 1.13 | % |
| 2.45 | % | |||||||||
|
| |
|
| |
|
| |
|
| |
|
| | |||||||||
Allowance for loan losses as a percentage of non-performing loans at end of year | 88.96 | % |
| 79.28 | % |
| 52.48 | % |
| 51.18 | % |
| 43.01 | % | |||||||||
______________
(1) | Total loans receivable (net) includes loans held for sale and is before the allowance for loan losses. |
19
The following table sets forth the allocation of the allowance for loan losses by loan category at the dates indicated.
| At September 30, | |||||||||||||||||||||||||||||||||
| 2014 |
| 2013 |
| 2012 |
| 2011 |
| 2010 | |||||||||||||||||||||||||
| Amount |
| Percent of Loans in Category to Total Loans |
| Amount |
| Percent of Loans in Category to Total Loans |
| Amount |
| Percent of Loans in Category to Total Loans |
| Amount |
| Percent of Loans in Category to Total Loans |
| Amount |
| Percent of Loans in Category to Total Loans | |||||||||||||||
| (Dollars in thousands) | |||||||||||||||||||||||||||||||||
Mortgage loans: |
|
|
|
|
|
|
|
|
|
|
|
|
|
|
|
|
|
|
| |||||||||||||||
One- to four-family | $ | 1,650 | |
| 16.22 | % |
| $ | 1,449 | |
| 18.00 | % |
| $ | 1,558 | |
| 18.82 | % |
| $ | 760 | |
| 20.47 | % |
| $ | 530 | |
| 21.65 | % |
Multi-family | 387 | |
| 7.61 | |
| 749 | |
| 8.82 | |
| 1,156 | |
| 8.36 | |
| 1,076 | |
| 5.53 | |
| 392 | |
| 5.77 | | |||||
Commercial | 4,836 | |
| 48.47 | |
| 5,275 | |
| 50.27 | |
| 4,247 | |
| 45.08 | |
| 4,035 | |
| 43.92 | |
| 3,173 | |
| 37.21 | | |||||
Construction and land development | 605 | |
| 11.28 | |
| 414 | |
| 7.79 | |
| 943 | |
| 9.92 | |
| 1,618 | |
| 9.37 | |
| 1,626 | |
| 12.39 | | |||||
Land | 1,434 | |
| 4.87 | |
| 1,940 | |
| 5.37 | |
| 2,392 | |
| 6.98 | |
| 2,795 | |
| 8.79 | |
| 3,709 | |
| 11.27 | | |||||
Non-mortgage loans: |
|
|
| |
|
| |
|
|
|
| |
|
| |
|
| |
|
| |
|
| |
|
| | |||||||
Consumer loans | 1,055 | |
| 6.52 | |
| 982 | |
| 6.73 | |
| 1,013 | |
| 6.87 | |
| 875 | |
| 7.90 | |
| 461 | |
| 8.49 | | |||||
Commercial business loans | 460 | |
| 5.03 | |
| 327 | |
| 3.02 | |
| 516 | |
| 3.97 | |
| 787 | |
| 4.02 | |
| 1,373 | |
| 3.22 | | |||||
Total allowance for loan losses | $ | 10,427 | |
| 100.00 | % |
| $ | 11,136 | |
| 100.00 | % |
| $ | 11,825 | |
| 100.00 | % |
| $ | 11,946 | |
| 100.00 | % |
| $ | 11,264 | |
| 100.00 | % |
20
Investment Activities
The investment policies of the Bank are established and monitored by the Board of Directors. The policies are designed primarily to provide and maintain liquidity, to generate a favorable return on investments without incurring undue interest rate and credit risk, and to compliment the Bank's lending activities. These policies dictate the criteria for classifying securities as either available-for-sale or held-to-maturity. The policies permit investment in various types of liquid assets permissible under applicable regulations, which includes U.S. Treasury obligations, securities of various federal agencies, certain certificates of deposit of insured banks, banker's acceptances, federal funds, mortgage-backed securities, and mutual funds. The Company's investment policy also permits investment in equity securities in certain financial service companies.
At September 30, 2014 , the Bank's investment portfolio totaled $8.2 million , primarily consisting of $1.9 million of mortgage-backed securities available-for-sale, $958,000 of mutual funds available-for-sale, $2.3 million of mortgage-backed securities held-to-maturity and $3.0 million of U.S. Agency securities held-to-maturity. The Bank does not maintain a trading account for any investments. This compares with a total investment portfolio of $6.8 million at September 30, 2013, primarily consisting of $3.1 million of mortgage-backed securities available-for-sale, $958,000 of mutual funds available-for-sale, and $2.7 million of mortgage-backed securities held-to-maturity. The composition of the portfolios by type of security, at the dates indicated is presented in the following table.
| At September 30, | |||||||||||||||||||
| 2014 |
| 2013 |
| 2012 | |||||||||||||||
| Recorded Amount |
| Percent of Total |
| Recorded Amount |
| Percent of Total |
| Recorded Amount |
| Percent of Total | |||||||||
| (Dollars in thousands) | |||||||||||||||||||
Held-to-Maturity: |
|
|
|
|
|
|
|
|
|
|
| |||||||||
|
|
|
|
|
|
|
|
|
|
|
| |||||||||
U.S. agency securities | $ | 3,016 | |
| 36.98 | % |
| $ | 14 | |
| 0.20 | % |
| $ | 27 | |
| 0.33 | % |
Mortgage-backed securities | 2,282 | |
| 27.98 | |
| 2,723 | |
| 39.82 | |
| 3,312 | |
| 39.98 | | |||
|
|
|
|
|
|
|
|
|
|
|
| |||||||||
Available-for-Sale: |
| |
|
| |
|
| |
|
| |
|
| |
|
| | |||
|
|
|
|
|
|
|
|
|
|
|
| |||||||||
Mortgage-backed securities | 1,899 | |
| 23.29 | |
| 3,143 | |
| 45.97 | |
| 3,932 | |
| 47.46 | | |||
Mutual funds | 958 | |
| 11.75 | |
| 958 | |
| 14.01 | |
| 1,013 | |
| 12.23 | | |||
|
|
|
|
|
|
|
|
|
|
|
| |||||||||
Total portfolio | $ | 8,155 | |
| 100.00 | % |
| $ | 6,838 | |
| 100.00 | % |
| $ | 8,284 | |
| 100.00 | % |
The following table sets forth the maturities and weighted average yields of the securities in the Bank's portfolio at September 30, 2014 . Mutual funds, which by their nature do not have maturities, are classified in the one year or less category.
| One Year or Less |
| After One to Five Years |
| After Five to Ten Years |
| After Ten Years | ||||||||||||||||||||
| Amount |
| Yield |
| Amount |
| Yield |
| Amount |
| Yield |
| Amount |
| Yield | ||||||||||||
| (Dollars in thousands) | ||||||||||||||||||||||||||
Held-to-Maturity: |
|
|
|
|
|
|
|
|
|
|
|
|
|
|
| ||||||||||||
|
|
|
|
|
|
|
|
|
|
|
|
|
|
|
| ||||||||||||
U.S. agency securities | $ | - | |
| - | % |
| $ | 3,016 | |
| 1.74 | % |
| $ | - | |
| - | % |
| $ | - | |
| - | % |
Mortgage-backed securities | - | |
| - | |
| 4 | |
| 4.61 | |
| 16 | |
| 3.08 | |
| 2,262 | |
| 5.28 | | ||||
|
|
|
|
|
|
|
|
|
|
|
|
|
|
|
| ||||||||||||
Available-for-Sale: |
| |
|
| |
|
| |
|
| |
|
| |
|
| |
|
| |
|
| | ||||
|
|
|
|
|
|
|
|
|
|
|
|
|
|
|
| ||||||||||||
Mortgage-backed securities | - | |
| - | |
| 19 | |
| 5.77 | |
| 34 | |
| 2.30 | |
| 1,846 | |
| 3.04 | | ||||
Mutual funds | 958 | |
| 2.41 | |
| - | |
| - | |
| - | |
| - | |
| - | |
| - | | ||||
|
|
|
|
|
|
|
|
|
|
|
|
|
|
|
| ||||||||||||
Total portfolio | $ | 958 | |
| 2.41 | % |
| $ | 3,039 | |
| 1.77 | % |
| $ | 50 | |
| 2.55 | % |
| $ | 4,108 | |
| 4.27 | % |
There were no securities which had an aggregate book value in excess of 10% of the Bank's total equity at September 30, 2014 . At September 30, 2014 , the Bank had $1.3 million of private label mortgage-backed securities of which $1.1 million were on non-accrual status. For additional information regarding investment securities, see "Item 1A. Risk Factors – Other-than-
21
temporary impairment charges in our investment securities portfolio could result in additional losses" and Note 3 of the Notes to the Consolidated Financial Statements included in Item 8 of this Annual Report on Form 10-K.
Deposit Activities and Other Sources of Funds
General . Deposits and loan repayments are the major sources of the Bank's funds for lending and other investment purposes. Scheduled loan repayments are a relatively stable source of funds, while deposit inflows and outflows and loan prepayments are influenced significantly by general interest rates and money market conditions. Borrowings through the FHLB-Seattle and the FRB may be used to compensate for reductions in the availability of funds from other sources.
Deposit Accounts . Substantially all of the Bank's depositors are residents of Washington. Deposits are attracted from within the Bank's market area through the offering of a broad selection of deposit instruments, including money market deposit accounts, checking accounts, regular savings accounts and certificates of deposit. Deposit account terms vary, according to the minimum balance required, the time periods the funds must remain on deposit and the interest rate, among other factors. In determining the terms of its deposit accounts, the Bank considers current market interest rates, profitability to the Bank, matching deposit and loan products and its customer preferences and concerns. The Bank actively seeks consumer and commercial checking accounts through checking account acquisition marketing programs. At September 30, 2014 , the Bank had 43.4% of total deposits in non-interest bearing accounts and NOW checking accounts.
At September 30, 2014 the Bank had $66.7 million of jumbo certificates of deposit of $100,000 or more. The Bank also had brokered certificates of deposit totaling $3.2 million at September 30, 2014 . The Bank believes that its jumbo certificates of deposit, which represented 10.8% of total deposits at September 30, 2014 , present similar interest rate risks as compared to its other deposits.
The following table sets forth information concerning the Bank's deposits at September 30, 2014 .
Category |
| Weighted Interest Rate |
| Amount |
| Percentage Deposits | ||||
|
| (In thousands) | ||||||||
Non-interest bearing |
| - | % |
| $ | 106,417 | |
| 17.30 | % |
Negotiable order of withdrawal ("NOW") checking |
| 0.28 | |
| 160,748 | |
| 26.13 | | |
Savings |
| 0.05 | |
| 95,665 | |
| 15.55 | | |
Money market |
| 0.26 | |
| 88,999 | |
| 14.47 | | |
Subtotal |
| 0.21 | |
| 451,829 | |
| 73.45 | | |
|
|
|
|
|
|
| ||||
Certificates of Deposit(1) |
|
| |
|
| |
|
| | |
|
|
|
|
|
|
| ||||
Maturing within 1 year |
| 0.54 | |
| 98,503 | |
| 16.01 | | |
Maturing after 1 year but within 2 years |
| 1.02 | |
| 32,746 | |
| 5.32 | | |
Maturing after 2 years but within 5 years |
| 1.26 | |
| 30,581 | |
| 4.97 | | |
Maturing after 5 years |
| 1.51 | |
| 1,457 | |
| 0.25 | | |
Total certificates of deposit |
| 0.81 | |
| 163,287 | |
| 26.55 | | |
Total deposits |
| 0.34 | % |
| $ | 615,116 | |
| 100.00 | % |
______________________
(1) | Based on remaining maturity of certificates. |
22
The following table indicates the amount of the Bank's jumbo certificates of deposit by time remaining until maturity as of September 30, 2014 . Jumbo certificates of deposit have principal balances of $100,000 or more and the rates paid on these accounts are generally negotiable.
Maturity Period |
| Amount | ||
|
| (In thousands) | ||
|
|
| ||
Three months or less |
| $ | 6,727 | |
Over three through six months |
| 12,417 | | |
Over six through twelve months |
| 16,843 | | |
Over twelve months |
| 30,676 | | |
Total |
| $ | 66,663 | |
Deposit Flow. The following table sets forth the balances of deposits in the various types of accounts offered by the Bank at the dates indicated.
| At September 30, | |||||||||||||||||||||||||||
| 2014 |
| 2013 |
| 2012 | |||||||||||||||||||||||
| Amount |
| Percent of Total |
| Increase (Decrease) |
| Amount |
| Percent of Total |
| Increase (Decrease) |
| Amount |
| Percent of Total | |||||||||||||
| (Dollars in thousands) | |||||||||||||||||||||||||||
Non-interest-bearing | $ | 106,417 | |
| 17.30 | % |
| $ | 18,760 | |
| $ | 87,657 | |
| 14.41 | % |
| $ | 12,361 | |
| $ | 75,296 | |
| 12.60 | % |
NOW checking | 160,748 | |
| 26.13 | |
| 4,648 | |
| 156,100 | |
| 25.66 | |
| 5,961 | |
| 150,139 | |
| 25.11 | | |||||
Savings | 95,665 | |
| 15.55 | |
| 4,316 | |
| 91,349 | |
| 15.02 | |
| 3,856 | |
| 87,493 | |
| 14.63 | | |||||
Money market | 88,999 | |
| 14.47 | |
| (10,007 | ) |
| 99,006 | |
| 16.28 | |
| 19,457 | |
| 79,549 | |
| 13.30 | | |||||
Certificates of deposit which mature: |
| |
|
| |
|
| |
|
| |
|
| |
|
| |
|
| |
|
| | |||||
Within 1 year | 98,503 | |
| 16.01 | |
| (12,977 | ) |
| 111,480 | |
| 18.33 | |
| (20,175 | ) |
| 131,655 | |
| 22.02 | | |||||
After 1 year, but within 2 years | 32,746 | |
| 5.32 | |
| 2,796 | |
| 29,950 | |
| 4.92 | |
| (8,647 | ) |
| 38,597 | |
| 6.46 | | |||||
After 2 years, but within 5 years | 30,581 | |
| 4.97 | |
| (772 | ) |
| 31,353 | |
| 5.15 | |
| (3,704 | ) |
| 35,057 | |
| 5.86 | | |||||
Certificates maturing thereafter | 1,457 | |
| 0.25 | |
| 90 | |
| 1,367 | |
| 0.23 | |
| 1,227 | |
| 140 | |
| 0.02 | | |||||
|
|
|
|
|
|
|
|
|
|
|
|
|
|
|
| |||||||||||||
Total | $ | 615,116 | |
| 100.0 | % |
| $ | 6,854 | |
| $ | 608,262 | |
| 100.0 | % |
| $ | 10,336 | |
| $ | 597,926 | |
| 100.00 | % |
Certificates of Deposit by Rates. The following table sets forth the certificates of deposit in the Bank classified by rates as of the dates indicated.
| At September 30, | ||||||||||
| 2014 |
| 2013 |
| 2012 | ||||||
| (In thousands) | ||||||||||
0.00 - 1.99% | $ | 145,098 | |
| $ | 149,120 | |
| $ | 174,456 | |
2.00 - 3.99% | 16,776 | |
| 24,759 | |
| 30,552 | | |||
4.00 - 5.99% | 1,413 | |
| 271 | |
| 441 | | |||
Total | $ | 163,287 | |
| $ | 174,150 | |
| $ | 205,449 | |
23
Certificates of Deposit by Maturities. The following table sets forth the amount and maturities of certificates of deposit at September 30, 2014 .
| Amount Due | ||||||||||||||||||
| Less Than One Year |
| One to Two Years |
| After Two to Five Years |
| After Five Years |
| Total | ||||||||||
| (In thousands) | ||||||||||||||||||
0.00 - 1.99% | $ | 90,405 | |
| $ | 24,050 | |
| $ | 29,413 | |
| $ | 1,230 | |
| $ | 145,098 | |
2.00 - 3.99% | 6,945 | |
| 8,696 | |
| 908 | |
| 227 | |
| 16,776 | | |||||
4.00 - 5.99% | 1,153 | |
| - | |
| 260 | |
| - | |
| 1,413 | | |||||
Total | $ | 98,503 | |
| $ | 32,746 | |
| $ | 30,581 | |
| $ | 1,457 | |
| $ | 163,287 | |
Deposit Activities. The following table sets forth the deposit activities of the Bank for the periods indicated.
| Year Ended September 30, | ||||||||||
| 2014 |
| 2013 |
| 2012 | ||||||
| (In thousands) | ||||||||||
Beginning balance | $ | 608,262 | |
| $ | 597,926 | |
| $ | 592,678 | |
Net deposits before interest credited | 4,788 | |
| 7,768 | |
| 1,297 | | |||
Interest credited | 2,066 | |
| 2,568 | |
| 3,951 | | |||
Net increase in deposits | 6,854 | |
| 10,336 | |
| 5,248 | | |||
Ending balance | $ | 615,116 | |
| $ | 608,262 | |
| $ | 597,926 | |
Borrowings. Deposits and loan repayments are generally the primary source of funds for the Bank's lending and investment activities and for general business purposes. The Bank has the ability to use advances from the FHLB-Seattle to supplement its supply of lendable funds and to meet deposit withdrawal requirements. The FHLB-Seattle functions as a central reserve bank providing credit for member financial institutions. As a member of the FHLB-Seattle, the Bank is required to own capital stock in the FHLB-Seattle and is authorized to apply for advances on the security of such stock and certain mortgage loans and other assets (principally securities which are obligations of, or guaranteed by, the United States government) provided certain creditworthiness standards have been met. The FHLB has recently announced that they have entered into an agreement to merge with the Federal Home Loan Bank of Des Moines. Although the agreement is still in process and has not yet been finalized and approved by certain regulatory agencies, management expects that the pending merger will continue to allow the Bank to obtain borrowings consistent with historical FHLB funding practices. Advances are made pursuant to several different credit programs. Each credit program has its own interest rate and range of maturities. Depending on the program, limitations on the amount of advances are based on the financial condition of the member institution and the adequacy of collateral pledged to secure the credit. At September 30, 2014 , the Bank maintained an uncommitted credit facility with the FHLB-Seattle that provided for immediately available advances up to an aggregate amount of 25% of the Bank's total assets, limited by available collateral, under which $45.0 million in advances was outstanding. The Bank also has a Variable Amount Letter of Credit ("VLOC") of up to $5.0 million with the FHLB for the purpose of collateralizing Washington State public deposits. Any amount advanced by FHLB under the VLOC reduces the Bank's available borrowing amount under the FHLB advance agreement. The Bank maintains a short-term borrowing line with the FRB with total credit based on eligible collateral. At September 30, 2014 , the Bank had no outstanding balance and $39.8 million in unused borrowing capacity on this borrowing line. A short-term borrowing line of $10.0 million is also maintained at Pacific Coast Bankers' Bank ("PCBB"). The Bank had no outstanding balance on this borrowing line at September 30, 2014 .
24
The following table sets forth certain information regarding borrowings including repurchase agreements by the Bank at the end of and during the periods indicated:
| At or For the Year Ended September 30, | ||||||||||
| 2014 |
| 2013 |
| 2012 | ||||||
| (Dollars in thousands) | ||||||||||
Average total borrowings | $ | 45,000 | |
| $ | 45,352 | |
| $ | 48,302 | |
|
|
|
|
|
| ||||||
Weighted average rate paid on total borrowings | 4.16 | % |
| 4.13 | % |
| 4.13 | % | |||
|
|
|
|
|
| ||||||
Total borrowings outstanding at end of period | $ | 45,000 | |
| $ | 45,000 | |
| $ | 45,855 | |
The following table sets forth certain information regarding short-term borrowings consisting solely of repurchase agreements with customers, by the Bank at the end of and during the periods indicated. Borrowings are considered short-term when the original maturity is less than one year.
| At or For the Year Ended September 30, | ||||||||||
| 2014 |
| 2013 |
| 2012 | ||||||
| (Dollars In thousands) | ||||||||||
Maximum amount outstanding at any month end: |
|
|
|
|
| ||||||
Repurchase agreements | $ | - | |
| $ | 787 | |
| $ | 948 | |
|
|
|
|
|
| ||||||
Average outstanding during period: |
| |
|
| |
|
| | |||
Repurchase agreements | $ | - | |
| $ | 352 | |
| $ | 699 | |
|
|
|
|
|
| ||||||
Weighted average rate paid during period: |
| |
|
| |
|
| | |||
Repurchase agreements | - | |
| 0.05 | % |
| 0.05 | % | |||
|
|
|
|
|
| ||||||
Outstanding at end of period: |
|
|
|
|
| ||||||
Repurchase agreements | $ | - | |
| $ | - | |
| $ | 855 | |
|
|
|
|
|
| ||||||
Weighted average rate at end of period: |
| |
|
| |
|
| | |||
Repurchase agreements | - | |
| - | |
| 0.05 | % | |||
Bank Owned Life Insurance
The Bank has purchased life insurance policies covering certain officers. These policies are recorded at their cash surrender value, net of any cash surrender charges. Increases in cash surrender value, net of policy premiums, and proceeds from death benefits are recorded in non-interest income. At September 30, 2014 , the cash surrender value of bank owned life insurance ("BOLI") was $17.6 million .
How We Are Regulated
General. As a bank holding company, Timberland Bancorp is subject to examination and supervision by, and is required to file certain reports with, the Federal Reserve. Timberland Bancorp is also subject to the rules and regulations of the SEC under the federal securities laws. As a state-chartered savings bank, the Bank is subject to regulation and oversight by the Division and the applicable provisions of Washington law and regulations of the Division adopted thereunder. The Bank also is subject to regulation and examination by the FDIC, which insures the deposits of the Bank to the maximum extent permitted by law, and requirements established by the Federal Reserve. State law and regulations govern the Bank's ability to take deposits and pay interest thereon, to make loans on or invest in residential and other real estate, to make consumer loans, to invest in securities, to offer various banking services to its customers, and to establish branch offices. Under state law, savings banks in Washington also generally have all of the powers that federal savings banks have under federal laws and regulations. The Bank is subject to periodic examination and reporting requirements by and of the Division and the FDIC.
25
The following is a brief description of certain laws and regulations applicable to Timberland Bancorp and the Bank. Descriptions of laws and regulations here and elsewhere in this report do not purport to be complete and are qualified in their entirety by reference to the actual laws and regulations. Legislation is introduced from time to time in the United States Congress or the Washington State Legislature that may affect the operations of Timberland Bancorp and Bank. In addition, the regulations governing the Company and the Bank may be amended from time to time by the FDIC, DFI, Federal Reserve and the Consumer Financial Protection Bureau ("CFPB"). Any such legislation or regulatory changes in the future could adversely affect the Company's and the Bank's operations and financial condition.
The Dodd-Frank Wall Street Reform and Consumer Protection Act (the "Dodd-Frank Act"), which was enacted in July 2010, imposed new restrictions and an expanded framework of regulatory oversight for financial institutions, including depository institutions and their holding companies. Among other changes, the Dodd-Frank Act established the CFPB as an independent bureau of the Federal Reserve Board. The CFPB assumed responsibility for the implementation of the federal financial consumer protection and fair lending laws and regulations and has authority to impose new requirements. The Bank is subject to consumer protection regulations issued by the CFPB, but as a smaller financial institution, the Bank is generally subject to supervision and enforcement by the FDIC and the DFI with respect to its compliance with consumer financial protection laws and CFPB regulations.
Many aspects of the Dodd-Frank Act are subject to rulemaking by the federal banking agencies, which has not been completed and will not take effect for some time, making it difficult to anticipate the overall financial impact of the Dodd-Frank Act on the Bank, Timberland Bancorp and the financial services industry more generally.
Regulation of the Bank
The Bank, as a state-chartered savings bank, is subject to regulation and oversight by the FDIC and the Division extending to all aspects of its operations.
Federal and State Enforcement Authority and Actions. As part of its supervisory authority over Washington-chartered savings banks, the Division may initiate enforcement proceedings to obtain a cease-and-desist order against an institution believed to have engaged in unsafe and unsound practices or to have violated a law, regulation, or other regulatory limit, including a written agreement. The FDIC also has the authority to initiate enforcement actions against insured institutions for similar reasons and may terminate the deposit insurance if it determines that an institution has engaged in unsafe or unsound practices or is in an unsafe or unsound condition. Both these agencies may utilize less formal supervisory tools to address their concerns about the condition, operations or compliance status of a savings bank.
Insurance of Accounts and Regulation by the FDIC. The deposit insurance fund, or the DIF of the FDIC insures deposit accounts in the Bank up to $250,000 per separately insured depositor. As insurer, the FDIC imposes deposit insurance premiums and is authorized to conduct examinations of and to require reporting by FDIC-insured institutions. Our deposit insurance premiums for the year ended September 30, 2014 , were $636,000 .
The Dodd-Frank Act requires that FDIC deposit insurance assessments be based on assets instead of deposits. The FDIC issued rules for this purpose, which specify that the assessment base for a bank is equal to its total average consolidated assets less average tangible equity capital. The revised FDIC assessment schedule established assessment rates that range from 2.5 to 45 basis points, depending on applicable adjustments for unsecured debt issued by an institution and brokered deposits (and to further adjustment for institutions that hold unsecured debt of other FDIC-insured institutions), until such time as the FDIC's reserve ratio equals 1.15%. Once the FDIC's reserve ratio reaches 1.15% and the reserve ratio for the immediately prior assessment period is less than 2.0%, the applicable assessment rates may range from three basis points to 30 basis points (subject to adjustments as described above). If the reserve ratio for the prior assessment period is equal to, or greater than 2.0% and less than 2.5%, the assessment rates may range from two basis points to 38 basis points and if the prior assessment period is greater than 2.5%, the assessment rates may range from one basis point to 35 basis points (in each case subject to adjustments as described above). No institution may pay a dividend if it is in default on its federal deposit insurance assessment.
The FDIC conducts examinations of and requires reporting by state non-member banks, such as the Bank. The FDIC also may prohibit any insured institution from engaging in any activity determined by regulation or order to pose a serious risk to the deposit insurance fund. The FDIC may terminate the deposit insurance of any insured depository institution, including the Bank, if it determines after a hearing that the institution has engaged or is engaging in unsafe or unsound practices, is in an unsafe or unsound condition to continue operations, or has violated any applicable law, regulation, order or any condition imposed by an agreement with the FDIC. It also may suspend deposit insurance temporarily during the hearing process for the permanent termination of insurance, if the institution has no tangible capital. If insurance of accounts is terminated, the accounts at the institution at the time of the termination, less subsequent withdrawals, shall continue to be insured for a period of six months to
26
two years, as determined by the FDIC. Management is aware of no existing circumstances which would result in termination of the Bank's deposit insurance.
A significant increase in insurance premiums would likely have an adverse effect on the operating expenses and results of operations of the Bank. There can be no prediction as to what changes in insurance assessment rates may be made in the future.
Prompt Corrective Action. Federal statutes establish a supervisory framework based on five capital categories: well capitalized, adequately capitalized, undercapitalized, significantly undercapitalized and critically undercapitalized. An institution's category depends upon where its capital levels are in relation to relevant capital measures, which include a risk-based capital measure, a leverage ratio capital measure and certain other factors. The federal banking agencies have adopted regulations that implement this statutory framework. Under these regulations, an institution is treated as well capitalized if its ratio of total capital to risk-weighted assets is 10% or more, its ratio of core capital to risk-weighted assets is 6% or more, its ratio of core capital to adjusted total assets (leverage ratio) is 5% or more, and it is not subject to any federal supervisory order or directive to meet a specific capital level. In order to be adequately capitalized, an institution must have a total risk-based capital ratio of not less than 8%, a Tier 1 risk-based capital ratio of not less than 4%, and a leverage ratio of not less than 4%. An institution that is not well capitalized is subject to certain restrictions on brokered deposits, including restrictions on the rates it can offer on its deposits generally. Any institution which is neither well capitalized nor adequately capitalized is considered undercapitalized.
Undercapitalized institutions are subject to certain prompt corrective action requirements, regulatory controls and restrictions which become more extensive as an institution becomes more severely undercapitalized. Failure by an institution to comply with applicable capital requirements would, if unremedied, result in progressively more severe restrictions on its activities and lead to enforcement actions, including, but not limited to, the issuance of a capital directive to ensure the maintenance of required capital levels and, ultimately, the appointment of the FDIC as receiver or conservator. Banking regulators will take prompt corrective action with respect to depository institutions that do not meet minimum capital requirements. Additionally, approval of any regulatory application filed for their review may be dependent on compliance with capital requirements.
At September 30, 2014 , the Bank was categorized as "well capitalized" under the prompt corrective action regulations of the FDIC. For additional information on capital requirements, see Note 18 of the Notes to the Consolidated Financial Statements contained in "Item 8. Financial Statements and Supplemental Data" of this Form 10-K.
Capital Requirements. Federally insured savings institutions, such as the Bank, are required to maintain a minimum level of regulatory capital.
Currently, FDIC regulations recognize two types, or tiers, of capital: core ("Tier 1") capital and supplementary ("Tier 2") capital. Tier 1 capital generally includes common shareholders' equity and noncumulative perpetual preferred stock, less most intangible assets. Tier 2 capital, which is limited to 100% of Tier 1 capital, includes such items as qualifying general loan loss reserves, cumulative perpetual preferred stock, mandatory convertible debt, term subordinated debt and limited life preferred stock; however, the amount of term subordinated debt and intermediate term preferred stock (original maturity of at least five years but less than 20 years) that may be included in Tier 2 capital is limited to 50% of Tier 1 capital.
The FDIC currently measures an institution's capital using a leverage limit together with certain risk-based ratios. The FDIC's minimum leverage capital requirement for a bank to be considered adequately capitalized specifies a minimum ratio of Tier 1 capital to average total assets of 4%. At September 30, 2014, the Bank had a Tier 1 leverage capital ratio of 10.2%. The FDIC retains the right to require a particular institution to maintain a higher capital level based on the its particular risk profile.
FDIC regulations also establish a measure of capital adequacy based on ratios of qualifying capital to risk-weighted assets. Assets are placed in one of four categories and given a percentage weight based on the relative risk of that category. In addition, certain off-balance-sheet items are converted to balance-sheet credit equivalent amounts, and each amount is then assigned to one of the four categories. Under the guidelines for a bank to be considered adequately capitalized, the ratio of total capital (Tier 1 capital plus Tier 2 capital) to risk-weighted assets (the Tier 1 risk based capital ratio) must be at least 8%, and the ratio of Tier 1 capital to risk-weighted assets must be at least 4%. In evaluating the adequacy of a bank's capital, the FDIC may also consider other factors that may affect a bank's financial condition. Such factors may include interest rate risk exposure, liquidity, funding and market risks, the quality and level of earnings, concentration of credit risk, risks arising from nontraditional activities, loan and investment quality, the effectiveness of loan and investment policies, and management's ability to monitor and control financial operating risks. At September 30, 2014 , the Bank's ratio of total capital to risk-weighted assets was 14.5% and the ratio of Tier 1 capital to risk-weighted assets was 13.2% .
The Division requires that net worth equal at least 5% of total assets. At September 30, 2014 , the Bank had a net worth of 10.0% of total assets.
27
The table below sets forth the Bank's capital position relative to its FDIC capital requirements at September 30, 2014 . The definitions of the terms used in the table are those provided in the capital regulations issued by the FDIC.
| At September 30, 2014 | |||||
| Amount |
| Percent of Adjusted Total Assets (1) | |||
| (Dollars in thousands) | |||||
Tier 1 (leverage) capital | $ | 75,734 | |
| 10.2 | % |
Tier 1 (leverage) capital requirement (2) | 29,629 | |
| 4.0 | | |
Excess | $ | 46,105 | |
| 6.2 | % |
|
|
|
| |||
Tier 1 risk adjusted capital | $ | 75,734 | |
| 13.2 | % |
Tier 1 risk adjusted capital requirement | 22,939 | |
| 4.0 | | |
Excess | $ | 52,795 | |
| 9.2 | % |
|
|
|
| |||
Total risk-based capital | $ | 82,945 | |
| 14.5 | % |
Total risk-based capital requirement | 45,878 | |
| 8.0 | | |
Excess | $ | 37,067 | |
| 6.5 | % |
______________
(1) | For the Tier 1 (leverage) capital and regulatory capital calculations, percent of total average assets of $740.7 million. For the Tier 1 risk-based capital and total risk-based capital calculations, percent of total risk-weighted assets of $573.5 million. |
(2) | As a Washington-chartered savings bank, the Bank is subject to the capital requirements of the FDIC and the Division. The FDIC requires state-chartered savings banks, including the Bank, to have a minimum leverage ratio of Tier 1 capital to total assets of at least 3%, provided, however, that all institutions, other than those (i) receiving the highest rating during the examination process and (ii) not anticipating any significant growth, are required to maintain a ratio of 1% to 2% above the stated minimum, with an absolute total capital to risk-weighted assets of at least 8%. |
On July 2, 2013, the FDIC and the other federal bank regulatory agencies issued a final rule to revise their risk-based and leverage capital requirements and their method for calculating risk-weighted assets, to make them consistent with the agreements that were reached by the Basel Committee on Banking Supervision and certain provisions of the Dodd-Frank Act. The final rule applies to all depository institutions, top-tier bank holding companies with total consolidated assets of $500 million or more, and top-tier savings and loan holding companies ("banking organizations"). Among other things, the rule establishes a new common equity Tier 1 minimum capital requirement (4.5% of risk-weighted assets), increases the minimum Tier 1 capital to risk-based assets requirement (from 4% to 6% of risk-weighted assets) and assigns a higher risk weight (150%) to loans that are more than 90 days past due or are on non-accrual status and to certain commercial real estate facilities that finance the acquisition, development or construction of real property. The final rule also limits a banking organization's capital distributions and certain discretionary bonus payments if the banking organization does not hold a "capital conservation buffer" consisting of 2.5% of common equity Tier 1 capital to risk-weighted assets. The final rule becomes effective for the Bank on January 1, 2015. The capital conservation buffer requirement will be phased in beginning January 1, 2016 and ending January 1, 2019, when the full capital conservation buffer requirement will be effective.
As of June 30, 2014, the Bank's current capital levels exceed the required capital amounts to be considered "well capitalized" and we believe they also meet the fully-phased in minimum capital requirements, including the related capital conservation buffers, as required by the Basel III capital rules.
The application of these stringent capital requirements could, among other things, result in lower returns on invested capital, over time require the raising of additional capital, and result in regulatory actions if we were to be unable to comply with such requirements. Implementation of changes to asset risk weightings for risk based capital calculations, items included or deducted in calculating regulatory capital and/or additional capital conservation buffers could result in management modifying its business strategy and could limit our ability to make distributions, including paying out dividends or repurchasing shares. Furthermore, the imposition of liquidity requirements in connection with the implementation of Basel III could result in our having to lengthen the term of our funding, restructure our business models, and/or increase our holdings of liquid assets. Any additional changes in our regulation and oversight, in the form of new laws, rules and regulations could make compliance more difficult or expensive or otherwise materially adversely affect our business, financial condition or prospects.
28
Federal Home Loan Bank System. The Bank is a member of the FHLB-Seattle, which is one of 12 regional FHLBs that administer the home financing credit function of savings institutions. Each FHLB serves as a reserve or central bank for its members within its assigned region. It is funded primarily from proceeds derived from the sale of consolidated obligations of the FHLB System. It makes loans or advances to members in accordance with policies and procedures, established by the Board of Directors of the FHLB, which are subject to the oversight of the Federal Housing Finance Board. All advances from the FHLB are required to be fully secured by sufficient collateral as determined by the FHLB. In addition, all long-term advances are required to provide funds for residential home financing. See "Business – Deposit Activities and Other Sources of Funds – Borrowings."
As a member, the Bank is required to purchase and maintain stock in the FHLB-Seattle. At September 30, 2014 , the Bank had $5.2 million in FHLB stock, which was in compliance with this requirement. Subsequent to December 31, 2008, the FHLB-Seattle announced that it was below its regulatory risk-based capital requirement and was precluded from paying dividends or repurchasing capital stock by its regulator, the Federal Housing Finance Agency. In September 2012, the FHLB-Seattle announced that it had been reclassified as adequately capitalized and it had been granted authority to repurchase up to $25 million of excess capital stock per quarter, provided it receives a non-objection from the Federal Housing Finance Agency. During the year ended September 30, 2014 , the FHLB-Seattle repurchased $206,000 of its stock, at par, from the Bank. The FHLB-Seattle resumed dividend payments in July 2013 and the Bank received $5,000 in dividends during the year ended September 30, 2014 . On September 25, 2014, the FHLB-Des Moines and the FHLB-Seattle announced that they have entered into an agreement to merge the two banks. A merger will require approval from the Federal Housing Finance Agency as well as member-owners of the FHLB-Des Moines and the FHLB-Seattle.
The FHLBs continue to contribute to low- and moderately-priced housing programs through direct loans or interest subsidies on advances targeted for community investment and low- and moderate-income housing projects. These contributions have adversely affected the level of FHLB dividends paid and could continue to do so in the future. These contributions could also have an adverse effect on the value of FHLB stock in the future. A reduction in value of the Bank's FHLB stock may result in a decrease in net income and possibly capital.
Standards for Safety and Soundness. The federal banking regulatory agencies have prescribed, by regulation, guidelines for all insured depository institutions relating to: internal controls, information systems and internal audit systems, loan documentation, credit underwriting, interest rate risk exposure, asset growth, asset quality, earnings, and compensation, fees and benefits. The guidelines set forth the safety and soundness standards that the federal banking agencies use to identify and address problems at insured depository institutions before capital becomes impaired. Each insured depository institution must implement a comprehensive written information security program that includes administrative, technical, and physical safeguards appropriate to the institution's size and complexity and the nature and scope of its activities. The information security program also must be designed to ensure the security and confidentiality of customer information, protect against any unanticipated threats or hazards to the security or integrity of such information, protect against unauthorized access to or use of such information that could result in substantial harm or inconvenience to any customer, and ensure the proper disposal of customer and consumer information. Each insured depository institution must also develop and implement a risk-based response program to address incidents of unauthorized access to customer information in customer information systems. If the FDIC determines that the Bank fails to meet any standard prescribed by the guidelines, it may require the Bank to submit to the agency an acceptable plan to achieve compliance with the standard. FDIC regulations establish deadlines for the submission and review of such safety and soundness compliance plans. Management of the Bank is not aware of any conditions relating to these safety and soundness standards which would require submission of a plan of compliance.
Real Estate Lending Standards. FDIC regulations require the Bank to adopt and maintain written policies that establish appropriate limits and standards for real estate loans. These standards, which must be consistent with safe and sound banking practices, must establish loan portfolio diversification standards, prudent underwriting standards (including loan-to-value ratio limits) that are clear and measurable, loan administration procedures, and documentation, approval and reporting requirements. The Bank is obligated to monitor conditions in its real estate markets to ensure that its standards continue to be appropriate for current market conditions. The Bank's Board of Directors is required to review and approve the Bank's standards at least annually. The FDIC has published guidelines for compliance with these regulations, including supervisory limitations on loan-to-value ratios for different categories of real estate loans. Under the guidelines, the aggregate amount of all loans in excess of the supervisory loan-to-value ratios should not exceed 100% of total capital, and the total of all loans for commercial, agricultural, multi-family or other non-one- to four-family residential properties in excess of the supervisory loan-to-value ratio should not exceed 30% of total capital. Loans in excess of the supervisory loan-to-value ratio limitations must be identified in the Bank's records and reported at least quarterly to the Bank's Board of Directors. The Bank is in compliance with the record and reporting requirements. As of September 30, 2014 , the Bank's aggregate loans in excess of the supervisory loan-to-value ratios were 6.6% of total capital and the Bank's loans on commercial, agricultural, multi-family or other non-one- to four-family residential properties in excess of the supervisory loan-to-value ratios were 4.7% of total capital.
29
Activities and Investments of Insured State-Chartered Financial Institutions. Federal law generally limits the activities and equity investments of FDIC-insured, state-chartered banks to those that are permissible for national banks. An insured state bank is not prohibited from, among other things, (i) acquiring or retaining a majority interest in a subsidiary, (ii) investing as a limited partner in a partnership the sole purpose of which is direct or indirect investment in the acquisition, rehabilitation or new construction of a qualified housing project, provided that such limited partnership investments may not exceed 2% of the bank's total assets, (iii) acquiring up to 10% of the voting stock of a company that solely provides or reinsures directors' and officers' liability insurance coverage or bankers' blanket bond group insurance coverage for insured depository institutions, and (iv) acquiring or retaining the voting shares of a depository institution owned by another FDIC-insured institution if certain requirements are met.
Washington State has enacted a law regarding financial institution parity. Primarily, the law affords Washington-chartered commercial banks the same powers as Washington-chartered savings banks. In order for a bank to exercise these powers, it must provide 30 days notice to the Director of Financial Institutions and the Director must authorize the requested activity. In addition, the law provides that Washington-chartered savings banks may exercise any of the powers of Washington-chartered commercial banks, national banks and federally-chartered savings banks, subject to the approval of the Director in certain situations. Finally, the law provides additional flexibility for Washington-chartered commercial and savings banks with respect to interest rates on loans and other extensions of credit. Specifically, they may charge the maximum interest rate allowable for loans and other extensions of credit by federally-chartered financial institutions to Washington residents.
Environmental Issues Associated With Real Estate Lending. The Comprehensive Environmental Response, Compensation and Liability Act ("CERCLA"), is a federal statute that generally imposes strict liability on all prior and present "owners and operators" of sites containing hazardous waste. However, Congress acted to protect secured creditors by providing that the term "owner and operator" excludes a person whose ownership is limited to protecting its security interest in the site. Since the enactment of the CERCLA, this "secured creditor exemption" has been the subject of judicial interpretations which have left open the possibility that lenders could be liable for cleanup costs on contaminated property that they hold as collateral for a loan.
To the extent that legal uncertainty exists in this area, all creditors, including the Bank, that have made loans secured by properties with potential hazardous waste contamination (such as petroleum contamination) could be subject to liability for cleanup costs, which costs often substantially exceed the value of the collateral property.
Federal Reserve System. The Federal Reserve Board requires that all depository institutions maintain reserves on transaction accounts or non-personal time deposits. These reserves may be in the form of cash or non-interest-bearing deposits with the regional Federal Reserve Bank. Negotiable order of withdrawal ("NOW") accounts and other types of accounts that permit payments or transfers to third parties fall within the definition of transaction accounts and are subject to reserve requirements, as are any non-personal time deposits at a savings bank. As of September 30, 2014 , the Bank's deposit with the Federal Reserve and vault cash exceeded its Regulation D reserve requirements.
Affiliate Transactions. Federal laws strictly limit the ability of banks to engage in certain transactions with their affiliates, including their bank holding companies. Transactions deemed to be a "covered transaction" under Section 23A of the Federal Reserve Act and between a subsidiary bank and its parent company or the nonbank subsidiaries of the bank holding company are limited to 10% of the bank subsidiary's capital and surplus and, with respect to the parent company and all such nonbank subsidiaries, to an aggregate of 20% of the bank subsidiary's capital and surplus. Further, covered transactions that are loans and extensions of credit generally are required to be secured by eligible collateral in specified amounts. Federal law also requires that covered transactions and certain other transactions listed in Section 23B of the Federal Reserve Act between a bank and its affiliates be on terms as favorable to the bank as transactions with non-affiliates.
Community Reinvestment Act. Banks are also subject to the provisions of the Community Reinvestment Act of 1977 ("CRA"), which requires the appropriate federal bank regulatory agency to assess a bank's performance under the CRA in meeting the credit needs of the community serviced by the bank, including low and moderate income neighborhoods. The regulatory agency's assessment of the bank's record is made available to the public. Further, a bank's performance must be considered in connection with a bank's application to, among other things, establish a new branch office that will accept deposits, relocate an existing office or merge or consolidate with, or acquire the assets or assume the liabilities of, a federally regulated financial institution. The Bank received a "satisfactory" rating during its most recent examination.
Dividends. Dividends from the Bank constitute the major source of funds available for dividends which may be paid to Company shareholders. The amount of dividends payable by the Bank to the Company depends upon the Bank's earnings and capital position, and is limited by federal and state laws, regulations and policies. According to Washington law, the Bank may not declare or pay a cash dividend on its capital stock if it would cause its net worth to be reduced below (i) the amount required for liquidation accounts or (ii) the net worth requirements, if any, imposed by the Director of the Division. In addition, dividends
30
on the Bank's capital stock may not be paid in an aggregate amount greater than the aggregate retained earnings of the Bank, without the approval of the Director of the Division.
The amount of dividends actually paid during any one period will be strongly affected by the Bank's management policy of maintaining a strong capital position. Federal law further provides that no insured depository institution may pay a cash dividend if it would cause the institution to be "undercapitalized," as defined in the prompt corrective action regulations. Moreover, the federal bank regulatory agencies also have the general authority to limit the dividends paid by insured banks if such payments should be deemed to constitute an unsafe and unsound practice.
Other Consumer Protection Laws and Regulations. The Bank is subject to a broad array of federal and state consumer protection laws and regulations that govern almost every aspect of its business relationships with consumers. While the list set forth below is not exhaustive, these include the Truth-in-Lending Act, the Truth in Savings Act, the Electronic Fund Transfer Act, the Expedited Funds Availability Act, the Equal Credit Opportunity Act, the Fair Housing Act, the Real Estate Settlement Procedures Act, the Home Mortgage Disclosure Act, the Fair Credit Reporting Act, the Fair Debt Collection Practices Act, the Right to Financial Privacy Act, the Home Ownership and Equity Protection Act, the Consumer Leasing Act, the Fair Credit Billing Act, the Homeowners Protection Act, the Check Clearing for the 21st Century Act, laws governing flood insurance, laws governing consumer protections in connection with the sale of insurance, federal and state laws prohibiting unfair and deceptive business practices, and various regulations that implement some or all of the foregoing. These laws and regulations mandate certain disclosure requirements and regulate the manner in which financial institutions must deal with customers when taking deposits, making loans, collecting loans, and providing other services. Failure to comply with these laws and regulations can subject the Bank to various penalties, including but not limited to, enforcement actions, injunctions, fines, civil liability, criminal penalties, punitive damages, and the loss of certain contractual rights.
Regulation of the Company
General. The Company, as the sole shareholder of the Bank, is a bank holding company and is registered as such with the Federal Reserve. Bank holding companies are subject to comprehensive regulation by the Federal Reserve under the Bank Holding Company Act of 1956, as amended ("BHCA"), and the regulations promulgated thereunder. This regulation and oversight is generally intended to ensure that Timberland Bancorp, Inc. limits its activities to those allowed by law and that it operates in a safe and sound manner without endangering the financial health of the Bank.
As a bank holding company, the Company is required to file quarterly reports with the Federal Reserve and any additional information required by the Federal Reserve and is subject to regular examinations by the Federal Reserve. The Federal Reserve also has extensive enforcement authority over bank holding companies, including the ability to assess civil money penalties, to issue cease and desist or removal orders and to require that a holding company divest subsidiaries (including its bank subsidiaries). In general, enforcement actions may be initiated for violations of laws and regulations and unsafe or unsound practices.
The Bank Holding Company Act. Under the BHCA, the Company is supervised by the Federal Reserve. The Federal Reserve has a policy that a bank holding company is required to serve as a source of financial and managerial strength to its subsidiary banks and may not conduct its operations in an unsafe or unsound manner. In addition, the Federal Reserve provides that bank holding companies should serve as a source of strength to its subsidiary banks by being prepared to use available resources to provide adequate capital funds to its subsidiary banks during periods of financial stress or adversity, and should maintain the financial flexibility and capital raising capacity to obtain additional resources for assisting its subsidiary banks. A bank holding company's failure to meet its obligation to serve as a source of strength to its subsidiary banks will generally be considered by the Federal Reserve to be an unsafe and unsound banking practice or a violation of the Federal Reserve's regulations or both.
Under the BHCA, the Federal Reserve may approve the ownership of shares by a bank holding company in any company the activities of which the Federal Reserve has determined to be so closely related to the business of banking or managing or controlling banks as to be a proper incident thereto. These activities generally include, among others, operating a savings institution, mortgage company, finance company, escrow company, credit card company or factoring company; performing certain data processing operations; providing certain investment and financial advice; underwriting and acting as an insurance agent for certain types of credit related insurance; leasing property on a full payout, non-operating basis; selling money orders, travelers' checks and U.S. Savings Bonds; real estate and personal property appraising; providing tax planning and preparation services; and, subject to certain limitations, providing securities brokerage services for customers.
Acquisitions. The BHCA prohibits a bank holding company, with certain exceptions, from acquiring direct or indirect ownership or control of more than 5% of the voting shares of any company that is not a bank or bank holding company and from engaging directly or indirectly in activities other than those of banking, managing or controlling banks, or providing services for
31
its subsidiaries. A bank holding company that meets certain supervisory and financial standards and elects to be designated as a financial holding company may also engage in certain securities, insurance and merchant banking activities and other activities determined to be financial in nature or incidental to financial activities.
Interstate Banking. The Federal Reserve may approve an application of a bank holding company to acquire control of, or acquire all or substantially all of the assets of, a bank located in a state other than such holding company's home state, without regard to whether the transaction is prohibited by the laws of any state except with respect to the acquisition of a bank that has not been in existence for the minimum time period, not exceeding five years, specified by the law of the host state. The Federal Reserve may not approve an application if the applicant controls or would control more than 10% of the insured deposits in the United States or 30% or more of the deposits in the target bank's home state or in any state in which the target bank maintains a branch. Federal law does not affect the authority of states to limit the percentage of total insured deposits in the state that may be held or controlled by a bank holding company to the extent such limitation does not discriminate against out-of-state banks or bank holding companies. Individual states may also waive the 30% state-wide concentration limit contained in the federal law.
The federal banking agencies are authorized to approve interstate merger transactions without regard to whether such transaction is prohibited by the law of any state, unless the home state of one of the banks adopted a law prior to June 1, 1997 which applies equally to all out-of-state banks and expressly prohibits merger transactions involving out-of-state banks. Interstate acquisitions of branches will be permitted only if the law of the state in which the branch is located permits such acquisitions. Interstate mergers and branch acquisitions will also be subject to the nationwide and statewide insured deposit concentration amounts described above.
Dividends. The Federal Reserve has issued a policy statement on the payment of cash dividends by bank holding companies, which expresses the Federal Reserve's view that a bank holding company should pay cash dividends only to the extent that the company's net income for the past year is sufficient to cover both the cash dividends and a rate of earning retention that is consistent with the company's capital needs, asset quality and overall financial condition, and that it is inappropriate for a company experiencing serious financial problems to borrow funds to pay dividends. Under Washington corporate law, the Company generally may not pay dividends if after that payment it would not be able to pay its liabilities as they become due in the usual course of business, or its total assets would be less than its total liabilities.
Stock Repurchases. Bank holding companies, except for certain "well-capitalized" and highly rated bank holding companies, are required to give the Federal Reserve prior written notice of any purchase or redemption of its outstanding equity securities if the consideration for the purchase or redemption, when combined with the net consideration paid for all such purchases or redemptions during the preceding 12 months, is equal to 10% or more of their consolidated net worth. The Federal Reserve may disapprove a purchase or redemption if it determines that the proposal would constitute an unsafe or unsound practice or would violate any law, regulation, Federal Reserve order, or any condition imposed by, or written agreement with, the Federal Reserve.
Capital Requirements. The Federal Reserve has established capital adequacy guidelines for bank holding companies that generally parallel the capital requirements of the FDIC for the Bank. See "- Regulation of the Bank - Capital Requirements."
The Federal Reserve regulations provide that capital standards will be applied on a consolidated basis in the case of a bank holding company with $500 million or more in total consolidated assets.
The Company's total risk based capital must equal 8% of risk-weighted assets and one half of the 8%, or 4%, must consist of Tier 1 (core) capital and its Tier 1 (core) capital must equal 4% of total assets. As of September 30, 2014 , the Company's total risk based capital was 14.9% of risk-weighted assets, its risk based capital of Tier 1 (core) capital was 13.7% of risk-weighted assets and its Tier 1 (core) capital was 10.6% of average assets.
The Dodd-Frank Wall Street Reform and Consumer Protection Act of 2010. On July 21, 2010, the Dodd-Frank Act was signed into law. The Dodd-Frank-Act imposes new restrictions and an expanded framework of regulatory oversight for financial institutions, including depository institutions and implements new capital regulations that Timberland Bancorp will become subject to and that are discussed above under "- Regulation and Supervision of the Bank - New Capital Rules." In addition, among other changes, the Dodd-Frank Act requires public companies, such as Timberland Bancorp, to (i) provide their shareholders with a non-binding vote (a) at least once every three years on the compensation paid to executive officers and (b) at least once every six years on whether they should have a "say on pay" vote every one, two or three years; (ii) have a separate, non-binding shareholder vote regarding golden parachutes for named executive officers when a shareholder vote takes place on mergers, acquisitions, dispositions or other transactions that would trigger the parachute payments; (iii) provide disclosure in annual proxy materials concerning the relationship between the executive compensation paid and the financial performance of the issuer; and (iv) amend Item 402 of Regulation S-K to require companies to disclose the ratio of the Chief Executive Officer's annual total compensation
32
to the median annual total compensation of all other employees. For certain of these changes, the implementing regulations have not been promulgated, so the full impact of the Dodd-Frank Act on public companies cannot be determined at this time.
Taxation
Federal Taxation
General . The Company and the Bank report their operations on a fiscal year basis using the accrual method of accounting and are subject to federal income taxation in the same manner as other corporations. The following discussion of tax matters is intended only as a summary and does not purport to be a comprehensive description of the tax rules applicable to the Bank or the Company.
Corporate Alternative Minimum Tax . The Internal Revenue Code imposes a tax on alternative minimum taxable income ("AMTI") at a rate of 20%. In addition, only 90% of AMTI can be offset by net operating loss carryovers. AMTI is increased by an amount equal to 75% of the amount by which the Bank's adjusted current earnings exceeds its AMTI (determined without regard to this preference and prior to reduction for net operating losses).
Dividends-Received Deduction . The Company may exclude from its income 100% of dividends received from the Bank as a member of the same affiliated group of corporations. The corporate dividends-received deduction is generally 70% in the case of dividends received from unaffiliated corporations with which the Company and the Bank will not file a consolidated tax return, except that if the Company or the Bank owns more than 20% of the stock of a corporation distributing a dividend, then 80% of any dividends received may be deducted.
Audits . The Company is no longer subject to United States federal tax examination by tax authorities for years ended on or before September 30, 2010.
Washington Taxation
The Company and the Bank are subject to a business and occupation tax imposed under Washington law at the rate of 1.50% of gross receipts at September 30, 2014 . Interest received on loans secured by mortgages or deeds of trust on residential properties, residential mortgage-backed securities, and certain U.S. Government and agency securities is not subject to this tax.
Competition
The Bank operates in an intensely competitive market for the attraction of deposits (generally its primary source of lendable funds) and in the origination of loans. Historically, its most direct competition for deposits has come from commercial banks, thrift institutions and credit unions in its primary market area. In times of high interest rates, the Bank experiences additional significant competition for investors' funds from short-term money market securities and other corporate and government securities. The Bank's competition for loans comes principally from mortgage bankers, commercial banks and thrift institutions. Such competition for deposits and the origination of loans may limit the Bank's future growth and earnings prospects.
Subsidiary Activities
The Bank has one wholly-owned subsidiary, Timberland Service Corporation ("Timberland Service"), whose primary function is to act as the Bank's escrow department and offer non-deposit investment services.
Personnel
As of September 30, 2014 , the Bank had 229 full-time employees and 27 part-time and on-call employees. The employees are not represented by a collective bargaining unit and the Bank believes its relationship with its employees is good.
33
Executive Officers of the Registrant
The following table sets forth certain information with respect to the executive officers of the Company and the Bank.
Executive Officers of the Company and Bank
|
| Age at 30, 2014 |
| Position | ||
Name |
|
| Company |
| Bank | |
Michael R. Sand |
| 60 |
| President and Chief Executive Officer |
| President and Chief Executive Officer |
|
|
|
|
|
|
|
Dean J. Brydon |
| 47 |
| Executive Vice President, Chief Financial Officer and Secretary |
| Executive Vice President, Chief Financial Officer and Secretary |
|
|
|
|
|
|
|
Robert A. Drugge |
| 63 |
| Executive Vice President |
| Executive Vice President of Lending |
|
|
|
|
|
|
|
Jonathan A. Fischer |
| 40 |
| Executive Vice President and Chief Operating Officer |
| Executive Vice President and Chief Operating Officer |
|
|
|
|
|
|
|
Edward C. Foster |
| 57 |
| Senior Vice President and Chief Credit Administrator |
| Senior Vice President and Chief Credit Administrator |
|
|
|
|
|
|
|
Marci A. Basich |
| 45 |
| Senior Vice President and Treasurer |
| Senior Vice President and Treasurer |
|
|
|
|
|
|
|
Biographical Information.
Michael R. Sand has been affiliated with the Bank since 1977 and has served as President of the Bank and the Company since January 23, 2003. On September 30, 2003, he was appointed as Chief Executive Officer of the Bank and Company. Prior to appointment as President and Chief Executive Officer, Mr. Sand had served as Executive Vice President and Secretary of the Bank since 1993 and as Executive Vice President and Secretary of the Company since its formation in 1997.
Dean J. Brydon has been affiliated with the Bank since 1994 and has served as the Chief Financial Officer of the Company and the Bank since January 2000 and Secretary of the Company and Bank since January 2004. Mr. Brydon is a Certified Public Accountant.
Robert A. Drugge has been affiliated with the Bank since April 2006 and has served as Executive Vice President of Lending since September 2006. Prior to joining Timberland, Mr. Drugge was employed at Bank of America as a senior officer and most recently served as Senior Vice President and Commercial Banking Manager. Mr. Drugge began his banking career at Seafirst in 1974, which was acquired by Bank America Corp. and became known as Bank of America.
Jonathan A. Fischer has been affiliated with the Bank since October 1997 and has served as Chief Operating Officer since August 23, 2012. Prior to that, Mr. Fischer had served as the Chief Risk Officer since October 2010. Mr. Fischer had also served as the Compliance Officer, Community Reinvestment Act Officer, and Privacy Officer since January 2000.
Edward C. Foster has been affiliated with the Bank, and has served as Chief Credit Administrator since February 2012. Prior to joining the Bank, Mr. Foster was employed by the FDIC, where he served as a Loan Review Specialist from January 2011 to February 2012. Mr. Foster owned a Credit Administration Consulting Business from February 2010 to January 2011. Prior to that, Mr. Foster served as the Chief Credit Officer for Carson River Community Bank from April 2008 through February 2010. Before joining Carson River Community Bank, Mr. Foster served as a Senior Regional Credit Officer for Omni National Bank from September 2006 through March 2008.
Marci A. Basich has been affiliated with the Bank since 1999 and has served as Treasurer of the Company and the Bank since January 2002. Ms. Basich is a Certified Public Accountant.
34
Item 1A. Risk Factors
We assume and manage a certain degree of risk in order to conduct our business strategy. In addition to the risk factors described below, other risks and uncertainties not specifically mentioned, or that are currently known to, or deemed to be immaterial by management, also may materially and adversely affect our financial position, results of operations and/or cash flows. Before making an investment decision, you should carefully consider the risks described below together with all of the other information included in this Form 10-K. If any of the circumstances described in the following risk factors actually occur to a significant degree, the value of our common stock could decline, and you could lose all or part of your investment.
The current weak economic conditions in the market areas we serve may continue to adversely impact our earnings and could increase the credit risk associated with our loan portfolio.
Substantially all of our loans are to businesses and individuals in the state of Washington. A decline in the economies of our local market areas of Grays Harbor, Pierce, Thurston, King, Kitsap and Lewis counties in which we operate, and which we consider to be our primary market areas, could have a material adverse effect on our business, financial condition, results of operations and prospects. In the recent economic downturn our market areas, as well as much of the rest of the state of Washington, experienced strains in the financial and housing markets, resulting in higher levels of loan delinquencies, problem assets and foreclosures and a decline in the values of the collateral securing our loans.
While real estate values and unemployment rates have recently improved, a prolonged slow recovery or a deterioration in economic conditions in the market areas we serve could result in the following consequences, any of which could have a materially adverse impact on our business, financial condition and results of operations:
• | loan delinquencies, problem assets and foreclosures may increase; |
• | the sale of foreclosed assets may slow; |
• | demand for our products and services may decline possibly resulting in a decrease in our total loans or assets; |
• | collateral for loans made may decline further in value, exposing us to increased risk loans, reducing customers' borrowing power, and reducing the value of assets and collateral associated with existing loans; |
• | the net worth and liquidity of loan guarantors may decline, impairing their ability to honor commitments to us; and |
• | the amount of our low-cost or non-interest bearing deposits may decrease and the composition of our deposits may be adversely affected. |
Strong competition within our market areas could hurt our profits and slow growth.
Although we consider ourselves competitive in our market areas, we face intense competition in both making loans and attracting deposits. Price competition for loans and deposits might result in our earning less on our loans and paying more on our deposits, which reduces net interest income. Some of the institutions with which we compete have substantially greater resources than we have and may offer services that we do not provide. We expect competition to increase in the future as a result of legislative, regulatory and technological changes and the continuing trend of consolidation in the financial services industry. Our profitability will depend upon our continued ability to compete successfully in our market areas.
Our real estate construction loans expose us to significant risks.
We make real estate construction loans to individuals and builders, primarily for the construction of residential properties. We originate these loans whether or not the collateral property underlying the loan is under contract for sale. At September 30, 2014 , construction and land development loans totaled $68.5 million, or 11.3% of our total loan portfolio, of which $65.2 million were for residential real estate projects. Approximately $59.8 million of our residential construction loans were made to finance the construction of owner-occupied homes and are structured to be converted to permanent loans at the end of the construction phase. In general, construction lending involves additional risks because of the inherent difficulty in estimating a property's value both before and at completion of the project as well as the estimated cost of the project. Construction costs may exceed original estimates as a result of increased materials, labor or other costs. In addition, because of current uncertainties in the residential real estate market, property values have become more difficult to determine. Construction loans often involve the disbursement of funds with repayment dependent, in part, on the success of the project and the ability of the borrower to sell or lease the property or refinance the indebtedness, rather than the ability of the borrower or guarantor to repay principal and interest. These loans are also generally more difficult to monitor. In addition, speculative construction loans to builders are often associated with homes that are not pre-sold, and thus pose a greater potential risk than construction loans to individuals on their personal residences. At September 30, 2014 , $2.6 million of our construction portfolio was comprised of speculative one- to four-family construction
35
loans. No real estate construction loans were non-performing at September 30, 2014 . A material increase in our non-performing construction loans could have a material adverse effect on our financial condition and results of operation.
Our emphasis on commercial real estate lending may expose us to increased lending risks.
Our current business strategy includes an emphasis on commercial real estate lending. This type of lending activity, while potentially more profitable than single-family residential lending, is generally more sensitive to regional and local economic conditions, making loss levels more difficult to predict. Collateral evaluation and financial statement analysis in these types of loans requires a more detailed analysis at the time of loan underwriting and on an ongoing basis. In our primary market of western Washington, a further downturn in the real estate market, could increase loan delinquencies, defaults and foreclosures, and significantly impair the value of our collateral and our ability to sell the collateral upon foreclosure. Many of our commercial borrowers have more than one loan outstanding with us. Consequently, an adverse development with respect to one loan or one credit relationship can expose us to a significantly greater risk of loss.
At September 30, 2014 , we had $294.4 million of commercial real estate mortgage loans, representing 48.5% of our total loan portfolio. These loans typically involve higher principal amounts than other types of loans, and repayment is dependent upon income generated, or expected to be generated, by the property securing the loan in amounts sufficient to cover operating expenses and debt service, which may be adversely affected by changes in the economy or local market conditions. For example, if the cash flow from the borrower's project is reduced as a result of leases not being obtained or renewed, the borrower's ability to repay the loan may be impaired. Commercial real estate loans also expose a lender to greater credit risk than loans secured by residential real estate because the collateral securing these loans typically cannot be sold as easily as residential real estate. In addition, many of our commercial real estate loans are not fully amortizing and contain large balloon payments upon maturity. Such balloon payments may require the borrower to either sell or refinance the underlying property in order to make the payment, which may increase the risk of default or non-payment.
A secondary market for most types of commercial real estate loans is not readily liquid, so we have less opportunity to mitigate credit risk by selling part or all of our interest in these loans. As a result of these characteristics, if we foreclose on a commercial real estate loan, our holding period for the collateral typically is longer than for one- to four-family residential mortgage loans because there are fewer potential purchasers of the collateral. Accordingly, charge-offs on commercial real estate loans may be larger as a percentage of the total principal outstanding than those incurred with our residential or consumer loan portfolios.
The level of our commercial real estate loan portfolio may subject us to additional regulatory scrutiny.
The FDIC, the Federal Reserve and the Office of the Comptroller of the Currency have promulgated joint guidance on sound risk management practices for financial institutions with concentrations in commercial real estate lending. Under this guidance, a financial institution that, like us, is actively involved in commercial real estate lending should perform a risk assessment to identify concentrations. A financial institution may have a concentration in commercial real estate lending if, among other factors (i) total reported loans for construction, land development, and other land represent 100% or more of total capital, or (ii) total reported loans secured by multi-family and non-farm residential properties, loans for construction, land development and other land, and loans otherwise sensitive to the general commercial real estate market, including loans to commercial real estate related entities, represent 300% or more of total capital. The particular focus of the guidance is on exposure to commercial real estate loans that are dependent on the cash flow from the real estate held as collateral and that are likely to be at greater risk to conditions in the commercial real estate market (as opposed to real estate collateral held as a secondary source of repayment or as an abundance of caution). The purpose of the guidance is to guide banks in developing risk management practices and capital levels commensurate with the level and nature of real estate concentrations. The guidance states that management should employ heightened risk management practices including board and management oversight and strategic planning, development of underwriting standards, risk assessment and monitoring through market analysis and stress testing. We have concluded that we have a concentration in commercial real estate lending under the foregoing standards because our balance in commercial real estate loans at September 30, 2014 represents more than 300% of total capital. While we believe we have implemented policies and procedures with respect to our commercial real estate loan portfolio consistent with this guidance, bank regulators could require us to implement additional policies and procedures consistent with their interpretation of the guidance that may result in additional costs to us.
Repayment of our commercial business loans is often dependent on the cash flows of the borrower, which may be unpredictable, and the collateral securing these loans may fluctuate in value.
At September 30, 2014 , we had $30.6 million or 5.0% of total loans in commercial business loans. Commercial business lending involves risks that are different from those associated with residential and commercial real estate lending. Real estate lending is generally considered to be collateral based lending with loan amounts based on predetermined loan to collateral values
36
and liquidation of the underlying real estate collateral being viewed as the primary source of repayment in the event of borrower default. Our commercial business loans are primarily made based on the cash flow of the borrower and secondarily on the underlying collateral provided by the borrower. The borrowers' cash flow may be unpredictable, and collateral securing these loans may fluctuate in value. Although commercial business loans are often collateralized by equipment, inventory, accounts receivable, or other business assets, the liquidation of collateral in the event of default is often an insufficient source of repayment because accounts receivable may be uncollectible and inventories may be obsolete or of limited use, among other things. Accordingly, the repayment of commercial business loans depends primarily on the cash flow and credit worthiness of the borrower and secondarily on the underlying collateral provided by the borrower.
Our business may be adversely affected by credit risk associated with residential property.
At September 30, 2014 , $133.4 million, or 22.0% of our total loan portfolio, was secured by one- to four-family mortgage loans and home equity loans. This type of lending is generally sensitive to regional and local economic conditions that significantly impact the ability of borrowers to meet their loan payment obligations, making loss levels difficult to predict. The decline in residential real estate values as a result of the downturn in the Washington housing market has reduced the value of the real estate collateral securing these types of loans and increased the risk that we would incur losses if borrowers default on their loans.
Many of our residential mortgage loans are secured by liens on mortgage properties in which the borrowers have little or no equity because either we originated the loan with a relatively high combined loan-to-value ratio or because of the decline in home values in our market areas subsequent to when the loans were originated. Residential loans with combined higher loan-to-value ratios will be more sensitive to declining property values than those with lower combined loan-to-value ratios and therefore may experience a higher incidence of default and severity of losses. In addition, if the borrowers sell their homes, such borrowers may be unable to repay their loans in full from the sale proceeds. Further, a significant amount of our home equity lines of credit consist of second mortgage loans. For those home equity lines secured by a second mortgage, it is unlikely that we will be successful in recovering all or a portion of our loan proceeds in the event of default unless we are prepared to repay the first mortgage loan and such repayment and the costs associated with a foreclosure are justified by the value of the property. For these reasons, we may experience higher rates of delinquencies, default and losses on our residential loans.
Our provision for loan losses and net charge-offs have fluctuated significantly during recent years compared to historical averages and we may be required to make further increases in our provision for loan losses and to charge-off additional loans in the future, which could adversely affect our results of operations.
For the fiscal year ended September 30, 2014, we recorded no provision for loan losses compared to $2.9 million for the prior fiscal year. We also recorded net loan charge-offs of $709,000 for the fiscal year ended September 30, 2014 as compared to $3.6 million for the prior fiscal year. We are still experiencing, however, elevated levels of loan delinquencies and credit losses as compared to historical standards. Although the housing and real estate markets have recently modestly improved in several of our market areas, until general economic conditions improve further, we expect that we will continue to experience further delinquencies and credit losses. In addition, our portfolio is concentrated in construction loans, land loans, and commercial real estate loans, all of which have a higher risk of loss than residential mortgage loans. As a result, we could be required to make further increases in our provision for loan losses to increase our allowance for loan losses. Our allowance for loan losses was 1.81% of total loans held for investment and 89% of non-performing loans at September 30, 2014 . Any increases in the provision for loan losses will result in a decrease in net income and may have a material adverse effect on our financial condition, results of operations and our capital.
Our allowance for loan losses may prove to be insufficient to absorb losses in our loan portfolio.
Lending money is a substantial part of our business and each loan carries a certain risk that it will not be repaid in accordance with its terms or that any underlying collateral will not be sufficient to assure repayment. This risk is affected by, among other things:
• | the cash flow of the borrower and/or the project being financed; |
• | the changes and uncertainties as to the future value of the collateral, in the case of a collateralized loan; |
• | the duration of the loan; |
• | the credit history of a particular borrower; and |
• | changes in economic and industry conditions. |
We maintain an allowance for loan losses, which is a reserve established through a provision for loan losses charged against operations, which we believe is appropriate to provide for probable losses in our loan portfolio. The amount of this
37
allowance is determined by our management through periodic comprehensive reviews and consideration of several factors, including, but not limited to:
• | an ongoing review of the quality, size and diversity of the loan portfolio; |
• | evaluation of non-performing loans; |
• | historical default and loss experience; |
• | existing economic conditions; |
• | risk characteristics of the various classifications of loans; and |
• | the amount and quality of collateral, including guarantees; securing the loans; |
• | regulatory requirements and expectations. |
The determination of the appropriate level of the allowance for loan losses inherently involves a high degree of subjectivity and requires us to make significant estimates of current credit risks and future trends, all of which may undergo material changes. Deterioration in economic conditions affecting borrowers, new information regarding existing loans, identification of additional problem loans and other factors, both within and outside of our control, may require an increase in the allowance for loan losses. Slower sales, excess inventory and declining prices in the housing market have been the primary causes of the recent increases in delinquencies and foreclosure in our loan portfolio. If current relatively weak conditions in the housing and real estate markets continue, we expect we will continue to experience further delinquencies and credit losses. If charge-offs in future periods exceed the allowance for loan losses we will need additional provisions to replenish the allowance for loan losses. In addition, bank regulatory agencies periodically review our allowance for loan losses and may require an increase in the provision for possible loan losses or the recognition of further loan charge-offs, based on their judgment about information available to them at the time of their examinations. Any additional provisions will result in a decrease in net income and possibly capital, and may have a material adverse effect on our financial condition and results of operations.
If our non-performing assets increase, our earnings will be adversely affected.
At September 30, 2014 our non-performing assets (which consist of non-accruing loans, accruing loans 90 days or more past due, non-accrual investment securities, and other real estate owned and other repossessed assets) were $21.9 million, or 2.94% of total assets. Our non-performing assets adversely affect our net income in various ways:
• | We do not record interest income on non-accrual loans or non-performing investment securities, except on a cash basis when the collectibility of the principal is not in doubt. |
• | We must provide for probable loan losses through a current period charge to the provision for loan losses. |
• | Non-interest expense increases when we must write down the value of properties in our OREO portfolio to reflect changing market values. |
• | Non-interest income decreases when we must recognize other-than-temporary impairment on non-performing investment securities. |
• | There are legal fees associated with the resolution of problem assets, as well as carrying costs, such as taxes, insurance, and maintenance costs related to our OREO. |
• | The resolution of non-performing assets requires the active involvement of management, which can distract them from more profitable activity. |
If additional borrowers become delinquent and do not pay their loans and we are unable to successfully manage our non-performing assets, our losses and troubled assets could increase significantly, which could have a material adverse effect on our financial condition and results of operations.
We have classified an additional $16.8 million in loans as performing troubled debt restructurings at September 30, 2014 .
If our investments in real estate are not properly valued or sufficiently reserved to cover actual losses, or if we are required to increase our valuation allowances, our earnings could be reduced.
We obtain updated valuations in the form of appraisals and broker price opinions when a loan has been foreclosed and the property is taken in as OREO, and at certain other times during the assets holding period. Our net book value ("NBV") in the loan at the time of foreclosure and thereafter is compared to the updated estimated market value of the foreclosed property less estimated selling costs (fair value). A charge-off is recorded for any excess in the asset's NBV over its fair value. If our valuation process is incorrect or if the property declines in value after foreclosure, the fair value of our OREO may not be sufficient to recover our NBV in such assets, resulting in the need for a valuation allowance.
38
In addition, bank regulators periodically review our OREO and may require us to recognize further valuation allowances. Significant charge-offs to our OREO, may have a material adverse effect on our financial condition and results of operations.
Other-than-temporary impairment charges in our investment securities portfolio could result in additional losses.
During the year ended September 30, 2014 , we recognized a $59,000 recovery of other than temporary impairment ("OTTI") charges on private label mortgage backed securities we hold for investment. However during the years ended September 30, 2013 and 2012 we recognized OTTI charges of $47,000 and $214,000, respectively, as management had previously estimated that the decline of the estimated fair value below the cost of these securities was other than temporary and recorded a credit loss through non-interest income. At September 30, 2014 our remaining private label mortgage backed securities portfolio totaled $1.2 million.
We closely monitor our investment securities for changes in credit risk. The valuation of our investment securities also is influenced by external market and other factors, including implementation of Securities and Exchange Commission and Financial Accounting Standards Board guidance on fair value accounting, default rates on residential mortgage securities, rating agency actions, and the prices at which observable market transactions occur. Accordingly, if market conditions deteriorate further and we determine our holdings of private label mortgage backed securities or other investment securities are other than temporarily impaired, our results of operations could be adversely affected.
An increase in interest rates, change in the programs offered by Freddie Mac or our ability to qualify for their programs may reduce our mortgage revenues, which would negatively impact our non-interest income.
The sale of residential mortgage loans to Freddie Mac provides a significant portion of our non-interest income. Any future changes in their program, our eligibility to participate in such program, the criteria for loans to be accepted or laws that significantly affect the activity of Freddie Mac could, in turn, materially adversely affect our results of operations if we could not find other purchasers. Further, in a rising or higher interest rate environment, the demand for mortgage loans, particularly refinancing of existing mortgage loans, tend to fall and our originations of mortgage loans may decrease, resulting in fewer loans that are available to be sold. This would result in a decrease in mortgage revenues and a corresponding decrease in non-interest income. In addition, our results of operations are affected by the amount of non-interest expense associated with our loan sale activities, such as salaries and employee benefits, occupancy, equipment and data processing expense and other operating costs. During periods of reduced loan demand, our results of operations may be adversely affected to the extent that we are unable to reduce expenses commensurate with the decline in loan originations.
Our real estate lending also exposes us to the risk of environmental liabilities.
In the course of our business, we may foreclose and take title to real estate, and we could be subject to environmental liabilities with respect to these properties. We may be held liable by a governmental entity or by third persons for property damage, personal injury, investigation, and clean-up costs incurred by these parties in connection with environmental contamination, or may be required to investigate or clean up hazardous or toxic substances, or chemical releases at a property. The costs associated with investigation or remediation activities could be substantial. In addition, as the owner or former owner of a contaminated site, we may be subject to common law claims by third parties based on damages and costs resulting from environmental contamination emanating from the property. If we ever become subject to significant environmental liabilities, our business, financial condition and results of operations could be materially and adversely affected.
Fluctuating interest rates can adversely affect our profitability.
Our profitability is dependent to a large extent upon net interest income, which is the difference, or spread, between the interest earned on loans, securities and other interest-earning assets and the interest paid on deposits, borrowings, and other interest-bearing liabilities. Because of the differences in maturities and repricing characteristics of our interest-earning assets and interest-bearing liabilities, changes in interest rates do not produce equivalent changes in interest income earned on interest-earning assets and interest paid on interest-bearing liabilities. We principally manage interest rate risk by managing our volume and mix of our earning assets and funding liabilities. In a changing interest rate environment, we may not be able to manage this risk effectively. Changes in interest rates also can affect: (1) our ability to originate and/or sell loans; (2) the fair value of our interest-earning assets, which would negatively impact shareholders' equity, and our ability to realize gains from the sale of such assets; (3) our ability to obtain and retain deposits in competition with other available investment alternatives; (4) the ability of our borrowers to repay adjustable or variable rate loans; and (5) the average duration of our mortgage-backed securities portfolio and the interest-earning assets. Interest rates are highly sensitive to many factors, including government monetary policies, domestic
39
and international economic and political conditions and other factors beyond our control. If we are unable to manage interest rate risk effectively, our business, financial condition and results of operations could be materially affected.
As a result of the relatively low interest rate environment, an increasing percentage of our deposits have been comprised of short-term certificates of deposit and other deposits yielding no or a relatively low rate of interest. At September 30, 2014 , we had $98.5 million in certificates of deposit that mature within one year and $451.8 million in non-interest bearing, NOW checking, savings and money market accounts. We would incur a higher cost of funds to retain these deposits in a rising interest rate environment. Earnings could also be adversely affected if the interest rates received on loans and other investments fall more quickly than the interest rates paid on deposits and other borrowings. In addition, a substantial amount of our residential mortgage loans and home equity lines of credit have adjustable interest rates. As a result, these loans may experience a higher rate of default in a rising interest rate environment.
Although management believes it has implemented effective asset and liability management strategies to reduce the potential effects of changes in interest rates on our results of operations, any substantial, unexpected or prolonged change in market interest rates could have a material adverse effect on our financial condition and results of operations. Also, our interest rate risk modeling techniques and assumptions likely may not fully predict or capture the impact of actual interest rate changes on our balance sheet.
Historically low interest rates may adversely affect our net interest income and profitability.
During the last six years it has been the policy of the Federal Reserve to maintain interest rates at historically low levels through its targeted federal funds rate and until recently the purchase of mortgage-backed securities. As a result, yields on securities we have purchased, and market rates on the loans we have originated, have been at levels lower than were available prior to 2008. Consequently, the average yield on our interest-earning assets has decreased during the recent low interest rate environment. However, our ability to lower our interest expense is limited at these interest rate levels, while the average yield on our interest-earning assets may continue to decrease. The Federal Reserve has indicated its intention to maintain low interest rates in the near future. Accordingly, our net interest income may decrease, which may have an adverse affect on our profitability. For information with respect to changes in interest rates, see "-Fluctuating interest rates can adversely affect our profitability."
Liquidity risk could impair our ability to fund operations and jeopardize our financial condition, growth and prospects.
Liquidity is essential to our business. An inability to raise funds through deposits, borrowings, the sale of loans and other sources could have a substantial negative effect on our liquidity. We rely on customer deposits and advances from the FHLB of Seattle, borrowings from the Federal Reserve Bank of San Francisco ("FRB") and other borrowings to fund our operations. At September 30, 2014 , we had $45.0 million of FHLB advances outstanding and a letter of credit with an available balance of $5.0 million and an additional $171.6 million of available borrowing capacity through the FHLB and the FRB. Although we have historically been able to replace maturing deposits and advances if desired, we may not be able to replace such funds in the future if, among other things, our financial condition, the financial condition of the FHLB or FRB, or market conditions change. Our access to funding sources in amounts adequate to finance our activities or on terms which are acceptable could be impaired by factors that affect us specifically or the financial services industry or economy in general such as a disruption in the financial markets or negative views and expectations about the prospects for the financial services industry in light of the recent turmoil faced by banking organizations and the continued deterioration in credit markets. Factors that could detrimentally impact our access to liquidity sources include a decrease in the level of our business activity as a result of a downturn in the Washington markets where our deposits are concentrated or adverse regulatory action against us.
Our financial flexibility will be severely constrained if we are unable to maintain our access to funding or if adequate financing is not available to accommodate future growth at acceptable interest rates. Although we consider our sources of funds adequate for our liquidity needs, we may seek additional debt in the future to achieve our long-term business objectives. Additional borrowings, if sought, may not be available to us or, if available, may not be available on reasonable terms. If additional financing sources are unavailable, or are not available on reasonable terms, our financial condition, results of operations, growth and future prospects could be materially adversely affected. Finally, if we are required to rely more heavily on more expensive funding sources to support future growth, our income may not increase proportionately to cover our costs.
We operate in a highly regulated environment and may be adversely affected by changes in federal and state laws and regulations, that are expected to increase our costs of operations.
The financial services industry is extensively regulated. Timberland Bank is currently subject to extensive examination, supervision and comprehensive regulation by the DFI, our state regulator, and the FDIC, as insurer of our deposits. As a bank holding company, Timberland Bancorp is subject to examination, supervision and regulation by the Federal Reserve. Such
40
regulation and supervision governs the activities in which an institution and its holding company may engage, and are intended primarily for the protection of the deposit insurance fund and consumers and not to benefit our shareholders. These regulatory authorities have extensive discretion in connection with their supervisory and enforcement activities, including the ability to impose restrictions on our operations, the classification of our assets, and the determination of the level of our allowance for loan losses and level of deposit insurance premiums assessed. Additionally, actions by regulatory agencies or significant litigation against us could require us to devote significant time and resources to defending our business and may lead to penalties that materially affect us. These regulations, along with the currently existing tax, accounting, securities, insurance, and monetary laws, regulations, rules, standards, policies, and interpretations control the methods by which financial institutions conduct business, implement strategic initiatives and tax compliance, and govern financial reporting and disclosures. Any change in such regulation and oversight, whether in the form of regulatory policy, regulations, legislation or supervisory action, may have a material impact on our operations.
As discussed under "Business - Regulation of the Bank - Financial Regulatory Reform" in Item I of this Form 10-K, the Dodd-Frank Act has significantly changed the bank regulatory structure and will affect the lending, deposit, investment, trading and operating activities of financial institutions and their holding companies. The Dodd-Frank Act requires various federal agencies to adopt and implement a broad range of new rules and regulations, and to prepare numerous studies and reports for Congress. The federal agencies are given significant discretion in drafting and implementing rules and regulations, and consequently, many of the details and much of the impact of the Dodd-Frank Act may not be known for many months or years. It is difficult at this time to predict when or how any new standards will ultimately be applied to us or what specific impact the Dodd-Frank Act and the yet to be written rules and regulations for implementation will have on community banks. However, it is expected that at a minimum they will increase our operating and compliance costs and could increase our non-interest expense.
The short-term and long-term impact of the changing regulatory capital requirements and new capital rules is uncertain.
As discussed under "Business - Regulation of the Bank - New Capital Rules" in Item I of this Form 10-K, effective January 1, 2015, Timberland Bancorp and Timberland Bank will be subject to new capital requirements under regulations adopted by the federal banking regulators to implement the Basel III regulatory capital reforms and changes required by the Dodd-Frank Act. These new requirements establish the following minimum capital ratios: (1) a common equity Tier 1 ("CET1") capital ratio of 4.5% of risk-weighted assets; (2) a Tier 1 capital ratio of 6.0% of risk-weighted assets; (3) a total capital ratio of 8.0% of risk-weighted assets; and (4) a leverage ratio of 4.0%. In addition, there is a new requirement to maintain a capital conservation buffer, comprised of CET1 capital, in an amount greater than 2.5% of risk-weighted assets over the minimum capital required by each of the minimum risk-based capital ratios in order to avoid limitations on the organization's ability to pay dividends, repurchase shares or pay discretionary bonuses. The capital conservation buffer requirement will be phased in, beginning January 1, 2016, requiring during 2016 a buffer amount greater than 0.625% in order to avoid these limitations, and increasing the amount each year until beginning January 1, 2019, the buffer amount must be greater than 2.5% in order to avoid the limitation.
The new regulations also change what qualifies as capital for purposes of meeting these various capital requirements, as well as the risk-weights of certain assets for purposes of the risk-based capital ratios. Under the new regulations, in order to be considered well-capitalized for prompt corrective action purposes, Timberland Bank will be required to maintain the following ratios: (1) a CET1 ratio of at least 6.5% of risk-weighted assets; (2) a Tier 1 capital ratio of at least 8.0% of risk-weighted assets; (3) a total capital ratio of at least 10.0% of risk-weighted assets; and (4) a leverage ratio of at least 5.0%.
We have conducted a pro forma analysis of these new requirements as of September 30, 2014. We have determined that if these requirements were in effect on that date, Timberland Bancorp and Timberland Bank would be considered well-capitalized.
The application of these more stringent capital requirements could, among other things, result in lower returns on invested capital, over time require the raising of additional capital, and result in regulatory actions if we were to be unable to comply with such requirements. Implementation of changes to asset risk weightings for risk based capital calculations, items included or deducted in calculating regulatory capital and/or additional capital conservation buffers could result in management modifying its business strategy and could limit our ability to make distributions, including paying out dividends or buying back shares. Furthermore, the imposition of liquidity requirements in connection with the implementation of Basel III could result in our having to lengthen the term of our funding, restructure our business models, and/or increase our holdings of liquid assets. Any additional changes in our regulation and oversight, in the form of new laws, rules and regulations could make compliance more difficult or expensive or otherwise materially adversely affect our business, financial condition or prospects.
Our growth or future losses may require us to raise additional capital in the future, but that capital may not be available when it is needed or the cost of that capital may be very high.
We are required by federal regulatory authorities to maintain adequate levels of capital to support our operations. At some point, we may need to raise additional capital to support our growth or replenish future losses. Our ability to raise additional
41
capital, if needed, will depend on conditions in the capital markets at that time, which are outside our control, and on our financial condition and performance. If we are able to raise capital it may not be on terms that are acceptable to us. Accordingly, we cannot make assurances that we will be able to raise additional capital. If we cannot raise additional capital when needed, our operations could be materially impaired and our financial condition and liquidity could be materially and adversely affected. As a result, we may have to raise additional capital on terms that may be dilutive to our shareholders.
We may experience future goodwill impairment, which could reduce our earnings.
We performed our test for goodwill impairment for fiscal year 2014, and the test concluded that recorded goodwill was not impaired. Our assessment of the fair value of goodwill is based on an evaluation of market capitalizations for similar financial institutions, discounted cash flows from forecasted earnings, our current market capitalization, and a valuation of our assets and liabilities. Our evaluation of the fair value of goodwill involves a substantial amount of judgment. If our judgment was incorrect, or if events or circumstances change, and an impairment of goodwill was deemed to exist, we would be required to write down our goodwill resulting in a charge against operations, which would adversely affect our results of operations, perhaps materially; however, it would have no impact on our liquidity, operations or regulatory capital.
Our investment in Federal Home Loan Bank of Seattle stock may become impaired.
At September 30, 2014 , we owned $5.2 million in FHLB stock. As a condition of membership at the FHLB, we are required to purchase and hold a certain amount of FHLB stock. Our stock purchase requirement is based, in part, upon the outstanding principal balance of advances from the FHLB and is calculated in accordance with the Capital Plan of the FHLB. Our FHLB stock has a par value of $100, is recorded at cost, and it is subject to recoverability testing per applicable accounting standards. The FHLB has announced that it had a risk-based capital deficiency under the regulations of the Federal Housing Finance Agency (the "FHFA"), its primary regulator, as of December 31, 2008, and that it would suspend future dividends and the repurchase and redemption of outstanding common stock. In September 2012, the FHLB announced that the FHFA reclassified the FHLB of Seattle to be adequately capitalized. The FHLB also announced that it had been granted authority to repurchase up to $25 million of excess capital stock per quarter, provided they receive a non-objection from the FHFA. As of September 30, 2014, the FHLB had repurchased $409,000 of its stock, at par, from Timberland Bank. The FHLB announced in July 2013 that, based on its second quarter 2013 financial results, their Board of Directors had declared a $0.025 per share cash dividend. This represented the first dividend in a number of years and represents a significant milestone in FHLB's return to normal operations. Subsequently, the FHLB has declared additional cash dividends. As a result, we have not recorded an impairment on our investment in FHLB stock. Deterioration in the FHLB's financial position may, however, result in future impairment in the value of those securities. We will continue to monitor the financial condition of the FHLB as it relates to, among other things, the recoverability of our investments. On September 25, 2014, the FHLB of Des Moines and the FHLB of Seattle announced that they have entered into an agreement to merge the two banks. A merger will require approval from the FHFA, as well as member-owners of the FHLB of Des Moines and the FHLB of Seattle. Although the agreement is still in process and has not yet been finalized and approved by regulatory agencies, management expects that the pending merger will positively affect the Company's recoverability of its investment in FHLB stock and continue to allow the Bank to obtain borrowings consistent with historical FHLB funding practices.
We may experience decreases in the fair value of our mortgage servicing rights, which could reduce our earnings.
Mortgage servicing rights ("MSRs") are capitalized at estimated fair value when acquired through the origination of loans that are subsequently sold with servicing rights retained. At September 30, 2014 our MSRs totaled $1.7 million. MSRs are amortized to servicing income on loans sold over the period of estimated net servicing income. The estimated fair value of MSRs at the date of the sale of loans is determined based on the discounted present value of expected future cash flows using key assumptions for servicing income and costs and prepayment rates on the underlying loans. On a quarterly basis we evaluate the fair value of MSRs for impairment by comparing actual cash flows and estimated cash flows from the servicing assets to those estimated at the time servicing assets were originated. Our methodology for estimating the fair value of MSRs is highly sensitive to changes in assumptions, such as prepayment speeds. The effect of changes in market interest rates on estimated rates of loan prepayments represents the predominant risk characteristic underlying the MSRs portfolio. For example, a decrease in mortgage interest rates typically increases the prepayment speeds of MSRs and therefore decreases the fair value of the MSRs. Future decreases in mortgage interest rates could decrease the fair value of our MSRs below their recorded amount, which would decrease our earnings.
42
Our assets as of September 30, 2014 include a deferred tax asset and we may not be able to realize the full amount of such asset.
We recognize deferred tax assets and liabilities based on differences between the financial statement recorded amounts and the tax bases of assets and liabilities. At September 30, 2014 , the net deferred tax asset was approximately $2.3 million. The net deferred tax asset results primarily from our provision for loan losses recorded for financial reporting purposes, which has been larger than net loan charge-offs deducted for tax reporting purposes.
We regularly review our net deferred tax assets for recoverability based on our expectations of future earnings and expected timing of reversals of temporary differences and record a valuation allowance if deemed necessary. Realization of deferred tax assets ultimately depends on the existence of sufficient taxable income, including taxable income in prior carry-back years, as well as future taxable income. We believe the recorded net deferred tax asset at September 30, 2014 is fully realizable; however, if we determine that we will be unable to realize all or part of the net deferred tax asset, we would adjust the net deferred tax asset, which would negatively impact our financial condition and results of operations.
The warrant we issued to the Treasury in connection with the Series A Preferred Stock issued in December 2008 may be dilutive to holders of our common stock.
On June 12, 2013, the Treasury sold, to private investors, the warrant to purchase up to 370,899 shares of our common stock at a price of $6.73 per share at any time through December 23, 2018. The sale of the warrant to new owners did not result in any proceeds to the Company and did not change the Company's capital position or accounting for the warrant. The ownership interest of the existing holders of our common stock will be diluted to the extent the warrant we issued in conjunction with the sale of the Series A Preferred Stock is exercised. The shares of common stock underlying the warrant represent approximately 5.0% of the shares of our common stock outstanding as of September 30, 2014 (including the shares issuable upon exercise of the warrant in total shares outstanding).
Changes in accounting standards may affect our performance.
Our accounting policies and methods are fundamental to how we record and report our financial condition and results of operations. From time to time there are changes in the financial accounting and reporting standards that govern the preparation of our financial statements. These changes can be difficult to predict and can materially impact how we report and record our financial condition and results of operations.
We are subject to a variety of operational risks, including legal and compliance risk, fraud and theft risk and the risk of operational errors, which may adversely affect our business and results of operations.
We are from time to time subject to claims and proceedings related to our operations. These claims and legal actions, which could include supervisory or enforcement actions by our regulators, or criminal proceedings, could involve large monetary claims, including civil money penalties or fines imposed by government authorities, and significant defense costs. To mitigate the cost of some of these claims, we maintain insurance coverage in amounts and with deductibles that we believe are appropriate for our operations.
Both internal and external fraud and theft are risks. If personal, non-public, confidential or proprietary information of customers in our possession were to be mishandled or misused, we could suffer significant regulatory consequences, reputational damage and financial loss. Such mishandling or misuse could include, for example, if such information were erroneously provided to parties who are not permitted to have the information, either by fault of our systems, employees, or counterparties, or if such information were to be intercepted or otherwise inappropriately taken by third parties.
Operational errors include clerical or record-keeping errors or those resulting from faulty or disabled computer or telecommunications systems. Because the nature of the financial services business involves a high volume of transactions, certain errors may be repeated or compounded before they are discovered and successfully rectified. Because of our large transaction volume and our necessary dependence upon automated systems to record and process these transactions there is a risk that technical flaws or tampering or manipulation of those automated systems arising from events wholly or partially beyond our control may give rise to a disruption of service to customers and to financial loss or liability. We are exposed to the risk that our business continuity and data security systems may prove to be inadequate.
The occurrence of any of these risks could result in a diminished ability to operate our business, additional costs to correct defects, potentially liability to clients, reputational damage and regulatory intervention, any of which could adversely affect our business, financial condition and results of operations.
43
We are subject to certain risks in connection with our use of technology.
Our security measures may not be sufficient to mitigate the risk of a cyber attack. Communications and information systems are essential to the conduct of our business, as we use such systems to manage our customer relationships, our general ledger and virtually all other aspects of our business. Our operations rely on the secure processing, storage, and transmission of confidential and other information in our computer systems and networks. Although we take protective measures and endeavor to modify them as circumstances warrant, the security of our computer systems, software, and networks may be vulnerable to breaches, unauthorized access, misuse, computer viruses, or other malicious code and cyber attacks that could have a security impact. If one or more of these events occur, this could jeopardize our or our customers' confidential and other information processed and stored in, and transmitted through, our computer systems and networks, or otherwise cause interruptions or malfunctions in our operations or the operations of our customers or counterparties. We may be required to expend significant additional resources to modify our protective measures or to investigate and remediate vulnerabilities or other exposures, and we may be subject to litigation and financial losses that are either not insured against or not fully covered through any insurance maintained by us. We could also suffer significant reputational damage.
Security breaches in our internet banking activities could further expose us to possible liability and damage our reputation. Any compromise of our security also could deter customers from using our internet banking services that involve the transmission of confidential information. We rely on standard internet security systems to provide the security and authentication necessary to effect secure transmission of data. These precautions may not protect our systems from compromises or breaches of our security measures, and could result in significant legal liability and significant damage to our reputation and our business.
Our security measures may not protect us from system failures or interruptions. While we have established policies and procedures to prevent or limit the impact of systems failures and interruptions, there can be no assurance that such events will not occur or that they will be adequately addressed if they do. In addition, we outsource certain aspects of our data processing and other operational functions to certain third-party providers. If our third-party providers encounter difficulties, or if we have difficulty in communicating with them, our ability to adequately process and account for transactions could be affected, and our business operations could be adversely impacted. Threats to information security also exist in the processing of customer information through various other vendors and their personnel.
The occurrence of any failures or interruptions may require us to identify alternative sources of such services, and we cannot assure you that we could negotiate terms that are as favorable to us, or could obtain services with similar functionality as found in our existing systems without the need to expend substantial resources, if at all. Further, the occurrence of any systems failure or interruption could damage our reputation and result in a loss of customers and business, could subject us to additional regulatory scrutiny, or could expose us to legal liability. Any of these occurrences could have a material adverse effect on our financial condition and results of operations.
We are dependent on key personnel and the loss of one or more of those key personnel may materially and adversely affect our prospects.
Competition for qualified employees and personnel in the banking industry is intense and there are a limited number of qualified persons with knowledge of, and experience in, the community banking industry where the Bank conducts its business. The process of recruiting personnel with the combination of skills and attributes required to carry out our strategies is often lengthy. Our success depends to a significant degree upon our ability to attract and retain qualified management, loan origination, finance, administrative, marketing and technical personnel and upon the continued contributions of our management and personnel. In particular, our success has been and continues to be highly dependent upon the abilities of key executives, including our President, and certain other employees. In addition, our success has been and continues to be highly dependent upon the services of our directors, and we may not be able to identify and attract suitable candidates to replace such directors.
Damage to our reputation could significantly harm our business, including our competitive position and business prospects.
We are dependent on our reputation within our market area, as a trusted and responsible financial company, for all aspects of our relationships with customers, employees, vendors, third-party service providers, and others, with whom we conduct business or potential future business. Our ability to attract and retain customers and employees could be adversely affected if our reputation is damaged. Our actual or perceived failure to address various issues could give rise to reputational risk that could cause harm to us and our business prospects. These issues also include, but are not limited to, legal and regulatory requirements; properly maintaining customer and employee personal information; record keeping; money-laundering; sales and trading practices; ethical issues; appropriately addressing potential conflicts of interest; and the proper identification of the legal, reputational, credit, liquidity and market risks inherent in our products. Failure to appropriately address any of these issues could also give rise to additional regulatory restrictions and legal risks, which could among other
44
consequences, increase the size and number of litigation claims and damages asserted or subject us to enforcement actions, fines and penalties and cause us to incur related costs and expenses.
We rely on other companies to provide key components of our business infrastructure.
Third party vendors provide key components of our business infrastructure such as internet connections, network access and core application processing. While we have selected these third party vendors carefully, we do not control their actions. Any problems caused by these third parties, including as a result of their not providing us their services for any reason or their performing their services poorly could adversely affect our ability to deliver products and services to our customers or otherwise conduct our business efficiently and effectively. Replacing these third party vendors could also entail significant delay and expense.
Item 1B. Unresolved Staff Comments
Not applicable.
Item 2. Properties
At September 30, 2014 the Bank operated 22 full service facilities. The following table sets forth certain information regarding the Bank's offices, all of which are owned, except for the Tacoma office, the Gig Harbor office and the Lacey office at 1751 Circle Lane SE, which are leased.
Location |
| Year Opened |
| Approximate Square Footage |
| Deposits at September 30, 2014 | |||
|
|
|
|
|
| (In thousands) | |||
Main Office: |
|
|
|
|
|
| |||
|
|
|
|
|
|
| |||
624 Simpson Avenue Hoquiam, Washington 98550 |
| 1966 |
| 7,700 | |
| $ | 76,670 | |
|
|
|
|
| |
|
| | |
Branch Offices: |
|
|
|
| |
|
| | |
|
|
|
|
|
|
| |||
300 N. Boone Street Aberdeen, Washington 98520 |
| 1974 |
| 3,400 | |
| 32,198 | | |
|
|
|
|
| |
|
| | |
201Main Street South Montesano, Washington 98563 |
| 2004 |
| 3,200 | |
| 30,010 | | |
|
|
|
|
| |
|
| | |
361 Damon Road Ocean Shores, Washington 98569 |
| 1977 |
| 2,100 | |
| 21,666 | | |
|
|
|
|
| |
|
| | |
2418 Meridian Avenue East Edgewood, Washington 98371 |
| 1980 |
| 2,400 | |
| 38,994 | | |
|
|
|
|
|
|
| |||
202 Auburn Way South Auburn, Washington 98002 |
| 1994 |
| 4,200 | |
| 24,768 | | |
|
|
|
|
|
|
| |||
12814 Meridian Avenue East (South Hill) Puyallup, Washington 98373 |
| 1996 |
| 4,200 | |
| 37,221 | | |
|
|
|
|
|
|
| |||
1201 Marvin Road, N.E. Lacey, Washington 98516 |
| 1997 |
| 4,400 | |
| 19,868 | | |
|
|
|
|
|
|
| |||
101 Yelm Avenue W. Yelm, Washington 98597 |
| 1999 |
| 3,400 | |
| 19,131 | | |
|
|
|
|
|
|
| |||
20464 Viking Way NW Poulsbo, Washington 98370 |
| 1999 |
| 1,800 | |
| 13,443 | | |
|
|
|
|
|
|
| |||
2419 224 th Street E. Spanaway, Washington 98387 |
| 1999 |
| 3,900 | |
| 32,343 | | |
|
|
|
|
|
|
| | ||
801 Trosper Road SW Tumwater, Washington 98512 |
| 2001 |
| 3,300 | |
| 27,404 | | |
(table continued on the following page) | |||||||||
45
Location |
| Year Opened |
| Approximate Square Footage |
| Deposits at September 30, 2014 |
|
|
|
|
|
| (In thousands) |
7805 South Hosmer Street |
| 2001 |
| 5,000 | |
| $ | 35,036 | |
|
|
|
|
|
|
| | ||
2401 Bucklin Hill Road |
| 2003 |
| 4,000 | |
| 36,589 | | |
|
|
|
|
| |
|
| | |
423 Washington Street SE |
| 2003 |
| 3,000 | |
| 19,532 | | |
|
|
|
|
| |
|
| | |
3105 Judson Street |
| 2004 |
| 2,700 | |
| 23,983 | | |
|
|
|
|
| |
|
| ||
117 N. Broadway |
| 2004 |
| 3,700 | |
| 22,847 | | |
|
|
|
|
| |
|
| | |
313 West Waldrip Street |
| 2004 |
| 5,900 | |
| 27,104 | | |
|
|
|
|
| |
|
| | |
1751 Circle Lane SE |
| 2004 |
| 900 | |
| 13,481 | | |
|
|
|
|
| |
|
| | |
101 2nd Street |
| 2004 |
| 1,800 | |
| 26,346 | | |
|
|
|
|
| |
|
| | |
209 NE 1st Street |
| 2004 |
| 3,400 | |
| 16,241 | | |
|
|
|
|
| |
|
| | |
714 W. Main Street |
| 2009 |
| 4,600 | |
| 20,241 | | |
|
|
|
|
| |
|
| | |
Loan Center/Data Center: |
|
|
|
| |
|
| | |
|
|
|
|
|
|
| |||
120 Lincoln Street |
| 2003 |
| 6,000 | |
| N/A | | |
|
|
|
|
| |
|
| | |
Administrative Offices: |
|
|
|
| |
|
| | |
|
|
|
|
|
|
| |||
305 8th Street Hoquiam, Washington 98550 |
| 2004 |
| 4,100 | |
| N/A | | |
Management believes that all facilities are appropriately insured and are adequately equipped for carrying on the business of the Bank.
At September 30, 2014 the Bank operated 23 proprietary ATMs that are part of a nationwide cash exchange network.
Item 3. Legal Proceedings
Periodically, there have been various claims and lawsuits involving the Company, such as claims to enforce liens, condemnation proceedings on properties in which the Company holds security interests, claims involving the making and servicing of real property loans and other issues incident to the Company's business. The Company is not a party to any pending legal proceedings that it believes would have a material adverse effect on the financial condition or operations of the Company.
Item 4. Mine Safety Disclosures
Not applicable.
46
PART II
Item 5. Market for Registrant's Common Equity, Related Stockholder Matters and Issuer Purchases of Equity Securities
The Company's common stock is traded on the Nasdaq Global Market under the symbol "TSBK." As of November 30, 2014, there were 7,052,036 shares of common stock issued and approximately 496 shareholders of record. The following table sets forth the high and low sales prices of, and dividends paid on, the Company's common stock for each quarter during the years ended September 30, 2014 and 2013 . The high and low price information was provided by the Nasdaq Stock Market.
Fiscal 2014 | High |
| Low |
| Dividends per Common Share | ||||||
First Quarter | $ | 9.76 | |
| $ | 8.28 | |
| $ | 0.03 | |
Second Quarter | 11.59 | |
| 9.61 | |
| 0.04 | | |||
Third Quarter | 11.00 | |
| 10.37 | |
| 0.04 | | |||
Fourth Quarter | 10.98 | |
| 10.27 | |
| 0.05 | | |||
Fiscal 2013 | High |
| Low |
| Dividends per | ||||||
First Quarter | $ | 6.94 | |
| $ | 5.77 | |
| $ | - | |
Second Quarter | 8.90 | |
| 6.66 | |
| 0.03 | | |||
Third Quarter | 8.46 | |
| 7.98 | |
| 0.03 | | |||
Fourth Quarter | 9.24 | |
| 8.25 | |
| 0.03 | | |||
Dividends
The timing and amount of cash dividends paid on our common stock depends on our earnings, capital requirements, financial condition and other relevant factors and is subject to the discretion of our board of directors. There can be no assurance that we will pay dividends on our common stock in the future.
Dividend payments by the Company are dependent primarily on dividends received by the Company from the Bank. Under federal regulations, the dollar amount of dividends the Bank may pay is dependent upon its capital position and recent net income. Generally, if the Bank satisfies its regulatory capital requirements, it may make dividend payments up to the limits prescribed in the FDIC regulations. However, an institution that has converted to a stock form of ownership may not declare or pay a dividend on, or repurchase any of, its common stock if the effect thereof would cause the regulatory capital of the institution to be reduced below the amount required for the liquidation account which was established in connection with the mutual to stock conversion.
The DFI has the power to require any bank to suspend the payment of any and all dividends. In addition, under Washington law, no bank may declare or pay any dividend in an amount greater than its retained earnings without the prior approval of the DFI. Further, under Washington law, Timberland Bancorp is prohibited if, after making such dividend payment, it would be unable to pay its debts as they become due in the usual course of business, or if its total liabilities, plus the amount that would be needed, in the event Timberland Bancorp were to be dissolved at the time of the dividend payment, to satisfy preferential rights on dissolution of holders of preferred stock ranking senior in right of payment to the capital stock on which the applicable distribution is to be made, exceed our total assets.
In addition to the foregoing regulatory considerations, there are numerous governmental requirements and regulations that affect our business activities. A change in applicable statutes, regulations or regulatory policy may have a material effect on our business and on our ability to pay dividends on our common stock.
Equity Compensation Plan Information
The equity compensation plan information presented under subparagraph (d) in Part III, Item 12. of this Form 10-K is incorporated herein by reference.
47
Stock Repurchases
The Company is subject to certain restrictions on its ability to repurchase its common stock. The Company is required to give the Federal Reserve prior written notice of any purchase or redemption of its outstanding equity securities if the consideration for the purchase or redemption, when combined with the net consideration paid for all such purchases or redemptions during the preceding 12 months, is equal to 10% or more of its consolidated net worth. The Federal Reserve may disapprove a purchase or redemption if it determines that the proposal would constitute an unsafe or unsound practice or would violate any law, regulation, Federal Reserve order, or any condition imposed by, or written agreement with, the Federal Reserve. The Company did not repurchase any shares of its common stock during the year ended September 30, 2014 .
Five-Year Stock Performance Graph
The following graph compares the cumulative total shareholder return on our common stock with the cumulative total return on the Nasdaq U.S. Companies Index and with the SNL $500 million to $1 Billion Asset Thrift Index, peer group indices. Total return assumes the reinvestment of all dividends and that the value of the Company's Common Stock and each index was $100 on September 30, 2009.
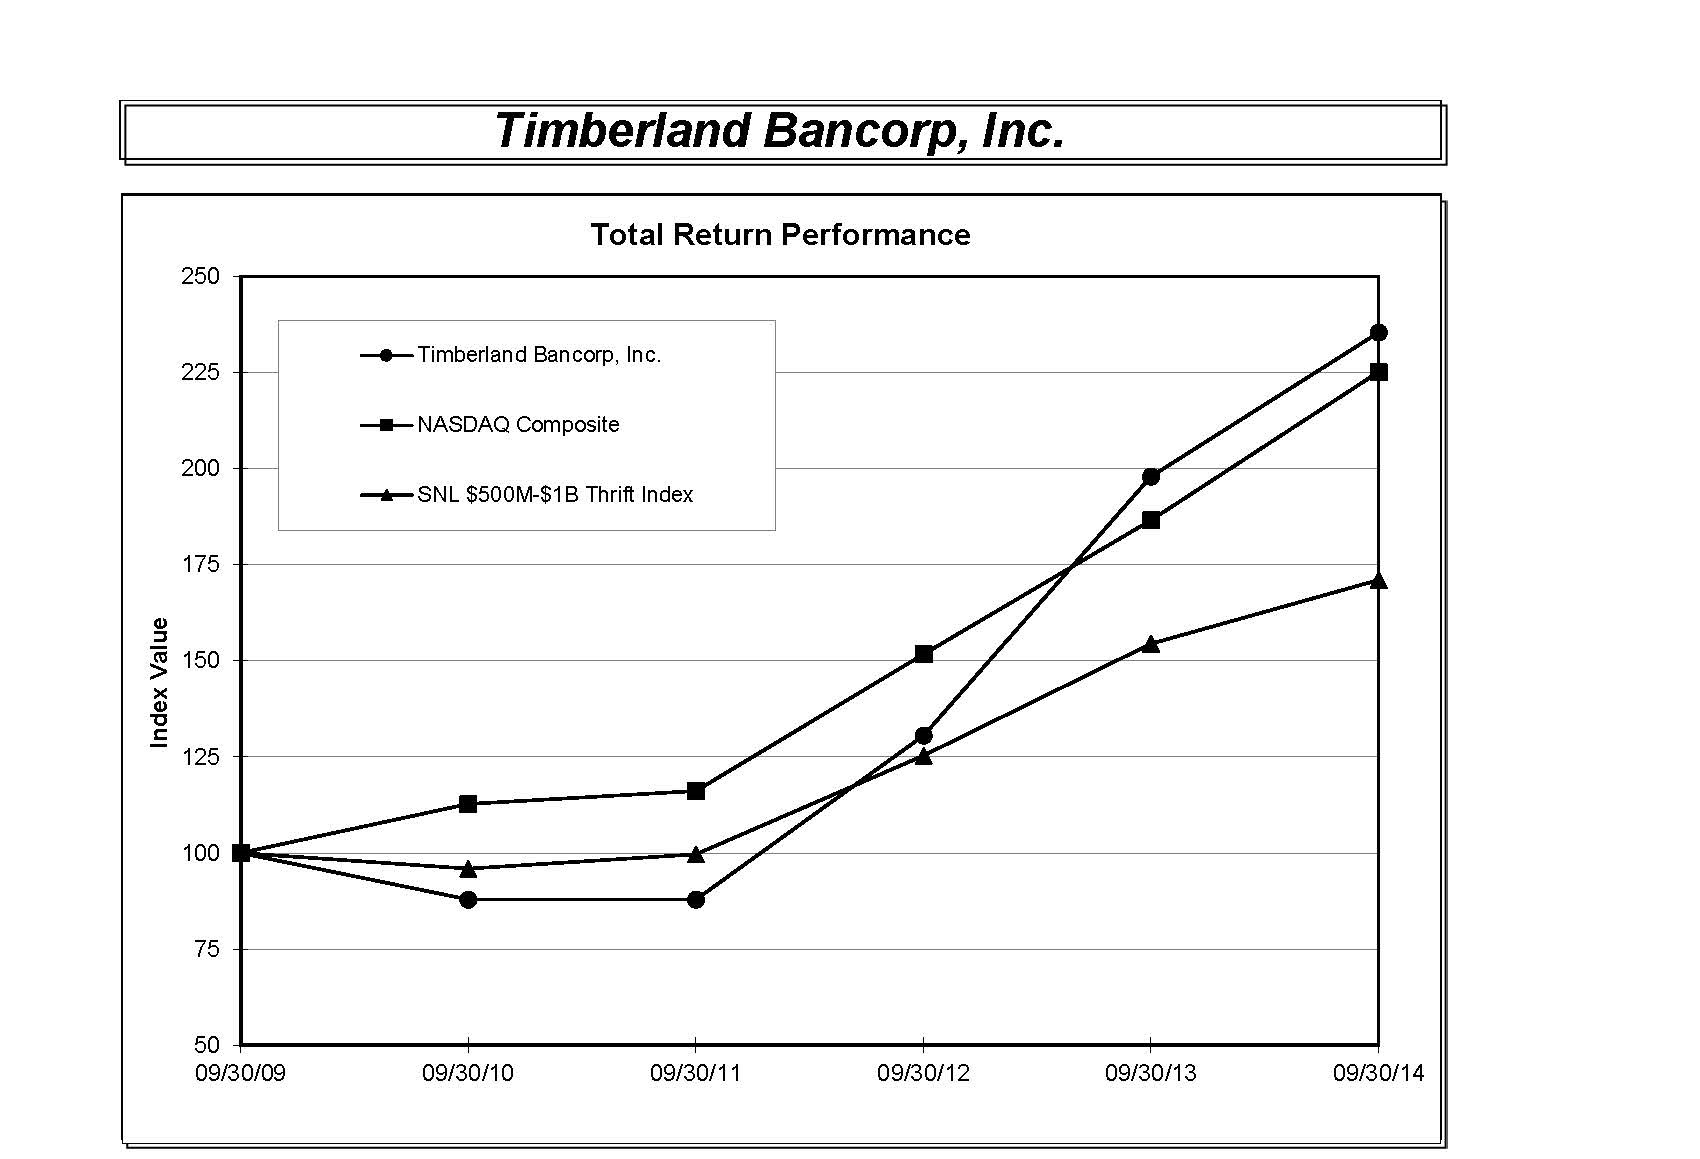
|
| Period Ended |
|
| |||||||||||||||
| Index | 9/30/2009 | | 9/30/2010 | | 9/30/2011 | | 9/30/2012 | | 9/30/2013 | | 9/30/2014 | | ||||||
| Timberland Bancorp, Inc. | $ | 100.00 | | $ | 87.90 | | $ | 87.91 | | $ | 130.55 | | $ | 197.94 | | $ | 235.42 | |
| NASDAQ Composite | 100.00 | | 112.74 | | 116.12 | | 151.70 | | 186.60 | | 225.17 | | ||||||
| SNL $500M-$1B Thrift Index * | 100.00 | | 95.92 | | 99.68 | | 125.36 | | 154.48 | | 171.03 | | ||||||
* Source: SNL Financial LC, Charlottesville, VA
48
Item 6. Selected Financial Data
The following table sets forth certain information concerning the consolidated financial position and results of operations of the Company and its subsidiary at and for the dates indicated. The consolidated data is derived in part from, and should be read in conjunction with, the Consolidated Financial Statements of the Company and its subsidiary presented herein.
| At September 30, | ||||||||||||||||||
| 2014 |
| 2013 |
| 2012 |
| 2011 |
| 2010 | ||||||||||
| (In thousands) | ||||||||||||||||||
SELECTED FINANCIAL CONDITION DATA: |
|
|
|
|
|
|
|
|
| ||||||||||
Total assets | $ | 745,565 | |
| $ | 745,648 | |
| $ | 736,954 | |
| $ | 738,224 | |
| $ | 742,687 | |
Loans receivable and loans held for sale, net | 565,752 | |
| 548,104 | |
| 538,480 | |
| 528,024 | |
| 527,591 | | |||||
Securities held-to-maturity | 5,298 | |
| 2,737 | |
| 3,339 | |
| 4,145 | |
| 5,066 | | |||||
Securities available-for-sale | 2,857 | |
| 4,101 | |
| 4,945 | |
| 6,717 | |
| 11,119 | | |||||
FHLB Stock | 5,246 | |
| 5,452 | |
| 5,655 | |
| 5,705 | |
| 5,705 | | |||||
Cash and due from financial institutions, interest-bearing deposits in banks and fed funds sold | 72,354 | |
| 94,496 | |
| 96,668 | |
| 112,065 | |
| 111,786 | | |||||
Certificates of deposit held for investment | 35,845 | |
| 30,042 | |
| 23,490 | |
| 18,659 | |
| 18,047 | | |||||
OREO and other repossessed assets | 9,092 | |
| 11,720 | |
| 13,302 | |
| 10,811 | |
| 11,519 | | |||||
Deposits | 615,116 | |
| 608,262 | |
| 597,926 | |
| 592,678 | |
| 578,869 | | |||||
FHLB advances | 45,000 | |
| 45,000 | |
| 45,000 | |
| 55,000 | |
| 75,000 | | |||||
Shareholders' equity | 82,778 | |
| 89,688 | |
| 90,319 | |
| 86,205 | |
| 85,408 | | |||||
|
|
|
|
|
|
|
|
|
| ||||||||||
| Year Ended September 30, | ||||||||||||||||||
| 2014 | |
| 2013 | |
| 2012 | |
| 2011 | |
| 2010 | | |||||
| (In thousands, except per share data) | ||||||||||||||||||
SELECTED OPERATING DATA: |
| |
|
| |
|
| |
|
| |
|
| | |||||
Interest and dividend income | $ | 29,857 | |
| $ | 30,237 | |
| $ | 31,605 | |
| $ | 33,966 | |
| $ | 36,596 | |
Interest expense | 3,939 | |
| 4,439 | |
| 5,947 | |
| 8,533 | |
| 10,961 | | |||||
Net interest income | 25,918 | |
| 25,798 | |
| 25,658 | |
| 25,433 | |
| 25,635 | | |||||
Provision for loan losses | - | |
| 2,925 | |
| 3,500 | |
| 6,758 | |
| 10,550 | | |||||
Net interest income after provision for loan losses | 25,918 | |
| 22,873 | |
| 22,158 | |
| 18,675 | |
| 15,085 | | |||||
Non-interest income | 8,530 | |
| 10,262 | |
| 9,781 | |
| 8,681 | |
| 5,696 | | |||||
Non-interest expense | 25,798 | |
| 25,864 | |
| 25,568 | |
| 25,963 | |
| 24,641 | | |||||
Income (loss) before income taxes | 8,650 | |
| 7,271 | |
| 6,371 | |
| 1,393 | |
| (3,860 | ) | |||||
Provision (benefit) for federal income taxes | 2,800 | |
| 2,514 | |
| 1,781 | |
| 304 | |
| (1,569 | ) | |||||
Net income (loss) | 5,850 | |
| 4,757 | |
| 4,590 | |
| 1,089 | |
| (2,291 | ) | |||||
Preferred stock dividends | (136 | ) |
| (710 | ) |
| (832 | ) |
| (832 | ) |
| (832 | ) | |||||
Preferred stock accretion | (70 | ) |
| (283 | ) |
| (240 | ) |
| (225 | ) |
| (210 | ) | |||||
Discount on redemption of preferred stock | - | |
| 255 | |
| - | |
| - | |
| - | | |||||
Net income (loss) to common shareholders | $ | 5,644 | |
| $ | 4,019 | |
| $ | 3,518 | |
| $ | 32 | |
| $ | (3,333 | ) |
|
|
|
|
|
|
|
|
|
| ||||||||||
Net income (loss) per common share: |
| |
|
| |
|
| |
|
| |
|
| | |||||
Basic | $ | 0.82 | |
| $ | 0.59 | |
| $ | 0.52 | |
| $ | - | |
| $ | (0.50 | ) |
Diluted | $ | 0.80 | |
| $ | 0.58 | |
| $ | 0.52 | |
| $ | - | |
| $ | (0.50 | ) |
Dividends per common share | $ | 0.16 | |
| $ | 0.09 | |
| $ | - | |
| $ | - | |
| $ | 0.04 | |
Dividend payout ratio (1) | 32.34 | % |
| 15.80 | % |
| N/A | |
| N/A | |
| N/A | | |||||
49
_______________
(1) | Cash dividends to common shareholders divided by net income to common shareholders. |
| At September 30, | |||||||||||||
| 2014 |
| 2013 |
| 2012 |
| 2011 |
| 2010 | |||||
OTHER DATA: |
|
|
|
|
|
|
|
|
| |||||
Number of real estate loans outstanding | 2,700 | |
| 2,712 | |
| 2,704 | |
| 2,796 | |
| 2,919 | |
Deposit accounts | 52,656 | |
| 54,809 | |
| 55,848 | |
| 56,152 | |
| 55,598 | |
Full-service offices | 22 | |
| 22 | |
| 22 | |
| 22 | |
| 22 | |
| At or For the Year Ended September 30, | |||||||||||||
| 2014 |
| 2013 |
| 2012 |
| 2011 |
| 2010 | |||||
KEY FINANCIAL RATIOS: |
|
|
|
|
|
|
|
|
| |||||
Performance Ratios: |
|
|
|
|
|
|
|
|
| |||||
Return (loss) on average assets (1) | 0.79 | % |
| 0.64 | % |
| 0.62 | % |
| 0.15 | % |
| (0.32 | )% |
Return (loss) on average equity (2) | 7.08 | |
| 5.27 | |
| 5.21 | |
| 1.26 | |
| (2.65 | ) |
Interest rate spread (3) | 3.71 | |
| 3.69 | |
| 3.65 | |
| 3.58 | |
| 3.63 | |
Net interest margin (4) | 3.84 | |
| 3.82 | |
| 3.81 | |
| 3.78 | |
| 3.87 | |
Average interest-earning assets to average interest-bearing liabilities | 122.04 | |
| 119.93 | |
| 117.42 | |
| 115.24 | |
| 114.51 | |
Non-interest expense as a percent of average total assets | 3.50 | |
| 3.49 | |
| 3.48 | |
| 3.54 | |
| 3.43 | |
|
|
|
|
|
|
|
|
|
| |||||
Efficiency ratio (5) | 74.89 | |
| 71.72 | |
| 72.15 | |
| 76.11 | |
| 78.65 | |
|
|
|
|
|
|
|
|
|
| |||||
Asset Quality Ratios: |
| |
|
| |
|
| |
|
| |
|
| |
Non-accrual and 90 days or more past due loans as a percent of total loans receivable, net | 2.03 | % |
| 2.51 | % |
| 4.09 | % |
| 4.32 | % |
| 4.86 | % |
Non-performing assets as a percent of total assets (6) | 2.94 | |
| 3.75 | |
| 5.19 | |
| 5.01 | |
| 5.53 | |
Allowance for loan losses as a percent of total loans receivable, net (7) | 1.81 | |
| 1.99 | |
| 2.15 | |
| 2.21 | |
| 2.09 | |
Allowance for loan losses as a percent of non-performing loans (8) | 88.96 | |
| 79.28 | |
| 52.48 | |
| 51.18 | |
| 43.01 | |
Net charge-offs to average outstanding loans | 0.12 | |
| 0.65 | |
| 0.66 | |
| 1.13 | |
| 2.45 | |
Capital Ratios: |
|
|
| |
|
| |
|
| |
|
| | |
Total equity-to-assets ratio | 11.10 | % |
| 12.03 | % |
| 12.26 | % |
| 11.68 | % |
| 11.50 | % |
Average equity to average assets | 11.20 | |
| 12.19 | |
| 11.98 | |
| 11.81 | |
| 12.05 | |
__________________
(1) | Net income (loss) divided by average total assets. |
(2) | Net income (loss) divided by average total equity. |
(3) | Difference between weighted average yield on interest-earning assets and weighted average cost of interest-bearing liabilities. |
(4) | Net interest income (before provision for loan losses) as a percentage of average interest-earning assets. |
(5) | Non-interest expenses divided by the sum of net interest income and non-interest income. |
(6) | Non-performing assets include non-accrual loans, loans past due 90 days or more and still accruing, non-accrual investment securities, OREO and other repossessed assets. |
(7) | Loans receivable includes loans held for sale and is before the allowance for loan losses. |
(8) | Non-performing loans include non-accrual loans and loans past due 90 days or more and still accruing. Troubled debt restructured loans that are on accrual status are not included. |
50
Item 7. Management's Discussion and Analysis of Financial Condition and Results of Operations
MANAGEMENT'S DISCUSSION AND ANALYSIS OF
FINANCIAL CONDITION AND RESULTS OF OPERATIONS
General
Management's Discussion and Analysis of Financial Condition and Results of Operations is intended to assist in understanding the consolidated financial condition and results of operations of the Company. The information contained in this section should be read in conjunction with the Consolidated Financial Statements and accompanying notes thereto included in Item 8 of this Annual Report on Form 10-K.
Special Note Regarding Forward-Looking Statements
Certain matters discussed on this Annual Report on Form 10-K may contain forward-looking statements within the meaning of the Private Securities Litigation Reform Act of 1995. These statements relate to our financial condition, results of operations, plans, objectives, future performance or business. Forward-looking statements are not statements of historical fact and often include the words "believes," "expects," "anticipates," "estimates," "forecasts," "intends," "plans," "targets," "potentially," "probably," "projects," "outlook" or similar expressions or future or conditional verbs such as "may," "will," "should," "would" and "could." Forward-looking statements include statements with respect to our beliefs, plans, objectives, goals, expectations, assumptions and statements about future economic performance. These forward-looking statements are subject to known and unknown risks, uncertainties and other factors that could cause our actual results to differ materially from the results anticipated or implied by our forward-looking statements, including, but not limited to: the credit risks of lending activities, including changes in the level and trend of loan delinquencies and write-offs and changes in our allowance for loan losses and provision for loan losses that may be impacted by deterioration in the housing and commercial real estate markets which may lead to increased losses and non-performing loans in our loan portfolio, and may result in our allowance for loan losses not being adequate to cover actual losses, and require us to materially increase our loan loss reserves; changes in general economic conditions, either nationally or in our market areas; changes in the levels of general interest rates, and the relative differences between short and long term interest rates, deposit interest rates, our net interest margin and funding sources; fluctuations in the demand for loans, the number of unsold homes, land and other properties and fluctuations in real estate values in our market areas; secondary market conditions for loans and our ability to sell loans in the secondary market; results of examinations of us by the Board of Governors of the Federal Reserve System and of our bank subsidiary by the Federal Deposit Insurance Corporation, the Washington State Department of Financial Institutions, Division of Banks or other regulatory authorities, including the possibility that any such regulatory authority may, among other things, institute a formal or informal enforcement action against us or our bank subsidiary which could require us to increase our allowance for loan losses, write-down assets, change our regulatory capital position or affect our ability to borrow funds or maintain or increase deposits or impose additional requirements or restrictions on us, any of which could adversely affect our liquidity and earnings; legislative or regulatory changes that adversely affect our business including changes in regulatory policies and principles, or the interpretation of regulatory capital or other rules including as a result of Basel III; the impact of the Dodd Frank Wall Street Reform and Consumer Protection Act and implementing regulations; our ability to attract and retain deposits; increases in premiums for deposit insurance; our ability to control operating costs and expenses; the use of estimates in determining fair value of certain of our assets, which estimates may prove to be incorrect and result in significant declines in valuation; difficulties in reducing risks associated with the loans on our consolidated balance sheet; staffing fluctuations in response to product demand or the implementation of corporate strategies that affect our work force and potential associated charges; the failure or security breach of computer systems on which we depend; our ability to retain key members of our senior management team; costs and effects of litigation, including settlements and judgments; our ability to implement our business strategies; our ability to successfully integrate any assets, liabilities, customers, systems, and management personnel we may acquire into our operations and our ability to realize related revenue synergies and cost savings within expected time frames and any goodwill charges related thereto; our ability to manage loan delinquency rates; increased competitive pressures among financial services companies; changes in consumer spending, borrowing and savings habits; the availability of resources to address changes in laws, rules, or regulations or to respond to regulatory actions; our ability to pay dividends on our common and preferred stock; adverse changes in the securities markets; inability of key third-party providers to perform their obligations to us; changes in accounting policies and practices, as may be adopted by the financial institution regulatory agencies or the Financial Accounting Standards Board, including additional guidance and interpretation on accounting issues and details of the implementation of new accounting methods; the economic impact of war or any terrorist activities; other economic, competitive, governmental, regulatory, and technological factors affecting our operations; pricing, products and services; and other risks described elsewhere in this Form 10-K.
51
Any of the forward-looking statements that we make in this Form 10-K and in the other public statements we make are based upon management's beliefs and assumptions at the time they are made. We do not undertake and specifically disclaim any obligation to publicly update or revise any forward-looking statements included in this annual report to reflect the occurrence of anticipated or unanticipated events or circumstances after the date of such statements or to update the reasons why actual results could differ from those contained in such statements, whether as a result of new information, future events or otherwise. We caution readers not to place undue reliance on any forward-looking statements. These risks could cause our actual results for fiscal 2015 and beyond to differ materially from those expressed in any forward-looking statements by, or on behalf of, us, and could negatively affect the Company's results of operations and stock price performance.
Critical Accounting Policies and Estimates
The Company has established various accounting policies that govern the application of accounting principles generally accepted in the United States of America ("GAAP") in the preparation of the Company's Consolidated Financial Statements. The Company has identified five policies, that as a result of judgments, estimates and assumptions inherent in those policies, are critical to an understanding of the Company's Consolidated Financial Statements. These policies relate to the methodology for the determination of the allowance for loan losses, the valuation of mortgage servicing rights ("MSRs"), the determination of other than temporary impairments in the market value of investment securities, the determination of goodwill impairment and the determination of the recorded value of other real estate owned. These policies and the judgments, estimates and assumptions are described in greater detail in subsequent sections of Management's Discussion and Analysis contained herein and in the notes to the Consolidated Financial Statements contained in Item 8 of this Form 10-K. In particular, Note 1 of the Notes to Consolidated Financial Statements, "Summary of Significant Accounting Policies," generally describes the Company's accounting policies. Management believes that the judgments, estimates and assumptions used in the preparation of the Company's Consolidated Financial Statements are appropriate given the factual circumstances at the time. However, given the sensitivity of the Company's Consolidated Financial Statements to these critical policies, the use of other judgments, estimates and assumptions could result in material differences in the Company's results of operations or financial condition.
Allowance for Loan Losses. The allowance for loan losses is maintained at a level sufficient to provide for probable loan losses based on evaluating known and inherent risks in the portfolio. The allowance is based upon management's comprehensive analysis of the pertinent factors underlying the quality of the loan portfolio. These factors include changes in the amount and composition of the loan portfolio, delinquency levels, actual loan loss experience, current economic conditions, and detailed analysis of individual loans for which full collectibility may not be assured. The detailed analysis includes methods to estimate the fair value of loan collateral and the existence of potential alternative sources of repayment. The appropriate allowance for loan loss level is estimated based upon factors and trends identified by management at the time the consolidated financial statements are prepared.
While the Company believes it has established its existing allowance for loan losses in accordance with GAAP, there can be no assurance that regulators, in reviewing the Company's loan portfolio, will not request the Company to significantly increase or decrease its allowance for loan losses. In addition, because future events affecting borrowers and collateral cannot be predicted with certainty, there can be no assurance that the existing allowance for loan losses is adequate or that substantial increases will not be necessary should the quality of any loans deteriorate as a result of the factors discussed elsewhere in this document. Although management believes the level of the allowance as of September 30, 2014 was adequate to absorb probable losses inherent in the loan portfolio, a decline in local economic conditions, results of examinations by the Company's or the Bank's regulators or other factors, could result in a material increase in the allowance for loan losses and may adversely affect the Company's financial condition and results of operations.
Mortgage Servicing Rights. MSRs are capitalized when acquired through the origination of loans that are subsequently sold with servicing rights retained and are amortized to servicing income on loans sold approximately in proportion to and over the period of estimated net servicing income. The value of MSRs at the date of the sale of loans is determined based on the discounted present value of expected future cash flows using key assumptions for servicing income and costs and prepayment rates on the underlying loans.
The estimated fair value is evaluated at least annually by a third party firm for impairment by comparing actual cash flows and estimated cash flows from the servicing assets to those estimated at the time servicing assets were originated. The effect of changes in market interest rates on estimated rates of loan prepayments represents the predominant risk characteristic underlying the MSRs' portfolio. The Company's methodology for estimating the fair value of MSRs is highly sensitive to changes in assumptions. For example, the determination of fair value uses anticipated prepayment speeds. Actual prepayment experience may differ and any difference may have a material effect on the fair value. Thus, any measurement of MSRs' fair value is limited by the conditions existing and assumptions as of the date made. Those assumptions may not be appropriate if they are applied at different times.
52
Other-Than-Temporary Impairment (OTTI) in the Estimated Fair Value of Investment Securities . Unrealized investment securities losses on available for sale and held to maturity securities are evaluated at least quarterly by a third-party firm to determine whether declines in value should be considered "other than temporary" and therefore be subject to immediate loss recognition through earnings for the portion related to credit losses. Although these evaluations involve significant judgment, an unrealized loss in the fair value of a debt security is generally deemed to be temporary when the fair value of the security is less than the recorded value primarily as a result of changes in interest rates, when there has not been significant deterioration in the financial condition of the issuer, and the Company has the intent and the ability to hold the security for a sufficient time to recover the recorded value. An unrealized loss in the value of an equity security is generally considered temporary when the fair value of the security is below the recorded value primarily as a result of current market conditions and not a result of deterioration in the financial condition of the underlying borrowers or the underlying collateral (in the case of mutual funds) and the Company has the intent and the ability to hold the security for a sufficient time to recover the recorded value. Other factors that may be considered in determining whether a decline in the value of either a debt or equity security is "other than temporary" include ratings by recognized rating agencies; capital strength and near-term prospects of the issuer, and recommendation of investment advisors or market analysts. Therefore, continued deterioration of current market conditions could result in additional impairment losses recognized within the Company's investment portfolio.
Goodwill. Goodwill is initially recorded when the purchase price paid for an acquisition exceeds the estimated fair value of the net identified tangible and intangible assets acquired and liabilities assumed. Goodwill is presumed to have an indefinite useful life and is analyzed annually for impairment. An annual test is performed during the third quarter of each fiscal year, or more frequently if indicators of potential impairment exist, to determine if the recorded goodwill is impaired. If the estimated fair value of the Company's sole reporting unit exceeds the recorded value of the reporting unit, goodwill is not considered impaired.
The goodwill impairment tests involves a two-step process. Step one of the goodwill impairment test estimates the fair value of the reporting unit utilizing the allocation of corporate value approach, the income approach and the market approach in order to derive an enterprise value for the Company. If the results of the Company's step one test indicate that the reporting unit's estimated fair value is less than its recorded value, a step two analysis is performed. In the step two analysis, the estimated fair value of assets and liabilities is calculated in order to determine the implied fair value of the Company's goodwill. If the implied value of the goodwill exceeds the recorded value of goodwill, then goodwill is not considered to be impaired.
A significant amount of judgment is involved in determining if an indicator of goodwill impairment has occurred. Such indicators may include, among others; a significant decline in the expected future cash flows; a sustained, significant decline in the Company's stock price and market capitalization; a significant adverse change in legal factors or in the business climate; adverse assessment or action by a regulator; and unanticipated competition. Key assumptions used in the annual goodwill impairment test are highly judgmental and include: selection of comparable companies, amount of control premium, projected cash flows, discount rate applied to projected cash flows and method of estimating the fair value of loans. Any change in these indicators or key assumptions could have a significant negative impact on the Company's financial condition, impact the goodwill impairment analysis or cause the Company to perform a goodwill impairment analysis more frequently than once per year.
During the quarter ended June 30, 2014, the Company engaged a third party firm specializing in goodwill impairment valuations for financial institutions to help perform the annual test for goodwill impairment. The test concluded that recorded goodwill was not impaired. As of September 30, 2014, there have been no events or changes in the circumstances that would indicate a potential impairment. No assurance can be given, however, that the Company will not record an impairment loss on goodwill in the future.
Other Real Estate Owned ("OREO") and Other Repossessed Assets. OREO and other repossessed assets consist of properties or assets acquired through or in lieu of foreclosure, and are recorded initially at the estimated fair value of the properties less estimated costs of disposal. Costs relating to development and improvement of the properties or assets are capitalized while costs relating to holding the properties or assets are expensed. Valuations are periodically performed by management, and a charge to earnings is recorded if the recorded value of a property exceeds its estimated net realizable value.
New Accounting Pronouncements
For a discussion of new accounting pronouncements and their impact on the Company, see Note 1 of the Notes to the Consolidated Financial Statements contained in "Item 8. Financial Statements and Supplementary Data."
53
Operating Strategy
The Company is a bank holding company which operates primarily through its subsidiary, the Bank. The Bank is a community-oriented bank which has traditionally offered a wide variety of savings products to its retail customers while concentrating its lending activities on real estate loans. In spite of persistently weak economic conditions and exceptionally low interest rates which have created an unusually challenging banking environment for an extended period, the Company experienced marked improvement in profitability in fiscal year 2014 as real estate values modestly improved along with general economic conditions resulting in materially lower loan charge-offs and write-downs of OREO as compared to prior periods. Although there continue to be indications that economic conditions in the United States, including Washington State where we hold substantially all of our loans and conduct all of our operations, are improving from the recessionary downturn, the pace of recovery has been modest and uneven and ongoing stress in the economy will likely continue to be challenging going forward. In response to the financial challenges in our market areas we have taken actions to manage our capital, reduce our exposure to speculative construction and land development loans and land loans and maintain higher levels of on balance sheet liquidity. We continue to originate residential fixed rate mortgage loans primarily for sale in the secondary market. We also continue to manage the growth of our commercial and multi-family real estate loan portfolios in a disciplined fashion while continuing to dispose of other real estate owned properties and increase retail deposits.
We believe the resolution of problem financial institutions and continued bank consolidation in western Washington will provide opportunities for the Company to increase market share within the communities it serves. We are currently pursuing the following strategies:
Improve Asset Quality. We are focused on monitoring existing performing loans, resolving non-performing assets and selling foreclosed assets. We have sought to reduce the level of non-performing assets through collections, write-downs, modifications and sales of OREO. We have taken proactive steps to resolve our non-performing loans, including negotiating payment plans, forbearances, loan modifications and loan extensions and accepting short payoffs on delinquent loans when such actions have been deemed appropriate.
Expand our presence within our existing market areas by capturing opportunities resulting from changes in the competitive environment. We currently conduct our business primarily in western Washington. We have a community bank strategy that emphasizes responsive and personalized service to our customers. As a result of consolidation of banks in our market areas, we believe there is an opportunity for a community and customer focused bank to expand its customer base. By offering timely decision making, delivering appropriate banking products and services, and providing customer access to our senior managers we believe community banks, such as Timberland Bank, can distinguish themselves from larger banks operating in our market areas. We believe we have a significant opportunity to attract additional borrowers and depositors and expand our market presence and market share within our extensive branch footprint.
Continue generating revenues through mortgage banking operations. The substantial majority of the fixed rate residential mortgage loans we originate are sold into the secondary market with servicing retained. This strategy produces gains on the sale of such loans and reduces the interest rate and credit risk associated with fixed rate residential lending. We continue to originate custom construction and owner builder loans for sale into the secondary market upon the completion of construction.
Portfolio Diversification. In recent years, we have strictly limited the origination of speculative construction, land development and land loans in favor of loans that possess credit profiles representing less risk to the Bank. We continue originating owner/builder and custom construction loans, multi-family loans, commercial business loans and certain commercial real estate loans which offer higher risk adjusted returns, shorter maturities and more sensitivity to interest rate fluctuations than fixed rate one-to four-family loans. We anticipate capturing more of each customer's banking relationship by cross selling our loan and deposit products and offering additional services to our customers.
Increase Core Deposits and other Retail Deposit Products. We focus on establishing a total banking relationship with our customers with the intent of internally funding our loan portfolio. We anticipate that the continued focus on customer relationships will increase our level of core deposits and locally-based retail certificates of deposit. In addition to our retail branches we maintain technology based products such as business cash management and a business remote deposit product that enables us to compete effectively with banks of all sizes.
Limit Exposure to Increasing Interest Rates. For many years the majority of the loans the Bank has retained in its portfolio have generally possessed periodic interest rate adjustment features or have been relatively short term in nature. Loans originated for portfolio retention have generally included ARM loans, short term construction loans, and to a lesser extent commercial business loans with interest rates tied to a market index such as the prime rate. Longer term fixed-rate mortgage loans have generally been originated for sale into the secondary market.
54
Market Risk and Asset and Liability Management
General. Market risk is the risk of loss from adverse changes in market prices and rates. The Bank's market risk arises primarily from interest rate risk inherent in its lending, investment, deposit and borrowing activities. The Bank, like other financial institutions, is subject to interest rate risk to the extent that its interest-earning assets reprice differently than its interest-bearing liabilities. Management actively monitors and manages its interest rate risk exposure. Although the Bank manages other risks, such as credit quality and liquidity risk, in the normal course of business management considers interest rate risk to be its most significant market risk that could potentially have the largest material effect on the Bank's financial condition and results of operations. The Bank does not maintain a trading account for any class of financial instruments nor does it engage in hedging activities. Furthermore, the Bank is not subject to foreign currency exchange rate risk or commodity price risk.
Qualitative Aspects of Market Risk. The Bank's principal financial objective is to achieve long-term profitability while reducing its exposure to fluctuating market interest rates. The Bank has sought to reduce the exposure of its earnings to changes in market interest rates by attempting to manage the difference between asset and liability maturities and interest rates. The principal element in achieving this objective is to increase the interest-rate sensitivity of the Bank's interest-earning assets by retaining in its portfolio, short-term loans and loans with interest rates subject to periodic adjustments. The Bank relies on retail deposits as its primary source of funds. As part of its interest rate risk management strategy, the Bank promotes transaction accounts and certificates of deposit with terms of up to six years.
The Bank has adopted a strategy that is designed to substantially match the interest rate sensitivity of assets relative to its liabilities. The primary elements of this strategy involve originating ARM loans for its portfolio, maintaining residential construction loans as a portion of total net loans receivable because of their generally shorter terms and higher yields than other one- to four-family residential mortgage loans, matching asset and liability maturities, investing in short-term securities, and originating fixed-rate loans for retention or sale in the secondary market while retaining the related mortgage servicing rights.
Sharp increases or decreases in interest rates may adversely affect the Bank's earnings. Management of the Bank monitors the Bank's interest rate sensitivity through the use of a model provided by FIMAC Solutions, LLC ("FIMAC"), a company that specializes in providing interest rate risk and balance sheet management services to the financial services industry. Based on a rate shock analysis prepared by FIMAC based on data at September 30, 2014, an immediate increase in interest rates of 200 basis points would increase the Bank's projected net interest income by approximately 7.0%, primarily because a larger portion of the Bank's interest rate sensitive assets than interest rate sensitive liabilities would reprice within a one year period. See "- Quantitative Aspects of Market Risk" below for additional information. Management has sought to sustain the match between asset and liability maturities and rates, while maintaining an acceptable interest rate spread. Pursuant to this strategy, the Bank actively originates adjustable-rate loans for retention in its loan portfolio. Fixed-rate mortgage loans with maturities greater than seven years generally are originated for the immediate or future resale in the secondary mortgage market. At September 30, 2014 , adjustable-rate mortgage loans constituted $365.0 million or 73.3% , of the Bank's total mortgage loan portfolio due after one year. Although the Bank has sought to originate ARM loans, the ability to originate such loans depends to a great extent on market interest rates and borrowers' preferences. In lower interest rate environments, borrowers often prefer fixed-rate loans.
Consumer, commercial business and construction loans typically have shorter terms and higher yields than permanent residential mortgage loans, and accordingly reduce the Bank's exposure to fluctuations in interest rates. At September 30, 2014 , the consumer, commercial business and construction portfolios amounted to $39.6 million , $30.6 million and $68.5 million , or 6.5% , 5.0% and 11.3% of total loans receivable (including loans held for sale), respectively.
Quantitative Aspects of Market Risk. The model provided for the Bank by FIMAC estimates the changes in net portfolio value ("NPV") and net interest income in response to a range of assumed changes in market interest rates. The model first estimates the level of the Bank's NPV (market value of assets, less market value of liabilities, plus or minus the market value of any off-balance sheet items) under the current rate environment. In general, market values are estimated by discounting the estimated cash flows of each instrument by appropriate discount rates. The model then recalculates the Bank's NPV under different interest rate scenarios. The change in NPV under the different interest rate scenarios provides a measure of the Bank's exposure to interest rate risk. The following table is provided by FIMAC based on data at September 30, 2014 .
55
Hypothetical |
| Net Interest Income (1)(2) |
| Current Market Value | ||||||||||||||||||
Interest Rate |
| Estimated |
| $ Change |
| % Change |
| Estimated |
| $ Change |
| % Change | ||||||||||
Scenario (3) |
| Value |
| from Base |
| from Base |
| Value |
| from Base |
| from Base | ||||||||||
(Basis Points) |
| (Dollars in thousands) | ||||||||||||||||||||
+400 |
| $ | 28,370 | |
| $ | 3,098 | |
| 12.26 | % |
| $ | 146,505 | |
| $ | 17,795 | |
| 13.83 | % |
+300 |
| 27,699 | |
| 2,427 | |
| 9.61 | |
| 142,325 | |
| 13,615 | |
| 10.58 | | ||||
+200 |
| 27,038 | |
| 1,766 | |
| 6.99 | |
| 138,352 | |
| 9,642 | |
| 7.49 | | ||||
+100 |
| 26,124 | |
| 852 | |
| 3.37 | |
| 133,613 | |
| 4,903 | |
| 3.81 | | ||||
BASE |
| 25,272 | |
| - | |
| - | |
| 128,710 | |
| - | |
| - | | ||||
-100 |
| 24,611 | |
| (661 | ) |
| (2.61 | ) |
| 122,801 | |
| (5,909 | ) |
| (4.59 | ) | ||||
___________
(1) | Does not include loan fees. |
(2) | Includes BOLI income, which is included in non-interest income on the Consolidated Financial Statements. |
(3) | No rates in the model are allowed to go below zero. Given the relatively low level of market interest rates, a calculation for a decrease of greater than 100 basis points has not been prepared. |
Computations of prospective effects of hypothetical interest rate changes are based on numerous assumptions, including relative levels of market interest rates, loan repayments and deposit decay, and should not be relied upon as indicative of actual results. Furthermore, the computations do not reflect any actions management may undertake in response to changes in interest rates.
In the event of a 100 basis point decrease in interest rates, the Bank would be expected to experience a 4.6% decrease in NPV and a 2.6% decrease in net interest income. In the event of a 200 basis point increase in interest rates, a 7.5% increase in NPV and a 7.0% increase in net interest income would be expected. Based upon the modeling described above, the Bank's asset and liability structure generally results in decreases in net interest income and NPV in a declining interest rate scenario and increases in net interest income and NPV in a rising rate scenario.
As with any method of measuring interest rate risk, certain shortcomings are inherent in the method of analysis presented in the foregoing table. For example, although certain assets and liabilities may have similar maturities or periods to repricing, they may react in different degrees to changes in market interest rates. Also, the interest rates on certain types of assets and liabilities may fluctuate in advance of changes in market interest rates, while interest rates on other types may lag behind changes in market rates. Additionally, certain assets have features which restrict changes in interest rates on a short-term basis and over the life of the asset. Further, in the event of a change in interest rates, expected rates of prepayments on loans and early withdrawals from certificates could possibly deviate significantly from those assumed in calculating the table.
Comparison of Financial Condition at September 30, 2014 and September 30, 2013
The Company's total assets remained relatively stable, decreasing by $83,000 , totaling $745.6 million at both September 30, 2014 and 2013. The decrease was primarily attributable to decreases in cash and cash equivalents and OREO and other repossessed assets, which were partially offset by increases in net loans receivable and certificates of deposit ("CDs") held for investment.
Net loans receivable, including loans held for sale, increased by $17.7 million , or 3.2% , to $565.8 million at September 30, 2014 from $548.1 million at September 30, 2013 , primarily a result of increases in one-to four-family construction and commercial business loan balances. These increases were partially offset by decreases to one-to four-family and multi-family loan balances.
Total deposits increased by $6.8 million , or 1.1% , to $615.1 million at September 30, 2014 from $608.3 million at September 30, 2013 , primarily as a result of increases in non-interest bearing, NOW checking and savings account balances. These increases were partially offset by a decrease in money market and CD account balances.
Shareholders' equity decreased by $6.9 million , or 7.7% , to $82.8 million at September 30, 2014 from $89.7 million at September 30, 2013 . The decrease was primarily due to the repurchase of the remaining 12,065 shares of Series A Preferred Stock and the payment of dividends on preferred and common stock. These decreases to shareholders' equity were partially offset by net income for the year ended September 30, 2014 . As of September 30, 2014 , the Company exceeded all regulatory capital requirements required for bank holding company regulatory purposes. For additional details see Note 18 of the Notes to Consolidated Financial Statements contained in "Item 8. Financial Statements and Supplementary Data" and "Item 1. Business - Regulation of the Company - Capital Requirements."
56
A more detailed explanation of the changes in significant balance sheet categories follows:
Cash and Cash Equivalents and CDs Held for Investment: Cash and cash equivalents and CDs held for investment decreased by $16.3 million , or 13.1% , to $108.2 million at September 30, 2014 from $124.5 million at September 30, 2013 . The decrease was primarily due to a $22.1 million decrease in total cash and cash equivalents, which was partially offset by a $5.8 million increase in higher yielding CDs held for investment. The net decrease in cash and cash equivalents was used to fund loan growth. The Company continued to maintain high levels of liquidity primarily for asset-liability management purposes.
Securities: Securities increased by $1.4 million , or 20.6% , to $8.2 million at September 30, 2014 from $6.8 million at September 30, 2013 . The increase was primarily due to the purchase of $3.0 million of U.S. government agency securities, which was partially offset by the sale of $747,000 in private label residential MBS and scheduled amortization and prepayments on MBS. For additional details on MBS and other investments, see "Item 1. Business - Investment Activities" and Note 3 of the Notes to the Consolidated Financial Statements contained in "Item 8. Financial Statements and Supplemental Data."
Loans Receivable and Loans Held for Sale, Net of Allowance for Loan Losses: Net loans receivable, including loans held for sale, increased by $17.7 million , or 3.2% to $565.8 million at September 30, 2014 from $548.1 million at September 30, 2013 . The increase was primarily a result of an $18.9 million increase in custom and owner/builder residential construction, a $13.1 million increase in commercial business loan balances, a $3.1 million increase in commercial real estate loan balances, a $2.7 million increase in multi-family construction loan balances, a $1.1 million increase in speculative one-to-four family construction loan balances, a $1.1 million increase in commercial construction loan balances, a $625,000 increase in consumer loans balances and a $709,000 decrease in the allowance for loan losses. These increases to net loans receivable were partially offset by an $5.8 million decrease in one-to-four family loan balances, a $4.9 million decrease in multi-family loan balances, a $1.6 million decrease in land loan balances, and a $10.9 million increase in the undisbursed portion of construction loans in process. The increase in custom and owner/builder residential construction loans was primarily due to increased demand for these types of construction loans in the Company's primary market areas. The increase in commercial business loans was primarily due to the Bank's increased emphasis on originating commercial and industrial ("C&I") loans.
Loan originations decreased by 14.7% to $185.8 million for the year ended September 30, 2014 from $217.8 million for the year ended September 30, 2013 . The Company continues to sell longer-term fixed rate residential loans for asset-liability management purposes and to generate non-interest income. The Company sold $33.4 million in fixed rate one- to four-family mortgage loans during the year ended September 30, 2014 compared to $89.4 million for the year ended September 30, 2013. The decrease in loan originations and loans sold was primarily due to a reduction of $56.0 million in loans originated for sale as refinance demand for single family loans decreased. For additional information on loans, see "Item 1. Business - Lending Activities" and Note 4 of the Notes to Consolidated Financial Statements contained in "Item 8, Financial Statements and Supplementary Data."
Premises and Equipment: Premises and equipment decreased by $85,000 , or 0.5% , to $17.7 million at September 30, 2014 from $17.8 million at September 30, 2013 . The decrease was primarily due to annual depreciation, which was partially offset by additions to premises and equipment from several remodeling projects at branch offices and capitalized technology related costs. For additional information on premises and equipment, see "Item 2. Properties" and Note 6 of the Notes to Consolidated Financial Statements contained in "Item 8. Financial Statements and Supplementary Data."
OREO and Other Repossessed Assets: OREO and other repossessed assets decreased by $2.6 million , or 22.4% to $9.1 million at September 30, 2014 from $11.7 million at September 30, 2013 . The decrease was primarily due to the disposition of $8.2 million in OREO properties and other repossessed assets and lower of cost or fair value losses of $604,000. These decreases in OREO and other repossessed assets were partially offset by the addition of $6.1 million in OREO properties and other repossessed assets and $47,000 in capitalized costs. At September 30, 2014 , the OREO balance was comprised of 40 individual properties. The properties consisted of 21 land parcels totaling $3.8 million , 14 single family homes totaling $2.9 million , four commercial real estate properties totaling $2.2 million and one multi-family property of $142,000 . The largest OREO property was land in Lewis County with a balance of $1.2 million. For additional information on OREO and other repossessed assets, see "Item 1. Business - Lending Activities - Other Real Estate Owned and Other Repossessed Assets" and Note 7 of the Notes to Consolidated Financial Statements contained in "Item 8. Financial Statements and Supplementary Data."
Bank Owned Life Insurance ("BOLI"): BOLI increased $530,000 , or 3.1% , to $17.6 million at September 30, 2014 from $17.1 million at September 30, 2013 due to net BOLI earnings.
Goodwill and Core Deposit Intangible ("CDI"): The recorded amount of goodwill of $5.7 million at September 30, 2014 remained unchanged from September 30, 2013 . The amortized value of CDI decreased by $ 116,000 to $3,000 at
57
September 30, 2014 from $119,000 at September 30, 2013 due to scheduled amortization. The Company performed its annual review of goodwill during the quarter ended June 30, 2014 and determined that there was no impairment. For additional information on goodwill and CDI, see Note 1 and Note 8 of the Notes to Consolidated Financial Statements contained in "Item 8. Financial Statements and Supplemental Data."
Mortgage Servicing Rights ("MSRs"): MSRs decreased $582,000 , or 25.7% , to $1.7 million at September 30, 2014 from $2.3 million at September 30, 2013 , primarily due to amortization of $969,000, which was partially offset by the addition of $387,000 in capitalized MSRs for new loans being serviced. The principal amount of loans serviced for Freddie Mac increased $1.9 million, or 5.7% to $327.6 million at September 30, 2014 from $325.7 million at September 30, 2013 . For additional information on MSRs, see Note 5 of the Notes to Consolidated Financial Statements contained in "Item 8. Financial Statements and Supplemental Data."
Deposits: Deposits increased by $6.8 million , or 1.1% , to $615.1 million at September 30, 2014 from $608.3 million at September 30, 2013 . The increase was primarily a result of an $18.8 million increase in non-interest bearing account balances, a $4.6 million increase in NOW checking account balances and a $4.3 million increase in savings account balances. These increases were partially offset by a $10.9 million decrease in CD account balances and a $10.0 million decrease in money market accounts. The increase in non-interest bearing account and NOW checking account balances was primarily due to increased commercial and consumer checking accounts as the Company continued to emphasize increasing its transaction accounts base. The Company also experienced deposit inflows due to a number of customers transferring funds from other financial institutions during the year ended September 30, 2014 . The decrease in CD account and money market account balances was primarily due to the Company opting not to match interest rates offered by competitors. For additional information on deposits, see "Item 1. Business - Deposit Activities and Other Sources of Funds" and Note 9 of the Consolidated Financial Statements contained in "Item 8. Financial Statements and Supplementary Data."
FHLB Advances: FHLB advances were $45.0 million at September 30, 2014 and at September 30, 2013 . For additional information on borrowings, see "Item 1, Business Deposit Activities and Other Sources of Funds Borrowings" and Note 10 of the Notes to Consolidated Financial Statements contained in "Item 8. Financial Statements and Supplementary Data."
Shareholders' Equity: Total shareholders' equity decreased by $6.9 million , or 7.7% , to $82.8 million at September 30, 2014 from $89.7 million at September 30, 2013 . The decrease was primarily due to the repurchase of 12,065 shares of Series A Preferred Stock for $12.1 million and the payment of $1.2 million in dividends to common and preferred shareholders. These decreases to shareholder's equity were partially offset by net income of $5.9 million for the year ended September 30, 2014. For additional information on shareholders' equity, see the Consolidated Statements of Shareholders' Equity contained in "Item 8. Financial Statements and Supplementary Data."
Comparison of Operating Results for the Years Ended September 30, 2014 and 2013
Net income for the year ended September 30, 2014 increased $1.09 million , or 23.0% , to $5.85 million from $4.76 million for the year ended September 30, 2013 . Net income to common shareholders after adjusting for preferred stock dividends, preferred stock discount accretion and discount on redemption of preferred stock increased $1.63 million , or 40.4% , to $5.64 million for the year ended September 30, 2014 from $4.02 million for the year ended September 30, 2013 . Net income per diluted common share increased $0.22 , or 37.9% , to $0.80 for the year ended September 30, 2014 from $0.58 for the year ended September 30, 2013 . The increase in net income was primarily due to a decrease in the provision for loan losses, which was partially offset by a decrease in non-interest income and an increase in the provision for federal income taxes.
The decrease in the provision for loan losses was primarily a result of improved underlying credit quality metrics in the loan portfolio as the level of net charge-offs, delinquent loans and loans graded substandard decreased during the year ended September 30, 2014 .
The decrease in non-interest income was primarily attributable to a decrease in gain on sale of loans and a decrease in the valuation recovery on MSRs. These decreases to non-interest income were partially offset by an increase in ATM and debit card interchange transaction fees.
A more detailed explanation of the income statement categories is presented below.
Net Interest Income: Net interest income increased by $120,000 , or 0.5% , to $25.92 million for the year ended September 30, 2014 from $25.80 million for the year ended September 30, 2013 . The increase in net interest income was due to a decrease in interest expense, which was partially offset by a decrease in interest income.
58
Total interest and dividend income decreased by $380,000 , or 1.3% , to $29.86 million for the year ended September 30, 2014 from $30.24 million for the year ended September 30, 2013 as the yield on interest earning assets decreased to 4.42% from 4.48% . The decrease in the weighted average yield on interest earning assets was primarily a result of a decrease in market interest rates. Partially offsetting the overall decrease in market interest rates was an increase in the percentage of loans comprising total interest-bearing assets. Average loans receivable increased $10.44 million to $567.25 million for the year ended September 30, 2014 from $556.82 million for the year ended September 30, 2013 .
Total interest expense decreased by $500,000 to $3.94 million , or 11.3% , for the year ended September 30, 2014 from $4.44 million for the year ended September 30, 2013 as the average rate paid on interest-bearing liabilities decreased to 0.71% for the year ended September 30, 2014 from 0.79% for the year ended September 30, 2013 . The decrease in funding costs was primarily a result of CDs repricing at lower market interest rates and a $24.55 million decrease in the average balance of CDs. In addition, the composition of the deposit base changed as the percentage of non-interest bearing and lower costing transaction accounts increased. Average interest-bearing liabilities decreased $9.36 million to $553.47 million for the year ended September 30, 2014 from $562.83 million for the year ended September 30, 2013 .
The net interest margin increased two basis points to 3.84% for the year ended September 30, 2014 from 3.82% for the year ended September 30, 2013 as funding costs decreased at a greater rate than the yield on interest-bearing assets decreased.
Provision for Loan Losses: There was no provision for loan losses for the year ended September 30, 2014 as compared to $2.93 million for the year ended September 30, 2013 . Net charge-offs decreased by $2.91 million , or 80.4% , to $709,000 for the year ended September 30, 2014 from $3.61 million for the year ended September 30, 2013 . The net charge-offs to average outstanding loans ratio was 0.12% for the year ended September 30, 2014 and 0.65% for the year ended September 30, 2013 . The decrease in the provision for loan losses was primarily due to the decreased level of net charge-offs and improvements in other underlying credit quality metrics in the loan portfolio. The level of delinquent loans (loans 30 or more days past due) decreased by $4.37 million , or 24.2% , to $13.70 million at September 30, 2014 from $18.07 million at September 30, 2013 and the level of loans graded substandard decreased by $9.92 million , or 35.5% , to $18.06 million at September 30, 2014 from $27.98 million at September 30, 2013 . Non-accrual loans decreased $2.70 million , or 19.8%, to $10.91 million at September 30, 2014 from $13.61 million at September 30, 2013 .
The Company has established a comprehensive methodology for determining the provision for loan losses. On a quarterly basis the Company performs an analysis that considers pertinent factors underlying the quality of the loan portfolio. These factors include changes in the amount and composition of the loan portfolio, historic loss experience for various loan segments, changes in economic conditions, delinquency rates, a detailed analysis of impaired loans, and other factors to determine an appropriate level of allowance for loan losses. Impaired loans are subject to an impairment analysis to determine an appropriate reserve or write-down to be applied against each loan. The aggregate principal impairment amount determined at September 30, 2014 was $2.01 million.
Based on the comprehensive methodology, management deemed the allowance for loan losses of $10.43 million at September 30, 2014 (1.81% of loans receivable and loans held for sale and 89.0% of non-performing loans) adequate to provide for probable losses based on an evaluation of known and inherent risks in the loan portfolio at that date. While the Company believes it has established its existing allowance for loan losses in accordance with GAAP, there can be no assurance that bank regulators, in reviewing the Company's loan portfolio, will not request the Company to increase significantly its allowance for loan losses. In addition, because future events affecting borrowers and collateral cannot be predicted with certainty, there can be no assurance that the existing allowance for loan losses is adequate or that, substantial increases will not be necessary should the quality of any loans deteriorate. Any material increase in the allowance for loan losses would adversely affect the Company's financial condition and results of operations. For additional information, see "Item 1. Business - Lending Activities -- Allowance for Loan Losses."
Non-interest Income: Total non-interest income decreased by $1.73 million or 16.9% , to $8.53 million for the year ended September 30, 2014 from $10.26 million for the year ended September 30, 2013 . This decrease was primarily a result of a $1.49 million decrease in gain on sales of loans and no remaining valuation recovery on MSRs during the year ended September 30, 2014 compared to a $475,000 valuation recovery on MSRs for the year ended September 30, 2013. These decreases to non-interest income were partially offset by a $284,000 increase in ATM and debit card interchange transaction fees.
The decrease in gain on sales of loans was primarily due to a decrease in the dollar volume of fixed-rate one- to four-family loans sold during the year ended September 30, 2014 as refinance activity decreased. The increase in ATM and debit card interchange transaction fees was primarily a result of increased debit card transaction activity levels and a change in the fee structure as the Company changed its ATM and debit card processor during the year ended September 30, 2014.
59
Non-interest Expense: Total non-interest expense decreased by $66,000 , or 0.3% , to $25.80 million for the year ended September 30, 2014 from $25.86 million for the year ended September 30, 2013 . The decrease was primarily attributable to a $1.58 million decrease in OREO and other repossessed assets expense, partially offset by a $689,000 increase in salaries and employee benefits expense, a $239,000 increase in ATM and debit card interchange fee expense, and a $218,000 increase in data processing and telecommunications expense. Also impacting the comparison between years was a $424,000 decrease in gain on disposition of premises and equipment as the Company recorded a $431,000 gain on the sale of property during the year ended September 30, 2013, which reduced total non-interest expenses.
The decrease in OREO related expenses was primarily a result of $1.46 million decrease in the level of valuation write-downs based on upon updated appraisals received on OREO properties. The increase in salaries and employee benefits expense was primarily due to the hiring of additional loan officers, annual salary adjustments and an increase in health insurance costs. Also contributing to the increase in salaries and employee benefits was a decrease in loan originations. Under GAAP, the portion of a loan origination fee that is attributable to the estimated employee costs to generate the loan is recorded as a reduction of salaries and employee benefits expense. With the decrease in loan originations, the loan origination fees that reduced salaries and employee benefit expense decreased by $225,000 during the year ended September 30, 2014 compared to the year ended September 30, 2013. The increases in ATM and debit card interchange fee expense and data processing and telecommunications expense were primarily due to expenses associated with the Company's technology upgrades, which included outsourcing the core processing system and upgrading its electronic funds transfer platform.
Provision for Federal Income Taxes: The provision for federal and state income taxes increased by $286,000 , or 11.4% to $2.80 million for the year ended September 30, 2014 from $2.51 million for the year ended September 30, 2013 , primarily due to increased income before income taxes. The Company's effective federal income tax rate was 32.4% for the year ended September 30, 2014 compared to 34.6% for the year ended September 30, 2013. The difference in the effective tax rate was primarily due to adjustments to the Company's deferred tax valuation allowance. During the year ended September 30, 2013 , the provision for income taxes was increased by $236,000 due to the expiration of a capital loss carry-forward. For additional information on federal income taxes, see Note 13 of the Consolidated Financial Statements contained in "Item 8. Financial Statements and Supplementary Data."
Comparison of Operating Results for the Years Ended September 30, 2013 and 2012
Net income was $4.76 million for the year ended September 30, 2013 compared to $4.59 million for the year ended September 30, 2012 . Net income to common shareholders after adjusting for preferred stock dividends and preferred stock discount accretion was $4.02 million for the year ended September 30, 2013 compared to $3.52 million for the year ended September 30, 2012 . Net income per diluted common share was $0.58 for the year ended September 30, 2013 compared to $0.52 per diluted common share for the year ended September 30, 2012 . The increase in net income was primarily due to a decrease in the provision for loan losses, an increase in non-interest income and an increase in net interest income. These increases to net income were partially offset by an increase in non-interest expense and an increase in the provision for income taxes.
The decrease in the provision for loan losses was primarily a result of improved underlying credit quality metrics in the loan portfolio as the level of delinquent loans and loans graded substandard decreased during the year ended September 30, 2013 .
The increase in non-interest income was primarily a result of an increase in the valuation recovery on MSRs and a reduction in net OTTI on securities. These increases to non-interest income were partially offset by a decrease in service charges on deposits.
The increase in net interest income was primarily attributable to increases in the Company's average loans receivable and a decrease in the average balance of interest-bearing liabilities.
The increase in non-interest expense was primarily attributable to increases in OREO related expenses and salaries and employee benefits expense. These increases to non-interest expense were partially offset by the gain on disposition of premises and equipment and a decrease in loan administration and foreclosure expenses.
A more detailed explanation of the income statement categories is presented below.
Net Interest Income: Net interest income increased by $140,000 , or 0.5% , to $25.80 million for the year ended September 30, 2013 from $25.66 million for the year ended September 30, 2012 . The increase in net interest income was primarily attributable to an increase in the Company's average loans receivable and a decrease in the average balance of interest-bearing liabilities.
60
Total interest and dividend income decreased by $1.37 million , or 4.3% , to $30.24 million for the year ended September 30, 2013 from $31.61 million for the year ended September 30, 2012 as the yield on interest earning assets decreased to 4.48% from 4.69% . The decrease in the weighted average yield on interest earning assets was primarily a result of a decrease in overall market rates for loans.
Total interest expense decreased by $1.51 million to $4.44 million for the year ended September 30, 2013 from $5.95 million for the year ended September 30, 2012 as the average rate paid on interest-bearing liabilities decreased to 0.79% for the year ended September 30, 2013 from 1.04% for the year ended September 30, 2012 . The decrease in funding costs was primarily a result of a decrease in overall market rates, a change in the composition of deposit categories and a decrease in the average level of FHLB advances.
Average loans receivable increased $12.29 million to $556.82 million for the year ended September 30, 2013 as compared to $544.52 million for the year ended September 30, 2012 . Average interest-bearing liabilities decreased $11.35 million to $562.83 million for the year ended September 30, 2013 from $574.18 million for the year ended September 30, 2012 . The net interest margin increased one basis point to 3.82% for the year ended September 30, 2013 from 3.81% for the year ended September 30, 2012 as funding costs decreased at a greater rate than the yield on interest earning assets.
Provision for Loan Losses: The provision for loan losses decreased by $575,000 , or 16.4% , to $2.93 million for the year ended September 30, 2013 from $3.50 million for the year ended September 30, 2012 . Net charge-offs decreased by $7,000, or 0.2%, to $3.61 million for the year ended September 30, 2013 from $3.62 million for the year ended September 30, 2012 . The net charge-offs to average outstanding loans ratio was 0.65% for the year ended September 30, 2013 and 0.66% for the year ended September 30, 2012 . The decrease in the provision for loan losses was primarily due to improved underlying credit quality metrics in the loan portfolio. The level of delinquent loans (loans 30 or more days past due) decreased by $12.17 million , or 40.2% , to $18.07 million at September 30, 2013 from $30.24 million at September 30, 2012 and the level of loans graded substandard decreased by $5.10 million , or 15.4% , to $27.98 million million at September 30, 2013 from $33.08 million at September 30, 2012 . Non-accruing loans decreased by $7.72 million to $13.61 million at September 30, 2013 from $21.33 million at September 30, 2012 .
Non-interest Income: Total non-interest income increased by $481,000 , or 4.9% , to $10.26 million for the year ended September 30, 2013 from $9.78 million for the year ended September 30, 2012 . This increase was primarily a result of a $465,000 increase in the valuation recovery on MSRs and a $167,000 reduction in net OTTI on MBS and other investments. These increases to non-interest income were partially offset by a $132,000 decrease in service charges on deposits.
The Company's valuation recovery on MSRs increased by $465,000 to $475,000 for the year ended September 30, 2013 from $10,000 for the year ended September 30, 2012 . The valuation of the MSRs was based on a third party valuation of the MSR asset. At September 30, 2013 , the MSR asset had no remaining valuation allowance available for future recovery. The decrease in net OTTI charges on MBS and other investments was primarily due to a reduction in the level of credit related impairment on private label MBS in the Company's investment portfolio during the year ended September 30, 2013 . At September 30, 2013 , the Company's remaining private label MBS had been reduced to $2.44 million from an original acquired balance of $15.30 million. The reduction in service charges on deposits was a result of fewer overdrafts on checking accounts.
Non-interest Expense: Total non-interest expense increased by $296,000 , or 1.2% , to $25.86 million for the year ended September 30, 2013 from $25.57 million for the year ended September 30, 2012 . The increase was primarily attributable to a $605,000 increase in OREO and other repossessed assets expense, a $555,000 increase in salaries and employee benefits and smaller increases in several other expense categories. These increases to non-interest expense were partially offset by a $431,000 gain on the disposition of premises and equipment, a $386,000 decrease to loan administration and foreclosure expenses and smaller decreases in several other expense categories.
The increase in OREO related expenses was primarily a result of a $1.02 million increase in the level of valuation write-downs based on updated appraisals received on OREO properties. The increase in OREO expenses due to valuation write-downs was partially offset by net gains on sales of OREO and other repossessed assets that totaled $266,000 for the year ended September 30, 2013 compared to a net loss of $(373,000) for the year ended September 30, 2012 . The increase in salaries and employee benefits expense was primarily due to annual salary adjustments and the hiring of additional lending department personnel. The gain on disposition of premises was a result of the sale of a land parcel adjacent to a branch office. The decrease in loan administration and foreclosure expense was primarily a result of decreased foreclosure related activity.
Provision for Federal Income Taxes: The provision for federal and state income taxes increased by $733,000 , or 41.2% to $2.51 million for the year ended September 30, 2013 from $1.78 million for the year ended September 30, 2012 , primarily due to increased income before income taxes and a deferred tax valuation allowance adjustment related to the expiration of a capital
61
loss carry-forward. The Company's effective federal income tax rate was 34.6% for the year ended September 30, 2013 compared to 28.0% for the year ended September 30, 2012 . The difference in the effective tax rate was primarily due to adjustments to the Company's deferred tax valuation allowance. During the year ended September 30, 2013 , the provision for income taxes was increased by $236,000 due to the expiration of a capital loss carry-forward. During the year ended September 30, 2012 , the provision for income taxes was reduced by $205,000 due to a deferred tax valuation recovery based on the expectation of certain tax planning strategies.
Average Balances, Interest and Average Yields/Cost
The earnings of the Company depend largely on the spread between the yield on interest-earning assets and the cost of interest-bearing liabilities, as well as the relative amount of the Company's interest-earning assets and interest- bearing liability portfolios.
62
The following table sets forth, for the periods indicated, information regarding average balances of assets and liabilities as well as the total dollar amounts of interest income from average interest-earning assets and interest expense on average interest-bearing liabilities and average yields and costs. Such yields and costs for the periods indicated are derived by dividing income or expense by the average daily balance of assets or liabilities, respectively, for the periods presented.
| Year Ended September 30, | |||||||||||||||||||||||||||||||
| 2014 |
| 2013 |
| 2012 | |||||||||||||||||||||||||||
| Average Balance |
| Interest and Dividends |
| Yield/ Cost |
| Average Balance |
| Interest and Dividends |
| Yield/ Cost |
| Average Balance |
| Interest and Dividends |
| Yield/ Cost | |||||||||||||||
|
|
|
|
|
|
| (Dollars in thousands) |
|
|
|
|
|
| |||||||||||||||||||
Interest-earning assets: |
|
|
|
|
|
|
|
|
|
|
|
|
|
|
|
|
| |||||||||||||||
Loans receivable (1)(2) | $ | 567,251 | |
| $ | 29,205 | |
| 5.15 | % |
| $ | 556,815 | |
| $ | 29,591 | |
| 5.31 | % |
| $ | 544,524 | |
| $ | 30,831 | |
| 5.66 | % |
Mortgage-backed securities and other investments | 6,782 | |
| 259 | |
| 3.82 | |
| 6,595 | |
| 281 | |
| 4.26 | |
| 8,479 | |
| 404 | |
| 4.75 | | ||||||
FHLB stock and equity securities | 6,332 | |
| 27 | |
| 0.44 | |
| 6,561 | |
| 29 | |
| 0.44 | |
| 6,707 | |
| 32 | |
| 0.48 | | ||||||
Interest-bearing deposits | 95,110 | |
| 366 | |
| 0.38 | |
| 105,055 | |
| 336 | |
| 0.32 | |
| 114,514 | |
| 338 | |
| 0.30 | | ||||||
Total interest-earning assets | 675,475 | |
| 29,857 | |
| 4.42 | |
| 675,026 | |
| 30,237 | |
| 4.48 | |
| 674,224 | |
| 31,605 | |
| 4.69 | | ||||||
Non-interest-earning assets | 62,432 | |
|
| |
|
| |
| 65,803 | |
|
| |
|
| |
| 60,927 | |
|
| |
|
| | ||||||
|
|
|
|
|
|
|
|
|
|
|
|
|
|
|
|
|
| |||||||||||||||
Total assets | $ | 737,907 | |
|
| |
|
| |
| $ | 740,829 | |
|
| |
|
| |
| $ | 735,151 | |
|
| |
|
| | |||
|
|
|
|
|
|
|
|
|
|
|
|
|
|
|
|
|
| |||||||||||||||
Interest-bearing liabilities: |
| |
|
| |
|
| |
|
| |
|
| |
|
| |
|
| |
|
| |
|
| | ||||||
Savings accounts | $ | 92,606 | |
| 46 | |
| 0.05 | |
| $ | 90,376 | |
| 55 | |
| 0.06 | |
| $ | 87,020 | |
| 245 | |
| 0.28 | | |||
Money market accounts | 94,894 | |
| 246 | |
| 0.26 | |
| 86,558 | |
| 246 | |
| 0.28 | |
| 70,111 | |
| 334 | |
| 0.48 | | ||||||
NOW accounts | 156,954 | |
| 440 | |
| 0.28 | |
| 151,980 | |
| 463 | |
| 0.30 | |
| 152,983 | |
| 651 | |
| 0.43 | | ||||||
Certificates of deposit | 164,014 | |
| 1,334 | |
| 0.81 | |
| 188,564 | |
| 1,804 | |
| 0.96 | |
| 215,759 | |
| 2,721 | |
| 1.26 | | ||||||
Short-term borrowings (3) | - | |
| - | |
| - | |
| 352 | |
| - | |
| 0.05 | |
| 699 | |
| - | |
| 0.05 | | ||||||
Long-term borrowings (4) | 45,000 | |
| 1,873 | |
| 4.16 | |
| 45,000 | |
| 1,871 | |
| 4.16 | |
| 47,603 | |
| 1,996 | |
| 4.19 | | ||||||
Total interest bearing liabilities | 553,468 | |
| 3,939 | |
| 0.71 | |
| 562,830 | |
| 4,439 | |
| 0.79 | |
| 574,175 | |
| 5,947 | |
| 1.04 | | ||||||
Non-interest bearing liabilities | 101,821 | |
|
| |
|
| |
| 87,698 | |
|
| |
|
| |
| 72,888 | |
|
| |
|
| | ||||||
Total liabilities | 655,289 | |
|
| |
|
| |
| 650,528 | |
|
| |
|
| |
| 647,063 | |
|
| |
|
| | ||||||
|
|
|
|
|
|
|
|
|
|
|
|
|
|
|
|
|
| |||||||||||||||
Shareholders' equity | 82,618 | |
|
| |
|
| |
| 90,301 | |
|
| |
|
| |
| 88,088 | |
|
| |
|
| | ||||||
Total liabilities and shareholders' equity | $ | 737,907 | |
|
| |
|
| |
| $ | 740,829 | |
|
| |
|
| |
| $ | 735,151 | |
|
| |
|
| | |||
|
|
|
|
|
|
|
|
|
|
|
|
|
|
|
|
|
| |||||||||||||||
Net interest income |
| |
| $ | 25,918 | |
|
| |
|
| |
| $ | 25,798 | |
|
| |
|
| |
| $ | 25,658 | |
|
| | |||
Interest rate spread. |
| |
|
| |
| 3.71 | % |
|
| |
|
| |
| 3.69 | % |
|
| |
|
| |
| 3.65 | % | ||||||
Net interest margin (5) |
| |
|
|
| 3.84 | % |
|
| |
|
| |
| 3.82 | % |
|
| |
|
| |
| 3.81 | % | |||||||
Ratio of average interest-earning assets to average interest-bearing liabilities |
| |
|
|
| 122.04 | % |
|
| |
|
| |
| 119.93 | % |
|
| |
|
| |
| 117.42 | % | |||||||
_______________________________________________
(1) | Does not include interest on loans on non-accrual status. Includes loans originated for sale. Amortized net deferred loan fees, late fees, extension fees and prepayment penalties (2014 - $739; 2013 - $522; and 2012 - $802) are included with interest and dividends. |
(2) | Average balance includes non-accrual loans. |
(3) | Includes FHLB advances with original maturities of less than one year and other short-term borrowings-repurchase agreements. |
(4) | Includes FHLB advances with original maturities of one year or greater. |
(5) | Net interest income divided by total average interest earning assets. |
63
Rate/Volume Analysis
The following table sets forth the effects of changing rates and volumes on net interest income on the Company. Information is provided with respect to the (i) effects on interest income attributable to changes in volume (changes in volume multiplied by prior rate), and (ii) effects on interest income attributable to changes in rate (changes in rate multiplied by prior volume), and (iii) the net change (sum of the prior columns). Changes in both rate and volume have been allocated to rate and volume variances based on the absolute values of each.
| Year Ended September 30, |
| Year Ended September 30, | |||||||||||||||||||||
| Rate |
| Volume |
| Net Change |
| Rate |
| Volume |
| Net Change | |||||||||||||
|
|
|
|
| (In thousands) |
|
|
|
| |||||||||||||||
Interest-earning assets: |
|
|
|
|
|
|
|
|
|
|
| |||||||||||||
Loans receivable (1) | $ | (414 | ) |
| $ | 28 | |
| $ | (386 | ) |
| $ | (1,925 | ) |
| $ | 685 | |
| $ | (1,240 | ) | |
Mortgage-backed securities and other investments | (20 | ) |
| (2 | ) |
| (22 | ) |
| (39 | ) |
| (84 | ) |
| (123 | ) | |||||||
FHLB stock and equity securities | - | |
| (2 | ) |
| (2 | ) |
| (3 | ) |
| - | |
| (3 | ) | |||||||
Interest-bearing deposits | 31 | |
| (1 | ) |
| 30 | |
| 27 | |
| (29 | ) |
| (2 | ) | |||||||
Total net change in income on interest-earning assets | (403 | ) |
| 23 | |
| (380 | ) |
| (1,940 | ) |
| 572 | |
| (1,368 | ) | |||||||
|
|
|
|
|
|
|
|
|
|
|
| |||||||||||||
Interest-bearing liabilities: |
| |
|
| |
|
| |
|
| |
|
| |
|
| | |||||||
Savings accounts | (8 | ) |
| (1 | ) |
| (9 | ) |
| (199 | ) |
| 9 | |
| (190 | ) | |||||||
Money market accounts | (6 | ) |
| 6 | |
| - | |
| (155 | ) |
| 67 | |
| (88 | ) | |||||||
NOW accounts | (22 | ) |
| (1 | ) |
| (23 | ) |
| (184 | ) |
| (4 | ) |
| (188 | ) | |||||||
Certificates of deposit | (251 | ) |
| (219 | ) |
| (470 | ) |
| (602 | ) |
| (315 | ) |
| (917 | ) | |||||||
Long-term borrowings | - | |
| 2 | |
| 2 | |
| (17 | ) |
| (108 | ) |
| (125 | ) | |||||||
Total net change in expense on interest-bearing liabilities | (287 | ) |
| (213 | ) |
| (500 | ) |
| (1,157 | ) |
| (351 | ) |
| (1,508 | ) | |||||||
Net change in net interest income | $ | (116 | ) | - | | $ | 236 | |
| $ | 120 | |
| $ | (783 | ) |
| $ | 923 | |
| $ | 140 | |
______________
(1) | Excludes interest on loans on non-accrual status. Includes loans originated for sale. |
Liquidity and Capital Resources
The Bank's primary sources of funds are customer deposits, proceeds from principal and interest payments on loans, the sale of loans, maturing securities and FHLB advances. While the maturity and scheduled amortization of loans are a predictable source of funds, deposit flows and mortgage prepayments are greatly influenced by general interest rates, economic conditions and competition.
The Bank must maintain an adequate level of liquidity to ensure the availability of sufficient funds to fund loan originations and deposit withdrawals, to satisfy other financial commitments and to take advantage of investment opportunities. The Bank generally maintains sufficient cash and short-term investments to meet short-term liquidity needs. At September 30, 2014 , the Bank's regulatory liquidity ratio (net cash, and short-term and marketable assets, as a percentage of net deposits and short-term liabilities) was 16.19% . At September 30, 2014 , the Bank maintained an uncommitted credit facility with the FHLB that provided for immediately available advances up to an aggregate amount equal to 25% of total assets, limited by available collateral, under which $131.8 million was available for additional borrowings. The Bank's available borrowing from the FHLB would be reduced by any amounts advanced by the FHLB under the VLOC. The Bank maintains a short-term borrowing line with the FRB with total credit based on eligible collateral. At September 30, 2014 the Bank had no outstanding balance on this borrowing line, under which $39.8 million was available for future borrowings. The Bank also maintains a $10.0 million overnight borrowing line with PCBB. At September 30, 2014 , the Bank did not have an outstanding balance on this borrowing line.
64
Liquidity management is both a short and long-term responsibility of the Bank's management. The Bank adjusts its investments in liquid assets based upon management's assessment of (i) expected loan demand, (ii) projected loan sales, (iii) expected deposit flows, and (iv) yields available on interest- bearing deposits. Excess liquidity is invested generally in interest-bearing overnight deposits, CDs held for investment and short-term government and agency obligations. If the Bank requires funds beyond its ability to generate them internally, it has additional borrowing capacity with the FHLB, the FRB and PCBB.
The Bank's primary investing activity is the origination of mortgage loans. During the years ended September 30, 2014 , 2013 and 2012, the Bank originated $155.4 million , $203.1 million and $215.0 million of mortgage loans, respectively. At September 30, 2014 , the Bank had loan commitments totaling $48.8 million and undisbursed loans in process totaling $29.4 million . The Bank anticipates that it will have sufficient funds available to meet current loan commitments. Certificates of deposit that are scheduled to mature in less than one year from September 30, 2014 totaled $98.5 million . Historically, the Bank has been able to retain a significant amount of its deposits as they mature.
The Bank's liquidity is also affected by the volume of loans sold and loan principal payments. During the years ended September 30, 2014 , 2013 and 2012 , the Bank sold $33.4 million , $89.4 million and $97.4 million in fixed rate, one- to four-family mortgage loans, respectively. During the years ended September 30, 2014 , 2013 and 2012 , the Bank received $126.5 million , $113.2 million and $121.1 million in principal repayments, respectively.
The Bank's liquidity has been impacted by increases in deposit levels. During the years ended September 30, 2014 , 2013 and 2012, deposits increased by $6.9 million , $10.3 million and $5.2 million , respectively.
Cash and cash equivalents, CDs held for investment and mortgage-backed securities and other investments decreased to $116.4 million at September 30, 2014 from $131.4 million at September 30, 2013 .
Timberland Bancorp is a separate legal entity from the Bank and must provide for its own liquidity and pay its own operating expenses. Sources of capital and liquidity for Timberland Bancorp include principal and interest payments on the loan receivable from the Employee Stock Ownership Plan ("ESOP"), distributions from the Bank and the issuance of debt or equity securities. At September 30, 2014 , Timberland Bancorp (on an unconsolidated basis) had liquid assets of $495,000.
Bank holding companies and federally-insured state-chartered banks are required to maintain minimum levels of regulatory capital. At September 30, 2014 , Timberland Bancorp and the Bank were in compliance with all applicable capital requirements. For additional details see Note 18 of the Notes to Consolidated Financial Statements contained in "Item 8. Financial Statements and Supplementary Data" and "Item 1. Business - Regulation of the Bank - Capital Requirements."
Contractual obligations. The following table presents, as of September 30, 2014 , the Company's significant fixed and determinable contractual obligations, within the categories described below, by payment date or contractual maturity. These contractual obligations, except for the operating lease obligations are included in the Consolidated Balance Sheet. The payment amounts represent those amounts contractually due at September 30, 2014 .
| Payments due by period | ||||||||||||||||||
| Less than 1 year |
| 1 year through 3 years |
| After 3 years through 5 years |
| After 5 years |
| Total | ||||||||||
Contractual obligations | |||||||||||||||||||
| (In thousands) | ||||||||||||||||||
Long-term debt obligations | $ | - | |
| $ | 45,000 | |
| $ | - | |
| $ | - | |
| $ | 45,000 | |
Operating lease obligations | 280 | |
| 321 | |
| 192 | |
| 120 | |
| 913 | | |||||
Total contractual obligations | $ | 280 | |
| $ | 45,321 | |
| $ | 192 | |
| $ | 120 | |
| $ | 45,913 | |
Effect of Inflation and Changing Prices
The consolidated financial statements and related financial data presented herein have been prepared in accordance with accounting principles generally accepted in the United States of America which require the measurement of financial position and operating results in terms of historical dollars, without considering the change in the relative purchasing power of money over time due to inflation. The primary impact of inflation on the operation of the Company is reflected in increased operating costs. Unlike most industrial companies, virtually all the assets and liabilities of a financial institution are monetary in nature. As
65
a result, interest rates generally have a more significant impact on a financial institution's performance than do general levels of inflation. Interest rates do not necessarily move in the same direction or to the same extent as the prices of goods and services.
Item 7A. Quantitative and Qualitative Disclosures About Market Risk
The information contained under "Item 7, Management's Discussion and Analysis of Financial Condition and Results of Operations - Market Risk and Asset and Liability Management" of this Form 10-K is incorporated herein by reference.
Item 8. Financial Statements and Supplementary Data
Management's Report on Internal Control Over Financial Reporting
The Company's management is responsible for establishing and maintaining adequate internal control over financial reporting. Internal control over financial reporting is a process designed to provide reasonable assurance regarding the reliability of financial reporting and the preparation of consolidated financial statements for external purposes in accordance with accounting principles generally accepted in the United States of America. The Company's internal control over financial reporting includes those policies and procedures that (i) pertain to the maintenance of records that, in reasonable detail, accurately and fairly reflect the transactions and disposition of the assets of the Company; (ii) provide reasonable assurance that transactions are recorded as necessary to permit preparation of consolidated financial statements in accordance with accounting principles generally accepted in the United States of America, and that receipts and expenditures of the Company are being made only in accordance with authorizations of management and directors of the Company; and (iii) provide reasonable assurance regarding prevention or timely detection of unauthorized acquisition, use, or disposition of the Company's assets that could have a material effect on the consolidated financial statements.
Because of its inherent limitations, internal control over financial reporting may not prevent or detect misstatements. All internal control systems, no matter how well designed, have inherent limitations, including the possibility of human error and the circumvention of overriding controls. Also, projections of any evaluation of effectiveness to future periods are subject to the risk that controls may become inadequate because of changes in conditions, or that the degree of compliance with the policies or procedures may deteriorate.
The Company's management conducted an evaluation of the effectiveness of internal control over financial reporting based on the framework in Internal Control -- Integrated Framework (1992) issued by the Committee of Sponsoring Organizations of the Treadway Commission as of September 30, 2014. Based on this evaluation, management concluded that the Company's internal control over financial reporting was effective as of September 30, 2014.
66
Table of Contents
TIMBERLAND BANCORP, INC. AND SUBSIDIARY
Index to Consolidated Financial Statements
| Page |
| |
Report of Independent Registered Public Accounting Firm | 68 |
Consolidated Balance Sheets as of September 30, 2014 and 2013 | 69 |
Consolidated Statements of Income For the Years Ended | |
September 30, 2014, 2013 and 2012 | 71 |
Consolidated Statements of Comprehensive Income For the | |
Years Ended September 30, 2014, 2013 and 2012 | 73 |
Consolidated Statements of Shareholders' Equity For the | |
Years Ended September 30, 2014, 2013 and 2012 | 74 |
Consolidated Statements of Cash Flows For the Years Ended | |
September 30, 2014, 2013 and 2012 | 76 |
Notes to Consolidated Financial Statements | 78 |
67
Report of Independent Registered Public Accounting Firm |
To the Board of Directors and
Shareholders of Timberland Bancorp, Inc.
We have audited the accompanying consolidated balance sheets of Timberland Bancorp, Inc. and Subsidiary (collectively, "the Company") as of September 30, 2014 and 2013, and the related consolidated statements of income, comprehensive income, shareholders' equity, and cash flows for each of the years in the three-year period ended September 30, 2014. The Company's management is responsible for these consolidated financial statements. Our responsibility is to express an opinion on these consolidated financial statements based on our audits.
We conducted our audits in accordance with the standards of the Public Company Accounting Oversight Board (United States). Those standards require that we plan and perform the audit to obtain reasonable assurance about whether the consolidated financial statements are free of material misstatement. The Company is not required to have, nor were we engaged to perform, an audit of its internal control over financial reporting. Our audit included consideration of internal control over financial reporting as a basis for designing audit procedures that are appropriate in the circumstances, but not for the purpose of expressing an opinion on the effectiveness of the Company's internal control over financial reporting. Accordingly, we express no such opinion. An audit also includes examining, on a test basis, evidence supporting the amounts and disclosures in the consolidated financial statements, assessing the accounting principles used and significant estimates made by management, as well as evaluating the overall financial statement presentation. We believe that our audits provide a reasonable basis for our opinion.
In our opinion, the consolidated financial statements referred to above present fairly, in all material respects, the financial position of Timberland Bancorp, Inc. and Subsidiary as of September 30, 2014 and 2013, and the results of their operations and their cash flows for each of the years in the three-year period ended September 30, 2014 in conformity with accounting principles generally accepted in the United States of America.
/s/ Delap LLP
Lake Oswego, Oregon
December 11, 2014
68
Consolidated Balance Sheets |
(Dollars in Thousands, Except Per Share Amounts)
Timberland Bancorp, Inc. and Subsidiary
September 30, 2014 and 2013
| 2014 | |
| 2013 | | ||
Assets |
|
|
| ||||
Cash and cash equivalents: |
|
|
| ||||
Cash and due from financial institutions | $ | 11,818 | |
| $ | 12,879 | |
Interest-bearing deposits in banks | 60,536 | |
| 81,617 | | ||
Total cash and cash equivalents | 72,354 | |
| 94,496 | | ||
|
|
|
| ||||
Certificates of deposit ("CDs") held for investment (at cost, which approximates fair value) | 35,845 | |
| 30,042 | | ||
Securities held to maturity, at amortized cost (estimated fair value of $6,274 and $3,533) | 5,298 | |
| 2,737 | | ||
Securities available for sale | 2,857 | |
| 4,101 | | ||
Federal Home Loan Bank of Seattle ("FHLB") stock | 5,246 | |
| 5,452 | | ||
|
|
|
| ||||
Loans receivable, net of allowance for loan losses of $10,427 and $11,136 | 564,853 | |
| 546,193 | | ||
Loans held for sale | 899 | |
| 1,911 | | ||
Net loans receivable | 565,752 | |
| 548,104 | | ||
|
|
|
| ||||
Premises and equipment, net | 17,679 | |
| 17,764 | | ||
Other real estate owned ("OREO") and other repossessed assets, net | 9,092 | |
| 11,720 | | ||
Accrued interest receivable | 1,910 | |
| 1,972 | | ||
Bank owned life insurance ("BOLI") | 17,632 | |
| 17,102 | | ||
Goodwill | 5,650 | |
| 5,650 | | ||
Core deposit intangible ("CDI") | 3 | |
| 119 | | ||
Mortgage servicing rights ("MSRs"), net | 1,684 | |
| 2,266 | | ||
Other assets | 4,563 | |
| 4,123 | | ||
Total assets | $ | 745,565 | |
| $ | 745,648 | |
|
|
|
| ||||
Liabilities and shareholders' equity |
| |
|
| | ||
Liabilities: |
| |
|
| | ||
Deposits: |
|
|
| ||||
Non-interest-bearing demand | $ | 106,417 | |
| $ | 87,657 | |
Interest-bearing | 508,699 | |
| 520,605 | | ||
Total deposits | 615,116 | |
| 608,262 | | ||
|
|
|
| ||||
FHLB advances | 45,000 | |
| 45,000 | | ||
Other liabilities and accrued expenses | 2,671 | |
| 2,698 | | ||
Total liabilities | 662,787 | |
| 655,960 | | ||
|
|
|
| ||||
Commitments and contingencies (See Note 16) |
|
|
| ||||
See notes to consolidated financial statements
69
Consolidated Balance Sheets (Continued) |
(Dollars in Thousands, Except Per Share Amounts)
Timberland Bancorp, Inc. and Subsidiary
September 30, 2014 and 2013
Shareholders' equity | 2014 | |
| 2013 | | ||
Fixed Rate Cumulative Perpetual Preferred Stock, Series A, $0.01 par value; 1,000,000 shares authorized; redeemable at $1,000 per share: 12,065 shares issued and outstanding - September 30, 2013 | $ | - | |
| $ | 11,936 | |
Common stock, $0.01 par value; 50,000,000 shares authorized; 7,047,336 shares issued and outstanding - September 30, 2014 7,045,036 shares issued and outstanding - September 30, 2013 | 10,773 | |
| 10,570 | | ||
Unearned shares issued to Employee Stock Ownership Plan ("ESOP") | (1,190 | ) |
| (1,454 | ) | ||
Retained earnings | 73,534 | |
| 68,998 | | ||
Accumulated other comprehensive loss | (339 | ) |
| (362 | ) | ||
Total shareholders' equity | 82,778 | |
| 89,688 | | ||
Total liabilities and shareholders' equity | $ | 745,565 | |
| $ | 745,648 | |
See notes to consolidated financial statements
70
Consolidated Statements of Income |
(Dollars in Thousands, Except Per Share Amounts)
Timberland Bancorp, Inc. and Subsidiary
Years Ended September 30, 2014 , 2013 , and 2012
| 2014 | |
| 2013 | |
| 2012 | | |||
Interest and dividend income |
|
|
|
|
| ||||||
Loans receivable | $ | 29,205 | |
| $ | 29,591 | |
| $ | 30,831 | |
Securities | 259 | |
| 281 | |
| 404 | | |||
Dividends from mutual funds and FHLB stock | 27 | |
| 29 | |
| 32 | | |||
Interest-bearing deposits in banks and CDs | 366 | |
| 336 | |
| 338 | | |||
Total interest and dividend income | 29,857 | |
| 30,237 | |
| 31,605 | | |||
|
|
|
|
|
| ||||||
Interest expense |
|
|
|
|
| ||||||
Deposits | 2,066 | |
| 2,568 | |
| 3,951 | | |||
FHLB advances | 1,873 | |
| 1,871 | |
| 1,996 | | |||
Total interest expense | 3,939 | |
| 4,439 | |
| 5,947 | | |||
|
|
|
|
|
| ||||||
Net interest income | 25,918 | |
| 25,798 | |
| 25,658 | | |||
|
|
|
|
|
| ||||||
Provision for loan losses | - | |
| 2,925 | |
| 3,500 | | |||
|
|
|
|
|
| ||||||
Net interest income after provision for loan losses | 25,918 | |
| 22,873 | |
| 22,158 | | |||
|
|
|
|
|
| ||||||
Non-interest income |
|
|
|
|
| ||||||
Recoveries (other than temporary impairment "OTTI") on securities | 7 | |
| (15 | ) |
| (206 | ) | |||
Adjustment for portion of OTTI recorded as (transferred from) other comprehensive loss (before taxes) | 52 | |
| (32 | ) |
| (8 | ) | |||
Net recoveries (OTTI) on securities | 59 | |
| (47 | ) |
| (214 | ) | |||
|
|
|
|
|
| ||||||
Gain (loss) on sales of securities | (32 | ) |
| - | |
| 22 | | |||
Service charges on deposits | 3,738 | |
| 3,663 | |
| 3,795 | | |||
ATM and debit card interchange transaction fees | 2,426 | |
| 2,142 | |
| 2,172 | | |||
BOLI net earnings | 530 | |
| 577 | |
| 607 | | |||
Gain on sales of loans, net | 1,013 | |
| 2,507 | |
| 2,472 | | |||
Escrow fees | 158 | |
| 184 | |
| 118 | | |||
Valuation recovery on MSRs, net | - | |
| 475 | |
| 10 | | |||
Other | 638 | |
| 761 | |
| 799 | | |||
Total non-interest income, net | 8,530 | |
| 10,262 | |
| 9,781 | | |||
See notes to consolidated financial statements
71
Consolidated Statements of Income (continued) |
(Dollars in Thousands, Except Per Share Amounts)
Timberland Bancorp, Inc. and Subsidiary
Years Ended September 30, 2014 , 2013 , and 2012
| 2014 | |
| 2013 | |
| 2012 | | |||
Non-interest expense |
|
|
|
|
| ||||||
Salaries and employee benefits | $ | 13,294 | |
| $ | 12,605 | |
| $ | 12,050 | |
Premises and equipment | 2,878 | |
| 2,835 | |
| 2,676 | | |||
Gain on disposition of premises and equipment, net | (7 | ) |
| (431 | ) |
| - | | |||
Advertising | 742 | |
| 742 | |
| 726 | | |||
OREO and other repossessed assets, net | 1,010 | |
| 2,587 | |
| 1,982 | | |||
ATM and debit card interchange transaction fees | 1,096 | |
| 857 | |
| 794 | | |||
Postage and courier | 446 | |
| 443 | |
| 501 | | |||
Amortization of CDI | 116 | |
| 130 | |
| 148 | | |||
State and local taxes | 479 | |
| 576 | |
| 608 | | |||
Professional fees | 792 | |
| 856 | |
| 822 | | |||
Federal Deposit Insurance Corporation ("FDIC") insurance | 636 | |
| 685 | |
| 942 | | |||
Other insurance | 150 | |
| 174 | |
| 212 | | |||
Loan administration and foreclosure | 456 | |
| 430 | |
| 816 | | |||
Data processing and telecommunications | 1,450 | |
| 1,232 | |
| 1,265 | | |||
Deposit operations | 759 | |
| 607 | |
| 776 | | |||
Other | 1,501 | |
| 1,536 | |
| 1,250 | | |||
Total non-interest expense | 25,798 | |
| 25,864 | |
| 25,568 | | |||
|
|
|
|
|
| ||||||
Income before income taxes | 8,650 | |
| 7,271 | |
| 6,371 | | |||
|
|
|
|
|
| ||||||
Provision for federal income taxes | 2,800 | |
| 2,514 | |
| 1,781 | | |||
Net income | 5,850 | |
| 4,757 | |
| 4,590 | | |||
|
|
|
|
|
| ||||||
Preferred stock dividends | (136 | ) |
| (710 | ) |
| (832 | ) | |||
Preferred stock discount accretion | (70 | ) |
| (283 | ) |
| (240 | ) | |||
Discount on redemption of preferred stock | - | |
| 255 | |
| - | | |||
|
|
|
|
|
| ||||||
Net income to common shareholders | $ | 5,644 | |
| $ | 4,019 | |
| $ | 3,518 | |
|
|
|
|
|
| ||||||
Net income per common share |
|
|
|
|
| ||||||
Basic | $ | 0.82 | |
| $ | 0.59 | |
| $ | 0.52 | |
Diluted | $ | 0.80 | |
| $ | 0.58 | |
| $ | 0.52 | |
|
|
|
|
|
| ||||||
See notes to consolidated financial statements
72
Consolidated Statements of Comprehensive Income |
(Dollars in Thousands)
Timberland Bancorp, Inc. and Subsidiary
Years Ended September 30, 2014 , 2013 , and 2012
| 2014 | |
| 2013 | |
| 2012 | | |||
Comprehensive income: |
|
|
|
|
| ||||||
Net income | $ | 5,850 | |
| $ | 4,757 | |
| $ | 4,590 | |
Unrealized holding gain (loss) on securities available for sale, net of tax | (63 | ) |
| 23 | |
| 14 | | |||
Change in OTTI on securities held to maturity, net of tax: |
|
|
|
|
| ||||||
Additions | - | |
| - | |
| (27 | ) | |||
Additional amount recognized related to credit loss for which OTTI was previously recognized | 13 | |
| 15 | |
| 8 | | |||
Amount of OTTI reclassified to credit loss for previously recorded market loss | 21 | |
| 6 | |
| 24 | | |||
Accretion of OTTI securities held to maturity, net of tax | 52 | |
| 57 | |
| 46 | | |||
|
|
|
|
|
| ||||||
Total comprehensive income | $ | 5,873 | |
| $ | 4,858 | |
| $ | 4,655 | |
See notes to consolidated financial statements
73
Consolidated Statements of Shareholders' Equity |
(Dollars in Thousands, Except Per Share Amounts)
Timberland Bancorp, Inc. and Subsidiary
Years Ended September 30, 2014 , 2013 , and 2012
| Number of Shares |
| Amount |
| Unearned Shares Issued to |
|
|
| Accumulated Other Compre- hensive | |
|
| |||||||||||||||||
| Preferred Stock |
| Common Stock |
| Preferred Stock |
| Common Stock |
|
| Retained Earnings |
|
| Total | ||||||||||||||||
September 30, 2011 | 16,641 | |
| 7,045,036 | |
| $ | 15,989 | |
| $ | 10,457 | |
| $ | (1,983 | ) |
| $ | 62,270 | |
| $ | (528 | ) |
| $ | 86,205 | |
|
|
|
|
|
|
|
|
|
|
|
|
|
|
|
| ||||||||||||||
Net income | - | |
| - | |
| - | |
| - | |
| - | |
| 4,590 | |
| - | |
| 4,590 | | ||||||
Accretion of preferred stock discount | - | |
| - | |
| 240 | |
| - | |
| - | |
| (240 | ) |
| - | |
| - | | ||||||
5% preferred stock dividend | - | |
| - | |
| - | |
| - | |
| - | |
| (832 | ) |
| - | |
| (832 | ) | ||||||
Earned ESOP shares, net of tax | - | |
| - | |
| - | |
| (65 | ) |
| 264 | |
| - | |
| - | |
| 199 | | ||||||
MRDP (1) compensation expense, net of tax | - | |
| - | |
| - | |
| 77 | |
| - | |
| - | |
| - | |
| 77 | | ||||||
Stock option compensation expense | - | |
| - | |
| - | |
| 15 | |
| - | |
| - | |
| - | |
| 15 | | ||||||
Unrealized holding gain on securities available for sale, net of tax | - | |
| - | |
| - | |
| - | |
| - | |
| - | |
| 14 | |
| 14 | | ||||||
Change in OTTI on securities held to maturity, net of tax | - | |
| - | |
| - | |
| - | |
| - | |
| - | |
| 5 | |
| 5 | | ||||||
Accretion of OTTI on securities held to maturity, net of tax | - | |
| - | |
| - | |
| - | |
| - | |
| - | |
| 46 | |
| 46 | | ||||||
|
|
|
|
|
|
|
|
|
|
|
|
|
|
|
| ||||||||||||||
September 30, 2012 | 16,641 | |
| 7,045,036 | |
| 16,229 | |
| 10,484 | |
| (1,719 | ) |
| 65,788 | |
| (463 | ) |
| 90,319 | | ||||||
|
|
|
|
|
|
|
|
|
|
|
|
|
|
|
| ||||||||||||||
Net income | - | |
| - | |
| - | |
| - | |
| - | |
| 4,757 | |
| - | |
| 4,757 | | ||||||
Accretion of preferred stock discount | - | |
| - | |
| 283 | |
| - | |
| - | |
| (283 | ) |
| - | |
| - | | ||||||
Redemption of preferred stock | (4,576 | ) | | - | | | (4,576 | ) | | - | | | - | | | 255 | | | - | | | (4,321 | ) | ||||||
5% preferred stock dividend | - | |
| - | |
| - | |
| - | |
| - | |
| (885 | ) |
| - | |
| (885 | ) | ||||||
Common stock dividends ($0.09 per common share) | - | |
| - | |
| - | |
| - | |
| - | |
| (634 | ) |
| - | |
| (634 | ) | ||||||
Earned ESOP shares, net of tax | - | |
| - | |
| - | |
| 6 | |
| 265 | |
| - | |
| - | |
| 271 | | ||||||
MRDP compensation expense, net of tax | - | |
| - | |
| - | |
| 31 | |
| - | |
| - | |
| - | |
| 31 | | ||||||
Stock option compensation expense | - | |
| - | |
| - | |
| 49 | |
| - | |
| - | |
| - | |
| 49 | | ||||||
Unrealized holding gain on securities available for sale, net of tax | - | |
| - | |
| - | |
| - | |
| - | |
| - | |
| 23 | |
| 23 | | ||||||
Change in OTTI on securities held to maturity, net of tax | - | |
| - | |
| - | |
| - | |
| - | |
| - | |
| 21 | |
| 21 | | ||||||
Accretion of OTTI on securities held to maturity, net of tax | - | |
| - | |
| - | |
| - | |
| - | |
| - | |
| 57 | |
| 57 | | ||||||
|
|
|
|
|
|
|
|
|
|
|
|
|
|
|
| ||||||||||||||
September 30, 2013 | 12,065 | |
| 7,045,036 | |
| 11,936 | |
| 10,570 | |
| (1,454 | ) |
| 68,998 | |
| (362 | ) |
| 89,688 | | ||||||
(1) 1998 Management Recognition and Development Plan ("MRDP").
See notes to consolidated financial statements
74
Consolidated Statements of Shareholders' Equity (continued) |
(Dollars in Thousands, Except Per Share Amounts)
Timberland Bancorp, Inc. and Subsidiary
Years Ended September 30, 2014 , 2013 , and 2012
| Number of Shares |
| Amount |
| Unearned Shares Issued to |
|
|
| Accumulated Other Compre- hensive | |
|
| |||||||||||||||||
| Preferred Stock |
| Common Stock |
| Preferred Stock |
| Common Stock |
|
| Retained Earnings |
|
| Total | ||||||||||||||||
September 30, 2013 | 12,065 | |
| 7,045,036 | |
| $ | 11,936 | |
| $ | 10,570 | |
| $ | (1,454 | ) |
| $ | 68,998 | |
| $ | (362 | ) |
| $ | 89,688 | |
|
|
|
|
|
|
|
|
|
|
|
|
|
|
|
| ||||||||||||||
Net income | - | |
| - | |
| - | |
| - | |
| - | |
| 5,850 | |
| - | |
| 5,850 | | ||||||
Accretion of preferred stock discount | - | |
| - | |
| 70 | |
| - | |
| - | |
| (70 | ) |
| - | |
| - | | ||||||
Redemption of preferred stock | (12,065 | ) |
| - | |
| (12,006 | ) |
| - | |
| - | |
| (59 | ) |
| - | |
| (12,065 | ) | ||||||
Exercise of stock options | - | |
| 5,000 | |
| - | |
| 23 | |
| - | |
| - | |
| - | |
| 23 | | ||||||
Forfeiture of MRDP shares | - | |
| (2,700 | ) |
| - | |
| - | |
| - | |
| - | |
| - | |
| - | | ||||||
5% preferred stock dividends | - | |
| - | |
| - | |
| - | |
| - | |
| (58 | ) |
| - | |
| (58 | ) | ||||||
Common stock dividends ($0.16 per common share) | - | |
| - | |
| - | |
| - | |
| - | |
| (1,127 | ) |
| - | |
| (1,127 | ) | ||||||
Earned ESOP shares, net of tax | - | |
| - | |
| - | |
| 64 | |
| 264 | |
| - | |
| - | |
| 328 | | ||||||
MRDP compensation expense, net of tax | - | |
| - | |
| - | |
| 4 | |
| - | |
| - | |
| - | |
| 4 | | ||||||
Stock option compensation expense | - | |
| - | |
| - | |
| 112 | |
| - | |
| - | |
| - | |
| 112 | | ||||||
Unrealized holding loss on securities available for sale, net of tax | - | |
| - | |
| - | |
| - | |
| - | |
| - | |
| (63 | ) |
| (63 | ) | ||||||
Change in OTTI on securities held to maturity, net of tax | - | |
| - | |
| - | |
| - | |
| - | |
| - | |
| 34 | |
| 34 | | ||||||
Accretion of OTTI on securities held to maturity, net of tax | - | |
| - | |
| - | |
| - | |
| - | |
| - | |
| 52 | |
| 52 | | ||||||
|
|
|
|
|
|
|
|
|
|
|
|
|
|
|
| ||||||||||||||
September 30, 2014 | - | |
| 7,047,336 | |
| $ | - | |
| $ | 10,773 | |
| $ | (1,190 | ) | | $ | 73,534 | |
| $ | (339 | ) |
| $ | 82,778 | |
See notes to consolidated financial statements
75
Consolidated Statements of Cash Flows |
(Dollars in Thousands)
Timberland Bancorp, Inc. and Subsidiary
Years Ended September 30, 2014 , 2013 , and 2012
| 2014 | |
| 2013 | |
| 2012 | | |||
Cash flows from operating activities |
|
|
|
|
| ||||||
Net income | $ | 5,850 | |
| $ | 4,757 | |
| $ | 4,590 | |
Adjustments to reconcile net income to net cash provided by operating activities: |
| |
|
| |
|
| ||||
Depreciation | 1,244 | |
| 1,095 | |
| 940 | | |||
Deferred federal income taxes | 451 | |
| 777 | |
| 154 | | |||
Amortization of CDI | 116 | |
| 130 | |
| 148 | | |||
Earned ESOP shares | 264 | |
| 265 | |
| 264 | | |||
MRDP compensation expense | 2 | |
| 39 | |
| 105 | | |||
Stock option compensation expense | 104 | |
| 49 | |
| 15 | | |||
Stock option tax effect less excess tax benefit | 4 | |
| - | |
| - | | |||
(Gain) loss on sales of securities | 32 | |
| - | |
| (22 | ) | |||
Net (recoveries) OTTI on securities | (59 | ) |
| 47 | |
| 214 | | |||
(Gain) loss on sales of OREO and other repossessed assets, net | (169 | ) |
| (264 | ) |
| 373 | | |||
Gains on sale of loans, net | (1,013 | ) |
| (2,507 | ) |
| (2,472 | ) | |||
Gain on disposition of premises and equipment, net | (7 | ) |
| (431 | ) |
| - | | |||
Provision for loan losses | - | |
| 2,925 | |
| 3,500 | | |||
Provision for OREO losses | 605 | |
| 2,064 | |
| 1,048 | | |||
Loans originated for sale | (31,320 | ) |
| (87,329 | ) |
| (93,073 | ) | |||
Amortization of MSRs | 969 | |
| 948 | |
| 805 | | |||
Proceeds from sales of loans | 33,345 | |
| 89,352 | |
| 97,357 | | |||
Valuation recovery on MSRs, net | - | |
| (475 | ) |
| (10 | ) | |||
BOLI net earnings | (530 | ) |
| (577 | ) |
| (607 | ) | |||
Increase (decrease) in deferred loan origination fees | 36 | |
| (60 | ) |
| (180 | ) | |||
Net change in accrued interest receivable and other assets, and other liabilities and accrued expenses | (1,301 | ) |
| 767 | |
| 2,239 | | |||
Net cash provided by operating activities | 8,623 | |
| 11,572 | |
| 15,388 | | |||
|
|
|
|
|
| ||||||
Cash flows from investing activities |
| |
|
| |
|
| ||||
Net increase in CDs held for investment | (5,803 | ) |
| (6,552 | ) |
| (4,831 | ) | |||
Purchase of securities held to maturity | (3,003 | ) |
| - | |
| - | | |||
Proceeds from maturities and prepayments of securities held to maturity | 583 | |
| 689 | |
| 751 | | |||
Proceeds from maturities and prepayments of securities available for sale | 355 | |
| 891 | |
| 1,042 | | |||
Proceeds from sales of securities available for sale | 856 | |
| - | |
| 743 | | |||
Proceeds from redemption of FHLB stock | 206 | |
| 203 | |
| 50 | | |||
Increase in loans receivable, net | (23,569 | ) |
| (15,819 | ) |
| (22,860 | ) | |||
Additions to premises and equipment | (1,189 | ) |
| (1,302 | ) |
| (1,436 | ) | |||
Proceeds from sales of OREO and other repossessed assets | 7,065 | |
| 3,596 | |
| 2,555 | | |||
Proceeds from disposition of premises and equipment, net | 37 | |
| 760 | |
| - | | |||
Net cash used in investing activities | (24,462 | ) |
| (17,534 | ) |
| (23,986 | ) | |||
S ee notes to consolidated financial statements
76
Consolidated Statements of Cash Flows (continued) |
(Dollars in Thousands)
Timberland Bancorp, Inc. and Subsidiary
Years Ended September 30, 2014 , 2013 , and 2012
| 2014 | |
| 2013 | |
| 2012 | | |||
Cash flows from financing activities |
| |
|
| |
|
| ||||
Net increase in deposits | $ | 6,854 | |
| $ | 10,336 | |
| $ | 5,248 | |
Repayment of FHLB advances | - | |
| - | |
| (10,000 | ) | |||
Net increase (decrease) in repurchase agreements | - | |
| (855 | ) |
| 126 | | |||
ESOP tax effect | 64 | |
| 6 | |
| (65 | ) | |||
MRDP compensation tax effect | 2 | |
| (8 | ) |
| (28 | ) | |||
Stock option excess tax benefit | 4 | |
| - | |
| - | | |||
Proceeds from exercise of stock options | 23 | |
| - | |
| - | | |||
Repurchase of preferred stock | (12,065 | ) |
| (4,321 | ) |
| - | | |||
Payment of dividends | (1,185 | ) |
| (1,368 | ) |
| (2,080 | ) | |||
Net cash provided by (used in) financing activities | (6,303 | ) | | 3,790 | | | (6,799 | ) | |||
|
| |
|
| |
|
| ||||
Net decrease in cash and cash equivalents | (22,142 | ) |
| (2,172 | ) |
| (15,397 | ) | |||
|
|
|
|
|
| ||||||
Cash and cash equivalents |
| |
|
| |
|
| ||||
Beginning of period | 94,496 | |
| 96,668 | |
| 112,065 | | |||
|
|
|
|
|
| ||||||
End of period | $ | 72,354 | |
| $ | 94,496 | |
| $ | 96,668 | |
|
|
|
|
|
| ||||||
|
|
|
|
|
| ||||||
Supplemental disclosure of cash flow information |
| |
|
| |
|
| ||||
Income taxes paid | $ | 2,888 | |
| $ | 1,793 | |
| $ | 2,343 | |
Interest paid | 3,961 | |
| 4,523 | |
| 6,089 | | |||
|
|
|
|
|
| ||||||
Supplemental disclosure of non-cash investing activities |
| |
|
| |
|
| ||||
Loans transferred to OREO and other repossessed assets | $ | 6,155 | |
| $ | 6,375 | |
| $ | 9,443 | |
Loans originated to facilitate the sale of OREO | 1,282 | |
| 2,708 | |
| 3,095 | | |||
See notes to consolidated financial statements
77
Notes to Consolidated Financial Statements_________________________________________________________________
Timberland Bancorp, Inc. and Subsidiary
September 30, 2014 and 2013
Note 1 - Summary of Significant Accounting Policies
Principles of Consolidation
The accompanying consolidated financial statements include the accounts of Timberland Bancorp, Inc. ("Timberland Bancorp"); its wholly owned subsidiary, Timberland Bank (the "Bank"); and the Bank's wholly owned subsidiary, Timberland Service Corp. (collectively, "the Company"). All significant intercompany transactions and balances have been eliminated in consolidation.
Nature of Operations
Timberland Bancorp is a bank holding company which operates primarily through its subsidiary, the Bank. The Bank was established in 1915 and, through its 22 branches located in Grays Harbor, Pierce, Thurston, Kitsap, King and Lewis counties in Washington State, attracts deposits from the general public, and uses those funds, along with other borrowings, primarily to provide residential real estate, construction, commercial real estate, commercial business and consumer loans to borrowers primarily in western Washington.
Consolidated Financial Statement Presentation
The consolidated financial statements have been prepared in accordance with accounting principles generally accepted in the United States of America ("U.S.")("GAAP") and prevailing practices within the banking industry. The preparation of consolidated financial statements requires management to make estimates and assumptions that affect the reported amounts of assets and liabilities, and the disclosure of contingent assets and liabilities, as of the date of the consolidated balance sheet, and the reported amounts of income and expenses during the reporting period. Actual results could differ from those estimates. Material estimates that are particularly susceptible to significant change in the near term relate to the determination of the allowance for loan losses, the determination of OTTI in the estimated fair value of MBS, the valuation of MSRs, the valuation of OREO and the valuation of goodwill for potential impairment.
Certain prior year amounts have been reclassified to conform to the 2014 fiscal year presentation with no change to previously reported net income or shareholders' equity.
Segment Reporting
The Company has one reportable operating segment which is defined as community banking in western Washington under the operating name "Timberland Bank."
Preferred Stock Sold in Troubled Asset Relief Program ("TARP") Capital Purchase Program ("CPP")
On December 23, 2008, the Company received $16.64 million from the U.S. Treasury Department ("Treasury") as a part of the Treasury's CPP, which was established as part of the TARP. The Company sold 16,641 shares of Fixed Rate Cumulative Perpetual Preferred Stock, Series A ("Series A Preferred Stock"), with a liquidation value of $1,000 per share and a related warrant to purchase 370,899 shares of the Company's common stock at an exercise price of $6.73 per share (subject to anti-dilution adjustments) at any time through December 23, 2018. The Series A Preferred Stock paid a 5.0% dividend through December 20, 2013, the date of its redemption.
The proceeds received in connection with the issuance of the Series A Preferred Stock were allocated between the preferred stock and warrant based on their relative fair values on the date of issuance. As a result, the preferred stock's initial recorded value was at a discount from the liquidation value or stated value. The discount from the liquidation value was accreted to the expected/actual redemption date and charged to retained earnings. This accretion was recorded using the level-yield method.
On November 13, 2012, the Company's outstanding 16,641 shares of Series A Preferred Stock were sold by the Treasury as part of Treasury's efforts to manage and recover its investments under the TARP. While the sale of this preferred stock to new owners did not result in any proceeds to the Company and did not change the Company's capital position or accounting for these securities, it did eliminate restrictions put in place by the Treasury on TARP recipients.
78
Notes to Consolidated Financial Statements_________________________________________________________________
Timberland Bancorp, Inc. and Subsidiary
September 30, 2014 and 2013
On June 12, 2013, the Treasury sold the warrant to purchase up to 370,899 shares of the Company's common stock to private investors. The sale of the warrant to new owners did not result in any proceeds to the Company and did not change the Company's capital position or accounting for the warrant.
During the year ended September 30, 2013, the Company purchased and retired 4,576 shares of its Series A Preferred Stock for $4.32 million ; a $255,000 discount from its liquidation value. The discount from liquidation value on the repurchased shares was recorded as an increase to retained earnings. On December 20, 2013, the Company redeemed the remaining 12,065 shares of its Series A Preferred Stock at the liquidation value of $12.07 million .
Investment Securities
Securities are classified upon acquisition as either held to maturity or available for sale. Securities that the Company has the positive intent and ability to hold to maturity are classified as held to maturity and reflected at amortized cost. Securities classified as available for sale are reflected at fair value, with unrealized gains and losses excluded from earnings and reported in other comprehensive income (loss), net of tax effects. Premiums and discounts are amortized to earnings using the interest method over the contractual life of the securities. Gains and losses on sales of securities are recognized on the trade date and determined using the specific identification method.
In estimating whether there are any OTTI losses, management considers (1) the length of time and the extent to which the fair value has been less than amortized cost, (2) the financial condition and near term prospects of the issuer, (3) the impact of changes in market interest rates and (4) the intent and ability of the Company to retain its investment for a period of time sufficient to allow for any anticipated recovery in fair value.
Declines in the fair value of individual securities available for sale that are deemed to be other than temporary are reflected in earnings when identified. The fair value of the security then becomes the new cost basis. For individual securities which the Company does not intend to sell and it is not more likely than not that the Company will be required to sell before recovery of its amortized cost basis, the other than temporary decline in the fair value of the security related to: (1) credit loss is recognized in earnings and (2) market or other factors is recognized in other comprehensive income (loss). Credit loss is recorded if the present value of cash flows is less than the amortized cost. For individual securities which the Company intends to sell or more likely than not will not recover all of its amortized cost, the OTTI is recognized in earnings equal to the entire difference between the security's cost basis and its fair value at the consolidated balance sheet date. For individual securities for which credit loss has been recognized in earnings, interest accruals and amortization and accretion of premiums and discounts are suspended when the credit loss is recognized. Interest received after accruals have been suspended is recognized on a cash basis.
FHLB Stock
The Company, as a member of the FHLB, is required to maintain an investment in capital stock of the FHLB in an amount equal to the greater of 1% of its outstanding home loans or 5% of advances from the FHLB. No ready market exists for this stock, and it has no quoted market value. However, redemption of this stock has historically been at par value. The Company's investment in FHLB stock is carried at cost, which approximates fair value.
The Company evaluates its FHLB stock for impairment as needed. The Company's determination of whether this investment is impaired is based on its assessment of the ultimate recoverability of cost rather than by recognizing temporary declines in value. The determination of whether a decline affects the ultimate recoverability of cost is influenced by criteria such as (1) the significance of any decline in net assets of the FHLB as compared with the capital stock amount and the length of time any decline has persisted; (2) commitments by the FHLB to make payments required by law or regulation and the level of such payments in relation to the operating performance of the FHLB; (3) the impact of legislative and regulatory changes on institutions and, accordingly, the customer base of the FHLB; and (4) the liquidity position of the FHLB. The FHLB has recently announced it has entered into an agreement to merge with the Federal Home Loan Bank of Des Moines. Although the agreement is still in process and has not yet been finalized and approved by certain regulatory agencies, management expects that the pending merger will positively affect the Company's recoverability of its investment in FHLB stock and continue to allow the Bank to obtain borrowings consistent with historical FHLB funding practices. Based on its evaluation, the Company determined that there was no impairment of FHLB stock at September 30, 2014 and 2013.
79
Notes to Consolidated Financial Statements_________________________________________________________________
Timberland Bancorp, Inc. and Subsidiary
September 30, 2014 and 2013
Loans Held for Sale
Mortgage loans originated and intended for sale in the secondary market are stated in the aggregate at the lower of cost or estimated fair value. Net unrealized losses, if any, are recognized through a valuation allowance by charges to income. Gains or losses on sales of loans are recognized at the time of sale. The gain or loss is the difference between the net sales proceeds and the recorded value of the loans, including any remaining unamortized deferred loan origination fees.
Loans Receivable
Loans are stated at the amount of unpaid principal, reduced by the undisbursed portion of construction loans in process, deferred loan origination fees and the allowance for loan losses.
Non-Performing Loans
Loans on non-accrual status and loans past due 90 days or more and still accruing interest are considered to be non-performing loans.
Troubled Debt Restructured Loans
A troubled debt restructured loan is a loan for which the Company, for reasons related to a borrower's financial difficulties, grants a significant concession to the borrower that the Company would not otherwise consider.
The loan terms which have been modified or restructured due to a borrower's financial difficulty, include but are not limited to: a reduction in the stated interest rate; an extension of the maturity at an interest rate below current market rates; a reduction in the face amount of the debt; a reduction in the accrued interest; or re-amortizations, extensions, deferrals and renewals. Troubled debt restructured loans are considered impaired and are individually evaluated for impairment. Troubled debt restructured loans are classified as non-performing unless they have been performing in accordance with modified terms for a period of at least six months.
Impaired Loans
A loan is generally considered impaired when it is probable that the Company will be unable to collect all contractual principal and interest payments due in accordance with the original or modified terms of the loan agreement. When a loan is considered collateral dependent, impairment is measured using the estimated fair value of the underlying collateral, less any prior liens, and when applicable, less estimated selling costs. For impaired loans that are not collateral dependent, impairment is measured using the present value of expected future cash flows, discounted at the loan's original effective interest rate.
The categories of non-accrual loans and impaired loans overlap, although they are not identical. The Company considers all circumstances regarding the loan and borrower on an individual basis when determining whether an impaired loan should be placed on non-accrual status, such as the financial strength of the borrower, the estimated collateral value, reasons for the delay, payment record, the amount past due and the number of days past due.
Allowance for Loan Losses
The allowance for loan losses is maintained at a level sufficient to provide for estimated loan losses based on evaluating known and inherent risks in the loan portfolio. The allowance is provided based upon management's comprehensive analysis of the pertinent factors underlying the quality of the loan portfolio. These factors include changes in the amount and composition of the loan portfolio, delinquency levels, actual loan loss experience, current economic conditions, and a detailed analysis of individual loans for which full collectability may not be assured. The detailed analysis includes methods to estimate the fair value of loan collateral and the existence of potential alternative sources of repayment. The allowance consists of specific and general components. The specific component relates to loans that are deemed impaired. For such loans that are classified as impaired, an allowance is established when the discounted cash flows, collateral value less selling costs (if applicable), or observable market price of the impaired loan is lower than the recorded value of that loan. The general component covers non-classified loans and classified loans that are not evaluated individually for impairment and is based on historical loss experience adjusted for qualitative factors. The Company's historical loss experience is determined by evaluating the average net charge-offs over the most recent economic cycle, but not to exceed six years. Qualitative factors are determined by loan type and allow
80
Notes to Consolidated Financial Statements_________________________________________________________________
Timberland Bancorp, Inc. and Subsidiary
September 30, 2014 and 2013
management to adjust reserve levels to reflect the current general economic environment and portfolio performance trends including recent charge-off trends. Allowances are provided based on management's continuing evaluation of the pertinent factors underlying the quality of the loan portfolio, including changes in the size and composition of the loan portfolio, actual loan loss experience, current economic conditions, collateral values, geographic concentrations, seasoning of the loan portfolio, specific industry conditions, the duration of the current business cycle and regulatory requirements and expectations. The appropriateness of the allowance for loan losses is estimated based upon these factors and trends identified by management at the time consolidated financial statements are prepared.
In accordance with GAAP, a loan is considered impaired when it is probable that a creditor will be unable to collect all amounts (principal and interest) due according to the contractual terms of the loan agreement. Smaller balance homogeneous loans, such as residential mortgage loans and consumer loans, may be collectively evaluated for impairment. When a loan has been identified as being impaired, the amount of the impairment is measured by using discounted cash flows, except when, as an alternative, the current estimated fair value of the collateral, reduced by estimated costs to sell (if applicable), or observable market price is used. The valuation of real estate collateral is subjective in nature and may be adjusted in future periods because of changes in economic conditions. Management considers third-party appraisals, as well as independent fair market value assessments from realtors or persons involved in selling real estate in determining the estimated fair value of particular properties. In addition, as certain of these third-party appraisals and independent fair market value assessments are only updated periodically, changes in the values of specific properties may have occurred subsequent to the most recent appraisals. Accordingly, the amounts of any such potential changes and any related adjustments are generally recorded at the time such information is received. When the measurement of the impaired loan is less than the recorded investment in the loan (including accrued interest and net deferred loan origination fees or costs), impairment is recognized by creating or adjusting an allocation of the allowance for loan losses and uncollected accrued interest is reversed against interest income. If ultimate collection of principal is in doubt, all cash receipts on impaired loans are applied to reduce the principal balance.
A provision for loan losses is charged against operations and is added to the allowance for loan losses based on a quarterly comprehensive analysis of the loan portfolio. The allowance for loan losses is allocated to certain loan categories based on the relative risk characteristics, asset classifications and actual loss experience of the loan portfolio. While management has allocated the allowance for loan losses to various loan portfolio segments, the allowance is general in nature and is available for the loan portfolio in its entirety.
The ultimate recovery of all loans is susceptible to future market factors beyond the Company's control. These factors may result in losses or recoveries differing significantly from those provided in the consolidated financial statements. The Company has experienced a significant decline in valuations for some real estate collateral since October 2008. If real estate values decline further and as updated appraisals are received on collateral for impaired loans, the Company may need to increase the allowance for loan losses appropriately. In addition, regulatory agencies, as an integral part of their examination process, periodically review the Company's allowance for loan losses, and may require the Company to make additions to the allowance based on their judgment about information available to them at the time of their examinations.
Interest on Loans and Loan Fees
Interest on loans is accrued daily based on the principal amount outstanding. Generally, the accrual of interest on loans is discontinued when, in management's opinion, the borrower may be unable to meet payments as they become due or when they are past due 90 days as to either principal or interest (based on contractual terms), unless they are well secured and in the process of collection. In determining whether a borrower may be able to meet payments as they become due, management considers circumstances such as the financial strength of the borrower, the estimated collateral value, reasons for the delays in payments, payment record, the amounts past due and the number of days past due. All interest accrued but not collected for loans that are placed on non-accrual status or charged off is reversed against interest income. Subsequent collections on a cash basis are applied proportionately to past due principal and interest, unless collectability of principal is in doubt, in which case all payments are applied to principal. Loans are returned to accrual status when the loan is deemed current, and the collectability of principal and interest is no longer doubtful, or, in the case of one- to four-family loans, when the loan is less than 90 days delinquent.
The Company charges fees for originating loans. These fees, net of certain loan origination costs, are deferred and amortized to income, on the level-yield basis, over the loan term. If the loan is repaid prior to maturity, the remaining unamortized deferred loan origination fee is recognized in income at the time of repayment.
81
Notes to Consolidated Financial Statements_________________________________________________________________
Timberland Bancorp, Inc. and Subsidiary
September 30, 2014 and 2013
MSRs
The Company holds rights to service loans that it has originated and sold to the Federal Home Loan Mortgage Corporation ("Freddie Mac"). MSRs are capitalized at estimated fair value when acquired through the origination of loans that are subsequently sold with the servicing rights retained and are amortized to servicing income on loans sold approximately in proportion to and over the period of estimated net servicing income. The value of MSRs at the date of the sale of loans is estimated based on the discounted present value of expected future cash flows using key assumptions for servicing income and costs and prepayment rates on the underlying loans. The estimated fair value is periodically evaluated for impairment by comparing actual cash flows and estimated future cash flows from the servicing assets to those estimated at the time the servicing assets were originated. Fair values are estimated using discounted cash flows based on current market rates of interest. For purposes of measuring impairment, the MSRs must be stratified by one or more predominant risk characteristics of the underlying loans. The Company stratifies its capitalized MSRs based on product type and term of the underlying loans. The amount of impairment recognized is the amount, if any, by which the amortized cost of the MSRs exceeds their fair value. Impairment, if deemed temporary, is recognized through a valuation allowance to the extent that fair value is less than the recorded amount.
BOLI
BOLI policies are recorded at their cash surrender value less applicable cash surrender charges. Income from BOLI is recognized when earned.
Goodwill
Goodwill is initially recorded when the purchase price paid for an acquisition exceeds the estimated fair value of the net identified tangible and intangible assets acquired. Goodwill is presumed to have an indefinite useful life and is analyzed annually for impairment. An annual review is performed during the third quarter of each fiscal year, or more frequently if indicators of potential impairment exist, to determine if the recorded goodwill is impaired. If the estimated fair value of the Company's sole reporting unit exceeds the recorded value of the reporting unit, goodwill is not considered impaired and no additional analysis is necessary.
The goodwill impairment test involves a two-step process. Step one estimates the fair value of the reporting unit. If the estimated fair value of the Company's sole reporting unit, the Bank, under step one exceeds the recorded value of the reporting unit, goodwill is not considered impaired and no further analysis is necessary. If the estimated fair value of the Company's sole reporting unit is less than the recorded value, then a step two test test, which calculates the fair value of assets and liabilities to calculate an implied value of goodwill, is performed.
Step one of the goodwill impairment test estimated the fair value of the reporting unit utilizing a discounted cash flow income approach analysis, a public company market approach analysis, a merger and acquisition market approach analysis and a trading price market approach analysis in order to derive an enterprise value for the Company.
The discounted cash flow income approach analysis uses a reporting unit's projection of estimated operating results and cash flows and discounts them using a rate that reflects current market conditions. The projection uses management's estimates of economic and market conditions over the projected period including growth rates in loans and deposits, estimates of future expected changes in net interest margins and cash expenditures. Key assumptions used by the Company in its discounted cash flow model (income approach) included an annual growth rate that ranged from 3.00% to 5.10% , an annual deposit growth rate that ranged from 2.80% to 4.00% and a return on assets that ranged from 0.70% to 1.00% . In addition to the above projections of estimated operating results, key assumptions used to determine the fair value estimate under the approach were the discount rate of 13.6% and the residual capitalization rate of 10.6% . The discount rate used was the cost of equity capital. The cost of equity capital was based on the capital asset pricing model ("CAPM"), modified to account for a small stock premium. The small stock premium represents the additional return required by investors for small stocks based on the Stocks, Bonds, Bills and Inflation 2013 Yearbook. Beyond the approximate five-year forecast period, residual free cash flows were estimated to increase at a constant rate into perpetuity. These cash flows were converted to a residual value using an appropriate residual capitalization rate. The residual capitalization rate was equal to the discount rate minus the expected long-term growth rate of cash flows. Based on historical results, the economic climate, the outlook for the industry and management's expectations, a long-term growth rate of 3.0% was estimated.
82
Notes to Consolidated Financial Statements_________________________________________________________________
Timberland Bancorp, Inc. and Subsidiary
September 30, 2014 and 2013
The public company market approach analysis estimates the fair value by applying cash flow multiples to the reporting unit's operating performance. The multiples are derived from comparable publicly traded companies with operating and investment characteristics similar to those of the Company. Key assumptions used by the Company included the selection of comparable public companies and performance ratios. In applying the public company analysis, the Company selected eight publicly traded institutions based on similar lines of business, markets, growth prospects, risks and firm size. The performance ratios included price to earnings (last twelve months), price to earnings (current year to date), price to book value, price to tangible book value and price to deposits.
The merger and acquisition market approach analysis estimates the fair value by using merger and acquisition transactions involving companies that are similar in nature to the Company. Key assumptions used by the Company included the selection of comparable merger and acquisition transactions and valuation ratios to be used. The analysis used banks located in Washington or Oregon that were acquired after January 1, 2012. The valuation ratios from these transactions for price to earnings and price to tangible book value were then used to derive an estimated fair value of the Company.
The trading price market approach analysis used the closing market price at May 30, 2014 of the Company's common stock, traded on the NASDAQ Global Market to determine the market value of total equity capital.
A key assumption used by the Company in the public company market approach analysis and the trading price market approach analysis was the application of a control premium. The Company's common stock is thinly traded and therefore management believes the trading price reflects a discount for illiquidity. In addition, the trading price of the Company's common stock reflects a minority interest value. To determine the fair market value of a majority interest in the Company's stock, premiums were calculated and applied to the indicated values. Therefore, a control premium was applied to the results of the public company market approach analysis and the trading price market approach analysis because the initial value conclusion was based on minority interest transactions. Merger and acquisition studies were analyzed to conclude that the difference between the acquisition price and a company's stock price prior to acquisition indicates, in part, the price effect of a controlling interest. Based on the evaluation of merger and acquisition studies, a control premium of 25% was used.
The Company performed its fiscal year 2014 goodwill impairment test during the quarter ended June 30, 2014 with the assistance of a third-party firm specializing in goodwill impairment valuations for financial institutions. The third-party analysis was conducted as of May 31, 2014 and the step one test concluded that the reporting unit's fair value was more than its recorded value and, therefore, step two of the analysis was not necessary. Accordingly, the recorded value of goodwill as of May 31, 2014 was not impaired.
A significant amount of judgment is involved in determining if an indicator of goodwill impairment has occurred. Such indicators may include, among others: a significant decline in the expected future cash flows; a sustained significant decline in the Company's stock price and market capitalization; a significant adverse change in legal factors or in the business climate; adverse assessment or action by a regulator; and unanticipated competition. Key assumptions used in the annual goodwill impairment test are highly judgmental and include: selection of comparable companies, amount of control premium, projected cash flows and discount rate applied to projected cash flows. Any change in these indicators or key assumptions could have a significant negative impact on the Company's financial condition, impact the goodwill impairment analysis or cause the Company to perform a goodwill impairment analysis more frequently than once per year.
As of September 30, 2014, management believed that there had been no events or changes in the circumstances since May 31, 2014 that would indicate a potential impairment of goodwill. No assurances can be given, however, that the Company will not record an impairment loss on goodwill in the future.
CDI
The CDI is amortized to non-interest expense using an accelerated method over a ten -year period.
Premises and Equipment
Premises and equipment are recorded at cost. Depreciation is computed using the straight-line method over the following estimated useful lives: buildings and improvements - five to 40 years; furniture and equipment - three to seven years; and
83
Notes to Consolidated Financial Statements_________________________________________________________________
Timberland Bancorp, Inc. and Subsidiary
September 30, 2014 and 2013
automobiles - five years. The cost of maintenance and repairs is charged to expense as incurred. Gains and losses on dispositions are reflected in earnings.
Impairment of Long-Lived Assets
Long-lived assets, consisting of premises and equipment, are reviewed for impairment whenever events or changes in circumstances indicate that the recorded amount of an asset may not be recoverable. Recoverability of assets to be held and used is measured by a comparison of the recorded amount of an asset to future net cash flows expected to be generated by the asset. If such assets are considered to be impaired, the impairment to be recognized is measured by the amount by which the recorded amount of the assets exceeds the discounted recovery amount or estimated fair value of the assets. No events or changes in circumstances have occurred during the years ended September 30, 2014 or 2013 that would cause management to evaluate the recoverability of the Company's long-lived assets.
OREO and Other Repossessed Assets
OREO and other repossessed assets consist of properties or assets acquired through or in lieu of foreclosure, and are recorded initially at the estimated fair value of the properties less estimated costs of disposal. When the property is acquired, any excess of the loan balance over the estimated net realizable value is charged to the allowance for loan losses. Costs relating to development and improvement of the properties or assets are capitalized, while costs relating to holding the properties or assets are expensed. The valuation of real estate collateral is subjective in nature and may be adjusted in future periods because of changes in economic conditions. Management considers third-party appraisals, as well as independent fair market value assessments from realtors or persons involved in selling real estate, in determining the estimated fair value of particular properties. In addition, as certain of these third-party appraisals and independent fair market value assessments are only updated periodically, changes in the values of specific properties may have occurred subsequent to the most recent appraisals. Accordingly, the amounts of any such potential changes and any related adjustments are generally recorded at the time such information is received.
Transfers of Financial Assets
Transfers of financial assets are accounted for as sales when control over the assets has been surrendered. Control over transferred assets is deemed to be surrendered when (1) the assets have been isolated from the Company, (2) the transferee obtains the right (free of conditions that constrain it from taking advantage of that right) to pledge or exchange the transferred assets, and (3) the Company does not maintain effective control over the transferred assets through an agreement to repurchase them before their maturity.
Income Taxes
The Company files a consolidated federal income tax return. The Bank provides for income taxes separately and remits to (receives from) Timberland Bancorp amounts currently due (receivable).
Deferred federal income taxes result from temporary differences between the tax basis of assets and liabilities, and their reported amounts in the consolidated financial statements. These temporary differences will result in differences between income (loss) for tax purposes and income (loss) for financial reporting purposes in future years. As changes in tax laws or rates are enacted, deferred tax assets and liabilities are adjusted through the provision (benefit) for income taxes. Valuation allowances are established to reduce the net recorded amount of deferred tax assets if it is determined to be more likely than not that all or some portion of the potential deferred tax asset will not be realized.
With respect to accounting for uncertainty in incomes taxes, a tax provision is recognized as a benefit only if it is "more likely than not" that the tax position would be sustained in a tax examination, with a tax examination being presumed to occur. The amount recognized is the largest amount of tax benefit that is greater than 50% likely to be realized on examination. For tax positions not meeting the "more likely than not" test, no tax benefit is recorded. The Company recognizes interest and/or penalties related to income tax matters as income tax expense. The Company is no longer subject to United States federal income tax examination by tax authorities for years ended on or before September 30, 2010.
84
Notes to Consolidated Financial Statements_________________________________________________________________
Timberland Bancorp, Inc. and Subsidiary
September 30, 2014 and 2013
ESOP
The Bank sponsors a leveraged ESOP that is accounted for in accordance with GAAP. Accordingly, the debt of the ESOP is recorded as other borrowed funds of the Bank, and the shares pledged as collateral are reported as unearned shares issued to the ESOP in the consolidated balance sheets. The debt of the ESOP is payable to Timberland Bancorp and is therefore eliminated in the consolidated financial statements. As shares are released from collateral, compensation expense is recorded equal to the average market price of the shares for the period, and the shares become available for net income per common share calculations. Dividends paid on unallocated shares reduce the Company's cash contributions to the ESOP.
Cash and Cash Equivalents and Cash Flows
The Company considers amounts included in the consolidated balance sheets' captions "Cash and due from financial institutions," and "Interest-bearing deposits in banks," all of which mature within ninety days, to be cash equivalents for purposes of reporting cash flows. Cash flows from loans, deposits, FHLB advances and repurchase agreements are reported net in the accompanying consolidated statements of cash flows.
Interest-bearing deposits in banks as of September 30, 2014 and 2013 included deposits with the FRB of $55,445,000 and $72,955,000 , respectively. The Company also maintains balances in correspondent bank accounts which, at times, may exceed FDIC insurance limits of $250,000 . Management believes that its risk of loss associated with such balances is minimal due to the financial strength of the FRB and the correspondent banks.
Advertising
Costs for advertising and marketing are expensed as incurred.
Stock-Based Compensation
The Company measures compensation cost for all stock-based awards based on the grant-date fair value of the stock-based awards and recognizes compensation cost over the service period of stock-based awards.
The fair value of stock options is determined using the Black-Scholes valuation model. The fair value of stock grants under the MRDP was equal to the fair value of the shares at the grant date.
The Company's stock compensation plans are described more fully in Note 15.
Net Income Per Common Share
Basic net income per common share is computed by dividing net income to common shareholders by the weighted average number of common shares outstanding during the period, without considering any dilutive items. Diluted net income per common share is computed by dividing net income to common shareholders by the weighted average number of common shares and common stock equivalents for items that are dilutive, net of shares assumed to be repurchased using the treasury stock method at the average share price for the Timberland Bancorp's common stock during the period. The 5% dividend and related accretion for the amount of the Company's Series A Preferred Stock outstanding for the respective year was deducted from net income, and the discount on the redemption of Series A Preferred Stock was added to net income in computing net income to common shareholders. Common stock equivalents arise from assumed conversion of outstanding stock options and the outstanding warrant to purchase common stock. Shares owned by the Bank's ESOP that have not been allocated are not considered to be outstanding for the purpose of computing net income per common share.
Related Party Transactions
The Chairman of the Board of the Bank and Timberland Bancorp is a member of the law firm that provides general counsel to the Company. Legal and other fees paid to this law firm for the years ended September 30, 2014, 2013 and 2012 totaled $179,000 , $166,000 and $203,000 , respectively.
85
Notes to Consolidated Financial Statements_________________________________________________________________
Timberland Bancorp, Inc. and Subsidiary
September 30, 2014 and 2013
Recent Accounting Pronouncements
In July 2013, the Financial Accounting Standards Board ("FASB") issued Accounting Standards Update ("ASU") No. 2013-11, Presentation of an Unrecognized Tax Benefit When a Net Operating Loss Carryforward, a Similar Tax Loss, or a Tax Credit Carryforward Exits . The ASU clarifies when it is appropriate for an unrecognized tax benefit, or portion of an unrecognized tax benefit, to be presented in the financial statements as a reduction to a deferred tax asset. ASU 2013-11 is effective for annual periods, and interim periods within those years, beginning after December 15, 2013. Early adoption is permitted. The ASU should be applied prospectively to all unrecognized tax benefits that exist at the effective date; however, retrospective application is also permitted. Adoption of ASU 2013-11 is not expected to have a material impact on the Company's consolidated financial statements.
In January 2014, the FASB issued ASU No. 2014-04, Receivables - Troubled Debt Restructurings by Creditors . The ASU clarifies when an in-substance repossession or foreclosure occurs, that is, when a creditor should be considered to have received physical possession of the real estate property collateralizing a consumer mortgage loan such that the loan should be derecognized and the real estate property recognized. ASU 2014-04 is effective for annual periods beginning after December 15, 2014, and interim periods within annual periods beginning after December 15, 2015. The ASU can be adopted using a modified retrospective transition method or a prospective transition method. Adoption of ASU 2014-04 is not expected to have a material impact on the Company's consolidated financial statements.
In May 2014, the FASB issued ASU No. 2014-09, Revenue from Contracts with Customers . The ASU implements a common revenue standard that clarifies the principles for recognizing revenue. The core principle of ASU 2014-09 is that an entity should recognize revenue to depict the transfer of promised goods or services to customers in an amount that reflects the consideration to which the entity expects to be entitled in exchange for those goods or services. To achieve that core principle, an entity should apply the following steps: (i) identify the contract(s) with a customer, (ii) identify the performance obligations in the contract, (iii) determine the transaction price, (iv) allocate the transaction price to the performance obligations in the contract and (v) recognize revenue when (or as) the entity satisfies a performance obligation. ASU 2014-09 is effective for annual and interim reporting periods beginning after December 15, 2016. Adoption of ASU 2014-09 is not expected to have a material impact on the Company's consolidated financial statements.
In August 2014, the FASB issued ASU No. 2014-14, Receivables - Troubled Debt Restructurings by Creditors (Subtopic 310-40): Classification of Certain Government-Guaranteed Mortgage Loans upon Foreclosure . The ASU addresses the classification of foreclosed loans that are either fully or partially guaranteed under government programs. ASU 2014-14 clarifies that upon foreclosure of fully or partially guaranteed loans which are guaranteed under government programs and meet certain conditions, the creditor will be required to reclassify the previously existing mortgage loan to a separate other receivable from the guarantor, measured at the amount of the loan balance (principal and interest) that it expects to collect from the guarantor. ASU 2014-14 will be effective for fiscal years, and interim periods within those years, beginning after December 15, 2014 for public organizations. Adoption of ASU 2014-14 is not expected to have a material impact on the Company's consolidated financial statements.
Note 2 - Restricted Assets
Federal Reserve Board regulations require that the Bank maintain certain minimum reserve balances on hand or on deposit with the FRB, based on a percentage of transaction account deposits. The amounts of the reserve requirement balances as of September 30, 2014 and 2013 were $1,008,000 and $840,000 , respectively.
86
Notes to Consolidated Financial Statements_________________________________________________________________
Timberland Bancorp, Inc. and Subsidiary
September 30, 2014 and 2013
Note 3 - Held to Maturity and Available for Sale Securities
Held to maturity and available for sale securities were as follows as of September 30, 2014 and 2013 (dollars in thousands):
| Amortized Cost |
| Gross Unrealized Gains |
| Gross Unrealized Losses |
| Estimated Fair Value | ||||||||
September 30, 2014 |
|
|
|
|
|
|
| ||||||||
Held to Maturity |
|
|
|
|
|
|
| ||||||||
MBS: |
|
|
|
|
|
|
| ||||||||
U.S. government agencies | $ | 1,002 | |
| $ | 32 | |
| $ | (2 | ) |
| $ | 1,032 | |
Private label residential | 1,280 | |
| 965 | |
| (7 | ) |
| 2,238 | | ||||
U.S. agency securities | 3,016 | |
| 1 | |
| (13 | ) |
| 3,004 | | ||||
Total | $ | 5,298 | |
| $ | 998 | |
| $ | (22 | ) |
| $ | 6,274 | |
|
|
|
|
|
|
|
| ||||||||
Available for Sale |
| |
|
| |
|
| |
|
| | ||||
MBS: |
| |
|
| |
|
| |
|
| | ||||
U.S. government agencies | $ | 1,801 | |
| $ | 100 | |
| $ | (2 | ) |
| $ | 1,899 | |
Mutual funds | 1,000 | |
| - | |
| (42 | ) |
| 958 | | ||||
Total | $ | 2,801 | |
| $ | 100 | |
| $ | (44 | ) |
| $ | 2,857 | |
|
|
|
|
|
|
|
| ||||||||
September 30, 2013 |
|
|
|
|
|
|
| ||||||||
Held to Maturity |
| |
|
| |
|
| |
|
| | ||||
MBS: |
| |
|
| |
|
| |
|
| | ||||
U.S. government agencies | $ | 1,202 | |
| $ | 31 | |
| $ | (2 | ) |
| $ | 1,231 | |
Private label residential | 1,521 | |
| 781 | |
| (15 | ) |
| 2,287 | | ||||
U.S. agency securities | 14 | |
| 1 | |
| - | |
| 15 | | ||||
Total | $ | 2,737 | |
| $ | 813 | |
| $ | (17 | ) |
| $ | 3,533 | |
|
|
|
|
|
|
|
| ||||||||
Available for Sale |
| |
|
| |
|
| |
|
| | ||||
MBS: |
| |
|
| |
|
| |
|
| | ||||
U.S. government agencies | $ | 2,144 | |
| $ | 87 | |
| $ | (2 | ) |
| $ | 2,229 | |
Private label residential | 804 | |
| 120 | |
| (10 | ) |
| 914 | | ||||
Mutual funds | 1,000 | |
| - | |
| (42 | ) |
| 958 | | ||||
Total | $ | 3,948 | |
| $ | 207 | |
| $ | (54 | ) |
| $ | 4,101 | |
87
Notes to Consolidated Financial Statements_________________________________________________________________
Timberland Bancorp, Inc. and Subsidiary
September 30, 2014 and 2013
Held to maturity and available for sale securities with unrealized losses were as follows as of September 30, 2014 (dollars in thousands):
| Less Than 12 Months |
| 12 Months or Longer |
| Total | ||||||||||||||||||||||||
| Estimated Fair Value |
| Gross Unrealized Losses |
| Qty |
| Estimated Fair Value |
| Gross Unrealized Losses |
| Qty |
| Estimated Fair Value |
| Gross Unrealized Losses | ||||||||||||||
Held to Maturity |
| |
|
| |
|
| |
|
| |
|
| |
|
| |
|
| |
|
| | ||||||
MBS: |
| |
|
| |
|
| |
|
| |
|
| |
|
| |
|
| |
|
| | ||||||
U.S. government agencies | $ | - | |
| $ | - | |
| - | |
| $ | 76 | |
| $ | (2 | ) |
| 8 | |
| $ | 76 | |
| $ | (2 | ) |
Private label residential | 9 | |
| - | |
| 1 | |
| 188 | |
| (7 | ) |
| 11 | |
| 197 | |
| (7 | ) | ||||||
U.S. agency securities | 2,989 | |
| (13 | ) |
| 1 | |
| - | |
| - | |
| - | |
| 2,989 | |
| (13 | ) | ||||||
Total | $ | 2,998 | |
| $ | (13 | ) |
| 2 | |
| $ | 264 | |
| $ | (9 | ) |
| 19 | |
| $ | 3,262 | |
| $ | (22 | ) |
|
|
|
|
|
|
|
|
|
|
|
|
|
|
|
| ||||||||||||||
Available for Sale |
| |
|
| |
|
| |
|
| |
|
| |
|
| |
|
| |
|
| | ||||||
MBS: |
| |
|
| |
|
| |
|
| |
|
| |
|
| |
|
| |
|
| | ||||||
U.S. government agencies | $ | 19 | |
| $ | - | |
| 1 | |
| $ | 40 | |
| $ | (2 | ) |
| 1 | |
| $ | 59 | |
| $ | (2 | ) |
Mutual funds | - | |
| - | |
| - | |
| 958 | |
| (42 | ) |
| 1 | |
| 958 | |
| (42 | ) | ||||||
Total | $ | 19 | |
| $ | - | |
| 1 | |
| $ | 998 | |
| $ | (44 | ) |
| 2 | |
| $ | 1,017 | |
| $ | (44 | ) |
Held to maturity and available for sale securities with unrealized losses were as follows as of September 30, 2013 (dollars in thousands):
| Less Than 12 Months |
| 12 Months or Longer |
| Total | ||||||||||||||||||||||||
| Estimated Fair Value |
| Gross Unrealized Losses |
| Qty |
| Estimated Fair Value |
| Gross Unrealized Losses |
| Qty |
| Estimated Fair Value |
| Gross Unrealized Losses | ||||||||||||||
Held to Maturity |
| |
|
| |
|
| |
|
| |
|
| |
|
| |
|
| |
|
| | ||||||
MBS: |
| |
|
| |
|
| |
|
| |
|
| |
|
| |
|
| |
|
| | ||||||
U.S. government agencies | $ | 3 | |
| $ | - | |
| 6 | |
| $ | 88 | |
| $ | (2 | ) |
| 4 | |
| $ | 91 | |
| $ | (2 | ) |
Private label residential | 80 | |
| (4 | ) |
| 4 | |
| 239 | |
| (11 | ) |
| 14 | |
| 319 | |
| (15 | ) | ||||||
Total | $ | 83 | |
| $ | (4 | ) |
| 10 | |
| $ | 327 | |
| $ | (13 | ) |
| 18 | |
| $ | 410 | |
| $ | (17 | ) |
|
|
|
|
|
|
|
|
|
|
|
|
|
|
|
| ||||||||||||||
Available for Sale |
| |
|
| |
|
| |
|
| |
|
| |
|
| |
|
| |
|
| | ||||||
MBS: |
| |
|
| |
|
| |
|
| |
|
| |
|
| |
|
| |
|
| | ||||||
U.S. government agencies | $ | 96 | |
| $ | (2 | ) |
| 3 | |
| $ | - | |
| $ | - | |
| 1 | |
| $ | 96 | |
| $ | (2 | ) |
Private label residential | - | |
| - | |
| - | |
| 108 | |
| (10 | ) |
| 2 | |
| 108 | |
| (10 | ) | ||||||
Mutual funds | 958 | |
| (42 | ) |
| 1 | |
| - | |
| - | |
| - | |
| 958 | |
| (42 | ) | ||||||
Total | $ | 1,054 | |
| $ | (44 | ) |
| 4 | |
| $ | 108 | |
| $ | (10 | ) |
| 3 | |
| $ | 1,162 | |
| $ | (54 | ) |
88
Notes to Consolidated Financial Statements_________________________________________________________________
Timberland Bancorp, Inc. and Subsidiary
September 30, 2014 and 2013
The Company has evaluated these securities and has determined that the decline in their value is temporary. The unrealized losses are primarily due to changes in market interest rates and spreads in the market for mortgage-related products. The fair value of these securities is expected to recover as the securities approach their maturity dates and/or as the pricing spreads narrow on mortgage-related securities. The Company has the ability and the intent to hold the investments until the market value recovers. Furthermore, as of September 30, 2014 , management does not have the intent to sell any of the securities classified as available for sale where the estimated fair value is below the recorded value and believes that it is more likely than not that the Company will not have to sell such securities before a recovery of cost or recorded value if previously written down.
In accordance with GAAP, the Company bifurcates OTTI into (1) amounts related to credit losses which are recognized through earnings and (2) amounts related to all other factors which are recognized as a component of other comprehensive income (loss).
To determine the component of the gross OTTI related to credit losses, the Company compared the amortized cost basis of the OTTI security to the present value of its revised expected cash flows, discounted using its pre-impairment yield. The revised expected cash flow estimates for individual securities are based primarily on an analysis of default rates, prepayment speeds and third-party analytic reports. Significant judgment by management is required in this analysis that includes, but is not limited to, assumptions regarding the collectability of principal and interest, net of related expenses, on the underlying loans.
The following table presents a summary of the significant inputs utilized to measure management's estimates of the credit loss component on OTTI securities as of September 30, 2014 , 2013 and 2012 :
| Range |
| Weighted | |||||
| Minimum |
| Maximum |
| Average | |||
September 30, 2014 |
|
|
|
|
| |||
Constant prepayment rate | 6.00 | % |
| 15.00 | % |
| 10.59 | % |
Collateral default rate | 0.01 | % |
| 22.34 | % |
| 7.41 | % |
Loss severity rate | 0.16 | % |
| 75.17 | % |
| 45.81 | % |
|
|
|
|
|
| |||
September 30, 2013 |
|
|
|
|
| |||
Constant prepayment rate | 6.00 | % |
| 15.00 | % |
| 12.33 | % |
Collateral default rate | 0.73 | % |
| 22.53 | % |
| 7.84 | % |
Loss severity rate | 20.48 | % |
| 75.02 | % |
| 52.69 | % |
|
|
|
|
|
| |||
September 30, 2012 |
|
|
|
|
| |||
Constant prepayment rate | 6.00 | % |
| 15.00 | % |
| 8.77 | % |
Collateral default rate | 0.06 | % |
| 28.40 | % |
| 8.74 | % |
Loss severity rate | 0.52 | % |
| 76.03 | % |
| 48.28 | % |
89
Notes to Consolidated Financial Statements_________________________________________________________________
Timberland Bancorp, Inc. and Subsidiary
September 30, 2014 and 2013
The following table presents the OTTI losses for the years ended September 30, 2014 , 2013 and 2012 (dollars in thousands):
| 2014 |
| 2013 |
| 2012 | ||||||||||||||||||
| Held To Maturity |
| Available For Sale |
| Held To Maturity |
| Available For Sale |
| Held To Maturity |
| Available For Sale | ||||||||||||
Total recoveries (OTTI) | $ | (83 | ) |
| $ | 90 | |
| $ | (13 | ) |
| $ | (2 | ) |
| $ | (156 | ) |
| $ | (50 | ) |
Adjustments for portion of OTTI recorded as (transferred from) other comprehensive loss (before taxes)(1) | 52 | |
| - | |
| (32 | ) |
| - | |
| (8 | ) |
| - | | ||||||
|
|
|
|
|
|
|
|
|
|
|
| ||||||||||||
Net recoveries (OTTI) recognized in earnings (2) | $ | (31 | ) |
| $ | 90 | |
| $ | (45 | ) |
| $ | (2 | ) |
| $ | (164 | ) |
| $ | (50 | ) |
________________________
(1) | Represents OTTI related to all other factors. |
(2) | Represents OTTI related to credit losses. |
The following table presents a roll forward of the credit loss component of held to maturity and available for sale debt securities that have been written down for OTTI with the credit loss component recognized in earnings for the years ended September 30, 2014 , 2013 and 2012 (dollars in thousands):
| 2014 | |
| 2013 | |
| 2012 | | |||
Balance, beginning of year | $ | 2,084 | |
| $ | 2,703 | |
| $ | 3,361 | |
|
|
|
|
|
| ||||||
Additions: |
| |
|
| |
|
| | |||
Credit losses for which OTTI was not previously recognized | 2 | |
| 7 | |
| 81 | | |||
Additional increases to the amount related to credit loss for which OTTI was previously recognized | 33 | |
| 45 | |
| 134 | | |||
Subtractions: |
|
|
| |
|
| | ||||
Realized losses previously recorded as credit losses | (555 | ) |
| (671 | ) |
| (873 | ) | |||
Recovery of prior credit loss | 90 | |
| - | |
| - | | |||
|
|
|
|
|
| ||||||
Balance, end of year | $ | 1,654 | |
| $ | 2,084 | |
| $ | 2,703 | |
During the year ended September 30, 2014 there were $32,000 in realized losses on five available for sale securities. During the year ended September 30, 2013 there were no realized gains on sales of available for sale securities. During the year ended September 30, 2012 , there was a realized gain on one available for sale security in the amount of $22,000 . During the year ended September 30, 2014 , the Company recorded a $465,000 net realized loss (as a result of securities being deemed worthless) on fifteen held to maturity and six available for sale residential MBS, all of which had been recognized previously as a credit loss. During the year ended September 30, 2013 , the Company recorded a $671,000 realized loss (as a result of securities being deemed worthless) on eighteen held to maturity and five available for sale residential MBS, all of which had been recognized previously as a credit loss. During the year ended September 30, 2012 , the Company recorded a $873,000 realized loss (as a result of securities being deemed worthless) on twenty-five held to maturity and five available for sale residential MBS all of which had been recognized previously as a credit loss.
The recorded amount of residential mortgage-backed and agency securities pledged as collateral for public fund deposits, federal treasury tax and loan deposits, FHLB collateral and other non-profit organization deposits totaled $6,221,000 and $4,537,000 at September 30, 2014 and 2013 , respectively.
90
Notes to Consolidated Financial Statements_________________________________________________________________
Timberland Bancorp, Inc. and Subsidiary
September 30, 2014 and 2013
The contractual maturities of debt securities at September 30, 2014 , are as follows (dollars in thousands). Expected maturities may differ from scheduled maturities due to the prepayment of principal or call provisions.
| Held to Maturity |
| Available for Sale | ||||||||||||
| Amortized Cost |
| Estimated Fair Value |
| Amortized Cost |
| Estimated Fair Value | ||||||||
Due after one year to five years | $ | 3,020 | |
| $ | 3,008 | |
| $ | 19 | |
| $ | 19 | |
Due after five years to ten years | 16 | |
| 17 | |
| 33 | |
| 34 | | ||||
Due after ten years | 2,262 | |
| 3,249 | |
| 1,749 | |
| 1,846 | | ||||
Total | $ | 5,298 | |
| $ | 6,274 | |
| $ | 1,801 | |
| $ | 1,899 | |
Note 4 - Loans Receivable and Allowance for Loan Losses
Loans receivable and loans held for sale by portfolio segment consisted of the following at September 30, 2014 and 2013 (dollars in thousands):
| 2014 | |
| 2013 | | ||
Mortgage loans: |
|
|
| ||||
One- to four-family | $ | 97,635 | |
| $ | 102,387 | |
Multi-family | 46,206 | |
| 51,108 | | ||
Commercial | 294,354 | |
| 291,297 | | ||
Construction – custom and owner/builder | 59,752 | |
| 40,811 | | ||
Construction – speculative one- to four-family | 2,577 | |
| 1,428 | | ||
Construction – commercial | 3,310 | |
| 2,239 | | ||
Construction – multi-family | 2,840 | |
| 143 | | ||
Construction – land development | - | |
| 515 | | ||
Land | 29,589 | |
| 31,144 | | ||
Total mortgage loans | 536,263 | |
| 521,072 | | ||
Consumer loans: |
| |
|
| | ||
Home equity and second mortgage | 34,921 | |
| 33,014 | | ||
Other | 4,699 | |
| 5,981 | | ||
Total consumer loans | 39,620 | |
| 38,995 | | ||
|
|
|
| ||||
Commercial business loans | 30,559 | |
| 17,499 | | ||
Total loans receivable | 606,442 | |
| 577,566 | | ||
Less: |
| |
|
| | ||
Undisbursed portion of construction loans in process | 29,416 | |
| 18,527 | | ||
Deferred loan origination fees | 1,746 | |
| 1,710 | | ||
Allowance for loan losses | 10,427 | |
| 11,136 | | ||
| 41,589 | |
| 31,373 | | ||
Loans receivable, net | 564,853 | |
| 546,193 | | ||
Loans held for sale (one- to four-family) | 899 | |
| 1,911 | | ||
Total loans receivable and loans held for sale, net | $ | 565,752 | |
| $ | 548,104 | |
91
Notes to Consolidated Financial Statements_________________________________________________________________
Timberland Bancorp, Inc. and Subsidiary
September 30, 2014 and 2013
Certain related parties of the Company, principally Bank directors and officers, are loan customers of the Bank in the ordinary course of business. Such related party loans were performing according to their repayment terms at September 30, 2014 and 2013 . Activity in related party loans during the years ended September 30, 2014 , 2013 and 2012 was as follows (dollars in thousands):
| 2014 | |
| 2013 | |
| 2012 | ||||
Balance, beginning of year | $ | 1,095 | |
| $ | 1,113 | |
| $ | 2,498 | |
New loans or advances | 40 | |
| 276 | |
| 175 | | |||
Repayments and reclassifications | (208 | ) |
| (294 | ) |
| (1,560 | ) | |||
Balance, end of year | $ | 927 | |
| $ | 1,095 | |
| $ | 1,113 | |
Loan Segment Risk Characteristics
The Company believes that its loan classes are the same as its loan segments.
One- To Four-Family Residential Lending: The Company originates both fixed rate and adjustable rate loans secured by one- to four-family residences. A portion of the fixed-rate one- to four-family loans are sold in the secondary market for asset/liability management purposes and to generate non-interest income. The Company's lending policies generally limit the maximum loan-to-value on one- to four-family loans to 90% of the lesser of the appraised value or the purchase price. However, the Company usually obtains private mortgage insurance on the portion of the principal amount that exceeds 80% of the appraised value of the property.
Multi-Family Lending : The Company originates loans secured by multi-family dwelling units (more than four units). Multi-family lending generally affords the Company an opportunity to receive interest at rates higher than those generally available from one- to four-family residential lending. However, loans secured by multi-family properties usually are greater in amount, more difficult to evaluate and monitor and, therefore, involve a greater degree of risk than one- to four-family residential mortgage loans. Because payments on loans secured by multi-family properties are often dependent on the successful operation and management of the properties, repayment of such loans may be affected by adverse conditions in the real estate market or economy. The Company attempts to minimize these risks by scrutinizing the financial condition of the borrower, the quality of the collateral and the management of the property securing the loan.
Commercial Mortgage Lending : The Company originates commercial real estate loans secured by properties such as office buildings, retail/wholesale facilities, motels, restaurants, mini-storage facilities and other commercial properties. Commercial real estate lending generally affords the Company an opportunity to receive interest at higher rates than those available from one- to four-family residential lending. However, loans secured by such properties usually are greater in amount, more difficult to evaluate and monitor and, therefore, involve a greater degree of risk than one- to four-family residential mortgage loans. Because payments on loans secured by commercial properties are often dependent on the successful operation and management of the properties, repayment of these loans may be affected by adverse conditions in the real estate market or economy. The Company attempts to mitigate these risks by generally limiting the maximum loan-to-value ratio to 80% and scrutinizing the financial condition of the borrower, the quality of the collateral and the management of the property securing the loan.
Construction Lending : The Company currently originates the following types of construction loans: custom construction loans, owner/builder construction loans, speculative construction loans (on a very limited basis), commercial real estate construction loans, and multi-family construction loans. The Company is not currently originating land development loans.
Construction lending affords the Company the opportunity to achieve higher interest rates and fees with shorter terms to maturity than does its single-family permanent mortgage lending. Construction lending, however, is generally considered to involve a higher degree of risk than one-to four family residential lending because of the inherent difficulty in estimating both a property's value at completion of the project and the estimated cost of the project. The nature of these loans is such that they are generally more difficult to evaluate and monitor. If the estimated cost of construction proves to be inaccurate, the Company may be required to advance funds beyond the amount originally committed to complete the project. If the estimate of value upon completion proves to be inaccurate, the Company may be confronted with a project whose value is insufficient to assure full repayment, and the Company may incur a loss. Projects may also be jeopardized by disagreements between borrowers and builders and by the failure of builders to pay subcontractors. Loans to construct homes for which no purchaser has been
92
Notes to Consolidated Financial Statements_________________________________________________________________
Timberland Bancorp, Inc. and Subsidiary
September 30, 2014 and 2013
identified carry more risk because the payoff for the loan depends on the builder's ability to sell the property prior to the time that the construction loan is due. The Company attempts to mitigate these risks by adhering to its underwriting policies, disbursement procedures, and monitoring practices.
Construction Lending – Custom and Owner/Builder: Custom construction loans are made to home builders who, at the time of construction, have a signed contract with a home buyer who has a commitment to purchase the finished home. Owner/builder construction loans are originated to home owners rather than home builders and are typically refinanced into permanent loans at the completion of construction.
Construction Lending – Speculative One- To Four-Family: Speculative one-to four-family construction loans are made to home builders and are termed "speculative" because the home builder does not have, at the time of the loan origination, a signed contract with a home buyer who has a commitment for permanent financing with the Company or another lender for the finished home. The home buyer may be identified either during or after the construction period. The Company is currently originating speculative one-to four-family construction loans on a very limited basis.
Construction Lending – Commercial: Commercial construction loans are originated to construct properties such as office buildings, hotels, retail rental space and mini-storage facilities.
Construction Lending – Multi-Family: Multi-family construction loans are originated to construct apartment buildings and condominium projects.
Construction Lending – Land Development: The Company historically originated loans to real estate developers for the purpose of developing residential subdivisions. The Company is not currently originating any land development loans.
Land Lending : The Company has historically originated loans for the acquisition of land upon which the purchaser can then build or make improvements necessary to build or to sell as improved lots. Currently, the Company is originating new land loans on a very limited basis. Loans secured by undeveloped land or improved lots involve greater risks than one- to four-family residential mortgage loans because these loans are more difficult to evaluate. If the estimate of value proves to be inaccurate, in the event of default or foreclosure, the Company may be confronted with a property value which is insufficient to assure full repayment. The Company attempts to minimize this risk by generally limiting the maximum loan-to-value ratio on land loans to 75% .
Consumer Lending – Home Equity and Second Mortgages: The Company originates home equity lines of credit and second mortgage loans. Home equity lines of credit and second mortgage loans have a greater credit risk than one- to four-family residential mortgage loans because they are secured by mortgages subordinated to the existing first mortgage on the property, which may or may not be held by the Company. The Company attempts to mitigate these risks by adhering to its underwriting policies in evaluating the collateral and the credit-worthiness of the borrower.
Consumer Lending – Other: The Company originates other consumer loans, which include automobile loans, boat loans, motorcycle loans, recreational vehicle loans, savings account loans and unsecured loans. Other consumer loans generally have shorter terms to maturity than mortgage loans. Other consumer loans generally involve a greater degree of risk than do residential mortgage loans, particularly in the case of consumer loans that are unsecured or secured by rapidly depreciating assets such as automobiles. In such cases, any repossessed collateral for a defaulted consumer loan may not provide an adequate source of repayment of the outstanding loan balance as a result of the greater likelihood of damage, loss or depreciation. The Company attempts to mitigate these risks by adhering to its underwriting policies in evaluating the credit-worthiness of the borrower.
Commercial Business Lending : The Company originates commercial business loans which are generally secured by business equipment, accounts receivable, inventory or other property. The Company also generally obtains personal guarantees from the business owners based on a review of personal financial statements. Commercial business lending generally involves risks that are different from those associated with residential and commercial real estate lending. Real estate lending is generally considered to be collateral based lending with loan amounts based on predetermined loan to collateral values, and liquidation of the underlying real estate collateral is viewed as the primary source of repayment in the event of borrower default. Although commercial business loans are often collateralized by equipment, inventory, accounts receivable, or other business assets, the liquidation of collateral in the event of a borrower default is often an insufficient source of repayment, because accounts receivable may be uncollectible and inventories and equipment may be obsolete or of limited use. Accordingly, the repayment of a commercial business loan depends primarily on the credit-worthiness of the borrower (and any guarantors), while the liquidation of collateral is a secondary and potentially insufficient source of repayment. The Company attempts to mitigate
93
Notes to Consolidated Financial Statements_________________________________________________________________
Timberland Bancorp, Inc. and Subsidiary
September 30, 2014 and 2013
these risks by adhering to its underwriting policies in evaluating the management of the business and the credit-worthiness of the borrowers and the guarantors.
Allowance for Loan Losses
The following table sets forth information for the year ended September 30, 2014 regarding activity in the allowance for loan losses by portfolio segment (dollars in thousands):
| Beginning Allowance |
| Provision (Credit) |
| Charge- offs |
| Recoveries |
| Ending Allowance | ||||||||||
Mortgage loans: |
|
|
|
|
|
|
|
|
| ||||||||||
One-to four-family | $ | 1,449 | |
| $ | 1,113 | |
| $ | 1,106 | |
| $ | 194 | |
| $ | 1,650 | |
Multi-family | 749 | |
| (362 | ) |
| - | |
| - | |
| 387 | | |||||
Commercial | 5,275 | |
| 20 | |
| 463 | |
| 4 | |
| 4,836 | | |||||
Construction – custom and owner/builder | 262 | |
| 188 | |
| - | |
| - | |
| 450 | | |||||
Construction – speculative one- to four-family | 96 | |
| (44 | ) |
| - | |
| - | |
| 52 | | |||||
Construction – commercial | 56 | |
| 22 | |
| - | |
| - | |
| 78 | | |||||
Construction – multi-family | - | |
| (226 | ) |
| - | |
| 251 | |
| 25 | | |||||
Construction – land development | - | |
| (287 | ) |
| - | |
| 287 | |
| - | | |||||
Land | 1,940 | |
| (664 | ) |
| 260 | |
| 418 | |
| 1,434 | | |||||
Consumer loans: |
| |
| | |
|
| |
|
| |
|
| | |||||
Home equity and second mortgage | 782 | |
| 137 | |
| 47 | |
| 7 | |
| 879 | | |||||
Other | 200 | |
| (20 | ) |
| 6 | |
| 2 | |
| 176 | | |||||
Commercial business loans | 327 | |
| 123 | |
| 14 | |
| 24 | |
| 460 | | |||||
Total | $ | 11,136 | |
| $ | - | |
| $ | 1,896 | |
| $ | 1,187 | |
| $ | 10,427 | |
The following table sets forth information for the year ended September 30, 2013 regarding activity in the allowance for loan losses by portfolio segment (dollars in thousands):
| Beginning Allowance |
| Provision (Credit) |
| Charge- offs |
| Recoveries |
| Ending Allowance | ||||||||||
Mortgage loans: |
|
|
|
|
|
|
|
|
| ||||||||||
One-to four-family | $ | 1,558 | |
| $ | 565 | |
| $ | 769 | |
| $ | 95 | |
| $ | 1,449 | |
Multi-family | 1,156 | |
| (407 | ) |
| - | |
| - | |
| 749 | | |||||
Commercial | 4,247 | |
| 1,640 | |
| 667 | |
| 55 | |
| 5,275 | | |||||
Construction – custom and owner/builder | 386 | |
| (124 | ) |
| 26 | |
| 26 | |
| 262 | | |||||
Construction – speculative one- to four-family | 128 | |
| (32 | ) |
| - | |
| - | |
| 96 | | |||||
Construction – commercial | 429 | |
| (373 | ) |
| - | |
| - | |
| 56 | | |||||
Construction – multi-family | - | |
| 116 | |
| 116 | |
| - | |
| - | | |||||
Construction – land development | - | |
| (129 | ) |
| 17 | |
| 146 | |
| - | | |||||
Land | 2,392 | |
| 1,801 | |
| 2,307 | |
| 54 | |
| 1,940 | | |||||
Consumer loans: |
| |
|
| |
|
| |
|
| |
|
| | |||||
Home equity and second mortgage | 759 | |
| 202 | |
| 184 | |
| 5 | |
| 782 | | |||||
Other | 254 | |
| (40 | ) |
| 14 | |
| - | |
| 200 | | |||||
Commercial business loans | 516 | |
| (294 | ) |
| - | |
| 105 | |
| 327 | | |||||
Total | $ | 11,825 | |
| $ | 2,925 | |
| $ | 4,100 | |
| $ | 486 | |
| $ | 11,136 | |
The following table sets forth information for the year ended September 30, 2012 regarding activity in the allowance for loan losses by portfolio segment (dollars in thousands):
94
Notes to Consolidated Financial Statements_________________________________________________________________
Timberland Bancorp, Inc. and Subsidiary
September 30, 2014 and 2013
| Beginning Allowance |
| Provision (Credit) |
| Charge- offs |
| Recoveries |
| Ending Allowance | ||||||||||
Mortgage loans: |
|
|
|
|
|
|
|
|
| ||||||||||
One-to four-family | $ | 760 | |
| $ | 1,000 | |
| $ | 276 | |
| $ | 74 | |
| $ | 1,558 | |
Multi-family | 1,076 | |
| 80 | |
| 14 | |
| 14 | |
| 1,156 | | |||||
Commercial | 4,035 | |
| 1,427 | |
| 1,215 | |
| - | |
| 4,247 | | |||||
Construction – custom and owner/builder | 222 | |
| 164 | |
| - | |
| - | |
| 386 | | |||||
Construction – speculative one- to four-family | 169 | |
| (42 | ) |
| - | |
| 1 | |
| 128 | | |||||
Construction – commercial | 794 | |
| 257 | |
| 622 | |
| - | |
| 429 | | |||||
Construction – multi-family | 354 | |
| (780 | ) |
| 24 | |
| 450 | |
| - | | |||||
Construction – land development | 79 | |
| 106 | |
| 239 | |
| 54 | |
| - | | |||||
Land | 2,795 | |
| 751 | |
| 1,251 | |
| 97 | |
| 2,392 | | |||||
Consumer loans: |
| |
|
| |
|
| |
|
| |
|
| | |||||
Home equity and second mortgage | 460 | |
| 517 | |
| 232 | |
| 14 | |
| 759 | | |||||
Other | 415 | |
| (137 | ) |
| 24 | |
| - | |
| 254 | | |||||
Commercial business loans | 787 | |
| 157 | |
| 430 | |
| 2 | |
| 516 | | |||||
Total | $ | 11,946 | |
| $ | 3,500 | |
| $ | 4,327 | |
| $ | 706 | |
| $ | 11,825 | |
The following table presents information on the loans evaluated individually and collectively for impairment in the allowance for loan losses by portfolio segment at September 30, 2014 (dollars in thousands):
| Allowance for Loan Losses |
| Recorded Investment in Loans | ||||||||||||||||||||
| Individually Evaluated for Impairment |
| Collectively Evaluated for Impairment |
| Total |
| Individually Evaluated for Impairment |
| Collectively Evaluated for Impairment |
| Total | ||||||||||||
Mortgage loans: |
|
|
|
|
|
|
|
|
|
|
| ||||||||||||
One- to four-family | $ | 709 | |
| $ | 941 | |
| $ | 1,650 | |
| $ | 7,011 | |
| $ | 91,523 | |
| $ | 98,534 | |
Multi-family | 39 | |
| 348 | |
| 387 | |
| 3,317 | |
| 42,889 | |
| 46,206 | | ||||||
Commercial | 797 | |
| 4,039 | |
| 4,836 | |
| 17,188 | |
| 277,166 | |
| 294,354 | | ||||||
Construction – custom and owner/ builder | - | |
| 450 | |
| 450 | |
| - | |
| 34,553 | |
| 34,553 | | ||||||
Construction – speculative one- to four-family | - | |
| 52 | |
| 52 | |
| - | |
| 1,204 | |
| 1,204 | | ||||||
Construction – commercial | - | |
| 78 | |
| 78 | |
| - | |
| 2,887 | |
| 2,887 | | ||||||
Construction – multi-family | - | |
| 25 | |
| 25 | |
| - | |
| 419 | |
| 419 | | ||||||
Land | 300 | |
| 1,134 | |
| 1,434 | |
| 5,158 | |
| 24,431 | |
| 29,589 | | ||||||
Consumer loans: |
| |
|
| |
|
| |
| | |
|
| |
|
| | ||||||
Home equity and second mortgage | 162 | |
| 717 | |
| 879 | |
| 797 | |
| 34,124 | |
| 34,921 | | ||||||
Other | - | |
| 176 | |
| 176 | |
| 3 | |
| 4,696 | |
| 4,699 | | ||||||
Commercial business loans | - | |
| 460 | |
| 460 | |
| - | |
| 30,559 | |
| 30,559 | | ||||||
Total | $ | 2,007 | |
| $ | 8,420 | |
| $ | 10,427 | |
| $ | 33,474 | |
| $ | 544,451 | |
| $ | 577,925 | |
95
Notes to Consolidated Financial Statements_________________________________________________________________
Timberland Bancorp, Inc. and Subsidiary
September 30, 2014 and 2013
The following table presents information on the loans evaluated individually and collectively for impairment in the allowance for loan losses by portfolio segment at September 30, 2013 (dollars in thousands):
| Allowance for Loan Losses |
| Recorded Investment in Loans | ||||||||||||||||||||
| Individually Evaluated for Impairment |
| Collectively Evaluated for Impairment |
| Total |
| Individually Evaluated for Impairment |
| Collectively Evaluated for Impairment |
| Total | ||||||||||||
Mortgage loans: |
|
|
|
|
|
|
|
|
|
|
| ||||||||||||
One- to four-family | $ | 600 | |
| $ | 849 | |
| $ | 1,449 | |
| $ | 8,984 | |
| $ | 95,314 | |
| $ | 104,298 | |
Multi-family | 334 | |
| 415 | |
| 749 | |
| 5,184 | |
| 45,924 | |
| 51,108 | | ||||||
Commercial | 1,763 | |
| 3,512 | |
| 5,275 | |
| 19,510 | |
| 271,787 | |
| 291,297 | | ||||||
Construction – custom and owner/ builder | - | |
| 262 | |
| 262 | |
| - | |
| 22,788 | |
| 22,788 | | ||||||
Construction – speculative one- to four-family | 88 | |
| 8 | |
| 96 | |
| 687 | |
| 236 | |
| 923 | | ||||||
Construction – commercial | - | |
| 56 | |
| 56 | |
| - | |
| 2,239 | |
| 2,239 | | ||||||
Construction – multi-family | - | |
| - | |
| - | |
| 143 | |
| 1 | |
| 144 | | ||||||
Construction – land development | - | |
| - | |
| - | |
| 515 | |
| - | |
| 515 | | ||||||
Land | 234 | |
| 1,706 | |
| 1,940 | |
| 2,391 | |
| 28,753 | |
| 31,144 | | ||||||
Consumer loans: |
| |
|
| |
|
| |
|
| |
|
| |
|
| | ||||||
Home equity and second mortgage | 57 | |
| 725 | |
| 782 | |
| 679 | |
| 32,335 | |
| 33,014 | | ||||||
Other | - | |
| 200 | |
| 200 | |
| 6 | |
| 5,975 | |
| 5,981 | | ||||||
Commercial business loans | - | |
| 327 | |
| 327 | |
| - | |
| 17,499 | |
| 17,499 | | ||||||
Total | $ | 3,076 | |
| $ | 8,060 | |
| $ | 11,136 | |
| $ | 38,099 | |
| $ | 522,851 | |
| $ | 560,950 | |
| 30–59 Days Past Due |
| 60-89 Days Past Due |
| Non- Accrual(1) |
| Past Due 90 Days or More and Still Accruing |
| Total Past Due |
| Current |
| Total Loans | ||||||||||||||
Mortgage loans: |
|
|
|
|
|
|
|
|
|
|
|
|
| ||||||||||||||
One- to four-family | $ | - | |
| $ | 577 | |
| $ | 4,376 | |
| $ | - | |
| $ | 4,953 | |
| $ | 93,581 | |
| $ | 98,534 | |
Multi-family | - | |
| - | |
| - | |
| - | |
| - | |
| 46,206 | |
| 46,206 | | |||||||
Commercial | - | |
| 695 | |
| 1,468 | |
| 812 | |
| 2,975 | |
| 291,379 | |
| 294,354 | | |||||||
Construction – custom and owner/ builder | - | |
| 156 | |
| - | |
| - | |
| 156 | |
| 34,397 | |
| 34,553 | | |||||||
Construction – speculative one- to four-family | - | |
| - | |
| - | |
| - | |
| - | |
| 1,204 | |
| 1,204 | | |||||||
Construction – commercial | - | |
| - | |
| - | |
| - | |
| - | |
| 2,887 | |
| 2,887 | | |||||||
Construction – multi-family | - | |
| - | |
| - | |
| - | |
| - | |
| 419 | |
| 419 | | |||||||
Land | 357 | |
| 27 | |
| 4,564 | |
| - | |
| 4,948 | |
| 24,641 | |
| 29,589 | | |||||||
Consumer loans: |
| |
|
| |
|
| |
|
| |
|
| |
| | |
| | | |||||||
Home equity and second mortgage | 62 | |
| 44 | |
| 498 | |
| - | |
| 604 | |
| 34,317 | |
| 34,921 | | |||||||
Other | 42 | |
| - | |
| 3 | |
| - | |
| 45 | |
| 4,654 | |
| 4,699 | | |||||||
Commercial business loans | 21 | |
| - | |
| - | |
| - | |
| 21 | |
| 30,538 | |
| 30,559 | | |||||||
Total | $ | 482 | |
| $ | 1,499 | |
| $ | 10,909 | |
| $ | 812 | |
| $ | 13,702 | |
| $ | 564,223 | |
| $ | 577,925 | |
__________________
(1) | Includes non-accrual loans past due 90 days or more and other loans classified as non-accrual. |
96
Notes to Consolidated Financial Statements_________________________________________________________________
Timberland Bancorp, Inc. and Subsidiary
September 30, 2014 and 2013
The following table presents an age analysis of past due status of loans by portfolio segment at September 30, 2013 (dollars in thousands):
| 30–59 Days Past Due |
| 60-89 Days Past Due |
| Non- Accrual(1) |
| Past Due 90 Days or More and Still Accruing |
| Total Past Due |
| Current |
| Total Loans | ||||||||||||||
Mortgage loans: |
|
|
|
|
|
|
|
|
|
|
|
|
| ||||||||||||||
One- to four-family | $ | 14 | |
| $ | 1,218 | |
| $ | 6,985 | |
| $ | - | |
| $ | 8,217 | |
| $ | 96,081 | |
| $ | 104,298 | |
Multi-family | - | |
| - | |
| - | |
| - | |
| - | |
| 51,108 | |
| 51,108 | | |||||||
Commercial | - | |
| 2,537 | |
| 3,435 | |
| - | |
| 5,972 | |
| 285,325 | |
| 291,297 | | |||||||
Construction – custom and owner/ builder | - | |
| - | |
| - | |
| - | |
| - | |
| 22,788 | |
| 22,788 | | |||||||
Construction – speculative one- to four-family | - | |
| - | |
| - | |
| - | |
| - | |
| 923 | |
| 923 | | |||||||
Construction – commercial | - | |
| - | |
| - | |
| - | |
| - | |
| 2,239 | |
| 2,239 | | |||||||
Construction – multi-family | - | |
| - | |
| 144 | |
| - | |
| 144 | |
| - | |
| 144 | | |||||||
Construction – land development | - | |
| - | |
| 515 | |
| - | |
| 515 | |
| - | |
| 515 | | |||||||
Land | - | |
| - | |
| 2,146 | |
| 284 | |
| 2,430 | |
| 28,714 | |
| 31,144 | | |||||||
Consumer loans: |
| |
|
| |
|
| |
|
| |
|
| |
|
| |
|
| | |||||||
Home equity and second mortgage | 101 | |
| 20 | |
| 380 | |
| 152 | |
| 653 | |
| 32,361 | |
| 33,014 | | |||||||
Other | 1 | |
| 39 | |
| 5 | |
| - | |
| 45 | |
| 5,936 | |
| 5,981 | | |||||||
Commercial business loans | 83 | |
| 15 | |
| - | |
| - | |
| 98 | |
| 17,401 | |
| 17,499 | | |||||||
Total | $ | 199 | |
| $ | 3,829 | |
| $ | 13,610 | |
| $ | 436 | |
| $ | 18,074 | |
| $ | 542,876 | |
| $ | 560,950 | |
___________________
(1) Includes non-accrual loans past due 90 days or more and other loans classified as non-accrual.
Credit Quality Indicators
The Company uses credit risk grades which reflect the Company's assessment of a loan's risk or loss potential. The Company categorizes loans into risk grade categories based on relevant information about the ability of borrowers to service their debt such as: current financial information, historical payment experience, credit documentation, public information and current economic trends, among other factors such as the estimated fair value of the collateral. The Company uses the following definitions for credit risk ratings as part of the on-going monitoring of the credit quality of its loan portfolio:
Pass: Pass loans are defined as those loans that meet acceptable quality underwriting standards.
Watch: Watch loans are defined as those loans that still exhibit acceptable quality, but have some concerns that justify greater attention. If these concerns are not corrected, a potential for further adverse categorization exists. These concerns could relate to a specific condition peculiar to the borrower or its industry segment or the general economic environment.
Special Mention: Special mention loans are defined as those loans deemed by management to have some potential weaknesses that deserve management's close attention. If left uncorrected, these potential weaknesses may result in the deterioration of the payment prospects of the loan. Assets in this category do not expose the Company to sufficient risk to warrant a substandard classification.
Substandard: Substandard loans are defined as those loans that are inadequately protected by the current net worth and paying capacity of the obligor, or of the collateral pledged. Loans classified as substandard have a well-defined weakness or weaknesses that jeopardize the repayment of the debt. If the weakness or weaknesses are not corrected, there is the distinct possibility that some loss will be sustained.
Loss: Loans in this classification are considered uncollectible and of such little value that continuance as an asset is not warranted. This classification does not mean that the loan has absolutely no recovery or salvage value, but rather it is not
97
Notes to Consolidated Financial Statements_________________________________________________________________
Timberland Bancorp, Inc. and Subsidiary
September 30, 2014 and 2013
practical or desirable to defer writing off this basically worthless loan even though partial recovery may be realized in the future.
The following table lists the loan credit risk grades utilized by the Company as credit quality indicators, by portfolio segment, at September 30, 2014 (dollars in thousands). At September 30, 2014 and 2013, there were no loans classified as loss.
| Loan Grades | ||||||||||||||||||
| Pass |
| Watch |
| Special Mention |
| Substandard |
| Total | ||||||||||
Mortgage loans: |
|
|
|
|
|
|
|
|
| ||||||||||
One- to four-family | $ | 90,340 | |
| $ | 1,749 | |
| $ | 1,045 | |
| $ | 5,400 | |
| $ | 98,534 | |
Multi-family | 37,336 | |
| 1,697 | |
| 6,410 | |
| 763 | |
| 46,206 | | |||||
Commercial | 266,467 | |
| 5,819 | |
| 15,946 | |
| 6,122 | |
| 294,354 | | |||||
Construction – custom and owner / builder | 34,553 | |
| - | |
| - | |
| - | |
| 34,553 | | |||||
Construction – speculative one- to four-family | 1,204 | |
| - | |
| - | |
| - | |
| 1,204 | | |||||
Construction – commercial | 2,887 | |
| - | |
| - | |
| - | |
| 2,887 | | |||||
Construction – multi-family | 419 | |
| - | |
| - | |
| - | |
| 419 | | |||||
Land | 21,084 | |
| 114 | |
| 3,586 | |
| 4,805 | |
| 29,589 | | |||||
Consumer loans: |
| |
|
| |
|
| |
|
| |
|
| | |||||
Home equity and second mortgage | 33,207 | |
| 724 | |
| 27 | |
| 963 | |
| 34,921 | | |||||
Other | 4,657 | |
| 39 | |
| - | |
| 3 | |
| 4,699 | | |||||
Commercial business loans | 30,355 | |
| 112 | |
| 92 | |
| - | |
| 30,559 | | |||||
Total | $ | 522,509 | |
| $ | 10,254 | |
| $ | 27,106 | |
| $ | 18,056 | |
| $ | 577,925 | |
The following table lists the loan credit risk grades utilized by the Company as credit quality indicators, by portfolio segment, at September 30, 2013 (dollars in thousands):
| Loan Grades | ||||||||||||||||||
| Pass |
| Watch |
| Special Mention |
| Substandard |
| Total | ||||||||||
Mortgage loans: |
|
|
|
|
|
|
|
|
| ||||||||||
One- to four-family | $ | 91,291 | |
| $ | 4,032 | |
| $ | 769 | |
| $ | 8,206 | |
| $ | 104,298 | |
Multi-family | 41,863 | |
| 132 | |
| 8,337 | |
| 776 | |
| 51,108 | | |||||
Commercial | 262,502 | |
| 3,309 | |
| 12,522 | |
| 12,964 | |
| 291,297 | | |||||
Construction – custom and owner / builder | 22,788 | |
| - | |
| - | |
| - | |
| 22,788 | | |||||
Construction – speculative one- to four-family | 236 | |
| 687 | |
| - | |
| - | |
| 923 | | |||||
Construction – commercial | 2,239 | |
| - | |
| - | |
| - | |
| 2,239 | | |||||
Construction – multi-family | - | |
| - | |
| - | |
| 144 | |
| 144 | | |||||
Construction – land development | - | |
| - | |
| - | |
| 515 | |
| 515 | | |||||
Land | 20,627 | |
| 5,101 | |
| 1,129 | |
| 4,287 | |
| 31,144 | | |||||
Consumer loans: |
| |
|
| |
|
| |
|
| |
|
| | |||||
Home equity and second mortgage | 31,096 | |
| 782 | |
| 55 | |
| 1,081 | |
| 33,014 | | |||||
Other | 5,937 | |
| 39 | |
| - | |
| 5 | |
| 5,981 | | |||||
Commercial business loans | 17,029 | |
| 366 | |
| 104 | |
| - | |
| 17,499 | | |||||
Total | $ | 495,608 | |
| $ | 14,448 | |
| $ | 22,916 | |
| $ | 27,978 | |
| $ | 560,950 | |
98
Notes to Consolidated Financial Statements_________________________________________________________________
Timberland Bancorp, Inc. and Subsidiary
September 30, 2014 and 2013
The following table is a summary of information related to impaired loans by portfolio segment as of and for the year ended September 30, 2014 (dollars in thousands):
| September 30, 2014 |
| For the Year Ended | ||||||||||||||||||||
| Recorded Investment |
| Unpaid Principal Balance (Loan Balance Plus Charge Off) |
| Related Allowance |
| Average Recorded Investment |
| Interest Income Recognized |
| Cash Basis Interest Income Recognized | ||||||||||||
With no related allowance recorded: |
|
|
|
|
|
|
|
|
|
|
| ||||||||||||
Mortgage loans: |
|
|
|
|
|
|
|
|
|
|
| ||||||||||||
One- to four-family | $ | 2,647 | |
| $ | 3,301 | |
| $ | - | |
| $ | 3,763 | |
| $ | - | |
| $ | - | |
Multi-family | - | |
| 857 | |
| - | |
| - | |
| - | |
| - | | ||||||
Commercial | 11,057 | |
| 14,184 | |
| - | |
| 7,859 | |
| 414 | |
| 325 | | ||||||
Construction – multi-family | - | |
| - | |
| - | |
| 57 | |
| - | |
| - | | ||||||
Construction – land development | - | |
| - | |
| - | |
| 141 | |
| - | |
| - | | ||||||
Land | 1,079 | |
| 1,674 | |
| - | |
| 1,044 | |
| 12 | |
| 10 | | ||||||
Consumer loans: |
|
|
| |
|
|
|
| |
|
| |
|
| | ||||||||
Home equity and second mortgage | 351 | |
| 574 | |
| - | |
| 276 | |
| - | |
| - | | ||||||
Other | 3 | |
| 3 | |
| - | |
| 7 | |
| - | |
| - | | ||||||
Commercial business loans | - | |
| 10 | |
| - | |
| 22 | |
| - | |
| - | | ||||||
Subtotal | 15,137 | |
| 20,603 | |
| - | |
| 13,169 | |
| 426 | |
| 335 | | ||||||
With an allowance recorded: |
| |
|
| |
|
| |
|
| |
|
| |
|
| | ||||||
Mortgage loans: |
| |
|
| |
|
| |
|
| |
|
| |
|
| | ||||||
One- to four-family | 4,364 | |
| 4,364 | |
| 709 | |
| 4,140 | |
| 146 | |
| 110 | | ||||||
Multi-family | 3,317 | |
| 3,317 | |
| 39 | |
| 4,157 | |
| 220 | |
| 165 | | ||||||
Commercial | 6,131 | |
| 6,131 | |
| 797 | |
| 10,083 | |
| 541 | |
| 423 | | ||||||
Construction – speculative one- to four-family | - | |
| - | |
| - | |
| 275 | |
| 11 | |
| 7 | | ||||||
Land | 4,079 | |
| 4,079 | |
| 300 | |
| 3,780 | |
| 18 | |
| 16 | | ||||||
Consumer loans: |
| |
|
| |
|
| |
|
| |
|
| |
|
| | ||||||
Home equity and second mortgage | 446 | |
| 446 | |
| 162 | |
| 404 | |
| 16 | |
| 12 | | ||||||
Subtotal | 18,337 | |
| 18,337 | |
| 2,007 | |
| 22,839 | |
| 952 | |
| 733 | | ||||||
Total |
| |
|
| |
|
| |
|
| |
|
| |
|
| | ||||||
Mortgage loans: |
| |
|
| |
|
| |
|
| |
|
| |
|
| | ||||||
One- to four-family | 7,011 | |
| 7,665 | |
| 709 | |
| 7,903 | |
| 146 | |
| 110 | | ||||||
Multi-family | 3,317 | |
| 4,174 | |
| 39 | |
| 4,157 | |
| 220 | |
| 165 | | ||||||
Commercial | 17,188 | |
| 20,315 | |
| 797 | |
| 17,942 | |
| 955 | |
| 748 | | ||||||
Construction – speculative one- to four-family | - | |
| - | |
| - | |
| 275 | |
| 11 | |
| 7 | | ||||||
Construction – multi-family | - | |
| - | |
| - | |
| 57 | |
| - | |
| - | | ||||||
Construction – land development | - | |
| - | |
| - | |
| 141 | |
| - | |
| - | | ||||||
Land | 5,158 | |
| 5,753 | |
| 300 | |
| 4,824 | |
| 30 | |
| 26 | | ||||||
Consumer loans: |
| |
|
| |
|
|
|
| |
|
| |
|
| | |||||||
Home equity and second mortgage | 797 | |
| 1,020 | |
| 162 | |
| 680 | |
| 16 | |
| 12 | | ||||||
Other | 3 | |
| 3 | |
| - | |
| 7 | |
| - | |
| - | | ||||||
Commercial business loans | - | |
| 10 | |
| - | |
| 22 | |
| - | |
| - | | ||||||
Total | $ | 33,474 | |
| $ | 38,940 | |
| $ | 2,007 | |
| $ | 36,008 | |
| $ | 1,378 | |
| $ | 1,068 | |
99
Notes to Consolidated Financial Statements_________________________________________________________________
Timberland Bancorp, Inc. and Subsidiary
September 30, 2014 and 2013
The following table is a summary of information related to impaired loans by portfolio segment as of and for the year ended September 30, 2013 (dollars in thousands):
| September 30, 2013 |
| For the Year Ended September 30, 2013 | ||||||||||||||||||||
| Recorded Investment |
| Unpaid Principal Balance (Loan Balance Plus Charge Off) |
| Related Allowance |
| Average Recorded Investment |
| Interest Income Recognized |
| Cash Basis Interest Income Recognized | ||||||||||||
With no related allowance recorded: |
|
|
|
|
|
|
|
|
|
|
| ||||||||||||
Mortgage loans: |
|
|
|
|
|
|
|
|
|
|
| ||||||||||||
One- to four-family | $ | 5,342 | |
| $ | 5,775 | |
| $ | - | |
| $ | 2,661 | |
| $ | 18 | |
| $ | 13 | |
Multi-family | - | |
| 982 | |
| - | |
| 473 | |
| 3 | |
| 3 | | ||||||
Commercial | 4,879 | |
| 8,005 | |
| - | |
| 8,781 | |
| 322 | |
| 267 | | ||||||
Construction – custom and owner / builder | - | |
| - | |
| - | |
| 97 | |
| - | |
| - | | ||||||
Construction – speculative one- to four-family | - | |
| - | |
| - | |
| 65 | |
| - | |
| - | | ||||||
Construction – multi-family | 143 | |
| 608 | |
| - | |
| 293 | |
| - | |
| - | | ||||||
Construction – land development | 515 | |
| 3,279 | |
| - | |
| 534 | |
| - | |
| - | | ||||||
Land | 1,188 | |
| 2,133 | |
| - | |
| 3,519 | |
| 9 | |
| 8 | | ||||||
Consumer loans: |
|
|
| |
|
|
|
| |
|
| |
|
| | ||||||||
Home equity and second mortgage | 380 | |
| 556 | |
| - | |
| 266 | |
| - | |
| - | | ||||||
Other | 6 | |
| 6 | |
| - | |
| 8 | |
| - | |
| - | | ||||||
Commercial business loans | - | |
| 33 | |
| - | |
| - | |
| - | |
| - | | ||||||
Subtotal | 12,453 | |
| 21,377 | |
| - | |
| 16,697 | |
| 352 | |
| 291 | | ||||||
With an allowance recorded: |
| |
|
| |
|
| |
|
| |
|
| |
|
| | ||||||
Mortgage loans: |
| |
|
| |
|
| |
|
| |
|
| |
|
| | ||||||
One- to four-family | 3,642 | |
| 3,726 | |
| 600 | |
| 4,397 | |
| 91 | |
| 68 | | ||||||
Multi-family | 5,184 | |
| 5,184 | |
| 334 | |
| 5,960 | |
| 301 | |
| 230 | | ||||||
Commercial | 14,631 | |
| 15,297 | |
| 1,763 | |
| 9,052 | |
| 526 | |
| 420 | | ||||||
Construction – custom and owner / builder | - | |
| - | |
| - | |
| 60 | |
| - | |
| - | | ||||||
Construction – speculative one- to four-family | 687 | |
| 687 | |
| 88 | |
| 695 | |
| 29 | |
| 16 | | ||||||
Construction – commercial | - | |
| - | |
| - | |
| - | |
| - | |
| - | | ||||||
Construction – multi-family | - | |
| - | |
| - | |
| - | |
| - | |
| - | | ||||||
Land | 1,203 | |
| 1,226 | |
| 234 | |
| 1,962 | |
| 27 | |
| 27 | | ||||||
Consumer loans: |
| |
|
| |
|
| |
|
| |
|
| |
|
| | ||||||
Home equity and second mortgage | 299 | |
| 299 | |
| 57 | |
| 352 | |
| 16 | |
| 12 | | ||||||
Subtotal | 25,646 | |
| 26,419 | |
| 3,076 | |
| 22,478 | |
| 990 | |
| 773 | | ||||||
Total |
| |
|
| |
|
| |
|
| |
|
| |
|
| | ||||||
Mortgage loans: |
| |
|
| |
|
| |
|
| |
|
| |
|
| | ||||||
One- to four-family | 8,984 | |
| 9,501 | |
| 600 | |
| 7,058 | |
| 109 | |
| 81 | | ||||||
Multi-family | 5,184 | |
| 6,166 | |
| 334 | |
| 6,433 | |
| 304 | |
| 233 | | ||||||
Commercial | 19,510 | |
| 23,302 | |
| 1,763 | |
| 17,833 | |
| 848 | |
| 687 | | ||||||
Construction – custom and owner / builder | - | |
| - | |
| - | |
| 157 | |
| - | |
| - | | ||||||
Construction – speculative one- to four-family | 687 | |
| 687 | |
| 88 | |
| 760 | |
| 29 | |
| 16 | | ||||||
Construction – multi-family | 143 | |
| 608 | |
| - | |
| 293 | |
| - | |
| - | | ||||||
Construction – land development | 515 | |
| 3,279 | |
| - | |
| 534 | |
| - | |
| - | | ||||||
Land | 2,391 | |
| 3,359 | |
| 234 | |
| 5,481 | |
| 36 | |
| 35 | | ||||||
Consumer loans: |
| |
|
| |
|
|
|
| |
|
| |
|
| | |||||||
Home equity and second mortgage | 679 | |
| 855 | |
| 57 | |
| 618 | |
| 16 | |
| 12 | | ||||||
Other | 6 | |
| 6 | |
| - | |
| 8 | |
| - | |
| - | | ||||||
Commercial business loans | - | |
| 33 | |
| - | |
| - | |
| - | |
| - | | ||||||
Total | $ | 38,099 | |
| $ | 47,796 | |
| $ | 3,076 | |
| $ | 39,175 | |
| $ | 1,342 | |
| $ | 1,064 | |
100
Notes to Consolidated Financial Statements_________________________________________________________________
Timberland Bancorp, Inc. and Subsidiary
September 30, 2014 and 2013
| September 30, 2012 |
| For the Year Ended September 30, 2012 | ||||||||||||||||||||
| Recorded Investment |
| Unpaid Principal Balance (Loan Balance Plus Charge Off) |
| Related Allowance |
| Average Recorded Investment |
| Interest Income Recognized |
| Cash Basis Interest Income Recognized | ||||||||||||
With no related allowance recorded: |
|
|
|
|
|
|
|
|
|
|
| ||||||||||||
Mortgage loans: |
|
|
|
|
|
|
|
|
|
|
| ||||||||||||
One- to four-family | $ | 1,510 | |
| $ | 1,605 | |
| $ | - | |
| $ | 1,838 | |
| $ | 20 | |
| $ | 16 | |
Multi-family | - | |
| 982 | |
| - | |
| - | |
| 1 | |
| 1 | | ||||||
Commercial | 7,596 | |
| 8,664 | |
| - | |
| 14,491 | |
| 543 | |
| 348 | | ||||||
Construction – custom and owner / builder | 208 | |
| 208 | |
| - | |
| 209 | |
| - | |
| - | | ||||||
Construction – speculative one- to four-family | 327 | |
| 327 | |
| - | |
| 65 | |
| - | |
| - | | ||||||
Construction – commercial | - | |
| 2,066 | |
|
| |
| - | |
| 14 | |
| 14 | | ||||||
Construction – multi-family | 345 | |
| 810 | |
| - | |
| 338 | |
| - | |
| - | | ||||||
Construction – land development | 589 | |
| 3,497 | |
| - | |
| 1,089 | |
| 14 | |
| 14 | | ||||||
Land | 5,989 | |
| 8,247 | |
| - | |
| 6,279 | |
| 28 | |
| 16 | | ||||||
Consumer loans: |
| |
|
| |
|
|
|
| |
|
| |
|
| | |||||||
Home equity and second mortgage | 261 | |
| 383 | |
| - | |
| 482 | |
| - | |
| - | | ||||||
Other | 7 | |
| 7 | |
| - | |
| 5 | |
| - | |
| - | | ||||||
Commercial business loans | - | |
| 166 | |
| - | |
| 32 | |
| 2 | |
| 2 | | ||||||
Subtotal | 16,832 | |
| 26,962 | |
| - | |
| 24,828 | |
| 622 | |
| 411 | | ||||||
With an allowance recorded: |
| |
|
| |
|
| |
|
| |
|
| |
|
| | ||||||
Mortgage loans: |
| |
|
| |
|
| |
|
| |
|
| |
|
| | ||||||
One- to four-family | 3,772 | |
| 3,772 | |
| 678 | |
| 2,520 | |
| 81 | |
| 62 | | ||||||
Multi-family | 6,879 | |
| 6,879 | |
| 711 | |
| 6,618 | |
| 294 | |
| 189 | | ||||||
Commercial | 9,596 | |
| 9,596 | |
| 667 | |
| 5,043 | |
| 60 | |
| 39 | | ||||||
Construction – custom and owner / builder | 101 | |
| 101 | |
| 15 | |
| 106 | |
| - | |
| - | | ||||||
Construction – speculative one- to four-family | 700 | |
| 700 | |
| 109 | |
| 700 | |
| 29 | |
| 20 | | ||||||
Construction – commercial | - | |
| - | |
| - | |
| 3,248 | |
| 230 | |
| 146 | | ||||||
Construction – multi-family | - | |
| - | |
| - | |
| 74 | |
| - | |
| - | | ||||||
Land | 2,624 | |
| 2,811 | |
| 686 | |
| 3,307 | |
| 37 | |
| 36 | | ||||||
Consumer loans: |
| |
|
| |
|
| |
|
| |
|
| |
|
| | ||||||
Home equity and second mortgage | 301 | |
| 301 | |
| 36 | |
| 515 | |
| 31 | |
| 23 | | ||||||
Commercial business loans | - | |
| - | |
| - | |
| 55 | |
| - | |
| - | | ||||||
Subtotal | 23,973 | |
| 24,160 | |
| 2,902 | |
| 22,186 | |
| 762 | |
| 515 | | ||||||
Total |
| |
|
| |
|
| |
|
| |
|
| |
|
| | ||||||
Mortgage loans: |
| |
|
| |
|
| |
|
| |
|
| |
|
| | ||||||
One- to four-family | 5,282 | |
| 5,377 | |
| 678 | |
| 4,358 | |
| 101 | |
| 78 | | ||||||
Multi-family | 6,879 | |
| 7,861 | |
| 711 | |
| 6,618 | |
| 295 | |
| 190 | | ||||||
Commercial | 17,192 | |
| 18,260 | |
| 667 | |
| 19,534 | |
| 603 | |
| 387 | | ||||||
Construction – custom and owner / builder | 309 | |
| 309 | |
| 15 | |
| 315 | |
| - | |
| - | | ||||||
Construction – speculative one- to four-family | 1,027 | |
| 1,027 | |
| 109 | |
| 765 | |
| 29 | |
| 20 | | ||||||
Construction – commercial | - | |
| 2,066 | |
| - | |
| 3,248 | |
| 244 | |
| 160 | | ||||||
Construction – multi-family | 345 | |
| 810 | |
| - | |
| 412 | |
| - | |
| - | | ||||||
Construction – land development | 589 | |
| 3,497 | |
| - | |
| 1,089 | |
| 14 | |
| 14 | | ||||||
Land | 8,613 | |
| 11,058 | |
| 686 | |
| 9,586 | |
| 65 | |
| 52 | | ||||||
Consumer loans: |
| |
|
| |
|
| |
|
| |
|
| |
|
| | ||||||
Home equity and second mortgage | 562 | |
| 684 | |
| 36 | |
| 997 | |
| 31 | |
| 23 | | ||||||
Other | 7 | |
| 7 | |
| - | |
| 5 | |
| - | |
| - | | ||||||
Commercial business loans | - | |
| 166 | |
| - | |
| 87 | |
| 2 | |
| 2 | | ||||||
Total | $ | 40,805 | |
| $ | 51,122 | |
| $ | 2,902 | |
| $ | 47,014 | |
| $ | 1,384 | |
| $ | 926 | |
101
Notes to Consolidated Financial Statements_________________________________________________________________
Timberland Bancorp, Inc. and Subsidiary
September 30, 2014 and 2013
Troubled debt restructured loans are considered impaired loans and are individually evaluated for impairment. Troubled debt restructured loans can be classified as either accrual or non-accrual. The Company had $19,088,000 in troubled debt restructured loans included in impaired loans at September 30, 2014 and had no commitments to lend additional funds on these loans. The Company had $22,604,000 in troubled debt restructured loans included in impaired loans at September 30, 2013 and had $1,000 in commitments to lend additional funds on these loans. The allowance for loan losses allocated to troubled debt restructured loans at September 30, 2014 and 2013 was $994,000 and $2,371,000 , respectively.
The following tables set forth information with respect to the Company's troubled debt restructured loans by interest accrual status as of September 30, 2014 and 2013 (dollars in thousands):
| 2014 | ||||||||||
| Accruing |
| Non- Accrual |
| Total | ||||||
Mortgage loans: |
|
|
|
|
| ||||||
One- to four-family | $ | 2,634 | |
| $ | 233 | |
| $ | 2,867 | |
Multi-family | 3,317 | |
| - | |
| 3,317 | | |||
Commercial | 9,960 | |
| 1,468 | |
| 11,428 | | |||
Land | 594 | |
| 431 | |
| 1,025 | | |||
Consumer loans: |
| |
|
| |
|
| | |||
Home equity and second mortgage | 299 | |
| 152 | |
| 451 | | |||
Total | $ | 16,804 | |
| $ | 2,284 | |
| $ | 19,088 | |
| 2013 | ||||||||||
| Accruing |
| Non- Accrual |
| Total | ||||||
Mortgage loans: |
|
|
|
|
| ||||||
One- to four-family | $ | 1,999 | |
| $ | 198 | |
| $ | 2,197 | |
Multi-family | 5,184 | |
| - | |
| 5,184 | | |||
Commercial | 10,160 | |
| 1,574 | |
| 11,734 | | |||
Construction – speculative one- to four-family | 687 | |
| - | |
| 687 | | |||
Construction – land development | - | |
| 515 | |
| 515 | | |||
Land | 244 | |
| 1,564 | |
| 1,808 | | |||
Consumer loans: |
| |
|
| |
|
| | |||
Home equity and second mortgage | 299 | |
| 180 | |
| 479 | | |||
Total | $ | 18,573 | |
| $ | 4,031 | |
| $ | 22,604 | |
102
Notes to Consolidated Financial Statements_________________________________________________________________
Timberland Bancorp, Inc. and Subsidiary
September 30, 2014 and 2013
The following tables set forth information with respect to the Company's troubled debt restructured loans by portfolio segment that occurred during the years ended September 30, 2014, 2013 and 2012 (dollars in thousands):
2014 | Number of Contracts |
| Pre-Modification Outstanding Recorded Investment |
| Post- Modification Outstanding Recorded Investment |
| End of Period Balance | |||||||
One-to four-family (1) | 1 | |
| $ | 42 | |
| $ | 42 | |
| $ | 42 | |
Land (1) | 1 | |
| 157 | |
| 157 | |
| 153 | | |||
Total | 2 | |
| $ | 199 | |
| $ | 199 | |
| $ | 195 | |
___________________________
(1) Modifications were a result of a reduction in the stated interest rate.
2013 | Number of Contracts |
| Pre-Modification Outstanding Recorded Investment |
| Post- Modification Outstanding Recorded Investment |
| End of Period Balance | |||||||
One-to four-family (1) | 2 | |
| $ | 353 | |
| $ | 353 | |
| $ | 350 | |
Commercial (2) | 2 | |
| 2,327 | |
| 2,327 | |
| 2,318 | | |||
Total | 4 | |
| $ | 2,680 | |
| $ | 2,680 | |
| $ | 2,668 | |
_______________________________
(1) | Modifications were a result of a combination of changes (i.e., a reduction in the stated interest rate and an extension of the maturity at an interest rate below current market). |
(2) Modifications were a result of a reduction in the stated interest rate.
2012 | Number of Contracts |
| Pre-Modification Outstanding Recorded Investment |
| Post- Modification Outstanding Recorded Investment |
| End of Period Balance | |||||||
One-to four-family (1) | 1 | |
| $ | 373 | |
| $ | 373 | |
| $ | 372 | |
Commercial (1) | 1 | |
| 2,718 | |
| 2,718 | |
| 2,657 | | |||
Land (2) | 1 | |
| 249 | |
| 249 | |
| 233 | | |||
Total | 3 | |
| $ | 3,340 | |
| $ | 3,340 | |
| $ | 3,262 | |
(1) | Modifications were a result of a combination of changes (i.e., a reduction in the stated interest rate; an extension of the maturity at an interest rate below current market; a reduction in the accrued interest; or re-aging, extensions, deferrals and renewals). |
(2) | Modification was a result of a reduction in the stated interest rate. |
No troubled debt restructured loans were recorded that subsequently defaulted during the years ended September 30, 2014 , 2013 and 2012 .
103
Notes to Consolidated Financial Statements_________________________________________________________________
Timberland Bancorp, Inc. and Subsidiary
September 30, 2014 and 2013
Note 5 - Mortgage Servicing Rights
Loans serviced for Freddie Mac are not included in the accompanying consolidated balance sheets. The principal amounts of those loans at September 30, 2014 , 2013 and 2012 were $327,594,000 , $325,726,000 and $304,872,000 , respectively.
The following is an analysis of the changes in MSRs for the years ended September 30, 2014, 2013 and 2012 (dollars in thousands):
| 2014 | |
| 2013 | |
| 2012 | | |||
Balance, beginning of year | $ | 2,266 | |
| $ | 2,011 | |
| $ | 2,108 | |
Additions | 387 | |
| 728 | |
| 698 | | |||
Amortization | (969 | ) |
| (948 | ) |
| (805 | ) | |||
Valuation allowance | - | |
| - | |
| (216 | ) | |||
Recovery of valuation allowance | - | |
| 475 | |
| 226 | | |||
|
|
|
|
|
| ||||||
Balance, end of year | $ | 1,684 | |
| $ | 2,266 | |
| $ | 2,011 | |
At September 30, 2014 , 2013 and 2012 , the estimated fair value of MSRs totaled $3,204,000 , $3,129,000 and $2,011,000 , respectively. The MSRs' fair values for 2014 , 2013 and 2012 were estimated using discounted cash flow analyses with average discount rates of 10.04% , 10.04% and 10.07% , respectively, and average prepayment speed factors of 164 , 177 and
330 , respectively. At September 30, 2014 and 2013 there were no valuation allowances on MSRs. At September 30, 2012 there was a valuation allowance on MSRs of $475,000 .
Note 6 - Premises and Equipment
Premises and equipment consisted of the following at September 30, 2014 and 2013 (dollars in thousands):
| 2014 | |
| 2013 | | ||
Land | $ | 4,085 | |
| $ | 4,112 | |
Buildings and improvements | 17,546 | |
| 17,344 | | ||
Furniture and equipment | 8,332 | |
| 7,527 | | ||
Property held for future expansion | 110 | |
| 110 | | ||
Construction and purchases in progress | 153 | |
| 370 | | ||
| 30,226 | |
| 29,463 | | ||
Less accumulated depreciation | 12,547 | |
| 11,699 | | ||
|
|
|
| ||||
Premises and equipment, net | $ | 17,679 | |
| $ | 17,764 | |
The Company leases certain premises under operating leases. Total rental expense was $267,000 , $250,000 and $248,000 for the years ended September 30, 2014 , 2013 , and 2012 , respectively, which was included in premises and equipment expense in the accompanying consolidated statements of income.
104
Notes to Consolidated Financial Statements_________________________________________________________________
Timberland Bancorp, Inc. and Subsidiary
September 30, 2014 and 2013
Minimum net rental commitments under non-cancellable leases having an original or remaining term of more than one year for fiscal years ending subsequent to September 30, 2014 are as follows (dollars in thousands):
2015 | $ | 280 | |
2016 | 225 | | |
2017 | 96 | | |
2018 | 96 | | |
2019 | 96 | | |
Thereafter | 120 | | |
|
| | |
Total minimum payments required | $ | 913 | |
Certain leases contain renewal options from five to ten years and escalation clauses based on increases in property taxes and other costs.
Note 7 – OREO and Other Repossessed Assets
The following table presents the activity related to OREO and other repossessed assets for the years ended September 30, 2014 and 2013 (dollars in thousands):
| 2014 |
| 2013 | ||||||||||
| Amount | |
| Number | |
|
| |
| Number | | ||
Balance, beginning of year | $ | 11,720 | |
| 47 | |
| $ | 13,302 | |
| 56 | |
Additions to OREO and other repossessed assets | 6,108 | |
| 29 | |
| 6,375 | |
| 25 | | ||
Capitalized improvements | 47 | |
| - | |
| 146 | |
| - | | ||
Lower of cost or estimated fair value losses | (605 | ) |
| - | |
| (2,064 | ) |
| - | | ||
Disposition of OREO and other repossessed assets | (8,178 | ) |
| (36 | ) |
| (6,039 | ) |
| (34 | ) | ||
|
|
|
|
|
|
|
| ||||||
Balance, end of year | $ | 9,092 | |
| 40 | |
| $ | 11,720 | |
| 47 | |
At September 30, 2014 , OREO and other repossessed assets consisted of 40 properties in Washington, with balances ranging from $6,000 to $1,203,000 . At September 30, 2013 , OREO consisted of 47 properties in Washington, with balances ranging from $4,000 to $1,301,000 . The Company recorded net gains on sale of OREO and other repossessed assets of $169,000 and $264,000 for the years ended September 30, 2014 and 2013, respectively. The Company recorded net losses on sales of OREO and other repossessed assets of $ 373,000 for the year ended September 30, 2012 . Gains and losses on sales of OREO and other repossessed assets are recorded in the OREO and other repossessed assets, net category in non-interest expense in the accompanying consolidated statements of income.
Note 8 - CDI
During the year ended September 30, 2005, the Company recorded a CDI of $2,201,000 in connection with the October 2004 acquisition of seven branches and related deposits. Net unamortized CDI totaled $3,000 and $119,000 at September 30, 2014
and 2013 , respectively. Amortization expense related to the CDI for the years ended September 30, 2014 , 2013 and 2012 was $116,000 , $130,000 and $148,000 , respectively.
Amortization expense for CDI for the year ending September 30, 2015 will be $3,000.
105
Notes to Consolidated Financial Statements_________________________________________________________________
Timberland Bancorp, Inc. and Subsidiary
September 30, 2014 and 2013
Note 9 - Deposits
Deposits consisted of the following at September 30, 2014 and 2013 (dollars in thousands):
| 2014 | |
| 2013 | | ||
Non-interest-bearing demand | $ | 106,417 | |
| $ | 87,657 | |
NOW checking | 160,748 | |
| 156,100 | | ||
Savings | 95,665 | |
| 91,349 | | ||
Money market accounts | 88,999 | |
| 99,006 | | ||
Certificates of deposit | 163,287 | |
| 174,150 | | ||
|
|
|
| ||||
Total | $ | 615,116 | |
| $ | 608,262 | |
Certificates of deposit of $100,000 or greater totaled $66,663,000 and $63,958,000 at September 30, 2014 and 2013 , respectively. The Company had brokered deposits totaling $3,192,000 and $1,191,000 at September 30, 2014 and 2013, respectively.
Scheduled maturities of certificates of deposit for future years ending September 30 are as follows (dollars in thousands):
2015 | $ | 98,503 | |
2016 | 32,746 | | |
2017 | 16,168 | | |
2018 | 6,075 | | |
2019 | 8,338 | | |
Thereafter | 1,457 | | |
|
| | |
Total | $ | 163,287 | |
Interest expense on deposits by account type was as follows for the years ended September 30, 2014 , 2013 and 2012 (dollars in thousands):
| 2014 | |
| 2013 | |
| 2012 | | |||
NOW checking | $ | 440 | |
| $ | 463 | |
| $ | 651 | |
Savings | 46 | |
| 55 | |
| 245 | | |||
Money market accounts | 246 | |
| 246 | |
| 334 | | |||
Certificates of deposit | 1,334 | |
| 1,804 | |
| 2,721 | | |||
|
|
|
|
|
| ||||||
Total | $ | 2,066 | |
| $ | 2,568 | |
| $ | 3,951 | |
Note 10 – FHLB Advances and Other Borrowings
The Bank has long- and short-term borrowing lines with the FHLB with total credit on the lines equal to 25% of the Bank's total assets, limited by available collateral. Borrowings are considered short-term when the original maturity is less than one year. The Bank had $45,000,000 of long-term FHLB advances outstanding at September 30, 2014 and 2013 . The long-term borrowings at September 30, 2014 mature at various dates during the 2017 fiscal year and bear interest at rates ranging from 3.69% to 4.34% . Under the Advances, Security and Deposit Agreement entered into with the FHLB ("FHLB Advance Agreement"), virtually all of the Bank's assets, not otherwise encumbered, are pledged as collateral for advances. A portion of the long-term advances have a putable feature and may be called by the FHLB earlier than the scheduled maturities.
106
Notes to Consolidated Financial Statements_________________________________________________________________
Timberland Bancorp, Inc. and Subsidiary
September 30, 2014 and 2013
The Bank also has a variable letter of credit ("VLOC") of up to $5,000,000 with the FHLB for the purpose of collateralizing Washington State public deposits at September 30, 2014. Any amounts advanced by the FHLB on the VLOC will reduce the Bank's available borrowings under the FHLB Advance Agreement.
The Bank also maintains a short-term borrowing line with the FRB with total credit based on eligible collateral. At September 30, 2014 the Bank had a borrowing capacity on this line of $39,842,000 . The Bank had no outstanding balance on this line at September 30, 2014 and 2013.
The Bank has a short-term $10,000,000 overnight borrowing line with Pacific Coast Banker's Bank. The borrowing line may be reduced or withdrawn at any time. As of September 30, 2014 and 2013 the Bank did no t have any outstanding advances on this borrowing line.
There were no short-term borrowings during the years ended September 30, 2014 , 2013 and 2012 .
Note 11 - Repurchase Agreements
The Bank had no overnight repurchase agreements with customers at September 30, 2014 and 2013, or during the year ended September 30, 2014. Information concerning repurchase agreements for the year ended September 30, 2013 is summarized as follows (dollars in thousands):
|
| ||
Average daily balance during the period | $ | 352 | |
Average daily interest rate during the period | 0.05 | % | |
|
| ||
Maximum month-end balance during the period | $ | 787 | |
Note 12 - Other Liabilities and Accrued Expenses
Other liabilities and accrued expenses were comprised of the following at September 30, 2014 and 2013 (dollars in thousands):
| 2014 | |
| 2013 | | ||
Accrued deferred compensation and profit sharing plans payable | $ | 657 | |
| $ | 660 | |
Accrued interest payable on deposits and advances | 298 | |
| 320 | | ||
Accounts payable and accrued expenses - other | 1,716 | |
| 1,718 | | ||
|
|
|
| ||||
Total other liabilities and accrued expenses | $ | 2,671 | |
| $ | 2,698 | |
Note 13 - Federal Income Taxes
The components of the provision for federal income taxes for the years ended September 30, 2014 , 2013 and 2012 were as follows (dollars in thousands):
| 2014 | |
| 2013 | |
| 2012 | | |||
Current | $ | 2,349 | |
| $ | 1,737 | |
| $ | 1,627 | |
Deferred | 451 | |
| 777 | |
| 154 | | |||
|
|
|
|
|
| ||||||
Provision | $ | 2,800 | |
| $ | 2,514 | |
| $ | 1,781 | |
107
Notes to Consolidated Financial Statements_________________________________________________________________
Timberland Bancorp, Inc. and Subsidiary
September 30, 2014 and 2013
At September 30, 2014 and 2013 , the Company had income taxes receivable of $461,000 and $80,000 , respectively, which are included in other assets in the accompanying consolidated balance sheets.
The components of the Company's deferred tax assets and liabilities at September 30, 2014 and 2013 were as follows (dollars in thousands):
| 2014 | |
| 2013 | | ||
Deferred Tax Assets |
|
|
| ||||
Accrued interest on loans | $ | - | |
| $ | 83 | |
Unearned ESOP shares | 202 | |
| 282 | | ||
Allowance for loan losses | 3,669 | |
| 4,018 | | ||
Allowance for OREO losses | 628 | |
| 794 | | ||
CDI | 249 | |
| 259 | | ||
Net unrealized securities losses | 128 | |
| 139 | | ||
OTTI credit impairment | 185 | |
| 198 | | ||
Other | 180 | |
| 174 | | ||
Total deferred tax assets | 5,241 | |
| 5,947 | | ||
Deferred Tax Liabilities |
|
|
| ||||
FHLB stock dividends | 773 | |
| 840 | | ||
Depreciation | 141 | |
| 147 | | ||
Goodwill | 1,281 | |
| 1,153 | | ||
MSRs | 572 | |
| 770 | | ||
Prepaid expenses | 134 | |
| 233 | | ||
Other | 9 | |
| 11 | | ||
Total deferred tax liabilities | 2,910 | |
| 3,154 | | ||
|
|
|
| ||||
Net deferred tax assets | $ | 2,331 | |
| $ | 2,793 | |
The provision for federal income taxes for the years ended September 30, 2014 , 2013 and 2012 differs from that computed at the statutory corporate tax rate as follows (dollars in thousands):
| 2014 | |
| 2013 | |
| 2012 | | |||
Expected tax provision at statutory rate | $ | 2,941 | |
| $ | 2,472 | |
| $ | 2,166 | |
BOLI income | (180 | ) |
| (196 | ) |
| (206 | ) | |||
Change in estimated utilization of net capital loss carry-forward | - | |
| 281 | |
| (208 | ) | |||
Dividends on ESOP | (41 | ) |
| (24 | ) |
| - | | |||
Other - net | 80 | |
| (19 | ) |
| 29 | | |||
|
|
|
|
|
| ||||||
Provision for federal income taxes | $ | 2,800 | |
| $ | 2,514 | |
| $ | 1,781 | |
During the year ended September 30, 2013, the Company utilized $183,000 of the capital loss carry-forward and wrote-off the remaining portion of the related deferred tax asset and valuation allowance due to the expiration of the capital loss carry-forward period. No valuation allowance for net deferred tax assets was recorded as of September 30, 2014 and 2013, as management believes that it is more likely than not that all of the net deferred tax assets will be realized based on management's expectations of future taxable income and/or because they were supported by recoverable taxes paid in prior years.
108
Notes to Consolidated Financial Statements_________________________________________________________________
Timberland Bancorp, Inc. and Subsidiary
September 30, 2014 and 2013
Note 14 – Employee Stock Ownership and 401(k) Plan ("KSOP")
Effective October 3, 2007, the Bank established the Timberland Bank Employee Stock Ownership and 401(k) Plan ("KSOP") by combining the existing Timberland Bank Employee Stock Ownership Plan (established in 1997) and the Timberland Bank 401(k) Profit Sharing Plan (established in 1970). The KSOP is comprised of two components, the ESOP and the 401(k) Plan. The KSOP benefits employees with at least one year of service who are 21 years of age or older. It may be funded by Bank contributions in cash or stock for the ESOP and in cash only for the 401(k) profit sharing. Employee vesting occurs over six years.
ESOP
The amount of the annual contribution is discretionary, except that it must be sufficient to enable the ESOP to service its debt. All dividends received by the ESOP are used to pay debt service. Dividends of $120,000 and $72,000 were used to service the debt during the years ended September 30, 2014 and 2013, respectively. There were no dividends used to service debt for the year ended September 30, 2012. As the Plan makes each payment of principal and interest, an appropriate percentage of stock is released and allocated annually to eligible employee accounts, in accordance with applicable regulations. As of September 30, 2014 , 335,187 ESOP shares had been distributed to participants.
In January 1998, the ESOP borrowed $7,930,000 from the Company to purchase 1,058,000 shares of common stock of the Company. The loan is being repaid primarily from the Bank's contributions to the ESOP and is scheduled to be fully repaid by March 31, 2019. The interest rate on the loan is 8.5% . Interest expense on the ESOP debt was $206,000 , $237,000 and
$266,000 for the years ended September 30, 2014 , 2013 and 2012 , respectively. The balance of the loan at September 30, 2014 was $2,183,000 .
Shares held by the ESOP as of September 30, 2014 , 2013 and 2012 were classified as follows:
| 2014 | |
| 2013 | |
| 2012 | |
Unallocated shares | 158,702 | |
| 193,968 | |
| 229,234 | |
Shares released for allocation | 564,111 | |
| 592,468 | |
| 597,641 | |
Total ESOP shares | 722,813 | |
| 786,436 | |
| 826,875 | |
The approximate fair market value of the ESOP's unallocated shares at September 30, 2014 , 2013 and 2012 , was $1,673,000 , $1,746,000 and $1,375,000 , respectively. Compensation expense recognized under the ESOP for the years ended September 30, 2014 , 2013 and 2012 was $242,000 , $202,000 , and $165,000 , respectively.
401(k)
Eligible employees may contribute a portion of their wages to the 401(k) part of the plan up to the maximum established by the Internal Revenue Service. Contributions by the Bank are at the discretion of the Board except for a 3% safe harbor contribution which is mandatory according to the plan document. Bank contributions totaled $302,000 , $289,000 and $283,000 for the years ended September 30, 2014 , 2013 and 2012 , respectively.
Note 15 - Stock Compensation Plans
Stock Option Plans
Under the Company's stock option plans (1999 Stock Option Plan and 2003 Stock Option Plan), the Company was able to grant options for up to 1,622,500 shares of common stock to employees, officers and directors. Shares issued may be purchased in the open market or may be issued from authorized and unissued shares. The exercise price of each option equals the fair market value of the Company's common stock on the date of grant. Generally, options vest in 20% annual installments on each of the five anniversaries from the date of the grant. At September 30, 2014 , there were no options for common shares available for future grant under the Company's stock option plans.
109
Notes to Consolidated Financial Statements_________________________________________________________________
Timberland Bancorp, Inc. and Subsidiary
September 30, 2014 and 2013
Stock option activity for the years ended September 30, 2014 , 2013 and 2012 is summarized as follows:
| Number of Shares | |
| Weighted Average Exercise Price | | |
Outstanding September 30, 2011 | 137,726 | |
| $ | 9.25 | |
Options granted | 76,000 | |
| 5.04 | | |
Options forfeited | (18,100 | ) |
| 5.44 | | |
Outstanding September 30, 2012 | 195,626 | |
| 7.97 | | |
| | |
|
| ||
Options granted | 29,000 | |
| 6.00 | | |
Options forfeited | (61,680 | ) |
| 9.69 | | |
Outstanding September 30, 2013 | 162,946 | |
| 6.96 | | |
| | |
|
| ||
Options granted | 135,000 | |
| 9.29 | | |
Options exercised | (5,000 | ) |
| 4.66 | | |
Options forfeited | (71,546 | ) |
| 9.87 | | |
Outstanding September 30, 2014 | 221,400 | |
| $ | 7.49 | |
The Company uses the Black-Scholes option pricing model to estimate the fair value of stock-based awards with the weighted average assumptions noted in the following table. The risk-free interest rate is based on the U.S. Treasury rate of a similar term
as the stock option at the particular grant date. The expected life is based on historical data, vesting terms, and estimated exercise dates. The expected dividend yield is based on the most recent quarterly dividend on an annualized basis in effect at the time the options were granted, adjusted, if appropriate, for management's expectations regarding future dividends. At the time the options were granted for the years ended September 30, 2013 and 2012, the Company was under regulatory restrictions prohibiting the payment of dividends. Since management did not know when the Company would be allowed to pay dividends, an expected dividend yield of 0% was used. The expected volatility is based on historical volatility of the Company's stock price. There were 76,000 options granted during the year ended September 30, 2012 with an aggregate grant date fair value of $150,000 . There were 29,000 options granted during the year ended September 30, 2013 with an aggregate grant date fair value of $69,000 . There were 135,000 options granted during the year ended September 30, 2014 with an aggregate grant date fair value of $349,000 . The weighted average assumptions for options granted during the years ended September 30, 2014 , 2013 and 2012 were as follows:
| 2014 | |
| 2013 | |
| 2012 | | |||
Expected volatility | 39 | % |
| 45 | % |
| 45 | % | |||
Expected term (in years) | 5 | |
| 5 | |
| 5 | | |||
Expected dividend yield | 2.51 | % |
| - | % |
| - | % | |||
Risk free interest rate | 1.41 | % |
| 0.76 | % |
| 0.76 | % | |||
Grant date fair value per share | $ | 2.59 | |
| $ | 2.37 | |
| $ | 1.97 | |
There were 43,800 options that vested during the year ended September 30, 2014 with a total fair value of $80,000 . There were 17,300 options that vested during the year ended September 30, 2013 with a total fair value of $32,000 . There were 5,000 options that vested during the year ended September 30, 2012 with a total fair value of $6,000 .
At September 30, 2014 there were 177,600 unvested options with an aggregate grant date fair value of $434,000 , all of which the Company assumes will vest. The unvested options had an aggregate intrinsic value of $435,000 at September 30, 2014 . At September 30, 2013 there were 91,000 unvested options with an aggregate grant date fair value of $189,000 .
There were 5,000 options exercised during the year ended September 30, 2014, with an intrinsic value of $25,000 . Proceeds from the exercise of these options totaled $23,000 and the related tax benefit recognized was $8,000 There were no options exercised during the years ended September 30, 2013 and 2012.
110
Notes to Consolidated Financial Statements_________________________________________________________________
Timberland Bancorp, Inc. and Subsidiary
September 30, 2014 and 2013
Additional information regarding options outstanding at September 30, 2014 , is as follows:
|
| Options Outstanding |
| Options Exercisable | ||||||||||||||
Range of Exercise Prices ($) |
| Number | |
| Weighted Average Exercise Price | |
| Weighted Average Remaining Contractual Life (Years) |
| Number | |
| Weighted Average Exercise Price | |
| Weighted Average Remaining Contractual Life (Years) | ||
$ 4.01 - 4.55 |
| 37,700 | |
| $ | 4.26 | |
| 6.2 |
| 23,600 | |
| $ | 4.34 | |
| 5.9 |
5.86 - 6.00 |
| 61,700 | |
| 5.92 | |
| 8.0 |
| 20,200 | |
| 5.90 | |
| 8.0 | ||
9.00 |
| 96,000 | |
| 9.00 | |
| 9.1 |
| - | |
| n/a | |
| n/a | ||
10.26 - 10.59 |
| 26,000 | |
| 10.34 | |
| 9.3 |
| - | |
| n/a | |
| n/a | ||
|
| 221,400 | |
| $ | 7.49 | |
| 8.3 |
| 43,800 | |
| $ | 5.06 | |
| 6.9 |
The aggregate intrinsic value of options outstanding at September 30, 2014 was $675,000 . The aggregate intrinsic value of options outstanding at September 30, 2013 was $443,000 . The aggregate intrinsic value of options outstanding at September 30, 2012 was $88,000 .
Stock Grant Plan
The Company adopted the MRDP in 1998 for the benefit of employees, officers and directors of the Company. The objective of the MRDP was to retain personnel of experience and ability in key positions by providing them with a proprietary interest in the Company.
The MRDP allowed for the issuance to participants of up to 529,000 shares of the Company's common stock. Awards under the MRDP were made in the form of restricted shares of common stock that are subject to restrictions on the transfer of ownership and are subject to a five -year vesting period. Compensation expense in the amount of the fair value of the common stock at the date of the grant to the plan participants was recognized over a five -year vesting period, with 20% vesting on each of the five anniversaries from the date of the grant. At September 30, 2014 , there were no shares available for future awards under the MRDP. There were no MRDP shares granted during the years ended September 30, 2014 , 2013 or 2012 .
A summary of MRDP shares vested for the years ended September 30, 2014 , 2013 and 2012 were as follows:
| 2014 | |
| 2013 | |
| 2012 | | |||
Shares vested | 3,254 | |
| 6,207 | |
| 10,831 | | |||
Aggregate vesting date fair value | $ | 30,000 | |
| $ | 38,000 | |
| $ | 46,000 | |
A summary of unvested MRDP shares as of September 30, 2014 and changes during the year ended September 30, 2014 , were as follows:
| Shares | |
| Weighted Average Grant Date Fair Value | | |
Unvested shares, beginning of period | 3,254 | |
| $ | 7.01 | |
Shares vested | 3,254 | |
| 7.01 | | |
|
|
|
| |||
Unvested shares, end of period | - | |
| $ | - | |
111
Notes to Consolidated Financial Statements_________________________________________________________________
Timberland Bancorp, Inc. and Subsidiary
September 30, 2014 and 2013
Expense for Stock Compensation Plans
Compensation expense recorded in the consolidated financial statements for all stock-based plans was as follows for the years ended September 30, 2014 , 2013 and 2012 (dollars in thousands):
| 2014 | |
| 2013 | |
| 2012 | | |||
Stock options | $ | 112 | |
| $ | 49 | |
| $ | 15 | |
MRDP stock grants | 2 | |
| 39 | |
| 105 | | |||
Less: related tax benefit recognized | (10 | ) |
| (8 | ) |
| (28 | ) | |||
| $ | 104 | |
| $ | 80 | |
| $ | 92 | |
The compensation expense to be recognized in the future years ending September 30 for stock options that had been awarded as of September 30, 2014 is as follows (in thousands):
2015 | $ | 106 | |
2016 | 106 | | |
2017 | 98 | | |
2018 | 67 | | |
2019 | 9 | | |
| $ | 386 | |
Note 16 - Commitments and Contingencies
The Company is party to financial instruments with off-balance-sheet risk in the normal course of business to meet the financing needs of its customers. These financial instruments include commitments to extend credit. These instruments involve, to varying degrees, elements of credit risk not recognized in the consolidated balance sheets.
The Company's exposure to credit loss in the event of nonperformance by the other party to the financial instrument for commitments to extend credit is represented by the contractual amount of those instruments. The Bank uses the same credit policies in making commitments as it does for on-balance-sheet instruments.
A summary of the Company's commitments at September 30, 2014 and 2013 is as follows (dollars in thousands):
| 2014 | |
| 2013 | | ||
Undisbursed portion of construction loans in process (see Note 4) | $ | 29,416 | |
| $ | 18,527 | |
Undisbursed lines of credit | 30,678 | |
| 25,187 | | ||
Commitments to extend credit | 18,119 | |
| 16,399 | | ||
Commitments to extend credit are agreements to lend to a customer as long as there is no violation of any condition established in the contract. Since commitments may expire without being drawn upon, the total commitment amounts do not necessarily represent future cash requirements. The Company evaluates each customer's credit - worthiness on a case-by-case basis. The amount of collateral obtained, if deemed necessary by the Company upon extension of credit, is based on management's credit evaluation of the party. However, such loan to value ratios will subsequently change, based on increases and decreases in the supporting collateral values. Collateral held varies, but may include accounts receivable, inventory, property and equipment, residential real estate, land, and income-producing commercial properties.
The Company maintains a separate reserve for losses related to unfunded loan commitments. Management estimates the amount of probable losses related to unfunded loan commitments by applying the loss factors used in the allowance for loan loss methodology to an estimate of the expected amount of funding and applies this adjusted factor to the unused portion of unfunded loan commitments. The reserve for unfunded loan commitments totaled $192,000 and $165,000 at September 30,
112
Notes to Consolidated Financial Statements_________________________________________________________________
Timberland Bancorp, Inc. and Subsidiary
September 30, 2014 and 2013
2014 and 2013 , respectively. These amounts are included in other liabilities and accrued expenses in the accompanying consolidated balance sheets. Increases (decreases) in the reserve for unfunded loan commitments are recorded in non-interest expense in the accompanying consolidated statements of income.
The Bank has an employee severance compensation plan which expires in 2017, and which provides severance pay benefits to eligible employees in the event of a change in control of Timberland Bancorp or the Bank (as defined in the plan). In general, all employees with two or more years of service will be eligible to participate in the plan. Under the plan, in the event of a change in control of Timberland Bancorp or the Bank, eligible employees who are terminated or who terminate employment (but only upon the occurrence of events specified in the plan) within 12 months of the effective date of a change in control would be entitled to a payment based on years of service or officer rank with the Bank. The maximum payment for any eligible employee would be equal to 24 months of the employee's current compensation.
In March 2013, the Bank and the Company entered into employment agreements with the Chief Executive Officer and the Chief Financial Officer. The employment agreements provide for a severance payment and other benefits if the officers are involuntarily terminated following a change in control of the Company or the Bank. The maximum value of the severance benefits under the employment agreements is 2.99 times the officer's average annual compensation during the five-year period prior to the effective date of the change in control.
Because of the nature of its activities, the Company is subject to various pending and threatened legal actions which arise in the ordinary course of business. In the opinion of management, liabilities arising from these claims, if any, will not have a material effect on the consolidated financial position of the Company.
Note 17 - Significant Concentrations of Credit Risk
Most of the Company's lending activity is with customers located in the state of Washington and involves real estate. At September 30, 2014 , the Company had $572,083,000 (including $29,416,000 of undisbursed construction loans in process) in loans secured by real estate, which represents 94.2% of total loans and loans held for sale. The real estate loan portfolio is primarily secured by one- to four-family properties, multi-family properties, undeveloped land, and a variety of commercial real estate property types. At September 30, 2014 , there were no concentrations of real estate loans to a specific industry or secured by a specific collateral type that equaled or exceeded 20% of the Company's total loan portfolio, other than loans secured by one-to four-family properties. The ultimate collectability of a substantial portion of the loan portfolio is susceptible to changes in economic and market conditions in the region and the impact of those changes on the real estate market. The Company typically originates real estate loans with loan-to-value ratios of no greater than 90% . Collateral and/or guarantees are required for all loans. The Company also had $35,845,000 in CDs held for investment at September 30, 2014 . The CDs are held with various FDIC insured institutions throughout the U.S., and each CD is below the FDIC insurance limit of $250,000.
Note 18 - Regulatory Matters
Timberland Bancorp and the Bank are subject to various regulatory capital requirements administered by the federal banking agencies. Failure to meet minimum capital requirements can initiate certain mandatory and possibly additional discretionary actions by regulators that, if undertaken, could have a direct material effect on the Company's consolidated financial statements. Under capital adequacy guidelines of the regulatory framework for prompt corrective action, the Bank must meet specific capital adequacy guidelines that involve quantitative measures of the Bank's assets, liabilities and certain off-balance-sheet items as calculated under regulatory accounting practices. The capital classifications of Timberland Bancorp and the Bank are also subject to qualitative judgments by the regulators about components, risk weightings and other factors.
Federally-insured state-chartered banks are required to maintain minimum levels of regulatory capital. Under current FDIC regulations, insured state-chartered banks generally must maintain (1) a ratio of Tier 1 leverage capital to total assets of at least 4.0%, (2) a ratio of Tier 1 capital to risk weighted assets of at least 4.0% and (3) a ratio of total capital to risk weighted assets of at least 8.0%.
113
Notes to Consolidated Financial Statements_________________________________________________________________
Timberland Bancorp, Inc. and Subsidiary
September 30, 2014 and 2013
The following table compares Timberland Bancorp's (consolidated) and the Bank's actual capital amounts at September 30, 2014 and 2013 to their minimum regulatory capital requirements at those dates (dollars in thousands):
| Actual |
| Capital Adequacy Purposes |
| To be Well Capitalized Under Prompt Corrective Action Provisions | |||||||||||||||
| Amount |
| Ratio |
| Amount |
| Ratio |
|
| Amount |
| Ratio | ||||||||
September 30, 2014 |
|
|
|
|
|
|
|
|
|
|
|
| ||||||||
Tier 1 leverage capital: |
|
|
|
|
|
|
|
|
|
|
|
| ||||||||
Timberland Bancorp | $ | 78,480 | |
| 10.6 | % |
| $ | 29,644 | |
| 4.0 | % |
| N/A | |
| N/A | | |
Timberland Bank | 75,734 | |
| 10.2 | |
| 29,629 | |
| 4.0 |
|
| $ | 37,036 | |
| 5.0 | % | ||
Tier 1 risk adjusted capital: |
| |
|
| |
|
|
|
|
|
|
| |
|
| | ||||
Timberland Bancorp | 78,480 | |
| 13.7 | |
| 22,943 | |
| 4.0 |
|
| N/A | |
| N/A | | |||
Timberland Bank | 75,734 | |
| 13.2 | |
| 22,939 | |
| 4.0 |
|
| 34,409 | |
| 6.0 | | |||
Total risk based capital: |
| |
|
|
|
| |
|
|
|
|
| |
|
| | ||||
Timberland Bancorp | 85,692 | |
| 14.9 | |
| 45,886 | |
| 8.0 |
|
| N/A | |
| N/A | | |||
Timberland Bank | 82,945 | |
| 14.5 | |
| 45,878 | |
| 8.0 |
|
| 57,348 | |
| 10.0 | | |||
|
|
|
|
|
|
|
|
|
|
|
|
| ||||||||
September 30, 2013 |
| |
|
| |
|
| |
|
|
|
|
| |
|
| | |||
Tier 1 leverage capital: |
| |
|
| |
|
| |
|
|
|
|
| |
|
| | |||
Timberland Bancorp | $ | 85,158 | |
| 11.5 | % |
| $ | 29,677 | |
| 4.0 | % |
| N/A | |
| N/A | | |
Timberland Bank | 82,265 | |
| 11.1 | |
| 29,662 | |
| 4.0 |
|
| $ | 37,078 | |
| 5.0 | % | ||
Tier 1 risk adjusted capital: |
| |
|
| |
|
|
|
|
|
|
| |
|
| | ||||
Timberland Bancorp | 85,158 | |
| 15.3 | |
| 22,259 | |
| 4.0 |
|
| N/A | |
| N/A | | |||
Timberland Bank | 82,265 | |
| 14.8 | |
| 22,255 | |
| 4.0 |
|
| 33,382 | |
| 6.0 | | |||
Total risk based capital: |
| |
|
| |
|
| |
|
|
|
|
| |
|
| | |||
Timberland Bancorp | 92,168 | |
| 16.6 | |
| 44,518 | |
| 8.0 |
|
| N/A | |
| N/A | | |||
Timberland Bank | 89,273 | |
| 16.1 | |
| 44,509 | |
| 8.0 |
|
| 55,636 | |
| 10.0 | | |||
Restrictions on Retained Earnings
At the time of conversion of the Bank from a Washington-chartered mutual savings bank to a Washington-chartered stock savings bank, the Bank established a liquidation account in an amount equal to its retained earnings of $23,866,000 as of June 30, 1997, the date of the latest statement of financial condition used in the final conversion prospectus. The liquidation account is maintained for the benefit of eligible account holders who have maintained their deposit accounts in the Bank after conversion. The liquidation account reduces annually to the extent that eligible account holders have reduced their qualifying deposits as of each anniversary date. Subsequent increases do not restore an eligible account holder's interest in the liquidation account. At September 30, 2014 management estimates the amount of the liquidation account to be $429,000 . In the event of a complete liquidation of the Bank (and only in such an event), eligible depositors who have continued to maintain accounts will be entitled to receive a distribution from the liquidation account before any distribution may be made with respect to common stock. The Bank may not declare or pay cash dividends if the effect thereof would reduce its regulatory capital below the amount required for the liquidation account.
114
Notes to Consolidated Financial Statements_________________________________________________________________
Timberland Bancorp, Inc. and Subsidiary
September 30, 2014 and 2013
Note 19 - Condensed Financial Information - Parent Company Only
Condensed Balance Sheets - September 30, 2014 and 2013
(dollars in thousands)
| 2014 | |
| 2013 | | ||
Assets |
|
|
| ||||
Cash and cash equivalents: |
|
|
| ||||
Cash and due from financial institutions | $ | 55 | |
| $ | 126 | |
Interest-bearing deposits in banks | 440 | |
| 379 | | ||
Total cash and cash equivalents | 495 | |
| 505 | | ||
|
|
|
| ||||
Loan receivable from ESOP | 2,183 | |
| 2,565 | | ||
Investment in Bank | 80,031 | |
| 86,795 | | ||
Other assets | 124 | |
| 40 | | ||
Total assets | $ | 82,833 | |
| $ | 89,905 | |
|
|
|
| ||||
Liabilities and shareholders' equity |
| |
|
| | ||
Accrued expenses | $ | 55 | |
| $ | 217 | |
Shareholders' equity | 82,778 | |
| 89,688 | | ||
Total liabilities and shareholders' equity | $ | 82,833 | |
| $ | 89,905 | |
115
Notes to Consolidated Financial Statements_________________________________________________________________
Timberland Bancorp, Inc. and Subsidiary
September 30, 2014 and 2013
Condensed Statements of Income - Years Ended September 30, 2014 , 2013 and 2012
(dollars in thousands)
| 2014 | |
| 2013 | |
| 2012 | | |||
Operating income |
|
|
|
|
| ||||||
Interest on deposits in banks | $ | - | |
| $ | 1 | |
| $ | 1 | |
Interest on loan receivable from ESOP | 206 | |
| 237 | |
| 266 | | |||
Dividends from bank | 13,190 | |
| 3,300 | |
| - | | |||
Total operating income | 13,396 | |
| 3,538 | |
| 267 | | |||
|
|
|
|
|
| ||||||
Operating expenses | 409 | |
| 455 | |
| 556 | | |||
|
|
|
|
|
| ||||||
Income (loss) before income taxes and equity in undistributed income of Bank | 12,987 | |
| 3,083 | |
| (289 | ) | |||
Benefit for income taxes | (110 | ) |
| (98 | ) |
| (98 | ) | |||
|
|
|
|
|
| ||||||
Income (loss) before undistributed income of Bank | 13,097 | |
| 3,181 | |
| (191 | ) | |||
|
|
|
|
|
| ||||||
Equity in undistributed income of Bank (dividends in excess of income of Bank) | (7,247 | ) |
| 1,576 | |
| 4,781 | | |||
|
|
|
|
|
| ||||||
Net income | 5,850 | |
| 4,757 | |
| 4,590 | | |||
|
|
|
|
|
| ||||||
Preferred stock dividends | (136 | ) |
| (710 | ) |
| (832 | ) | |||
Preferred stock accretion | (70 | ) |
| (283 | ) |
| (240 | ) | |||
Discount on redemption of preferred stock | - | |
| 255 | |
| - | | |||
|
|
|
|
|
| ||||||
Net income to common shareholders | $ | 5,644 | |
| $ | 4,019 | |
| $ | 3,518 | |
116
Notes to Consolidated Financial Statements_________________________________________________________________
Timberland Bancorp, Inc. and Subsidiary
September 30, 2014 and 2013
Condensed Statements of Cash Flows - Years Ended September 30, 2014 , 2013 and 2012
(dollars in thousands)
| 2014 | |
| 2013 | |
| 2012 | | |||
Cash flows from operating activities |
|
|
|
|
| ||||||
Net income | $ | 5,850 | |
| $ | 4,757 | |
| $ | 4,590 | |
Adjustments to reconcile net income to net cash provided by operating activities: |
| |
|
| |
|
| | |||
(Equity in undistributed income of Bank) dividends in excess of income of Bank | 7,247 | |
| (1,576 | ) |
| (4,781 | ) | |||
ESOP shares earned, net of tax | 264 | |
| 265 | |
| 264 | | |||
MRDP compensation expense | 2 | |
| 39 | |
| 105 | | |||
Stock option compensation expense | 104 | |
| 49 | |
| 15 | | |||
Stock option tax effect | 4 | |
| - | |
| - | | |||
Other, net | (247 | ) |
| (39 | ) |
| 406 | | |||
Net cash provided by operating activities | 13,224 | |
| 3,495 | |
| 599 | | |||
|
|
|
|
|
| ||||||
Cash flows from investing activities |
| |
|
| |
|
| | |||
Investment in Bank | (459 | ) |
| (344 | ) |
| (243 | ) | |||
Principal repayments on loan receivable from Bank | 382 | |
| 353 | |
| 322 | | |||
Net cash provided by (used in) investing activities | (77 | ) |
| 9 | |
| 79 | | |||
|
|
|
|
|
| ||||||
Cash flows from financing activities |
| |
|
| |
|
| | |||
Proceeds from issuance of common stock | 23 | |
| - | |
| - | | |||
Repurchase of preferred stock | (12,065 | ) |
| (4,321 | ) |
| - | | |||
Payment of dividends | (1,185 | ) |
| (1,368 | ) |
| (2,080 | ) | |||
ESOP tax effect | 64 | |
| 6 | |
| (65 | ) | |||
MRDP compensation tax effect | 2 | |
| (8 | ) |
| (28 | ) | |||
Stock option excess tax benefit | 4 | |
| - | |
| - | | |||
Net cash used in financing activities | (13,157 | ) |
| (5,691 | ) |
| (2,173 | ) | |||
|
|
|
|
|
| ||||||
Net decrease in cash and cash equivalents | (10 | ) |
| (2,187 | ) |
| (1,495 | ) | |||
|
|
|
|
|
| ||||||
Cash and cash equivalents |
| |
|
| |
|
| | |||
Beginning of year | 505 | |
| 2,692 | |
| 4,187 | | |||
End of year | $ | 495 | |
| $ | 505 | |
| $ | 2,692 | |
117
Notes to Consolidated Financial Statements_________________________________________________________________
Timberland Bancorp, Inc. and Subsidiary
September 30, 2014 and 2013
Note 20 - Net Income Per Common Share
Information regarding the calculation of basic and diluted net income per common share for the years ended September 30, 2014 , 2013 and 2012 is as follows (dollars in thousands, except per share amounts):
| 2014 | |
| 2013 | |
| 2012 | | |||
Basic net income per common share computation |
|
|
|
|
| ||||||
Numerator - net income | $ | 5,850 | |
| $ | 4,757 | |
| $ | 4,590 | |
Preferred stock dividends | (136 | ) |
| (710 | ) |
| (832 | ) | |||
Discount on redemption of preferred stock | - | |
| 255 | |
| - | | |||
Preferred stock discount accretion | (70 | ) |
| (283 | ) |
| (240 | ) | |||
Net income to common stockholders | $ | 5,644 | |
| $ | 4,019 | |
| $ | 3,518 | |
|
|
|
|
|
| ||||||
Denominator - weighted average common shares outstanding | 6,856,730 | |
| 6,817,918 | |
| 6,780,612 | | |||
|
|
|
|
|
| ||||||
Basic net income per common share | $ | 0.82 | |
| $ | 0.59 | |
| $ | 0.52 | |
|
|
|
|
|
| ||||||
Diluted net income per common share computation |
| |
|
| |
|
| | |||
Numerator - net income | $ | 5,850 | |
| $ | 4,757 | |
| $ | 4,590 | |
Preferred stock dividends | (136 | ) |
| (710 | ) |
| (832 | ) | |||
Discount on redemption of preferred stock | - | |
| 255 | |
| - | | |||
Preferred stock discount accretion | (70 | ) |
| (283 | ) |
| (240 | ) | |||
Net income to common stockholders | $ | 5,644 | |
| $ | 4,019 | |
| $ | 3,518 | |
|
|
|
|
|
| ||||||
Denominator - weighted average common shares outstanding | 6,856,730 | |
| 6,817,918 | |
| 6,780,612 | | |||
Effect of dilutive stock options | 36,614 | |
| 16,555 | |
| - | | |||
Effect of dilutive stock warrant | 126,332 | |
| 52,522 | |
| - | | |||
Weighted average common shares outstanding- assuming dilution | 7,019,676 | |
| 6,886,995 | |
| 6,780,612 | | |||
|
|
|
|
|
| ||||||
Diluted net income per common share | $ | 0.80 | |
| $ | 0.58 | |
| $ | 0.52 | |
For the years ended September 30, 2014 , 2013 and 2012 , average options to purchase 131,489 , 109,953 and 162,517 shares of common stock, respectively, were outstanding but not included in the computation of diluted net income per common share because their effect would have been anti-dilutive.
For the year ended September 30, 2012 a warrant to purchase a weighted average of 370,899 shares was outstanding but not included in the computation of diluted net income per common share because the warrant's exercise price was greater than the average market price of the common shares and, therefore, its effect would have been anti-dilutive.
Note 21 - Fair Value Measurements
GAAP requires disclosure of estimated fair values for financial instruments. Such estimates are subjective in nature, and significant judgment is required regarding the risk characteristics of various financial instruments at a discrete point in time. Therefore, such estimates could vary significantly if assumptions regarding uncertain factors were to change. In addition, as the Company normally intends to hold the majority of its financial instruments until maturity, it does not expect to realize many of the estimated amounts disclosed. The disclosures also do not include estimated fair value amounts for certain items which are not defined as financial instruments but which may have significant value. The Company does not believe that it
118
Notes to Consolidated Financial Statements_________________________________________________________________
Timberland Bancorp, Inc. and Subsidiary
September 30, 2014 and 2013
would be practicable to estimate a representational fair value for these types of items as of September 30, 2014 and 2013 . Because GAAP excludes certain items from fair value disclosure requirements, any aggregation of the fair value amounts presented would not represent the underlying value of the Company.
Accounting guidance regarding fair value measurements defines fair value and establishes a framework for measuring fair value in accordance with GAAP. Fair value is the exchange price that would be received for an asset or paid to transfer a liability in an orderly transaction between market participants on the measurement date. The following definitions describe the levels of inputs that may be used to measure fair value:
Level 1: Quoted prices (unadjusted) in active markets for identical assets or liabilities that the reporting
entity has the ability to access at the measurement date.
Level 2: Significant observable inputs other than quoted prices included within Level 1, such as
quoted prices in markets that are not active, and inputs other than quoted prices that are observable or
can be corroborated by observable market data.
Level 3: Significant unobservable inputs that reflect a company's own assumptions about the
assumptions market participants would use in pricing an asset or liability based on the best information
available in the circumstances.
The Company used the following methods and significant assumptions to estimate fair value on a recurring basis:
Securities Available for Sale
The estimated fair value of MBS and other investments are based upon the assumptions market participants would use in pricing the security. Such assumptions include quoted market prices (Level 1), market prices of similar securities or observable inputs (Level 2).
The following table summarizes the balances of assets and liabilities measured at estimated fair value on a recurring basis at September 30, 2014 (dollars in thousands):
| Estimated Fair Value |
|
| ||||||||||||
| Level 1 |
| Level 2 |
| Level 3 |
| Total | ||||||||
Available for Sale Securities |
|
|
|
|
|
|
| ||||||||
MBS: U.S. government agencies | $ | - | |
| $ | 1,899 | |
| $ | - | |
| $ | 1,899 | |
Mutual funds | 958 | |
| - | |
| - | |
| 958 | | ||||
Total | $ | 958 | |
| $ | 1,899 | |
| $ | - | |
| $ | 2,857 | |
There were no transfers among Level 1, Level 2 and Level 3 during the year ended September 30, 2014 .
The following table summarizes the balances of assets and liabilities measured at estimated fair value on a recurring basis at September 30, 2013 (dollars in thousands):
| Estimated Fair Value |
|
| ||||||||||||
| Level 1 |
| Level 2 |
| Level 3 |
| Total | ||||||||
Available for Sale Securities |
|
|
|
|
|
|
| ||||||||
MBS: |
|
|
|
|
|
|
| ||||||||
U.S. government agencies | $ | - | |
| $ | 2,229 | |
| $ | - | |
| $ | 2,229 | |
Private label residential | - | |
| 914 | |
| - | |
| 914 | | ||||
Mutual funds | 958 | |
| - | |
| - | |
| 958 | | ||||
Total | $ | 958 | |
| $ | 3,143 | |
| $ | - | |
| $ | 4,101 | |
There were no transfers among Level 1, Level 2 and Level 3 during the year ended September 30, 2013 .
119
Notes to Consolidated Financial Statements_________________________________________________________________
Timberland Bancorp, Inc. and Subsidiary
September 30, 2014 and 2013
The Company may be required, from time to time, to measure certain assets and liabilities at fair value on a nonrecurring basis in accordance with GAAP. These include assets that are measured at the lower of cost or market value that were recognized at fair value below cost at the end of the period.
The Company uses the following methods and significant assumptions to estimate fair value on a non-recurring basis:
Impaired Loans : The specific reserve for collateral dependent impaired loans was based on the estimated fair value of the collateral less estimated costs to sell, if applicable. The estimated fair value of impaired loans is calculated using the collateral value method or on a discounted cash flow basis. In some cases, adjustments were made to the appraised values due to various factors including age of the appraisal, age of comparables included in the appraisal, and known changes in the market and in the collateral. Such adjustments may be significant and typically result in a Level 3 classification of the inputs for determining fair value. Impaired loans are evaluated on a quarterly basis for additional impairment and adjusted accordingly.
Securities Held to Maturity: The estimated fair value of securities held to maturity are based upon the assumptions market participants would use in pricing the security. Such assumptions include quoted market prices (Level 1), market prices of similar securities or observable inputs (Level 2) and unobservable inputs such as dealer quotes, discounted cash flows or similar techniques (Level 3).
OREO and Other Repossessed Assets, net: The Company's OREO and other repossessed assets are initially recorded at estimated fair value less estimated costs to sell. This amount becomes the property's new basis. Estimated fair value was generally determined by management based on a number of factors, including third-party appraisals of estimated fair value in an orderly sale. Estimated costs to sell are based on standard market factors. The valuation of OREO and other repossessed assets is subject to significant external and internal judgment (Level 3).
The following table summarizes the balances of assets measured at estimated fair value on a non-recurring basis at September 30, 2014 , and the total losses resulting from these estimated fair value adjustments for the year ended September 30, 2014 (dollars in thousands):
| Estimated Fair Value |
|
| ||||||||||||
| Level 1 |
| Level 2 |
| Level 3 |
| Total Losses | ||||||||
Impaired loans: |
|
|
|
|
|
|
| ||||||||
Mortgage Loans: |
|
|
|
|
|
|
| ||||||||
One-to four-family | $ | - | |
| $ | - | |
| $ | 3,655 | |
| $ | 1,106 | |
Multi-family | - | |
| - | |
| 3,278 | |
| - | | ||||
Commercial | - | |
| - | |
| 5,334 | |
| 463 | | ||||
Land | - | |
| - | |
| 3,779 | |
| 260 | | ||||
Consumer loans: |
| |
|
| |
|
| |
|
| | ||||
Home equity and second mortgage | - | |
| - | |
| 284 | |
| 47 | | ||||
Total impaired loans (1) | - | |
| - | |
| 16,330 | |
| 1,876 | | ||||
MBS – held to maturity (2): |
| |
|
| |
|
| |
|
| | ||||
Private label residential | - | |
| 40 | |
| - | |
| 31 | | ||||
OREO and other repossessed assets (3) | - | |
| - | |
| 9,092 | |
| 605 | | ||||
Total | $ | - | |
| $ | 40 | |
| $ | 25,422 | |
| $ | 2,512 | |
_______________________
(1) | The loss represents charge-offs on collateral dependent loans for estimated fair value adjustments based on the estimated fair value of the collateral net of estimated costs to sell, if applicable. |
(2) | The loss represents OTTI credit-related charges on held-to-maturity MBS. |
(3) | The loss represents adjustments resulting from management's periodic reviews of the recorded value to determine whether the property continues to be recorded at the lower of its recorded book value or estimated fair value, net of estimated costs to sell. |
120
Notes to Consolidated Financial Statements_________________________________________________________________
Timberland Bancorp, Inc. and Subsidiary
September 30, 2014 and 2013
The following table summarizes the balances of assets measured at estimated fair value on a non-recurring basis at September 30, 2013 and the total losses resulting from these estimated fair value adjustments for the year ended September 30, 2013 (dollars in thousands):
| Estimated Fair Value |
|
| ||||||||||||
| Level 1 |
| Level 2 |
| Level 3 |
| Total Losses | ||||||||
Impaired loans: |
|
|
|
|
|
|
| ||||||||
Mortgage Loans: |
|
|
|
|
|
|
| ||||||||
One-to four-family | $ | - | |
| $ | - | |
| $ | 3,042 | |
| $ | 769 | |
Multi-family | - | |
| - | |
| 4,850 | |
| - | | ||||
Commercial | - | |
| - | |
| 12,868 | |
| 667 | | ||||
Construction – speculative one-to four-family | - | |
| - | |
| 599 | |
| - | | ||||
Land | - | |
| - | |
| 969 | |
| 2,307 | | ||||
Consumer loans: |
| |
|
| |
|
| |
|
| | ||||
Home equity and second mortgage | - | |
| - | |
| 242 | |
| 184 | | ||||
Total impaired loans (1) | - | |
| - | |
| 22,570 | |
| 3,927 | | ||||
MBS – held to maturity (2): |
| |
|
| |
|
| |
|
| | ||||
Private label residential | - | |
| 83 | |
| - | |
| 45 | | ||||
OREO and other repossessed assets (3) | - | |
| - | |
| 11,720 | |
| 2,064 | | ||||
Total | $ | - | |
| $ | 83 | |
| $ | 34,290 | |
| $ | 6,036 | |
_______________________
(1) | The loss represents charge-offs on collateral dependent loans for estimated fair value adjustments based on the estimated fair value of the collateral, net of estimated cost to sell, if applicable. |
(2) | The loss represents OTTI credit-related charges on held-to-maturity MBS. |
(3) | The loss represents adjustments resulting from management's periodic reviews of the recorded value to determine whether the property continues to be recorded at the lower of its recorded book value or estimated fair value, net of estimated costs to sell. |
The following table presents quantitative information about Level 3 fair value measurements for financial instruments measured at fair value on a non-recurring basis as of September 30, 2014 (dollars in thousands):
| Estimated Fair Value |
|
Valuation Technique(s) |
|
Unobservable Input(s) |
|
Range | ||
Impaired loans | $ | 16,330 | |
| Market approach |
| Appraised value less selling costs |
| NA |
|
|
|
|
|
|
|
| ||
OREO and other repossessed assets | $ | 9,092 | |
| Market approach |
| Lower of appraised value or listing price less selling costs |
| NA |
|
|
|
|
|
|
|
| ||
The following methods and assumptions were used by the Company in estimating fair value of its other financial instruments:
Cash and Cash Equivalents: The estimated fair value of financial instruments that are short-term or re-price frequently and that have little or no risk are considered to have an estimated fair value equal to the recorded value.
CDs Held for Investment: The estimated fair value of financial instruments that are short-term or re-price frequently and that have little or no risk are considered to have an estimated fair value equal to the recorded value.
Securities: See descriptions above.
121
Notes to Consolidated Financial Statements_________________________________________________________________
Timberland Bancorp, Inc. and Subsidiary
September 30, 2014 and 2013
FHLB Stock: No ready market exists for this stock, and it has no quoted market value. However, redemption of this stock has historically been at par value. During the year ended September 30, 2014 , 2,061 shares of FHLB stock was redeemed from the Company at par value. Accordingly, par value is deemed to be a reasonable estimate of fair value.
Loans Receivable, Net: At September 30, 2014 the fair value of non-impaired loans is estimated by discounting the future cash flows using the current rates at which similar loans would be made to borrowers for the same remaining maturities. Prepayments are based on the historical experience of the Bank. Fair values for impaired loans are estimated using the methods described above. At September 30, 2013 the fair value of loans was estimated using a discounted cash flow analysis and comparable market statistics. A discounted cash flow analysis was used to estimate the fair value of loans graded pass. The fair value of loans graded, watch, special mention and substandard was estimated using comparable market statistics that approximated sales of similarly rated loans.
Loans Held for Sale: The estimated fair value is based on quoted market prices obtained from Freddie Mac.
Accrued Interest: The recorded amount of accrued interest approximates the estimated fair value.
Deposits : The estimated fair value of deposits with no stated maturity date is deemed to be the amount payable on demand. The estimated fair value of fixed maturity certificates of deposit is computed by discounting future cash flows using the rates currently offered by the Bank for deposits of similar remaining maturities.
FHLB Advances: The estimated fair value of FHLB advances is computed by discounting the future cash flows of the borrowings at a rate which approximates the current offering rate of the borrowings with a comparable remaining life.
Off-Balance-Sheet Instruments: Since the majority of the Company's off-balance-sheet instruments consist of variable-rate commitments, the Company has determined that they do not have a distinguishable estimated fair value.
The estimated fair values of financial instruments were as follows as of September 30, 2014 (dollars in thousands):
|
|
| Fair Value Measurements Using: | |||||||||||||||||
|
Recorded Amount |
| Estimated Fair Value |
|
Level 1 |
|
Level 2 |
|
Level 3 | |||||||||||
Financial Assets |
|
|
|
|
|
|
|
|
| |||||||||||
Cash and cash equivalents | $ | 72,354 | |
| $ | 72,354 | |
| $ | 72,354 | |
| $ | - | |
| $ | - | | |
CDs held for investment | 35,845 | |
| 35,845 | |
| 35,845 | |
| - | |
| - | | ||||||
Securities | 8,155 | |
| 9,131 | |
| 958 | | 6,676 | | 8,173 | |
| - | | |||||
FHLB stock | 5,246 | |
| 5,246 | |
| 5,246 | |
| - | |
| - | | ||||||
Loans receivable, net | 564,853 | |
| 563,802 | |
| - | |
| - | |
| 563,802 | | ||||||
Loans held for sale | 899 | |
| 921 | |
| 921 | |
| - | |
| - | | ||||||
Accrued interest receivable | 1,910 | |
| 1,910 | |
| 1,910 | |
| - | |
| - | | ||||||
|
|
|
|
|
|
|
|
|
| |||||||||||
Financial Liabilities |
| |
|
| |
|
| |
|
| |
|
| | ||||||
Deposits: |
| |
|
| |
|
| |
|
| |
|
| | ||||||
Non-interest bearing demand | $ | 106,417 | |
| $ | 106,417 | |
| $ | 106,417 | |
| $ | - | |
| $ | - | | |
Interest-bearing | 508,699 | |
| 509,406 | |
| 345,412 | |
| - | |
| 163,994 | | ||||||
Total deposits | 615,116 | |
| 615,823 | |
| 451,829 | |
| - | |
| 163,994 | | ||||||
FHLB advances | 45,000 | |
| 47,279 | |
| - | |
| 47,279 | |
| - | | ||||||
Accrued interest payable | 298 | |
| 298 | |
| 298 | |
| - | |
| - | | ||||||
122
Notes to Consolidated Financial Statements_________________________________________________________________
Timberland Bancorp, Inc. and Subsidiary
September 30, 2014 and 2013
The estimated fair values of financial instruments were as follows as of September 30, 2013 (dollars in thousands):
|
|
| Fair Value Measurements Using: | ||||||||||||||||
|
Recorded Amount |
| Estimated Fair Value |
|
Level 1 |
|
Level 2 |
|
Level 3 | ||||||||||
Financial Assets |
|
|
|
|
|
|
|
|
| ||||||||||
Cash and cash equivalents | $ | 94,496 | |
| $ | 94,496 | |
| $ | 94,496 | |
| $ | - | |
| $ | - | |
CDs held for investment | 30,042 | |
| 30,042 | |
| 30,042 | |
| - | |
| - | | |||||
Securities | 6,838 | |
| 7,634 | |
| 973 | |
| 6,661 | |
| - | | |||||
FHLB stock | 5,452 | |
| 5,452 | |
| 5,452 | |
| - | |
| - | | |||||
Loans receivable, net | 546,193 | |
| 514,616 | |
| - | |
| - | |
| 514,616 | | |||||
Loans held for sale | 1,911 | |
| 1,973 | |
| 1,973 | |
| - | |
| - | | |||||
Accrued interest receivable | 1,972 | |
| 1,972 | |
| 1,972 | |
| - | |
| - | | |||||
|
|
|
|
|
|
|
|
|
| ||||||||||
Financial Liabilities |
| |
|
| |
|
| |
|
| |
|
| | |||||
Deposits: |
| |
|
| |
|
| |
|
| |
|
| | |||||
Non-interest bearing demand | $ | 87,657 | |
| $ | 87,657 | |
| $ | 87,657 | |
| $ | - | |
| $ | - | |
Interest-bearing | 520,605 | |
| 522,021 | |
| 346,455 | |
| - | |
| 175,566 | | |||||
Total deposits | 608,262 | |
| 609,678 | |
| 434,112 | |
| - | |
| 175,566 | | |||||
FHLB advances | 45,000 | |
| 48,445 | |
| - | |
| 48,445 | |
| - | | |||||
Accrued interest payable | 320 | |
| 320 | |
| 320 | |
| - | |
| - | | |||||
The Company assumes interest rate risk (the risk that general interest rate levels will change) as a result of its normal operations. As a result, the estimated fair value of the Company's financial instruments will change when interest rate levels change, and that change may either be favorable or unfavorable to the Company. Management attempts to match maturities of assets and liabilities to the extent believed necessary to appropriately manage interest rate risk. However, borrowers with fixed interest rate obligations are less likely to prepay in a rising interest rate environment and more likely to prepay in a falling interest rate environment. Conversely, depositors who are receiving fixed interest rates are more likely to withdraw funds before maturity in a rising interest rate environment and less likely to do so in a falling interest rate environment. Management monitors interest rates and maturities of assets and liabilities, and attempts to manage interest rate risk by adjusting terms of new loans and deposits and by investing in securities with terms that mitigate the Company's overall interest rate risk.
123
Notes to Consolidated Financial Statements_________________________________________________________________
Timberland Bancorp, Inc. and Subsidiary
September 30, 2014 and 2013
Note 22 - Selected Quarterly Financial Data (Unaudited)
The following selected financial data are presented for the quarters ended (dollars in thousands, except per share amounts):
| September 30, | |
| June 30, | |
| March 31, | |
| December 31, | | ||||
Interest and dividend income | $ | 7,567 | |
| $ | 7,397 | |
| $ | 7,412 | |
| $ | 7,481 | |
Interest expense | (978 | ) |
| (964 | ) |
| (975 | ) |
| (1,022 | ) | ||||
Net interest income | 6,589 | |
| 6,433 | |
| 6,437 | |
| 6,459 | | ||||
|
|
|
|
|
|
|
| ||||||||
Non-interest income | 2,206 | |
| 2,116 | |
| 2,013 | |
| 2,195 | | ||||
Non-interest expense | (6,373 | ) |
| (6,430 | ) |
| (6,754 | ) |
| (6,241 | ) | ||||
|
|
|
|
|
|
|
| ||||||||
Income before income taxes | 2,422 | |
| 2,119 | |
| 1,696 | |
| 2,413 | | ||||
|
|
|
|
|
|
|
| ||||||||
Provision for federal income taxes | 776 | |
| 685 | |
| 537 | |
| 802 | | ||||
|
|
|
|
|
|
|
| ||||||||
Net income | 1,646 | |
| 1,434 | |
| 1,159 | |
| 1,611 | | ||||
|
|
|
|
|
|
|
| ||||||||
Preferred stock dividends | - | |
| - | |
| - | |
| (136 | ) | ||||
Preferred stock discount accretion | - | |
| - | |
| - | |
| (70 | ) | ||||
|
|
|
|
|
|
|
| ||||||||
Net income to common shareholders | $ | 1,646 | |
| $ | 1,434 | |
| $ | 1,159 | |
| $ | 1,405 | |
|
|
|
|
|
|
|
| ||||||||
Net income per common share |
|
|
|
|
|
|
| ||||||||
Basic | $ | 0.24 | |
| $ | 0.21 | |
| $ | 0.17 | |
| $ | 0.20 | |
Diluted | $ | 0.23 | |
| $ | 0.20 | |
| $ | 0.16 | |
| $ | 0.20 | |
124
Notes to Consolidated Financial Statements_________________________________________________________________
Timberland Bancorp, Inc. and Subsidiary
September 30, 2014 and 2013
| September 30, | |
| June 30, | |
| March 31, | |
| December 31, | | ||||
Interest and dividend income | $ | 7,521 | |
| $ | 7,575 | |
| $ | 7,552 | |
| $ | 7,589 | |
Interest expense | (1,052 | ) |
| (1,076 | ) |
| (1,111 | ) |
| (1,200 | ) | ||||
Net interest income | 6,469 | |
| 6,499 | |
| 6,441 | |
| 6,389 | | ||||
|
|
|
|
|
|
|
| ||||||||
Provision for loan losses | (165 | ) |
| (1,385 | ) |
| (1,175 | ) |
| (200 | ) | ||||
Non-interest income | 2,397 | |
| 2,372 | |
| 2,778 | |
| 2,715 | | ||||
Non-interest expense | (7,066 | ) |
| (6,237 | ) |
| (6,184 | ) |
| (6,377 | ) | ||||
|
|
|
|
|
|
|
| ||||||||
Income before income taxes | 1,635 | |
| 1,249 | |
| 1,860 | |
| 2,527 | | ||||
|
|
|
|
|
|
|
| ||||||||
Provision for federal income taxes | 740 | |
| 373 | |
| 582 | |
| 819 | | ||||
|
|
|
|
|
|
|
| ||||||||
Net income | 895 | |
| 876 | |
| 1,278 | |
| 1,708 | | ||||
|
|
|
|
|
|
|
| ||||||||
Preferred stock dividends | (151 | ) |
| (151 | ) |
| (207 | ) |
| (201 | ) | ||||
Preferred stock discount accretion | (47 | ) |
| (47 | ) |
| (126 | ) |
| (63 | ) | ||||
Discount on redemption of preferred stock | - | |
| - | |
| 255 | |
| - | | ||||
|
|
|
|
|
|
|
| ||||||||
Net income to common shareholders | $ | 697 | |
| $ | 678 | |
| $ | 1,200 | |
| $ | 1,444 | |
|
|
|
|
|
|
|
| ||||||||
Net income per common share |
|
|
|
|
|
|
| ||||||||
Basic | $ | 0.10 | |
| $ | 0.10 | |
| $ | 0.18 | |
| $ | 0.21 | |
Diluted | $ | 0.10 | |
| $ | 0.10 | |
| $ | 0.17 | |
| $ | 0.21 | |
Item 9. Changes in and Disagreements with Accountants on Accounting and Financial Disclosure
None.
Item 9A. Controls and Procedures
(a) Evaluation of Disclosure Controls and Procedures : An evaluation of the Company's disclosure controls and procedures (as defined in Rule 13a-15(e) of the Securities Exchange Act of 1934 (the "Exchange Act")) was carried out under the supervision and with the participation of the Company's Chief Executive Officer, Chief Financial Officer and several other members of the Company's senior management as of the end of the period covered by this annual report. The Company's Chief Executive Officer and Chief Financial Officer concluded that as of September 30, 2014 the Company's disclosure controls and procedures were effective in ensuring that the information required to be disclosed by the Company in the reports it files or submits under the Act is (i) accumulated and communicated to the Company's management (including the Chief Executive Officer and Chief Financial Officer) in a timely manner, and (ii) recorded, processed, summarized and reported within the time periods specified in the SEC's rules and forms.
(b) Changes in Internal Controls : There have been no changes in our internal control over financial reporting (as defined in 13a-15(f) of the Exchange Act) that occurred during the quarter ended September 30, 2014, that have materially affected, or are reasonably likely to materially affect, our internal control over financial reporting. The Company continued, however, to implement suggestions from its internal auditor and independent auditor on ways to strengthen existing controls. The Company does not expect that its disclosure controls and procedures and internal controls over financial reporting will prevent all errors and fraud. A control procedure, no matter how well conceived and operated, can provide only reasonable, not absolute, assurance that the objectives of the control procedure are met. Because of the inherent limitations in all control procedures, no evaluation of controls can provide absolute assurance that all control issues and instances of fraud, if any, within the Company have been detected. These inherent limitations include the realities that judgments in decision-making can be faulty, and that breakdowns
125
in controls or procedures can occur because of simple error or mistake. Additionally, controls can be circumvented by the individual acts of some persons, by collusion of two or more people, or by management override of the control. The design of any control procedure is based in part upon certain assumptions about the likelihood of future events and there can be no assurance that any design will succeed in achieving its stated goals under all potential future conditions; over time, controls become inadequate because of changes in conditions, or the degree of compliance with the policies or procedures may deteriorate. Because of the inherent limitations in a cost-effective control procedure, misstatements due to error or fraud may occur and not be detected.
Management's Report on Internal Control Over Financial Reporting is included in this Form 10-K under Part II, Item 8. "Financial Statements and Supplementary Data."
Item 9B. Other Information
None.
PART III
Item 10. Directors, Executive Officers and Corporate Governance
The information required by this item is contained under the section captioned "Proposal I - Election of Directors" in the Company's Definitive Proxy Statement for the 2014 Annual Meeting of Stockholders ("Proxy Statement") and is incorporated herein by reference.
For information regarding the executive officers of the Company and the Bank, see "Item 1. Business - Executive Officers."
Compliance with Section 16(a) of the Exchange Act
The information required by this item is contained under the section captioned "Section 16(a) Beneficial Ownership Reporting Compliance" included in the Company's Proxy Statement and is incorporated herein by reference.
Audit Committee Matters and Audit Committee Financial Expert
The Company has a separately designated standing Audit Committee, composed of Directors Robbel, Smith, Goldberg and Stoney. Each member of the Audit Committee is "independent" as defined in the Nasdaq Stock Market listing standards. The Company's Board of Directors has designated Directors Robbel and Stoney as the Audit Committee financial experts, as defined in the SEC's Regulation S-K. Directors Robbel, Smith, Goldberg and Stoney are independent as that term is used in Item 7(c) of Schedule 14A promulgated under the Exchange Act.
Code of Ethics
The Board of Directors ratified its Code of Ethics for the Company's officers (including its senior financial officers), directors and employees during the year ended September 30, 2014. The Code of Ethics requires the Company's officers, directors and employees to maintain the highest standards of professional conduct. The Company's Code of Ethics was filed as an exhibit to its Annual Report on Form 10-K for the year ended September 30, 2003 and is available on our website at www.timberlandbank.com.
Nomination Procedures
There have been no material changes to the procedures by which stockholders may recommend nominees to the Company's Board of Directors.
Item 11. Executive Compensation
The information required by this item is contained under the sections captioned "Executive Compensation" and "Directors' Compensation" included in the Company's Proxy Statement and is incorporated herein by reference.
126
Item 12. Security Ownership of Certain Beneficial Owners and Management and Related Stockholder Matters
(a) Security Ownership of Certain Beneficial Owners.
The information required by this item is contained under the section captioned "Security Ownership of Certain Beneficial Owners and Management" included in the Company's Proxy Statement and is incorporated herein by reference.
(b) Security Ownership of Management.
The information required by this item is contained under the sections captioned "Security Ownership of Certain Beneficial Owners and Management" and "Proposal I - Election of Directors" included in the Company's Proxy Statement is incorporated herein by reference.
(c) Changes In Control.
The Company is not aware of any arrangements, including any pledge by any person of securities of the Company, the operation of which may at a subsequent date result in a change in control of the Company.
(d) Equity Compensation Plan Information. The following table summarizes share and exercise price information about the Company's equity compensation plans as of September 30, 2014.
Plan category | Number of securities to be issued upon exercise of outstanding options, warrants and rights |
| Weighted-average exercise price of outstanding options, warrants and rights |
| Number of securities remaining available for future issuance under equity compensation plans (excluding securities reflected in column (a)) | ||||
| (a) |
| (b) |
| (c) | ||||
Equity compensation plans approved by security holders: |
|
|
|
|
| ||||
2003 Stock Option Plan | 221,400 | |
| $ | 7.49 | |
| - | |
|
|
|
|
|
| ||||
Equity compensation plans not approved by security holders | - | |
| - | |
| - | | |
|
|
|
|
|
| ||||
Total | 221,400 | |
|
| |
| - | | |
Item 13. Certain Relationships and Related Transactions, and Director Independence
The information required by this item is contained under the sections captioned "Meetings and Committees of the Board of Directors And Corporate Governance Matters - Corporate Governance - Related Party Transactions" and "Meetings and Committees of the Board of Directors and Corporate Governance Matters - Corporate Governance - Director Independence" included in the Company's Proxy Statement and are incorporated herein by reference.
Item 14. Principal Accounting Fees and Services
The information required by this item is contained under the section captioned "Independent Auditor" included in the Company's Proxy Statement and is incorporated herein by reference.
127
Table of Contents
PART IV
Item 15. Exhibits, Financial Statement Schedules
(a) Exhibits
3.1 | |
| Articles of Incorporation of the Registrant (1) |
3.2 | |
| Amended and Restated Bylaws of the Registrant (2) |
3.3 | |
| Articles of Amendment to Articles of Incorporation of the Registrant (3) |
4.2 | |
| Warrant to purchase shares of the Company's common stock dated December 23, 2008 (3) |
4.3 | |
| Letter Agreement (including Securities Purchase Agreement – Standard Terms, attached as Exhibit A) dated December 23, 2008 between the Company and the United States Department of the Treasury (3) |
10.1 | |
| Employee Severance Compensation Plan (4) |
10.2 | |
| Employee Stock Ownership Plan (5) |
10.3 | |
| 1999 Stock Option Plan (6) |
10.4 | |
| 2003 Stock Option Plan (7) |
10.5 | |
| Form of Incentive Stock Option Agreement (8) |
10.6 | |
| Form of Non-qualified Stock Option Agreement (8) |
10.7 | |
| Management Recognition and Development Plan (6) |
10.8 | |
| Form of Management Recognition and Development Award Agreement (7) |
10.9 | |
| Employment Agreement with Michael R. Sand (9) |
10.10 | |
| Employment Agreement with Dean J. Brydon (9) |
14 | |
| Code of Ethics (10) |
21 | |
| Subsidiaries of the Registrant |
23.1 | |
| Consent of Delap LLP |
31.1 | |
| Certification of Chief Executive Officer Pursuant to Section 302 of the Sarbanes-Oxley Act |
31.2 | |
| Certification of Chief Financial Officer Pursuant to Section 302 of the Sarbanes-Oxley Act |
32 | |
| Certification Pursuant to Section 906 of the Sarbanes-Oxley Act |
101 | |
| The following materials from Timberland Bancorp, Inc.'s Annual Report on Form 10-K for the year ended September 30, 2014, formatted in Extensible Business Reporting Language (XBRL): (a) Consolidated Balance Sheets; (b) Consolidated Statements of Income; (c) Consolidated Statements of Comprehensive Income; (d) Consolidated Statements of Shareholders' Equity; (e) Consolidated Statements of Cash Flows; and (f) Notes to Consolidated Financial Statements (11) |
____________
(1) | Filed as an exhibit to the Registrant's Registration Statement on Form S-1 (333-35817) and incorporated by reference. |
(2) | Incorporated by reference to the Registrant's Current Report on Form 8-K filed April 29, 2010. |
(3) | Incorporated by reference to the Registrant's Current Report on Form 8-K filed on December 23, 2008. |
(4) | Incorporated by reference to the Registrant's Current Report on Form 8-K filed April 16, 2007. |
(5) | Incorporated by reference to the Registrant's Quarterly Report on Form 10-Q for the quarter ended December 31, 1997. |
(6) | Incorporated by reference to Exhibit 99 included in the Registrant's Registration Statement on Form S-8 (333-32386) |
(7) | Incorporated by reference to Exhibit 99.2 included in the Registrant's Registration Statement on Form S-8 (333-1161163) |
(8) | Incorporated by reference to the Registrant's Annual Report on Form 10-K for the year ended September 30, 2005. |
(9) | Incorporated by reference to the Registrant's Current Report on Form 8-K filed on March 29, 2013. |
(10) | Incorporated by reference to the Registrant's Annual Report on Form 10-K for the year ended September 30, 2003. |
(11) | Pursuant to Rule 406T of Regulation S-T, these interactive data files are deemed not filed or part of a registration statement or prospectus for purposes of Sections 11 or 12 of the Securities Act of 1933 or Section 18 of the Securities Exchange Act of 1934, as amended, and otherwise are not subject to liability under those sections. |
128
SIGNATURES
Pursuant to the requirements of Section 13 or 15(d) of the Securities Exchange Act of 1934, the registrant has duly caused this report to be signed on its behalf by the undersigned, thereunto duly authorized.
| TIMBERLAND BANCORP, INC. | ||
|
|
| |
Date: December 11, 2014 | By: | /s/Michael R. Sand | |
|
|
| Michael R. Sand |
|
|
| President and Chief Executive Officer |
Pursuant to the requirements of the Securities Exchange Act of 1934, this report has been signed below by the following persons on behalf of the registrant and in the capacities and on the dates indicated.
SIGNATURES | TITLE | DATE |
| ||
/s/Michael R. Sand | President, Chief Executive Officer and | December 11, 2014 |
Michael R. Sand | Director | |
| (Principal Executive Officer) |
|
| ||
/s/Jon C. Parker | Chairman of the Board | December 11, 2014 |
Jon C. Parker |
| |
|
|
|
/s/Dean J. Brydon | Chief Financial Officer | December 11, 2014 |
Dean J. Brydon | (Principal Financial and Accounting Officer) | |
| ||
/s/Andrea M. Clinton | Director | December 11, 2014 |
Andrea M. Clinton | ||
| ||
/s/Larry D. Goldberg | Director | December 11, 2014 |
Larry D. Goldberg | ||
|
|
|
/s/James C. Mason | Director | December 11, 2014 |
James C. Mason | ||
| ||
/s/Ronald A. Robbel | Director | December 11, 2014 |
Ronald A. Robbel |
|
|
|
|
|
/s/David A. Smith | Director | December 11, 2014 |
David A. Smith | ||
| ||
/s/Michael J. Stoney | Director | December 11, 2014 |
Michael J. Stoney | ||
129
EXHIBIT INDEX
Exhibit No. |
| Description of Exhibit |
|
21 |
| Subsidiaries of the Registrant |
23.1 |
| Consent of Delap LLP |
31.1 |
| Certification of Chief Executive Officer Pursuant to Section 302 of the Sarbanes-Oxley Act |
31.2 |
| Certification of Chief Financial Officer Pursuant to Section 302 of the Sarbanes-Oxley Act |
32 |
| Certification Pursuant to Section 906 of the Sarbanes-Oxley Act |
101 |
| The following materials from Timberland Bancorp, Inc.'s Annual Report on Form 10-K for the year ended September 30, 2014, formatted in Extensible Business Reporting Language (XBRL): (a) Consolidated Balance Sheets; (b) Consolidated Statements of Income; (c) Consolidated Statements of Comprehensive Income; (d) Consolidated Statements of Shareholders' Equity; (e) Consolidated Statements of Cash Flows; and (f) Notes to Consolidated Financial Statements * |
* | Pursuant to Rule 406T of Regulation S-T, these interactive data files are deemed not filed or part of a registration statement or prospectus for purposes of Sections 11 or 12 of the Securities Act of 1933 or Section 18 of the Securities Exchange Act of 1934, as amended, and otherwise are not subject to liability under those sections. |
130