UNITED STATES
SECURITIES AND EXCHANGE COMMISSION
Washington, D.C. 20549
Form 10-K
| x | ANNUAL REPORT PURSUANT TO SECTION 13 OR 15(d) OF THE SECURITIES EXCHANGE ACT OF 1934 |
For the fiscal year ended December 31, 2013
or
| ¨ | TRANSITION REPORT PURSUANT TO SECTION 13 OR 15(d) OF THE SECURITIES EXCHANGE ACT OF 1934 |
For the transition period from to .
Commission File No. 001-35873
TAYLOR MORRISON HOME CORPORATION
(Exact name of registrant as specified in its charter)
| Delaware | 90-0907433 | |
(State or other jurisdiction of incorporation or organization) | (I.R.S. Employer Identification No.) |
4900 N. Scottsdale Road, Suite 2000, Scottsdale, Arizona 85251
(Address of principal executive offices) (Zip Code)
Registrant's telephone number, including area code: (480) 840-8100
Securities Registered Pursuant to Section 12(b) of the Act:
Title of each class | Name of each exchange on which registered | |
| Class A Common Stock, $0.00001 par value | New York Stock Exchange |
Securities Registered Pursuant to Section 12(g) of the Act: None
Indicate by check mark if the registrant is a well-known seasoned issuer, as defined in Rule 405 of the Securities Act. Yes ¨ No x
Indicate by check mark if the registrant is not required to file reports pursuant to Section 13 or Section 15(d) of the Act. Yes ¨ No x
Indicate by check mark whether the registrant (1) has filed all reports required to be filed by Section 13 or 15(d) of the Securities Exchange Act of 1934 during the preceding 12 months (or for such shorter period that the registrant was required to file such reports), and (2) has been subject to such filing requirements for the past 90 days. Yes x No ¨
Indicate by check mark whether the registrant has submitted electronically and posted on its corporate Web site, if any, every Interactive Data File required to be submitted and posted pursuant to Rule 405 of Regulation S-T during the preceding 12 months (or for such shorter period that the registrant was required to submit and post such files). Yes x No ¨
Indicate by check mark if disclosure of delinquent filers pursuant to Item 405 of Regulation S-K is not contained herein, and will not be contained, to the best of registrant's knowledge, in definitive proxy or information statements incorporated by reference in Part III of this Form 10-K or any amendment to this Form 10-K. x
Indicate by check mark whether the registrant is a large accelerated filer, an accelerated filer, a non-accelerated filer, or a smaller reporting company. See the definitions of "large accelerated filer," "accelerated filer" and "smaller reporting company" in Rule 12b-2 of the Exchange Act.
| Large accelerated filer | ¨ | Accelerated filer | ¨ | |||
| Non-accelerated filer | x | Smaller reporting company | ¨ | |||
Indicate by check mark whether the registrant is a shell company (as defined in Rule 12b-2 of the Exchange Act). Yes ¨ No x
The aggregate market value of voting stock held by non-affiliates of the registrant on June 28, 2013 was $801,295,022, based on the closing sales price per share as reported by the New York Stock Exchange on such date.
Indicate the number of shares outstanding of each of the issuer's classes of common stock, as of February 24, 2014:
Class | Outstanding | |||
Class A Common Stock, $0.00001 par value | 32,857,800 | |||
Class B Common Stock, $0.00001 par value | 89,451,164 | |||
Documents Incorporated by Reference
Portions of Part III of this Form 10-K are incorporated by reference from the Registrant's definitive proxy statement for its 2014 annual meeting of shareholders to be filed with the Securities and Exchange Commission no later than 120 days after the end of the Registrant's fiscal year.
TAYLOR MORRISON HOME CORPORATION AND SUBSIDIARIES
(CONSOLIDATED AND COMBINED WITH TMM HOLDINGS LIMITED PARTNERSHIP AND SUBSIDIARIES)
FORM 10-K
FOR THE YEAR ENDED DECEMBER 31, 2013
TABLE OF CONTENTS
| Page Number | ||||||
| PART I | ||||||
Item 1. | Business | 2 | ||||
Item 1A. | Risk Factors | 17 | ||||
Item 1B. | Unresolved Staff Comments | 37 | ||||
Item 2. | Properties | 37 | ||||
Item 3. | Legal Proceedings | 37 | ||||
Item 4. | Mine Safety Disclosures | 37 | ||||
| PART II | ||||||
Item 5. | Market for Registrant's Common Equity, Related Stockholder Matters and Issuer Purchases of Equity Securities | 38 | ||||
Item 6. | Selected Financial Data | 40 | ||||
Item 7. | Management's Discussion and Analysis of Financial Condition and Results of Operations | 41 | ||||
Item 7A. | Quantitative and Qualitative Disclosures About Market Risk | 77 | ||||
Item 8. | Financial Statements and Supplementary Data | 79 | ||||
Item 9. | Changes in and Disagreements with Accountants on Accounting and Financial Disclosure | 130 | ||||
Item 9A. | Controls and Procedures | 130 | ||||
Item 9B. | Other Information | 130 | ||||
| PART III | ||||||
Item 10. | Directors, Executive Officers and Corporate Governance | 131 | ||||
Item 11. | Executive Compensation | 131 | ||||
Item 12. | Security Ownership of Certain Beneficial Owners and Management and Related Stockholder Matters | 131 | ||||
Item 13. | Certain Relationships and Related Transactions, and Director Independence | 132 | ||||
Item 14. | Principal Accounting Fees and Services | 132 | ||||
| PART IV | ||||||
Item 15. | Exhibits, Financial Statement Schedules | 132 | ||||
Signatures | 135 | |||||
i
TAYLOR MORRISON HOME CORPORATION AND SUBSIDIARIES
(CONSOLIDATED AND COMBINED WITH TMM HOLDINGS LIMITED PARTNERSHIP AND SUBSIDIARIES)
| Page Number | ||||
Report of Independent Registered Public Accounting Firm | 79 | |||
Consolidated and Combined Balance Sheets as of December 31, 2013 and 2012 | 80 | |||
Consolidated and Combined Statements of Operations for the Years Ended December 31, 2013 and 2012 | 81 | |||
Consolidated and Combined Statements of Comprehensive Income (loss) for the Years Ended December 31, 2013 and 2012 | 82 | |||
Consolidated and Combined Statements of Stockholders' Equity for the Years Ended December 31, 2013 and 2012 | 83 | |||
Consolidated and Combined Statements of Cash Flows for the Years Ended December 31, 2013 and 2012 | 84 | |||
Notes to Consolidated and Combined Financial Statements | 85 | |||
Separate combined financial statements of our unconsolidated joint venture activities have been omitted because, if considered in the aggregate, they would not constitute a significant subsidiary as defined by Rule 3-09 of Regulation S-X.
ii
Available Information
Information about our company and communities is provided on our Internet websites at www.taylormorrison.com, www.monarchgroup.net and www.darlinghomes.com (collectively, the "Taylor Morrison website"). The information contained on the Taylor Morrison websites is not considered part of this Annual Report on Form 10-K ("Annual Report"). Our periodic and current reports, including any amendments, filed or furnished pursuant to Section 13(a) or 15(d) of the Securities Exchange Act of 1934, as amended (the "Exchange Act") are available, free of charge, on our Taylor Morrison website as soon as reasonably practicable after they are electronically filed with or furnished to the Securities and Exchange Commission ("SEC"). These filings are also available on the SEC's website at www.sec.gov. In addition to our SEC filings, our corporate governance documents, including our Code of Conduct and Ethics and Corporate Governance Guidelines are available on the "Investor Relations" page of our Taylor Morrison website under "Corporate Governance." Our stockholders may also obtain these documents in paper format free of charge upon request made to our Investor Relations department.
In this Annual Report, unless the context requires otherwise, references to "the Company," "we," "us," or "our" are to Taylor Morrison Home Corporation ("TMHC") and its subsidiaries and references to "Predecessor" are to the North American business of Taylor Wimpey plc, "Predecessor Parent Company".
Including our predecessors, we commenced homebuilding operations in 1936. The July 2007 merger between Taylor Woodrow plc and George Wimpey plc, two UK-based, publicly listed homebuilders, resulted in the formation of Taylor Wimpey plc, and the subsequent integration of Taylor Woodrow Holdings (USA), Inc. and Morrison Homes, Inc. in the U.S. resulting in Taylor Morrison Communities, Inc. ("Taylor Morrison Communities", "Taylor Morrison" or "TMC"), and Monarch Corporation ("Monarch") in Canada. TMHC was incorporated in Delaware in November 2012. Our principal executive offices are located at 4900 N. Scottsdale Road, Suite 2000, Scottsdale, Arizona 85251 and the telephone number is (480) 840-8100.
Forward-Looking Statements
Certain information included in this Annual Report or in other materials we have filed or will file with the SEC (as well as information included in oral statements or other written statements made or to be made by us) contains or may contain forward-looking statements within the meaning of Section 27A of the Securities Act of 1933, as amended (the "Securities Act"), and Section 21E of the Exchange Act. You can identify these statements by the fact that they do not relate to matters of strictly historical or factual nature and generally discuss or relate to estimates or other expectations regarding future events. They contain words such as, but not limited to, "anticipate," "estimate," "expect," "project," "intend," "plan," "believe," "may," "can," "could," "might," "should" and other words or phrases of similar meaning in connection with any discussion of future operating or financial performance. As you read this Annual Report and other reports or public statements, you should understand that these statements are not guarantees of performance or results. They involve known and unknown risks, uncertainties and assumptions, including those described under the heading "Risk Factors" in Part I, Item 1A. and elsewhere in this Annual Report. Although we believe that these forward-looking statements are based upon reasonable assumptions, you should be aware that many factors, including those described under the heading "Risk Factors" in Part I, Item 1A. and elsewhere in this Annual Report, could affect our actual financial results or results of operations and could cause actual results to differ materially from those in the forward-looking statements.
Forward-looking statements speak only as of the date they are made. We undertake no obligation to publicly update any forward-looking statements, whether as a result of new information, future events or otherwise. This discussion is provided as permitted by the Private Securities Litigation Reform Act of 1995, and all of our forward-looking statements are expressly qualified in their entirety by the cautionary statements contained or referenced in this section.
1
PART I
ITEM 1. BUSINESS
Overview of Taylor Morrison Home Corporation
We are one of the largest public homebuilders in North America. Headquartered in Scottsdale, Arizona, we build single-family detached and attached homes and develop land, which includes lifestyle and master-planned communities. We are proud of our legacy of nearly 80 years in the homebuilding industry, having originally commenced homebuilding operations in 1936. We operate under our Taylor Morrison and Darling Homes brands in the U.S. and under our Monarch brand in Canada.
Our business has twelve homebuilding operating divisions, which are combined into three reportable segments: East, West and Canada, which segments accounted for 58%, 31% and 11%, respectively, of our net sales orders (excluding unconsolidated joint ventures) for the year ended December 31, 2013.
Our reportable homebuilding segments have operations in:
| East: | Houston (which includes a Taylor Morrison division and a Darling Homes division), Austin, Dallas (which includes a Darling Homes division only), North Florida and West Florida. | |
| West: | Phoenix, Northern California, Southern California and Denver. | |
| Canada: | Kitchener-Waterloo, Ottawa, Toronto. | |
In all of our markets, we build and sell a broad and innovative mix of homes across a wide range of price points. Our emphasis is on designing, building and selling homes to move-up buyers. We are well positioned in our markets with a top-10 market share (based on 2013 home closings as reported by Hanley Wood and Metrostudy and 2013 home sales as reported by Real Net Canada, Inc.) in 14 of our 19 markets. A market is defined as an individual metropolitan area, and we could have multiple markets within each division.
All of the divisions in our East and West segments offer single-family attached and/or detached homes and generally operate as merchant builders. Merchant builders generally acquire fully planned and entitled lots and may construct on-site improvements but normally do not construct significant off-site utility or infrastructure improvements. In certain markets we also operate as community developers. Community development includes the acquisition and development of large-scale communities that may include significant planning and entitlement approvals and construction of off-site and on-site utilities and infrastructure. Our Canada segment consists of our operations within the province of Ontario, primarily in the Greater Toronto Area ("GTA") and also in Ottawa and Kitchener-Waterloo, and offers both single-family and high-rise communities.
Mortgage Operations is also a separate reportable segment of our business. Our Mortgage Operations reportable segment provides financial services to customers in the U.S. through its wholly owned mortgage brokerage subsidiary, operating as Taylor Morrison Home Funding, LLC ("TMHF"), and title examination services in some U.S. locations through various joint ventures.
We believe our business is distinguished by:
| • | our strong historical financial performance and margins; |
| • | our strong balance sheet with liquidity available for growth; |
| • | our attractively located land inventory carried at a low cost basis; |
| • | our strong presence in high-growth homebuilding markets; |
| • | our profitable Monarch business in Ontario; |
| • | our expertise delivering "lifestyle" communities targeted at move-up buyers; and |
| • | our deep knowledge of our homebuyer customer base and our reputation for quality. |
2
For financial information about our segments, see Item 7 - Management's Discussion and Analysis of Financial Condition and Results of Operations , of this Annual Report, and the accompanying Consolidated and Combined Financial Statements and Notes thereto in Item 8 of this Annual Report.
Industry Overview and Current Market Developments
Housing Industry Conditions within the U.S.
We believe that a fundamental housing recovery is underway on a national basis, driven by consumers who are increasingly optimistic about their economic prospects and is supported by several positive economic and demographic factors, including decreasing unemployment, increasing home values, improving household balance sheets, declines in new and existing for-sale home inventory, and low interest rates supporting affordability and home ownership. While we were encouraged by the positive and improved trends of 2013, several challenges still exist that may impact the speed of the recovery, such as lingering unemployment concerns, national and global economic uncertainty and a continuing restrictive mortgage lending environment. We are additionally challenged by shortages in the labor supply, specifically as it relates to qualified tradespeople. However, we believe we are in an upward business cycle in most of our markets as the ability to deliver homes to prospective buyers' still lags behind demand and the availability of new and pre-owned homes remains constrained.
Housing Industry Conditions within Ontario, Canada
The Canadian housing market has been more stable than the U.S. housing market over the past five years but has moderated during 2013 as the U.S. housing recovery has strengthened. The recent strength and consistency of the Canadian housing market, particularly in Ontario where we operate, is largely a result of low interest rates and steady home growth in demand due to continuing job growth and immigration-driven population growth. The Canadian housing market has generally been characterized by a stable level of housing starts, a balanced sales-to-listings ratio and steady long-term growth in housing prices. In addition, Canadian home buying practices reflect a number of structural, mortgage lending, legal and general market characteristics that have allowed the Canadian housing market to grow at a sustainable pace and to experience significantly lower mortgage default rates over the past decade as compared to the U.S.
In Canada, almost all mortgages are "full recourse" loans, meaning that the borrower remains responsible for the mortgage even in the case of a mortgage completion by the lender. The laws of most Canadian jurisdictions permit home mortgage lenders to seek to apply all other assets of the borrower against the mortgage and even to garnish future earnings of the borrower in the event of default. In contrast, many mortgages in the U.S. are "limited recourse" which provide for more limited remedies.
For information and analysis of recent trends in our operations and financial condition, see Item 7 - Management's Discussion and Analysis of Financial Condition and Results of Operations of this Annual Report, and for financial information about our results of operations, assets, liabilities, stockholders' equity and cash flows, see the accompanying Consolidated and Combined Financial Statements and Notes thereto in Item 8 of this Annual Report.
Strategy
During the economic downturn, we maintained our core business strategy of focusing on move-up buyers, whereas we observed that many homebuilders refocused their businesses on lower-priced homes. We believe our experience in the move-up market allows us to significantly expand our new home offerings at higher price points. Our average price of homes closed was $389,000 for the year ended December 31, 2013. Historically, our average selling price has ranked us among the top quartile in this category of the public homebuilders. We believe homebuyers at these higher price points are more likely to value and pay for the quality of lifestyle and construction for which we are known, and that they are more insulated from market volatility. We believe our long land position, in what we believe are highly desirable submarkets, and strength of our land pipeline have positioned the Company for growth and increased profitability in an improving housing market through disciplined execution of the following elements of our strategy:
| • | Drive revenue by opening new communities from existing land supply; |
| • | Combine land acquisition and development expertise with homebuilding operations to maximize profitability; |
3
| • | Focus our offerings on targeted customer groups; |
| • | Build aspirational homes for our customers and deliver superior customer service; |
| • | Maintain a strong capital structure; |
| • | Selectively pursue acquisitions; |
| • | Adhere to consistent core operating principles to drive long-term performance; and |
| • | Ensure we have the best available team by hiring and retaining top talent, expecting top level performance and allocating proper resources to drive execution of our business plan. |
2011 Acquisition by our Principal Equityholders
In July 2011, affiliates of TPG Global, LLC ("TPG"), Oaktree Capital Management, L.P. ("Oaktree") and JH Investments Inc. ("JH", and, together with TPG and Oaktree, the "Principal Equityholders"), used TMM Holdings Limited Partnership ("TMM Holdings") to acquire TMC and Monarch from U.K. based Taylor Wimpey plc for aggregate cash consideration of approximately $1.2 billion (the "Acquisition").
The Acquisition was financed in part by a $620.3 million cash equity contribution (the "Equity Contribution") by the Principal Equityholders and a $625 million senior unsecured credit facility with affiliates of TPG and Oaktree, consisting of a $500 million bridge loan facility and a $125 million incremental bridge loan facility (collectively, the "Sponsor Loan"). We repaid the $125 million bridge facility in August 2011 and repaid $350 million of the Sponsor Loan in April 2012 with a portion of the proceeds of the issuance of $550 million of 7.75% Senior Notes due 2020 (the "2020 Senior Notes"). The affiliates of TPG and Oaktree who were lenders under the Sponsor Loan caused the then remaining $150.0 million of the Sponsor Loan to be acquired by a subsidiary of TMM Holdings, and affiliates of TPG and Oaktree acquired an additional $150.0 million of limited partnership interests in TMM Holdings.
Recent Developments
Initial Public Offering
On April 12, 2013, TMHC completed its initial public offering (the "IPO") of 32,857,800 shares of its Class A Common Stock, par value $0.00001 per share (the "Class A Common Stock"), including 4,285,800 shares of Class A Common Stock sold in connection with the full exercise of the option to purchase additional shares granted to the underwriters, at a price to the public of $22.00 per share. The shares began trading on the New York Stock Exchange on April 10, 2013 under the ticker symbol "TMHC." As a result of the completion of the IPO and the Reorganization Transactions (as defined below), TMHC became the indirect parent of TMM Holdings, the entity at which we previously consolidated our financial statements.
Reorganization Transactions
In connection with the IPO, TMHC completed a series of transactions on April 9, 2013 (the "Reorganization Transactions") pursuant to a Reorganization Agreement dated as of April 9, 2013 (the "Reorganization Agreement") among TMHC, TMM Holdings II Limited Partnership ("New TMM"), other subsidiaries of TMHC, affiliates of the Principal Equityholders, certain members of TMHC's management and its Board of Directors (the "Board"), TPG TMM Holdings II, L.P. (the "TPG Holding Vehicle"), OCM TMM Holdings II, L.P. (the "Oaktree Holding Vehicle" and, together with the TPG Holding Vehicle, the "TPG and Oaktree Holding Vehicles") and TMM Holdings. The Reorganization Agreement governs the terms of the Reorganization Transactions, which are described in TMHC's Registration Statement on Form S-1 (File No. 333-185269), which was declared effective by the SEC on April 9, 2013 (the "Registration Statement").
In the Reorganization Transactions, the existing holders of limited partnership interests in TMM Holdings, including the Principal Equityholders and certain members of TMHC's management and Board, through a series of transactions, contributed their limited partnership interests in TMM Holdings to a new limited partnership, New TMM, such that TMM Holdings and the general partner of TMM Holdings became wholly-owned subsidiaries of New TMM. TMHC, through a series of transactions, became the sole owner of the general partner of New TMM, and TMHC used a portion of the net cash proceeds received in the IPO to purchase common partnership units in New TMM ("New TMM Units") from New TMM.
4
In the Reorganization Transactions:
| • | TPG and Oaktree each formed the TPG Holding Vehicle and the Oaktree Holding Vehicle, respectively; |
| • | The Principal Equityholders and members of TMHC's management and Board directly or indirectly exchanged all of their respective Class A Units, Class J Units and performance-vesting Class M Units in TMM Holdings on a one-for-one basis for new equity interests of the TPG and Oaktree Holding Vehicles with terms that are substantially the same as the Class A Units (other than certain Class A Units exchanged by JH as described below), Class J Units (other than with respect to certain vesting conditions) and performance-vesting Class M Units in TMM Holdings surrendered for exchange; |
| • | JH exchanged a portion of its Class A Units in TMM Holdings for New TMM Units to be held by JH; |
| • | Members of TMHC's management and Board exchanged all of their time-vesting Class M Units in TMM Holdings for New TMM Units with vesting terms that are substantially the same as those of the Class M Units surrendered for exchange; |
| • | New TMM directly or indirectly acquired all of the Class A Units, Class J Units and Class M Units in TMM Holdings outstanding prior to the Reorganization Transactions; and |
| • | The TPG and Oaktree Holding Vehicles directly or indirectly acquired New TMM Units. |
Immediately following the consummation of the Reorganization Transactions, the limited partners of New TMM consisted of TMHC, the TPG Holding Vehicle, the Oaktree Holding Vehicle, JH and certain members of TMHC's management and Board. The number of New TMM Units issued to each of the TPG and Oaktree Holding Vehicles, JH and members of TMHC's management and Board, as described above, was determined based on a hypothetical cash distribution by TMM Holdings of TMHC's pre-IPO value to the holders of Class A Units, Class J Units and Class M Units of TMM Holdings, the IPO price and the price per share paid by the underwriters for shares of Class A Common Stock in the IPO.
In connection with the Reorganization Transactions, the TPG and Oaktree Holding Vehicles, JH and members of TMHC's management and Board were also issued a number of shares of TMHC's Class B Common Stock, par value $0.00001 per share (the "Class B Common Stock") equal to the number of New TMM Units that each received. One share of Class B Common Stock, together with one New TMM Unit is exchangeable into one share of Class A Common Stock.
In connection with the Reorganization Transactions, TMHC recorded a one-time, non-cash charge of $80.2 million (based on the IPO price of $22.00 and other factors) in respect of the modification of the Class J Units in TMM resulting from the termination of the JHI Services Agreement between JH and TMM Holdings (the "JHI Services Agreement") and the direct or indirect exchange (on a one-for-one basis) of the Class J Units for units having substantially equivalent performance vesting and distribution terms in the TPG and Oaktree Holding Vehicles.
In connection with the Acquisition in July 2011, affiliates of the Principal Equityholders entered into management services agreements with TMM Holdings, Taylor Morrison Holdings, Inc. ("Taylor Morrison Holdings") and Monarch Communities Inc. ("Monarch Communities") relating to the provision of certain management, advisory and consulting services. In consideration of financial and structural advice and analysis made in connection with the Acquisition, Taylor Morrison Holdings and Monarch Communities paid a one-time transaction fee of $13.7 million to the Principal Equityholders and also reimbursed the Principal Equityholders for third-party, out-of-pocket expenses incurred in connection with the Acquisition, including fees, expenses and disbursements of lawyers, accountants, consultants and other advisors. In addition, as compensation for ongoing services provided by affiliates of the Principal Equityholders under the management services agreements, Taylor Morrison Holdings and Monarch Communities agreed to pay to affiliates of the Principal Equityholders an annual aggregate management fee of $5.0 million. Immediately prior to the IPO, the management services agreements were terminated in exchange for an aggregate payment pursuant to the terms of such agreements of $29.8 million split equally between TPG and Oaktree.
Use of Proceeds of the IPO
Net proceeds from the sale of 32,857,800 shares of Class A Common Stock in the IPO were approximately $668.6 million after deducting underwriting discounts and commissions and offering expenses.
5
TMHC used $204.2 million of the net proceeds of the IPO to acquire New TMM Units from New TMM (at a price equal to the price paid by the underwriters for shares of Class A Common Stock in the IPO). New TMM contributed such net proceeds to TMM Holdings, which then contributed such proceeds to TMC and Monarch Communities (collectively "the Bond Co-Issuers") to redeem $189.6 million aggregate principal amount of our 2020 Senior Notes (at a purchase price equal to 103.875% of their principal amount, plus accrued and unpaid interest of $7.3 million through the April 12, 2013 redemption date). The remaining approximately $464.4 million of the net proceeds from the IPO, together with $18.1 million of cash on hand was used to purchase 23,333,800 New TMM Units (at a price equal to the price paid by the underwriters for shares of TMHC's Class A Common Stock) held by the TPG and Oaktree Holding Vehicles, JH and certain members of TMHC's management and Board. A summary of the use of the IPO proceeds follows (in thousands):
| Use of Proceeds | ||||
Proceeds from sale of Class A Common Stock | $ | 722,872 | ||
Underwriting discounts and commissions | (43,372 | ) | ||
Offering expenses | (10,902 | ) | ||
|
| |||
Net proceeds | $ | 668,598 | ||
Principal and premium payment on 2020 Senior Notes | (204,180 | ) | ||
Purchase of New TMM Units and corresponding shares of Class B Common Stock | (482,543 | ) | ||
Cash on hand | 18,125 | |||
|
| |||
| $ | - | |||
|
| |||
Because TMHC purchased New TMM Units at a valuation in excess of the proportion of the book value of net assets acquired, TMHC incurred an immediate dilution of $297.6 million, which is calculated as the net proceeds used by TMHC to purchase New TMM Units of $668.6 million less the book value of such interests of $371.0 million. This dilution is reflected within TMHC's additional paid in capital ("APIC") as a reallocation from APIC to non-controlling interests - Principal Equityholders in the accompanying Consolidated and Combined Statement of Shareholders Equity.
Impact to Quarterly Information Previously Filed - The previously filed Consolidated Statements of Stockholders' Equity for the six and nine months ended June 30, 2013 and September 30, 2013 did not reflect the $297.6 million re-allocation between APIC and non-controlling interest - Principal Equityholders. The impact of this error to the previously issued financial statements is a decrease in APIC and a corresponding equivalent increase to non-controlling interest - Principal Equityholders of $297.6 million for both periods. There would be no impact on the total balance of equity, share counts or previously reported earnings per share and it is not material to our previously issued consolidated financial statements.
Restated Revolving Credit Facility
Concurrently with the Acquisition in July 2011, TMC and Monarch (the "Original Revolver Co-Borrowers"), entered into a senior secured revolving credit facility with a syndicate of third party banks and financial institutions, with an aggregate committed principal amount of $75.0 million (as amended and restated as of April 13, 2012, the "Original Revolving Credit Facility"). On August 15, 2012, we utilized the $50.0 million incremental facility feature under the Original Revolving Credit Facility to increase the revolving credit commitments from $75.0 million to $125.0 million. On December 27, 2012, we further amended the Original Revolving Credit Facility to provide for $225.0 million in aggregate revolving credit commitments.
On April 12, 2013, the Original Revolver Co-Borrowers entered into an amendment agreement (the "Amendment") to the Original Revolving Credit Facility (as amended and restated by the Amendment and the January 2014 amendment described below, the "Restated Revolving Credit Facility"). The Restated Revolving Credit Facility, among other things, converted the Original Revolving Credit Facility into an unsecured facility and increased the aggregate revolving credit commitments under the facility to $400.0 million.
On January 15, 2014, the Original Revolver Co-Borrowers amended the Restated Revolving Credit Facility to remove Monarch as co-borrower. The overall borrowing capacity and terms were otherwise unchanged. As a result of the
6
Amendment, TMC is now the sole borrower under the Restated Revolving Credit Facility. See Note 19 - Subsequent Events of the Notes to the Consolidated and Combined Financial Statements in Item 8 of this Annual Report.
We had no outstanding borrowings under the Restated Revolving Credit Facility at December 31, 2013 and $50.0 million outstanding at December 31, 2012. As of December 31, 2013, we had $373.5 million of additional availability for borrowings and $173.5 million of additional availability for letters of credit (giving effect to $26.5 million of letters of credit outstanding as of such date). For more information regarding the Restated Revolving Credit Facility, see Item 7 - Management's Discussion and Analysis of Financial Condition and Results of Operations - Overview of Capital Resources and Liquidity - Capital Resources - Original Revolving Credit Facility and Restated Revolving Credit Facility in this Annual Report.
2021 Senior Notes
On April 16, 2013, the Bond Co-Issuers completed the issuance of $550.0 million aggregate principal amount of 5.25% Senior Notes due 2021 (the "2021 Senior Notes" and together with the 2020 Senior Notes, the "Senior Notes"). We used the net proceeds from the issuance of the 2021 Senior Notes to repay the outstanding balance under the Restated Revolving Credit Facility and for general corporate purposes, including the purchase of additional land inventory. For more information regarding the 2021 Senior Notes, see Item 7 - Management's Discussion and Analysis of Financial Condition and Results of Operations - Overview of Capital Resources and Liquidity - Capital Resources - 2021 Senior Notes in this Annual Report.
Darling Acquisition
On December 31, 2012, we acquired certain assets and liabilities of Darling Interests, Inc., a Texas-based homebuilder, and certain affiliated entities (collectively, "Darling" or the "Darling Acquisition"). Darling builds homes under the Darling Homes brand for move-up and luxury buyers in the Dallas-Fort Worth Metroplex and in the Greater Houston Area markets. Darling is a well-established builder whose products complement our existing product lines in Texas. The acquisition of Darling has given us a strong presence in the Dallas homebuilding market and has expanded our existing operations in Houston.
The consideration for the acquisition of the Darling assets was $114.8 million as well as a contingent payment of $50.0 million, plus 5% of any cumulative earnings before interest and taxes above $229.5 million over the four year period following December 31, 2012. A portion of this amount was financed by $50.0 million of borrowings under our Original Revolving Credit Facility. Approximately $27.6 million of the price for the acquisition was financed by the sellers. In connection with the purchase price allocation for the acquisition, we recorded $23.4 million of goodwill and $9.9 million of intangible assets with finite useful lives. Additionally, we incurred $1.8 million of transaction costs which were recorded as other expense (income), net in 2012 in our Consolidated and Combined Statements of Operations. Darling operates as part of our East segment, and the goodwill recorded as part of the Darling Acquisition has been recorded in the balance sheet for the East segment and is included in our Consolidated and Combined Balance Sheets.
Exchange of Class J Units in TMM Holdings
In connection with the Acquisition in July 2011, JH received an aggregate of 60,531,998 Class J Units in TMM Holdings (made up of J-1 Units, J-2 Units and J-3 Units). Class J Units in TMM Holdings were issued in consideration of JH's service to TMM Holdings and were subject to both time and performance-based vesting conditions. At the completion of the Acquisition, TMM Holdings and JH entered into the JHI Services Agreement.
Satisfaction of the time-vesting condition required the JHI Services Agreement to be in effect as of the date each annual installment vests. The service conditions set forth in the JHI Services Agreement were to lapse after a period of five years.
In the Reorganization Transactions, the TMM Holdings Class J Units tied to TPG's returns were exchanged for Class J Units of the TPG Holding Vehicle, and the TMM Holdings Class J Units tied to Oaktree's returns were exchanged for Class J Units of the Oaktree Holding Vehicle, in each case with substantially equivalent performance vesting and distribution terms but no future service conditions. J-1 Units, J-2 Units and J-3 Units of the TPG and Oaktree Holding
7
Vehicles will generally vest when the applicable sponsor, TPG or Oaktree, has achieved an internal rate of return (in cash) on its aggregate capital contribution of 10%, 15%, or 15% plus a 1.0x, 1.0x or 2.0x return of capital, respectively. These rates of return were generally similar to those in the Class J Units in TMM Holdings that were replaced.
As a result of the completion of the Reorganization Transactions and the IPO, no Class J Units are part of the equity structure of TMHC or New TMM. The JHI Services Agreement has been terminated and will not be replaced. The termination of the JHI Services Agreement in connection with the exchange was a modification of the Class J Units under ASC Topic 718-20-35-3, requiring the recognition of an $80.2 million non-cash charge in our Consolidated and Combined Statements of Operations in indemnification and transaction expenses. This non-cash charge is non-recurring and was recorded as an expense and as an offset in the non-controlling interests of TMM Holdings. The amount of the charge represents the fair value of the Class J Units on the date of modification. The fair value of the Class J Units at the date of modification has been estimated using a Black-Scholes model with the following key assumptions: (1) volatility of 40%, based on a comparable peer set of companies, which includes Standard Pacific Corp., Lennar Corporation, Ryland Group Inc., KB Home, PulteGroup Inc., Hovnanian Enterprises Inc., Beazer Homes USA Inc., Meritage Homes Corporation, M/I Homes, Inc., and DR Horton, Inc.; (2) a risk free rate of 0.4%, based on U.S. Treasuries with a like term; (3) an expected life of three years; (4) a 20% discount for lack of marketability to account for the illiquidity of the Class J Units in TMM Holdings and the Class J Units in the TPG and Oaktree Holding Vehicles being issued in exchange as well as the impact of the performance conditions (the requirement to realize the return on capital of TPG and Oaktree at the applicable thresholds) still to be met as of the date of the modification, based on both quantitative and qualitative factors; and (5) a hypothetical cash distribution by TMM Holdings of TMM Holdings' pre-IPO value to the holders of Class A Units, Class J Units and Class M Units of TMM Holdings based on the price per share paid by the underwriters for shares of TMHC's Class A Common Stock in the IPO on the assumption that the performance conditions applicable to the Class J Units in TMM (the requirement to realize the return on capital of TPG and Oaktree at the applicable thresholds) had been met as of the date of the IPO.
Homebuilding Operations
We focus on developing "lifestyle" communities, which have many distinguishing attributes, including proximity to job centers, strong school systems and a variety of amenities. Within our communities, we offer a range of award-winning designs through our single-family detached, single-family attached and high-rise condominium products. We engineer our homes for energy-efficiency, cost savings and comfort to reduce the impact on the environment while decreasing our homebuyers' annual operating costs. Although we target move-up buyers, our portfolio also includes high quality homes aimed at entry-level, luxury and active adult buyers.
We strive to maintain appropriate consumer product and price level diversification. We target the largest and most profitable consumer groups while ensuring the divisional portfolios are not overly concentrated in any one group. Our ability to build at multiple price points enables us to adjust readily to changing consumer preferences and affordability. We also use measures of market specific supply and demand to determine which consumer groups are ultimately targeted and will be the most profitable in a specific land position.
We market single-family homes with many amenities to entry-level through move-up homebuyers. We believe that our reputation as a builder of homes for move-up buyers enhances our competitive position with respect to the sale of our smaller, more moderately priced single-family detached and attached homes enabling us to capture more margin.
We have developed a number of home designs with features such as single-story living, split bedroom plans and first floor master bedroom suites to appeal to universal design needs, as well as communities with recreational amenities such as golf courses, pool complexes, country clubs and recreation centers. We have integrated these designs and features in many of our homes and communities.
We offer some of the same basic home designs in similar communities and engage unaffiliated architectural firms and internal architectural resources to develop new designs to replace or augment existing plans in order to ensure that our homes reflect current and local consumer tastes. During the past year, we introduced 118 new single-family detached and attached floor plans.
8
A summary of homebuilding activity by segment as of and for the year ended December 31, 2013 is as follows:
(Dollars in thousands)
| Year Ended December 31, 2013 | At December 31, 2013 | |||||||||||||||||||||||
| Homes Closed | Average Selling Price of Closed Homes | Homes Sold | Number of Active Selling Communities | Homes in Backlog | $ Value of Backlog | |||||||||||||||||||
East | 2,913 | $ | 376 | 3,255 | 130 | 1,544 | $ | 667,725 | ||||||||||||||||
West | 1,803 | 423 | 1,763 | 48 | 622 | 320,029 | ||||||||||||||||||
|
|
|
|
|
|
|
|
|
| |||||||||||||||
Subtotal U.S. | 4,716 | $ | 394 | 5,018 | 178 | 2,166 | $ | 987,754 | ||||||||||||||||
Canada | 1,113 | 366 | 596 | 16 | 822 | 259,352 | ||||||||||||||||||
|
|
|
|
|
|
|
|
|
| |||||||||||||||
Subtotal North America | 5,829 | $ | 389 | 5,614 | 194 | 2,988 | $ | 1,247,106 | ||||||||||||||||
Unconsolidated joint ventures | 441 | 301 | 83 | 3 | 548 | 195,979 | ||||||||||||||||||
|
|
|
|
|
|
|
|
|
| |||||||||||||||
Total | 6,270 | $ | 382 | 5,697 | 197 | 3,536 | $ | 1,443,085 | ||||||||||||||||
|
|
|
|
|
|
|
|
|
| |||||||||||||||
We believe that during 2014 we will deliver to customers substantially all homes in backlog at December 31, 2013 under existing or, in the case of cancellations, replacement sales contracts.
Land Acquisition Policies and Development
Locating and acquiring suitable land positions is a critical challenge for any homebuilder or developer. In order to maximize our expected risk-adjusted return, the allocation of capital for land investment is performed at the corporate level with a disciplined approach to overall portfolio management. Our investment committee meets twice monthly, or as needed, and consists of five of our senior executives. Annually, the divisions prepare a strategic plan for their specific geographies. Macro and micro indices, such as employment, housing starts, new home sales, resales and foreclosures along with market related shifts in competition, land availability and consumer preferences, are carefully analyzed to determine the land and homebuilding strategy. Supply and demand are analyzed on a consumer segment and submarket basis to ensure land investment is targeted appropriately. The long-term plan is compared on an ongoing basis to current conditions in the marketplace as they evolve and is adjusted to the extent necessary. Major development strategy decisions regarding community positioning are included in the underwriting process and are made in consultation with senior members of our management team. Our existing land portfolio as of December 31, 2013 is detailed below:
| Owned Lots December 31, 2013 | Controlled Lots December 31, 2013 | |||||||||||||||||||||||||||||||||||||||
| Raw | Partially developed | Finished | Long- term strategic assets | Total | Raw | Partially developed | Finished | Total | Total owned & controlled lots | |||||||||||||||||||||||||||||||
East | 8,768 | 6,110 | 4,368 | 1,922 | 21,168 | 7,028 | 876 | 901 | 8,805 | 29,973 | ||||||||||||||||||||||||||||||
West | 2,818 | 2,721 | 2,849 | 1,807 | 10,195 | 1,897 | 121 | 45 | 2,063 | 12,258 | ||||||||||||||||||||||||||||||
|
|
|
|
|
|
|
|
|
|
|
|
|
|
|
|
|
|
|
| |||||||||||||||||||||
Subtotal U.S. | 11,586 | 8,831 | 7,217 | 3,729 | 31,363 | 8,925 | 997 | 946 | 10,868 | 42,231 | ||||||||||||||||||||||||||||||
Canada | 1,064 | 959 | 342 | - | 2,365 | 200 | - | 575 | 775 | 3,140 | ||||||||||||||||||||||||||||||
|
|
|
|
|
|
|
|
|
|
|
|
|
|
|
|
|
|
|
| |||||||||||||||||||||
Subtotal North America | 12,650 | 9,790 | 7,559 | 3,729 | 33,728 | 9,125 | 997 | 1,521 | 11,643 | 45,371 | ||||||||||||||||||||||||||||||
Unconsolidated joint ventures (1) | 1,332 | 1,038 | - | - | 2,370 | - | 468 | - | 468 | 2,838 | ||||||||||||||||||||||||||||||
|
|
|
|
|
|
|
|
|
|
|
|
|
|
|
|
|
|
|
| |||||||||||||||||||||
Total | 13,982 | 10,828 | 7,559 | 3,729 | 36,098 | 9,125 | 1,465 | 1,521 | 12,111 | 48,209 | ||||||||||||||||||||||||||||||
|
|
|
|
|
|
|
|
|
|
|
|
|
|
|
|
|
|
|
| |||||||||||||||||||||
| (1) | Single-family joint ventures and high-rise joint ventures owned and controlled lots are comprised of our proportionate share of lots within consolidated joint ventures. |
9
Lot Development Status
| As of December 31, 2013 | ||||||||
(Dollars in thousands) Development Status | Owned Lots (1) | Book Value of Land and Development | ||||||
Raw | 13,982 | $ | 425,759 | |||||
Partially developed | 10,828 | 516,492 | ||||||
Finished | 7,559 | 732,015 | ||||||
Long-term strategic assets | 3,729 | 27,988 | ||||||
|
|
|
| |||||
Total | 36,098 | $ | 1,702,254 | |||||
|
|
|
| |||||
| (1) | Includes 2,370 lots which are held within consolidated joint ventures. |
In North America, many builders buy finished lots from a land developer. This approach reduces the margin available and makes planning difficult when competition for finished lots is particularly high. We are less dependent on this approach, having a well-established land development business in several of our markets, which we believe allows us to generate higher margins.
Lot Vintage
| As of December 31, 2013 | ||||||||||||||||||||||||||||||||||||
(Dollars in thousands) Year Acquired | East | West | Subtotal U.S. | Canada | Subtotal North America | Unconsolidated Joint Ventures | Total Owned Lots | Book Value of Land and Development | Dollar % of Total | |||||||||||||||||||||||||||
Pre-2008 | 4,216 | 2,734 | 6,950 | 1,620 | 8,570 | 1,225 | 9,795 | $ | 144,711 | 8.5 | % | |||||||||||||||||||||||||
2008 | 320 | 165 | 485 | - | 485 | 210 | 695 | 5,258 | 0.3 | |||||||||||||||||||||||||||
2009 | 419 | 1,603 | 2,022 | - | 2,022 | - | 2,022 | 60,519 | 3.6 | |||||||||||||||||||||||||||
2010 | 2,105 | 49 | 2,154 | 10 | 2,164 | 174 | 2,338 | 34,259 | 2.0 | |||||||||||||||||||||||||||
2011 | 1,245 | 664 | 1,909 | 238 | 2,147 | 201 | 2,348 | 120,009 | 7.1 | |||||||||||||||||||||||||||
2012 | 6,014 | 2,551 | 8,565 | 85 | 8,650 | - | 8,650 | 540,057 | 31.7 | |||||||||||||||||||||||||||
2013 | 6,849 | 2,429 | 9,278 | 412 | 9,690 | 560 | 10,250 | 797,441 | 46.8 | |||||||||||||||||||||||||||
|
|
|
|
|
|
|
|
|
|
|
|
|
|
|
|
|
| |||||||||||||||||||
Total | 21,168 | 10,195 | 31,363 | 2,365 | 33,728 | 2,370 | 36,098 | $ | 1,702,254 | 100.0 | % | |||||||||||||||||||||||||
|
|
|
|
|
|
|
|
|
|
|
|
|
|
|
|
|
| |||||||||||||||||||
In the land purchasing process, specific projects of interest are detailed by the local division team, including proposed ownership structure, environmental concerns, anticipated product segmentation, competitive environment and financial returns. We also determine whether further spending on currently owned and controlled land is a well-timed and appropriate use of capital. As market circumstances change, we evaluate whether communities that have been put on hold will be resumed. In all circumstances, our investment strategy emphasizes expected profitability to reflect the risk and timing of returns, rather than the establishment or maintenance of sales volumes in new or existing markets.
Community Development
We aim to establish a complete concept for each community we develop, beginning with an overall community design and then determining the size, style and price range of the homes and the layout of the streets and individual home sites. In the case of developed communities, after necessary governmental subdivision and other approvals have been obtained, we improve the land by clearing and grading, installing roads, underground utility lines and recreational amenities, erecting distinctive entrance structures and staking out individual home sites.
Each community has personnel that perform superintendent, sales and customer service functions, in conjunction with a local management team to manage the general project.
Our construction, land and purchasing managers coordinate subcontracting services and supervise all aspects of construction work and quality control. We are a general contractor for all of our homebuilding projects in the U.S. and all of our projects in Canada. Subcontractors perform all home construction and land development work, generally under
10
fixed-price contracts. Although the construction time for our homes varies from project to project depending on geographic region, the time of year, the size and complexity of the homes, local labor situations, the governmental approval processes, availability of materials and supplies, and other factors, we typically complete the construction of a home in approximately three to six months.
Procurement and Construction
We employ a comprehensive procurement program that leverages our size and national presence to achieve attractive cost savings. Our objective in procurement is to maximize efficiencies on local, regional and national levels and to ensure consistent utilization of established contractual arrangements.
The program currently involves over 40 vendors and includes highly reputable and well-established companies who supply us with lumber, appliances, HVAC systems, insulation, shingles, paint and lighting, among other supplies. Through these relationships, we are able to realize discounts on the costs of essential materials. Contracts are typically structured to include a blend of attractive upfront pricing and rebates and, in some cases, advantageous retroactive pricing in instances of contract renewals. The program arrangements are typically not designed to be completely exclusive in nature; for example, divisions may choose to use local or alternate suppliers if they find cost savings by doing so. However, our divisions have historically made use of over 80% of our national procurement contracts, largely as a result of the advantageous pricing available under such contracts.
In addition to cost advantages, these arrangements also help minimize the risk of construction delays during supply shortages, as we are often able to leverage our size to obtain our full allocation of required materials. Furthermore, these arrangements sometimes include provisions for cooperative marketing, which allow us to extend the reach and effectiveness of our advertising efforts. We are, however, challenged by shortages in the labor supply, specifically as it relates to qualified tradespeople.
Sources and Availability of Raw Materials
Based on local market practices, we either directly or through our subcontractors, purchase drywall, cement, steel, lumber, insulation and the other building materials necessary to construct a home. While these materials are generally widely available from a variety of sources, from time to time we experience serious material shortages on a localized basis, particularly during periods where the regions in which we operate experience natural disasters that have a significant impact on existing residential and commercial structures and during periods of robust construction activity when there is high demand for new homes. During these periods, the prices for these materials can substantially increase and our construction process can be slowed. We generally have multiple sources for the materials we purchase and have not experienced significant delays due to unavailability of necessary materials.
Homes in Inventory
We manage our inventory of homes under construction by selectively starting construction on unsold homes to capture new home demand, while monitoring the number and aging of unsold homes. As of December 31, 2013, we had a total of 4,206 homes in inventory, which included 2,988 homes under contract but not yet closed.
The following is a summary of our homes in inventory by segment as of December 31, 2013:
| (Dollars in thousands) | Sold Homes in Backlog (1) | Models | Inventory to be Sold | Total | Inventory Value without Land | |||||||||||||||
East | 1,544 | 130 | 445 | 2,119 | $ | 216,622 | ||||||||||||||
West | 622 | 122 | 435 | 1,179 | 154,766 | |||||||||||||||
|
|
|
|
|
|
|
|
|
| |||||||||||
Subtotal U.S. | 2,166 | 252 | 880 | 3,298 | $ | 371,388 | ||||||||||||||
Canada (2) | 822 | 23 | 63 | 908 | 82,999 | |||||||||||||||
|
|
|
|
|
|
|
|
|
| |||||||||||
Total | 2,988 | 275 | 943 | 4,206 | $ | 454,387 | ||||||||||||||
|
|
|
|
|
|
|
|
|
| |||||||||||
| (1) | Includes homes sold but not yet started |
| (2) | Does not include unconsolidated joint ventures. |
11
A significant portion of our Canada homes in inventory relate to our High-Rise division. The following table summarizes the size and status of the active projects of our High-Rise division, as of December 31, 2013:
| Ultra | Yorkland | Garden Court | Couture | Water- scapes | Encore | Lago | Picasso | |||||||||||||||||||||||||
Ownership by Monarch Corporation | 100.0 | % | 100.0 | % | 100.0 | % | 50.0 | % | 50.0 | % | 50.0 | % | 50.0 | % | 50.0 | % | ||||||||||||||||
Units in the project | 423 | 402 | 186 | 476 | 344 | 403 | 436 | 401 | ||||||||||||||||||||||||
Total firm offers as of Dec. 31, 2013 | 422 | 399 | 170 | 474 | 335 | 400 | 378 | 367 | ||||||||||||||||||||||||
Percentage sold | 99.8 | % | 99.3 | % | 91.4 | % | 99.6 | % | 97.4 | % | 99.3 | % | 86.7 | % | 91.5 | % | ||||||||||||||||
Launch date | May 08 | Apr. 10 | Oct. 11 | Oct. 07 | Sep. 08 | Feb. 10 | Jun. 11 | Nov. 11 | ||||||||||||||||||||||||
| Actual | Expected | Expected | Actual | Expected | Actual | Expected | Expected | |||||||||||||||||||||||||
Occupancy | May 13 | Jun. 14 | Sep. 14 | Mar. 13 | Jun. 14 | Sep. 13 | Sep. 16 | Jun. 16 | ||||||||||||||||||||||||
The table above does not include data for projects where selling efforts have commenced but financial viability has yet to be achieved.
Warranty Program
U.S. Operations - We offer warranties on homes that generally provide for limited one-year warranties to cover various defects in workmanship or materials or to cover structural construction defects. We may also offer a longer structural warranty in certain markets or to comply with regulatory requirements. Warranty reserves are established as homes close in an amount estimated to be adequate to cover expected costs of materials and outside labor during warranty periods. Our warranty reserves are based on factors that include an actuarial study for structural warranty, historical and anticipated warranty claims, trends related to similar product types, number of home closings, and geographical areas. The structural warranty is carried by Beneva Indemnity Company, one of our wholly owned subsidiaries. We also provide third-party warranty coverage on homes where required by Federal Housing Administration or Veterans Administration lenders.
Canadian Operations - We offer a limited warranty that generally provides for seven years of structural coverage; two years of coverage for water penetration, electrical, plumbing, heating, and exterior cladding defects; and one year of coverage for workmanship and materials. We are responsible for performing all of the work during the warranty period. As a result, warranty reserves are established as homes close in an amount estimated to be adequate to cover expected costs of materials and labor during warranty periods. The warranty reserves are determined using historical experience and trends related to similar product types, and number of home closings.
Sales and Marketing
Our marketing program calls for a balanced approach of corporate support and local expertise to attract potential homebuyers in a focused, efficient and cost-effective manner. Our sales and marketing team provides a generalized marketing framework across our regional operations as well as sales training to our local teams. Our divisional sales and marketing teams utilize local media and marketing streams to deliver a unique message that is relevant to our targeted consumer groups in each market.
Our goal is to identify the preferences of our target customer and demographic groups and offer them innovative, high-quality products that are efficient and profitable to build. To achieve this goal, we conduct extensive market research to determine preferences of our customer groups. We do not use "off the shelf" industry-standard customer groups (which tend to focus on classification by price point) in our marketing programs. Instead, through extensive and targeted market research, we have identified seven consumer groups by focusing on particular lifestyle preferences, tastes and other attributes of our customer base. Our group classification, includes four categories of couples or singles, such as our "Fancy Nesters" customers, and three categories of families, such as our "Parks and Prestige" customers.
We have gathered data regarding each group's specific consumer preferences. Our approach to customer group identification guides all of our operations from the initial land acquisition through to our design, building, marketing and
12
delivery of homes and our ongoing after-sales customer service. Among our peers, we believe we are at the forefront of directed marketing strategies, as evidenced by our highly-trafficked internet site as well as our strategic partnership at the Innoventions Dream Home in the Disneyland ® Resort in California.
The central element of our marketing platform is our web presence at www.taylormorrison.com, www.monarchgroup.net and www.darlinghomes.com (none of which is a part of this Annual Report). The main purpose of these websites is to direct potential customers to one of our sales teams. Customers are also able to use the websites to make inquiries and to receive a prompt response from one of our "Internet Home Consultants." The websites are fully integrated with our customer relationship management ("CRM") system. By analyzing the content of the CRM, we are able to focus our lead generation programs to deliver high-quality sales leads. With these leads we are better able to increase sale conversion rates and lower marketing costs.
We use furnished model homes as a marketing tool to demonstrate to prospective homebuyers the advantages of the designs and features of our homes. We generally employ or contract with interior and landscape designers who create attractive model homes that highlight the features and options available for the product line within a project. We generally build between one and three model homes for each active selling community, depending upon the number of homes to be built in the project and the products to be offered. At December 31, 2013, we owned 275 model homes.
In Canada, our homes are only sold by third party brokers who are paid a sales commission based on the price of the home. In the U.S., our homes generally are sold by our commissioned employees who typically work primarily from a sales office located in one of the model homes for each project. We also employ a team of internet sales associates who offer assistance to potential buyers viewing our products over the Internet. At December 31, 2013, we had approximately 330 full-time sales and marketing personnel. Our goal is to ensure that our sales force has extensive knowledge of our housing product, our energy efficient features, our sales strategies and mortgage options, and community dynamics, in order to fully execute our marketing message. To achieve this goal, we train our sales associates and conduct regular meetings to update them on items such as our products, sales techniques, competitive products in the area, financing availability and credit score repair opportunities. Our sales associates are licensed real estate agents where required by law and assist our customers in adding available customization features to their homes, which we design to appeal to local consumer demands. Third-party brokers who sell our homes are usually paid a sales commission based on the price of the home. We mainly contract with third-party design studios that specialize in assisting our homebuyers with options and upgrades to personalize their homes. Utilizing these third-party design studios allows us to manage our overhead and costs more efficiently. We may also offer various sales incentives, including price concessions, assistance with closing costs, and landscaping or interior upgrades, to attract buyers. The use, types and amount of incentives depends largely on existing economic and local competitive market conditions.
Competition
The homebuilding business is highly competitive and fragmented. We compete with numerous home builders of varying sizes, ranging from local to national in scope, some of which have greater sales and financial resources than we do. Sales of existing homes, whether by a homeowner or by a financial institution that has acquired a home through a foreclosure, also provide competition. We compete primarily on the basis of price, location, design, quality, service and reputation.
The homebuilding industry has historically been subject to significant volatility. We may be at a competitive disadvantage with regard to certain of our national competitors whose operations are more geographically diversified than ours, as these competitors may be better able to withstand any future regional downturn in the housing market. In addition, some of our national competitors are larger than we are and may have greater financial and operational resources than we do. This may give our competitors an advantage in marketing their products, securing materials and labor at lower prices and allowing their homes to be delivered to customers more quickly and at more favorable prices, as discussed under Risk Factors in Item 1.A of this Annual Report.
In order to maximize our sales volumes, profitability and product strategy, we strive to understand our competition and their pricing, product and sales volume strategies and results. In recent years, market conditions in the U.S. have also led to a large number of foreclosed and short sale homes being offered for sale, which has increased competition and has affected pricing. However, we have taken a proactive approach to distancing ourselves from highly affected submarkets, enabling us to drive sales in our markets without competing as directly with foreclosures.
13
Across our U.S. markets, we have seen reduced competition from small and mid-sized private builders who had been competitors in the new home market. We believe that access to and cost of capital for these private builders has been significantly constrained; however, private builders in the Canadian markets are well capitalized.
Seasonality
Our business is seasonal. We have historically experienced, and in the future expect to continue to experience, variability in our results on a quarterly basis. We generally have more homes under construction, close more homes and have greater revenues and operating income in the third and fourth quarters of the year. Therefore, although new home contracts are obtained throughout the year, a significant portion of our home closings occur during the third and fourth calendar quarters. Our revenue therefore may fluctuate significantly on a quarterly basis and we must maintain sufficient liquidity to meet short-term operating requirements. Factors expected to contribute to these fluctuations include:
| • | the timing of the introduction and start of construction of new projects; |
| • | the timing of project sales; |
| • | the timing of closings of homes, condominium units, lots and parcels; |
| • | our ability to continue to acquire land and options on that land on acceptable terms; |
| • | the timing of receipt of regulatory approvals for development and construction; |
| • | the condition of the real estate market and general economic conditions in the areas in which we operate; |
| • | mix of homes closed; |
| • | construction timetables; |
| • | the prevailing interest rates and the availability of financing, both for us and for the purchasers of our homes; |
| • | the cost and availability of materials and labor; and |
| • | weather conditions in the markets we build in. |
As a result of seasonal activity, our quarterly results of operation and financial position are not necessarily representative of the results we expect at year end. We expect this seasonal pattern to continue.
Mortgage Operations
TMHF provides a number of mortgage-related services to our homebuilding customers through its mortgage lending operations. The main strategic purpose of TMHF in our business is:
| • | to utilize finance as a sales tool as part of the purchase process to ensure a consistent customer experience and assist in maintaining production efficiency; and |
| • | to control and assist in determining our backlog quality and to better manage projected closing and delivery dates for our customers. |
As of January 1, 2011, in response to U.S. federal regulatory changes, TMHF transitioned to operating as a full lender (previously TMHF operated as a table-funded lender) and conducting its business as a Federal Housing Authority ("FHA") Full Eagle lender. TMHF funds mortgage loans utilizing a warehouse line facility. Revenue is earned through origination and processing fees combined with service release premiums earned in the secondary market once the loans are sold to investors. We typically seek to hold loans on our books for approximately 20 days before selling them to the secondary market.
14
The following details the number of loans closed, the aggregate value and capture rate on our loans for the last three years:
| TMHF Closed Loans | Aggregate Loan Volume (in millions) | Capture Rate | ||||||||||
December 31, 2013 | 2,828 | $ | 845.3 | 78 | % | |||||||
December 31, 2012 | 2,022 | 529.7 | 84 | |||||||||
December 31, 2011 | 1,512 | 374.5 | 83 | |||||||||
Our mortgage capture rate represents the percentage of our U.S. homes sold to a purchaser that utilized a mortgage, for which the borrower obtained such mortgage from TMHF or one of our preferred third party lenders. Our capture rate decreased in 2013 as we transitioned our Darling operations from a legacy provider to TMHF. In 2013 and 2012 the average FICO score of customers who obtained mortgages through TMHF was 739 and 738, respectively.
TMHF competes with other mortgage lenders, including national, regional and local mortgage bankers and other financial institutions. While many large homebuilders are affiliated with a single lender, TMHF utilizes a multi-lender correspondent platform which gives us increased flexibility when placing loans with investors. During the downturn, during which time this structure had limited correspondent lenders, TMHF continued to strengthen its relationships with its existing lender sources. This created stability and consistency in our processes and delivery of funding. Although we do not benefit from the secondary market segment of our mortgage transactions, we have the benefits of utilizing our lender's underwriting and funding platforms. Along with reduced underwriting risk of the legacy pipeline, we believe this advantage has made us stronger and more resilient than many of our peers in uncertain economic conditions. Due to the historically low interest rate environment, many banks are focused on existing home refinance business and government modification/refinance programs, while our focus and expertise remains dedicated to the financing of new home construction. While many builder-owned mortgage companies sustained significant losses from repurchase demands, TMHF did not suffer losses comparable to those of many of its peers, due to the unique multi-lender platform and mitigated exposure to repurchases and buy-backs.
Regulation, Environmental, Health and Safety Matters
Regulatory
We are subject to various local, state, provincial and federal statutes, ordinances, rules and regulations concerning zoning, building design, construction and similar matters, including local regulations that impose restrictive zoning and density requirements in order to limit the number of homes that can eventually be built within the boundaries of a particular property or locality. In a number of our markets, there has been an increase in state, provincial and local legislation authorizing the acquisition of land as dedicated open space, mainly by governmental, quasi-public and non-profit entities. In addition, we are subject to various licensing, registration and filing requirements in connection with the construction, advertisement and sale of homes in our communities. The impact of these laws has been to increase our overall costs, and may have delayed the opening of communities or caused us to conclude that development of particular communities would not be economically feasible, even if any or all necessary governmental approvals were obtained. We also may be subject to periodic delays or may be precluded entirely from developing communities due to building moratoriums in one or more of the areas in which we operate. Generally, such moratoriums relate to insufficient water, power, drainage or sewage facilities or inadequate road capacity.
In order to secure certain approvals in some areas, we may be required to provide affordable housing at below market rental or sales prices. The impact on us depends on how the various state and local governments in the areas in which we engage, or intend to engage, in development implement their programs for affordable housing. To date, these restrictions have not had a material impact on us.
TMHF is subject to various state and federal statutes, rules and regulations, including those that relate to licensing, lending operations and other areas of mortgage origination and financing. The impact of those statutes, rules and regulations can increase our home buyers' cost of financing, increase our cost of doing business, as well as restrict our home buyers' access to some types of loans. In January 2013, the Consumer Financial Protection Bureau proposed a
15
number of new rules that became effective in January 2014, including but not limited to rules regarding the creation and definition of a "Qualified Mortgage", rules for lender practices regarding assessing borrowers' ability to repay, and limitations on certain fees and incentive arrangements. The effects of these rules upon their adoption could affect the availability and cost of mortgage credit. Other requirements provided for by the Dodd-Frank Act have not yet been finalized or implemented. The effect of such provisions on our financial services business will depend on the rules that are ultimately enacted.
In order for our homebuyers to finance their home purchases with FHA-insured, Veterans Administration ("VA")-guaranteed or U.S. Department of Agriculture ("USDA")-guaranteed mortgages, we are required to build such homes in accordance with the regulatory requirements of those agencies.
Some states have statutory disclosure requirements or other pre-approval requirements or limitations governing the marketing and sale of new homes. These requirements vary widely from state to state.
Some states require us to be registered as a licensed contractor, a licensed real estate broker and in some markets our sales agents are additionally required to be registered as licensed real estate agents.
Environmental
We also are subject to a variety of local, state, provincial and federal statutes, ordinances, rules and regulations concerning protection of public health and the environment (collectively, the "environmental laws"). The particular environmental laws that apply to any given community vary greatly according to the location and environmental condition of the site and the present and former uses of the site. Complying with these environmental laws may result in delays, may cause us to incur substantial compliance and other costs, and/or may prohibit or severely restrict development in certain environmentally sensitive regions or areas.
As part of the land acquisition due diligence process, we utilize environmental assessments to identify environmental conditions that may exist on potential acquisition properties. To date, environmental site assessments conducted at our properties have not revealed any environmental liability or compliance concerns that we believe would have a material adverse effect on our business, liquidity or results of operations, nor are we aware of any material environmental liability or concerns.
We manage compliance with federal, state, provincial and local environmental requirements at the division level with assistance from the corporate and regional legal departments, including environmental regulations related to U.S. Storm Water Pollution Prevention, U.S. Endangered Species Act, U.S. Wetlands Permitting, NPDES Permitting, Cultural Resources, dust control measures and state, provincial and local preservation ordinances.
Health and Safety
We are committed to maintaining high standards in health and safety at all of our sites, to ensure the safety of our team members, our trade partners, our customers and prospects and the general public. That commitment is tested through our health and safety audit system that includes comprehensive twice-yearly independent third-party inspections of selected sites covering all aspects of health and safety. A key area of focus is ensuring that site conditions meet exacting health and safety standards and that subcontractor performance throughout our operating areas meet or exceed expectations. All of our team members must complete an assigned curriculum of online safety courses each year. These courses vary according to job responsibility. In addition, groups such as construction and field personnel are required to attend additional training programs such as the Occupational Safety and Health Administration ("OSHA") 10-hour course, First-Aid and CPR.
Employees, Subcontractors and Consultants
As of December 31, 2013, we employed 1,259 full-time equivalent persons. Of these, 1,135 were engaged in corporate and homebuilding operations, and the remaining 124 were engaged in mortgage services. As of December 31, 2013, we were subject to no collective bargaining agreements. We consider our employee relations to be good.
16
We act solely as a general contractor, and all construction operations are supervised by our project managers and field superintendents who manage third party subcontractors. We use independent consultants and contractors for architectural, engineering, advertising and some legal services, and we strive to maintain good relationships with our subcontractors and independent consultants and contractors.
Information Technology
We have a centralized information technology organization with its core team located at our corporate headquarters in Scottsdale, augmented with field support technicians in key locations across the U.S. and Canada. Our approach to information technology is to continuously simplify our information technology platform and consolidate and standardize applications. We believe a common application platform enables the sharing of ideas and rapid implementation of process improvements and best practices across the entire company. All back-office operations in the U.S. and Canada use a fully integrated, industry recognized enterprise resource planning package. Marketing and field sales utilize a leading CRM solution that tracks leads and prospects from all sources and manages the customer communication process from lead creation through the buying process and beyond the post-warranty period. Field operations teams collaborate with the supply chain to schedule and manage development and construction projects with a set of standard and widely used homebuilding industry solutions.
Intellectual Property
We own certain logos and trademarks that are important to our overall branding and sales strategy. Our consumer logos are designed to draw on a recognized homebuilding heritage while emphasizing a customer-centric focus.
| ITEM 1A. | RISK FACTORS |
Risks related to our industry and our business
Our business is cyclical and is significantly affected by changes in general and local economic conditions.
Our business can be substantially affected by adverse changes in general economic or business conditions that are outside of our control, including changes in:
| • | short- and long-term interest rates; |
| • | the availability and cost of financing for homebuyers; |
| • | consumer confidence generally and the confidence of potential homebuyers in particular; |
| • | the ability of existing homeowners to sell their existing homes at prices that are acceptable to them; |
| • | U.S., Canadian and global financial system and credit markets, including stock market and credit market volatility; |
| • | private and federal mortgage financing programs and federal, state and provincial regulation of lending practices; |
| • | federal, state and provincial income tax provisions, including provisions for the deduction of mortgage interest payments; |
| • | housing demand from population growth and demographic changes (including immigration levels and trends in urban and suburban migration); |
| • | demand from overseas buyers for our homes (particularly in our GTA market), which may fluctuate according to economic circumstances in overseas markets; |
| • | the supply of available new or existing homes and other housing alternatives, such as apartments and other residential rental property; |
| • | employment levels and job and personal income growth and household debt-to-income levels; |
| • | real estate taxes; and |
| • | the supply of developable land in our markets in the U.S. and Canada. |
17
Adverse changes in these conditions may affect our business nationally or may be more prevalent or concentrated in particular regions or localities in which we operate. During the recent downturn, unfavorable changes in many of the above factors negatively affected all of the markets we serve, although to a more limited extent in Canada than in the U.S. Economic conditions in all our markets continue to be characterized by levels of uncertainty. Any deterioration in economic conditions or continuation of uncertain economic conditions would have a material adverse effect on our business.
Adverse changes in economic conditions can cause demand and prices for our homes to diminish or cause us to take longer to build our homes and make it more costly for us to do so. We may not be able to recover these increased costs by raising prices because of weak market conditions and because the price of each home we sell is usually set several months before the home is delivered, as many customers sign their home purchase contracts before construction begins. The potential difficulties described above could impact our customers' ability to obtain suitable financing and cause some homebuyers to cancel or refuse to honor their home purchase contracts altogether.
The homebuilding industry in the U.S. has recently undergone a significant downturn, and the likelihood of a full recovery is uncertain in the current state of the economy. A slowdown in our business in the U.S. or a downturn in Ontario, Canada could have additional adverse effects on our operating results and financial condition.
In connection with the most recent downturn in the U.S. housing market, we incurred substantial losses, after impairments, in our U.S. operations during 2008 and 2009. Although the U.S. housing market continues to recover, we cannot predict the extent of further recovery or its timing. In addition, while the market for single-family homes and high-rise condominiums in Canada remained relatively stable during the U.S. downturn, the housing market in parts of Canada has lately shown signs of weakening. With slowing job growth relative to the recent past, ongoing global economic uncertainty and increasing units under construction, the GTA has seen a moderation in sales activity compared to prior periods. It is anticipated that Ontario housing starts could continue to moderate and average new home prices have remained relatively flat in 2013 and may remain flat in 2014. A significant weakening of the Ontario housing market could adversely affect our business.
Though we have taken steps to alleviate the impact of these conditions on our business, given the downturn in the homebuilding industry over the past several years and global economic uncertainty, there can be no guarantee that steps taken by us will continue to be effective, and to the extent the current economic environment does not improve or any improvement takes place over an extended period of time, our business, financial condition and results of operations may be adversely affected.
Changes to foreign currency exchange rates could adversely affect our earnings and net asset value.
We have businesses with exposure to foreign currency exchange risk in Canada. Changes in the $U.S.-$CAD exchange rate will affect the value of our reported earnings and the value of our assets and liabilities denominated in foreign currencies. For example, an increase in the value of the U.S. dollar compared to the Canadian dollar would reduce our Canadian dollar-denominated revenue when reported in U.S. dollars, our functional reporting currency. Our business, financial condition and operating results may be adversely affected by such exchange rate fluctuations.
An inability to obtain additional performance, payment and completion surety bonds and letters of credit could limit our future growth.
We are often required to provide performance, payment and completion and warranty/maintenance surety bonds or letters of credit to secure the completion of our construction contracts, development agreements and other arrangements. We have obtained facilities to provide the required volume of performance, payment and completion and warranty maintenance surety bonds and letters of credit for our expected growth in the medium term; however, unexpected growth may require additional facilities. We may also be required to renew or amend our existing facilities. Our ability to obtain additional performance, payment and completion and warranty/maintenance surety bonds and letters of credit primarily depends on our credit rating, capitalization, working capital, past performance, management expertise and certain external factors, including the capacity of the markets for such bonds. Performance, payment and completion and warranty/maintenance surety bond and letter of credit providers consider these factors in addition to our performance and claims record and provider-specific underwriting standards, which may change from time to time.
18
If our performance record or our providers' requirements or policies change, if we cannot obtain the necessary consent from our lenders, or if the market's capacity to provide performance, payment and completion or warranty/maintenance bonds or letters of credit is not sufficient for any unexpected growth and we are unable to renew or amend our existing facilities on favorable terms or at all, we could be unable to obtain additional performance, payment and completion and warranty/maintenance surety bonds or letters of credit from other sources when required, which could have a material adverse effect on our business, financial condition and results of operations.
Higher cancellation rates of existing agreements of sale may have an adverse effect on our business.
Our backlog reflects sales contracts with our homebuyers for homes that have not yet been delivered. We have received a deposit from a homebuyer for each home reflected in our backlog, and generally we have the right, subject to certain exceptions, to retain the deposit if the homebuyer fails to comply with his or her obligations under the sales contract, including as a result of state and local law, the homebuyer's inability to sell his or her current home or the homebuyer's inability to make additional deposits required prior to the closing date. In addition, in our Canadian markets we have the right to retain the deposits and pursue the homebuyer for damages or specific performance in the event of a homebuyer's breach of the purchase and sale agreement. However, in the U.S., if prices for new homes decline, if competitors increase their use of sales incentives, if interest rates increase, if the availability of mortgage financing diminishes or if there is a downturn in local or regional economies or in the national economy, U.S. homebuyers may terminate their existing home purchase contracts with us in order to negotiate for a lower price or because they cannot, or will not, complete the purchase and our remedies generally do not extend beyond the retention of deposits as our liquidated damages.
Compared to the prevailing cancellation rates in the U.S., our experience has been that cancellations in Canada are less common due to differences in the Canadian economy and the laws of Ontario, which make it more difficult for purchasers to cancel their contracts. Although our cancellation rates for our homebuyers in the U.S. are now closer to long-term historical averages, cancellation rates may rise in the future. If uncertain economic conditions in the U.S. and Canada continue, if mortgage financing becomes less available or if current homeowners find it difficult to sell their current homes, more homebuyers may cancel their sales contracts with us. As a result, our financial condition may deteriorate and you may lose a portion of your investment.
In cases of cancellation, we remarket the home and usually retain any deposits we are permitted to retain. Nevertheless, the deposits may not cover the additional costs involved in remarketing the home, replacing installed options, reducing the sales price or increasing incentives on the completed home for greater marketability and carrying higher inventory. Further, depending on the stage of cancellation, a contract that is cancelled at the end of a phase may cause additional construction costs, roadway repairs or added nuisances to existing homeowners for the out of sequence construction or modification of the one home. Significant numbers of cancellations could adversely affect our business, financial condition and results of operations.
The homebuilding and mortgage services industries are highly competitive and, if our competitors are more successful or offer better value to our customers, our business could decline.
We operate in a very competitive environment which is characterized by competition from a number of other homebuilders in each market in which we operate. We compete with large national and regional homebuilding companies and with smaller local homebuilders for land, financing, affiliated or in-house services, raw materials and skilled management, volume discounts, local REALTOR ® and labor resources. We also compete with the resale, or "previously owned," home market which has increased significantly due to the large number of homes that have been foreclosed on or could be foreclosed on due to the recent economic downturn. Increased competition could cause us to increase our selling incentives and reduce our prices. An oversupply of homes available for sale and the heavy discounting of home prices by some of our competitors have adversely affected demand for our homes and the results of our operations in the past and could do so again in the future. Our Mortgage Operations business competes with other mortgage lenders and title companies, including national, regional and local mortgage banks and other financial institutions, some of which are subject to fewer government regulations. Mortgage lenders who are subject to fewer regulations or have greater access to capital or different lending criteria may be able to offer more attractive financing to potential customers. If we are unable to compete effectively in our homebuilding and mortgage services markets, our business could decline disproportionately to our competitors, and our results of operations and financial condition could be adversely affected.
19
If homebuyers are not able to obtain suitable financing, our results of operations may decline.
A substantial majority of our homebuyers finance their home purchases through lenders that provide mortgage financing. The availability of mortgage credit remains constrained in the U.S., due to various regulatory changes and lower risk appetite by lenders, with many lenders requiring increased levels of financial qualification, including lenders adhering to the new "Qualified Mortgage" requirements and ability to repay standard, and lending lower multiples of income. Investors and first-time homebuyers are generally more affected by the availability of financing than other potential homebuyers. These buyers are a key source of our demand. A limited availability of home mortgage financing may adversely affect the volume of our home sales and the sales prices we achieve in the U.S.
During the last five fiscal years, the mortgage lending industry in the U.S. has experienced significant instability, beginning with increased defaults on subprime loans and other nonconforming loans and compounded by expectations of increasing interest payments requirements and further defaults. Lending requirements and standards remain tightened and as a result, investor demand for mortgage loans and mortgage-backed securities has declined. The liquidity provided by government sponsored entities, such as Fannie Mae, Freddie Mac, the FHA and Veterans Administration, to the mortgage industry has been very important to the housing market. These entities have required substantial injections of capital from the federal government and may require additional government support in the future. Several federal government officials have proposed changing the nature of the relationship between Fannie Mae and Freddie Mac and the federal government and even nationalizing or eliminating these entities entirely. If Fannie Mae and Freddie Mac were dissolved or if the federal government determined to stop providing liquidity support to the mortgage market, there would be a reduction in the availability of the financing provided by these institutions. Any such reduction would likely have an adverse effect on interest rates, mortgage availability and our sales of new homes. The FHA insures mortgage loans that generally have lower loan payment requirements and qualification standards compared to conventional guidelines, and as a result, continue to be a particularly important source for financing the sale of our homes. In recent years, lenders have taken a more conservative view of FHA guidelines causing significant tightening of borrower eligibility for approval. Further restrictions are expected on FHA-insured loans, including limitations on seller-paid closing costs and concessions. This or any other restriction may negatively affect the availability or affordability of FHA financing, which could adversely affect our ability to sell homes in the U.S. In addition, changes in federal and provincial regulatory and fiscal policies aimed at aiding the home buying market (including a repeal of the home mortgage interest tax deduction) may also negatively affect potential homebuyers' ability to purchase homes.
In each of our markets, decreases in the availability of credit and increases in the cost of credit adversely affect the ability of homebuyers to obtain or service mortgage debt. Even if potential homebuyers do not themselves need mortgage financing, where potential homebuyers must sell their existing homes in order to buy a new home, increases in mortgage costs, lack of availability of mortgages and/or regulatory changes could prevent the buyers of potential homebuyers' existing homes from obtaining a mortgage, which would result in our potential customers' inability to buy a new home. Similar risks apply to those buyers who are awaiting delivery of their homes and are currently in backlog. The success of homebuilders depends on the ability of potential homebuyers to obtain mortgages for the purchase of homes. If our customers (or potential buyers of our customers' existing homes) cannot obtain suitable financing our sales and results of operations could be adversely affected.
Any increase in unemployment or underemployment may lead to an increase in the number of loan delinquencies and property repossessions and have an adverse impact on us.
In the U.S., the unemployment rate was 6.6% as of January 2014, according to the U.S. Bureau of Labor Statistics ("BLS"). In addition, the labor force participation rate reported by the BLS has been declining, from 66.2% in January 2008 to 63.0% in January 2014, potentially reflecting an increased number of "discouraged workers" who have left the labor force. People who are not employed, are underemployed, who have left the labor force or are concerned about the loss of their jobs are less likely to purchase new homes, may be forced to try to sell the homes they own and may face difficulties in making required mortgage payments. Therefore, any increase in unemployment or underemployment may lead to an increase in the number of loan delinquencies and property repossessions and have an adverse impact on us both by reducing demand for the homes we build and by increasing the supply of homes for sale.
20
Increases in taxes, government fees or interest rates could prevent potential customers from buying our homes and adversely affect our business or financial results.
Significant expenses of owning a home, including mortgage interest and real estate taxes, generally are deductible expenses for an individual's U.S. federal, and in some cases, state income taxes, subject to various limitations under current tax law and policy. Mortgage interest and real estate taxes are not deductible for an individual's federal or provincial income taxes in Canada. If the U.S. federal government or a state government changes its income tax laws, as has been discussed from time to time, to eliminate, limit or substantially modify these income tax deductions, the after-tax cost of owning a new home would increase for many of our potential customers. The resulting loss or reduction of homeowner tax deductions, if such tax law changes were enacted without offsetting provisions, or any other increase in any taxes affecting homeowners, would adversely impact demand for and sales prices of new homes.
Increases in property tax rates by local governmental authorities, as experienced in response to reduced federal, state and provincial funding, can adversely affect the ability of potential customers to obtain financing or their desire to purchase new homes. Fees imposed on developers to fund schools, open spaces, road improvements, and/or provide low and moderate income housing, could increase our costs and have an adverse effect on our operations. In addition, increases in sales taxes (such as the Ontario harmonized sales tax initiative implemented in July 2010 by the Government of Ontario combining the 5% Canadian federal goods and services tax and the 8% Ontario provincial sales tax with certain abatement, rebate and transition rules for new housing) could adversely affect our potential customers who may consider those costs in determining whether to make a new home purchase and decide, as a result, not to purchase one of our homes.
In addition, increases in interest rates as a result of changes to U.S. and Canadian monetary policies could significantly increase the costs of owning a home, which in turn would adversely impact demand for and sales prices of homes and the ability of potential customers to obtain financing and adversely affect our business, financial condition and operating results.
Inflation could adversely affect our business and financial results, particularly in a period of oversupply of homes.
Inflation can adversely affect us by increasing costs of land, materials and labor. In the event of an increase in inflation, we may seek to increase the sales prices of homes in order to maintain satisfactory margins. However, an oversupply of homes relative to demand and home prices being set several months before homes are delivered may make any such increase difficult or impossible. In addition, inflation is often accompanied by higher interest rates, which historically had a negative impact on housing demand. In such an environment, we may not be able to raise home prices sufficiently to keep up with the rate of inflation and our margins could decrease. Moreover, the cost of capital increases as a result of inflation and the purchasing power of our cash resources declines. Current or future efforts by the government to stimulate the economy may increase the risk of significant inflation and its adverse impact on our business or financial results.
Our quarterly operating results may fluctuate because of the seasonal nature of our business and other factors.
Our quarterly operating results generally fluctuate by season and also because of the uneven delivery schedule of certain of our products and communities, such as high-rise condominiums in the GTA.
Historically, a larger percentage of our agreements of sale in the U.S. have been entered into in the winter and spring. Weather-related problems, typically in the fall, late winter and early spring, may delay starts or closings and increase costs and thus reduce profitability. Seasonal natural disasters such as hurricanes, tornadoes, floods and fires could cause delays in the completion of, or increase the cost of, developing one or more of our communities, causing an adverse effect on our sales and revenues.
In many cases, we may not be able to recapture increased costs by raising prices because we set our prices up to 12 months in advance of delivery upon signing the home sales contract. In the case of high-rise condominium sales, purchase agreements are signed up to three years in advance of delivery. In addition, deliveries may be staggered over different periods of the year and may be concentrated in particular quarters. Our quarterly operating results may fluctuate because of these factors.
21
Negative publicity may affect our business performance and could affect our stock price.
Unfavorable media related to our industry, company, brands, marketing, personnel, operations, business performance, or prospects may affect our stock price and the performance of our business, regardless of its accuracy or inaccuracy. Our success in maintaining, extending and expanding our brand image depends on our ability to adapt to a rapidly changing media environment. Adverse publicity or negative commentary on social media outlets, such as blogs, websites or newsletters, could hurt operating results, as consumers might avoid brands that receive bad press or negative reviews. Negative publicity may result in a decrease in our operating results.
Homebuilding is subject to home warranty and construction defect claims in the ordinary course of business that can be significant.
As a homebuilder, we are subject to home warranty and construction defect claims arising in the ordinary course of business. There can be no assurance that any developments we undertake will be free from defects once completed. Construction defects may occur on projects and developments and may arise during a significant period of time after completion. Defects arising on a development attributable to us may lead to significant contractual or other liabilities.
As a consequence, we maintain products and completed operations excess liability insurance, obtain indemnities and certificates of insurance from subcontractors generally covering claims related to damages resulting from faulty workmanship and materials, and create warranty and other reserves for the homes we sell based on historical experience in our markets and our judgment of the risks associated with the types of homes built. Although we actively monitor our insurance reserves and coverage, because of the uncertainties inherent to these matters, we cannot provide assurance that our insurance coverage, our subcontractor arrangements and our reserves will be adequate to address all of our warranty and construction defect claims in the future. In addition, contractual indemnities can be difficult to enforce. We may also be responsible for applicable self-insured retentions and some types of claims may not be covered by insurance or may exceed applicable coverage limits. Additionally, the coverage offered by and the availability of products and completed operations excess liability insurance for construction defects is currently limited and costly. This coverage may be further restricted or become more costly in the future.
In 2005 and 2006, we discontinued requiring insurance policies from most of our contractors in California and instead adopted an Owner Controlled Insurance Plan ("OCIP") for general liability exposures of most subcontractors (excluding consultants), as a result of the inability of subcontractors to procure acceptable insurance coverage to meet our requirements. Under the OCIP, subcontractors are effectively insured by us. We have assigned risk retentions and bid deductions to our subcontractors based on their risk category. These deductions are used to fund future liabilities.
Unexpected expenditures attributable to defects or previously unknown sub-surface conditions arising on a development project may have a material adverse effect on our business, financial condition and operating results. In addition, severe or widespread incidents of defects giving rise to unexpected levels of expenditure, to the extent not covered by insurance or redress against sub-contractors, may adversely affect our business, financial condition and operating results.
Our reliance on contractors can expose us to various liability risks.
We rely on contractors in order to perform the construction of our homes, and in many cases, to select and obtain raw materials. We are exposed to various risks as a result of our reliance on these contractors and their respective subcontractors and suppliers, including, as described above, the possibility of defects in our homes due to improper practices or materials used by contractors, which may require us to comply with our warranty obligations and/or bring a claim under an insurance policy. Several other homebuilders have received inquiries from regulatory agencies concerning whether homebuilders using contractors are deemed to be employers of the employees of such contractors under certain circumstances. Although contractors are independent of the homebuilders that contract with them under normal management practices and the terms of trade contracts and subcontracts within the homebuilding industry, if regulatory agencies reclassify the employees of contractors as employees of homebuilders, homebuilders using contractors could be responsible for wage, hour and other employment-related liabilities of their contractors. In the event that a regulatory agency reclassified the employees of our contractors as our own employees, we could be responsible for wage, hour and other employment-related liabilities of our contractors.
22
Failure to manage land acquisitions, inventory and development and construction processes could result in significant cost overruns or errors in valuing sites.
We own and purchase a large number of sites each year and are therefore dependent on our ability to process a very large number of transactions (which include, among other things, evaluating the site purchase, designing the layout of the development, sourcing materials and sub-contractors and managing contractual commitments) efficiently and accurately. Errors by employees, failure to comply with regulatory requirements and conduct of business rules, failings or inadequacies in internal control processes, equipment failures, natural disasters or the failure of external systems, including those of our suppliers or counterparties, could result in operational losses that could adversely affect our business, financial condition and operating results and our relationships with our customers.
In certain circumstances, a grant of entitlements or development agreement with respect to a particular parcel of land may include restrictions on the transfer of such entitlements to a buyer of such land, which may increase our exposure to decreases in the price of such entitled land by restricting our ability to sell it for its full entitled value. In addition, inventory carrying costs can be significant and can result in reduced margins or losses in a poorly performing community or market. In recent periods of market weakness, we have sold homes and land for lower margins or at a loss and we have recorded significant inventory impairment charges, and such conditions may recur. The recording of a significant inventory impairment could negatively affect our reported earnings per share and negatively impact the market perception of our business.
If land and lots are not available at competitive prices, our sales and results of operations could be adversely affected.
Our long-term profitability depends in large part on the price at which we are able to obtain suitable land and lots for the development of our communities. Increases in the price (or decreases in the availability) of suitable land and lots could adversely affect our profitability. Moreover, changes in the general availability of desirable land, competition for available land and lots, limited availability of financing to acquire land and lots, zoning regulations that limit housing density, environmental requirements and other market conditions may hurt our ability to obtain land and lots for new communities at prices that will allow us to be profitable. If the supply of land and lots that are appropriate for development of our communities becomes more limited because of these factors, or for any other reason, the cost of land and lots could increase and the number of homes that we are able to build and sell could be reduced, which could adversely affect our results of operations and financial condition.
If the market value of our land inventory decreases, our results of operations could be adversely affected by impairments and write-downs.
The market value of our land and housing inventories depends on market conditions. We acquire land for expansion into new markets and for replacement of land inventory and expansion within our current markets. There is an inherent risk that the value of the land owned by us may decline after purchase. The valuation of property is inherently subjective and based on the individual characteristics of each property. We may have acquired options on or bought and developed land at a cost we will not be able to recover fully or on which we cannot build and sell homes profitably. In addition, our deposits for lots controlled under option or similar contracts may be put at risk. Factors such as changes in regulatory requirements and applicable laws (including in relation to building regulations, taxation and planning), political conditions, the condition of financial markets, both local and national economic conditions, the financial condition of customers, potentially adverse tax changes, and interest and inflation rate fluctuations subject valuations to uncertainty. Moreover, all valuations are made on the basis of assumptions that may not prove to reflect economic or demographic reality. If housing demand decreases below what we anticipated when we acquired our inventory, our profitability may be adversely affected and we may not be able to recover our costs when we sell and build houses.
Due to economic conditions in the U.S. in recent years, including increased amounts of home and land inventory that entered certain U.S. markets from foreclosure sales or short sales, the market value of our land and home inventory was negatively impacted prior to 2011. Write-downs and impairments have had an adverse effect (and any further write-downs may also have an adverse effect) on our business, financial condition and operating results. We recorded no inventory impairments in 2011, 2012 or the year ended December 31, 2013. In 2011, the carrying value of all of our land was adjusted to its fair market value as of the date of the Acquisition. We regularly review the value of our land holdings
23
and continue to review our holdings on a periodic basis. Further material write-downs and impairments in the value of our inventory may be required, and we may in the future sell land or homes at a loss, which could adversely affect our results of operations and financial condition.
If we experience shortages in labor supply, increased labor costs or labor disruptions, there could be delays or increased costs in developing our communities or building homes, which could adversely affect our operating results.
We require a qualified labor force to develop our communities and build our homes. Access to qualified labor may be affected by circumstances beyond our control, including:
| • | work stoppages resulting from labor disputes; |
| • | shortages of qualified trades people, such as carpenters, roofers, electricians and plumbers, especially in our key markets in the southwest U.S.; |
| • | changes in laws relating to union organizing activity; |
| • | changes in immigration laws and trends in labor force migration; and |
| • | increases in sub-contractor and professional services costs. |
Any of these circumstances could give rise to delays in the start or completion of, or could increase the cost of, developing one or more of our communities and building homes. We may not be able to recover these increased costs by raising our home prices because the price for each home is typically set months prior to its delivery pursuant to sales contracts with our homebuyers. In such circumstances, our operating results could be adversely affected. Additionally, market and competitive forces may also limit our ability to raise the sales prices of our homes.
Failure to recruit, retain and develop highly skilled, competent people at all levels, including finding suitable subcontractors, may have a material adverse effect on our standards of service.
Key employees, including management team members, are fundamental to our ability to obtain, generate and manage opportunities. Key employees working in the homebuilding and construction industries are highly sought after. Failure to attract and retain such personnel or to ensure that their experience and knowledge is not lost when they leave the business through retirement, redundancy or otherwise may adversely affect the standards of our service and may have an adverse impact on our business, financial conditions and operating results. In addition, we do not maintain key person insurance in respect of any member of our senior management team. The loss of any of our management members or key personnel could adversely impact our business, financial condition and operating results.
The vast majority of our work carried out on site is performed by subcontractors. The difficult operating environment over the last six years in the U.S. has resulted in the failure of some subcontractors' businesses and may result in further failures. In addition, reduced levels of homebuilding in the U.S. have led to some skilled tradesmen leaving the industry to take jobs in other sectors. If subcontractors are not able to recruit sufficient numbers of skilled employees, our development and construction activities may suffer from delays and quality issues, which would also lead to reduced levels of customer satisfaction.
During the recent downturn, we had to reduce our number of employees, which may have resulted in a loss of knowledge that could be detrimental to our business and our ability to manage future business opportunities. Our margins, and accordingly our business, financial conditions and operating results, may be adversely affected.
Government regulations and legal challenges may delay the start or completion of our communities, increase our expenses or limit our homebuilding or other activities, which could have a negative impact on our results of operations.
The approval of numerous governmental authorities must be obtained in connection with our development activities, and these governmental authorities often have broad discretion in exercising their approval authority. We incur substantial costs related to compliance with legal and regulatory requirements. Any increase in legal and regulatory requirements may cause us to incur substantial additional costs, or in some cases cause us to determine that the property is not feasible
24
for development. Various local, provincial, state and federal statutes, ordinances, rules and regulations concerning building, health and safety, site and building design, environment, zoning, sales and similar matters apply to and/or affect the housing industry. We are also subject to various fees and charges of government authorities designed to defray the cost of providing certain governmental services and improvements.
Municipalities may restrict or place moratoriums on the availability of utilities, such as water and sewer taps. If municipalities in which we operate take such actions, it could have an adverse effect on our business by causing delays, increasing our costs or limiting our ability to operate in those municipalities.
Certain states, cities and counties in which we operate have in the past approved, or approved for inclusion on their ballot, various "slow growth" or "no growth" initiatives and other ballot measures that could negatively impact the availability of land and building opportunities within those localities. A similar initiative in Ontario, Canada known as "smart growth" could also negatively impact our Canadian operations. The Ontario smart growth initiatives were implemented in 2005 pursuant to the "Places to Grow Act" and the "Greenbelt Act". The legislation is designed to minimize urban sprawl, promote population density increases in cities and towns and protect the agricultural land and natural systems that surround the GTA, extending from Niagara Falls to Oshawa, Ontario, bordering Lake Ontario. The effect of the legislation is to restrict development on approximately 1.8 million acres of land. These measures may reduce our ability to open new home communities and to build and sell homes in the affected markets, including with respect to land we may already own, and create additional costs and administration requirements, which in turn may harm our future sales, margins and earnings. A further expansion of these measures or the adoption of new slow-growth, no-growth, "smart-growth" or other similar programs could exacerbate such risks. The above risks could have a material, adverse effect on our business and results of operations in Canada.
Environmental regulations can also have an adverse impact on the availability and price of certain raw materials, such as lumber.
In addition, there is a variety of new legislation being enacted, or considered for enactment at the federal, state and local level relating to energy and climate change. This legislation relates to items such as carbon dioxide emissions control and building codes that impose energy efficiency standards. New building code requirements that impose stricter energy efficiency standards could significantly increase our cost to construct homes. As climate change concerns continue to grow, legislation and regulations of this nature are expected to continue and become more costly to comply with. Similarly, energy-related initiatives affect a wide variety of companies throughout the U.S. and the world and because our operations are heavily dependent on significant amounts of raw materials, such as lumber, steel, and concrete, they could have an indirect adverse impact on our operations and profitability to the extent the manufacturers and suppliers of our materials are burdened with expensive cap and trade and similar energy related regulations.
Governmental regulation affects not only construction activities but also sales activities, mortgage lending activities and other dealings with consumers. In addition, it is possible that some form of expanded energy efficiency legislation may be passed by the U.S. Congress or federal agencies and certain state and provincial legislatures, which may, despite being phased in over time, significantly increase our costs of building homes and the sale price to our buyers, and adversely affect our sales volumes. We may be required to apply for additional approvals or modify our existing approvals because of changes in local circumstances or applicable law. Further, we may experience delays and increased expenses as a result of legal challenges to our proposed communities, whether brought by governmental authorities or private parties.
Our Mortgage Operations business may be adversely affected by changes in governmental regulation and other risks associated with acting as a mortgage lender.
Prior to January 1, 2011, TMHF operated as a mortgage broker, limiting TMHF's exposure to employee or third party fraud in the origination and processing of loan applications submitted to wholesale lending groups, and which may repurchase risk from previously closed loans. Since January 1, 2011, in response to new legislation and in order to operate competitively in the market, TMHF transitioned to full lender status. This change results in TMHF having the ability to originate, underwrite and fund mortgage transactions through correspondent lending relationships. While we intend for the loans that TMHF originates to typically be held for no more than 20 days before being sold on the secondary market, if TMHF is unable to sell loans into the secondary mortgage market or directly to large secondary
25
market loan purchasers such as Fannie Mae and Freddie Mac, TMHF would bear the risk of being a long-term investor in these originated loans. Mortgage lending is also subject to credit risks associated with the borrowers to whom the loans are extended and an increase in default rates could have a material and adverse effect on our business. Being required to hold loans on a long-term basis would also negatively affect our liquidity and could require us to use additional capital resources to finance the loans that TMHF is extending. In addition, although mortgage lenders under the mortgage warehouse facilities TMHF currently uses to finance our lending operations normally purchase our mortgages within 20 days of origination, if such mortgage lenders default under these warehouse facilities TMHF would be required to fund the mortgages then in the pipeline. In such case, amounts available under our Restated Revolving Credit Facility and cash from operations may not be sufficient to allow TMHF to provide financing required by our business during these times.
An obligation to commit our own funds to long-term investments in mortgage loans could, among other things, delay the time when we recognize revenues from home sales on our statements of operations. If, due to higher costs, reduced liquidity, heightened risk retention obligations and/or new operating restrictions or regulatory reforms related to or arising from compliance with new U.S. federal laws and regulations, residential consumer loan putback demands or internal or external reviews of its residential consumer mortgage loan foreclosure processes, or other factors or business decisions, TMHF could be unable to make loan products available to our homebuyers, and home sales and mortgage services results of operations may be adversely affected.
In addition, changes in governmental regulation with respect to mortgage lenders could adversely affect the financial results of this portion of our business. Our mortgage lending operations are subject to numerous federal, state and local laws and regulations. There have been numerous changes and proposed changes in these regulations as a result of the housing downturn. For example, in July 2010, the Dodd-Frank Wall Street Reform and Consumer Protection Act was enacted. Among other things, this legislation provides for minimum standards for mortgages and lender practices in making mortgages, limitations on certain fees, retention of credit risk, prohibition of certain tying arrangements and remedies for borrowers in foreclosure proceedings. In January 2013, the Consumer Financial Protection Bureau proposed a number of new rules that became effective in January 2014, including but not limited to rules regarding the creation and definition of a "Qualified Mortgage", rules for lender practices regarding assessing borrowers' ability to repay, and limitations on certain fees and incentive arrangements. The effects of these rules upon their adoption could affect the availability and cost of mortgage credit. Other requirements provided for by the Dodd-Frank Act have not yet been finalized or implemented. The effect of such provisions on our Mortgage Operations business will depend on the rules that are ultimately enacted. Any such changes or new enactments could adversely affect our financial condition and results of operations and the market perception of our business.
The prices of our mortgages could be adversely affected if we lose any of our important commercial relationships.
TMHF has longstanding relationships with members of the lender community from which its borrowers benefit. TMHF plans to continue with these relationships and use the correspondent lender platform as a part of its operational plan. If our relationship with any one or more of those banks deteriorates or if one or more of those banks decide to renegotiate or terminate existing agreements or otherwise exit the market, TMHF may be required to increase the price of our products, or modify the range of products TMHF offers, which could cause us to lose customers who may choose other providers based solely on the price or fees, which could adversely affect our financial condition and results of operations.
We may not be able to use certain deferred tax assets, which may result in our having to pay substantial taxes.
We have significant deferred tax assets, including net operating losses in the U.S. that could be used to offset earnings and reduce the amount of taxes we are required to pay. Our ability to use net operating losses to offset earnings is dependent on a number of factors, including applicable rules relating to the permitted carry back period for offsetting certain net operating losses against prior period earnings and the timing and amount of future taxable income.
26
Raw materials and building supply shortages and price fluctuations could delay or increase the cost of home construction and adversely affect our operating results.
The homebuilding industry has, from time to time, experienced raw material shortages and been adversely affected by volatility in global commodity prices. In particular, shortages and fluctuations in the price of concrete, drywall, lumber or other important raw materials could result in delays in the start or completion of, or increase the cost of, developing one or more of our residential communities.
In addition, the cost of petroleum products, which are used both to deliver our materials and to transport workers to our job sites, fluctuates and may be subject to increased volatility as a result of geopolitical events or accidents such as the Deepwater Horizon accident in the Gulf of Mexico. Changes in such costs could also result in higher prices for any product utilizing petrochemicals. These cost increases may have an adverse effect on our operating margin and results of operations. Furthermore, any such cost increase may adversely affect the regional economies in which we operate and reduce demand for our homes.
The geographic concentration of our operations subjects us to an increased risk of loss of revenue or decreases in the market value of our land and homes in these regions from factors which may affect any of these regions.
Our operations are concentrated in Ontario, Canada and California, Colorado, Arizona, Texas and Florida. Some or all of these regions could be affected by:
| • | severe weather; |
| • | natural disasters; |
| • | shortages in the availability or increased costs in obtaining land, equipment, labor or building supplies; |
| • | changes to the population growth rates and therefore the demand for homes in these regions; and |
| • | changes in the regulatory and fiscal environment. |
Due to the concentrated nature of our operations, negative factors affecting one or a number of these geographic regions at the same time could result in a relatively greater impact on our results of operations than they might have on other companies that have a more diversified portfolio of operations.
Changes to the population growth rates in certain of the markets in which we operate could affect the demand for homes in these regions.
Slower rates of population growth or population declines in our key markets, especially as compared to the high population growth rates in prior years, could affect the demand for housing, causing home prices in these markets to fall, and adversely affect our business, financial condition and operating results.
We participate in certain unconsolidated joint ventures where we may be adversely impacted by the failure of the unconsolidated joint venture or the other partners in the unconsolidated joint venture to fulfill their obligations.
We have investments in and commitments to certain unconsolidated joint ventures with unrelated strategic partners to acquire and develop land and, in some cases, build and deliver homes. To finance these activities, our unconsolidated joint ventures often obtain loans from third-party lenders that are secured by the unconsolidated joint venture's assets. In certain instances, we and the other partners in an unconsolidated joint venture provide guarantees and indemnities to lenders with respect to the unconsolidated joint venture's debt, which may be triggered under certain conditions when the unconsolidated joint venture fails to fulfill its obligations under its loan agreements.
In Canada, we have consistently used joint ventures as a means of acquiring land. Where we do not have a controlling interest in these unconsolidated joint ventures, we depend heavily on the other partners in each unconsolidated joint venture to both cooperate and make mutually acceptable decisions regarding the conduct of the business and affairs of the unconsolidated joint venture and ensure that they, and the unconsolidated joint venture, fulfill their respective obligations to us and to third parties. If the other partners in our unconsolidated joint ventures do not provide such
27
cooperation or fulfill these obligations due to their financial condition, strategic business interests (which may be contrary to ours), or otherwise, we may be required to spend additional resources (including payments under the guarantees we have provided to the unconsolidated joint ventures' lenders) and suffer losses, each of which could be significant. Moreover, our ability to recoup such expenditures and losses by exercising remedies against such partners may be limited due to potential legal defenses they may have, their respective financial condition and other circumstances. In addition, certain joint ventures relating to our Canadian operations have change of control consent requirements that may have the effect of delaying, deferring or preventing a change of control of such joint ventures. Furthermore, the termination of a joint venture may also give rise to lawsuits and legal costs.
In certain instances, Monarch and the other partners in a joint venture provide guarantees and indemnities to lenders with respect to the unconsolidated joint venture's debt, which may be triggered under certain conditions when the joint venture fails to fulfill its obligations under its loan agreements. As of December 31, 2013, Monarch's total recourse exposure under its guarantees of joint venture debt was approximately $91.1 million. To the extent any or all of our joint ventures default on obligations secured by the assets of such joint venture or guaranteed by Monarch, the assets of our joint ventures could be forfeited to our joint ventures' third party lenders, and Monarch could be liable to such third party lenders to the full extent of its guarantees and, in the case of secured guarantees, to the extent of the assets of Monarch that secure the applicable guarantee. Any such default by our joint ventures could cause significant losses, with a resulting adverse effect on our financial condition and results of operations. Recent market conditions have required us to provide a greater number of such guarantees and we expect this trend to continue.
Information technology failures and data security breaches could harm our business.
We use information technology and other computer resources to carry out important operational and marketing activities as well as maintain our business records, including information provided by our customers. Many of these resources are provided to us and/or maintained on our behalf by third-party service providers pursuant to agreements that specify certain security and service level standards. Our ability to conduct our business may be impaired if these resources are compromised, degraded, damaged or fail, whether due to a virus or other harmful circumstance, intentional penetration or disruption of our information technology resources by a third party, natural disaster, hardware or software corruption or failure or error (including a failure of security controls incorporated into or applied to such hardware or software), telecommunications system failure, service provider error or failure, intentional or unintentional personnel actions (including the failure to follow our security protocols), or lost connectivity to our networked resources. A significant and extended disruption in the functioning of these resources could damage our reputation and cause us to lose customers, sales and revenue.
In addition, breaches of our data security systems could result in the unintended public disclosure or the misappropriation of proprietary, personal and confidential information (including confidential information about our employees, consumers who view our homes, homebuyers, mortgage loan borrowers and business partners), and require us to incur significant expense to address and resolve these kinds of issues. The release of confidential information may also lead to identity theft and related fraud, litigation or other proceedings against us by affected individuals and/or business partners and/or by regulators, and the outcome of such proceedings, which could include penalties or fines, could have a material and adverse effect on our business, financial condition and results of operations. In addition, the costs of maintaining adequate protection against such threats, as they develop in the future (or as legal requirements related to data security increase) could be material.
We may incur a variety of costs to engage in future growth or expansion of our operations or acquisitions or disposals of businesses, and the anticipated benefits may never be realized.
As a part of our business strategy, we may make acquisitions, or significant investments in, and/or disposals of businesses. Any future acquisitions, investments and/or disposals would be accompanied by risks such as:
| • | difficulties in assimilating the operations and personnel of acquired companies or businesses; |
| • | diversion of our management's attention from ongoing business concerns; |
| • | our potential inability to maximize our financial and strategic position through the successful incorporation or disposition of operations; |
28
| • | maintenance of uniform standards, controls, procedures and policies; and |
| • | impairment of existing relationships with employees, contractors, suppliers and customers as a result of the integration of new management personnel and cost-saving initiatives. |
We cannot guarantee that we will be able to successfully integrate any company or business that we might acquire in the future, and our failure to do so could harm our current business.
In addition, we may not realize the anticipated benefits of these transactions and there may be other unanticipated or unidentified effects. While we would seek protection, for example, through warranties and indemnities in the case of acquisitions, significant liabilities may not be identified in due diligence or come to light after the expiry of warranty or indemnity periods. Additionally, while we would seek to limit our ongoing exposure, for example, through liability caps and period limits on warranties and indemnities in the case of disposals, some warranties and indemnities may give rise to unexpected and significant liabilities. Any claims arising in the future may adversely affect our business, financial condition and operating results.
We have defined benefit and defined contribution pension schemes to which we may be required to increase our contributions to fund deficits.
We provide retirement benefits for former and certain of our current employees through a number of defined benefit and defined contribution pension schemes. Certain of these plans are no longer available to new employees, though in Canada we retain a defined contribution plan. As of December 31, 2013, we had recorded a deficit of $5.9 million in our defined benefit pension plans. This deficit may increase, and we may be required to increase contributions to our plans in the future, which may materially and adversely affect our liquidity and financial condition.
A major health and safety incident relating to our business could be costly in terms of potential liabilities and reputational damage.
Building sites are inherently dangerous, and operating in the homebuilding industry poses certain inherent health and safety risks. Due to health and safety regulatory requirements and the number of projects we work on, health and safety performance is critical to the success of all areas of our business. Any failure in health and safety performance may result in penalties for non-compliance with relevant regulatory requirements, and a failure that results in a major or significant health and safety incident is likely to be costly in terms of potential liabilities incurred as a result. Such a failure could generate significant negative publicity and have a corresponding impact on our reputation, our relationships with relevant regulatory agencies or governmental authorities, and our ability to attract customers, which in turn could have a material adverse effect on our business, financial condition and operating results.
Ownership, leasing or occupation of land and the use of hazardous materials carries potential environmental risks and liabilities.
We are subject to a variety of local, state, provincial and federal statutes, rules and regulations concerning land use and the protection of health and the environment, including those governing discharge of pollutants to water and air, including asbestos, the handling of hazardous materials and the cleanup of contaminated sites. We may be liable for the costs of removal, investigation or remediation of hazardous or toxic substances located on, under or in a property currently or formerly owned, leased or occupied by us, whether or not we caused or knew of the pollution. The costs of any required removal, investigation or remediation of such substances or the costs of defending against environmental claims may be substantial. The presence of such substances, or the failure to remediate such substances properly, may also adversely affect our ability to sell the land or to borrow using the land as security. Environmental impacts from historical activities have been identified at some of the projects we have developed in the past and additional projects may be located on land that may have been contaminated by previous use. Although we are not aware of any projects requiring material remediation activities by us as a result of historical contamination, no assurances can be given that material claims or liabilities relating to such developments will not arise in the future.
The particular impact and requirements of environmental laws that apply to any given community vary greatly according to the community site, the site's environmental conditions and the present and former use of the site. We expect that
29
increasingly stringent requirements may be imposed on homebuilders in the future. Environmental laws may result in delays, cause us to implement time consuming and expensive compliance programs and prohibit or severely restrict development in certain environmentally sensitive regions or areas, such as wetlands. We also may not identify all of these concerns during any pre-development review of project sites. Environmental regulations can also have an adverse impact on the availability and price of certain raw materials, such as lumber. Furthermore, we could incur substantial costs, including cleanup costs, fines, penalties and other sanctions and damages from third-party claims for property damage or personal injury, as a result of our failure to comply with, or liabilities under, applicable environmental laws and regulations. In addition, we are subject to third-party challenges, such as by environmental groups, under environmental laws and regulations to the permits and other approvals required for our projects and operations. These matters could adversely affect our business, financial condition and operating results.
We may be liable for claims for damages as a result of use of hazardous materials.
As a homebuilding business with a wide variety of historic homebuilding and construction activities, we could be liable for future claims for damages as a result of the past or present use of hazardous materials, including building materials which in the future become known or are suspected to be hazardous. Any such claims may adversely affect our business, financial condition and operating results. Insurance coverage for such claims may be limited or non-existent.
We may suffer uninsured losses or suffer material losses in excess of insurance limits.
We could suffer physical damage to property and liabilities resulting in losses that may not be fully compensated by insurance. In addition, certain types of risks, such as personal injury claims, may be, or may become in the future, either uninsurable or not economically insurable, or may not be currently or in the future covered by our insurance policies. Should an uninsured loss or a loss in excess of insured limits occur, we could sustain financial loss or lose capital invested in the affected property as well as anticipated future income from that property. In addition, we could be liable to repair damage or meet liabilities caused by uninsured risks. We may be liable for any debt or other financial obligations related to affected property. Material losses or liabilities in excess of insurance proceeds may occur in the future.
In the U.S., the coverage offered and the availability of general liability insurance for construction defects is currently limited and is costly. As a result, an increasing number of our subcontractors in the U.S. may be unable to obtain insurance, particularly in California where we have instituted an OCIP, under which subcontractors are effectively insured by us. If we cannot effectively recover construction defect liabilities and costs of defense from our subcontractors or their insurers, or if we have self-insured, we may suffer losses. Coverage may be further restricted and become even more costly. Such circumstances could adversely affect our business, financial condition and operating results.
We may face substantial damages or be enjoined from pursuing important activities as a result of existing or future litigation, arbitration or other claims.
We are involved in various litigation and legal claims in the normal course of our business operations, including actions brought on behalf of various classes of claimants. We are also subject to a variety of local, state, and federal laws and regulations related to land development activities, house construction standards, sales practices, mortgage lending operations, employment practices, and protection of the environment. As a result, we are subject to periodic examination or inquiry by various governmental agencies that administer these laws and regulations.
We establish liabilities for legal claims and regulatory matters when such matters are both probable of occurring and any potential loss is reasonably estimable. We accrue for such matters based on the facts and circumstances specific to each matter and revise these estimates as the matters evolve. In such cases, there may exist an exposure to loss in excess of any amounts currently accrued. In view of the inherent difficulty of predicting the outcome of these legal and regulatory matters, we generally cannot predict the ultimate resolution of the pending matters, the related timing, or the eventual loss. While the outcome of such contingencies cannot be predicted with certainty, we do not believe that the resolution of such matters will have a material adverse impact on our results of operations, financial position, or cash flows. However, to the extent the liability arising from the ultimate resolution of any matter exceeds the estimates reflected in the recorded reserves relating to such matter, we could incur additional charges that could be significant.
30
Poor relations with the residents of our communities could negatively impact sales, which could cause our revenues or results of operations to decline.
Residents of communities we develop rely on us to resolve issues or disputes that may arise in connection with the operation or development of their communities. Efforts made by us to resolve these issues or disputes could be deemed unsatisfactory by the affected residents and subsequent actions by these residents could adversely affect sales or our reputation. In addition, we could be required to make material expenditures related to the settlement of such issues or disputes or to modify our community development plans, which could adversely affect our results of operations.
We are dependent on certain members of our management and key personnel.
Our business involves complex operations and therefore demands a management team and employee workforce that is knowledgeable and expert in many areas necessary for our operations. Our performance and success are dependent, in part, upon key members of our management and personnel, and their loss or departure could be detrimental to our future success. Further, the process of attracting and retaining suitable replacements for key personnel whose services we may lose would result in transition costs and would divert the attention of other members of our senior management from our existing operations. In addition, we do not maintain key person insurance in respect of any members of our senior management team. The loss of any of our management members or key personnel could adversely impact our business, financial condition and operating results.
Utility and resource shortages or rate fluctuations could have an adverse effect on our operations.
Several of the markets in which we operate have historically been subject to utility and resource shortages, including significant changes to the availability of electricity and water. Austin and Denver in particular have at times been affected by such shortages. Shortages of natural resources in our markets, particularly of water, may make it more difficult for us to obtain regulatory approval of new developments. We have also experienced material fluctuations in utility and resource costs across our markets, and we may incur additional costs and may not be able to complete construction on a timely basis if such fluctuations arise. Our lumber inventory is particularly sensitive to these shortages. Furthermore, these shortages and rate fluctuations may adversely affect the regional economies in which we operate, which may reduce demand for our homes and negatively affect our business and results of operations.
Constriction of the capital markets could limit our ability to access capital and increase our costs of capital.
We fund our operations from cash from operations, capital markets financings and borrowings under our Restated Revolving Credit Facility and other credit facilities. Volatile economic conditions and the constriction of the capital markets could reduce the sources of liquidity available to us and increase our costs of capital. Our Canadian operations rely on separate banking facilities for liquidity. The credit facilities used in our Canadian operations are typically required to be renewed annually. If the size or availability of these banking facilities is reduced in the future, or if we are unable to renew existing facilities in the future on favorable terms, it would have an adverse effect on our liquidity and operations.
As of December 31, 2013, we had $221.3 million of debt maturing in the next 12 months. We believe we can meet our other capital requirements with our existing cash resources and future cash flows and, if required, other sources of financing that we anticipate will be available to us. However, we can provide no assurance that we will continue to be able to do so, particularly if industry or economic conditions deteriorate. The future effects on our business, liquidity and financial results of these conditions could be adverse, both in the ways described above and in other ways that we do not currently foresee.
Our substantial debt could adversely affect our business, financial condition or results of operations and prevent us from fulfilling our debt-related obligations.
We have a substantial amount of debt. As of December 31, 2013, the total principal amount of our debt (including $74.9 million of indebtedness of TMHF) was $1.4 billion. Our substantial debt could have important consequences for the holders of our common stock, including:
| • | making it more difficult for us to satisfy our obligations with respect to our debt or to our trade or other creditors; |
31
| • | increasing our vulnerability to adverse economic or industry conditions; |
| • | limiting our ability to obtain additional financing to fund capital expenditures and acquisitions, particularly when the availability of financing in the capital markets is limited; |
| • | requiring a substantial portion of our cash flows from operations and the proceeds of any capital markets offerings for the payment of interest on our debt and reducing our ability to use our cash flows to fund working capital, capital expenditures, acquisitions and general corporate requirements; |
| • | limiting our flexibility in planning for, or reacting to, changes in our business and the industry in which we operate; and |
| • | placing us at a competitive disadvantage to less leveraged competitors. |
We cannot assure you that our business will generate sufficient cash flow from operations or that future borrowings will be available to us through capital markets financings or under our Restated Revolving Credit Facility or otherwise in an amount sufficient to enable us to pay our indebtedness, or to fund our other liquidity needs. We may need to refinance all or a portion of our indebtedness, on or before its maturity. We cannot assure you that we will be able to refinance any of our indebtedness on commercially reasonable terms or at all. In addition, we may incur additional indebtedness in order to finance our operations or to repay existing indebtedness. If we cannot service our indebtedness, we may have to take actions such as selling assets, seeking additional debt or equity or reducing or delaying capital expenditures, strategic acquisitions, investments and alliances. We cannot assure you that any such actions, if necessary, could be effected on commercially reasonable terms or at all, or on terms that would be advantageous to our stockholders or on terms that would not require us to breach the terms and conditions of our existing or future debt agreements.
Restrictive covenants in the indentures governing our Senior Notes and the agreements governing our Restated Revolving Credit Facility and other indebtedness may restrict our ability to pursue our business strategies.
The indentures governing our Senior Notes and the agreement governing our Restated Revolving Credit Facility limit our ability, and the terms of any future indebtedness may limit our ability, among other things, to:
| • | incur or guarantee additional indebtedness; |
| • | make certain investments; |
| • | pay dividends or make distributions on our capital stock; |
| • | sell assets, including capital stock of restricted subsidiaries; |
| • | agree to restrictions on distributions, transfers or dividends affecting our restricted subsidiaries; |
| • | consolidate, merge, sell or otherwise dispose of all or substantially all of our assets; |
| • | enter into transactions with our affiliates; |
| • | incur liens; and |
| • | designate any of our subsidiaries as unrestricted subsidiaries. |
The agreement governing the Restated Revolving Credit Facility contains certain "springing" financial covenants requiring TMM Holdings and its subsidiaries to comply with a certain maximum capitalization ratio and a certain minimum consolidated tangible net worth test. The agreement governing the Restated Revolving Credit Facility also contains customary restrictive covenants, including limitations on incurrence of liens, the payment of dividends and other distributions, the making of asset dispositions, investments, sale and leasebacks, and limitations on debt payments and amendments. See Item 7 - Management's Discussion and Analysis of Financial Condition and Results of Operations - Overview of Capital Resources and Liquidity in this Annual Report.
The restrictions contained in the indentures governing our Senior Notes and the agreement governing our Restated Revolving Credit Facility could also limit our ability to plan for or react to market conditions, meet capital needs or make acquisitions or otherwise restrict our activities or business plans.
32
Monarch is party to the TD Facility and the HSBC Facility. These facilities also contain restrictive covenants, including a maximum debt to equity ratio, minimum consolidated net equity, limitations on dividends and maintenance of a minimum interest coverage ratio. A breach of any of these restrictive covenants or our inability to comply with the applicable financial covenants could result in a default under the agreements governing our Restated Revolving Credit Facility, the TD Facility and the HSBC Facility, which could allow for the acceleration of the debt under the agreements. If the indebtedness under our Restated Revolving Credit Facility, the TD Facility, the HSBC Facility, the Senior Notes were to be accelerated, we cannot assure you that our assets would be sufficient to repay in full that indebtedness and our other indebtedness. See Item 7 –Management's Discussion and Analysis of Financial Condition and Results of Operations – Overview of Capital Resources and Liquidity in this Annual Report.
We may require additional capital in the future and may not be able to secure adequate funds on terms acceptable to us.
The expansion and development of our business may require significant capital, which we may be unable to obtain, to fund our capital expenditures and operating expenses, including working capital needs. During 2013, 2012 and 2011 we made expenditures for land and development of $992.4 million, $777.7 million and $332.8 million respectively.
During the next 12 months, we otherwise expect to meet our cash requirements with existing cash and cash equivalents, cash flow from operations (including sales of our homes and land) and borrowings under our Restated Revolving Credit Facility. We may fail to generate sufficient cash flow from the sales of our homes and land to meet our cash requirements. Further, our capital requirements may vary materially from those currently planned if, for example, our revenues do not reach expected levels or we have to incur unforeseen capital expenditures and make investments to maintain our competitive position. If this is the case, we may require additional financing sooner than anticipated or we may have to delay or abandon some or all of our development and expansion plans or otherwise forego market opportunities.
To a large extent, our cash flow generation ability is subject to general economic, financial, competitive, legislative and regulatory factors and other factors that are beyond our control. We cannot assure you that our business will generate cash flow from operations in an amount sufficient to enable us to fund our liquidity needs. As a result, we may need to refinance all or a portion of our indebtedness, on or before its maturity, or obtain additional equity or debt financing. We cannot assure you that we will be able to do so on commercially reasonable terms, if at all. Any inability to generate sufficient cash flow, refinance our indebtedness or incur additional indebtedness on commercially reasonable terms could adversely affect our financial condition and could cause us to be unable to service our debt and may delay or prevent the expansion of our business.
Risks related to our structure and organization
TMHC's only asset is its interest in New TMM, and accordingly it is dependent upon distributions from New TMM to pay dividends, if any, taxes and other expenses. New TMM is a holding company with no operations of its own and, in turn, relies on distributions from TMM Holdings and its operating subsidiaries.
TMHC is a holding company and has no assets other than its ownership, directly or indirectly, of New TMM Units. TMHC has no independent means of generating revenue. TMHC intends to cause New TMM to make distributions to its partners in an amount sufficient to cover all applicable taxes payable and dividends, if any, declared by TMHC. To the extent that TMHC needs funds, and New TMM is restricted from making such distributions under applicable law or regulation, or is otherwise unable to provide such funds, it could materially and adversely affect TMHC's liquidity and financial condition. In addition, New TMM has no direct operations and derives all of its cash flow from TMM Holdings and its subsidiaries. Because the operations of TMHC's business are conducted through subsidiaries of TMM Holdings, New TMM is dependent on those entities for dividends and other payments to generate the funds necessary to meet the financial obligations of New TMM. Legal and contractual restrictions in the agreements governing the Restated Revolving Credit Facility, the Senior Notes and other debt agreements governing current and future indebtedness of New TMM's subsidiaries, as well as the financial condition and operating requirements of New TMM's subsidiaries, may limit TMHC's ability to obtain cash from New TMM's subsidiaries. The earnings from, or other available assets of, New TMM's subsidiaries may not be sufficient to pay dividends or make distributions or loans to TMHC to enable TMHC to pay any dividends on the Class A Common Stock, taxes and other expenses.
33
The Principal Equityholders have substantial influence over our business, and their interests may differ from our interests or those of our other stockholders.
The Principal Equityholders, via the TPG and Oaktree Holding Vehicles, hold a majority of the combined voting power of TMHC. Due to their ownership, our Principal Equityholders have the power to control us and our subsidiaries, including the power to:
| • | elect a majority of our directors and appoint our executive officers, set our management policies and exercise overall control over the Company and subsidiaries; |
| • | agree to sell or otherwise transfer a controlling stake in the Company; and |
| • | determine the outcome of substantially all actions requiring stockholder approval, including transactions with related parties, corporate reorganizations, acquisitions and dispositions of assets, and dividends. |
The interests of our Principal Equityholders may differ from our interests or those of our other stockholders and the concentration of control in our Principal Equityholders will limit other stockholders' ability to influence corporate matters. The concentration of ownership and voting power of our Principal Equityholders may also delay, defer or even prevent an acquisition by a third party or other change of control of the Company and may make some transactions more difficult or impossible without the support of our Principal Equityholders, even if such events are perceived by the other stockholders as being in their best interest. The concentration of voting power among our Principal Equityholders may have an adverse effect on the price of our Class A Common Stock. The Company may take actions that our other stockholders do not view as beneficial, which may adversely affect our results of operations and financial condition and cause the value of your investment to decline.
Pursuant to the stockholders agreement, to which TMHC is a party, along with the TPG and Oaktree Holding Vehicles and JH, certain of our actions require the approval of the directors nominated by the TPG and Oaktree Holding Vehicles. Specifically, the approval of a director nominated by the TPG Holding Vehicle, so long as it owns at least 50% of TMHC's common stock held by it at the closing of our IPO (and the application of net proceeds therefrom), and the approval of a director nominated by the Oaktree Holding Vehicle, so long as it owns at least 50% of TMHC's common stock held by it following our IPO (and the application of net proceeds therefrom), must be obtained before we are permitted to take any of the following actions:
| • | any change of control of TMHC; |
| • | acquisitions or dispositions by TMHC or any of its subsidiaries of assets valued at more than $50.0 million; |
| • | incurrence by TMHC or any of its subsidiaries of any indebtedness in an aggregate amount in excess of $50.0 million or the making of any loan in excess of $50.0 million; |
| • | issuance of any equity securities of TMHC, subject to limited exceptions (which include issuances pursuant to approved compensation plans); |
| • | hiring and termination of our Chief Executive Officer; and |
| • | certain changes to the size of our Board of Directors. |
Section 203 of the Delaware General Corporation Law may affect the ability of an "interested stockholder" to engage in certain business combinations, including mergers, consolidations or acquisitions of additional shares, for a period of three years following the time that the stockholder becomes an "interested stockholder." An "interested stockholder" is defined to include persons owning directly or indirectly 15% or more of the outstanding voting stock of a corporation. We have elected in our amended and restated certificate of incorporation not to be subject to Section 203 of the Delaware General Corporation Law. Nevertheless, our amended and restated certificate of incorporation contains provisions that have the same effect as Section 203 of the Delaware General Corporation Law, except that they provide that the TPG and Oaktree Holding Vehicles and their respective affiliates and transferees will not be deemed to be "interested stockholders," regardless of the percentage of our voting stock owned by them, and accordingly will not be subject to such restrictions.
In addition, because the Principal Equityholders hold their economic interest in our business through New TMM, but not through TMHC, the public company, these existing owners may have conflicting interests with holders of shares of our Class A Common Stock.
34
As a "controlled company" within the meaning of the corporate governance rules of the New York Stock Exchange, we qualify for, and rely on, exemptions from certain corporate governance requirements. As a result, holders of our Class A Common Stock may not have the same degree of protection as that afforded to stockholders of companies that are subject to all of the corporate governance requirements of these exchanges.
We are a "controlled company" within the meaning of the corporate governance rules of the New York Stock Exchange as a result of the ownership position and voting rights of our Principal Equityholders. A "controlled company" is a company of which more than 50% of the voting power is held by an individual, group or another company. More than 50% of our voting power is held by the TPG and Oaktree Holding Vehicles. As a controlled company, we are entitled to elect, and have elected, not to comply with certain corporate governance rules of the New York Stock Exchange that would otherwise require the Board of Directors to have a majority of independent directors and our compensation and nominating and governance committees to be comprised entirely of independent directors, have written charters addressing such committee's purpose and responsibilities and perform an annual evaluation of such committee. Accordingly, holders of our Class A Common Stock do not have the same protection afforded to stockholders of companies that are subject to all of the corporate governance requirements of the New York Stock Exchange and the ability of our independent directors to influence our business policies and affairs may be reduced.
TMHC's directors who have relationships with the Principal Equityholders may have conflicts of interest with respect to matters involving the Company.
The majority of TMHC's directors are affiliated with the Principal Equityholders. These persons have fiduciary duties to TMHC and in addition have duties to the Principal Equityholders. In addition, TMHC's amended and restated certificate of incorporation provides that no officer or director of TMHC who is also an officer, director, employee or other affiliate of the Principal Equityholders or an officer, director or employee of an affiliate of the Principal Equityholders will be liable to TMHC or its stockholders for breach of any fiduciary duty by reason of the fact that any such individual directs a corporate opportunity to the Principal Equityholders or their affiliates instead of TMHC, or does not communicate information regarding a corporate opportunity to TMHC that such person or affiliate has directed to the Principal Equityholders or their affiliates. As a result, such circumstances may entail real or apparent conflicts of interest with respect to matters affecting both TMHC and the Principal Equityholders, whose interests, in some circumstances, may be adverse to those of TMHC. In addition, as a result of the Principal Equityholders' indirect ownership interest, conflicts of interest could arise with respect to transactions involving business dealings between TMHC and the Principal Equityholders or their affiliates, including potential business transactions, potential acquisitions of businesses or properties, the issuance of additional securities, the payment of dividends by TMHC and other matters.
Failure to establish and maintain effective internal control over financial reporting could have an adverse effect on our business, operating results and the trading price of our securities.
Maintaining effective internal control over financial reporting is necessary for us to produce reliable financial reports and is important in helping to prevent financial fraud. To date, we have not conducted an audit of our controls and our auditors have not conducted an audit of our internal control over financial reporting. If we are unable to maintain adequate internal controls, our business and operating results could be harmed. We are in the process of evaluating how to document and test our internal control procedures to satisfy the requirements of Section 404 of the Sarbanes-Oxley Act and the related rules of the SEC, which require, among other things, our management to assess annually the effectiveness of our internal control over financial reporting and our independent registered public accounting firm to issue a report on our internal control over financial reporting beginning with our Annual Report on Form 10-K for the year ending December 31, 2014. During the course of this documentation and testing, we may identify material deficiencies that we may be unable to remedy before the requisite deadline for those reports. For example, during the course of the audit of our financial statements for the year ended December 31, 2013, our independent auditors brought to our attention a material weakness in the manner in which we calculate our net deferred tax assets and liabilities, which we are in process of remediating. Any failure to remediate material weaknesses or significant deficiencies noted by us or our independent registered public accounting firm during the audit of our internal controls or to implement required new or improved controls or difficulties encountered in their implementation could cause us to fail to meet our reporting obligations or result in material misstatements in our financial statements. If our management or our independent registered public accounting firm were to conclude in their reports that our internal control over financial reporting was
35
not effective, investors could lose confidence in our reported financial information. Failure to comply with Section 404 of the Sarbanes-Oxley Act could potentially subject us to sanctions or investigations by the SEC, the Financial Industry Regulatory Authority or other regulatory authorities.
Provisions in our charter and bylaws and provisions of Delaware law may delay or prevent our acquisition by a third party, which might diminish the value of our Class A Common Stock. Provisions in our debt agreements may also require an acquirer to refinance our outstanding indebtedness if a change of control occurs.
In addition to the TPG and Oaktree Holding Vehicles holding a majority of the voting power of TMHC following this offering, our amended and restated certificate of incorporation and our bylaws contain certain provisions that may discourage, delay or prevent a change in our management or control over us that stockholders may consider favorable, including the following, some of which may only become effective when the TPG and Oaktree Holding Vehicles no longer beneficially own shares representing 50% or more of the combined voting power of our common stock (the "Triggering Event"):
| • | the division of our board of directors into three classes and the election of each class for three-year terms; |
| • | the sole ability of the board of directors to fill a vacancy created by the expansion of the board of directors; |
| • | advance notice requirements for stockholder proposals and director nominations; |
| • | after the Triggering Event, limitations on the ability of stockholders to call special meetings and to take action by written consent; |
| • | after the Triggering Event, in certain cases, the approval of holders of at least three-fourths of the shares entitled to vote generally on the making, alteration, amendment or repeal of our certificate of incorporation or bylaws will be required to adopt, amend or repeal our bylaws, or amend or repeal certain provisions of our certificate of incorporation; |
| • | after the Triggering Event, the required approval of holders of at least three-fourths of the shares entitled to vote at an election of the directors to remove directors, which removal may only be for cause; and |
| • | the ability of our board of directors to designate the terms of and issue new series of preferred stock without stockholder approval, which could be used, among other things, to institute a rights plan that would have the effect of significantly diluting the stock ownership of a potential hostile acquirer, likely preventing acquisitions that have not been approved by our board of directors. |
Section 203 of the Delaware General Corporation Law may affect the ability of an "interested stockholder" to engage in certain business combinations, for a period of three years following the time that the stockholder becomes an "interested stockholder." We have elected in our amended and restated certificate of incorporation not to be subject to Section 203 of the Delaware General Corporation Law. Nevertheless, our amended and restated certificate of incorporation contains provisions that have the same effect as Section 203 of the Delaware General Corporation Law, except that they provide that the TPG and Oaktree Holding Vehicles and their respective affiliates and transferees will not be deemed to be "interested stockholders," and accordingly will not be subject to such restrictions.
The existence of the foregoing provisions and anti-takeover measures could limit the price that investors might be willing to pay in the future for shares of our common stock. They could also deter potential acquirers of our company, thereby reducing the likelihood that you could receive a premium for your common stock in the acquisition.
Under our Restated Revolving Credit Facility, a change of control would be an event of default, which would therefore require a third party acquirer to obtain a facility to refinance any outstanding indebtedness under the Restated Revolving Credit Facility. Under the indentures governing our Senior Notes, if a change of control were to occur, we would be required to make offers to repurchase the Senior Notes at prices equal to 101% of their respective principal amounts. These change of control provisions in our existing debt agreements may also delay or diminish the value of an acquisition by a third party.
Any of the above risks could have a material adverse effect on your investment in our Class A Common Stock and Senior Notes.
36
| ITEM 1B. | UNRESOLVED STAFF COMMENTS |
None.
| ITEM 2. | PROPERTIES |
We lease office facilities for our homebuilding and mortgage operations. We lease our corporate headquarters, which is located in Scottsdale, Arizona. The lease on this facility consists of approximately 24,000 square feet and expires in June 2018. We lease approximately 13 other properties for our other division offices and design centers. For information on land owned and controlled by us for use in our homebuilding activities, please refer to Item 1 - Business - Homebuilding Operations - Land Acquisition Policies and Development .
| ITEM 3. | LEGAL PROCEEDINGS |
We are involved in various litigation and legal claims in the normal course of our business operations, including actions brought on behalf of various classes of claimants. We are also subject to a variety of local, state, and federal laws and regulations related to land development activities, house construction standards, sales practices, mortgage lending operations, employment practices, and protection of the environment. As a result, we are subject to periodic examination or inquiry by various governmental agencies that administer these laws and regulations.
We establish liabilities for legal claims and regulatory matters when such matters are both probable of occurring and any potential loss is reasonably estimable. We accrue for such matters based on the facts and circumstances specific to each matter and revise these estimates as the matters evolve. In such cases, there may exist an exposure to loss in excess of any amounts currently accrued. In view of the inherent difficulty of predicting the outcome of these legal and regulatory matters, we generally cannot predict the ultimate resolution of the pending matters, the related timing, or the eventual loss. While the outcome of such contingencies cannot be predicted with certainty, we do not believe that the resolution of such matters will have a material adverse impact on our results of operations, financial position, or cash flows. However, to the extent the liability arising from the ultimate resolution of any matter exceeds the estimates reflected in the recorded reserves relating to such matter, we could incur additional charges that could be significant.
| ITEM 4. | MINE SAFETY DISCLOSURES |
Not applicable.
37
PART II
| ITEM 5. | MARKET FOR REGISTRANT'S COMMON EQUITY, RELATED STOCKHOLDER MATTERS AND ISSUER PURCHASES OF EQUITY |
Market Information
The Company lists its Class A Common Stock on the New York Stock Exchange (NYSE) under the symbol "TMHC". On February 24, 2014 we had 1 holder of record of our Class A Common Stock. The following table sets forth for the quarters indicated the range of high and low trading for the Company's common stock during fiscal 2013:
| 1 st Qtr | 2 nd Qtr | 3 rd Qtr | 4 th Qtr | |||||||||||||
Fiscal Year Ended December 31, 2013: | ||||||||||||||||
High | N/A | $ | 26.89 | $ | 25.89 | $ | 23.40 | |||||||||
Low | N/A | 23.04 | 19.96 | 20.02 | ||||||||||||
The Company's Class B Common Stock is not listed on a securities exchange. On February 24, 2013 we had 39 holders of our Class B Common Stock. For details on the Class B Common Stock see Note 16 – Capital Structure – Reorganization Transactions in the notes to our Consolidated and Combined Financial Statements included in Item 8 of this Annual Report.
38
Stock Performance Graph
The following shall not be deemed "filed" for purposes of Section 18 of the Exchange Act, or incorporated by reference into any of our other filings under the Exchange Act or the Securities Act, except to the extent we specifically incorporate it by reference into such filing.
This chart compares the cumulative total return on our common stock with that of the Standard & Poor's 500 Composite Stock Index (the "S&P 500") and the Standard & Poor's Homebuilding Index (the "S&P Homebuilding"). The chart assumes $100.00 was invested at the close of market on April 10, 2013, the date of our IPO, in the Class A common stock of Taylor Morrison Home Corporation, the S&P 500 Index and the S&P Homebuilding Index, and assumes the reinvestment of any dividends. The stock price performance on the following graph is not necessarily indicative of future stock price performance.
Comparison of Cumulative Total Return Among TMHC, the S&P 500 and the S&P Homebuilding from April 10, 2013 to December 31, 2013
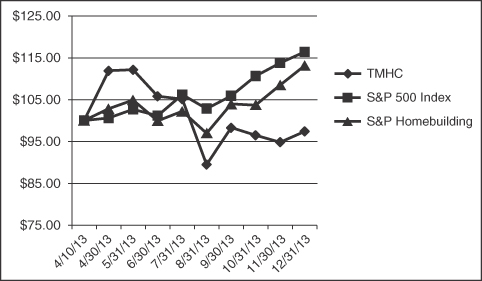
| 4/10/13 | 4/30/13 | 5/31/13 | 6/30/13 | 7/31/13 | 8/31/13 | 9/30/13 | 10/31/13 | 11/30/13 | 12/31/13 | |||||||||||||||||||||||||||||||
TMHC | $ | 100.00 | $ | 111.89 | $ | 112.11 | $ | 105.82 | $ | 105.16 | $ | 89.45 | $ | 98.31 | $ | 96.53 | $ | 94.84 | $ | 97.44 | ||||||||||||||||||||
S&P 500 | 100.00 | 100.62 | 102.71 | 101.17 | 106.17 | 102.85 | 105.91 | 110.63 | 113.74 | 116.42 | ||||||||||||||||||||||||||||||
S&P Homebuilding | 100.00 | 102.85 | 104.92 | 99.92 | 102.20 | 96.97 | 103.96 | 103.69 | 108.51 | 113.15 | ||||||||||||||||||||||||||||||
Dividends
We currently anticipate that we will retain all available funds for use in the operation and expansion of our business, and do not anticipate paying any cash dividends in the foreseeable future or to make distributions from New TMM to its limited partners (other than to TMHC to fund its operations). See Item 7 - Management's Discussion and Analysis of Financial Condition and Results of Operations . TMHC has not previously declared or paid any cash dividends on its common stock.
Any future determination as to our dividend policy will be made at the discretion of the Board of Directors of TMHC and will depend upon many factors, including those governing our Restated Revolving Credit Facility and our Senior Notes, that limit our ability to pay dividends to stockholders and other factors the Board of Directors of TMHC deem relevant. For further information, see Item 7 - Management's Discussion and Analysis of Financial Condition and Results of Operations - Overview of Capital Resources and Liquidity - Capital Resources - Original Revolving Credit Facility and Restated Revolving Credit Facility , - 2020 Senior Notes and - 2021 Senior Notes.
Issuer Purchases of Equity Securities
None.
39
| ITEM 6. | SELECTED FINANCIAL DATA |
The following tables set forth selected consolidated and combined financial and housing data at and for each of the five fiscal years in the period ended December 31, 2013. It should be read in conjunction with the Consolidated and Combined Financial Statements and Notes thereto, listed in Item 8 of this Annual Report and Management's Discussion and Analysis of Financial Condition and Results of Operations included in Item 7 of this Annual Report.
| TMHC | Predecessor | |||||||||||||||||||||||
| Year Ended December 31, 2013 | Year Ended December 31, 2012 | July 13 to December 31, 2011 | January 1 to July 12, 2011 | Year Ended December 31, 2010 | Year Ended December 31, 2009 | |||||||||||||||||||
(Dollars in thousands, except per share amounts) | ||||||||||||||||||||||||
Statements of Operations Data: | ||||||||||||||||||||||||
Home closings revenue | $ | 2,264,985 | $ | 1,369,452 | $ | 731,216 | $ | 600,069 | $ | 1,273,160 | $ | 1,224,082 | ||||||||||||
Land closings revenue | 27,881 | 44,408 | 10,657 | 13,639 | 12,116 | 24,967 | ||||||||||||||||||
Mortgage operations revenue | 30,371 | 21,861 | 8,579 | 6,027 | 12,591 | 13,415 | ||||||||||||||||||
|
|
|
|
|
|
|
|
|
|
|
| |||||||||||||
Total revenues | $ | 2,323,237 | $ | 1,435,721 | $ | 750,452 | $ | 619,735 | $ | 1,297,867 | $ | 1,262,464 | ||||||||||||
Cost of home closings | 1,774,761 | 1,077,525 | 591,891 | 474,534 | 1,003,172 | 1,003,694 | ||||||||||||||||||
Cost of land closings | 26,741 | 35,884 | 8,583 | 7,133 | 6,028 | 17,001 | ||||||||||||||||||
Inventory impairments | - | - | - | - | 4,054 | 78,241 | ||||||||||||||||||
Mortgage operations expenses | 16,446 | 11,266 | 4,495 | 3,818 | 7,246 | 6,269 | ||||||||||||||||||
|
|
|
|
|
|
|
|
|
|
|
| |||||||||||||
Gross margin | $ | 505,289 | $ | 311,046 | $ | 145,483 | $ | 134,250 | $ | 277,367 | $ | 157,259 | ||||||||||||
Sales, commissions and other marketing costs | 142,848 | 80,907 | 36,316 | 40,126 | 85,141 | 100,534 | ||||||||||||||||||
General and administrative expenses | 90,743 | 60,444 | 32,883 | 35,743 | 66,232 | 71,300 | ||||||||||||||||||
Equity in income of unconsolidated entities | (37,563 | ) | (22,964 | ) | (5,247 | ) | (2,803 | ) | (5,319 | ) | (347 | ) | ||||||||||||
Interest (income) expense, net | (476 | ) | (2,446 | ) | (3,867 | ) | 941 | 40,238 | 20,732 | |||||||||||||||
Loss on extinguishment of debt | 10,141 | 7,953 | - | - | - | - | ||||||||||||||||||
Other expense (income), net | 2,541 | 3,567 | 2,308 | (10,658 | ) | 2,351 | 1,260 | |||||||||||||||||
Indemnification and transaction expenses | 199,119 | 13,034 | 52,292 | - | - | - | ||||||||||||||||||
|
|
|
|
|
|
|
|
|
|
|
| |||||||||||||
Income (loss) before income taxes | $ | 97,936 | $ | 170,551 | $ | 30,798 | $ | 70,901 | $ | 88,724 | $ | (36,220 | ) | |||||||||||
Income tax provision (benefit) | 3,068 | (260,297 | ) | 4,031 | 20,881 | (1,878 | ) | (35,396 | ) | |||||||||||||||
|
|
|
|
|
|
|
|
|
|
|
| |||||||||||||
Income (loss) before non-controlling interests, net of tax | $ | 94,868 | $ | 430,848 | $ | 26,767 | $ | 50,020 | $ | 90,602 | $ | (824 | ) | |||||||||||
Loss (income) attributable to non-controlling interests – joint ventures | 131 | (28 | ) | (1,178 | ) | (4,122 | ) | (3,235 | ) | (5,138 | ) | |||||||||||||
|
|
|
|
|
|
|
|
|
|
|
| |||||||||||||
Net income (loss) | $ | 94,999 | $ | 430,820 | $ | 25,589 | $ | 45,898 | $ | 87,367 | $ | (5,962 | ) | |||||||||||
Income attributable to non-controlling interests – Principal Equityholders | $ | (49,579 | ) | - | - | - | - | - | ||||||||||||||||
|
|
|
|
|
|
|
|
|
|
|
| |||||||||||||
Net income (loss) available to Taylor Morrison Home Corporation | $ | 45,420 | $ | 430,820 | $ | 25,589 | $ | 45,898 | $ | 87,367 | $ | (5,962 | ) | |||||||||||
|
|
|
|
|
|
|
|
|
|
|
| |||||||||||||
Earnings per share: | ||||||||||||||||||||||||
Basic | $ | 1.38 | N/A | N/A | N/A | N/A | N/A | |||||||||||||||||
Diluted | $ | 1.38 | N/A | N/A | N/A | N/A | N/A | |||||||||||||||||
Weighted average number of shares outstanding: | ||||||||||||||||||||||||
Basic | 32,840 | N/A | N/A | N/A | N/A | N/A | ||||||||||||||||||
Diluted | 122,319 | N/A | N/A | N/A | N/A | N/A | ||||||||||||||||||
Balance Sheet Data (at period end): | ||||||||||||||||||||||||
Cash and cash equivalents, excluding restricted cash | $ | 389,181 | $ | 300,602 | $ | 279,322 | $ | 165,415 | $ | 189,032 | $ | 237,267 | ||||||||||||
Real estate inventory | 2,262,339 | 1,604,187 | 1,003,482 | 1,073,953 | 979,562 | 1,072,147 | ||||||||||||||||||
Total assets | 3,438,558 | 2,738,056 | 1,671,067 | 1,527,321 | 1,500,473 | 1,562,868 | ||||||||||||||||||
Total debt | 1,415,082 | 1,027,869 | 599,750 | 605,768 | 925,863 | 1,048,535 | ||||||||||||||||||
Total equity | 1,544,901 | 1,204,575 | 628,565 | 465,531 | 103,773 | 68,944 | ||||||||||||||||||
Operating Data (for the period ended: (1) | ||||||||||||||||||||||||
Average active selling communities | 177 | 129 | 140 | 151 | 149 | 164 | ||||||||||||||||||
Net sales orders (units) | 5,697 | 4,842 | 2,035 | 2,094 | 3,690 | 5,216 | ||||||||||||||||||
Closings (units) | 6,270 | 4,014 | 2,077 | 1,843 | 4,140 | 4,755 | ||||||||||||||||||
Average sales price of homes delivered | $ | 382 | $ | 364 | $ | 366 | $ | 326 | $ | 308 | $ | 257 | ||||||||||||
Backlog at the end of period (value) | $ | 1,443,085 | $ | 1,448,934 | $ | 982,525 | $ | 1,120,466 | $ | 931,001 | $ | 972,632 | ||||||||||||
Backlog at the end of period (units) | 3,536 | 4,112 | 2,965 | 3,008 | 2,756 | 2,452 | ||||||||||||||||||
| (1) | Includes proportionate share of unconsolidated joint ventures |
40
| ITEM 7. | MANAGEMENT'S DISCUSSION AND ANALYSIS OF FINANCIAL CONDITION AND RESULTS OF OPERATIONS |
Overview
We generate revenue primarily through sales of detached and attached homes and condominium units as well as through sales of land and the operations of our mortgage subsidiary, TMHF. We recognize revenue on detached and attached homes when the homes are completed and delivered to the buyers. We recognize revenue on the majority of our high-rise condominiums at the time of occupancy. We also recognize revenue when buyer deposits are forfeited. Revenues from loan origination are recognized at the time the related real estate transactions are completed, usually upon the close of escrow.
Our primary costs are the acquisition of land in various stages of development and the construction costs of the homes and condominiums we sell (including capitalized interest, real estate taxes and related development costs). Home construction costs are accumulated and charged to cost of sales based on the construction cost of the home being sold. Land acquisition, development, interest, taxes, overhead and condominium construction costs are allocated to homes and units using methods that approximate the relative sales value.
Our business is organized into four segments - East, West, Canada and Mortgage Operations. Our East, West and Canada segments are based on geographic regions:
| • | East: Houston (which includes a Taylor Morrison division and a Darling Homes division), Austin, Dallas (which includes a Darling Homes division only), North Florida and West Florida. |
| • | West: Phoenix, Northern California, Southern California and Denver. |
| • | Canada: Kitchener-Waterloo, Ottawa, Toronto. |
In all of our markets, we build and sell a broad and innovative mix of homes across a wide range of price points. Our emphasis is on designing, building and selling homes to first and second-time move-up buyers.
All of the divisions in our East and West segments offer single-family attached and/or detached homes and generally operate as merchant builders. Merchant builders generally acquire fully planned and entitled lots and may construct on-site improvements but normally do not construct significant off-site utility or infrastructure improvements. In certain markets we also operate as community developers. Community development includes the acquisition and development of large-scale communities that may include significant planning and entitlement approvals and construction of off-site and on-site utilities and infrastructure. Our Canada segment consists of our operations within the province of Ontario, primarily in the GTA and also in Ottawa and Kitchener-Waterloo, and offers both single-family and high-rise communities.
Mortgage Operations is also a separate reportable segment of our business. Our Mortgage Operations reportable segment provides financial services to customers in the U.S. through its wholly owned mortgage brokerage subsidiary, operating as TMHF, and title examination services in some U.S. locations through various joint ventures.
Strategy
Because the housing market is cyclical, and home price movement between the peak and trough of the cycle can be significant, we seek to adhere to our core operating principles through these cycles to drive consistent long-term performance.
Based on our current land position, we expect to drive revenue by opening new communities from our existing land supply. We believe land supply provides us with the opportunity to increase our community count on a net basis by approximately 25-30% in 2014. We also currently own or have an option to purchase over 98% of the land on which we expect to close homes during 2014. We expect that most of the communities we will open during the next twelve months will be in our Phoenix, West Florida and Houston markets in response to increased demand by consumers in those markets.
41
Because a significant portion of our land supply was purchased at low price points during the recent downturn in the housing cycle and because our entire land inventory was adjusted to fair market value at the time of the Acquisition, we expect to continue our revenue growth and strong gross margin performance in our U.S. communities. Our approach to land supply management in our East and West regions has historically been to acquire land that has attractive characteristics, including good access to schools, shopping, recreation and transportation facilities. In connection with our overall land inventory management process, our management team reviews these considerations, as well as other financial metrics, in order to decide the highest and best use of our land assets. Historically, land dispositions have not had a material effect on our overall results of operations, but may impact overall margins.
We intend to maintain a consistent approach to land positioning within our regions, markets and communities in the foreseeable future in an effort to concentrate a greater amount of our land inventory in areas that have the attractive characteristics referred to above. We also intend to continue to combine our land development expertise with our homebuilding operations to increase the flexibility of our business, to enhance our margin performance and to control the timing of delivery of lots.
Over the next twelve months our goal is to further focus our offerings on targeted customer groups. We aim to identify the preferences of our target customer and demographic groups and offer them innovative, high-quality homes that are efficient and profitable to build. To achieve this goal, we intend to continue our market research to determine preferences of our customer groups.
We will also seek to grow through selective acquisitions in both existing markets and new markets that exhibit positive long-term fundamentals. For example, on December 31, 2012 we acquired Darling, a Texas- based homebuilder, which gives us a presence in the Dallas market and expands our presence in the Houston market.
Factors Affecting Comparability of Results
You should read this Management's Discussion and Analysis of our Financial Condition and Results of Operations in conjunction with our historical consolidated financial statements included elsewhere in this Annual Report. Below are the period-to-period comparisons of our historical results and the analysis of our financial condition. In addition to the impact of the matters discussed in the Risk Factors listed in Item 1A of this Annual Report, our future results could differ materially from our historical results due to a variety of factors, including the following:
Liquidity and Interest Expense
We rely on our ability to finance our operations by generating operating cash flows, borrowing under our Restated Revolving Credit Facility and our existing Canadian credit facilities or accessing the debt and equity capital markets. We also rely on our independent ability to obtain performance, payment and completion surety bonds, and letters of credit to finance our projects. We believe that we can fund our current and foreseeable liquidity needs from the cash generated from operations and borrowings under our Restated Revolving Credit Facility and our existing Canadian letter of credit facilities.
The Predecessor Parent Company no longer provides financing support for our operations, so our current liquidity profile is significantly different from that of our predecessor. For the same reason, the historical interest expense (including capitalized interest) for predecessor periods ending prior to the July 2011 Acquisition will not be comparable to that for successor periods ending after the Acquisition.
The Acquisition and Financing Transactions and Basis of Presentation
The July 2011 Acquisition has been accounted for as a purchase under ASC Topic 805, Business Combinations . As a result of the change in ownership, our historical financial data for periods prior to the July 13, 2011 Acquisition (the predecessor periods) are derived from the historical financial statements of our predecessor, the North American business of Taylor Wimpey plc, which financial statements have been prepared using the historical cost basis of accounting that existed prior to the Acquisition. Our financial statements for periods from and after the July 13, 2011 Acquisition (the successor period) are derived from the financial statements of TMM Holdings, which already reflect adjustments made as a result of the application of purchase accounting in connection with the Acquisition. Therefore, the financial information for the predecessor period is not comparable with that for the successor periods.
42
In connection with the Acquisition, we incurred indebtedness, including $625.0 million of borrowings under the Sponsor Loan, $125.0 million of which was repaid through working capital in August 2011 pursuant to our recapitalization plan, $350.0 million of which was refinanced by the offering of the senior notes and $150.0 million of which was contributed or transferred to a subsidiary of TMM Holdings. We also have the ability to borrow under our Restated Revolving Credit Facility and Canadian letter of credit facilities from time to time as warranted by business needs. Since we operated largely as a stand-alone company prior to the Acquisition, we have not incurred significant incremental general and administrative expenses as a result of the separation from Taylor Wimpey plc. Additional cost savings within the organization may be achieved in the future. However, we cannot accurately predict, and there can be no assurances as to, the extent of any such savings.
Certain results for 2011 are presented to reflect the arithmetically combined historical results from the predecessor period from January 1, 2011 to July 12, 2011 and the successor period from July 13, 2011 to December 31, 2011. This presentation may yield results that are not directly comparable on a period-to-period basis with those in predecessor periods because of differences in accounting basis due to the change of ownership resulting from the Acquisition. The cost of home closings and the cost of land closings were the only line items directly impacted in any material respect by the purchase accounting adjustments described below (although the effects of such adjustments are carried through to the items below such line items in our statement of operations). For purposes of this Annual Report, however, we believe that it is most meaningful to present our results of operations for 2011 in this manner. The combined historical results for 2011 are not necessarily indicative of what the results for the period would have been had the Acquisition actually occurred as of January 1, 2011.
Home closings and land sales that occurred during the predecessor period do not reflect any purchase accounting adjustments to costs of home closings and costs of land closings, while home closings and land sales occurring during the successor period do reflect such purchase accounting adjustments to the cost of home closings and cost of land closings. The carrying values of home and land inventory were both increased and decreased in adjusting their carrying values to fair market value as of the closing of the Acquisition through the application of purchase accounting. Such adjustments may result in higher or lower costs of home and land closings in the successor period and future periods as compared to the predecessor period. For the successor period from July 13, 2011 to December 31, 2011, such adjustments increased our cost of home closings by $38.9 million and our cost of land closings by $0.9 million. For the successor years ended December 31, 2012, such adjustments increased our cost of home closings by $6.9 million and decreased our cost of land closings by $1.6 million and in 2013 by an immaterial amount.
Non-GAAP Measures
In addition to the results reported in accordance with U.S. GAAP, we have provided information in this Annual Report relating to "adjusted gross margins," and the results of "unconsolidated joint ventures."
Results of unconsolidated joint ventures
References to the information or results of "unconsolidated joint ventures" refer to our proportionate share of unconsolidated joint ventures in Canada and are included as non-GAAP measures because they are accounted for under the equity method. We believe that such results are useful to investors as an indication of the level of business activity of our joint ventures in Canada as well as the potential for cash and revenue generation from those joint ventures.
Adjusted gross margins
We calculate adjusted gross margin from U.S. GAAP gross margin by adding impairment charges attributable to the write-down of operating communities, and the amortization of capitalized interest through cost of home closings. We also discuss adjusted home closings gross margin, which is calculated by adding back to home closings gross margin the capitalized interest amortization and impairment charges related to the homes closed. Adjusted land closings gross margin is calculated similarly. Adjusted mortgage operations gross margin is calculated by adding back impairment charges attributable to the write-down of loans receivable. Management uses our adjusted gross margin measures to evaluate our performance on a consolidated basis as well as the performance of our segments. We believe these adjusted gross margins are relevant and useful to investors for evaluating our performance. These measures are considered non-GAAP financial measures and should be considered in addition to, rather than as a substitute for, the comparable U.S.
43
GAAP financial measures as measures of our operating performance. Although other companies in the homebuilding industry report similar information, the methods used may differ. We urge investors to understand the methods used by other companies in the homebuilding industry to calculate gross margins and any adjustments to such amounts before comparing our measures to those of such other companies.
Results of Operations
The following table sets forth our results of operations (Dollars in thousands):
| TMHC | Arithmetically Combined (Predeccessor/ TMHC) | TMHC | Predecessor | |||||||||||||||||||
| Year Ended December 31, 2013 | Year Ended December 31, 2012 | Year Ended December 31, 2011 | July 13 to December 31, 2011 | January 1 to July 12, 2011 | ||||||||||||||||||
Statements of Operations Data: | ||||||||||||||||||||||
Home closings revenue | $ | 2,264,985 | $ | 1,369,452 | $ | 1,331,285 | $ | 731,216 | $ | 600,069 | ||||||||||||
Land closings revenue | 27,881 | 44,408 | 24,296 | 10,657 | 13,639 | |||||||||||||||||
Mortgage operations revenue | 30,371 | 21,861 | 14,606 | 8,579 | 6,027 | |||||||||||||||||
|
|
|
|
|
|
|
|
|
| |||||||||||||
Total revenues | $ | 2,323,237 | $ | 1,435,721 | $ | 1,370,187 | $ | 750,452 | $ | 619,735 | ||||||||||||
Cost of home closings | 1,774,761 | 1,077,525 | 1,066,425 | 591,891 | 474,534 | |||||||||||||||||
Cost of land closings | 26,741 | 35,884 | 15,716 | 8,583 | 7,133 | |||||||||||||||||
Mortgage operations expenses | 16,446 | 11,266 | 8,313 | 4,495 | 3,818 | |||||||||||||||||
|
|
|
|
|
|
|
|
|
| |||||||||||||
Gross margin | $ | 505,289 | $ | 311,046 | $ | 279,733 | $ | 145,483 | $ | 134,250 | ||||||||||||
Sales, commissions and other marketing costs | 142,848 | 80,907 | 76,442 | 36,316 | 40,126 | |||||||||||||||||
General and administrative expenses | 90,743 | 60,444 | 68,626 | 32,883 | 35,743 | |||||||||||||||||
Equity in income of unconsolidated entities | (37,563 | ) | (22,964 | ) | (8,050 | ) | (5,247 | ) | (2,803 | ) | ||||||||||||
Interest (income) expense, net | (476 | ) | (2,446 | ) | (2,926 | ) | (3,867 | ) | 941 | |||||||||||||
Loss on extinguishment of debt | 10,141 | 7,953 | - | - | - | |||||||||||||||||
Other expense (income), net | 2,541 | 3,567 | (8,350 | ) | 2,308 | (10,658 | ) | |||||||||||||||
Indemnification and transaction expenses | 199,119 | 13,034 | 52,292 | 52,292 | - | |||||||||||||||||
|
|
|
|
|
|
|
|
|
| |||||||||||||
Income before income taxes | $ | 97,936 | $ | 170,551 | $ | 101,699 | $ | 30,798 | $ | 70,901 | ||||||||||||
Income tax provision (benefit) | 3,068 | (260,297 | ) | 24,912 | 4,031 | 20,881 | ||||||||||||||||
|
|
|
|
|
|
|
|
|
| |||||||||||||
Income before non-controlling interests, net of tax | $ | 94,868 | $ | 430,848 | $ | 76,787 | $ | 26,767 | $ | 50,020 | ||||||||||||
Loss (income) attributable to non-controlling interests – joint ventures | 131 | (28 | ) | (5,300 | ) | (1,178 | ) | (4,122 | ) | |||||||||||||
|
|
|
|
|
|
|
|
|
| |||||||||||||
Net income | $ | 94,999 | $ | 430,820 | $ | 71,487 | $ | 25,589 | $ | 45,898 | ||||||||||||
Income attributable to non-controlling interests – Principal Equityholders | (49,579 | ) | - | - | - | - | ||||||||||||||||
Net income available to Taylor Morrison Home Corporation | $ | 45,420 | $ | 430,820 | $ | 71,487 | $ | 25,589 | $ | 45,898 | ||||||||||||
|
|
|
|
|
|
|
|
|
| |||||||||||||
Gross margin as a % of revenue from home closings | 22.3 | % | 22.7 | % | 21.0 | % | 19.9 | % | 22.4 | % | ||||||||||||
Sales, commissions and other marketing costs as a % of revenue from home closings | 6.3 | % | 5.9 | % | 5.7 | % | 5.0 | % | 6.7 | % | ||||||||||||
General and administrative expenses as a % of revenue from home closings | 4.0 | % | 4.4 | % | 5.2 | % | 4.5 | % | 6.0 | % | ||||||||||||
Average sales price per home closed | $ | 382 | $ | 364 | $ | 347 | $ | 366 | $ | 326 | ||||||||||||
|
|
|
|
|
|
|
|
|
| |||||||||||||
44
Key Results
Key financial results as of and for the year ended December 31, 2013, as compared to the same period in 2012, are as follows:
| • | Net sales orders increased 17.7% from 4,842 homes (including 360 homes in unconsolidated joint ventures) to 5,697 homes (including 83 homes in unconsolidated joint ventures). Orders in our East segment increased from 2,077 homes to 3,255 homes, while orders in our West segment increased from 1,661 homes to 1,763 homes. Orders in our Canada segment, including our share of joint ventures, decreased from 1,104 to 679 homes. |
| • | Homes closed increased 56.2% from 4,014 homes (including 232 homes in unconsolidated joint ventures) to 6,270 homes (including 441 homes in unconsolidated joint ventures), with an increase in the average selling price of those homes closed of 5.0% to $382,000. Homes closed in our East segment increased from 1,661 homes to 2,913 homes, while home closings in the West segment increased from 1,272 homes to 1,803 homes. Closings in Canada, including our share of joint ventures, increased from 1,081 homes to 1,554 homes. |
| • | Homebuilding revenues increased 65.4%, from $1.4 billion to $2.3 billion. |
| • | Gross margin remained constant at 21.7%. |
| • | Selling, commissions and marketing costs increased 76.6% from $80.9 million to $142.8 million, and as a percentage of total revenues increased slightly from 5.6% to 6.1%. |
| • | General and administrative expenses increased 50.1% from $60.4 million to $90.7 million, and as a percentage of total revenues decreased slightly from 4.2% to 4.0%. |
| • | In 2013 we incurred a charge of $88.5 million related to the tax indemnity item, and in connection with, the following IPO-related Reorganization Transactions, we incurred one time charges of: $80.2 million for the modification of the TMM Holdings Class J Units, $29.8 million to terminate the management services agreement and $10.1 million related to early extinguishment of debt. |
Year Ended December 31, 2013 Compared to Year Ended December 31, 2012
Average Active Selling Communities
| Year Ended December 31, | ||||||||||||
| 2013 | 2012 | Change | ||||||||||
East | 120.7 | 74.6 | 61.8 | % | ||||||||
West | 37.6 | 33.2 | 13.3 | |||||||||
|
|
|
| |||||||||
Subtotal U.S . | 158.3 | 107.8 | 46.8 | % | ||||||||
|
|
|
| |||||||||
Canada | 14.8 | 14.0 | 5.7 | |||||||||
|
|
|
| |||||||||
Subtotal North America | 173.1 | 121.8 | 42.1 | % | ||||||||
Unconsolidated joint ventures (1) | 4.0 | 6.9 | (42.0 | ) | ||||||||
|
|
|
| |||||||||
Total | 177.1 | 128.7 | 37.6 | % | ||||||||
|
|
|
| |||||||||
| (1) | Represents the average number of total communities in which our joint ventures were actively selling during the period. |
Average active selling communities increased 37.6% from the year ended December 31, 2012 to the year ended December 31, 2013 with the largest increase in the East segment, primarily due to the addition of 43 Darling Homes communities. We opened new communities and completed existing communities throughout all of our markets during 2013, with the largest number of additions in our West Florida, Phoenix and Houston divisions, where demand and our land positions afforded us the opportunity. We open communities when we believe we have the greatest probability of capitalizing on favorable market conditions in which the community is located.
45
Net Sales Orders
| Year Ended December 31, (1) | ||||||||||||||||||||||||||||||||||||
| (Dollars in thousands ) | Net Homes Sold | Sales Value | Average Selling Price | |||||||||||||||||||||||||||||||||
| 2013 | 2012 | Change | 2013 | 2012 | Change | 2013 | 2012 | Change | ||||||||||||||||||||||||||||
East | 3,255 | 2,077 | 56.7 | % | $ | 1,266,461 | $ | 692,287 | 82.9 | % | $ | 389 | $ | 333 | 16.7 | % | ||||||||||||||||||||
West | 1,763 | 1,661 | 6.1 | 839,764 | 612,428 | 37.1 | 476 | 369 | 29.2 | |||||||||||||||||||||||||||
|
|
|
|
|
|
|
| |||||||||||||||||||||||||||||
Subtotal U.S . | 5,018 | 3,738 | 34.2 | % | $ | 2,106,225 | $ | 1,304,715 | 61.4 | % | $ | 420 | $ | 349 | 20.3 | % | ||||||||||||||||||||
Canada | 596 | 744 | (19.9 | ) | 265,367 | 309,584 | (14.3 | ) | 445 | 416 | 7.0 | |||||||||||||||||||||||||
|
|
|
|
|
|
|
| |||||||||||||||||||||||||||||
Subtotal North America | 5,614 | 4,482 | 25.3 | % | $ | 2,371,592 | $ | 1,614,299 | 46.9 | % | $ | 422 | $ | 360 | 17.3 | % | ||||||||||||||||||||
Unconsolidated joint ventures (2) | 83 | 360 | (76.9 | ) | 30,812 | 82,845 | 62.8 | 371 | 230 | 61.1 | ||||||||||||||||||||||||||
|
|
|
|
|
|
|
| |||||||||||||||||||||||||||||
Total | 5,697 | 4,842 | 17.7 | % | $ | 2,402,404 | $ | 1,697,144 | 41.6 | % | $ | 422 | $ | 351 | 20.3 | % | ||||||||||||||||||||
|
|
|
|
|
|
|
| |||||||||||||||||||||||||||||
| (1) | Net sales orders represent the number and dollar value of new sales contracts executed with customers. High-rise sales are generally not recognized until a building is approved for construction. High-rise sales typically do not close in the year sold. Other sales are recognized after a contract is signed and the rescission period has ended. |
| (2) | Includes only proportionate share of unconsolidated joint ventures. |
The value of net sales orders, including those of unconsolidated joint ventures, increased by 41.6% to $2.4 billion in the year ended December 31, 2013, from $1.7 billion in the year ended December 31, 2012. The number of net homes sold, including those of unconsolidated joint ventures, increased 17.7% to 5,697 homes (including 83 homes in unconsolidated joint ventures) in the year ended December 31, 2013 from 4,842 homes (including 360 in unconsolidated joint ventures) in the year December 31, 2012. These results were driven by the continued strong demand in the U.S. spring selling season in 2013, during which we benefited from higher selling prices as consumers in the market gained confidence in the values present in the marketplace, historically low interest rates and improved macro economic conditions. The improved homebuilding market significantly impacted areas such as Phoenix, West Florida and Northern California resulting in an increase in the number of units sold and related revenue for the year ended December 31, 2013 over the prior year comparable period. The Canada segment experienced a decline of 425 units (including units in joint ventures) in net new homes sold in the year ended December 31, 2013 when compared to the same period last year. The decrease is attributable to the lower availability of saleable product in the segment in the year ended December 31, 2013 and moderating local economic conditions.
We expect that, to the extent economic and housing conditions improve in the markets in which we operate, net homes sold and aggregate sales value will increase. Average selling price is dependent to a large degree on product type, which communities are being actively sold and consumer demand.
Sales Order Cancellations-Units
| Year Ended December 31, | ||||||||||||||||
| Cancelled Sales Orders | Cancellation Rate (1) | |||||||||||||||
| 2013 | 2012 | 2013 | 2012 | |||||||||||||
East | 533 | 363 | 14.1 | % | 14.9 | % | ||||||||||
West | 306 | 243 | 14.8 | 12.8 | ||||||||||||
|
|
|
| |||||||||||||
Subtotal U.S./weighted average | 839 | 606 | 14.3 | % | 14.0 | % | ||||||||||
Canada | 10 | 19 | 1.7 | 2.5 | ||||||||||||
|
|
|
| |||||||||||||
Subtotal North America/weighted average | 849 | 625 | 13.1 | % | 12.2 | % | ||||||||||
Unconsolidated joint ventures (2) | 1 | 6 | 1.2 | 1.8 | ||||||||||||
|
|
|
| |||||||||||||
Total/weighted average | 850 | 631 | 13.0 | % | 11.5 | % | ||||||||||
|
|
|
| |||||||||||||
| (1) | Cancellation rate represents the number of cancelled sales orders divided by gross sales orders. |
| (2) | Includes only proportionate share of unconsolidated joint ventures. |
46
The number of our sales order cancellations, including those of unconsolidated joint ventures, increased due to increases in sales volume, from 631 in the year ended December 31, 2012 to 850 in the year ended December 31, 2013. The cancellation rate increased 150 basis points from 11.5% in the year ended December 31, 2012 to 13.0% for the year ended December 31, 2013. This increase was due to a decrease in the proportion of units ordered in Canada, which typically has a cancellation rate around 2% as sales contracts are under specific performance conditions, as compared to the U.S. where a buyer generally has a greater ability to cancel a sales contract. Our continued scrutiny of potential buyers, consumer-friendly lending markets, use of prequalification strategies, as well as our increased deposit amounts, help us maintain a low cancellation rate.
Sales Order Backlog
| As of December 31, | ||||||||||||||||||||||||||||||||||||
| (Dollars in thousands) | Sold Homes in Backlog (1) | Sales Value | Average Selling Price | |||||||||||||||||||||||||||||||||
| 2013 | 2012 | Change | 2013 | 2012 | Change | 2013 | 2012 | Change | ||||||||||||||||||||||||||||
East | 1,544 | 1,202 | 28.5 | % | $ | 667,725 | $ | 474,086 | 40.8 | % | $ | 432 | $ | 394 | 9.6 | % | ||||||||||||||||||||
West | 622 | 662 | (6.0 | ) | 320,029 | 241,947 | 32.3 | 515 | 365 | 40.8 | ||||||||||||||||||||||||||
|
|
|
|
|
|
|
| |||||||||||||||||||||||||||||
Subtotal U.S. | 2,166 | 1,864 | 16.2 | % | 987,754 | 716,033 | 37.9 | % | $ | 456 | $ | 384 | 18.7 | % | ||||||||||||||||||||||
Canada | 822 | 1,339 | (38.6 | ) | 259,352 | 419,607 | (38.2 | ) | 316 | 313 | 0.7 | |||||||||||||||||||||||||
|
|
|
|
|
|
|
| |||||||||||||||||||||||||||||
Subtotal North America | 2,988 | 3,203 | (6.7 | )% | $ | 1,247,106 | $ | 1,135,640 | 9.8 | % | $ | 417 | $ | 355 | 17.7 | % | ||||||||||||||||||||
Unconsolidated joint ventures (2) | 548 | 909 | (39.7 | ) | 195,979 | 313,294 | (37.4 | ) | 358 | 345 | 3.8 | |||||||||||||||||||||||||
|
|
|
|
|
|
|
| |||||||||||||||||||||||||||||
Total | 3,536 | 4,112 | (14.0 | )% | $ | 1,443,085 | $ | 1,448,934 | (0.4 | )% | $ | 408 | $ | 352 | 15.8 | % | ||||||||||||||||||||
|
|
|
|
|
|
|
| |||||||||||||||||||||||||||||
| (1) | Sales order backlog represents homes under contract for which revenue has not yet been recognized at the end of the period (including homes sold but not yet started). Some of the contracts in our sales order backlog are subject to contingencies including mortgage loan approval and buyers selling their existing homes, which can result in cancellations. |
| (2) | Reflects our proportionate share of unconsolidated joint ventures. |
Our homes in backlog at December 31, 2013 decreased by 14.0% from December 31, 2012. This decrease was driven in part by an increase in the number of homes closed in 2013 compared to 2012 and the delivery of two joint venture and one wholly owned high-rise building in our Canada segment. In 2013, we did not launch any new towers for sale. The decrease is also a result of timing as the home delivery cycle has continued to show efficiencies. The above decreases are partially offset by the acquisition of Darling Homes in our East segment, which added units in backlog. Our backlog of 3,536 homes, including 548 homes in unconsolidated joint ventures, was valued at $1.4 billion as compared to 4,112 homes, including 909 homes in unconsolidated joint ventures, at December 31, 2012, valued at $1.4 billion.
Home Closings Revenue
| Year Ended December 31, | ||||||||||||||||||||||||||||||||||||
| (Dollars in thousands) | Homes Closed | Sales Value (1) | Average Selling Price | |||||||||||||||||||||||||||||||||
| 2013 | 2012 | Change | 2013 | 2012 | Change | 2013 | 2012 | Change | ||||||||||||||||||||||||||||
East | 2,913 | 1,661 | 75.4 | % | $ | 1,094,578 | $ | 529,686 | 106.6 | % | $ | 376 | $ | 319 | 17.8 | % | ||||||||||||||||||||
West | 1,803 | 1,272 | 41.7 | 763,372 | 456,512 | 67.2 | 423 | 359 | 18.0 | |||||||||||||||||||||||||||
|
|
|
|
|
|
|
| |||||||||||||||||||||||||||||
Subtotal U.S. | 4,716 | 2,933 | 60.8 | % | $ | 1,857,950 | $ | 986,198 | 88.4 | % | $ | 394 | $ | 336 | 17.2 | % | ||||||||||||||||||||
Canada | 1,113 | 849 | 31.1 | 407,035 | 383,254 | 6.2 | 366 | 451 | (19.0 | ) | ||||||||||||||||||||||||||
|
|
|
|
|
|
|
| |||||||||||||||||||||||||||||
Subtotal North America | 5,829 | 3,782 | 54.1 | % | $ | 2,264,985 | $ | 1,369,452 | 65.4 | % | $ | 389 | $ | 362 | 7.3 | % | ||||||||||||||||||||
Unconsolidated joint ventures (2) (3) | 441 | 232 | 90.1 | 132,525 | 90,791 | 46.0 | 301 | 391 | (23.2 | ) | ||||||||||||||||||||||||||
|
|
|
|
|
|
|
| |||||||||||||||||||||||||||||
Total | 6,270 | 4,014 | 56.2 | % | $ | 2,397,510 | $ | 1,460,243 | 64.2 | % | $ | 382 | $ | 364 | 5.0 | % | ||||||||||||||||||||
|
|
|
|
|
|
|
| |||||||||||||||||||||||||||||
| (1) | Home closings revenue represents homes where possession has transferred to the buyer. |
| (2) | Reflects our proportionate share of unconsolidated joint ventures. |
| (3) | Unconsolidated joint venture revenue is not reported as revenue but is recognized as a component of income of unconsolidated entities. Included here on a non-GAAP basis for informational purposes only. |
47
Home closings revenue (including unconsolidated joint venture home closings revenue), increased 64.2% from $1.5 billion in the year ended December 31, 2012, to $2.4 billion in the year ended December 31, 2013. Home closings revenue (excluding unconsolidated joint ventures) increased from $1.4 billion in the year ended December 31, 2012 to $2.3 billion in the year ended December 31, 2013. The average selling price of homes closed (including unconsolidated joint ventures) during the year ended December 31, 2013 was $382,000, up 5.0% from the $364,000 average selling price in the year ended December 31, 2012. Sales backlog converted in our Phoenix, Houston and West Florida markets, as well as with the Darling Acquisition, surpassed prior periods by significant amounts driving both units and revenue dollars higher. In Canada, the decrease in average home closings sales price was due to a product mix shift into move-up communities located in affordable areas of the GTA during 2013 and a shift in mix from single-family to high-rise units as reflected in the increase in the number of homes closed.
Land Closings Revenue
| Year Ended December 31, | ||||||||||||
| (In thousands) | 2013 | 2012 | Change | |||||||||
East | $ | 22,720 | $ | 28,837 | (21.2 | )% | ||||||
West | 5,040 | 4,286 | 17.6 | |||||||||
|
|
|
| |||||||||
Subtotal U.S. | $ | 27,760 | $ | 33,123 | (16.2 | )% | ||||||
Canada | 121 | 11,285 | (98.9 | ) | ||||||||
|
|
|
| |||||||||
Total | $ | 27,881 | $ | 44,408 | (37.2 | )% | ||||||
|
|
|
| |||||||||
Land closings revenue decreased 37.2% to $27.9 million in the year ended December 31, 2013, from $44.4 million in the year ended December 31, 2012. We generally purchase land and lots with the intent to build and sell homes on them. However, in some locations where we act as a developer, we occasionally purchase land that includes commercially zoned parcels, which we typically sell to commercial developers. We also sell residential lots or land parcels to manage our land and lot supply on larger tracts of land for which we would otherwise not achieve financial returns that are in line with internal expectations based on longer development timelines. During 2013 we recorded various land sales in our Phoenix, Northern California, Houston, Dallas, Austin and Canadian markets as part of planned dispositions relating to development. Land and lot sales occur at various intervals and varying degrees of profitability. Therefore, the revenue and gross margin from land closings fluctuate from period to period.
Home Closings Gross Margin
The following table sets forth a reconciliation between our home closings gross margin and our adjusted home closings gross margin. Adjusted gross margins are non-GAAP financial measures calculated based on gross margins, excluding impairments and capitalized interest amortization. See Non-GAAP Measures - Adjusted gross margins of this MD&A.
| Year Ended December 31, | ||||||||
| (In thousands) | 2013 | 2012 | ||||||
Home closings revenue | $ | 2,264,985 | $ | 1,369,452 | ||||
Cost of home closings | 1,774,761 | 1,077,525 | ||||||
|
|
|
| |||||
Home closings gross margin | $ | 490,224 | $ | 291,927 | ||||
Capitalized interest amortization | 50,224 | 28,757 | ||||||
|
|
|
| |||||
Adjusted home closings gross margin | $ | 540,448 | $ | 320,684 | ||||
|
|
|
| |||||
Home closings gross margin % | 21.6 | % | 21.3 | % | ||||
Adjusted home closings gross margin % | 23.9 | % | 23.4 | % | ||||
Our home closings gross margin increased in the year ended December 31, 2013 to $490.2 million, from $291.9 million in the year ended December 31, 2012. As a percentage of revenue, our home closings gross margin increased 30 basis points, to 21.6% in the year ended December 31, 2013 from 21.3% in the year ended December 31, 2012. The increase in home closings gross margin percentage in the year ended December 31, 2013 was primarily due to a shift to higher
48
margin product mix across our U.S. markets, particularly in the Northern California, Austin and Phoenix markets, where our move-up and luxury homes produced higher margins in the improving markets. Consumer demand in these areas allowed continued price increases and we were able to achieve higher margins than in the prior year period. Our price increases generally exceed construction and land price increases in our markets to date. Our Canada home closings gross margin decreased in 2013 as we benefited in 2012 from higher average selling prices and higher margin communities closed in 2012.
Adjusted home closings gross margin increased by 68.5% to $540.4 million in the year ended December 31, 2013, from $320.7 million in the year ended December 31, 2012, and as a percentage of home closings revenue increased by 50 basis points, to 23.9%. The increase in adjusted home closings gross margin percentage was primarily due to our increased margins in the aforementioned markets.
Segment Gross Margins
East Segment
The following table sets forth a reconciliation between our East segment gross margins (home closings, land closings and home and land closings) and our corresponding East segment adjusted gross margins. See Non-GAAP Measures - Adjusted gross margins of this MD&A.
| Year Ended December 31, | ||||||||
| (In thousands) | 2013 | 2012 | ||||||
Home Closings | ||||||||
Home closings revenue | $ | 1,094,578 | $ | 529,686 | ||||
Cost of home closings | 867,053 | 421,204 | ||||||
|
|
|
| |||||
Home closings gross margin | $ | 227,525 | $ | 108,482 | ||||
Capitalized interest amortization | 15,310 | 9,409 | ||||||
|
|
|
| |||||
Adjusted home closings gross margin | $ | 242,835 | $ | 117,891 | ||||
|
|
|
| |||||
Home closings gross margin % | 20.8 | % | 20.5 | % | ||||
Adjusted home closings gross margin % | 22.2 | % | 22.3 | % | ||||
Land Closings | ||||||||
Land closings revenue | $ | 22,720 | $ | 28,837 | ||||
Cost of land closings | 22,549 | 25,895 | ||||||
|
|
|
| |||||
Land gross margin | $ | 171 | $ | 2,942 | ||||
Capitalized interest amortization | 631 | 1,497 | ||||||
|
|
|
| |||||
Land adjusted gross margin | $ | 802 | $ | 4,439 | ||||
|
|
|
| |||||
Land gross margin % | 0.8 | % | 10.2 | % | ||||
Land adjusted gross margin % | 3.5 | % | 15.4 | % | ||||
Home and Land Closings | ||||||||
Home and land closings revenue | $ | 1,117,298 | $ | 558,523 | ||||
Cost of home and land closings | 889,602 | 447,099 | ||||||
|
|
|
| |||||
Gross margin | $ | 227,696 | $ | 111,424 | ||||
Capitalized interest amortization | 15,941 | 10,906 | ||||||
|
|
|
| |||||
Adjusted gross margin | $ | 243,637 | $ | 122,330 | ||||
|
|
|
| |||||
Gross margin % | 20.4 | % | 19.9 | % | ||||
Adjusted gross margin % | 21.8 | % | 21.9 | % | ||||
49
For the year ended December 31, 2013, the acquisition of Darling Homes and its integration into our operations accounted for a significant portion of the increases in our East segment home closings revenue, home closings gross margin and adjusted home closings gross margin. During the year ended December 31, 2013, home closings revenue in the East segment was $1.1 billion, an increase of 106.6% compared to the year ended December 31, 2012. The increase was driven by an increase in home closings of 75.4% to 2,913 homes, compared to 1,661 homes in the prior year. The continued improvement throughout the East segment markets, as well as favorable home buyer demand for communities opened in prior periods also contributed to closing revenue increases. The number of average active selling communities in the East segment increased 61.8% to 121 communities in the year ended December 31, 2013 from 75 communities in the prior year. Net homes sold increased by 56.7% to 3,255 homes, compared to 2,077 homes in the prior period, driving sales order value higher by 82.9% to $1.3 billion compared to $692.3 million for the year ended December 31, 2012. Sales order cancellation rates in the East segment declined to 14.1% in the year ended December 31, 2013, compared to 14.9% in the prior year. The East segment also had an average monthly sales pace of 2.2 homes per community in the year ended December 31, 2013, which is consistent with the year ended December 31, 2012. Average home closings sales price in the East segment increased 17.8% to $376,000, from $319,000 in the prior year from a combination of price appreciation and product mix. The average sales order price also increased by $56,000, or 16.7% as management in this segment diligently looks to reduce customer incentives and other promotions, and increases sales prices as market conditions allow. Backlog sales value in the East segment increased 40.8% in the year ended December 31, 2013 over the prior year due to a 28.5% increase in backlog units and a 9.6% increase in the average sales price of backlog homes. The increase in backlog units is due primarily to the addition of Darling in December 2012. Overall, the improvement in East segment home closings revenue, sales prices and sales pace has been due primarily to our well-located land positions, an increase in active selling communities and our consumer-driven offerings.
During the year ended December 31, 2013, home closings gross margin for the East segment was 20.8%, up 30 basis points from 20.5% for the year ended December 31, 2012. East segment adjusted home closings gross margin was 22.2% in the year ended December 31, 2013 consistent with 22.3% for the same period in 2012. We recorded purchase accounting adjustments on the assets acquired in the Darling Acquisition that reduced home closings gross margin percentage in earlier quarters that were offset eventually by sales price increases. Our Austin and North Florida divisions recorded the largest increases in home closings gross margin percentage, but all divisions recorded some levels of increase. The recovery and improved stabilization of the West Florida market, which has recently tended to generate lower home closings margins, began when sustained consumer demand returned in the Tampa and Ft. Myers areas of Florida, and we were able to leverage land with a low cost basis and produce homes at a higher price point than in the prior year. The Austin and Houston markets improved from the prior year, as we were able to increase prices on our move-up offerings and maintain stable land and construction costs. To the extent that the overall U.S. economic recovery and, in particular, the housing market recovery in our East segment markets continues, we expect that our margin performance will continue to be favorable.
50
West Segment
The following table sets forth a reconciliation between our West segment gross margins (home closings, land closings and home and land closings) and our corresponding West segment adjusted gross margins. See Non-GAAP Measures - Adjusted gross margins of this MD&A.
| Year Ended December 31, | ||||||||
| (In thousands) | 2013 | 2012 | ||||||
Home Closings | ||||||||
Home closings revenue | $ | 763,372 | $ | 456,512 | ||||
Cost of home closings | 590,401 | 374,775 | ||||||
|
|
|
| |||||
Home closings gross margin | $ | 172,971 | $ | 81,737 | ||||
Capitalized interest amortization | 18,837 | 9,474 | ||||||
|
|
|
| |||||
Adjusted home closings gross margin | $ | 191,808 | $ | 91,211 | ||||
|
|
|
| |||||
Home closings gross margin % | 22.7 | % | 17.9 | % | ||||
Adjusted home closings gross margin % | 25.1 | % | 20.0 | % | ||||
Land Closings | ||||||||
Land closings revenue | $ | 5,040 | $ | 4,286 | ||||
Cost of land closings | 3,766 | 1,401 | ||||||
|
|
|
| |||||
Land gross margin | $ | 1,274 | $ | 2,885 | ||||
Capitalized interest | 115 | 32 | ||||||
|
|
|
| |||||
Land adjusted gross margin | $ | 1,389 | $ | 2,917 | ||||
|
|
|
| |||||
Land gross margin % | 25.3 | % | 67.3 | % | ||||
Land adjusted gross margin % | 27.6 | % | 68.1 | % | ||||
Home and Land Closings | ||||||||
Home and land closings revenue | $ | 768,412 | $ | 460,798 | ||||
Cost of home and land closings | 594,167 | 376,176 | ||||||
|
|
|
| |||||
Gross margin | $ | 174,245 | $ | 84,622 | ||||
Capitalized interest | 18,952 | 9,506 | ||||||
|
|
|
| |||||
Adjusted gross margin | $ | 193,197 | $ | 94,128 | ||||
|
|
|
| |||||
Gross margin % | 22.7 | % | 18.4 | % | ||||
Adjusted gross margin % | 25.1 | % | 20.4 | % | ||||
Home closing revenue in the West segment increased by $306.9 million in the year ended December 31, 2013 compared to the prior year. The 67.2% increase in home closing revenue was due to an 18.0% increase in average home closing selling price and a 41.7% increase in the number of homes closed. The West segment closed 1,803 homes in the year ended December 31, 2013 compared to 1,272 in the prior year. The number of average active selling communities in the West segment increased 13.3% in the year ended December 31, 2013 when compared to the prior year. We sold 1,763 homes in the West segment in the year ended December 31, 2013, which represents a 6.1% increase compared to the same period last year. The availability of product and timing of releases within communities provided saleable inventory that was well-received by consumers. Net sales order value increased to $840.0 million from $612.4 million or 37.1%, in the year ended December 31, 2013 compared to the prior year. The average sales per community per month for the years ending December 31, 2013 and 2012 were 3.9 and 4.2, respectively. The average home closing selling price increased 18.0%, to $423,000 in the year ended December 31, 2013 compared to $359,000 in the prior year. Overall, during the year ended December 31, 2013, revenues improved in the West segment compared to the same period in 2012 primarily due to housing market recoveries and advances in the Phoenix and Northern California divisions. We continue to see strong demand in these markets and are systematically releasing product into the marketplace to capture and maintain increased operating margins, as evidenced by the 40.8% year-over-year increase in average sales price of our backlog homes. Backlog units in the West segment have decreased 6% from the prior year, although total backlog sales value has increased 32.3% due to the average sales price increase noted above.
51
During the year ended December 31, 2013, home closings gross margin for the West segment was 22.7%, up from 17.9% for the year ended December 31, 2012. Adjusted home closings gross margin in the West segment increased by 510 basis points in the year ended December 31, 2013, compared to the year ended December 31, 2012. The increase in home closings gross margin and adjusted home closings gross margin was primarily due to our ability to control our construction costs, while increasing our average home closing selling price by 18.0% in 2013 compared to 2012. All divisions increased gross margin percentage during the period. The Northern California and Phoenix divisions experienced the highest percentage of price increases during the year and also were able to contain construction costs as the volume of construction within our communities in those markets allowed us to effectively manage cost pressures on construction materials and labor. If the recovery in our West segment markets continues, we expect that our margin performance will continue to be favorable. We believe that the backlog margins and magnitude in the West segment indicate that the recovery in that segment has become more well-established.
Canadian Segment
The following table sets forth a reconciliation between our Canada gross margins (home closings, land closings and home and land closings) and our corresponding Canada adjusted gross margins. See Non-GAAP Measures - Adjusted gross margins of this MD&A.
| Year Ended December 31, | ||||||||
| (In thousands) | 2013 | 2012 | ||||||
Home Closings | ||||||||
Home closings revenue | $ | 407,035 | $ | 383,254 | ||||
Cost of home closings | 317,307 | 281,546 | ||||||
|
|
|
| |||||
Home closings gross margin | $ | 89,728 | $ | 101,708 | ||||
Capitalized interest amortization | 16,077 | 9,874 | ||||||
|
|
|
| |||||
Adjusted home closings gross margin | $ | 105,805 | $ | 111,582 | ||||
|
|
|
| |||||
Home closings gross margin % | 22.0 | % | 26.5 | % | ||||
Adjusted home closings gross margin % | 26.0 | % | 29.1 | % | ||||
Land Closings | ||||||||
Land closings revenue | $ | 121 | $ | 11,285 | ||||
Cost of land closings | 426 | 8,588 | ||||||
|
|
|
| |||||
Land gross margin | $ | (305 | ) | $ | 2,697 | |||
Capitalized interest | - | 30 | ||||||
|
|
|
| |||||
Land adjusted gross margin | $ | (305 | ) | $ | 2,727 | |||
|
|
|
| |||||
Land gross margin % | (252.1 | )% | 23.9 | % | ||||
Land adjusted gross margin % | (252.1 | )% | 24.2 | % | ||||
Home and Land Closings | ||||||||
Home and land closings revenue | $ | 407,156 | $ | 394,539 | ||||
Cost of home and land closings | 317,733 | 290,134 | ||||||
|
|
|
| |||||
Gross margin | $ | 89,423 | $ | 104,405 | ||||
Capitalized interest | 16,077 | 9,904 | ||||||
|
|
|
| |||||
Adjusted gross margin | $ | 105,500 | $ | 114,309 | ||||
|
|
|
| |||||
Gross margin % | 22.0 | % | 26.5 | % | ||||
Adjusted gross margin % | 25.9 | % | 29.0 | % | ||||
Canada segment home closings revenue for the year ended December 31, 2013 increased by 6.2% to $407.0 million, compared to $383.3 million for the year ended December 31, 2012. The number of home closing units in the year ended December 31, 2013 increased by 31.1% compared to the year ended December 31, 2012. Canada segment revenues and number of closings were affected by the timing of high-rise closings. In the year ended December 31, 2012, we began closing one joint venture tower, Nautilus, which had 382 of its 389 units close in the period, accounting for more than
52
$8.1 million in joint venture income, while in 2013, we recognized $27.0 million of joint venture income on 862 of 879 units from closings at our joint venture high-rise buildings Couture and Encore. Income from joint venture closings is included as a component of equity in income of unconsolidated entities and not included in homebuilding revenue. During the year ended December 31, 2013 we closed 422 of 423 units in our wholly owned tower Ultra, which produced $104.3 million of revenue. The average home closings sales price was 19.0% lower for the year ended December 31, 2013 when compared to the same period last year. This decrease was due to a product mix shift into move-up communities located in affordable areas of the GTA during 2013 and a shift in mix between single-family and high-rise units. The Canada segment experienced a decline of 148 units in net new homes sold in the year ended December 31, 2013 when compared to the same period last year, which is attributable to the timing of high-rise sales launches, the close-out of some historically higher volume communities and new product availability. The decline in home sales from a tempered sales pace and a product mix change have contributed to the reduced aggregate sales values during 2013. Our total sales value in the year ended December 31, 2013 was $265.4 million compared to $309.6 million in the prior year period. Average sales price increased by $29,000 or 7.0%, and average sales value declined 14.3% when comparing the year ended December 31, 2013 to the year ended December 31, 2012. The average sales per community per month were 3.4 and 4.4 for the years ended December 31, 2013 and 2012, respectively. We believe 2013 represents a normalized pace in the segment. We continue to implement our margin over volume approach to selling in our communities.
Home closings gross margin for the year ended December 31, 2013 for the Canada segment was 22.0%, compared to 26.5% for the year ended December 31, 2012. The adjusted home closings gross margin for the Canada segment was 310 basis points lower in 2013, when compared to 2012. The decreases in home closings gross margin and adjusted home closings gross margin were due to a shift in product sales, as more wholly owned multi-family units closed during 2013, whereas legacy single family products with favorable cost basis closed out during 2012. Currently we anticipate, in light of slowing job growth in Ontario relative to the recent past, ongoing global economic uncertainty and increasing units under construction, that growth in the Ontario housing market will moderate in the near term and return to paces and prices that more closely resemble the long-term historical averages.
Mortgage Operations
Our Mortgage Operations segment, which provides mortgage lending through TMHF and title services through various joint ventures in our Florida markets, is highly dependent on our sales and closings volumes.
| Year Ended December 31, | ||||||||
| (In thousands) | 2013 | 2012 | ||||||
Mortgage operations revenue | $ | 30,371 | $ | 21,861 | ||||
Mortgage operations expense | 16,446 | 11,266 | ||||||
|
|
|
| |||||
Mortgage operations gross margin | $ | 13,925 | $ | 10,595 | ||||
Impairments | - | - | ||||||
|
|
|
| |||||
Adjusted mortgage operations gross margin | $ | 13,925 | $ | 10,595 | ||||
|
|
|
| |||||
Mortgage operations margin % | 45.8 | % | 48.5 | % | ||||
Adjusted mortgage operations margin % | 45.8 | % | 48.5 | % | ||||
Our Mortgage Operations segment's revenue increased from $21.9 million in the year ended December 31, 2012 to $30.4 million in the year ended December 31, 2013, due primarily to increased closings volume and average loan amounts. The decrease in gross margin was due primarily to increases in mortgage underwriting costs driven by increased staffing for compliance initiatives as well as increased costs to integrate Darling. Our capture rate of 78% was down slightly from the prior period as we transitioned our Darling Homes operations from the legacy provider to TMHF.
Sales, Commissions and Other Marketing Costs
For the year ended December 31, 2013 and 2012, sales, commissions, and other marketing costs such as advertising and sales office expenses were $142.8 million and $80.9 million, respectively, which is a 76.6% increase year over year. This increase reflects a 54.1% increase in homes closed (excluding joint ventures) as well as an increase in average selling price. Our U.S. segments tend to have higher per-unit commissions, so our mix of commissions paid moved in
53
tandem with our U.S. operations, where we closed 60.8% more homes in the year ended December 31, 2013 as compared to the same period in 2012. Additionally, our Canadian high-rise closings bear the cost of a real estate broker commission while the single family Canadian closings generally do not have these commissions. As a percentage of home sales revenue, sales commissions and other marketing costs increased to 6.3% from 5.9% for the year ended December 31, 2013 and 2012 respectively. An increase in external commissions paid and a higher selling cost structure at Darling, added to the increase year over year as consumers leveraged outside professionals more prominently than in the prior period.
General and Administrative Expenses
For the year ended December 31, 2013, general and administrative expenses were $90.7 million as compared to $60.4 million in the same period in 2012, which represents a 50.1% increase. General and administrative expenses were 3.9% as a percentage of total revenue in the year ended December 31, 2013, compared to 4.2% in the same period in 2012 due to our diligent cost containment strategy as we pursue synergies within the business relating to our recent acquisition. We were also able to leverage our existing infrastructure while increasing closings by 54.1%. We recorded $2.9 million of expense for the options and restricted stock units granted in connection with our IPO and grants under our equity compensation plan during the remainder of the year. There are no comparable amounts in the corresponding prior period. In 2012, we recorded a discrete reversal of legal accruals related to a favorable legal settlement of $9.1 million. Excluding the legal reversal in 2012, general and administrative expenses were 5.7% of total revenue.
Equity in Income of Unconsolidated Entities
Equity in income of unconsolidated entities was $37.6 million for the year ended December 31, 2013 compared to $23.0 million for the year ended December 31, 2012. Our joint venture income comes largely from the Nautilus, Encore and Couture high-rises and single family projects in our Canada segment. During the comparative periods we experienced similar margins but recognized 86.2% more closings in 2013 with a larger proportion of these closings in high rise buildings, which generally have lower margins than our low rise product.
Interest (Income) Expense, net
Interest expense represents interest incurred, but not capitalized, on our long-term debt and other borrowings. Purchase accounting from the Acquisition eliminated the accumulated capitalized interest on the balance sheet as of the Acquisition date. Interest (income) expense, net for the years ending December 31, 2013 and 2012, was $0.5 million of income and $2.4 million of income, respectively.
Loss on Extinguishment of Debt
During 2012, we prepaid $350.0 million of the Sponsor Loan with proceeds from the 2020 Senior Notes issued in April 2012. The remaining $150.0 million of the Sponsor Loan was exchanged for equity interests. The amount of the Sponsor Loan that was retired had been borrowed at a discount of 2.5% and consequently, the $7.9 million of unamortized portion of the discount was written off during 2012 to expense.
On April 12, 2013, we used $204.2 million of the net proceeds of the IPO, which were contributed to the Bond Co-Issuers, to redeem $189.6 million aggregate principal amount of 2020 Senior Notes (at a purchase price equal to 103.875% of their principal amount, plus accrued and unpaid interest of $7.3 million through the date of redemption). We wrote off $4.6 million of unamortized issuance costs, expensed $1.8 million of original issue premium and incurred a call premium of $7.3 million related to the redemption. These costs are included in the $10.1 million loss on extinguishment of debt in the accompanying Consolidated and Combined Statements of Operations for the year ended December 31, 2013.
Other Expense (Income), net
Other expense (income), net for the year ended December 31, 2013 was $2.5 million of expense compared to $3.6 million of expense in the year ended December 31, 2012. This expense is related to mothball community expense, pre-acquisition costs on unpursued land projects and captive insurance claims costs.
54
Indemnification and Transaction Expense
The Predecessor Parent Company has indemnified TMM Holdings for specific uncertain tax positions existing as of the date of the Acquisition. An indemnification receivable of $129.7 million was recorded at the time of the Acquisition. The indemnification receivable also includes a periodic increase for accrued interest, penalties, and additional identified tax issues covered by the indemnity, offset by periodic decreases as uncertain tax matters and related tax obligations are resolved. The receivable due from the Predecessor Parent Company for the indemnification was valued at the same amount as the estimated income tax liability. During the year ended December 31, 2013 and 2012, $88.5 million and $12.3 million of the indemnification receivable was written off due to successful settlement of tax positions that were subject to the Predecessor Parent Company indemnification. The uncertain tax position was reversed simultaneously in our tax provision during each period.
During the year ended December 31, 2013, we also incurred $29.8 million of expense related to the termination of the management services agreements between us and the Principal Equityholders as part of the Reorganization Transactions. Additionally, we incurred $80.2 million of non-cash stock compensation expense for the modification of the TMM Holdings Class J Units which were exchanged for units in the TPG and Oaktree Holding Vehicles. The change was related to the termination of the JHI Services Agreement. See Item 1 - Business - Recent Developments - Reorganization Transactions of this Annual Report.
Income Tax Provision
Our effective tax rate for the year ended December 31, 2013 and 2012 was composed of the statutory tax rates in the U.S. and Canada and was affected primarily by state income taxes, the recognition of previously unrecognized tax benefits, the establishment of uncertain tax positions, and interest relating to uncertain tax positions. In addition, the IPO and Reorganization Transactions also resulted in an increase to our effective tax rate for the year ended December 31, 2013 due to certain non-deductible charges related to modification of the Class J Units of TMM Holdings and incremental U.S. tax as a result of our structure after the IPO.
During the year ended December 31, 2013, we accepted a settlement offer related to Taylor Woodrow Holdings (USA) Inc. for the 2008 and 2009 tax years. As a result, $102.0 million of our previously unrecognized indemnified tax positions including interest and penalties were recognized during the year ended December 31, 2013.
As of December 31, 2013, our cumulative gross unrecognized tax benefits were $2.1 million in the U.S. and $7.9 million in Canada and all unrecognized tax benefits, if recognized, would affect the effective tax rate. As of December 31, 2012, our cumulative gross unrecognized tax benefits were $85.7 million in the U.S. and $9.8 million in Canada. These amounts are included in income taxes payable in the accompanying Consolidated and Combined Balance Sheets at December 31, 2013 and December 31, 2012. None of the unrecognized tax benefits are expected to reverse in the next 12 months.
For further information, see Note 11 - Income Taxes in the Notes to the Consolidated and Combined Financial Statements in Item 8 of this Annual Report.
55
Year Ended December 31, 2012 Compared to Year Ended December 31, 2011
Data for the year ended December 31, 2011 represents the arithmetic sum of predecessor and TMHC results while data for the year ended December 31, 2012 represent TMHC results, except where noted.
Average Active Selling Communities
| Year Ended December 31, | ||||||||||||
| 2012 | 2011 | Change | ||||||||||
East | 74.6 | 82.6 | (9.7 | )% | ||||||||
West | 33.2 | 37.6 | (11.7 | ) | ||||||||
|
|
|
| |||||||||
Subtotal U.S . | 107.8 | 120.2 | (3.1 | )% | ||||||||
Canada | 14.0 | 14.4 | (3.1 | ) | ||||||||
|
|
|
| |||||||||
Subtotal North America | 121.8 | 134.6 | (9.5 | )% | ||||||||
Unconsolidated joint ventures (1) | 6.9 | 5.3 | 30.5 | |||||||||
|
|
|
| |||||||||
Total | 128.7 | 139.9 | (8.0 | )% | ||||||||
|
|
|
| |||||||||
| (1) | Represents the average number of total communities in which our joint ventures were actively selling during the period. |
Average active selling communities declined 8.0% from the year ended December 31, 2011 to the year ended December 31, 2012 with the largest decrease in the West segment, primarily due to the close out of some vintage selling communities during the ordinary course of business and the timing of new community openings coming to market. We opened new communities throughout all of our markets during 2013, mostly in our West Florida, Phoenix and Houston divisions, where demand and our land positions afforded us the opportunity. We recognized home closings in 2013 from the communities we opened during that period.
Net Sales Orders
| Year Ended December 31, (1) | ||||||||||||||||||||||||||||||||||||
| (Dollars in thousands ) | Net Homes Sold | Sales Value | Average Selling Price | |||||||||||||||||||||||||||||||||
| 2012 | 2011 | Change | 2012 | 2011 | Change | 2012 | 2011 | Change | ||||||||||||||||||||||||||||
East | 2,077 | 1,617 | 28.4 | % | $ | 692,287 | $ | 498,445 | 38.9 | % | $ | 333 | $ | 308 | 8.1 | % | ||||||||||||||||||||
West | 1,661 | 947 | 75.4 | 612,428 | 320,907 | 90.8 | 369 | 339 | 8.8 | |||||||||||||||||||||||||||
|
|
|
|
|
|
|
| |||||||||||||||||||||||||||||
Subtotal U.S . | 3,738 | 2,564 | 45.8 | % | $ | 1,304,715 | $ | 819,352 | 59.2 | % | $ | 349 | $ | 320 | 9.1 | % | ||||||||||||||||||||
Canada | 744 | 1,420 | (47.6 | ) | 309,584 | 512,037 | (39.5 | ) | 416 | 361 | 15.4 | |||||||||||||||||||||||||
|
|
|
|
|
|
|
| |||||||||||||||||||||||||||||
Subtotal North America | 4,482 | 3,984 | 12.5 | % | $ | 1,614,299 | $ | 1,331,389 | 21.2 | % | $ | 360 | $ | 334 | 7.8 | % | ||||||||||||||||||||
Unconsolidated joint ventures (2) | 360 | 145 | 147.9 | 82,845 | 32,876 | 152.0 | 230 | 227 | 1.6 | |||||||||||||||||||||||||||
|
|
|
|
|
|
|
| |||||||||||||||||||||||||||||
Total | 4,842 | 4,129 | 17.3 | % | $ | 1,697,144 | $ | 1,364,265 | 24.4 | % | $ | 351 | $ | 330 | 6.1 | % | ||||||||||||||||||||
|
|
|
|
|
|
|
| |||||||||||||||||||||||||||||
| (1) | Net sales orders represent the number and dollar value of new sales contracts executed with customers. High-rise sales are generally not recognized until a building is approved for construction. High-rise sales typically do not close in the year sold. Other sales are recognized after a contract is signed and the rescission period has ended. |
| (2) | Includes only proportionate share of unconsolidated joint ventures. |
The value of net sales orders, including those of unconsolidated joint ventures, increased by 24.4% to $1.697 billion (4,842 homes) in the year ended December 31, 2012, from $1.364 billion (4,129 homes) in the year ended December 31, 2011. The number of net sales orders, including those of unconsolidated joint ventures, increased 17.3% in the year ended December 31, 2012 compared to the year ended December 31, 2011. These results were impacted by the strong demand in the spring and summer selling seasons in 2012, during which we benefited from higher selling prices as consumers in the market gained confidence in the values present in the marketplace. The improved market in the U.S. in
56
areas such as Phoenix, West Florida and Northern California resulted in an increase in the number of units sold and related revenue for the year ended December 31, 2012 over the prior year. The Canada segment experienced a decline of 676 units in net new homes sold in the year ended December 31, 2012 when compared to the same period in 2011, which is attributable to the lower number of wholly owned open communities in the segment in the year ended December 31, 2012, and product mix.
Sales Order Cancellations - Units
| Year Ended December 31, | ||||||||||||||||
| Cancelled Sales Orders | Cancellation Rate (1) | |||||||||||||||
| 2012 | 2011 | 2012 | 2011 | |||||||||||||
East | 363 | 319 | 14.9 | % | 16.5 | % | ||||||||||
West | 243 | 194 | 12.8 | 17.0 | ||||||||||||
|
|
|
| |||||||||||||
Subtotal U.S/weighted average | 606 | 513 | 14.0 | % | 16.7 | % | ||||||||||
Canada | 19 | 12 | 2.5 | 0.8 | ||||||||||||
|
|
|
| |||||||||||||
Subtotal North America/weighted average | 625 | 525 | 12.2 | % | 11.6 | % | ||||||||||
Unconsolidated joint ventures (2) | 6 | 2 | 1.8 | 1.4 | ||||||||||||
|
|
|
| |||||||||||||
Total/weighted average | 631 | 527 | 11.5 | % | 11.3 | % | ||||||||||
|
|
|
| |||||||||||||
| (1) | Cancellation rate represents the number of cancelled sales orders divided by gross sales orders. |
| (2) | Includes only proportionate share of unconsolidated joint ventures. |
Our annual sales order cancellations, including those of unconsolidated joint ventures, increased due to increases in sales volume, from 527 in the year ended December 31, 2011 to 631 in the year ended December 31, 2012. The cancellation rate increased slightly from 11.3% in 2011 to 12.0% for 2012. Our continued scrutiny of potential buyers and use of prequalification strategies helps us maintain a low cancellation rate.
Sales Order Backlog
| As of December 31, | ||||||||||||||||||||||||||||||||||||
| (Dollars in thousands) | Sold Homes in Backlog (1) | Sales Value | Average Selling Price | |||||||||||||||||||||||||||||||||
| 2012 | 2011 | Change | 2012 | 2011 | Change | 2012 | 2011 | Change | ||||||||||||||||||||||||||||
East | 1,202 | 467 | 157.4 | % | $ | 474,086 | $ | 170,085 | 178.7 | % | $ | 394 | $ | 364 | 8.3 | % | ||||||||||||||||||||
West | 662 | 273 | 142.5 | 241,947 | 89,306 | 170.9 | 365 | 327 | 11.7 | |||||||||||||||||||||||||||
|
|
|
|
|
|
|
| |||||||||||||||||||||||||||||
Subtotal U.S. | 1,864 | 740 | 151.9 | % | $ | 716,033 | $ | 259,391 | 176.0 | % | $ | 384 | $ | 351 | 9.4 | % | ||||||||||||||||||||
Canada | 1,339 | 1,444 | (7.3 | ) | 419,607 | 473,675 | (11.4 | ) | 313 | 328 | (4.5 | ) | ||||||||||||||||||||||||
|
|
|
|
|
|
|
| |||||||||||||||||||||||||||||
Subtotal North America | 3,203 | 2,184 | 46.7 | % | $ | 1,135,640 | $ | 733,066 | 54.9 | % | $ | 355 | $ | 336 | 5.6 | % | ||||||||||||||||||||
Unconsolidated joint ventures (2) | 909 | 781 | 16.4 | 313,294 | 249,458 | 25.6 | 345 | 319 | 7.9 | |||||||||||||||||||||||||||
|
|
|
|
|
|
|
| |||||||||||||||||||||||||||||
Total | 4,112 | 2,965 | 38.7 | % | $ | 1,448,934 | $ | 982,524 | 47.5 | % | $ | 352 | $ | 331 | 6.3 | % | ||||||||||||||||||||
|
|
|
|
|
|
|
| |||||||||||||||||||||||||||||
| (1) | Sales order backlog represents homes under contract for which revenue has not yet been recognized at the end of the period. Some of the contracts in our sales order backlog are subject to contingencies including mortgage loan approval and buyers selling their existing homes, which can result in cancellations. |
| (2) | Reflects our proportionate share of unconsolidated joint ventures. |
Our homes in backlog at December 31, 2012 increased by 38.7% from December 31, 2011. This increase was caused in part by increased consumer demand and the market recovery in the U.S., as evidenced by increased sales in 2012. Our backlog of 4,112 homes was valued at $1.449 billion as compared to 2,965 homes at December 31, 2011 valued at $982.5 million. Backlog increased as the business continued to recognize improved sales performance in most of our communities and relieved pent-up consumer demand in some of our markets, which have also experienced price appreciation.
57
Home Closings Revenue
| Year Ended December 31, | ||||||||||||||||||||||||||||||||||||
| (Dollars in thousands) (1) | Homes Closed | Sales Value (1) | Average Selling Price | |||||||||||||||||||||||||||||||||
| 2012 | 2011 | Change | 2012 | 2011 | Change | 2012 | 2011 | Change | ||||||||||||||||||||||||||||
East | 1,661 | 1,460 | 13.8 | % | $ | 529,686 | $ | 417,182 | 27.0 | % | $ | 319 | $ | 286 | 11.6 | % | ||||||||||||||||||||
West | 1,272 | 867 | 46.7 | 456,512 | 294,810 | 54.8 | 359 | 340 | 5.5 | |||||||||||||||||||||||||||
|
|
|
|
|
|
|
| |||||||||||||||||||||||||||||
Subtotal U.S. | 2,933 | 2,327 | 26.0 | % | $ | 986,198 | $ | 711,992 | 38.5 | % | $ | 336 | $ | 306 | 9.8 | % | ||||||||||||||||||||
Canada | 849 | 1,538 | (44.8 | ) | 383,254 | 619,293 | (38.1 | ) | 451 | 403 | 12.1 | |||||||||||||||||||||||||
|
|
|
|
|
|
|
| |||||||||||||||||||||||||||||
Subtotal North America | 3,782 | 3,865 | (2.1 | )% | $ | 1,369,452 | $ | 1,331,285 | 2.9 | % | $ | 362 | $ | 344 | 5.1 | % | ||||||||||||||||||||
Unconsolidated joint ventures (2) (3) | 232 | 55 | 321.8 | 90,791 | 28,740 | 215.9 | 391 | 523 | (25.1 | ) | ||||||||||||||||||||||||||
|
|
|
|
|
|
|
| |||||||||||||||||||||||||||||
Total | 4,014 | 3,920 | 2.4 | % | $ | 1,460,243 | $ | 1,360,025 | 7.4 | % | $ | 364 | $ | 347 | 4.9 | % | ||||||||||||||||||||
|
|
|
|
|
|
|
| |||||||||||||||||||||||||||||
| (1) | Home closings revenue represents homes where possession has transferred to the buyer. |
| (2) | Reflects our proportionate share of unconsolidated joint ventures. In 2011 we closed two wholly owned high-rise buildings, while in 2012 only a portion of a single joint venture high-rise building contributed to closings. |
| (3) | Unconsolidated joint venture revenue is not reported as revenue but is recognized as a component of income of unconsolidated entities. Included here on a non-GAAP basis for informational purposes only. |
Home closings revenue, including unconsolidated joint venture home closings revenue, increased 7.4% from $1.360 billion in the year ended December 31, 2011, to $1.460 billion in the year ended December 31, 2012. Home closings revenue increased from $1.331 billion in the year ended December 31, 2011 to $1.369 billion in the year ended December 31, 2012. The average selling price of homes closed (including unconsolidated joint ventures) during the year ended December 31, 2012 was $364,000 up 4.9% from the $347,000 average in the year ended December 31, 2011. Canada revenues were negatively impacted in 2012 due to the timing and nature of high-rise closings. In 2011, we closed two wholly owned joint venture high-rise buildings, which accounted for more than $93 million in revenue on 469 closed units, compared to 2012, when we only recognized $2.4 million of revenue from the sale of two wholly owned high-rise units and had only one joint venture high-rise building close, which revenue was recorded as a component of income of unconsolidated entities and not included in homebuilding revenue. In addition, some markets in which we operate experienced a robust recovery. In particular, the Phoenix and West Florida markets experienced a recovery although their product mix recognized in the period remained at a lower price point than our overall average sales price. Also, during 2012, we closed out of vintage communities with higher margins in our West and East segments. These changes in our geographic and product mix resulted in lower home closings revenue as well as lower home closings gross margins in 2012, compared to 2011. The lower home closings revenue and gross margins we recognized in 2012 as compared to 2011 resulted from a higher portion of sales attributable to deliveries in markets such as Phoenix and West Florida, where the average sales price and specification levels of our homes generally resulted in lower dollar margins than in other markets in which we operate.
Land Closings Revenue
Year Ended December 31, | ||||||||||||
| (In thousands) | 2012 | 2011 | Change | |||||||||
East | $ | 28,837 | $ | 22,531 | 28.0 | % | ||||||
West | 4,286 | 1,765 | 142.8 | |||||||||
|
|
|
| |||||||||
Subtotal U.S . | $ | 33,123 | $ | 24,296 | 36.3 | % | ||||||
Canada | 11,285 | - | N/A | |||||||||
|
|
|
| |||||||||
Total | $ | 44,408 | $ | 24,296 | 82.8 | % | ||||||
|
|
|
| |||||||||
Land closings revenue increased 82.8% to $44.4 million in the year ended December 31, 2012, from $24.3 million in the year ended December 31, 2011. We generally purchase land and lots with the intent to build and sell homes on them.
58
Nevertheless, in some locations where we act as a developer, we occasionally purchase land that includes commercially zoned parcels, which we typically sell to commercial developers, and we also sell residential lots or land parcels to manage our land and lot supply. Land and lot sales occur at various intervals and varying degrees of profitability. Therefore, the revenue and gross margin from land closings fluctuate from period to period.
Home Closings Gross Margin
The following table sets forth a reconciliation between our home closings gross margin and our adjusted home closings gross margin. Adjusted gross margins are non-GAAP financial measures calculated based on gross margins, excluding impairments and capitalized interest amortization. See Non-GAAP Measures - Adjusted gross margins of this MD&A.
| TMHC | Combined (Predecessor/ TMHC) | TMHC | Predecessor | |||||||||||||||
| (In thousands) | Year Ended December 31, 2012 | Year Ended December 31, 2011 | July 13 to December 31, 2011 | January 1 to July 12, 2011 | ||||||||||||||
Home closings revenue | $ | 1,369,452 | $ | 1,331,285 | $ | 731,216 | $ | 600,069 | ||||||||||
Cost of home closings | 1,077,525 | 1,066,425 | 591,891 | 474,534 | ||||||||||||||
|
|
|
|
|
|
|
| |||||||||||
Home closings gross margin | $ | 291,927 | $ | 264,860 | $ | 139,325 | $ | 125,535 | ||||||||||
Capitalized interest amortization | 28,757 | 28,496 | 9,531 | 18,965 | ||||||||||||||
|
|
|
|
|
|
|
| |||||||||||
Adjusted home closings gross margin | $ | 320,684 | $ | 293,356 | $ | 148,856 | $ | 144,500 | ||||||||||
|
|
|
|
|
|
|
| |||||||||||
Home closings gross margin % | 21.3 | % | 19.9 | % | 19.1 | % | 20.9 | % | ||||||||||
Adjusted home closings gross margin % | 23.4 | % | 22.0 | % | 20.4 | % | 24.1 | % | ||||||||||
Our home closings gross margin increased in the year ended December 31, 2012 to $291.9 million, from $264.9 million in the year ended December 31, 2011. The earned housing profit recognized in connection with the Acquisition impacted 2012 by $6.9 million of margin that would have been contributed to 2012, compared to $38.1 million for the 2011 period. Earned housing profit represents the fair value adjustment to work in process for inventory in construction at the time of the Acquisition. As a percentage of revenue, our home closings gross margin increased 140 basis points, to 21.3% in the year ended December 31, 2012 from 19.9% in the year ended December 31, 2011. The increase in home closings gross margin in the year ended December 31, 2012 was primarily due to a shift to higher margin product mix across our markets, but particularly in the Northern California, Phoenix and Houston markets, where our move-up homes produced higher margins in the improving markets. Consumer demand in these areas, as well as in certain other markets in which we operate, allowed price increases and we were able to achieve higher margins than in the prior year period.
Adjusted home closings gross margin increased by 9.3% to $320.7 million in the year ended December 31, 2012, from $293.4 million in the year ended December 31, 2011, and as a percentage of home closings revenue increased 140 basis points, to 23.4%. The increase in adjusted home closings gross margin was primarily due to our increased margins in Canada, where we recognized an increase from product mix, and to a lesser extent our West segment's Phoenix and Northern California divisions. We generally recognized lower margins in our Phoenix division due to lower consumer price points and specification levels associated with our Phoenix product mix.
59
Segment Gross Margins
East Segment
The following table sets forth a reconciliation between our East segment gross margins (home closings, land closings and home and land closings) and our corresponding East segment adjusted gross margins. See Non-GAAP Measures - Adjusted gross margins of this MD&A.
| TMHC | Combined (Predecessor/ TMHC) | TMHC | Predecessor | |||||||||||||||
| (In thousands) | Year Ended December 31, 2012 | Year Ended December 31, 2011 | July 13 to December 31, 2011 | January 1 to July 12, 2011 | ||||||||||||||
Home Closings | ||||||||||||||||||
Home closings revenue | $ | 529,686 | $ | 417,182 | $ | 237,654 | $ | 179,528 | ||||||||||
Cost of home closings | 421,204 | 334,523 | 190,486 | 144,037 | ||||||||||||||
|
|
|
|
|
|
|
| |||||||||||
Home closings gross margin | $ | 108,482 | $ | 82,659 | $ | 47,168 | $ | 35,491 | ||||||||||
Capitalized interest amortization | 9,409 | 9,837 | 2,514 | 7,323 | ||||||||||||||
|
|
|
|
|
|
|
| |||||||||||
Adjusted home closings gross margin | $ | 117,891 | $ | 92,496 | $ | 49,682 | $ | 42,814 | ||||||||||
|
|
|
|
|
|
|
| |||||||||||
Home closings gross margin % | 20.5 | % | 19.8 | % | 19.8 | % | 19.8 | % | ||||||||||
Adjusted home closings gross margin % | 22.3 | % | 22.2 | % | 20.9 | % | 23.8 | % | ||||||||||
Land Closings | ||||||||||||||||||
Land closings revenue | $ | 28,837 | $ | 22,531 | $ | 9,212 | $ | 13,319 | ||||||||||
Cost of land closings | 25,895 | 13,823 | 7,207 | 6,616 | ||||||||||||||
|
|
|
|
|
|
|
| |||||||||||
Land gross margin | $ | 2,942 | $ | 8,708 | $ | 2,005 | $ | 6,703 | ||||||||||
Capitalized interest amortization | 1,497 | 1,004 | 583 | 421 | ||||||||||||||
|
|
|
|
|
|
|
| |||||||||||
Land adjusted gross margin | $ | 4,439 | $ | 9,712 | $ | 2,588 | $ | 7,124 | ||||||||||
|
|
|
|
|
|
|
| |||||||||||
Land gross margin % | 10.2 | % | 38.6 | % | 21.8 | % | 50.3 | % | ||||||||||
Land adjusted gross margin % | 15.4 | % | 43.1 | % | 28.1 | % | 53.5 | % | ||||||||||
Home and Land Closings | ||||||||||||||||||
Home and land closings revenue | $ | 558,523 | $ | 439,713 | $ | 246,866 | $ | 192,847 | ||||||||||
Cost of home and land closings | 447,099 | 348,346 | 197,693 | 150,653 | ||||||||||||||
|
|
|
|
|
|
|
| |||||||||||
Gross margin | $ | 111,424 | $ | 91,367 | $ | 49,173 | $ | 42,194 | ||||||||||
Capitalized interest amortization | 10,906 | 10,841 | 3,097 | 7,744 | ||||||||||||||
|
|
|
|
|
|
|
| |||||||||||
Adjusted gross margin | $ | 122,330 | $ | 102,208 | $ | 52,270 | $ | 49,938 | ||||||||||
|
|
|
|
|
|
|
| |||||||||||
Gross margin % | 19.9 | % | 20.8 | % | 19.9 | % | 21.9 | % | ||||||||||
Adjusted gross margin % | 21.9 | % | 23.2 | % | 21.2 | % | 25.9 | % | ||||||||||
For the year ended December 31, 2012, home closings revenue in the East segment increased by 27.0% compared to the year ended December 31, 2011, driven by an increase in home closing units of 13.8% to 1,661 units, compared to 1,460 units in the same period of 2011. Average home closings sales price in the East segment increased to $319,000, from $286,000 a year earlier. Net homes sold increased by 28.4% to 2,077 units, compared to 1,617 units a year ago, driving sales order value higher by 38.9% to $692.3 million compared to $498.4 million for the year ended December 31, 2011 with an average sales price increasing by $25,000, or 8.1%. The number of average active selling communities in the East segment was 9.7% lower in 2012 than in 2011 as the segment was able to close out of several legacy communities as market conditions improved. The East segment also had an increase in the average monthly sales pace to 2.3 homes per community in 2012, from 1.6 homes per community in 2011. Sales order cancellation rates were 14.9% and 16.5% in the East segment for the years ended December 31, 2012 and 2011, respectively. Overall, the improvement in East segment home closings revenue, sales prices and sales pace was due primarily to our well-located land positions and our consumer-driven offerings. Continued stability in the Houston and Austin, Texas markets and a positive recovery in the Florida markets that bolstered our backlog.
60
During the year ended December 31, 2012, home closings gross margin for the East segment was 20.5%, compared to 19.8% for the year ended December 31, 2011. East segment adjusted home closings gross margin was 22.3% in 2012 compared to 22.2% for 2011. The recovery and improved stabilization of the West Florida market, which generally tended to generate lower margins within the East segment, began when consumer demand returned and we were able to leverage land with a low cost basis and produce homes at a higher price point than in the prior year. The Houston market improved from the prior year, as we were able to increase prices on our move-up offerings and maintain stable land and construction costs. In addition, we were able to increase prices on average in the East segment by 11.6% in 2012 compared to 2011. As a result of the above factors, East segment home closings gross margin and adjusted home closings gross margin increased in 2012, compared to 2011.
Land revenue in the East segment was $28.8 million in 2012 compared to $22.5 million in 2011. Land sales during the year were the result of planned dispositions and strategic opportunities to monetize those assets where the highest and best use warranted sale. Land closings revenue in 2011 was primarily generated from sales at our consolidated Steiner Ranch joint venture in Austin, Texas, and in 2012 at Steiner Ranch and our Old Mill Preserve community in West Florida. Land closings gross margin percentage decreased in 2012 to 10.2% compared to 38.6% in 2011, and adjusted land closings gross margin percentage decreased in 2012 to 15.4% from 43.1% in 2011. These decreases were largely due to Acquisition-related purchase accounting increases in the carrying values of the relevant lots that were sold.
West Segment
The following table sets forth a reconciliation between our West segment gross margins (home closings, land closings and home and land closings) and our corresponding West segment adjusted gross margins. See Non-GAAP Measures - Adjusted gross margins of this MD&A.
| TMHC | Combined (Predecessor/ TMHC) | TMHC | Predecessor | |||||||||||||||
| (In thousands) | Year Ended December 31, 2012 | Year Ended December 31, 2011 | July 13 to December 31, 2011 | January 1 to July 12, 2011 | ||||||||||||||
Home Closings | ||||||||||||||||||
Home closings revenue | $ | 456,512 | $ | 294,810 | $ | 152,552 | $ | 142,258 | ||||||||||
Coat of home closings | 374,775 | 252,122 | 129,654 | 122,468 | ||||||||||||||
|
|
|
|
|
|
|
| |||||||||||
Home closings gross margin | $ | 81,737 | $ | 42,688 | $ | 22,898 | $ | 19,790 | ||||||||||
Capitalized interest amortization | 9,474 | 12,713 | 1,895 | 10,818 | ||||||||||||||
|
|
|
|
|
|
|
| |||||||||||
Adjusted home closings gross margin | $ | 91,211 | $ | 55,401 | $ | 24,793 | $ | 30,608 | ||||||||||
|
|
|
|
|
|
|
| |||||||||||
Home closings gross margin % | 17.9 | % | 14.5 | % | 15.0 | % | 13.9 | % | ||||||||||
Adjusted home closings gross margin % | 20.0 | % | 18.8 | % | 16.3 | % | 21.5 | % | ||||||||||
Land Closings | ||||||||||||||||||
Land closings revenue | $ | 4,286 | $ | 1,765 | $ | 1,445 | $ | 320 | ||||||||||
Cost of land closings | 1,401 | 1,406 | 1,367 | 39 | ||||||||||||||
|
|
|
|
|
|
|
| |||||||||||
Land gross margin | $ | 2,885 | $ | 359 | $ | 78 | $ | 281 | ||||||||||
Capitalized interest | 32 | 36 | - | 36 | ||||||||||||||
|
|
|
|
|
|
|
| |||||||||||
Land adjusted gross margin | $ | 2,917 | $ | 395 | $ | 78 | $ | 317 | ||||||||||
|
|
|
|
|
|
|
| |||||||||||
Land gross margin % | 67.3 | % | 20.3 | % | 5.4 | % | 87.8 | % | ||||||||||
Land adjusted gross margin % | 68.1 | % | 22.4 | % | 5.4 | % | 99.1 | % | ||||||||||
Home and Land Closings | ||||||||||||||||||
Home and land closings revenue | $ | 460,798 | $ | 296,575 | $ | 153,997 | $ | 142,578 | ||||||||||
Cost of home and land closings | 376,176 | 253,528 | 131,021 | 122,507 | ||||||||||||||
|
|
|
|
|
|
|
| |||||||||||
Gross margin | $ | 84,622 | $ | 43,047 | $ | 22,976 | $ | 20,071 | ||||||||||
Capitalized interest | 9,506 | 12,749 | 1,895 | 10,854 | ||||||||||||||
|
|
|
|
|
|
|
| |||||||||||
Adjusted gross margin | $ | 94,128 | $ | 55,796 | $ | 24,871 | $ | 30,925 | ||||||||||
|
|
|
|
|
|
|
| |||||||||||
Gross margin % | 18.4 | % | 14.5 | % | 14.9 | % | 14.1 | % | ||||||||||
Adjusted gross margin % | 20.4 | % | 18.8 | % | 16.2 | % | 21.7 | % | ||||||||||
61
The West segment closed 405 more units in the year ended December 31, 2012 than in the same period in 2011. This increase in units closed and a 5.5% increase in average selling price during the year ended December 31, 2012 resulted in an additional $161.7 million of home closings revenue, compared to the year ended December 31, 2011. The West segment has experienced the largest increase in net sales of all of our segments when comparing the years ended December 31, 2012 and 2011, recognizing that a number of markets in the West segment experienced artificially low demand during the market downturn. We closed 1,272 units in the West segment in the year ended December 31, 2012, which represents a 46.7% increase compared to 2011. Net sales order value increased to $612.4 million from $320.9 million, or 90.8%, when comparing the year ended December 31, 2012 to the year ended December 31, 2011. The average selling price increased 8.8%, or $30,000, in the year ended December 31, 2012 compared to the same period in 2011. The number of average active selling communities in the West segment declined 11.7% when compared to the same period in 2011. The average sales per outlet per month for the years ending December 31 2012 and 2011 were 4.2 and 2.1, respectively. Overall, during the year ended December 31, 2012, revenues and sales pace improved in the West segment compared to the same period in 2011 primarily due to housing market recoveries in the Phoenix and Northern California markets. Strong demand in these markets was evidenced by the 11.7% increase in average sales price of our backlog units.
During the year ended December 31, 2012, home closings gross margin for the West segment was 17.9%, compared to 14.5% for 2011. Adjusted home closings gross margin in the West segment increased by 120 basis points in the year ended December 31, 2012, compared to the year ended December 31, 2011. The increase in home closings gross margin and adjusted home closings gross margin was primarily due to our ability to control our construction costs while increasing our average selling price by 5.5% in 2012 compared to 2011. The Phoenix and Northern California divisions experienced the highest percentage of price increases during the year and also were able to contain construction costs as the volume of construction in those markets allowed us to effectively manage cost pressures on construction materials and labor. The recovery in our West segment markets continued during 2012, and our margin performance continued to be favorable.
Land revenue in the West segment was $4.3 million in 2012 compared to $1.8 million in 2011. Land sales during 2012 were the result of planned dispositions and strategic opportunities to monetize those assets where the highest and best use warranted sale.
62
Canada
The following table sets forth a reconciliation between our Canada gross margins (home closings, land closings and home and land closings) and our corresponding Canada adjusted gross margins. See Non-GAAP Measures - Adjusted gross margins of this MD&A.
| TMHC | Combined (Predecessor/ TMHC) | TMHC | Predecessor | |||||||||||||||
| (In thousands) | Year Ended December 31, 2012 | Year Ended December 31, 2011 | July 13 to December 31, 2011 | January 1 to July 12, 2011 | ||||||||||||||
Home Closings | ||||||||||||||||||
Home closings revenue | $ | 383,254 | $ | 619,293 | $ | 341,010 | $ | 278,283 | ||||||||||
Cost of home closings | 281,546 | 479,717 | 271,761 | 207,956 | ||||||||||||||
|
|
|
|
|
|
|
| |||||||||||
Home closings gross margin | $ | 101,708 | $ | 139,576 | $ | 69,249 | $ | 70,327 | ||||||||||
Capitalized interest amortization | 9,874 | 5,946 | 5,122 | 824 | ||||||||||||||
|
|
|
|
|
|
|
| |||||||||||
Adjusted home closings gross margin | $ | 111,582 | $ | 145,522 | $ | 74,371 | $ | 71,151 | ||||||||||
|
|
|
|
|
|
|
| |||||||||||
Home closings gross margin | 26.5 | % | 22.5 | % | 20.3 | % | 25.3 | % | ||||||||||
Adjusted home closings gross margin | 29.1 | % | 23.5 | % | 21.8 | % | 25.6 | % | ||||||||||
Land Closings | ||||||||||||||||||
Land closings revenue | $ | 11,285 | $ | - | $ | - | $ | - | ||||||||||
Cost of land closings | 8,588 | - | - | - | ||||||||||||||
|
|
|
|
|
|
|
| |||||||||||
Land gross margin | $ | 2,697 | $ | - | $ | - | $ | - | ||||||||||
Capitalized interest | 30 | - | - | - | ||||||||||||||
|
|
|
|
|
|
|
| |||||||||||
Land adjusted gross margin | $ | 2,727 | $ | - | $ | - | $ | - | ||||||||||
|
|
|
|
|
|
|
| |||||||||||
Land gross margin % | 23.9 | % | N/A | N/A | N/A | |||||||||||||
Land adjusted gross margin % | 24.2 | % | N/A | N/A | N/A | |||||||||||||
Home and Land Closings | ||||||||||||||||||
Home and land closings revenue | $ | 394,539 | $ | 619,293 | $ | 341,010 | $ | 278,283 | ||||||||||
Cost of home and land closings | 290,134 | 479,717 | 271,760 | 207,957 | ||||||||||||||
|
|
|
|
|
|
|
| |||||||||||
Gross margin | $ | 104,405 | $ | 139,576 | $ | 69,250 | $ | 70,326 | ||||||||||
Capitalized interest | 9,904 | 5,946 | 5,122 | 824 | ||||||||||||||
|
|
|
|
|
|
|
| |||||||||||
Adjusted gross margin | $ | 114,309 | $ | 145,522 | $ | 74,372 | $ | 71,150 | ||||||||||
|
|
|
|
|
|
|
| |||||||||||
Gross margin % | 26.5 | % | 22.5 | % | 20.3 | % | 25.3 | % | ||||||||||
Adjusted gross margin % | 29.0 | % | 23.5 | % | 21.8 | % | 25.6 | % | ||||||||||
Canada segment home closings revenue for the year ended December 31, 2012 decreased by 38.1%, to $383.3 million, compared to $619.3 million for the year ended December 31, 2011. The number of home closings units in the year ended December 31, 2012 decreased by 44.8% compared to the year ended December 31, 2011. Canada segment revenues and number of closings were affected by timing of high-rise closings. In 2011, we closed two wholly owned high-rise buildings which accounted for more than $93 million in revenue on 469 closed units, while in 2012, we only recognized $2.4 million of revenue from wholly owned high-rise units and only had a single joint venture high-rise building close, which was included as a component of net income of unconsolidated entities and not included in homebuilding revenue. The average home closings sales price was 12.1% higher for the year ended December 31, 2012 when compared to the same period in 2011. This increase was due to a product mix shift into a larger number of single-family detached homes during 2012, which have higher average sale prices compared to high-rise closings, which were a larger component of our 2011 closings. The Canada segment experienced a decline of 676 units in net new homes sold in the year ended December 31, 2012 when compared to the same period in 2011, which is attributable to the number of open communities in the segment, timing of high-rise sales launches and product mix. The average sales per community per month were 4.4 and 8.2 for the years ended December 31, 2012 and 2011, respectively. The occupancy of two towers in 2011 accounted for a large portion of home closings revenue recorded in 2011. We continue to focus on our margin over
63
volume approach to selling in our communities. Average sales price increased by $55,000 or 15.4%, and average sales value declined 39.5% when comparing the year ended December 31, 2012 to the year ended December 31, 2011. The decline in home sales from fewer wholly owned communities and a product mix change contributed to the reduced sales values during 2012. Our total sales value was $309.6 million in 2012, compared to $512.0 million in 2011.
Home closings gross margin for the year ended December 31, 2012 for the Canada segment was 26.5%, compared to 22.5% for the year ended December 31, 2011. The adjusted home closings gross margin for the Canada segment was 560 basis points higher in 2012, when compared to 2011. The increases in home closings gross margin and adjusted home closings gross margin were due to a shift into higher margin single-family detached and attached homes. In light of slowing job growth in Ontario relative to the recent past, ongoing global economic uncertainty and increasing units under construction, growth in the Ontario housing market moderated during 2012.
Land closings revenue for the Canada segment was $11.3 million in the year ended December 31, 2012, while there was no land closings revenue for the year ended December 31, 2011. We made these land sales as part of our land management strategy when determining the highest and best use of the property.
Mortgage Operations
Our Mortgage Operations segment, which provides mortgage lending through TMHF and title services through various joint ventures in certain markets, is highly dependent on our sales and closings volumes. Our Mortgage Operations' segment revenue increased from $14.6 million in the year ended December 31, 2011 to $21.9 million in the year ended December 31, 2012, due primarily to increased closings volume and average loan amounts. The increase in gross margin was driven primarily by the same factors, from 1,495 and $250,479, respectively, in the year ended December 31, 2011, to 2,001 and $264,723, respectively, in the year ended December 31, 2012.
| TMHC | Combined (Predecessor/ TMHC) | TMHC | Predecessor | |||||||||||||||
| (In thousands) | Year Ended December 31, 2012 | Year Ended December 31, 2011 | July 13 to December 31, 2011 | January 1 to July 12, 2011 | ||||||||||||||
Mortgage operations | $ | 21,861 | $ | 14,606 | $ | 8,579 | $ | 6,027 | ||||||||||
Mortgage operations expense | 11,266 | 8,313 | 4,495 | 3,818 | ||||||||||||||
|
|
|
|
|
|
|
| |||||||||||
Mortgage operations gross margin | $ | 10,595 | $ | 6,293 | $ | 4,084 | $ | 2,209 | ||||||||||
Impairments | - | - | - | - | ||||||||||||||
Other | - | - | - | - | ||||||||||||||
|
|
|
|
|
|
|
| |||||||||||
Adjusted mortgage operations margin | $ | 10,595 | $ | 6,293 | $ | 4,084 | $ | 2,209 | ||||||||||
|
|
|
|
|
|
|
| |||||||||||
Mortgage operations margin % | 48.5 | % | 43.1 | % | 47.6 | % | 36.7 | % | ||||||||||
Adjusted mortgage operations margin % | 48.5 | % | 43.1 | % | 47.6 | % | 36.7 | % | ||||||||||
Sales, Commissions and Other Marketing Costs
For the years ended December 31, 2012 and 2011, sales, commissions, and other marketing costs such as advertising and sales office expenses were $80.9 million and $76.4 million, respectively, reflecting the 5.1% increase in average selling price, partially offset by a 2.1% decrease in homes closed. Our U.S. segments tend to have higher per-unit commissions, so our mix of commissions paid shifted more towards our U.S. operations, where we closed 26.0% more homes in 2012 as compared to 2011.
General and Administrative Expenses
For the year ended December 31, 2012, general and administrative expenses were $60.4 million as compared to $68.6 million in the same period in 2011, an 11.9% decrease. General and administrative expenses were 4.4% as a percentage of total home closings revenue in the year ended December 31, 2012, compared to 5.2% in the same period in 2011. The decrease was due in part to certain one-time reversals of legal reserves of $9.1 million from a favorable litigation settlement during 2012 as well as our diligent cost containment strategy as we pursued synergies within the business and were therefore able to reduce professional consulting fee expenses.
64
Equity in Income of Unconsolidated Entities
Equity in income of unconsolidated entities was $23.0 million for the year ended December 31, 2012 compared to $8.1 million for the year ended December 31, 2011. The increase in income was due to the timing and progress of joint venture projects, particularly the closing of high-rise condominiums in the Canada segment which began occupancy in 2012.
Interest (Income) Expense, net
Interest expense represents interest incurred, but not capitalized on our long-term debt and other borrowings. Purchase accounting from the Acquisition eliminated the accumulated capitalized interest on the balance sheet as of the Acquisition date. Interest (income) expense, net for the years ended December 31, 2012 and 2011, was $2.4 million and $2.9 million of income in both years, respectively. While we had a higher level of cash and cash equivalents during 2012 than in 2011, Taylor Wimpey plc paid interest on certain cash deposits it held on our behalf in the 2011 period, which did not occur in 2012.
Other Expense (Income), net
Other expense (income), net for the year ended December 31, 2012 was $3.6 million of expense as compared to $8.4 million of income for the year ended December 31, 2011. The increase in expense is primarily driven by increased insurance losses from our captive insurance company of $2.1 million, and to a lesser extent, $1.8 million of acquisition costs related to the Darling Acquisition and reduced golf course fees of $1.4 million and general contracting fees of $1.0 million.
Loss on Extinguishment of Debt
During 2012, we prepaid $350.0 million of the Sponsor Loan with proceeds from the 2020 Senior Notes. The remaining $150.0 million of the Sponsor Loan was exchanged for equity interests. The portion of the Sponsor Loan that was retired had been borrowed at a discount of 2.5%, consequently, the $7.9 million of unamortized portion of the discount was written off during 2012 to expense.
Income Tax Provision (Benefit)
Income tax provision for December 31, 2012 was a $260.3 million income tax benefit compared to a $24.9 million income tax expense for the comparable period in 2011. Our Canadian operations generated taxable income in each period and recorded tax expense at their effective rate. In the year ended December 31, 2012, our U.S. operations recorded a benefit primarily related to the reversal of prior valuation allowances on deferred tax assets of $334.6 million as we achieved a three year cumulative profit in the fourth quarter. The prospects of continued profitability and growth were further supported by a strong order backlog and sufficient balance sheet liquidity to sustain and grow operations as of December 31, 2012. In addition there was other evidence supporting the reversal of uncertain tax positions under ASC Topic 740, Income Taxes that we effectively settled with the Internal Revenue Service ("IRS") during the period in the amount of $15.0 million. In the year ended December 31, 2011, our U.S. operations recorded benefits primarily related to reversal of prior uncertain tax positions under ASC Topic 740, Income Taxes that we effectively settled with the IRS during the periods and expense related to interest on those uncertain positions.
Overview of Capital Resources and Liquidity
Our principal uses of capital in the year ended December 31, 2013 and 2012 were land and property purchases, lot development, home construction, operating expenses, payment of debt service, income taxes, investments in joint ventures and the payment of various liabilities. In addition, during the 2013 period, we made significant payments and incurred significant expenses in connection with our Reorganization Transactions. Historically, we have used a combination of capital contributions and intercompany borrowings from our former parent, Taylor Wimpey plc, and funds generated by operations to meet our short-term working capital requirements. Cash flows for each of our communities depend on the status of the development cycle, and can differ substantially from reported earnings. Early stages of development or expansion require significant cash outlays for land acquisitions, plats, vertical development,
65
construction of model homes, general landscaping and other amenities. Because these costs are a component of our inventory and are not recognized in our statements of operations until a home closes, we incur significant cash outflows prior to recognition of earnings. In the later stages of a community, cash inflows may significantly exceed earnings reported for financial statement purposes, as the costs associated with home and land construction were previously incurred.
We have a defined strategy for cash management, particularly as related to cash outlays for land and inventory development. We used $214.5 million of cash in operating activities for the year ended December 31, 2012 and $151.9 million of cash used in operating activities in the same period in 2013. Our principal cash uses in 2013 were real estate inventory acquisitions. We generated the cash used in 2013 through our operating activities, borrowings under our revolving facilities and the issuance of the 2021 Senior Notes.
Since the Acquisition, we have primarily funded our cash needs from cash from operations, borrowings under our Restated Revolving Credit Facility and cash generated from our offerings of Senior Notes. Our need for letters of credit has been primarily fulfilled through the TD Facility, the revolving facilities and the HSBC Facility, which are discussed in more detail below. We believe that our solid balance sheet and liquidity position will allow us to be flexible in reacting to changing market conditions.
We believe that we can fund our cash needs for planned and projected operations for the next twelve months from cash on hand and cash generated from operations and borrowings under our Restated Revolving Credit Facility. As of December 31, 2013, under our Restated Revolving Credit Facility, we had $373.5 million of additional availability for borrowings and $173.5 million of additional availability for letters of credit (giving effect to $26.5 million of letters of credit outstanding as of such date). Depending upon future homebuilding market conditions and our expectations for these conditions, we may use a portion of our cash and cash equivalents to take advantage of land opportunities. We intend to maintain adequate liquidity and balance sheet strength, and we will continue to evaluate opportunities to access the debt and equity capital markets as they are available. See Overview of Capital Resources and Liquidity - Capital Resources - Original Revolving Credit Facility and Restated Revolving Credit Facility and 2021 Senior Notes of this MD&A for more information.
Capital Resources
Cash and Cash Equivalents
As of December 31, 2013, we had available cash and cash equivalents of $389.2 million. Cash and cash equivalents consist of cash on hand, demand deposits with financial institutions and short-term, highly liquid investments. We consider all highly liquid investments with original maturities of 90 days or less, such as certificates of deposit, money market funds, and commercial paper, to be cash equivalents. Cash accounts are insured up to $250,000 in the U.S. by the Federal Deposit Insurance Corporation and up to $100,000 in Canada by the Canadian Deposit Insurance Company.
The amount of cash and cash equivalents held by foreign subsidiaries as of December 31, 2013 was $195.7 million. While all of such cash and cash equivalents are readily convertible into U.S. dollars, we would be required to accrue and pay taxes to repatriate those funds to the U.S. Historically we have not generally repatriated such funds, since we generally have used such funds in our Canadian business. However, we may in the future repatriate such funds to the U.S.
Original Revolving Credit Facility and Restated Revolving Credit Facility
In 2011, the Original Revolver Co-Borrowers entered into the Original Revolving Credit Facility. In conjunction with the August 21, 2012 offering of the Additional Notes (as defined below), the Original Revolver Co-Borrowers exercised the incremental feature of the facility and expanded the line to $125.0 million in capacity. In December 2012, availability under the Original Revolving Credit Facility was further expanded to $225.0 million.
On April 12, 2013, the Original Revolver Co-Borrowers entered into the Restated Revolving Credit Facility. The Restated Revolving Credit Facility, among other things, (a) converted the Original Revolving Credit Facility into an unsecured facility; (b) reduced the Eurodollar application margin from 3.25% to 2.00% (subject to a step-up or step-down based on a capitalization ratio) and base rate applicable margin from 2.25% to 1.00% (subject to a step-up or step-down based on a capitalization ratio); (c) increased the aggregate amount of commitments under the Original Revolving Credit Facility to $400.0 million, of which $200.0 million is available for letters of credit; (d) permits an increase in the
66
Restated Revolving Credit Facility up to an additional $200.0 million through an incremental facility feature; (e) permits borrowings up to the full commitment amount under the Restated Revolving Credit Facility unless the capitalization ratio as of the most recently ended fiscal quarter exceeds 0.55 to 1.00, in which case, borrowing availability under the Restated Revolving Credit Facility will be measured by reference to a borrowing base formula to be calculated quarterly (or more frequently as we may elect); and (f) extended the maturity date of the facility to April 12, 2017.
On January 15, 2014, the Original Revolver Co-Borrowers further amended the Restated Revolving Credit Facility to remove Monarch Corporation as co-borrower so it can no longer borrow against the line. The overall borrowing capacity and terms otherwise remained consistent with the Restated Revolving Credit Facility. TMC is now the only borrower under the Restated Revolving Credit Facility. See Note 19 - Subsequent Events of the Notes to the Consolidated and Combined Financial Statements in Item 8 of this Annual Report.
Borrowings under the Restated Revolving Credit Facility may be made in U.S. dollars, and bear interest based upon LIBOR interest rate plus an applicable margin. The applicable margin for (a) any Eurodollar Rate Loan is 2.00% per annum, payable on the last date of each applicable interest period or at the end of each three-month period if the applicable interest period is longer than three months and (b) any Base Rate Loan 1.00% per annum, payable quarterly. There is a fee of 0.50% per annum on the commitment (whether drawn or undrawn), payable quarterly in arrears. TMC have the right to make "amend and extend" offers to lenders of a particular class.
The Restated Revolving Credit Facility contains certain "springing" financial covenants, requiring TMM Holdings and its subsidiaries to comply with a certain maximum capitalization ratio and a minimum consolidated tangible net worth test. The financial covenants would be in effect for any fiscal quarter during which any (a) loans under the Restated Revolving Credit Facility are outstanding during the last day of such fiscal quarter or on more than five separate days during such fiscal quarter or (b) undrawn letters of credit (except to the extent cash collateralized) issued under the Restated Revolving Credit Facility in an aggregate amount greater than $40.0 million or unreimbursed letters of credit issued under the Restated Revolving Credit Facility are outstanding on the last day of such fiscal quarter or for more than five consecutive days during such fiscal quarter. For purposes of determining compliance with the financial covenants for any fiscal quarter, the Restated Revolving Credit Facility provides that TMC may exercise an equity cure by issuing certain permitted securities for cash or otherwise recording cash contributions to its capital that will, upon the contribution of such cash to TMC, be included in the calculation of consolidated tangible net worth and consolidated total capitalization. The equity cure right is exercisable up to twice in any period of four consecutive fiscal quarters and up to five times overall. The maximum capitalization ratio is 0.60 to 1.00. The ratio, as calculated by TMC, at December 31, 2013 was 0.39 to 1.00. The minimum consolidated tangible net worth requirement was approximately $1.2 billion at December 31, 2013. At December 31, 2013 our consolidated tangible net worth was $1.5 billion.
The Restated Revolving Credit Facility contains certain restrictive covenants including limitations on incurrence of liens, dividends and other distributions, asset dispositions and investments in entities that are not guarantors, limitations on prepayment of subordinated indebtedness and limitations on fundamental changes. The Restated Revolving Credit Facility contains customary events of default, subject to applicable grace periods, including for nonpayment of principal, interest or other amounts, violation of covenants (including financial covenants, subject to the exercise of an equity cure), incorrectness of representations and warranties in any material respect, cross default and cross acceleration, bankruptcy, material monetary judgments, ERISA events with material adverse effect, actual or asserted invalidity of material guarantees and change of control. As of December 31, 2013 and December 31, 2012, we were in compliance with our financial covenants.
We had no outstanding borrowings under the Restated Revolving Credit Facility at December 31, 2013 and $50.0 million outstanding at December 31, 2012. As of December 31, 2013, we had $373.5 million of additional availability for borrowings including $173.5 million of additional availability for letters of credit (giving effect to $26.5 million of letters of credit outstanding as of such date).
67
2020 Senior Notes
On April 13, 2012, the Bond Co-Issuers issued $550.0 million in aggregate principal amount of 7.750% Senior Initial Notes due 2020 ("Initial Notes") at an initial offering price of 100.0% of the principal amount (the "2020 Senior Notes Offering"). The net proceeds from the sale of the Initial Notes were $537.4 million, net of debt issuance costs of $12.6 million, were used, in part, to repay $350.0 million of the Sponsor Loan (as discussed below). The remaining proceeds of approximately $187.4 million from the 2020 Senior Notes Offering were used by the Bond Co-Issuers for general corporate purposes. An additional $3.0 million of issuance costs were settled outside the bond proceeds.
On August 21, 2012, the Bond Co-Issuers issued an additional $125.0 million of 7.75% Senior Notes due 2020 (the "Additional 2020 Senior Notes") at an initial offering price of 105.5% of the principal amount. The Bond Co-Issuers received $132.5 million including prepaid interest, net of debt issuance costs of $3.1 million. The net proceeds from the issuance of the Additional 2020 Senior Notes were used for general corporate purposes. Interest on the 2020 Senior Notes is payable semiannually in arrears on April 15 and October 15 of each year.
On April 12, 2013, we used $204.2 million of the net proceeds of the IPO, which were contributed to the Bond Co-Issuers, to redeem $189.6 million aggregate principal amount of 2020 Senior Notes (at a purchase price equal to 103.875% of their principal amount, plus accrued and unpaid interest of $7.3 million through the date of redemption). We wrote off $4.6 million of unamortized issuance costs and $1.8 million of original issue premium and incurred a call premium of $7.3 million related to the redemption. These costs are included in the $10.1 million Loss on Extinguishment of Debt in the accompanying Consolidated and Combined Statements of Operations for the year ended December 31, 2013.
The indenture for the 2020 Senior Notes contains covenants that limit (i) the making of investments, (ii) the payment of dividends and the redemption of equity and junior debt, (iii) additional indebtedness, (iv) asset dispositions, (v) mergers and similar corporate transactions, (vi) the incurrence of liens, (vii) payments and asset transfers among the issuers and restricted subsidiaries and (viii) transactions with affiliates, among other items. The indenture governing the 2020 Senior Notes contains customary events of default. The most restrictive covenant of the indenture requires a fixed charge coverage ratio of 2.00 to 1.00. At December 31, 2013, our fixed charge coverage ratio was 4.80 to 1.00.
Obligations to pay principal and interest on the 2020 Senior Notes are guaranteed by TMM Holdings and the U.S. homebuilding subsidiaries (collectively, the "Guarantor Subsidiaries") who guarantee the Restated Revolving Credit Facility, each of which is directly or indirectly 100.0% owned by TMM Holdings. Such guarantees are full and unconditional, and joint and several. We do not provide separate financial statements of the Guarantor Subsidiaries or condensed consolidating financial information because the 2020 Senior Notes are not registered and are not subject to registration rights.
The Bond Co-Issuers are entitled to redeem up to 40% of the aggregate principal amount of the 2020 Senior Notes at a redemption price of 107.750% of the aggregate principal amount plus accrued and unpaid interest on or after April 15, 2013 and prior to April 15, 2015. Following the redemption of $189.6 million aggregate principal amount of 2020 Senior Notes on April 12, 2013, the Bond Co-Issuers are entitled to redeem a further $80.4 million of 2020 Senior Notes pursuant to this redemption provision.
Upon a "Change of Control" (as defined in the indenture governing the 2020 Senior Notes), the Bond Co-Issuers would be required to make an offer to repurchase all outstanding 2020 Senior Notes at a purchase price equal to 101% of their principal amount, plus accrued and unpaid interest. The Bond Co-Issuers, under certain conditions, are required to offer to use unapplied proceeds from certain asset sales to redeem the 2020 Senior Notes at par. As of December 31, 2013, there was $485.4 million aggregate principal amount of 2020 Senior Notes outstanding.
2021 Senior Notes
On April 16, 2013, the Bond Co-Issuers completed the issuance of $550.0 million aggregate principal amount of Senior Notes due 2021 (the "2021 Senior Notes"). The 2021 Senior Notes are guaranteed by the same subsidiaries that guarantee the 2020 Senior Notes and have substantially the same terms and covenants as the 2020 Senior Notes, except that:
| • | the maturity date is April 15, 2021; |
| • | the interest rate is 5.25% per annum; |
68
| • | the Bond Co-Issuers may redeem some or all of the 2021 Senior Notes at any time prior to April 15, 2016, at a redemption price equal to 100.0% of the aggregate principal amount of the 2021 Senior Notes to be redeemed, plus a make-whole premium and accrued and unpaid interest, if any, to, but not including, the redemption date; |
| • | on or after April 15, 2016, the Bond Co-Issuers may also redeem some or all of the 2021 Senior Notes at the redemption prices specified in the indenture relating to the 2021 Senior Notes; and |
| • | at any time prior to April 15, 2016, the Bond Co-Issuers may also redeem up to 40% of the original aggregate principal amount of the 2021 Senior Notes with the net cash proceeds of certain equity offerings, at a redemption price equal to 105.250% of the aggregate principal amount of the 2021 Senior Notes to be redeemed, plus accrued and unpaid interest, if any, to, but not including, the redemption date. |
The 2021 Senior Notes do not have any registration rights. As of December 31, 2013, there was $550 million aggregate principal amount of 2021 Senior Notes outstanding.
Mortgage Company Loan Facilities
In December 2010, TMHF, our wholly owned mortgage subsidiary, entered into an agreement with Flagstar Bank (the "Flagstar Agreement"), as agent and representative for itself and other buyers of our held-for-sale mortgages named therein. The Flagstar Agreement was amended in March 2013 to reduce the interest rate minimum floor from 3.95% to 3.5%. The purpose of the Flagstar Agreement is to finance the origination of up to $30 million of mortgage loans at any one time by TMHF, subject to certain sub-limits, and with a temporary accordion feature subject to approval by Flagstar, which allows for borrowings in excess of total availability. Borrowings under the facility are accounted for as a secured borrowing under ASC Topic 860, Transfers and Servicing . The Flagstar Agreement is terminable by either party with 30 days' notice and bears interest at a rate of LIBOR plus 2.5%, with a minimum floor of 3.5%. Borrowings under this facility are paid back with proceeds received when mortgages are sold to participating lenders in the Flagstar Agreement, or to other buyers subject to certain sub-limits. The time period from borrowing to repayment is typically less than 20 business days. At December 31, 2013 and December 31, 2012, there were $38.1 million and $38.6 million, respectively, in outstanding borrowings under the Flagstar Agreement.
In December 2011, TMHF entered into a letter agreement with Comerica Bank (the "Comerica Bank Agreement"), as agent and representative for itself and other buyers of our held-for-sale mortgages named within. In June 2013, the Comerica Bank Agreement was amended to increase the capacity from $30 million to $50 million. The line has the capacity to finance up to $50 million of mortgage loans at any one time by TMHF, subject to certain sub-limits. At December 31, 2013 and December 31, 2012, mortgage loans financed under this arrangement were $36.8 million and $41.7 million, respectively.
The mortgage borrowings outstanding as of December 31, 2013 and December 31, 2012, are collateralized by $95.7 million and $85.0 million, respectively, of mortgage loans held for sale, which comprise the balance of mortgage receivables in the Consolidated and Combined Balance Sheets, and $2.0 million and $2.0 million, respectively of restricted short-term investments in certificates of deposit known as CDARS, which are included in restricted cash in the Consolidated and Combined Balance Sheets.
Letters of Credit, Surety Bonds and Financial Guarantees
We are often required to provide letters of credit and surety bonds to secure our performance under construction contracts, development agreements and other arrangements. The amount of such obligations outstanding at any time varies in accordance with our pending development activities. In the event any such bonds or letters of credit are drawn upon, we would be obligated to reimburse the issuer of such bonds or letters of credit. In addition, Monarch will typically provide guarantees of the financing debt of the joint ventures through which Monarch operates, which guarantees may be secured.
We are committed, under various letters of credit, and surety bonds, to perform certain development and construction activities and provide certain guarantees in the normal course of business. These guarantees have been made in connection with joint venture funding of our operations in Canada. Outstanding letters of credit and surety bonds under these arrangements, including our share of responsibility for arrangements with our joint ventures, totaled $212.2 million
69
as of December 31, 2013 and $230.8 million as of December 31, 2012. Although significant development and construction activities have been completed related to these site improvements, the letters of credit and surety bonds are reduced as development and construction work is completed, but not fully released until warranty periods have expired.
Monarch is a party to a credit facility with The Toronto-Dominion Bank ("TD Facility"). The TD Facility provides facilities including letters of credit of up to CAD $100.0 million or its U.S. dollar equivalent to provide letter of credit financing in support of Monarch's projects. Under the terms of the TD Facility, the first CAD $80.0 million drawn under the facility is secured by liens on the interests of Monarch in certain Canadian real property. Amounts drawn above CAD $80.0 million are secured with cash. Monarch also guarantees the credit facilities that certain joint ventures are party to with The Toronto – Dominion Bank. There were CAD $98.5 million and CAD $102.6 million letters of credit outstanding under the Monarch and joint venture TD Facility as of December 31, 2013 and December 31, 2012, respectively.
Monarch is also party to a credit facility with HSBC Bank Canada ("HSBC Facility"). The HSBC Facility provides a letter of credit facility of up to CAD $24.2 million as of December 31, 2013 in support of Monarch's construction projects. Under the terms of the HSBC Facility, amounts drawn under this facility are secured by liens over the interests of Monarch in certain Canadian real property or cash. There was CAD $18.0 million and CAD $11.0 million letters of credit outstanding under the HSBC Facility as of December 31, 2013 and December 31, 2012, respectively.
The TD Facility contains certain financial covenants. We are required to maintain a minimum net equity and a minimum debt-to-equity ratio as well as maintain an interest coverage ratio. As of December 31, 2013, our net equity, as defined in the TD Facility, was CAD $411.1 million (compared with the minimum requirement of CAD $250.0 million), our debt-to-equity ratio was 39% (compared with the requirement not to exceed 125%). Violations of the financial covenants in the TD Facility, if not waived by the lenders or cured, could result in acceleration by the lenders. In the event these violations were not waived by the lenders or cured, the violations could also result in a default under our other indebtedness. As of December 31, 2013, we were in compliance with all of the covenants under the TD Facility.
Both the TD Facility and the HSBC Facility are 364-day facilities that expire on June 30, each year. Both Facilities have been renewed and extended to June 30, 2014 on terms substantially similar to those in effect prior to the extensions.
Other Loans Payable and Other Borrowings
Other loans payable and other borrowings as of December 31, 2013 consist of project-level debt due to various land sellers and municipalities, and such loans are generally secured by the land that was acquired. Principal payments generally coincide with corresponding project lot sales or a principal reduction schedule. The weighted average interest rate on $174.5 million of the loans as of December 31, 2013 was 5.6% per annum, and $126.2 million of the loans were non-interest bearing. As of December 31, 2013, other loans payable and other borrowings increased by an estimated $84.7 million compared to December 31, 2012 primarily due to the closing of transactions under land purchase contracts with seller financing and high-rise funding.
Operating Cash Flow Activities
Our net cash used in operating activities amounted to $151.9 million for the year ended December 31, 2013 compared to $214.5 million used in operating activities for the year ended December 31, 2012. The primary cause of our increase in cash used in operating activities was our increased purchases of land inventory. These purchases were primarily funded with our operating activities and issuance of 2020 Senior Notes. Prepaid expense decreased during the period as amounts recognized for model homes and insurance renewals decreased during the period as closings increased and insurance policies conditioned on number of closings forecasted were entered into. Customer deposits increased during the year as amounts received related to our decreased volume of sales, resulted in higher backlog deposit amounts. Accrued other liabilities were reduced by payouts exceeding prior year as well as the recognition of deferred revenue related to closings of homes on property purchased from joint venture land development operations. Income taxes payable during the prior year included a reversal of a payable amount related to an uncertain tax position in which we received a favorable settlement.
70
Investing Cash Flow Activities
Net cash used in investing activities was $75.8 million and $138.9 million for the years ended December 31, 2013 and 2012, respectively. The decrease in cash used in 2013 was primarily the result of reduced investments in unconsolidated entities as we received distributions from joint venture operations, primarily in our Canada segment, and made equipment purchases partially offset by an increase in restricted cash from securing credit lines in our Canadian operations.
Financing Cash Flow Activities
Net cash provided by financing activities totaled $337.9 million and $375.5 million for the years ended December 31, 2013 and 2012, respectively. Net cash provided by financing activities in 2013 was primarily attributable to our issuance of $550.0 million of 2021 Senior Notes in April 2013. In 2013 our loans receivable from mortgage operations were reduced during the year by $5.5 million as loans were sold to financial institutions as part of our lending procedures. Funds collected reduced the outstanding mortgage borrowings. The decrease in 2013 is primarily related to the incremental borrowings under our revolving facilities. Additionally the proceeds from the IPO in 2013 were used to buy back $189.6 million aggregate principal amount of the 2020 Senior Notes and $485.8 million to purchase New TMM Units held by the TPG and Oaktree Holding Vehicles, JH and certain members of TMHC's management and Board.
Commercial Commitments and Off-Balance Sheet Arrangements
| Payments Due by Period (in thousands) | ||||||||||||||||||||
| Totals | Less than 1 year | 1-3 years | 4-5 years | More than 5 years | ||||||||||||||||
Operating lease obligations | $ | 24,900 | $ | 6,371 | $ | 11,493 | $ | 5,827 | $ | 1,209 | ||||||||||
Topic 740 obligations including interest and penalties (1) | 5,216 | - | 5,216 | - | - | |||||||||||||||
Land purchase contracts (2) | 500,857 | 224,635 | 171,772 | 84,278 | 20,172 | |||||||||||||||
Debt outstanding (3) | 1,415,082 | 221,337 | 83,509 | 58,499 | 1,051,737 | |||||||||||||||
Estimated interest expense (4) | 421,701 | 76,300 | 141,463 | 137,046 | 66,892 | |||||||||||||||
|
|
|
|
|
|
|
|
|
| |||||||||||
Totals | $ | 2,367,756 | $ | 528,643 | $ | 413,453 | $ | 285,650 | $ | 1,140,010 | ||||||||||
|
|
|
|
|
|
|
|
|
| |||||||||||
| (1) | We are currently under examination by various taxing jurisdictions with respect to our historical tax returns. The Predecessor Parent Company has indemnified us for amounts payable in respect of these additional taxes. See " Item 1A - Risk Factors - We may not be able to use certain deferred tax assets, which may result in our having to pay substantial taxes ." |
| (2) | Represents remaining purchase price due under full-recourse land purchase contracts. |
| (3) | As of December 31, 2013 total debt outstanding includes $485.4 million aggregate principal amount of 2020 Senior Notes, $550.0 aggregate principal amount of 2021 Senior Notes, $74.9 million of mortgage borrowings by TMHF and $300.7 million of loans and other borrowings. Scheduled maturities of certain loans and other borrowings as of December 31, 2013 reflect estimates of anticipated lot take-downs associated with such loans. |
| (4) | Estimated interest expense amounts for debt outstanding at the respective contractual interest rates, the weighted average of which is 5.6% as of December 31, 2013. |
71
The following table summarizes our letters of credit, surety bonds and financial guarantees of joint ventures as of the dates indicated:
| As of December 31, | ||||||||
| (In thousands) | 2013 | 2012 | ||||||
Letters of credit | ||||||||
U.S. | $ | 26,457 | $ | 25,333 | ||||
Canada | 77,871 | 100,462 | ||||||
|
|
|
| |||||
Total outstanding letters of credit | $ | 104,328 | $ | 125,795 | ||||
|
|
|
| |||||
Surety bonds | ||||||||
U.S. | $ | 130,459 | $ | 61,619 | ||||
Canada | 58,248 | 48,369 | ||||||
|
|
|
| |||||
Total outstanding surety bonds | $ | 188,707 | $ | 109,988 | ||||
|
|
|
| |||||
Financial guarantees of joint ventures, proportionate | ||||||||
Letters of credit | $ | 15,115 | $ | 14,013 | ||||
Borrowings | 25,169 | 52,847 | ||||||
|
|
|
| |||||
Total outstanding financial guarantees of joint ventures | $ | 40,284 | $ | 66,860 | ||||
|
|
|
| |||||
Total outstanding letters of credit, surety bonds and financial guarantees of joint ventures | $ | 333,319 | $ | 302,643 | ||||
|
|
|
| |||||
We do not engage in commodity trading or other similar activities. We had no derivative financial instruments at December 31, 2013 or December 31, 2012.
Investments in Land Development and Homebuilding Joint Ventures or Unconsolidated Entities
We participate in a number of strategic land development and homebuilding joint ventures with unrelated third parties. These joint ventures operate primarily in our Canada segment and relate mainly to our high-rise developments. The use of these entities, in some instances, enables us to acquire land to which we could not otherwise obtain access, or could not obtain access on terms that are favorable. Our partners in these joint ventures historically have been land owners/developers, other homebuilders and financial or strategic partners. Joint ventures with land owners/developers have given us access to sites owned or controlled by our partners. Joint ventures with other homebuilders have provided us with the ability to bid jointly with our partners for large or expensive land parcels. Joint ventures with financial partners have allowed us to combine our homebuilding expertise with access to our partners' capital. Joint ventures with strategic partners have allowed us to combine our homebuilding expertise with the specific expertise (e.g. commercial or infill experience) of our partners.
As of December 31, 2013, we had equity investments in 34 unconsolidated land development and homebuilding joint ventures, compared to 39 at December 31, 2012. Not all of these joint ventures are actively engaged in operations and some may be maintained, despite no longer being operational.
Investment in unconsolidated land development and homebuilding joint ventures
| As of December 31, | ||||||||
| (In thousands) | 2013 | 2012 | ||||||
East | $ | 20,191 | $ | 723 | ||||
West | - | - | ||||||
Canada | 118,115 | 73,210 | ||||||
Other | 1,244 | 532 | ||||||
|
|
|
| |||||
Total | $ | 139,550 | $ | 74,465 | ||||
|
|
|
| |||||
72
These joint ventures often obtain acquisition, development and construction financing, designed to reduce our equity investment and improve our overall returns. This joint venture specific indebtedness is typically secured by all assets of the entity raising the debt. As of December 31, 2013, our unconsolidated joint ventures' borrowings were $139.4 million compared to $162.2 million at December 31, 2012. Our proportional share of letters of credit issued and indebtedness was $15.1 million and $25.2 million at December 31, 2013 and $14.0 million and $52.8 million at December 31, 2012.
As added support to the third party lenders of these unconsolidated joint ventures related to our Canadian business, secured guarantees are typically provided by Monarch, typically in proportion to Monarch's equity ownership in the joint ventures. As of December 31, 2013, our maximum recourse exposure related to outstanding indebtedness and letters of credit issued by our unconsolidated land development and homebuilding joint ventures totaled $91.1 million, a decrease from $140.4 million as of December 31, 2012. We also provide completion and performance guarantees for projects undertaken by our unconsolidated joint ventures.
The summarized balance sheets below of our unconsolidated land development and homebuilding joint ventures with recourse to us were as follows:
Summary balance sheet
| As of December 31, | ||||||||
| (In thousands) | 2013 | 2012 | ||||||
Assets | $ | 573,351 | $ | 473,115 | ||||
Liabilities | 313,726 | 356,094 | ||||||
Equity | 259,625 | 117,021 | ||||||
Land Purchase and Land Option Contracts
We enter into land purchase and option contracts to procure land or lots for the construction of homes in the ordinary course of business. Lot option contracts enable us to control significant lot positions with a minimal capital investment and substantially reduce the risks associated with land ownership and development. As of December 31, 2013, we had outstanding land purchase and lot option contracts of $500.9 million for 6,570 lots. We are obligated to close the transaction under our land purchase contracts. However, our obligations with respect to the option contracts are generally limited to the forfeiture of the related non-refundable cash deposits and/or letters of credit provided to obtain the options. For additional detail, see Overview of Capital Resources and Liquidity - Commercial Commitments and Off-Balance Sheet Arrangements of this MD&A.
Critical Accounting Policies
General
A comprehensive enumeration of the significant accounting policies is presented in Note 2 - Summary of Significant Accounting Policies of our Consolidated and Combined Financial Statements in Item 8 of this Annual Report. Each of our accounting policies is based upon current authoritative literature that collectively comprises U.S. GAAP. In instances where alternative methods of accounting are permissible under U.S. GAAP, the method used is that which most appropriately reflects the nature of our business, the results of our operations and our financial condition, and we have consistently applied those methods over each of the periods presented in the financial statements.
Revenue Recognition
Home Sales
Home closings revenue is recorded at closing using the completed-contract method of accounting at the time each home is delivered, title and possession are transferred to the buyer, we have no significant continuing involvement with the home, and the buyer has demonstrated sufficient initial and continuing investment in the property.
73
Revenues from the sale of high-rise condominiums are recognized when construction is beyond the preliminary stage, the buyer is committed to the extent of being unable to require a refund except for non-delivery of the unit, sufficient units in the project have been sold to ensure that the property will not be converted to a rental property, the sales proceeds are collectible and the aggregate sales proceeds and total cost of the project can be reasonably estimated.
Revenue for our Canadian high-rise condominiums is recognized, on an individual unit basis, when a certificate of occupancy has been received, all significant conditions of registration have been performed and the purchaser has the right to occupy the unit. At such time, the deposits that have been received from firm sales are applied to the sales price, and a receivable is set up for the balance due upon closing. Costs are recognized on the individual unit's proportionate share of budgeted project costs along with the budgeted specifically identifiable home costs.
Land Sales
Land closings revenue is recognized when title is transferred to the buyer, we have no significant continuing involvement, and the buyer has demonstrated sufficient initial and continuing investment in the property sold. If the buyer has not made an adequate initial or continuing investment in the property, the profit on such sale is deferred until these conditions are met.
Mortgage Operations Revenue
Revenues from loan origination are recognized at the time the related real estate transactions are completed, usually upon the close of escrow. All of the loans TMHF originates are sold within a short period of time, typically within 20 days, on a non-recourse basis as further described in Note 9 - Debt - Mortgage Company Loan Facilities in Item 8 of this Annual Report. After the loans are sold, we retain potential liability for possible claims by purchasers that we breached certain limited industry-standard representations and warranties in the loan sale agreement. Gains or losses from the sale of mortgages are recognized based on the difference between the selling price and carrying value of the related loans upon sale.
Deposits
Forfeited buyer deposits related to home, condominium, and land sales are recognized in other income in the accompanying Consolidated and Combined Statements of Operations in the period in which we determine that the buyer will not complete the purchase of the property and the deposit is determined to be non-refundable to the buyer.
Sales Discounts and Incentives
We typically grant our homebuyers sales discounts and incentives, including cash discounts, discounts on options included in the home, option upgrades, and seller-paid financing or closing costs. Discounts are generally accounted for as a reduction in the sales price of the home.
Real Estate Inventory
Inventory consists of land, land under development, homes under construction, completed homes, and model homes, which are stated at cost. In addition to direct carrying costs, we also capitalize interest, real estate taxes, and related development costs that benefit the entire community, such as field construction supervision and related direct overhead. Home construction costs are accumulated and charged to cost of sales at home closing using the specific identification method. Land acquisition, development, interest, real estate taxes, overhead, and condominium construction costs are allocated to homes and units using methods that approximate the relative sales value method. These costs are capitalized to inventory from the point development begins to the point construction is completed. Changes in estimated costs to be incurred in a community are generally allocated to the remaining homes on a prospective basis. For those communities that have been temporarily closed or development has been discontinued, we do not allocate interest or other costs to the community's inventory until activity resumes.
We assess the recoverability of our land inventory in accordance with the provisions of Accounting Standards Codification ("ASC") Topic 360, Property, Plant, and Equipment . We review our real estate inventory for indicators of
74
impairment by community during each reporting period. Closeout communities (those communities with fewer than 15 remaining homes) are excluded from the analysis. If indicators of impairment are present for a community, we first perform an undiscounted cash flow analysis to determine if the carrying value of the assets in that community exceeds the undiscounted cash flows. If the carrying value of the assets exceeds their estimated undiscounted cash flows, then the assets are deemed to be impaired and are recorded at fair value as of the assessment date. These cash flows are significantly impacted by various estimates of sales prices, construction costs, sales pace, and other factors. The discount rate used in determining each asset's fair value depends on the community's projected life and development stage. Historically, our discount rates have generally ranged from 12.0% to 18.0%. For additional information on the qualitative factors considered and key assumptions used see Note 2 - Summary of Significant Accounting Policies – Real Estate Inventory of our Consolidated and Combined Financial Statements and the notes to our Consolidated and Combined Financial Statements included in Item 8 of this Annual Report.
We evaluated 197 communities as of December 31, 2013, 120 communities as of December 31, 2012 and 122 communities as of December 31, 2011 for impairments. No impairments were recorded for these years.
When an impairment charge for a community is determined, the charge is then allocated to each lot in the community in the same manner as land and development costs are allocated to each lot. Inventory within each community is categorized as construction in progress and finished homes, residential land and lots developed and under development, or land held for development, based on the stage of production or plans for future development.
Our estimate of undiscounted cash flows from these communities may change with market conditions and could result in a future need to record impairment charges to adjust the carrying value of these assets to their estimated fair value. Several factors could lead to changes in the estimates of undiscounted future cash flows for a given community. The most significant of these include pricing and incentive levels actually realized by the community, the rate at which the homes are sold and changes in the costs incurred to develop lots and
construct homes. Pricing and incentive levels are often interrelated with sales pace within a community, given that price reductions generally lead to an increase in sales pace. Further, both of these factors are heavily influenced by the competitive pressures facing a given community from both new homes and existing homes, some of which may result from foreclosures. If conditions worsen in the broader economy, homebuilding industry or specific markets in which we operate, and as we re-evaluate specific community pricing and incentives, construction and development plans and our overall land sale strategies, we may be required to evaluate additional communities or re-evaluate previously impaired communities for potential impairment. We do not forecast any adjusted market improvement in our analysis above the original model we used as of the date of the Acquisition. For assets that are currently "mothballed" (i.e., strategic long-term land positions not currently under development or subject to an active selling effort), assumptions are based on current development plans and current price pace and house costs of similar communities. These evaluations may result in additional impairment charges.
The life cycle of a community generally ranges from three to five years, commencing with the acquisition of unentitled or entitled land, continuing through the land development phase and concluding with the sale, construction and delivery of homes. Actual community lives will vary based on the size of the community, the sales absorption rate and whether we purchased the property as raw land or finished lots. In the years ended December 31, 2013 and 2012, we were actively selling in an average of 177 and 129 communities, respectively.
Capitalized Interest
We capitalize certain interest costs to inventory during the development and construction periods. Capitalized interest is charged to cost of sales when the related inventory is delivered or when the related inventory is charged to cost of sales under the percentage-of-completion method of accounting.
Investments in Unconsolidated Entities and Variable Interest Entities (VIEs)
In the ordinary course of business, we enter into land and lot option purchase contracts in order to procure land or lots for the construction of homes. Lot option contracts enable us to control significant lot positions with a minimal capital investment and substantially reduce the risks associated with land ownership and development. In June 2009, the FASB revised its guidance regarding the determination of a primary beneficiary of a VIE, ASC Topic 810-10, Consolidation.
75
We have concluded that when we enter into an option or purchase agreement to acquire land or lots and pay a non-refundable deposit, a VIE may be created because we are deemed to have provided subordinated financial support that will absorb some or all of an entity's expected losses if they occur. For each VIE, we assess whether we are the primary beneficiary by first determining if we have the ability to control the activities of the VIE that most significantly impact its economic performance. Such activities include, but are not limited to, the ability to determine the budget and scope of land development work, if any; the ability to control financing decisions for the VIE; the ability to acquire additional land into the VIE or dispose of land in the VIE not under contract with us; and the ability to change or amend the existing option contract with the VIE. If we are not able to control such activities, we are not considered the primary beneficiary of the VIE. If we do have the ability to control such activities, we will continue our analysis by determining if we are expected to absorb a potentially significant amount of the VIE's losses or, if no party absorbs the majority of such losses, if we will potentially benefit from a significant amount of the VIE's expected gains. If we are the primary beneficiary of the VIE, we will consolidate the VIE in our financial statements and reflect such assets and liabilities as consolidated real estate not owned within our inventory balance in the Consolidated and Combined Balance Sheets.
We are also involved in several joint ventures with independent third parties for our homebuilding activities. We use the equity method of accounting for investments that qualify as VIEs where we are not the primary beneficiary and entities that we do not control or where we do not own a majority of the economic interest, but have the ability to exercise significant influence over the operating and financial policies of the investee. For those unconsolidated entities in which we function as the managing member, we have evaluated the rights held by our joint venture partners and determined that they have substantive participating rights that preclude the presumption of control. For joint ventures accounted for using the equity method, our share of net earnings or losses is included in Equity in Income (Loss) of Unconsolidated Entities when earned and distributions are credited against our investment in the joint venture when received.
Non-controlling Interests - joint ventures - We consolidate joint ventures when we are the primary beneficiary. Therefore, those entities' financial statements are consolidated into our Consolidated and Combined Financial Statements and the other partners' equity is recorded as Non-controlling Interests – joint ventures.
Non-controlling Interests - Principal Equityholders and Former Controlling Interests - In the Reorganization Transactions (see Note 16 - Capital Structure - Reorganization Transactions in Item 8 of this Annual Report), immediately prior to our IPO, the existing holders of TMM Holdings limited partnership interests (the Principal Equityholders, members of management and the Board of Directors), exchanged their limited partnership interests for New TMM Units. For each New TMM Unit received in the exchange, the Principal Equityholders, members of management and the Board of Directors also received, directly and indirectly, a corresponding number of shares of Class B Common Stock. All of our Class B Common Stock is owned by the Principal Equityholders, members of management and the Board of Directors. Our Class B Common Stock has voting rights but no economic rights. One share of Class B Common Stock, together with one New TMM Unit, is exchangeable into one share of our Class A Common Stock.
We sold Class A Common Stock to the investing public in our IPO. The proceeds received in the IPO were used by us to purchase New TMM Units, such that we own an amount of New TMM Units equal to the amount of our shares of Class A Common Stock. Our Class A Common Stock has voting rights and economic rights. Also in the Reorganization Transactions, we became the sole owner of the general partner of New TMM. As the general partner of New TMM, we exercise exclusive and complete control over New TMM. Consequently, we consolidate New TMM and record a non-controlling interest in our Consolidated and Combined Balance Sheet for the economic interests in New TMM held, directly and indirectly, by the Principal Equityholders, members of management and the Board of Directors.
The Non-controlling interests - Principal Equityholders percentages at December 31, 2013 are as follows:
| Shares Outstanding | Percentage | |||||||
Class A Common Stock | 32,857,800 | 26.9 | % | |||||
Class B Common Stock | 89,451,164 | 73.1 | ||||||
|
|
|
| |||||
Total | 122,308,964 | 100.0 | % | |||||
76
Business Combinations
We account for businesses we acquire in accordance with ASC Topic 805, Business Combinations . Under the purchase method of accounting, the assets acquired and liabilities assumed are recorded at their estimated fair values. Any purchase price paid in excess of the net fair values of tangible and identified intangible assets less liabilities assumed is recorded as goodwill. Our reported income from an acquired company includes the operations of the acquired company from the effective date of acquisition.
Income Taxes
See Note 2 of our Consolidated and Combined Financial Statements and the notes to our Consolidated and Combined Financial Statements included in Item 8 of this Annual Report.
Recently Issued Accounting Pronouncements
See Note 2 of our Consolidated and Combined Financial Statements and the notes to our Consolidated and Combined Financial Statements included in Item 8 of this Annual Report.
| ITEM 7A. | QUANTITATIVE AND QUALITATIVE DISCLOSURES ABOUT MARKET RISK |
Interest Rate Risk
Our operations are interest rate sensitive. We monitor our exposure to changes in interest rates and incur both fixed rate and variable rate debt. At December 31, 2013, 95% of our debt was fixed rate and 5% was variable rate. None of our market sensitive instruments were entered into for trading purposes. We did not utilize swaps, forward or option contracts on interest rates or other types of derivative financial instruments to manage our risk as of and for the year ended December 31, 2013. For fixed rate debt, changes in interest rates generally affect the fair value of the debt instrument, but not our earnings or cash flows. Conversely, for variable rate debt, changes in interest rates generally do not impact the fair value of the debt instrument but may affect our future earnings and cash flows, and may also impact our variable rate borrowing costs, which principally relate to any borrowings under our Restated Revolving Credit Facility and to any borrowings by TMHF under its various warehouse facilities. As of December 31, 2013, we had no outstanding borrowings under our $400.0 million Restated Revolving Credit Facility. We had $373.5 million of additional availability for borrowings and $173.5 million of additional availability for letters of credit (giving effect to $26.5 million of letters of credit outstanding as of such date). See Item 7 - Overview of Capital Resources and Liquidity - Capital Resources - Original Revolving Credit Facility and Restated Revolving Credit Facility. Our fixed rate debt is subject to a requirement that we offer to purchase the senior notes at par with certain proceeds of asset sales (to the extent not applied in accordance with the indenture governing the senior notes). We are also required to offer to purchase all of the outstanding senior notes at 101% of their aggregate principal amount upon the occurrence of specified change of control events. Other than in those circumstances, we do not have an obligation to prepay fixed rate debt prior to maturity and, as a result, interest rate risk and changes in fair value would not have a significant impact on our cash flows related to our fixed rate debt until such time as we are required to refinance, repurchase or repay such debt.
We are not materially exposed to interest rate risk associated with TMHF's mortgage loan origination business, because at the time any loan is originated, TMHF has identified the investor who will agree to purchase the loan on the interest rate terms that are locked in with the borrower at the time the loan is originated.
77
The following table sets forth principal cash flows by scheduled maturity and effective weighted average interest rates and estimated fair value of our debt obligations as of December 31, 2013. The interest rate for our variable rate debt represents the interest rate on our mortgage warehouse facilities. Because the mortgage warehouse facilities are effectively secured by certain mortgage loans held for sale which are typically sold within 20 days, its outstanding balance is included as a variable rate maturity in the most current period presented.
| Expected Maturity Date | ||||||||||||||||||||||||||||||||
| (In millions, except percentage data) | 2014 | 2015 | 2016 | 2017 | 2018 | Thereafter | Total | Fair Value | ||||||||||||||||||||||||
Fixed Rate Debt | $ | 147.1 | $ | 49.2 | $ | 35.6 | $ | 17.6 | $ | 42.2 | $ | 1,048.5 | $ | 1,340.2 | $ | 1,386.1 | ||||||||||||||||
Average interest rate (1) | 3.0 | % | 3.0 | % | 3.0 | % | 3.0 | % | 3.0 | % | 6.4 | % | 5.6 | % | - | |||||||||||||||||
Variable rate debt (2) | $ | 74.9 | - | - | - | - | - | $ | 74.9 | $ | 74.9 | |||||||||||||||||||||
Average interest rate | 3.4 | % | - | - | - | - | - | 3.4 | % | - | ||||||||||||||||||||||
| (1) | Represents the coupon rate of interest on the full principal amount of the debt. |
| (2) | Based upon the amount of variable rate debt at December 31, 2013, and holding the variable rate debt balance constant, each 1% increase in interest rates would increase the interest incurred by us by approximately $0.7 million per year. |
Currency Exchange Risk
The functional currency for our Canadian operations is the Canadian dollar. In the year ended December 31, 2013 and 2012, 17.5% and 27.5%, respectively, of our consolidated revenues were generated by our Canadian operations. As a result, our future earnings could be affected by fluctuations in the exchange rate between the U.S. and Canadian dollars. We did not utilize swaps, forward or option contracts on currency exchange rates or other types of derivative financial instruments to manage our risk for the year ended December 31, 2013. Based upon the level of our Canadian operations during the year ended December 31, 2013, relative to our operations as a whole, a 10% increase in the value of the Canadian dollar as compared to the U.S. dollar would have reduced net income by approximately $7.5 million for the year ended December 31, 2013.
78
| ITEM 8. | FINANCIAL STATEMENTS AND SUPPLEMENTARY DATA |
REPORT OF INDEPENDENT REGISTERED PUBLIC ACCOUNTING FIRM
To the Board of Directors and Stockholders of
Taylor Morrison Home Corporation
Scottsdale, Arizona
We have audited the accompanying consolidated balance sheets of Taylor Morrison Home Corporation and subsidiaries (the "Company") as of December 31, 2013 and 2012, and the related consolidated and combined statements of operations, comprehensive income (loss), stockholders' equity, and cash flows for each of the two years in the period ended December 31, 2013 and for the period from July 13, 2011 through December 31, 2011 (Successor) and the period from January 1, 2011 through July 12, 2011 (Predecessor). These consolidated and combined financial statements are the responsibility of the Company's management. Our responsibility is to express an opinion on these consolidated and combined financial statements based on our audits.
We conducted our audits in accordance with the standards of the Public Company Accounting Oversight Board (United States). Those standards require that we plan and perform the audit to obtain reasonable assurance about whether the financial statements are free of material misstatement. The Company is not required to have, nor were we engaged to perform, an audit of its internal control over financial reporting. Our audits included consideration of internal control over financial reporting as a basis for designing audit procedures that are appropriate in the circumstances, but not for the purpose of expressing an opinion on the effectiveness of the Company's internal control over financial reporting. Accordingly, we express no such opinion. An audit also includes examining, on a test basis, evidence supporting the amounts and disclosures in the financial statements, assessing the accounting principles used and significant estimates made by management, as well as evaluating the overall financial statement presentation. We believe that our audits provide a reasonable basis for our opinion.
In our opinion, such consolidated and combined financial statements present fairly, in all material respects, the consolidated and combined financial position of Taylor Morrison Home Corporation and subsidiaries as of December 31, 2013 and 2012, and the results of their operations and their cash flows for each of the two years in the period ended December 31, 2013 and for the period from July 13, 2011 through December 31, 2011 (Successor) and the period from January 1, 2011 through July 12, 2011 (Predecessor), in conformity with accounting principles generally accepted in the United States of America.
As described in Note 1 to the consolidated and combined financial statements, the Company acquired all outstanding shares of Taylor Woodrow Holdings (USA), Inc. and Monarch Corporation on July 13, 2011, at which date all assets and liabilities of the acquired companies were recorded at fair value. The financial information for the Predecessor period, which combines the operations of the two acquired entities, is not comparable with that for the Successor periods.
/s/ DELOITTE & TOUCHE LLP
Phoenix, Arizona
February 24, 2014
79
TAYLOR MORRISON HOME CORPORATION AND SUBSIDIARIES
(CONSOLIDATED AND COMBINED WITH TMM HOLDINGS LIMITED PARTNERSHIP AND SUBSIDIARIES)
CONSOLIDATED AND COMBINED BALANCE SHEETS
(In thousands, except share and per share amounts)
| December 31, | ||||||||
| 2013 | 2012 | |||||||
Assets | ||||||||
Cash and cash equivalents | $ | 389,181 | $ | 300,602 | ||||
Restricted cash | 24,814 | 13,683 | ||||||
Real estate inventory: | ||||||||
Owned inventory | 2,243,744 | 1,604,187 | ||||||
Real estate not owned under option agreements | 18,595 | - | ||||||
|
|
|
| |||||
Total real estate inventory | 2,262,339 | 1,604,187 | ||||||
Land deposits | 43,739 | 28,724 | ||||||
Loans receivable | 33,395 | 48,579 | ||||||
Mortgages receivable | 95,718 | 84,963 | ||||||
Tax indemnification receivable | 5,216 | 107,638 | ||||||
Prepaid expenses and other assets, net | 98,870 | 102,952 | ||||||
Other receivables, net | 56,213 | 48,951 | ||||||
Investments in unconsolidated entities | 139,550 | 74,465 | ||||||
Deferred tax assets, net | 244,920 | 274,757 | ||||||
Property and equipment, net | 7,515 | 6,423 | ||||||
Intangible assets, net | 13,713 | 18,757 | ||||||
Goodwill | 23,375 | 23,375 | ||||||
|
|
|
| |||||
Total assets | $ | 3,438,558 | $ | 2,738,056 | ||||
|
|
|
| |||||
Liabilities | ||||||||
Accounts payable | $ | 121,865 | $ | 98,647 | ||||
Accrued expenses and other liabilities | 214,500 | 213,414 | ||||||
Income taxes payable | 47,540 | 111,513 | ||||||
Customer deposits | 94,670 | 82,038 | ||||||
Mortgage borrowings | 74,892 | 80,360 | ||||||
Loans payable and other borrowings: | ||||||||
Loans payable and other borrowings attributable to the Company | 282,098 | 215,968 | ||||||
Loans payable and other borrowings attributable to consolidated option agreements. | 18,595 | - | ||||||
|
|
|
| |||||
Total loans payable and other borrowings | 300,693 | 215,968 | ||||||
Revolving credit facility borrowings | - | 50,000 | ||||||
Senior notes | 1,039,497 | 681,541 | ||||||
|
|
|
| |||||
Total liabilities | 1,893,657 | 1,533,481 | ||||||
COMMITMENTS AND CONTINGENCIES (Note 18) | ||||||||
Stockholders' Equity | ||||||||
Class A common stock, $0.00001 par value, 400,000,000 shares authorized, 32,857,800 shares issued and outstanding as of December 31, 2013 and no shares issued and outstanding as of December 31, 2012 | - | - | ||||||
Class B common stock, $0.00001 par value, 200,000,000 shares authorized, 89,451,164 shares issued and outstanding as of December 31, 2013 and no shares issued and outstanding as of December 31, 2012 | 1 | - | ||||||
Preferred stock, $0.00001 par value, 50,000,000 shares authorized, no shares issued and outstanding as of December 31, 2013 and December 31, 2012 | - | - | ||||||
Additional paid-in capital | 372,789 | - | ||||||
Retained earnings | 43,479 | 1,231,050 | ||||||
Accumulated other comprehensive loss | (452 | ) | (34,365 | ) | ||||
Non-controlling interests - joint ventures | 7,236 | 7,890 | ||||||
Non-controlling interests - Principal Equityholders | 1,121,848 | - | ||||||
|
|
|
| |||||
Total stockholders' equity | 1,544,901 | 1,204,575 | ||||||
|
|
|
| |||||
Total liabilities and stockholders' equity | $ | 3,438,558 | $ | 2,738,056 | ||||
|
|
|
| |||||
See accompanying notes to Consolidated and Combined Financial Statements
80
TAYLOR MORRISON HOME CORPORATION AND SUBSIDIARIES
(CONSOLIDATED AND COMBINED WITH TMM HOLDINGS LIMITED PARTNERSHIP AND SUBSIDIARIES)
CONSOLIDATED AND COMBINED STATEMENTS OF OPERATIONS
(In thousands, except per share amounts)
| Predecessor | ||||||||||||||||||
| Year Ended December 31, | July 13, 2011 Through December 31, | January 1, 2011 Through July 12, | ||||||||||||||||
| 2013 | 2012 | 2011 | 2011 | |||||||||||||||
Home closings revenue | $ | 2,264,985 | $ | 1,369,452 | $ | 731,216 | $ | 600,069 | ||||||||||
Land closings revenue | 27,881 | 44,408 | 10,657 | 13,639 | ||||||||||||||
Mortgage operations revenue | 30,371 | 21,861 | 8,579 | 6,027 | ||||||||||||||
|
|
|
|
|
|
|
| |||||||||||
Total revenues | 2,323,237 | 1,435,721 | 750,452 | 619,735 | ||||||||||||||
Cost of home closings | 1,774,761 | 1,077,525 | 591,891 | 474,534 | ||||||||||||||
Cost of land closings. | 26,741 | 35,884 | 8,583 | 7,133 | ||||||||||||||
Mortgage operations expenses | 16,446 | 11,266 | 4,495 | 3,818 | ||||||||||||||
|
|
|
|
|
|
|
| |||||||||||
Total cost of revenues | 1,817,948 | 1,124,675 | 604,969 | 485,485 | ||||||||||||||
Gross margin | 505,289 | 311,046 | 145,483 | 134,250 | ||||||||||||||
Sales, commissions and other marketing costs | 142,848 | 80,907 | 36,316 | 40,126 | ||||||||||||||
General and administrative expenses | 90,743 | 60,444 | 32,883 | 35,743 | ||||||||||||||
Equity in income of unconsolidated entities | (37,563 | ) | (22,964 | ) | (5,247 | ) | (2,803 | ) | ||||||||||
Interest (income) expense, net | (476 | ) | (2,446 | ) | (3,867 | ) | 941 | |||||||||||
Loss on extinguishment of debt | 10,141 | 7,953 | - | - | ||||||||||||||
Other expense (income), net | 2,541 | 3,567 | 2,308 | (10,658 | ) | |||||||||||||
Indemnification and transaction expenses | 199,119 | 13,034 | 52,292 | - | ||||||||||||||
|
|
|
|
|
|
|
| |||||||||||
Income before income taxes | 97,936 | 170,551 | 30,798 | 70,901 | ||||||||||||||
Income tax provision (benefit) | 3,068 | (260,297 | ) | 4,031 | 20,881 | |||||||||||||
|
|
|
|
|
|
|
| |||||||||||
Income before non-controlling interests, net of tax | 94,868 | 430,848 | 26,767 | 50,020 | ||||||||||||||
Loss (income) attributable to non-controlling interests - joint ventures | 131 | (28 | ) | (1,178 | ) | (4,122 | ) | |||||||||||
|
|
|
|
|
|
|
| |||||||||||
Net income | 94,999 | 430,820 | 25,589 | 45,898 | ||||||||||||||
Income attributable to non-controlling interests - | ||||||||||||||||||
Principal Equityholders | (49,579 | ) | - | - | - | |||||||||||||
|
|
|
|
|
|
|
| |||||||||||
Net income available to Taylor Morrison Home Corporation | $ | 45,420 | $ | 430,820 | $ | 25,589 | $ | 45,898 | ||||||||||
|
|
|
|
|
|
|
| |||||||||||
Earnings per common share (1) : | ||||||||||||||||||
Basic | $ | 1.38 | N/A | N/A | N/A | |||||||||||||
Diluted | $ | 1.38 | N/A | N/A | N/A | |||||||||||||
Weighted average number of shares of common stock (1) : | ||||||||||||||||||
Basic | 32,840 | N/A | N/A | N/A | ||||||||||||||
Diluted | 122,319 | N/A | N/A | N/A | ||||||||||||||
| (1) | Prior to the Reorganization Transactions on April 9, 2013 and the IPO no common shares were outstanding. See Note 16 - Capital Structure - Reorganization Transactions for additional information. |
See accompanying notes to Consolidated and Combined Financial Statements
81
TAYLOR MORRISON HOME CORPORATION AND SUBSIDIARIES
(CONSOLIDATED AND COMBINED WITH TMM HOLDINGS LIMITED PARTNERSHIP AND SUBSIDIARIES)
CONSOLIDATED AND COMBINED STATEMENTS OF COMPREHENSIVE INCOME
(In thousands)
| Predeccessor | ||||||||||||||||||
| Year Ended December 31, | July 13, 2011 Through December 31, | January 1, 2011 Through July 12, | ||||||||||||||||
| 2013 | 2012 | 2011 | 2011 | |||||||||||||||
Income before non-controlling interests, net of tax | $ | 94,868 | $ | 430,848 | $ | 26,767 | $ | 50,020 | ||||||||||
Other comprehensive income (loss), net of tax: | ||||||||||||||||||
Foreign currency translation adjustments, net of tax | (16,727 | ) | (1,073 | ) | (22,320 | ) | 8,866 | |||||||||||
Post-retirement benefits adjustments, net of tax | 7,483 | (3,227 | ) | (7,745 | ) | 214 | ||||||||||||
|
|
|
|
|
|
|
| |||||||||||
Other comprehensive income (loss), net of tax | (9,244 | ) (1) | (4,300 | ) | (30,065 | ) | 9,080 | |||||||||||
Comprehensive income (loss) | 85,624 | 426,548 | (3,298 | ) | 59,100 | |||||||||||||
Comprehensive loss (income) attributable to non-controlling interests - joint ventures | 131 | 28 | (1,178 | ) | (4,122 | ) | ||||||||||||
Comprehensive income attributable to non-controlling interests - Principal Equityholders | (39,876 | ) | - | - | - | |||||||||||||
|
|
|
|
|
|
|
| |||||||||||
Comprehensive income (loss) available to Taylor Morrison Home Corporation | $ | 45,879 | $ | 426,576 | $ | (4,476 | ) | $ | 54,978 | |||||||||
|
|
|
|
|
|
|
| |||||||||||
| (1) | Difference between other comprehensive income reported on this schedule and other comprehensive income reported in the Consolidated and Combined Statement of Stockholders' Equity is the result of deferred tax assets on post retirement benefits recorded in net income in the current year. |
See accompanying notes to Consolidated and Combined Financial Statements
82
TAYLOR MORRISON HOME CORPORATION AND SUBSIDIARIES
(CONSOLIDATED AND COMBINED WITH TMM HOLDINGS LIMITED
PARTNERSHIP AND SUBSIDIARIES)
CONSOLIDATED AND COMBINED STATEMENTS OF STOCKHOLDERS' EQUITY
(In thousands, except share data)
| Common Stock | ||||||||||||||||||||||||||||||||||||||||||||
| Class A | Class B | Additional Paid-in Capital | Stockholders' equity | |||||||||||||||||||||||||||||||||||||||||
| Shares | Amount | Shares | Amount | Amount | Net Owners' Equity | Retained Earnings | Accumulated Other Comprehensive Income (Loss) | (1) Non-controlling Interest - Joint Venture | Non-controlling Interest -Principal Equityholders | Total Stockholders' Equity | ||||||||||||||||||||||||||||||||||
Balance - January 1, 2011 (Predecessor) | - | $ | - | - | $ | - | $ | - | $ | 463,211 | $ | - | $ | (2,503 | ) | $ | 4,823 | $ | - | $ | 465,531 | |||||||||||||||||||||||
Net income | - | - | - | - | - | 45,898 | - | - | 4,122 | - | 50,020 | |||||||||||||||||||||||||||||||||
Other comprehensive income | - | - | - | - | - | - | - | 9,080 | - | 9,080 | ||||||||||||||||||||||||||||||||||
Receivable from Predecessor Parent Company, net | - | - | - | - | - | 11,359 | - | - | - | 11,359 | ||||||||||||||||||||||||||||||||||
Distributions to non-controlling interests | - | - | - | - | - | - | - | - | (5,326 | ) | - | (5,326 | ) | |||||||||||||||||||||||||||||||
|
|
|
|
|
|
|
|
|
|
|
|
|
|
|
|
|
|
|
|
|
| |||||||||||||||||||||||
Balance - July 12, 2011 (Predecessor) | - | - | - | - | - | 520,468 | - | 6,577 | 3,619 | - | 530,664 | |||||||||||||||||||||||||||||||||
Initial capital contribution and purchase price allocation adjustments | - | - | - | - | - | 99,852 | - | (6,577 | ) | 9,574 | - | 102,849 | ||||||||||||||||||||||||||||||||
Net income | - | - | - | - | - | 25,589 | - | - | 1,178 | - | 26,767 | |||||||||||||||||||||||||||||||||
Other comprehensive loss | - | - | - | - | - | - | - | (30,065 | ) | - | - | (30,065 | ) | |||||||||||||||||||||||||||||||
Issuance of partnership units | - | - | - | - | - | 3,300 | - | - | - | - | 3,300 | |||||||||||||||||||||||||||||||||
Distributions to non-controlling interests | - | - | - | - | - | - | - | - | (4,950 | ) | - | (4,950 | ) | |||||||||||||||||||||||||||||||
|
|
|
|
|
|
|
|
|
|
|
|
|
|
|
|
|
|
|
|
|
| |||||||||||||||||||||||
Balance - December 31, 2011 | - | - | - | - | - | 649,209 | - | (30,065 | ) | 9,421 | - | 628,565 | ||||||||||||||||||||||||||||||||
Net income | - | - | - | - | - | 430,820 | - | - | 28 | - | 430,848 | |||||||||||||||||||||||||||||||||
Other comprehensive loss | - | - | - | - | - | - | - | (4,300 | ) | - | - | (4,300 | ) | |||||||||||||||||||||||||||||||
Share based compensation | - | - | - | - | - | 1,975 | - | - | - | - | 1,975 | |||||||||||||||||||||||||||||||||
Distributions to non-controlling interests | - | - | - | - | - | - | - | - | (1,800 | ) | - | (1,800 | ) | |||||||||||||||||||||||||||||||
Contribution of debt in exchange for equity | - | - | - | - | - | 146,633 | - | - | - | - | 146,633 | |||||||||||||||||||||||||||||||||
Non-controlling interest of acquired entity | - | - | - | - | - | - | - | - | 241 | - | 241 | |||||||||||||||||||||||||||||||||
Issuance of partnership units | - | - | - | - | - | 2,413 | - | - | - | - | 2,413 | |||||||||||||||||||||||||||||||||
|
|
|
|
|
|
|
|
|
|
|
|
|
|
|
|
|
|
|
|
|
| |||||||||||||||||||||||
Balance - December 31, 2012 | - | - | - | - | - | 1,231,050 | - | (34,365 | ) | 7,890 | - | 1,204,575 | ||||||||||||||||||||||||||||||||
Establish non-controlling interest on April 12, 2013 | - | - | - | - | - | (1,231,050 | ) | - | 34,365 | - | 1,196,685 | - | ||||||||||||||||||||||||||||||||
Issuance of Class A Common Stock, net of offering costs | 32,857,800 | - | - | - | 668,598 | - | - | - | - | - | 668,598 | |||||||||||||||||||||||||||||||||
Issuance of Class B Common Stock, net of offering costs | - | - | 112,784,964 | 1 | - | - | - | - | - | - | 1 | |||||||||||||||||||||||||||||||||
Repurchase of New TMM Units and corresponding number of class B Common Stock | - | - | (23,333,800 | ) | - | - | - | - | - | - | (485,782 | ) | (485,782 | ) | ||||||||||||||||||||||||||||||
Offering costs capitalized to equity | - | - | - | - | - | - | - | - | - | (10,775 | ) | (10,775 | ) | |||||||||||||||||||||||||||||||
Allocation of dilution on IPO Class A Common Stock | - | - | - | - | (297,591 | ) | - | - | - | - | 297,591 | - | ||||||||||||||||||||||||||||||||
Net income (loss) | - | - | - | - | - | - | 45,420 | - | (131 | ) | 49,579 | 94,868 | ||||||||||||||||||||||||||||||||
Other comprehensive (loss) income | - | - | - | - | - | - | - | (452 | ) | - | (8,792 | ) | (9,244 | ) | ||||||||||||||||||||||||||||||
Dividends | - | - | - | - | - | - | (1,941 | ) | - | - | (2,194 | ) | (4,135 | ) | ||||||||||||||||||||||||||||||
Share based compensation | - | - | - | - | 1,782 | - | - | - | - | 85,536 | 87,318 | |||||||||||||||||||||||||||||||||
Non-controlling interest of acquired entity | - | - | - | - | - | - | - | - | (106 | ) | (106 | ) | ||||||||||||||||||||||||||||||||
Distributions to non-controlling interests - joint ventures | - | - | - | - | - | - | - | - | (417 | ) | - | (417 | ) | |||||||||||||||||||||||||||||||
|
|
|
|
|
|
|
|
|
|
|
|
|
|
|
|
|
|
|
|
|
| |||||||||||||||||||||||
Balance - December 31, 2013 | 32,857,800 | $ | - | 89,451,164 | $ | 1 | $ | 372,789 | $ | - | $ | 43,479 | $ | (452 | ) | $ | 7,236 | $ | 1,121,848 | $ | 1,544,901 | |||||||||||||||||||||||
|
|
|
|
|
|
|
|
|
|
|
|
|
|
|
|
|
|
|
|
|
| |||||||||||||||||||||||
| (1) | Changes in opening balances at December 31, 2012 relate to adjustments to the purchase price allocation for the Darling Acquisition recorded during the year ended December 31, 2013. See Note 2 - Summary of Significant Accounting Policies - Acquisition Accounting - Darling Acquisition for details. |
See accompanying notes to Consolidated and Combined Financial Statements
83
TAYLOR MORRISON HOME CORPORATION AND SUBSIDIARIES
(CONSOLIDATED AND COMBINED WITH TMM HOLDINGS LIMITED PARTNERSHIP AND SUBSIDIARIES)
CONSOLIDATED AND COMBINED STATEMENTS OF CASH FLOWS
(In thousands)
| Year ended December 31, | For the period from July 13, 2011 through December 31, | For the period from January 1, 2011 through July 12, | ||||||||||||||
| 2013 | 2012 | 2011 | 2011 | |||||||||||||
CASH FLOWS FROM OPERATING ACTIVITIES: | ||||||||||||||||
Income before non-controlling interests, net of tax | $ | 94,868 | $ | 430,848 | $ | 26,767 | $ | 50,020 | ||||||||
Adjustments to reconcile net income to net cash used in operating activities: | ||||||||||||||||
Equity in income of unconsolidated entities | (37,563 | ) | (22,964 | ) | (5,247 | ) | (2,803 | ) | ||||||||
Stock compensation expense | 87,318 | 1,975 | - | - | ||||||||||||
Distributions of earnings from unconsolidated entities | 30,136 | 36,746 | 5,684 | 9,603 | ||||||||||||
Depreciation and amortization | 3,462 | 4,370 | 2,564 | 1,655 | ||||||||||||
Loss on extinguishment of debt | 10,141 | 7,853 | - | - | ||||||||||||
Deferred income taxes | 30,662 | (278,880 | ) | (11,676 | ) | 423 | ||||||||||
Changes in operating assets and liabilities: | ||||||||||||||||
Real estate inventory and land deposits | (450,147 | ) | (331,116 | ) | 52,587 | 23,832 | ||||||||||
Receivables, prepaid expenses and other assets | (5,183 | ) | (109,970 | ) | 25,757 | (8,426 | ) | |||||||||
Customer deposits | 15,795 | 16,845 | (8,534 | ) | (6,506 | ) | ||||||||||
Accounts payable, accrued expenses and other liabilities | 35,387 | 6,089 | 12,484 | (9,407 | ) | |||||||||||
Income taxes payable | 33,191 | 23,735 | 6,645 | (6,992 | ) | |||||||||||
|
|
|
|
|
|
|
| |||||||||
Net cash (used in) provided by operating activities | (151,933 | ) | (214,469 | ) | 107,031 | 51,399 | ||||||||||
|
|
|
|
|
|
|
| |||||||||
CASH FLOWS FROM INVESTING ACTIVITIES: | ||||||||||||||||
Purchase of property and equipment | (3,786 | ) | (2,753 | ) | (1,428 | ) | (1,329 | ) | ||||||||
Business acquisitions, net of cash acquired | - | (114,571 | ) | - | - | |||||||||||
Distribution from unconsolidated entities | 8,840 | - | - | - | ||||||||||||
(Increase) decrease in restricted cash | (12,211 | ) | (8,645 | ) | 1,686 | (3,260 | ) | |||||||||
Investments of capital into unconsolidated entities | (68,634 | ) | (12,967 | ) | (1,000 | ) | - | |||||||||
|
|
|
|
|
|
|
| |||||||||
Net cash used in investing activities | (75,791 | ) | (138,936 | ) | (742 | ) | (4,589 | ) | ||||||||
|
|
|
|
|
|
|
| |||||||||
CASH FLOWS FROM FINANCING ACTIVITIES: | ||||||||||||||||
Borrowings on net payable to Predecessor Parent Company | - | - | - | 80,554 | ||||||||||||
Payments on net payable to Predecessor Parent Company | - | - | - | (3,000 | ) | |||||||||||
Decrease in receivable to Predecessor Parent Company capital contributions | - | - | - | 8,560 | ||||||||||||
Net proceeds from the issuance of Class A common stock | 668,598 | - | - | - | ||||||||||||
Purchase of New TMM Units and corresponding number of shares of Class B Common Stock | (485,782 | ) | - | - | - | |||||||||||
Borrowings on line of credit related to mortgage borrowings | 703,536 | 525,745 | 204,692 | 140,040 | ||||||||||||
Repayment on line of credit related to mortgage borrowing | (709,004 | ) | (478,115 | ) | (204,096 | ) | (112,548 | ) | ||||||||
Proceeds from loans payable and other borrowings | 45,289 | 41,598 | 19,477 | 2,820 | ||||||||||||
Repayments of loans payable and other borrowings | (182,977 | ) | (69,028 | ) | (55,974 | ) | (30,598 | ) | ||||||||
Borrowings on revolving credit facility | 907,000 | 50,000 | - | - | ||||||||||||
Payments on revolving credit facility | (957,000 | ) | - | - | - | |||||||||||
Net proceeds from the issuance of senior notes | 550,000 | 675,000 | - | - | ||||||||||||
Repayments on senior notes | (189,608 | ) | (350,000 | ) | - | - | ||||||||||
Repayments of Sponsor Loan (due to a related party) | - | - | (125,000 | ) | - | |||||||||||
Deferred financing costs | (9,680 | ) | (20,282 | ) | (2,751 | ) | - | |||||||||
Distributions to non-controlling interests – joint ventures | (418 | ) | (1,800 | ) | (4,950 | ) | (5,326 | ) | ||||||||
Intercompany borrowings | (7 | ) | - | - | - | |||||||||||
Equity (distributions) contributions | (2,000 | ) | 2,413 | 58,800 | - | |||||||||||
|
|
|
|
|
|
|
| |||||||||
Net cash provided by (used in) financing activities | 337,947 | 375,531 | (109,802 | ) | 80,502 | |||||||||||
|
|
|
|
|
|
|
| |||||||||
EFFECT OF EXCHANGE RATE CHANGES ON CASH AND CASH EQUIVALENTS | (21,644 | ) | (881 | ) | (12,591 | ) | 2,699 | |||||||||
|
|
|
|
|
|
|
| |||||||||
NET INCREASE (DECREASE) IN CASH AND CASH EQUIVALENTS | $ | 88,579 | $ | 21,245 | $ | (16,104 | ) | $ | 130,011 | |||||||
CASH AND CASH EQUIVALENTS - Beginning of period (1) | 300,602 | 279,322 | 295,426 | 165,415 | ||||||||||||
|
|
|
|
|
|
|
| |||||||||
CASH AND CASH EQUIVALENTS - End of period | $ | 389,181 | $ | 300,567 | $ | 279,322 | $ | 295,426 | ||||||||
|
|
|
|
|
|
|
| |||||||||
SUPPLEMENTAL CASH FLOW INFORMATION: | ||||||||||||||||
Income taxes paid, net | $ | (24,354 | ) | $ | (45,088 | ) | $ | (17,986 | ) | $ | (24,024 | ) | ||||
|
|
|
|
|
|
|
| |||||||||
SUPPLEMENTAL NON-CASH INVESTING AND FINANCING ACTIVITIES: | ||||||||||||||||
Conversion of Sponsor loans payable to additional Class A Units | $ | - | $ | 146,663 | $ | - | $ | - | ||||||||
|
|
|
|
|
|
|
| |||||||||
Conversion of loans payable to Predecessor Parent Company to contributions from Predecessor Parent Company | $ | - | $ | - | $ | - | $ | 499,935 | ||||||||
|
|
|
|
|
|
|
| |||||||||
Conversion of joint venture loans receiveable for equity in joint venture | $ | - | $ | 36,855 | $ | - | $ | - | ||||||||
|
|
|
|
|
|
|
| |||||||||
Loans payable and liabilities assumed related to business acquisition | $ | - | $ | 54,926 | $ | - | $ | - | ||||||||
|
|
|
|
|
|
|
| |||||||||
Decrease in loans payable issued to sellers in connection with land purchase contracts | $ | 226,441 | $ | 134,001 | $ | 35,972 | $ | 5,707 | ||||||||
|
|
|
|
|
|
|
| |||||||||
Decrease in income taxes payable and related tax indemnification receivable from seller | $ | 102,422 | $ | 15,233 | $ | 12,850 | $ | - | ||||||||
|
|
|
|
|
|
|
| |||||||||
| (1) | Cash and cash equivalents at the beginning of the period ended December 31, 2013 includes approximately $35,000 of TMHC cash that was not consolidated with TMM and included in the cash balance at December 31, 2012. |
See accompanying notes to Consolidated and Combined Financial Statements
84
TAYLOR MORRISON HOME CORPORATION AND SUBSIDIARIES
(CONSOLIDATED AND COMBINED WITH TMM HOLDINGS LIMITED PARTNERSHIP AND SUBSIDIARIES)
NOTES TO THE CONSOLIDATED AND COMBINED FINANCIAL STATEMENTS
AS OF DECEMBER 31, 2013 AND 2012, FOR THE YEARS ENDED DECEMBER 31, 2013 AND 2012, THE PERIOD FROM JULY 13, 2011 THROUGH DECEMBER 31, 2011 AND FOR THE PERIOD FROM JANUARY 1, 2011 THROUGH
JULY 12, 2011 (PREDECESSOR)
1. BUSINESS
Organization and Description of the Business - On April 12, 2013, Taylor Morrison Home Corporation ("TMHC" or the "Company") completed the initial public offering (the "IPO") of its Class A common stock, par value $0.00001 per share (the "Class A Common Stock"). The shares began trading on the New York Stock Exchange on April 10, 2013 under the ticker symbol "TMHC." As a result of the completion of the IPO and the Reorganization Transactions (see Note 16 - Capital Structure - Reorganization Transactions ), TMHC became the indirect parent of TMM Holdings Limited Partnership ("TMM Holdings") through the formation of TMM Holdings II Limited Partnership ("New TMM"). TMM Holdings is a British Columbia limited partnership formed in 2011 by a consortium comprised of affiliates of TPG Global, LLC (the "TPG Entities"), investment funds managed by Oaktree Capital Management, L.P. or their respective subsidiaries (the "Oaktree Entities"), and affiliates of JH Investments, Inc. (the "JH Entities" and together with the TPG and Oaktree Entities, the "Principal Equityholders"). On July 13, 2011, TMM Holdings, through various wholly owned acquisition subsidiaries, acquired all of the outstanding shares of Taylor Woodrow Holdings (USA), Inc. (now known as Taylor Morrison Communities, Inc., "Taylor Morrison" or "TMC") and Monarch Corporation ("Monarch"), collectively the "Predecessor" from Taylor Wimpey plc ("Predecessor Parent Company") through a combination of equity and debt (the "Acquisition"). In conjunction with the Acquisition, a series of holding companies and partnerships were established to hold TMM Holdings' investments in the acquired businesses. Taylor Morrison's principal business is residential homebuilding and the development of lifestyle communities throughout the U.S., with operations focused in Arizona, California, Colorado, Florida, and Texas. Taylor Morrison's product lines feature entry-level, move-up, and luxury homes. Monarch was founded in 1918, began homebuilding operations in 1936 and is one of the oldest names in Canadian homebuilding. Its businesses focus on high-rise and single family home residential construction in Ontario, Canada. Taylor Morrison and Monarch are the general contractors for all of their projects and retain subcontractors for home construction and site development. In addition to homebuilding, Taylor Morrison offers mortgage services to its customers in the U.S. through its mortgage brokerage subsidiary and title examination services in some U.S. locations through various joint ventures.
2. SUMMARY OF SIGNIFICANT ACCOUNTING POLICIES
Basis of Presentation and Consolidation - In the Reorganization Transactions, the Company became the sole owner of the general partner of New TMM. As the general partner of New TMM, the Company exercises exclusive and complete control over New TMM. Consequently:
| • | For periods subsequent to April 9, 2013, the Company consolidates New TMM and records a non-controlling interest in its Consolidated and Combined Balance Sheet for the economic interests in New TMM, that are directly or indirectly held by the Principal Equityholders or by members of management and the Board of Directors. The Consolidated and Combined Financial Statements fore these periods include the accounts of TMHC, TMM Holdings, New TMM, TMC, Monarch and the Company's consolidated subsidiaries, partnerships and other entities in which the Company has a controlling financial interest, and of variable interest entities in which the Company is deemed the primary beneficiary; |
| • | The Consolidated and Combined Financial Statements as of and for the year ended December 31, 2012 and the period from July 13, 2011 to December 31, 2011 reflect the consolidated operations of TMM Holdings only as there were no operating activities or equity transactions in TMHC during those periods; and |
| • | The statements of operations, comprehensive income and changes in stockholders' equity for the periods prior to July 13, 2011 reflect the historical financial statements of the North American Business of Taylor Wimpy plc., the Predecessor Parent Company, whose financial statements have been prepared using the historical cost basis of accounting that existed prior to the Acquisition. |
85
On July 13, 2011, TMM Holdings and its subsidiaries acquired 100.0% of the issued share capital of TMC and Monarch for aggregate cash consideration of approximately $1.2 billion. The Company's financial statements for periods from and after the July 13, 2011 Acquisition are derived from the financial statements of TMM Holdings, which reflect adjustments made as a result of the application of purchase accounting in connection with the Acquisition. Therefore, the financial information for the predecessor periods is not comparable with that for the period after July 13, 2011.
The Predecessor's financial statements include the accounts of TMC and Monarch, their consolidated subsidiaries and other entities in which the companies have controlling financial interests, and have been combined given the common ownership and control by the Predecessor Parent Company. The Consolidated and Combined Financial Statements have been prepared in accordance with accounting principles generally accepted in the United States of America ("U.S. GAAP"), and intercompany balances and transactions have been eliminated in consolidation. Unless the context requires otherwise, references in these financial statements to "the Company" are to the Company and its consolidated subsidiaries.
Unless otherwise stated, amounts are shown in U.S. dollars. Assets and liabilities recorded in foreign currencies are translated at the exchange rate on the balance sheet date, and revenues and expenses are translated at average rates of exchange prevailing during the period. Translation adjustments resulting from this process are recorded to accumulated other comprehensive income (loss) in the accompanying Consolidated and Combined Balance Sheets and Statements of Stockholders' Equity.
Acquisition Accounting
2011 Acquisition - In connection with the Acquisition and in accordance with Financial Accounting Standards Board ("FASB") Accounting Standards Codification ("ASC") Topic 805, Business Combinations , ("ASC 805") the Acquisition was accounted for on July 13, 2011, under the acquisition method of accounting and all acquired assets and assumed liabilities were recorded at fair value.
Cash and cash equivalents, restricted cash, other assets, accounts payable, and accrued and other liabilities were generally stated at historical carrying values given the short-term nature of these assets and liabilities. Income tax receivables and liabilities were recorded at historical carrying values in accordance with ASC Topic 805. The Predecessor Parent Company has indemnified the Company for specific uncertain tax positions for which tax liabilities are included in income taxes payable in the accompanying Consolidated and Combined Balance Sheets. A receivable due from the Predecessor Parent Company for the indemnification is valued at the same amount as the estimated income tax liability.
The Company determined the fair value of real estate inventory on a community-by-community basis primarily using the income and sales comparison approaches. The income approach derives a value indication for income-producing property by converting anticipated benefits, such as cash flow, into property value. This approach was used exclusively for finished lots. The sales comparison approach used recent land sales to provide a lot value for finished lots or an average value for raw land. In markets where there were no recent land sales, the third party appraiser conducted interviews with local market participants, including brokers and appraisers, to gain an understanding of local land and lot values. In instances where both the income and sales approaches were used, equal weightings were typically given to each approach. These estimated cash flows are significantly affected by estimates related to expected average selling prices and sales incentives, expected sales paces and cancellation rates, expected land development and construction timelines, and anticipated land development, construction, and overhead costs. Such estimates must be made for each individual community and may vary significantly between communities.
The fair value of acquired intangible assets was determined based on valuations performed by independent valuation specialists using the income approach. The intangibles were valued at $10.2 million with $4.1 million related to the Taylor Morrison trade name and $6.1 million related to the Monarch trade name. Both trade names are being amortized on a straight line basis over 10 years. Amortization of $1.0 million was recorded for both of the years ending December 31, 2013 and 2012 and $0.5 million for the period from July 13, 2011 through December 31, 2011. These amounts are included in general and administrative expenses in the accompanying Consolidated and Combined Statements of Operations.
86
The Company completed its business combination accounting as of December 31, 2011. A summary of the fair value of assets acquired and liabilities assumed as of July 13, 2011, is as follows (in thousands):
Financial Statement Caption | Total | |||
Cash and cash equivalents | $ | 295,426 | ||
Restricted cash | 6,705 | |||
Real estate inventory | 1,036,068 | |||
Land deposits | 9,667 | |||
Loan receivables, net | 76,386 | |||
Mortgage receivables | 32,531 | |||
Other receivables | 64,481 | |||
Tax indemnity receivable | 129,686 | |||
Prepaid expenses and other assets, net | 48,781 | |||
Investment in unconsolidated entities | 38,488 | |||
Property and equipment, net | 6,591 | |||
Intangible assets | 10,200 | |||
Deferred tax liabilities, net | (16,240 | ) | ||
Accounts payable | (44,763 | ) | ||
Accrued expenses and other liabilities | (199,235 | ) | ||
Income taxes payable | (120,878 | ) | ||
Customer deposits | (71,155 | ) | ||
Mortgage borrowings | (32,134 | ) | ||
Loans payable and other borrowings | (80,092 | ) | ||
Non-controlling interests | (13,193 | ) | ||
|
| |||
Net assets acquired at fair value | $ | 1,177,320 | ||
Less amounts financed through debt | (612,500 | ) | ||
|
| |||
Equity infusion paid to seller | $ | 564,820 | ||
Cash contributed by the Sponsors | 55,500 | |||
|
| |||
Net Sponsors equity | $ | 620,320 | ||
Less carrying basis of Predecessors' equity | (527,045 | ) | ||
|
| |||
Initial capital contribution and purchase price allocation adjustments | $ | 93,275 | ||
|
| |||
Transaction Expenses - In 2012, these costs relate to a $7.9 million loss on the early extinguishment of debt related to a portion of the Sponsor Loan that was repaid (see Note 9 - Debt - Sponsor Loan ) and $0.1 million of transaction costs directly related to the Acquisition. In 2011, these costs include transaction and integration costs directly related to the Acquisition, excluding the impact of restructuring costs and acquisition accounting adjustments, totaling $39.4 million, which were incurred by TMM Holdings and the Sponsors and are recorded in the Consolidated and Combined Statements of Operations as indemnification and transaction expenses.
Unaudited supplemental pro-forma information - The unaudited supplemental pro forma information presented below includes the effects of the acquisition of the TMC and Monarch businesses as if it had been completed as of January 1, 2011. The pro forma results include (i) the impact of certain estimated fair value adjustments and (ii) interest expense associated with debt used to fund the acquisition. The pro forma results for the period from January 1, 2011 through July 12, 2011 include adjustments for the financial impact of certain acquisition related items incurred during the period from July 13, 2011 through December 31, 2011. Accordingly, the following unaudited pro forma financial information should not be considered indicative of either future results or results that might have occurred had the acquisition been consummated as of January 1, 2011 (in thousands):
| For the Period from January 1 through July 12, 2011 | ||||
Total revenues | $ | 619,735 | ||
Net income | $ | 57,603 | ||
87
Darling Acquisition - On December 31, 2012, the Company acquired certain assets and liabilities of Darling Interests, Inc. and certain affiliated entities, a Texas-based homebuilder (the "Darling Acquisition"). Darling builds homes under the Darling Homes brand for move-up and luxury buyers in the Dallas-Fort Worth Metroplex and in the Greater Houston Area markets. Darling is a well-established builder whose products complement our existing product lines in Texas. The Company believes the Darling Acquisition has given it a strong presence in the Dallas homebuilding market and has expanded its existing operations in Houston.
The consideration for the acquisition of the Darling assets was $114.8 million as well as a contingent payment of $50.0 million, plus 5% of any cumulative earnings before interest and taxes above $229.5 million over the four year period following December 31, 2012. A portion of this amount was financed by $50.0 million of borrowings under the Company's Revolving Credit Facility (as defined in Note 9 - Debt - Revolving Credit Facility ). Approximately $27.6 million of the price for the acquisition was financed by the sellers. In connection with the purchase price allocation for the acquisition, the Company recorded $23.4 million of goodwill and $9.9 million of intangible assets with finite useful lives. Darling operates as part of the Company's East segment, and the goodwill recorded as part of the Darling Acquisition has been recorded in the balance sheet for the East segment included in the accompanying Consolidated and Combined Balance Sheets. The purchase price, as allocated to the assets and liabilities acquired, is as follows (in thousands):
| Amount | ||||
Initial consideration | $ | 114,845 | ||
Contingent consideration | 8,300 | |||
Seller financing | 27,605 | |||
Liabilities assumed | 19,021 | |||
|
| |||
| $ | 169,771 | |||
|
| |||
The Company has completed its business combination accounting as of December 31, 2013. In connection with the purchase price allocation for the acquisition, the Company recorded (in thousands):
| Preliminary Amount | Final Amount | Change | ||||||||||
Real estate inventory | $ | 111,814 | $ | 110,508 | $ | (1,306 | ) | |||||
Land deposits | 12,500 | 12,500 | - | |||||||||
Joint Venture interests before consolidation | 18,999 | 10,200 | (8,799 | ) | ||||||||
Other assets | 1,971 | 3,264 | 1,293 | |||||||||
Intangibles with finite lives | 9,121 | 9,924 | 803 | |||||||||
Goodwill | 15,526 | 23,375 | 7,849 | |||||||||
Contingent consideration | (8,300 | ) | (8,300 | ) | - | |||||||
Seller financing | (27,605 | ) | (27,605 | ) | - | |||||||
Liabilities assumed | (19,021 | ) | (19,021 | ) | - | |||||||
|
|
|
|
|
| |||||||
Net assets required | $ | 115,005 | $ | 114,845 | $ | (160 | ) | |||||
|
|
|
|
|
| |||||||
The $9.9 million of intangible assets with finite useful lives consist of $1.1 million of trade name, $6.0 million of lot option contracts and supplier relationships, $2.6 million of non-compete covenants and $0.2 million of favorable leases.
The Company valued the $50.0 million of contingent purchase price using probability weightings of the anticipated liability under four different scenarios: (1) business enterprise forecast of liability; (2) the contribution margin and earnings before income and tax estimates from a valuation income forecast; (3) alternative estimates of contribution margin and earnings before interest and taxes; and (4) as if the full buy out obligation was paid to Darling. The mid point of the range of the results of these probability weighted valuations was discounted, resulting in a $8.3 million liability that is included within loans payable and other borrowings at December 31, 2013 and December 31, 2012 in the Consolidated and Combined Balance Sheets.
The Company expects the entire $23.4 million of goodwill recorded from the acquisition to be deductible for tax purposes.
88
In the course of finalizing the purchase price allocation, the Company consolidated one joint venture resulting from the Darling Acquisition that yielded a preliminary $18.9 million adjustment to the non-controlling interests to account for joint venture partner debts in the Consolidated and Combined Statement of Stockholders' Equity at December 31, 2012. This adjustment was finalized at $10.2 million with the adjustment recorded against investments in unconsolidated entities in the balance sheet prior to consolidation of the joint venture in 2013. During the year ended December 31, 2013, the Company also reclassified intangible assets totaling $8.5 million into goodwill; decreased the basis assigned to one of the joint ventures by $1.8 million and increased the value assigned for lot options by $1.5 million, both of which were recorded against goodwill.
Additionally, the Company incurred $1.8 million of transaction costs which were recorded in 2012 as other expense (income), net in the Consolidated and Combined Statements of Operations. Darling's Dallas and Houston operations were integrated into the Company's East segment for segment reporting purposes in 2013.
The December 31, 2012 comparative information has been retrospectively adjusted for the above in accordance with ASC 805. Amortization of approximately $1.1 million related to the reclassified intangible assets has been reversed and is included in general and administrative expenses for the year ended December 31, 2013 as a reduction in amortization expense. Additional amortization of $0.4 million taken on the increase in lot options has been included in cost of home closings for the year ended December 31, 2013.
Reclassifications - Certain reclassifications have been made to the prior period cash flows to show additional detail of financing activities in the Consolidated and Combined Statements of Cash Flows to conform to the current period presentation. Additionally, certain December 31, 2012 balances affected by purchase price accounting in the accompanying Consolidated and Combined Financial Statements were reclassified in accordance with ASC 805. The reclassifications have no effect on the previously reported net income. Reclassifications related to the Darling Acquisition are described in more detail previously in this footnote in Summary of Significant Accounting Policies - Acquisition Accounting - Darling Acquisition .
Use of Estimates - The preparation of financial statements in accordance with U.S. GAAP requires management to make estimates and assumptions that affect the amounts reported in the Consolidated and Combined Financial Statements and accompanying notes. Significant estimates include the purchase price allocations, valuation of certain real estate, valuations of equity awards, valuation allowance on deferred tax assets and reserves for warranty and self-insured risks. Actual results could differ from those estimates.
Cash and Cash Equivalents - Cash and cash equivalents consist of cash on hand, demand deposits with financial institutions, and investments with original maturities of 90 days or less. At December 31, 2013, the majority of the Company's cash and cash equivalents were invested in high-quality money market funds or on deposit with major banks.
Restricted Cash - Restricted cash consists of $2.0 million pledged to collateralize mortgage credit lines through certificates of deposit known as Certificate of Deposit Account Registry Service (CDARS) and $22.8 million of funds used to collateralize our Canadian lines of credit.
Concentration of Credit Risk - Financial instruments that potentially subject us to concentrations of credit risk are primarily cash and cash equivalents. Cash and cash equivalents include amounts on deposit with financial institutions in the U.S. that are in excess of the Federal Deposit Insurance Corporation ("FDIC") federally insured limits of up to $250,000 and amounts on deposit with financial institutions in Canada that are in excess of the Canadian Deposit Insurance Corporation ("CDIC") federally insured limits of up to $100,000. No losses have been experienced to date.
In addition, the Company is exposed to credit risk to the extent that mortgage and loan borrowers may fail to meet their contractual obligations. This risk is mitigated by collateralizing the mortgaged property or land that was sold to the buyer.
89
Loans Receivable - Loans receivable, which consist of amounts due from land buyers and certain of the Company's joint ventures, are generally secured by the underlying land, bear interest at average interest rates of 5.0% and 5.5% as of December 31, 2013 and 2012, respectively, and mature at various dates through 2017. The Company imputes interest based on relevant market data for loans with no stated interest rate. The Company assesses the need for an allowance on in individual loan basis based on historical experience, the value of the underlying collateral, communications with the counterparty, knowledge of the counterparty's financial condition and plans, present economic conditions, and other factors considered relevant by the Company. Allowances are generally recorded in other expense (income), net when it becomes likely that some amount will not be collectible. Loans receivable are written off when it is determined that collection efforts will no longer be pursued.
The following represents our loans receivable and related allowance for credit losses (in thousands):
| As of December 31, | ||||||||
| 2013 | 2012 | |||||||
Loans receivable, gross | $ | 37,588 | $ | 50,937 | ||||
Allowance for credit losses | (4,193 | ) | (2,358 | ) | ||||
|
|
|
| |||||
Loans receivable, net | $ | 33,395 | $ | 48,579 | ||||
|
|
|
| |||||
Mortgages Receivable - Mortgages receivable consists of mortgages due from buyers of Taylor Morrison homes that are financed through Taylor Morrison's mortgage brokerage subsidiary, TMHF. Mortgages receivable are held for sale and are carried at fair value, which is calculated using observable market information, including pricing from actual market transactions, investor commitment prices, or broker quotations (see Note 10 - Fair Value Disclosures ). Due to the short term nature of mortgages receivable, an allowance for potential credit losses is not deemed necessary.
Other Receivables - Other receivables primarily consist of amounts due from buyers of condominiums, as well as other amounts expected to be recovered from various community development districts and utility deposits. Allowances of $0.6 and $1.1 million at December 31, 2013 and 2012, respectively, are maintained for potential credit losses based on historical experience, present economic conditions, and other factors considered relevant by the Company. Allowances are generally recorded in other expense (income), net when it becomes likely that some amount will not be collectible. Other receivables are written off when it is determined that collection efforts will no longer be pursued.
| Year Ended December 31, | ||||||||
| (Dollars in thousands) | 2013 | 2012 | ||||||
Allowance - beginning of period | $ | 1,104 | $ | 3,956 | ||||
Additions to allowance | - | - | ||||||
Amounts written off | - | - | ||||||
Change in estimates to preexisting allowance | (546 | ) | (2,852 | ) | ||||
|
|
|
| |||||
Allowance - end of period | $ | 558 | $ | 1,104 | ||||
|
|
|
| |||||
Property and Equipment, net - Property and equipment are recorded at cost, less accumulated depreciation. Depreciation is generally computed using the straight-line basis over the estimated useful lives of the assets as follows:
Buildings: 20 – 40 years
Building and leasehold improvements: 10 years or remaining life of building/lease term if less than 10 years
Information systems : over the term of the license
Furniture, fixtures and computer and equipment: 5 – 7 years
Model and sales office improvements: lesser of 3 years or the life of the community
90
Maintenance and repair costs are expensed as incurred.
Tax Indemnification Receivable - The Predecessor Parent Company has indemnified TMM Holdings for specific uncertain tax positions existing as of the date of the transaction. An indemnification receivable was recorded at $129.7 million at the time of the Acquisition. The indemnification receivable also includes a periodic increase for accrued interest, penalties, and additional identified tax issues covered by the indemnity, offset by periodic decreases as uncertain tax matters and related tax obligations are resolved. The receivable due from the Predecessor Parent Company for the indemnification is valued at the same amount as the estimated income tax liability, which is included as an offset to income taxes payable in the Consolidated and Combined Balance Sheets. The balance of the tax indemnification receivable was $5.2 million and $107.6 million at December 31, 2013 and 2012, respectively.
Real Estate Inventory - Inventory consists of land, land under development, homes under construction, completed homes, and model homes. Inventory is carried at cost. In addition to direct carrying costs, the Company also capitalizes interest, real estate taxes, and related development costs that benefit the entire community, such as field construction supervision and related direct overhead. Home construction costs are accumulated and charged to cost of sales at home closing using the specific identification method. Land acquisition, development, interest, taxes, overhead, and condominium construction costs are allocated to homes and units using methods that approximate the relative sales value method. These costs are capitalized to inventory from the point development begins to the point construction is completed. Changes in estimated costs to be incurred in a community are generally allocated to the remaining homes on a prospective basis. For those communities that have been temporarily closed or where development has been discontinued, the Company does not allocate interest or other costs to the community's inventory until activity resumes.
In accordance with the provisions of ASC Topic 360, Property, Plant, and Equipment , ("ASC 360") the Company reviews its real estate inventory for indicators of impairment by community during each reporting period. In conducting the review for indicators of impairment at the community level, the Company evaluates, among other things, the margins on homes that have been delivered, margins on homes under sales contracts in backlog, projected margins with regard to future home sales over the life of the community, projected margins with regard to future land sales and the estimated fair value of the land itself. Closeout communities (those communities with fewer than 15 remaining homes) and communities in which the actual or projected home margin is less than 10 percent are excluded from the analysis. If indicators of impairment are present for a community, the Company performs an additional analysis to determine if the carrying value of the assets in that community exceeds the undiscounted cash flows estimated to be generated by those assets. If the carrying value of the assets does exceed their estimated undiscounted cash flows, the assets are deemed to be impaired and are recorded at fair value as of the assessment date.
The Company estimates the fair value of a community using a discounted cash flow model. The key assumptions related to the projected cash flows for each community are significantly impacted by local market and economic conditions; these include, but are not limited to product type by community, home-site sizes, sales pace, sales prices, sales incentives, construction costs, sales and marketing expenses, competitive conditions, labor costs, and costs of materials, all of which are inherently uncertain. Critical assumptions in the Company's cash flow model include: (i) the projected absorption pace for home sales in the community, based on general economic conditions that will have an impact on the market in which the community is located and competition within the market; (ii) the expected sales prices and sales incentives to be offered; (iii) costs to build and deliver homes in the community, including, but not limited to, land and land development costs, home construction costs, interest costs and overhead costs; and (iv) alternative uses for the property, such as the possibility of a sale of the entire community to another builder or the sale of individual home sites. Assumptions are based on current development budgets and there are no assumptions in increases in either pace or price. Discount rates are determined using a base rate, which may be increased depending on the total remaining lots in a community, the development status of the land, the market in which it is located and if the product is higher-priced with potentially lower demand. Historically, our discount rates have generally been in the range of 12.0% to 18.0%.
Since the estimates and assumptions included in the Company's cash flow models are based upon historical results and projected trends, they do not anticipate unexpected changes in market conditions or strategies that may lead the Company to incur additional impairment charges in the future. Using available information, the Company calculates its best estimate of projected cash flows for each community. The determination of fair value also requires discounting the estimated cash flows at a rate the Company believes a market participant would determine to be commensurate with the inherent risks associated with the assets and related estimated cash flow streams.
91
Inventory impairment charges are recognized against all inventory costs of a community, such as land, land improvements, cost of home construction and capitalized interest. For the years ended December 31, 2013, 2012 and 2011, no impairment charges were recorded. In certain cases, the Company may elect to stop development and/or marketing of an existing community if it believes the economic performance of the community would be maximized by deferring development for a period of time to allow for temporary market conditions to improve. The decision may be based on financial and/or operational metrics as determined by the Company. If the Company decides to stop developing a project, it will impair such project if necessary to its fair value as discussed above and then cease future development and/or marketing activity until such a time when the Company believes that market conditions have improved and economic performance can be maximized.
The Company's assessment of the carrying value of it's assets typically includes subjective estimates of future performance, including the timing of when development will recommence, the type of product to be offered, and the margin to be realized. In the future, some of these inactive communities may be re-opened while others may be sold. As of December 31, 2013, there were 19 inactive projects with a carrying value of $28.0 million of which $4.6 million and $23.4 million is in the East and West segments, respectively. During the year ended December 31, 2013, the Company placed one community into inactive status and moved two communities into active status.
The life cycle of a community generally ranges from three to five years, commencing with the acquisition of unentitled or entitled land, continuing through the land development phase, and concluding with the sale, construction, and delivery of homes. Actual community lives will vary based on the size of the community, the sales absorption rate, and whether the Company purchased the property as raw land or finished lots. As of December 31, 2013 and 2012 the Company was actively selling in 197 and 120 communities, respectively.
As discussed in this note under Investments in Consolidated and Unconsolidated Entities , in the ordinary course of business, the Company acquires various specific performance lots through existing lot option agreements. Real estate not owned under these contracts is consolidated into real estate inventory with a corresponding liability in loans payable and other borrowings in the Consolidated and Combined Balance Sheets.
Inventory consists of the following (in thousands):
| As of December 31, | ||||||||
| 2013 | 2012 (1) | |||||||
Operating communities | $ | 1,862,649 | $ | 1,267,900 | ||||
Real estate held for development or sale | 381,095 | 336,287 | ||||||
|
|
|
| |||||
Total owned inventory | 2,243,744 | 1,604,187 | ||||||
Real estate not owned | 18,595 | - | ||||||
|
|
|
| |||||
Total real estate inventory | $ | 2,262,339 | $ | 1,604,187 | ||||
|
|
|
| |||||
| (1) | Changes in the amounts recorded at December 31, 2012 relate to adjustments made to the purchase price allocation of the Darling Acquisition. Inventory adjustments reflect the effect of adjustments to the joint venture interests and the underlying real estate assets after consolidation. |
92
Capitalized Interest - The Company capitalizes certain interest costs to real estate inventory during the development and construction periods. Capitalized interest is charged to cost of home closings when the related inventory is delivered. Interest capitalized, incurred, and expensed is as follows (in thousands):
| Predecessor | ||||||||||||||||||
| Year Ended December 31, | July 13, 2011 Through December 31, 2011 | January 1 Through July 12, 2011 | ||||||||||||||||
| 2013 | 2012 | |||||||||||||||||
Interest capitalized - beginning of period | $ | 59,643 | $ | 27,491 | $ | - | $ | 68,202 | ||||||||||
Interest incurred | 79,241 | 62,468 | 37,605 | 23,091 | ||||||||||||||
Interest expense not qualified for capitalization and included as interest expense | (812 | ) | - | - | - | |||||||||||||
Interest amortized to cost of home closings | (50,971 | ) | (30,316 | ) | (10,114 | ) | (19,422 | ) | ||||||||||
Foreign currency adjustment | - | - | - | 51 | ||||||||||||||
|
|
|
|
|
|
|
| |||||||||||
Interest capitalized - end of period | $ | 87,101 | $ | 59,643 | $ | 27,491 | $ | 71,922 | ||||||||||
|
|
|
|
|
|
|
| |||||||||||
Land Deposits - The Company pays deposits related to land options and land purchase contracts, which are capitalized when paid and classified as land deposits until the associated property is purchased. To the extent the deposits are non-refundable, they are charged to expense if the land acquisition process is terminated or no longer determined probable. The Company reviews the likelihood of the acquisition of contracted lots in conjunction with its periodic real estate inventory impairment analysis. Non-refundable deposits are recorded as a component of real estate inventory in the accompanying Consolidated and Combined Balance Sheets at the time the deposit is applied to the acquisition price of the land based on the terms of the underlying agreements. Refundable deposits are recorded in prepaid expenses and other assets, net in the accompanying Consolidated and Combined Balance Sheets.
The Company is subject to the usual obligations associated with entering into contracts, including option contracts, for the purchase, development, and sale of real estate inventory in the routine conduct of its business. The Company has acquired a number of land purchase option contracts, generally through cash deposits or letters of credit, for the right to purchase land or lots at a future point in time with predetermined terms. The Company does not have title to the property and the creditors generally have no recourse against the Company, except in Canada where sellers have full recourse under statutory regulations. The Company's obligations with respect to the option contracts are generally limited to the forfeiture of the related non-refundable cash deposits and/or letters of credit. As of December 31, 2013 and 2012, the Company had the right to purchase approximately 6,570 and 5,013 lots under land option and land purchase contracts, respectively, which represents an aggregate purchase price of $500.9 million and $268.0 million as of December 31, 2013 and 2012, respectively. As of December 31, 2013, the Company had $43.7 million in land deposits and had posted $14.9 million in letters of credit related to land options and land purchase contracts. As of December 31, 2012, the Company had $28.7 million in land deposits and had posted $0.2 million in letters of credit related to land options and land purchase contracts.
For the years ended December 31, 2013, 2012 and 2011, no impairment of option deposits and capitalized pre-acquisition costs for abandoned projects were recorded. The Company continues to evaluate the terms of open land option and purchase contracts and may impair option deposits and capitalized pre-acquisition costs in the future, particularly in those instances where land sellers or third-party financial entities are unwilling to renegotiate significant contract terms.
Investments in Consolidated and Unconsolidated Entities - In the ordinary course of business, the Company enters into land and lot option purchase contracts in order to procure land or lots for the construction of homes. Lot option contracts enable the Company to control significant lot positions with a minimal capital investment and substantially reduce the risks associated with land ownership and development. The Company is also involved in several joint ventures with independent third parties for homebuilding activities. The Company uses the equity method of accounting for entities it does not control or where it does not own a majority of the economic interest, but has the ability to exercise significant influence over the operating and financial policies of the investee. For those unconsolidated entities in which the Company functions as the managing member, the Company has evaluated the rights held by its joint venture partners and determined that they have substantive participating rights that preclude the presumption of control. For joint
93
ventures accounted for using the equity method, the Company's share of net earnings or losses is included in equity in income of unconsolidated entities when earned and distributions are credited against its investment in the joint venture when received. See Note 3 - Investments in Unconsolidated Entities for financial statement information related to unconsolidated entities.
In accordance with ASC Topic 810, Consolidation , the Company has concluded that when it enters into an option or purchase agreement to acquire land or lots and pay a non-refundable deposit, a variable interest entity ("VIE") may be created because the Company is deemed to have provided subordinated financial support that will absorb some or all of an entity's expected losses if they occur. For each VIE, the Company assesses whether it is the primary beneficiary by first determining if the Company has the ability to control the activities of the VIE that most significantly affect its economic performance. Such activities include, but are not limited to, the ability to determine the budget and scope of land development work, if any; the ability to control financing decisions for the VIE; the ability to acquire additional land into the VIE or dispose of land in the VIE not under contract with the Company; and the ability to change or amend the existing option contract with the VIE. If the Company is not able to control such activities, it is not considered the primary beneficiary of the VIE. If the Company does have the ability to control such activities, the Company will continue its analysis by determining if it is expected to absorb a potentially significant amount of the VIE's losses or, if no party absorbs the majority of such losses, if the Company will potentially benefit from a significant amount of the VIE's expected gains. If the Company is the primary beneficiary of the VIE, it will consolidate the VIE in its Consolidated and Combined Financial Statements and reflect such assets and liabilities as real estate not owned under option agreements within the Company's inventory balance in the accompanying Consolidated and Combined Balance Sheets (see Real Estate Inventory above). The Company's exposure to loss related to its option contracts with third parties and unconsolidated entities consists of non-refundable option deposits totaling $43.7 million and $28.7 million, as of December 31, 2013 and 2012, respectively. Additionally, the Company posted $14.9 million and $0.2 million of letters of credit in lieu of cash deposits under certain option contracts as of December 31, 2013 and 2012, respectively. Creditors of these VIEs, if any, generally have no recourse against the Company (see Note 9 - Debt - Letters of Credit, Surety Bonds and Guarantees ).
The evaluation of the Company's investment in unconsolidated entities includes certain critical assumptions made by management: (1) projected future distributions from the unconsolidated entities; (2) discount rates applied to the future distributions; and (3) various other factors. The Company's assumptions on the projected future distributions from the unconsolidated entities are dependent on market conditions. Specifically, distributions are dependent on cash to be generated from the sale of inventory by the unconsolidated entities. Such inventory is also reviewed for potential impairment by the unconsolidated entities. The unconsolidated entities generally use a discount rate of approximately 12-18% in their reviews for impairment, subject to the perceived risks associated with the community's cash flow streams relative to its inventory. If a valuation adjustment is recorded by an unconsolidated entity related to its assets, the Company's proportionate share is reflected in the equity in income from unconsolidated entities with a corresponding decrease to its investments in unconsolidated entities.
The Company evaluates its investments in unconsolidated entities for indicators of impairment during each reporting period. A series of operating losses of an investee or other factors may indicate that a decrease in value of the Company's investment in the unconsolidated entity has occurred which is other-than-temporary. The amount of impairment recognized is the excess of the investment's carrying amount over its estimated fair value. Additionally, the Company considers various qualitative factors to determine if a decrease in the value of the investment is other-than-temporary. These factors include age of the venture, stage in its life cycle, intent and ability for the Company to recover its investment in the entity, financial condition and long-term prospects of the entity, short-term liquidity needs of the unconsolidated entity, trends in the general economic environment of the land, entitlement status of the land held by the unconsolidated entity, overall projected returns on investment, defaults under contracts with third parties (including bank debt), recoverability of the investment through future cash flows and relationships with the other partners. If the Company believes that the decline in the fair value of the investment is temporary, then no impairment is recorded. We did not record any impairment charges for the years ended December 31, 2013, 2012 or 2011.
Non-controlling Interests - Joint Ventures - The Company consolidates joint ventures when it is the primary beneficiary. Therefore, those entities' financial statements are consolidated in the Company's Consolidated and Combined Financial Statements and the other partners' equity is recorded as non-controlling interests – joint ventures.
94
Non-controlling Interests – Principal Equityholders - In the Reorganization Transactions (see Note 16 - Capital Structure - Reorganization Transactions ), immediately prior to the Company's IPO, the existing holders of TMM Holdings limited partnership interests (the Principal Equityholders, members of management and the Board of Directors), exchanged their limited partnership interests for limited partnership interests of a newly formed limited partnership, New TMM (the "New TMM Units"). For each New TMM Unit received in the exchange, the Principal Equityholders, members of management and the Board of Directors also received, directly or indirectly, a corresponding number of shares of the Company's Class B common stock, par value $0.00001 per share (the "Class B Common Stock"). All of the Company's Class B Common Stock is owned by the Principal Equityholders, members of management and the Board of Directors. The Company's Class B Common Stock has voting rights but no economic rights. One share of Class B Common Stock, together with one New TMM Unit is exchangeable into one share of the Company's Class A Common Stock. The Company sold Class A Common Stock to the investing public in its initial public offering. The proceeds received in the initial public offering were used by the Company to purchase New TMM Units, such that the Company owns an amount of New TMM Units equal to the amount of the Company's outstanding shares of Class A Common Stock. The Company's Class A Common Stock has voting rights and economic rights. Also, in the Reorganization Transactions, the Company became the sole owner of the general partner of New TMM. As the general partner of New TMM, the Company exercises exclusive and complete control over New TMM. Consequently, the Company consolidates New TMM and records a non-controlling interest in its Consolidated and Combined Balance Sheet for the economic interests in New TMM, directly or indirectly, held by the Principal Equityholders, members of management and the Board of Directors.
The Non-controlling interests – Principal Equityholders percentages at December 31, 2013 are as follows:
| Shares Outstanding | Percentage | |||||||
Class A Common Stock | 32,857,800 | 26.9 | % | |||||
Class B Common Stock | 89,451,164 | 73.1 | ||||||
|
|
|
| |||||
Total | 122,308,964 | 100.0 | % | |||||
Activity in the Non-controlling interests – Principal Equityholders and former controlling interests net income (loss) amounts is as follows (in thousands):
| Year Ended December 31, 2013 | ||||
Post-IPO Non-controlling Interests - Principal Equityholders | $ | 123,532 | ||
Pre-IPO Controlling Interest | (73,953 | ) | ||
|
| |||
Non-controlling Interests - Principal Equityholders | $ | 49,579 | ||
|
| |||
Pre-IPO activity is for the period prior to April 10, 2013 while post-IPO is activity subsequent to that date.
Goodwill - The excess of the purchase price of a business acquisition over the net fair value of assets acquired and liabilities assumed is capitalized as goodwill in accordance with ASC Topic 350, Intangibles - Goodwill and Other ("ASC 350"). ASC 350 requires that goodwill and intangible assets that do not have finite lives not be amortized, but instead be assessed for impairment at least annually or more frequently if certain impairment indicators are present. There was no goodwill recorded in connection with the Acquisition on July 13, 2011 (see Note 4 – Goodwill and Other Intangible Assets ). The Company recorded $23.4 million of goodwill related to the purchase price allocation for the Darling Acquisition. We perform our annual impairment test during the fourth quarter or whenever impairment indicators are present. No goodwill impairment charges were recorded for the years ended December 31, 2013 and 2012.
Income Taxes - We account for income taxes in accordance with ASC Topic 740, Income Taxes ("ASC 740") . Deferred tax assets and liabilities are recorded based on future tax consequences of both temporary differences between the amounts reported for financial reporting purposes and the amounts deductible for income tax purposes, and are measured using enacted tax rates expected to apply in the years in which the temporary differences are expected to be recovered or settled. The effect on deferred tax assets and liabilities of a change in tax rates is recognized in earnings in the period when the changes are enacted.
95
In accordance with the provisions of ASC 740, we periodically assess our deferred tax assets, including the benefit from net operating losses, to determine if a valuation allowance is required. A valuation allowance must be established when, based upon available evidence, it is more likely than not that all or a portion of the deferred tax assets will not be realized. Realization of the deferred tax assets is dependent upon, among other matters, taxable income in prior years available for carryback, estimates of future income, tax planning strategies, and reversal of existing temporary differences.
Insurance Costs and Self-Insurance Reserves - We have certain deductible limits under our workers' compensation, automobile, and general liability insurance policies, and we record expense and liabilities for the estimated costs of potential claims for construction defects. The excess liability limits are $50 million per occurrence in the annual aggregate and apply in excess of automobile liability, employer's liability under workers compensation and general liability policies. We also generally require our sub-contractors and design professionals to indemnify us for liabilities arising from their work, subject to certain limitations. We are the parent of Beneva Indemnity Company ("Beneva"), which provides insurance coverage for construction defects discovered during a period of time up to 10 years following the sale of a home, coverage for premise operations risk, and property coverage. We accrue for the expected costs associated with the deductibles and self-insured amounts under our various insurance policies based on historical claims, estimates for claims incurred but not reported, and potential for recovery of costs from insurance and other sources. The estimates are subject to significant variability due to factors, such as claim settlement patterns, litigation trends, and the extended period of time in which a construction defect claim might be made after the closing of a home.
Warranty Reserves:
U.S. Operations - The Company offers warranties on homes that generally provide for limited one-year warranties to cover various defects in workmanship or materials or to cover structural construction defects. The Company may also offer a longer structural warranty in certain markets or to comply with regulatory requirements. Warranty reserves are established as homes close in an amount estimated to be adequate to cover expected costs of materials and outside labor during warranty periods. The Company's warranty reserves are based on factors that include an actuarial study for structural warranty, historical and anticipated warranty claims, trends related to similar product types, number of home closings, and geographical areas. The structural warranty is carried by Beneva Indemnity Company, a wholly owned subsidiary of TMC. The Company also provides third-party warranty coverage on homes where required by Federal Housing Administration or Veterans Administration lenders.
Canadian Operations - The Company offers a limited warranty that generally provides for seven years of structural coverage; two years of coverage for water penetration, electrical, plumbing, heating, and exterior cladding defects; and one year of coverage for workmanship and materials. The Company is responsible for performing all of the work during the warranty period. As a result, warranty reserves are established as homes close in an amount estimated to be adequate to cover expected costs of materials and labor during warranty periods. The warranty reserves are determined using historical experience and trends related to similar product types, and number of home closings.
The Company regularly reviews the reasonableness and adequacy of warranty reserves and makes adjustments to the balance of the preexisting reserves to reflect changes in trends and historical data as information becomes available. Warranty reserves are included in accrued expenses and other liabilities in the accompanying Consolidated and Combined Balance Sheets. A summary of the changes in the Company's warranty reserves is as follows (in thousands):
| Predecessor | ||||||||||||||||||
| Year Ended December 31, | July 13, 2011 Through December 31, 2011 | January 1 Through July 12, 2011 | ||||||||||||||||
| 2013 | 2012 | |||||||||||||||||
Reserve - beginning of period | $ | 39,760 | $ | 43,158 | $ | 45,929 | $ | 50,069 | ||||||||||
Purchase price allocation adjustments | - | - | (2,731 | ) | - | |||||||||||||
Additions to reserves | 16,408 | 3,096 | 2,950 | 9,634 | ||||||||||||||
Costs and claims incurred | (13,159 | ) | (10,858 | ) | (15,428 | ) | (16,267 | ) | ||||||||||
Changes in estimates to pre-existing reserves | (1,102 | ) | 4,036 | 13,036 | 2,346 | |||||||||||||
Foreign currency adjustment | (504 | ) | 328 | (598 | ) | 147 | ||||||||||||
|
|
|
|
|
|
|
| |||||||||||
Reserve - end of period | $ | 41,403 | $ | 39,760 | $ | 43,158 | $ | 45,929 | ||||||||||
|
|
|
|
|
|
|
| |||||||||||
96
Revenue Recognition:
Home Sales - Revenues from home sales are recorded at closing, using the completed contract method of accounting at the time each home is delivered, title and possession are transferred to the buyer, there is no significant continuing involvement with the home, and the buyer has demonstrated sufficient initial and continuing investment in the property.
Condominium Sales - Revenues from the sale of condominium units is recognized when construction is beyond the preliminary stage, the buyer is committed to the extent of being unable to require a refund under applicable laws except for non-delivery of the unit, sufficient units in the project have been sold to ensure that the property will not be converted to a rental property, the sales proceeds are collectible, and the aggregate sales proceeds and the total cost of the project can be reasonably estimated. For the Company's Canadian high-rise condominiums, these conditions are met when a certificate of occupancy has been received, all significant conditions of registration have been performed and the purchaser has the right to occupy the unit.
Land Sales - Revenues from land sales are recognized when title is transferred to the buyer, there is no significant continuing involvement, and the buyer has demonstrated sufficient initial and continuing investment in the property sold. If the buyer has not made an adequate initial or continuing investment in the property, the profit on such sales is deferred until these conditions are met.
Mortgage Operations - Revenues from loan origination are recognized at the time the related real estate transactions are completed, usually upon the close of escrow. All of the loans Taylor Morrison Home Funding, LLC ("TMHF") originates are sold within a short period of time, generally 20 days, on a nonrecourse basis as further described in Note 9 - Debt - Mortgage Company Loan Facilities . After the loans are sold, the Company retains potential liability for possible claims by purchasers of the loan that it breached certain limited industry-standard representations and warranties in the loan sale agreement. Gains or losses from the sale of mortgages are recognized based on the difference between the selling price and carrying value of the related loans upon sale.
Deposits - Forfeited buyer deposits related to home, condominium, and land sales are recognized in other expense (income), net in the accompanying Consolidated and Combined Statements of Operations in the period in which the Company determines that the buyer will not complete the purchase of the property and the deposit is determined to be non-refundable to the buyer.
Sales Discounts and Incentives - The Company grants home buyers sales discounts and incentives from time to time, including cash discounts, discounts on options included in the home, option upgrades and seller-paid financing or closing costs. Discounts are generally accounted for as a reduction in the sales price of the home.
Advertising Costs - We expense advertising costs as incurred. Advertising costs were $24.5 million and $15.4 million for the years ended December 31, 2013 and 2012, $6.1 million for the period from July 13, 2011 through December 31, 2011, and $7.0 million for the period from January 1, 2011 through July 12, 2011.
97
Earnings Per Common Share - Basic earnings per common share is computed by dividing net income available to TMHC by the weighted average number of Class A Common Stock outstanding during the period. Diluted earnings per share gives effect to the potential dilution that could occur if Class B Common Stock and New TMM Units were exchanged for Class A Common Stock and if equity awards to issue common stock that are dilutive were exercised (in thousands):
| Year Ended December 31, 2013 | ||||
Numerator: | ||||
Net income available to TMHC - basic | $ | 45,420 | ||
Pre-IPO Principal Equityholders' non-controlling interest | 123,532 | |||
|
| |||
Net income available to TMHC - diluted | $ | 168,952 | ||
Denominator: | ||||
Weighted average shares - basic | 32,840 | |||
Pre-IPO Principal Equityholders' non-controlling interest | 89,469 | |||
Restricted stock units | 9 | |||
Stock options | 1 | |||
|
| |||
Weighted average shares -diluted | 122,319 | |||
Earnings per common share: | ||||
Basic | $ | 1.38 | ||
Diluted | $ | 1.38 | ||
The Company excluded 1,439,645 stock options from the calculation of earnings per common share for the year ended December 31, 2013 as their inclusion is anti-dilutive.
The shares of Class B Common Stock do not have economic rights (including no rights to dividends or distribution on liquidation), but only have voting rights and therefore are not participating securities. Accordingly, basic net income per share is not presented for these shares.
Recently Issued Accounting Pronouncements - In July 2013, the FASB issued Accounting Standards Update ("ASU 2013–11") Income Taxes , which provides guidance on the financial statement presentation of an unrecognized tax benefit when a net operating loss carryforward, similar tax loss, or tax credit carryforward exists. ASU 2013-11 is effective for the Company beginning January 1, 2014. The Company does not anticipate the adoption of ASU 2013-11 will have a material effect on its Consolidated and Combined Financial Statements or disclosures.
In April 2013, the FASB issued ASU 2013-04, Liabilities ("ASU 2013-04"), which provides guidance for the recognition, measurement, and disclosure of obligations resulting from joint and several liability arrangements for which the total amount of the obligation is fixed at the reporting date. ASU 2013-04 is effective for the Company beginning January 1, 2014. The Company does not anticipate the adoption of ASU 2013-04 will have a material effect on its Consolidated and Combined Financial Statements or disclosures.
3. INVESTMENTS IN UNCONSOLIDATED ENTITIES
The Company participates in a number of joint ventures with unrelated third parties. These entities are generally involved in real estate development, mortgage lending or title services. The Company uses the equity method of accounting for its investments in unconsolidated entities, which are not VIEs and which the Company does not control, but normally has ownership interests up to 65.0% in Canada.
98
Summarized condensed, unaudited financial information of unconsolidated entities that are accounted for by the equity method is as follows (in thousands):
| As of December 31, | ||||||||
| 2013 | 2012 | |||||||
Assets: | ||||||||
Real estate inventory | $ | 434,411 | $ | 364,105 | ||||
Other assets | 138,940 | 109,010 | ||||||
|
|
|
| |||||
Total assets | $ | 573,351 | $ | 473,115 | ||||
|
|
|
| |||||
Liabilities and owners' equity: | ||||||||
Debt | $ | 139,355 | $ | 162,197 | ||||
Other liabilities | 174,371 | 193,897 | ||||||
|
|
|
| |||||
Total liabilities | $ | 313,726 | $ | 356,094 | ||||
|
|
|
| |||||
Owners' equity: | ||||||||
TMM Holdings | 139,550 | 57,837 | ||||||
Others | 120,075 | 59,184 | ||||||
|
|
|
| |||||
Total owners' equity | 259,625 | 117,021 | ||||||
|
|
|
| |||||
Total liabilities and owners' equity | $ | 573,351 | $ | 473,115 | ||||
|
|
|
| |||||
| Predecessor | ||||||||||||||||||
| Year Ended December 31, | July 13 Through December 31, | January 1 Through July 12, | ||||||||||||||||
| 2013 | 2012 | 2011 | 2011 | |||||||||||||||
Revenues | $ | 343,145 | $ | 238,763 | $ | 77,426 | $ | 22,374 | ||||||||||
Costs and expenses | (248,529 | ) | (180,596 | ) | (61,860 | ) | (17,027 | ) | ||||||||||
|
|
|
|
|
|
|
| |||||||||||
Income of unconsolidated entities | $ | 94,616 | $ | 58,167 | $ | 15,566 | $ | 5,347 | ||||||||||
|
|
|
|
|
|
|
| |||||||||||
Company's share in income of unconsolidated entities | $ | 37,563 | $ | 22,964 | $ | 5,247 | $ | 2,803 | ||||||||||
|
|
|
|
|
|
|
| |||||||||||
The Company has investments in, and advances to, a number of joint ventures with unrelated parties to develop land and to develop condominium projects, including for-sale residential units and commercial space. Some of these joint ventures develop land for the sole use of the venture participants, including the Company, and others develop land for sale to the joint venture participants and to unrelated builders. The Company's share of the joint venture profit relating to lots the Company purchases from the joint ventures is deferred until homes are delivered by the Company and title passes to a homebuyer.
The investment in unconsolidated entities on the accompanying Consolidated and Combined Balance Sheets as of December 31, 2013 and 2012 includes the fair value adjustments as a result of purchase accounting, while the amounts in this note for the corresponding periods represent the original equity amounts.
Fair value adjustments for the Company's investment in unconsolidated entities are recorded at the consolidated level and are amortized against the Company's share of earnings of the underlying joint ventures as the underlying joint venture assets are sold.
99
4. GOODWILL AND OTHER INTANGIBLE ASSETS
Goodwill
A summary of the changes in goodwill during 2012 and 2013 is as follows (in thousands):
| Carrying Value | ||||
Balance at January 1, 2012 | $ | - | ||
Additions | 15,526 | |||
|
| |||
Balance at December 31, 2012 | $ | 15,526 | ||
Adjustments (1) | 7,849 | |||
|
| |||
Adjusted balance at December 31, 2012 | $ | 23,375 | ||
Additions | - | |||
Adjustments | - | |||
|
| |||
Balance at December 31, 2013 | $ | 23,375 | ||
|
| |||
| (1) | Represents adjustments made in 2013 to the purchase price allocation for the December 31, 2012 acquisition of Darling (see Note 2 - Summary of Significant Accounting Policies - Acquisition Accounting - Darling Acquisition ). |
Intangible assets
A summary of the changes in the opening balance as of December 31, 2012 is as follows (in thousands):
| Carrying Value | ||||
Balance at December 31, 2012 | $ | 17,954 | ||
Adjustments (1) | 803 | |||
|
| |||
Adjusted balance at December 31, 2012 | $ | 18,757 | ||
|
| |||
| (1) | Represents adjustments made in 2013 to the purchase price allocation for the December 31, 2012 acquisition of Darling (see Note 2 - Summary of Significant Accounting Policies - Acquisition Accounting - Darling Acquisition ). |
Intangible assets consist of the following (in thousands):
| As of December 31, 2013 | As of December 31, 2012 | |||||||||||||||||||||||||||||||||||
| Gross Carrying Amount | Accumulated Amortization | Foreign Currency Translation | Net | Weighted Average Remaining Useful Life (1) | Gross Carrying Amount | Accumulated Amortization | Net | Weighted Average Remaining Useful Life (2) | ||||||||||||||||||||||||||||
Tradenames | $ | 11,428 | $ | (2,630 | ) | $ | (404 | ) | $ | 8,394 | 7.3 | $ | 11,449 | $ | (1,516 | ) | $ | 9,933 | 8.7 | |||||||||||||||||
Lot option contracts and land supplier relationships | 6,000 | (3,040 | ) | - | 2,960 | 3.0 | 6,000 | - | 6,000 | 2.0 | ||||||||||||||||||||||||||
FMV Leases | 224 | (32 | ) | - | 192 | 6.0 | 224 | - | 224 | 5.0 | ||||||||||||||||||||||||||
Non-compete covenants | 2,600 | (433 | ) | - | 2,167 | 5.0 | 2,600 | - | 2,600 | 6.0 | ||||||||||||||||||||||||||
|
|
|
|
|
|
|
|
|
|
|
|
|
| |||||||||||||||||||||||
Total | $ | 20,252 | $ | (6,135 | ) | $ | (404 | ) | $ | 13,713 | $ | 20,273 | $ | (1,516 | ) | $ | 18,757 | (3) | ||||||||||||||||||
|
|
|
|
|
|
|
|
|
|
|
|
|
| |||||||||||||||||||||||
| (1) | Remaining useful life is weighted average, calculated based on the net book value and the remaining amortization period of each respective intangible asset. |
| (2) | Change from previously reported amount is due to adjustments made in 2013 to the purchase price allocation for the December 31, 2012 Darling Acquisition. See reconciliation in the table above. |
100
Amortization expense recorded during the years ended December 31, 2013 and 2012 was $1.6 million and $1.0 million, respectively, and for the period from July 13, 2011 through December 31, 2011, was $0.5 million. Additionally, during the year ended December 31, 2013, $3.0 million of lot option contracts were reclassified to real estate inventory as the lot options were exercised.
As of December 31, 2013, future amortization expense for intangible assets is estimated to be (in thousands):
2014 | $ | 3,403 | ||
2015 | 2,130 | |||
2016 | 1,990 | |||
2017 | 1,922 | |||
2018 | 1,717 | |||
Thereafter | 2,551 | |||
|
| |||
Total | $ | 13,713 | ||
|
|
5. PREPAID EXPENSES AND OTHER ASSETS
Prepaid expenses and other assets consist of the following (in thousands):
| As of December 31, | ||||||||
| 2013 | 2012 | |||||||
Prepaid expenses | $ | 73,683 | $ | 65,022 | ||||
Other assets | 25,187 | 37,930 | ||||||
|
|
|
| |||||
Total prepaid expenses and other assets | $ | 98,870 | $ | 102,952 | ||||
|
|
|
| |||||
Our prepaid expenses consist primarily of prepaid debt issue costs, sales commissions, sales presentation centers and model home costs, such as design fees and furniture. The prepaid sales commissions are recorded on pre-closing sales activities, which are recognized on the ultimate closing of the units to which they relate. The model home and sales presentation centers costs are paid in advance and amortized over the life of the project on a per-unit basis, or a maximum of three years. Other assets consist primarily of various operating and escrow deposits, golf club membership inventory, pre-acquisition costs and other deferred costs.
6. PROPERTY AND EQUIPMENT
Property and equipment are stated at cost, less accumulated depreciation. Gross property and equipment and accumulated depreciation, excluding software licenses, at December 31, 2013 and December 31, 2012, was as follows:
| As of December 31, | ||||||||
| 2013 | 2012 | |||||||
Property and equipment, gross | $ | 14,588 | $ | 11,225 | ||||
Accumulated Depreciation | (7,073 | ) | (4,802 | ) | ||||
|
|
|
| |||||
Property and equipment, net | $ | 7,515 | $ | 6,423 | ||||
|
|
|
| |||||
Depreciation expense was $2.3 million for the year ending December 31, 2013, $3.1 million for the year ended December 31, 2012, $1.7 million for the period from July 13, 2011 to December 31, 2011 and $1.6 million for the period from January 1, 2011 through July 12, 2011. Depreciation expense is recorded in general and administrative expenses in the accompanying Consolidated and Combined Statements of Operations.
101
7. ACCRUED EXPENSES AND OTHER LIABILITIES
Accrued expenses and other liabilities consist of the following (in thousands):
| As of December 31, | ||||||||
| 2013 | 2012 | |||||||
Real estate development costs to complete | $ | 28,491 | $ | 31,904 | ||||
Compensation and employee benefits | 49,362 | 47,554 | ||||||
Insurance, litigation reserves, and other professional fees | 6,935 | 9,104 | ||||||
Self-insurance and warranty reserves | 41,403 | 39,760 | ||||||
Interest payable | 17,024 | 12,360 | ||||||
Merger and restructuring reserves | 1,326 | (1) | 2,212 | |||||
Property and sales taxes payable | 22,731 | 13,097 | ||||||
Other accruals | 47,228 | 57,423 | ||||||
|
|
|
| |||||
Total accrued expenses and other liabilities | $ | 214,500 | $ | 213,414 | ||||
|
|
|
| |||||
| (1) | As a result of the July 2007 combination of the parent companies of Taylor Woodrow Holdings (USA), Inc., and Morrison Homes, Inc. (Taylor Woodrow plc and George Wimpey plc, respectively), the Company incurred total merger and restructuring charges of $34.9 million. The remaining liability for restructuring costs of $1.3 million and $2.2 million included in accrued expenses and other liabilities at December 31, 2013 and 2012, respectively, relate to lease termination costs that will be paid through March of 2016. |
8. LOANS PAYABLE AND OTHER BORROWINGS
Loans payable and other borrowings as of December 31, 2013 and 2012 consist of amounts due to various land sellers and $27.6 million of debt payable to the former owners of Darling. See Note 2 - Summary of Significant Accounting Policies - Acquisition Accounting - Darling Acquisition for more information related to the Company's December 31, 2012 acquisition of Darling. Loans payable bear interest at rates that ranged from 0% to 8% at December 31, 2013 and 2012, and generally are secured by the land that was acquired with the loans. The Company imputes interest for loans with no stated interest rates.
Principal maturities of loans payable and other borrowings for the year ending December 31, 2013 are as follows (in thousands):
2014 | $ | 146,445 | ||
2015 | 48,595 | |||
2016 | 34,914 | |||
2017 | 16,986 | |||
2018 | 41,513 | |||
Thereafter | 12,240 | |||
|
| |||
Total loans payable and other borrowings | $ | 300,693 | ||
|
|
9. DEBT
2020 Senior Notes
On April 13, 2012, TMC and Monarch (together, the "Bond Co-Issuers") issued $550.0 million of 7.75% Senior Notes due 2020 (the "Initial 2020 Senior Notes") at an initial offering price of 100.0% of the principal amount (the "Offering"). The net proceeds from the sale of the Initial 2020 Senior Notes were $537.4 million, net of debt issue costs of $12.6 million, and were used, in part, to repay $350.0 million of the Sponsor Loan (as discussed below). The remaining proceeds of approximately $187.4 million from the Offering were used by the Bond Co-Issuers for general corporate purposes. An additional $3.0 million of debt issue costs were settled outside the bond proceeds.
102
On August 21, 2012, the Bond Co-Issuers issued an additional $125.0 million of 7.75% Senior Notes due 2020 (the "Additional 2020 Senior Notes" together with the Initial 2020 Senior Notes the "2020 Senior Notes") at an initial offering price of 105.5% of the principal amount, resulting in the Company recording an original issue premium of $6.9 million, which amortizes over the life of the Additional 2020 Senior Notes. The Bond Co-Issuers received $132.5 million including prepaid interest, net of debt issue costs of $3.1 million. The net proceeds of the Additional 2020 Senior Notes were used for general corporate purposes. The Additional 2020 Senior Notes were issued pursuant to the existing indenture for the 2020 Senior Notes.
On April 12, 2013, TMHC used $204.3 million of the net proceeds of the IPO to acquire new TMM Units from New TMM (at a price equal to the price paid by the underwriters for shares of Class A Common Stock in the IPO). New TMM contributed such net proceeds to TMM Holdings, which then contributed such net proceeds to the Bond Co-Issuers to redeem $189.6 million aggregate principal amount of 2020 Senior Notes (at a purchase price equal to 103.875% of their principal amount, plus accrued and unpaid interest of $7.3 million through the date of redemption). The Initial 2020 Senior Notes and the Additional 2020 Senior Notes were repurchased on a pro rata basis based on aggregate principal amount outstanding at the time. The Company wrote off $4.6 million of unamortized debt issuance costs and $1.8 million of original issue premium and incurred a call premium of $7.3 million related to the redemption. These costs are included in loss on extinguishment of debt in the accompanying Consolidated and Combined Statements of Operations for the year ended December 31, 2013.
There were approximately $10.6 million and $16.9 million in unamortized debt issue costs related to the 2020 Senior Notes at December 31, 2013 and 2012, respectively, which are included in prepaid expenses and other assets, net on the accompanying Consolidated and Combined Balance Sheets. During the year ended December 31, 2013 and 2012, the Company amortized $1.9 million and $1.8 million of such debt issue costs, respectively. There is $4.1 million of unamortized original issue premium included in the Additional 2020 Senior Notes.
The 2020 Senior Notes will mature on April 15, 2020. Interest on the 2020 Senior Notes accrues at 7.75% per annum, payable semiannually in arrears on April 15 and October 15 of each year. Obligations to pay principal and interest on the 2020 Senior Notes are guaranteed by TMM Holdings and the U.S. homebuilding subsidiaries (collectively, the "Guarantors"), each of which is directly or indirectly 100.0% owned by TMM Holdings. Such guarantees are full and unconditional, and joint and several. The Company does not provide separate financial statements of the Guarantors or condensed consolidating financial information because the 2020 Senior Notes are not registered and are not subject to registration rights. The 2020 Senior Notes and the guarantees are senior unsecured obligations of the Bond Co-Issuers and the Guarantors. The indenture for the 2020 Senior Notes contains covenants that limit (i) the making of investments, (ii) the payment of dividends and the redemption of equity and junior debt, (iii) additional indebtedness, (iv) asset dispositions, (v) mergers and similar corporate transactions, (vi) the incurrence of liens, (vii) payments and asset transfers among the issuers and restricted subsidiaries and (viii) transactions with affiliates, among other items. The indenture governing the 2020 Senior Notes contains customary events of default. The most restrictive covenant of the indenture requires a fixed charge coverage ratio of 2.00 to 1.00. At December 31, 2013, the Company's fixed charge coverage ratio was 4.80 to 1.00.
The Bond Co-Issuers are entitled to redeem up to 40% of the aggregate principal amount of the 2020 Senior Notes at a redemption price of 107.750% of the aggregate principal amount plus accrued and unpaid interest on or after April 15, 2013 and prior to April 15, 2015. Following the redemption of $189.6 million aggregate principal amount of 2020 Senior Notes on April 12, 2013, the Bond Co-Issuers are entitled to redeem an additional $80.4 million of 2020 Senior Notes pursuant to the redemption provision.
Upon a "Change of Control" (as defined in the indenture governing the 2020 Senior Notes), the Bond Co-Issuers would be required to make an offer to repurchase all outstanding 2020 Senior Notes at a purchase price equal to 101% of the aggregate principal amount, plus accrued and unpaid interest. The Bond Co-Issuers, under certain conditions, are required to offer to use unapplied proceeds from certain asset sales to redeem the 2020 Senior Notes at par.
2021 Senior Notes
On April 16, 2013, the Bond Co-Issuers completed the issuance of $550.0 million aggregate principal amount of 5.25% Senior Notes due 2021 (the "2021 Senior Notes"). The net proceeds from the issuance of the 2021 Senior Notes were
103
$541.7 million net of $8.3 million of debt issuance costs paid to underwriters, were used by the Bond Co-Issuers to repay the outstanding balance under the Restated Revolving Credit Facility and for general corporate purposes, including the purchase of additional land inventory.
There were approximately $8.7 million in total unamortized debt issue costs at December 31, 2013 related to the 2021 Senior Notes, which are included in prepaid expenses and other assets, net on the accompanying Consolidated and Combined Balance Sheets. These costs are amortized to interest (income) expense in the accompanying Consolidated and Combined Statements of Operations. During the years ended December 31, 2013, the Company amortized $0.9 million of deferred debt issue costs.
The 2021 Senior Notes are guaranteed by the same Guarantors that guarantee the 2020 Senior Notes and have substantially the same terms and covenants as the 2020 Senior Notes, except that:
| • | the maturity date is April 15, 2021; |
| • | the interest rate is 5.25% per annum; |
| • | the Bond Co-Issuers may redeem Issuers may redeem some or all of the 2021 Senior Notes at any time prior to April 15, 2016, at a redemption price equal to 100.0% of the aggregate principal amount of the 2021 Senior Notes to be redeemed, plus a make-whole premium and accrued and unpaid interest, if any, to, but not including, the redemption date; |
| • | on or after April 15, 2016, the Bond Co-Issuers may also redeem some or all of the 2021 Senior Notes at the redemption prices specified in the indenture relating to the 2021 Senior Notes; and |
| • | at any time prior to April 15, 2016, the Bond Co-Issuers may also redeem up to 40% of the original aggregate principal amount of the 2021 Senior Notes with the net cash proceeds of certain equity offerings, at a redemption price equal to 105.250% of the aggregate principal amount of the 2021 Senior Notes to be redeemed, plus accrued and unpaid interest, if any, to, but not including, the redemption date. |
The 2021 Senior Notes do not have any registration rights.
Revolving Credit Facility
In 2011, TMC and Monarch (together, the "Original Revolver Co-Borrowers") entered into a $75.0 million Revolving Credit Facility secured by the underlying assets of the U.S. operations. In conjunction with the August 21, 2012 2020 Senior Notes offering, the Original Revolver Co-Borrowers exercised the incremental feature of the facility and expanded the line to $125.0 million in capacity. In December 2012, availability under the Revolving Credit Facility was further expanded to $225.0 million.
On April 12, 2013, the Original Revolver Co-Borrowers entered into an amendment agreement (the "Amendment") to the Revolving Credit Facility (the "Restated Revolving Credit Facility"). The Amendment, among other things: (i) converted the Revolving Credit Facility into an unsecured facility; (ii) reduced the Eurodollar application margin from 3.25% to 2.00% (subject to a step-up or step-down based on a capitalization ratio) and base rate applicable margin from 2.25% to 1.00% (subject to a step-up or step-down based on a capitalization ratio); (iii) increased the aggregate amount of commitments under the Revolving Credit Facility to $400.0 million, of which $200.0 million are available for letters of credit; (iv) permits an increase in the Restated Revolving Credit Facility up to an additional $200.0 million through an incremental facility feature; (v) permits borrowing of up to the full commitment amount under the Restated Revolving Credit Facility, unless the capitalization ratio as of the most recently ended fiscal quarter exceeds 0.55 to 1.00, in which case, borrowing availability under the Restated Revolving Credit Facility will be measured by reference to a borrowing base formula to be calculated quarterly (or more frequently as the Original Revolver Co-Borrowers may elect); and (vi) extended the maturity date of the facility to April 12, 2017.
On January 15, 2014, the Original Revolver Co-Borrowers further amended the Restated Revolving Credit Facility to remove Monarch as co-borrower so it can no longer borrow against the line. The overall borrowing capacity and terms otherwise remained consistent with the Restated Revolving Credit Facility. As a result, TMC is the only borrower under the Restated Revolving Credit Facility. See Note 19 - Subsequent Events of the Notes to the Consolidated and Combined Financial Statements in Item 8 of this Annual Report.
104
Borrowings under the Restated Revolving Credit Facility may be made in U.S. dollars and in Canadian dollars subject to a U.S. $80.0 million Canadian sub-limit and bear interest based upon either a LIBOR or CDOR interest rate option, as applicable, or a base rate or Canada prime rate option, as applicable, as selected by the borrowers plus, in each case, an applicable margin. The applicable margin for (a) any Eurodollar Rate Loan or CDOR Rate Loan is 2.00% per annum, payable on the last date of each applicable interest period or at the end of each three-month period if the applicable interest period is longer than three months and (b) any Base Rate Loan or Canadian Prime Rate Loan, 1.00% per annum, payable quarterly. There is a fee of 0.50% per annum on the commitment (whether drawn or undrawn), payable quarterly in arrears. The Original Revolver Co-Borrowers have the right to make "amend and extend" offers to lenders of a particular class.
The Restated Revolving Credit Facility contains certain "springing" financial covenants, requiring TMM Holdings and its subsidiaries to comply with a certain maximum capitalization ratio and a certain minimum consolidated tangible net worth test. The financial covenants would be in effect for any fiscal quarter during which any (a) loans under the Restated Revolving Credit Facility are outstanding during the last day of such fiscal quarter or on more than five separate days during such fiscal quarter or (b) undrawn letters of credit (except to the extent cash collateralized) issued under the Restated Revolving Credit Facility in an aggregate amount greater than $40.0 million or unreimbursed letters of credit issued under the Restated Revolving Credit Facility are outstanding on the last day of such fiscal quarter or for more than five consecutive days during such fiscal quarter. For purposes of determining compliance with the financial covenants for any fiscal quarter, the Restated Revolving Credit Facility provides that TMC may exercise an equity cure by issuing certain permitted securities for cash or otherwise recording cash contributions to its capital that will, upon the contribution of such cash to TMC, be included in the calculation of consolidated tangible net worth and consolidated total capitalization. The equity cure right is exercisable up to twice in any period of four consecutive fiscal quarters and up to five times overall. The maximum capitalization ratio is 0.60 to 1.00. The ratio as calculated by the Company at December 31, 2013 was 0.39 to 1.00. The minimum consolidated tangible net worth requirement was approximately $1.2 billion at December 31, 2013. At December 31, 2013, TMM Holding's tangible net worth, as defined in the Restated Revolving Credit Facility, was $1.5 billion.
The Restated Revolving Credit Facility contains certain restrictive covenants including limitations on incurrence of liens, dividends and other distributions, asset dispositions and investments in entities that are not guarantors, limitations on prepayment of subordinated indebtedness and limitations on fundamental changes. The Restated Revolving Credit Facility contains customary events of default, subject to applicable grace periods, including for nonpayment of principal, interest or other amounts, violation of covenants (including financial covenants, subject to the exercise of an equity cure), incorrectness of representations and warranties in any material respect, cross default and cross acceleration, bankruptcy, material monetary judgments, ERISA events with material adverse effect, actual or asserted invalidity of material guarantees and change of control. As of December 31, 2013 and 2012, the Company was in compliance with its financial covenants.
There were no outstanding borrowings under the Restated Revolving Credit Facility at December 31, 2013 and $50.0 million of outstanding borrowings as of December 31, 2012. As of December 31, 2013, there was $373.5 million of availability for borrowings under the Restated Revolving Credit Facility, including $173.5 million of additional availability for letters of credit (giving effect to $26.5 million of letters of credit outstanding as of such date).
In connection with the Original Revolving Credit Facility and the Restated Revolving Credit Facility, the Company capitalized $5.8 million and $2.1 million of debt issue costs in 2013 and 2012, respectively. These costs are amortized to interest (income) expense in the accompanying Consolidated and Combined Statements of Operations. The Company recorded amortization of $2.5 million and $0.7 million for the years ended December 31, 2013 and 2012, respectively.
Mortgage Company Loan Facilities
In December 2010, TMHF, the Company's wholly owned mortgage subsidiary, entered into an agreement with Flagstar Bank (the "Flagstar Agreement"), as agent and representative for itself and other buyers of the Company's mortgage receivables named therein. The Flagstar Agreement was amended in March 2013 to reduce the interest rate minimum floor from 3.95% to 3.5%. The purpose of the Flagstar Agreement is to finance the origination of up to $30 million of mortgage loans at any one time by TMHF, subject to certain sub-limits and with a temporary accordion feature subject to approval by Flagstar Bank, which allows for borrowings in excess of total availability. Borrowings under the facility are
105
accounted for as a secured borrowing under ASC Topic 860, Transfers and Servicing . The Flagstar agreement is terminable by either party with 30 days' notice and bears interest at a rate of LIBOR plus 2.5%, with a minimum floor of 3.5%. Borrowings under this facility are paid back with proceeds received when mortgages are sold to participating lenders in the Flagstar agreement, or to other buyers subject to certain sub-limits. The time period from borrowing to repayment is typically less than 20 business days. At December 31, 2013 and 2012, there were $38.1 million and $38.6 million, respectively, in outstanding borrowings under the Flagstar agreement.
In December of 2011, TMHF entered into an agreement with Comerica Bank (the "Comerica Agreement"), as agent and representative for itself and other buyers of the Company's held-for-sale mortgages named within. In June 2013, the Comerica Agreement was amended to increase the capacity from $30 million to $50 million. The line has the capacity to finance up to $50 million of mortgage loans at any one time by TMHF, subject to certain sub-limits. At December 31, 2013 and 2012, mortgage loans financed under the Comerica Agreement were $36.8 million and $41.8 million, respectively.
The mortgage borrowings outstanding as of December 31, 2013 and 2012, are collateralized by $95.7 million and $85.0 million, respectively, of mortgage loans held for sale, which comprise the balance of mortgage receivables and $2.0 million and $2.0 million, respectively of restricted short-term investments in certificate of deposits known as CDARS, which are included in restricted cash in the accompanying Consolidated and Combined Balance Sheets.
Letters of Credit, Surety Bonds and Guarantees
The Company, through its subsidiaries is committed, under various letters of credit and surety bonds, to perform certain development and construction activities and provide certain guarantees in the normal course of business. These guarantees have been made in connection with joint venture funding of the Company's operations in Canada. Outstanding letters of credit and surety bonds under these arrangements, including the Company's share of responsibility for arrangements with its joint ventures, totaled $212.2 million and $230.8 million as of December 31, 2013 and 2012, respectively. Although significant development and construction activities have been completed related to these site improvements, the letters of credit and surety bonds are reduced as development and construction work is completed, but not fully released until warranty periods have expired.
Monarch is party to a credit facility with The Toronto-Dominion Bank ("TD Facility"). The TD Facility provides facilities including letters of credit of up to CAD $100.0 million or its U.S. dollar equivalent to provide letter of credit financing in support of Monarch's projects. Under the terms of the TD Facility, the first CAD $80.0 million drawn under the facility is secured by liens on the interests of Monarch in certain Canadian real property. Amounts drawn above CAD $80.0 million are secured with cash. Monarch also guarantees the credit facilities that certain joint ventures are party to with the Toronto-Dominion Bank. There was a total of CAD $98.5 million and CAD $102.6 million letters of credit outstanding under the TD Facilities as of December 31, 2013 and 2012, respectively.
Monarch is also party to a credit facility with HSBC Bank Canada ("HSBC Facility"). The HSBC Facility provides a letter of credit facility of up to CAD $24.2 million as of December 31, 2013 in support of Monarch's construction projects. Under the terms of the HSBC Facility, amounts drawn under this facility are secured by liens over the interests of Monarch in certain Canadian real property or cash. There was CAD $18.0 million and CAD $11.0 million letters of credit outstanding under the HSBC Facility as of December 31, 2013 and 2012, respectively.
Both the TD Facility and the HSBC Facility are 364-day facilities that expire on June 30 th each year. Both Facilities have been renewed and extended to June 30, 2014 on terms substantially similar to those in effect prior to the extension.
Sponsor Loan
In connection with the Acquisition in July 2011, TMC and Monarch entered into a loan agreement with certain investment funds managed by Oaktree Entities and TPG Entities, providing for a $625.0 million senior unsecured loan (the "Sponsor Loan") maturing on July 13, 2018. The Sponsor Loan was issued at a discount of 2.5% for $500.0 million of the balance and at par for the remaining $125.0 million balance. In August 2011, $125.0 million of the Sponsor Loan was repaid by Monarch from operating cash. In April 2012, in connection with the offering of the 2020 Senior Notes
106
above, $350.0 million of the Sponsor Loan was repaid in full and the remaining $150.0 million, net of unamortized discount, was acquired by a subsidiary of the Bond Co-Issuers and in exchange the TPG Entities and Oaktree Entities acquired $150.0 million of TMM Holdings Class A Units. The remaining balance of the unamortized discount totaling $7.9 million was written off in the quarter ended September 30, 2012 as a result of the retirement of the Sponsor Loan. Amortization expense of the discount was nil and $0.4 million the years ended December 31, 2013 and 2012, respectively, which is included in interest expense in the accompanying Consolidated and Combined Statements of Operations. The Sponsor Loan bore a 13% annual interest rate calculated on a 360-day year. Interest amounts were paid quarterly on the final day of the period. There were no amounts outstanding under the Sponsor Loan at December 31, 2013 and 2012.
10. FAIR VALUE DISCLOSURES
The Company has adopted ASC Topic 820 Fair Value Measurements ("ASC 820") for valuation of financial instruments. ASC 820 provides a framework for measuring fair value under GAAP, expands disclosures about fair value measurements, and establishes a fair value hierarchy, which requires an entity to maximize the use of observable inputs and minimize the use of unobservable inputs when measuring fair value. The three levels of the fair value hierarchy are summarized as follows:
Level 1 - Fair value is based on quoted prices for identical assets or liabilities in active markets for identical assets or liabilities.
Level 2 - Fair value is determined using significant observable inputs, generally either quoted prices in active markets for similar assets or liabilities, or quoted prices for similar assets or liabilities in markets that are not active.
Level 3 - Fair value is determined using one or more significant input that is unobservable in active markets at the measurement date, such as a pricing model, discounted cash flow, or similar technique.
Mortgages receivable and mortgage borrowings attributable to TMC are recorded at fair value, which are considered a level 2 valuation. The carrying value of mortgages receivable exceeds the face value by approximately $1.6 million and $4.6 million as of December 31, 2013 and 2012, respectively.
At December 31, 2013 and 2012, the carrying value of the Company's loans receivable of $33.4 million and $48.7 million, respectively, approximated fair value. The estimated fair values of the Company's loans receivable are considered a Level 2 valuation.
At December 31, 2013 and 2012, the carrying value of the Company's loans payable and other borrowings of $300.7 million and $216.0 million, respectively, approximated fair value. The estimated fair values of the Company's loans payable are considered a Level 2 valuation.
The fair value of the Company's 2020 Senior Notes and 2021 Senior Notes is considered a Level 2 valuation in the hierarchy for fair value measurement and is derived from quoted market prices by independent dealers and is as follows (in thousands):
| December 31, | ||||||||||||||||
| 2013 | 2012 | |||||||||||||||
| Aggregate Principal | Estimated Fair Value | Aggregate Principal | Estimated Fair Value | |||||||||||||
Description: | ||||||||||||||||
7.75% Senior Notes due 2020 | $ | 485,392 | $ | 532,718 | $ | 675,000 | $ | 723,938 | ||||||||
5.25% Senior Notes due 2021 | $ | 550,000 | $ | 532,125 | $ | - | $ | - | ||||||||
The fair value of the Sponsor Loan that was outstanding at December 31, 2012 was not readily determinable because of the related party nature of the debt and the absence of market equivalents.
107
The fair values of advances to and from the Predecessor Parent Company and affiliated companies are not determinable given their related-party nature and the absence of market equivalents.
We consider the carrying value of cash and cash equivalents, restricted cash, loans receivable, other receivables, net, accounts payable and Restated Revolving Credit Facility Borrowings to approximate fair value due to their short-term nature.
As described in Note 2 - Summary of Significant Accounting Policies and in conjunction with the Acquisition all assets and liabilities of the Company were adjusted to fair value on a non recurring basis using significant Level 3 unobservable assumptions and valuation inputs. Additionally the allocation of purchase price to the assets and liabilities related to the December 31, 2012 Darling acquisition have been recorded at fair value on a non recurring basis using significant Level 3 unobservable assumptions and valuation inputs.
11. INCOME TAXES
The (benefit) provision for income taxes for the years ended December 31, 2013 and 2012, the period from July 13, 2011 through December 31, 2011 and the period from January 1, 2011 through July 12, 2011 consists of the following (in thousands):
| Predecessor | ||||||||||||||||||
| Year Ended December 31, | July 13 Through December 31, 2011 | January 1 Through July 12, 2011 | ||||||||||||||||
| 2013 | 2012 | |||||||||||||||||
Domestic | $ | (24,403 | ) | $ | (284,301 | ) | $ | (11,893 | ) | $ | 4,228 | |||||||
Foreign | 27,471 | 24,004 | 15,924 | 16,653 | ||||||||||||||
|
|
|
|
|
|
|
| |||||||||||
Total income tax provision (benefit) | $ | 3,068 | $ | (260,297 | ) | $ | 4,031 | $ | 20,881 | |||||||||
|
|
|
|
|
|
|
| |||||||||||
Current: | ||||||||||||||||||
Federal | $ | (55,771 | ) | $ | (12,084 | ) | $ | (11,306 | ) | $ | 3,869 | |||||||
State | 2,259 | 890 | (587 | ) | 291 | |||||||||||||
Foreign | 27,886 | 29,727 | 27,355 | 16,258 | ||||||||||||||
|
|
|
|
|
|
|
| |||||||||||
Current tax provision (benefit) | $ | (25,626 | ) | $ | 18,533 | $ | 15,462 | $ | 20,418 | |||||||||
Deferred: | ||||||||||||||||||
Federal | 24,179 | (218,967 | ) | - | - | |||||||||||||
State | 4,930 | (54,141 | ) | - | - | |||||||||||||
Foreign | (415 | ) | (5,722 | ) | (11,431 | ) | 463 | |||||||||||
|
|
|
|
|
|
|
| |||||||||||
Deferred tax provision (benefit) | $ | 28,694 | $ | (278,830 | ) | $ | (11,431 | ) | $ | 463 | ||||||||
|
|
|
|
|
|
|
| |||||||||||
Total income tax provision (benefit) | $ | 3,068 | $ | (260,297 | ) | $ | 4,031 | $ | 20,881 | |||||||||
|
|
|
|
|
|
|
| |||||||||||
The components of income (loss) before income taxes are as follows:
| Predecessor | ||||||||||||||||||
| Year Ended December 31, | July 13 Through December 31, 2011 | January 1 Through July 12, 2011 | ||||||||||||||||
| 2013 | 2012 | |||||||||||||||||
Domestic | $ | (3,181 | ) | $ | 73,317 | $ | (19,486 | ) | $ | 11,065 | ||||||||
Foreign | 101,117 | 97,234 | 50,284 | 59,836 | ||||||||||||||
|
|
|
|
|
|
|
| |||||||||||
Income before income taxes | $ | 97,936 | $ | 170,551 | $ | 30,798 | $ | 70,901 | ||||||||||
|
|
|
|
|
|
|
| |||||||||||
At December 31, 2013 and 2012, the Company had a valuation allowance of $40.0 million and $62.9 million, respectively, against net deferred tax assets, which include the tax benefit from federal and state net operating loss ("NOL") carryforwards. Federal NOL carryforwards may be used to offset future taxable income for 20 years and begin
108
to expire in 2028. State NOL carryforwards may be used to offset future taxable income for a period of time ranging from 5 to 20 years, depending on the state, and begin to expire in 2014. NOL carryforwards in Canada expire in 20 years. The change in the valuation allowance from 2012 to 2013, and from 2011 to 2012, was a decrease of $22.9 million and $334.6 million, respectively. The Company's future deferred tax asset realization depends on sufficient taxable income in the carryforward periods under existing tax laws. State deferred tax assets include approximately $15.7 and $15.8 million at December 31, 2013 and 2012, respectively, of tax benefits related to state NOL carryovers, which begin to expire in 2014. On an ongoing basis, we will continue to review all available evidence to determine if and when we expect to realize our deferred tax assets and federal and state NOL carryovers.
A reconciliation of the provision (benefit) for income taxes and the amount computed by applying the statutory federal income tax rate of 35% to income before provision (benefit) for income taxes is as follows:
| Predecessor | |||||||||||||||||
| Year Ended December 31, | July 13 through December 31, 2011 |
| January 1 through July 12, 2011 | |||||||||||||||
| 2013 | 2012 |
| ||||||||||||||||
Tax at federal statutory rate | 35.0 | % | 35.0 | % | 35.0 | % | 35.0 | % | ||||||||||
State income taxes (net of federal benefit) | 4.5 | (20.5 | ) | 0.3 | 0.1 | |||||||||||||
Foreign income taxed below U.S. Rate | (8.3 | ) | (4.9 | ) | (14.7 | ) | (5.7 | ) | ||||||||||
Valuation allowance | (16.1 | ) | (173.9 | ) | (31.8 | ) | (3.4 | ) | ||||||||||
Built in loss limitation | 8.3 | 23.8 | 20.0 | - | ||||||||||||||
Tax Indemnity | 31.7 | 2.7 | 15.4 | - | ||||||||||||||
Uncertain tax positions | (84.7 | ) | (9.2 | ) | (39.1 | ) | 3.3 | |||||||||||
Transaction costs | - | (2.8 | ) | 35.3 | - | |||||||||||||
Non-controlling interest | - | - | (1.3 | ) | (2.0 | ) | ||||||||||||
Deferred tax adjustments | - | (4.4 | ) | - | - | |||||||||||||
Disallowed compensation expense | 30.2 | - | - | - | ||||||||||||||
Foreign gain exclusion | (1.8 | ) | - | - | - | |||||||||||||
Holding company tax | 4.3 | - | - | - | ||||||||||||||
Other | - | - | (6.0 | ) | 2.3 | |||||||||||||
|
|
|
|
|
|
|
|
| ||||||||||
Effective Rate | 3.1 | % | (154.2 | )% | 13.1 | % | 29.6 | % | ||||||||||
|
|
|
|
|
|
|
|
| ||||||||||
The Company has substantial tax attributes available to offset the impact of future income taxes. The Company has a process for determining the need for a valuation allowance with respect to these attributes. In accordance with ASC Topic 740-10, Income Taxes , the Company assesses whether a valuation allowance should be established based on the consideration of available evidence using a "more likely than not" standard with significant weight being given to evidence that can be objectively verified. This assessment includes an extensive review of both positive and negative evidence including the Company's earnings history, forecasts of future profitability, assessment of the industry, the length of statutory carry-forward periods, experiences of utilizing NOLs and built-in losses, and tax planning alternatives.
As a result of the Acquisition on July 13, 2011, the Company had a "change in control" as defined by Section 382 of the Internal Revenue Code of 1986 as amended (the "IRC"). Section 382 of the IRC imposes certain limitations on the Company's ability to utilize certain tax attributes and net unrealized built-in losses that existed as of July 13, 2011. The gross deferred tax asset includes amounts that are considered to be net unrealized built-in losses. To the extent these net unrealized losses are realized during the five-year period after July 13, 2011, they may not be deductible for federal income tax reporting purposes to the extent they exceed the Company's overall IRC Section 382 limitation.
The most significant judgments the Company makes in its assessment of the need for a valuation allowance involve estimating the amount of built-in losses that may be utilized to offset future taxable income from the sale of real estate inventory that it held on the Acquisition date, and the ability to utilize NOLs as limited by Section 382 of the IRC. Making such estimates and judgments, particularly pertaining to the future ability to utilize built-in losses, is subject to inherent uncertainties.
109
The Company recorded a full valuation allowance against all of its U.S. deferred tax assets during 2007 due to economic conditions and the weight of negative evidence at that time. During the fourth quarter of 2012, the Company reversed a large portion of the valuation allowance because the weight of the positive evidence exceeded that of the negative evidence. At December 31, 2013 and December 31, 2012 we retained a valuation allowance of $40.0 million and $62.9 million, respectively, primarily for various deferred tax assets we estimate we will not be able to utilize due to federal and state limitations. In evaluating the need for a valuation allowance at December 31, 2013, we considered available positive and negative evidence, including that the Company's last four years of cumulative results became profitable during the fourth quarter of 2012 and continues to be the case as of December 31, 2013. The Company also took into account evidence of recovery in the housing markets where it operates and its level of pre-tax income and growth in sales orders. The prospects of continued profitability and growth were further supported by a strong order backlog and sufficient balance sheet liquidity to sustain and grow operations. In addition, most of the Company's tax jurisdictions have a 20-year NOL carryforward utilization period during which time the Company fully expects to be able to absorb NOL carryovers and temporary differences as they reverse in future years.
The components of net deferred tax assets and liabilities at December 31, 2013 and 2012, consisted of timing differences related to inventory impairment, expense accruals, provisions for liabilities, and NOL carryforwards. The Company has approximately $133.0 million in available federal NOL carryforwards, which will begin to expire in 2028. The Company has approximately $6.6 million in available NOL carryforwards related to the Canadian operations which will begin to expire in 2025. A summary of these components is as follows (in thousands):
| December 31, | ||||||||
| 2013 | 2012 | |||||||
Deferred tax assets | ||||||||
Real estate inventory | $ | 179,549 | $ | 205,461 | ||||
Accruals and reserves | 25,100 | 32,293 | ||||||
Other | 22,600 | 23,810 | ||||||
Net operating losses | 74,893 | 83,908 | ||||||
Foreign exchange | 959 | - | ||||||
|
|
|
| |||||
Total deferred tax assets | $ | 303,101 | $ | 345,472 | ||||
Deferred tax liabilities | ||||||||
Real estate inventory, intangibles, other | (18,151 | ) | (7,847 | ) | ||||
Valuation allowance | (40,030 | ) | (62,868 | ) | ||||
|
|
|
| |||||
Total net deferred tax assets | $ | 244,920 | $ | 274,757 | ||||
|
|
|
| |||||
The Company accounts for uncertain tax positions in accordance with ASC 740. This guidance clarifies the accounting for uncertainty in income taxes and prescribes a recognition threshold and measurement attributes for the financial statement recognition and measurement of a tax position taken, or expected to be taken, in a tax return. ASC 740 also provides guidance on derecognition, classification, interest and penalties, accounting in interim periods, disclosure, and transition. ASC 740 requires a company to recognize the financial statement effect of a tax position when it is more likely than not (defined as a substantiated likelihood of more than 50%) based on the technical merits of the position that the position will be sustained upon examination. A tax position that meets the more-likely-than-not recognition threshold is measured to determine the amount of benefit to be recognized in the financial statements based upon the largest amount of benefit that is greater than 50% likely of being realized upon ultimate settlement with a taxing authority that has full knowledge of all relevant information. The Company's inability to determine that a tax position meets the more-likely-than-not recognition threshold does not mean that the Internal Revenue Service ("IRS") or any other taxing authority will disagree with the position that it has taken. If a tax position does not meet the more-likely-than-not recognition threshold despite the Company's belief that its filing position is supportable, the benefit of that tax position is not recognized in the financial statements and the Company is required to accrue potential interest and penalties until the uncertainty is resolved. Potential interest and penalties are recognized as components of the provision for income taxes in the accompanying Consolidated and Combined Statements of Operations. Differences between amounts taken in a tax return and amounts recognized in the Consolidated and Combined Financial Statements are considered unrecognized tax benefits. The Company believes that it has a reasonable basis for each of its filing positions and intends to defend those positions if challenged by the IRS or other taxing jurisdictions.
110
Following is a tabular reconciliation of the total amounts of unrecognized tax benefits (in thousands):
| Predecessor | ||||||||||||||||||
| Year Ended December 31, | July 13 through December 31, 2011 | January 1 through July 12, 2011 | ||||||||||||||||
| 2013 | 2012 | |||||||||||||||||
Beginning of the period | $ | 95,566 | $ | 108,955 | $ | 120,033 | $ | 119,901 | ||||||||||
Increases of current year items | 7,200 | 1,394 | 5,211 | - | ||||||||||||||
Increases of prior year items | 317 | 3,189 | - | - | ||||||||||||||
Settlement with tax authorities | (90,668 | ) | (615 | ) | - | - | ||||||||||||
Decreased for tax positions of prior years | (1,766 | ) | (14,995 | ) | - | - | ||||||||||||
Decreased due to statute of limitations | (678 | ) | (2,362 | ) | (16,049 | ) | - | |||||||||||
Foreign exchange differences | - | - | (240 | ) | 132 | |||||||||||||
|
|
|
|
|
|
|
| |||||||||||
End of the period | $ | 9,971 | $ | 95,566 | $ | 108,955 | $ | 120,033 | ||||||||||
|
|
|
|
|
|
|
| |||||||||||
During the year ended December 31, 2013, December 31, 2012, the period from July 13, 2011 through December 31, 2011 and the period from January 1, 2011 through July 12, 2011, the Company recognized potential penalties and interest expense on its uncertain tax positions of $0.3 million, $3.0 million, $4.1 million, and $2.3 million, respectively, which is included in income tax provision (benefit) in the accompanying Consolidated and Combined Statements of Operations. Accrued interest and penalties of $1.2 million and $19.7 million are recorded at December 31, 2013 and 2012, respectively, and are included in other liabilities in the accompanying Consolidated and Combined Balance Sheets. Interest and penalties of $18.6 million and $6.3 million were released in the years ended December 31, 2013 and 2012, respectively.
For the filing periods of 2005 to 2007, the Company reached a settlement in 2012 with the IRS for the legacy Morrison Homes which reduced its income tax expense by $15.0 million related to the Section 382 issue. Income tax payable in the accompanying Consolidated and Combined Balance Sheets at December 31, 2012, includes reserves of $8.7 million and $74.8 million related to this issue for the tax years 2009 and 2008, respectively. For the filing periods of 2009 and 2008, the Company reached a settlement in 2013 with the IRS for the legacy Morrison Homes which reduced its income tax expense by $83.5 million related to this issue.
The Company currently is under appeals for the 2000 and 2003 periods for its Canadian operations with the Canada Revenue Authority, the outcome of which are not readily determinable at this time.
The Company has received an indemnity from the Predecessor Parent Company for certain tax matters where a liability is related to periods ending prior to December 31, 2010.
The Company currently operates in five states and is subject to various state tax jurisdictions. The Company estimates its state tax liability based upon the individual taxing authorities' regulations, estimates of income by taxing jurisdiction, and its ability to utilize certain tax-saving strategies. Primarily due to a change in the Company's estimate of the allocation of income or loss, as the case may be, among the various taxing jurisdictions and changes in tax regulations and their impact on our tax strategies, the Company's estimated rate for state income taxes was 3.4% and 3.6% for 2013 and 2012, respectively, before consideration of any applicable valuation allowance.
During the next 12 months, the amount of unrecognized tax benefits could decrease as a result of the completion of tax audits where certain of the filing positions are ultimately accepted by the IRS and/or other tax jurisdictions and/or expiration of tax statutes and successfully settled to the benefit of the Company. As a result of the lapse of the statute of limitations for the federal and Arizona jurisdictions, unrecognized tax benefits of $16.1 million were recognized in income tax expense in the period from July 13, 2011 through December 31, 2011. As of December 31, 2013, the Company's cumulative gross unrecognized tax benefits were $2.1 million in the U.S. and $7.9 million in Canada and all unrecognized tax benefits, if recognized, would affect the effective tax rate. As of December 31, 2012, the Company's cumulative gross unrecognized tax benefits were $85.7 million in the U.S. and $9.8 million in Canada. These amounts are included in income taxes payable in the accompanying Consolidated and Combined Balance Sheets at 2012. No unrecognized tax benefits are expected to reverse in the next 12 months.
111
12. RELATED-PARTY TRANSACTIONS
From time to time, the Company may engage in transactions with entities that are affiliated with one or more of the Principal Equityholders. The Company believes transactions with related parties are in the normal course of operations and are executed at arm's length as they are entered into at terms comparable to those with unrelated third parties. There were $16.0 million and $30.0 million in real estate inventory acquisitions from such affiliates in the years ended December 31, 2013 and 2012, respectively.
Management and Advisory Fees - In connection with the Acquisition, affiliates of the Principal Equityholders entered into services agreements with TMC and Monarch relating to the provision of financial and strategic advisory services and consulting services. Subsidiaries of the Company paid affiliates of the Principal Equityholders a one-time transaction fee of $13.7 million for structuring the Acquisition. In addition, the Company paid a monitoring fee for management services and advice. The management services agreement with affiliates of TPG and Oaktree was terminated immediately prior to the IPO in exchange for an aggregate payment of $29.8 million split equally between affiliates of TPG and Oaktree, which was recorded as a transaction expense for the year ended December 31, 2013. Management fees for the year ended December 31, 2013 and 2012 were $1.4 million and $5.0 million, respectively, and such fees are included in general and administrative expenses in the accompanying Consolidated and Combined Statements of Operations.
In addition, in conjunction with the formation of TMM Holdings and in connection with the Acquisition, an affiliate of JH entered into a partnership services agreement with TMM Holdings (the "JHI Services Agreement") relating to the provision of certain services to TMM Holdings. In consideration of these services, TMM Holdings granted to the JH affiliate an amount of partnership units, subject to certain terms, conditions and restrictions contained in a unit award agreement and the TMM Holdings limited partnership agreement. Prior to the IPO, in connection with the Reorganization Transactions, the Company recorded a one-time, non-cash charge of $80.2 million for the year ended December 31, 2013. This charge was recorded in indemnification and transaction expense in the Consolidated and Combined Statements of Operations in respect of the modification of the Class J Units in TMM Holdings, resulting from the termination of the JHI Services Agreement between JH and TMM Holdings, and the direct or indirect exchange (on a one-for-one basis) of the Class J Units in TMM Holdings for units having substantially equivalent performance vesting and distribution terms in the TPG and Oaktree Holding Vehicles.
U.S. Operations - For the period from January 1, 2011 through July 12, 2011, interest expense incurred related to fixed and revolving debt due to the Predecessor Parent Company was $19.2 million and is included in interest expense in the accompanying Consolidated and Combined Statements of Operations, net of amounts capitalized.
Canadian Operations - Loans and other receivables due from joint ventures and partners in the joint ventures was $33.4 million and $48.7 million as of December 31, 2013 and 2012, respectively, which comprise the balance of loans receivable in the accompanying Consolidated and Combined Balance Sheet.
Interest (income) expense, net in the accompanying Consolidated and Combined Statements of Operations for the period from January 1, 2011 through July 12, 2011 includes $6.8 million of interest income earned from a receivable from the Predecessor Parent Company.
13. EMPLOYEE BENEFIT, RETIREMENT, AND DEFERRED COMPENSATION PLANS
U. S. Operations - The Company maintains a defined contribution plan pursuant to Section 401(k) of the IRC ("401(k) Plan). Each eligible employee may elect to make before-tax contributions up to the current tax limits. The Company matches 100.0% of employees' voluntary contributions up to a maximum of 3.5% of eligible compensation. The Company contributed $1.8 million, $1.1 million, $0.6 million and $0.5 million to the 401(k) Plan for the year ended December 31, 2013, December 31, 2012, the period from July 13, 2011 through December 31, 2011 and the period from January 1, 2011 through July 12, 2011, respectively.
The Taylor Woodrow (USA) U.K. Supplementary Pension Plan is an unfunded, nonqualified pension plan for several individuals who transferred from the Company's U.K. related companies to the employment of Taylor Woodrow on or before October 1, 1995. The recorded obligations represent benefits accrued by these individuals for service with Taylor
112
Woodrow prior to the employees' participation in the U.S. pension plan minus any benefit accrued in any other pension-type benefit plans sponsored by or contributed to a Taylor Woodrow Group-related company for the period of service prior to participation in the U.S. plan. In accordance with the plan document, the participants are entitled to a fixed monthly pension and a fixed survivor benefit after the age of 65. At December 31, 2013 and 2012, the Company accrued $1.8 million and $1.8 million, respectively, for obligations under this plan. These obligations are recorded in accrued expenses and other liabilities on the accompanying Consolidated and Combined Balance Sheets.
The Company also maintains the Taylor Morrison Cash Balance Pension Plan (the "U.S. Cash Balance Plan"). This is a consolidated defined benefit plan arising from the 2007 merger of the parent companies of Taylor Woodrow Holdings (USA), Inc. and Morrison Homes, Inc. All full-time employees were eligible to participate in this plan. The contribution percentage is based on participant's age and ranges from 2% to 4% of eligible compensation, plus 1% of eligible compensation over the social security wage base. The Company contributed to the plan $0.7 million, and $1.0 million for the year ended December 31, 2013 and 2012, respectively. At December 31, 2013 and 2012, the unfunded status of the plan was $5.9 million and 11.9 million, respectively. These obligations are recorded in accrued expenses and other liabilities on the accompanying Consolidated and Combined Balance Sheets. Effective December 31, 2010, the U.S. Cash Balance Plan was amended to freeze participation so that no new or reemployed employees may become participants and to freeze all future benefit accruals to existing participants.
The changes in the total benefit obligation and in the fair value of assets and the funded status of the U.S. Cash Balance Plan are as follows (in thousands):
| Year Ended December 31, | ||||||||
| 2013 | 2012 | |||||||
Change in benefit obligations: | ||||||||
Benefit obligation - beginning of period | $ | 33,592 | $ | 30,961 | ||||
Interest on liabilities | 1,294 | 1,326 | ||||||
Benefits paid | (1,025 | ) | (1,206 | ) | ||||
Actuarial loss (gain) | (4,013 | ) | 2,511 | |||||
|
|
|
| |||||
Benefit obligation - end of period | $ | 29,848 | $ | 33,592 | ||||
|
|
|
| |||||
Change in fair value of plan assets: | ||||||||
Fair value of plan assets - beginning of period | 21,738 | 19,394 | ||||||
Return on plan assets | 2,548 | 2,552 | ||||||
Employer contributions | 670 | 999 | ||||||
Benefits paid | (1,025 | ) | (1,207 | ) | ||||
|
|
|
| |||||
Fair value of plan assets - end of period | $ | 23,931 | $ | 21,738 | ||||
|
|
|
| |||||
Unfunded status - end of period | $ | 5,917 | $ | 11,854 | ||||
|
|
|
| |||||
The significant weighted-average assumptions adopted in measuring the benefit obligations and net periodic pension costs are as follows:
| Predecessor | ||||||||||||||||||
| Year Ended December 31, | July 13 Through December 31, 2011 | January 1 Through July 12, 2011 | ||||||||||||||||
| 2013 | 2012 | |||||||||||||||||
Discount rate: | ||||||||||||||||||
Net periodic pension cost | 3.90 | % | 4.31 | % | 5.56 | % | 5.47 | % | ||||||||||
Pension obligation | 4.80 | 3.81 | 4.31 | 5.56 | ||||||||||||||
Expected return on plan assets | 7.00 | 7.00 | 7.00 | 7.00 | ||||||||||||||
Rate of compensation increase | N/A | N/A | N/A | N/A | ||||||||||||||
113
The overall expected long-term rate of return on plan assets assumption is determined based on the plan's targeted allocation among asset classes and the weighted-average expected return of each class. The expected return of each class is determined based on the current yields on inflation-indexed bonds, current forecasts of inflation, and long-term historical real returns.
Components of net periodic pension cost of the U.S. Cash Balance Plan are as follows (in thousands):
| Predecessor | ||||||||||||||||||
| Year Ended December 31, | July 13 Through December 31, 2011 | January 1 Through July 12, 2011 | ||||||||||||||||
| 2013 | 2012 | |||||||||||||||||
Interest Cost | $ | 1,294 | $ | 1,326 | $ | 691 | $ | 688 | ||||||||||
Amortization of net actuarial loss | 133 | 108 | - | 75 | ||||||||||||||
Expected return on plan assets | (1,499 | ) | (1,358 | ) | (692 | ) | (686 | ) | ||||||||||
|
|
|
|
|
|
|
| |||||||||||
Net periodic pension cost | $ | (72 | ) | $ | (76 | ) | $ | (1 | ) | $ | 77 | |||||||
|
|
|
|
|
|
|
| |||||||||||
Accumulated other comprehensive loss of $2.6 million and $7.8 million as of December 31, 2013 and 2012, respectively, consist of the net actuarial gain in the current year partially offset by the net actuarial loss that arose during the year ended December 31, 2012 and the period from July 13, 2011 through December 31, 2011, and has not yet been recognized as a component of net periodic pension cost. The Company does not expect that any of the amounts in accumulated other comprehensive income will be recognized into net periodic pension cost during the year ending December 31, 2014.
The estimated future benefit payments in the next five years and the five years thereafter in aggregate are as follows (in thousands):
| Years Ending December 31, | ||||
2014 | $ | 909 | ||
2015 | 1,071 | |||
2016 | 1,011 | |||
2017 | 1,196 | |||
2018 | 1,537 | |||
2019–2023 | 7,232 | |||
The Company expects to contribute $1.6 million to the U.S. Cash Balance Plan in the year ending December 31, 2014.
114
The fair value of the U.S. Cash Balance Plan's assets by asset categories is as follows (in thousands):
| Fair Value Measurements at December 31, 2013 | ||||||||||||||||
Asset Category | Quoted Prices in Active Markets (Level 1) | Significant Other Observable Inputs (Level 2) | Significant Unobservable Inputs (Level 3) | Total | ||||||||||||
U.S. equity securities | $ | 8,677 | $ | - | $ | - | $ | 8,677 | ||||||||
International equity securities | 2,917 | - | - | 2,917 | ||||||||||||
Fixed-income securities | 10,757 | - | - | 10,757 | ||||||||||||
Cash | 1,089 | - | - | 1,089 | ||||||||||||
Other | 491 | - | - | 491 | ||||||||||||
|
|
|
|
|
|
|
| |||||||||
Total | $ | 23,931 | $ | - | $ | - | $ | 23,931 | ||||||||
|
|
|
|
|
|
|
| |||||||||
| Fair Value Measurements at December 31, 2012 | ||||||||||||||||
Asset Category | Quoted Prices in Active Markets (Level 1) | Significant Other Observable Inputs (Level 2) | Significant Unobservable Inputs (Level 3) | Total | ||||||||||||
U.S. equity securities | $ | 7,826 | $ | - | $ | - | $ | 7,826 | ||||||||
International equity securities | 2,608 | - | - | 2,608 | ||||||||||||
Fixed-income securities | 9,782 | - | - | 9,782 | ||||||||||||
Cash | 1,087 | - | - | 1,087 | ||||||||||||
Other | 435 | - | - | 435 | ||||||||||||
|
|
|
|
|
|
|
| |||||||||
Total | $ | 21,738 | $ | - | $ | - | $ | 21,738 | ||||||||
|
|
|
|
|
|
|
| |||||||||
The Company believes the U.S. Cash Balance Plan's assets are invested in a manner consistent with generally accepted standards of fiduciary responsibility. Taylor Morrison's primary investment objective is to build and maintain the plan's assets through employer contributions and investment returns to satisfy legal requirements and benefit payment requirements when due. Because of the long-term nature of the plan's obligations, Taylor Morrison has the following goals in managing the plan: long-term (i.e., five years and more) performance objectives, maintenance of cash reserves sufficient to pay benefits, and achievement of the highest long-term rate of return practicable without taking excessive risk that could jeopardize the plan's funding policy or subject the Company to undue funding volatility. The investment portfolio contains a diversified blend of equity, fixed-income securities, and cash, though allocation will favor equity investments in order to reach the U.S. Cash Balance Plan's stated objectives. One of the U.S. Cash Balance Plan's investment criteria is that over a complete market cycle, each of the investment funds should typically rank in the upper half of the universe of all active investment funds in the same asset class with similar investment objectives. Investments in commodities, private placements, or letter stock are not permitted. The equity securities are diversified across U.S. and non-U.S. stocks, as well as growth and value. Investment performance is measured and monitored on an ongoing basis through quarterly portfolio reviews and annual reviews relative to the objectives and guidelines of the plan.
The range of target allocation percentages of plan assets of the U.S. Cash Balance Plan is as follows:
| Minimum | Maximum | Target | ||||||||||
U.S. equity securities | 37 | % | 47 | % | 42 | % | ||||||
International equity securities | 8 | 18 | 13 | |||||||||
Fixed-income securities | 35 | 45 | 40 | |||||||||
Other | 10 | 5 | ||||||||||
|
| |||||||||||
| 100 | % | |||||||||||
|
| |||||||||||
Canadian Operations - Effective January 31, 2006, Monarch elected to convert the provisions of its defined benefit plan to defined contribution provisions for service beyond January 31, 2006. As part of this conversion, the plan members were given the option to convert their defined benefits accrued prior to February 1, 2006, to the defined contribution plan. As a result, Monarch maintains both a defined benefit plan (the "Monarch Plan") and a defined
115
contribution plan. Total expense for the defined contribution plan was $0.2 million for each of the years ended December 31, 2013 and 2012, and $0.1 million and $0.8 million for the period from July 13, 2011 through December 31, 2011 and the period from January 1, 2011 through July 12, 2011, respectively.
The Company also maintains a Supplemental Executive Retirement Plan ("SERP") in its Canada operations. This plan covers select legacy executives and its obligations are determined by valuing the estimated actuarial liabilities to its retired members. The plan is not open to new participants and the estimated liabilities for the SERP were $0.9 million and $1.1 million as of December 31, 2013 and 2012, respectively, which were recorded in accrued expenses and other liabilities in the accompanying Consolidated and Combined Balance Sheets.
The Company's funding policy in regards to the Monarch Plan is to make contributions to its pension funds based on various actuarial cost methods as permitted by pension regulatory bodies, and Monarch is responsible to adequately fund the plan. Contributions reflect actuarial assumptions concerning future investment returns and future service benefits. Plan assets are represented primarily by Canadian and foreign equities, government and corporate bonds, debentures, and secured mortgages.
The changes in the total benefit obligation and in the fair value of assets and the funded status of the Monarch Plan are as follows (in thousands):
| Year Ended December 31, | ||||||||
| 2013 | 2012 | |||||||
Change in benefit obligations: | ||||||||
Benefit obligation - beginning of period | $ | 12,346 | $ | 11,092 | ||||
Interest on liabilities | 446 | 522 | ||||||
Benefits paid | (725 | ) | (733 | ) | ||||
Actuarial loss gain | (268 | ) | 1,210 | |||||
Currency translation adjustment | (836 | ) | 255 | |||||
|
|
|
| |||||
Benefit obligation - end of period | $ | 10,963 | $ | 12,346 | ||||
|
|
|
| |||||
Change in fair value of plan assets: | ||||||||
Fair value of plan assets - beginning of period | 10,973 | 10,630 | ||||||
Return on plan assets | 1,197 | 682 | ||||||
Employer contributions | 744 | 149 | ||||||
Benefits paid | (725 | ) | (733 | ) | ||||
Currency translation adjustment | (743 | ) | 245 | |||||
|
|
|
| |||||
Fair value of plan assets - end of period. | $ | 11,446 | $ | 10,973 | ||||
|
|
|
| |||||
Funded status - deficit (surplus) - end of period | $ | (483 | ) | $ | 1,373 | |||
|
|
|
| |||||
The significant weighted-average assumptions adopted in measuring the benefit obligations and net periodic pension costs are as follows:
| Predecessor | ||||||||||||||||
| Year Ended December 31, | July 13 Through December 31, 2011 | January 1 Through July 12, 2011 | ||||||||||||||
| 2013 | 2012 | |||||||||||||||
Discount rate: | ||||||||||||||||
Net periodic pension cost | 4.00 | % | 4.75 | % | 4.875 | % | 5.25 | % | ||||||||
Pension obligation | 4.25 | 4.00 | 4.75 | 4.875 | ||||||||||||
Expected return on plan assets | 6.25 | 6.25 | 6.50 | 6.50 | ||||||||||||
116
The expected long-term rate of return on plan assets assumption was determined by reviewing the current investment policy as compared to current expected rates of return for all asset categories.
Components of net periodic pension cost are as follows (in thousands):
| Predecessor | ||||||||||||||||
| Year Ended December 31, | July 13 Through December 31, 2011 | January 1 Through July 12, 2011 | ||||||||||||||
| 2013 | 2012 | |||||||||||||||
Interest cost | $ | 446 | $ | 522 | $ | 253 | $ | 310 | ||||||||
Amortization of net actuarial gain | 45 | - | - | - | ||||||||||||
Expected return on plan assets | (641 | ) | (688 | ) | (333 | ) | (408 | ) | ||||||||
|
|
|
|
|
|
|
| |||||||||
Net periodic pension cost | $ | (150 | ) | $ | (166 | ) | $ | (80 | ) | $ | (98 | ) | ||||
|
|
|
|
|
|
|
| |||||||||
Accumulated other comprehensive loss of $0.9 million and $1.9 million as of December 31, 2013 and 2012 respectively, consist of the net actuarial loss that has not yet been recognized as a component of net periodic pension cost. The Company does not expect that any of the amounts in accumulated other comprehensive income will be recognized into net periodic pension cost during the year ending December 31, 2014.
The estimated future benefit payments in the next five years and the five years thereafter in aggregate are as follows (in thousands):
| Years Ending December 31, | ||||
2014 | $ | 684 | ||
2015 | 677 | |||
2016 | 661 | |||
2017 | 646 | |||
2018 | 627 | |||
2019–2023 | 2,755 | |||
The Company expects to contribute $0.4 million to the Monarch Plan in the year ending December 31, 2014.
The fair value of the Monarch Plan's assets by asset categories is as follows (in thousands):
| Fair Value Measurements at December 31, 2013 | ||||||||||||||||
Asset Category | Quoted Prices in Active Markets (Level 1) | Significant Other Observable Inputs (Level 2) | Significant Unobservable Inputs (Level 3) | Total | ||||||||||||
Canadian equity securities | $ | - | $ | 4,005 | $ | - | $ | 4,005 | ||||||||
U.S. equity securities | - | 916 | - | 916 | ||||||||||||
International equity securities | - | 916 | - | 916 | ||||||||||||
Fixed-income securities | - | 4,350 | - | 4,350 | ||||||||||||
Balanced income securities | - | 1,259 | - | 1,259 | ||||||||||||
|
|
|
|
|
|
|
| |||||||||
Total | $ | - | $ | 11,446 | $ | - | $ | 11,446 | ||||||||
|
|
|
|
|
|
|
| |||||||||
| Fair Value Measurements at December 31, 2012 | ||||||||||||||||
Asset Category | Quoted Prices in Active Markets (Level 1) | Significant Other Observable Inputs (Level 2) | Significant Unobservable Inputs (Level 3) | Total | ||||||||||||
Canadian equity securities | $ | - | $ | 3,576 | $ | - | $ | 3,576 | ||||||||
U.S. equity securities | - | 707 | - | 707 | ||||||||||||
International equity securities | - | 709 | - | 709 | ||||||||||||
Fixed-income securities | - | 5,981 | - | 5,981 | ||||||||||||
|
|
|
|
|
|
|
| |||||||||
Total | $ | - | $ | 10,973 | $ | - | $ | 10,973 | ||||||||
|
|
|
|
|
|
|
| |||||||||
117
Monarch employs a total return on investment approach whereby a mix of equities and fixed-income securities is used to maximize the long-term return of plan assets for an appropriate level of risk. Risk tolerance is established through careful consideration of plan liabilities, plan funded status, and corporate financial condition. The investment portfolio contains a diversified blend of equity and fixed-income securities. One of the Monarch Plan's investment criteria is that the plan will achieve a rate of return that exceeds the rate of wage inflation, as measured by the Wage Price Index provided by Statistics Canada, by 1% per annum over the long term. The equity securities are diversified across Canadian and non-Canadian stocks, as well as growth and value. Investment performance is measured and monitored on an ongoing basis through quarterly portfolio reviews and annual reviews relative to the objectives and guidelines of the Monarch Plan.
The range of target allocation percentages of plan assets of the Monarch Plan is as follows:
| Minimum | Maximum | |||||||
Canadian equity securities | 25 | % | 60 | % | ||||
Foreign equity securities (including U.S. and global equities) | - | 20 | ||||||
Fixed-income securities | 30 | 60 | ||||||
Real estate | - | 15 | ||||||
Cash and cash equivalents | - | 40 | ||||||
Resource properties | - | 5 | ||||||
14. ACCUMULATED OTHER COMPREHENSIVE INCOME
The table below provides, for the fiscal year ended December 31, 2013, the components of accumulated other comprehensive income (loss) (amounts in thousands):
| Total Post- Retirement Benefits Adjustments | Non-controlling Interest in Principal Equityholders | Foreign Currency Translation Adjustments | Total | |||||||||||||
Balance, beginning of period | $ | (12,088 | ) | $ | - | $ | (22,277 | ) | $ | (34,365 | ) | |||||
|
|
|
|
|
|
|
| |||||||||
Other comprehensive income (loss) before reclassifications | 6,107 | - | (17,686 | ) | (11,578 | ) | ||||||||||
Gross amounts reclassified from accumulated other comprehensive income | 177 | 3,496 | - | 3,673 | ||||||||||||
Foreign currency translation | 199 | - | - | 199 | ||||||||||||
Income tax (expense) benefit | (2,496 | ) | - | 959 | (1,537 | ) | ||||||||||
|
|
|
|
|
|
|
| |||||||||
Other comprehensive income (loss) net of tax | $ | 3,987 | $ | 3,496 | $ | (16,727 | ) | $ | (9,244 | ) | ||||||
Gross amounts reclassified within accumulated other comprehensive income (loss) | 12,088 | 8,792 | 22,277 | 43,157 | ||||||||||||
|
|
|
|
|
|
|
| |||||||||
Balance, end of period | $ | 3,987 | $ | 12,288 | $ | (16,727 | ) | $ | (452 | ) | ||||||
|
|
|
|
|
|
|
| |||||||||
Reclassifications for the amortization of the employee retirement plans are included in selling, general and administrative expense in the accompanying Consolidated and Combined Statements of Operations. See Note 13 – Employee Benefit, Retirement and Deferred Compensation Plans for additional information.
118
15. OPERATING AND REPORTING SEGMENTS
In accordance with ASC Topic 280, Segment Reporting , the Company has twelve homebuilding operating divisions which it aggregates into three reportable homebuilding segments. These segments are engaged in the business of acquiring and developing land, constructing homes, marketing and selling those homes, and providing warranty and customer service. The Company aggregates its operating segments into a reporting segment based on similar long-term economic characteristics. The Company has no inter-segment sales as all sales are to external customers. The Company capitalizes certain interest costs to inventory during the development and construction periods. Capitalized interest is charged to cost of home closings when the related inventory is delivered to customers. In addition, the Company includes Mortgage Operations as a separate segment. The Company's reporting segments are as follows:
| West (Domestic) | Phoenix, Northern California, Southern California and Denver | |
| East (Domestic) | Houston (which includes a Taylor Morrison division and a Darling Homes division), Austin, Dallas (which includes a Darling Homes division only), North Florida and West Florida | |
| Canada (Foreign) | Kitchener-Waterloo, Ottawa and Toronto | |
| Mortgage Operations (Domestic) | Mortgage and Title Services |
Management primarily evaluates segment performance based on segment adjusted gross margin, which is comprised of segment gross margin, as defined under U.S. GAAP, less interest amortized to cost of home closings, and impairments ("adjusted gross margin"). Management also reviews segment performance based on segment gross margin, which the Company defines as homebuilding and land revenue less cost of home construction, commissions and other sales costs, land development and other land sales costs and other costs incurred by, or allocated to each segment, including impairments. Each reportable segment follows the same accounting policies described in Note 2 – Summary of Significant Accounting Policies . Operating results for each segment may not be indicative of the results for such segment had it been an independent, stand-alone entity.
Segment information for the Company is as follows (in thousands):
| Predecessor | ||||||||||||||||
| Year Ended December 31, | July 13 Through December 31, 2011 | January 1 Through July 12, 2011 | ||||||||||||||
| 2013 | 2012 | |||||||||||||||
Revenue: | ||||||||||||||||
East | $ | 1,117,298 | $ | 558,523 | $ | 246,866 | $ | 192,847 | ||||||||
West | 768,412 | 460,798 | 153,997 | 142,578 | ||||||||||||
Canada | 407,156 | 394,539 | 341,010 | 278,283 | ||||||||||||
Mortgage Operations | 30,371 | 21,861 | 8,579 | 6,027 | ||||||||||||
|
|
|
|
|
|
|
| |||||||||
Total revenues | $ | 2,323,237 | $ | 1,435,721 | $ | 750,452 | $ | 619,735 | ||||||||
Gross margin: | ||||||||||||||||
East | 227,696 | 111,424 | 49,173 | 42,194 | ||||||||||||
West | 174,245 | 84,622 | 22,976 | 20,071 | ||||||||||||
Canada | 89,423 | 104,405 | 69,250 | 70,326 | ||||||||||||
Mortgage Operations | 13,925 | 10,595 | 4,084 | 1,659 | ||||||||||||
|
|
|
|
|
|
|
| |||||||||
Total gross margin | $ | 505,289 | $ | 311,046 | $ | 145,483 | $ | 134,250 | ||||||||
Corporate and unallocated expenses (1) | (233,591 | ) | (141,351 | ) | (69,199 | ) | (75,869 | ) | ||||||||
Equity in income of unconsolidated entities | 37,563 | 22,964 | 5,247 | 2,803 | ||||||||||||
Indemnification and transaction expenses | (199,119 | ) | (7,953 | ) | (39,442 | ) | - | |||||||||
Loss on extinguishment of debt | (10,141 | ) | (13,034 | ) | (12,850 | ) | - | |||||||||
Interest and other (expense) income | (2,065 | ) | (1,121 | ) | 1,559 | 9,717 | ||||||||||
|
|
|
|
|
|
|
| |||||||||
Income before income taxes | $ | 97,936 | $ | 170,551 | $ | 30,798 | $ | 70,901 | ||||||||
|
|
|
|
|
|
|
| |||||||||
| (1) | Represents sales, commissions and other marketing costs, and general and administrative expenses which do not have a readily determinable metric to allocate to the segments |
119
| Year Ended December 31, 2013 | ||||||||||||||||||||
| East | West | Canada | Mortgage Operations (1) | Total | ||||||||||||||||
Gross margin | $ | 227,696 | $ | 174,245 | $ | 89,423 | $ | 13,925 | $ | 505,289 | ||||||||||
Add back interest amortized to cost of revenue | 15,941 | 18,952 | 16,077 | - | 50,970 | |||||||||||||||
|
|
|
|
|
|
|
|
|
| |||||||||||
Adjusted gross margin | $ | 243,637 | $ | 193,197 | $ | 105,500 | $ | 13,925 | $ | 556,259 | ||||||||||
|
|
|
|
|
|
|
|
|
| |||||||||||
| (1) | Adjusted mortgage operations gross margin is calculated by adding back impairment charges attributable to the write-down of loans receivable. No adjustments were made to mortgage operation gross margins in the period presented because no impairments occurred. |
| Year Ended December 31, 2012 | ||||||||||||||||||||
| East | West | Canada | Mortgage Operations (1) | Total | ||||||||||||||||
Gross margin | $ | 111,424 | $ | 84,622 | $ | 104,405 | $ | 10,595 | $ | 311,046 | ||||||||||
Add back interest amortized to cost of revenue | 10,906 | 9,506 | 9,904 | - | 30,316 | |||||||||||||||
|
|
|
|
|
|
|
|
|
| |||||||||||
Adjusted gross margin | $ | 122,330 | $ | 94,128 | $ | 114,309 | $ | 10,595 | $ | 341,362 | ||||||||||
|
|
|
|
|
|
|
|
|
| |||||||||||
| (1) | Adjusted mortgage operations gross margin is calculated by adding back impairment charges attributable to the write-down of loans receivable. No adjustments were made to mortgage operation gross margins in the period presented because no impairments occurred. |
| For the Period From July 13 Through December 31, 2011 | ||||||||||||||||||||
| East | West | Canada | Mortgage Operations (1) | Total | ||||||||||||||||
Gross margin | $ | 49,173 | $ | 22,976 | $ | 69,250 | $ | 4,084 | $ | 145,483 | ||||||||||
Add back interest amortized to cost of revenue | 3,097 | 1,895 | 5,122 | - | 10,114 | |||||||||||||||
|
|
|
|
|
|
|
|
|
| |||||||||||
Adjusted gross margin | $ | 52,270 | $ | 24,871 | $ | 74,372 | $ | 4,084 | $ | 155,597 | ||||||||||
|
|
|
|
|
|
|
|
|
| |||||||||||
| (1) | Adjusted mortgage operations gross margin is calculated by adding back impairment charges attributable to the write-down of loans receivable. No adjustments were made to mortgage operation gross margins in the period presented because no impairments occurred. |
| For the Period From January 1 Through July 12, 2011 | ||||||||||||||||||||
| East | West | Canada | Mortgage Operations (1) | Total | ||||||||||||||||
Gross margin | $ | 42,194 | $ | 20,071 | $ | 70,326 | $ | 1,659 | $ | 134,250 | ||||||||||
Add back interest amortized to cost of revenue | 7,744 | 10,854 | 824 | - | 19,422 | |||||||||||||||
|
|
|
|
|
|
|
|
|
| |||||||||||
Adjusted gross margin | $ | 49,938 | $ | 30,925 | $ | 71,150 | $ | 1,659 | $ | 153,672 | ||||||||||
|
|
|
|
|
|
|
|
|
| |||||||||||
| (1) | Adjusted mortgage operations gross margin is calculated by adding back impairment charges attributable to the write-down of loans receivable. No adjustments were made to mortgage operation gross margins in the period presented because no impairments occurred. |
| As of December 31, 2013 | ||||||||||||||||||||||||
| East | West | Canada | Mortgage Operations | Corporate and Unallocated | Total | |||||||||||||||||||
Real estate inventory and land deposits | $ | 1,048,091 | $ | 1,002,500 | $ | 255,487 | $ | - | $ | - | $ | 2,306,078 | ||||||||||||
Investments in unconsolidated entities | 20,191 | - | 118,115 | 1,244 | - | 139,550 | ||||||||||||||||||
Other assets | 103,107 | 27,842 | 289,527 | 110,004 | 462,450 | 992,930 | ||||||||||||||||||
|
|
|
|
|
|
|
|
|
|
|
| |||||||||||||
Total assets | $ | 1,171,389 | $ | 1,030,342 | $ | 663,129 | $ | 111,248 | $ | 462,450 | $ | 3,438,558 | ||||||||||||
|
|
|
|
|
|
|
|
|
|
|
| |||||||||||||
120
| As of December 31, 2012 | ||||||||||||||||||||||||
| East | West | Canada | Mortgage Operations | Corporate and Unallocated | Total | |||||||||||||||||||
Real estate inventory and land deposits | $ | 741,911 | $ | 647,877 | $ | 243,123 | $ | - | $ | - | $ | 1,632,911 | ||||||||||||
Investments in unconsolidated entities | 723 | - | 73,210 | 532 | - | 74,465 | ||||||||||||||||||
Other assets | 109,531 | 22,069 | 315,436 | 100,200 | 483,364 | 1,030,600 | ||||||||||||||||||
|
|
|
|
|
|
|
|
|
|
|
| |||||||||||||
Total assets | $ | 852,245 | $ | 669,946 | $ | 631,769 | $ | 100,732 | $ | 483,364 | $ | 2,738,056 | ||||||||||||
|
|
|
|
|
|
|
|
|
|
|
| |||||||||||||
16. CAPITAL STRUCTURE
Capital Structure prior to the Company's Reorganization on April 9, 2013 and IPO on April 10, 2013:
On July 13, 2011, TMM Holdings, a partnership in which the Principal Equityholders were the equity investors, acquired TMC and Monarch from Taylor Wimpey plc, a United Kingdom publicly listed company. The Acquisition was funded by an approximately $625.0 million Sponsor Loan and $620.3 million in equity contributions to TMM Holdings. In August 2011, $125.0 million of the Sponsor Loan was repaid. Certain members of management contributed approximately $3.3 million in equity to TMM Holdings in the Acquisition. Following the Acquisition, TMM Holdings had 623,619,973 Class A Units held by the limited partners. Also as part of the Acquisition and in addition to Class A Units, JH received 30,265,998 Class J-1 Units, 15,133,000 Class J-2 Units, and 15,133,000 Class J-3 Units (collectively, the "Class J Units"). TMM Holdings did not realize any proceeds relating to the issuance of the Class J Units, which were issued in consideration for services to be provided by the holders of such Units. TMM Holdings GP, Inc., ("General Partner") a British Columbia corporation formed in 2011, was the general partner of TMM Holdings.
On April 13, 2012, the Bond Co-Issuers issued $550.0 million of 2020 Senior Notes at an initial offering price of 100.0% of the principal amount. The net proceeds from the sale of the 2020 Senior Notes were $537.4 million, net of debt issuance costs of $12.6 million, were used, in part, to repay $350.0 million of the Sponsor Loan. The remaining $150.0 million of the Sponsor Loan was acquired by a subsidiary of the Bond Co-issuers, and the Principal Equityholders acquired an additional 136,363,636 Class A Units in TMM Holdings for $150.0 million. As part of the new equity issuance, the same members of management who initially invested in Class A Units at the Acquisition were given the opportunity to purchase additional Class A Units in TMM Holdings, and certain of those members of management elected to purchase an aggregate of 462,142 additional Class A Units in TMM Holdings, which were issued for proceeds of approximately $0.5 million.
TMM Holdings also issued Class M Units in TMM Holdings to certain members of management as equity compensation, subject to time and performance vesting conditions, as discussed below. Subsequent to the IPO, no additional Class M Units in TMM Holdings will be awarded. During 2012, two members of the Board of Directors purchased 1,727,273 Class A Units in TMM Holdings for $1.9 million.
Equity-Based Compensation - Class M Units
TMM Holdings Class M Units were issued as long-term incentive compensation to management and independent members of the Board of Directors. In addition, TMM Holdings issued phantom Class M Units to certain employees who resided in Canada, which were treated as Class M Units for purposes of this description and the financial statements.
The Class M Units in TMM Holdings had certain time vesting and performance based vesting provisions, as more precisely defined in the grant agreements. Generally, 5/7 or 71.4% of the Class M Units were designated as Time Vesting Units and vested at the rate of twenty percent (20%) on each of the first, second, third, fourth and fifth anniversaries of the grant date. For the purposes of calculating periodic equity-based compensation expense, a five-year requisite service period had been assumed for the Time Vesting Units and expense was recognized using the straight-line allocation method. In addition, upon termination of a participant for any reason other than cause or upon resignation for good reason within the 24 month period following a change in control, all the then outstanding unvested Time Vesting Units were to immediately became vested upon such termination. The remaining 2/7 or 28.6% of the Class M Units that
121
were designated as Performance Vesting Units vested 50% upon a 2.0x cash return on capital contributed by the Principal Equityholders and the remaining 50% upon a 2.5x return on capital contributed by the Principal Equityholders. Prior to the IPO, the performance conditions were not expected to be met.
Equity-Based Awards to Non-Employees - Class J Units
TMM Holdings issued Class J Units as awards to non-employees for services rendered to TMM Holdings. The Class J Units were subject to the participation preferences and other rights of the Class A Units and Class M Units as described in this note along with time and performance metrics that had not been met as of the time of the IPO. No Class J Units vested. Had these metrics been achieved and vesting occurred, the Company would have recorded an expense related to the value of the Class J Units.
The Class M Units and Class J Units contained certain repurchase provisions that could result in an award being settled in cash in the event of certain types of termination scenarios. The Company established a policy that settlement would not occur until the point in time where the unit holder had borne sufficient risks and rewards of equity ownership, assumed as six-months and one-day after vesting.
Fair value
The Company accounts for equity-based compensation in accordance with the fair value provisions of ASC Topic 718 Compensation – Stock Compensation . Principles of option pricing theory were used to calculate the fair value of the subject grants. Under this methodology, the various classes of TMM Holdings Units are modeled as call options with distinct claims on the assets of TMM Holdings. The characteristics of the Unit classes, as determined by the unit agreements and the TMM Holdings limited partnership agreement, determined the uniqueness of each Unit's claim on TMM Holdings' assets relative to each other and the other components of TMM Holdings' capital structure. Periodic valuations were performed in order to properly recognize equity- based compensation expense in the accompanying Consolidated and Combined Statements of Operations as general and administrative expenses.
During 2012, the Company considered the following significant factors in preparing its business enterprise valuations:
| • | Additional capital contributions associated with the conversion of the Sponsor Loan to TMM Holdings Class A Units and associated management purchases of TMM Holdings Class A Units, discussed above; |
| • | Issuances of $675.0 million aggregate principal amount of 2020 Senior Notes; |
| • | Changes in multiples of book value of invested capital for the Company's comparable publicly-traded peers; |
| • | The state of the housing industry in general, including the timing of the housing industry recovery and the Company's view of the sustainability of any such recovery; |
| • | The Company's ability to access the debt and equity capital markets; |
| • | The Company's performance and results of operations and related indicators (including backlog); |
| • | Housing market conditions in the geographic areas in which the Company operated; |
| • | Changes in and uncertainties with respect to, regional, national and international economic conditions; and |
| • | The Company's ability to capitalize on any recovery in the housing industry. |
Capital structure after the Company's Reorganization on April 9, 2013 and IPO on April 10, 2013:
Initial public offering
On April 12, 2013, the Company completed its IPO of 32,857,800 shares of its Class A Common Stock, including 4,285,800 shares of Class A Common Stock sold in connection with the full exercise of the option to purchase additional shares granted to the underwriters, at a price to the public of $22.00 per share, resulting in net proceeds of $668.6 million to the Company. The shares began trading on the New York Stock Exchange on April 10, 2013 under the ticker symbol "TMHC." As a result of the completion of the IPO and the Reorganization Transactions (as defined below), the Company became the indirect parent of TMM Holdings.
122
Reorganization Transactions
In connection with the IPO, the Company completed a series of transactions on April 9, 2013 (the "Reorganization Transactions") pursuant to a Reorganization Agreement dated as of April 9, 2013 (the "Reorganization Agreement") among the Company, New TMM, other subsidiaries of TMHC, the Principal Equityholders, certain members of TMHC's management and its Board of Directors (the "Board"), TPG TMM Holdings II, L.P. (the "TPG Holding Vehicle"), OCM TMM Holdings II, L.P. (the "Oaktree Holding Vehicle" and, together with the TPG Holding Vehicle, the "TPG and Oaktree Holding Vehicles") and TMM Holdings. The Reorganization Agreement governs the terms of the Reorganization Transactions, which are described in TMHC's Registration Statement on Form S-1 filed with the SEC.
In the Reorganization Transactions, the existing holders of limited partnership interests in TMM Holdings, including the Principal Equityholders and certain members of TMHC's management and Board, through a series of transactions, contributed their limited partnership interests in TMM Holdings to a new limited partnership, New TMM, such that TMM Holdings and the general partner of TMM became wholly-owned subsidiaries of New TMM. TMHC, through a series of transactions, became the sole owner of the general partner of New TMM, and TMHC used a portion of the net cash proceeds received in the IPO to purchase New TMM Units from New TMM. See Use of Proceeds of the IPO below.
In the Reorganization Transactions:
| • | TPG and Oaktree each formed the TPG Holding Vehicle and the Oaktree Holding Vehicle, respectively; |
| • | The Principal Equityholders and members of TMHC's management and Board directly or indirectly exchanged all of their respective Class A Units, Class J Units and performance-vesting Class M Units in TMM Holdings on a one-for-one basis for new equity interests of the TPG and Oaktree Holding Vehicles with terms that are substantially the same as the Class A Units (other than certain Class A Units exchanged by JH as described below), Class J Units (other than with respect to certain vesting conditions) and performance-vesting Class M Units in TMM Holdings surrendered for exchange; |
| • | JH exchanged a portion of its Class A Units in TMM Holdings for New TMM Units to be held by JH; |
| • | Members of TMHC's management and Board exchanged all of their time-vesting Class M Units in TMM Holdings for New TMM Units with vesting terms that are substantially the same as those of the Class M Units surrendered for exchange; |
| • | New TMM directly or indirectly acquired all of the Class A Units, Class J Units and Class M Units outstanding prior to the Reorganization Transactions; and |
| • | The TPG and Oaktree Holding Vehicles directly or indirectly acquired New TMM Units. |
Immediately following the consummation of the Reorganization Transactions, the limited partners of New TMM consisted of the Company, the TPG Holding Vehicle, the Oaktree Holding Vehicle, JH and certain members of the Company's management and Board. The number of New TMM Units issued to each of the TPG and Oaktree Holding Vehicles, JH and members of the Company's management and Board as described above was determined based on a hypothetical cash distribution by TMM Holdings of the Company's pre-IPO value to the holders of Class A Units, Class J Units and Class M Units of TMM Holdings, the IPO and the price per share paid by the underwriters for shares of Class A Common Stock in the IPO, resulting in the issuance of 112,784,964 New TMM Units and a corresponding number of shares of the Company's Class B Common Stock.
In connection with the Reorganization Transactions, the TPG and Oaktree Holding Vehicles, JH and members of the Company's management and Board were also issued a number of shares of the Company's Class B Common Stock equal to the number of New TMM Units that each received. One share of Class B Common Stock, together with one new TMM Unit is exchangeable into a share of Class A Common Stock.
Use of Proceeds of the IPO - The net proceeds from the sale of 32,857,800 shares of its Class A Common Stock in the IPO were $668.6 million after deducting underwriting discounts and commissions and offering costs.
123
The Company used $204.2 million of the net proceeds of the IPO to acquire New TMM Units from New TMM (at a price equal to the price paid by the underwriters for shares of Class A Common Stock in the IPO). New TMM contributed such net proceeds to TMM, which then contributed such proceeds to the Bond Co-Issuers to redeem $189.6 million aggregate principal amount of 2020 Senior Notes (at a purchase price equal to 103.875% of their principal amount, plus accrued and unpaid interest of $7.3 million through the date of redemption). The Company used the remaining $464.4 million of the net proceeds from the IPO, together with $18.1 million of cash on hand to purchase 23,333,800 New TMM Units (at a price equal to the price paid by the underwriters for shares of the Company's Class A Common Stock) held by the TPG and Oaktree Holding Vehicles, JH and certain members of the Company's management and to pay the $10.9 million of offering expenses related to the IPO.
A summary of the use of the IPO proceeds follows (in thousands):
| Use of Proceeds | ||||
Proceeds from sale of Class A Common Stock | $ | 722,872 | ||
Underwriting discounts and commissions | (43,372 | ) | ||
Offering expenses | (10,902 | ) | ||
|
| |||
Net proceeds | $ | 668,598 | ||
Purchase of New TMM Units and corresponding shares of Class B Common Stock | (482,543 | ) | ||
Principal and premium payment on 2020 Senior Notes | (204,180 | ) | ||
Cash on hand | 18,125 | |||
|
| |||
| $ | - | |||
|
| |||
Because the Company purchased New TMM Units at a valuation in excess of the proportion of the book value of net assets acquired, the Company incurred an immediate dilution of $297.6 million, which is calculated as the net proceeds used by the Company to purchase New TMM Units of $668.6 million less the book value of such interests of $371.0 million. This dilution is reflected within the Company's APIC as a reallocation from APIC to non-controlling interests - Principal Equityholders in the accompanying Consolidated and Combined Statements of Shareholders' Equity.
Impact to Quarterly Information Previously Filed - The previously filed Consolidated Statements of Stockholders' Equity for the six and nine months ended June 30, 2013 and September 30, 2013 did not reflect the $297.6 million re-allocation between APIC and non-controlling interest - Principal Equityholders. The impact of this error to the previously issued financial statements is a decrease in APIC and a corresponding equivalent increase to non-controlling interest - Principal Equityholders of $297.6 million for both periods. There would be no impact on the total balance of equity, share counts or previously reported earnings per share and it is not material to our previously issued consolidated financial statements.
Capital Stock - Under its amended and restated Certificate of Incorporation, The Company's authorized capital stock consists of 400,000,000 shares of Class A Common Stock, 200,000,000 shares of Class B Common Stock, and 50,000,000 shares of preferred stock, par value $0.00001 per share.
Holders of Class A Common Stock and Class B Common Stock are entitled to one vote for each share held on all matters submitted to stockholders for their vote or approval. The holders of Class A Common Stock and Class B Common Stock vote together as a single class on all matters submitted to stockholders for their vote or approval, except with respect to the amendment of certain provisions of the amended and restated Certificate of Incorporation that would alter or change the powers, preferences or special rights of the Class B Common Stock so as to affect them adversely, which amendments must be approved by a majority of the votes entitled to be cast by the holders of the shares affected by the amendment, voting as a separate class, or as otherwise required by applicable law. The voting power of the outstanding Class B Common Stock (expressed as a percentage of the total voting power of all common stock) is equal to the percentage of partnership interests in TMM Holdings not held directly or indirectly by the Company.
124
Equity-Based Compensation - Class M
Units of Holding Vehicles - The Principal Equityholders and members of the Company's management and Board directly or indirectly exchanged all of their performance-vesting Class M Units in TMM Holdings on a one-for-one basis for new equity interests of the TPG and Oaktree Holding Vehicles with terms that are substantially the same ("Holding Vehicle Performance Units").
No Performance Vesting Class M Units vested prior to the IPO. Concurrent with the IPO in the second quarter of 2013, the Company determined that it was probable that the performance conditions for the 752,782 Holding Vehicle Performance Units outstanding would be met. Consequently, the Company recorded the $2.8 million grant date fair value related to those Holding Vehicle Performance Units as general and administrative expenses in the accompanying Consolidated and Combined Statements of Operations.
Members of the Company's management and Board exchanged all of their time-vesting Class M Units in TMM Holdings for New TMM Units with vesting terms that are substantially the same as those of the Class M Units surrendered for exchange.
As of December 31, 2013 and December 31, 2012 there were 764,751 and 525,188, respectively, time vesting New TMM Units vested. The corresponding amount of the Company's Class B Common Stock is included in the 89,451,164 shares of Class B common stock outstanding as of December 31, 2013.
The following is a summary of the activity for the time-vesting New TMM Units issued to members of management and the Board of Directors:
| Number of Awards | Weighted Average Grant Date Fair Value | |||||||
As of January 1, 2013 (1) | 1,812,099 | $ | 4.90 | |||||
Paid out in connection with the IPO | (156,630 | ) | 3.64 | |||||
|
| |||||||
As of December 31, 2013 | 1,655,469 | $ | 5.02 | |||||
|
| |||||||
| (1) | Reflects time vesting units in TMM. |
As of December 31, 2013, of the 1,655,469 awards, there were 890,719 New TMM Units outstanding and unvested, which have an aggregate grant date fair value of $5.0 million. Unamortized compensation expense of $5.2 million for those units is expected to be recorded over a weighted average period of 3.2 years. Compensation expense for the year ended December 31, 2013 was $1.5 million, and for the year ended December 31, 2012 was $2.0 million, and is recorded in general and administrative expenses.
There are no remaining unissued Class M Unit awards under the Class M Unit Plan and the Company does not intend to grant any future awards under the Class M Unit Plan. The Company intends to terminate the Class M Unit Plan.
Equity-Based Awards to Non-Employees-Class J Units of Holding Vehicles - The JH Entities directly or indirectly exchanged all of their respective Class J Units in TMM Holdings on a one-for-one basis for new equity interests of the TPG and Oaktree Holding Vehicles with terms that are substantially the same (other than with respect to certain vesting conditions).
No Performance Class J Units vested prior to the IPO. In connection with the Reorganization Transactions prior to the IPO, the JHI Management Services Agreement ("the JHI Services Agreement") between JH and TMM Holdings was terminated, resulting in a modification to the vesting conditions of the 5,014,426 New TMM Units that resulted in the removal of a service vesting condition. Consequently, the Company recorded an $80.2 million non-cash charge related to those units as Transaction Expenses. A corresponding number of Class B Common Stock is included in the 89,451,164 shares of Class B Common Stock outstanding at December 31, 2013.
125
Stock-Based Compensation - In April 2013, the Company adopted the Taylor Morrison Home Corporation 2013 Omnibus Equity Award Plan (the "Plan"). The Plan provides for the grant of stock options, restricted stock units, and other awards based on the Company's common stock. As of December 31, 2013 the maximum number of shares of the Company's Class A Common Stock that may be subject to awards under the Plan is 7,956,955, subject to adjustment in accordance with the terms of the Plan. The Company had an aggregate of 6,517,310 shares of Common Stock available for future grants under the Plan at December 31, 2013.
Stock Options - Options under the Plan granted in connection with the Company's IPO vest and become exercisable ratably on the second, third, fourth and fifth anniversary of the date of grant. The majority of options granted in the periods subsequent to the IPO vest and become exercisable ratably on the first, second and third anniversary of the date of grant. Vesting of the options is subject to continued employment on the applicable vesting dates, and expires within ten years from the date of grant. The following table summarizes stock option activity for the Plan:
| Shares | Weighted Average Exercise Price Per Share | Weighted Average Remaining Contractual Life (In Years) | Aggregate Intrinsic Value (1) (in thousands) | |||||||||||||
Outstanding at January 1, 2013 | - | $ | - | |||||||||||||
Granted | 1,380,829 | 22.41 | ||||||||||||||
Exercised | - | - | ||||||||||||||
Cancelled | (130,000 | ) | 22.00 | |||||||||||||
|
| |||||||||||||||
Outstanding at December 31, 2013 | 1,250,829 | $ | 22.45 | 9.3 | $ | 520 | ||||||||||
|
| |||||||||||||||
Vested and exercisable at the end of the period | - | $ | - | - | $ | - | ||||||||||
|
| |||||||||||||||
| (1) | The aggregate intrinsic value is based on the market price of the Company's Common Stock on December 30, 2013, the last trading day in December 2013, which was $22.13, less the applicable exercise price of the underlying option. This aggregate intrinsic value represents the amount that would have been realized if all the option holders had exercised their options on December 31, 2013. |
The fair value of each option granted is estimated on the date of grant using the Black-Scholes option pricing model considering the weighted average assumptions noted in the following table. Expected volatilities are based on the historical stock price volatility of five comparable publicly traded home builders. Expected term, which represents the period of time that options granted are expected to be outstanding, is estimated using expected term data disclosed by five comparable publicly traded home builders. Due to the limited number and homogeneous nature of option holders, the expected term was evaluated using a single group. The risk-free rate is based on the U.S. Treasury yield curve for periods equivalent to the expected term of the options on the grant date.
| Year Ended December 31, 2013 | ||||
Expected dividend yield | 0.0 | % | ||
Expected volatility | 56.59 | % | ||
Risk-free interest rate | 0.54 | % | ||
Expected term (years) | 4.28 | |||
Weighted average fair value of options granted during the year | $ | 11.57 | ||
As of December 31, 2013 approximately $12.4 million of unrecognized stock based compensation related to unvested stock options (net of estimated forfeitures) is expected to be recognized over a weighted average period of 4.3 years.
Restricted Stock Units - The Company's Restricted Stock Units ("RSUs") consist of shares of the Company's Class A Common Stock that have been awarded to employees and directors of the Company. The RSUs granted in connection with the IPO shall become vested with respect to 25% of the RSUs on each of the first four anniversaries of the grant date; provided, that, if the performance condition has not been met as of any such annual vesting date, then such portion
126
of the RSUs shall continue to have the opportunity to become vested with respect to the performance condition on such subsequent date on which the performance condition is first satisfied. The "performance condition" shall be satisfied only if the weighted average price (after reduction for underwriting discount and commissions) at which the TPG and Oaktree holding vehicles have actually sold their New TMM Units or related shares of Class A Common Stock, exceeds the $22.00 price per share of the Company's Class A Common Stock paid by the public in the Company's IPO, it being understood that (i) all sales by the Principal Equityholders through December 31, 2015 will be included (including sales of New TMM Units as part of the synthetic secondary component of the IPO) and (ii) the "performance condition" will be satisfied the first time prior to December 31, 2015 that the weighted-average price per New TMM Unit (or related share of the Company's Class A Common Stock) actually sold by the TPG and Oaktree Holding Vehicles, after reduction for underwriting discount and commissions, exceeds the applicable threshold. If the performance condition has not been met as of December 31, 2015, all of the RSUs being granted subject to the performance condition shall be automatically forfeited without consideration and are of no further force or effect. As these awards contained both service and market performance conditions, the Company has recorded the compensation expense related to these awards over the service period as that condition is longer than the market performance condition. Most of the restricted stock units granted in the periods subsequent to the IPO will become fully vested on the first anniversary of the grant date. The following table summarizes the activity of the Company's RSUs:
| Shares | Weighted Average Grant Date Fair Value | |||||||
Balance at January 1, 2013 | - | $ | - | |||||
Granted | 200,846 | 24.15 | ||||||
Vested | - | - | ||||||
Forfeited | (12,030 | ) | 24.30 | |||||
|
| |||||||
Balance at December 31, 2013 | 188,816 | $ | 24.14 | |||||
|
| |||||||
As of December 31, 2013, approximately $3.7 million of unrecognized stock-based compensation expense related to unvested RSUs, net of estimated forfeitures, is expected to be recognized over a weighted-average period of approximately 3.3 years.
Summary of Stock-Based Compensation Expense
The following table summarizes the components and classification of stock-based compensation expense (in thousands), which is included in general and administrative expenses in the accompanying Consolidated and Combined Statements of Operations:
| Year Ended December 31, | ||||||||
| 2013 | 2012 | |||||||
M Units | $ | 4,270 | $ | 1,975 | ||||
J Units | 80,190 | - | ||||||
Stock options | 2,043 | - | ||||||
Restricted stock | 815 | - | ||||||
|
|
|
| |||||
Total stock compensation | $ | 87,318 | $ | 1,975 | ||||
|
|
|
| |||||
Tax benefits attributable to stock-based compensation represented 38.5% of stock-based compensation expense.
127
17. SELECTED QUARTERLY FINANCIAL DATA (UNAUDITED)
Quarterly results are as follows (in thousands, except per share data):
| First Quarter 2013 | Second Quarter 2013 | Third Quarter 2013 | Fourth Quarter 2013 | |||||||||||||
Total revenue | $ | 381,512 | $ | 508,865 | $ | 634,441 | $ | 798,419 | ||||||||
Gross margin | 81,546 | 104,940 | 134,223 | 184,580 | ||||||||||||
Income before income taxes | 39,872 | (147,783 | ) | 84,307 | 121,540 | |||||||||||
Income before non-controlling interests, net of tax | 24,337 | (78,287 | ) | 52,632 | 96,186 | |||||||||||
Net income available to the Company | - | 5,327 | 14,263 | 25,830 | ||||||||||||
Basic and diluted earnings per share | N/A | $ | 0.16 | $ | 0.43 | $ | 0.79 | |||||||||
| First Quarter 2012 | Second Quarter 2012 | Third Quarter, 2012 | Fourth Quarter 2012 | |||||||||||||
Total revenue | $ | 239,426 | $ | 318,147 | $ | 321,455 | $ | 556,693 | ||||||||
Gross margin | 43,798 | 61,872 | 74,154 | 131,222 | ||||||||||||
Income before income taxes | 16,057 | 18,660 | 44,022 | 91,812 | ||||||||||||
Income before non-controlling interests, net of tax | 10,559 | 28,834 | 42,436 | 349,019 | (1) | |||||||||||
Net income available to the Company | 10,297 | 28,858 | 42,602 | 349,063 | (1) | |||||||||||
| (1) | The Company recorded a net tax benefit of $257.2 million in the fourth quarter of 2012 from the reversal of a deferred tax asset valuation allowance. See Note 11 - Income Taxes , for additional information. |
Correction to Quarterly Information Previously Filed - The previously filed Consolidated Statement of Stockholders' Equity as of June 30, 2013 and September 30, 2013 did not reflect the $297.6 million reallocation between Additional Paid-in Capital and Non Controlling Interest - Principal Equityholders as described in Note 16 - Capital Structure . For additional details see Note 16 - Capital Structure - Impact to Quarterly Information Previously Filed.
18. COMMITMENTS AND CONTINGENCIES
Letters of Credit and Surety Bonds - The Company is committed, under various letters of credit and surety bonds, to perform certain development and construction activities and provide certain guarantees in the normal course of business. Outstanding letters of credit and surety bonds under these arrangements, including the Company's share of responsibility for arrangements with our joint ventures, totaled $212.2 million and $230.8 million as of December 31, 2013 and 2012, respectively. Although significant development and construction activities have been completed related to these site improvements, the bonds are generally not released until all development and construction activities are completed. The Company does not believe that it is probable that any outstanding bonds as of December 31, 2013, will be drawn upon.
Purchase Commitments - The Company is subject to the usual obligations associated with entering into contracts (including option contracts) for the purchase, development, and sale of real estate in the routine conduct of its business. The Company has a number of land purchase option contracts, generally through cash deposits or letters of credit, for the right to purchase land or lots at a future point in time with predetermined terms. The Company does not have title to the property and the creditors generally have no recourse against it except in Canada where sellers have full recourse under statutory regulations. The Company's obligations with respect to the option contracts are generally limited to the forfeiture of the related non-refundable cash deposits and/or letters of credit. At December 31, 2013 and 2012, the Company had the right to purchase approximately 6,570 and 5,013 lots under land option and land purchase contracts, respectively, which represents an aggregate purchase price of $500.9 million and $268.0 million at December 31, 2013 and 2012, respectively. At December 31, 2013, the Company had $43.7 million in land deposits and $14.9 million in letters of credit related to land options and land purchase contracts, respectively. At December 31, 2012, the Company had $28.7 million in land deposits and $0.2 million in letters of credit related to land options and land purchase contracts.
128
Legal Proceedings - The Company is involved in various litigation and legal claims in the normal course of its business operations, including actions brought on behalf of various classes of claimants. The Company is also subject to a variety of local, state, and federal laws and regulations related to land development activities, house construction standards, sales practices, mortgage lending operations, employment practices, and protection of the environment. As a result, the Company is subject to periodic examination or inquiry by various governmental agencies that administer these laws and regulations.
The Company establishes liabilities for legal claims and regulatory matters when such matters are both probable of occurring and any potential loss is reasonably estimable. At December 31, 2013 and December 31, 2012, the Company's legal accruals were $4.9 million and $7.5 million, respectively. The Company accrues for such matters based on the facts and circumstances specific to each matter and revises these estimates as the matters evolve. In such cases, there may exist an exposure to loss in excess of any amounts currently accrued. In view of the inherent difficulty of predicting the outcome of these legal and regulatory matters, the Company generally cannot predict the ultimate resolution of the pending matters, the related timing, or the eventual loss. While the outcome of such contingencies cannot be predicted with certainty, the Company does not believe that the resolution of such matters will have a material adverse impact on its results of operations, financial position, or cash flows. However, to the extent the liability arising from the ultimate resolution of any matter exceeds the estimates reflected in the recorded reserves relating to such matter, the Company could incur additional charges that could be significant.
Operating Leases - The Company leases office facilities and certain equipment under operating lease agreements. In most cases, the Company expects that, in the normal course of business, leases that expire will be renewed or replaced by other leases. Approximate future minimum payments under the non-cancelable leases in effect at December 31, 2013, are as follows (in thousands):
| Years Ending December 31, | Lease Payments | |||
2014………………………………………………………………………. | $ | 6,371 | ||
2015………………………………………………………………………. | 6,407 | |||
2016………………………………………………………………………. | 5,086 | |||
2017………………………………………………………………………. | 3,861 | |||
2018………………………………………………………………………. | 1,966 | |||
Thereafter………………………………………………………………… | 1,209 | |||
|
| |||
Total………………………………………………………………………. | $ | 24,900 | ||
|
| |||
Rent expense under non-cancelable operating leases for the year ended December 31, 2013, the year ended December 31, 2012, the period from July 13, 2011 through December 31, 2011, and for the period from January 1, 2011 through July 12, 2011, was $4.9 million, $3.8 million, $1.6 million, and $2.0 million, respectively, and is included in general and administrative expenses or sales commissions and other marketing costs in the accompanying Consolidated and Combined Statements of Operations.
Sublease income under non-cancelable operating leases for the year ended December 31, 2013, the year ended December 31, 2012, the period from July 13, 2011 through December 31, 2011, and the period from January 1, 2011 through July 12, 2011, was $0.4 million, $0.5 million, $0.5 million, and $0.5 million, respectively, and is included in general and administrative expenses or sales, commissions and other marketing costs in the accompanying Consolidated and Combined Statements of Operations. Total sublease income to be received in years subsequent to December 31, 2013, is $0.1 million.
19. SUBSEQUENT EVENTS
On January 15, 2014, TMC and various other subsidiaries of TMHC entered into Amendment No. 1 to the Restated Revolving Credit Facility. This Amendment No. 1 released Monarch from all of its obligations under the Restated Revolving Credit Facility. As a result, the only borrower under the Restated Revolving Credit Facility is TMC.
129
| ITEM 9. | CHANGES IN AND DISAGREEMENTS WITH ACCOUNTANTS ON ACCOUNTING AND FINANCIAL DISCLOSURE |
None.
| ITEM 9A. | CONTROLS AND PROCEDURES |
Disclosure Controls and Procedures
Under the supervision and with the participation of our Chief Executive Officer and Chief Financial Officer, management has evaluated the effectiveness of the design and operation of our disclosure controls and procedures (as defined in Rules 13a-15(e) or 15d-15(e) of the Exchange Act) as of December 31, 2013. Based upon that evaluation, our Chief Executive Officer and Chief Financial Officer concluded that, our disclosure controls and procedures are effective to ensure information is recorded, processed, summarized and reported within the periods specified in the Securities and Exchange Commission's rules and forms and is accumulated and communicated to our management, including our Chief Executive Officer and Chief Financial Officer, as appropriate to allow timely decisions regarding required disclosure.
Our management, including our Chief Executive Officer and Chief Financial Officer, does not expect that our disclosure controls and procedures will prevent all errors and all fraud. A control system, no matter how well conceived and operated, can provide only reasonable, not absolute, assurance that the objectives of the control system are met. Further, the design of a control system must reflect the fact that there are resource constraints, and the benefits of controls must be considered relative to their costs. Because of the inherent limitations in all control systems, no evaluation of controls can provide absolute assurance that all control issues and instances of fraud, if any, have been detected. These inherent limitations include the realities that judgments in decision-making can be faulty and that breakdowns can occur because of simple error and mistake. Additionally, controls can be circumvented by the individual acts of some persons, by collusion of two or more people or by management override of controls.
The design of any system of controls also is based in part upon certain assumptions about the likelihood of future events, and there can be no assurance that any design will succeed in achieving its stated goals under all potential future conditions. Over time, a control may become inadequate because of changes in conditions or because the degree of compliance with the policies or procedures may deteriorate. Because of the inherent limitations in a cost-effective control system, misstatements due to error or fraud may occur and may not be detected.
Management's Annual Report on Internal Control Over Financial Reporting
This Annual Report does not include a report of management's assessment regarding internal control over financial reporting or an attestation report of the Company's independent registered public accounting firm due to a transition period established by rules of the SEC for newly public companies.
Changes in Internal Controls
No change in our internal control over financial reporting as such term is defined in Exchange Act Rule 13a-15(f) occurred during the year ended December 31, 2013 that has materially affected, or is reasonably likely to materially affect, our internal control over financial reporting.
| ITEM 9B. | OTHER INFORMATION |
None.
130
PART III
| ITEM 10. | DIRECTORS, EXECUTIVE OFFICERS AND CORPORATE GOVERNANCE |
The information required by Items 401, 405, 406 and 407(c)(3), (d)(4) and (d)(5) of Regulation S-K will be set forth in our 2014 Annual Meeting Proxy Statement, which will be filed with the Securities and Exchange Commission not later than 120 days after December 31, 2013 (the "Proxy Statement"). For the limited purpose of providing the information necessary to comply with this Item 10, the Proxy Statement is incorporated herein by this reference. All references to the Proxy Statement in this Part III are exclusive of the information set forth under the captions "Compensation Committee Report" and "Audit Committee Report."
| ITEM 11. | EXECUTIVE COMPENSATION |
The information required by Items 402 and 407(e)(4) and (e)(5) of Regulation S-K will be set forth in the Proxy Statement. For the limited purpose of providing the information necessary to comply with this Item 11, the Proxy Statement is incorporated herein by this reference.
| ITEM 12. | SECURITY OWNERSHIP OF CERTAIN BENEFICIAL OWNERS AND MANAGEMENT AND RELATED STOCKHOLDER MATTERS |
Securities Authorized for Issuance under Equity Compensation Plans
Equity Compensation Plan Information
The following table provides information with respect to the Taylor Morrison Home Corporation 2013 Omnibus Equity Award Plan (the "2013 Equity Plan") under which our equity securities are authorized for issuance as of December 31, 2013.
Plan Category | Number of securities to be issued upon exercise of outstanding options, warrants and rights (a) | Weighted- average exercise price of outstanding options, warrants and rights (b) | Number of securities remaining available for future issuance under equity compensation plans excluding securities reflected in column (a)) (c) | |||||||||
Equity compensation plans approved by security holders (1) | 1,439,645 | $ | 22.45 | (2) | 6,517,310 | (3) | ||||||
Equity compensation plans not approved by security holders | - | - | - | |||||||||
| (1) | Equity compensation plans approved by security holders covers the 2013 Equity Plan. The 2013 Equity Plan is currently our only compensation plan pursuant to which our equity is awarded. This figure does not include the 1,655,469 New TMM Units (and the corresponding shares of our Class B Common Stock) that can be exchanged on a one-for-one basis for shares of our Class A Common Stock. The New TMM Units were issued pursuant to the TMM Holdings II Limited Partnership 2013 Common Unit Plan and were not made pursuant to any equity compensation plan. |
| (2) | Column (a) includes 188,816 shares of our Class A Common Stock underlying outstanding restricted stock units. Because there is no exercise price associated with restricted stock units, such equity awards are not include in the weighted-average exercise price calculation in column (b). |
| (3) | A total of 7,956,955 shares of our Class A Common Stock have been authorized for issuance pursuant to the terms of the 2013 Equity Plan. |
The information required by Item 403 of Regulation S-K will be set forth in the Proxy Statement. For the limited purpose of providing the information necessary to comply with this Item 12, the Proxy Statement is incorporated herein by this reference.
131
| ITEM 13. | CERTAIN RELATIONSHIPS AND RELATED TRANSACTIONS, AND DIRECTOR INDEPENDENCE |
The information required by Items 404 and 407(a) of Regulation S-K will be set forth in the Proxy Statement. For the limited purpose of providing the information necessary to comply with this Item 13, the Proxy Statement is incorporated herein by this reference.
| ITEM 14. | PRINCIPAL ACCOUNTING FEES AND SERVICES |
This information required by Item 9(e) of Schedule 14A will be set forth in the Proxy Statement. For the limited purpose of providing the information necessary to comply with this Item 14, the Proxy Statement is incorporated herein by this reference.
| ITEM 15. | EXHIBITS AND FINANCIAL STATEMENT SCHEDULES |
Exhibit | Description | |
| 3.1 | Amended and Restated Certificate of Incorporation (included as Exhibit 3.1 to the Company's Current Report on Form 8-K, filed on April 15, 2013, and incorporated herein by reference). | |
| 3.2 | Amended and Restated By-laws (included as Exhibit 3.2 to the Company's Current Report on Form 8-K, filed on April 15, 2013, and incorporated herein by reference). | |
| 4.1 | Indenture, dated as of April 16, 2013, relating to Taylor Morrison Communities, Inc.'s and Monarch Communities Inc.'s 5.25% Senior Notes due 2021 by and among Taylor Morrison Communities Inc., Monarch Communities Inc. and Wells Fargo Bank, National Association (included as Exhibit 4.1 to the Company's Quarterly Report on Form 10-Q for the quarter ended June 30, 2013). | |
| 4.2 | Indenture, dated as of April 13, 2012, relating to Taylor Morrison Communities, Inc.'s and Monarch Communities Inc.'s 7.750% Senior Notes due 2020, by and among Taylor Morrison Communities, Inc., Monarch Communities Inc., the guarantors party thereto and Wells Fargo Bank, National Association, as trustee (incorporated by reference from Exhibit 4.1 to Amendment No. 5 to Taylor Morrison Home Corporation's Registration Statement on Form S-1 filed on April 4, 2013). | |
| 4.3 | Specimen Class A Common Stock Certificate of Taylor Morrison Home Corporation (incorporated by reference from Exhibit 4.2 to Amendment No. 5 to Taylor Morrison Home Corporation's Registration Statement on Form S-1 filed on April 4, 2013). | |
| 10.1 | Registration Rights Agreement, dated as of April 9, 2013, by and among Taylor Morrison Home Corporation and the other parties named therein (included as Exhibit 10.1 to the Company's Current Report on Form 8-K, filed on April 15, 2013, and incorporated herein by reference). | |
| 10.2 | Amended and Restated Agreement of Exempted Limited Partnership of TMM Holdings II Limited Partnership, dated as of April 9, 2013 (included as Exhibit 10.2 to the Company's Current Report on Form 8-K, filed on April 15, 2013, and incorporated herein by reference). | |
| 10.3 | Exchange Agreement, dated as of April 9, 2013, by and among Taylor Morrison Home Corporation and the other parties named therein (included as Exhibit 10.3 to the Company's Current Report on Form 8-K, filed on April 15, 2013, and incorporated herein by reference). | |
| 10.4 | Stockholders Agreement, dated as of April 9, 2013, by and among Taylor Morrison Home Corporation and the other parties named therein (included as Exhibit 10.4 to the Company's Current Report on Form 8-K, filed on April 15, 2013, and incorporated herein by reference). | |
| 10.5 | Put/Call Agreement, dated as of April 9, 2013, by and among Taylor Morrison Home Corporation and TPG TMM Holdings II, L.P. and OCM TMM Holdings II, L.P (included as Exhibit 10.5 to the Company's Current Report on Form 8-K, filed on April 15, 2013, and incorporated herein by reference). | |
132
Exhibit | Description | |
| 10.6 | Reorganization Agreement, dated as of April 9, 2013, by and among Taylor Morrison Home Corporation and the other parties named therein (included as Exhibit 10.6 to the Company's Current Report on Form 8-K, filed on April 15, 2013, and incorporated herein by reference). | |
| 10.7 | U.S. Parent Governance Agreement, dated as of April 9, 2013, by and among Taylor Morrison Home Corporation, Taylor Morrison Holdings, Inc. and the other parties named therein (included as Exhibit 10.7 to the Company's Current Report on Form 8-K, filed on April 15, 2013, and incorporated herein by reference). | |
| 10.8 | Canadian Parent Governance Agreement, dated as of April 9, 2013, by and among Taylor Morrison Home Corporation, Monarch Communities Inc. and the other parties named therein (included as Exhibit 10.8 to the Company's Current Report on Form 8-K, filed on April 15, 2013, and incorporated herein by reference). | |
| 10.9 | Credit Agreement, dated as of July 13, 2011, among Taylor Morrison Communities, Inc., Monarch Corporation, TMM Holdings Limited Partnership, Monarch Communities Inc., Monarch Parent Inc., Taylor Morrison Holdings, Inc., Taylor Morrison Finance, Inc., the lenders party thereto and Credit Suisse AG, as administrative agent (incorporated by reference from Exhibit 10.1 to Amendment No. 5 to Taylor Morrison Home Corporation's Registration Statement on Form S-1 filed on April 4, 2013). | |
| 10.9(a) | Amendment Agreement, dated as of April 12, 2013, to the Credit Agreement dated as of July 13, 2011 (as amended and restated as of April 13, 2012 and as thereafter amended as of August 15, 2012 and December 27, 2012), among Taylor Morrison Communities Inc., Monarch Corporation, TMM Holdings Limited Partnership and the other parties named therein (included as Exhibit 10.9 to the Company's Current Report on Form 8-K, filed on April 15, 2013, and incorporated herein by reference). | |
| 10.9(b) | Amendment No. 1, dated as of January 15, 2014, to the Second Amended and Restated Credit Agreement, dated as of July 13, 2011 (as amended and restated as of April 13, 2012, thereafter amended as of August 15, 2012 and December 27, 2012 and as further amended and restated as of April 12, 2013), by and among Taylor Morrison Communities, Inc., Monarch Corporation, TMM Holdings Limited Partnership, Monarch Communities Inc., Monarch Parent Inc., Taylor Morrison Holdings, Inc., Taylor Morrison Finance, Inc., the lenders party thereto and Credit Suisse AG, as administrative agent for the lenders (included as Exhibit 10.1 to the Company's Current Report on Form 8-K, filed on January 17, 2014, and incorporated herein by reference). | |
| 10.10 | Form of Indemnification Agreement (included as Exhibit 10.4 to the Company's Registration Statement on Form S-1, as amended (File No. 333-185269), filed on April 4, 2013, and incorporated herein by reference). | |
| 10.11 | Taylor Morrison Home Corporation 2013 Omnibus Equity Award Plan (included as Exhibit 10.14 to the Company's Registration Statement on Form S-1, as amended (File No. 333-185269), filed on April 4, 2013, and incorporated herein by reference). | |
| 10.12 | Form of Employee Nonqualified Option Award Agreement for use with the Taylor Morrison Home Corporation 2013 Omnibus Equity Award Plan (included as Exhibit 10.15 to the Company's Registration Statement on Form S-1, as amended (File No. 333-185269), filed on April 4, 2013, and incorporated herein by reference). | |
| 10.13 | Taylor Morrison Long-Term Cash Incentive Plan (incorporated by reference from Exhibit 10.19 to Amendment No. 4 to Taylor Morrison Home Corporation's Registration Statement on Form S-1 filed on April 4, 2013). | |
| 10.14 | Form of Restricted Stock Unit Agreement for use with the Taylor Morrison Home Corporation 2013 Omnibus Equity Award Plan (included as Exhibit 10.16 to the Company's Registration Statement on Form S-1, as amended (File No. 333-185269), filed on April 1, 2013, and incorporated herein by reference). | |
133
Exhibit | Description | |
| 10.15 | Form of Class B Common Stock Subscription Agreement with Taylor Morrison Home Corporation (included as Exhibit 10.17 to the Company's Registration Statement on Form S-1, as amended (File No. 333-185269), filed on April 8, 2013, and incorporated herein by reference). | |
| 10.16 | TMM Holdings II Limited Partnership 2013 Common Unit Plan (included as Exhibit 10.23 to the Company's Registration Statement on Form S-1, as amended (File No. 333-185269), filed on April 4, 2013, and incorporated herein by reference). | |
| 10.17 | Employment Agreement, dated as of July 13, 2011, between Taylor Morrison, Inc. and Sheryl D. Palmer (incorporated by reference from Exhibit 10.7 to Taylor Morrison Home Corporation's Registration Statement on Form S-1 filed on December 5, 2012). | |
| 10.17(a) | First Amendment to Employment Agreement, dated May 17, 2012, between Taylor Morrison, Inc. and Sheryl D. Palmer (incorporated by reference from Exhibit 10.8 to Taylor Morrison Home Corporation's Registration Statement on Form S-1 filed on December 5, 2012). | |
| 10.18 | Employment Agreement, dated as of January 1, 2013, between Taylor Morrison, Inc. and C. David Cone (incorporated by reference from Exhibit 10.9 to Amendment No. 3 to Taylor Morrison Home Corporation's Registration Statement on Form S-1 filed on March 6, 2013). | |
| 10.19 | Form of Restrictive Covenants Agreement with Taylor Morrison, Inc. (incorporated by reference from Exhibit 10.12 to Amendment No. 3 to Taylor Morrison Home Corporation's Registration Statement on Form S-1 filed on March 6, 2013). | |
| 21.1* | Subsidiaries of Taylor Morrison Home Corporation | |
| 23.1* | Consent of Deloitte & Touche LLP | |
| 24.1* | Power of Attorney (included on signature page) | |
| 31.1* | Certification of Sheryl D. Palmer, Chief Executive Officer, pursuant to Section 302 of the Sarbanes–Oxley Act of 2002. | |
| 31.2* | Certification of C. David Cone, Chief Financial Officer, pursuant to Section 302 of the Sarbanes–Oxley Act of 2002. | |
| 32.1* | Certification of Sheryl D. Palmer, Chief Executive Officer, pursuant to Section 906 of the Sarbanes–Oxley Act of 2002. | |
| 32.2* | Certification of C. David Cone, Chief Financial Officer, pursuant to Section 906 of the Sarbanes–Oxley Act of 2002. | |
| 101.INS† | XBRL Instance Document. | |
| 101.SCH† | XBRL Taxonomy Extension Schema Document. | |
| 101.CAL† | XBRL Taxonomy Extension Calculation Linkbase Document. | |
| 101.DEF† | XBRL Taxonomy Extension Definition Linkbase Document. | |
| 101.LAB† | XBRL Taxonomy Extension Label Linkbase Document. | |
| 101.PRE† | XBRL Taxonomy Extension Presentation Linkbase Document. | |
| * | Filed herewith. |
| † | XBRL information is deemed not filed or a part of a registration statement or Annual Report for purposes of Sections 11 and 12 of the Securities Act of 1933, as amended, is deemed not filed for purposes of Section 18 of the Securities Exchange Act of 1934, as amended, and otherwise is not subject to liability under such sections. |
134
SIGNATURES
Pursuant to the requirements of the Securities Exchange Act of 1934, the Registrant has duly caused this Annual Report to be signed on its behalf by the undersigned thereunto duly authorized.
| TAYLOR MORRISON HOME CORPORATION | ||||
| Registrant | ||||
| DATE: February 24, 2014 | ||||
/s/ Sheryl D. Palmer | ||||
| Sheryl D. Palmer | ||||
President and Chief Executive Officer (Principal Executive Officer) | ||||
/s/ C. David Cone | ||||
| C. David Cone | ||||
Vice President and Chief Financial Officer (Principal Financial Officer, Principal Accounting Officer) | ||||
KNOW ALL MEN BY THESE PRESENTS , that each person whose signature appears below constitutes and appoints Sheryl D. Palmer, C. David Cone and Darrell C. Sherman, and each of them, his or her true and lawful attorneys-in-fact and agents, with full power of substitution and re-substitution, for him or her and in his or her name, place and stead, in any and all capacities, to sign any and all amendments to this Annual Report on Form 10-K, and to file the same, with all exhibits thereto and other documents in connection therewith the Securities and Exchange Commission, granting unto said attorneys-in-fact and agents, and each of them, full power and authority to do and perform each and every act and thing requisite and necessary to be done in and about the premises, as fully and to all intents and purposes as he or she might or could do in person hereby ratifying and confirming all that said attorneys-in-fact and agents, or his or her substitute or substitutes, may lawfully do or cause to be done by virtue hereof.
Pursuant to the requirements of the Securities and Exchange Act of 1934, the report has been signed below by the following persons on behalf of the Registrant and in the capacities and on the dates indicated.
| Signature | Title | Date | ||
/s/ Sheryl D. Palmer | President and Chief Executive Officer | February 24, 2014 | ||
| Sheryl D. Palmer | ||||
/s/ C. David Cone | Vice President and Chief Financial Officer | February 24, 2014 | ||
| C. David Cone | ||||
/s/ Timothy R. Eller | Director and Chairman of the Board of Directors | February 24, 2014 | ||
| Timothy R. Eller | ||||
/s/ John Brady | Director | February 24, 2014 | ||
| John Brady | ||||
/s/ Kelvin Davis | Director | February 24, 2014 | ||
| Kelvin Davis | ||||
/s/ James Henry | Director | February 24, 2014 | ||
| James Henry | ||||
135
| Signature | Title | Date | ||
/s/ Joe S. Houssian | Director | February 24, 2014 | ||
| Joe S. Houssian | ||||
/s/ Jason Keller | Director | February 24, 2014 | ||
| Jason Keller | ||||
/s/ Greg Kranias | Director | February 24, 2014 | ||
| Greg Kranias | ||||
/s/ Peter Lane | Director | February 24, 2014 | ||
| Peter Lane | ||||
/s/ David Merritt | Director | February 24, 2014 | ||
| David Merritt | ||||
/s/ Rajath Shourie | Director | February 24, 2014 | ||
| Rajath Shourie | ||||
136
EXHIBIT INDEX
Exhibit | Description | |
| 3.1 | Amended and Restated Certificate of Incorporation (included as Exhibit 3.1 to the Company's Current Report on Form 8-K, filed on April 15, 2013, and incorporated herein by reference). | |
| 3.2 | Amended and Restated By-laws (included as Exhibit 3.2 to the Company's Current Report on Form 8-K, filed on April 15, 2013, and incorporated herein by reference). | |
| 4.1 | Indenture, dated as of April 16, 2013, relating to Taylor Morrison Communities, Inc.'s and Monarch Communities Inc.'s 5.25% Senior Notes due 2021 by and among Taylor Morrison Communities Inc., Monarch Communities Inc. and Wells Fargo Bank, National Association (included as Exhibit 4.1 to the Company's Quarterly Report on Form 10-Q for the quarter ended June 30, 2013). | |
| 4.2 | Indenture, dated as of April 13, 2012, relating to Taylor Morrison Communities, Inc.'s and Monarch Communities Inc.'s 7.750% Senior Notes due 2020, by and among Taylor Morrison Communities, Inc., Monarch Communities Inc., the guarantors party thereto and Wells Fargo Bank, National Association, as trustee (incorporated by reference from Exhibit 4.1 to Amendment No. 5 to Taylor Morrison Home Corporation's Registration Statement on Form S-1 filed on April 4, 2013). | |
| 4.3 | Specimen Class A Common Stock Certificate of Taylor Morrison Home Corporation (incorporated by reference from Exhibit 4.2 to Amendment No. 5 to Taylor Morrison Home Corporation's Registration Statement on Form S-1 filed on April 4, 2013). | |
| 10.1 | Registration Rights Agreement, dated as of April 9, 2013, by and among Taylor Morrison Home Corporation and the other parties named therein (included as Exhibit 10.1 to the Company's Current Report on Form 8-K, filed on April 15, 2013, and incorporated herein by reference). | |
| 10.2 | Amended and Restated Agreement of Exempted Limited Partnership of TMM Holdings II Limited Partnership, dated as of April 9, 2013 (included as Exhibit 10.2 to the Company's Current Report on Form 8-K, filed on April 15, 2013, and incorporated herein by reference). | |
| 10.3 | Exchange Agreement, dated as of April 9, 2013, by and among Taylor Morrison Home Corporation and the other parties named therein (included as Exhibit 10.3 to the Company's Current Report on Form 8-K, filed on April 15, 2013, and incorporated herein by reference). | |
| 10.4 | Stockholders Agreement, dated as of April 9, 2013, by and among Taylor Morrison Home Corporation and the other parties named therein (included as Exhibit 10.4 to the Company's Current Report on Form 8-K, filed on April 15, 2013, and incorporated herein by reference). | |
| 10.5 | Put/Call Agreement, dated as of April 9, 2013, by and among Taylor Morrison Home Corporation and TPG TMM Holdings II, L.P. and OCM TMM Holdings II, L.P (included as Exhibit 10.5 to the Company's Current Report on Form 8-K, filed on April 15, 2013, and incorporated herein by reference). | |
| 10.6 | Reorganization Agreement, dated as of April 9, 2013, by and among Taylor Morrison Home Corporation and the other parties named therein (included as Exhibit 10.6 to the Company's Current Report on Form 8-K, filed on April 15, 2013, and incorporated herein by reference). | |
| 10.7 | U.S. Parent Governance Agreement, dated as of April 9, 2013, by and among Taylor Morrison Home Corporation, Taylor Morrison Holdings, Inc. and the other parties named therein (included as Exhibit 10.7 to the Company's Current Report on Form 8-K, filed on April 15, 2013, and incorporated herein by reference). | |
| 10.8 | Canadian Parent Governance Agreement, dated as of April 9, 2013, by and among Taylor Morrison Home Corporation, Monarch Communities Inc. and the other parties named therein (included as Exhibit 10.8 to the Company's Current Report on Form 8-K, filed on April 15, 2013, and incorporated herein by reference). | |
137
Exhibit | Description | |
| 10.9 | Credit Agreement, dated as of July 13, 2011, among Taylor Morrison Communities, Inc., Monarch Corporation, TMM Holdings Limited Partnership, Monarch Communities Inc., Monarch Parent Inc., Taylor Morrison Holdings, Inc., Taylor Morrison Finance, Inc., the lenders party thereto and Credit Suisse AG, as administrative agent (incorporated by reference from Exhibit 10.1 to Amendment No. 5 to Taylor Morrison Home Corporation's Registration Statement on Form S-1 filed on April 4, 2013). | |
| 10.9(a) | Amendment Agreement, dated as of April 12, 2013, to the Credit Agreement dated as of July 13, 2011 (as amended and restated as of April 13, 2012 and as thereafter amended as of August 15, 2012 and December 27, 2012), among Taylor Morrison Communities Inc., Monarch Corporation, TMM Holdings Limited Partnership and the other parties named therein (included as Exhibit 10.9 to the Company's Current Report on Form 8-K, filed on April 15, 2013, and incorporated herein by reference). | |
| 10.9(b) | Amendment No. 1, dated as of January 15, 2014, to the Second Amended and Restated Credit Agreement, dated as of July 13, 2011 (as amended and restated as of April 13, 2012, thereafter amended as of August 15, 2012 and December 27, 2012 and as further amended and restated as of April 12, 2013), by and among Taylor Morrison Communities, Inc., Monarch Corporation, TMM Holdings Limited Partnership, Monarch Communities Inc., Monarch Parent Inc., Taylor Morrison Holdings, Inc., Taylor Morrison Finance, Inc., the lenders party thereto and Credit Suisse AG, as administrative agent for the lenders (included as Exhibit 10.1 to the Company's Current Report on Form 8-K, filed on January 17, 2014, and incorporated herein by reference). | |
| 10.10 | Form of Indemnification Agreement (included as Exhibit 10.4 to the Company's Registration Statement on Form S-1, as amended (File No. 333-185269), filed on April 4, 2013, and incorporated herein by reference). | |
| 10.11 | Taylor Morrison Home Corporation 2013 Omnibus Equity Award Plan (included as Exhibit 10.14 to the Company's Registration Statement on Form S-1, as amended (File No. 333-185269), filed on April 4, 2013, and incorporated herein by reference). | |
| 10.12 | Form of Employee Nonqualified Option Award Agreement for use with the Taylor Morrison Home Corporation 2013 Omnibus Equity Award Plan (included as Exhibit 10.15 to the Company's Registration Statement on Form S-1, as amended (File No. 333-185269), filed on April 4, 2013, and incorporated herein by reference). | |
| 10.13 | Taylor Morrison Long-Term Cash Incentive Plan (incorporated by reference from Exhibit 10.19 to Amendment No. 4 to Taylor Morrison Home Corporation's Registration Statement on Form S-1 filed on April 4, 2013). | |
| 10.14 | Form of Restricted Stock Unit Agreement for use with the Taylor Morrison Home Corporation 2013 Omnibus Equity Award Plan (included as Exhibit 10.16 to the Company's Registration Statement on Form S-1, as amended (File No. 333-185269), filed on April 1, 2013, and incorporated herein by reference). | |
| 10.15 | Form of Class B Common Stock Subscription Agreement with Taylor Morrison Home Corporation (included as Exhibit 10.17 to the Company's Registration Statement on Form S-1, as amended (File No. 333-185269), filed on April 8, 2013, and incorporated herein by reference). | |
| 10.16 | TMM Holdings II Limited Partnership 2013 Common Unit Plan (included as Exhibit 10.23 to the Company's Registration Statement on Form S-1, as amended (File No. 333-185269), filed on April 4, 2013, and incorporated herein by reference). | |
| 10.17 | Employment Agreement, dated as of July 13, 2011, between Taylor Morrison, Inc. and Sheryl D. Palmer (incorporated by reference from Exhibit 10.7 to Taylor Morrison Home Corporation's Registration Statement on Form S-1 filed on December 5, 2012). | |
| 10.17(a) | First Amendment to Employment Agreement, dated May 17, 2012, between Taylor Morrison, Inc. and Sheryl D. Palmer (incorporated by reference from Exhibit 10.8 to Taylor Morrison Home Corporation's Registration Statement on Form S-1 filed on December 5, 2012). | |
138
Exhibit | Description | |
| 10.18 | Employment Agreement, dated as of January 1, 2013, between Taylor Morrison, Inc. and C. David Cone (incorporated by reference from Exhibit 10.9 to Amendment No. 3 to Taylor Morrison Home Corporation's Registration Statement on Form S-1 filed on March 6, 2013). | |
| 10.19 | Form of Restrictive Covenants Agreement with Taylor Morrison, Inc. (incorporated by reference from Exhibit 10.12 to Amendment No. 3 to Taylor Morrison Home Corporation's Registration Statement on Form S-1 filed on March 6, 2013). | |
| 21.1* | Subsidiaries of Taylor Morrison Home Corporation | |
| 23.1* | Consent of Deloitte & Touche LLP | |
| 24.1* | Power of Attorney (included on signature page) | |
| 31.1* | Certification of Sheryl D. Palmer, Chief Executive Officer, pursuant to Section 302 of the Sarbanes–Oxley Act of 2002. | |
| 31.2* | Certification of C. David Cone, Chief Financial Officer, pursuant to Section 302 of the Sarbanes–Oxley Act of 2002. | |
| 32.1* | Certification of Sheryl D. Palmer, Chief Executive Officer, pursuant to Section 906 of the Sarbanes–Oxley Act of 2002. | |
| 32.2* | Certification of C. David Cone, Chief Financial Officer, pursuant to Section 906 of the Sarbanes–Oxley Act of 2002. | |
| 101.INS† | XBRL Instance Document. | |
| 101.SCH† | XBRL Taxonomy Extension Schema Document. | |
| 101.CAL† | XBRL Taxonomy Extension Calculation Linkbase Document. | |
| 101.DEF† | XBRL Taxonomy Extension Definition Linkbase Document. | |
| 101.LAB† | XBRL Taxonomy Extension Label Linkbase Document. | |
| 101.PRE† | XBRL Taxonomy Extension Presentation Linkbase Document. | |
| * | Filed herewith. |
| † | XBRL information is deemed not filed or a part of a registration statement or Annual Report for purposes of Sections 11 and 12 of the Securities Act of 1933, as amended, is deemed not filed for purposes of Section 18 of the Securities Exchange Act of 1934, as amended, and otherwise is not subject to liability under such sections. |
139