UNITED STATES
SECURITIES AND EXCHANGE COMMISSION
Washington, D.C. 20549
FORM 10-K
(Mark One)
| ☑ | ANNUAL REPORT PURSUANT TO SECTION 13 OR 15(d) |
OF THE SECURITIES EXCHANGE ACT OF 1934
For the fiscal year ended December 31, 2011
OR
| ¨ | TRANSITION REPORT PURSUANT TO SECTION 13 OR 15(d) |
OF THE SECURITIES EXCHANGE ACT OF 1934
Commission file number 1-12387
TENNECO INC.
(Exact name of registrant as specified in its charter)
| Delaware | 76-0515284 | |
(State or other jurisdiction of incorporation or organization) | (I.R.S. Employer Identification No.) | |
500 North Field Drive Lake Forest, IL (Address of principal executive offices) | 60045 (Zip Code) | |
Registrant's telephone number, including area code: (847) 482-5000
Securities registered pursuant to Section 12(b) of the Act:
Title of each class | Name of each Exchange on which registered | |
| Common Stock, par value $.01 per share | New York and Chicago Stock Exchanges |
Securities registered pursuant to Section 12(g) of the Act: None
Indicate by check mark if the registrant is a well-known seasoned issuer, as defined in Rule 405 of the Securities Act. Yes ☑ No ¨
Indicate by check mark if the registrant is not required to file reports pursuant to Section 13 or Section 15(d) of the Act. Yes ¨ No ☑
Note - Checking the box above will not relieve any registrant required to file reports pursuant to Section 13 or 15(d) of the Exchange Act from their obligations under those Sections.
Indicate by check mark whether the registrant (1) has filed all reports required to be filed by Section 13 or 15(d) of the Securities Exchange Act of 1934 during the preceding 12 months (or for such shorter period that the registrant was required to file such reports), and (2) has been subject to such filing requirements for the past 90 days. Yes ☑ No ¨
Indicate by check mark if disclosure of delinquent filers pursuant to Item 405 of Regulation S-K is not contained herein, and will not be contained, to the best of registrant's knowledge, in definitive proxy or information statements incorporated by reference in Part III of this Form 10-K or any amendment to this Form 10-K. ☑
Indicate by check mark whether the registrant has submitted electronically and posted on its corporate Web site, if any, every Interactive Data File required to be submitted and posted pursuant to Rule 405 of Regulation S-T during the preceding 12 months (or for such shorter period that the registrant was required to submit and post such files). Yes ☑ No ¨
Indicate by check mark whether the registrant is a large accelerated filer, an accelerated filer, a non-accelerated filer, or a smaller reporting company. See the definitions of "large accelerated filer," "accelerated filer" and "smaller reporting company" in Rule 12b-2 of the Exchange Act. (Check one):
| Large accelerated filer ☑ | Accelerated filer ¨ | Non-accelerated filer ¨ | Smaller reporting company ¨ | |||
| (Do not check if a smaller reporting company) | ||||||
Indicate by check mark whether the registrant is a shell company (as defined in Rule 12b-2 of the Exchange Act). Yes ¨ No ☑
State the aggregate market value of the voting and non-voting common equity held by non-affiliates computed by reference to the price at which the common equity was last sold, or the average bid and asked price of such common equity, as of the last business day of the registrant's most recently completed second fiscal quarter.
Class of Common Equity and Number of Shares held by Non-affiliates at June 30, 2011 | Market Value held by Non-affiliates* | |
Common Stock, 58,288,962 shares | $2,568,794,555 |
| * | Based upon the closing sale price on the New York Stock Exchange Composite Tape for the Common Stock on June 30, 2011. |
INDICATE THE NUMBER OF SHARES OUTSTANDING OF EACH OF THE REGISTRANT'S CLASSES OF COMMON STOCK, AS OF THE LATEST PRACTICABLE DATE. Common Stock, par value $.01 per share, 60,452,457 shares outstanding as of February 21, 2012.
Documents Incorporated by Reference:
| Document | Part of the Form 10-K into which incorporated | |
| Portions of Tenneco Inc.'s Definitive Proxy Statement for the Annual Meeting of Stockholders to be held May 16, 2012 | Part III |
CAUTIONARY STATEMENT FOR PURPOSES OF THE "SAFE HARBOR" PROVISIONS OF THE PRIVATE SECURITIES LITIGATION REFORM ACT OF 1995
This Annual Report contains forward-looking statements within the meaning of the Private Securities Litigation Reform Act of 1995 concerning, among other things, our prospects and business strategies. These forward-looking statements are included in various sections of this report, including the section entitled "Outlook" appearing in Item 7 of this report. The words "may," "will," "believe," "should," "could," "plan," "expect," "anticipate," "estimate," and similar expressions (and variations thereof), identify these forward-looking statements. Although we believe that the expectations reflected in these forward-looking statements are based on reasonable assumptions, these expectations may not prove to be correct. Because these forward-looking statements are also subject to risks and uncertainties, actual results may differ materially from the expectations expressed in the forward-looking statements. Important factors that could cause actual results to differ materially from the expectations reflected in the forward-looking statements include:
| • | general economic, business and market conditions; |
| • | our ability to source and procure needed materials, components and other products and services in accordance with customer demand and at competitive prices; |
| • | changes in capital availability or costs, including increases in our cost of borrowing (i.e., interest rate increases), the amount of our debt, our ability to access capital markets at favorable rates, and the credit ratings of our debt; |
| • | changes in consumer demand, prices and our ability to have our products included on top selling vehicles, including any shifts in consumer preferences away from light trucks, which tend to be higher margin products for our customers and us, to other lower margin vehicles, for which we may or may not have supply contracts; |
| • | changes in automotive and commercial vehicle manufacturers' production rates and their actual and forecasted requirements for our products, such as the significant production cuts during 2008 and 2009 by automotive manufacturers in response to difficult economic conditions; |
| • | the overall highly competitive nature of the automobile and commercial vehicle parts industries, and any resultant inability to realize the sales represented by our awarded book of business (which is based on anticipated pricing and volumes for the applicable program over its life); |
| • | the loss of any of our large original equipment manufacturer ("OEM") customers (on whom we depend for a substantial portion of our revenues), or the loss of market shares by these customers if we are unable to achieve increased sales to other OEMs; |
| • | industrywide strikes, labor disruptions at our facilities or any labor or other economic disruptions at any of our significant customers or suppliers or any of our customers' other suppliers (such as the 2008 strike at American Axle, which disrupted our supply of products for significant General Motors (GM) platforms); |
| • | increases in the costs of raw materials, including our ability to successfully reduce the impact of any such cost increases through materials substitutions, cost reduction initiatives, low cost country sourcing, and price recovery efforts with aftermarket and OE customers; |
| • | the negative impact of higher fuel prices on transportation and logistics costs, raw material costs and discretionary purchases of vehicles or aftermarket products; |
| • | the cyclical nature of the global vehicle industry, including the performance of the global aftermarket sector and the longer product lives of vehicle parts; |
| • | our ability to successfully execute cash management, restructuring and other cost reduction plans and to realize anticipated benefits from these plans; |
| • | costs related to product warranties and other customer satisfaction actions; |
2
| • | the impact of consolidation among vehicle parts suppliers and customers on our ability to compete; |
| • | changes in distribution channels or competitive conditions in the markets and countries where we operate, including the impact of changes in distribution channels for aftermarket products on our ability to increase or maintain aftermarket sales; |
| • | the cost and outcome of existing and any future legal proceedings, including, but not limited to, proceedings against us or our customers relating to intellectual property rights; |
| • | economic, exchange rate and political conditions in the countries where we operate or sell our products; |
| • | customer acceptance of new products; |
| • | new technologies that reduce the demand for certain of our products or otherwise render them obsolete; |
| • | our ability to realize our business strategy of improving operating performance; |
| • | our ability to successfully integrate any acquisitions that we complete and effectively manage our joint ventures and other third-party relationships; |
| • | changes by the Financial Accounting Standards Board or the Securities and Exchange Commission of authoritative generally accepted accounting principles or policies; |
| • | changes in accounting estimates and assumptions, including changes based on additional information; |
| • | any changes by International Standards Organization (ISO), Technical Specifications (TS) and other such committees in their certification processes for processes and products, which may have the effect of delaying or hindering our ability to bring new products to market; |
| • | the impact of changes in and compliance with laws and regulations, including environmental laws and regulations, which may result in our incurrence of environmental liabilities in excess of the amount reserved, the implementation of mandated timelines for local, regional and national emission regulations, which could impact the demand for certain of our products, and any changes to the timing of the funding requirements for our pension and other postretirement benefit liabilities; |
| • | the potential impairment in the carrying value of our long-lived assets and goodwill or our deferred tax assets; |
| • | potential volatility in our effective tax rate; |
| • | natural disasters, such as the 2011 earthquake in Japan and flooding in Thailand, and any resultant disruptions in the supply or production of goods or services to us or by us or in demand by our customers; |
| • | acts of war and/or terrorism, as well as actions taken or to be taken by the United States and other governments as a result of further acts or threats of terrorism, and the impact of these acts on economic, financial and social conditions in the countries where we operate; and |
| • | the timing and occurrence (or non-occurrence) of other transactions, events and circumstances which may be beyond our control. |
The risks included here are not exhaustive. Refer to "Part I, Item 1A - Risk Factors" of this report for further discussion regarding our exposure to risks. Additionally, new risk factors emerge from time to time and it is not possible for us to predict all such risk factors, nor to assess the impact such risk factors might have on our business or the extent to which any factor or combination of factors may cause actual results to differ materially from those contained in any forward-looking statements. Given these risks and uncertainties, investors should not place undue reliance on forward-looking statements as a prediction of actual results.
3
TABLE OF CONTENTS
| PART I | ||||||
Item 1. | Business | 5 | ||||
Tenneco Inc | 5 | |||||
Contributions of Major Businesses | 8 | |||||
Description of Our Business | 9 | |||||
Item 1A. | Risk Factors | 26 | ||||
Item 1B. | Unresolved Staff Comments | 34 | ||||
Item 2. | Properties | 34 | ||||
Item 3. | Legal Proceedings | 34 | ||||
Item 4. | Mine Safety Disclosure | 36 | ||||
Item 4.1. | Executive Officers of the Registrant | 36 | ||||
| PART II | ||||||
Item 5. | Market for Registrant's Common Equity, Related Stockholder Matters and Issuer Purchases of Equity Securities | 38 | ||||
Item 6. | Selected Financial Data | 41 | ||||
Item 7. | Management's Discussion and Analysis of Financial Condition and Results of Operations | 44 | ||||
Item 7A. | Quantitative and Qualitative Disclosures About Market Risk | 78 | ||||
Item 8. | Financial Statements and Supplementary Data | 79 | ||||
Item 9. | Changes in and Disagreements with Accountants on Accounting and Financial Disclosure | 144 | ||||
Item 9A. | Controls and Procedures | 144 | ||||
Item 9B. | Other Information | 144 | ||||
| PART III | ||||||
Item 10. | Directors, Executive Officers and Corporate Governance | 145 | ||||
Item 11. | Executive Compensation | 145 | ||||
Item 12. | Security Ownership of Certain Beneficial Owners and Management and Related Stockholder Matters | 145 | ||||
Item 13. | Certain Relationships and Related Transactions, and Director Independence | 146 | ||||
Item 14. | Principal Accountant Fees and Services | 146 | ||||
| PART IV | ||||||
Item 15. | Exhibits and Financial Statement Schedules | 147 | ||||
4
PART I
ITEM 1. BUSINESS.
TENNECO INC.
General
Our company, Tenneco Inc., is one of the world's largest producers of emission control and ride control products and systems for light, commercial and specialty vehicle applications. Our company serves both original equipment vehicle manufacturers ("OEMs") and the repair and replacement markets, or aftermarket, worldwide. As used herein, the term "Tenneco," "we," "us," "our," or the "Company" refers to Tenneco Inc. and its consolidated subsidiaries.
We were incorporated in Delaware in 1996. In 2005, we changed our name from Tenneco Automotive Inc. to Tenneco Inc. The name Tenneco better represents the expanding number of markets we serve through our commercial and specialty vehicle businesses. Building a stronger presence in these markets complements our core businesses of supplying ride control and emission control products and systems for light and commercial vehicles to original equipment and aftermarket customers worldwide. Our common stock is traded on the New York Stock Exchange under the symbol "TEN."
Corporate Governance and Available Information
We have established a comprehensive approach to corporate governance for the purpose of defining responsibilities, setting high standards of professional and personal conduct and assuring compliance with such responsibilities and standards. As part of its annual review process, the Board of Directors monitors developments in the area of corporate governance. Listed below are some of the key elements of our corporate governance policies.
For more information about these matters, see our definitive Proxy Statement for the Annual Meeting of Stockholders to be held on May 16, 2012.
Independence of Directors
| • | Six of our eight directors are independent under the New York Stock Exchange ("NYSE") listing standards. |
| • | Independent directors are scheduled to meet separately in executive session after every regularly scheduled Board of Directors meeting. |
| • | We have a lead independent director, Mr. Paul T. Stecko. |
Audit Committee
| • | All members meet the independence standards for audit committee membership under the NYSE listing standards and applicable Securities and Exchange Commission ("SEC") rules. |
| • | One member of the Audit Committee, Mr. Dennis Letham, has been designated by the Board as an "audit committee financial expert," as defined in the SEC rules, and the remaining members of the Audit Committee satisfy the NYSE's financial literacy requirements. |
| • | The Audit Committee operates under a written charter which governs its duties and responsibilities, including its sole authority to appoint, review, evaluate and replace our independent auditors. |
| • | The Audit Committee has adopted policies and procedures governing the pre-approval of all audit, audit-related, tax and other services provided by our independent auditors. |
Compensation/Nominating/Governance Committee
| • | All members meet the independence standards for compensation and nominating committee membership under the NYSE listing standards. |
5
| • | The Compensation/Nominating/Governance Committee operates under a written charter that governs its duties and responsibilities, including the responsibility for executive compensation. |
| • | We have an Executive Compensation Subcommittee which has the responsibility to consider and approve equity based compensation for our executive officers which is intended to qualify as "performance based compensation" under Section 162(m) of the Internal Revenue Code. |
Corporate Governance Principles
| • | We have adopted Corporate Governance Principles, including qualification and independence standards for directors. |
Stock Ownership Guidelines
| • | We have adopted Stock Ownership Guidelines to align the interests of our executives with the interests of stockholders and promote our commitment to sound corporate governance. |
| • | The Stock Ownership Guidelines apply to the independent directors, the Chairman and Chief Executive Officer, and all other officers with a rank of Vice President or higher. |
Communication with Directors
| • | The Audit Committee has established a process for confidential and anonymous submission by our employees, as well as submissions by other interested parties, regarding questionable accounting or auditing matters. |
| • | Additionally, the Board of Directors has established a process for stockholders to communicate with the Board of Directors, as a whole, or any independent director. |
Codes of Business Conduct and Ethics
| • | We have adopted a Code of Ethical Conduct for Financial Managers, which applies to our Chief Executive Officer, Chief Operating Officer, Chief Financial Officer, Controller and other key financial managers. This code is filed as Exhibit 14 to this report. |
| • | We also operate under a Statement of Business Principles that applies to all directors, officers and employees and includes provisions ranging from restrictions on gifts to conflicts of interests. All salaried employees are required to affirm annually their acceptance of, and compliance with, these principles. |
Related Party Transactions Policy
| • | We have adopted a Policy and Procedure for Transactions With Related Persons, under which our Board of Directors must generally pre-approve transactions involving more than $120,000 with our directors, executive officers, five percent or greater stockholders and their immediate family members. |
Equity Award Policy
| • | We have adopted a written policy for all issuances by our company of compensatory awards in the form of our common stock or any derivative of the common stock. |
Personal Loans to Executive Officers and Directors
| • | We comply with and operate in a manner consistent with the legislation outlawing extensions of credit in the form of a personal loan to or for our directors or executive officers. |
Our Internet address is http://www.tenneco.com . We make our proxy statements, annual report to stockholders, annual report on Form 10-K, quarterly reports on Form 10-Q, current reports on Form 8-K and amendments to those reports, as filed with or furnished to the SEC, available free of charge on our Internet
6
website as soon as reasonably practicable after submission to the SEC. Securities ownership reports on Forms 3, 4 and 5 are also available free of charge on our website as soon as reasonably practicable after submission to the SEC. The contents of our website are not, however, a part of this report. All such statements and reports can also be found at the internet site maintained by the SEC at http://www.sec.gov .
Our Audit Committee, Compensation/Nominating/Governance Committee and Executive Compensation Subcommittee Charters, Corporate Governance Principles, Stock Ownership Guidelines, Audit Committee policy regarding accounting complaints, Code of Ethical Conduct for Financial Managers, Statement of Business Principles, Policy and Procedures for Transactions with Related Persons, Equity Award Policy, policy for communicating with the Board of Directors and Audit Committee policy regarding the pre-approval of audit, non-audit, tax and other services are available free of charge on our website at www.tenneco.com. In addition, we will make a copy of any of these documents available to any person, without charge, upon written request to Tenneco Inc., 500 North Field Drive, Lake Forest, Illinois 60045, Attn: General Counsel. We intend to satisfy the disclosure requirements under Item 5.05 of Form 8-K and applicable NYSE rules regarding amendments to, or waivers of, our Code of Ethical Conduct for Financial Managers and Statement of Business Principles by posting this information on our website at www.tenneco.com.
7
CONTRIBUTIONS OF MAJOR BUSINESSES
For information concerning our operating segments, geographic areas and major products or groups of products, see Note 11 to the consolidated financial statements of Tenneco Inc. included in Item 8. The following tables summarize for each of our reportable segments for the periods indicated: (i) net sales and operating revenues; (ii) earnings before interest expense, income taxes and noncontrolling interests ("EBIT"); and (iii) expenditures for plant, property and equipment. You should also read "Management's Discussion and Analysis of Financial Condition and Results of Operations" included in Item 7 for information about certain costs and charges included in our results.
Net Sales and Operating Revenues:
| 2011 | 2010 | 2009 | ||||||||||||||||||||||
| (Dollar Amounts in Millions) | ||||||||||||||||||||||||
North America | $ | 3,426 | 48 | % | $ | 2,832 | 48 | % | $ | 2,099 | 45 | % | ||||||||||||
Europe, South America and India | 3,169 | 44 | 2,594 | 44 | 2,209 | 48 | ||||||||||||||||||
Asia Pacific | 804 | 11 | 698 | 12 | 525 | 11 | ||||||||||||||||||
Intergroup sales | (194 | ) | (3 | ) | (187 | ) | (4 | ) | (184 | ) | (4 | ) | ||||||||||||
|
|
|
|
|
|
|
|
|
|
|
| |||||||||||||
Total | $ | 7,205 | 100 | % | $ | 5,937 | 100 | % | $ | 4,649 | 100 | % | ||||||||||||
|
|
|
|
|
|
|
|
|
|
|
| |||||||||||||
EBIT:
| 2011 | 2010 | 2009 | ||||||||||||||||||||||
| (Dollar Amounts in Millions) | ||||||||||||||||||||||||
North America | $ | 216 | 57 | % | $ | 155 | 55 | % | $ | 42 | 45 | % | ||||||||||||
Europe, South America and India | 125 | 33 | 76 | 27 | 20 | 22 | ||||||||||||||||||
Asia Pacific | 38 | 10 | 50 | 18 | 30 | 33 | ||||||||||||||||||
|
|
|
|
|
|
|
|
|
|
|
| |||||||||||||
Total | $ | 379 | 100 | % | $ | 281 | 100 | % | $ | 92 | 100 | % | ||||||||||||
|
|
|
|
|
|
|
|
|
|
|
| |||||||||||||
Expenditures for plant, property and equipment:
| 2011 | 2010 | 2009 | ||||||||||||||||||||||
| (Dollar Amounts in Millions) | ||||||||||||||||||||||||
North America | $ | 88 | 40 | % | $ | 59 | 38 | % | $ | 45 | 38 | % | ||||||||||||
Europe, South America and India | 95 | 44 | 66 | 43 | 58 | 49 | ||||||||||||||||||
Asia Pacific | 35 | 16 | 29 | 19 | 15 | 13 | ||||||||||||||||||
|
|
|
|
|
|
|
|
|
|
|
| |||||||||||||
Total | $ | 218 | 100 | % | $ | 154 | 100 | % | $ | 118 | 100 | % | ||||||||||||
|
|
|
|
|
|
|
|
|
|
|
| |||||||||||||
Interest expense, income taxes, and noncontrolling interests that were not allocated to our operating segments are:
| 2011 | 2010 | 2009 | ||||||||||
| (Millions) | ||||||||||||
Interest expense (net of interest capitalized) | $ | 108 | $ | 149 | $ | 133 | ||||||
Income tax expense | 88 | 69 | 13 | |||||||||
Noncontrolling interests | 26 | 24 | 19 | |||||||||
8
DESCRIPTION OF OUR BUSINESS
We design, manufacture and sell emission control and ride control systems and products for light, commercial and specialty vehicle applications, and generated revenues of $7.2 billion in 2011. We serve both original equipment manufacturers (OEMs) and replacement markets worldwide through leading brands, including Monroe ® , Rancho ® , Clevite ® Elastomers, Marzocchi ® , Axios TM , Kinetic TM , and Fric-Rot TM ride control products and Walker ® , Fonos TM , DynoMax ® , Thrush TM , and Lukey TM emission control products.
As a parts supplier, we produce individual component parts for vehicles as well as groups of components that are combined as modules or systems within vehicles. These parts, modules and systems are sold globally to most leading OEMs, commercial vehicle engine manufactures, and aftermarket distribution channels.
Overview of Vehicle Parts Industry and Adjacent Markets
The vehicle parts industry is generally separated into two categories: (1) "original equipment" or "OE" in which parts are sold in large quantities directly for use by OEMs, commercial vehicle engine manufactures; and (2) "aftermarket" in which replacement parts are sold in varying quantities to wholesalers, retailers and installers. In the OE market, parts suppliers are generally divided into tiers - "Tier 1" suppliers that provide their products directly to OEMs, and "Tier 2" or "Tier 3" suppliers that sell their products principally to other suppliers for combination into the other supplier's own product offerings.
The market for "light vehicles" is comprised of: (1) passenger cars and (2) light trucks which include sport-utility vehicles (SUV), crossover vehicles (CUV), pick-up trucks, vans and multi-purpose passenger vehicles. Demand for automotive parts in the OE light vehicle market is generally a function of the number of new vehicles produced, which in turn is a function of prevailing economic conditions and consumer preferences. In 2011, the number of light vehicles produced by region was 13.1 million in North America, 30.2 million in Europe, South America and India and 33.3 million in Asia Pacific. Worldwide light vehicle production is forecasted to increase to 79.6 million units in 2012 from approximately 76.6 million units in 2011, according to IHS Automotive. Although OE demand is tied to planned vehicle production, parts suppliers also have the opportunity to grow revenues by increasing their product content per vehicle, by further expanding business with existing customers and by serving new customers in existing or new markets. Companies with a global presence and advanced technology, engineering, manufacturing and support capabilities, such as our Company, are better positioned to take advantage of these opportunities.
The increase and expansion in mandated diesel emission control and noise regulations or standards through 2014 in North America, Europe, China, Japan, Brazil, Russia and India, have enabled suppliers such as us to serve customers beyond the light vehicle market. Certain automotive parts suppliers are now developing and producing components and integrated systems for the commercial market of medium- and heavy-duty trucks, buses, off-road equipment, and locomotive/marine applications as well as the recreational segment for two-wheelers and all-terrain vehicles. Tenneco foresees this market diversification as a source of future growth.
Demand for aftermarket products is driven by general economic conditions, the number of vehicles in operation, the age and distance driven of the vehicle fleet, and the average useful life and quality of vehicle parts. Although more vehicles are on the road than ever before, the aftermarket has experienced longer replacement cycles due to the improved quality of OE parts and increases in the average useful life of automotive parts as a result of technological innovation. Suppliers are increasingly being required to deliver innovative aftermarket products to drive increased aftermarket demand. Global economic downturns generally impact aftermarket sales less adversely than OE sales, as customers forego new vehicle purchases and keep their vehicles longer, thereby increasing demand for repair and maintenance services.
9
Industry Trends
As the dynamics of the markets we serve change, so do the roles, responsibilities and relationships of the participants. Key trends that we believe are affecting parts suppliers include:
General Economic Factors and Production Levels
The economic crisis in 2008 and 2009 materially and negatively impacted the automotive industry and our customers' businesses in the U.S. and elsewhere. Automakers around the world experienced financial difficulties from a weakened economy, tightening credit markets, low consumer confidence, and reduced demand for their products. General Motors and Chrysler reorganized under bankruptcy protection in 2009, and other OE manufacturers took actions to improve profitability and remain solvent. The automotive supply base in turn also faced severe cash flow problems as a result of the significantly lower production levels of light vehicles, increased costs of certain raw materials, commodity and energy costs, and restricted access to additional liquidity through the capital markets. Consumers facing a weak job market and inadequate financing options were reluctant to purchase durable goods such as automobiles.
As a result of the lack of consumer confidence caused by the global economic downturn and credit market crisis, the industry experienced a rapid decline in light vehicle purchases in 2008 and the first half of 2009. The industry began to recover during the second half of 2009 when OE light vehicle production began to stabilize and then strengthen, as inventory levels began to be replenished, tracking more closely to vehicle sales. In 2010, light vehicle production continued to strengthen, evidenced by North America, Asia Pacific and Europe light vehicle production volumes increasing 39 percent, 30 percent and 16 percent, respectively in 2010 as compared to 2009. Production volumes continued to strengthen in 2011 in most geographic regions in which we operate. For example, production volumes in North America and Europe increased 10 percent and five percent, respectively, in 2011, though still not to the levels seen in recent history. The Asia Pacific region experienced a decline of two percent in production volumes as a result of a continued decline in industry production in Australia, and lower OE volumes in Thailand and Japan as a result of the flooding and earthquakes experienced in those regions in 2011.
Increasing Environmental Standards
OE manufacturers and their parts suppliers are designing and developing products to respond to increasingly stringent environmental requirements, growth in the diesel markets and increased demands for better fuel economy. Government regulations adopted over the past decade require substantial reductions in vehicle tailpipe emissions, longer warranties on parts of a vehicle's pollution control equipment and additional equipment to control fuel vapor emissions. Manufacturers are responding with new technologies for gasoline- and diesel-fueled vehicles that minimize pollution and improve fuel economy.
As a leading supplier of emission control systems with strong technical capabilities, we believe we are well positioned to benefit from the more rigorous environmental standards being adopted around the world. We continue to expand our investment in regions such as China, India and Thailand to capitalize on growing demand for environmentally friendly solutions for light and commercial vehicles driven by environmental regulations in these regions.
To meet stricter air quality regulations, we have developed and sold diesel particulate filters (DPFs) for the Mercedes Benz Sprinter and BMW 1 and 3 series passenger cars in Europe and for GM Duramax engine applications, the Ford Super Duty, the Chrysler Ram, Navistar medium-duty trucks in North America, and off-road applications for Caterpillar and John Deere in Europe and North America. These particulate filters, coupled with converters, reduce emissions of particulate matter by up to 90 percent and of nitrogen oxide by up to 85 percent. In addition, we have development and production contracts for our selective catalytic reduction (SCR) systems with light and medium-duty truck manufacturers in North America, South America, Europe and Asia. In China, we have development contracts for complete turnkey SCR systems, including the ELIM-NOx urea dosing technology acquired in 2007, now sold globally under the name XNOx TM . Customers have also purchased prototypes of our hydrocarbon injector, a product acquired in 2007 alongside our XNOx TM technology, which is used to inject hydrocarbon directly into the exhaust system to regenerate diesel particulate filters and
10
Lean NOx Traps. New regulations in the U.S. and European markets, which require reductions in carbon dioxide emissions and improvements in fuel economy, are creating increased demand for our fabricated manifolds, maniverters, integrated turbocharger/manifold modules, electronic exhaust valves, and lighter weight components. Lastly, for various off-road customers, we have developed emission aftertreatment systems designed to meet Tier 4A and Tier 4 final environmental regulations. Both on-road and off-road customers are embracing the concept of turnkey aftertreatment systems, where we have developed and sold both electronic aftertreatment electronic control units (ECUs) as well as the related control software.
Increasing Technologically Sophisticated Content
As consumers continue to demand vehicles with improved performance, safety and functionality at competitive prices, the components and systems in these vehicles are becoming technologically more advanced and sophisticated. Mechanical functions are being replaced with electronics; and mechanical and electronic devices are being integrated into single systems. More stringent emission and other regulatory standards are increasing the complexity of the systems as well.
To remain competitive as a parts and systems supplier, we invest in engineering, research and development, spending $133 million in 2011, $117 million in 2010, and $97 million in 2009, net of customer reimbursements. In addition, we build prototypes and incur other costs on behalf of our customers to further our technological capabilities. Such expenses reimbursed by our customers totaled $119 million in 2011, $110 million in 2010, and $104 million in 2009. We also fund and sponsor university and other independent research to advance our emission control and ride control development.
By investing in technology, we can expand our product offerings and penetrate new markets. For example, we developed DPFs which were first sold in Europe and then offered in North America. Since these original innovations, we have developed T.R.U.E-Clean ® with our partners, a product used to regenerate DPFs. We have also built prototypes of urea SCR systems for locomotive and marine engines. We expanded our suite of NOx-reduction technologies, developing prototypes of SCR systems using solid forms of ammonia as the reductant and a hydrocarbon lean NOx catalyst (HC-LNC for NOx reduction) that relies on hydrocarbons or other reductants instead of urea. For example, we are in a period of exclusive development with General Electric, utilizing their proprietary hydrocarbon lean NOx catalyst (HC-LNC for NOx reduction), and have multiple customers testing this system in Brazil. We successfully developed and sold fabricated manifolds, used only on gasoline engines, into the passenger car diesel segment. Recently, we developed and sold our first aftertreatment system for large engines, up to 4500 horsepower, used as line haul locomotives. On the ride control side of our business, we co-developed with Öhlins Racing AB a continuously controlled electronic suspension system (CES) now offered by Volvo, Audi, Ford, VW and Mercedes Benz in their vehicles.
Enhanced Vehicle Safety and Handling
In 2009, with the adoption of Regulation No. 661/2009, Europe made electronic stability control (ESC) systems mandatory for all passenger cars and commercial vehicles being newly introduced to the market beginning in 2011. This regulation was further expanded to include all passenger cars and commercial vehicles (regardless of when the relevant car model was first approved for introduction into the market) beginning in November 2014. In addition, the U.S. made ESC systems mandatory by 2012 with the adoption of the Federal Motor Vehicle Safety Standard 126 (FMVSS-126). OEMs, to serve the needs of their customers and meet government mandates, are seeking parts suppliers that invest in new technologies, capabilities and products that advance vehicle safety, such as roll-over protection systems, computerized electronic suspension, and safer, more durable materials. Those suppliers able to offer such innovative products and technologies have a distinct competitive advantage.
Tenneco co-developed with Öhlins Racing AB, CES, and offers Kinetic ® ride control technology to improve vehicle stability and handling. We also develop other advanced suspension systems like Actively Controlled Car (ACOCAR) TM that are being designed to provide improved vehicle safety and control. Further, we introduced premium Monroe ® branded brakes to the aftermarket to further complement our product offerings
11
in the aftermarket space. In addition to these efforts, we continue to promote the Safety Triangle TM of Steering-Stopping-Stability to educate consumers about the detrimental effect of worn shock absorbers on vehicle steering and stopping distances.
Outsourcing and Demand for Systems and Modules
OEMs have steadily outsourced more of the design and manufacturing of vehicle parts and systems to simplify the assembly process, lower costs and reduce development times. Furthermore, they have demanded fully integrated, functional systems made possible with the development of advanced electronics in addition to innovative, individual vehicle components and parts that may not readily interface together. As a result, successful parts suppliers offer a variety of component products individually as well as integrated modules and systems:
| • | "Modules" are groups of component parts arranged in close physical proximity to each other within a vehicle. Modules are often assembled by the supplier and shipped to the OEM for installation in a vehicle as a unit. Integrated shock and spring units, seats, instrument panels, axles and door panels are examples. |
| • | "Systems" are groups of component parts located throughout a vehicle which operate together to provide a specific vehicle functionality. Emission control systems, anti-lock braking systems, safety restraint systems, roll control systems and powertrain systems are examples. |
This shift towards fully integrated systems created the role of the Tier 1 systems integrator, a supplier responsible for executing a broad array of activities, including design, development, engineering, and testing of component parts, systems and modules. With more than a decade of experience as an established Tier 1 supplier, we have produced modules and systems for various vehicle platforms produced worldwide, supplying ride control modules for the Chevrolet Silverado, GMC Sierra, Chevrolet Malibu, Chevrolet Impala and Chevrolet Cruze and emission control systems for the Ford Super Duty, Ford Focus, Chevrolet Silverado, GMC Sierra, Chevrolet Malibu, Opel Astra, and VW Golf. In addition, we continue to design other modules and systems for platforms yet to be introduced to the global marketplace.
Global Reach of OE Customers
Changing market dynamics are driving OE manufacturers and their parts suppliers to expand their global reach:
| • | Growing Importance of Developing Markets: Because the North American and Western European automotive markets are mature, OEMs are increasingly focusing on developing markets for growth opportunities, particularly Brazil, Russia, India and China, collectively known as the BRIC economies, as well as Thailand. As OEMs have penetrated new regions, growth opportunities for suppliers have emerged. |
| • | Governmental Tariffs and Local Parts Requirements: Many governments around the world require vehicles sold within their country to contain specified percentages of locally produced parts. Additionally, some governments place high tariffs on imported parts. |
| • | Location of Production Closer to End Markets: As OE manufacturers and parts suppliers have shifted production globally to be closer to their end markets, suppliers have expanded their reach, capturing sales in developing markets and taking advantage of relatively lower labor costs. |
Because of these trends, OE manufacturers are increasingly seeking suppliers capable of supporting vehicle platforms on a global basis. They want suppliers like Tenneco with design, production, engineering and logistics capabilities that can be accessed not just in North America and Europe but also in the developing markets.
Global Rationalization of OE Vehicle Platforms
OE manufacturers continue to standardize on "global platforms," designing basic mechanical structures that are each suited for a number of similar vehicle models and able to accommodate different features for more than one region. Light vehicle platforms of over one million units are expected to grow from 42 percent to 51 percent of global OE production from 2011 to 2016.
12
With such global platforms, OE manufacturers realize significant economies of scale by limiting variations in items such as steering columns, brake systems, transmissions, axles, exhaust systems, support structures and power window and door lock mechanisms. The shift towards standardization can also benefit automotive parts suppliers. They can experience greater economies of scale, lower material costs, and reduced development costs.
Extended Product Life of Automotive Parts
The average useful life of automotive parts, both OE and replacement, has been steadily increasing in recent years due to technological innovations including longer-lasting materials. As a result, although there are more vehicles on the road than ever before, the global aftermarket has not kept pace with that growth. Accordingly, aftermarket suppliers have focused on reducing costs and providing product differentiation through advanced technology and recognized brand names. With our long history of technological innovation, strong brands and operational effectiveness, we believe we are well positioned to leverage our products and technology.
Changing Aftermarket Distribution Channels
From 2001 to 2011, the number of retail outlets supplying aftermarket parts increased significantly while the number of jobber stores declined 10 percent in the U.S. Major aftermarket retailers, such as AutoZone and Advance Auto Parts, attempted to expand their commercial sales by selling directly to parts installers, which had historically purchased from their local warehouse distributors and jobbers, as they continued to market to individual retail consumers. Retailers now have the option to offer premium brands which are often preferred by their commercial customers in addition to standard products which are often selected by their individual store buyers. We believe we are well positioned to respond to this trend because we continue to produce high-quality, premium brands and products. As distribution channels continue to consolidate, both wholesalers and retailers can realize the benefits of sourcing products from a supplier like Tenneco with our breadth of suspension and emissions control products.
Analysis of Revenues
The table below provides, for each of the years 2009 through 2011, information relating to our net sales and operating revenues, by primary product lines and customer categories.
| Net Sales Year Ended December 31, | ||||||||||||
| 2011 | 2010 | 2009 | ||||||||||
| (Millions) | ||||||||||||
Emission Control Products & Systems | ||||||||||||
Aftermarket | $ | 351 | $ | 318 | $ | 315 | ||||||
Original Equipment | ||||||||||||
OE Value-add | 2,732 | 2,223 | 1,638 | |||||||||
OE Substrate(1) | 1,678 | 1,284 | 966 | |||||||||
|
|
|
|
|
| |||||||
| 4,410 | 3,507 | 2,604 | ||||||||||
|
|
|
|
|
| |||||||
| 4,761 | 3,825 | 2,919 | ||||||||||
|
|
|
|
|
| |||||||
Ride Control Products & Systems | ||||||||||||
Aftermarket | 944 | 851 | 721 | |||||||||
Original Equipment | 1,500 | 1,261 | 1,009 | |||||||||
|
|
|
|
|
| |||||||
| 2,444 | 2,112 | 1,730 | ||||||||||
|
|
|
|
|
| |||||||
Total Revenues | $ | 7,205 | $ | 5,937 | $ | 4,649 | ||||||
|
|
|
|
|
| |||||||
| (1) | See "Management's Discussion and Analysis of Financial Condition and Results of Operations" included in Item 7 for a discussion of substrate sales. |
13
Brands
In each of our operating segments, we manufacture and market products with leading brand names. Monroe ® ride control products and Walker ® exhaust products are two of the most recognized brands in the industry. We emphasize product value differentiation with brands such as Monroe ® , Axios TM (suspension products), Kinetic TM and Fric-Rot TM (ride control products) , DynoMax ® , Thrush TM and Lukey TM (performance exhaust products), Rancho ® (ride control products for the high performance light truck market), Clevite ® Elastomers (noise, vibration and harshness control components), and Marzocchi ® (forks and suspensions for the two-wheeler market).
Customers
We have developed long-standing business relationships with our customers around the world. In each of our operating segments, we work collaboratively with our customers in all stages of production, including design, development, component sourcing, quality assurance, manufacturing and delivery. With a diverse mix of OE and aftermarket products and facilities in major markets worldwide, we believe we are well positioned to meet customer needs. We believe we have a strong, established reputation with customers for providing high-quality products at competitive prices, as well as for timely delivery and customer service.
Worldwide we serve more than 64 different OEMs and Commercial Vehicle engine manufacturers, and our products are included on nine of the top 10 passenger car models produced for sale in Europe and nine of the top 10 light truck models produced for sale in North America for 2011.
During 2011, our OEM and Commercial Vehicle engine manufacturer customers included:
| North America | Europe | Asia | ||
| AM General | AvtoVAZ | Beijing Automotive | ||
| Caterpillar | BMW | BMW | ||
| Club Car | Caterpillar | Brilliance Automobile | ||
| Daimler AG | Daimler AG | Changan Automotive | ||
| E-Z Go | Deutz AG | Daimler AG | ||
| Fiat-Chrysler | Ducati Motor | Dongfeng Motor | ||
| Fiat Industrial (CNH) | Fiat-Chrysler | Ducati Motor | ||
| Ford Motor | Fiat Industrial (Iveco) | First Auto Works | ||
| General Motors | Ford Motor | Ford Motor | ||
| Harley-Davidson | Geely Automobile | Geely Automobile | ||
| Honda Motors | General Motors | General Motors | ||
| Hyundai Motor | Harley-Davidson | Great Wall Motor | ||
| John Deere | John Deere | Hyundai Motor | ||
| Navistar International | Mazda Motor | Isuzu Motors | ||
| Nissan Motor | McLaren Automotive | Jiangling Motors | ||
| Oshkosh Truck | Nissan Motor | Nissan Motor | ||
| Paccar | Paccar | SAIC Motor | ||
| Toyota Motor | Porsche | Suzuki Motor | ||
| Volkswagen Group | PSA Peugeot Citroen | Volkswagen Group | ||
| Volvo Global Truck | Renault | Weichai Power | ||
| Suzuki Motor | ||||
| Tata Motors | ||||
| Toyota Motor | ||||
| Volkswagen Group | ||||
| Volvo Global Truck |
14
| Australia | South America | India | ||
| Club Car | Daimler AG | Club Car | ||
| Fiat Industrial (Iveco) | Fiat-Chrysler | E-Z Go | ||
| Ford Motor | Fiat Industrial (Iveco) | Fiat-Chrysler | ||
| General Motors | Ford Motor | Ford Motor | ||
| Mazda Motor | General Motors | General Motors | ||
| Toyota Motor | MAN SE | Isuzu Motor | ||
| Navistar International | Mahindra & Mahindra | |||
| Nissan Motor | Nissan Motor | |||
| PSA Peugeot Citroen | Suzuki Motor | |||
| Renault | Tata Motors | |||
| Toyota Motor | Toyota Motor | |||
| Volkswagen Group | Volkswagen Group | |||
| Volvo Global Truck |
The following customers accounted for 10 percent or more of our net sales in any of the last three years.
Customer | 2011 | 2010 | 2009 | |||||||||
General Motors | 19 | % | 19 | % | 16 | % | ||||||
Ford | 15 | % | 13 | % | 14 | % | ||||||
During 2011, our aftermarket customers were comprised of full-line and specialty warehouse distributors, retailers, jobbers, installer chains and car dealers. These customers included National Auto Parts Association (NAPA), Advance Auto Parts, Uni-Select, and O'Reilly Automotive in North America, Temot Autoteile GmbH, Autodistribution International, Group Auto Union, Auto Teile Ring and AP United in Europe and Rede Presidente in South America. We believe our revenue mix is balanced, with our top 10 aftermarket customers accounting for 40 percent of our net aftermarket sales and our aftermarket sales representing 18 percent of our total net sales in 2011.
Competition
We operate in highly competitive markets. Customer loyalty is a key element of competition in these markets and is developed through long-standing relationships, customer service, high quality value-added products and timely delivery. Product pricing and services provided are other important competitive factors.
In both the OE light vehicle market and aftermarket, we compete with the vehicle manufacturers, some of which are also customers of ours, and numerous independent suppliers. In the OE market, we believe that we rank among the top two suppliers in certain key markets we serve throughout the world for both emission control and ride control products and systems for light vehicles. In the aftermarket, we believe that we are the market share leader in supplying emission control and ride control products for light vehicles in certain key markets we serve throughout the world.
Seasonality
Our OE and aftermarket businesses are somewhat seasonal. OE production is historically higher in the first half of the year compared to the second half. It decreases in the third quarter due to OE plant shutdowns for model changeovers, and softens in the fourth quarter due to reduced consumer demand for new vehicles during the holiday season and the winter months in North America and Europe generally. Our aftermarket operations, also affected by seasonality, experience relatively higher demand during the spring as vehicle owners prepare for the summer driving season.
While seasonality does impact our business, actual results may vary from the above trends due to global and local economic dynamics as well as industry-specific platform launches and other production-related events. During periods of economic recession, OE sales traditionally decline due to reduced consumer demand for
15
automobiles and other capital goods. Aftermarket sales tend not to be as adversely affected during periods of economic downturn, as consumers forego new vehicle purchases and keep their vehicles longer, thereby increasing demand for repair and maintenance services. By participating in both the OE and aftermarket segments, we generally see a smaller revenue decline during economic downturns than the overall change in OE production.
During the recent global recession that began in 2008, seasonal OE plant closures were longer and more pronounced and aftermarket inventory levels remained leaner than normal. As the industry began to recover, the effects of seasonality were somewhat masked during the later half of 2009 through 2010, as OE sales and inventories improved from their depressed levels as consumers began spending again on the maintenance and repair of their vehicles. In 2011, our production of parts returned to our normal seasonal trend of higher OE volumes in the first half of the year and higher AM volumes in the spring and summer months.
Emission Control Systems
Vehicle emission control products and systems play a critical role in safely conveying noxious exhaust gases away from the passenger compartment and reducing the level of pollutants and engine exhaust noise emitted to acceptable levels. Precise engineering of the exhaust system - extending from the manifold that connects an engine's exhaust ports to an exhaust pipe, to the catalytic converter that eliminates pollutants from the exhaust, and to the muffler that modulates noise and emissions - leads to a pleasant, tuned engine sound, reduced pollutants and optimized engine performance.
We design, manufacture and distribute a variety of products and systems designed to reduce pollution and optimize engine performance, acoustic tuning and weight, including the following:
| • | Catalytic converters and diesel oxidation catalysts - Devices consisting of a substrate coated with precious metals enclosed in a steel casing used to reduce harmful gaseous emissions, such as carbon monoxide; |
| • | Diesel Particulate Filters (DPFs) - Devices to capture and regenerate particulate matter emitted from diesel engines; |
| • | Burner systems - Devices which actively combust fuel and air inside the exhaust system to create extra heat for DPF regeneration, or for improved efficiency of SCR systems; |
| • | Lean NOx traps - Devices which reduce Nitrogen Oxide (NOx) emissions from diesel powertrains using capture and store technology; |
| • | Hydrocarbon vaporizers and injectors - Devices to add fuel to a diesel exhaust system in order to regenerate diesel particulate filters or Lean NOx traps; |
| • | Selective Catalytic Reduction (SCR) systems - Devices which reduce NOx emissions from diesel powertrains using injected reductants such as Verband der Automobil Industrie e.V. (AdBLue) TM or Diesel Exhaust Fluid (DEF); |
| • | Alternative NOx reduction technologies - Devices which reduce NOx emissions from diesel powertrains, by using alternative reductants such as diesel fuel, E85 (85% ethanol, 15% gasoline), or solid forms of ammonia; |
| • | Mufflers and resonators - Devices to provide noise elimination and acoustic tuning; |
| • | Fabricated Exhaust manifolds - Components that collect gases from individual cylinders of a vehicle's engine and direct them into a single exhaust pipe; fabricated manifolds can form the core of an emissions module including an integrated catalytic converter (maniverter) and/or turbocharger; |
| • | Pipes - Utilized to connect various parts of both the hot and cold ends of an exhaust system; |
| • | Hydroformed assemblies - Forms in various geometric shapes, such as Y-pipes or T-pipes, which provide optimization in both design and installation as compared to conventional pipes; |
16
| • | Hangers and isolators - Used for system installation and elimination of noise and vibration, and for the improvement of useful life; and |
| • | Aftertreatment control units - Computerized electronic devices that utilize embedded software to regulate the performance of active aftertreatment systems, including the control of sensors, injectors, vaporizers, pumps, heaters, valves, actuators, wiring harnesses, relays and other mechatronic components. |
For the catalytic converters we sell, we either buy completed catalytic converters systems or procure substrates coated with precious metals which we incorporate into full systems. We obtain these components and systems from third parties or directly from OE manufacturers, often at the OEM's direction. See Item 7, "Management's Discussion and Analysis of Financial Condition and Results of Operations" for more information on our sales of these products.
We supply our emission control offerings to 28 light vehicle manufacturers for use on over 215 light vehicle models, including six of the top 10 passenger car models produced in Europe and six of the top 10 light truck models produced in North America for 2011. We also supply emission control products to 18 manufacturers of commercial vehicles and engines, and specialty vehicles including Harley-Davidson, BMW Motorcycle, Daimler Trucks, Navistar, Caterpillar, John Deere, Deutz and Weichai Power.
We entered the emission control market in 1967 with the acquisition of Walker Manufacturing Company, which was founded in 1888, and became one of Europe's leading OE emission control systems suppliers with the acquisition of Heinrich Gillet GmbH & Co. in 1994. Throughout this document, the term "Walker" refers to our subsidiaries and affiliates that produce emission control products and systems.
In the aftermarket, we manufacture, market and distribute replacement mufflers for virtually all North American, European, and Asian light vehicle models under brand names including Quiet-Flow ® , Tru-Fit ® and Aluminox Pro TM , in addition to offering a variety of other related products such as pipes and catalytic converters (Walker ® Perfection). We also serve the specialty exhaust aftermarket with offerings that include Mega-Flow ® exhaust products for heavy-duty vehicle applications and DynoMax ® high performance exhaust products. We continue to emphasize product-value differentiation with other aftermarket brands such as Thrush ® and Fonos TM .
Ride Control Systems
Superior ride control is governed by a vehicle's suspension system, including shock absorbers and struts. Shock absorbers and struts maintain the vertical loads placed on vehicle tires, helping keep the tires in contact with the road. Vehicle steering, braking, acceleration and safety depends on maintaining contact between the tires and the road. Worn shocks and struts can allow excess transfer of the vehicle's weight - either from side to side which is called "roll;" from front to rear which is called "pitch;" or up and down, which is called "bounce." Shock absorbers and struts are designed to control the vertical loads placed on tires and thereby provide resistance to vehicle roll, pitch and bounce. They function as safety components and provide a comfortable ride.
We design, manufacture and distribute a variety of ride control products and systems including:
| • | Shock absorbers - A broad range of mechanical shock absorbers and related components for light- and heavy-duty vehicles, including twin-tube and monotube shock absorbers; |
| • | Struts - A complete line of struts and strut assemblies for light vehicles; |
| • | Vibration control components (Clevite ® Elastomers, Axios ™ ) - Generally, rubber-to-metal bushings and mountings to reduce vibration between metal parts of a vehicle. Offerings include a broad range of suspension arms, rods and links for light- and heavy-duty vehicles; |
| • | Kinetic ® suspension technology - A suite of roll-control and nearly equal wheel-loading systems ranging from simple mechanical systems to complex hydraulic systems featuring proprietary and patented technology. The Kinetic ® suspension technology was incorporated on the Citroën World Rally Car that was featured in the World Rally Championship of 2003, 2004 and 2005. Additionally, the Kinetic ® suspension technology was offered on the Lexus GX 470 sport utility vehicle which resulted in our winning the PACE Award; |
17
| • | Advanced suspension systems - Shock absorbers and suspension systems that electronically adjust a vehicle's performance based on inputs such as steering and braking; and |
| • | Other - We also offer other ride control products such as load assist products, springs, steering stabilizers, adjustable suspension systems, suspension kits and modular assemblies. |
We supply our ride control offerings to 22 light vehicle manufacturers for use on over 150 light vehicle models, including five of the top 10 passenger car models produced in Europe and nine of the top 10 light truck models produced in North America for 2011. We also supply ride control products and systems to over 40 commercial and specialty vehicle manufacturers including Volvo Truck, Scania, Navistar, Daimler Trucks and PACCAR.
In the ride control aftermarket, we manufacture, market and distribute replacement shock absorbers for virtually all North American, European and Asian light vehicle models under several brand names including Gas-Matic ® , Sensa-Trac ® , Monroe Reflex ® and Monroe Adventure TM , Quick-Strut ® , as well as Clevite ® Elastomers for elastomeric vibration control components. We also sell ride control offerings for the heavy-duty, off-road and specialty aftermarket, such as our Gas-Magnum ® shock absorbers for the North American heavy-duty category and Marzocchi front forks for two-wheelers.
We entered the ride control product line in 1977 with the acquisition of Monroe Auto Equipment Company, which was founded in 1916, and introduced the world's first modern tubular shock absorber in 1930. When the term "Monroe" is used in this document it refers to our subsidiaries and affiliates that produce ride control products and systems.
Financial Information About Geographic Areas
Refer to Note 11 of the consolidated financial statements of Tenneco Inc. included in Item 8 of this report for financial information about geographic areas.
Sales, Marketing and Distribution
We have separate and distinct sales and marketing efforts for our OE and aftermarket businesses.
For OE sales, our sales and marketing team is an integrated group of professionals, including skilled engineers and program managers, who are organized by customer and product type (e.g., ride control and emission control). Our sales and marketing team provides the appropriate mix of operational and technical expertise needed to interface successfully with the OEMs. Our new business "capture process" involves working closely with the OEM platform engineering and purchasing teams. Bidding on OE automotive platforms typically encompasses many months of engineering and business development activity. Throughout the process, our sales team, program managers and product engineers assist the OE customer in defining the project's technical and business requirements. A normal part of the process includes our engineering and sales personnel working on customers' integrated product teams, and assisting with developing component/system specifications and test procedures. Given that the OE business involves long-term production contracts awarded on a platform-by-platform basis, our strategy is to leverage our engineering expertise and strong customer relationships to target and win new business and increase operating margins.
For aftermarket sales and marketing, our sales force is generally organized by customer and region and covers multiple product lines. We sell aftermarket products through four primary channels of distribution: (1) the traditional three-step distribution system of full-line warehouse distributors, jobbers and installers; (2) the specialty two-step distribution system of specialty warehouse distributors that carry only specified automotive product groups and installers; (3) direct sales to retailers; and (4) direct sales to installer chains. Our aftermarket sales and marketing representatives cover all levels of the distribution channel, stimulating interest in our products and helping our products move through the distribution system. Also, to generate demand for our products from end-users, we run print and television advertisements and offer pricing promotions. We offer business-to-business services to customers with TA-Direct, an on-line order entry and customer service tool. In addition, we maintain detailed web sites for each of Walker ® , Monroe ® , Rancho ® , DynoMax ® , Monroe brake brands and our heavy-duty products.
18
Manufacturing and Engineering
We focus on achieving superior product quality at the lowest operating costs possible using productive, reliable and safe manufacturing processes to achieve that goal. Our manufacturing strategy centers on a lean production system called the Tenneco Manufacturing System (TMS), that is designed to eliminate waste, develop skills, share best practices and lead our manufacturing enterprise to reduce overall costs, while maintaining quality standards and reducing manufacturing cycle time. As part of TMS, we use Six Sigma techniques both in manufacturing and design to minimize product defects and improve operational efficiencies. We deploy new technology to differentiate our products from our competitors and to achieve higher quality and productivity. We continue to adapt our capacity to customer demand, both expanding capabilities in growth areas as well as reallocating capacity away from segments in decline.
Emission Control
Our consolidated businesses operate 11 emission control manufacturing facilities in the U.S. and 46 emission control manufacturing facilities outside of the U.S. We operate 16 of these international manufacturing facilities through joint ventures in which we hold a controlling interest. We operate five emission control engineering and technical facilities worldwide and share two other such facilities with our ride control operations. In addition, two joint ventures in which we hold a noncontrolling interest operate a total of two manufacturing facilities outside the U.S.
Within each of our emission control manufacturing facilities, operations are organized by component (e.g., muffler, catalytic converter, pipe, resonator and manifold). Our manufacturing systems incorporate cell-based designs, allowing work-in-process to move through the operation with greater speed and flexibility. We continue to invest in plant and equipment to stay competitive in the industry. For instance, in our Smithville, Tennessee, OE manufacturing facility, we have developed a muffler assembly cell that utilizes laser welding. This allows for quicker change-over times in the process as well as less material used and less weight for the product. There is also a reduced cycle time compared to traditional joining and increased manufacturing precision for superior durability and performance. In 2007, we introduced the Measured and Matched Converter technique in North America. This allows us to maintain the optimum GBD (Gap Bulk Density) in our converter manufacturing operations with Tenneco proprietary processing. This process, coupled with cold spinning of the converter body, versus traditional cone to can welding, allows for more effective use of material through reduced welding, lower cost, and better performance of the product. In 2009, we introduced low-cost fabricated diesel manifolds in Europe which utilize advanced manufacturing processes such as deep drawing, laser welding, and furnace brazing.
To strengthen our position as a Tier 1 OE systems supplier, we have developed some of our emission control manufacturing operations into "just-in-time" or "JIT" systems. In this system, a JIT facility located close to our OE customer's manufacturing plant receives product components from both our manufacturing operations and independent suppliers, and then assembles and ships products to the OEMs on an as-needed basis. To manage the JIT functions and material flow, we have advanced computerized material requirements planning systems linked with our customers' and supplier partners' resource management systems. We have three emission control JIT assembly facilities in the United States and 23 throughout the rest of the world.
Our engineering capabilities include advanced predictive design tools, advanced prototyping processes and state-of-the-art testing equipment. These technological capabilities make us a "full system" integrator to the OEMs, supplying complete emission control systems from the manifold to the tailpipe, to provide full emission and noise control. We expanded our engineering capabilities with the 2007 acquisition of Combustion Component Associates' ELIM-NOx, mobile emission technology, now sold globally under the XNOx TM name, that includes urea and hydrocarbon injection, and electronic controls and software for selective catalytic reduction. We also offer a complete suite of alternative full system NOx aftertreatment technologies, including the Hydrocarbon Lean NOx Catalyst (HC-LNC) technology under joint development with General Electric, and SOLID SCR TM technology licensed from FEV, a powertrain development and engineering company based in Germany. We also developed advanced predictive engineering tools, including KBM&E (Knowledge Based
19
Manufacturing & Engineering). The innovation of our KBM&E (which we call TEN-KBM&E) is a modular toolbox set of CAD embedded applications for manufacturing and engineering compliant design. The encapsulated TEN-KBM&E content is driven by an analytical method which continuously captures and updates the knowledge of our main manufacturing and engineering processes. Our global engineering capabilities are standardized through the use of the ATLAS Global PDM (Product Data Management) system, enabling a more efficient transfer of knowledge around the world.
Ride Control
Our consolidated businesses operate seven ride control manufacturing facilities in the U.S. and 23 ride control manufacturing facilities outside the U.S. We operate two of these international facilities through joint ventures in which we hold a controlling interest. We operate seven engineering and technical facilities worldwide and share two other such facilities with our emission control operations.
Within each of our ride control manufacturing facilities, operations are organized by product (e.g., shocks, struts and vibration control products) and include computer numerically controlled and conventional machine centers; tube milling and drawn-over-mandrel manufacturing equipment; metal inert gas and resistance welding; powdered metal pressing and sintering; chrome plating; stamping; and assembly/test capabilities. Our manufacturing systems incorporate cell-based designs, allowing work-in-process to move through the operation with greater speed and flexibility.
To strengthen our position as a Tier 1 OE module supplier, we have developed some of our manufacturing operations into JIT systems. We have two JIT ride control facilities outside the U.S.
In designing our shock absorbers and struts, we use advanced engineering and test capabilities to provide product reliability, endurance and performance. Our engineering capabilities feature advanced computer-aided design equipment and testing facilities. Our dedication to innovative solutions has led to such technological advances as:
| • | Adaptive damping systems - adapt to the vehicle's motion to better control undesirable vehicle motions; |
| • | Electronically adjustable suspensions - change suspension performance based on a variety of inputs such as steering, braking, vehicle height, and velocity; and |
| • | Air leveling systems - manually or automatically adjust the height of the vehicle. |
Conventional shock absorbers and struts generally compromise either ride comfort or vehicle control. Our innovative grooved-tube, gas-charged shock absorbers and struts provide both ride comfort and vehicle control, resulting in improved handling, reduced vibration and a wider range of vehicle control. This technology can be found in our premium quality Sensa-Trac ® shock absorbers. We further enhanced this technology by adding the SafeTech TM fluon banded piston, which improves shock absorber performance and durability. We introduced the Monroe Reflex ® shock absorber, which incorporates our Impact Sensor TM device. This technology permits the shock absorber to automatically switch in milliseconds between firm and soft compression, damping when the vehicle encounters rough road conditions, and thus maintaining better tire-to-road contact and improving handling and safety. We developed the Quick-Strut ® which simplifies and shortens the installation of aftermarket struts. This technology combines the spring and upper mount into a single, complete module, eliminating the need for special tools and skills required previously. We have also developed an innovative computerized electronic suspension system, which features dampers developed by Tenneco and electronic valves designed by Öhlins Racing AB. The continuously controlled electronic suspension ("CES") ride control system is featured on Audi, Volvo, Ford, VW, BMW, and Mercedes Benz vehicles.
Quality Control
Quality control is an important part of our production process. Our quality engineers establish performance and reliability standards in the product's design stage, and use prototypes to confirm that the component/system can be manufactured to specifications. Quality control is also integrated into the manufacturing process, with shop operators responsible for quality control of their specific work product. In addition, our inspectors test work-in-progress at various stages to ensure components are being fabricated to meet customers' requirements.
20
We believe our commitment to quality control and sound management practices and policies is demonstrated by our successful participation in the International Standards Organization/Technical Specifications certification process ("ISO/TS"). ISO/TS certifications are semi-annual or annual audits that certify that a company's facilities meet stringent quality and business systems requirements. Without ISO or TS certification, we would not be able to supply our products for the aftermarket or the OE market, respectively, either locally or globally. All of our manufacturing facilities where we have determined that TS certification is required to serve our customers or would provide us with an advantage in securing additional business, have achieved ISO/TS 16949 certification.
Global Procurement Management
Our direct and indirect material costs represent a significant component of our cost structure. To ensure that our material acquisition process provides both a local and global competitive advantage, in addition to meeting regional legislative requirements, we have designed globally integrated standard processes which are managed by global teams of commodity specialists. Each global commodity strategy is tailored to regional requirements while leveraging our global scale to deliver the most cost effective solutions at a local level.
Business Strategy
We strive to strengthen our global market position by designing, manufacturing, delivering and marketing technologically innovative emission control and ride control products and systems for OEMs and the aftermarket. We work toward achieving a balanced mix of products, markets and customers by capitalizing on emerging trends, specific regional preferences and changing customer requirements. We target both mature and developing markets for both light vehicle and commercial and specialty vehicle business. We further enhance our operations by focusing on operational excellence in all functional areas.
The key components of our business strategy are described below:
Develop and Commercialize Advanced Technologies
We develop and commercialize technologies that allow us to expand into new, fast-growing markets and serve our existing customers. By anticipating customer needs and preferences, we design advanced technologies that meet global market needs. For example, to meet the increasingly stringent emissions regulations being introduced around the world, we offer several technologies designed to reduce NOx emissions on passenger and commercial vehicles. This includes an integrated Selective Catalytic Reduction (SCR) system that incorporates our ELIM-NOx technology, now sold globally under the name XNOx TM . We also offer a NOx absorber and are developing a hydrocarbon lean NOx catalyst system and a solid form of ammonia SCR system to address NOx emissions. Additionally, we offer thermal management solutions, including our T.R.U.E.-Clean ® active diesel particulate filter system.
We expect available content per vehicle to continue to rise over the next several years. Advanced aftertreatment exhaust systems are required to comply with emissions regulations that affect light and commercial vehicles as well as off-road, locomotive and stationary engines. In addition, vehicle manufacturers, we believe, will offer greater comfort, handling and safety features by offering products such as electronic suspension and adjustable dampers. Our Continuously Controlled Electronic Suspension (CES) shock absorbers, which we co-developed with Öhlins Racing AB, are now sold to Volvo, Audi, Mercedes, VW, and Ford, among others, and our engineered elastomers to manufacturers with unique requirements. Our newest electronic suspension product DRiV TM , based on technology licensed from Sturman Industries, is the first industry example of digital valves for ride control products, thereby offering faster response, lighter weight, and reduced power consumption compared to existing analog products.
We continue to focus on developing highly engineered systems and complex assemblies and modules designed to provide value-added solutions to customers and increase vehicle content generally. Having many of our engineering and manufacturing facilities integrated electronically, we believe, has helped our products continue to be selected for inclusion in top-selling vehicles. In addition, our just-in-time and in-line sequencing manufacturing processes and distribution capabilities have enabled us to be more responsive to our customers' needs.
21
Penetrate Adjacent Markets
We seek to penetrate a variety of adjacent markets and achieve growth in higher-margin businesses by applying our existing design, engineering and manufacturing capabilities. For example, we are aggressively leveraging our technology and engineering leadership in emission and ride control into adjacent markets for two-wheelers, heavy-duty trucks, buses, agricultural equipment, construction machinery and other commercial and specialty vehicles. Commercial vehicle emission control launches are currently underway and will ramp up in line with regulatory enforcement, for on- and off-road equipment in North America, Europe, China and South America. These customers include Caterpillar, for whom we are their global diesel emission control system integrator, as well as John Deere, Navistar, Deutz, Daimler Trucks, MAN SE, China National Heavy Truck Company, Shanghai Diesel Engine Company, Weichai Power, FAW, and YuChai. In addition, we continue to expand into new markets with new customers, including our most recently announced new emission control business with a commercial vehicle customer in Japan. Our 2010 and 2011 revenue generated by our commercial and specialty vehicle business was nine percent and 11 percent, of our total OE revenue, respectively. In 2008, we added the ride control products and technologies of Gruppo Marzocchi to our existing exhaust systems business for two-wheelers. In addition, we are evaluating and selectively pursuing retrofit opportunities which will allow us to penetrate new markets or expand our products in existing markets.
Expand in Developing Markets
We continue to expand our global footprint into growth regions around the world. In 2010, we opened wholly-owned emission control manufacturing facilities in Chennai, India and Guangzhou, China, and a ride control facility in Chonburi, Thailand. In addition, we opened new emission control facilities in Changchun, China and in Beijing, China as a result of our joint venture agreements with FAW Sihuan and Beijing Hainachuan Automotive Part Company Limited, respectively. In 2011 we relocated and expanded two plants in China and increased our investment in Thailand during the third quarter of 2011, by acquiring the remaining interest in our emission control joint venture. We continue to develop our Thailand footprint with the goal of using it as a base for our future operations in that region. As OEMs have expanded in the fast-growing markets of Brazil, Russia, India, China, and Thailand, we have followed, building our capabilities to engineer and produce locally cost-competitive and cutting-edge products, which has enabled us to capture new business.
Maintain Our Aftermarket Leadership
We manufacture and market leading, brand-name products to a diversified and global aftermarket customer base. Two of the most recognized brand-name products in the automotive parts industry are our Monroe ® ride control products and Walker ® emission control products, which have been offered to consumers since the 1930s. We believe our brand equity in the aftermarket is a key asset especially as customers consolidate and distribution channels converge.
We provide value differentiation by creating product extensions bearing our various brands. For example, we offer Monroe Reflex ® and Monroe ® Sensa-Trac ® shock absorbers, Walker ® Quiet-Flow ® mufflers, Rancho ® ride control products, DynoMax ® exhaust products and Walker Ultra ® catalytic converters, and in European markets, Walker and Aluminox Pro TM mufflers. Further, we introduced Monroe ® Springs and Monro-Magnum ® (bus and truck shock line) in Europe and Monroe Dynamics ® and Monroe Ceramics ® brake pads in the United States. We continue to explore other opportunities for developing new product lines that will be marketed under our existing, well-known brands.
We strive to gain market share in the aftermarket business by adding new product offerings and increasing our market coverage of existing brands and products. To this end, we offer an innovative, ride control product, the Quick-Strut ® , that combines the spring and the upper mount into a single, complete module and simplifies and shortens the installation process, eliminating the need for the special tools and skills required previously. We plan on adapting our products further for use in foreign nameplate vehicles with the introduction of OESpectrum to our ride control line. We benefited from the consolidation of, and regional expansion by, our customers and gained business lost by competitors that encountered financial difficulties.
22
Our success in the aftermarket business strengthens our competitive position with OEMs. We gain timely market and product knowledge that can be used to modify and enhance our offerings for greater customer acceptance. On our exhaust product line, we continue to enhance our converter coverage, including additional manifold converter part numbers. In addition, we also offer aftermarket diesel particulate filters.
Execute Focused Transactions
We have successfully identified and capitalized on strategic acquisitions and alliances to achieve growth. Through these acquisitions and alliances, we have (1) expanded our product portfolio with complementary technologies; (2) realized incremental business from existing customers; (3) gained access to new customers; and (4) achieved leadership positions in geographic markets outside North America.
We developed a strategic alliance with Futaba, a leading exhaust manufacturer in Japan. This alliance helps us grow our business with Japan-based OEMs by leveraging the geographical reach of our partner to serve global vehicle platforms of these OEMs. We positioned ourselves as a leading exhaust supplier in the rapidly growing Asian market through our operations in China, India and Thailand. In June 2009, we formed a joint venture with Beijing Hainachuan Automotive Parts Company Limited in Beijing that produces emission control exhaust systems for Hyundai. In addition, we continue to serve North American and European OEMs located in China; we supply luxury cars produced by BMW and Audi through our joint venture with Eberspächer International GmbH, and we supply various Ford platforms through our joint venture with Chengdu Lingchuan Mechanical Plant. We established a local engineering center in Shanghai to develop automotive exhaust products when our joint venture with Shanghai Tractor and Engine Company, a subsidiary of Shanghai Automotive Industry Corp., was expanded. Also, we increased our investment from 60 percent to 80 percent in Tenneco Tongtai Exhaust Company Limited located in Dalian in January 2010 and from 75 percent to 100 percent in our Thailand emission control company, Walker Exhaust Co. Limited in August 2011. Further, we formed a new joint venture in March 2010 with FAW Sihuan to supply emission control components and systems for passenger and commercial vehicles.
In February 2009, we signed a joint development agreement with GE Transportation, a unit of General Electric Company, to develop a proprietary diesel aftertreatment technology for various transportation and other applications. We are collaborating with GE Transportation on the development and production of GE's Hydrocarbon Lean NOx catalyst technology, a diesel aftertreatment innovation aimed at reducing harmful nitrogen oxide (NOx) emissions as effectively as urea-based SCR systems. We are working with others on alternative urea SCR technologies, such as solid forms of ammonia.
We signed exclusive licensing agreements for T.R.U.E. Clean ® , an exhaust aftertreatment technology used for automatic and active regeneration of Diesel Particulate Filters (DPFs), with Woodward Governor Company and for vaporizer technologies with another company. These technologies, which complement our array of existing emissions control products, allow us to provide integrated exhaust aftertreatment systems to commercial vehicle manufacturers and others.
We intend to continue to pursue strategic alliances, joint ventures, acquisitions and other transactions that complement or enhance our existing products, technology, systems development efforts, customer base and/or global presence. We will align with companies that have proven products, proprietary technology, advanced research capabilities, broad geographic reach, and/or strong market positions to further strengthen our product leadership, technology position, global reach and customer relationships.
Adapt Cost Structure to Economic Realities
We aggressively respond to difficult economic environments, aligning our operations to any resulting reductions in production levels and replacement demand and executing comprehensive restructuring and cost-reduction initiatives. In the fourth quarter of 2008, we launched a global restructuring program which included actions to permanently reduce our fixed cost base and flex our costs, such as:
| • | Permanently eliminating 1,100 jobs worldwide, which is in addition to 1,150 jobs previously eliminated in 2008; |
| • | Closing three North American manufacturing plants and an engineering facility in Australia; |
23
| • | Suspending matching contributions to employee 401(k) programs (which we reinstituted in 2010); and |
| • | Cutting spending on information technology, sales and marketing programs. |
During 2009, we further flexed our operations to address the market conditions, implementing temporary layoffs of hourly workers at our plants worldwide that were impacted by customers' plant shutdowns and announced the closing of our original equipment ride control plant in Cozad, Nebraska. In North America, where customer production cuts were the greatest, we also initiated salaried employee furloughs. In Europe, we eliminated all temporary positions and negotiated with various works councils to pursue similar cost reduction efforts including reduced work hours. We instituted salary reductions of at least 10 percent for salaried employees effective April 1, 2009, and implemented other actions to control employee costs. As economic and industry-wide conditions improved, we restored salaries to their prior levels effective October 1, 2009, and reinstated the employer matching contributions to the employee 401(k) plans for the year 2010.
In addition, during 2009, we strategically reduced capital expenditures and engineering investments where possible without compromising our long-term growth prospects. We eliminated or postponed regional expansion projects, deferred spending tied to delayed customer launches, redeployed assets where feasible, and eliminated all discretionary capital spending. We focused on developing technologies and capabilities tied to business launching within the next two to three years, making exceptions in instances where the customer agreed to pay upfront for engineering and advance technology developments for programs launching in 2012 and beyond. In this way, we were able to continue all programs critical to our growth while limiting any near-term cash impact.
In the third quarter of 2011, we completed a restructuring action that permanently eliminated 53 positions, or seven percent of our total workforce in Australia, which put our cost structure more in line with the industry environment. This restructuring is part of a continuing broader plan for the Asia Pacific region where we are positioning Tenneco for growth by re-deploying assets to maximize utilization while at the same time addressing the industry environment in the region.
Strengthen Operational Excellence
We will continue to focus on operational excellence by optimizing our manufacturing footprint, enhancing our Six Sigma processes and Lean productivity tools, developing further our engineering capabilities, managing the complexities of our global supply chain to realize purchasing economies of scale while satisfying diverse and global requirements, and supporting our businesses with robust information technology systems. We will make investments in our operations and infrastructure as required to achieve our strategic goals. We will be mindful of the changing market conditions that might necessitate adjustments to our resources and manufacturing capacity around the world. We will remain committed to protecting the environment as well as the health and safety of our employees.
Environmental Matters
We estimate that we and our subsidiaries will make expenditures for plant, property and equipment for environmental matters of approximately $8 million in 2012 and $3 million in 2013.
For additional information regarding environmental matters, see Item 3, "Legal Proceedings," Item 7, "Management's Discussion and Analysis of Financial Condition and Results of Operations - Environmental and Other Matters," Item 7, "Management's Discussion and Analysis of Financial Condition and Results of Operations - Liquidity and Capital Resources" and Note 12 to the consolidated financial statements of Tenneco Inc. included in Item 8.
Employees
As of December 31, 2011, we had approximately 24,000 employees of whom approximately 48 percent were covered by collective bargaining agreements. European works councils cover 19 percent of our total employees, a majority of whom are also included under collective bargaining agreements. Several of our existing
24
labor agreements in Mexico are scheduled for renegotiation in 2012. In addition, agreements are expiring in 2012 in Europe and South America covering plants in France, Germany, Poland, and Argentina. We regard our employee relations as satisfactory.
Other
The principal raw material that we use is steel. We obtain steel from a number of sources pursuant to various contractual and other arrangements. We believe that an adequate supply of steel can presently be obtained from a number of different domestic and foreign suppliers. In general, steel prices have been increasing since 2004 with the exception of a temporary but significant decline in prices as a result of the economic turmoil in 2008 and 2009. We addressed these price increases by evaluating alternative materials and processes, reviewing material substitution opportunities, increasing component and assembly to best cost countries, as well as strategically pursuing regional and global purchasing strategies for specific commodities, and aggressively negotiating with our customers to allow us to recover these higher costs from them. As global economies continue to recover, we expect increasing price pressure on key commodities, including rubber, oil and steel.
We hold a number of domestic and foreign patents and trademarks relating to our products and businesses. We manufacture and distribute our products primarily under the Walker ® and Monroe ® brand names, which are well-recognized in the marketplace and are registered trademarks. We also sell certain of our emission control products to OE manufacturers under the names SOLID SCR TM and XNOx TM . The patents, trademarks and other intellectual property owned by or licensed to us are important in the manufacturing, marketing and distribution of our products.
25
| ITEM 1A. | RISK FACTORS. |
Future deterioration or prolonged difficulty in economic conditions could have a material adverse impact on our business, financial position and liquidity.
The economic crisis in 2008 and 2009 and the related worldwide financial industry turmoil resulted in a severe and global tightening of credit and liquidity. These conditions led to low consumer confidence, which resulted in delayed and reduced purchases of durable consumer goods such as automobiles. As a result, our OEM customers significantly reduced their production schedules. Light vehicle production has been increasing since the second half of 2009, and is forecasted to increase in most regions in 2012 as compared to 2011, however, production is still at low levels and is expected to decline in Europe and Australia. We cannot assure you that production levels will continue to increase or that they may not decline. Future deterioration or prolonged difficulty in economic conditions could have a material adverse effect on our business, financial position and liquidity.
For example, as we saw in 2008 and 2009, disruptions in the financial markets may adversely impact the availability and cost of credit which could materially and negatively affect our Company. Future disruptions in the capital and credit markets could adversely affect our customers' and our ability to access the liquidity that is necessary to fund operations on terms that are acceptable to us or at all.
In addition, financial or other difficulties at any of our major customers could have a material adverse impact on us, including as a result of lost revenues, significant write offs of accounts receivable, significant impairment charges or additional restructurings beyond our current global plans. Severe financial or other difficulties at any of our major suppliers could have a material adverse effect on us if we are unable to obtain on a timely basis on similar economic terms the quantity and quality of components we require to produce our products.
Moreover, severe financial or operating difficulties at any automotive manufacturer or other supplier could have a significant disruptive effect on the entire automotive industry, leading to supply chain disruptions and labor unrest, among other things. These disruptions could force automotive manufacturers and, in turn, other suppliers, including us, to shut down production at plants. While the difficulties facing our customers and suppliers over the last several years have been primarily financial in nature, other difficulties, such as an inability to meet increased demand as the economy recovers, could also result in supply chain and other disruptions.
Factors that reduce demand for our products or reduce prices could materially and adversely impact our financial condition and results of operations.
Demand for and pricing of our products are subject to economic conditions and other factors present in the various domestic and international markets where the products are sold. Demand for our OE products is subject to the level of consumer demand for new vehicles that are equipped with our parts. The level of new light and commercial vehicle purchases is cyclical, affected by such factors as general economic conditions, interest rates and availability of credit, consumer confidence, patterns of consumer spending, fuel cost and the automobile replacement cycle. Consumer preferences also impact the demand for new light vehicle purchases. For example, if consumers increasingly prefer electric vehicles, demand for the vehicles equipped with our emission control products would decrease.
Demand for our aftermarket, or replacement, products varies based upon such factors as general economic conditions; the level of new vehicle purchases, which initially displaces demand for aftermarket products; the severity of winter weather, which increases the demand for certain aftermarket products; and other factors, including the average useful life of parts and number of miles driven.
The highly cyclical nature of the automotive and commercial vehicle industry presents a risk that is outside our control and that cannot be accurately predicted. Decreases in demand for automobiles and commercial vehicles and vehicle parts generally, or in the demand for our products in particular, could materially and adversely impact our financial condition and results of operations.
26
In addition, we believe that increasingly stringent environmental standards for emissions have presented and will continue to present an important opportunity for us to grow our emissions control business. We cannot assure you, however, that environmental standards for emissions will continue to become more stringent or that the adoption of any new standards will not be delayed beyond our expectations.
We are dependent on large customers for future revenue. The loss of all or a substantial portion of our sales to any of these customers or the loss of market share by these customers could have a material adverse impact on us.
We depend on major vehicle manufacturers for a substantial portion of our net sales. For example, during fiscal year ended December 31, 2011, GM and Ford accounted for 19 percent and 15 percent of our net sales, respectively. The loss of all or a substantial portion of our sales to any of our large-volume customers could have a material adverse effect on our financial condition and results of operations by reducing cash flows and our ability to spread costs over a larger revenue base. We may make fewer sales to these customers for a variety of reasons, including but not limited to: (1) loss of awarded business; (2) reduced or delayed customer requirements; (3) strikes or other work stoppages affecting production by the customers; or (4) reduced demand for our customers' products.
In addition, our OE customers compete intensively against each other and other OE manufacturers. The loss of market share by any of our significant OE customers could have a material adverse effect on our business unless we are able to achieve increased sales to other OE manufacturers.
We may be unable to realize sales represented by our awarded business, which could materially and adversely impact our financial condition and results of operations.
The realization of future sales from awarded business is inherently subject to a number of important risks and uncertainties, including the number of vehicles that our OE customers will actually produce, the timing of that production and the mix of options that our OE customers and consumers may choose. For several years prior to 2008, substantially all of our North American vehicle manufacturing customers had slowed or maintained at relatively flat levels new vehicle production. In 2009, new vehicle production decreased dramatically in many geographic regions as a result of the global economic crisis. During the second half of 2009 and in 2010, new vehicle production stabilized and began to strengthen from these low production levels. For 2011, light vehicle production continued to improve in most geographic regions in which we operate, though still not to the levels seen in recent history. In addition to the risks inherent in the cyclicality of vehicle production, our customers generally have the right to replace us with another supplier at any time for a variety of reasons and have demanded price decreases over the life of awarded business. Accordingly, we cannot assure you that we will in fact realize any or all of the future sales represented by our awarded business. Any failure to realize these sales could have a material adverse effect on our financial condition, results of operations, and liquidity.
In many cases, we must commit substantial resources in preparation for production under awarded OE business well in advance of the customer's production start date. In certain instances, the terms of our OE customer arrangements permit us to recover these pre-production costs if the customer cancels the business through no fault of our company. Although we have been successful in recovering these costs under appropriate circumstances in the past, we can give no assurance that our results of operations will not be materially impacted in the future if we are unable to recover these types of pre-production costs in the event of an OE customer's cancellation of awarded business.
Our level of debt makes us more sensitive to the effects of economic downturns; our level of debt and provisions in our debt agreements could limit our ability to react to changes in the economy or our industry.
Our level of debt makes us more vulnerable to changes in our results of operations because a substantial portion of our cash flow from operations is dedicated to servicing our debt and is not available for other purposes. Our level of debt could have other negative consequences to us, including the following:
| • | limiting our ability to borrow money or sell stock for our working capital, capital expenditures, debt service requirements or other general corporate purposes; |
27
| • | limiting our flexibility in planning for, or reacting to, changes in our operations, our business or the industry in which we compete; and |
| • | our leverage may place us at a competitive disadvantage by limiting our ability to invest in the business or in further research and development. |
Our ability to make payments on our indebtedness depends on our ability to generate cash in the future. If we do not generate sufficient cash flow to meet our debt service and working capital requirements, we may need to seek additional financing or sell assets. This may make it more difficult for us to obtain financing on terms that are acceptable to us, or at all. Without any such financing, we could be forced to sell assets to make up for any shortfall in our payment obligations under unfavorable circumstances. If necessary, we may not be able to sell assets quickly enough or for sufficient amounts to enable us to meet our obligations.
In addition, our senior credit facility and our other debt agreements contain covenants that limit our flexibility in planning for or reacting to changes in our business and our industry, including limitations on incurring additional indebtedness, making investments, granting liens and merging or consolidating with other companies. Complying with these covenants may impair our ability to finance our future operations or capital needs or to engage in other favorable business activities.
Our failure to comply with the covenants contained in our senior credit facility or the indentures for our other debt instruments, including as a result of events beyond our control, could result in an event of default, which could materially and adversely affect our operating results and our financial condition.
Our senior credit facility and receivables securitization program in the U.S. require us to maintain certain financial ratios. Our senior credit facility and our other debt instruments require us to comply with various operational and other covenants. If there were an event of default under any of our debt instruments that was not cured or waived, the holders of the defaulted debt could cause all amounts outstanding with respect to that debt to be due and payable immediately. We cannot assure you that our assets or cash flow would be sufficient to fully repay borrowings under our outstanding debt instruments, either upon maturity or if accelerated, upon an event of default, or that we would be able to refinance or restructure the payments on those debt instruments.
For example, in February 2009, we sought an amendment to our senior credit facility to revise the financial ratios we are required to maintain thereunder. If, in the future, we are required to obtain similar amendments as a result of our inability to meet the required financial ratios, there can be no assurance that those amendments will be available on commercially reasonable terms or at all. If, as or when required, we are unable to repay, refinance or restructure our indebtedness under our senior credit facility, or amend the covenants contained therein, the lenders under our senior credit facility could elect to terminate their commitments thereunder, cease making further loans and institute foreclosure proceedings against our assets. In addition, any event of default or declaration of acceleration under one of our debt instruments could also result in an event of default under one or more of our other financing agreements, including our other debt instruments and/or the agreements under which we sell certain of our accounts receivable. This would have a material adverse impact on our liquidity, financial position and results of operations.
Our working capital requirements may negatively affect our liquidity and capital resources.
Our working capital requirements can vary significantly, depending in part on the level, variability and timing of our customers' worldwide vehicle production and the payment terms with our customers and suppliers. If our working capital needs exceed our cash flows from operations, we would look to our cash balances and availability for borrowings under our borrowing arrangements to satisfy those needs, as well as potential sources of additional capital, which may not be available on satisfactory terms and in adequate amounts, if at all.
The hourly workforce in the automotive industry is highly unionized and our business could be adversely affected by labor disruptions.
A portion of our hourly workforce in North America and the majority of our hourly workforce in Europe is unionized. Although we consider our current relations with our employees to be satisfactory, if major work
28
disruptions were to occur, our business could be adversely affected by, for instance, a loss of revenues, increased costs or reduced profitability. We have not experienced a material labor disruption in our recent history, but there can be no assurance that we will not experience a material labor disruption at one of our facilities in the future in the course of renegotiation of our labor arrangements or otherwise.
In addition, substantially all of the hourly employees of General Motors, Ford and Chrysler in North America and many of their other suppliers are represented by the United Automobile, Aerospace and Agricultural Implement Workers of America under collective bargaining agreements. Vehicle manufacturers, their suppliers and their respective employees in other countries are also subject to labor agreements. A work stoppage or strike at one of our production facilities, at those of a customer, or impacting a supplier of ours or any of our customers, such as the 2008 strike at American Axle which resulted in 30 GM facilities in North America being idled for several months, could have an adverse impact on us by disrupting demand for our products and/or our ability to manufacture our products.
In the past, we have experienced significant increases and fluctuations in raw materials pricing; and future changes in the prices of raw materials or utilities could have a material adverse impact on us without proportionate recovery from our customers.
Significant increases in the cost of certain raw materials used in our products or the cost of utilities required to produce our products, to the extent they are not timely reflected in the price we charge our customers or are otherwise mitigated, could materially and adversely impact our results. In general, commodity prices including steel, oil and rubber, have been increasing since 2004 with the exception of a temporary but significant decline in prices as a result of the economic turmoil in 2008 and 2009. Notwithstanding this temporary decline, the trend of increasing commodity prices has continued. We mitigated these challenges by evaluating alternative materials and processes, reviewing material substitution opportunities, increasing component and assembly to best cost countries as well as strategically pursuing regional and global purchasing strategies for specific commodities, and aggressively negotiating to recover these higher costs from our customers. We also continue to pursue productivity initiatives and other opportunities to reduce costs through restructuring activities. During periods of economic recovery, the cost of raw materials and utilities generally rise. Accordingly, we cannot ensure that we will not face increased prices in the future or, if we do, whether these actions will be effective in containing them.
We may be unable to realize our business strategy of improving operating performance, growing our business and generating savings and improvements.
We regularly implement strategic and other initiatives designed to improve our operating performance. The failure to achieve the goals of these initiatives could have a material adverse effect on our business, particularly since we rely on these initiatives to offset pricing pressures from our suppliers and our customers, as described above, as well as to manage the impacts of production cuts such as the significant production decreases we experienced during 2008 and 2009 as a result of the recent global economic crisis. Furthermore, the terms of our senior credit facility and the indentures governing our notes may restrict the types of initiatives we undertake, as these agreements restrict our uses of cash and certain of these agreements require us to maintain financial ratios and otherwise prohibit us from undertaking certain activities. In the past we have been successful in obtaining the consent of our senior lenders where appropriate in connection with our initiatives. We cannot assure you, however, that we will be able to pursue, successfully implement or realize the expected benefits of any initiative or that we will be able to sustain improvements made to date.
We may incur material costs related to product warranties, environmental and regulatory matters and other claims, which could have a material adverse impact on our financial condition and results of operations.
From time to time, we receive product warranty claims from our customers, pursuant to which we may be required to bear costs of repair or replacement of certain of our products. Vehicle manufacturers require their outside suppliers to guarantee or warrant their products and to be responsible for the operation of these
29
component products in new vehicles sold to consumers. Warranty claims may range from individual customer claims to full recalls of all products in the field. We cannot assure you that costs associated with providing product warranties will not be material, or that those costs will not exceed any amounts reserved in our consolidated financial statements. For a description of our accounting policies regarding warranty reserves, see "Management's Discussion and Analysis of Financial Condition and Results of Operations - Critical Accounting Policies" included in Item 7.
We are subject to extensive government regulations worldwide. Foreign, federal, state and local laws and regulations may change from time to time and our compliance with new or amended laws and regulations in the future may materially increase our costs and could adversely affect our results of operations and competitive position. For example, we are subject to a variety of environmental and pollution control laws and regulations in all jurisdictions in which we operate. Soil and groundwater remediation activities are being conducted at certain of our current and former real properties. We record liabilities for these activities when environmental assessments indicate that the remedial efforts are probable and the costs can be reasonably estimated. On this basis, we have established reserves that we believe are adequate for the remediation activities at our current and former real properties for which we could be held responsible. Although we believe our estimates of remediation costs are reasonable and are based on the latest available information, the cleanup costs are estimates and are subject to revision as more information becomes available about the extent of remediation required. In future periods, we could be subject to cash costs or charges to earnings if we are required to undertake material additional remediation efforts based on the results of our ongoing analysis of the environmental status of our properties, as more information becomes available to us.
We also from time to time are involved in legal proceedings, claims or investigations that are incidental to the conduct of our business. Some of these proceedings allege damages against us relating to environmental liabilities, intellectual property matters, personal injury claims, taxes, employment matters or commercial or contractual disputes. For example, we are subject to a number of lawsuits initiated by a significant number of claimants alleging health problems as a result of exposure to asbestos. Many of these cases involve significant numbers of individual claimants. Many of these cases also involve numerous defendants, with the number of defendants in some cases exceeding 100 defendants from a variety of industries. As major asbestos manufacturers or other companies that used asbestos in their manufacturing processes continue to go out of business, we may experience an increased number of these claims.
We vigorously defend ourselves in connection with all of the matters described above. We cannot, however, assure you that the costs, charges and liabilities associated with these matters will not be material, or that those costs, charges and liabilities will not exceed any amounts reserved for them in our consolidated financial statements. In future periods, we could be subject to cash costs or charges to earnings if any of these matters are resolved unfavorably to us. See "Management's Discussion and Analysis of Financial Condition and Results of Operations - Environmental and Other Matters" included in Item 7.
We may have difficulty competing favorably in the highly competitive automotive parts industry.
The automotive parts industry is highly competitive. Although the overall number of competitors has decreased due to ongoing industry consolidation, we face significant competition within each of our major product areas, including from new competitors entering the markets which we serve. The principal competitive factors include price, quality, service, product performance, design and engineering capabilities, new product innovation, global presence and timely delivery. As a result, many suppliers have established or are establishing themselves in emerging, low-cost markets to reduce their costs of production and be more conveniently located for customers. Although we are also pursuing a low-cost country production strategy and otherwise continue to seek process improvements to reduce costs, we cannot assure you that we will be able to continue to compete favorably in this competitive market or that increased competition will not have a material adverse effect on our business by reducing our ability to increase or maintain sales or profit margins.
Furthermore, due to the cost focus of our major customers, we have been, and expect to continue to be, requested to reduce prices as part of our initial business quotations and over the life of vehicle platforms we have
30
been awarded. We cannot be certain that we will be able to generate cost savings and operational improvements in the future that are sufficient to offset price reductions requested by existing customers and necessary to win additional business.
The decreasing number of automotive parts customers and suppliers could make it more difficult for us to compete favorably.
Our financial condition and results of operations could be adversely affected because the customer base for automotive parts is decreasing in both the original equipment market and aftermarket. As a result, we are competing for business from fewer customers. Furthermore, the trend toward consolidation and bankruptcies among automotive parts suppliers is resulting in fewer, larger suppliers who benefit from purchasing and distribution economies of scale. If we cannot achieve cost savings and operational improvements sufficient to allow us to compete favorably in the future with these larger companies, our financial condition and results of operations could be adversely affected due to a reduction of, or inability to increase sales.
We may not be able to successfully respond to the changing distribution channels for aftermarket products.
Major automotive aftermarket retailers, such as AutoZone and Advance Auto Parts, are attempting to increase their commercial sales by selling directly to automotive parts installers in addition to individual consumers. These installers have historically purchased from their local warehouse distributors and jobbers, who are our more traditional customers. We cannot assure you that we will be able to maintain or increase aftermarket sales through increasing our sales to retailers. Furthermore, because of the cost focus of major retailers, we have occasionally been requested to offer price concessions to them. Our failure to maintain or increase aftermarket sales, or to offset the impact of any reduced sales or pricing through cost improvements, could have an adverse impact on our business and operating results.
Longer product lives of automotive parts are adversely affecting aftermarket demand for some of our products.
The average useful life of automotive parts has steadily increased in recent years due to innovations in products and technologies. The longer product lives allow vehicle owners to replace parts of their vehicles less often. As a result, a portion of sales in the aftermarket has been displaced. This has adversely impacted, and could continue to adversely impact, our aftermarket sales. Also, any additional increases in the average useful lives of automotive parts would further adversely affect the demand for our aftermarket products. Aftermarket sales represented approximately 18 percent and 20 percent of our net sales in the fiscal years ended December 31, 2011 and 2010, respectively.
Assertions against us or our customers relating to intellectual property rights could materially impact our business.
We and others in our industry hold a number of patents and other intellectual property rights that are critical to our respective businesses. On occasion, third parties may assert claims against us and our customers and distributors alleging our products or technology infringe upon third-party intellectual property rights. Similarly, we may assert claims against third-parties who are taking actions that we believe are infringing on our intellectual property rights. These claims, regardless of their merit or resolution, are frequently costly to prosecute, defend or settle and divert the efforts and attention of our management and employees. Claims of this sort also could harm our relationships with our customers and might deter future customers from doing business with us. If any such claim were to result in an adverse outcome, we could be required to take actions which may include: cease the manufacture, use or sale of the infringing products; pay substantial damages to third parties, including to customers to compensate them for their discontinued use or replace infringing technology with non-infringing technology; or expend significant resources to develop or license non-infringing products. Any of the foregoing results could have a material adverse effect on our business, financial condition and results of operations.
31
Any acquisitions we make could disrupt our business and seriously harm our financial condition.
We may, from time to time, consider acquisitions of complementary companies, products or technologies. Acquisitions involve numerous risks, including difficulties in the assimilation of the acquired businesses, the diversion of our management's attention from other business concerns and potential adverse effects on existing business relationships with current customers and suppliers. In addition, any acquisitions could involve the incurrence of substantial additional indebtedness. We cannot assure you that we will be able to successfully integrate any acquisitions that we pursue or that such acquisitions will perform as planned or prove to be beneficial to our operations and cash flow. Any such failure could seriously harm our business, financial condition and results of operations.
We are subject to risks related to our international operations.
We have manufacturing and distribution facilities in many regions and countries, including Australia, Asia, North America, Europe, South Africa and South America, and sell our products worldwide. For the fiscal year ended December 31, 2011, approximately 53 percent of our net sales were derived from operations outside North America. International operations are subject to various risks which could have a material adverse effect on those operations or our business as a whole, including:
| • | exposure to local economic conditions; |
| • | exposure to local political conditions, including the risk of seizure of assets by a foreign government; |
| • | exposure to local social unrest, including any resultant acts of war, terrorism or similar events; |
| • | exposure to local public health issues and the resultant impact on economic and political conditions; |
| • | currency exchange rate fluctuations; |
| • | hyperinflation in certain foreign countries; |
| • | controls on the repatriation of cash, including imposition or increase of withholding and other taxes on remittances and other payments by foreign subsidiaries; and |
| • | export and import restrictions. |
Exchange rate fluctuations could cause a decline in our financial condition and results of operations.
As a result of our international operations, we are subject to increased risk because we generate a significant portion of our net sales and incur a significant portion of our expenses in currencies other than the U.S. dollar. For example, where we have a greater portion of costs than revenues generated in a foreign currency, we are subject to risk if the foreign currency in which our costs are paid appreciates against the currency in which we generate revenue because the appreciation effectively increases our cost in that country.
The financial condition and results of operations of some of our operating entities are reported in foreign currencies and then translated into U.S. dollars at the applicable exchange rate for inclusion in our consolidated financial statements. As a result, appreciation of the U.S. dollar against these foreign currencies generally will have a negative impact on our reported revenues and operating profit while depreciation of the U.S. dollar against these foreign currencies will generally have a positive effect on reported revenues and operating profit. For example, our consolidated results of operations were positively impacted in 2011 due to the strengthening of the Euro against the U.S. dollar. However, in 2008 through 2010, the dollar strengthened against the Euro which had negative effects on our results of operations. Our South American operations were negatively impacted by the devaluation in 2000 of the Brazilian currency as well as by the devaluation of the Argentine currency in 2002. We do not generally seek to mitigate this translation effect through the use of derivative financial instruments. To the extent we are unable to match revenues received in foreign currencies with costs paid in the same currency, exchange rate fluctuations in that currency could have a material adverse effect on our business.
32
Entering new markets poses new competitive threats and commercial risks.
As we have expanded into markets beyond light vehicles, we expect to diversify our product sales by leveraging technologies being developed for the light vehicle segment. Such diversification requires investments and resources which may not be available as needed. We cannot guarantee that we will be successful in leveraging our capabilities into new markets and thus, in meeting the needs of these new customers and competing favorably in these new markets. Further, a significant portion of our growth potential is dependent on our ability to increase sales to commercial vehicle customers. While we believe that we can achieve our growth targets with the production contracts that have been awarded to us, our future prospects will be negatively affected if those customers underlying these contracts experience reduced demand for their production or financial difficulties.
Impairment in the carrying value of long-lived assets and goodwill could negatively affect our operating results.
We have a significant amount of long-lived assets and goodwill on our consolidated balance sheet. Under generally accepted accounting principles, long-lived assets are required to be reviewed for impairment whenever adverse events or changes in circumstances indicate a possible impairment. If business conditions or other factors cause profitability and cash flows to decline, we may be required to record non-cash impairment charges. Goodwill must be evaluated for impairment annually or more frequently if events indicate it is warranted. If the carrying value of our reporting units exceeds their current fair value as determined based on the discounted future cash flows of the related business, the goodwill is considered impaired and is reduced to fair value by a non-cash charge to earnings. Events and conditions that could result in impairment in the value of our long-lived assets and goodwill include changes in the industries in which we operate, particularly the impact of a downturn in the global economy, as well as competition and advances in technology, adverse changes in the regulatory environment, or other factors leading to reduction in expected long-term sales or profitability. For example, during the fiscal year ended December 31, 2008, we recorded a $114 million asset impairment charge to write-off the remaining goodwill related to our 1996 acquisition of Clevite Industries and during the fiscal year ended December 31, 2011, we recorded a $11 million goodwill impairment charge relating to our Australian reporting unit.
The value of our deferred tax assets could become impaired, which could materially and adversely affect our operating results.
As of December 31, 2011, we had approximately $76 million in net deferred tax assets. These deferred tax assets include net operating loss carryovers that can be used to offset taxable income in future periods and reduce income taxes payable in those future periods. Each quarter, we determine the probability of the realization of deferred tax assets, using significant judgments and estimates with respect to, among other things, historical operating results, expectations of future earnings and tax planning strategies. If we determine in the future that there is not sufficient positive evidence to support the valuation of these assets, due to the risk factors described herein or other factors, we may be required to further adjust the valuation allowance to reduce our deferred tax assets. Such a reduction could result in material non-cash expenses in the period in which the valuation allowance is adjusted and could have a material adverse effect on our results of operations.
Our expected annual effective tax rate could be volatile and materially change as a result of changes in mix of earnings and other factors.
Our overall effective tax rate is equal to our total tax expense as a percentage of our total profit or loss before tax. However, tax expenses and benefits are determined separately for each tax paying entity or group of entities that is consolidated for tax purposes in each jurisdiction. Losses in certain jurisdictions may provide no current financial statement tax benefit. As a result, changes in the mix of profits and losses between jurisdictions, among other factors, could have a significant impact on our overall effective tax rate.
33
| ITEM 1B. | UNRESOLVED STAFF COMMENTS. |
None.
| ITEM 2. | PROPERTIES. |
We lease our principal executive offices, which are located at 500 North Field Drive, Lake Forest, Illinois, 60045.
Our emission control business operates 11 manufacturing facilities in the U.S. and 46 manufacturing facilities outside of the U.S. Our emission control business also operates five engineering and technical facilities worldwide and share two other such facilities with our ride control business. Twenty-six of these manufacturing plants are JIT facilities. In addition, two joint ventures in which we hold a noncontrolling interest operate a total of two manufacturing facilities outside the U.S., all of which are JIT facilities.
Our ride control business operates seven manufacturing facilities in the U.S. and 23 manufacturing facilities outside the U.S. Our ride control business also operates seven engineering and technical facilities worldwide and share two other such facilities with our emission control business. Two of these manufacturing plants are JIT facilities.
The above-described manufacturing locations outside of the U.S. are located in Argentina, Australia, Belgium, Brazil, Canada, China, Czech Republic, France, Germany, India, Italy, Korea, Mexico, Poland, Portugal, Russia, Spain, South Africa, Sweden, Thailand, and the United Kingdom. We also have sales offices located in Japan, Singapore and Taiwan.
We own 52 of the properties described above and lease 64. We hold 17 of the above-described international manufacturing facilities through seven joint ventures in which we own a controlling interest. In addition, two joint ventures in which we hold a noncontrolling interest operate a total of two manufacturing facilities outside the U.S. We also have distribution facilities at our manufacturing sites and at a few offsite locations, substantially all of which we lease.
We believe that substantially all of our plants and equipment are, in general, well maintained and in good operating condition. They are considered adequate for present needs and, as supplemented by planned construction, are expected to remain adequate for the near future.
We also believe that we have generally satisfactory title to the properties owned and used in our respective businesses.
| ITEM 3. | LEGAL PROCEEDINGS. |
We are involved in environmental remediation matters, legal proceedings, claims, investigations and warranty obligations that are incidental to the conduct of our business and create the potential for contingent losses. We accrue for potential contingent losses when our review of available facts indicates that it is probable a loss has been incurred and the amount of the loss is reasonably estimable. Each quarter we assess our loss contingencies based upon currently available facts, existing technology, and presently enacted laws and regulations taking into consideration the likely effects of inflation and other societal and economic factors and record adjustments to these reserves as required. As an example, we consider all available evidence including prior experience in remediation of contaminated sites, other companies' cleanup experiences and data released by the United States Environmental Protection Agency or other organizations when we evaluate our environmental remediation contingencies. Further, all of our loss contingency estimates are subject to revision in future periods based on actual costs or new information. With respect to our environmental liabilities, where future cash flows are fixed or reliably determinable, we have discounted those liabilities. All other environmental liabilities are recorded at their undiscounted amounts. We evaluate recoveries separately from the liability and, when they are assured, recoveries are recorded and reported separately from the associated liability in our consolidated financial statements.
We are subject to a variety of environmental and pollution control laws and regulations in all jurisdictions in which we operate. We expense or capitalize, as appropriate, expenditures for ongoing compliance with
34
environmental regulations that relate to current operations. We expense costs related to an existing condition caused by past operations that do not contribute to current or future revenue generation. As of December 31, 2011, we have the obligation to remediate or contribute towards the remediation of certain sites, including one Federal Superfund site. At December 31, 2011, our aggregated estimated share of environmental remediation costs for all these sites on a discounted basis was approximately $17 million, of which $5 million is recorded in other current liabilities and $12 million is recorded in deferred credits and other liabilities in our consolidated balance sheet. For those locations in which the liability was discounted, the weighted average discount rate used was 1.9 percent. The undiscounted value of the estimated remediation costs was $20 million. Our expected payments of environmental remediation costs are estimated to be approximately $4 million in 2012, $2 million in 2013, $1 million each year beginning 2014 through 2016 and $11 million thereafter. Based on information known to us, we have established reserves that we believe are adequate for these costs. Although we believe these estimates of remediation costs are reasonable and are based on the latest available information, the costs are estimates and are subject to revision as more information becomes available about the extent of remediation required. At some sites, we expect that other parties will contribute towards the remediation costs. In addition, certain environmental statutes provide that our liability could be joint and several, meaning that we could be required to pay in excess of our share of remediation costs. Our understanding of the financial strength of other potentially responsible parties at these sites has been considered, where appropriate, in our determination of our estimated liability. We do not believe that any potential costs associated with our current status as a potentially responsible party in the Federal Superfund site, or as a liable party at the other locations referenced herein, will be material to our consolidated results of operations, financial position or cash flows.
We also from time to time are involved in legal proceedings, claims or investigations. Some of these proceedings allege damages against us relating to environmental liabilities (including, toxic tort, property damage and remediation), intellectual property matters (including patent, trademark and copyright infringement, and licensing disputes), personal injury claims (including injuries due to product failure, design or warning issues, and other product liability related matters), taxes, employment matters, and commercial or contractual disputes, sometimes related to acquisitions or divestitures. For example, one of our Argentine subsidiaries is currently defending against a criminal complaint alleging the failure to comply with laws requiring the proceeds of export transactions to be collected, reported and/or converted to local currency within specified time periods. As another example, in the U.S. we are subject to an audit in 11 states with respect to the payment of unclaimed property to those states, spanning a period as far back as 30 years. We now have practices in place which we believe ensure that we pay unclaimed property as required. We vigorously defend ourselves against all of these claims. In future periods, we could be subject to cash costs or charges to earnings if any of these matters are resolved on unfavorable terms. However, although the ultimate outcome of any legal matter cannot be predicted with certainty, based on current information, including our assessment of the merits of the particular claim, we do not expect that these legal proceedings or claims will have any material adverse impact on our future consolidated financial position, results of operations or cash flows.
In addition, we are subject to a number of lawsuits initiated by a significant number of claimants alleging health problems as a result of exposure to asbestos. In the early 2000's we were named in nearly 20,000 complaints, most of which were filed in Mississippi state court and the vast majority of which made no allegations of exposure to asbestos from our product categories. Most of these claims have been dismissed and our current docket of active and inactive cases is less than 500 cases nationwide. A small number of claims have been asserted by railroad workers alleging exposure to asbestos products in railroad cars manufactured by The Pullman Company, one of our subsidiaries. The balance of the claims is related to alleged exposure to asbestos in our automotive products. Only a small percentage of the claimants allege that they were automobile mechanics and a significant number appear to involve workers in other industries or otherwise do not include sufficient information to determine whether there is any basis for a claim against us. We believe, based on scientific and other evidence, it is unlikely that mechanics were exposed to asbestos by our former products and that, in any event, they would not be at increased risk of asbestos-related disease based on their work with these products. Further, many of these cases involve numerous defendants, with the number of each in some cases exceeding 100 defendants from a variety of industries. Additionally, the plaintiffs either do not specify any, or specify the jurisdictional minimum, dollar amount for damages. As major asbestos manufacturers and/or users continue to go
35
out of business or file for bankruptcy, we may experience an increased number of these claims. We vigorously defend ourselves against these claims as part of our ordinary course of business. In future periods, we could be subject to charges to earnings if any of these matters are resolved unfavorably to us. To date, with respect to claims that have proceeded sufficiently through the judicial process, we have regularly achieved favorable resolutions. Accordingly, we presently believe that these asbestos-related claims will not have a material adverse impact on our future consolidated financial condition, results of operations or cash flows.
| ITEM 4. | MINE SAFETY DISCLOSURES. |
Not applicable.
| ITEM 4.1. | EXECUTIVE OFFICERS OF THE REGISTRANT. |
The following provides information concerning the persons who serve as our executive officers as of February 24, 2012.
Name and Age | Offices Held | |
Gregg M. Sherrill (59) | Chairman and Chief Executive Officer | |
Hari N. Nair (52) | Chief Operating Officer | |
Kenneth R. Trammell (51) | Executive Vice President and Chief Financial Officer | |
Neal A. Yanos (50) | Executive Vice President, North America | |
Brent J. Bauer (56) | Senior Vice President and General Manager - North America Original Equipment Emission Control | |
Michael J. Charlton (53) | Senior Vice President, Global Supply Chain Management and Manufacturing | |
Josep Fornos (59) | Senior Vice President, General Manager Europe, South America and India | |
James D. Harrington (51) | Senior Vice President, General Counsel and Corporate Secretary | |
Timothy E. Jackson (55) | Senior Vice President and Chief Technology Officer | |
Barbara A. Kluth (55) | Senior Vice President - Global Human Resources | |
Paul D. Novas (53) | Vice President and Controller |
Gregg M. Sherrill - Mr. Sherrill was named the Chairman and Chief Executive Officer of Tenneco in January 2007. Mr. Sherrill joined us from Johnson Controls Inc., where he served since 1998, most recently as President, Power Solutions. From 2002 to 2003, Mr. Sherrill served as the Vice President and Managing Director of Europe, South Africa and South America for Johnson Controls' Automotive Systems Group. Prior to joining Johnson Controls, Mr. Sherrill held various engineering and manufacturing assignments over a 22-year span at Ford Motor Company, including Plant Manager of Ford's Dearborn, Michigan engine plant, Chief Engineer, Steering Systems and Director of Supplier Technical Assistance. Mr. Sherrill became a director of our company in January 2007.
Hari N. Nair - Mr. Nair was named Chief Operating Officer in July 2010. Prior to that, he served as our Executive Vice President and President - International since March 2007. Previously, Mr. Nair served as Executive Vice President and Managing Director of our business in Europe, South America and India. Before that, he was Senior Vice President and Managing Director - International. Prior to December 2000, Mr. Nair was the Vice President and Managing Director - Emerging Markets. Previously, Mr. Nair was the Managing Director for Tenneco Automotive Asia, based in Singapore and responsible for all operations and development projects in Asia. He began his career with the former Tenneco Inc. in 1987, holding various positions in strategic planning, marketing, business development, quality systems and finance. Prior to joining Tenneco, Mr. Nair was a senior financial analyst at General Motors Corporation focusing on European operations. Mr. Nair became a director of our company in March 2009.
Kenneth R. Trammell - Mr. Trammell has served as our Executive Vice President and Chief Financial Officer since January 2006. Mr. Trammell was named our Senior Vice President and Chief Financial Officer in September 2003, having served as our Vice President and Controller since September 1999. From April 1997 to
36
November 1999, he served as Corporate Controller of Tenneco Inc. He joined Tenneco Inc. in May 1996 as Assistant Controller. Before joining Tenneco Inc., Mr. Trammell spent 12 years with the international public accounting firm of Arthur Andersen LLP, last serving as a senior manager.
Neal A. Yanos - Mr. Yanos was named Executive Vice President, North America in July 2008. Prior to that, he served as our Senior Vice President and General Manager - North American Original Equipment Ride Control and North American Aftermarket since May 2003. He joined our Monroe ride control division as a process engineer in 1988 and since that time has served in a broad range of assignments including product engineering, strategic planning, business development, finance, program management and marketing, including Director of our North American Original Equipment GM/VW business unit and most recently as our Vice President and General Manager - North American Original Equipment Ride Control from December 2000. Before joining our company, Mr. Yanos was employed in various engineering positions by Sheller Globe Inc. from 1985 to 1988.
Brent J. Bauer - Mr. Bauer has served as our Senior Vice President and General Manager - North American Original Equipment Emission Control since May 2002. Prior to this appointment, Mr. Bauer was named Vice President and General Manager - European and North American Original Equipment Emission Control in July 2001. Mr. Bauer joined Tenneco Automotive in August 1996 as a Plant Manager and was named Vice President and General Manager - European Original Equipment Emission Control in September 1999. Prior to joining Tenneco, he was employed at AeroquipVickers Corporation for 20 years in positions of increasing responsibility serving most recently as Director of Operations.
Michael J. Charlton - Mr. Charlton has served as our Senior Vice President, Global Supply Chain Management and Manufacturing since January 2010. Mr. Charlton served as our Vice President, Global Supply Chain Management and Manufacturing from November 2008 through December 2009. Mr. Charlton served as Tenneco's Managing Director for India from January 2008 until November 2008. Prior to that, he served as the operations director for the Company's emission control business in Europe since 2005. Prior to joining Tenneco in 2005, Mr. Charlton held a variety of positions of increasing responsibility at TRW Automotive, the most recent being Lead Director, European Purchasing and Operations for the United Kingdom.
Josep Fornos - Josep Fornos was named Senior Vice President and General Manager, Europe, South America and India in July 2010. Prior to this appointment, he had served as Vice President and General Manager, Europe Original Equipment Emission Control since March 2007. Mr. Fornos joined Tenneco in July 2000 as Vice President and General Manager, Europe Original Equipment Ride Control. Prior to joining Tenneco, Fornos spent a year at Lear Corporation as General Manager of the company's seating and wire and harness business in France, following Lear's acquisition of United Technologies Automotive. Mr. Fornos spent 16 years with United Technologies Automotive, holding several management positions in production, engineering and quality control in Spain and later having Europe-wide responsibility for engineering and quality control.
James D. Harrington - Mr. Harrington has served as our Senior Vice President, General Counsel and Corporate Secretary since June 2009 and is responsible for managing our worldwide legal affairs including corporate governance and compliance. Mr. Harrington joined us in January 2005 as Corporate Counsel and was named Vice President - Law in July 2007. Prior to joining Tenneco, he worked at Mayer Brown LLP in the firm's corporate and securities practice.
Timothy E. Jackson - Mr. Jackson has served as our Chief Technology Officer since March 2007. Prior to this role, Mr. Jackson served as our Senior Vice President - Global Technology and General Manager, Asia Pacific since July 2005. From 2002 to 2005, Mr. Jackson served as Senior Vice President - Manufacturing, Engineering, and Global Technology. In August 2000, he was named Senior Vice President - Global Technology, a role he served in after joining us as Senior Vice President and General Manager - North American Original Equipment and Worldwide Program Management in June 1999. Mr. Jackson came to Tenneco from ITT Industries where he was President of that company's Fluid Handling Systems Division. With over 30 years of management experience, 14 within the automotive industry, he had also served as Chief Executive Officer for HiSAN, a joint venture between ITT Industries and Sanoh Industrial Company. Mr. Jackson has also held senior management positions at BF Goodrich Aerospace and General Motors Corporation.
37
Barbara A. Kluth - Ms. Kluth has served as Senior Vice President, Global Human Resources since March 2011. She was named Vice President, Global Human Resources in April 2010. In December 2001, she was named Executive Director, HR, North America after beginning her career in human resources in 1988 as HR manager for our Marshall, Michigan facility. She joined Tenneco in 1985 as an internal auditor.
Paul D. Novas - Mr. Novas was named our Vice President and Controller in July 2006. Mr. Novas served as Vice President, Finance and Administration for Tenneco Europe from January 2004 until July 2006 and as Vice President and Treasurer of Tenneco from November 1999 until January 2004. Mr. Novas joined Tenneco in 1996 as assistant treasurer responsible for corporate finance and North American treasury operations. Prior to joining Tenneco, Mr. Novas worked in the treasurer's office of General Motors Corporation for ten years.
PART II
| ITEM 5. | MARKET FOR REGISTRANT'S COMMON EQUITY, RELATED STOCKHOLDER MATTERS, AND ISSUER PURCHASES OF EQUITY SECURITIES. |
Our outstanding shares of common stock, par value $.01 per share, are listed on the New York and Chicago Stock Exchanges. The following table sets forth, for the periods indicated, the high and low sales prices of our common stock on the New York Stock Exchange Composite Transactions Tape.
| Sales Prices | ||||||||
Quarter | High | Low | ||||||
2011 | ||||||||
1st | $ | 46.81 | $ | 36.23 | ||||
2nd | 46.80 | 36.52 | ||||||
3rd | 46.49 | 24.33 | ||||||
4th | 36.96 | 22.47 | ||||||
2010 | ||||||||
1st | $ | 25.00 | $ | 17.17 | ||||
2nd | 27.50 | 19.06 | ||||||
3rd | 31.46 | 19.29 | ||||||
4th | 43.71 | 28.47 | ||||||
As of February 21, 2012, there were approximately 18,378 holders of record of our common stock, including brokers and other nominees.
The declaration of dividends on our common stock is at the discretion of our Board of Directors. The Board has not adopted a dividend policy as such; subject to legal and contractual restrictions, its decisions regarding dividends are based on all considerations that in its business judgment are relevant at the time. These considerations may include past and projected earnings, cash flows, economic, business and securities market conditions and anticipated developments concerning our business and operations.
We are highly leveraged and restricted with respect to the payment of dividends under the terms of our financing arrangements. On January 10, 2001, we announced that our Board of Directors eliminated the regular quarterly dividend on the Company's common stock. The Board took this action in response to then- current industry conditions, primarily greater than anticipated production volume reductions by OEMs in North America and continued softness in the global aftermarket. We have not paid dividends on our common stock since the fourth quarter of 2000. There are no current plans to reinstate a dividend on our common stock. For additional information concerning our payment of dividends, see "Management's Discussion and Analysis of Financial Condition and Results of Operations" included in Item 7.
See "Security Ownership of Certain Beneficial Owners and Management and Related Stockholder Matters" included in Item 12 for information regarding securities authorized for issuance under our equity compensation plans.
38
Purchase of equity securities by the issuer and affiliated purchasers
The following table provides information relating to our purchase of shares of our common stock in fourth quarter of 2011. All these purchases reflect shares withheld upon vesting of restricted stock for minimum tax withholding obligations. We intend to continue to satisfy statutory minimum tax withholding obligations in connection with the vesting of outstanding restricted stock through the withholding of shares.
Period | Total Number of Shares Purchased | Average
Price Paid | ||||||||
October 2011 | 2,888 | $33.98 | ||||||||
November 2011 | 9 | 31.10 | ||||||||
December 2011 | 2,820 | 29.73 | ||||||||
|
| |||||||||
Total | 5,717 | $31.88 | ||||||||
In January 2012, our Board of Directors approved a share repurchase program, authorizing our company to repurchase up to 600,000 shares of the Company's outstanding common stock over a 12 month period. Our share repurchase program is intended to offset dilution from shares of restricted stock and stock options issued in 2012 to employees.
Recent Sales of Unregistered Securities
None.
39
Share Performance
The following graph shows a five year comparison of the cumulative total stockholder return on Tenneco's common stock as compared to the cumulative total return of two other indexes: a custom composite index ("Peer Group") and the Standard & Poor's 500 Composite Stock Price Index. The companies included in the Peer Group are: ArvinMeritor Inc., American Axle & Manufacturing Co., Borg Warner Inc., Cummins Inc., Johnson Controls Inc., Lear Corp., Magna International Inc. and TRW Automotive Holdings Corp. These comparisons assume an initial investment of $100 and the reinvestment of dividends.
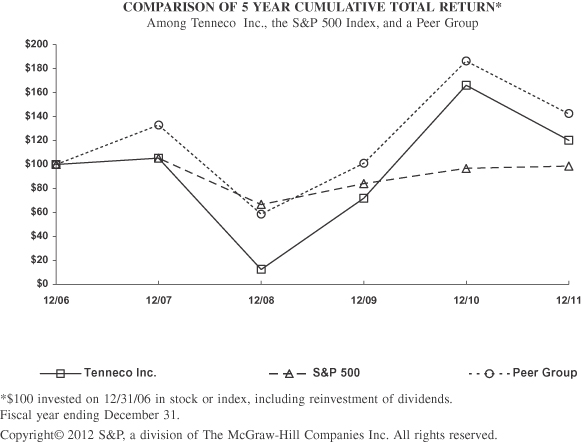
| 12/31/06 | 12/31/07 | 12/31/08 | 12/31/09 | 12/31/10 | 12/31/11 | |||||||||||||||||||
Tenneco Inc. | 100.00 | 105.46 | 11.93 | 71.72 | 166.50 | 120.47 | ||||||||||||||||||
S&P 500 | 100.00 | 105.49 | 66.46 | 84.05 | 96.71 | 98.75 | ||||||||||||||||||
Peer Group | 100.00 | 133.21 | 58.42 | 101.00 | 186.97 | 142.42 | ||||||||||||||||||
The graph and other information furnished in the section titled "Share Performance" under this Part II, Item 5 of this Form 10-K shall not be deemed to be "soliciting" material or to be "filed" with the Securities and Exchange Commission or subject to Regulation 14A or 14C, or to the liabilities of Section 18 of the Securities Exchange Act of 1934, as amended.
40
| ITEM 6. | SELECTED FINANCIAL DATA. |
The following data should be read in conjunction with Item 7 - "Management's Discussion and Analysis of Financial Condition and Operations" and our consolidated financial statements in Item 8 - "Financial Statements and Supplementary Data." These items include discussions of factors affecting comparability of the information shown below.
TENNECO INC. AND CONSOLIDATED SUBSIDIARIES
SELECTED CONSOLIDATED FINANCIAL DATA
| Year Ended December 31, | ||||||||||||||||||||
| 2011(a) | 2010 | 2009(b) | 2008(c) | 2007 | ||||||||||||||||
| (Millions Except Share and Per Share Amounts) | ||||||||||||||||||||
Statements of Income (Loss) Data: | ||||||||||||||||||||
Net sales and operating revenues - | ||||||||||||||||||||
North America | $ | 3,426 | $ | 2,832 | $ | 2,099 | $ | 2,641 | $ | 2,910 | ||||||||||
Europe, South America and India | 3,169 | 2,594 | 2,209 | 2,983 | 3,135 | |||||||||||||||
Asia Pacific | 804 | 698 | 525 | 543 | 560 | |||||||||||||||
Intergroup sales | (194 | ) | (187 | ) | (184 | ) | (251 | ) | (421 | ) | ||||||||||
|
|
|
|
|
|
|
|
|
| |||||||||||
| $ | 7,205 | $ | 5,937 | $ | 4,649 | $ | 5,916 | $ | 6,184 | |||||||||||
|
|
|
|
|
|
|
|
|
| |||||||||||
Earnings (loss) before interest expense, income taxes, and noncontrolling interests North America | $ | 216 | $ | 155 | $ | 42 | $ | (107 | ) | $ | 120 | |||||||||
Europe, South America and India | 125 | 76 | 20 | 85 | 99 | |||||||||||||||
Asia Pacific | 38 | 50 | 30 | 19 | 33 | |||||||||||||||
|
|
|
|
|
|
|
|
|
| |||||||||||
Total | 379 | 281 | 92 | (3 | ) | 252 | ||||||||||||||
Interest expense (net of interest capitalized) | 108 | 149 | 133 | 113 | 164 | |||||||||||||||
Income tax expense | 88 | 69 | 13 | 289 | 83 | |||||||||||||||
|
|
|
|
|
|
|
|
|
| |||||||||||
Net income (loss) | 183 | 63 | (54 | ) | (405 | ) | 5 | |||||||||||||
|
|
|
|
|
|
|
|
|
| |||||||||||
Less: Net income attributable to noncontrolling interests | 26 | 24 | 19 | 10 | 10 | |||||||||||||||
|
|
|
|
|
|
|
|
|
| |||||||||||
Net income (loss) attributable to Tenneco Inc. | $ | 157 | $ | 39 | $ | (73 | ) | $ | (415 | ) | $ | (5 | ) | |||||||
|
|
|
|
|
|
|
|
|
| |||||||||||
Weighted average shares of common stock outstanding - | ||||||||||||||||||||
Basic | 59,884,139 | 59,208,103 | 48,572,463 | 46,406,095 | 45,809,730 | |||||||||||||||
Diluted | 61,520,160 | 60,998,694 | 48,572,463 | 46,406,095 | 45,809,730 | |||||||||||||||
Basic earnings (loss) per share of common stock | $ | 2.62 | $ | 0.65 | $ | (1.50 | ) | $ | (8.95 | ) | $ | (0.11 | ) | |||||||
Diluted earnings (loss) per share of common stock | $ | 2.55 | $ | 0.63 | $ | (1.50 | ) | $ | (8.95 | ) | $ | (0.11 | ) | |||||||
41
| Years Ended December 31, | ||||||||||||||||||||
| 2011 | 2010 | 2009 | 2008 | 2007 | ||||||||||||||||
| (Millions Except Ratio and Percent Amounts) | ||||||||||||||||||||
Balance Sheet Data (at year end): | ||||||||||||||||||||
Total assets | $ | 3,337 | $ | 3,167 | $ | 2,841 | $ | 2,828 | $ | 3,590 | ||||||||||
Short-term debt | 66 | 63 | 75 | 49 | 46 | |||||||||||||||
Long-term debt | 1,158 | 1,160 | 1,145 | 1,402 | 1,328 | |||||||||||||||
Redeemable noncontrolling interests | 12 | 12 | 7 | 7 | 6 | |||||||||||||||
Total Tenneco Inc. shareholders' equity | - | (4 | ) | (21 | ) | (251 | ) | 400 | ||||||||||||
Noncontrolling interests | 43 | 39 | 32 | 24 | 25 | |||||||||||||||
|
|
|
|
|
|
|
|
|
| |||||||||||
Total equity | 43 | 35 | 11 | (227 | ) | 425 | ||||||||||||||
Statement of Cash Flows Data: | ||||||||||||||||||||
Net cash provided by operating activities | $ | 245 | $ | 244 | $ | 241 | $ | 160 | $ | 158 | ||||||||||
Net cash used by investing activities | (224 | ) | (157 | ) | (119 | ) | (261 | ) | (202 | ) | ||||||||||
Net cash used by financing activities | (26 | ) | (30 | ) | (87 | ) | 58 | (10 | ) | |||||||||||
Cash payments for plant, property and equipment | (213 | ) | (151 | ) | (120 | ) | (233 | ) | (177 | ) | ||||||||||
Other Data: | ||||||||||||||||||||
EBITDA including noncontrolling interests(d) | $ | 586 | $ | 497 | $ | 313 | $ | 219 | $ | 457 | ||||||||||
Ratio of EBITDA including noncontrolling interests to interest expense | 5.43 | 3.34 | 2.35 | 1.94 | 2.79 | |||||||||||||||
Ratio of net debt (total debt less cash and cash equivalents) to EBITDA including noncontrolling interests(e) | 1.72 | 1.99 | 3.36 | 6.05 | 2.60 | |||||||||||||||
Ratio of earnings to fixed charges(f) | 3.10 | 1.79 | - | - | 1.46 | |||||||||||||||
NOTE: Our consolidated financial statements for the three years ended December 31, 2011, which are discussed in the following notes, are included in this Form 10-K under Item 8.
| (a) | During the third quarter of 2011, we recorded a goodwill impairment charge of $11 million related to our Australian reporting unit within the Asia Pacific segment. |
| (b) | We incurred no direct economic loss from the bankruptcy filing of Chrysler and General Motors plants in North America during the second and third quarters of 2009. In this regard, we collected substantially all of our pre-petition receivables from Chrysler Group LLC and Chrysler Group LLC has assumed substantially all of the contracts which we had with Chrysler LLC. We collected substantially all of our pre-petition receivables from General Motors Company and General Motors Company has assumed substantially all of the contracts which we had with General Motors Corporation. However, the vehicle production shutdowns at Chrysler and significant reductions in vehicle production volumes at General Motors plants in North America during the second quarter of 2009 that coincided with their bankruptcies did cause Tenneco's revenue from those two customers in North America to decline to $123 million in the second quarter of 2009, down from $242 million in the second quarter of 2008. We believe that General Motors and Chrysler were able to meet any unmet demand for their vehicles resulting from their production volume reductions in the second quarter of 2009 during the second half of 2009 after they exited their respective bankruptcy proceedings. Accordingly, for the entire 2009 calendar year, we consider the vehicle production volume reductions at Chrysler and General Motors to have been primarily driven by the same severe deterioration in overall economic conditions that caused substantially all of our original equipment customers in North America to significantly reduce production volumes in response to lower purchases of new vehicles. |
| (c) | During the fourth quarter of 2008, we recorded a goodwill impairment charge of $114 million related to our North American Original Equipment Ride Control reporting unit whose carrying value exceeded the estimated fair value. In addition, during the second half of 2008, we recorded tax expense of $190 million related to establishing a valuation allowance against our net deferred tax assets in the U.S. |
| (d) | EBITDA including noncontrolling interests is a non-GAAP measure defined as net income before extraordinary items, cumulative effect of changes in accounting principle, interest expense, income taxes, depreciation and amortization and noncontrolling interests. We use EBITDA including noncontrolling interests, together with GAAP measures, to evaluate and compare our operating performance on a consistent basis between time periods and with other companies that |
42
| compete in our markets but which may have different capital structures and tax positions, which can have an impact on the comparability of interest expense, noncontrolling interests and tax expense. We also believe that using this measure allows us to understand and compare operating performance both with and without depreciation expense, which can vary based on several factors. We believe EBITDA including noncontrolling interests is useful to our investors and other parties for these same reasons. |
EBITDA including noncontrolling interests should not be used as a substitute for net income or for net cash provided by operating activities prepared in accordance with GAAP. It should also be noted that EBITDA including noncontrolling interests may not be comparable to similarly titled measures used by other companies and, furthermore, that it excludes expenditures for debt financing, taxes and future capital requirements that are essential to our ongoing business operations. For these reasons, EBITDA including noncontrolling interests is of value to management and investors only as a supplement to, and not in lieu of, GAAP results. EBITDA including noncontrolling interests are derived from the statements of income (loss) as follows:
| Year Ended December 31, | ||||||||||||||||||||
| 2011 | 2010 | 2009 | 2008 | 2007 | ||||||||||||||||
| (Millions) | ||||||||||||||||||||
Net income (loss) | $ | 157 | $ | 39 | $ | (73 | ) | $ | (415 | ) | $ | (5 | ) | |||||||
Noncontrolling interests | 26 | 24 | 19 | 10 | 10 | |||||||||||||||
Income tax expense | 88 | 69 | 13 | 289 | 83 | |||||||||||||||
Interest expense, net of interest capitalized | 108 | 149 | 133 | 113 | 164 | |||||||||||||||
Depreciation and amortization of other intangibles | 207 | 216 | 221 | 222 | 205 | |||||||||||||||
|
|
|
|
|
|
|
|
|
| |||||||||||
Total EBITDA including noncontrolling interests | $ | 586 | $ | 497 | $ | 313 | $ | 219 | $ | 457 | ||||||||||
|
|
|
|
|
|
|
|
|
| |||||||||||
| (e) | We present the ratio of net debt (total debt less cash and cash equivalents) to EBITDA including noncontrolling interests because management believes it is a useful measure of Tenneco's credit position and progress toward reducing leverage. The calculation is limited in that we may not always be able to use cash to repay debt on a dollar-for-dollar basis. |
| (f) | For purposes of computing this ratio, earnings generally consist of income before income taxes and fixed charges excluding capitalized interest. Fixed charges consist of interest expense, the portion of rental expense considered representative of the interest factor and capitalized interest. Earnings were insufficient to cover fixed charges by $39 million and $121 million for the years ended December 31, 2009 and 2008, respectively. See Exhibit 12 to this Form 10-K for the calculation of this ratio. |
43
| ITEM 7. | MANAGEMENT'S DISCUSSION AND ANALYSIS OF FINANCIAL CONDITION AND RESULTS OF OPERATIONS. |
As you read the following review of our financial condition and results of operations, you should also read our consolidated financial statements and related notes beginning on page 67.
Executive Summary
We are one of the world's leading manufacturers of emission control and ride control products and systems for light, commercial and specialty vehicle applications. We serve both original equipment (OE) vehicle designers and manufacturers and the repair and replacement markets, or aftermarket, globally through leading brands, including Monroe ® , Rancho ® , Clevite ® Elastomers, Marzocchi ® , Axios TM , Kinetic TM and Fric-Rot TM ride control products and Walker ® , Fonos TM , DynoMax ® , Thrush TM and Lukey TM emission control products. We serve more than 64 different original equipment manufacturers and commercial vehicle engine manufacturers, and our products are included on nine of the top 10 car models produced for sale in Europe and nine of the top 10 light truck models produced for sale in North America for 2011. Our aftermarket customers are comprised of full-line and specialty warehouse distributors, retailers, jobbers, installer chains and car dealers. As of December 31, 2011, we operated 87 manufacturing facilities worldwide and employed approximately 24,000 people to service our customers' demands.
Factors that continue to be critical to our success include winning new business awards, managing our overall global manufacturing footprint to ensure proper placement and workforce levels in line with business needs, maintaining competitive wages and benefits, maximizing efficiencies in manufacturing processes and reducing overall costs. In addition, our ability to adapt to key industry trends, such as a shift in consumer preferences to other vehicles in response to higher fuel costs and other economic and social factors, increasing technologically sophisticated content, changing aftermarket distribution channels, increasing environmental standards and extended product life of automotive parts, also play a critical role in our success. Other factors that are critical to our success include adjusting to economic challenges such as increases in the cost of raw materials and our ability to successfully reduce the impact of any such cost increases through material substitutions, cost reduction initiatives and other methods.
For 2011, light vehicle production continued to improve from recent years in most geographic regions in which we operate. Light vehicle production was up 10 percent in North America and up five percent in both Europe and China, though not to the levels seen in recent history.
We have a substantial amount of indebtedness. As such, our ability to generate cash - both to fund operations and service our debt - is also a significant area of focus for our company. See "Liquidity and Capital Resources" below for further discussion of cash flows and Item 1A, "Risk Factors" included in this Annual Report on Form 10-K.
Total revenues for 2011 were $7,205 million ($1,295 million in aftermarket revenues and $5,910 million in original equipment revenues), a 21 percent increase from $5,937 million ($1,169 million in aftermarket revenues and $4,768 million in original equipment revenues) in 2010. Excluding the impact of currency and substrate sales, revenue was up $711 million, or 15 percent, driven primarily by higher OE production volumes, higher aftermarket sales globally and new launches of light and commercial vehicle emission control programs.
44
Cost of sales: Cost of sales for 2011 was $6,037 million, or 83.8 percent of sales, compared to $4,900 million, or 82.5 percent of sales in 2010. The following table lists the primary drivers behind the change in cost of sales ($ millions).
Year ended December 31, 2010 | $ | 4,900 | ||
Volume and mix | 871 | |||
Material | 70 | |||
Currency exchange rates | 179 | |||
Restructuring | (16 | ) | ||
Other Costs | 33 | |||
|
| |||
Year ended December 31, 2011 | $ | 6,037 | ||
|
|
The increase in cost of sales was due primarily to the year-over-year increase in production volumes, the impact of foreign currency exchange rates and higher material and other costs, mainly manufacturing.
Gross margin: Revenue less cost of sales for 2011 was $1,168 million, or 16.2 percent, versus $1,037 million, or 17.5 percent in 2010. The decline in gross margin percentage was primarily driven by a higher mix of OE revenues, higher substrate sales and higher material costs net of recoveries, which together had a 0.9 percentage point impact on gross margin. The effects on gross margin resulting from higher volumes and lower restructuring and related expenses were more than offset by unfavorable pricing, primarily related to contractual price reductions, higher manufacturing costs, particularly in our North America OE ride control business, and inflationary wage costs in South America and accounted for the remaining decline in gross margin.
Engineering, research and development: Engineering, research and development expense was $133 million and $117 million in 2011 and 2010, respectively. Increased spending to support customer programs, technology applications, and growth in emerging markets, and higher foreign exchange rates drove the increase in expense year-over-year.
Selling, general and administrative: Selling, general and administrative expense was up $11 million in 2011, at $428 million, compared to $417 million in 2010. Wage inflation in South America, expenses to support new customer programs and new manufacturing facilities in China, and higher aftermarket changeover costs primarily drove the increase in expense year-over-year. Lower deferred and long-term compensation expense indexed to the Company's stock price partially offset these increases. 2010 included $6 million of charges related to an actuarial loss for lump-sum pension payments.
Depreciation and amortization: Depreciation and amortization expense in 2011 was $207 million, compared to $216 million in 2010. Included in 2010 was $5 million of restructuring and related expenses.
Goodwill impairment: During the third quarter of 2011, we performed an impairment evaluation of our Australian reporting unit's goodwill balance as a result of continued deterioration of that reporting unit's financial performance driven by significant declines in industry production volumes in that region. As a result of our impairment evaluation, we concluded that the remaining amount of goodwill was impaired and accordingly, we recorded a goodwill impairment charge of $11 million.
Earnings before interest expense, taxes and noncontrolling interests ("EBIT") was $379 million for 2011, an improvement of $98 million, when compared to $281 million in the prior year. Higher OE revenues, stronger margins on new light and commercial vehicle launches, lower depreciation and amortization expense, decreased restructuring and related costs, higher aftermarket sales, lower deferred and long-term compensation expense indexed to the Company's stock price and $14 million of positive currency, drove the year-over-year increase to EBIT. Partially offsetting the increase were higher selling, general, administrative and engineering spending to support new customer programs, which included higher aftermarket changeover costs and investments in new facilities in China, unfavorable pricing, primarily related to contractual price reductions, increased material costs net of recoveries, a goodwill impairment charge of $11 million in Australia and higher manufacturing and freight expenses.
45
Results from Operations
Net Sales and Operating Revenues for Years 2011 and 2010
The following tables reflect our revenues for 2011 and 2010. We present these reconciliations of revenues in order to reflect the trend in our sales in various product lines and geographic regions separately from the effects of doing business in currencies other than the U.S. dollar. We have not reflected any currency impact in the 2010 table since this is the base period for measuring the effects of currency during 2011 on our operations. We believe investors find this information useful in understanding period-to-period comparisons in our revenues.
Additionally, we show the component of our revenue represented by substrate sales in the following tables. While we generally have primary design, engineering and manufacturing responsibility for OE emission control systems, we do not manufacture substrates. Substrates are porous ceramic filters coated with a catalyst - precious metals such as platinum, palladium and rhodium. These are supplied to us by Tier 2 suppliers as directed by our OE customers. We generally earn a small margin on these components of the system. As the need for more sophisticated emission control solutions increases to meet more stringent environmental regulations, and as we capture more diesel aftertreatment business, these substrate components have been increasing as a percentage of our revenue. While these substrates dilute our gross margin percentage, they are a necessary component of an emission control system. We view the growth of substrates as a key indicator that our value-add content in an emission control system is moving toward the higher technology hot-end gas and diesel business.
Our value-add content in an emission control system includes designing the system to meet environmental regulations through integration of the substrates into the system, maximizing use of thermal energy to heat up the catalyst quickly, efficiently managing airflow to reduce back pressure as the exhaust stream moves past the catalyst, managing the expansion and contraction of the emission control system components due to temperature extremes experienced by an emission control system, using advanced acoustic engineering tools to design the desired exhaust sound, minimizing the opportunity for the fragile components of the substrate to be damaged when we integrate it into the emission control system and reducing unwanted noise, vibration and harshness transmitted through the emission control system.
46
We present these substrate sales separately in the following table because we believe investors utilize this information to understand the impact of this portion of our revenues on our overall business and because it removes the impact of potentially volatile precious metals pricing from our revenues. While our original equipment customers generally assume the risk of precious metals pricing volatility, it impacts our reported revenues. Excluding "substrate" catalytic converter and diesel particulate filter sales removes this impact.
| Year Ended December 31, 2011 | ||||||||||||||||||||
| Revenues | Currency Impact | Revenues Excluding Currency | Substrate Sales Excluding Currency | Revenues Excluding Currency and Substrate Sales | ||||||||||||||||
| (Millions) | ||||||||||||||||||||
North America Original Equipment | ||||||||||||||||||||
Ride Control | $ | 608 | $ | 4 | $ | 604 | $ | - | $ | 604 | ||||||||||
Emission Control | 2,085 | - | 2,085 | 971 | 1,114 | |||||||||||||||
|
|
|
|
|
|
|
|
|
| |||||||||||
Total North America Original Equipment | 2,693 | 4 | 2,689 | 971 | 1,718 | |||||||||||||||
North America Aftermarket | ||||||||||||||||||||
Ride Control | 518 | 5 | 513 | - | 513 | |||||||||||||||
Emission Control | 203 | 3 | 200 | - | 200 | |||||||||||||||
|
|
|
|
|
|
|
|
|
| |||||||||||
Total North America Aftermarket | 721 | 8 | 713 | - | 713 | |||||||||||||||
Total North America | 3,414 | 12 | 3,402 | 971 | 2,431 | |||||||||||||||
Europe Original Equipment | ||||||||||||||||||||
Ride Control | 567 | 31 | 536 | - | 536 | |||||||||||||||
Emission Control | 1,455 | 81 | 1,374 | 464 | 910 | |||||||||||||||
|
|
|
|
|
|
|
|
|
| |||||||||||
Total Europe Original Equipment | 2,022 | 112 | 1,910 | 464 | 1,446 | |||||||||||||||
Europe Aftermarket | ||||||||||||||||||||
Ride Control | 219 | 12 | 207 | - | 207 | |||||||||||||||
Emission Control | 140 | 8 | 132 | - | 132 | |||||||||||||||
|
|
|
|
|
|
|
|
|
| |||||||||||
Total Europe Aftermarket | 359 | 20 | 339 | - | 339 | |||||||||||||||
South America & India | 632 | 8 | 624 | 102 | 522 | |||||||||||||||
Total Europe, South America & India | 3,013 | 140 | 2,873 | 566 | 2,307 | |||||||||||||||
Asia | 618 | 29 | 589 | 93 | 496 | |||||||||||||||
Australia | 160 | 20 | 140 | 10 | 130 | |||||||||||||||
|
|
|
|
|
|
|
|
|
| |||||||||||
Total Asia Pacific | 778 | 49 | 729 | 103 | 626 | |||||||||||||||
|
|
|
|
|
|
|
|
|
| |||||||||||
Total Tenneco | $ | 7,205 | $ | 201 | $ | 7,004 | $ | 1,640 | $ | 5,364 | ||||||||||
|
|
|
|
|
|
|
|
|
| |||||||||||
47
| Year Ended December 31, 2010 | ||||||||||||||||||||
| Revenues | Currency Impact | Revenues Excluding Currency | Substrate Sales Excluding Currency | Revenues Excluding Currency and Substrate Sales | ||||||||||||||||
| (Millions) | ||||||||||||||||||||
North America Original Equipment | ||||||||||||||||||||
Ride Control | $ | 527 | $ | - | $ | 527 | $ | - | $ | 527 | ||||||||||
Emission Control | 1,642 | - | 1,642 | 739 | 903 | |||||||||||||||
|
|
|
|
|
|
|
|
|
| |||||||||||
Total North America Original Equipment | 2,169 | - | 2,169 | 739 | 1,430 | |||||||||||||||
North America Aftermarket | ||||||||||||||||||||
Ride Control | 484 | - | 484 | - | 484 | |||||||||||||||
Emission Control | 168 | - | 168 | - | 168 | |||||||||||||||
|
|
|
|
|
|
|
|
|
| |||||||||||
Total North America Aftermarket | 652 | - | 652 | - | 652 | |||||||||||||||
Total North America | 2,821 | - | 2,821 | 739 | 2,082 | |||||||||||||||
Europe Original Equipment | ||||||||||||||||||||
Ride Control | 462 | - | 462 | - | 462 | |||||||||||||||
Emission Control | 1,121 | - | 1,121 | 351 | 770 | |||||||||||||||
|
|
|
|
|
|
|
|
|
| |||||||||||
Total Europe Original Equipment | 1,583 | - | 1,583 | 351 | 1,232 | |||||||||||||||
Europe Aftermarket | ||||||||||||||||||||
Ride Control | 190 | - | 190 | - | 190 | |||||||||||||||
Emission Control | 141 | - | 141 | - | 141 | |||||||||||||||
|
|
|
|
|
|
|
|
|
| |||||||||||
Total Europe Aftermarket | 331 | - | 331 | - | 331 | |||||||||||||||
South America & India | 532 | - | 532 | 76 | 456 | |||||||||||||||
Total Europe, South America & India | 2,446 | - | 2,446 | 427 | 2,019 | |||||||||||||||
Asia | 517 | - | 517 | 107 | 410 | |||||||||||||||
Australia | 153 | - | 153 | 11 | 142 | |||||||||||||||
|
|
|
|
|
|
|
|
|
| |||||||||||
Total Asia Pacific | 670 | - | 670 | 118 | 552 | |||||||||||||||
|
|
|
|
|
|
|
|
|
| |||||||||||
Total Tenneco | $ | 5,937 | $ | - | $ | 5,937 | $ | 1,284 | $ | 4,653 | ||||||||||
|
|
|
|
|
|
|
|
|
| |||||||||||
48
| Year Ended December 31,
2011 Versus Year Ended December 31, 2010 Dollar and Percent Increase (Decrease) | ||||||||||||||||
| Revenues | Percent | Revenues Excluding Currency and Substrate Sales | Percent | |||||||||||||
| (Millions Except Percent Amounts) | ||||||||||||||||
North America Original Equipment | ||||||||||||||||
Ride Control | $ | 81 | 15 | % | $ | 77 | 15 | % | ||||||||
Emission Control | 443 | 27 | % | 211 | 23 | % | ||||||||||
|
|
|
|
|
|
|
| |||||||||
Total North America Original Equipment | 524 | 24 | % | 288 | 20 | % | ||||||||||
North America Aftermarket | ||||||||||||||||
Ride Control | 34 | 7 | % | 29 | 6 | % | ||||||||||
Emission Control | 35 | 21 | % | 32 | 19 | % | ||||||||||
|
|
|
|
|
|
|
| |||||||||
Total North America Aftermarket | 69 | 11 | % | 61 | 9 | % | ||||||||||
Total North America | 593 | 21 | % | 349 | 17 | % | ||||||||||
Europe Original Equipment | ||||||||||||||||
Ride Control | 105 | 23 | % | 74 | 16 | % | ||||||||||
Emission Control | 334 | 30 | % | 140 | 18 | % | ||||||||||
|
|
|
|
|
|
|
| |||||||||
Total Europe Original Equipment | 439 | 28 | % | 214 | 17 | % | ||||||||||
Europe Aftermarket | ||||||||||||||||
Ride Control | 29 | 15 | % | 17 | 9 | % | ||||||||||
Emission Control | (1 | ) | (1 | )% | (9 | ) | (7 | )% | ||||||||
|
|
|
|
|
|
|
| |||||||||
Total Europe Aftermarket | 28 | 8 | % | 8 | 2 | % | ||||||||||
South America & India | 100 | 19 | % | 66 | 15 | % | ||||||||||
Total Europe, South America & India | 567 | 23 | % | 288 | 14 | % | ||||||||||
Asia | 101 | 20 | % | 86 | 21 | % | ||||||||||
Australia | 7 | 5 | % | (12 | ) | (9 | )% | |||||||||
|
|
|
|
|
|
|
| |||||||||
Total Asia Pacific | 108 | 16 | % | 74 | 13 | % | ||||||||||
|
|
|
|
|
|
|
| |||||||||
Total Tenneco | $ | 1,268 | 21 | % | $ | 711 | 15 | % | ||||||||
|
|
|
|
|
|
|
| |||||||||
Light Vehicle Industry Production by Region for Years Ended December 31, 2011 and 2010 (According to IHS Automotive, January 2012)
| Year
Ended December 31, | Increase (Decrease) | % Increase | ||||||||||||||
| 2011 | 2010 | |||||||||||||||
| (Number of Vehicles in Thousands) | ||||||||||||||||
North America | 13,126 | 11,941 | 1,185 | 10 | % | |||||||||||
Europe | 20,089 | 19,208 | 881 | 5 | % | |||||||||||
South America | 4,318 | 4,173 | 145 | 3 | % | |||||||||||
India | 3,573 | 3,247 | 326 | 10 | % | |||||||||||
|
|
|
|
|
|
|
| |||||||||
Total Europe, South America & India | 27,980 | 26,628 | 1,352 | 5 | % | |||||||||||
China | 17,210 | 16,398 | 812 | 5 | % | |||||||||||
Australia | 221 | 242 | (21 | ) | (9 | )% | ||||||||||
49
North American light vehicle production increased 10 percent, while industry Class 8 commercial vehicle production was up 61 percent and industry Class 4-7 commercial vehicle production was up 49% in 2011 when compared to 2010. Revenues from our North American operations increased in 2011 compared to last year due to higher OE and aftermarket sales of both product lines. The increase in North American OE revenues was primarily driven by improved production volumes, which accounted for $503 million of the year-over-year change in revenues, on Tenneco-supplied vehicles such as the Ford Super-Duty and F-150 pick-ups, Ford Focus, Chevy Malibu, VW Jetta, Chevrolet Equinox, GM's crossover models and the Toyota Tundra. Also contributing to the increase was a 63 percent increase in commercial vehicle OE revenues and a favorable $4 million currency impact on OE revenue year-over-year. The increase in aftermarket revenue for North America was primarily due to higher volumes in both product lines which resulted in a combined increase in revenue of $57 million. Favorable currency impacted aftermarket revenue by $8 million year-over-year.
Our European, South American and Indian segment's revenues increased in 2011 compared to last year, due to increased sales in both Europe OE business units and European Aftermarket ride control as well as in South America and India. The full year total European light vehicle industry production was up five percent, while industry Class 8 commercial vehicle production was up 37 percent and industry Class 4-7 commercial vehicle production was up eight percent in 2011 when compared to 2010. Improved volumes due to higher OE production on platforms such as the VW Golf and Polo, the Mercedes E-class and CLS, Diamler Sprinter, the Ford Focus, the BMW 1 and 3 Series, Audi A4, A6 and A1, Renault/Dacia Logan and Opel Astra and Zafira were the primary drivers of our increased Europe OE revenues and contributed to an increase in revenue of $315 million. Higher commercial and specialty revenue also contributed to this increase. European OE revenue also benefited compared to last year from improved pricing, mainly material cost recovery and favorable foreign currency which had a combined impact of $127 million. Excluding currency, European ride control aftermarket revenues improved compared to last year on higher sales volumes which had a $17 million impact, tied in part to heavy duty sales. Excluding currency, European emission control aftermarket sales were down mainly due to volumes which accounted for $8 million of the decline. Light vehicle production increased three percent in South America and 10 percent in India for 2011 when compared to 2010. South American and Indian revenues were higher in 2011 when compared to the prior year primarily due to stronger OE and aftermarket volumes in both regions, which increased revenue by $76 million. Currency also added $8 million to South American and Indian revenue.
Industry light vehicle production increased five percent year-over-year in China but decreased nine percent year-over-year in Australia. Revenues from our Asia Pacific segment increased mainly due to higher sales in China. Asian revenues for 2011 improved from last year, primarily due to $77 million from stronger production volumes, particularly in China on key Tenneco-supplied GM, Ford, Audi, Volkswagon, FAW and Nissan platforms. Foreign currency also benefited Asian revenue by $29 million. Excluding $20 million in favorable foreign currency, lower OE production volumes in Australia drove a $10 million negative impact on revenue for 2011 over 2010.
50
Net Sales and Operating Revenues for Years 2010 and 2009
The following tables reflect our revenues for the years of 2010 and 2009. See "Net Sales and Operating Revenues for Years 2011 and 2010" for a description of why we present these reconciliations of revenue.
| Year Ended December 31, 2010 | ||||||||||||||||||||
| Revenues | Currency Impact | Revenues Excluding Currency | Substrate Sales Excluding Currency | Revenues Excluding Currency and Substrate Sales | ||||||||||||||||
| (Millions) | ||||||||||||||||||||
North America Original Equipment | ||||||||||||||||||||
Ride Control | $ | 527 | $ | 11 | $ | 516 | $ | - | $ | 516 | ||||||||||
Emission Control | 1,642 | 7 | 1,635 | 739 | 896 | |||||||||||||||
|
|
|
|
|
|
|
|
|
| |||||||||||
Total North America Original Equipment | 2,169 | 18 | 2,151 | 739 | 1,412 | |||||||||||||||
North America Aftermarket | ||||||||||||||||||||
Ride Control | 484 | 4 | 480 | - | 480 | |||||||||||||||
Emission Control | 168 | 2 | 166 | - | 166 | |||||||||||||||
|
|
|
|
|
|
|
|
|
| |||||||||||
Total North America Aftermarket | 652 | 6 | 646 | - | 646 | |||||||||||||||
Total North America | 2,821 | 24 | 2,797 | 739 | 2,058 | |||||||||||||||
Europe Original Equipment | ||||||||||||||||||||
Ride Control | 462 | (26 | ) | 488 | - | 488 | ||||||||||||||
Emission Control | 1,121 | (40 | ) | 1,161 | 369 | 792 | ||||||||||||||
|
|
|
|
|
|
|
|
|
| |||||||||||
Total Europe Original Equipment | 1,583 | (66 | ) | 1,649 | 369 | 1,280 | ||||||||||||||
Europe Aftermarket | ||||||||||||||||||||
Ride Control | 190 | (8 | ) | 198 | - | 198 | ||||||||||||||
Emission Control | 141 | (7 | ) | 148 | - | 148 | ||||||||||||||
|
|
|
|
|
|
|
|
|
| |||||||||||
Total Europe Aftermarket | 331 | (15 | ) | 346 | - | 346 | ||||||||||||||
South America & India | 532 | 33 | 499 | 74 | 425 | |||||||||||||||
Total Europe, South America & India | 2,446 | (48 | ) | 2,494 | 443 | 2,051 | ||||||||||||||
Asia | 517 | 8 | 509 | 106 | 403 | |||||||||||||||
Australia | 153 | 18 | 135 | 9 | 126 | |||||||||||||||
|
|
|
|
|
|
|
|
|
| |||||||||||
Total Asia Pacific | 670 | 26 | 644 | 115 | 529 | |||||||||||||||
|
|
|
|
|
|
|
|
|
| |||||||||||
Total Tenneco | $ | 5,937 | $ | 2 | $ | 5,935 | $ | 1,297 | $ | 4,638 | ||||||||||
|
|
|
|
|
|
|
|
|
| |||||||||||
51
| Year Ended December 31, 2009 | ||||||||||||||||||||
| Revenues | Currency Impact | Revenues Excluding Currency | Substrate Sales Excluding Currency | Revenues Excluding Currency and Substrate Sales | ||||||||||||||||
| (Millions) | ||||||||||||||||||||
North America Original Equipment | ||||||||||||||||||||
Ride Control | $ | 382 | $ | - | $ | 382 | $ | - | $ | 382 | ||||||||||
Emission Control | 1,154 | - | 1,154 | 530 | 624 | |||||||||||||||
|
|
|
|
|
|
|
|
|
| |||||||||||
Total North America Original Equipment | 1,536 | - | 1,536 | 530 | 1,006 | |||||||||||||||
North America Aftermarket | ||||||||||||||||||||
Ride Control | 406 | - | 406 | - | 406 | |||||||||||||||
Emission Control | 150 | - | 150 | - | 150 | |||||||||||||||
|
|
|
|
|
|
|
|
|
| |||||||||||
Total North America Aftermarket | 556 | - | 556 | - | 556 | |||||||||||||||
Total North America | 2,092 | - | 2,092 | 530 | 1,562 | |||||||||||||||
Europe Original Equipment | ||||||||||||||||||||
Ride Control | 421 | - | 421 | - | 421 | |||||||||||||||
Emission Control | 917 | - | 917 | 296 | 621 | |||||||||||||||
|
|
|
|
|
|
|
|
|
| |||||||||||
Total Europe Original Equipment | 1,338 | - | 1,338 | 296 | 1,042 | |||||||||||||||
Europe Aftermarket | ||||||||||||||||||||
Ride Control | 181 | - | 181 | - | 181 | |||||||||||||||
Emission Control | 154 | - | 154 | - | 154 | |||||||||||||||
|
|
|
|
|
|
|
|
|
| |||||||||||
Total Europe Aftermarket | 335 | - | 335 | - | 335 | |||||||||||||||
South America & India | 374 | - | 374 | 45 | 329 | |||||||||||||||
Total Europe, South America & India | 2,047 | - | 2,047 | 341 | 1,706 | |||||||||||||||
Asia | 380 | - | 380 | 85 | 295 | |||||||||||||||
Australia | 130 | - | 130 | 10 | 120 | |||||||||||||||
|
|
|
|
|
|
|
|
|
| |||||||||||
Total Asia Pacific | 510 | - | 510 | 95 | 415 | |||||||||||||||
|
|
|
|
|
|
|
|
|
| |||||||||||
Total Tenneco | $ | 4,649 | $ | - | $ | 4,649 | $ | 966 | $ | 3,683 | ||||||||||
|
|
|
|
|
|
|
|
|
| |||||||||||
52
| Year Ended December 31,
2010 Versus Year Ended December 31, 2009 Dollar and Percent Increase (Decrease) | ||||||||||||||||
| Revenues | Percent | Revenues Excluding Currency and Substrate Sales | Percent | |||||||||||||
| (Millions Except Percent Amounts) | ||||||||||||||||
North America Original Equipment | ||||||||||||||||
Ride Control | $ | 145 | 38 | % | $ | 134 | 35 | % | ||||||||
Emission Control | 488 | 42 | % | 272 | 44 | % | ||||||||||
|
|
|
|
|
|
|
| |||||||||
Total North America Original Equipment | 633 | 41 | % | 406 | 40 | % | ||||||||||
North America Aftermarket | ||||||||||||||||
Ride Control | 78 | 19 | % | 74 | 18 | % | ||||||||||
Emission Control | 18 | 12 | % | 16 | 10 | % | ||||||||||
|
|
|
|
|
|
|
| |||||||||
Total North America Aftermarket | 96 | 17 | % | 90 | 16 | % | ||||||||||
Total North America | 729 | 35 | % | 496 | 32 | % | ||||||||||
Europe Original Equipment | ||||||||||||||||
Ride Control | 41 | 10 | % | 67 | 16 | % | ||||||||||
Emission Control | 204 | 22 | % | 171 | 28 | % | ||||||||||
|
|
|
|
|
|
|
| |||||||||
Total Europe Original Equipment | 245 | 18 | % | 238 | 23 | % | ||||||||||
Europe Aftermarket | ||||||||||||||||
Ride Control | 9 | 6 | % | 17 | 10 | % | ||||||||||
Emission Control | (13 | ) | (9 | )% | (6 | ) | (4 | )% | ||||||||
|
|
|
|
|
|
|
| |||||||||
Total Europe Aftermarket | (4 | ) | (1 | )% | 11 | 3 | % | |||||||||
South America & India | 158 | 42 | % | 96 | 29 | % | ||||||||||
Total Europe, South America & India | 399 | 20 | % | 345 | 20 | % | ||||||||||
Asia | 137 | 36 | % | 108 | 37 | % | ||||||||||
Australia | 23 | 18 | % | 6 | 4 | % | ||||||||||
|
|
|
|
|
|
|
| |||||||||
Total Asia Pacific | 160 | 31 | % | 114 | 27 | % | ||||||||||
|
|
|
|
|
|
|
| |||||||||
Total Tenneco | $ | 1,288 | 28 | % | $ | 955 | 26 | % | ||||||||
|
|
|
|
|
|
|
| |||||||||
Light Vehicle Industry Production by Region for Years Ended December 31, 2010 and 2009 (Updated according to IHS Automotive, January 2012)
| Year Ended December 31, | Increase (Decrease) | % Increase | ||||||||||||||
| 2010 | 2009 | |||||||||||||||
| (Number of Vehicles in Thousands) | ||||||||||||||||
North America | 11,941 | 8,583 | 3,358 | 39 | % | |||||||||||
Europe | 19,208 | 16,517 | 2,691 | 16 | % | |||||||||||
South America | 4,173 | 3,693 | 480 | 13 | % | |||||||||||
India | 3,247 | 2,464 | 783 | 32 | % | |||||||||||
|
|
|
|
|
|
|
| |||||||||
Total Europe, South America & India | 26,628 | 22,674 | 3,954 | 17 | % | |||||||||||
China | 16,398 | 12,601 | 3,797 | 30 | % | |||||||||||
Australia | 242 | 213 | 29 | 14 | % | |||||||||||
53
North American light vehicle production increased 39 percent, while industry Class 8 commercial vehicle production was up 25 percent and industry Class 4-7 commercial vehicle production was flat in 2010 when compared to 2009. Revenues from our North American operations increased in 2010 compared to 2009 due to higher OE and aftermarket sales of both product lines. The increase in North American OE revenues was primarily driven by improved production volumes of Tenneco-supplied vehicles such as the Ford F-150 and Super-Duty pick-ups, GM's crossover models and the GMT900 platform which accounted for $655 million in revenues. Partially offsetting the increase was unfavorable platform mix which impacted revenue by $31 million when comparing 2010 to 2009. The increase in aftermarket revenues for North America was primarily due to higher customer demand for both product lines which resulted in a combined increase in revenue of $101 million.
Our European, South American and Indian segment's revenues increased in 2010 compared to 2009, due to increased sales in both Europe OE business units as well as in South America and India. The full year total European light vehicle industry production was up 16 percent, while industry Class 8 commercial vehicle production was up 55 percent and industry Class 4-7 commercial vehicle production was up 38 percent in 2010 when compared to 2009. Improved volumes due to our content on better-selling vehicles such as the Ford Focus, VW Polo, Opel Astra, Ford Mondeo and the Daimler Sprinter was the primary driver of our increased Europe OE revenues and resulted in an increase in revenue of $292 million, partially offset by a decrease of $66 million due to foreign currency. Excluding currency, European aftermarket revenues improved on higher ride control sales volumes of $16 million, tied in part to heavy duty sales, partially offset by lower emission control sales volumes of $6 million. Light vehicle production increased 13 percent in South America and 32 percent in India for 2010 when compared to 2009. South American and Indian revenues were higher in 2010 when compared to 2009 primarily due to higher aftermarket sales in South America and stronger OE production volumes in both regions, which increased revenue by $112 million. Currency also added $33 million to South American and Indian revenue.
Industry light vehicle production increased when comparing 2010 versus 2009 by 30 percent and 14 percent in China and Australia, respectively. Revenues from our Asia Pacific segment, which includes Australia and Asia, increased due to higher sales in both regions. Asian revenues for 2010 improved from 2009, primarily due to $133 million from stronger production volumes, particularly in China on key Tenneco-supplied GM, VW and Audi platforms. A $9 million impact on revenue due to stronger OE production volumes drove the 2010 revenue increase for Australia over 2009. Currency added $8 million to Asia revenue and $18 million to Australia revenue.
Earnings before Interest Expense, Income Taxes and Noncontrolling Interests ("EBIT") for Years 2011 and 2010
| Year
Ended December 31, | Change | |||||||||||
| 2011 | 2010 | |||||||||||
| (Millions) | ||||||||||||
North America | $ | 216 | $ | 155 | $ | 61 | ||||||
Europe, South America and India | 125 | 76 | 49 | |||||||||
Asia Pacific | 38 | 50 | (12 | ) | ||||||||
|
|
|
|
|
| |||||||
| $ | 379 | $ | 281 | $ | 98 | |||||||
|
|
|
|
|
| |||||||
54
The EBIT results shown in the preceding table include the following items, certain of which are discussed below under "Restructuring and Other Charges," which have an effect on the comparability of EBIT results between periods:
| Year
Ended December 31, | ||||||||
| 2011 | 2010 | |||||||
| (Millions) | ||||||||
North America | ||||||||
Restructuring and related expenses | $ | 2 | $ | 14 | ||||
Pension Charges(1) | - | 6 | ||||||
Europe, South America and India | ||||||||
Restructuring and related expenses | 3 | 3 | ||||||
Asia Pacific | ||||||||
Restructuring and related expenses | 3 | 2 | ||||||
Goodwill impairment charge(2) | 11 | - | ||||||
| (1) | Represents charges related to an actuarial loss for lump-sum pension payments in a non-qualified pension plan in which one current and three former employees were participants. Lump-sum pension payments are required when participants retire or when they turn 55. Two former employees turned 55 in 2010. |
| (2) | Non-cash asset impairment charge related to goodwill for Tenneco's Australian reporting unit. |
EBIT from North American operations increased to $216 million in 2011, from $155 million one year ago. The benefits to EBIT from significantly higher OE production volumes, the related manufacturing efficiencies, decreased depreciation and amortization expense, lower deferred and long-term compensation expense indexed to the Company's stock price and improved aftermarket revenues were partially offset by increased material spending, increased manufacturing and distribution costs, and higher selling, general, administrative and engineering costs, which included a year-over-year increase to aftermarket changeover costs related to new aftermarket business. Restructuring and related expenses of $2 million were included in 2011 compared to $14 million of restructuring and related expenses and charges of $6 million for an actuarial loss from lump-sum pension payments in 2010. The increased manufacturing costs included higher year-over-year costs, particularly in the third and fourth quarters, related to our North American OE ride control business as we incur some temporarily higher costs while consolidating two North American manufacturing locations. Additionally, in the fourth quarter, we encountered an issue involving struts supplied on one particular OE platform. As a result, we directly incurred approximately $2 million in premium freight and overtime costs, some of which we expect to continue into 2012. We are also continuing to work through details with the customer to determine responsibility for any other costs associated with this issue. We cannot estimate the amount of these costs at this time, but do not believe they will be material to our annual operating results.
Our European, South American and Indian segment's EBIT was $125 million for 2011 compared to $76 million during the same period last year. The increase was driven by higher OE production volumes, material cost management activities and lower deferred and long-term compensation expense indexed to the Company's stock price. Unfavorable pricing, mainly contractual price reductions and increased manufacturing and selling, general, administrative and engineering costs, in particular inflationary wage costs in South America, partially offset the increase. Restructuring and related expenses of $3 million was included in EBIT for both 2011 and 2010. Currency had an $11 million favorable impact on EBIT for 2011 when compared to last year.
EBIT for our Asia Pacific segment in 2011 was $38 million compared to $50 million in 2010. Higher volumes and the related manufacturing efficiencies in China and lower deferred and long-term compensation expense indexed to the Company's stock price drove EBIT improvement, but was more than offset by a goodwill impairment charge and volume declines in Australia, unfavorable pricing and increased selling, general, administrative, and engineering costs to support new plants in China. In addition, lower OE production volumes in Thailand due to the flooding negatively impacted EBIT. Currency had a $3 million favorable impact on EBIT for 2011 when compared to last year.
55
Currency had a $14 million favorable impact on overall company EBIT for 2011 as compared to the prior year.
EBIT for Years 2010 and 2009
| Year
Ended December 31, | Change | |||||||||||
| 2010 | 2009 | |||||||||||
| (Millions) | ||||||||||||
North America | $ | 155 | $ | 42 | $ | 113 | ||||||
Europe, South America and India | 76 | 20 | 56 | |||||||||
Asia Pacific | 50 | 30 | 20 | |||||||||
|
|
|
|
|
| |||||||
| $ | 281 | $ | 92 | $ | 189 | |||||||
|
|
|
|
|
| |||||||
The EBIT results shown in the preceding table include the following items, certain of which are discussed below under "Restructuring and Other Charges", which have an effect on the comparability of EBIT results between periods:
| Year
Ended December 31, | ||||||||
| 2010 | 2009 | |||||||
| (Millions) | ||||||||
North America | ||||||||
Restructuring and related expenses | $ | 14 | $ | 17 | ||||
Pension Charges(1) | 6 | - | ||||||
Environmental reserve(2) | - | 5 | ||||||
Europe, South America and India | ||||||||
Restructuring and related expenses | 3 | 4 | ||||||
Asia Pacific | ||||||||
Restructuring and related expenses | 2 | - | ||||||
| (1) | Represents charges related to an actuarial loss for lump-sum pension payments in a non-qualified pension plan in which one current and three former employees were participants. Lump-sum pension payments are required when participants retire or when they turn 55. Two former employees turned 55 in 2010. |
| (2) | Represents a reserve related to environmental liabilities of a company Tenneco acquired in 1996, at locations never operated by Tenneco, and for which that acquired company had been indemnified by Mark IV Industries, which declared bankruptcy in the second quarter of 2009. |
EBIT for North American operations was $155 million in 2010, an increase of $113 million from $42 million in 2009. The benefits to EBIT from significantly higher OE production volumes, the related manufacturing efficiencies and improved aftermarket revenues were partially offset by higher selling, general, administrative and engineering costs, which included higher performance-based compensation costs, the temporary cost reduction efforts from 2009, which included employee furloughs and salary and benefit cuts, that were subsequently restored by the beginning of 2010, charges of $6 million related to an actuarial loss for lump-sum pension payments and increased aftermarket changeover costs related to new aftermarket business. Currency had a $13 million favorable impact on North American EBIT for 2010 when compared to 2009. Restructuring and related expenses of $14 million were included in 2010 compared to $17 million of restructuring and related expenses and an environmental reserve charge of $5 million in 2009.
Our European, South American and Indian segment's EBIT was $76 million for 2010, up $56 million from $20 million in 2009. The increase was driven by higher OE production volumes and the related manufacturing efficiencies, new platform launches, favorable platform mix in Europe and material cost management activities.
56
Increased selling, general, administrative and engineering costs partially offset the increase. Restructuring and related expenses of $3 million were included in EBIT for 2010, versus $4 million from the same period 2009. Currency had a $13 million unfavorable impact on EBIT for 2010.
EBIT for our Asia Pacific segment, which includes Asia and Australia, increased $20 million to $50 million in 2010 from $30 million in 2009. Higher volumes and the related manufacturing efficiencies drove the EBIT improvement. This increase was partially offset by increased selling, general, administrative and engineering costs. Currency had a $1 million favorable impact on 2010 EBIT for our Asia Pacific segment.
Currency had a $1 million favorable impact on overall company EBIT for 2010 as compared to 2009.
EBIT as a Percentage of Revenue for Years 2011, 2010 and 2009
| Year
Ended December 31, | ||||||||||||
| 2011 | 2010 | 2009 | ||||||||||
North America | 6 | % | 6 | % | 2 | % | ||||||
Europe, South America and India | 4 | % | 3 | % | 1 | % | ||||||
Asia Pacific | 5 | % | 7 | % | 6 | % | ||||||
Total Tenneco | 5 | % | 5 | % | 2 | % | ||||||
In North America, EBIT as a percentage of revenue for 2011 was even when compared to last year. The increase in EBIT from higher OE production volumes and the related manufacturing efficiencies, higher aftermarket sales, lower depreciation and amortization expense, lower deferred and long-term compensation expense indexed to the Company's stock price and decreased restructuring and related charges was offset as a percentage of revenue by increased material spending and manufacturing and distribution costs and higher selling, general, administrative and engineering expenses, including higher aftermarket changeover costs. In Europe, South America and India, EBIT margin for 2011 was up one percentage point from the prior year. Improved volumes, lower deferred and long-term compensation expense indexed to the Company's stock price, currency benefits and material cost management actions, were almost offset as a percentage of revenue by unfavorable pricing and increased manufacturing and selling, general, administrative and engineering expenses, in particular inflationary wage costs in South America. EBIT as a percentage of revenue for our Asia Pacific segment decreased two percentage points in 2011 versus the prior year as higher volumes and the related manufacturing efficiencies in China and lower deferred and long-term compensation expense indexed to the Company's stock price, were more than offset by unfavorable pricing, a goodwill impairment charge, production declines in Australia and increased selling, general, administrative, and engineering expenses to support new plants in China. In addition, lower OE production volumes in Thailand due to the flooding negatively impacted EBIT as a percentage of revenue.
In North America, EBIT as a percentage of revenue for 2010 was up four percentage points when compared to 2009. The increase in EBIT from higher OE production volumes and the related manufacturing efficiencies, decreased restructuring and related charges, higher aftermarket sales and favorable currency was partially offset as a percentage of revenue by higher selling, general, administrative and engineering expenses, including higher aftermarket changeover costs, higher performance-based compensation costs and charges for an actuarial loss for lump-sum pension payments. In Europe, South America and India, EBIT margin for 2010 was two percentage points higher than 2009 due to improved volumes, the related manufacturing efficiencies, lower restructuring and related expenses, favorable platform mix and material cost management actions, partially offset by unfavorable currency and increased selling, general, administrative and engineering expenses. EBIT as a percentage of revenue for our Asia Pacific segment increased one percentage point in 2010 versus the 2009 as higher volumes and the related manufacturing efficiencies were partially offset by increased selling, general, administrative and engineering expenses.
57
Interest Expense, Net of Interest Capitalized
We reported interest expense in 2011 of $108 million net of interest capitalized of $4 million ($105 million in our U.S. operations and $3 million in our foreign operations), down from $149 million net of interest capitalized of $4 million ($146 million in our U.S. operations and $3 million in our foreign operations) in 2010. Included in 2011 was $1 million of expense related to our refinancing activities. Included in 2010 was $27 million of expense related to our refinancing activities and $4 million of expense related to an accounting change impacting our factored receivables. See "Liquidity and Capital Resources" below for further discussion on the accounting change. Excluding the refinancing expenses, interest expense decreased in 2011 compared to the prior year as a result of lower rates due to last year's debt refinancing transactions.
We reported interest expense in 2010 of $149 million net of interest capitalized of $4 million ($146 million in our U.S. operations and $3 million in our foreign operations), up from $133 million net of interest capitalized of $4 million ($130 million in our U.S. operations and $3 million in our foreign operations) in 2009. Included in 2010 was $27 million of expense related to our refinancing activities and $4 million of expense related to an accounting change impacting our factored receivables. See "Liquidity and Capital Resources" below for further discussion of the accounting change. Excluding the refinancing expenses, interest expense decreased in 2010 compared to 2009 as a result of our lower average borrowings due to our operating cash performance and the 2009 equity offering.
On December 31, 2011, we had $987 million in long-term debt obligations that have fixed interest rates. Of that amount, $250 million is fixed through November 2015, $225 million is fixed through August 2018, $500 million is fixed through December 2020 and the remainder is fixed from 2012 through 2025. We also have $175 million in long-term debt obligations that are subject to variable interest rates. For more detailed explanations on our debt structure and senior credit facility refer to "Liquidity and Capital Resources - Capitalization" later in this Management's Discussion and Analysis.
Income Taxes
Income tax expense was $88 million for 2011. The tax expense recorded for 2011 differs from a statutory rate of 35 percent due to a net tax benefit of $7 million primarily related to U.S. taxable income with no associated tax expense due to our net operating loss carryforward and income generated in lower tax rate jurisdictions, partially offset by the impact of recording a valuation allowance against the tax benefit for losses in certain foreign jurisdictions and taxes on repatriation of foreign earnings. Income tax expense was $69 million for 2010. The tax expense recorded for 2010 differs from a statutory rate of 35 percent due to tax charges of $23 million primarily related to the impact of recording a valuation allowance against the tax benefit for losses in the U.S. and certain foreign jurisdictions and charges related to adjustments to prior year income taxes and tax contingencies, partially offset by income generated in lower tax rate jurisdictions. In 2009, we recorded income tax expense of $13 million. Computed using the U.S. Federal statutory income tax rate of 35 percent, income tax would be a benefit of $14 million. The difference is due primarily to valuation allowances against deferred tax assets generated by 2009 losses in the U.S. and in certain foreign countries which we cannot benefit, partially offset by adjustments to past valuation allowances for deferred tax assets including a reversal of $20 million of U.S. valuation allowance based on the change in the fair value of a tax planning strategy.
Restructuring and Other Charges
Over the past several years, we have adopted plans to restructure portions of our operations. These plans were approved by our Board of Directors and were designed to reduce operational and administrative overhead costs throughout the business. For 2009, we incurred $21 million in restructuring and related costs, of which $16 million was recorded in cost of sales, $1 million was recorded in selling, general, administrative and engineering expense and $4 million was recorded in depreciation and amortization expense. In 2010, we incurred $19 million in restructuring and related costs, of which $14 million was recorded in cost of sales and $5 million was recorded in depreciation and amortization expense. During 2011, we incurred $8 million in restructuring and related costs, primarily related to headcount reductions in Europe and Australia and the closure of our ride control plant in Cozad, Nebraska, all of which was recorded in cost of sales.
58
Amounts related to activities that are part of our restructuring plans are as follows:
| December 31, 2010 Restructuring Reserve | 2011 Expenses | 2011 Cash Payments | Reserve Adjustments | December 31, 2011 Restructuring Reserve | ||||||||||||||||
| (millions) | ||||||||||||||||||||
Severance | $ | 7 | 8 | (13 | ) | (1 | ) | $ | 1 | |||||||||||
Under the terms of our amended and extended senior credit agreement that took effect on June 3, 2010, we are allowed to exclude $60 million of cash charges and expenses, before taxes, related to cost reduction initiatives incurred after June 3, 2010 from the calculation of the financial covenant ratios required under our senior credit facility. As of December 31, 2011, we have excluded $17 million in cumulative allowable charges relating to restructuring initiatives against the $60 million available under the terms of the senior credit facility.
On September 22, 2009, we announced that we were closing our original equipment ride control plant in Cozad, Nebraska. The closure of the Cozad plant eliminates approximately 500 positions. We are hiring at other facilities as we move production from Cozad to those facilities, which will result in a net decrease of approximately 60 positions. Much of the production is being shifted from Cozad to our plant in Hartwell, Georgia.
During the transition of production from our Cozad facility to our Hartwell facility, several customer programs, which were planned to phase out, were reinstated and volumes increased beyond the amount in our original restructuring plan. To meet the higher volume requirements, we have taken a number of actions over the past few months to stabilize the production environment in Hartwell including reinforcing several core processes, realigning assembly lines, upgrading equipment to increase output and accelerating our Lean manufacturing activities. Based on the higher volumes, we are adjusting our consolidation plan. Our revised consolidation plan includes temporarily continuing some basic production operations in Cozad, and redirecting some programs from our Hartwell facility to our other North American facilities to better balance production. These actions are anticipated to conclude during the third quarter of 2012. As of December 31, 2011, more than 95 percent of the positions at our Cozad facility have been eliminated. We still estimate that we will generate $8 million in annualized cost savings once these actions are completed.
During 2009 and 2010, we recorded $11 million and $10 million, respectively, of restructuring and related expenses related to this initiative, of which approximately $16 million represents cash expenditures. For 2011, we have recorded an additional cash charge of $2 million related to this initiative.
During 2011, we recorded $3 million of restructuring and related expenses, all of which represented cash expenditures, related to the permanent elimination of 53 positions in our Australian operations as a result of the continued decline in industry production volumes in that region.
Earnings (Loss) Per Share
We reported a net income of $157 million or $2.55 per diluted common share for 2011. Included in the results for 2011 were negative impacts from expenses related to our restructuring activities, a goodwill impairment charge, costs related to our refinancing activities and tax adjustments. The net impact of these items decreased earnings per diluted share by $0.11. We reported net income of $39 million or $0.63 per diluted common share for 2010. Included in the results for 2010 were negative impacts from expenses related to our restructuring activities, pension charges, costs related to our refinancing activities and tax adjustments. The net impact of these items decreased earnings per diluted share by $0.94. We reported a net loss of $73 million or $1.50 per diluted common share for 2009. Included in the results for 2009 were negative impacts from expenses related to our restructuring activities, an environmental reserve and tax adjustments. The net impact of these items decreased earnings per diluted share by $0.91.
Dividends on Common Stock
On January 10, 2001, our Board of Directors eliminated the quarterly dividend on our common stock. There are no current plans to reinstate a dividend on our common stock.
59
Cash Flows for 2011 and 2010
| Year
Ended December 31, | ||||||||
| 2011 | 2010 | |||||||
| (Millions) | ||||||||
Cash provided (used) by: | ||||||||
Operating activities | $ | 245 | $ | 244 | ||||
Investing activities | (224 | ) | (157 | ) | ||||
Financing activities | (26 | ) | (30 | ) | ||||
Operating Activities
For 2011, operating activities provided $245 million in cash compared to $244 million in cash provided during last year. For 2011, cash used for working capital was $130 million versus $71 million of cash used for working capital in 2010. The demand for working capital to support higher revenue primarily drove the increase in 2011 versus 2010. Receivables were a use of cash of $183 million in 2011 compared to a cash use of $231 million in the prior year. Inventory represented a cash outflow of $64 million during 2011, compared to a cash outflow of $122 million for the prior year. Accounts payable provided cash of $144 million for the year ended December 31, 2011, compared to cash provided of $238 million for the year ended December 31, 2010. Cash taxes were $85 million for 2011 compared to $53 million in the prior year.
One of our European subsidiaries receives payment from one of its OE customers whereby the accounts receivable are satisfied through the delivery of negotiable financial instruments. We may collect these financial instruments before their maturity date by either selling them at a discount or using them to satisfy accounts receivable that have previously been sold to a European bank. Any of these financial instruments which are not sold are classified as other current assets. The amount of these financial instruments that was collected before their maturity date and sold at a discount totaled $10 million and $6 million at December 31, 2011 and 2010, respectively. No negotiable financial instruments were held by our European subsidiary as of December 31, 2011 and 2010, respectively.
In certain instances, several of our Chinese subsidiaries receive payment from OE customers and satisfy vendor payments through the receipt and delivery of negotiable financial instruments. Financial instruments used to satisfy vendor payables and not redeemed totaled $14 million and $8 million at December 31, 2011 and 2010, respectively, and were classified as notes payable. Financial instruments received from OE customers and not redeemed totaled $9 million and $11 million at December 31, 2011 and 2010, respectively. We classify financial instruments received from our OE customers as other current assets if issued by a financial institution of our customers or as customer notes and accounts, net if issued by our customer. We classified $9 million and $11 million in other current assets at December 31, 2011 and 2010, respectively. Some of our Chinese subsidiaries that issue their own negotiable financial instruments to pay vendors are required to maintain a cash balance if they exceed certain credit limits with the financial institution that guarantees those financial instruments. A restricted cash balance was not required at those Chinese subsidiaries at December 31, 2011 and 2010, respectively.
The negotiable financial instruments received by one of our European subsidiaries and some of our Chinese subsidiaries are checks drawn by our OE customers and guaranteed by their banks that are payable at a future date. The use of these instruments for payment follows local commercial practice. Because negotiable financial instruments are financial obligations of our customers and are guaranteed by our customers' banks, we believe they represent a lower financial risk than the outstanding accounts receivable that they satisfy which are not guaranteed by a bank.
Investing Activities
Cash used for investing activities was $67 million higher in 2011 compared to the same period a year ago. Cash payments for plant, property and equipment were $213 million in 2011 versus payments of $151 million in
60
2010, an increase of $62 million. This increase was due to investments for new business launches, technology development and future growth opportunities. Cash payments for software-related intangible assets were $15 million in 2011 compared to $12 million in 2010.
Financing Activities
Cash flow from financing activities was an outflow of $26 million for the year ending December 31, 2011 compared to an outflow of $30 million for the year ending December 31, 2010. In the second quarter of 2011, we announced a plan to repurchase up to 400,000 shares of our outstanding common stock. During 2011, we purchased all 400,000 shares of our outstanding common stock for $16 million. We also paid $4 million to secure the remaining 25 percent interest in our emission control joint venture in Thailand, now wholly-owned, during 2011. We ended 2011 with $24 million in borrowings under our revolving credit facility. At December 31, 2011, there were no borrowings outstanding under the North American accounts receivable securitization programs.
Cash Flows for 2010 and 2009
| Year
Ended December 31, | ||||||||
| 2010 | 2009 | |||||||
| (Millions) | ||||||||
Cash provided (used) by: | ||||||||
Operating activities | $ | 244 | $ | 241 | ||||
Investing activities | (157 | ) | (119 | ) | ||||
Financing activities | (30 | ) | (87 | ) | ||||
Operating Activities
For 2010, operating activities provided $244 million in cash compared to $241 million in cash for 2009. For 2010, cash used for working capital was $71 million versus $65 million of cash provided from working capital in 2009. Receivables were a use of cash of $231 million compared to a cash use of $8 million in 2009. The change in cash flow from receivables was partially due to higher year-over-year sales and a change in accounting in the first quarter of 2010. This accounting change requires that North America accounts receivable securitization programs be accounted for as secured borrowings rather than as a sale of accounts receivables. As a result, funding from the North America accounts receivable securitization program is included in net cash provided by financing activities on the statement of cash flows and was previously reflected in net cash used by operating activities. See "Liquidity and Capital Resources" below for further discussion of the accounting change. Inventory represented a cash outflow of $122 million during 2010, compared to a cash inflow of $101 million in 2009. The year-over-year change to cash flow from inventory was primarily a result of higher OE production levels. The higher production environment also led to accounts payable providing cash of $238 million in 2010, compared to a use of cash of $2 million in 2009. Cash taxes were $53 million for 2010 compared to $38 million in 2009.
61
Investing Activities
Cash used for investing activities was $38 million higher in 2010 compared to 2009. Cash payments for plant, property, and equipment were $151 million in 2010 versus payments of $120 million in 2009, an increase of $31 million. This increase was due to deferring discretionary projects in 2009, the investments for new business launches, technology development and future growth opportunities. Cash payments for software-related intangible assets were $12 million in 2010 compared to $6 million in 2009.
Financing Activities
Cash flow from financing activities was an outflow of $30 million in 2010 compared to an outflow of $87 million in 2009. The 2010 outflow was primarily due to debt issuance costs related to our refinancing activities. We used $188 million in net proceeds from our common stock offering in 2009 to pay down debt, primarily borrowings against our revolving credit facility. We ended 2010 with no borrowings under our revolving credit facility. As mentioned above in the "Operating Activities" section of this cash flow discussion, cash flow from financing activities was impacted by the accounting change for the way we account for our North American accounts receivable securitization programs. At December 31, 2010, there were no borrowings outstanding under the North American accounts receivable securitization programs.
Outlook
We are well positioned to deliver revenue growth in 2012 as we launch new business, ramp up programs that have already launched and help our customers meet stricter emissions standards for both on-road and off-road vehicles. We will continue to benefit from our strong position on many of the top-selling light vehicle models and our global presence in the world's largest and fastest growing markets. We estimate that our global original equipment revenues will be approximately $6.6 billion in 2012 and $7.8 billion in 2013 with substrate sales making up 29 percent of total OE revenue in 2012 and 30 percent of total OE revenue in 2013. We expect our global original equipment revenue to increase to between $10.0 billion and $11.5 billion by 2016, with substrate sales comprising 32 percent of total OE revenue.
We will continue to drive OE growth with the technology-driven expansion of commercial vehicle emission control programs, both truck and engine manufacturers, to help customers meet new emissions regulations for on-road and off-road commercial vehicles. We project that our OE commercial and specialty vehicle revenue to be $1.2 billion in 2012 and $1.9 billion in 2013 and account for about 30 percent to 35 percent of our global original equipment revenue by 2016.
62
The revenue estimates presented in this "Outlook" are based on volume projections summarized in the following chart and on original equipment manufacturers' programs that have been formally awarded to the company; programs where the company is highly confident that it will be awarded business based on informal customer indications consistent with past practices; our status as supplier for existing programs and our relationships and experience with the customer; and the actual original equipment revenues achieved by the company for each of the last several years compared to the amount of those revenues that the company estimated it would generate at the beginning of each year. Our revenue estimates are subject to increase or decrease due to changes in customer requirements, customer and consumer preferences, and the number of vehicles actually produced by our customers. We update these estimates annually. In the interim we do not intend to otherwise update the estimates to reflect future changes in these assumptions. In addition, our revenue estimate is based on our anticipated pricing for each applicable program over its life. However, we are under continuing pricing pressures from our OE customers. We do not intend to update the amounts shown above for any price changes. Finally, for our foreign operations, our revenue estimate assumes fixed foreign currency values relative to the U.S. dollar. These values are used to translate foreign revenues to the U.S. dollar. Although such currency values are subject to fluctuations based on the economic conditions in each of our foreign operations, we do not intend to update the annual revenue estimates shown above due to these fluctuations. Currency is assumed to be constant at $1.27 per Euro throughout our projection. We plan to update our revenue guidance during the first quarter of 2013. See "Cautionary Statement for Purposes of the ‘Safe Harbor' Provisions of the Private Securities Litigation Reform Act of 1995" and Item 1A, "Risk Factors".
Light Vehicle Production (According to IHS Automotive, January 2012)
| 2011(actual) | 2012 | 2013 | 2016 | |||||||||||||
| (Number of Vehicles in Millions) | ||||||||||||||||
North America | 13.1 | 13.9 | 14.7 | 16.8 | ||||||||||||
Europe | 20.1 | 18.5 | 19.6 | 22.5 | ||||||||||||
China | 17.2 | 18.4 | 20.4 | 25.8 | ||||||||||||
South America | 4.3 | 4.6 | 5.0 | 5.9 | ||||||||||||
On-Road Commercial Vehicle Production (Class 4-8) (According to Power Systems Research, January 2012)
| 2011(actual) | 2012 | 2013 | 2016 | |||||||||||||
| (Number of Vehicles in Thousands) | ||||||||||||||||
North America | 416 | 467 | 512 | 477 | ||||||||||||
Europe | 558 | 655 | 753 | 790 | ||||||||||||
China | 1,095 | 1,154 | 1,214 | 1,300 | ||||||||||||
Brazil | 204 | 184 | 196 | 223 | ||||||||||||
Off-Road Commercial Vehicle Production (Agriculture, Construction, Mining & Forestry) (According to Power Systems Research, January 2012)
| 2011(actual) | 2012 | 2013 | 2016 | |||||||||||||
| (Number of Vehicles in Thousands) | ||||||||||||||||
U.S. ( ³ 25hp) | 218 | 217 | 229 | 247 | ||||||||||||
Europe ( ³ 50hp) | 426 | 440 | 458 | 459 | ||||||||||||
We anticipate that the global aftermarket for 2012 will continue to be a solid contributor to our business based on our market-leading global brands. We will continue to support our strong brands and aggressively pursue new customers, actions that we hope will help expand our market share globally.
We expect our capital expenditures for 2012 to be approximately $230 million to $250 million. We expect our 2012 interest expense to be about $105 million and our 2012 cash taxes to be approximately $100 million.
63
Liquidity and Capital Resources
Capitalization
| Year
Ended December 31, | % Change | |||||||||||
| 2011 | 2010 | |||||||||||
| (Millions) | ||||||||||||
Short-term debt and maturities classified as current | $ | 66 | $ | 63 | 5 | % | ||||||
Long-term debt | 1,158 | 1,160 | - | |||||||||
|
|
|
| |||||||||
Total debt | 1,224 | 1,223 | - | |||||||||
|
|
|
| |||||||||
Total redeemable noncontrolling interests | 12 | 12 | - | |||||||||
|
|
|
| |||||||||
Total noncontrolling interests | 43 | 39 | 10 | |||||||||
|
|
|
| |||||||||
Tenneco Inc. shareholders' equity | - | (4 | ) | NM | ||||||||
|
|
|
| |||||||||
Total equity | 43 | 35 | 23 | |||||||||
|
|
|
| |||||||||
Total capitalization | $ | 1,279 | $ | 1,270 | 1 | |||||||
|
|
|
| |||||||||
General. Short-term debt, which includes maturities classified as current and borrowings by foreign subsidiaries, was $66 million and $63 million as of December 31, 2011 and 2010, respectively. Borrowings under our revolving credit facilities, which are classified as long-term debt, were $24 million and zero at December 31, 2011 and 2010, respectively.
The 2011 year-to-date increase in total equity primarily resulted from net income attributable to Tenneco Inc. of $157 million, a $10 million increase in premium on common stock and other capital surplus relating to common stock issued pursuant to benefit plans, offset by a $102 million increase in accumulated other comprehensive loss due to higher unrecognized pension and postretirement benefit costs, a $43 million decrease caused by the impact of changes in foreign exchange rates on the translation of financial statements of our foreign subsidiaries into U.S. dollars, a $16 million increase in treasury stock as a result of open market purchases of common stock under our share repurchase program, and a $2 million decrease in premium on common stock and other capital surplus due to the purchase of the remaining 25 percent equity interest in our Thailand emission control joint venture, Walker Exhaust Co. Limited, now wholly owned by Tenneco Automotive (Thailand) Limited.
We have in the past and will continue to review our outstanding indebtedness and opportunities to optimize our debt structure. We will continue to undertake transactions to amend, extend or otherwise refinance our indebtedness as and when market conditions permit and we determine it would be in our interests to do so. We may incur costs and charges relating to these refinancing transactions when they are undertaken.
Overview. Our financing arrangements are primarily provided by a committed senior secured financing arrangement with a syndicate of banks and other financial institutions. The arrangement is secured by substantially all our domestic assets and pledges of up to 66 percent of the stock of certain first-tier foreign subsidiaries, as well as guarantees by our material domestic subsidiaries.
On June 3, 2010, we completed an amendment and extension of our senior secured credit facility by extending the term of our revolving credit facility and replacing our $128 million term loan A with a larger and longer maturity term loan B facility. As a result of the amendment and extension, as of December 31, 2011, the senior credit facility provides us with a total revolving credit facility size of $622 million until March 16, 2012, when commitments of $66 million will expire. After March 16, 2012, the extended revolving credit facility will provide $556 million of revolving credit and will mature on May 31, 2014. The extended facility will mature earlier on December 15, 2013, if our $130 million tranche B-1 letter of credit/revolving loan facility is not refinanced by that date. Prior to maturity, funds may be borrowed, repaid and re-borrowed under the two revolving credit facilities without premium or penalty.
64
As of December 31, 2011, the senior credit facility also provides a six-year, $148 million term loan B maturing in June 2016, and a seven-year $130 million tranche B-1 letter of credit/revolving loan facility maturing in March 2014. We are required to make quarterly principal payments of $375 thousand on the term loan B, through March 31, 2016 with a final payment of $141 million due June 3, 2016. The tranche B-1 letter of credit/revolving loan facility requires repayment by March 2014. We can enter into revolving loans and issue letters of credit under the $130 million tranche B-1 letter of credit/revolving loan facility. The tranche B-1 letter of credit/revolving loan facility is reflected as debt on our balance sheet only if we borrow money under this facility or if we use the facility to make payments for letters of credit. There is no additional cost to us for issuing letters of credit under the tranche B-1 letter of credit/revolving loan facility. However, outstanding letters of credit reduce our availability to enter into revolving loans under the facility. We pay the tranche B-1 lenders a margin on the $130 million deposited with the administrative agent. In addition, we pay lenders interest equal to the London Interbank Offered Rate ("LIBOR") on all borrowings under the facility. Funds deposited with the administrative agent by the lenders and not borrowed by the Company earn interest at an annual rate approximately equal to LIBOR less 25 basis points.
Beginning June 3, 2010, our term loan B and revolving credit facility bear interest at an annual rate equal to, at our option, either (i) LIBOR plus a margin of 475 and 450 basis points, respectively, or (ii) a rate consisting of the greater of (a) the JPMorgan Chase prime rate plus a margin of 375 and 350 basis points, respectively, (b) the Federal Funds rate plus 50 basis points plus a margin of 375 and 350 basis points, respectively, and (c) the Eurodollar Rate plus 100 basis points plus a margin of 375 and 350 basis points, respectively. The margin we pay on these borrowings will be reduced by 25 basis points following each fiscal quarter for which our consolidated net leverage ratio is less than 2.25 for extending lenders and for the term loan B and will be further reduced by an additional 25 basis points following each fiscal quarter for which the consolidated net leverage ratio is less than 2.00 for extending lenders. Our consolidated net leverage ratio was 1.88 and 2.24 as of December 31, 2011 and 2010, respectively. Accordingly, in February of 2012 the margin we pay on these borrowings will be reduced by 25 basis points for extending lenders and will remain at such level for so long as our consolidated net leverage ratio remains below 2.00.
The borrowings under our tranche B-1 letter of credit/revolving loan facility incur interest at an annual rate equal to, at our option, either (i) LIBOR plus a margin of 500 basis points, or (ii) a rate consisting of the greater of (a) the JPMorgan Chase prime rate plus a margin of 400 basis points, (b) the Federal Funds rate plus 50 basis points plus a margin of 400 basis points, and (c) the Eurodollar Rate plus 100 basis points plus a margin of 400 basis points.
At December 31, 2011, of the $752 million available under the two revolving credit facilities within our senior secured credit facility, we had unused borrowing capacity of $670 million with $24 million in outstanding borrowings and $58 million in letters of credit outstanding. As of December 31, 2011, our outstanding debt also included $250 million of 8 1 / 8 percent senior notes due November 15, 2015, $148 million term loan B due June 3, 2016, $225 million of 7 3 / 4 percent senior notes due August 15, 2018, $500 million of 6 7 / 8 percent senior notes due December 15, 2020, and $78 million of other debt.
On December 9, 2010, we commenced a cash tender offer of our outstanding $500 million 8 5 / 8 percent senior subordinated notes due in 2014 and a consent solicitation to amend the indenture governing these notes. On December 23, 2010, we issued $500 million of 6 7 / 8 percent senior notes due December 15, 2020 in a private offering. The net proceeds of this transaction, together with cash and available liquidity, were used to finance the purchase of our 8 5 / 8 percent senior subordinated notes pursuant to the tender offer at a price of 103.25 percent of the principal amount, plus accrued and unpaid interest for holders who tendered prior to the expiration of the consent solicitation, and 100.25 percent of the principal amount, plus accrued and unpaid interest, for other participants. A total of $480 million of the senior subordinated notes were tendered prior to the expiration of the consent solicitation. On January 7, 2011, we redeemed all remaining outstanding $20 million of senior subordinated notes that were not previously tendered, at a price of 102.875 percent of the principal amount, plus accrued and unpaid interest. To facilitate these transactions, we amended our senior credit agreement to permit us to refinance our senior subordinated notes with new senior unsecured notes. We did not incur any fee in connection with this amendment. The new notes are general senior obligations of Tenneco Inc. and are not
65
secured by assets of Tenneco Inc. or any of our subsidiaries that guarantee the new notes. We recorded $20 million of pre-tax charges in December 2010 and an additional $1 million of pre-tax charges in the first quarter of 2011 related to our repurchase and redemption of our 8 5 / 8 percent senior subordinated notes. On March 14, 2011, we completed an offer to exchange the $500 million of 6 7 / 8 percent senior notes due in 2020 which have been registered under the Securities Act of 1933, for and in replacement of all outstanding unregistered 6 7 / 8 percent senior notes due in 2020. We received tenders from holders of all $500 million of the aggregate outstanding amount of the original notes. The terms of the new notes are substantially identical to the terms of the original notes for which they were exchanged, except that the transfer restrictions and the registration rights applicable to the original notes generally do not apply to the new notes.
On August 3, 2010, we issued $225 million of 7 3 / 4 percent senior notes due August 15, 2018 in a private offering. The net proceeds of this transaction, together with cash and available liquidity, were used to finance the redemption of our 10 1 / 4 percent senior secured notes due in 2013. We called the senior secured notes for redemption on August 3, 2010, and completed the redemption on September 2, 2010 at a price of 101.708 percent of the principal amount, plus accrued and unpaid interest. We recorded $5 million of expense related to our redemption of our 10 1 / 4 percent senior secured notes in the third quarter of 2010. The new notes are general senior obligations of Tenneco Inc. and are not secured by assets of Tenneco Inc. or any of our subsidiaries that guarantee the new notes. On February 14, 2011, we completed an offer to exchange the $225 million of 7 3 / 4 percent senior notes due in 2018 which have been registered under the Securities Act of 1933, for and in replacement of all outstanding unregistered 7 3 / 4 percent senior notes due in 2018. We received tenders from holders of all $225 million of the aggregate outstanding amount of the original notes. The terms of the new notes are substantially identical to the terms of the original notes for which they were exchanged, except that the transfer restrictions and the registration rights applicable to the original notes generally do not apply to the new notes.
Senior Credit Facility - Interest Rates and Fees. Borrowings and letters of credit issued under the senior credit facility bear interest at an annual rate equal to, at our option, either (i) LIBOR plus a margin as set forth in the table below; or (ii) a rate consisting of the greater of the JPMorgan Chase prime rate, the Federal Funds rate plus 50 basis points or the Eurodollar Rate plus 100 basis points, plus a margin as set forth in the table below:
| 8/14/2009 thru 2/28/2010 | 3/1/2010 thru 6/2/2010 | 6/3/2010 thru 2/27/2011 | 2/28/2011 thru 5/15/2011 | 5/16/2011 thru 8/7/2011 | Beginning 8/8/2011 | |||||||||||||||||||
Applicable Margin over: | ||||||||||||||||||||||||
LIBOR for Revolving Loans | 5.50 | % | 4.50 | % | 4.50 | % | 4.25 | % | 4.50 | % | 4.25 | %* | ||||||||||||
LIBOR for Term Loan B Loans | - | - | 4.75 | % | 4.50 | % | 4.75 | % | 4.50 | %* | ||||||||||||||
LIBOR for Term Loan A Loans | 5.50 | % | 4.50 | % | - | - | - | - | ||||||||||||||||
LIBOR for Tranche B-1 Loans | 5.50 | % | 5.00 | % | 5.00 | % | 5.00 | % | 5.00 | % | 5.00 | % | ||||||||||||
Prime-based Term Loan A Loans | 4.50 | % | 3.50 | % | - | - | - | - | ||||||||||||||||
Prime for Revolving Loans | - | - | 3.50 | % | 3.25 | % | 3.50 | % | 3.25 | %* | ||||||||||||||
Prime for Term Loan B Loans | - | - | 3.75 | % | 3.50 | % | 3.75 | % | 3.50 | %* | ||||||||||||||
Prime for Tranche B-1 Loans | - | - | 4.00 | % | 4.00 | % | 4.00 | % | 4.00 | % | ||||||||||||||
Federal Funds for Revolving Loans | - | - | 3.50 | % | 3.25 | % | 3.50 | % | 3.25 | %* | ||||||||||||||
Federal Funds for Term Loan B Loans | - | - | 3.75 | % | 3.50 | % | 3.75 | % | 3.50 | %* | ||||||||||||||
Federal Funds for Tranche B-1 Loans | 5.00 | % | 4.00 | % | 4.00 | % | 4.00 | % | 4.00 | % | 4.00 | % | ||||||||||||
Commitment Fee | 0.75 | % | 0.50 | % | 0.75 | % | 0.50 | % | 0.75 | % | 0.50 | %* | ||||||||||||
* In February 2012, the margin we pay on borrowings will decrease by 25 basis points, as a result of a decrease in our consolidated net leverage ratio from 2.07 at September 30, 2011 to 1.88 at December 31, 2011.
66
Senior Credit Facility - Other Terms and Conditions. Our senior credit facility requires that we maintain financial ratios equal to or better than the following consolidated net leverage ratio (consolidated indebtedness net of cash divided by consolidated EBITDA, as defined in the senior credit facility agreement), and consolidated interest coverage ratio (consolidated EBITDA divided by consolidated interest expense, as defined under the senior credit facility agreement) at the end of each period indicated. Failure to maintain these ratios will result in a default under our senior credit facility. The financial ratios required under the amended and restated senior credit facility and, the actual ratios we achieved for the four quarters of 2011, are as follows:
| Quarter Ended | ||||||||||||||||||||||||||||||||
| March
31, 2011 | June
30, 2011 | September
30, 2011 | December
31, 2011 | |||||||||||||||||||||||||||||
| Req. | Act. | Req. | Act. | Req. | Act. | Req. | Act. | |||||||||||||||||||||||||
Leverage Ratio (maximum) | 4.00 | 2.32 | 3.75 | 2.17 | 3.50 | 2.07 | 3.50 | 1.88 | ||||||||||||||||||||||||
Interest Coverage Ratio (minimum) | 2.55 | 4.37 | 2.55 | 4.76 | 2.55 | 5.17 | 2.55 | 5.69 | ||||||||||||||||||||||||
The financial ratios required under the senior credit facility for each quarter beyond December 31, 2011 include a maximum leverage ratio of 3.50 and a minimum interest coverage ratio of 2.75.
The covenants in our senior credit facility agreement generally prohibit us from repaying or refinancing our senior notes. So long as no default existed, we would, however, under our senior credit facility agreement, be permitted to repay or refinance our senior notes: (i) with the net cash proceeds of incremental facilities and permitted refinancing indebtedness (as defined in the senior credit facility agreement); (ii) with the net cash proceeds from the sale of shares of our common stock; (iii) in exchange for permitted refinancing indebtedness or in exchange for shares of our common stock; (iv) with the net cash proceeds of any new senior or subordinated unsecured indebtedness; (v) with the proceeds of revolving credit loans (as defined in the senior credit facility agreement); (vi) with the cash generated by the operations of the Company; and (vii) in an amount equal to the sum of (a) the net cash proceeds of qualified stock issued by the Company after March 16, 2007, plus (b) the portion of annual excess cash flow (beginning with excess cash flow for fiscal year 2010) not required to be applied to payment of the credit facilities and which is not used for other purposes, provided that the aggregate principal amount of senior notes purchased and cancelled or redeemed pursuant to clauses (v), (vi) and (vii), is capped as follows based on the pro forma consolidated leverage ratio after giving effect to such purchase, cancellation or redemption:
Pro forma Consolidated Leverage Ratio | Aggregate Senior Note Maximum Amount | |||
| (Millions) | ||||
Greater than or equal to 3.0x | $ | 20 | ||
Greater than or equal to 2.5x | $ | 100 | ||
Less than 2.5x | $ | 125 | ||
Although the senior credit facility agreement would permit us to repay or refinance our senior notes under the conditions described above, any repayment or refinancing of our outstanding notes would be subject to market conditions and either the voluntary participation of note holders or our ability to redeem the notes under the terms of the applicable note indenture. For example, while the senior credit agreement would allow us to repay our outstanding notes via a direct exchange of the notes for either permitted refinancing indebtedness or for shares of our common stock, we do not, under the terms of the agreements governing our outstanding notes, have the right to refinance the notes via any type of direct exchange.
The senior credit facility agreement also contains other restrictions on our operations that are customary for similar facilities, including limitations on: (i) incurring additional liens; (ii) sale and leaseback transactions (except for the permitted transactions as described in the senior credit facility agreement); (iii) liquidations and dissolutions; (iv) incurring additional indebtedness or guarantees; (v) investments and acquisitions; (vi) dividends and share repurchases; (vii) mergers and consolidations; and (viii) refinancing of the senior notes. Compliance with these requirements and restrictions is a condition for any incremental borrowings under the senior credit facility agreement and failure to meet these requirements enables the lenders to require repayment of any outstanding loans.
67
As of December 31, 2011, we were in compliance with all the financial covenants and operational restrictions of the facility. Our senior credit facility does not contain any terms that could accelerate payment of the facility or affect pricing under the facility as a result of a credit rating agency downgrade.
Senior Notes. As of December 31, 2011, our outstanding debt also includes $250 million of 8 1 / 8 percent senior notes due November 15, 2015, $225 million of 7 3 / 4 percent senior notes due August 15, 2018 and $500 million of 6 7 / 8 percent senior notes due December 15, 2020. Under the indentures governing the notes, we are permitted to redeem some or all of the remaining senior notes at any time after November 15, 2011 in the case of the senior notes due 2015, August 14, 2014 in the case of the senior notes due 2018, and December 15, 2015 in the case of senior notes due 2020. If we sell certain of our assets or experience specified kinds of changes in control, we must offer to repurchase the notes. Under the indentures governing the notes, we are permitted to redeem up to 35 percent of the senior notes due 2018, with the proceeds of certain equity offerings completed before August 13, 2013 and up to 35 percent of the senior notes due 2020, with the proceeds of certain equity offerings completed before December 15, 2013.
Our senior notes require that, as a condition precedent to incurring certain types of indebtedness not otherwise permitted, our consolidated fixed charge coverage ratio, as calculated on a pro forma basis, be greater than 2.00. The indentures also contain restrictions on our operations, including limitations on: (i) incurring additional indebtedness or liens; (ii) dividends; (iii) distributions and stock repurchases; (iv) investments; (v) asset sales and (vi) mergers and consolidations. Subject to limited exceptions, all of our existing and future material domestic wholly owned subsidiaries fully and unconditionally guarantee these notes on a joint and several basis. There are no significant restrictions on the ability of the subsidiaries that have guaranteed these notes to make distributions to us. As of December 31, 2011, we were in compliance with the covenants and restrictions of these indentures.
Accounts Receivable Securitization. We securitize some of our accounts receivable on a limited recourse basis in North America and Europe. As servicer under these accounts receivable securitization programs, we are responsible for performing all accounts receivable administration functions for these securitized financial assets including collections and processing of customer invoice adjustments. In North America, we have an accounts receivable securitization program with three commercial banks comprised of a first priority facility and a second priority facility. We securitize original equipment and aftermarket receivables on a daily basis under the bank program. In March 2011, the North American program was amended and extended to March 23, 2012. The first priority facility continues to provide financing of up to $110 million and the second priority facility, which is subordinated to the first priority facility, continues to provide up to an additional $40 million of financing. Both facilities monetize accounts receivable generated in the U.S. and Canada that meet certain eligibility requirements, and the second priority facility also monetizes certain accounts receivable generated in the U.S. or Canada that would otherwise be ineligible under the first priority securitization facility. The amendments to the North American program expand the trade receivables that are eligible for purchase under the program and decrease the margin we pay to our banks. We had no outstanding third party investments in our securitized accounts receivable under the North American program at December 31, 2011 and 2010, respectively.
Each facility contains customary covenants for financings of this type, including restrictions related to liens, payments, mergers or consolidation and amendments to the agreements underlying the receivables pool. Further, each facility may be terminated upon the occurrence of customary events (with customary grace periods, if applicable), including breaches of covenants, failure to maintain certain financial ratios, inaccuracies of representations and warranties, bankruptcy and insolvency events, certain changes in the rate of default or delinquency of the receivables, a change of control and the entry or other enforcement of material judgments. In addition, each facility contains cross-default provisions, where the facility could be terminated in the event of non-payment of other material indebtedness when due and any other event which permits the acceleration of the maturity of material indebtedness.
We also securitize receivables in our European operations with regional banks in Europe. The arrangements to securitize receivables in Europe are provided under seven separate facilities provided by various financial institutions in each of the foreign jurisdictions. The commitments for these arrangements are generally for one
68
year, but some may be cancelled with notice 90 days prior to renewal. In some instances, the arrangement provides for cancellation by the applicable financial institution at any time upon 15 days, or less, notification. The amount of outstanding third party investments in our securitized accounts receivable in Europe was $121 million and $91 million at December 31, 2011 and December 31, 2010, respectively.
If we were not able to securitize receivables under either the North American or European securitization programs, our borrowings under our revolving credit agreements might increase. These accounts receivable securitization programs provide us with access to cash at costs that are generally favorable to alternative sources of financing, and allow us to reduce borrowings under our revolving credit agreements.
We adopted the amended accounting guidance under Accounting Standards Codification ("ASC") Topic 860, Accounting for Transfers of Financial Assets effective January 1, 2010. Prior to the adoption of this new guidance, we accounted for activities under our North American and European accounts receivable securitization programs as sales of financial assets to our banks. The new accounting guidance changed the condition that must be met for the transfer of financial assets to be accounted for as a sale. The new guidance adds additional conditions that must be satisfied for transfers of financial assets to be accounted for as sales when the transferor has not transferred the entire original financial asset, including the requirement that no partial interest holder have rights in the transferred asset that are subordinate to the rights of other partial interest holders.
In our North American accounts receivable securitization programs, we transfer a partial interest in a pool of receivables and the interest that we retain is subordinate to the transferred interest. Accordingly, beginning January 1, 2010, we account for our North American securitization program as a secured borrowing. In our European programs, we transfer accounts receivables in their entirety to the acquiring entities and satisfy all of the conditions established under ASC Topic 860 to report the transfer of financial assets in their entirety as a sale. The fair value of assets received as proceeds in exchange for the transfer of accounts receivable under our European securitization programs approximates the fair value of such receivables. We recognized $3 million and $4 million in interest expense for the years ended 2011 and 2010, respectively, relating to our North American securitization program, which effective January 1, 2010, is accounted for as a secured borrowing under the amended accounting guidance for transfers of financial assets. In addition, we recognized a loss of $5 million, $3 million and $9 million for the years ended 2011, 2010 and 2009, respectively, on the sale of trade accounts receivable in our European and North American accounts receivable securitization programs, representing the discount from book values at which these receivables were sold to our banks. The discount rate varies based on funding costs incurred by our banks, which averaged approximately three percent, four percent and five percent for the years ended 2011, 2010 and 2009, respectively.
Capital Requirements. We believe that cash flows from operations, combined with our cash on hand, subject to any applicable withholding taxes upon repatriation of cash balances from our foreign operations, and available borrowing capacity described above, assuming that we maintain compliance with the financial covenants and other requirements of our loan agreement, will be sufficient to meet our future capital requirements, including debt amortization, capital expenditures, pension contributions, and other operational requirements, for the following year. Our ability to meet the financial covenants depends upon a number of operational and economic factors, many of which are beyond our control. In the event that we are unable to meet these financial covenants, we would consider several options to meet our cash flow needs. Such actions include additional restructuring initiatives and other cost reductions, sales of assets, reductions to working capital and capital spending, issuance of equity and other alternatives to enhance our financial and operating position. Should we be required to implement any of these actions to meet our cash flow needs, we believe we can do so in a reasonable time frame.
69
Contractual Obligations.
Our remaining required debt principal amortization and payment obligations under lease and certain other financial commitments as of December 31, 2011 are shown in the following table:
| Payments due in: | ||||||||||||||||||||||||||||
| 2012 | 2013 | 2014 | 2015 | 2016 | Beyond 2016 | Total | ||||||||||||||||||||||
| (Millions) | ||||||||||||||||||||||||||||
Obligations: | ||||||||||||||||||||||||||||
Revolver borrowings | $ | - | $ | - | $ | 24 | $ | - | $ | - | $ | - | $ | 24 | ||||||||||||||
Senior term loans | 1 | 2 | 2 | 2 | 141 | - | 148 | |||||||||||||||||||||
Senior notes | - | - | - | 250 | - | 725 | 975 | |||||||||||||||||||||
Notes payable to customers | 1 | 2 | - | - | - | - | 3 | |||||||||||||||||||||
Debentures | 1 | - | - | - | - | - | 1 | |||||||||||||||||||||
Other subsidiary debt | 1 | 1 | 1 | 1 | 1 | 6 | 11 | |||||||||||||||||||||
Short-term debt | 62 | - | - | - | - | - | 62 | |||||||||||||||||||||
|
|
|
|
|
|
|
|
|
|
|
|
|
| |||||||||||||||
Debt and capital lease obligations | 66 | 5 | 27 | 253 | 142 | 731 | 1,224 | |||||||||||||||||||||
Operating leases | 33 | 24 | 17 | 10 | 8 | 8 | 100 | |||||||||||||||||||||
Interest payments | 91 | 90 | 82 | 77 | 55 | 172 | 567 | |||||||||||||||||||||
Capital commitments | 80 | - | - | - | - | - | 80 | |||||||||||||||||||||
|
|
|
|
|
|
|
|
|
|
|
|
|
| |||||||||||||||
Total payments | $ | 270 | $ | 119 | $ | 126 | $ | 340 | $ | 205 | $ | 911 | $ | 1,971 | ||||||||||||||
|
|
|
|
|
|
|
|
|
|
|
|
|
| |||||||||||||||
If we do not maintain compliance with the terms of our senior credit facility or senior notes indentures described above, all amounts under those arrangements could, automatically or at the option of the lenders or other debt holders, become due. Additionally, each of those facilities contains provisions that certain events of default under one facility will constitute a default under the other facility, allowing the acceleration of all amounts due. We currently expect to maintain compliance with the terms of all of our various credit agreements for the foreseeable future.
Included in our contractual obligations is the amount of interest to be paid on our long-term debt. As our debt structure contains both fixed and variable rate obligations, we have made assumptions in calculating the amount of future interest payments. Interest on our senior notes is calculated using the fixed rates of 7 3 / 4 percent, 6 7 / 8 percent, and 8 1 / 8 percent, respectively. Interest on our variable rate debt is calculated as LIBOR plus the applicable margin in effect at December 31, 2011 for the Eurodollar, term loan B and tranche B-1 loans and prime plus the applicable margin in effect on December 31, 2011 on the prime-based loans. We have assumed that both LIBOR and the prime rate will remain unchanged for the outlying years. See "- Capitalization."
We have also included an estimate of expenditures required after December 31, 2011 to complete the projects authorized at December 31, 2011, in which we have made substantial commitments in connection with purchasing plant, property and equipment for our operations. For 2012, we expect our capital expenditures to be about $230 million to $250 million.
We have not included purchase obligations as part of our contractual obligations as we generally do not enter into long-term agreements with our suppliers. In addition, the agreements we currently have do not specify the volumes we are required to purchase. If any commitment is provided, in many cases the agreements state only the minimum percentage of our purchase requirements we must buy from the supplier. As a result, these purchase obligations fluctuate from year-to-year and we are not able to quantify the amount of our future obligations.
We have not included material cash requirements for unrecognized tax benefits or taxes as we are a taxpayer in certain foreign jurisdictions, but generally not in the U.S. Additionally, it is difficult to estimate taxes to be paid as changes in where we generate income can have a significant impact on future tax payments. We have also
70
not included cash requirements for funding pension and postretirement benefit costs. Based upon current estimates, we believe we will be required to make contributions of approximately $57 million to those plans in 2012. Pension and postretirement contributions beyond 2012 will be required but those amounts will vary based upon many factors, including the performance of our pension fund investments during 2012. For additional information relating to the funding of our pension and other postretirement plans, refer to Note 10 of our consolidated financial statements. In addition, we have not included cash requirements for environmental remediation. Based upon current estimates we believe we will be required to spend approximately $20 million over the next 30 years. However, due to possible modifications in remediation processes and other factors, it is difficult to determine the actual timing of the payments. See "- Environmental and Other Matters."
We occasionally provide guarantees that could require us to make future payments in the event that the third party primary obligor does not make its required payments. We are not required to record a liability for any of these guarantees.
Additionally, we have from time to time issued guarantees for the performance of obligations by some of our subsidiaries, and some of our subsidiaries have guaranteed our debt. All of our existing and future material domestic wholly-owned subsidiaries fully and unconditionally guarantee our senior credit facility and our senior notes on a joint and several basis. The arrangement for the senior credit facility is also secured by first-priority liens on substantially all our domestic assets and pledges of up to 66 percent of the stock of certain first-tier foreign subsidiaries. You should also read Note 13 of the consolidated financial statements of Tenneco Inc., where we present the Supplemental Guarantor Condensed Consolidating Financial Statements.
In March 2011, we entered into two performance guarantee agreements in the U.K. between Tenneco Management (Europe) Limited ("TMEL") and the two Walker Group Retirement Plans, the Walker Group Employee Benefit Plan and the Walker Group Executive Retirement Benefit Plan (the "Walker Plans"), whereby TMEL will guarantee the payment of all current and future pension contributions in event of a payment default by the sponsoring or participating employers of the Walker Plans. As a result of our decision to enter into these performance guarantee agreements, the levy due to the U.K. Pension Protection Fund was reduced. The Walker Plans are comprised of employees from Tenneco Walker (U.K.) Limited and our Futaba Tenneco U.K. joint venture. Employer contributions are funded by both Tenneco Walker (U.K.) Limited, as the sponsoring employer and Futaba Tenneco U.K., as a participating employer. The performance guarantee agreements are expected to remain in effect until all pension obligations for the Walker Plans' sponsoring and participating employers have been satisfied. The maximum amount payable for these pension performance guarantees relating to other participating employers is approximately $3 million as of December 31, 2011 which is determined by taking 105 percent of the liability of the Walker Plans calculated under section 179 of the U.K. Pension Act of 2004 offset by plan assets. We did not record an additional liability in March 2011 for this performance guarantee since Tenneco Walker (U.K.) Limited, as the sponsoring employer of the Walker Plans, already recognizes 100 percent of the pension obligation calculated based on U.S. GAAP, for all of the Walker Plans' participating employers on its balance sheet, which was $13 million and $9 million at December 31, 2011 and December 31, 2010, respectively. At December 31, 2011, all pension contributions under the Walker Plans were current for all of the Walker Plans' sponsoring and participating employers.
In June 2011, we entered into an indemnity agreement between TMEL and Futaba Industrial Co. Ltd. ("Futaba") which requires Futaba to indemnify TMEL for any cost, loss or liability which TMEL may incur under the performance guarantee agreements. The maximum amount reimbursable by Futaba to TMEL under this indemnity agreement is equal to the amount incurred by TMEL under the performance guarantee agreements multiplied by Futaba's shareholder ownership percentage of the Futaba Tenneco U.K. joint venture. At December 31, 2011 the maximum amount reimbursable by Futaba to TMEL is approximately $3 million.
We have issued guarantees through letters of credit in connection with some obligations of our affiliates. As of December 31, 2011, we have $58 million in letters of credit to support some of our subsidiaries' insurance arrangements, foreign employee benefit programs, environmental remediation activities and cash management and capital requirements.
71
Critical Accounting Policies
We prepare our consolidated financial statements in accordance with accounting principles generally accepted in the United States of America. Preparing our consolidated financial statements in accordance with generally accepted accounting principles requires us to make estimates and assumptions that affect the reported amounts of assets and liabilities and disclosure of contingent assets and liabilities at the date of the consolidated financial statements and the reported amounts of revenues and expenses during the reporting period. The following paragraphs include a discussion of some critical areas where estimates are required.
Revenue Recognition
We recognize revenue for sales to our original equipment and aftermarket customers when title and risk of loss passes to the customers under the terms of our arrangements with those customers, which is usually at the time of shipment from our plants or distribution centers. Generally, in connection with the sale of exhaust systems to certain original equipment manufacturers, we purchase catalytic converters and diesel particulate filters or components thereof including precious metals ("substrates") on behalf of our customers which are used in the assembled system. These substrates are included in our inventory and "passed through" to the customer at our cost, plus a small margin, since we take title to the inventory and are responsible for both the delivery and quality of the finished product. Revenues recognized for substrate sales were $1,640 million, $1,297 million and $966 million in 2011, 2010 and 2009, respectively. For our aftermarket customers, we provide for promotional incentives and returns at the time of sale. Estimates are based upon the terms of the incentives and historical experience with returns. Certain taxes assessed by governmental authorities on revenue producing transactions, such as value added taxes, are excluded from revenue and recorded on a net basis. Shipping and handling costs billed to customers are included in revenues and the related costs are included in cost of sales in our Statements of Income (Loss).
Warranty Reserves
Where we have offered product warranty, we also provide for warranty costs. Provisions for estimated expenses related to product warranty are made at the time products are sold or when specific warranty issues are identified on OE products. These estimates are established using historical information about the nature, frequency, and average cost of warranty claims and upon specific warranty issues as they arise. The warranty terms vary but range from one year up to limited lifetime warranties on some of our premium aftermarket products. We actively study trends of our warranty claims and take action to improve product quality and minimize warranty claims. While we have not experienced any material differences between these estimates and our actual costs, it is reasonably possible that future warranty issues could arise that could have a significant impact on our consolidated financial statements.
Engineering, Research and Development
We expense engineering, research, and development costs as they are incurred. Engineering, research, and development expenses were $133 million for 2011, $117 million for 2010 and $97 million for 2009, net of reimbursements from our customers. Of these amounts, $16 million in 2011, $13 million in 2010 and $10 million in 2009 relate to research and development, which includes the research, design, and development of a new unproven product or process. Additionally, $92 million, $80 million and $61 million of engineering, research, and development expense for 2011, 2010 and 2009, respectively, relates to engineering costs we incurred for application of existing products and processes to vehicle platforms. The remainder of the expenses in each year relate to improvements and enhancements to existing products and processes. Further, our customers reimburse us for engineering, research, and development costs on some platforms when we prepare prototypes and incur costs before platform awards. Our engineering, research, and development expense for 2011, 2010 and 2009 has been reduced by $119 million, $110 million and $104 million, respectively, for these reimbursements.
72
Pre-production Design and Development and Tooling Assets
We expense pre-production design and development costs as incurred unless we have a contractual guarantee for reimbursement from the original equipment customer. Unbilled pre-production design and development costs recorded in prepayments and other and long-term receivables was $19 million and $15 million on December 31, 2011 and 2010, respectively. In addition, plant, property and equipment included $38 million at both December 31, 2011 and 2010, respectively, for original equipment tools and dies that we own, and prepayments and other included $49 million and $46 million at December 31, 2011 and 2010, respectively, for in-process tools and dies that we are building for our original equipment customers.
Income Taxes
We reported income tax expense of $88 million, $69 million and $13 million in the years ending 2011, 2010 and 2009, respectively. The tax expense recorded in 2011 differs from the expense that would be recorded using a U.S. Federal statutory rate of 35 percent due to a net tax benefit of $7 million primarily related to U.S. taxable income with no associated tax expense due to our net operating loss ("NOL") carryforward and income generated in lower tax rate jurisdictions, partially offset by the impact of recording a valuation allowance against the tax benefit for losses in certain foreign jurisdictions and taxes on repatriation of foreign earnings.
We evaluate our deferred income taxes quarterly to determine if valuation allowances are required or should be adjusted. U.S. GAAP requires that companies assess whether valuation allowances should be established against their deferred tax assets based on consideration of all available evidence, both positive and negative, using a "more likely than not" standard. This assessment considers, among other matters, the nature, frequency and amount of recent losses, the duration of statutory carryforward periods, and tax planning strategies. In making such judgments, significant weight is given to evidence that can be objectively verified.
Valuation allowances have been established for deferred tax assets based on a "more likely than not" threshold. The ability to realize deferred tax assets depends on our ability to generate sufficient taxable income within the carryforward periods provided for in the tax law for each tax jurisdiction. We have considered the following possible sources of taxable income when assessing the realization of our deferred tax assets:
| • | Future reversals of existing taxable temporary differences; |
| • | Taxable income or loss, based on recent results, exclusive of reversing temporary differences and carryforwards; |
| • | Tax-planning strategies; and |
| • | Taxable income in prior carryback years if carryback is permitted under the relevant tax law. |
In 2008, given our historical losses in the U.S., we concluded that our ability to fully utilize our NOLs was limited, as we were required to project the continuation of the negative economic environment at that time and the impact of the negative operating environment on our tax planning strategies. As a result, we recorded a valuation allowance against all of our U.S. deferred tax assets except for our tax planning strategies which have not yet been implemented and which do not depend upon generating future taxable income. We carry deferred tax assets in the U.S. of $90 million, as of December 31, 2011, relating to the expected utilization of those NOLs. The recording of a valuation allowance does not impact the amount of the NOL that would be available for federal and state income tax purposes in future periods. The federal NOLs expire beginning in tax years ending in 2021 through 2029. The state NOLs expire in various tax years through 2029.
If our operating performance continues to improve on a sustained basis, our conclusion regarding the need for a valuation allowance could change, resulting in the reversal of some or all of the valuation allowance in the future. The charge to establish the U.S. valuation allowance also includes items related to the losses allocable to certain state jurisdictions where it was determined that tax attributes related to those jurisdictions were potentially not realizable. In addition, the charge to establish the U.S. valuation allowance eliminated the need for certain tax reserves which would need to be recorded if the valuation allowance was reversed. If we were to reverse our U.S. valuation allowance, as of December 31, 2011, the impact on earnings would approximate $147 million.
73
In prior years, we recorded a valuation allowance against deferred tax assets generated by taxable losses in the U.S. as well as certain other foreign jurisdictions. Our provision for income taxes will include no tax benefit with respect to losses incurred and no tax expense with respect to income generated in these jurisdictions until the respective valuation allowance is eliminated. In certain foreign jurisdictions, we have recorded a tax benefit on NOLs and tax credits with unlimited lives that are supported by tax actions and forecasted profitability. If the tax actions are not successful or losses are incurred, we may need to record a valuation allowance in a future period. We have recorded net deferred tax assets of approximately $23 million in these jurisdictions as of December 31, 2011. These actions will cause variability in our effective tax rate.
Goodwill, net
We evaluate goodwill for impairment in the fourth quarter of each year, or more frequently if events indicate it is warranted. The goodwill impairment test consists of a two-step process. In step one, we compare the estimated fair value of our reporting units with goodwill to the carrying value of the unit's assets and liabilities to determine if impairment exists within the recorded balance of goodwill. We estimate the fair value of each reporting unit using the income approach which is based on the present value of estimated future cash flows. The income approach is dependent on a number of factors, including estimates of market trends, forecasted revenues and expenses, capital expenditures, weighted average cost of capital and other variables. A separate discount rate derived by a combination of published sources, internal estimates and weighted based on our debt and equity structure, was used to calculate the discounted cash flows for each of our reporting units. These estimates are based on assumptions that we believe to be reasonable, but which are inherently uncertain and outside of the control of management. If the carrying value of the reporting unit is higher than its fair value, there is an indication that impairment may exist which requires step two to be performed to measure the amount of the impairment loss. The amount of impairment is determined by comparing the implied fair value of a reporting unit's goodwill to its carrying value.
In the fourth quarter of 2010, the estimated fair value of all of our reporting units, except for our Australian reporting unit, significantly exceeded the carrying value of its assets and liabilities. Our Australian reporting unit had a goodwill balance of $11 million with an estimated fair value in excess of its net carrying value of one percent as of the testing date.
During the third quarter of 2011, we performed an impairment evaluation of our Australian reporting unit's goodwill balance as a result of continued deterioration of that reporting unit's financial performance driven primarily by significant declines in industry production volumes in that region. We identified in our step one test that the carrying value of our Australian reporting unit was higher than its fair value which is an indication that impairment may exist which required us to perform step two of the goodwill impairment test to measure the amount of the impairment loss. Step two of the goodwill impairment evaluation required us to calculate the implied fair value of goodwill of our Australian reporting unit by allocating the estimated fair value to the assets and liabilities of this reporting unit as if the reporting unit had been acquired in a business combination and the fair value of the reporting unit was the acquisition price. As a result of performing steps one and two of the goodwill impairment test, we concluded that the remaining amount of goodwill related to our Australian reporting unit was impaired and accordingly, we recorded a goodwill impairment charge of $11 million during the third quarter of 2011.
In the fourth quarter of 2011, the estimated fair value of each of our reporting units exceeded the carrying value of their assets and liabilities as of the testing date.
Pension and Other Postretirement Benefits
We have various defined benefit pension plans that cover some of our employees. We also have postretirement health care and life insurance plans that cover some of our domestic employees. Our pension and postretirement health care and life insurance expenses and valuations are dependent on assumptions used by our actuaries in calculating those amounts. These assumptions include discount rates, health care cost trend rates, long-term return on plan assets, retirement rates, mortality rates and other factors. Health care cost trend rate
74
assumptions are developed based on historical cost data and an assessment of likely long-term trends. Retirement rates are based primarily on actual plan experience while mortality rates are based upon the general population experience which is not expected to differ materially from our experience.
Our approach to establishing the discount rate assumption for both our domestic and foreign plans is generally based on the yield on high-quality corporate fixed-income investments. At the end of each year, the discount rate is determined using the results of bond yield curve models based on a portfolio of high quality bonds matching the notional cash inflows with the expected benefit payments for each significant benefit plan. Based on this approach, for 2011 we lowered the weighted average discount rate for all our pension plans to 4.9 percent in 2011 from 5.5 percent in 2010. The discount rate for postretirement benefits was lowered to 4.8 percent in 2011 from 5.6 percent in 2010.
Our approach to determining expected return on plan asset assumptions evaluates both historical returns as well as estimates of future returns, and is adjusted for any expected changes in the long-term outlook for the equity and fixed income markets. Based on this approach, our estimate of the weighted average long-term rate of return on plan assets for all of our pension plans was 7.2 percent for both 2011 and 2010.
Except in the U.K., our pension plans generally do not require employee contributions. Our policy is to fund our pension plans in accordance with applicable U.S. and foreign government regulations and to make additional payments as funds are available to achieve full funding of the accumulated benefit obligation. At December 31, 2011, all legal funding requirements had been met. In 2010, we recognized a charge of $6 million related to an actuarial loss for lump sum pension payments to two former employees. Other postretirement benefit obligations, such as retire medical, and certain foreign pension plans are funded as the obligations become due.
Refer to Note 10 of our consolidated financial statements for more information regarding our pension and other postretirement employee benefit costs and assumptions.
New Accounting Pronouncements
Note 1 to the consolidated financial statements of Tenneco Inc. located in Item 8 - Financial Statements and Supplemental Data are incorporated herein by reference.
Derivative Financial Instruments
Foreign Currency Exchange Rate Risk
We use derivative financial instruments, principally foreign currency forward purchase and sale contracts with terms of less than one year, to hedge our exposure to changes in foreign currency exchange rates. Our primary exposure to changes in foreign currency rates results from intercompany loans made between affiliates to minimize the need for borrowings from third parties. Additionally, we enter into foreign currency forward purchase and sale contracts to mitigate our exposure to changes in exchange rates on certain intercompany and third-party trade receivables and payables. We manage counter-party credit risk by entering into derivative financial instruments with major financial institutions that can be expected to fully perform under the terms of such agreements. We do not enter into derivative financial instruments for speculative purposes.
75
In managing our foreign currency exposures, we identify and aggregate existing offsetting positions and then hedge residual exposures through third-party derivative contracts. The fair value of our foreign currency forward contracts was a net asset position of $1 million at December 31, 2011 and is based on an internally developed model which incorporates observable inputs including quoted spot rates, forward exchange rates and discounted future expected cash flows utilizing market interest rates with similar quality and maturity characteristics. The following table summarizes by major currency the notional amounts for our foreign currency forward purchase and sale contracts as of December 31, 2011. All contracts in the following table mature in 2012.
| Notional Amount in Foreign Currency | ||||||||
| (Millions) | ||||||||
Australian dollars | -Purchase | 2 | ||||||
British pounds | -Purchase | 4 | ||||||
European euro | -Sell | (56 | ) | |||||
Japanese yen | -Purchase | 431 | ||||||
South African rand | -Purchase | 92 | ||||||
U.S. dollars | -Purchase | 2 | ||||||
| -Sell | (47 | ) | ||||||
Other | -Purchase | 1 | ||||||
| -Sell | (1 | ) | ||||||
Interest Rate Risk
Our financial instruments that are sensitive to market risk for changes in interest rates are primarily our debt securities. We use our revolving credit facilities to finance our short-term and long-term capital requirements. We pay a current market rate of interest on these borrowings. Our long-term capital requirements have been financed with long-term debt with original maturity dates ranging from four to ten years. On December 31, 2011, we had $987 million in long-term debt obligations that have fixed interest rates. Of that amount, $500 million is fixed through December 2020, $250 million is fixed through November 2015, $225 million is fixed through August 2018 and the remainder is fixed from 2012 through 2025. We also have $175 million in long-term debt obligations that are subject to variable interest rates. For more detailed explanations on our debt structure and senior credit facility refer to "Liquidity and Capital Resources - Capitalization" earlier in this Management's Discussion and Analysis.
We estimate that the fair value of our long-term debt at December 31, 2011 was about 103 percent of its book value. A one percentage point increase or decrease in interest rates would increase or decrease the annual interest expense we recognize in the income statement and the cash we pay for interest expense by about $2 million.
Environmental and Legal Contingencies
We are involved in environmental remediation matters, legal proceedings, claims, investigations and warranty obligations that are incidental to the conduct of our business and create the potential for contingent losses. We accrue for potential contingent losses when our review of available facts indicates that it is probable a loss has been incurred and the amount of the loss is reasonably estimable. Each quarter we assess our loss contingencies based upon currently available facts, existing technology, and presently enacted laws and regulations taking into consideration the likely effects of inflation and other societal and economic factors and record adjustments to these reserves as required. As an example, we consider all available evidence including prior experience in remediation of contaminated sites, other companies' cleanup experiences and data released by the United States Environmental Protection Agency or other organizations when we evaluate our environmental remediation contingencies. Further, all of our loss contingency estimates are subject to revision in future periods
76
based on actual costs or new information. With respect to our environmental liabilities, where future cash flows are fixed or reliably determinable, we have discounted those liabilities. All other environmental liabilities are recorded at their undiscounted amounts. We evaluate recoveries separately from the liability and, when they are assured, recoveries are recorded and reported separately from the associated liability in our consolidated financial statements.
We are subject to a variety of environmental and pollution control laws and regulations in all jurisdictions in which we operate. We expense or capitalize, as appropriate, expenditures for ongoing compliance with environmental regulations that relate to current operations. We expense costs related to an existing condition caused by past operations that do not contribute to current or future revenue generation. As of December 31, 2011, we have the obligation to remediate or contribute towards the remediation of certain sites, including one Federal Superfund site. At December 31, 2011, our aggregated estimated share of environmental remediation costs for all these sites on a discounted basis was approximately $17 million, of which $5 million is recorded in other current liabilities and $12 million is recorded in deferred credits and other liabilities in our consolidated balance sheet. For those locations in which the liability was discounted, the weighted average discount rate used was 1.9 percent. The undiscounted value of the estimated remediation costs was $20 million. Our expected payments of environmental remediation costs are estimated to be approximately $4 million in 2012, $2 million in 2013, $1 million each year beginning 2014 through 2016 and $11 million thereafter. Based on information known to us, we have established reserves that we believe are adequate for these costs. Although we believe these estimates of remediation costs are reasonable and are based on the latest available information, the costs are estimates and are subject to revision as more information becomes available about the extent of remediation required. At some sites, we expect that other parties will contribute towards the remediation costs. In addition, certain environmental statutes provide that our liability could be joint and several, meaning that we could be required to pay in excess of our share of remediation costs. Our understanding of the financial strength of other potentially responsible parties at these sites has been considered, where appropriate, in our determination of our estimated liability. We do not believe that any potential costs associated with our current status as a potentially responsible party in the Federal Superfund site, or as a liable party at the other locations referenced herein, will be material to our consolidated results of operations, financial position or cash flows.
We also from time to time are involved in legal proceedings, claims or investigations. Some of these proceedings allege damages against us relating to environmental liabilities (including toxic tort, property damage and remediation), intellectual property matters (including patent, trademark and copyright infringement, and licensing disputes), personal injury claims (including injuries due to product failure, design or warning issues, and other product liability related matters), taxes, employment matters, and commercial or contractual disputes, sometimes related to acquisitions or divestitures. For example, one of our Argentine subsidiaries is currently defending against a criminal complaint alleging the failure to comply with laws requiring the proceeds of export transactions to be collected, reported and/or converted to local currency within specified time periods. As another example, in the U.S. we are subject to an audit in 11 states with respect to the payment of unclaimed property to those states, spanning a period as far back as 30 years. We now have practices in place which we believe ensure that we pay unclaimed property as required. We vigorously defend ourselves against all of these claims. In future periods, we could be subject to cash costs or charges to earnings if any of these matters are resolved on unfavorable terms. However, although the ultimate outcome of any legal matter cannot be predicted with certainty, based on current information, including our assessment of the merits of the particular claim, we do not expect that these legal proceedings or claims will have any material adverse impact on our future consolidated financial position, results of operations or cash flows.
In addition, we are subject to a number of lawsuits initiated by a significant number of claimants alleging health problems as a result of exposure to asbestos. In the early 2000's we were named in nearly 20,000 complaints, most of which were filed in Mississippi state court and the vast majority of which made no allegations of exposure to asbestos from our product categories. Most of these claims have been dismissed and our current docket of active and inactive cases is less than 500 cases nationwide. A small number of claims have been asserted by railroad workers alleging exposure to asbestos products in railroad cars manufactured by The Pullman Company, one of our subsidiaries. The balance of the claims is related to alleged exposure to asbestos in
77
our automotive products. Only a small percentage of the claimants allege that they were automobile mechanics and a significant number appear to involve workers in other industries or otherwise do not include sufficient information to determine whether there is any basis for a claim against us. We believe, based on scientific and other evidence, it is unlikely that mechanics were exposed to asbestos by our former products and that, in any event, they would not be at increased risk of asbestos-related disease based on their work with these products. Further, many of these cases involve numerous defendants, with the number of each in some cases exceeding 100 defendants from a variety of industries. Additionally, the plaintiffs either do not specify any, or specify the jurisdictional minimum, dollar amount for damages. As major asbestos manufacturers and/or users continue to go out of business or file for bankruptcy, we may experience an increased number of these claims. We vigorously defend ourselves against these claims as part of our ordinary course of business. In future periods, we could be subject to charges to earnings if any of these matters are resolved unfavorably to us. To date, with respect to claims that have proceeded sufficiently through the judicial process, we have regularly achieved favorable resolutions. Accordingly, we presently believe that these asbestos-related claims will not have a material adverse impact on our future consolidated financial condition, results of operations or cash flows.
Employee Retirement Savings Plans
We have established Employee Stock Ownership Plans for the benefit of U.S. employees. Under the plans, subject to limitations in the Internal Revenue Code, participants may elect to defer up to 75 percent of their salary through contributions to the plan, which are invested in selected mutual funds or used to buy our common stock. We match in cash 50 percent of each employee's contribution up to eight percent of the employee's salary. In 2009, we temporarily discontinued these matching contributions as a result of the global economic downturn that began in 2008. We restored the matching contributions to salaried and non-union hourly U.S. employees beginning on January 1, 2010. In connection with freezing the defined benefit pension plans for nearly all U.S. based salaried and non-union hourly employees effective December 31, 2006, and the related replacement of those defined benefit plans with defined contribution plans, we are making additional contributions to the Employee Stock Ownership Plans. We recorded expense for these contributions of approximately $18 million, $17 million, and $10 million in 2011, 2010 and 2009, respectively. Matching contributions vest immediately. Defined benefit replacement contributions fully vest on the employee's third anniversary of employment.
Effective January 1, 2012, the Tenneco Employee Stock Ownership Plan for Hourly Employees and the Tenneco Employee Stock Ownership Plan for Salaried Employees were merged into one plan called the Tenneco 401(k) Retirement Savings Plan (the "Retirement Savings Plan"). The Retirement Savings Plan has been designed to adopt a Safe-Harbor approach approved by the Internal Revenue Service and which will provide for increased company matching contributions at lower percentages of employee deferrals. The company matching contribution will increase from 50 percent on the first eight percent of employee contributions to 100 percent on the first three percent and 50 percent on the next two percent of employee contributions.
| ITEM 7A. | QUANTITATIVE AND QUALITATIVE DISCLOSURES ABOUT MARKET RISK. |
The section entitled "Derivative Financial Instruments" in Item 7, "Management's Discussion and Analysis of Financial Condition and Results of Operations" is incorporated herein by reference.
78
| ITEM 8. | FINANCIAL STATEMENTS AND SUPPLEMENTARY DATA. |
INDEX TO FINANCIAL STATEMENTS OF TENNECO INC.
AND CONSOLIDATED SUBSIDIARIES
| Page | ||||
Management's Report on Internal Control Over Financial Reporting | 80 | |||
Reports of Independent Registered Public Accounting Firms | 81 | |||
Statements of income (loss) for each of the three years in the period ended December 31, 2011 | 83 | |||
Balance sheets - December 31, 2011 and 2010 | 84 | |||
Statements of cash flows for each of the three years in the period ended December 31, 2011 | 85 | |||
Statements of changes in shareholders' equity for each of the three years in the period ended December 31, 2011 | 86 | |||
Statements of comprehensive income (loss) for each of the three years in the period ended December 31, 2011 | 87 | |||
Notes to consolidated financial statements | 90 | |||
Schedule II - Valuation and Qualifying Accounts | 143 | |||
79
MANAGEMENT'S REPORT ON INTERNAL CONTROL OVER FINANCIAL REPORTING
Management of Tenneco Inc. is responsible for establishing and maintaining adequate internal control over financial reporting (as defined in Rule 13a-15(f) and 15d-15(f) under the Securities Exchange Act of 1934). Management's internal control system is designed to provide reasonable assurance regarding the preparation and fair presentation of published financial statements. All internal control systems, no matter how well designed, have inherent limitations, including the possibility of human error or circumvention or overriding of controls. Therefore, even those systems determined to be effective can provide only reasonable assurance with respect to financial statement preparation and presentation and may not prevent or detect misstatements in financial reporting. Further, due to changing conditions and adherence to established policies and controls, internal control effectiveness may vary over time.
Management assessed the company's effectiveness of internal controls over financial reporting. In making this assessment, it used the criteria set forth by the Committee of Sponsoring Organizations of the Treadway Commission ("COSO") in Internal Control-Integrated Framework.
Based on our assessment we have concluded that the company's internal control over financial reporting was effective as of December 31, 2011.
Our internal control over financial reporting as of December 31, 2011 has been audited by PricewaterhouseCoopers LLP, our independent registered public accounting firm, as stated in their report, which is included herein.
February 24, 2012
80
REPORT OF INDEPENDENT REGISTERED PUBLIC ACCOUNTING FIRM
To the Board of Directors and Shareholders of Tenneco Inc.:
In our opinion, the accompanying consolidated balance sheets and the related consolidated statements of income (loss), cash flows, changes in shareholders' equity and comprehensive income present fairly, in all material respects, the financial position of Tenneco Inc. and its subsidiaries at December 31, 2011 and 2010 and the results of their operations and their cash flows for the years ended December 31, 2011 and 2010 in conformity with accounting principles generally accepted in the United States of America. In addition, in our opinion, the financial statement schedule for the years ended December 31, 2011 and 2010 in Item 8 presents fairly, in all material respects, the information set forth therein when read in conjunction with the related consolidated financial statements. Also in our opinion, the Company maintained, in all material respects, effective internal control over financial reporting as of December 31, 2011, based on criteria established in Internal Control - Integrated Framework issued by the Committee of Sponsoring Organizations of the Treadway Commission (COSO). The Company's management is responsible for these financial statements and financial statement schedule, for maintaining effective internal control over financial reporting and for its assessment of the effectiveness of internal control over financial reporting, included in the accompanying Management's Report on Internal Control over Financial Reporting. Our responsibility is to express opinions on these financial statements, on the financial statement schedule, and on the Company's internal control over financial reporting based on our integrated audits. We conducted our audits in accordance with the standards of the Public Company Accounting Oversight Board (United States). Those standards require that we plan and perform the audits to obtain reasonable assurance about whether the financial statements are free of material misstatement and whether effective internal control over financial reporting was maintained in all material respects. Our audits of the financial statements included examining, on a test basis, evidence supporting the amounts and disclosures in the financial statements, assessing the accounting principles used and significant estimates made by management, and evaluating the overall financial statement presentation. Our audit of internal control over financial reporting included obtaining an understanding of internal control over financial reporting, assessing the risk that a material weakness exists, and testing and evaluating the design and operating effectiveness of internal control based on the assessed risk. Our audits also included performing such other procedures as we considered necessary in the circumstances. We believe that our audits provide a reasonable basis for our opinions.
A company's internal control over financial reporting is a process designed to provide reasonable assurance regarding the reliability of financial reporting and the preparation of financial statements for external purposes in accordance with generally accepted accounting principles. A company's internal control over financial reporting includes those policies and procedures that (i) pertain to the maintenance of records that, in reasonable detail, accurately and fairly reflect the transactions and dispositions of the assets of the company; (ii) provide reasonable assurance that transactions are recorded as necessary to permit preparation of financial statements in accordance with generally accepted accounting principles, and that receipts and expenditures of the company are being made only in accordance with authorizations of management and directors of the company; and (iii) provide reasonable assurance regarding prevention or timely detection of unauthorized acquisition, use, or disposition of the company's assets that could have a material effect on the financial statements.
Because of its inherent limitations, internal control over financial reporting may not prevent or detect misstatements. Also, projections of any evaluation of effectiveness to future periods are subject to the risk that controls may become inadequate because of changes in conditions, or that the degree of compliance with the policies or procedures may deteriorate.
/ S / P RICEWATERHOUSE C OOPERS LLP
PricewaterhouseCoopers LLP
Chicago, Illinois
February 24, 2012
81
REPORT OF INDEPENDENT REGISTERED PUBLIC ACCOUNTING FIRM
To the Board of Directors and Shareholders of Tenneco Inc.:
We have audited the consolidated statement of income (loss), cash flow, changes in shareholders' equity, and comprehensive income (loss) of Tenneco Inc. and subsidiaries (the "Company") for the year ended December 31, 2009. Our audit also included the financial statement schedule listed in the Index at Item 8 for the year ended December 31, 2009. These financial statements and financial statement schedule are the responsibility of the Company's management. Our responsibility is to express an opinion on the financial statements and financial statement schedule based on our audit.
We conducted our audit in accordance with the standards of the Public Company Accounting Oversight Board (United States). Those standards require that we plan and perform the audit to obtain reasonable assurance about whether the financial statements are free of material misstatement. An audit includes examining, on a test basis, evidence supporting the amounts and disclosures in the financial statements. An audit also includes assessing the accounting principles used and significant estimates made by management, as well as evaluating the overall financial statement presentation. We believe that our audit provides a reasonable basis for our opinion.
In our opinion, such consolidated financial statements present fairly, in all material respects, the results of the Company's operations and its cash flows for the year ended December 31, 2009, in conformity with accounting principles generally accepted in the United States of America. Also, in our opinion, such financial statement schedule, when considered in relation to the basic consolidated financial statements taken as a whole, present fairly, in all material respects, the information set forth therein.
/ S / D ELOITTE & T OUCHE LLP
Chicago, Illinois
February 26, 2010
82
TENNECO INC.
CONSOLIDATED STATEMENTS OF INCOME (LOSS)
| Year Ended December 31, | ||||||||||||
| 2011 | 2010 | 2009 | ||||||||||
| (Millions Except Share and Per Share Amounts) | ||||||||||||
Revenues | ||||||||||||
Net sales and operating revenues | $ | 7,205 | $ | 5,937 | $ | 4,649 | ||||||
|
|
|
|
|
| |||||||
Costs and expenses | ||||||||||||
Cost of sales (exclusive of depreciation and amortization shown below) | 6,037 | 4,900 | 3,875 | |||||||||
Goodwill impairment charge | 11 | - | - | |||||||||
Engineering, research, and development | 133 | 117 | 97 | |||||||||
Selling, general, and administrative | 428 | 417 | 344 | |||||||||
Depreciation and amortization of other intangibles | 207 | 216 | 221 | |||||||||
|
|
|
|
|
| |||||||
| 6,816 | 5,650 | 4,537 | ||||||||||
|
|
|
|
|
| |||||||
Other income (expense) | ||||||||||||
Loss on sale of receivables | (5 | ) | (3 | ) | (9 | ) | ||||||
Other income (expense) | (5 | ) | (3 | ) | (11 | ) | ||||||
|
|
|
|
|
| |||||||
| (10 | ) | (6 | ) | (20 | ) | |||||||
|
|
|
|
|
| |||||||
Earnings before interest expense, income taxes, and noncontrolling interests | 379 | 281 | 92 | |||||||||
Interest expense (net of interest capitalized of $4 million in each of 2011, 2010 and 2009, respectively) | 108 | 149 | 133 | |||||||||
|
|
|
|
|
| |||||||
Earnings before income taxes and noncontrolling interests | 271 | 132 | (41 | ) | ||||||||
Income tax expense | 88 | 69 | 13 | |||||||||
|
|
|
|
|
| |||||||
Net income (loss) | 183 | 63 | (54 | ) | ||||||||
|
|
|
|
|
| |||||||
Less: Net income attributable to noncontrolling interests | 26 | 24 | 19 | |||||||||
|
|
|
|
|
| |||||||
Net income (loss) attributable to Tenneco Inc. | $ | 157 | $ | 39 | $ | (73 | ) | |||||
|
|
|
|
|
| |||||||
Earnings (loss) per share | ||||||||||||
Weighted average shares of common stock outstanding - | ||||||||||||
Basic | 59,884,139 | 59,208,103 | 48,572,463 | |||||||||
Diluted | 61,520,160 | 60,998,694 | 48,572,463 | |||||||||
Basic earnings (loss) per share of common stock | $ | 2.62 | $ | 0.65 | $ | (1.50 | ) | |||||
Diluted earnings (loss) per share of common stock | $ | 2.55 | $ | 0.63 | $ | (1.50 | ) | |||||
The accompanying notes to consolidated financial statements are an integral
part of these statements of income (loss).
83
TENNECO INC.
CONSOLIDATED BALANCE SHEETS
| December 31, | ||||||||
| 2011 | 2010 | |||||||
| (Millions) | ||||||||
| ASSETS | ||||||||
Current assets: | ||||||||
Cash and cash equivalents | $ | 214 | $ | 233 | ||||
Receivables - | ||||||||
Customer notes and accounts, net | 936 | 796 | ||||||
Other | 44 | 30 | ||||||
Inventories | 592 | 547 | ||||||
Deferred income taxes | 40 | 38 | ||||||
Prepayments and other | 153 | 146 | ||||||
|
|
|
| |||||
Total current assets | 1,979 | 1,790 | ||||||
|
|
|
| |||||
Other assets: | ||||||||
Long-term receivables, net | 10 | 9 | ||||||
Goodwill | 74 | 89 | ||||||
Intangibles, net | 32 | 32 | ||||||
Deferred income taxes | 92 | 92 | ||||||
Other | 103 | 105 | ||||||
|
|
|
| |||||
| 311 | 327 | |||||||
|
|
|
| |||||
Plant, property, and equipment, at cost | 3,153 | 3,109 | ||||||
Less - Accumulated depreciation and amortization | (2,106 | ) | (2,059 | ) | ||||
|
|
|
| |||||
| 1,047 | 1,050 | |||||||
|
|
|
| |||||
Total Assets | $ | 3,337 | $ | 3,167 | ||||
|
|
|
| |||||
| LIABILITIES AND SHAREHOLDERS' EQUITY | ||||||||
Current liabilities: | ||||||||
Short-term debt (including current maturities of long-term debt) | $ | 66 | $ | 63 | ||||
Trade payables | 1,171 | 1,048 | ||||||
Accrued taxes | 44 | 51 | ||||||
Accrued interest | 13 | 13 | ||||||
Accrued liabilities | 226 | 227 | ||||||
Other | 50 | 66 | ||||||
|
|
|
| |||||
Total current liabilities | 1,570 | 1,468 | ||||||
|
|
|
| |||||
Long-term debt | 1,158 | 1,160 | ||||||
Deferred income taxes | 51 | 56 | ||||||
Postretirement benefits | 385 | 311 | ||||||
Deferred credits and other liabilities | 118 | 125 | ||||||
Commitments and contingencies | ||||||||
|
|
|
| |||||
Total liabilities | 3,282 | 3,120 | ||||||
|
|
|
| |||||
Redeemable noncontrolling interests | 12 | 12 | ||||||
|
|
|
| |||||
Tenneco Inc. Shareholders' equity: | ||||||||
Common stock | 1 | 1 | ||||||
Premium on common stock and other capital surplus | 3,016 | 3,008 | ||||||
Accumulated other comprehensive loss | (382 | ) | (237 | ) | ||||
Retained earnings (accumulated deficit) | (2,379 | ) | (2,536 | ) | ||||
|
|
|
| |||||
| 256 | 236 | |||||||
Less - Shares held as treasury stock, at cost | 256 | 240 | ||||||
|
|
|
| |||||
Total Tenneco Inc. shareholders' equity | - | (4 | ) | |||||
|
|
|
| |||||
Noncontrolling interests | 43 | 39 | ||||||
|
|
|
| |||||
Total equity | 43 | 35 | ||||||
|
|
|
| |||||
Total liabilities, redeemable noncontrolling interests and equity | $ | 3,337 | $ | 3,167 | ||||
|
|
|
| |||||
The accompanying notes to consolidated financial statements are an integral
part of these balance sheets.
84
TENNECO INC.
CONSOLIDATED STATEMENTS OF CASH FLOWS
| Year Ended December 31, | ||||||||||||
| 2011 | 2010 | 2009 | ||||||||||
| (Millions) | ||||||||||||
Operating Activities | ||||||||||||
Net income (loss) | $ | 183 | $ | 63 | $ | (54 | ) | |||||
Adjustments to reconcile net income (loss) to cash provided by operating activities - | ||||||||||||
Goodwill impairment charge | 11 | - | - | |||||||||
Depreciation and amortization of other intangibles | 207 | 216 | 221 | |||||||||
Deferred income taxes | (5 | ) | 4 | (24 | ) | |||||||
Stock-based compensation | 8 | 9 | 7 | |||||||||
Loss on sale of assets | 4 | 3 | 9 | |||||||||
Changes in components of working capital - | ||||||||||||
(Increase) decrease in receivables | (183 | ) | (231 | ) | (8 | ) | ||||||
(Increase) decrease in inventories | (64 | ) | (122 | ) | 101 | |||||||
(Increase) decrease in prepayments and other current assets | (13 | ) | 20 | (55 | ) | |||||||
Increase (decrease) in payables | 144 | 238 | (2 | ) | ||||||||
Increase (decrease) in accrued taxes | (7 | ) | 12 | 10 | ||||||||
Increase (decrease) in accrued interest | - | (8 | ) | (1 | ) | |||||||
Increase (decrease) in other current liabilities | (7 | ) | 20 | 20 | ||||||||
Change in long-term assets | 1 | 12 | 10 | |||||||||
Change in long-term liabilities | (41 | ) | 6 | 2 | ||||||||
Other | 7 | 2 | 5 | |||||||||
|
|
|
|
|
| |||||||
Net cash provided by operating activities | 245 | 244 | 241 | |||||||||
|
|
|
|
|
| |||||||
Investing Activities | ||||||||||||
Proceeds from sale of assets | 4 | 3 | 5 | |||||||||
Cash payments for plant, property, and equipment | (213 | ) | (151 | ) | (120 | ) | ||||||
Cash payments for software related intangible assets | (15 | ) | (12 | ) | (6 | ) | ||||||
Acquisition of businesses, net of cash acquired | - | - | 1 | |||||||||
Other | - | 3 | 1 | |||||||||
|
|
|
|
|
| |||||||
Net cash used by investing activities | (224 | ) | (157 | ) | (119 | ) | ||||||
|
|
|
|
|
| |||||||
Financing Activities | ||||||||||||
Purchase of common stock under the share repurchase program | (16 | ) | - | - | ||||||||
Issuance of common shares | - | - | 188 | |||||||||
Issuance of long-term debt | 5 | 880 | 6 | |||||||||
Debt issuance costs of long-term debt | (1 | ) | (24 | ) | (8 | ) | ||||||
Retirement of long-term debt | (24 | ) | (864 | ) | (22 | ) | ||||||
Increase (decrease) in bank overdrafts | 3 | 2 | (23 | ) | ||||||||
Net increase (decrease) in revolver borrowings and short-term debt excluding current maturities of long-term debt | 30 | (10 | ) | (218 | ) | |||||||
Capital contribution from noncontrolling interest partner | 1 | - | - | |||||||||
Purchase of additional noncontrolling equity interest | (4 | ) | - | - | ||||||||
Distribution to noncontrolling interests partners | (20 | ) | (14 | ) | (10 | ) | ||||||
|
|
|
|
|
| |||||||
Net cash used by financing activities | (26 | ) | (30 | ) | (87 | ) | ||||||
|
|
|
|
|
| |||||||
Effect of foreign exchange rate changes on cash and cash equivalents | (14 | ) | 9 | 6 | ||||||||
|
|
|
|
|
| |||||||
Increase (decrease) in cash and cash equivalents | (19 | ) | 66 | 41 | ||||||||
Cash and cash equivalents, January 1 | 233 | 167 | 126 | |||||||||
|
|
|
|
|
| |||||||
Cash and cash equivalents, December 31 (Note) | $ | 214 | $ | 233 | $ | 167 | ||||||
|
|
|
|
|
| |||||||
Supplemental Cash Flow Information | ||||||||||||
Cash paid during the year for interest | $ | 106 | $ | 149 | $ | 131 | ||||||
Cash paid during the year for income taxes (net of refunds) | 85 | 53 | 38 | |||||||||
Non-cash Investing and Financing Activities | ||||||||||||
Period end balance of trade payables for plant, property, and equipment | $ | 35 | $ | 29 | $ | 26 | ||||||
| Note: | Cash and cash equivalents include highly liquid investments with a maturity of three months or less at the date of purchase. |
The accompanying notes to consolidated financial statements are an integral
part of these statements of cash flows.
85
TENNECO INC.
CONSOLIDATED STATEMENTS OF CHANGES IN SHAREHOLDERS' EQUITY
| Year Ended December 31, | ||||||||||||||||||||||||
| 2011 | 2010 | 2009 | ||||||||||||||||||||||
| Shares | Amount | Shares | Amount | Shares | Amount | |||||||||||||||||||
| (Millions Except Share Amounts) | ||||||||||||||||||||||||
Common Stock | ||||||||||||||||||||||||
Balance January 1 | 61,541,760 | $ | 1 | 60,789,739 | $ | 1 | 48,314,490 | $ | - | |||||||||||||||
Issued | - | - | - | - | 12,000,000 | 1 | ||||||||||||||||||
Issued pursuant to benefit plans | 49,871 | - | 142,643 | - | 283,195 | - | ||||||||||||||||||
Stock options exercised | 509,704 | - | 609,378 | - | 192,054 | - | ||||||||||||||||||
|
|
|
|
|
|
|
|
|
|
|
| |||||||||||||
Balance December 31 | 62,101,335 | 1 | 61,541,760 | 1 | 60,789,739 | 1 | ||||||||||||||||||
|
|
|
|
|
|
|
|
|
|
|
| |||||||||||||
Premium on Common Stock and Other Capital Surplus | ||||||||||||||||||||||||
Balance January 1 | 3,008 | 3,005 | 2,809 | |||||||||||||||||||||
Purchase of additional noncontrolling equity interest | (2 | ) | (11 | ) | - | |||||||||||||||||||
Premium on common stock issued | - | - | 188 | |||||||||||||||||||||
Premium on common stock issued pursuant to benefit plans | 10 | 14 | 8 | |||||||||||||||||||||
|
|
|
|
|
| |||||||||||||||||||
Balance December 31 | 3,016 | 3,008 | 3,005 | |||||||||||||||||||||
|
|
|
|
|
| |||||||||||||||||||
Accumulated Other Comprehensive Loss | ||||||||||||||||||||||||
Balance January 1 | (237 | ) | (212 | ) | (318 | ) | ||||||||||||||||||
Other comprehensive income (loss) | (145 | ) | (25 | ) | 106 | |||||||||||||||||||
|
|
|
|
|
| |||||||||||||||||||
Balance December 31 | (382 | ) | (237 | ) | (212 | ) | ||||||||||||||||||
|
|
|
|
|
| |||||||||||||||||||
Retained Earnings (Accumulated Deficit) | ||||||||||||||||||||||||
Balance January 1 | (2,536 | ) | (2,575 | ) | (2,502 | ) | ||||||||||||||||||
Net income (loss) attributable to Tenneco Inc. | 157 | 39 | (73 | ) | ||||||||||||||||||||
|
|
|
|
|
| |||||||||||||||||||
Balance December 31 | (2,379 | ) | (2,536 | ) | (2,575 | ) | ||||||||||||||||||
|
|
|
|
|
| |||||||||||||||||||
Less - Common Stock Held as Treasury Stock, at Cost | ||||||||||||||||||||||||
Balance January 1 | 1,294,692 | 240 | 1,294,692 | 240 | 1,294,692 | 240 | ||||||||||||||||||
Purchase of common stock through stock repurchase program | 400,000 | 16 | - | - | - | - | ||||||||||||||||||
|
|
|
|
|
|
|
|
|
|
|
| |||||||||||||
Balance December 31 | 1,694,692 | 256 | 1,294,692 | 240 | 1,294,692 | 240 | ||||||||||||||||||
|
|
|
|
|
|
|
|
|
|
|
| |||||||||||||
Total Tenneco Inc. shareholders' equity | $ | - | $ | (4 | ) | $ | (21 | ) | ||||||||||||||||
|
|
|
|
|
| |||||||||||||||||||
Noncontrolling interests: | ||||||||||||||||||||||||
Balance January 1 | 39 | 32 | 24 | |||||||||||||||||||||
Net income | 19 | 16 | 13 | |||||||||||||||||||||
Sale of twenty percent equity interest to Tenneco Inc. | - | (4 | ) | - | ||||||||||||||||||||
Other comprehensive income (loss) | (1 | ) | 3 | - | ||||||||||||||||||||
Dividends declared | (14 | ) | (8 | ) | (5 | ) | ||||||||||||||||||
|
|
|
|
|
| |||||||||||||||||||
Balance December 31 | $ | 43 | $ | 39 | $ | 32 | ||||||||||||||||||
|
|
|
|
|
| |||||||||||||||||||
Total equity | $ | 43 | $ | 35 | $ | 11 | ||||||||||||||||||
|
|
|
|
|
| |||||||||||||||||||
The accompanying notes to consolidated financial statements are an integral
part of these statements of changes in shareholders' equity.
86
TENNECO INC.
CONSOLIDATED STATEMENTS OF COMPREHENSIVE INCOME
| Year Ended December 31, 2011 | ||||||||||||||||||||||||
| Tenneco Inc. | Noncontrolling interests | Total | ||||||||||||||||||||||
| Accumulated Other Comprehensive Income (Loss) | Comprehensive Income (Loss) | Accumulated Other Comprehensive Income (Loss) | Comprehensive Income (Loss) | Accumulated Other Comprehensive Income (Loss) | Comprehensive Income (Loss) | |||||||||||||||||||
| (Millions) | ||||||||||||||||||||||||
Net Income | $ | 157 | $ | 26 | $ | 183 | ||||||||||||||||||
|
|
|
|
|
| |||||||||||||||||||
Accumulated Other Comprehensive Income (Loss) | ||||||||||||||||||||||||
Cumulative Translation Adjustment | ||||||||||||||||||||||||
Balance January 1 | $ | 8 | $ | 5 | $ | 13 | ||||||||||||||||||
Translation of foreign currency statements | (38 | ) | (38 | ) | (1 | ) | (1 | ) | (39 | ) | (39 | ) | ||||||||||||
|
|
|
|
|
| |||||||||||||||||||
Balance December 31 | (30 | ) | 4 | (26 | ) | |||||||||||||||||||
|
|
|
|
|
| |||||||||||||||||||
Additional Liability for Pension and Postretirement Benefits | ||||||||||||||||||||||||
Balance January 1 | (250 | ) | - | (250 | ) | |||||||||||||||||||
Additional Liability for Pension and Postretirement benefits, net of tax | (102 | ) | (102 | ) | (102 | ) | (102 | ) | ||||||||||||||||
|
|
|
| |||||||||||||||||||||
Balance December 31 | (352 | ) | (352 | ) | ||||||||||||||||||||
|
|
|
|
|
| |||||||||||||||||||
Balance December 31 | $ | (382 | ) | $ | 4 | $ | (378 | ) | ||||||||||||||||
|
|
|
|
|
|
|
|
|
|
|
| |||||||||||||
Other comprehensive income (loss) | (140 | ) | (1 | ) | (141 | ) | ||||||||||||||||||
|
|
|
|
|
| |||||||||||||||||||
Comprehensive Income | $ | 17 | $ | 25 | $ | 42 | ||||||||||||||||||
|
|
|
|
|
| |||||||||||||||||||
The accompanying notes to consolidated financial statements are an integral
part of these statements of comprehensive income.
87
TENNECO INC.
CONSOLIDATED STATEMENTS OF COMPREHENSIVE INCOME
| Year Ended December 31, 2010 | ||||||||||||||||||||||||||||||
| Tenneco Inc. | Noncontrolling interests | Total | ||||||||||||||||||||||||||||
| Accumulated Other Comprehensive Income (Loss) | Comprehensive Income (Loss) | Accumulated Other Comprehensive Income (Loss) | Comprehensive Income (Loss) | Accumulated Other Comprehensive Income (Loss) | Comprehensive Income (Loss) | |||||||||||||||||||||||||
| (Millions) | ||||||||||||||||||||||||||||||
Net Income | $ | 39 | $ | 24 | $ | 63 | ||||||||||||||||||||||||
|
|
|
|
|
| |||||||||||||||||||||||||
Accumulated Other Comprehensive Income (Loss) | ||||||||||||||||||||||||||||||
Cumulative Translation Adjustment | ||||||||||||||||||||||||||||||
Balance January 1 | $ | 37 | $ | - | $ | 37 | ||||||||||||||||||||||||
Translation of foreign currency statements | (29 | ) | (29 | ) | 5 | 5 | (24 | ) | (24 | ) | ||||||||||||||||||||
|
|
|
|
|
| |||||||||||||||||||||||||
Balance December 31 | 8 | 5 | 13 | |||||||||||||||||||||||||||
|
|
|
|
|
| |||||||||||||||||||||||||
Additional Liability for Pension and Postretirement Benefits | ||||||||||||||||||||||||||||||
Balance January 1 | (249 | ) | - | (249 | ) | |||||||||||||||||||||||||
Additional liability for pension and postretirement benefits, net of tax | (1 | ) | (1 | ) | (1 | ) | (1 | ) | ||||||||||||||||||||||
|
|
|
| |||||||||||||||||||||||||||
Balance December 31 | (250 | ) | (250 | ) | ||||||||||||||||||||||||||
|
|
|
|
|
| |||||||||||||||||||||||||
Balance December 31 | $ | (242 | ) | $ | 5 | $ | (237 | ) | ||||||||||||||||||||||
|
|
|
|
|
|
|
|
|
|
|
| |||||||||||||||||||
Other comprehensive income (loss) | (30 | ) | 5 | (25 | ) | |||||||||||||||||||||||||
|
|
|
|
|
| |||||||||||||||||||||||||
Comprehensive Income | $ | 9 | $ | 29 | $ | 38 | ||||||||||||||||||||||||
|
|
|
|
|
| |||||||||||||||||||||||||
The accompanying notes to consolidated financial statements are an integral
part of these statements of comprehensive income.
88
TENNECO INC.
CONSOLIDATED STATEMENTS OF COMPREHENSIVE INCOME
| Year Ended December 31, 2009 | ||||||||||||||||||||||||||||||
| Tenneco Inc. | Noncontrolling interests | Total | ||||||||||||||||||||||||||||
| Accumulated Other Comprehensive Income (Loss) | Comprehensive Income (Loss) | Accumulated Other Comprehensive Income (Loss) | Comprehensive Income (Loss) | Accumulated Other Comprehensive Income (Loss) | Comprehensive Income (Loss) | |||||||||||||||||||||||||
| (Millions) | ||||||||||||||||||||||||||||||
Net Income (Loss) | $ (73) | $ 19 | $ (54) | |||||||||||||||||||||||||||
|
|
|
|
|
| |||||||||||||||||||||||||
Accumulated Other Comprehensive Income (Loss) | ||||||||||||||||||||||||||||||
Cumulative Translation Adjustment | ||||||||||||||||||||||||||||||
Balance January 1 | $ (42) | $- | $ (42) | |||||||||||||||||||||||||||
Translation of foreign currency statements | 79 | 79 | - | - | 79 | 79 | ||||||||||||||||||||||||
|
|
|
|
|
| |||||||||||||||||||||||||
Balance December 31 | 37 | - | 37 | |||||||||||||||||||||||||||
|
|
|
|
|
| |||||||||||||||||||||||||
Additional Liability for Pension and Postretirement Benefits | ||||||||||||||||||||||||||||||
Balance January 1 | (276) | - | (276) | |||||||||||||||||||||||||||
Additional liability for pension and postretirement benefits, net of tax of $1 million | 27 | 27 | 27 | 27 | ||||||||||||||||||||||||||
|
|
|
| |||||||||||||||||||||||||||
Balance December 31 | (249) | (249) | ||||||||||||||||||||||||||||
|
|
|
|
|
| |||||||||||||||||||||||||
Balance December 31 | $(212) | $- | $(212) | |||||||||||||||||||||||||||
|
|
|
|
|
|
|
|
|
|
|
| |||||||||||||||||||
Other comprehensive income (loss) | 106 | - | 106 | |||||||||||||||||||||||||||
|
|
|
|
|
| |||||||||||||||||||||||||
Comprehensive Income | $ 33 | $ | 19 | $ | 52 | |||||||||||||||||||||||||
|
|
|
|
|
| |||||||||||||||||||||||||
The accompanying notes to consolidated financial statements are an integral
part of these statements of comprehensive income.
89
TENNECO INC.
NOTES TO CONSOLIDATED FINANCIAL STATEMENTS
| 1. | Summary of Accounting Policies |
Consolidation and Presentation
Our consolidated financial statements include all majority-owned subsidiaries. We carry investments in 20 percent to 50 percent owned companies in which the Company does not have a controlling interest, as equity method investments, at cost plus equity in undistributed earnings since the date of acquisition and cumulative translation adjustments. We have eliminated intercompany transactions. We have evaluated all subsequent events through the date our financial statements were issued.
Use of Estimates
The preparation of financial statements in conformity with accounting principles generally accepted in the United States of America requires us to make estimates and assumptions that affect the reported amounts of assets and liabilities and disclosure of contingent assets and liabilities at the date of the consolidated financial statements and the reported amounts of revenues and expenses during the reporting period. These estimates include, among others allowances for doubtful receivables, promotional and product returns, pension and post-retirement benefit plans, income taxes, and contingencies. These items are covered in more detail elsewhere in Note 1, Note 7, Note 10, and Note 12 of the consolidated financial statements of Tenneco Inc. Actual results could differ from those estimates.
Redeemable Noncontrolling Interests
We have noncontrolling interests in three joint ventures with redemption features that could require us to purchase the noncontrolling interests at fair value in the event of a change in control of Tenneco Inc. or certain of our subsidiaries. We do not believe that it is probable that the redemption features in any of these joint venture agreements will be triggered. However, the redemption of these shares is not solely within our control. Accordingly, the related noncontrolling interests are presented as "Redeemable noncontrolling interests" in the temporary equity section of our consolidated balance sheets.
In August 2011, we purchased the remaining 25 percent equity interest in our emission control joint venture in Thailand for $4 million in cash. As a result of this purchase, our equity ownership of this joint venture investment changed to 100 percent from 75 percent. Refer to Note 3 of the consolidated financial statements of Tenneco Inc. for additional details.
The following is a rollforward of activity in our redeemable noncontrolling interests for the years ending December 31, 2011, 2010 and 2009, respectively:
| 2011 | 2010 | 2009 | ||||||||||
| (Millions) | ||||||||||||
Balance January 1 | $ | 12 | $ | 7 | $ | 7 | ||||||
Net income attributable to redeemable noncontrolling interests | 7 | 8 | 5 | |||||||||
Sale of 25 percent equity interest to Tenneco Inc | (2 | ) | - | - | ||||||||
Capital Contributions | 1 | - | - | |||||||||
Other comprehensive income (loss) | - | 2 | - | |||||||||
Dividends declared | (6 | ) | (5 | ) | (5 | ) | ||||||
|
|
|
|
|
| |||||||
Balance December 31 | $ | 12 | $ | 12 | $ | 7 | ||||||
|
|
|
|
|
| |||||||
90
TENNECO INC.
NOTES TO CONSOLIDATED FINANCIAL STATEMENTS - (Continued)
Inventories
At December 31, 2011 and 2010, inventory by major classification was as follows:
| 2011 | 2010 | |||||||
| (Millions) | ||||||||
Finished goods | $ | 244 | $ | 222 | ||||
Work in process | 181 | 164 | ||||||
Raw materials | 121 | 118 | ||||||
Materials and supplies | 46 | 43 | ||||||
|
|
|
| |||||
| $ | 592 | $ | 547 | |||||
|
|
|
| |||||
Our inventories are stated at the lower of cost or market value using the first-in, first-out ("FIFO") or average cost methods.
Goodwill and Intangibles, net
We evaluate goodwill for impairment in the fourth quarter of each year, or more frequently if events indicate it is warranted. The goodwill impairment test consists of a two-step process. In step one, we compare the estimated fair value of our reporting units with goodwill to the carrying value of the unit's assets and liabilities to determine if impairment exists within the recorded balance of goodwill. We estimate the fair value of each reporting unit using the income approach which is based on the present value of estimated future cash flows. The income approach is dependent on a number of factors, including estimates of market trends, forecasted revenues and expenses, capital expenditures, weighted average cost of capital and other variables. A separate discount rate derived by a combination of published sources, internal estimates and weighted based on our debt and equity structure, was used to calculate the discounted cash flows for each of our reporting units. These estimates are based on assumptions that we believe to be reasonable, but which are inherently uncertain and outside of the control of management. If the carrying value of the reporting unit is higher than its fair value, there is an indication that impairment may exist which requires step two to be performed to measure the amount of the impairment loss. The amount of impairment is determined by comparing the implied fair value of a reporting unit's goodwill to its carrying value.
In the fourth quarter of 2010, the estimated fair value of all of our reporting units, except for our Australian reporting unit, significantly exceeded the carrying value of its assets and liabilities. Our Australian reporting unit had a goodwill balance of $11 million with an estimated fair value in excess of its net carrying value of one percent as of the testing date.
During the third quarter of 2011, we performed an impairment evaluation of our Australian reporting unit's goodwill balance as a result of continued deterioration of that reporting unit's financial performance driven primarily by significant declines in industry production volumes in that region. We identified in our step one test that the carrying value of our Australian reporting unit was higher than its fair value which is an indication that impairment may exist which required us to perform step two of the goodwill impairment test to measure the amount of the impairment loss. Step two of the goodwill impairment evaluation required us to calculate the implied fair value of goodwill of our Australian reporting unit by allocating the estimated fair value to the assets and liabilities of this reporting unit as if the reporting unit had been acquired in a business combination and the fair value of the reporting unit was the acquisition price. As a result of performing steps one and two of the goodwill impairment test, we concluded that the remaining amount of goodwill related to our Australian reporting unit was impaired and accordingly, we recorded a goodwill impairment charge of $11 million during the third quarter of 2011.
91
TENNECO INC.
NOTES TO CONSOLIDATED FINANCIAL STATEMENTS - (Continued)
In the fourth quarter of 2011, the estimated fair value of each of our reporting units exceeded the carrying value of their assets and liabilities as of the testing date.
The changes in the net carrying amount of goodwill for the years ended December 31, 2011 and 2010 were as follows:
| Year Ended December 31, 2011 | ||||||||||||||||
| North America | Europe, South America and India | Asia Pacific | Total | |||||||||||||
| (Millions) | ||||||||||||||||
Balance as January 1 | ||||||||||||||||
Goodwill | $ | 330 | $ | 85 | $ | 12 | $ | 427 | ||||||||
Accumulated impairment losses | (306 | ) | (31 | ) | (1 | ) | (338 | ) | ||||||||
|
|
|
|
|
|
|
| |||||||||
| 24 | 54 | 11 | 89 | |||||||||||||
Translation adjustments | 1 | (5 | ) | - | (4 | ) | ||||||||||
|
|
|
|
|
|
|
| |||||||||
Goodwill impairment charge | - | - | 11 | 11 | ||||||||||||
|
|
|
|
|
|
|
| |||||||||
Balance at December 31 | ||||||||||||||||
Goodwill | 331 | 80 | 12 | 423 | ||||||||||||
Accumulated impairment losses | (306 | ) | (31 | ) | (12 | ) | (349 | ) | ||||||||
|
|
|
|
|
|
|
| |||||||||
| $ | 25 | $ | 49 | $ | - | $ | 74 | |||||||||
|
|
|
|
|
|
|
| |||||||||
| Year Ended December 31, 2010 | ||||||||||||||||
| North America | Europe, South America and India | Asia Pacific | Total | |||||||||||||
| (Millions) | ||||||||||||||||
Balance as January 1 | ||||||||||||||||
Goodwill | $ | 330 | $ | 87 | $ | 10 | $ | 427 | ||||||||
Accumulated impairment losses | (306 | ) | (32 | ) | - | (338 | ) | |||||||||
|
|
|
|
|
|
|
| |||||||||
| 24 | 55 | 10 | 89 | |||||||||||||
Translation adjustments | - | (1 | ) | 1 | - | |||||||||||
|
|
|
|
|
|
|
| |||||||||
Balance at December 31 | ||||||||||||||||
Goodwill | 330 | 85 | 12 | 427 | ||||||||||||
Accumulated impairment losses | (306 | ) | (31 | ) | (1 | ) | (338 | ) | ||||||||
|
|
|
|
|
|
|
| |||||||||
| $ | 24 | $ | 54 | $ | 11 | $ | 89 | |||||||||
|
|
|
|
|
|
|
| |||||||||
92
TENNECO INC.
NOTES TO CONSOLIDATED FINANCIAL STATEMENTS - (Continued)
We have capitalized certain intangible assets, primarily technology rights, trademarks and patents, based on their estimated fair value at the date we acquired them. We amortize our finite useful life intangible assets on a straight-line basis over periods ranging from five to 50 years. Amortization of intangibles amounted to $2 million in each of 2011, 2010 and 2009, and is included in the statements of income caption "Depreciation and amortization of intangibles." The carrying amount and accumulated amortization of our finite useful life intangible assets were as follows:
| December 31, 2011 | December 31, 2010 | |||||||||||||||||||
| Gross
Carrying Value | Accumulated Amortization | Gross
Carrying Value | Accumulated Amortization | |||||||||||||||||
| (Millions) | (Millions) | |||||||||||||||||||
Customer contract | $ 8 | $ (3) | $ 8 | $ (2) | ||||||||||||||||
Patents | 5 | (4) | 5 | (4) | ||||||||||||||||
Technology rights | 20 | (6) | 21 | (5) | ||||||||||||||||
Other | 9 | - | 6 | (1) | ||||||||||||||||
|
|
|
|
|
|
|
| |||||||||||||
Total | $ 42 | $ (13) | $ 40 | $ (12) | ||||||||||||||||
|
|
|
|
|
|
|
| |||||||||||||
Estimated amortization of intangible assets over the next five years is expected to be $3 million in 2012, $4 million in both 2013 and 2014, $3 million in 2015 and $2 million in 2016. We have capitalized indefinite life intangibles of $3 million relating to purchased trademarks from our Marzocchi acquisition in 2007.
Plant, Property, and Equipment, at Cost
At December 31, 2011 and 2010, plant, property, and equipment, at cost, by major category were as follows:
| 2011 | 2010 | |||||||
| (Millions) | ||||||||
Land, buildings, and improvements | $ | 530 | $ | 524 | ||||
Machinery and equipment | 2,406 | 2,406 | ||||||
Other, including construction in progress | 217 | 179 | ||||||
|
|
|
| |||||
| $ | 3,153 | $ | 3,109 | |||||
|
|
|
| |||||
We depreciate these properties excluding land on a straight-line basis over the estimated useful lives of the assets. Useful lives range from 10 to 50 years for buildings and improvements and from three to 25 years for machinery and equipment.
Notes and Accounts Receivable and Allowance for Doubtful Accounts
Receivables consist of amounts billed and currently due from customers and unbilled pre-production design and development costs. Short and long-term accounts receivable outstanding were $959 million and $823 million at December 31, 2011 and 2010, respectively. The allowance for doubtful accounts on short-term and long-term accounts receivable was $17 million and $20 million at December 31, 2011 and 2010, respectively. Short and long-term notes receivable outstanding were $4 million and $2 million at December 31, 2011 and 2010, respectively. The allowance for doubtful accounts on short-term and long-term notes receivable was zero at both December 31, 2011 and 2010.
Pre-production Design and Development and Tooling Assets
We expense pre-production design and development costs as incurred unless we have a contractual guarantee for reimbursement from the original equipment customer. Unbilled pre-production design and development costs recorded in prepayments and other and long-term receivables was $19 million and $15 million
93
TENNECO INC.
NOTES TO CONSOLIDATED FINANCIAL STATEMENTS - (Continued)
at December 31, 2011 and 2010, respectively. In addition, plant, property and equipment included $38 million at both December 31, 2011 and 2010, respectively, for original equipment tools and dies that we own, and prepayments and other included $49 million and $46 million at December 31, 2011 and 2010, respectively, for in-process tools and dies that we are building for our original equipment customers.
Internal Use Software Assets
We capitalize certain costs related to the purchase and development of software that we use in our business operations. We amortize the costs attributable to these software systems over their estimated useful lives, ranging from 3 to 12 years, based on various factors such as the effects of obsolescence, technology, and other economic factors. Capitalized software development costs, net of amortization, were $58 million and $53 million at December 31, 2011 and 2010, respectively, and are recorded in other long-term assets. Amortization of software development costs was approximately $15 million, $18 million and $22 million for the years ended December 31, 2011, 2010 and 2009, respectively, and is included in the statements of income (loss) caption "Depreciation and amortization of intangibles." Additions to capitalized software development costs, including payroll and payroll-related costs for those employees directly associated with developing and obtaining the internal use software, are classified as investing activities in the statements of cash flows.
Income Taxes
We reported income tax expense of $88 million, $69 million and $13 million in the years ending 2011, 2010 and 2009, respectively. The tax expense recorded in 2011 differs from the expense that would be recorded using a U.S. Federal statutory rate of 35 percent due to a net tax benefit of $7 million primarily related to U.S. taxable income with no associated tax expense due to our net operating loss ("NOL") carryforward and income generated in lower tax rate jurisdictions, partially offset by the impact of recording a valuation allowance against the tax benefit for losses in certain foreign jurisdictions and taxes on repatriation of foreign earnings.
We evaluate our deferred income taxes quarterly to determine if valuation allowances are required or should be adjusted. U.S. GAAP requires that companies assess whether valuation allowances should be established against their deferred tax assets based on consideration of all available evidence, both positive and negative, using a "more likely than not" standard. This assessment considers, among other matters, the nature, frequency and amount of recent losses, the duration of statutory carryforward periods, and tax planning strategies. In making such judgments, significant weight is given to evidence that can be objectively verified.
Valuation allowances have been established for deferred tax assets based on a "more likely than not" threshold. The ability to realize deferred tax assets depends on our ability to generate sufficient taxable income within the carryforward periods provided for in the tax law for each tax jurisdiction. We have considered the following possible sources of taxable income when assessing the realization of our deferred tax assets:
| • | Future reversals of existing taxable temporary differences; |
| • | Taxable income or loss, based on recent results, exclusive of reversing temporary differences and carryforwards; |
| • | Tax-planning strategies; and |
| • | Taxable income in prior carryback years if carryback is permitted under the relevant tax law. |
In 2008, given our historical losses in the U.S., we concluded that our ability to fully utilize our NOLs was limited, as we were required to project the continuation of the negative economic environment at that time and the impact of the negative operating environment on our tax planning strategies. As a result, we recorded a valuation allowance against all of our U.S. deferred tax assets except for our tax planning strategies which have not yet been implemented and which do not depend upon generating future taxable income. We carry deferred
94
TENNECO INC.
NOTES TO CONSOLIDATED FINANCIAL STATEMENTS - (Continued)
tax assets in the U.S. of $90 million, as of December 31, 2011, relating to the expected utilization of those NOLs. The recording of a valuation allowance does not impact the amount of the NOL that would be available for federal and state income tax purposes in future periods. The federal NOLs expire beginning in tax years ending in 2021 through 2029. The state NOLs expire in various tax years through 2029.
If our operating performance continues to improve on a sustained basis, our conclusion regarding the need for a valuation allowance could change, resulting in the reversal of some or all of the valuation allowance in the future. The charge to establish the U.S. valuation allowance also includes items related to the losses allocable to certain state jurisdictions where it was determined that tax attributes related to those jurisdictions were potentially not realizable. In addition, the charge to establish the U.S. valuation allowance eliminated the need for certain tax reserves which would need to be recorded if the valuation allowance was reversed. If we were to reverse our U.S. valuation allowance, as of December 31, 2011, the impact on earnings would approximate $147 million.
In prior years, we recorded a valuation allowance against deferred tax assets generated by taxable losses in the U.S. as well as certain other foreign jurisdictions. Our provision for income taxes will include no tax benefit with respect to losses incurred and no tax expense with respect to income generated in these jurisdictions until the respective valuation allowance is eliminated. In certain foreign jurisdictions, we have recorded a tax benefit on NOLs and tax credits with unlimited lives that are supported by tax actions and forecasted profitability. If the tax actions are not successful or losses are incurred, we may need to record a valuation allowance in a future period. We have recorded net deferred tax assets of approximately $23 million in these jurisdictions as of December 31, 2011. These actions will cause variability in our effective tax rate.
Revenue Recognition
We recognize revenue for sales to our original equipment and aftermarket customers when title and risk of loss passes to the customers under the terms of our arrangements with those customers, which is usually at the time of shipment from our plants or distribution centers. Generally, in connection with the sale of exhaust systems to certain original equipment manufacturers, we purchase catalytic converters and diesel particulate filters or components thereof including precious metals ("substrates") on behalf of our customers which are used in the assembled system. These substrates are included in our inventory and "passed through" to the customer at our cost, plus a small margin, since we take title to the inventory and are responsible for both the delivery and quality of the finished product. Revenues recognized for substrate sales were $1,640 million, $1,297 million and $966 million in 2011, 2010 and 2009, respectively. For our aftermarket customers, we provide for promotional incentives and returns at the time of sale. Estimates are based upon the terms of the incentives and historical experience with returns. Certain taxes assessed by governmental authorities on revenue producing transactions, such as value added taxes, are excluded from revenue and recorded on a net basis. Shipping and handling costs billed to customers are included in revenues and the related costs are included in cost of sales in our consolidated statements of income (loss).
Warranty Reserves
Where we have offered product warranty, we also provide for warranty costs. Provisions for estimated expenses related to product warranty are made at the time products are sold or when specific warranty issues are identified on OE products. These estimates are established using historical information about the nature, frequency, and average cost of warranty claims and upon specific warranty issues as they arise. The warranty terms vary but range from one year up to limited lifetime warranties on some of our premium aftermarket products. We actively study trends of our warranty claims and take action to improve product quality and minimize warranty claims. While we have not experienced any material differences between these estimates and our actual costs, it is reasonably possible that future warranty issues could arise that could have a significant impact on our consolidated financial statements.
95
TENNECO INC.
NOTES TO CONSOLIDATED FINANCIAL STATEMENTS - (Continued)
Earnings Per Share
We compute basic earnings per share by dividing income available to common shareholders by the weighted-average number of common shares outstanding. The computation of diluted earnings per share is similar to the computation of basic earnings per share, except that we adjust the weighted-average number of shares outstanding to include estimates of additional shares that would be issued if potentially dilutive common shares had been issued. In addition, we adjust income available to common shareholders to include any changes in income or loss that would result from the assumed issuance of the dilutive common shares. Due to the net loss for the year ended December 31, 2009, the calculation of diluted earnings per share did not include the dilutive effect from shares of restricted stock and stock options. See Note 2 to the consolidated financial statements of Tenneco Inc.
Engineering, Research and Development
We expense engineering, research, and development costs as they are incurred. Engineering, research, and development expenses were $133 million for 2011, $117 million for 2010 and $97 million for 2009, net of reimbursements from our customers. Our customers reimburse us for engineering, research, and development costs on some platforms when we prepare prototypes and incur costs before platform awards. Our engineering, research, and development expense for 2011, 2010, and 2009 has been reduced by $119 million, $110 million and $104 million, respectively, for these reimbursements.
Advertising and Promotion Expenses
We expense advertising and promotion expenses as they are incurred. Advertising and promotion expenses were $61 million, $59 million, and $50 million for the years ended December 31, 2011, 2010, and 2009, respectively.
Foreign Currency Translation
We translate the consolidated financial statements of foreign subsidiaries into U.S. dollars using the exchange rate at each balance sheet date for assets and liabilities and a weighted-average exchange rate for revenues and expenses in each period. We record translation adjustments for those subsidiaries whose local currency is their functional currency as a component of accumulated other comprehensive loss in shareholders' equity. We recognize transaction gains and losses arising from fluctuations in currency exchange rates on transactions denominated in currencies other than the functional currency in earnings as incurred, except for those transactions which hedge purchase commitments and for those intercompany balances which are designated as long-term investments. Our results include foreign currency transaction losses of $3 million in 2011, less than $1 million in 2010, and $4 million in 2009, respectively.
Risk Management Activities
We use derivative financial instruments, principally foreign currency forward purchase and sales contracts with terms of less than one year, to hedge our exposure to changes in foreign currency exchange rates. Our primary exposure to changes in foreign currency rates results from intercompany loans made between affiliates to minimize the need for borrowings from third parties. Additionally, we enter into foreign currency forward purchase and sale contracts to mitigate our exposure to changes in exchange rates on certain intercompany and third-party trade receivables and payables. We manage counter-party credit risk by entering into derivative financial instruments with major financial institutions that can be expected to fully perform under the terms of such agreements. We do not enter into derivative financial instruments for speculative purposes. In managing our foreign currency exposures, we identify and aggregate existing offsetting positions and then hedge residual exposures through third-party derivative contracts. The fair value of our foreign currency forward contracts was a net asset position of $1 million at December 31, 2011 and is based on an internally developed model which
96
TENNECO INC.
NOTES TO CONSOLIDATED FINANCIAL STATEMENTS - (Continued)
incorporates observable inputs including quoted spot rates, forward exchange rates and discounted future expected cash flows utilizing market interest rates with similar quality and maturity characteristics. We record the change in fair value of these foreign exchange forward contracts as part of currency gains (losses) within cost of sales in the consolidated statements of income (loss). The fair value of foreign exchange forward contracts are recorded in prepayments and other current assets or other current liabilities in the consolidated balance sheet.
New Accounting Pronouncements
In April 2011, the Financial Accounting Standards Board ("FASB") issued an amendment to the accounting guidance for transfers of financial assets which changes the criteria that must be met to achieve sales accounting. This amendment removes from the assessment of effective control the criterion relating to the transferor's ability to repurchase or redeem financial assets on substantially the agreed terms, even in the event of default by the transferee. In addition, this amendment eliminates the requirement to demonstrate that the transferor possesses adequate collateral to fund substantially all the cost of purchasing replacement financial assets. This amendment is effective for a reporting entity's first interim or annual period beginning on or after December 15, 2011. We do not believe the adoption of this amendment to the accounting guidance for transfers of financial assets on January 1, 2012 will have a material impact on our consolidated financial statements.
In May 2011, the FASB issued an amendment to achieve common fair value measurement and disclosure requirements in United States Generally Accepted Accounting Principles ("U.S. GAAP") and International Financial Reporting Standards ("IFRS"). The amendment includes (1) that the concepts of highest and best use and valuation premise in a fair value measurement are relevant only when measuring the fair value of nonfinancial assets, (2) provides specific requirements for measuring the fair value of an instrument classified in a reporting entity's shareholders' equity, (3) requires disclosure of quantitative information about unobservable inputs used in a fair value measurement that is categorized within Level 3 of the fair value hierarchy, (4) allows the use of a price, that would be received to sell a net asset position for a particular risk or to transfer a net liability position for a particular risk, in measuring the fair value of financial instruments that are managed within a portfolio, (5) in the absence of a Level 1 input a reporting entity should apply premiums or discounts when market participants would do so when pricing an asset or liability and (6) additional disclosure about fair value measurements. This amendment is effective for a reporting entity's interim and annual periods beginning after December 15, 2011. We do not believe the adoption of this amendment for fair value measurements on January 1, 2012 will have a material impact on the measurement of our financial assets and liabilities. We will add additional fair value disclosures, as required by this amendment, beginning with our first interim reporting period ending March 31, 2012.
In June 2011, the FASB issued an amendment to the accounting guidance for the presentation on comprehensive income which must be applied retrospectively for all periods presented. This amendment removes one of the three presentation options for presenting the components of other comprehensive income as part of the statement of changes in stockholders' equity and requires either a single continuous statement of comprehensive income or a two statement approach and is effective for fiscal years, and interim periods within those fiscal years, beginning after December 15, 2011. If a reporting entity elects the two statement approach, this amendment requires consecutive presentation of the statement of net income followed by the statement of other comprehensive income. In addition, this amendment requires an entity to present reclassification adjustments on the face of the financial statements from other comprehensive income to net income. The FASB issued in December 2011, an amendment to defer the presentation of reclassification adjustments to allow additional time to redeliberate these new presentation requirements. We do not believe the adoption of this amendment to the accounting guidance for the presentation of comprehensive income on January 1, 2012 will have a material impact on our consolidated financial statements.
In September 2011, the FASB issued an amendment to the accounting guidance for testing goodwill for impairment. This amendment provides a reporting entity the option to first assess qualitative factors to determine whether the existence of events and circumstances leads to a determination that it is more likely than not that the
97
TENNECO INC.
NOTES TO CONSOLIDATED FINANCIAL STATEMENTS - (Continued)
fair value of a reporting unit is less than its carrying amount. If the reporting entity's assessment after considering all events and circumstances is that it is not more likely than not that its fair value is less than its carrying amount, then performing the two-step impairment test is not required. If the reporting entity concludes that it is more likely than not that its fair value is less than its carrying amount then the first step of the two-step impairment test is required. If the carrying amount of the reporting unit exceeds its fair value, then the reporting unit is required to perform the second step of the goodwill impairment test to measure the amount of the impairment loss. This amendment is effective for annual and interim goodwill impairment tests performed for fiscal years beginning after December 15, 2011. We do not believe the adoption of this amendment on January 1, 2012 for testing goodwill for impairment will have a material impact on our consolidated financial statements.
In December 2011, the FASB issued an amendment relating to the disclosure about offsetting assets and liabilities. This amendment requires disclosure to provide information to help reconcile differences in the offsetting requirements under U.S. GAAP and IFRS. A reporting entity will be required to disclose 1) the gross amount of recognized assets and liabilities, 2) the amounts offset to determine the net amounts presented in the statement of financial position, 3) the net amounts presented in the statement of financial position, 4) the amounts subject to an enforceable master netting arrangement or similar agreement not otherwise included in (2), and 5) the net amount after deducting the amounts in (4) and (3). This amendment is effective for a reporting entity's interim and annual periods beginning on or after January 1, 2013. We do not believe the adoption of this amendment relating to the disclosure about offsetting assets and liabilities on January 1, 2013 will have a material impact on our consolidated financial statements.
Restricted Net Assets
In certain countries where we operate, transfers of funds out of such countries by way of dividends, loans or advances are subject to certain central bank restrictions which require approval from the central bank authorities prior to transferring funds out of these countries. The countries in which we operate that have such restrictions include China, Russia, South Africa, India, Thailand and Argentina. At December 31, 2011, the net asset balance of our subsidiaries in the countries in which we operate that have such restrictions was $137 million. These central banking restrictions do not have a significant effect on our ability to manage liquidity on a global basis.
98
TENNECO INC.
NOTES TO CONSOLIDATED FINANCIAL STATEMENTS - (Continued)
| 2. | Earnings (Loss) Per Share |
Earnings (loss) per share of common stock outstanding were computed as follows:
| Year Ended December 31, | ||||||||||||
| 2011 | 2010 | 2009 | ||||||||||
| (Millions Except Share and Per Share Amounts) | ||||||||||||
Basic earnings (loss) per share - | ||||||||||||
Net income (loss) attributable to Tenneco Inc. | $ | 157 | $ | 39 | $ | (73 | ) | |||||
|
|
|
|
|
| |||||||
Average shares of common stock outstanding | 59,884,139 | 59,208,103 | 48,572,463 | |||||||||
|
|
|
|
|
| |||||||
Earnings (loss) per average share of common stock | $ | 2.62 | $ | 0.65 | $ | (1.50 | ) | |||||
Diluted earnings (loss) per share - | ||||||||||||
Net income attributable to Tenneco Inc. | $ | 157 | $ | 39 | $ | (73 | ) | |||||
Average shares of common stock outstanding | 59,884,139 | 59,208,103 | 48,572,463 | |||||||||
Effect of dilutive securities: | ||||||||||||
Restricted stock | 168,539 | 441,561 | - | |||||||||
Stock options | 1,467,482 | 1,349,030 | - | |||||||||
|
|
|
|
|
| |||||||
Average shares of common stock outstanding including dilutive securities | 61,520,160 | 60,998,694 | 48,572,463 | |||||||||
|
|
|
|
|
| |||||||
Earnings (loss) per average share of common stock | $ | 2.55 | $ | 0.63 | $ | (1.50 | ) | |||||
|
|
|
|
|
| |||||||
Options to purchase 202,009 and 612,832 shares of common stock were outstanding as of December 31, 2011 and 2010, respectively, but not included in the computation of diluted earnings per share, because the options were anti-dilutive. As a result of the net loss in 2009, the calculation of diluted loss per share excludes the dilutive effect of options and restricted stock.
| 3. | Acquisitions |
In August 2011, we purchased the remaining 25 percent equity interest in our emission control joint venture in Thailand for $4 million in cash. As a result of this purchase, our equity ownership of this joint venture investment changed to 100 percent from 75 percent.
In January 2010, we purchased an additional 20 percent equity interest in our Tenneco Tongtai (Dalian) Exhaust System Co., Ltd. joint venture investment in China for $15 million in cash. As a result of this purchase, our equity ownership percentage of this joint venture investment increased to 80 percent from 60 percent.
| 4. | Restructuring and Other Charges |
Over the past several years, we have adopted plans to restructure portions of our operations. These plans were approved by our Board of Directors and were designed to reduce operational and administrative overhead costs throughout the business. For 2009, we incurred $21 million in restructuring and related costs, of which $16 million was recorded in cost of sales, $1 million was recorded in selling, general, administrative and engineering expense and $4 million was recorded in depreciation and amortization expense. In 2010, we incurred $19 million in restructuring and related costs, of which $14 million was recorded in cost of sales and $5 million was recorded in depreciation and amortization expense. During 2011, we incurred $8 million in restructuring and related costs, primarily related to headcount reductions in Europe and Australia and the closure of our ride control plant in Cozad, Nebraska, all of which was recorded in cost of sales.
99
TENNECO INC.
NOTES TO CONSOLIDATED FINANCIAL STATEMENTS - (Continued)
Amounts related to activities that are part of our restructuring plans are as follows:
| December 31, 2010 Restructuring Reserve | 2011 Expenses | 2011 Cash Payments | Reserve Adjustments | December 31, 2011 Restructuring Reserve | |||||||||||||||||||||
| (Millions) | |||||||||||||||||||||||||
Severance | $7 | 8 | (13 | ) | (1 | ) | $1 | ||||||||||||||||||
Under the terms of our amended and extended senior credit agreement that took effect on June 3, 2010, we are allowed to exclude $60 million of cash charges and expenses, before taxes, related to cost reduction initiatives incurred after June 3, 2010 from the calculation of the financial covenant ratios required under our senior credit facility. As of December 31, 2011, we have excluded $17 million in cumulative allowable charges relating to restructuring initiatives against the $60 million available under the terms of the senior credit facility.
On September 22, 2009, we announced that we were closing our original equipment ride control plant in Cozad, Nebraska. The closure of the Cozad plant will eliminate approximately 500 positions. We are hiring at other facilities as we move production from Cozad to those facilities, which will result in a net decrease of approximately 60 positions. Much of the production is being shifted from Cozad to our plant in Hartwell, Georgia.
During the transition of production from our Cozad facility to our Hartwell facility, several customer programs, which were planned to phase out, were reinstated and volumes increased beyond the amount in our original restructuring plan. To meet the higher volume requirements, we have taken a number of actions over the past few months to stabilize the production environment in Hartwell including reinforcing several core processes, realigning assembly lines, upgrading equipment to increase output and accelerating our Lean manufacturing activities. Based on the higher volumes, we are adjusting our consolidation plan. Our revised consolidation plan includes temporarily continuing some basic production operations in Cozad, and redirecting some programs from our Hartwell facility to our other North American facilities to better balance production. These actions are anticipated to conclude during the third quarter of 2012. As of December 31, 2011, more than 95 percent of the positions at our Cozad facility have been eliminated.
During 2009 and 2010, we recorded $11 million and $10 million, respectively, of restructuring and related expenses related to this initiative, of which approximately $16 million represents cash expenditures. In 2011, we have recorded an additional cash charge of $2 million related to this initiative.
In 2011, we recorded $3 million of restructuring and related expenses, all of which represented cash expenditures, related to the permanent elimination of 53 positions in our Australian operations as a result of the continued decline in industry production volumes in that region.
100
TENNECO INC.
NOTES TO CONSOLIDATED FINANCIAL STATEMENTS - (Continued)
| 5. | Long-Term Debt, Short-Term Debt, and Financing Arrangements |
Long-Term Debt
A summary of our long-term debt obligations at December 31, 2011 and 2010, is set forth in the following table:
| 2011 | 2010 | |||||||
| (Millions) | ||||||||
Tenneco Inc. - | ||||||||
Revolver borrowings due 2014, average effective interest rate 5.3% in 2011 and 5.4% in 2010 | $ | 24 | $ | - | ||||
Senior Term Loan due 2012 through 2016, average effective interest rate 4.9% in 2011 and 5.1% in 2010 | 148 | 149 | ||||||
7 3 / 4 % Senior Notes due 2018 | 225 | 225 | ||||||
6 7 / 8 % Senior Notes due 2020 | 500 | 500 | ||||||
8 5 / 8 % Senior Subordinated Notes due 2014(a) | - | 20 | ||||||
8 1 / 8 % Senior Notes due 2015 | 250 | 250 | ||||||
Debentures due 2012 through 2025, average effective interest rate 8.4% in 2011 and 2010 | 1 | 1 | ||||||
Customer Notes due 2013, average effective interest rate 8.0% in 2011 and 2010 | 3 | 4 | ||||||
Other subsidiaries - | ||||||||
Notes due 2012 through 2025, average effective interest rate 1.3% in 2011 and 3.0% in 2010 | 11 | 13 | ||||||
|
|
|
| |||||
| 1,162 | 1,162 | |||||||
Less - maturities classified as current | 4 | 2 | ||||||
|
|
|
| |||||
Total long-term debt | $ | 1,158 | $ | 1,160 | ||||
|
|
|
| |||||
| (a) | On January 7, 2011, we redeemed the remaining $20 million 8 5 / 8 percent senior subordinated notes by increasing our revolver borrowings which are classified as long-term debt. |
The aggregate maturities and sinking fund requirements applicable to the long-term debt outstanding at December 31, 2011, are $4 million, $5 million, $27 million, $253 million and $142 million for 2012, 2013, 2014, 2015 and 2016, respectively.
101
TENNECO INC.
NOTES TO CONSOLIDATED FINANCIAL STATEMENTS - (Continued)
Short-Term Debt
Our short-term debt includes the current portion of long-term obligations and borrowings by foreign subsidiaries. Information regarding our short-term debt as of and for the years ended December 31, 2011 and 2010 is as follows:
| 2011 | 2010 | |||||||
| (Millions) | ||||||||
Maturities classified as current | $ | 4 | $ | 2 | ||||
Notes payable | 62 | 61 | ||||||
|
|
|
| |||||
Total short-term debt | $ | 66 | $ | 63 | ||||
|
|
|
| |||||
| Notes Payable(a) | ||||||||
| 2011 | 2010 | |||||||
| (Dollars in Millions) | ||||||||
Outstanding borrowings at end of year | $ | 62 | $ | 61 | ||||
Weighted average interest rate on outstanding borrowings at end of year(b) | 6.0 | % | 7.8 | % | ||||
Approximate maximum month-end outstanding borrowings during year | $ | 178 | $ | 201 | ||||
Approximate average month-end outstanding borrowings during year | $ | 118 | $ | 109 | ||||
Weighted average interest rate on approximate average month-end outstanding borrowings during year(b) | 5.6 | % | 5.5 | % | ||||
| (a) | Includes borrowings under both committed credit facilities and uncommitted lines of credit and similar arrangements. |
| (b) | This calculation does not include the commitment fees to be paid on the unused revolving credit facility balances which are recorded as interest expense for accounting purposes. |
Financing Arrangements
| Committed Credit Facilities(a) as of December 31, 2011 | ||||||||||||||||||||
| Term | Commitments | Borrowings | Letters
of Credit(b) | Available | ||||||||||||||||
| (Millions) | ||||||||||||||||||||
Tenneco Inc. revolving credit agreement | 2014 | 622 | - | 58 | 564 | |||||||||||||||
Tenneco Inc. tranche B-1 letter of credit/revolving loan agreement | 2014 | 130 | 24 | - | 106 | |||||||||||||||
Tenneco Inc. Senior Term Loans | 2016 | 148 | 148 | - | - | |||||||||||||||
Subsidiaries' credit agreements | 2012-2025 | 88 | 73 | - | 15 | |||||||||||||||
|
|
|
|
|
|
|
| |||||||||||||
| $ | 988 | $ | 245 | $ | 58 | $ | 685 | |||||||||||||
|
|
|
|
|
|
|
| |||||||||||||
| (a) | We generally are required to pay commitment fees on the unused portion of the total commitment. |
| (b) | Letters of credit reduce the available borrowings under the revolving credit agreement. |
Overview. Our financing arrangements are primarily provided by a committed senior secured financing arrangement with a syndicate of banks and other financial institutions. The arrangement is secured by
102
TENNECO INC.
NOTES TO CONSOLIDATED FINANCIAL STATEMENTS - (Continued)
substantially all our domestic assets and pledges of up to 66 percent of the stock of certain first-tier foreign subsidiaries, as well as guarantees by our material domestic subsidiaries.
On June 3, 2010, we completed an amendment and extension of our senior secured credit facility by extending the term of our revolving credit facility and replacing our $128 million term loan A with a larger and longer maturity term loan B facility. As a result of the amendment and extension, as of December 31, 2011, the senior credit facility provides us with a total revolving credit facility size of $622 million until March 16, 2012, when commitments of $66 million will expire. After March 16, 2012, the extended revolving credit facility will provide $556 million of revolving credit and will mature on May 31, 2014. The extended facility will mature earlier on December 15, 2013, if our $130 million tranche B-1 letter of credit/revolving loan facility is not refinanced by that date. Prior to maturity, funds may be borrowed, repaid and re-borrowed under the two revolving credit facilities without premium or penalty.
As of December 31, 2011, the senior credit facility also provides a six-year, $148 million term loan B maturing in June 2016, and a seven-year $130 million tranche B-1 letter of credit/revolving loan facility maturing in March 2014. We are required to make quarterly principal payments of $375 thousand on the term loan B, through March 31, 2016 with a final payment of $141 million due June 3, 2016. The tranche B-1 letter of credit/revolving loan facility requires repayment by March 2014. We can enter into revolving loans and issue letters of credit under the $130 million tranche B-1 letter of credit/revolving loan facility. The tranche B-1 letter of credit/revolving loan facility is reflected as debt on our balance sheet only if we borrow money under this facility or if we use the facility to make payments for letters of credit. There is no additional cost to us for issuing letters of credit under the tranche B-1 letter of credit/revolving loan facility. However, outstanding letters of credit reduce our availability to enter into revolving loans under the facility. We pay the tranche B-1 lenders a margin on the $130 million deposited with the administrative agent. In addition, we pay lenders interest equal to the London Interbank Offered Rate ("LIBOR") on all borrowings under the facility. Funds deposited with the administrative agent by the lenders and not borrowed by the Company earn interest at an annual rate approximately equal to LIBOR less 25 basis points.
Beginning June 3, 2010, our term loan B and revolving credit facility bear interest at an annual rate equal to, at our option, either (i) LIBOR plus a margin of 475 and 450 basis points, respectively, or (ii) a rate consisting of the greater of (a) the JPMorgan Chase prime rate plus a margin of 375 and 350 basis points, respectively, (b) the Federal Funds rate plus 50 basis points plus a margin of 375 and 350 basis points, respectively, and (c) the Eurodollar Rate plus 100 basis points plus a margin of 375 and 350 basis points, respectively. The margin we pay on these borrowings will be reduced by 25 basis points following each fiscal quarter for which our consolidated net leverage ratio is less than 2.25 for extending lenders and for the term loan B and will be further reduced by an additional 25 basis points following each fiscal quarter for which the consolidated net leverage ratio is less than 2.00 for extending lenders. Our consolidated net leverage ratio was 1.88 and 2.24 as of December 31, 2011 and 2010, respectively. Accordingly, in February of 2012 the margin we pay on these borrowings will be reduced by 25 basis points for extending lenders and will remain at such level for so long as our consolidated net leverage ratio remains below 2.00.
The borrowings under our tranche B-1 letter of credit/revolving loan facility incur interest at an annual rate equal to, at our option, either (i) LIBOR plus a margin of 500 basis points, or (ii) a rate consisting of the greater of (a) the JPMorgan Chase prime rate plus a margin of 400 basis points, (b) the Federal Funds rate plus 50 basis points plus a margin of 400 basis points, and (c) the Eurodollar Rate plus 100 basis points plus a margin of 400 basis points.
At December 31, 2011, of the $752 million available under the two revolving credit facilities within our senior secured credit facility, we had unused borrowing capacity of $670 million with $24 million in outstanding borrowings and $58 million in letters of credit outstanding. As of December 31, 2011, our outstanding debt also included $250 million of 8 1 / 8 percent senior notes due November 15, 2015, $148 million term loan B due
103
TENNECO INC.
NOTES TO CONSOLIDATED FINANCIAL STATEMENTS - (Continued)
June 3, 2016, $225 million of 7 3 / 4 percent senior notes due August 15, 2018, $500 million of 6 7 / 8 percent senior notes due December 15, 2020, and $78 million of other debt.
On December 9, 2010, we commenced a cash tender offer of our outstanding $500 million 8 5 / 8 percent senior subordinated notes due in 2014 and a consent solicitation to amend the indenture governing these notes. On December 23, 2010, we issued $500 million of 6 7 / 8 percent senior notes due December 15, 2020 in a private offering. The net proceeds of this transaction, together with cash and available liquidity, were used to finance the purchase of our 8 5 / 8 percent senior subordinated notes pursuant to the tender offer at a price of 103.25 percent of the principal amount, plus accrued and unpaid interest for holders who tendered prior to the expiration of the consent solicitation, and 100.25 percent of the principal amount, plus accrued and unpaid interest, for other participants. A total of $480 million of the senior subordinated notes were tendered prior to the expiration of the consent solicitation. On January 7, 2011, we redeemed all remaining outstanding $20 million of senior subordinated notes that were not previously tendered, at a price of 102.875 percent of the principal amount, plus accrued and unpaid interest. To facilitate these transactions, we amended our senior credit agreement to permit us to refinance our senior subordinated notes with new senior unsecured notes. We did not incur any fee in connection with this amendment. The new notes are general senior obligations of Tenneco Inc. and are not secured by assets of Tenneco Inc. or any of our subsidiaries that guarantee the new notes. We recorded $20 million of pre-tax charges in December 2010 and an additional $1 million of pre-tax charges in the first quarter of 2011 related to our repurchase and redemption of our 8 5 / 8 percent senior subordinated notes. On March 14, 2011, we completed an offer to exchange the $500 million of 6 7 / 8 percent senior notes due in 2020 which have been registered under the Securities Act of 1933, for and in replacement of all outstanding unregistered 6 7 / 8 percent senior notes due in 2020. We received tenders from holders of all $500 million of the aggregate outstanding amount of the original notes. The terms of the new notes are substantially identical to the terms of the original notes for which they were exchanged, except that the transfer restrictions and the registration rights applicable to the original notes generally do not apply to the new notes.
On August 3, 2010, we issued $225 million of 7 3 / 4 percent senior notes due August 15, 2018 in a private offering. The net proceeds of this transaction, together with cash and available liquidity, were used to finance the redemption of our 10 1 / 4 percent senior secured notes due in 2013. We called the senior secured notes for redemption on August 3, 2010, and completed the redemption on September 2, 2010 at a price of 101.708 percent of the principal amount, plus accrued and unpaid interest. We recorded $5 million of expense related to our redemption of our 10 1 / 4 percent senior secured notes in the third quarter of 2010. The new notes are general senior obligations of Tenneco Inc. and are not secured by assets of Tenneco Inc. or any of our subsidiaries that guarantee the new notes. On February 14, 2011, we completed an offer to exchange the $225 million of 7 3 / 4 percent senior notes due in 2018 which have been registered under the Securities Act of 1933, for and in replacement of all outstanding unregistered 7 3 / 4 percent senior notes due in 2018. We received tenders from holders of all $225 million of the aggregate outstanding amount of the original notes. The terms of the new notes are substantially identical to the terms of the original notes for which they were exchanged, except that the transfer restrictions and the registration rights applicable to the original notes generally do not apply to the new notes.
104
TENNECO INC.
NOTES TO CONSOLIDATED FINANCIAL STATEMENTS - (Continued)
Senior Credit Facility - Interest Rates and Fees. Borrowings and letters of credit issued under the senior credit facility bear interest at an annual rate equal to, at our option, either (i) LIBOR plus a margin as set forth in the table below; or (ii) a rate consisting of the greater of the JPMorgan Chase prime rate, the Federal Funds rate plus 50 basis points or the Eurodollar Rate plus 100 basis points, plus a margin as set forth in the table below:
| 8/14/2009 thru 2/28/2010 | 3/1/2010 thru 6/2/2010 | 6/3/2010 thru 2/27/2011 | 2/28/2011 thru 5/15/2011 | 5/16/2011 thru 8/7/2011 | Beginning 8/8/2011 | |||||||||||||||||||
Applicable Margin over: | ||||||||||||||||||||||||
LIBOR for Revolving Loans | 5.50 | % | 4.50 | % | 4.50 | % | 4.25 | % | 4.50 | % | 4.25 | %* | ||||||||||||
LIBOR for Term Loan B Loans | - | - | 4.75 | % | 4.50 | % | 4.75 | % | 4.50 | %* | ||||||||||||||
LIBOR for Term Loan A Loans | 5.50 | % | 4.50 | % | - | - | - | - | ||||||||||||||||
LIBOR for Tranche B-1 Loans | 5.50 | % | 5.00 | % | 5.00 | % | 5.00 | % | 5.00 | % | 5.00 | % | ||||||||||||
Prime-based Term Loan A Loans | 4.50 | % | 3.50 | % | - | - | - | - | ||||||||||||||||
Prime for Revolving Loans | - | - | 3.50 | % | 3.25 | % | 3.50 | % | 3.25 | %* | ||||||||||||||
Prime for Term Loan B Loans | - | - | 3.75 | % | 3.50 | % | 3.75 | % | 3.50 | %* | ||||||||||||||
Prime for Tranche B-1 Loans | - | - | 4.00 | % | 4.00 | % | 4.00 | % | 4.00 | % | ||||||||||||||
Federal Funds for Revolving Loans | - | - | 3.50 | % | 3.25 | % | 3.50 | % | 3.25 | %* | ||||||||||||||
Federal Funds for Term Loan B Loans | - | - | 3.75 | % | 3.50 | % | 3.75 | % | 3.50 | %* | ||||||||||||||
Federal Funds for Tranche B-1 Loans | 5.00 | % | 4.00 | % | 4.00 | % | 4.00 | % | 4.00 | % | 4.00 | % | ||||||||||||
Commitment Fee | 0.75 | % | 0.50 | % | 0.75 | % | 0.50 | % | 0.75 | % | 0.50 | %* | ||||||||||||
| * | In February 2012, the margin we pay on borrowings will decrease by 25 basis points, as a result of a decrease in our consolidated net leverage ratio from 2.07 at September 30, 2011 to 1.88 at December 31, 2011. |
Senior Credit Facility - Other Terms and Conditions. Our senior credit facility requires that we maintain financial ratios equal to or better than the following consolidated net leverage ratio (consolidated indebtedness net of cash divided by consolidated EBITDA, as defined in the senior credit facility agreement), and consolidated interest coverage ratio (consolidated EBITDA divided by consolidated interest expense, as defined under the senior credit facility agreement) at the end of each period indicated. Failure to maintain these ratios will result in a default under our senior credit facility. The financial ratios required under the amended and restated senior credit facility and, the actual ratios we achieved for the four quarters of 2011, are as follows:
| Quarter Ended | ||||||||||||||||||||||||||||||||
| March 31, 2011 | June 30, 2011 | September 30, 2011 | December 31, 2011 | |||||||||||||||||||||||||||||
| Req. | Act. | Req. | Act. | Req. | Act. | Req. | Act. | |||||||||||||||||||||||||
Leverage Ratio (maximum) | 4.00 | 2.32 | 3.75 | 2.17 | 3.50 | 2.07 | 3.50 | 1.88 | ||||||||||||||||||||||||
Interest Coverage Ratio (minimum) | 2.55 | 4.37 | 2.55 | 4.76 | 2.55 | 5.17 | 2.55 | 5.69 | ||||||||||||||||||||||||
The financial ratios required under the senior credit facility for each quarter beyond December 31, 2011 include a maximum leverage ratio of 3.50 and a minimum interest coverage ratio of 2.75.
The covenants in our senior credit facility agreement generally prohibit us from repaying or refinancing our senior notes. So long as no default existed, we would, however, under our senior credit facility agreement, be permitted to repay or refinance our senior notes: (i) with the net cash proceeds of incremental facilities and permitted refinancing indebtedness (as defined in the senior credit facility agreement); (ii) with the net cash proceeds from the sale of shares of our common stock; (iii) in exchange for permitted refinancing indebtedness or in exchange for shares of our common stock; (iv) with the net cash proceeds of any new senior or subordinated unsecured indebtedness; (v) with the proceeds of revolving credit loans (as defined in the senior credit facility
105
TENNECO INC.
NOTES TO CONSOLIDATED FINANCIAL STATEMENTS - (Continued)
agreement); (vi) with the cash generated by the operations of the Company; and (vii) in an amount equal to the sum of (a) the net cash proceeds of qualified stock issued by the Company after March 16, 2007, plus (b) the portion of annual excess cash flow (beginning with excess cash flow for fiscal year 2010) not required to be applied to payment of the credit facilities and which is not used for other purposes, provided that the aggregate principal amount of senior notes purchased and cancelled or redeemed pursuant to clauses (v), (vi) and (vii), is capped as follows based on the pro forma consolidated leverage ratio after giving effect to such purchase, cancellation or redemption:
Pro forma Consolidated Leverage Ratio | Aggregate Senior Note Maximum Amount | ||||
| (Millions) | |||||
Greater than or equal to 3.0x | $ 20 | ||||
Greater than or equal to 2.5x | $100 | ||||
Less than 2.5x | $125 | ||||
Although the senior credit facility agreement would permit us to repay or refinance our senior notes under the conditions described above, any repayment or refinancing of our outstanding notes would be subject to market conditions and either the voluntary participation of note holders or our ability to redeem the notes under the terms of the applicable note indenture. For example, while the senior credit agreement would allow us to repay our outstanding notes via a direct exchange of the notes for either permitted refinancing indebtedness or for shares of our common stock, we do not, under the terms of the agreements governing our outstanding notes, have the right to refinance the notes via any type of direct exchange.
The senior credit facility agreement also contains other restrictions on our operations that are customary for similar facilities, including limitations on: (i) incurring additional liens; (ii) sale and leaseback transactions (except for the permitted transactions as described in the senior credit facility agreement); (iii) liquidations and dissolutions; (iv) incurring additional indebtedness or guarantees; (v) investments and acquisitions; (vi) dividends and share repurchases; (vii) mergers and consolidations; and (viii) refinancing of the senior notes. Compliance with these requirements and restrictions is a condition for any incremental borrowings under the senior credit facility agreement and failure to meet these requirements enables the lenders to require repayment of any outstanding loans.
As of December 31, 2011, we were in compliance with all the financial covenants and operational restrictions of the facility. Our senior credit facility does not contain any terms that could accelerate payment of the facility or affect pricing under the facility as a result of a credit rating agency downgrade.
Senior Notes. As of December 31, 2011, our outstanding debt also includes $250 million of 8 1 / 8 percent senior notes due November 15, 2015, $225 million of 7 3 / 4 percent senior notes due August 15, 2018 and $500 million of 6 7 / 8 percent senior notes due December 15, 2020. Under the indentures governing the notes, we are permitted to redeem some or all of the remaining senior notes at any time after November 15, 2011 in the case of the senior notes due 2015, August 14, 2014 in the case of the senior notes due 2018, and December 15, 2015 in the case of senior notes due 2020. If we sell certain of our assets or experience specified kinds of changes in control, we must offer to repurchase the notes. Under the indentures governing the notes, we are permitted to redeem up to 35 percent of the senior notes due 2018, with the proceeds of certain equity offerings completed before August 13, 2013 and up to 35 percent of the senior notes due 2020, with the proceeds of certain equity offerings completed before December 15, 2013.
Our senior notes require that, as a condition precedent to incurring certain types of indebtedness not otherwise permitted, our consolidated fixed charge coverage ratio, as calculated on a pro forma basis, be greater than 2.00. The indentures also contain restrictions on our operations, including limitations on: (i) incurring additional indebtedness or liens; (ii) dividends; (iii) distributions and stock repurchases; (iv) investments;
106
TENNECO INC.
NOTES TO CONSOLIDATED FINANCIAL STATEMENTS - (Continued)
(v) asset sales and (vi) mergers and consolidations. Subject to limited exceptions, all of our existing and future material domestic wholly owned subsidiaries fully and unconditionally guarantee these notes on a joint and several basis. There are no significant restrictions on the ability of the subsidiaries that have guaranteed these notes to make distributions to us. As of December 31, 2011, we were in compliance with the covenants and restrictions of these indentures.
Accounts Receivable Securitization. We securitize some of our accounts receivable on a limited recourse basis in North America and Europe. As servicer under these accounts receivable securitization programs, we are responsible for performing all accounts receivable administration functions for these securitized financial assets including collections and processing of customer invoice adjustments. In North America, we have an accounts receivable securitization program with three commercial banks comprised of a first priority facility and a second priority facility. We securitize original equipment and aftermarket receivables on a daily basis under the bank program. In March 2011, the North American program was amended and extended to March 23, 2012. The first priority facility continues to provide financing of up to $110 million and the second priority facility, which is subordinated to the first priority facility, continues to provide up to an additional $40 million of financing. Both facilities monetize accounts receivable generated in the U.S. and Canada that meet certain eligibility requirements, and the second priority facility also monetizes certain accounts receivable generated in the U.S. or Canada that would otherwise be ineligible under the first priority securitization facility. The amendments to the North American program expand the trade receivables that are eligible for purchase under the program and decrease the margin we pay to our banks. We had no outstanding third party investments in our securitized accounts receivable under the North American program at December 31, 2011 and 2010, respectively.
Each facility contains customary covenants for financings of this type, including restrictions related to liens, payments, mergers or consolidation and amendments to the agreements underlying the receivables pool. Further, each facility may be terminated upon the occurrence of customary events (with customary grace periods, if applicable), including breaches of covenants, failure to maintain certain financial ratios, inaccuracies of representations and warranties, bankruptcy and insolvency events, certain changes in the rate of default or delinquency of the receivables, a change of control and the entry or other enforcement of material judgments. In addition, each facility contains cross-default provisions, where the facility could be terminated in the event of non-payment of other material indebtedness when due and any other event which permits the acceleration of the maturity of material indebtedness.
We also securitize receivables in our European operations with regional banks in Europe. The arrangements to securitize receivables in Europe are provided under seven separate facilities provided by various financial institutions in each of the foreign jurisdictions. The commitments for these arrangements are generally for one year, but some may be cancelled with notice 90 days prior to renewal. In some instances, the arrangement provides for cancellation by the applicable financial institution at any time upon 15 days, or less, notification. The amount of outstanding third party investments in our securitized accounts receivable in Europe was $121 million and $91 million at December 31, 2011 and 2010, respectively.
If we were not able to securitize receivables under either the North American or European securitization programs, our borrowings under our revolving credit agreements might increase. These accounts receivable securitization programs provide us with access to cash at costs that are generally favorable to alternative sources of financing, and allow us to reduce borrowings under our revolving credit agreements.
We adopted the amended accounting guidance under ASC Topic 860, Accounting for Transfers of Financial Assets effective January 1, 2010. Prior to the adoption of this new guidance, we accounted for activities under our North American and European accounts receivable securitization programs as sales of financial assets to our banks. The new accounting guidance changed the condition that must be met for the transfer of financial assets to be accounted for as a sale. The new guidance adds additional conditions that must be satisfied for transfers of financial assets to be accounted for as sales when the transferor has not transferred the entire original financial
107
TENNECO INC.
NOTES TO CONSOLIDATED FINANCIAL STATEMENTS - (Continued)
asset, including the requirement that no partial interest holder have rights in the transferred asset that are subordinate to the rights of other partial interest holders.
In our North American accounts receivable securitization programs, we transfer a partial interest in a pool of receivables and the interest that we retain is subordinate to the transferred interest. Accordingly, beginning January 1, 2010, we account for our North American securitization program as a secured borrowing. In our European programs, we transfer accounts receivables in their entirety to the acquiring entities and satisfy all of the conditions established under ASC Topic 860 to report the transfer of financial assets in their entirety as a sale. The fair value of assets received as proceeds in exchange for the transfer of accounts receivable under our European securitization programs approximates the fair value of such receivables. We recognized $3 million and $4 million in interest expense for the years ended 2011 and 2010, respectively, relating to our North American securitization program, which effective January 1, 2010, is accounted for as a secured borrowing under the amended accounting guidance for transfers of financial assets. In addition, we recognized a loss of $5 million, $3 million and $9 million for the years ended 2011, 2010 and 2009, respectively, on the sale of trade accounts receivable in our European and North American accounts receivable securitization programs, representing the discount from book values at which these receivables were sold to our banks. The discount rate varies based on funding costs incurred by our banks, which averaged approximately three percent, four percent and five percent for the years ended 2011, 2010 and 2009, respectively.
| 6. | Financial Instruments |
The carrying and estimated fair values of our financial instruments by class at December 31, 2011 and 2010 were as follows:
| December 31, 2011 | December 31, 2010 | |||||||||||||||
| Carrying Amount | Fair Value | Carrying Amount | Fair Value | |||||||||||||
| (Millions) | ||||||||||||||||
Long-term debt (including current maturities) | $ | 1,162 | $ | 1,200 | $ | 1,162 | $ | 1,201 | ||||||||
Instruments with off-balance sheet risk: | ||||||||||||||||
Foreign exchange forward contracts: | ||||||||||||||||
Asset derivative contracts | 1 | 1 | 2 | 2 | ||||||||||||
Asset and Liability Instruments - The fair value of cash and cash equivalents, short and long-term receivables, accounts payable, and short-term debt was considered to be the same as or was not determined to be materially different from the carrying amount.
Long-term Debt - The fair value of our public fixed rate senior notes is based on quoted market prices. The fair value of our private borrowings under our senior credit facility and other long-term debt instruments is based on the market value of debt with similar maturities, interest rates and risk characteristics.
Foreign exchange forward contracts - We use derivative financial instruments, principally foreign currency forward purchase and sales contracts with terms of less than one year, to hedge our exposure to changes in foreign currency exchange rates. Our primary exposure to changes in foreign currency rates results from intercompany loans made between affiliates to minimize the need for borrowings from third parties. Additionally, we enter into foreign currency forward purchase and sale contracts to mitigate our exposure to changes in exchange rates on certain intercompany and third-party trade receivables and payables. We manage counter-party credit risk by entering into derivative financial instruments with major financial institutions that can be expected to fully perform under the terms of such agreements. We do not enter into derivative financial instruments for speculative purposes. The fair value of our foreign currency forward contracts is based on an internally developed model which incorporates observable inputs including quoted spot rates, forward exchange
108
TENNECO INC.
NOTES TO CONSOLIDATED FINANCIAL STATEMENTS - (Continued)
rates and discounted future expected cash flows utilizing market interest rates with similar quality and maturity characteristics. We record the change in fair value of these foreign exchange forward contracts as part of currency gains (losses) within cost of sales in the consolidated statements of income. The fair value of foreign exchange forward contracts are recorded in prepayments and other current assets or other current liabilities in the consolidated balance sheet. The fair value of our foreign exchange forward contracts, presented on a gross basis by derivative contract at December 31, 2011 and 2010, respectively, was as follows:
| Fair Value of Derivative Instruments | ||||||||||||||||||||||||||||||
| December 31, 2011 | December 31, 2010 | |||||||||||||||||||||||||||||
| Asset Derivatives | Liability Derivatives | Total | Asset Derivatives | Liability Derivatives | Total | |||||||||||||||||||||||||
| (Millions) | ||||||||||||||||||||||||||||||
Foreign exchange forward contracts | $1 | $- | $1 | $2 | $- | $2 | ||||||||||||||||||||||||
The fair value of our recurring financial assets and liabilities at December 31, 2011 and 2010, respectively, are as follows:
| December 31, 2011 | December 31, 2010 | |||||||||||||||||||||||||||||
| Level 1 | Level 2 | Level 3 | Level 1 | Level 2 | Level 3 | |||||||||||||||||||||||||
| (Millions) | ||||||||||||||||||||||||||||||
Financial Assets: | ||||||||||||||||||||||||||||||
Foreign exchange contracts | n/a | $1 | n/a | n/a | $2 | n/a | ||||||||||||||||||||||||
The fair value hierarchy definition prioritizes the inputs used in measuring fair value into the following levels:
Level 1 | - | Quoted prices in active markets for identical assets or liabilities. | ||||
Level 2 | - | Inputs, other than quoted prices in active markets, that are observable either directly or indirectly. | ||||
Level 3 | - | Unobservable inputs based on our own assumptions. | ||||
The following table summarizes by major currency the notional amounts for foreign currency forward purchase and sale contracts as of December 31, 2011 (all of which mature in 2012):
| Notional Amount in Foreign Currency | ||||||||||
| (Millions) | ||||||||||
Australian dollars | -Purchase | 2 | ||||||||
British pounds | -Purchase | 4 | ||||||||
European euro | -Sell | (56 | ) | |||||||
Japanese Yen | -Purchase | 431 | ||||||||
South African rand | -Purchase | 92 | ||||||||
U.S. dollars | -Purchase | 2 | ||||||||
| -Sell | (47 | ) | ||||||||
Other | -Purchase | 1 | ||||||||
| -Sell | (1 | ) | ||||||||
Guarantees - We have from time to time issued guarantees for the performance of obligations by some of our subsidiaries, and some of our subsidiaries have guaranteed our debt. All of our existing and future material domestic wholly-owned subsidiaries fully and unconditionally guarantee our senior credit facility and our senior notes on a joint and several basis. The arrangement for the senior credit facility is also secured by first-priority
109
TENNECO INC.
NOTES TO CONSOLIDATED FINANCIAL STATEMENTS - (Continued)
liens on substantially all our domestic assets and pledges of up to 66 percent of the stock of certain first-tier foreign subsidiaries. No assets or capital stock of our direct or indirect foreign subsidiaries secure our senior notes. For additional information, refer to Note 13 of the consolidated financial statements of Tenneco Inc., where we present the Supplemental Guarantor Condensed Consolidating Financial Statements.
In March 2011, we entered into two performance guarantee agreements in the U.K. between Tenneco Management (Europe) Limited ("TMEL") and the two Walker Group Retirement Plans, the Walker Group Employee Benefit Plan and the Walker Group Executive Retirement Benefit Plan (the "Walker Plans"), whereby TMEL will guarantee the payment of all current and future pension contributions in event of a payment default by the sponsoring or participating employers of the Walker Plans. As a result of our decision to enter into these performance guarantee agreements, the levy due to the U.K. Pension Protection Fund was reduced. The Walker Plans are comprised of employees from Tenneco Walker (U.K.) Limited and our Futaba Tenneco U.K. joint venture. Employer contributions are funded by both Tenneco Walker (U.K.) Limited, as the sponsoring employer and Futaba Tenneco U.K., as a participating employer. The performance guarantee agreements are expected to remain in effect until all pension obligations for the Walker Plans' sponsoring and participating employers have been satisfied. The maximum amount payable for these pension performance guarantees relating to other participating employers is approximately $3 million as of December 31, 2011 which is determined by taking 105 percent of the liability of the Walker Plans calculated under section 179 of the U.K. Pension Act of 2004 offset by plan assets. We did not record an additional liability in March 2011 for this performance guarantee since Tenneco Walker (U.K.) Limited, as the sponsoring employer of the Walker Plans, already recognizes 100 percent of the pension obligation calculated based on U.S. GAAP, for all of the Walker Plans' participating employers on its balance sheet, which was $13 million and $9 million at December 31, 2011 and 2010, respectively. At December 31, 2011, all pension contributions under the Walker Plans were current for all of the Walker Plans' sponsoring and participating employers.
In June 2011, we entered into an indemnity agreement between TMEL and Futaba Industrial Co. Ltd. ("Futaba") which requires Futaba to indemnify TMEL for any cost, loss or liability which TMEL may incur under the performance guarantee agreements. The maximum amount reimbursable by Futaba to TMEL under this indemnity agreement is equal to the amount incurred by TMEL under the performance guarantee agreements multiplied by Futaba's shareholder ownership percentage of the Futaba Tenneco U.K. joint venture. At December 31, 2011 the maximum amount reimbursable by Futaba to TMEL is approximately $3 million.
We have issued guarantees through letters of credit in connection with some obligations of our affiliates. As of December 31, 2011, we have guaranteed $58 million in letters of credit to support some of our subsidiaries' insurance arrangements, foreign employee benefit programs, environmental remediation activities and cash management and capital requirements.
Negotiable Financial Instruments - One of our European subsidiaries receives payment from one of its OE customers whereby the accounts receivable are satisfied through the delivery of negotiable financial instruments. We may collect these financial instruments before their maturity date by either selling them at a discount or using them to satisfy accounts receivable that have previously been sold to a European bank. Any of these financial instruments which are not sold are classified as other current assets. The amount of these financial instruments that was collected before their maturity date and sold at a discount totaled $10 million and $6 million at December 31, 2011 and 2010, respectively. No negotiable financial instruments were held by our European subsidiary as of December 31, 2011 and 2010, respectively.
In certain instances, several of our Chinese subsidiaries receive payment from OE customers and satisfy vendor payments through the receipt and delivery of negotiable financial instruments. Financial instruments used to satisfy vendor payables and not redeemed totaled $14 million and $8 million at December 31, 2011 and 2010, respectively, and were classified as notes payable. Financial instruments received from OE customers and not redeemed totaled $9 million and $11 million at December 31, 2011 and 2010, respectively. We classify financial
110
TENNECO INC.
NOTES TO CONSOLIDATED FINANCIAL STATEMENTS - (Continued)
instruments received from our OE customers as other current assets if issued by a financial institution of our customers or as customer notes and accounts, net if issued by our customer. We classified $9 million and $11 million in other current assets at December 31, 2011 and 2010, respectively. Some of our Chinese subsidiaries that issue their own negotiable financial instruments to pay vendors are required to maintain a cash balance if they exceed certain credit limits with the financial institution that guarantees those financial instruments. A restricted cash balance was not required at those Chinese subsidiaries at December 31, 2011 and 2010, respectively.
The negotiable financial instruments received by one of our European subsidiaries and some of our Chinese subsidiaries are checks drawn by our OE customers and guaranteed by their banks that are payable at a future date. The use of these instruments for payment follows local commercial practice. Because negotiable financial instruments are financial obligations of our customers and are guaranteed by our customers' banks, we believe they represent a lower financial risk than the outstanding accounts receivable that they satisfy which are not guaranteed by a bank.
| 7. | Income Taxes |
The domestic and foreign components of our income before income taxes and noncontrolling interests are as follows:
| Year
Ended December 31, | ||||||||||||
| 2011 | 2010 | 2009 | ||||||||||
| (Millions) | ||||||||||||
U.S. income (loss) before income taxes | $ | 55 | $ | (45) | $ | (118 | ) | |||||
Foreign income before income taxes | 216 | 177 | 77 | |||||||||
|
|
|
|
|
| |||||||
Income (loss) before income taxes and noncontrolling interests | $ | 271 | $ | 132 | $ | (41 | ) | |||||
|
|
|
|
|
| |||||||
Following is a comparative analysis of the components of income tax expense:
| Year Ended December 31, | ||||||||||||
| 2011 | 2010 | 2009 | ||||||||||
| (Millions) | ||||||||||||
Current - | ||||||||||||
U.S. federal | $ | - | $ | - | $ | (2 | ) | |||||
State and local | 2 | 1 | 4 | |||||||||
Foreign | 91 | 64 | 35 | |||||||||
|
|
|
|
|
| |||||||
| 93 | 65 | 37 | ||||||||||
|
|
|
|
|
| |||||||
Deferred - | ||||||||||||
U.S. federal | - | - | (18 | ) | ||||||||
State and local | - | - | (3 | ) | ||||||||
Foreign | (5 | ) | 4 | (3 | ) | |||||||
|
|
|
|
|
| |||||||
| (5 | ) | 4 | (24 | ) | ||||||||
|
|
|
|
|
| |||||||
Income tax expense | $ | 88 | $ | 69 | $ | 13 | ||||||
|
|
|
|
|
| |||||||
111
TENNECO INC.
NOTES TO CONSOLIDATED FINANCIAL STATEMENTS - (Continued)
Following is a reconciliation of income taxes computed at the statutory U.S. federal income tax rate (35 percent for all years presented) to the income tax expense reflected in the statements of income (loss):
| Year Ended December 31, | ||||||||||||
| 2011 | 2010 | 2009 | ||||||||||
| (Millions) | ||||||||||||
Income tax expense (benefit) computed at the statutory U.S. federal income tax rate | $ | 95 | $ | 46 | $ | (14 | ) | |||||
Increases (reductions) in income tax expense resulting from: | ||||||||||||
Foreign income taxed at different rates | (14 | ) | (16 | ) | 14 | |||||||
Taxes on repatriation of dividends | 6 | 4 | 4 | |||||||||
State and local taxes on income, net of U.S. federal income tax benefit | 2 | 2 | 2 | |||||||||
Changes in valuation allowance for tax loss carryforwards and credits | (11 | ) | 16 | 5 | ||||||||
Foreign tax holidays | (4 | ) | (5 | ) | (3 | ) | ||||||
Investment and R&D tax credits | (4 | ) | (2 | ) | (5 | ) | ||||||
Foreign earnings subject to U.S. federal income tax | 6 | 5 | 3 | |||||||||
Adjustment of prior years taxes | - | 4 | - | |||||||||
Impact of foreign tax law changes | - | (1 | ) | 2 | ||||||||
Tax contingencies | 3 | 12 | 6 | |||||||||
Goodwill impairment | 3 | - | - | |||||||||
Other | 6 | 4 | (1 | ) | ||||||||
|
|
|
|
|
| |||||||
Income tax expense | $ | 88 | $ | 69 | $ | 13 | ||||||
|
|
|
|
|
| |||||||
The components of our net deferred tax assets were as follows:
| December 31, | ||||||||
| 2011 | 2010 | |||||||
| (Millions) | ||||||||
Deferred tax assets - | ||||||||
Tax loss carryforwards: | ||||||||
U.S. federal | $ | 41 | $ | 96 | ||||
State | 45 | 43 | ||||||
Foreign | 57 | 56 | ||||||
Investment tax credit benefits | 45 | 46 | ||||||
Postretirement benefits other than pensions | 54 | 52 | ||||||
Pensions | 79 | 55 | ||||||
Bad debts | 3 | 3 | ||||||
Sales allowances | 6 | 6 | ||||||
Payroll and other accruals | 98 | 93 | ||||||
Valuation allowance | (225 | ) | (247 | ) | ||||
|
|
|
| |||||
Total deferred tax assets | 203 | 203 | ||||||
|
|
|
| |||||
Deferred tax liabilities - | ||||||||
Tax over book depreciation | 65 | 82 | ||||||
Other | 62 | 54 | ||||||
|
|
|
| |||||
Total deferred tax liabilities | 127 | 136 | ||||||
|
|
|
| |||||
Net deferred tax assets | $ | 76 | $ | 67 | ||||
|
|
|
| |||||
Certain amounts in the 2010 presentation were reclassified to conform to the current year presentation.
112
TENNECO INC.
NOTES TO CONSOLIDATED FINANCIAL STATEMENTS - (Continued)
U.S. and state tax loss carryforwards have been presented net of uncertain tax positions, that if realized, would reduce tax loss carryforwards in 2011 and 2010 by $53 million and $9 million, respectively.
Following is a reconciliation of deferred taxes to the deferred taxes shown in the balance sheet:
| December 31, | ||||||||
| 2011 | 2010 | |||||||
| (Millions) | ||||||||
Balance Sheet: | ||||||||
Current portion - deferred tax asset | $ | 40 | $ | 38 | ||||
Non-current portion - deferred tax asset | 92 | 92 | ||||||
Current portion - deferred tax liability shown in other current liabilities | (5 | ) | (7 | ) | ||||
Non-current portion - deferred tax liability | (51 | ) | (56 | ) | ||||
|
|
|
| |||||
Net deferred tax assets | $ | 76 | $ | 67 | ||||
|
|
|
| |||||
As a result of the valuation allowances recorded for $225 million and $247 million at December 31, 2011 and 2010, respectively, we have potential tax assets that were not recognized on our balance sheet. These unrecognized tax assets resulted primarily from U.S. tax loss carryforwards, foreign tax loss carryforwards, foreign investment tax credits and U.S. state net operating losses that are available to reduce future U.S., U.S. state and foreign tax liabilities.
We reported income tax expense of $88 million, $69 million and $13 million in the years ending 2011, 2010 and 2009, respectively. The tax expense recorded in 2011 differs from the expense that would be recorded using a U.S. Federal statutory rate of 35 percent due to a net tax benefit of $7 million primarily related to U.S. taxable income with no associated tax expense due to our net operating loss ("NOL") carryforward and income generated in lower tax rate jurisdictions, partially offset by the impact of recording a valuation allowance against the tax benefit for losses in certain foreign jurisdictions and taxes on repatriation of foreign earnings.
We evaluate our deferred income taxes quarterly to determine if valuation allowances are required or should be adjusted. U.S. GAAP requires that companies assess whether valuation allowances should be established against their deferred tax assets based on consideration of all available evidence, both positive and negative, using a "more likely than not" standard. This assessment considers, among other matters, the nature, frequency and amount of recent losses, the duration of statutory carryforward periods, and tax planning strategies. In making such judgments, significant weight is given to evidence that can be objectively verified.
Valuation allowances have been established for deferred tax assets based on a "more likely than not" threshold. The ability to realize deferred tax assets depends on our ability to generate sufficient taxable income within the carryforward periods provided for in the tax law for each tax jurisdiction. We have considered the following possible sources of taxable income when assessing the realization of our deferred tax assets:
| • | Future reversals of existing taxable temporary differences; |
| • | Taxable income or loss, based on recent results, exclusive of reversing temporary differences and carryforwards; |
| • | Tax-planning strategies; and |
| • | Taxable income in prior carryback years if carryback is permitted under the relevant tax law. |
In 2008, given our historical losses in the U.S., we concluded that our ability to fully utilize our NOLs was limited, as we were required to project the continuation of the negative economic environment at that time and the impact of the negative operating environment on our tax planning strategies. As a result, we recorded a valuation allowance against all of our U.S. deferred tax assets except for our tax planning strategies which have
113
TENNECO INC.
NOTES TO CONSOLIDATED FINANCIAL STATEMENTS - (Continued)
not yet been implemented and which do not depend upon generating future taxable income. We carry deferred tax assets in the U.S. of $90 million, as of December 31, 2011, relating to the expected utilization of those NOLs. The recording of a valuation allowance does not impact the amount of the NOL that would be available for federal and state income tax purposes in future periods. The federal NOLs expire beginning in tax years ending in 2021 through 2029. The state NOLs expire in various tax years through 2029.
If our operating performance continues to improve on a sustained basis, our conclusion regarding the need for a U.S. valuation allowance could change, resulting in the reversal of some or all of the valuation allowance in the future. The charge to establish the U.S. valuation allowance also includes items related to the losses allocable to certain state jurisdictions where it was determined that tax attributes related to those jurisdictions were potentially not realizable. In addition, the charge to establish the U.S. valuation allowance eliminated the need for certain tax reserves which would need to be recorded if the valuation allowance was reversed. If we were to reverse our U.S. valuation allowance as of December 31, 2011, the impact on earnings would approximate $147 million.
In prior years, we recorded a valuation allowance against deferred tax assets generated by taxable losses in the U.S. as well as certain other foreign jurisdictions. Our provision for income taxes will include no tax benefit with respect to losses incurred and no tax expense with respect to income generated in these jurisdictions until the respective valuation allowance is eliminated. In certain foreign jurisdictions, we have recorded a tax benefit on NOLs and tax credits with unlimited lives that are supported by tax actions and forecasted profitability. If the tax actions are not successful or losses are incurred, we may need to record a valuation allowance in a future period. We have recorded net deferred tax assets of approximately $23 million in these jurisdictions as of December 31, 2011. These actions will cause variability in our effective tax rate.
We do not provide for U.S. income taxes on unremitted earnings of foreign subsidiaries, except for the earnings of certain of our China operations, as our present intention is to reinvest the unremitted earnings in our foreign operations. Unremitted earnings of foreign subsidiaries were approximately $698 million at December 31, 2011. We estimated that the amount of U.S. and foreign income taxes that would be accrued or paid upon remittance of the assets that represent those unremitted earnings was $269 million.
We have tax sharing agreements with our former affiliates that allocate tax liabilities for prior periods and establish indemnity rights on certain tax issues.
U.S. GAAP provides that a tax benefit from an uncertain tax position may be recognized when it is "more likely than not" that the position will be sustained upon examination, including resolutions of any related appeals or litigation processes, based on the technical merits.
A reconciliation of our uncertain tax positions is as follows:
| 2011 | 2010 | 2009 | ||||||||||
| (Millions) | ||||||||||||
Uncertain tax positions - | ||||||||||||
Balance January 1 | $ | 111 | $ | 96 | $ | 83 | ||||||
Gross increases in tax positions in current period | 19 | 23 | 17 | |||||||||
Gross increases in tax positions in prior period | 3 | 4 | 16 | |||||||||
Gross decreases in tax positions in prior period | (10 | ) | (6 | ) | - | |||||||
Gross decreases - settlements | - | (2 | ) | (17 | ) | |||||||
Gross decreases - statute of limitations expired | (4 | ) | (4 | ) | (3 | ) | ||||||
|
|
|
|
|
| |||||||
Balance December 31 | $ | 119 | $ | 111 | $ | 96 | ||||||
|
|
|
|
|
| |||||||
114
TENNECO INC.
NOTES TO CONSOLIDATED FINANCIAL STATEMENTS - (Continued)
Included in the balance of uncertain tax positions were $36 million at both December 31, 2011 and 2010, and $28 million in 2009, of tax benefits, that if recognized, would affect the effective tax rate. We recognize accrued interest and penalties related to unrecognized tax benefits as income tax expense. Related to the uncertain tax positions noted above, we accrued penalties of $2 million in 2009. No penalties were accrued in 2011 and 2010. Additionally, we accrued interest related to uncertain tax positions of $2 million in 2011, less than one million in 2010, and zero in 2009. Our liability for penalties was $2 million at December 31, 2011 and $3 million at both December 31, 2010 and 2009, respectively, and our liability for interest was $7 million, $5 million and $4 million at December 31, 2011, 2010 and 2009, respectively.
Our uncertain tax position at December 31, 2011 and 2010 included foreign exposures relating to the disallowance of deductions, global transfer pricing and various other issues. We believe it is reasonably possible that a decrease of up to $4 million in unrecognized tax benefits related to the expiration of foreign statute of limitations and the conclusion of foreign income tax examinations may occur within the coming year.
We are subject to taxation in the U.S. and various state and foreign jurisdictions. As of December 31, 2011, our tax years open to examination in primary jurisdictions are as follows:
| Open To
Tax Year | ||||
United States - due to NOL | 1998 | |||
Spain | 2003 | |||
Germany | 2006 | |||
Canada | 2007 | |||
Belgium | 2009 | |||
United Kingdom | 2010 | |||
| 8. | Common Stock |
We have authorized 135 million shares ($0.01 par value) of common stock, of which 62,101,335 shares and 61,541,760 shares were issued at December 31, 2011 and 2010, respectively. We held 1,694,692 and 1,294,692 shares of treasury stock at December 31, 2011 and 2010, respectively.
Equity Plans - In December 1996, we adopted the 1996 Stock Ownership Plan, which permitted the granting of a variety of awards, including common stock, restricted stock, performance units, stock equivalent units, stock appreciation rights ("SARs") and stock options to our directors, officers, employees and consultants. The 1996 plan, which terminated as to new awards on December 31, 2001, was renamed the "Stock Ownership Plan." In December 1999, we adopted the Supplemental Stock Ownership Plan, which permitted the granting of a variety of similar awards to our directors, officers, employees and consultants. We were authorized to deliver up to about 1.1 million treasury shares of common stock under the Supplemental Stock Ownership Plan, which also terminated as to new awards on December 31, 2001. In March 2002, we adopted the 2002 Long-Term Incentive Plan which permitted the granting of a variety of similar awards to our officers, directors, employees and consultants. Up to 4 million shares of our common stock were authorized for delivery under the 2002 Long-Term Incentive Plan. In March 2006, we adopted the 2006 Long-Term Incentive Plan which replaced the 2002 Long-Term Incentive Plan and permits the granting of a variety of similar awards to directors, officers, employees and consultants. On May 13, 2009, our stockholders approved an amendment to the Tenneco Inc. 2006 Long-Term Incentive Plan to increase the shares of common stock available thereunder by 2.3 million. Each share underlying an award generally counts as one share against the total plan availability. Each share underlying a full value award (e.g. restricted stock), however, counts as 1.25 shares against the total plan availability. As of December 31, 2011, up to 1,569,025 shares of our common stock remain authorized for delivery under the 2006 Long-Term Incentive Plan. Our nonqualified stock options have seven to 20 year terms and vest equally over a three-year service period from the date of the grant.
115
TENNECO INC.
NOTES TO CONSOLIDATED FINANCIAL STATEMENTS - (Continued)
We have granted restricted common stock and stock options to our directors and certain key employees and restricted stock units, payable in cash, to certain key employees. These awards generally require, among other things, that the award holder remain in service to our company during the restriction period, which is currently three years, with a portion of the award vesting equally each year. We also have granted stock equivalent units and long-term performance units to certain key employees that are payable in cash. At December 31, 2011, the long-term performance units outstanding included a three-year grant for 2010-2012 ("the 2010 Grant") payable in the first quarter of 2013 and a three-year grant for 2011-2013 ("the 2011 Grant") payable in the first quarter of 2014. Payment is based on the attainment of specified performance goals. Grant value is based on stock price, cumulative EBITDA and free cashflow metrics. In addition, we have granted SARs to certain key employees in our Asian and Indian operations that are payable in cash after a three-year service period. The grant value is indexed to the stock price.
In November 2009, we successfully completed the public offering of 12 million shares of common stock at a price of $16.50 per share. We received $198 million in gross proceeds and approximately $188 million in net proceeds, after expenses from the sales of our common stock. We used the proceeds to repay outstanding borrowings under our revolving credit facility and for general corporate purposes.
Accounting Methods - We have recorded compensation expense of $3 million in each of the three years ended December 31, 2011, 2010 and 2009, respectively, related to nonqualified stock options as part of our selling, general and administrative expense. This resulted in a decrease in basic and diluted earnings per share of $0.05 in both 2011 and 2010, and $0.06 in 2009.
We immediately expense stock options and restricted stock awarded to employees who are eligible to retire. When employees become eligible to retire during the vesting period, we recognize the remaining expense associated with their stock options and restricted stock.
As of December 31, 2011, there was approximately $5 million of unrecognized compensation costs related to our stock options awards that we expect to recognize over a weighted average period of 0.7 years.
Compensation expense for restricted stock, restricted stock units, long-term performance units and SARs was $11 million, $14 million and $5 million for each of the years ended 2011, 2010 and 2009, respectively, and was recorded in selling, general, and administrative expense on the consolidated statements of income (loss).
Cash received from stock option exercises was $6 million in both 2011 and 2010, and $1 million in 2009. Stock option exercises would have generated an excess tax benefit of $4 million in both 2011 and 2010, and $1 million in 2009. We did not record the excess tax benefit as we have federal and state net operating losses which are not currently being utilized.
Assumptions - We calculated the fair values of stock option awards using the Black-Scholes option pricing model with the weighted average assumptions listed below. The fair value of share-based awards is determined at the time the awards are granted which is generally in January of each year, and requires judgment in estimating employee and market behavior.
| Year Ended December 31, | ||||||||||||
| 2011 | 2010 | 2009 | ||||||||||
Stock Options Granted | ||||||||||||
Weighted average grant date fair value, per share | $ | 26.13 | $ | 11.76 | $ | 1.34 | ||||||
Weighted average assumptions used: | ||||||||||||
Expected volatility | 70.1 | % | 75.4 | % | 82.6 | % | ||||||
Expected lives | 4.8 | 4.6 | 4.5 | |||||||||
Risk-free interest rates | 1.8 | % | 2.2 | % | 1.48 | % | ||||||
Dividends yields | 0.00 | % | 0.00 | % | 0.00 | % | ||||||
116
TENNECO INC.
NOTES TO CONSOLIDATED FINANCIAL STATEMENTS - (Continued)
Expected volatility is calculated based on current implied volatility and historical realized volatility for the Company.
Expected lives of options are based upon the historical and expected time to post-vesting forfeiture and exercise. We believe this method is the best estimate of the future exercise patterns currently available.
The risk-free interest rates are based upon the Constant Maturity Rates provided by the U.S. Treasury. For our valuations, we used the continuous rate with a term equal to the expected life of the options.
Stock Options - The following table reflects the status and activity for all options to purchase common stock for the period indicated:
| Year Ended December 31, 2011 | ||||||||||||||||
| Shares Under Option | Weighted
Avg. Exercise Prices | Weighted
Avg. Remaining Life in Years | Aggregate Intrinsic Value | |||||||||||||
| (Millions) | ||||||||||||||||
Outstanding Stock Options | ||||||||||||||||
Outstanding, January 1, 2011 | 3,168,474 | $ | 14.27 | 4.3 | $ | 68 | ||||||||||
Granted | 201,133 | 45.42 | ||||||||||||||
Expired | (56,046 | ) | 3.66 | |||||||||||||
Forfeited | (13,184 | ) | 9.36 | |||||||||||||
Exercised | (125,624 | ) | 17.10 | 3 | ||||||||||||
|
| |||||||||||||||
Outstanding, March 31, 2011 | 3,174,753 | $ | 16.34 | 4.4 | $ | 80 | ||||||||||
Granted | 2,711 | 43.51 | ||||||||||||||
Forfeited | (23,841 | ) | 14.26 | |||||||||||||
Exercised | (82,166 | ) | 11.50 | 3 | ||||||||||||
|
| |||||||||||||||
Outstanding, June 30, 2011 | 3,071,457 | $ | 16.51 | 4.2 | $ | 76 | ||||||||||
Granted | 1,649 | 44.02 | ||||||||||||||
Forfeited | (450 | ) | 4.03 | |||||||||||||
Exercised | (115,249 | ) | 8.94 | 3 | ||||||||||||
|
| |||||||||||||||
Outstanding, September 30, 2011 | 2,957,407 | $ | 16.83 | 4.0 | $ | 54 | ||||||||||
Granted | 173 | 24.97 | ||||||||||||||
Expired | (10,000 | ) | 1.57 | |||||||||||||
Forfeited | (17,716 | ) | 1.82 | |||||||||||||
Exercised | (186,665 | ) | 10.19 | 3 | ||||||||||||
|
| |||||||||||||||
Outstanding, December 31, 2011 | 2,743,199 | $ | 17.43 | 4.0 | $ | 37 | ||||||||||
|
| |||||||||||||||
Vested and Expected to Vest, December 31, 2011 | 2,700,577 | 17.17 | 4.0 | $ | 37 | |||||||||||
|
| |||||||||||||||
Exercisable, December 31, 2011 | 2,164,226 | $ | 15.95 | 3.9 | $ | 30 | ||||||||||
|
| |||||||||||||||
The weighted average grant-date fair value of options granted during the years 2011, 2010 and 2009 was $45.37, $11.84 and $1.34, respectively. The total intrinsic value of options exercised during the years ended December 31, 2011, 2010 and 2009 was $13 million, $10 million and $4 million, respectively. The total fair value of shares vested was $3 million in both 2011 and 2010, and $4 million in 2009.
117
TENNECO INC.
NOTES TO CONSOLIDATED FINANCIAL STATEMENTS - (Continued)
Restricted Stock - The following table reflects the status for all nonvested restricted shares for the period indicated:
| Year Ended December 31, 2011 | ||||||||
| Shares | Weighted Avg. Grant Date Fair Value | |||||||
Nonvested Restricted Shares | ||||||||
Nonvested balance at January 1, 2011 | 558,198 | $ | 11.58 | |||||
Granted | 141,036 | 45.42 | ||||||
Vested | (268,891 | ) | 12.00 | |||||
Forfeited | (4,822 | ) | 13.74 | |||||
|
| |||||||
Nonvested balance at March 31, 2011 | 425,521 | $ | 22.51 | |||||
Granted | 1,381 | 43.51 | ||||||
Vested | (3,851 | ) | 15.47 | |||||
Forfeited | (7,190 | ) | 23.82 | |||||
|
| |||||||
Nonvested balance at June 30, 2011 | 415,861 | $ | 22.62 | |||||
Granted | 1,042 | 44.02 | ||||||
Vested | (3,206 | ) | 15.41 | |||||
Forfeited | (158 | ) | 1.86 | |||||
|
| |||||||
Nonvested balance at September 30, 2011 | 413,539 | $ | 22.74 | |||||
Granted | 109 | 24.97 | ||||||
Vested | (5,735 | ) | 29.92 | |||||
Forfeited | (162 | ) | 1.87 | |||||
|
| |||||||
Nonvested balance at December 31, 2011 | 407,751 | $ | 22.64 | |||||
|
| |||||||
The fair value of restricted stock grants is equal to the average market price of our stock at the date of grant. As of December 31, 2011, approximately $5 million of total unrecognized compensation costs related to restricted stock awards is expected to be recognized over a weighted-average period of approximately 1.8 years.
The weighted average grant-date fair value of restricted stock granted during the years 2011, 2010 and 2009 was $45.38, $19.60 and $2.02, respectively. The total fair value of restricted shares vested was $3 million in 2011 and $2 million in both 2010 and 2009.
Share Repurchase Program - In May 2011, our Board of Directors approved a share repurchase program, authorizing our company to repurchase up to 400,000 shares of our outstanding common stock over a 12 month period. This share repurchase program was intended to offset dilution from shares of restricted stock and stock options that were issued in 2011 to employees. We purchased all of the 400,000 shares through open market purchases, which were funded through cash from operations, as of August 3, 2011 at a total cost of $16 million through this program. These repurchased shares are held as part of our treasury stock which increased to 1,694,692 shares at December 31, 2011 from 1,294,692 shares at December 31, 2010.
In January 2012, our Board of Directors approved a share repurchase program, authorizing our company to repurchase up to 600,000 shares of the Company's outstanding common stock over a 12 month period. This share repurchase program is intended to offset dilution from shares of restricted stock and stock options issued in 2012 to employees.
118
TENNECO INC.
NOTES TO CONSOLIDATED FINANCIAL STATEMENTS - (Continued)
Long-Term Performance Units, Restricted Stock Units and SARs - Long-term performance units, restricted stock units, and SARs are paid in cash and recognized as a liability based upon their fair value. As of December 31, 2011, $7 million of total unrecognized compensation costs is expected to be recognized over a weighted-average period of approximately 1.2 years.
| 9. | Preferred Stock |
We had 50 million shares of preferred stock ($0.01 par value) authorized at December 31, 2011 and 2010, respectively. No shares of preferred stock were outstanding at those dates.
| 10. | Pension Plans, Postretirement and Other Employee Benefits |
Pension benefits are based on years of service and, for most salaried employees, on average compensation. Our funding policy is to contribute to the plans amounts necessary to satisfy the funding requirement of applicable federal or foreign laws and regulations. Of our $784 million benefit obligation at December 31, 2011, approximately $710 million required funding under applicable federal and foreign laws. At December 31, 2011, we had approximately $529 million in assets to fund that obligation. The balance of our benefit obligation, $74 million, did not require funding under applicable federal or foreign laws and regulations. Pension plan assets were invested in the following classes of securities:
| Percentage of Fair Market Value | ||||||||||||||||
| December 31, 2011 | December 31, 2010 | |||||||||||||||
| US | Foreign | US | Foreign | |||||||||||||
Equity Securities | 70 | % | 53 | % | 71 | % | 57 | % | ||||||||
Debt Securities | 29 | % | 40 | % | 28 | % | 36 | % | ||||||||
Real Estate | - | 2 | % | - | 2 | % | ||||||||||
Other | 1 | % | 5 | % | 1 | % | 5 | % | ||||||||
The assets of some of our pension plans are invested in trusts that permit commingling of the assets of more than one employee benefit plan for investment and administrative purposes. Each of the plans participating in the trust has interests in the net assets of the underlying investment pools of the trusts. The investments for all our pension plans are recorded at estimated fair value, in compliance with the accounting guidance on fair value measurement.
119
TENNECO INC.
NOTES TO CONSOLIDATED FINANCIAL STATEMENTS - (Continued)
The following table presents our plan assets using the fair value hierarchy as of December 31, 2011 and 2010, respectively. The fair value hierarchy has three levels based on the methods used to determine the fair value. Level 1 assets refer to those asset values based on quoted market prices in active markets for identical assets at the measurement date. Level 2 assets refer to assets with values determined using significant other observable inputs, and Level 3 assets include values determined with non-observable inputs.
| Fair Value Level as of December 31, 2011 | ||||||||||||||||||||||||
| US | Foreign | |||||||||||||||||||||||
Asset Category | Level 1 | Level 2 | Level 3 | Level 1 | Level 2 | Level 3 | ||||||||||||||||||
| (Millions) | ||||||||||||||||||||||||
Equity securities: | ||||||||||||||||||||||||
U.S. large cap | $ | 24 | $ | 102 | $ | - | $ | 23 | $ | 9 | $ | - | ||||||||||||
U.S. mid cap | - | - | - | - | 2 | - | ||||||||||||||||||
U.S. Small Cap | - | 18 | - | - | 1 | - | ||||||||||||||||||
Non-U.S. large cap | - | - | - | 26 | 63 | - | ||||||||||||||||||
Non-U.S. mid cap | - | 17 | - | 3 | 19 | - | ||||||||||||||||||
Non-U.S. small cap | - | - | - | - | 5 | - | ||||||||||||||||||
Emerging markets | - | 5 | - | 1 | - | - | ||||||||||||||||||
Debt securities: | ||||||||||||||||||||||||
U.S. corporate bonds | - | 4 | - | - | - | - | ||||||||||||||||||
U.S. other fixed income | - | 67 | - | - | - | - | ||||||||||||||||||
Non-U.S. treasuries/government bonds | - | - | - | 37 | 35 | - | ||||||||||||||||||
Non-U.S. corporate bonds | - | - | - | 17 | 20 | - | ||||||||||||||||||
Non-U.S. mortgage backed securities | - | - | - | - | 3 | - | ||||||||||||||||||
Non-U.S. municipal obligations | - | - | - | 1 | - | - | ||||||||||||||||||
Non-U.S. asset backed securities | - | - | - | - | 3 | - | ||||||||||||||||||
Non-U.S. other fixed income | - | - | - | - | 1 | - | ||||||||||||||||||
Real Estate: | ||||||||||||||||||||||||
Non-U.S. real estate | - | - | - | - | 5 | - | ||||||||||||||||||
Other: | ||||||||||||||||||||||||
Insurance contracts | - | - | - | - | 7 | 6 | ||||||||||||||||||
Cash held in bank accounts | 2 | - | - | 3 | - | - | ||||||||||||||||||
|
|
|
|
|
|
|
|
|
|
|
| |||||||||||||
Total | $ | 26 | $ | 213 | $ | - | $ | 111 | $ | 173 | $ | 6 | ||||||||||||
|
|
|
|
|
|
|
|
|
|
|
| |||||||||||||
120
TENNECO INC.
NOTES TO CONSOLIDATED FINANCIAL STATEMENTS - (Continued)
| Fair Value Level as of December 31, 2010 | ||||||||||||||||||||||||
| US | Foreign | |||||||||||||||||||||||
Asset Category | Level 1 | Level 2 | Level 3 | Level 1 | Level 2 | Level 3 | ||||||||||||||||||
| (Millions) | ||||||||||||||||||||||||
Equity securities: | ||||||||||||||||||||||||
U.S. large cap | $ | 33 | $ | 96 | $ | - | $ | 25 | $ | 7 | $ | - | ||||||||||||
U.S. mid cap | - | - | - | - | 1 | - | ||||||||||||||||||
U.S. Small Cap | - | 18 | - | - | 1 | - | ||||||||||||||||||
Non-U.S. large cap | - | 18 | - | 36 | 65 | - | ||||||||||||||||||
Non-U.S. mid cap | - | - | - | - | 19 | - | ||||||||||||||||||
Non-U.S. small cap | - | - | - | - | 8 | - | ||||||||||||||||||
Emerging markets | - | 6 | - | 1 | - | - | ||||||||||||||||||
Debt securities: | ||||||||||||||||||||||||
U.S. treasuries/government bonds | 20 | - | - | - | - | - | ||||||||||||||||||
U.S. corporate bonds | - | 20 | - | - | - | - | ||||||||||||||||||
U.S. mortgage backed securities | - | 24 | - | - | - | - | ||||||||||||||||||
U.S. asset backed securities | - | 1 | - | - | - | - | ||||||||||||||||||
U.S. other fixed income | - | 4 | - | - | - | - | ||||||||||||||||||
Non-U.S. treasuries/government bonds | - | 1 | - | 59 | 5 | - | ||||||||||||||||||
Non-U.S. corporate bonds | - | 1 | - | 15 | 21 | - | ||||||||||||||||||
Non-U.S. other fixed income | - | - | - | - | - | 6 | ||||||||||||||||||
Real Estate: | ||||||||||||||||||||||||
Non-U.S. real estate | - | - | - | - | 5 | - | ||||||||||||||||||
Other: | ||||||||||||||||||||||||
Insurance contracts | - | - | - | - | 7 | - | ||||||||||||||||||
Cash held in bank accounts | - | - | - | 6 | - | - | ||||||||||||||||||
|
|
|
|
|
|
|
|
|
|
|
| |||||||||||||
Total | $ | 53 | $ | 189 | $ | - | $ | 142 | $ | 139 | $ | 6 | ||||||||||||
|
|
|
|
|
|
|
|
|
|
|
| |||||||||||||
Level 1 assets were valued using market prices based on daily net asset value (NAV) or prices available daily through a public stock exchange. Level 2 assets were valued primarily using market prices, sometimes net of estimated realization expenses, and based on broker/dealer markets or in commingled funds where NAV is not available daily or publicly. For insurance contracts, the estimated surrender value of the policy was used to estimate fair market value. Level 3 assets in the Netherlands were valued using an industry standard model based on certain assumptions such as the U-return and estimated technical reserve.
The table below summarizes the changes in the fair value of the Level 3 assets:
| December 31, 2011 | December 31, 2010 | |||||||||||||||
| Level 3 Assets | Level 3 Assets | |||||||||||||||
| US | Foreign | US | Foreign | |||||||||||||
| (Millions) | (Millions) | |||||||||||||||
Balance at December 31 of the previous year | $ | - | $ | 6 | $ | - | $ | 6 | ||||||||
Actual return on plan assets: | ||||||||||||||||
Relating to assets still held at the reporting date | - | - | - | - | ||||||||||||
Ending Balance at December 31 | $ | - | $ | 6 | $ | - | $ | 6 | ||||||||
|
|
|
|
|
|
|
| |||||||||
121
TENNECO INC.
NOTES TO CONSOLIDATED FINANCIAL STATEMENTS - (Continued)
The following table contains information about significant concentrations of risk, including all individual assets that make up more than 5% of the total assets and any direct investments in Tenneco stock:
Asset Category | Fair Value Level | Value | Percentage of Total Assets | |||||||||
| (Millions) | ||||||||||||
2011: | ||||||||||||
Tenneco Stock | 1 | $ | 24 | 4.6 | % | |||||||
2010: | ||||||||||||
Tenneco Stock | 1 | $ | 34 | 6.3 | % | |||||||
Our investment policy for both our domestic and foreign plans is to invest more heavily in equity securities than debt securities. Targeted pension plan allocations are 70 percent in equity securities and 30 percent in debt securities, with acceptable tolerance levels of plus or minus five percent within each category for our domestic plans. Our foreign plans are individually managed to different target levels depending on the investing environment in each country.
Our approach to determining expected return on plan asset assumptions evaluates both historical returns as well as estimates of future returns, and adjusts for any expected changes in the long-term outlook for the equity and fixed income markets for both our domestic and foreign plans.
122
TENNECO INC.
NOTES TO CONSOLIDATED FINANCIAL STATEMENTS - (Continued)
A summary of the change in benefit obligation, the change in plan assets, the development of net amount recognized, and the amounts recognized in the balance sheets for the pension plans and postretirement benefit plan follows:
| Pension | Postretirement | |||||||||||||||||||||||
| 2011 | 2010 | 2011 | 2010 | |||||||||||||||||||||
| US | Foreign | US | Foreign | US | US | |||||||||||||||||||
| (Millions) | ||||||||||||||||||||||||
Change in benefit obligation: | ||||||||||||||||||||||||
Benefit obligation at December 31 of the previous year | $ | 354 | $ | 361 | $ | 341 | $ | 333 | $ | 135 | $ | 142 | ||||||||||||
Currency rate conversion | - | (6 | ) | - | (3 | ) | - | - | ||||||||||||||||
Settlement | - | (4 | ) | - | (2 | ) | - | - | ||||||||||||||||
Service cost | 1 | 6 | 1 | 5 | 1 | 1 | ||||||||||||||||||
Interest cost | 20 | 19 | 20 | 19 | 7 | 8 | ||||||||||||||||||
Administrative expenses/taxes paid | - | (1 | ) | - | (1 | ) | - | - | ||||||||||||||||
Plan amendments | - | - | - | 1 | - | - | ||||||||||||||||||
Actuarial (gain)/loss | 56 | 8 | 22 | 21 | 5 | (7 | ) | |||||||||||||||||
Benefits paid | (17 | ) | (15 | ) | (30 | ) | (15 | ) | (8 | ) | (9 | ) | ||||||||||||
Participants' contributions | - | 2 | - | 3 | - | - | ||||||||||||||||||
|
|
|
|
|
|
|
|
|
|
|
| |||||||||||||
Benefit obligation at December 31 | $ | 414 | $ | 370 | $ | 354 | $ | 361 | $ | 140 | $ | 135 | ||||||||||||
Change in plan assets: | ||||||||||||||||||||||||
Fair value at December 31 of the previous year | $ | 242 | $ | 287 | $ | 199 | $ | 262 | $ | - | $ | - | ||||||||||||
Currency rate conversion | - | (4 | ) | - | (1 | ) | - | - | ||||||||||||||||
Settlement | - | (4 | ) | - | (2 | ) | - | - | ||||||||||||||||
Actual return on plan assets | (7 | ) | - | 40 | 20 | - | - | |||||||||||||||||
Employer contributions | 21 | 24 | 33 | 20 | 9 | 9 | ||||||||||||||||||
Prescription drug subsidy received | - | - | - | - | (1 | ) | - | |||||||||||||||||
Participants' contributions | - | 2 | - | 3 | - | - | ||||||||||||||||||
Benefits paid | (17 | ) | (15 | ) | (30 | ) | (15 | ) | (8 | ) | (9 | ) | ||||||||||||
|
|
|
|
|
|
|
|
|
|
|
| |||||||||||||
Fair value at December 31 | $ | 239 | $ | 290 | $ | 242 | $ | 287 | $ | - | $ | - | ||||||||||||
|
|
|
|
|
|
|
|
|
|
|
| |||||||||||||
Development of net amount recognized: | ||||||||||||||||||||||||
Unfunded status at December 31 | $ | (175 | ) | $ | (80 | ) | $ | (112 | ) | $ | (74 | ) | $ | (140 | ) | $ | (135 | ) | ||||||
Unrecognized cost: | ||||||||||||||||||||||||
Actuarial loss | 248 | 138 | 165 | 120 | 64 | 63 | ||||||||||||||||||
Prior service cost/(credit) | 1 | 9 | 2 | 11 | (29 | ) | (35 | ) | ||||||||||||||||
|
|
|
|
|
|
|
|
|
|
|
| |||||||||||||
Net amount recognized at December 31 | $ | 74 | $ | 67 | $ | 55 | $ | 57 | $ | (105 | ) | $ | (107 | ) | ||||||||||
|
|
|
|
|
|
|
|
|
|
|
| |||||||||||||
Amounts recognized in the balance sheets as of December 31 | ||||||||||||||||||||||||
Noncurrent assets | $ | - | $ | - | $ | - | $ | 1 | $ | - | $ | - | ||||||||||||
Current liabilities | (3 | ) | (2 | ) | (3 | ) | (3 | ) | (9 | ) | (10 | ) | ||||||||||||
Noncurrent liabilities | (172 | ) | (78 | ) | (109 | ) | (72 | ) | (131 | ) | (125 | ) | ||||||||||||
|
|
|
|
|
|
|
|
|
|
|
| |||||||||||||
Net amount recognized | $ | (175 | ) | $ | (80 | ) | $ | (112 | ) | $ | (74 | ) | $ | (140 | ) | $ | (135 | ) | ||||||
|
|
|
|
|
|
|
|
|
|
|
| |||||||||||||
123
TENNECO INC.
NOTES TO CONSOLIDATED FINANCIAL STATEMENTS - (Continued)
Assets of one plan may not be utilized to pay benefits of other plans. Additionally, the prepaid (accrued) pension cost has been recorded based upon certain actuarial estimates as described below. Those estimates are subject to revision in future periods given new facts or circumstances.
Net periodic pension costs (income) for the years 2011, 2010, and 2009, consist of the following components:
| 2011 | 2010 | 2009 | ||||||||||||||||||||||
| US | Foreign | US | Foreign | US | Foreign | |||||||||||||||||||
| (Millions) | ||||||||||||||||||||||||
Service cost - benefits earned during the year | $ | 1 | $ | 6 | $ | 1 | $ | 5 | $ | 1 | $ | 4 | ||||||||||||
Interest cost | 20 | 19 | 20 | 19 | 20 | 18 | ||||||||||||||||||
Expected return on plan assets | (23 | ) | (20 | ) | (21 | ) | (19 | ) | (22 | ) | (19 | ) | ||||||||||||
Curtailment loss | - | - | - | - | 1 | - | ||||||||||||||||||
Settlement loss | - | 1 | 6 | - | 2 | - | ||||||||||||||||||
Net amortization: | ||||||||||||||||||||||||
Actuarial loss | 4 | 5 | 3 | 3 | 2 | 2 | ||||||||||||||||||
Prior service cost | - | 2 | - | 2 | 1 | 2 | ||||||||||||||||||
|
|
|
|
|
|
|
|
|
|
|
| |||||||||||||
Net pension costs | $ | 2 | $ | 13 | $ | 9 | $ | 10 | $ | 5 | $ | 7 | ||||||||||||
|
|
|
|
|
|
|
|
|
|
|
| |||||||||||||
Amounts recognized in accumulated other comprehensive loss for pension benefits consist of the following components:
| 2011 | 2010 | |||||||||||||||
| US | Foreign | US | Foreign | |||||||||||||
| (Millions) | ||||||||||||||||
Net actuarial loss | $ | 248 | $ | 138 | $ | 165 | $ | 120 | ||||||||
Prior service cost | 1 | 9 | 2 | 11 | ||||||||||||
|
|
|
|
|
|
|
| |||||||||
| $ | 249 | $ | 147 | $ | 167 | $ | 131 | |||||||||
|
|
|
|
|
|
|
| |||||||||
In 2012, we expect to recognize the following amounts, which are currently reflected in accumulated other comprehensive loss, as components of net periodic benefit cost:
| 2012 | ||||||||
| US | Foreign | |||||||
| (Millions) | ||||||||
Net actuarial loss | $ | 6 | $ | 7 | ||||
Prior service cost | - | 1 | ||||||
|
|
|
| |||||
| $ | 6 | $ | 8 | |||||
|
|
|
| |||||
124
TENNECO INC.
NOTES TO CONSOLIDATED FINANCIAL STATEMENTS - (Continued)
The projected benefit obligation, accumulated benefit obligation and fair value of plan assets for all pension plans with accumulated benefit obligations in excess of plan assets at December 31, 2011 and 2010 were as follows:
| December 31, 2011 | December 31, 2010 | |||||||||||||||
| US | Foreign | US | Foreign | |||||||||||||
| (Millions) | ||||||||||||||||
Projected benefit obligation | $ | 414 | $ | 363 | $ | 354 | $ | 332 | ||||||||
Accumulated benefit obligation | 414 | 355 | 352 | 328 | ||||||||||||
Fair value of plan assets | 239 | 284 | 242 | 257 | ||||||||||||
The following estimated benefit payments are payable from the pension plans to participants:
Year | US | Foreign | ||||||
| (Millions) | ||||||||
2012 | $ | 19 | $ | 16 | ||||
2013 | 24 | 15 | ||||||
2014 | 22 | 16 | ||||||
2015 | 20 | 17 | ||||||
2016 | 20 | 18 | ||||||
2017-2021 | 122 | 100 | ||||||
The following assumptions were used in the accounting for the pension plans for the years of 2011, 2010, and 2009:
| 2011 | 2010 | |||||||||||||||
| US | Foreign | US | Foreign | |||||||||||||
Weighted-average assumptions used to determine benefit obligations | ||||||||||||||||
Discount rate | 4.8 | % | 4.9 | % | 5.6 | % | 5.4 | % | ||||||||
Rate of compensation increase | N/A | 3.5 | % | N/A | 3.5 | % | ||||||||||
| 2011 | 2010 | 2009 | ||||||||||||||||||||||
| US | Foreign | US | Foreign | US | Foreign | |||||||||||||||||||
Weighted-average assumptions used to determine net periodic benefit cost | ||||||||||||||||||||||||
Discount rate | 5.6 | % | 5.4 | % | 6.1 | % | 6.0 | % | 6.2 | % | 6.3 | % | ||||||||||||
Expected long-term return on plan assets | 8.3 | % | 6.4 | % | 8.3 | % | 6.9 | % | 8.8 | % | 7.3 | % | ||||||||||||
Rate of compensation increase | N/A | 3.5 | % | N/A | 3.5 | % | N/A | 3.1 | % | |||||||||||||||
We made contributions of $45 million to our pension plans during 2011. Based on current actuarial estimates, we believe we will be required to make contributions of $48 million to those plans during 2012. Pension contributions beyond 2012 will be required, but those amounts will vary based upon many factors, including the performance of our pension fund investments during 2012.
We have life insurance plans which provided benefit to a majority of our U.S. employees. We also have postretirement plans for our U.S. employees hired before January 1, 2001. The plans cover salaried employees retiring on or after attaining age 55 who have at least 10 years of service with us after attaining age 45. For hourly employees, the postretirement benefit plans generally cover employees who retire according to one of our
125
TENNECO INC.
NOTES TO CONSOLIDATED FINANCIAL STATEMENTS - (Continued)
hourly employee retirement plans. All of these benefits may be subject to deductibles, co-payment provisions and other limitations, and we have reserved the right to change these benefits. For those employees hired after January 1, 2001, we do not provide any postretirement benefits. Our postretirement healthcare and life insurance plans are not funded. The measurement date used to determine postretirement benefit obligations is December 31.
Net periodic postretirement benefit cost for the years 2011, 2010, and 2009, consists of the following components:
| 2011 | 2010 | 2009 | ||||||||||
| (Millions) | ||||||||||||
Service cost - benefits earned during the year | $ | 1 | $ | 1 | $ | 1 | ||||||
Interest on accumulated postretirement benefit obligation | 7 | 8 | 8 | |||||||||
Net amortization: | ||||||||||||
Actuarial loss | 4 | 4 | 5 | |||||||||
Prior service credit | (6 | ) | (6 | ) | (6 | ) | ||||||
|
|
|
|
|
| |||||||
Net periodic postretirement benefit cost | $ | 6 | $ | 7 | $ | 8 | ||||||
|
|
|
|
|
| |||||||
In 2012, we expect to recognize the following amounts, which are currently reflected in accumulated other comprehensive loss, as components of net periodic benefit cost:
| 2012 | ||||
| (Millions) | ||||
Net actuarial loss | $ | 5 | ||
Prior service credit | (6 | ) | ||
|
| |||
| $ | (1 | ) | ||
|
| |||
The following estimated postretirement benefit payments are payable from the plan to participants:
Year | Postretirement Benefits | ||||
| (Millions) | |||||
2012 | 9 | ||||
2013 | 10 | ||||
2014 | 10 | ||||
2015 | 10 | ||||
2016 | 10 | ||||
2017-2021 | 48 | ||||
126
TENNECO INC.
NOTES TO CONSOLIDATED FINANCIAL STATEMENTS - (Continued)
The following estimated subsidies under the Medicare Prescription Drug, Improvement, and Modernization Act are expected to be received:
Year | Postretirement Benefits | ||||
| (Millions) | |||||
2012 | 1 | ||||
2013 | 1 | ||||
2014 | 1 | ||||
2015 | 1 | ||||
2016 | 1 | ||||
2017-2021 | 4 | ||||
The weighted-average assumed health care cost trend rate used in determining the 2011 accumulated postretirement benefit obligation was 8.0 percent, declining to 4.5 percent by 2019. The health care cost trend rate was 7.5 percent for 2010 and 8.3 percent in 2009, declining to five percent over succeeding periods.
The following assumptions were used in the accounting for postretirement cost for the years of 2011, 2010 and 2009:
| 2011 | 2010 | |||||||
Weighted-average assumptions used to determine benefit obligations | ||||||||
Discount rate | 4.8 | % | 5.6 | % | ||||
Rate of compensation increase | N/A | N/A | ||||||
| 2011 | 2010 | 2009 | ||||||||||
Weighted-average assumptions used to determine net periodic benefit cost | ||||||||||||
Discount rate | 5.6 | % | 6.1 | % | 6.2 | % | ||||||
Rate of compensation increase | N/A | N/A | 4.0 | % | ||||||||
A one-percentage-point increase in the 2011 assumed health care cost trend rates would increase total service and interest cost by less than $1 million and would increase the postretirement benefit obligation by $10 million. A one-percentage-point decrease in the 2011 assumed health care cost trend rates would decrease the total service and interest cost by less than $1 million and decrease the postretirement benefit obligation by $8 million.
Based on current actuarial estimates, we believe we will be required to make postretirement contributions of approximately $9 million during 2012.
We have established Employee Stock Ownership Plans for the benefit of U.S. employees. Under the plans, subject to limitations in the Internal Revenue Code, participants may elect to defer up to 75 percent of their salary through contributions to the plan, which are invested in selected mutual funds or used to buy our common stock. We match in cash 50 percent of each employee's contribution up to eight percent of the employee's salary. In 2009, we temporarily discontinued these matching contributions, as a result of the global economic downturn that began in 2008. We restored the matching contributions to salaried and non-union hourly U.S. employees beginning on January 1, 2010. In connection with freezing the defined benefit pension plans for nearly all U.S. based salaried and non-union hourly employees effective December 31, 2006, and the related replacement of those defined benefit plans with defined contribution plans, we are making additional contributions to the Employee Stock Ownership Plans. We recorded expense for these contributions of approximately $18 million, $17 million, and $10 million in 2011, 2010 and 2009, respectively. Matching contributions vest immediately. Defined benefit replacement contributions fully vest on the employee's third anniversary of employment.
127
TENNECO INC.
NOTES TO CONSOLIDATED FINANCIAL STATEMENTS - (Continued)
Effective January 1, 2012, the Tenneco Employee Stock Ownership Plan for Hourly Employees and the Tenneco Employee Stock Ownership Plan for Salaried Employees were merged into one plan called the Tenneco 401(k) Retirement Savings Plan (the "Retirement Savings Plan"). The Retirement Savings Plan has been designed to adopt a Safe-Harbor approach approved by the Internal Revenue Service and which will provide for increased company matching contributions at lower percentages of employee deferrals. The company matching contribution will increase from 50 percent on the first eight percent of employee contributions to 100 percent on the first three percent and 50 percent on the next two percent of employee contributions.
| 11. | Segment and Geographic Area Information |
We are a global manufacturer with three geographic reportable segments: (1) North America, (2) Europe, South America and India ("Europe"), and (3) Asia Pacific. Each segment manufactures and distributes ride control and emission control products primarily for the automotive industry. We have not aggregated individual operating segments within these reportable segments. We evaluate segment performance based primarily on earnings before interest expense, income taxes, and noncontrolling interests. Products are transferred between segments and geographic areas on a basis intended to reflect as nearly as possible the "market value" of the products.
128
TENNECO INC.
NOTES TO CONSOLIDATED FINANCIAL STATEMENTS - (Continued)
Segment results for 2011, 2010, and 2009 are as follows:
| Segment | ||||||||||||||||||||
| North America | Europe | Asia Pacific | Reclass & Elims | Consolidated | ||||||||||||||||
| (Millions) | ||||||||||||||||||||
At December 31, 2011, and for the Year Then Ended | ||||||||||||||||||||
Revenues from external customers | $ | 3,414 | $ | 3,013 | $ | 778 | $ | - | $ | 7,205 | ||||||||||
Intersegment revenues | 12 | 156 | 26 | (194 | ) | - | ||||||||||||||
Interest income | - | 3 | 1 | - | 4 | |||||||||||||||
Depreciation and amortization of intangibles | 95 | 88 | 24 | - | 207 | |||||||||||||||
Earnings before interest expense, income taxes, and noncontrolling interests | 216 | 125 | 38 | - | 379 | |||||||||||||||
Total assets | 1,419 | 1,326 | 567 | 25 | 3,337 | |||||||||||||||
Equity in net assets of unconsolidated affiliates | - | 9 | - | - | 9 | |||||||||||||||
Expenditures for plant, property and equipment | 88 | 95 | 35 | - | 218 | |||||||||||||||
Noncash items other than depreciation and amortization | 6 | 12 | 11 | - | 29 | |||||||||||||||
At December 31, 2010, and for the Year Then Ended | ||||||||||||||||||||
Revenues from external customers | $ | 2,821 | $ | 2,446 | $ | 670 | $ | - | $ | 5,937 | ||||||||||
Intersegment revenues | 11 | 148 | 28 | (187 | ) | - | ||||||||||||||
Interest income | - | 3 | 1 | - | 4 | |||||||||||||||
Depreciation and amortization of intangibles | 109 | 86 | 21 | - | 216 | |||||||||||||||
Earnings before interest expense, income taxes, and noncontrolling interests | 155 | 76 | 50 | - | 281 | |||||||||||||||
Total assets | 1,281 | 1,337 | 525 | 24 | 3,167 | |||||||||||||||
Equity in net assets of unconsolidated affiliates | - | 9 | - | - | 9 | |||||||||||||||
Expenditures for plant, property and equipment | 59 | 66 | 29 | - | 154 | |||||||||||||||
Noncash items other than depreciation and amortization | 4 | 6 | - | - | 10 | |||||||||||||||
At December 31, 2009, and for the Year Then Ended | ||||||||||||||||||||
Revenues from external customers | $ | 2,092 | $ | 2,047 | $ | 510 | $ | - | $ | 4,649 | ||||||||||
Intersegment revenues | 7 | 162 | 15 | (184 | ) | - | ||||||||||||||
Interest income | - | 3 | 1 | - | 4 | |||||||||||||||
Depreciation and amortization of intangibles | 113 | 89 | 19 | - | 221 | |||||||||||||||
Earnings before interest expense, income taxes, and noncontrolling interests | 42 | 20 | 30 | - | 92 | |||||||||||||||
Total assets | 1,102 | 1,338 | 391 | 10 | 2,841 | |||||||||||||||
Equity in net assets of unconsolidated affiliates | - | 12 | - | - | 12 | |||||||||||||||
Expenditures for plant, property and equipment | 45 | 58 | 15 | - | 118 | |||||||||||||||
Noncash items other than depreciation and amortization | 8 | (1 | ) | 1 | - | 8 | ||||||||||||||
129
TENNECO INC.
NOTES TO CONSOLIDATED FINANCIAL STATEMENTS - (Continued)
The following table shows information relating to our external customer revenues for each product or each group of similar products:
| Net Sales Year Ended December 31, | ||||||||||||
| 2011 | 2010 | 2009 | ||||||||||
| (Millions) | ||||||||||||
Emission Control Systems & Products | ||||||||||||
Aftermarket | $ | 351 | $ | 318 | $ | 315 | ||||||
Original Equipment | ||||||||||||
OE Value-add | 2,732 | 2,223 | 1,638 | |||||||||
OE Substrate | 1,678 | 1,284 | 966 | |||||||||
|
|
|
|
|
| |||||||
| 4,410 | 3,507 | 2,604 | ||||||||||
|
|
|
|
|
| |||||||
| 4,761 | 3,825 | 2,919 | ||||||||||
|
|
|
|
|
| |||||||
Ride Control Systems & Products | ||||||||||||
Aftermarket | 944 | 851 | 721 | |||||||||
Original Equipment | 1,500 | 1,261 | 1,009 | |||||||||
|
|
|
|
|
| |||||||
| 2,444 | 2,112 | 1,730 | ||||||||||
|
|
|
|
|
| |||||||
Total Revenues | $ | 7,205 | $ | 5,937 | $ | 4,649 | ||||||
|
|
|
|
|
| |||||||
The following customers accounted for 10 percent or more of our net sales in any of the last three years.
Customer | 2011 | 2010 | 2009 | |||||||||
General Motors | 19 | % | 19 | % | 16 | % | ||||||
Ford | 15 | % | 13 | % | 14 | % | ||||||
The following table shows information relating to the geographic regions in which we operate:
| Geographic Area | ||||||||||||||||||||||||||||
| United States | Germany | Canada | China | Other Foreign(a) | Reclass & Elims | Consolidated | ||||||||||||||||||||||
| (Millions) | ||||||||||||||||||||||||||||
At December 31, 2011, and for the Year Then Ended | ||||||||||||||||||||||||||||
Revenues from external customers(b) | $ | 2,795 | $ | 826 | $ | 343 | $ | 567 | $ | 2,674 | $ | - | $ | 7,205 | ||||||||||||||
Long-lived assets(c) | 359 | 110 | 57 | 104 | 530 | - | 1,160 | |||||||||||||||||||||
Total assets | 1,280 | 347 | 163 | 387 | 1,251 | (91 | ) | 3,337 | ||||||||||||||||||||
At December 31, 2010, and for the Year Then Ended | ||||||||||||||||||||||||||||
Revenues from external customers(b) | $ | 2,275 | $ | 616 | $ | 327 | $ | 473 | $ | 2,246 | $ | - | $ | 5,937 | ||||||||||||||
Long-lived assets(c) | 352 | 109 | 64 | 76 | 564 | - | 1,165 | |||||||||||||||||||||
Total assets | 1,147 | 322 | 149 | 321 | 1,308 | (80 | ) | 3,167 | ||||||||||||||||||||
At December 31, 2009, and for the Year Then Ended | ||||||||||||||||||||||||||||
Revenues from external customers(b) | $ | 1,531 | $ | 559 | $ | 416 | $ | 361 | $ | 1,782 | $ | - | $ | 4,649 | ||||||||||||||
Long-lived assets(c) | 373 | 116 | 75 | 61 | 604 | - | 1,229 | |||||||||||||||||||||
Total assets | 984 | 409 | 125 | 249 | 1,153 | (79 | ) | 2,841 | ||||||||||||||||||||
Note: | (a) | Revenues from external customers and long-lived assets for individual foreign countries other than Germany, Canada, and China are not material. |
| (b) | Revenues are attributed to countries based on location of the shipper. |
| (c) | Long-lived assets include all long-term assets except goodwill, intangibles and deferred tax assets. |
130
TENNECO INC.
NOTES TO CONSOLIDATED FINANCIAL STATEMENTS - (Continued)
| 12. | Commitments and Contingencies |
Capital Commitments
We estimate that expenditures aggregating approximately $80 million will be required after December 31, 2011 to complete facilities and projects authorized at such date, and we have made substantial commitments in connection with these facilities and projects.
Lease Commitments
We have long-term leases for certain facilities, equipment and other assets. The minimum lease payments under our non-cancelable operating leases with lease terms in excess of one year are $33 million in 2012, $24 million in 2013, $17 million in 2014, $10 million in 2015, and $8 million in both 2016 and subsequent years. The minimum lease payments under our non-cancelable capital leases with lease terms in excess of one year are less than $1 million in each of the next five years. Total rental expense for the year 2011, 2010 and 2009 was $52 million, $45 million and $43 million, respectively.
Environmental Matters, Litigation and Product Warranties
We are involved in environmental remediation matters, legal proceedings, claims, investigations and warranty obligations that are incidental to the conduct of our business and create the potential for contingent losses. We accrue for potential contingent losses when our review of available facts indicates that it is probable a loss has been incurred and the amount of the loss is reasonably estimable. Each quarter we assess our loss contingencies based upon currently available facts, existing technology, and presently enacted laws and regulations taking into consideration the likely effects of inflation and other societal and economic factors and record adjustments to these reserves as required. As an example, we consider all available evidence including prior experience in remediation of contaminated sites, other companies' cleanup experiences and data released by the United States Environmental Protection Agency or other organizations when we evaluate our environmental remediation contingencies. Further, all of our loss contingency estimates are subject to revision in future periods based on actual costs or new information. With respect to our environmental liabilities, where future cash flows are fixed or reliably determinable, we have discounted those liabilities. All other environmental liabilities are recorded at their undiscounted amounts. We evaluate recoveries separately from the liability and, when they are assured, recoveries are recorded and reported separately from the associated liability in our consolidated financial statements.
We are subject to a variety of environmental and pollution control laws and regulations in all jurisdictions in which we operate. We expense or capitalize, as appropriate, expenditures for ongoing compliance with environmental regulations that relate to current operations. We expense costs related to an existing condition caused by past operations that do not contribute to current or future revenue generation. As of December 31, 2011, we have the obligation to remediate or contribute towards the remediation of certain sites, including one Federal Superfund site. At December 31, 2011, our aggregated estimated share of environmental remediation costs for all these sites on a discounted basis was approximately $17 million, of which $5 million is recorded in other current liabilities and $12 million is recorded in deferred credits and other liabilities in our consolidated balance sheet. For those locations in which the liability was discounted, the weighted average discount rate used was 1.9 percent. The undiscounted value of the estimated remediation costs was $20 million. Based on information known to us, we have established reserves that we believe are adequate for these costs. Although we believe these estimates of remediation costs are reasonable and are based on the latest available information, the costs are estimates and are subject to revision as more information becomes available about the extent of remediation is required. At some sites, we expect that other parties will contribute towards the remediation costs. In addition, certain environmental statutes provide that our liability could be joint and several, meaning that we could be required to pay in excess of our share of remediation costs. Our understanding of the financial strength of other potentially responsible parties at these sites has been considered, where appropriate, in our determination of our estimated liability. We do not believe that any potential costs associated with our current status as a
131
TENNECO INC.
NOTES TO CONSOLIDATED FINANCIAL STATEMENTS - (Continued)
potentially responsible party in the Federal Superfund site, or as a liable party at the other locations referenced herein, will be material to our consolidated results of operations, financial position or cash flows.
We also from time to time are involved in legal proceedings, claims or investigations. Some of these proceedings allege damages against us relating to environmental liabilities (including toxic tort, property damage and remediation), intellectual property matters (including patent, trademark and copyright infringement, and licensing disputes), personal injury claims (including injuries due to product failure, design or warning issues, and other product liability related matters), taxes, employment matters, and commercial or contractual disputes, sometimes related to acquisitions or divestitures. For example, one of our Argentine subsidiaries is currently defending against a criminal complaint alleging the failure to comply with laws requiring the proceeds of export transactions to be collected, reported and/or converted to local currency within specified time periods. As another example, in the U.S. we are subject to an audit in 11 states with respect to the payment of unclaimed property to those states, spanning a period as far back as over 30 years. We now have practices in place which we believe ensure that we pay unclaimed property as required. We vigorously defend ourselves against all of these claims. In future periods, we could be subject to cash costs or charges to earnings if any of these matters are resolved on unfavorable terms. However, although the ultimate outcome of any legal matter cannot be predicted with certainty, based on current information, including our assessment of the merits of the particular claim, we do not expect that these legal proceedings or claims will have any material adverse impact on our future consolidated financial position, results of operations or cash flows.
In addition, we are subject to a number of lawsuits initiated by a significant number of claimants alleging health problems as a result of exposure to asbestos. In the early 2000's we were named in nearly 20,000 complaints, most of which were filed in Mississippi state court and the vast majority of which made no allegations of exposure to asbestos from our product categories. Most of these claims have been dismissed and our current docket of active and inactive cases is less than 500 cases nationwide. A small number of claims have been asserted by railroad workers alleging exposure to asbestos products in railroad cars manufactured by The Pullman Company, one of our subsidiaries. The balance of the claims is related to alleged exposure to asbestos in our automotive products. Only a small percentage of the claimants allege that they were automobile mechanics and a significant number appear to involve workers in other industries or otherwise do not include sufficient information to determine whether there is any basis for a claim against us. We believe, based on scientific and other evidence, it is unlikely that mechanics were exposed to asbestos by our former products and that, in any event, they would not be at increased risk of asbestos-related disease based on their work with these products. Further, many of these cases involve numerous defendants, with the number of each in some cases exceeding 100 defendants from a variety of industries. Additionally, the plaintiffs either do not specify any, or specify the jurisdictional minimum, dollar amount for damages. As major asbestos manufacturers and/or users continue to go out of business or file for bankruptcy, we may experience an increased number of these claims. We vigorously defend ourselves against these claims as part of our ordinary course of business. In future periods, we could be subject to charges to earnings if any of these matters are resolved unfavorably to us. To date, with respect to claims that have proceeded sufficiently through the judicial process, we have regularly achieved favorable resolutions. Accordingly, we presently believe that these asbestos-related claims will not have a material adverse impact on our future consolidated financial condition, results of operations or cash flows.
We provide warranties on some of our products. The warranty terms vary but range from one year up to limited lifetime warranties on some of our premium aftermarket products. Provisions for estimated expenses related to product warranty are made at the time products are sold or when specific warranty issues are identified on OE products. These estimates are established using historical information about the nature, frequency, and average cost of warranty claims. We actively study trends of our warranty claims and take action to improve product quality and minimize warranty claims. We believe that the warranty reserve is appropriate; however, actual claims incurred could differ from the original estimates, requiring adjustments to the reserve. The reserve is included in both current and long-term liabilities on the balance sheet.
132
TENNECO INC.
NOTES TO CONSOLIDATED FINANCIAL STATEMENTS - (Continued)
Below is a table that shows the activity in the warranty accrual accounts:
| Year
Ended December 31, | ||||||||||||
| 2011 | 2010 | 2009 | ||||||||||
| (Millions) | ||||||||||||
Beginning Balance | $ | 33 | $ | 32 | $ | 27 | ||||||
Accruals related to product warranties | 11 | 19 | 18 | |||||||||
Reductions for payments made | (18 | ) | (18 | ) | (13 | ) | ||||||
|
|
|
|
|
| |||||||
Ending Balance | $ | 26 | $ | 33 | $ | 32 | ||||||
|
|
|
|
|
| |||||||
In the fourth quarter of 2011, we encountered an issue in our North America OE ride control business involving struts supplied on one particular OE platform. As a result, we directly incurred approximately $2 million in premium freight and overtime costs. We are continuing to work through details with the customer to determine responsibility for any other costs associated with this issue. We cannot estimate the amount of these costs at this time, but do not believe they will be material to our annual operating results.
| 13. | Supplemental Guarantor Condensed Consolidating Financial Statements |
Basis of Presentation
Substantially all of our existing and future material domestic 100% owned subsidiaries (which are referred to as the Guarantor Subsidiaries) fully and unconditionally guarantee our senior notes due in 2015, 2018, and 2020 on a joint and several basis. However, a subsidiary's guarantee may be released in certain customary circumstances such as a sale of the subsidiary, or all, or substantially all of its assets in accordance with the indenture applicable to the notes. The Guarantor Subsidiaries are combined in the presentation below.
These consolidating financial statements are presented on the equity method. Under this method, our investments are recorded at cost and adjusted for our ownership share of a subsidiary's cumulative results of operations, capital contributions and distributions, and other equity changes. You should read the condensed consolidating financial information of the Guarantor Subsidiaries in connection with our consolidated financial statements and related notes of which this note is an integral part.
Distributions
There are no significant restrictions on the ability of the Guarantor Subsidiaries to make distributions to us.
133
TENNECO INC.
NOTES TO CONSOLIDATED FINANCIAL STATEMENTS - (Continued)
STATEMENT OF INCOME (LOSS)
| For the Year Ended December 31, 2011 | ||||||||||||||||||||
| Guarantor Subsidiaries | Nonguarantor Subsidiaries | Tenneco Inc. (Parent Company) | Reclass & Elims | Consolidated | ||||||||||||||||
| (Millions) | ||||||||||||||||||||
Revenues | ||||||||||||||||||||
Net sales and operating revenues - | ||||||||||||||||||||
External | $ | 3,103 | $ | 4,102 | $ | - | $ | - | $ | 7,205 | ||||||||||
Affiliated companies | 162 | 514 | - | (676 | ) | - | ||||||||||||||
|
|
|
|
|
|
|
|
|
| |||||||||||
| 3,265 | 4,616 | - | (676 | ) | 7,205 | |||||||||||||||
|
|
|
|
|
|
|
|
|
| |||||||||||
Costs and expenses | ||||||||||||||||||||
Cost of sales (exclusive of depreciation and amortization shown below) | 2,764 | 3,949 | - | (676 | ) | 6,037 | ||||||||||||||
Goodwill impairment charge | - | 11 | - | - | 11 | |||||||||||||||
Engineering, research, and development | 57 | 76 | - | - | 133 | |||||||||||||||
Selling, general, and administrative | 144 | 281 | 3 | - | 428 | |||||||||||||||
Depreciation and amortization of other intangibles | 74 | 133 | - | - | 207 | |||||||||||||||
|
|
|
|
|
|
|
|
|
| |||||||||||
| 3,039 | 4,450 | 3 | (676 | ) | 6,816 | |||||||||||||||
|
|
|
|
|
|
|
|
|
| |||||||||||
Other income (expense) | ||||||||||||||||||||
Loss on sale of receivables | - | (5 | ) | - | - | (5 | ) | |||||||||||||
Other income (expense) | 80 | 1 | - | (86 | ) | (5 | ) | |||||||||||||
|
|
|
|
|
|
|
|
|
| |||||||||||
| 80 | (4 | ) | - | (86 | ) | (10 | ) | |||||||||||||
|
|
|
|
|
|
|
|
|
| |||||||||||
Earnings (loss) before interest expense, income taxes, noncontrolling interests and equity in net income from affiliated companies | 306 | 162 | (3 | ) | (86 | ) | 379 | |||||||||||||
|
|
|
|
|
|
|
|
|
| |||||||||||
Interest expense - | ||||||||||||||||||||
External (net of interest capitalized) | (1 | ) | 6 | 103 | - | 108 | ||||||||||||||
Affiliated companies (net of interest income) | 211 | (72 | ) | (139 | ) | - | - | |||||||||||||
|
|
|
|
|
|
|
|
|
| |||||||||||
Earnings (loss) before income taxes, noncontrolling interests and equity in net income from affiliated companies | 96 | 228 | 33 | (86 | ) | 271 | ||||||||||||||
|
|
|
|
|
|
|
|
|
| |||||||||||
Income tax expense (benefit) | 12 | 76 | - | - | 88 | |||||||||||||||
Equity in net income (loss) from affiliated companies | 116 | - | 124 | (240 | ) | - | ||||||||||||||
|
|
|
|
|
|
|
|
|
| |||||||||||
Net income (loss) | 200 | 152 | 157 | (326 | ) | 183 | ||||||||||||||
|
|
|
|
|
|
|
|
|
| |||||||||||
Less: Net income attributable to noncontrolling interests | - | 26 | - | - | 26 | |||||||||||||||
|
|
|
|
|
|
|
|
|
| |||||||||||
Net income (loss) attributable to Tenneco Inc. | $ | 200 | $ | 126 | $ | 157 | $ | (326 | ) | $ | 157 | |||||||||
|
|
|
|
|
|
|
|
|
| |||||||||||
134
TENNECO INC.
NOTES TO CONSOLIDATED FINANCIAL STATEMENTS - (Continued)
STATEMENT OF INCOME (LOSS)
| For the Year Ended December 31, 2010 | ||||||||||||||||||||
| Guarantor Subsidiaries | Nonguarantor Subsidiaries | Tenneco Inc. (Parent Company) | Reclass & Elims | Consolidated | ||||||||||||||||
| (Millions) | ||||||||||||||||||||
Revenues | ||||||||||||||||||||
Net sales and operating revenues - | ||||||||||||||||||||
External | $ | 2,571 | $ | 3,366 | $ | - | $ | - | $ | 5,937 | ||||||||||
Affiliated companies | 130 | 472 | - | (602 | ) | - | ||||||||||||||
|
|
|
|
|
|
|
|
|
| |||||||||||
| 2,701 | 3,838 | - | (602 | ) | 5,937 | |||||||||||||||
|
|
|
|
|
|
|
|
|
| |||||||||||
Costs and expenses | ||||||||||||||||||||
Cost of sales (exclusive of depreciation and amortization shown below) | 2,331 | 3,171 | - | (602 | ) | 4,900 | ||||||||||||||
Engineering, research, and development | 48 | 69 | - | - | 117 | |||||||||||||||
Selling, general, and administrative | 153 | 261 | 3 | - | 417 | |||||||||||||||
Depreciation and amortization of other intangibles | 86 | 130 | - | - | 216 | |||||||||||||||
|
|
|
|
|
|
|
|
|
| |||||||||||
| 2,618 | 3,631 | 3 | (602 | ) | 5,650 | |||||||||||||||
|
|
|
|
|
|
|
|
|
| |||||||||||
Other income (expense) | ||||||||||||||||||||
Loss on sale of receivables | - | (3 | ) | - | - | (3 | ) | |||||||||||||
Other income (expense) | 12 | 1 | - | (16 | ) | (3 | ) | |||||||||||||
|
|
|
|
|
|
|
|
|
| |||||||||||
| 12 | (2 | ) | - | (16 | ) | (6 | ) | |||||||||||||
|
|
|
|
|
|
|
|
|
| |||||||||||
Earnings (loss) before interest expense, income taxes, noncontrolling interests and equity in net income from affiliated companies | 95 | 205 | (3 | ) | (16 | ) | 281 | |||||||||||||
|
|
|
|
|
|
|
|
|
| |||||||||||
Interest expense - | ||||||||||||||||||||
External (net of interest capitalized) | (2 | ) | 7 | 144 | - | 149 | ||||||||||||||
Affiliated companies (net of interest income) | 186 | (54 | ) | (132 | ) | - | - | |||||||||||||
|
|
|
|
|
|
|
|
|
| |||||||||||
Earnings (loss) before income taxes, noncontrolling interests and equity in net income from affiliated companies | (89 | ) | 252 | (15 | ) | (16 | ) | 132 | ||||||||||||
|
|
|
|
|
|
|
|
|
| |||||||||||
Income tax expense (benefit) | 7 | 62 | - | - | 69 | |||||||||||||||
Equity in net income (loss) from affiliated companies | 154 | - | 54 | (208 | ) | - | ||||||||||||||
|
|
|
|
|
|
|
|
|
| |||||||||||
Net income (loss) | 58 | 190 | 39 | (224 | ) | 63 | ||||||||||||||
|
|
|
|
|
|
|
|
|
| |||||||||||
Less: Net income attributable to noncontrolling interests | - | 24 | - | - | 24 | |||||||||||||||
|
|
|
|
|
|
|
|
|
| |||||||||||
Net income (loss) attributable to Tenneco Inc. | $ | 58 | $ | 166 | $ | 39 | $ | (224 | ) | $ | 39 | |||||||||
|
|
|
|
|
|
|
|
|
| |||||||||||
135
TENNECO INC.
NOTES TO CONSOLIDATED FINANCIAL STATEMENTS - (Continued)
STATEMENT OF INCOME (LOSS)
| For the Year Ended December 31, 2009 | ||||||||||||||||||||
| Guarantor Subsidiaries | Nonguarantor Subsidiaries | Tenneco Inc. (Parent Company) | Reclass & Elims | Consolidated | ||||||||||||||||
| (Millions) | ||||||||||||||||||||
Revenues | ||||||||||||||||||||
Net sales and operating revenues - | ||||||||||||||||||||
External | $ | 1,915 | $ | 2,734 | $ | - | $ | - | $ | 4,649 | ||||||||||
Affiliated companies | 92 | 399 | - | (491 | ) | - | ||||||||||||||
|
|
|
|
|
|
|
|
|
| |||||||||||
| 2,007 | 3,133 | - | (491 | ) | 4,649 | |||||||||||||||
|
|
|
|
|
|
|
|
|
| |||||||||||
Costs and expenses | ||||||||||||||||||||
Cost of sales (exclusive of depreciation and amortization shown below) | 1,836 | 2,530 | - | (491 | ) | 3,875 | ||||||||||||||
Engineering, research, and development | 36 | 61 | - | - | 97 | |||||||||||||||
Selling, general, and administrative | 105 | 236 | 3 | - | 344 | |||||||||||||||
Depreciation and amortization of other intangibles | 91 | 130 | - | - | 221 | |||||||||||||||
|
|
|
|
|
|
|
|
|
| |||||||||||
| 2,068 | 2,957 | 3 | (491 | ) | 4,537 | |||||||||||||||
|
|
|
|
|
|
|
|
|
| |||||||||||
Other income (expense) | ||||||||||||||||||||
Loss on sale of receivables | - | (9 | ) | - | - | (9 | ) | |||||||||||||
Other income (expense) | (2 | ) | 4 | - | (13 | ) | (11 | ) | ||||||||||||
|
|
|
|
|
|
|
|
|
| |||||||||||
| (2 | ) | (5 | ) | - | (13 | ) | (20 | ) | ||||||||||||
|
|
|
|
|
|
|
|
|
| |||||||||||
Earnings (loss) before interest expense, income taxes, noncontrolling interests, and equity in net income from affiliated companies | (63 | ) | 171 | (3 | ) | (13 | ) | 92 | ||||||||||||
|
|
|
|
|
|
|
|
|
| |||||||||||
Interest expense - | ||||||||||||||||||||
External (net of interest capitalized) | (1 | ) | 4 | 130 | - | 133 | ||||||||||||||
Affiliated companies (net of interest income) | 140 | (15 | ) | (125 | ) | - | - | |||||||||||||
|
|
|
|
|
|
|
|
|
| |||||||||||
Earnings (loss) before income taxes, noncontrolling interests, and equity in net income from affiliated companies | (202 | ) | 182 | (8 | ) | (13 | ) | (41 | ) | |||||||||||
|
|
|
|
|
|
|
|
|
| |||||||||||
Income tax expense (benefit) | (1 | ) | 33 | (19 | ) | - | 13 | |||||||||||||
Equity in net income (loss) from affiliated companies | 124 | - | (84 | ) | (40 | ) | - | |||||||||||||
|
|
|
|
|
|
|
|
|
| |||||||||||
Net income (loss) | (77 | ) | 149 | (73 | ) | (53 | ) | (54 | ) | |||||||||||
|
|
|
|
|
|
|
|
|
| |||||||||||
Less: Net income attributable to noncontrolling interests | - | 19 | - | - | 19 | |||||||||||||||
|
|
|
|
|
|
|
|
|
| |||||||||||
Net income (loss) attributable to Tenneco Inc. | $ | (77 | ) | $ | 130 | $ | (73 | ) | $ | (53 | ) | $ | (73 | ) | ||||||
|
|
|
|
|
|
|
|
|
| |||||||||||
136
TENNECO INC.
NOTES TO CONSOLIDATED FINANCIAL STATEMENTS - (Continued)
BALANCE SHEET
| December 31, 2011 | ||||||||||||||||||||
| Guarantor Subsidiaries | Nonguarantor Subsidiaries | Tenneco Inc. (Parent Company) | Reclass & Elims | Consolidated | ||||||||||||||||
| (Millions) | ||||||||||||||||||||
| ASSETS | ||||||||||||||||||||
Current assets: | ||||||||||||||||||||
Cash and cash equivalents | $ | 1 | $ | 213 | $ | - | $ | - | $ | 214 | ||||||||||
Receivables, net | 455 | 1,214 | 27 | (716 | ) | 980 | ||||||||||||||
Inventories | 248 | 344 | - | - | 592 | |||||||||||||||
Deferred income taxes | 35 | 31 | - | (26 | ) | 40 | ||||||||||||||
Prepayments and other | 21 | 132 | - | - | 153 | |||||||||||||||
|
|
|
|
|
|
|
|
|
| |||||||||||
Total current assets | 760 | 1,934 | 27 | (742 | ) | 1,979 | ||||||||||||||
|
|
|
|
|
|
|
|
|
| |||||||||||
Other assets: | ||||||||||||||||||||
Investment in affiliated companies | 444 | - | 681 | (1,125 | ) | - | ||||||||||||||
Notes and advances receivable from affiliates | 4,252 | 1,507 | 6,059 | (11,818 | ) | - | ||||||||||||||
Long-term receivables, net | 2 | 8 | - | - | 10 | |||||||||||||||
Goodwill | 22 | 52 | - | - | 74 | |||||||||||||||
Intangibles, net | 13 | 19 | - | - | 32 | |||||||||||||||
Deferred income taxes | 64 | 25 | 3 | - | 92 | |||||||||||||||
Other | 31 | 45 | 27 | - | 103 | |||||||||||||||
|
|
|
|
|
|
|
|
|
| |||||||||||
| 4,828 | 1,656 | 6,770 | (12,943 | ) | 311 | |||||||||||||||
|
|
|
|
|
|
|
|
|
| |||||||||||
Plant, property, and equipment, at cost | 1,041 | 2,112 | - | - | 3,153 | |||||||||||||||
Less - Accumulated depreciation and amortization | (749 | ) | (1,357 | ) | - | - | (2,106 | ) | ||||||||||||
|
|
|
|
|
|
|
|
|
| |||||||||||
| 292 | 755 | - | - | 1,047 | ||||||||||||||||
|
|
|
|
|
|
|
|
|
| |||||||||||
Total assets | $ | 5,880 | $ | 4,345 | $ | 6,797 | $ | (13,685 | ) | $ | 3,337 | |||||||||
|
|
|
|
|
|
|
|
|
| |||||||||||
| LIABILITIES AND SHAREHOLDERS' EQUITY | ||||||||||||||||||||
Current liabilities: | ||||||||||||||||||||
Short-term debt (including current maturities of long-term debt) | ||||||||||||||||||||
Short-term debt - non-affiliated | $ | - | $ | 64 | $ | 2 | $ | - | $ | 66 | ||||||||||
Short-term debt - affiliated | 203 | 374 | 10 | (587 | ) | - | ||||||||||||||
Trade payables | 455 | 825 | - | (109 | ) | 1,171 | ||||||||||||||
Accrued taxes | 11 | 33 | - | - | 44 | |||||||||||||||
Other | 118 | 178 | 39 | (46 | ) | 289 | ||||||||||||||
|
|
|
|
|
|
|
|
|
| |||||||||||
Total current liabilities | 787 | 1,474 | 51 | (742 | ) | 1,570 | ||||||||||||||
|
|
|
|
|
|
|
|
|
| |||||||||||
Long-term debt - non-affiliated | - | 9 | 1,149 | - | 1,158 | |||||||||||||||
Long-term debt - affiliated | 4,718 | 1,546 | 5,554 | (11,818 | ) | - | ||||||||||||||
Deferred income taxes | - | 51 | - | - | 51 | |||||||||||||||
Postretirement benefits and other liabilities | 407 | 92 | - | 4 | 503 | |||||||||||||||
Commitments and contingencies | ||||||||||||||||||||
|
|
|
|
|
|
|
|
|
| |||||||||||
Total liabilities | 5,912 | 3,172 | 6,754 | (12,556 | ) | 3,282 | ||||||||||||||
|
|
|
|
|
|
|
|
|
| |||||||||||
Redeemable noncontrolling interests | - | 12 | - | - | 12 | |||||||||||||||
|
|
|
|
|
|
|
|
|
| |||||||||||
Tenneco Inc. Shareholders' equity | (32 | ) | 1,118 | 43 | (1,129 | ) | - | |||||||||||||
|
|
|
|
|
|
|
|
|
| |||||||||||
Noncontrolling interests | - | 43 | - | - | 43 | |||||||||||||||
|
|
|
|
|
|
|
|
|
| |||||||||||
Total equity | (32 | ) | 1,161 | 43 | (1,129 | ) | 43 | |||||||||||||
|
|
|
|
|
|
|
|
|
| |||||||||||
Total liabilities, redeemable noncontrolling interests and equity | $ | 5,880 | $ | 4,345 | $ | 6,797 | $ | (13,685 | ) | $ | 3,337 | |||||||||
|
|
|
|
|
|
|
|
|
| |||||||||||
137
TENNECO INC.
NOTES TO CONSOLIDATED FINANCIAL STATEMENTS - (Continued)
BALANCE SHEET
| December 31, 2010 | ||||||||||||||||||||
| Guarantor Subsidiaries | Nonguarantor Subsidiaries | Tenneco Inc. (Parent Company) | Reclass & Elims | Consolidated | ||||||||||||||||
| (Millions) | ||||||||||||||||||||
| ASSETS | ||||||||||||||||||||
Current assets: | ||||||||||||||||||||
Cash and cash equivalents | $ | - | $ | 233 | $ | - | $ | - | $ | 233 | ||||||||||
Receivables, net | 402 | 1,106 | 24 | (706 | ) | 826 | ||||||||||||||
Inventories | 221 | 326 | - | - | 547 | |||||||||||||||
Deferred income taxes | 103 | - | - | (65 | ) | 38 | ||||||||||||||
Prepayments and other | 35 | 111 | - | - | 146 | |||||||||||||||
|
|
|
|
|
|
|
|
|
| |||||||||||
Total current assets | 761 | 1,776 | 24 | (771 | ) | 1,790 | ||||||||||||||
|
|
|
|
|
|
|
|
|
| |||||||||||
Other assets: | ||||||||||||||||||||
Investment in affiliated companies | 391 | - | 707 | (1,098 | ) | - | ||||||||||||||
Notes and advances receivable from affiliates | 4,119 | 788 | 5,853 | (10,760 | ) | - | ||||||||||||||
Long-term receivables, net | 1 | 8 | - | - | 9 | |||||||||||||||
Goodwill | 22 | 67 | - | - | 89 | |||||||||||||||
Intangibles, net | 14 | 18 | - | - | 32 | |||||||||||||||
Deferred income taxes | 37 | 21 | 34 | - | 92 | |||||||||||||||
Other | 26 | 46 | 33 | - | 105 | |||||||||||||||
|
|
|
|
|
|
|
|
|
| |||||||||||
| 4,610 | 948 | 6,627 | (11,858 | ) | 327 | |||||||||||||||
|
|
|
|
|
|
|
|
|
| |||||||||||
Plant, property, and equipment, at cost | 997 | 2,112 | - | - | 3,109 | |||||||||||||||
Less - Accumulated depreciation and amortization | (713 | ) | (1,346 | ) | - | - | (2,059 | ) | ||||||||||||
|
|
|
|
|
|
|
|
|
| |||||||||||
| 284 | 766 | - | - | 1,050 | ||||||||||||||||
|
|
|
|
|
|
|
|
|
| |||||||||||
Total assets | $ | 5,655 | $ | 3,490 | $ | 6,651 | $ | (12,629 | ) | $ | 3,167 | |||||||||
|
|
|
|
|
|
|
|
|
| |||||||||||
| LIABILITIES AND SHAREHOLDERS' EQUITY | ||||||||||||||||||||
Current liabilities: | ||||||||||||||||||||
Short-term debt (including current maturities of long-term debt) | ||||||||||||||||||||
Short-term debt - non-affiliated | $ | - | $ | 62 | $ | 1 | $ | - | $ | 63 | ||||||||||
Short-term debt - affiliated | 214 | 371 | 10 | (595 | ) | - | ||||||||||||||
Trade payables | 367 | 773 | - | (92 | ) | 1,048 | ||||||||||||||
Accrued taxes | 20 | 31 | - | - | 51 | |||||||||||||||
Other | 130 | 213 | 47 | (84 | ) | 306 | ||||||||||||||
|
|
|
|
|
|
|
|
|
| |||||||||||
Total current liabilities | 731 | 1,450 | 58 | (771 | ) | 1,468 | ||||||||||||||
|
|
|
|
|
|
|
|
|
| |||||||||||
Long-term debt - non-affiliated | - | 11 | 1,149 | - | 1,160 | |||||||||||||||
Long-term debt - affiliated | 4,583 | 768 | 5,409 | (10,760 | ) | - | ||||||||||||||
Deferred income taxes | - | 56 | - | - | 56 | |||||||||||||||
Postretirement benefits and other liabilities | 347 | 85 | - | 4 | 436 | |||||||||||||||
Commitments and contingencies | ||||||||||||||||||||
|
|
|
|
|
|
|
|
|
| |||||||||||
Total liabilities | 5,661 | 2,370 | 6,616 | (11,527 | ) | 3,120 | ||||||||||||||
|
|
|
|
|
|
|
|
|
| |||||||||||
Redeemable noncontrolling interests | - | 12 | - | - | 12 | |||||||||||||||
|
|
|
|
|
|
|
|
|
| |||||||||||
Tenneco Inc. Shareholders' equity | (6 | ) | 1,069 | 35 | (1,102 | ) | (4 | ) | ||||||||||||
|
|
|
|
|
|
|
|
|
| |||||||||||
Noncontrolling interests | - | 39 | - | - | 39 | |||||||||||||||
|
|
|
|
|
|
|
|
|
| |||||||||||
Total equity | (6 | ) | 1,108 | 35 | (1,102 | ) | 35 | |||||||||||||
|
|
|
|
|
|
|
|
|
| |||||||||||
Total liabilities, redeemable noncontrolling interests and equity | $ | 5,655 | $ | 3,490 | $ | 6,651 | $ | (12,629 | ) | $ | 3,167 | |||||||||
|
|
|
|
|
|
|
|
|
| |||||||||||
138
TENNECO INC.
NOTES TO CONSOLIDATED FINANCIAL STATEMENTS - (Continued)
STATEMENT OF CASH FLOWS
| Year Ended December 31, 2011 | ||||||||||||||||||||
| Guarantor Subsidiaries | Nonguarantor Subsidiaries | Tenneco Inc. (Parent Company) | Reclass & Elims | Consolidated | ||||||||||||||||
| (Millions) | ||||||||||||||||||||
Operating Activities | ||||||||||||||||||||
Net cash provided (used) by operating activities | $ | 401 | $ | 83 | $ (239 | ) | $ | - | $ | 245 | ||||||||||
|
|
|
|
|
|
|
|
|
| |||||||||||
Investing Activities | ||||||||||||||||||||
Proceeds from sale of assets | 3 | 1 | - | - | 4 | |||||||||||||||
Cash payments for plant, property, and equipment | (69 | ) | (144 | ) | - | - | (213 | ) | ||||||||||||
Cash payments for software related intangible assets | (4 | ) | (11 | ) | - | - | (15 | ) | ||||||||||||
|
|
|
|
|
|
|
|
|
| |||||||||||
Net cash used by investing activities | (70 | ) | (154 | ) | - | - | (224 | ) | ||||||||||||
|
|
|
|
|
|
|
|
|
| |||||||||||
Financing Activities | ||||||||||||||||||||
Issuance of long-term debt | - | 5 | - | - | 5 | |||||||||||||||
Debt issuance cost on long-term debt | - | - | (1 | ) | - | (1 | ) | |||||||||||||
Retirement of long-term debt | - | (1 | ) | (23 | ) | - | (24 | ) | ||||||||||||
Increase (decrease) in bank overdrafts | - | 3 | - | - | 3 | |||||||||||||||
Net increase (decrease) in revolver borrowings and short-term debt excluding current maturities of long-term debt | - | 6 | 24 | - | 30 | |||||||||||||||
Intercompany dividends and net increase (decrease) in intercompany obligations | (330 | ) | 75 | 255 | - | - | ||||||||||||||
Capital contribution from noncontrolling interest partner | - | 1 | - | - | 1 | |||||||||||||||
Purchase of additional noncontrolling equity interest | - | (4 | ) | - | - | (4 | ) | |||||||||||||
Distribution to noncontrolling interests partners | - | (20 | ) | - | - | (20 | ) | |||||||||||||
Purchase of common stock under the share repurchase program | - | - | (16 | ) | - | (16 | ) | |||||||||||||
|
|
|
|
|
|
|
|
|
| |||||||||||
Net cash provided (used) by financing activities | (330 | ) | 65 | 239 | - | (26 | ) | |||||||||||||
|
|
|
|
|
|
|
|
|
| |||||||||||
Effect of foreign exchange rate changes on cash and cash equivalents | - | (14 | ) | - | - | (14 | ) | |||||||||||||
|
|
|
|
|
|
|
|
|
| |||||||||||
Increase (decrease) in cash and cash equivalents | 1 | (20 | ) | - | - | (19 | ) | |||||||||||||
Cash and cash equivalents, January 1 | - | 233 | - | - | 233 | |||||||||||||||
|
|
|
|
|
|
|
|
|
| |||||||||||
Cash and cash equivalents, December 31 (Note) | $ | 1 | $ | 213 | $ | - | $ | - | $ | 214 | ||||||||||
|
|
|
|
|
|
|
|
|
| |||||||||||
| Note: | Cash and cash equivalents include highly liquid investments with a maturity of three months or less at the date of purchase. |
139
TENNECO INC.
NOTES TO CONSOLIDATED FINANCIAL STATEMENTS - (Continued)
STATEMENT OF CASH FLOWS
| Year Ended December 31, 2010 | ||||||||||||||||||||
| Guarantor Subsidiaries | Nonguarantor Subsidiaries | Tenneco Inc. (Parent Company) | Reclass & Elims | Consolidated | ||||||||||||||||
| (Millions) | ||||||||||||||||||||
Operating Activities | ||||||||||||||||||||
Net cash provided (used) by operating activities | $ | 97 | $ | 380 | $ | (233) | $ | - | $ | 244 | ||||||||||
|
|
|
|
|
|
|
|
|
| |||||||||||
Investing Activities | ||||||||||||||||||||
Proceeds from sale of assets | 1 | 2 | - | - | 3 | |||||||||||||||
Cash payments for plant, property, and equipment | (50 | ) | (101 | ) | - | - | (151 | ) | ||||||||||||
Cash payments for software related intangible assets | (7 | ) | (5 | ) | - | - | (12 | ) | ||||||||||||
Investments and other | - | 3 | - | - | 3 | |||||||||||||||
|
|
|
|
|
|
|
|
|
| |||||||||||
Net cash used by investing activities | (56 | ) | (101 | ) | - | - | (157 | ) | ||||||||||||
|
|
|
|
|
|
|
|
|
| |||||||||||
Financing Activities | ||||||||||||||||||||
Issuance of long-term debt | - | 5 | 875 | - | 880 | |||||||||||||||
Debt issuance cost on long-term debt | - | - | (24 | ) | - | (24 | ) | |||||||||||||
Retirement of long-term debt | - | (4 | ) | (860 | ) | - | (864 | ) | ||||||||||||
Increase (decrease) in bank overdrafts | - | 2 | - | - | 2 | |||||||||||||||
Net increase (decrease) in revolver borrowings and short-term debt excluding current maturities of long-term debt | - | (10 | ) | - | - | (10 | ) | |||||||||||||
Intercompany dividends and net increase (decrease) in intercompany obligations | (61 | ) | (181 | ) | 242 | - | - | |||||||||||||
Distribution to noncontrolling interests partners | - | (14 | ) | - | - | (14 | ) | |||||||||||||
|
|
|
|
|
|
|
|
|
| |||||||||||
Net cash provided (used) by financing activities | (61 | ) | (202 | ) | 233 | - | (30 | ) | ||||||||||||
|
|
|
|
|
|
|
|
|
| |||||||||||
Effect of foreign exchange rate changes on cash and cash equivalents | - | 9 | - | - | 9 | |||||||||||||||
|
|
|
|
|
|
|
|
|
| |||||||||||
Increase (decrease) in cash and cash equivalents | (20 | ) | 86 | - | - | 66 | ||||||||||||||
Cash and cash equivalents, January 1 | 20 | 147 | - | - | 167 | |||||||||||||||
|
|
|
|
|
|
|
|
|
| |||||||||||
Cash and cash equivalents, December 31 (Note) | $ | - | $ | 233 | $ | - | $ | - | $ | 233 | ||||||||||
|
|
|
|
|
|
|
|
|
| |||||||||||
| Note: | Cash and cash equivalents include highly liquid investments with a maturity of three months or less at the date of purchase. |
140
TENNECO INC.
NOTES TO CONSOLIDATED FINANCIAL STATEMENTS - (Continued)
STATEMENT OF CASH FLOWS
| Year Ended December 31, 2009 | ||||||||||||||||||||
| Guarantor Subsidiaries | Nonguarantor Subsidiaries | Tenneco Inc. (Parent Company) | Reclass & Elims | Consolidated | ||||||||||||||||
| (Millions) | ||||||||||||||||||||
Operating Activities | ||||||||||||||||||||
Net cash provided (used) by operating activities | $ | 347 | $ | 160 | $ | (266) | $ | - | $ | 241 | ||||||||||
|
|
|
|
|
|
|
|
|
| |||||||||||
Investing Activities | ||||||||||||||||||||
Proceeds from sale of assets | - | 5 | - | - | 5 | |||||||||||||||
Cash payments for plant, property, and equipment | (42 | ) | (78 | ) | - | - | (120 | ) | ||||||||||||
Acquisition of business (net of cash acquired) | - | 1 | - | - | 1 | |||||||||||||||
Cash payments for software related intangible assets | (2 | ) | (4 | ) | - | - | (6 | ) | ||||||||||||
Investment and other | - | 1 | - | - | 1 | |||||||||||||||
|
|
|
|
|
|
|
|
|
| |||||||||||
Net cash used by investing activities | (44 | ) | (75 | ) | - | - | (119 | ) | ||||||||||||
|
|
|
|
|
|
|
|
|
| |||||||||||
Financing Activities | ||||||||||||||||||||
Issuance of common shares | - | - | 188 | - | 188 | |||||||||||||||
Issuance of long-term debt | - | - | 6 | - | 6 | |||||||||||||||
Debt issuance cost on long-term debt | - | - | (8 | ) | - | (8 | ) | |||||||||||||
Retirement of long-term debt | - | (5 | ) | (17 | ) | - | (22 | ) | ||||||||||||
Increase (decrease) in bank overdrafts | - | (23 | ) | - | - | (23 | ) | |||||||||||||
Net increase (decrease) in revolver borrowings and short-term debt excluding current maturities of long-term debt | - | 21 | (239 | ) | - | (218 | ) | |||||||||||||
Intercompany dividends and net increase (decrease) in intercompany obligations | (299 | ) | (37 | ) | 336 | - | - | |||||||||||||
Distribution to noncontrolling interests partners | - | (10 | ) | - | - | (10 | ) | |||||||||||||
|
|
|
|
|
|
|
|
|
| |||||||||||
Net cash provided (used) by financing activities | (299 | ) | (54 | ) | 266 | - | (87 | ) | ||||||||||||
|
|
|
|
|
|
|
|
|
| |||||||||||
Effect of foreign exchange rate changes on cash and cash equivalents | - | 6 | - | - | 6 | |||||||||||||||
|
|
|
|
|
|
|
|
|
| |||||||||||
Increase (decrease) in cash and cash equivalents | 4 | 37 | - | - | 41 | |||||||||||||||
Cash and cash equivalents, January 1 | 16 | 110 | - | - | 126 | |||||||||||||||
|
|
|
|
|
|
|
|
|
| |||||||||||
Cash and cash equivalents, December 31 (Note) | $ | 20 | $ | 147 | $ | - | $ | - | $ | 167 | ||||||||||
|
|
|
|
|
|
|
|
|
| |||||||||||
| Note: | Cash and cash equivalents include highly liquid investments with a maturity of three months or less at the date of purchase. |
141
TENNECO INC.
NOTES TO CONSOLIDATED FINANCIAL STATEMENTS - (Continued)
| 14. | Quarterly Financial Data (Unaudited) |
Quarter | Net Sales and Operating Revenues | Cost of Sales (Excluding Depreciation and Amortization) | Earnings Before Interest Expense, Income Taxes and Noncontrolling Interests | Net Income
(Loss) Attributable to Tenneco Inc. | ||||||||||||
| (Millions) | ||||||||||||||||
2011 | ||||||||||||||||
1st | $ | 1,760 | $ | 1,466 | $ | 94 | $ | 47 | ||||||||
2nd | 1,888 | 1,565 | 113 | 50 | ||||||||||||
3rd | 1,773 | 1,492 | 84 | 30 | ||||||||||||
4th | 1,784 | 1,514 | 88 | 30 | ||||||||||||
|
|
|
|
|
|
|
| |||||||||
| $ | 7,205 | $ | 6,037 | $ | 379 | $ | 157 | |||||||||
|
|
|
|
|
|
|
| |||||||||
2010 | ||||||||||||||||
1st | $ | 1,316 | $ | 1,073 | $ | 59 | $ | 7 | ||||||||
2nd | 1,502 | 1,222 | 93 | 40 | ||||||||||||
3rd | 1,542 | 1,280 | 67 | 10 | ||||||||||||
4th | 1,577 | 1,325 | 62 | (18 | ) | |||||||||||
|
|
|
|
|
|
|
| |||||||||
| $ | 5,937 | $ | 4,900 | $ | 281 | $ | 39 | |||||||||
|
|
|
|
|
|
|
| |||||||||
Quarter | Basic Earnings (Loss) per Share of Common Stock | Diluted Earnings (Loss) per Share of Common Stock | ||||||
2011 | ||||||||
1st | $ | 0.78 | $ | 0.75 | ||||
2nd | 0.84 | 0.81 | ||||||
3rd | 0.51 | 0.49 | ||||||
4th | 0.50 | 0.49 | ||||||
Full Year | 2.62 | 2.55 | ||||||
2010 | ||||||||
1st | $ | 0.11 | $ | 0.11 | ||||
2nd | 0.68 | 0.66 | ||||||
3rd | 0.17 | 0.17 | ||||||
4th | (0.31 | ) | (0.31 | ) | ||||
Full Year | 0.65 | 0.63 | ||||||
| Note: | The sum of the quarters may not equal the total of the respective year's earnings per share on either a basic or diluted basis due to changes in the weighted average shares outstanding throughout the year. |
(The preceding notes are an integral part of the foregoing consolidated financial statements.)
142
SCHEDULE VALUATION AND QUALIFYING ACCOUNTS
SCHEDULE II
TENNECO INC. AND CONSOLIDATED SUBSIDIARIES
SCHEDULE II - VALUATION AND QUALIFYING ACCOUNTS
Column A | Column B | Column C | Column D | Column E | ||||||||||||||||
| Additions | ||||||||||||||||||||
Description | Balance at Beginning of Year | Charged to Costs and Expenses | Charged to Other Accounts | Deductions | Balance at End of Year | |||||||||||||||
| (Millions) | ||||||||||||||||||||
Allowance for Doubtful Accounts and Notes Receivable Deducted from Assets to Which it Applies: | ||||||||||||||||||||
Year Ended December 31, 2011 | $ | 20 | 1 | - | 4 | $ | 17 | |||||||||||||
|
|
|
|
|
|
|
|
|
| |||||||||||
Year Ended December 31, 2010 | $ | 25 | 2 | - | 7 | $ | 20 | |||||||||||||
|
|
|
|
|
|
|
|
|
| |||||||||||
Year Ended December 31, 2009 | $ | 24 | 5 | - | 4 | $ | 25 | |||||||||||||
|
|
|
|
|
|
|
|
|
| |||||||||||
143
| ITEM 9. | CHANGES IN AND DISAGREEMENTS WITH ACCOUNTANTS ON ACCOUNTING AND FINANCIAL DISCLOSURE. |
None.
| ITEM 9A. | CONTROLS AND PROCEDURES. |
Evaluation of Disclosure Controls and Procedures
An evaluation was carried out under the supervision and with the participation of our management, including our Chief Executive Officer and Chief Financial Officer, of the effectiveness of our disclosure controls and procedures (as defined in Rule 13a-15(e) and Rule 15d-15(e) under the Securities Exchange Act of 1934) as of the end of the year covered by this report. Based on their evaluation, our Chief Executive Officer and Chief Financial Officer have concluded that the Company's disclosure controls and procedures are effective to ensure that information required to be disclosed by our company in reports that it files or submits under the Exchange Act is recorded, processed, summarized and reported within the time periods specified in Securities and Exchange Commission rules and forms and such information is accumulated and communicated to management as appropriate to allow timely decisions regarding required disclosures.
See Item 8, "Financial Statements and Supplementary Data" for management's report on internal control over financial reporting and the report of our independent registered public accounting firm thereon.
Changes in Internal Control over Financial Reporting
There have been no changes in our internal control over financial reporting during the quarter ended December 31, 2011, that have materially affected, or are reasonably likely to materially affect, our internal control over financial reporting.
| ITEM 9B. | OTHER INFORMATION. |
None.
144
| ITEM 10. | DIRECTORS, EXECUTIVE OFFICERS AND CORPORATE GOVERNANCE. |
The sections entitled "Election of Directors" and "Corporate Governance" in our definitive Proxy Statement for the Annual Meeting of Stockholders to be held May 16, 2012 are incorporated herein by reference. In addition, Item 4.1 of this Annual Report on Form 10-K, which appears at the end of Part I, is incorporated herein by reference.
A copy of our Code of Ethical Conduct for Financial Managers, which applies to our Chief Executive Officer, Chief Financial Officer, Controller and other key financial managers, is filed as Exhibit 14 to this Form 10-K. We have posted a copy of the Code of Ethical Conduct for Financial Managers on our Internet website at www.tenneco.com . We will make a copy of this code available to any person, without charge, upon written request to Tenneco Inc., 500 North Field Drive, Lake Forest, Illinois 60045, Attn: General Counsel. We intend to satisfy the disclosure requirement under Item 5.05 of Form 8-K and applicable NYSE rules regarding amendments to or waivers of our Code of Ethical Conduct by posting this information on our Internet website at www.tenneco.com .
| ITEM 11. | EXECUTIVE COMPENSATION. |
The section entitled "Executive Compensation" in our definitive Proxy Statement for the Annual Meeting of Stockholders to be held on May 16, 2012 is incorporated herein by reference.
| ITEM 12. | SECURITY OWNERSHIP OF CERTAIN BENEFICIAL OWNERS AND MANAGEMENT AND RELATED STOCKHOLDER MATTERS. |
The section entitled "Ownership of Common Stock" in our definitive Proxy Statement for the Annual Meeting of Stockholders to be held on May 16, 2012 is incorporated herein by reference.
Securities Authorized for Issuance under Equity Compensation Plans
The following table shows, as of December 31, 2011, information regarding outstanding awards available under our compensation plans (including individual compensation arrangements) under which our equity securities may be delivered:
Plan category | (a) Number of securities to be issued upon exercise of outstanding options, warrants and rights(1) | (b) Weighted- average exercise price of outstanding options, warrants and rights | (c) Number of securities available for future issuance (excluding shares in column (a))(1) | |||||||||
Equity compensation plans approved by security holders: | ||||||||||||
Stock Ownership Plan(2) | 79,155 | $ | 20.39 | - | ||||||||
2002 Long-Term Incentive Plan (as amended)(3) | 659,810 | $ | 6.06 | - | ||||||||
2006 Long-Term Incentive Plan(4) | 2,004,234 | $ | 19.30 | 1,569,025 | ||||||||
| (1) | Reflects the number of shares of the Company's common stock. Does not include 436,662 shares that may be issued in settlement of common stock equivalent units that were (i) credited to outside directors as payment for their retainer and other fees or (ii) credited to any of our executive officers who have elected to defer a portion of their compensation. In general, these units are settled in cash. At the option of the Company, however, the units may be settled in shares of the Company's common stock. |
| (2) | This plan terminated as to new awards on December 31, 2001 (except awards pursuant to commitments outstanding at that date). |
| (3) | This plan terminated as to new awards upon adoption of our 2006 Long-term Incentive Plan (except awards pursuant to commitments outstanding on that date). |
145
| (4) | Does not include 407,751 shares subject to outstanding restricted stock (vest over time) as of December 31, 2011 that were issued at a weighted average grant date fair value of $22.64. Under this plan, as of December 31, 2011, a maximum of 1,255,220 shares remained available for delivery under full value awards (i.e., bonus stock, stock equivalent units, performance units, restricted stock and restricted stock units). |
| ITEM 13. | CERTAIN RELATIONSHIPS AND RELATED TRANSACTIONS, AND DIRECTOR INDEPENDENCE. |
The subsections entitled "The Board of Directors and its Committees - General" and "Transactions with Related Persons" under the section entitled "Corporate Governance" in our definitive Proxy Statement for the Annual Meeting of Stockholders to be held on May 16, 2012 are incorporated herein by reference.
| ITEM 14. | PRINCIPAL ACCOUNTANT FEES AND SERVICES. |
The sections entitled "Ratify Appointment of Independent Public Accountants - Audit, Audit-Related, Tax and All Other Fees" and "Ratify Appointment of Independent Public Accountants - Pre-Approval Policy" in our definitive Proxy Statement for the Annual Meeting of Stockholders to be held on May 16, 2012 are incorporated herein by reference.
146
PART IV
| ITEM 15. | EXHIBITS AND FINANCIAL STATEMENT SCHEDULES. |
CONSOLIDATED FINANCIAL STATEMENTS INCLUDED IN ITEM 8
See "Index to Financial Statements of Tenneco Inc. and Consolidated Subsidiaries" set forth in Item 8, "Financial Statements and Supplementary Data" for a list of financial statements filed as part of this Report.
INDEX TO SCHEDULE INCLUDED IN ITEM 8
| Page | ||||
Schedule of Tenneco Inc. and Consolidated Subsidiaries - Schedule II - Valuation and qualifying accounts - three years ended December 31, 2011 | 119 | |||
SCHEDULES OMITTED AS NOT REQUIRED OR INAPPLICABLE
Schedule I - Condensed financial information of registrant
Schedule III - Real estate and accumulated depreciation
Schedule IV - Mortgage loans on real estate
Schedule V - Supplemental information concerning property - casualty insurance operations
147
EXHIBITS
The following exhibits are filed with this Annual Report on Form 10-K for the fiscal year ended December 31, 2011, or incorporated herein by reference (exhibits designated by an asterisk are filed with the report; all other exhibits are incorporated by reference):
INDEX TO EXHIBITS
Exhibit Number | Description | |||
| 2 | - | None. | ||
| 3.1(a) | - | Restated Certificate of Incorporation of the registrant dated December 11, 1996 (incorporated herein by reference to Exhibit 3.1(a) of the registrant's Annual Report on Form 10-K for the year ended December 31, 1997, File No. 1-12387). | ||
| 3.1(b) | - | Certificate of Amendment, dated December 11, 1996 (incorporated herein by reference to Exhibit 3.1(c) of the registrant's Annual Report on Form 10-K for the year ended December 31, 1997, File No. 1-12387). | ||
| 3.1(c) | - | Certificate of Ownership and Merger, dated July 8, 1997 (incorporated herein by reference to Exhibit 3.1(d) of the registrant's Annual Report on Form 10-K for the year ended December 31, 1997, File No. 1-12387). | ||
| 3.1(d) | - | Certificate of Designation of Series B Junior Participating Preferred Stock dated September 9, 1998 (incorporated herein by reference to Exhibit 3.1(d) of the registrant's Quarterly Report on Form 10-Q for the quarter ended September 30, 1998, File No. 1-12387). | ||
| 3.1(e) | - | Certificate of Elimination of the Series A Participating Junior Preferred Stock of the registrant dated September 11, 1998 (incorporated herein by reference to Exhibit 3.1(e) of the registrant's Quarterly Report on Form 10-Q for the quarter ended September 30, 1998, File No. 1-12387). | ||
| 3.1(f) | - | Certificate of Amendment to Restated Certificate of Incorporation of the registrant dated November 5, 1999 (incorporated herein by reference to Exhibit 3.1(f) of the registrant's Quarterly Report on Form 10-Q for the quarter ended September 30, 1999, File No. 1-12387). | ||
| 3.1(g) | - | Certificate of Amendment to Restated Certificate of Incorporation of the registrant dated November 5, 1999 (incorporated herein by reference to Exhibit 3.1(g) of the registrant's Quarterly Report on Form 10-Q for the quarter ended September 30, 1999, File No. 1-12387). | ||
| 3.1(h) | - | Certificate of Ownership and Merger merging Tenneco Automotive Merger Sub Inc. with and into the registrant, dated November 5, 1999 (incorporated herein by reference to Exhibit 3.1(h) of the registrant's Quarterly Report on Form 10-Q for the quarter ended September 30, 1999, File No. 1-12387). | ||
| 3.1(i) | - | Certificate of Amendment to Restated Certificate of Incorporation of the registrant dated May 9, 2000 (incorporated herein by reference to Exhibit 3.1(i) of the registrant's Quarterly Report on Form 10-Q for the quarter ended March 31, 2000, File No. 1-12387). | ||
| 3.1(j) | - | Certificate of Ownership and Merger merging Tenneco Inc. with and into the registrant, dated October 27, 2005 (incorporated herein by reference to Exhibit 99.1 of the registrant's Current Report on Form 8-K dated October 28, 2005, File No. 1-12387). | ||
| 3.2 | - | By-laws of the registrant, as amended March 4, 2008 (incorporated herein by reference to Exhibit 99.1 of the registrant's Current Report on Form 8-K event date March 4, 2008, File No. 1-12387). | ||
| 3.3 | - | Certificate of Incorporation of Tenneco Global Holdings Inc. ("Global"), as amended (incorporated herein by reference to Exhibit 3.3 of the registrant's Registration Statement on Form S-4, Reg. No. 333-93757). | ||
| 3.4 | - | By-laws of Global (incorporated herein by reference to Exhibit 3.4 of the registrant's Registration Statement on Form S-4, Reg. No. 333-93757). | ||
148
Exhibit Number | Description | |||
| 3.5 | - | Certificate of Incorporation of TMC Texas Inc. ("TMC") (incorporated herein by reference to Exhibit 3.5 of the registrant's Registration Statement on Form S-4, Reg. No. 333-93757). | ||
| 3.6 | - | By-laws of TMC (incorporated herein by reference to Exhibit 3.6 of the registrant's Registration Statement on Form S-4, Reg. No. 333-93757). | ||
| 3.7 | - | Amended and Restated Certificate of Incorporation of Tenneco International Holding Corp. dated as of April 29, 2010 (incorporated herein by reference to Exhibit 3.1 of the registrant's Quarterly Report on Form 10-Q for the quarter ended September 30, 2010, File No. 1-12387). | ||
| 3.8 | - | Amended and Restated By-laws of TIHC (incorporated herein by reference to Exhibit 3.8 of the registrant's Registration Statement on Form S-4, Reg. No. 333-93757). | ||
| 3.9 | - | Certificate of Incorporation of Clevite Industries Inc. ("Clevite"), as amended (incorporated herein by reference to Exhibit 3.9 of the registrant's Registration Statement on Form S-4, Reg. No. 333-93757). | ||
| 3.10 | - | By-laws of Clevite (incorporated herein by reference to Exhibit 3.10 of the registrant's Registration Statement on Form S-4, Reg. No. 333-93757). | ||
| 3.11 | - | Amended and Restated Certificate of Incorporation of The Pullman Company ("Pullman") (incorporated herein by reference to Exhibit 3.11 of the registrant's Registration Statement on Form S-4, Reg. No. 333-93757). | ||
| 3.12 | - | By-laws of Pullman (incorporated herein by reference to Exhibit 3.12 of the registrant's Registration Statement on Form S-4, Reg. No. 333-93757). | ||
| 3.13 | - | Certificate of Incorporation of Tenneco Automotive Operating Company Inc. ("Operating") (incorporated herein by reference to Exhibit 3.13 of the registrant's Registration Statement on Form S-4, Reg. No. 333-93757). | ||
| 3.14 | - | By-laws of Operating (incorporated herein by reference to Exhibit 3.14 of the registrant's Registration Statement on Form S-4, Reg. No. 333-93757). | ||
| 4.1(a) | - | Indenture, dated as of November 1, 1996, between the registrant and The Chase Manhattan Bank, as Trustee (incorporated herein by reference to Exhibit 4.1 of the registrant's Registration Statement on Form S-4, Registration No. 333-14003). | ||
| 4.1(b) | - | Third Supplemental Indenture dated as of December 11, 1996 to Indenture dated as of November 1, 1996 between the registrant and The Chase Manhattan Bank, as Trustee (incorporated herein by reference to Exhibit 4.3(d) of the registrant's Annual Report on Form 10-K for the year ended December 31, 1996, File No. 1-12387). | ||
| 4.1(c) | - | Fourth Supplemental Indenture dated as of December 11, 1996 to Indenture dated as of November 1, 1996 between the registrant and The Chase Manhattan Bank, as Trustee (incorporated herein by reference to Exhibit 4.3(e) of the registrant's Annual Report on Form 10-K for the year ended December 31, 1996, File No. 1-12387). | ||
| 4.1(d) | - | Eleventh Supplemental Indenture, dated October 21, 1999, to Indenture dated November 1, 1996 between The Chase Manhattan Bank, as Trustee, and the registrant (incorporated herein by reference to Exhibit 4.2(l) of the registrant's Quarterly Report on Form 10-Q for the quarter ended September 30, 1999, File No. 1-12387). | ||
| 4.2 | - | Specimen stock certificate for Tenneco Inc. common stock (incorporated herein by reference to Exhibit 4.3 of the registrant's Annual Report on Form 10-K for the year ended December 31, 2006, File No. 1-12387). | ||
| 4.3(a) | - | Second Amended and Restated Credit Agreement, dated as of March 16, 2007, among Tenneco Inc., JPMorgan Chase Bank, N.A., as administrative agent, and the other lenders party thereto (incorporated herein by reference to Exhibit 99.1 of the registrant's Current Report on Form 8-K dated March 16, 2007). | ||
149
Exhibit Number | Description | |||
| 4.3(b) | - | Guarantee and Collateral Agreement, dated as of March 16, 2007 (amending and restating the Guarantee and Collateral Agreement dated as of November 4, 1999, as previously amended and amended and restated), among Tenneco Inc., various of its subsidiaries and JPMorgan Chase Bank, N.A., as administrative agent (incorporated herein by reference to Exhibit 99.2 of the registrant's Current Report on Form 8-K dated March 16, 2007). | ||
| 4.3(c) | - | Waiver, dated July 23, 2007, to Second Amended and Restated Credit Agreement, dated as March 16, 2007, by and among the registrant, JPMorgan Chase Bank, N.A., as administrative agent, and the other lenders party thereto (incorporated herein by reference to Exhibit 4.5(c) of the registrant's Annual Report on Form 10-K for the year ended December 31, 2007, File No. 1-12387). | ||
| 4.3(d) | - | Second Amendment, dated November 26, 2007, to Second Amended and Restated Credit Agreement, dated as March 16, 2007, by and among the registrant, JPMorgan Chase Bank, N.A., as administrative agent, and the other lenders party thereto (incorporated herein by reference to Exhibit 4.5(d) of the registrant's Annual Report on Form 10-K for the year ended December 31, 2007, File No. 1-12387). | ||
| 4.3(e) | - | Third Amendment, dated as of December 23, 2008, to Second Amended and Restated Credit Agreement, dated as of March 16, 2007, by and among the registrant, JPMorgan Chase Bank, N.A., as administrative agent, and the other lenders party thereto (incorporated herein by reference to Exhibit 10.1 of the registrant's Current Report on Form 8-K dated December 23, 2008). | ||
| 4.3(f) | - | Fourth Amendment, dated as of February 23, 2009, to Second Amended and Restated Credit Agreement, dated as of March 16, 2007, by and among the registrant, JP Morgan Chase Bank, N.A., as administrative agent, and the other lenders party thereto (incorporated herein by reference to Exhibit 4.1 of the registrant's Current Report on Form 8-K dated February 23, 2009). | ||
| 4.3(g) | - | Fifth Amendment to the Second Amended and Restated Credit Agreement, dated June 3, 2010, by and among the registrant, various subsidiaries of the registrant and JP Morgan Chase Bank, N.A., as administrative agent (incorporated herein by reference to Exhibit 99.1 of the registrant's Current Report on Form 8-K filed June 9, 2010, File No. 1-12387). | ||
| 4.3(h) | - | Sixth Amendment to the Second Amended and Restated Credit Agreement, dated November 15, 2010, by and among the registrant, various subsidiaries of the registrant and JP Morgan Chase Bank, N.A., as administrative agent (incorporated herein by reference to Exhibit 4.1 of the registrant's Current Report on Form 8-K filed November 30, 2010, File No. 1-12387). | ||
| 4.4(a) | - | Indenture, dated as of November 19, 2007, by and among the registrant, the subsidiary guarantors party thereto and Wells Fargo Bank, N.A., as trustee (incorporated herein by reference to Exhibit 4.9(a) of the registrant's Annual Report on Form 10-K for the year ended December 31, 2007, File No. 1-12387). | ||
| 4.4(b) | - | Agreement of Resignation, Appointment and Acceptance between Tenneco Inc., Wells Fargo Bank, National Association and Bank of New York Mellon Trust Company, N.A. (incorporated herein by reference to Exhibit 10.1 of the registrant's Quarterly Report on Form 10-Q for the quarter ended September 30, 2009, File No. 1-12387). | ||
| 4.5 | - | Indenture, dated August 3, 2010, among the registrant, various subsidiaries of the registrant and U.S. Bank National Association, as trustee (incorporated herein by reference to Exhibit 4.1 of the registrant's Current Report on Form 8-K filed August 3, 2010, File No. 1-12387). | ||
| 4.6 | - | Indenture, dated December 23, 2010, among the registrant, various subsidiaries of the registrant and The Bank of New York Mellon Trust Company, N.A., as trustee (incorporated herein by reference to Exhibit 4.1 of the registrant's Current Report on Form 8-K filed December 23, 2010, File No. 1-12387). | ||
| 9 | - | None. | ||
150
Exhibit Number | Description | |||
| 10.1 | - | Distribution Agreement, dated November 1, 1996, by and among El Paso Tennessee Pipeline Co., the registrant, and Newport News Shipbuilding Inc. (incorporated herein by reference to Exhibit 2 of the registrant's Form 10, File No. 1-12387). | ||
| 10.2 | - | Amendment No. 1 to Distribution Agreement, dated as of December 11, 1996, by and among El Paso Tennessee Pipeline Co., the registrant, and Newport News Shipbuilding Inc. (incorporated herein by reference to Exhibit 10.2 of the registrant's Annual Report on Form 10-K for the year ended December 31, 1996, File No. 1-12387). | ||
| 10.3 | - | Debt and Cash Allocation Agreement, dated December 11, 1996, by and among El Paso Tennessee Pipeline Co., the registrant, and Newport News Shipbuilding Inc. (incorporated herein by reference to Exhibit 10.3 of the registrant's Annual Report on Form 10-K for the year ended December 31, 1996, File No. 1-12387). | ||
| 10.4 | - | Benefits Agreement, dated December 11, 1996, by and among El Paso Tennessee Pipeline Co., the registrant, and Newport News Shipbuilding Inc. (incorporated herein by reference to Exhibit 10.4 of the registrant's Annual Report on Form 10-K for the year ended December 31, 1996, File No. 1-12387). | ||
| 10.5 | - | Insurance Agreement, dated December 11, 1996, by and among El Paso Tennessee Pipeline Co., the registrant, and Newport News Shipbuilding Inc. (incorporated herein by reference to Exhibit 10.5 of the registrant's Annual Report on Form 10-K for the year ended December 31, 1996, File No. 1-12387). | ||
| 10.6 | - | Tax Sharing Agreement, dated December 11, 1996, by and among El Paso Tennessee Pipeline Co., Newport News Shipbuilding Inc., the registrant, and El Paso Natural Gas Company (incorporated herein by reference to Exhibit 10.6 of the registrant's Annual Report on Form 10-K for the year ended December 31, 1996, File No. 1-12387). | ||
| 10.7 | - | First Amendment to Tax Sharing Agreement, dated as of December 11, 1996, among El Paso Tennessee Pipeline Co., the registrant, El Paso Natural Gas Company and Newport News Shipbuilding Inc. (incorporated herein by reference to Exhibit 10.7 of the registrant's Annual Report on Form 10-K for the year ended December 31, 1996, File No. 1-12387). | ||
| +10.8 | - | Change of Control Severance Benefits Plan for Key Executives (incorporated herein by reference to Exhibit 10.13 of the registrant's Quarterly Report on Form 10-Q for the quarter ended September 30, 1999, File No. 1-12387). | ||
| +10.9 | - | Stock Ownership Plan (incorporated herein by reference to Exhibit 10.10 of the registrant's Registration Statement on Form S-4, Reg. No. 333-93757). | ||
| +10.10 | - | Key Executive Pension Plan (incorporated herein by reference to Exhibit 10.11 of the registrant's Quarterly Report on Form 10-Q for the quarter ended June 30, 2000, File No. 1-12387). | ||
| +10.11 | - | Deferred Compensation Plan (incorporated herein by reference to Exhibit 10.12 of the registrant's Quarterly Report on Form 10-Q for the quarter ended June 30, 2000, File No. 1-12387). | ||
| +10.12 | - | Supplemental Executive Retirement Plan (incorporated herein by reference to Exhibit 10.13 of the registrant's Quarterly Report on Form 10-Q for the quarter ended June 30, 2000, File No. 1-12387). | ||
| 10.13 | - | Human Resources Agreement by and between the registrant and Tenneco Packaging Inc. dated November 4, 1999 (incorporated herein by reference to Exhibit 99.1 of the registrant's Current Report on Form 8-K dated November 4, 1999, File No. 1-12387). | ||
| 10.14 | - | Tax Sharing Agreement by and between the registrant and Tenneco Packaging Inc. dated November 3, 1999 (incorporated herein by reference to Exhibit 99.2 of the registrant's Current Report on Form 8-K dated November 4, 1999, File No. 1-12387). | ||
151
Exhibit Number | Description | |||
| 10.15 | - | Amended and Restated Transition Services Agreement by and between the registrant and Tenneco Packaging Inc. dated as of November 4, 1999 (incorporated herein by reference to Exhibit 10.21 of the registrant's Quarterly Report on Form 10-Q for the quarter ended September 30, 1999, File No. 1-12387). | ||
| +10.16 | - | Amendment No. 1 to Change in Control Severance Benefits Plan for Key Executives (incorporated herein by reference to Exhibit 10.23 of the registrant's Quarterly Report on Form 10-Q for the quarter ended June 30, 2000, File No. 1-12387). | ||
| +10.17 | - | Form of Indemnity Agreement entered into between the registrant and the following directors of the registrant: Paul Stecko, M. Kathryn Eickhoff and Dennis Severance (incorporated herein by reference to Exhibit 10.29 of the registrant's Quarterly Report on Form 10-Q for the quarter ended September 30, 2000, File No. 1-12387). | ||
| +10.18 | - | Letter Agreement dated July 27, 2000 between the registrant and Timothy E. Jackson (incorporated herein by reference to Exhibit 10.27 of the registrant's Quarterly Report on Form 10-Q for the quarter ended June 30, 2000, File No. 1-12387). | ||
| +10.19 | - | Letter Agreement dated as of June 1, 2001 between the registrant and Hari Nair (incorporated herein by reference to Exhibit 10.28 of the registrant's Annual Report on Form 10-K for the year ended December 31, 2001, File No. 1-12387). | ||
| +10.20 | - | 2002 Long-Term Incentive Plan (As Amended and Restated Effective March 11, 2003) (incorporated herein by reference to Exhibit 10.26 of the registrant's Quarterly Report on Form 10-Q for the quarter ended June 30, 2003, File No. 1-12387). | ||
| +10.21 | - | Amendment No. 1 to Deferred Compensation Plan (incorporated herein by reference to Exhibit 10.27 of the registrant's Annual Report on Form 10-K for the year ended December 31, 2002, File No. 1-12387). | ||
| +10.22 | - | Supplemental Stock Ownership Plan (incorporated herein by reference to Exhibit 10.28 of the registrant's Annual Report on Form 10-K for the year ended December 31, 2002, File No. 1-12387). | ||
| +10.23 | - | Form of Stock Option Agreement for employees under the 2002 Long-Term Incentive Plan, as amended (providing for a ten year option term) (incorporated herein by reference to Exhibit 99.2 of the registrant's Current Report on Form 8-K dated January 13, 2005, File No. 1-12387). | ||
| +10.24 | - | Form of Stock Option Agreement for non-employee directors under the 2002 Long-Term Incentive Plan, as amended (providing for a ten year option term) (incorporated herein by reference to Exhibit 99.3 of the registrant's Current Report on Form 8-K dated January 13, 2005, File No. 1-12387). | ||
| +10.25 | - | Form of Stock Option Agreement for employees under the 2002 Long-Term Incentive Plan, as amended (providing for a seven year option term) (incorporated herein by reference to Exhibit 99.2 of the registrant's Current Report on Form 8-K dated January 17, 2005, File No. 1-12387). | ||
| +10.26 | - | Form of Stock Option Agreement for non-employee directors under the 2002 Long-Term Incentive Plan, as amended (providing for a seven year option term) (incorporated herein by reference to Exhibit 99.3 of the registrant's Current Report on Form 8-K dated January 17, 2005, File No. 1-12387). | ||
| +10.27 | - | Amendment No. 1 to the Key Executive Pension Plan (incorporated herein by reference to Exhibit 10.39 of the registrant's Quarterly Report on Form 10-Q for the quarter ended March 31, 2005, File No. 1-12387). | ||
| +10.28 | - | Amendment No. 1 to the Supplemental Executive Retirement Plan (incorporated herein by reference to Exhibit 10.40 of the registrant's Quarterly Report on Form 10-Q for the quarter ended June 30, 2005, File No. 1-12387). | ||
152
Exhibit Number | Description | |||
| +10.29 | - | Second Amendment to the Key Executive Pension Plan (incorporated herein by reference to Exhibit 10.41 of the registrant's Quarterly Report on Form 10-Q for the quarter ended June 30, 2005, File No. 1-12387). | ||
| +10.30 | - | Amendment No. 2 to the Deferred Compensation Plan (incorporated herein by reference to Exhibit 10.42 of the registrant's Quarterly Report on Form 10-Q for the quarter ended June 30, 2005, File No. 1-12387). | ||
| +10.31 | - | Supplemental Retirement Plan (incorporated herein by reference to Exhibit 10.43 of the registrant's Quarterly Report on Form 10-Q for the quarter ended June 30, 2005, File No. 1-12387). | ||
| +10.32 | - | Supplemental Pension Plan for Management (incorporated herein by reference to Exhibit 10.45 of the registrant's Quarterly Report on Form 10-Q for the quarter ended June 30, 2005, File No. 1-12387). | ||
| +10.33 | - | Amended and Restated Value Added ("TAVA") Incentive Compensation Plan, effective January 1, 2006 (incorporated herein by reference to Exhibit 10.47 of the registrant's Annual Report on Form 10-K for the year ended December 31, 2005, File No. 1-12387). | ||
| +10.34 | - | Tenneco Inc. 2006 Long-Term Incentive Plan (incorporated herein by reference to Exhibit 99.1 of the registrant's Current Report on Form 8-K, dated May 9, 2006). | ||
| +10.35 | - | Form of Restricted Stock Award Agreement for non-employee directors under the Tenneco Inc. 2006 Long-Term Incentive Plan (incorporated herein by reference to Exhibit 99.2 of the registrant's Current Report on Form 8-K, dated May 9, 2006). | ||
| +10.36 | - | Form of Stock Option Agreement for employees under the Tenneco Inc. 2006 Long-Term Incentive Plan (incorporated herein by reference to Exhibit 99.3 of the registrant's Current Report on Form 8-K, dated May 9, 2006). | ||
| +10.37 | - | Form of Restricted Stock Award Agreement for employees under the Tenneco Inc. 2006 Long-Term Incentive Plan (incorporated herein by reference to Exhibit 99.4 of the registrant's Current Report on Form 8-K, dated May 9, 2006). | ||
| +10.38 | - | Form of First Amendment to the Tenneco Inc. Supplemental Pension Plan for Management (incorporated herein by reference to Exhibit 10.56 of the registrant's Annual Report on Form 10-K for the year ended December 31, 2006, File No. 1-12387). | ||
| +10.39 | - | Form of First Amendment to the Tenneco Inc. Supplemental Retirement Plan (incorporated herein by reference to Exhibit 10.57 of the registrant's Annual Report on Form 10-K for the year ended December 31, 2006, File No. 1-12387). | ||
| +10.40 | - | Letter Agreement dated January 5, 2007 between the registrant and Hari N. Nair (incorporated herein by reference to Exhibit 10.60 of the registrant's Annual Report on Form 10-K for the year ended December 31, 2006, File No. 1-12387). | ||
| +10.41 | - | Letter Agreement between Tenneco Inc. and Gregg Sherrill (incorporated herein by reference to Exhibit 99.2 of the registrant's Current Report on Form 8-K dated as of January 5, 2007, File No. 1-12387). | ||
| +10.42 | - | Letter Agreement between Tenneco Inc. and Gregg Sherrill, dated as of January 15, 2007 (incorporated herein by reference to Exhibit 99.1 of the registrant's Current Report on Form 8-K dated as of January 15, 2007, File No. 1-12387). | ||
| +10.43 | - | Form of Restricted Stock Agreement between Tenneco Inc. and Gregg M. Sherrill (incorporated herein by reference to Exhibit 10.63 of the registrant's Annual Report on Form 10-K for the year ended December 31, 2006, File No. 1-12387). | ||
| +10.44 | - | Form of Long-Term Performance Unit Award Under the 2006 Long-Term Incentive Plan (stub period award for 2007) (incorporated herein by reference to Exhibit 10.64 of the registrant's Quarterly Report on Form 10-Q for the quarter ended June 30, 2007, File No. 1-12387). | ||
153
Exhibit Number | Description | |||
| +10.45 | - | Form of Long-Term Performance Unit Award Under the 2006 Long-Term Incentive Plan (three-year award for 2007-2009 period) (incorporated herein by reference to Exhibit 10.65 of the registrant's Quarterly Report on Form 10-Q for the quarter ended June 30, 2007, File No. 1-12387). | ||
| +10.46 | - | Tenneco Inc. Change in Control Severance Benefit Plan for Key Executives, as Amended and Restated effective December 12, 2007 (incorporated herein by reference to Exhibit 10.61 of the registrant's Annual Report on Form 10-K for the year ended December 31, 2008, File No. 1-12387). | ||
| +10.47 | - | Form of Long-Term Performance Unit Award Under the 2006 Long-Term Incentive Plan (stub period award for 2008) (incorporated herein by reference to Exhibit 10.67 of the registrant's Annual Report on Form 10-K for the year ended December 31, 2007, File No. 1-12387). | ||
| +10.48 | - | Form of Long-Term Performance Unit Award Under the 2006 Long-Term Incentive Plan (three-year award for periods commencing with 2008) (incorporated herein by reference to Exhibit 10.68 of the registrant's Annual Report on Form 10-K for the year ended December 31, 2007, File No. 1-12387). | ||
| +10.49 | - | Letter Agreement dated January 5, 2007 between the registrant and Timothy E. Jackson (incorporated herein by reference to Exhibit 10.69 of the registrant's Annual Report on Form 10-K for the year ended December 31, 2007, File No. 1-12387). | ||
| +10.50 | - | Excess Benefit Plan, including Supplements for Gregg M. Sherrill and Kenneth R. Trammell (incorporated herein by reference to Exhibit 10.65 of the registrant's Annual Report on Form 10-K for the year ended December 31, 2008, File No. 1-12387). | ||
| +10.51 | - | Amendment No. 2 to Change in Control Severance Benefit Plan for Key Executives (incorporated herein by reference to Exhibit 10.66 of the registrant's Annual Report on Form 10-K for the year ended December 31, 2008, File No. 1-12387). | ||
| +10.52 | - | Incentive Deferral Plan, as Amended and Restated Effective as of January 1, 2008 (incorporated herein by reference to Exhibit 10.67 of the registrant's Annual Report on Form 10-K for the year ended December 31, 2008, File No. 1-12387). | ||
| +10.53 | - | Code Section 409A Amendment to 2002 Long-Term Incentive Plan (incorporated herein by reference to Exhibit 10.68 of the registrant's Annual Report on Form 10-K for the year ended December 31, 2008, File No. 1-12387). | ||
| +10.54 | - | Code Section 409A Amendment to 2006 Long-Term Incentive Plan (incorporated herein by reference to Exhibit 10.69 of the registrant's Annual Report on Form 10-K for the year ended December 31, 2008, File No. 1-12387). | ||
| +10.55 | - | Code Section 409A to Excess Benefit Plan (incorporated herein by reference to Exhibit 10.70 of the registrant's Annual Report on Form 10-K for the year ended December 31, 2008, File No. 1-12387). | ||
| +10.56 | - | Code Section 409A Amendment to Supplemental Retirement Plan (incorporated herein by reference to Exhibit 10.71 of the registrant's Annual Report on Form 10-K for the year ended December 31, 2008, File No. 1-12387). | ||
| +10.57 | - | Code Section 409A Amendment to Supplemental Pension Plan for Management (incorporated herein by reference to Exhibit 10.72 of the registrant's Annual Report on Form 10-K for the year ended December 31, 2008, File No. 1-12387). | ||
| +10.58 | - | Code Section 409A Amendment to Amended and Restated Value Added ("TAVA") Incentive Compensation Plan (incorporated herein by reference to Exhibit 10.73 of the registrant's Annual Report on Form 10-K for the year ended December 31, 2008, File No. 1-12387). | ||
| +10.59 | - | Code Section 409A Amendment to Letter Agreement between the registrant and Gregg M. Sherrill (incorporated herein by reference to Exhibit 10.74 of the registrant's Annual Report on Form 10-K for the year ended December 31, 2008, File No. 1-12387). | ||
154
Exhibit Number | Description | |||
| +10.60 | - | Code Section 409A Amendment to Letter Agreement between the registrant and Hari N. Nair (incorporated herein by reference to Exhibit 10.75 of the registrant's Annual Report on Form 10-K for the year ended December 31, 2008, File No. 1-12387). | ||
| +10.61 | - | Code Section 409A Amendment to Letter Agreement between the registrant and Timothy E. Jackson (incorporated herein by reference to Exhibit 10.76 of the registrant's Annual Report on Form 10-K for the year ended December 31, 2008, File No. 1-12387). | ||
| 10.62 | - | Second Amended and Restated Receivables Purchase Agreement, dated as of May 4, 2005, among the registrant, as Servicer, Tenneco Automotive RSA Company, as Seller, Jupiter Securitization Corporation and Liberty Street Funding Corp., as Conduits The Bank of Nova Scotia, JP Morgan Chase Bank, N.A. and the Committed Purchasers from time to time party thereto, and Amendments 1 through 10 thereto (incorporated herein by reference to Exhibit 10.77 of the registrant's Annual Report on Form 10-K for the year ended December 31, 2008, File No. 1-12387). | ||
| 10.63 | - | Amendment No. 11, dated as of April 29, 2009, to Second Amended and Restated Receivable Purchase Agreement (incorporated herein by reference to Exhibit 10.1 of the registrant's Quarterly Report on Form 10-Q for the quarter ended March 31, 2009, File No. 1-12387). | ||
| +10.64 | - | Tenneco Inc. 2006 Long-Term Incentive Plan (as amended and restated effective March 11, 2009) (incorporated herein by reference to Appendix A of the registrant's proxy statement on Schedule 14A, filed with the Securities and Exchange Commission on March 31, 2009, File No. 1-12387). | ||
| 10.65 | - | Amendment No. 12, dated as of June 25, 2009, to Second Amended and Restated Receivable Purchase Agreement (incorporated herein by reference to Exhibit 10.1 of the registrant's Quarterly Report on Form 10-Q for the quarter ended June 30, 2009, File No. 1-12387). | ||
| 10.66 | - | Amendment No. 13, dated as of July 31, 2009, to Second Amended and Restated Receivable Purchase Agreement (incorporated herein by reference to Exhibit 10.2 of the registrant's Quarterly Report on Form 10-Q for the quarter ended June 30, 2009, File No. 1-12387). | ||
| 10.67 | - | Underwriting Agreement, dated November 18, 2009, between Tenneco Inc. and the underwriters named therein (incorporated herein by reference to Exhibit 1.1 of the registrant's Current Report on Form 8-K filed November 19, 2009, File No. 1-12387). | ||
| +10.68 | - | Amendment No. 2, effective January 15, 2010, to Amended and Restated Tenneco Value Added Incentive Compensation Plan (incorporated herein by reference to Exhibit 10.70 of the registrant's Annual Report on Form 10-K for the year ended December 31, 2009, File No. 1-12387). | ||
| +10.69 | - | Amendment dated December 18, 2009, to Tenneco Inc. Incentive Deferral Plan (incorporated herein by reference to Exhibit 10.71 of the registrant's Annual Report on Form 10-K for the year ended December 31, 2009, File No. 1-12387). | ||
| +10.70 | - | Form of Amendment to Long-Term Performance Unit Award under the 2006 Long-Term Incentive Plan (three year award for 2007-2009 period) (incorporated herein by reference to Exhibit 10.72 of the registrant's Annual Report on Form 10-K for the year ended December 31, 2009, File No. 1-12387). | ||
| +10.71 | - | Form of Amendment to Long-Term Performance Unit Award under the 2006 Long-Term Incentive Plan (three year award for 2008-2010 period) (incorporated herein by reference to Exhibit 10.73 of the registrant's Annual Report on Form 10-K for the year ended December 31, 2009, File No. 1-12387). | ||
| 10.72 | - | Amendment No. 14, dated February 19, 2010, to Second Amended and Restated Receivables Purchase Agreement (incorporated herein by reference to Exhibit 10.74 of the registrant's Annual Report on Form 10-K for the year ended December 31, 2009, File No. 1-12387). | ||
155
Exhibit Number | Description | |||
| 10.73 | - | Third Amended and Restated Receivables Purchase Agreement, dated as of March 26, 2010, among Tenneco Automotive RSA Company, as Seller, Tenneco Automotive Operating Company Inc., as Servicer, Falcon Asset Securitization Company LLC and Liberty Street Funding LLC, as Conduits, the Committed Purchasers from time to time party thereto, JPMorgan Chase Bank, N.A., The Bank of Nova Scotia and Wells Fargo Bank, N.A., as Co-Agents and JPMorgan Chase Bank, N.A., as Administrative Agent (incorporated herein by reference to Exhibit 10.1 of the registrant's Current Report on Form 8-K dated as of March 26, 2010, File No. 1-12387). | ||
| 10.74 | - | Intercreditor Agreement, dated as of March 26, 2010, among Tenneco Automotive RSA Company, Tenneco Automotive Operating Company Inc., JPMorgan Chase Bank, N.A. and Wells Fargo Bank, N.A. (incorporated herein by reference to Exhibit 10.2 of the registrant's Current Report on Form 8-K dated as of March 26, 2010, File No. 1-12387). | ||
| 10.75 | - | Omnibus Amendment No. 4, dated as of March 26, 2010, to Receivables Sale Agreements, as amended (incorporated herein by reference to Exhibit 10.3 of the registrant's Current Report on Form 8-K dated as of March 26, 2010, File No. 1-12387). | ||
| 10.76 | - | SLOT Receivables Purchase Agreement, dated as of March 26, 2010, among Tenneco Automotive RSA Company, as Seller, Tenneco Automotive Operating Company Inc., as Servicer, and Wells Fargo Bank, N.A., individually and as SLOT Agent (incorporated herein by reference to Exhibit 10.4 of the registrant's Current Report on Form 8-K dated as of March 26, 2010, File No. 1-12387). | ||
| 10.77 | - | Fourth Amended and Restated Performance Undertaking, dated as of March 26, 2010, by the registrant in favor of Tenneco Automotive RSA Company (incorporated herein by reference to Exhibit 10.5 of the registrant's Current Report on Form 8-K dated as of March 26, 2010, File No. 1-12387). | ||
| +10.78 | - | Form of Tenneco Inc. Three Year Long-Term Performance Unit Award Agreement (incorporated herein by reference to Exhibit 10.1 of the registrant's Current Report on Form 8-K dated as of March 15, 2010, File No. 1-12387). | ||
| +10.79 | - | Form of Tenneco Inc. 2006 Long-Term Incentive Plan Restricted Stock Award Agreement (incorporated herein by reference to Exhibit 10.1 of the registrant's Quarterly Report on Form 10-Q for the quarter ended September 30, 2010, File No. 1-12387). | ||
| +10.80 | - | Second Amendment to Tenneco Inc. Incentive Deferral Plan effective as of January 1, 2011 (incorporated herein by reference to Exhibit 10.1 of the registrant's Quarterly Report on Form 10-Q for the quarter ended September 30, 2010, File No. 1-12387). | ||
| 10.81 | - | Amendment No. 1 to Third Amended and Restated Receivables Purchase Agreement, dated as of March 25, 2011, among Tenneco Automotive RSA Company, as Seller, Tenneco Automotive Operating Company Inc., as Servicer, Falcon Asset Securitization Company LLC and Liberty Street Funding LLC, as Conduits, the Committed Purchasers from time to time party thereto, JPMorgan Chase Bank, N.A., The Bank of Nova Scotia and Wells Fargo Bank, N.A., as Co-Agents and JPMorgan Chase Bank, N.A., as Administrative Agent (incorporated herein by reference from Exhibit 10.1 of the registrant's Current Report on Form 8-K dated as of March 29, 2011, File No. 1-12387). | ||
| 10.82 | - | Amendment No. 1 to SLOT Receivables Purchase Agreement, dated as of March 25, 2011, among Tenneco Automotive RSA Company, as Seller, Tenneco Automotive Operating Company Inc. as Servicer, and Wells Fargo Bank, N.A., individually and as SLOT Agent (incorporated herein by reference from Exhibit 10.2 of the registrant's Current Report on Form 8-K dated as of March 29, 2011, File No. 1-12387). | ||
| +10.83 | - | First Amendment to Tenneco Inc. Change in Control Severance Benefit Plan for Key Executives, as Amended and Restated effective December 12, 2007 (incorporated herein by reference to Exhibit 10.3 of the registrant's Quarterly Report on Form 10-Q for the quarter ended March 31, 2011, File No. 1-12387). | ||
156
Exhibit Number | Description | |||
| +10.84 | - | Form of Restricted Stock Award for Non-Employee Directors (incorporated herein by reference to Exhibit 10.1 of the registrant's Current Report on Form 8-K dated January 18, 2012, File No. 1-12387). | ||
| +10.85 | - | Form of Restricted Stock Award for Employees (incorporated herein by reference to Exhibit 10.2 of the registrant's Current Report on Form 8-K dated January 18, 2012, File No. 1-12387). | ||
| +10.86 | - | Form of Non-Qualified Stock Option Agreement for Employees (incorporated herein by reference to Exhibit 10.3 of the registrant's Current Report on Form 8-K dated January 18, 2012, File No. 1-12387). | ||
| +*10.87 | - | General Manager Service Contract, dated as of March 1, 2007, between Heinrich Gillet GmbH and Josep Fornos. | ||
| +*10.88 | Letter of Understanding, dated as of December 2, 2010, between Tenneco Inc. and Josep Fornos. | |||
| 11 | - | None. | ||
| *12 | - | Computation of Ratio of Earnings to Fixed Charges. | ||
| 13 | - | None. | ||
| 14 | - | Tenneco Inc. Code of Ethical Conduct for Financial Managers (incorporated herein by reference from Exhibit 99.3 to the registrant's Annual Report on Form 10-K for the year ended December 31, 2002, File No. 1-12387). | ||
| 16.1 | - | Letter from Deloitte & Touche LLP to the Securities and Exchange Commission dated August 6, 2009 (incorporated herein by reference to Exhibit 10.1 of the registrant's Current Report on Form 8-K dated August 6, 2009, File No. 1-12387). | ||
| 16.2 | - | Letter from Deloitte & Touche LLP to the Securities and Exchange Commission dated March 3, 2010 (incorporated herein by reference to Exhibit 16.1 of the registrant's Current Report on Form 8-K dated March 3, 2010, File No. 1-12387). | ||
| 18 | - | None. | ||
| *21 | - | List of Subsidiaries of Tenneco Inc. | ||
| 22 | - | None. | ||
| *23.1 | - | Consent of PricewaterhouseCoopers LLP. | ||
| *23.2 | - | Consent of Deloitte & Touche LLP. | ||
| *24 | - | Powers of Attorney. | ||
| *31.1 | - | Certification of Gregg M. Sherrill under Section 302 of the Sarbanes-Oxley Act of 2002. | ||
| *31.2 | - | Certification of Kenneth R. Trammell under Section 302 of the Sarbanes-Oxley Act of 2002. | ||
| *32.1 | - | Certification of Gregg M. Sherrill and Kenneth R. Trammell under Section 906 of the Sarbanes-Oxley Act of 2002. | ||
| 33 | - | None. | ||
| 34 | - | None. | ||
| 35 | - | None. | ||
| 99 | - | None. | ||
| 100 | - | None. | ||
| 101 | - | None. | ||
| *101.INS | - | XBRL Instance Document. | ||
| *101.SCH | - | XBRL Taxonomy Extension Schema Document. | ||
| *101.CAL | - | XBRL Taxonomy Extension Calculation Linkbase Document. | ||
| *101.DEF | - | XBRL Taxonomy Extension Definition Linkbase Document. | ||
| *101.LAB | - | XBRL Taxonomy Extension Label Linkbase Document. | ||
| *101.PRE | - | XBRL Taxonomy Extension Presentation Linkbase Document. | ||
| * | Filed herewith. |
| + | Indicates a management contract or compensatory plan or arrangement. |
157
SIGNATURES
Pursuant to the requirements of Section 13 or 15(d) of the Securities Exchange Act of 1934, the registrant has duly caused this report to be signed on its behalf by the undersigned, thereunto duly authorized.
| TENNECO INC. | ||
| By | / S / G REGG M. S HERRILL | |
| Gregg M. Sherrill | ||
| Chairman and Chief Executive Officer | ||
Date: February 24, 2012
Pursuant to the requirements of the Securities Exchange Act of 1934 this report has been signed by the following persons in the capacities indicated on February 24, 2011.
Signature | Title | |||
/ S / G REGG M. S HERRILL Gregg M. Sherrill | Chairman, President and Chief Executive Officer and Director (principal executive officer) | |||
/ S / K ENNETH R. T RAMMELL Kenneth R. Trammell | Executive Vice President and Chief Financial Officer (principal financial officer) | |||
* Paul D. Novas | Vice President and Controller (principal accounting officer) | |||
* Dennis J. Letham | Director | |||
* Hari N. Nair | Director | |||
* Roger B. Porter | Director | |||
* David B. Price, Jr. | Director | |||
* Paul T. Stecko | Director | |||
* Mitsunobu Takeuchi | Director | |||
* Jane L. Warner | Director | |||
*By: | / S / K ENNETH R. T RAMMELL Kenneth R. Trammell Attorney in fact | |||
158