UNITED STATES
SECURITIES AND EXCHANGE COMMISSION
Washington, DC 20549
FORM 10-K
| x | ANNUAL REPORT PURSUANT TO SECTION 13 OR 15(d) OF THE SECURITIES EXCHANGE ACT OF 1934 |
For the fiscal year ended June 30, 2013
| ¨ | TRANSITION REPORT PURSUANT TO SECTION 13 OR 15(d) OF THE SECURITIES EXCHANGE ACT OF 1934 |
For the transition period from to
Commission File Number: 000-17272
TECHNE CORPORATION
(Exact name of Registrant as specified in its charter)
| Minnesota | 41-1427402 | |
(State of Incorporation) | (IRS Employer Identification No.) | |
| 614 McKinley Place N.E., Minneapolis, MN | 55413-2610 | |
| (Address of principal executive offices) | (Zip Code) | |
Registrant's telephone number: (612) 379-8854
Securities registered pursuant to Section 12(b) of the Act: Common Stock, $0.01 par value
Name of each exchange on which registered: The Nasdaq Stock Market LLC
(Nasdaq Global Select Market)
Securities registered pursuant to Section 12(g) of the Act: None
Indicate by check mark if the registrant is a well-known seasoned issuer, as defined in Rule 405 of the Securities Act. Yes x No ¨
Indicate by check mark if the registrant is not required to file reports pursuant to Section 13 or 15(d) of the Act. Yes ¨ No x
Indicate by check mark whether the registrant (1) has filed all reports required to be filed by section 13 or 15(d) of the Securities Exchange Act of 1934 during the preceding 12 months (or for such shorter period that the registrant was required to file such reports), and (2) has been subject to such filing requirements for the past 90 days: Yes x No ¨
Indicate by check mark whether the registrants has submitted electronically and posted on its corporate Web site, if any, every Interactive Data File required to be submitted and posted pursuant to Rule 405 of Regulation S-T (§232.405 of this chapter) during the preceding 12 months (or for such shorter period that the registrant was required to submit and post such files). Yes x No ¨
Indicate by check mark if disclosure of delinquent filers pursuant to Item 405 of Regulation S-K is not contained herein, and will not be contained, to the best of registrant's knowledge, in definitive proxy or information statements incorporated by reference in Part III of this Form 10-K or any amendment to this Form 10-K. ¨
Indicate by check mark whether the registrant is a large accelerated filer, an accelerated filer, a non-accelerated filer, or a smaller reporting company. See the definitions of "large accelerated filer," "accelerated filer" and "smaller reporting company" in Rule 12b-2 of the Exchange Act.
| Large accelerated filer | x | Accelerated filer | ¨ | |||
| Non-accelerated filer | ¨ | Small reporting company | ¨ | |||
Indicate by check mark whether the Registrant is a shell company (as defined in Exchange Act Rule 12b-2). Yes ¨ No x
The aggregate market value of the Common Stock held by non-affiliates of the Registrant, based upon the closing sale price on December 31, 2012 as reported on The Nasdaq Stock Market ($68.34 per share) was approximately $2.2 billion. Shares of Common Stock held by each officer and director and by each person who owns 5% or more of the outstanding Common Stock have been excluded.
Shares of $0.01 par value Common Stock outstanding at August 23, 2013: 36,844,944
DOCUMENTS INCORPORATED BY REFERENCE
Portions of the Company's Proxy Statement for its 2013 Annual Meeting of Shareholders are incorporated by reference into Part III.
TABLE OF CONTENTS
| Page | ||||
PART I | ||||
Item 1. Business | 1 | |||
Item 1A. Risk Factors | 8 | |||
Item 1B. Unresolved Staff Comments | 12 | |||
Item 2. Properties | 12 | |||
Item 3. Legal Proceedings | 13 | |||
Item 4. Mine Safety Disclosures | 13 | |||
PART II | ||||
Item 5. Market for the Registrant's Common Equity, Related Shareholder Matters and Issuer Purchases of Equity Securities | 13 | |||
Item 6. Selected Financial Data | 15 | |||
Item 7. Management's Discussion and Analysis of Financial Condition and Results of Operations | 16 | |||
Item 7A. Quantitative and Qualitative Disclosures about Market Risk | 26 | |||
Item 8. Financial Statements and Supplementary Data | 28 | |||
Item 9. Changes in and Disagreements with Accountants on Accounting and Financial Disclosure | 45 | |||
Item 9A. Controls and Procedures | 45 | |||
Item 9B. Other Information | 46 | |||
PART III | ||||
Item 10. Directors, Executive Officers and Corporate Governance | 46 | |||
Item 11. Executive Compensation | 46 | |||
Item 12. Security Ownership of Certain Beneficial Owners and Management and Related Shareholder Matters | 47 | |||
Item 13. Certain Relationships and Related Transactions, and Director Independence | 47 | |||
Item 14. Principal Accounting Fees and Services | 47 | |||
PART IV | ||||
Item 15. Exhibits, Financial Statement Schedules | 48 | |||
SIGNATURES | 49 | |||
i
PART I
ITEM 1. BUSINESS
OVERVIEW
Techne Corporation and subsidiaries (the Company) are engaged in the development, manufacture and sale of biotechnology products and clinical diagnostic controls. These activities are conducted domestically through its wholly-owned subsidiaries, R&D Systems, Inc. (R&D Systems), Boston Biochem, Inc. (Boston Biochem), and BiosPacific, Inc. (BiosPacific). The Company's European biotechnology operations are conducted through its wholly-owned U.K. subsidiaries, R&D Systems Europe Ltd. (R&D Europe) and Tocris Holdings Limited (Tocris). R&D Europe has a sales subsidiary, R&D Systems GmbH, in Germany and a sales office in France. The Company distributes its biotechnology products in China through its wholly-owned subsidiary, R&D Systems China Co., Ltd. (R&D China). R&D China has a sales subsidiary, R&D Systems Hong Kong Ltd., in Hong Kong.
The Company has two reportable segments based on the nature of its products (biotechnology and clinical controls). R&D Systems' Biotechnology Division, R&D Europe, Tocris, R&D China, BiosPacific and Boston Biochem are included in the biotechnology reporting segment. The Company's biotechnology reporting segment develops, manufactures and sells biotechnology research and diagnostic products world-wide. The Company's clinical controls reporting segment (formerly hematology), which consists of R&D Systems' Clinical Controls Division, develops and manufactures controls and calibrators for sale world-wide.
On July 22, 2013, the Company acquired Bionostics Holdings Limited (Bionostics) and its U.S. operating subsidiary, Bionostics, Inc. Bionostics is a global leader in the development, manufacture and distribution of clinical control solutions that verify the proper operation of in-vitro diagnostic devices primarily utilized in point of care blood glucose and blood gas testing. All of the shares of Bionostics were acquired for approximately $104 million in cash, subject to adjustment following closing based on the final level of working capital of Bionostics. Bionostics will become part of the Company's clinical controls segment.
THE MARKET
The Company manufactures and sells products for the biotechnology research market and the clinical diagnostics market. In fiscal 2013, 2012 and 2011, net sales from the Company's biotechnology segment were 93% of consolidated net sales in each year. The Company's clinical controls segment net sales were 7% of consolidated net sales for each of fiscal 2013, 2012 and 2011. Financial information relating to the Company's segments is incorporated herein by reference to Note L to the Consolidated Financial Statements included in Item 8 of this Annual Report on Form 10-K.
Biotechnology Segment
The Company, through its biotechnology segment, is one of the world's leading suppliers of specialized proteins, such as cytokines and related reagents, to the biotechnology research community. These valuable proteins are produced in minute amounts by different types of cells and can be isolated from these cells or synthesized through recombinant DNA technology. Currently, nearly all of the Company's proteins are produced by recombinant DNA technology.
The growing interest by academic and commercial researchers in cytokines is largely due to the profound effect that a tiny amount of a cytokine can have on cells and tissues. Cytokines are intercellular messengers. They act as signaling agents by interacting with specific receptors on the affected cells and trigger events that can lead to significant changes in a cell, tissue or organ. For example, cytokines can induce cells to acquire more specialized functions and features. Another example of the beneficial action of cytokines is their key role played in attracting cells at the site of injury, inducing them to grow and divide and initiate the healing process. Unregulated cytokine production and action can have non-beneficial effects and lead to various pathologies.
1
The Company also produces and markets enzymes and intracellular signaling reagents. Enzymes are proteins which act as biological catalysts that accelerate a variety of chemical reactions in cells. Most enzymes, including proteases, kinases and phosphatases, are proteins that modify the structure and function of other proteins. Additionally, both enzymes and cytokines have the potential to serve as predictive biomarkers and therapeutic targets for a variety of diseases and conditions including cancer, Alzheimer's, arthritis, autoimmunity, diabetes, hypertension, obesity, inflammation, AIDS and influenza.
The Company markets a variety of immunoassays on different testing platforms, including a microtiter plated based kit sold under the trade name Quantikine ® , immunoassays based on encoded beads technology and immunoassays based on spotted surfaces. All of these immunoassay products are used by researchers to quantify the level of a specific protein in biological fluids, such as serum, plasma, or urine. Protein quantification is an integral component of basic research and as a valuable indicator of the effects of new therapeutic compounds in the pharmaceutical drug discovery and development process.
With the acquisition of Tocris in April 2011, the Company added chemically-based products to its biotechnology segment. Tocris products are small compounds, sold in highly purified forms typically with agonistic or antagonistic properties in a variety of biological processes. The addition of Tocris products to the Company's product lines allows customers to have access to the broadest range of compounds and biological reagents to meet their life science research needs. The Company's combined chemical and biological reagents portfolio provide new tools which customers can use in solving the complexity of important biological pathways and glean knowledge which may lead to a fuller understanding of biological processes and ultimately to the development of novel strategies to address different pathologies.
The Company currently manufactures and sells approximately 24,000 biotechnology products.
Biotechnology Products
Proteins. Cytokines and enzymes, extracted from natural sources or produced using recombinant DNA technology, are manufactured to the highest possible purity. Proteins, including enzyme substrates and inhibitors, are highly purified and characterized to ensure the highest biological activity.
Antibodies. Antibodies are specialized proteins produced by the immune system of an animal that recognize and bind to target molecules. The Company's polyclonal antibodies are produced in animals (primarily goats, sheep and rabbits) and purified from the animals' blood. Monoclonal antibodies are derived from immortalized rodent cell lines and are isolated from cell culture medium.
Immunoassays. The immunoassay product line includes Quantikine kits for the detection of human and animal proteins using 96-well plates, along with immunoassays on other testing platforms, which allow researchers to quantify the amount of a specific analyte (typically a cytokine, adhesion molecule or an enzyme) in a sample derived from any biological fluid.
Clinical Diagnostic Immunoassay Kits. The Company has received Food and Drug Administration (FDA) marketing clearance for its erythropoietin (EPO), transferrin receptor (TfR) and Beta2-microglobulin (ß2M) immunoassays for use as in vitro diagnostic devices.
Flow Cytometry Products. This product line includes fluorochrome labeled antibodies and kits, which are used to determine the immuno-phenotypic properties of cells from different tissues.
Intracellular Signaling Products. This diverse product line provides reagents to elucidate signal transduction pathways within cells. Products include antibodies, phospho-specific antibodies, antibody arrays, active caspases, kinases, phosphatases, and enzyme-linked immunosorbant assay (ELISA) assays to measure the activity of apoptotic and signaling molecules.
Small Molecule Chemically-based Products. These products include small natural or synthetic chemical compounds used by investigators as agonists, antagonists and/or inhibitors of various biological functions. Used in concert with other Company products, they provide additional tools to elucidate key pathways of cellular functions and can provide insight into the drug discovery process.
2
The Company sells its biotechnology products directly to customers in North America, most of Western Europe and to certain customers in China. Third party distributors are used in the remainder of China and Europe and in the rest of the world.
Clinical Controls Segment (formerly the Hematology Segment)
Proper diagnosis of many illnesses requires a thorough and accurate analysis of a patient's blood cells, which is usually done with automated or semi-automated hematology instruments. One of the most frequently performed laboratory tests on a blood sample is a complete blood count (CBC). Doctors use this test in disease screening and diagnosis.
Hematology controls and calibrators are products derived from various cellular components of blood which have been stabilized. Control and calibrator products can be utilized to ensure that hematology instruments are performing accurately and reliably. Ordinarily, a hematology control is used once to several times a day to make sure the instrument is reading accurately. In addition, most instruments need to be calibrated periodically. Hematology calibrators are similar to controls, but undergo additional testing to ensure that the calibration values assigned are within tight specifications and can be used to calibrate the instrument.
The Company offers a wide range of hematology controls and calibrators for both impedance and laser type cell counters. The Company believes its products have improved stability and versatility and a longer shelf life than most of those of its competitors. Hematology control products are also supplied for use as proficiency testing tools by laboratory certifying authorities in a number of states and countries.
Original Equipment Manufacturer (OEM) agreements represent the largest market for clinical controls made by the Company. In fiscal 2013, 2012 and 2011, OEM agreements accounted for $10.8 million, $9.7 million and $8.7 million, respectively, or 3% of total consolidated net sales in each fiscal year. The Company sells its clinical control products directly to customers in the United States and through distributors in the rest of the world.
PRODUCTS UNDER DEVELOPMENT
The Company is engaged in ongoing research and development in all of its major product lines: controls and calibrators and cytokines, antibodies, assays, small bioactive molecules and related biotechnology products. The Company believes that its future success depends, to a large extent, on its ability to keep pace with changing technologies and markets. At the same time, the Company continues to examine its production processes to ensure high quality and maximum efficiency.
In fiscal 2013, the Company introduced 2,100 new biotechnology products. The Company is planning to release new proteins, antibodies, immunoassay products and chemically-based research reagents in the coming year. All of these products will be for research use only and therefore do not require FDA clearance. The Company also developed several new clinical diagnostic products in fiscal 2013 and is continuously working to expand these product lines along with ongoing product improvements and enhancements. However, there is no assurance that any of the products in the research and development phase can be successfully completed or, if completed, can be successfully introduced into the marketplace.
| Year Ended June 30, | ||||||||||||
| 2013 | 2012 | 2011 | ||||||||||
Research expense (in thousands): | ||||||||||||
Biotechnology | $ | 28,441 | $ | 27,112 | $ | 25,176 | ||||||
Clinical Controls | 816 | 800 | 809 | |||||||||
|
|
|
|
|
| |||||||
| $ | 29,257 | $ | 27,912 | $ | 25,985 | |||||||
|
|
|
|
|
| |||||||
Percent of net sales | 9.4 | % | 8.9 | % | 9.0 | % | ||||||
3
INVESTMENTS
The Company has an approximately 15.0% equity investment in ChemoCentryx, Inc. (CCXI). CCXI is a technology and drug development company working in the area of chemokines. Chemokines are cytokines which regulate the trafficking patterns of leukocytes, the effector cells of the human immune system. At June 30, 2011, the Company had a $14.3 million investment in the preferred stock of CCXI and accounted for the investment on a cost basis. The investment was included in "Investments in unconsolidated entities" at June 30, 2011. In September 2011, the Company entered into a $10.0 million loan agreement with CCXI. The loan agreement contained a number of conversion features contingent upon CCXI obtaining future debt or equity financing. The agreement also included a $5.0 million commitment by the Company to participate in a private placement in the event of a successful public offering of CCXI shares. On February 8, 2012, CCXI completed its initial public offering (IPO) at $10 per share. Upon the close of the IPO, the Company's investment in CCXI's preferred shares and the loan, plus accrued interest, converted into CCXI common stock. The Company invested an additional $5.0 million in the private placement, as discussed above, and received ten year warrants to purchase 150,000 shares of CCXI common stock at $20 per share. The Company's investment in CCXI is included in "Short-term available-for-sale investments" at June 30, 2013 and 2012 at fair values of $89.6 million and $94.7 million, respectively.
The Company has a 6.5% ownership percentage in H2Equity, LLC (formerly Hemerus Medical, LLC). The Company accounts for its investment in H2Equity under the equity method of accounting as H2Equity is a limited liability company. During fiscal 2012, H2Equity entered into an agreement to sell substantially all of its assets. The sale closed in April 2013. The Company received a $1.1 million distribution at closing and recorded a gain of $708,000. The Company's net investment in H2Equity was $26,000 and $551,000 at June 30, 2013 and 2012, respectively.
The Company has a 16.8% ownership interest in Nephromics LLC (Nephromics). The Company accounts for its investment in Nephromics under the equity method of accounting as Nephromics is a limited liability company. During fiscal 2012, Nephromics signed an agreement to sell substantially all of its assets. The sale price included a payment at closing, future payment contingent upon the issuance of certain patents, and royalties on future sublicense income. As a result of the agreement, the Company determined that a portion of its investment in Nephromics was other-than-temporarily impaired and wrote off $2.4 million of this investment in fiscal 2012. The Company's net investment in Nephromics was $505,000 at both June 30, 2013 and 2012.
The Company held an ownership interest in ACTGen, Inc. (ACTGen), a development stage biotechnology company located in Japan through October 2012. During fiscal 2012, the Company determined that the Company's investment in ACTGen was other-than-temporarily impaired and wrote off its remaining investment of $854,000.
GOVERNMENT REGULATION
All manufacturers of clinical diagnostic controls are regulated under the Federal Food, Drug and Cosmetic Act, as amended. All of the Company's clinical control products are classified as " in vitro diagnostic products" by the FDA. The entire control manufacturing process, from receipt of raw materials to the monitoring of control products through their expiration date, is strictly regulated and documented. FDA inspectors make periodic site inspections of the Company's clinical control operations and facilities. Clinical control manufacturing must comply with Quality System Regulations (QSR) as set forth in the FDA's regulations governing medical devices.
Three of the Company's immunoassay kits, EPO, TfR and ß2M, have FDA clearance to be sold for clinical diagnostic use. The Company must comply with QSR for the manufacture of these kits. Biotechnology products manufactured in the United States and sold for use in the research market do not require FDA clearance. Tocris products are used as research tools and require no regulatory approval for commercialization. Some of Tocris' products are considered controlled substances and require government permits to stock such products and to ship them to end-users. The Company has no reason to believe that these annual permits will not be re-issued.
4
Some of the Company's research groups use small amounts of radioactive materials in the form of radioisotopes in their product development activities. Thus, the Company is subject to regulation and inspection by the Minnesota Department of Health and has been granted a license through August 2014. The license is renewable annually. The Company has had no difficulties in renewing this license in prior years and has no reason to believe it will not be renewed in the future. If, however, the license was not renewed, it would have minimal effect on the Company's business since there are other technologies the research groups could use to replace the use of radioisotopes.
Beginning January 1, 2013, the Company was subject to the medical device excise tax which was included as part of the Affordable Care Act. The tax applies to the sale of medical devices by a manufacturer, producer or importer of the device and is 2.3% of the sale price. The tax applies to the Company's in vitro diagnostic products, including its clinical control products and biotechnology clinical diagnostic immunoassay kits. The Company's medical device excise tax for fiscal 2013 was $91,000.
AVAILABILITY OF RAW MATERIALS
The primary raw material for the Company's clinical controls is whole blood. Human blood is purchased from commercial blood banks, while porcine and bovine blood is purchased from nearby meat processing plants. After raw blood is received, it is separated into its components, processed and stabilized. Although the cost of human blood has increased due to the requirement that it be tested for certain diseases and pathogens, the higher cost of these materials has not had a material adverse effect on the Company's business. The Company does not perform its own pathogen testing as the supplier tests all human blood purchased.
R&D Systems' Biotechnology Division develops and manufactures the majority of its cytokines from synthetic genes developed in-house, thus significantly reducing its reliance on outside resources. R&D Systems typically has several outside sources for all critical raw materials necessary for the manufacture of products. Tocris sources its raw material from multiple world-wide sources. Many of the starting components used in the chemical synthesis are widely available products and no single source of raw reagents poses a supply risk to this business.
PATENTS AND TRADEMARKS
The Company owns patent protection for certain clinical controls which extend for various periods depending on the date of the patent application or patent grant. The Company is not substantially dependent on products for which it has obtained patent protection. Sales of such products are not material to the Company's financial results.
The Company may seek patent protection for new or existing products it manufactures. No assurance can be given that any such patent protection will be obtained. No assurance can be given that the Company's products do not infringe upon patents or proprietary rights owned or claimed by others, particularly for genetically engineered products. The Company has not conducted a patent infringement study for each of its products. For more information on patent litigation, see Item 3 "Legal Proceedings" in this Annual Report on Form 10-K.
The Company has a number of licensing agreements with patent holders under which it has the non-exclusive right to use patented technology or the non-exclusive right to manufacture and sell certain patented proteins and related products to the research market. For fiscal 2013, 2012 and 2011, total royalties expensed under these licenses were approximately $3.3 million, $3.2 million and $3.4 million, respectively.
The Company has obtained federal trademark registration for certain of its clinical controls and biotechnology product groups which extend for various periods depending upon the date of the trademark grant. The Company believes it has common law trademark rights to certain marks in addition to those which it has registered.
SEASONALITY OF BUSINESS
Biotechnology segment products marketed by the Company historically experience a slowing of sales or of the rate of sales growth during the summer months. The Company also usually experiences a slowing of sales in both of its reportable segments during the Thanksgiving to New Year holiday period. The Company believes this seasonality is a result of vacation schedules in Europe and Japan and of academic schedules in the United States.
5
SIGNIFICANT CUSTOMERS
No single customer in either reportable segment accounted for more than 10% of the Company's consolidated net sales during fiscal 2013, 2012 or 2011.
BACKLOG
There was no significant backlog of orders for the Company's products as of the date of this Annual Report on Form 10-K or as of a comparable date for fiscal 2012. The majority of the Company's biotechnology products are shipped within one day of receipt of the customers' orders. The majority of the Company's clinical control products are shipped based on a preset, recurring schedule.
COMPETITION
The worldwide market for protein related and chemically-based research reagents is being supplied by a number of companies, including GE Healthcare Life Sciences, BD Biosciences, Merck KGaA/EMD Chemicals, Inc., Life Technologies Corporation, Millipore Corporation, PeproTech, Inc., Santa Cruz Biotechnology, Inc., Abcam plc., Sigma-Aldrich Corporation, Thermo Fisher Scientific, Inc., Cayman Chemical Company and Enzo Biochem, Inc. The Company believes that it is one of the leading world-wide suppliers of cytokine related products in the research marketplace. The Company further believes that the expanding line of its products, their recognized quality, and the growing demand for protein related and chemically-based research reagents will allow the Company to remain competitive in the growing biotechnology research and diagnostic market.
Competition is intense in the clinical control business. The first control products were developed in response to the rapid advances in electronic instrumentation used in hospital and clinical laboratories for blood cell counting. Historically, most of the instrument manufacturing companies made controls for use in their own instruments. With rapid expansion of the instrument market, however, a need for more versatile controls enabled non-instrument manufacturers to gain a foothold. Today the market is composed of manufacturers of laboratory reagents, chemicals and coagulation products and independent control manufacturers in addition to instrument manufacturers. The principal clinical diagnostic control competitors for the Company's retail products are Abbott Diagnostics, Beckman Coulter, Inc., Bio-Rad Laboratories, Inc., Streck, Inc., Siemens Healthcare Diagnostics Inc. and Sysmex Corporation. The Company believes it is the third largest supplier of hematology controls in the marketplace behind Beckman Coulter, Inc. and Streck, Inc.
EMPLOYEES
Through its subsidiaries, the Company employed 789 full-time and 65 part-time employees as of June 30, 2013, as follows:
| Full-time | Part-time | |||||||
U.S. | 665 | 35 | ||||||
Europe | 105 | 29 | ||||||
Asia | 19 | 1 | ||||||
|
|
|
| |||||
| 789 | 65 | |||||||
|
|
|
| |||||
ENVIRONMENT
Compliance with federal, state and local environmental protection laws in the United States, United Kingdom, Germany, China and Hong Kong had no material effect on the Company in fiscal 2013.
6
GEOGRAPHIC AREA FINANICAL INFORMATION
Following is financial information relating to geographic areas (in thousands):
| Year Ended June 30, | ||||||||||||
| 2013 | 2012 | 2011 | ||||||||||
External sales | ||||||||||||
United States | $ | 164,308 | $ | 172,310 | $ | 159,857 | ||||||
Europe | 88,297 | 90,142 | 83,676 | |||||||||
China | 14,106 | 11,378 | 8,299 | |||||||||
Other Asia | 28,608 | 25,988 | 24,715 | |||||||||
Rest of world | 15,256 | 14,742 | 13,415 | |||||||||
|
|
|
|
|
| |||||||
Total external sales | $ | 310,575 | $ | 314,560 | $ | 289,962 | ||||||
|
|
|
|
|
| |||||||
| As of June 30, | ||||||||||||
| 2013 | 2012 | 2011 | ||||||||||
Long-lived assets | ||||||||||||
United States | $ | 103,541 | $ | 87,968 | $ | 88,802 | ||||||
Europe | 7,129 | 7,528 | 7,819 | |||||||||
China | 117 | 141 | 96 | |||||||||
|
|
|
|
|
| |||||||
Total long-lived assets | $ | 110,787 | $ | 95,637 | $ | 96,717 | ||||||
|
|
|
|
|
| |||||||
Net sales are attributed to countries based on the location of the customer/distributor. Long-lived assets are comprised of land, buildings and improvements and equipment, net of accumulated depreciation and other assets. See the description of risks associated with the Company's foreign subsidiaries in Item 1A of this Annual Report on Form 10-K.
INVESTOR INFORMATION
The Company is subject to the information requirements of the Securities Exchange Act of 1934 (the Exchange Act). Therefore, the Company files periodic reports, proxy statements, and other information with the Securities and Exchange Commission (SEC). Such reports, proxy statements, and other information may be obtained by visiting the Public Reference Room of the SEC at 100 F Street, N.E., Room 1580, Washington, DC 20549 or by calling the SEC at 1-800-SEC-0330. In addition, the SEC maintains an internet site (http://www.sec.gov) that contains reports, proxy and information statements, and other information regarding issuers that file electronically.
Financial and other information about the Company is available on its web site (http://www.techne-corp.com). The Company makes available on its web site copies of its Annual Report on Form 10-K, Quarterly Reports on Form 10-Q, Current Reports on Form 8-K, and amendments to those reports filed or furnished pursuant to Section 13 or 15(d) of the Exchange Act as soon as reasonably practicable after filing such material electronically or otherwise furnishing it to the SEC.
EXECUTIVE OFFICERS OF THE REGISTRANT
Currently, the names, ages and positions of each executive officer of the Company are as follows:
Name | Age | Position | Officer Since | |||||||
Charles Kummeth | 52 | President, Chief Executive Officer and Director | 2013 | |||||||
Gregory J. Melsen | 61 | Vice President of Finance, Treasurer and Chief Financial Officer | 2004 | |||||||
Marcel Veronneau | 59 | Senior Vice President, Clinical Controls | 1995 | |||||||
Kevin Reagan | 61 | Senior Vice President, Biotech | 2013 | |||||||
J. Fernando Bazan | 53 | Chief Technical Officer | 2013 | |||||||
7
The term of office of each executive officer is annual or until a successor is elected. There are no arrangements or understandings among any of the executive officers and any other person (not an officer or director acting as such) pursuant to which any of the executive officers was selected as an officer of the Company.
Charles Kummeth has been President and Chief Executive Officer of the Company since April 1, 2013. Prior to joining the Company, he served as President of Mass Spectrometry and Chromatography at Thermo Fisher Scientific Inc. from September 2011. He was President of that company's Laboratory Consumables Division from 2009 to September 2011. Prior to joining Thermo Fisher, Mr. Kummeth served in various roles at 3M Corporation, most recently as the Vice President of the company's Medical Division from 2006 to 2008.
Gregory J. Melsen joined the Company in December 2004 as Vice President of Finance and Chief Financial Officer. In October 2010, he also assumed the role of Treasurer. Prior to 2004, he held various vice president and chief financial officer positions at several publicly traded companies and was employed by a public accounting firm for 19 years, including nine years as an audit partner.
Marcel Veronneau was appointed as Vice President, Clinical Controls (formerly Hematology) for the Company in March 1995. Prior thereto, he served as Director of Operations for R&D Systems' Clinical Controls Division since joining the Company in 1993.
Dr. Kevin Reagan was appointed Senior Vice President, Biotech on August 1, 2013. Dr. Reagan joined the Company in January 2012 as R&D Systems' Vice President of Immunology. Prior to joining the Company, Dr. Reagan served as Managing Director of Calbiotech Veterinary Diagnostics from 2010 through 2011 and Senior Vice President of Calbiotech, Inc from 2009 through 2011. From 2005 through 2009, he served as Vice President, R&D, Immunological Systems at Invitrogen, Corp,, a division of Life Technologies Corporation.
Dr. J. Fernando Bazan was appointed Chief Technical Officer when he joined the Company on August 1, 2013. Dr. Bazan is an adjunct profession at the University of Minnesota School of Medicine and served as Chief Scientific Officer at Neuroscience, Inc., a neuroimmunology startup from 2010 to 2012. From 2003 through 2010, Dr. Bazan served as Senior Scientist at Genentech, Inc. (Roche).
ITEM 1A. RISK FACTORS
Statements in this Annual Report on Form 10-K, and elsewhere, that are forward-looking involve risks and uncertainties which may affect the Company's actual results of operations. Certain of these risks and uncertainties which have affected and, in the future, could affect the Company's actual results are discussed below. The Company undertakes no obligation to update or revise any forward-looking statements made due to new information or future events. Investors are cautioned not to place undue emphasis on these statements.
The following risk factors should be read carefully in connection with evaluation of the Company's business and any forward-looking statements made in this Annual Report on Form 10-K and elsewhere. Any of the following risks or others discussed in this Annual Report on Form 10-K or the Company's other SEC filings, could materially adversely affect the Company's business, operating results and financial condition.
The Company's future growth is dependent on the development of new products in a rapidly changing technological environment.
A major element of the Company's growth strategy is to increase revenues through new product releases. As a result, the Company must anticipate industry trends and develop products in advance of customer needs. New product development requires planning, designing and testing at both technological and manufacturing-process levels and may require significant research and development expenditures. There can be no assurance that any products now in development, or that the Company may seek to develop in the future, will achieve feasibility or gain market acceptance. There can also be no assurance that the Company's competitors will not succeed in developing technologies and products that are more effective than any which have been or are being developed by the Company or that would render the Company's technologies and products obsolete or noncompetitive.
8
Changes in economic conditions could negatively impact the Company's revenues and earnings.
The Company's biotechnology products are sold primarily to research scientists at pharmaceutical and biotechnology companies and at university and government research institutions. Research and development spending by the Company's customers and the availability of government research funding can fluctuate based on spending priorities and general economic conditions. An economic downturn or a reduction or delay in governmental funding could cause customers to delay or forego purchases of the Company's products. The Company carries essentially no backlog of orders and changes in the level of orders received and filled daily can cause fluctuations in quarterly revenues and earnings.
The biotechnology and clinical control industries are very competitive.
The Company faces significant competition across all of its product lines and in each market in which it operates. Competitors include companies ranging from start-up companies, who may be able to more quickly respond to customers' needs, to large multinational companies, which may have greater financial and marketing resources than the Company. In addition consolidation trends in the pharmaceutical and biotechnology industries have served to create fewer customer accounts and/or to concentrate purchasing decisions for some customers, resulting in increased pricing pressure on the Company. The entry into the market of manufacturers in China and other low-cost manufacturing locations is also creating increased pricing pressures, particularly in developing markets. Failure to anticipate and respond to competitors' actions may impact the Company's future sales and earnings.
The Company relies heavily on internal manufacturing and related operations to produce, package and distribute its products.
The Company manufactures the majority of the products it sells at its Minneapolis, Minnesota facility. Quality control, packaging and distribution operations support all of the Company's sales. Since the Company creates value for its customers through the development of high-quality products, any significant decline in quality or disruption of operations for any reason could adversely affect sales and customer relationships, and therefore adversely affect the business. While the Company has taken certain steps to manage these operational risks, and while insurance coverage may reimburse, in whole or in part, for losses related to such disruptions, the Company's ability to provide products in the longer term could adversely affect future sales growth and earnings.
The design and manufacture of products involves certain inherent risks. Manufacturing or design defects could lead to recalls, litigation or alerts relating to the Company's products. A recall could result in significant costs and damage to the Company's reputation which could reduce demand for its products.
The Company is significantly dependent on sales made through foreign subsidiaries which are subject to changes in exchange rates.
Approximately 31% of the Company's sales are made through its foreign subsidiaries, which transact their sales in foreign currencies. The Company's revenues and earnings are, therefore, affected by fluctuations in currency exchange rates. Any adverse movement in foreign currency exchange rates could negatively affect the Company's revenues and earnings.
The Company conducts and plans to grow its business in developing markets.
The Company's efforts to grow its businesses depends, to a degree, on its success in developing market share in additional geographic markets including, but not limited to, China. In some cases, these countries have greater political and economic volatility and greater vulnerability to infrastructure and labor disruptions than the Company's other markets. Operating and seeking to expand business in a number of different regions and countries exposes the Company to multiple and potentially conflicting cultural practices, business practices and legal and regulatory requirements.
9
The Company faces risk resulting from the economic instability in the Eurozone countries.
Sales in Europe made up approximately 28% of the Company's net sales in fiscal 2013. As a result of several Eurozone countries facing fiscal crises and uncertainty about the continued viability of the Euro as a single currency, the Company's European sales may be adversely affected by reduced spending on health care and research by Eurozone governments and general economic instability in the region. Such reduced sales would adversely affect the Company's revenues, financial condition and results of operations.
The Company's success will be dependent on recruiting and retaining highly qualified personnel.
Recruiting and retaining qualified scientific, production and management personnel are critical to the Company's success. The Company's anticipated growth and its expected expansion into areas and activities requiring additional expertise will require the addition of new personnel and the development of additional expertise by existing personnel. The failure to attract and retain such personnel could adversely affect the Company's business.
The Company's business is subject to governmental laws and regulations.
The Company's operations are subject to regulation by various U.S. federal, state and international agencies. Laws and regulations enacted and enforced by these agencies impact all aspects of the Company's operations including design, development, manufacturing, labeling, selling and the importing and exporting of products across international borders. Any changes to laws and regulations governing such activities could have an effect on the Company's operations. If the Company fails to comply with any of these regulations, it may become subject to fines, penalties or actions that could impact development, manufacturing and distribution and/or increase costs or reduce sales. The approval process applicable to clinical control products of the type that may be developed by the Company may take a year or more. Delays in obtaining approvals could adversely affect the marketing of new products developed by the Company, and negatively affect the Company's revenues.
As a multinational corporation, the Company is subject to the tax laws and regulations of the U.S. federal, state and local governments and of several international jurisdictions. From time to time, new tax legislation may be implemented which could adversely affect current or future tax filings or negatively impact the Company's effective tax rate and thus increase future tax payments.
The Company is dependent on maintaining its intellectual property rights.
The Company's success will depend, in part, on its ability to obtain licenses and patents, maintain trade secret protection and operate without infringing the proprietary rights of others. The Company has obtained and continues to negotiate licenses to produce a number of products claimed to be owned by others. Since the Company has not conducted a patent infringement study for each of its products, it is possible that products of the Company may unintentionally infringe patents of third parties or that the Company may have to alter its products or processes, pay licensing fees or cease certain activities because of patent rights of third parties, thereby causing additional unexpected costs and delays which may have a material adverse effect on the Company.
The Company is exposed to credit risk and fluctuations in the market values of its investment portfolio.
The Company has investments in marketable securities that are classified and accounted for as available-for-sale. These securities may include U.S. government and agency securities, state and municipal securities, foreign government securities, U.S. and foreign corporate debt and equity securities and certificates of deposit. These investments may experience reduced liquidity due to changes in market conditions and investor demand. Although the Company has not recognized any significant losses to date on its available-for-sale securities, any significant future declines in their market values could materially adversely affect the Company's financial condition and operating results. Given the global nature of its business, the Company has investments both domestically and internationally. Credit ratings and pricing of these investments can be negatively impacted by liquidity, credit deterioration or losses, financial results, or other factors. As a result, the value or liquidity of the Company's available-for-sale investments could decline and result in a material impairment, which could materially adversely affect the Company's financial condition and operating results.
10
The Company may incur losses as a result of its investments in ChemoCentryx, Inc. and other companies, the success of which is largely out of the Company's control.
The Company's expansion strategies include collaborations, investments in joint ventures and companies developing new products related to the Company's business, and the acquisition of businesses for new products, technologies and additional customer base. These strategies carry risks that objectives will not be achieved and future earnings will be adversely affected.
The Company has an approximate 15.0% equity investment in ChemoCentryx, Inc. (CCXI) that is valued at $89.6 million on the Company's June 30, 2013 Balance Sheet. CCXI is a biopharmaceutical company focused on discovering, developing and commercializing orally-administered therapeutics to treat autoimmune diseases, inflammatory diseases and cancers. The development of new drugs is a highly risky undertaking. CCXI is dependent on a limited number of products, must achieve favorable clinical trial results, obtain regulatory and marketing approval for these products and is reliant on a strategic alliance with GlaxoSmithKline. CCXI has also incurred significant losses and has yet to achieve profitability.
The ownership of CCXI shares is very concentrated, the share price is highly volatile and there is limited trading of the shares. These factors make it possible that the Company could experience future dilution or a substantial decline in the $60.2 million unrealized gain it has on its CCXI investment and/or its $29.5 million investment in CCXI. At August 26, 2013, the market value of the Company's investment in CCXI was $51.2 million and its unrealized gain declined to $21.8 million.
We have identified a material weakness in our internal controls that, if not properly corrected, could adversely affect our operations and result in material misstatements in our financial statements.
As described in "Item 9A. Controls and Procedures", we have identified a material weakness in our system of internal control over financial reporting as of June 30, 2013. A material weakness is a deficiency, or combination of deficiencies in internal control over financial reporting such that there is a reasonable possibility that a material misstatement of our annual or interim financial statements will not be prevented or detected on a timely basis.
The Company has identified a material weakness in the design, implementation and operating effectiveness of general IT controls (GITCs) intended to ensure that access to financial applications and data was adequately restricted to appropriate personnel, and that program changes to particular financial applications are documented, tested, and moved into the production environment only by individuals separate from the development function. As a result, certain classes of transactions subject to controls that rely upon information generated by the Company's IT systems that are subject to the operation of the GITCs, including the completeness, existence, and accuracy of revenue and accounts receivable, allow for a reasonable possibility that a misstatement is not adequately prevented or detected through the operation of management's system of internal control over financial reporting.
In response to the material weakness we have developed a plan to enhance our internal testing approach, including related procedures, documentation, and possible expansion of human resources, for select controls to ensure that we have adequately addressed the completeness and accuracy of system-generated information used to support the operation of the controls and to improve segregation of duties.
Although there can be no assurances, we believe these enhancements and improvements, when repeated in future periods, will remediate the material weakness described above. However, if we are not able to remedy the material weakness in a timely manner, we may be unable to provide holders of our securities with the required financial information in a timely and reliable manner and we may incorrectly report financial information. Either of these events could subject us to regulatory enforcement and other actions, and could have a material adverse effect on our operations, investor, supplier and customer confidence in our reported financial information and the trading price of our common stock.
11
ITEM 1B. UNRESOLVED STAFF COMMENTS
There are no unresolved staff comments as of the date of this report.
ITEM 2. PROPERTIES
The Company owns the facilities that its headquarters and R&D Systems subsidiary occupy in Minneapolis, Minnesota. The Minneapolis facilities are utilized by both the Company's clinical controls and biotechnology segments.
The Minneapolis complex includes approximately 800,000 square feet of space in several adjoining buildings. R&D Systems uses approximately 600,000 square feet of the complex for administrative, research, manufacturing, shipping and warehousing activities. The Company is currently leasing or plans to lease the remaining space in the complex as retail and office space.
The Company owns approximately 649 acres of farmland, including buildings, in southeast Minnesota. A portion of the land and buildings are being leased to third parties as cropland and for a dairy operation. The remaining property is used by the Company to house goats and sheep for polyclonal antibody production for its biotechnology segment.
Rental income from the above properties was $830,000, $693,000 and $549,000 in fiscal 2013, 2012 and 2011, respectively.
The Company owns the 17,000 square foot facility that its R&D Europe subsidiary occupies in Abingdon, England. This facility is utilized by the Company's biotechnology segment.
The Company leases the following facilities, all of which are utilized by the Company's biotechnology segment:
Subsidiary | Location | Type | Square Feet | |||
| R&D GmbH | Wiesbaden-Nordenstadt, Germany | Office space | 4,200 | |||
| BiosPacific | Emeryville, California | Office space | 3,000 | |||
| R&D China | Shanghai, China | Office/warehouse | 5,600 | |||
| R&D Hong Kong | Hong Kong | Office space | 1,200 | |||
| Boston Biochem | Cambridge, Massachusetts | Office/lab | 7,400 | |||
| Tocris | Bristol, United Kingdom | Office/manufacturing/lab/warehouse | 11,000 |
The Company is currently analyzing options related to upgrading the Tocris facility. The Company is also pursuing a lease for warehouse space near Heathrow airport in London to simplify logistics for the European marketplace.
The Company believes the owned and leased properties, other than the Tocris facility, are adequate to meet its occupancy needs in the foreseeable future.
12
ITEM 3. LEGAL PROCEEDINGS
As of August 23, 2013, the Company is not a party to any legal proceedings that, individually or in the aggregate, are reasonably expected to have a material adverse effect on the Company's business, results of operations, financial condition or cash flows.
ITEM 4. MINE SAFETY DISCLOSURES
Not applicable.
PART II
ITEM 5. MARKET FOR THE REGISTRANT'S COMMON EQUITY, RELATED SHAREHOLDER
MATTERS AND ISSUER PURCHASES OF EQUITY SECURITIES
The Company's common stock trades on the NASDAQ Global Select Market under the symbol "TECH." The following table sets forth for the periods indicated the high and low sales price per share for the Company's common stock as reported by the NASDAQ Global Select Market.
| Fiscal 2013 Price | Fiscal 2012 Price | |||||||||||||||
| High | Low | High | Low | |||||||||||||
1st Quarter | $ | 76.02 | $ | 66.26 | $ | 86.43 | $ | 66.34 | ||||||||
2nd Quarter | 74.17 | 65.37 | 73.55 | 62.04 | ||||||||||||
3rd Quarter | 72.20 | 65.67 | 72.20 | 65.25 | ||||||||||||
4th Quarter | 70.00 | 62.55 | 74.79 | 63.08 | ||||||||||||
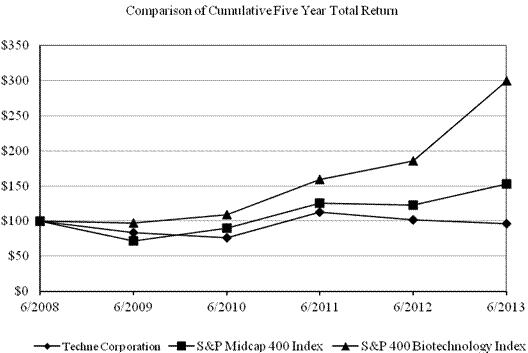
As of August 23, 2013, there were over 29,000 beneficial shareholders of the Company's common stock and over 150 shareholders of record. The Company paid quarterly cash dividends totaling $43.5 million, $41.0 million and $39.7 million in fiscal 2013, 2012 and 2011, respectively. Its Board of Directors periodically considers the payment of cash dividends, and there is no guarantee that the Company will pay cash dividends in the future.
The following chart compares the cumulative total shareholder return on the Company's common stock with the S&P Midcap 400 Index and the S&P 400 Biotechnology Index. The comparison assumes $100 was invested on the last trading day before July 1, 2008 in the Company's common stock and in each of the foregoing indices and assumes reinvestment of dividends.
13
The following table sets forth the repurchases of Company common stock for the quarter ended June 30, 2013.
Period | Total Number of Shares Purchased | Average Price Paid Per Share | Total Number of Shares Purchased as Part of Publicly Announced Plans or Programs | Maximum Approximate Dollar Value of Shares that May Yet Be Purchased Under the Plans or Programs | ||||||||||||
4/1/13 - 4/30/13 | 24,000 | 64.29 | 24,000 | $ | 125.5 million | |||||||||||
5/1/13 - 5/31/13 | 4,300 | 64.85 | 4,300 | $ | 125.2 million | |||||||||||
6/1/13 - 6/30/13 | 0 | 0 | 0 | $ | 125.2 million | |||||||||||
In April 2009, the Company authorized a plan for the repurchase and retirement of $60 million of its common stock. The plan does not have an expiration date. In October 2012, the Company increased the amount authorized under the plan by $100 million.
14
ITEM 6. SELECTED FINANCIAL DATA
(dollars in thousands, except per share data)
Income and Share Data: | 2013 | 2012 | 2011 (1) | 2010 | 2009 | |||||||||||||||
Net sales | $ | 310,575 | $ | 314,560 | $ | 289,962 | $ | 269,047 | $ | 263,956 | ||||||||||
Gross margin (2) | 74.4 | % | 75.0 | % | 77.6 | % | 79.6 | % | 78.8 | % | ||||||||||
Selling, general and administrative expenses (2) | 14.0 | % | 13.3 | % | 12.4 | % | 12.2 | % | 12.8 | % | ||||||||||
Research and development expenses (2) | 9.4 | % | 8.9 | % | 9.0 | % | 9.3 | % | 8.9 | % | ||||||||||
Operating income (2) | 51.0 | % | 52.8 | % | 56.2 | % | 58.1 | % | 57.1 | % | ||||||||||
Earnings before income taxes (2) | 51.7 | % | 51.6 | % | 56.9 | % | 58.1 | % | 58.9 | % | ||||||||||
Net earnings (2) | 36.2 | % | 35.7 | % | 38.7 | % | 40.8 | % | 39.9 | % | ||||||||||
Net earnings | $ | 112,561 | $ | 112,331 | $ | 112,302 | $ | 109,776 | $ | 105,242 | ||||||||||
Diluted earnings per share | $ | 3.05 | $ | 3.04 | $ | 3.02 | $ | 2.94 | $ | 2.78 | ||||||||||
Average common and common equivalent shares-diluted (in thousands) | 36,900 | 37,006 | 37,172 | 37,347 | 37,900 | |||||||||||||||
Closing price per share: | ||||||||||||||||||||
High | $ | 76.02 | $ | 85.13 | $ | 83.37 | $ | 69.65 | $ | 81.90 | ||||||||||
Low | $ | 63.42 | $ | 62.37 | $ | 56.14 | $ | 57.10 | $ | 45.64 | ||||||||||
Balance Sheet Data as of June 30: | 2013 | 2012 | 2011 | 2010 | 2009 | |||||||||||||||
Cash, cash equivalents and short-term available-for-sale investments | $ | 332,937 | $ | 268,986 | $ | 140,813 | $ | 138,811 | $ | 202,887 | ||||||||||
Receivables | 40,175 | 37,741 | 37,860 | 34,137 | 31,153 | |||||||||||||||
Inventories | 34,877 | 38,277 | 44,906 | 13,737 | 11,269 | |||||||||||||||
Working capital | 377,432 | 310,757 | 212,229 | 184,016 | 239,944 | |||||||||||||||
Total assets | 778,098 | 719,324 | 617,670 | 518,816 | 472,005 | |||||||||||||||
Cash Flow Data: | 2013 | 2012 | 2011 | 2010 | 2009 | |||||||||||||||
Net cash provided by operating activities | $ | 123,562 | $ | 126,746 | $ | 127,194 | $ | 111,260 | $ | 111,321 | ||||||||||
Capital expenditures | 22,454 | 6,017 | 3,630 | 4,644 | 6,556 | |||||||||||||||
Cash dividends paid per common share (3) | 1.18 | 1.11 | 1.07 | 1.03 | 0.75 | |||||||||||||||
Financial Ratios: | 2013 | 2012 | 2011 | 2010 | 2009 | |||||||||||||||
Return on average equity | 15.9 | % | 17.8 | % | 20.6 | % | 22.9 | % | 22.3 | % | ||||||||||
Return on average assets | 15.0 | % | 16.8 | % | 19.8 | % | 22.2 | % | 21.5 | % | ||||||||||
Current ratio | 12.8 | 9.7 | 12.7 | 11.8 | 16.5 | |||||||||||||||
Price to earnings ratio (4) | 23 | 24 | 28 | 20 | 23 | |||||||||||||||
Employee Data as of June 30: | 2013 | 2012 | 2011 | 2010 | 2009 | |||||||||||||||
Full-time employees | 789 | 783 | 763 | 684 | 687 | |||||||||||||||
| (1) | The Company acquired Boston Biochem, Inc. on April 1, 2011 and Tocris Holdings Limited and subsidiaries on April 28, 2011. |
| (2) | As a percent of net sales. |
| (3) | The Company's Board of Directors periodically considers the payment of cash dividends. |
| (4) | Common share price at end of fiscal year (June 30) divided by the diluted earnings per share for the respective fiscal year. |
15
ITEM 7. MANAGEMENT'S DISCUSSION AND ANALYSIS OF FINANCIAL
CONDITION AND RESULTS OF OPERATIONS
FORWARD-LOOKING INFORMATION
This report contains forward-looking statements, which are based on the Company's current assumptions and expectations. The principal forward-looking statements in this report include: the Company's expectations regarding product releases, governmental license renewals, future income tax rates, capital expenditures, the performance of the Company's investments, future dividend declarations, the construction and lease of certain facilities, the adequacy of owned and leased property for future operations, fluctuations in the Company's financial results and sufficiency of capital resources to meet the Company's foreseeable future cash and working capital requirements.
All such forward-looking statements are intended to enjoy the protection of the safe harbor for forward-looking statements contained in the Private Securities Litigation Reform Act of 1995, as amended. Although the Company believes there is a reasonable basis for the forward-looking statements, the Company's actual results could be materially different. The most important factors which could cause the Company's actual results to differ from forward-looking statements are set forth in the Company's description of risk factors in Item 1A to this Annual Report on Form 10-K.
Forward-looking statements speak only as of the date they are made, and the Company does not undertake any obligation to update any forward-looking statements.
USE OF ADJUSTED FINANCIAL MEASURES:
The adjusted financial measures used in this Annual Report on Form 10-K quantify the impact the following events had on reported net sales, gross margin percentages and net earnings for fiscal 2013 as compared to fiscal 2012 and 2011:
| • | fluctuations in exchange rates used to convert transactions in foreign currencies (primarily the Euro, British pound sterling and Chinese yuan) to U.S. dollars; |
| • | the acquisitions of Boston Biochem, Inc. on April 1, 2011 and Tocris Holdings Limited on April 28, 2011, including the impact of amortizing intangible assets and the recognition of costs upon the sale of inventory written-up to fair value; |
| • | professional fees and other costs incurred as part of the acquisitions of Boston Biochem, Inc. and Tocris Holdings Limited in fiscal 2011 and the acquisition of Bionostics Holdings Limited in July 2013; |
| • | impairment losses related to the Company's investments in unconsolidated entities; and |
| • | income tax adjustments related to the reversal of valuation allowances on deferred tax assets and the reinstatement of the U.S. credit for research and development expenditures. |
These adjusted financial measures are not prepared in accordance with generally accepted accounting principles (GAAP) and may be different from adjusted financial measures used by other companies. Adjusted financial measures should not be considered as a substitute for, or superior to, measures of financial performance prepared in accordance with GAAP. The Company views these adjusted financial measures to be helpful in assessing the Company's ongoing operating results. In addition, these adjusted financial measures facilitate our internal comparisons to historical operating results and comparisons to competitors' operating results. These adjusted financial measures are included in this Annual Report on Form 10-K because the Company believes they are useful to investors in allowing for greater transparency related to supplemental information used in the Company's financial and operational analysis. Investors are encouraged to review the reconciliations of adjusted financial measures used in this Annual Report on Form 10-K to their most directly comparable GAAP financial measures.
16
OVERVIEW
Techne Corporation and subsidiaries (the Company) are engaged in the development, manufacture and sale of biotechnology products and clinical diagnostic controls. These activities are conducted domestically through its wholly-owned subsidiaries, R&D Systems, Inc. (R&D Systems), Boston Biochem, Inc. (Boston Biochem) and BiosPacific, Inc. (BiosPacific). The Company's European biotechnology operations are conducted through its wholly-owned U.K. subsidiaries, R&D Systems Europe Ltd. (R&D Europe) and Tocris Holdings Limited (Tocris). R&D Europe has a sales subsidiary, R&D Systems GmbH, in Germany and a sales office in France. The Company distributes its biotechnology products in China through its wholly-owned subsidiary, R&D Systems China Co., Ltd. (R&D China). R&D China has a sales subsidiary, R&D Systems Hong Kong Ltd., in Hong Kong.
The Company has two reportable segments based on the nature of its products (biotechnology and clinical controls). R&D Systems' Biotechnology Division, R&D Europe, Tocris, R&D China, BiosPacific and Boston Biochem are included in the biotechnology reporting segment. The Company's biotechnology reporting segment develops, manufactures and sells biotechnology research and diagnostic products world-wide. The Company's clinical controls reporting segment, which consists of R&D Systems' Clinical Controls Division, develops and manufactures controls and calibrators for sale world-wide.
OVERALL RESULTS
Consolidated net sales decreased 1.3% and consolidated net earnings were flat for fiscal 2013 as compared to fiscal 2012. Consolidated net earnings for fiscal 2013 included $4.5 million of costs recognized upon the sale of inventory acquired in fiscal 2011 that was written-up to fair value compared to $7.6 million in fiscal 2012. Consolidated net earnings in fiscal 2012 included impairment losses of $3.3 million recorded on two of the Company's investments in unconsolidated entities and a $3.0 million tax benefit from the reversal of deferred tax valuation allowances.
Consolidated net sales increased 8.5% and consolidated net earnings were flat for fiscal 2012 as compared to fiscal 2011. Consolidated net sales in fiscal 2012 were impacted by the acquisitions of Boston Biochem and Tocris during the fourth quarter of fiscal 2011. Included in fiscal 2012 and fiscal 2011 consolidated net sales were $19.4 million and $4.7 million, respectively, of acquisition-related net sales. Consolidated net earnings for fiscal 2012 included $7.6 million of costs recognized upon the sale of inventory that was written-up to fair value at the time of the acquisitions and $5.1 million amortization of intangible assets compared to $1.8 million and $1.5 million, respectively, in fiscal 2011.
RESULTS OF OPERATIONS
Net Sales
Consolidated organic net sales, excluding the impact of the acquisitions in fiscal 2011 and the effect of the change from the prior year in exchange rates used to convert sales in foreign currencies (primarily British pound sterling, euros and Chinese yuan) into U.S. dollars, were as follows (in thousands):
| Year Ended June 30, | ||||||||
| 2013 | 2012 | |||||||
Consolidated net sales | $ | 310,575 | $ | 314,560 | ||||
Organic sales adjustments: | ||||||||
Impact of foreign currency fluctuations | 2,637 | 0 | ||||||
|
|
|
| |||||
Consolidated organic net sales | $ | 313,212 | $ | 314,560 | ||||
|
|
|
| |||||
Organic sales growth | (0.4 | %) | ||||||
17
| Year Ended June 30, | ||||||||
| 2012 | 2011 | |||||||
Consolidated net sales | $ | 314,560 | $ | 289,962 | ||||
Organic sales adjustments: | ||||||||
Acquisitions | (19,385 | ) | 0 | |||||
Impact of foreign currency fluctuations | 27 | 0 | ||||||
|
|
|
| |||||
Consolidated organic net sales | $ | 295,202 | $ | 289,962 | ||||
|
|
|
| |||||
Organic sales growth | 1.8 | % | ||||||
Net sales by reportable segment were as follows (in thousands):
| Year Ended June 30, | ||||||||||||
| 2013 | 2012 | 2011 | ||||||||||
Biotechnology | $ | 288,156 | $ | 293,274 | $ | 270,287 | ||||||
Clinical Controls | 22,419 | 21,286 | 19,675 | |||||||||
|
|
|
|
|
| |||||||
| $ | 310,575 | $ | 314,560 | $ | 289,962 | |||||||
|
|
|
|
|
| |||||||
Biotechnology segment net sales decreased $5.1 million (1.8%) and increased $23.0 million (8.5%), respectively, in fiscal 2013 and fiscal 2012 from each of the prior fiscal years. Biotechnology segment organic net sales decreased $2.5 million (0.8%) in fiscal 2013 primarily as a result of decreased sales volume in the U.S. Biotechnology segment organic net sales increased $3.6 million (1.3%) in fiscal 2012, primarily as a result of increased sales volume. Included in fiscal 2013 and 2012 net sales were $2.8 million and $2.7 million, respectively, of sales of new biotechnology products which had their first sale in each of the fiscal years.
Biotechnology segment organic sales growth from the same prior-year periods was as follows:
| Year Ended June 30, | ||||||||
| 2013 | 2012 | |||||||
U.S. industrial, pharmaceutical and biotechnology | (2.6 | %) | 3.2 | % | ||||
U.S. academic | (5.9 | %) | (5.1 | %) | ||||
Europe | 0.1 | % | (1.5 | %) | ||||
China | 18.9 | % | 21.6 | % | ||||
Pacific rim distributors, excluding China | 3.5 | % | 7.0 | % | ||||
Biotechnology segment net sales consisted of the following:
| Year Ended June 30, | ||||
| 2013 | ||||
United States | ||||
Industrial, pharmaceutical and biotechnology | 29 | % | ||
Academic | 13 | % | ||
Other | 13 | % | ||
|
| |||
| 55 | % | |||
Europe | 28 | % | ||
China | 5 | % | ||
Pacific rim distributors, excluding China | 9 | % | ||
Rest of world | 3 | % | ||
|
| |||
| 100 | % | |||
|
| |||
Clinical controls segment net sales increased $1.1 million (5.3%) and $1.6 million (8.2%), respectively, in fiscal 2013 and 2012 from each of the prior fiscal years, primarily as a result of increased sales volume.
18
Gross Margins
Fluctuations in gross margins, as a percentage of net sales, are typically the result of changes in foreign currency exchange rates and changes in product mix. Such fluctuations are normal and expected to continue in future periods. Gross margins have also been affected by acquisitions completed in prior years.
Consolidated gross margins for fiscal 2013 and 2012 were negatively impacted as a result of purchase accounting related to inventory and intangible assets acquired during the fourth quarter of fiscal 2011. Under purchase accounting, inventory is valued at fair value less expected selling and marketing costs, resulting in reduced margins in future periods as the inventory is sold.
A reconciliation of the reported consolidated gross margin percentages, adjusted for acquired inventory sold and intangible amortization included in cost of sales, is as follows:
| Year Ended June 30, | ||||||||||||
| 2013 | 2012 | 2011 | ||||||||||
Consolidated gross margin percentage | 74.4 | % | 75.0 | % | 77.6 | % | ||||||
Identified adjustments: | ||||||||||||
Costs recognized upon sale of acquired inventory | 1.4 | % | 2.4 | % | 0.6 | % | ||||||
Amortization of intangibles | 1.0 | % | 1.0 | % | 0.3 | % | ||||||
|
|
|
|
|
| |||||||
Adjusted gross margin percentage | 76.8 | % | 78.4 | % | 78.5 | % | ||||||
|
|
|
|
|
| |||||||
Segment gross margins, as a percentage of net sales, were as follows:
| Year Ended June 30, | ||||||||||||
| 2013 | 2012 | 2011 | ||||||||||
Biotechnology | 76.4 | % | 76.9 | % | 79.8 | % | ||||||
Clinical Controls | 49.0 | % | 48.6 | % | 47.0 | % | ||||||
Consolidated | 74.4 | % | 75.0 | % | 77.6 | % | ||||||
The Biotechnology segment gross margin percentages for fiscal 2013 and 2012 were negatively impacted by purchase accounting and intangible asset amortization as discussed above. The clinical controls segment gross margin percentages changed from the comparable prior-year periods as a result of changes in product mix.
Selling, General and Administrative Expenses
Selling, general and administrative expenses increased $1.7 million (4.1%) and $5.8 million (16.1%) in fiscal 2013 and 2012, respectively. The increase in fiscal 2013 was the results of $607,000 of professional fees related to the acquisition of Bionostics Holdings Limited, which was completed in early fiscal 2014 and $500,000 of professional fees related to the design and engineering for a new facility in the U.K. A decision was made in late fiscal 2013 to pursue other options related to the facilities in the U.K. These increases in fiscal 2013 were offset by a decrease of $1.1 million in profit sharing and bonuses as compared to fiscal 2012. The remaining increase in fiscal 2013 was the result of increased executive compensation and marketing wages and consulting related to upgrading the Company's website. The increase in fiscal 2012 resulted primarily from $3.3 million of additional expenses of the companies acquired in late fiscal 2011 and an increase in customer relationships and trade name amortization of $1.5 million as a result of the acquisitions. The remainder of the change in selling, general and administrative expenses for fiscal 2012 was mainly the result of annual wage, salary and benefit increases.
19
Consolidated selling, general and administrative expenses were composed of the following (in thousands):
| Year Ended June 30, | ||||||||||||
| 2013 | 2012 | 2011 | ||||||||||
Biotechnology | $ | 37,421 | $ | 36,453 | $ | 30,058 | ||||||
Clinical Controls | 1,561 | 1,697 | 1,451 | |||||||||
Unallocated corporate expenses | 4,402 | 3,533 | 4,388 | |||||||||
|
|
|
|
|
| |||||||
| $ | 43,384 | $ | 41,683 | $ | 35,897 | |||||||
|
|
|
|
|
| |||||||
Research and Development Expenses
Research and development expenses increased $1.3 million (4.8%) and $1.9 million (7.4%) in fiscal 2013 and 2012, respectively, as compared to prior-year periods. The increases were primarily the result of the development of new proteins, antibodies and assay kits by R&D Systems' Biotechnology Division and product development by Boston Biochem and Tocris. The Company introduced approximately 2,100 and 1,800 new biotechnology products in fiscal 2013 and 2012, respectively. Research and development expenses are composed of the following (in thousands):
| Year Ended June 30, | ||||||||||||
| 2013 | 2012 | 2011 | ||||||||||
Biotechnology | $ | 28,441 | $ | 27,112 | $ | 25,176 | ||||||
Clinical Controls | 816 | 800 | 809 | |||||||||
|
|
|
|
|
| |||||||
| $ | 29,257 | $ | 27,912 | $ | 25,985 | |||||||
|
|
|
|
|
| |||||||
Interest Income
Interest income for fiscal 2013, 2012 and 2011 was $2.6 million, $2.6 million and $3.8 million, respectively. Interest income in fiscal 2013 remained flat from fiscal 2012 as a result of increased cash balances offset by lower interest rates. The decrease in fiscal 2012 from the prior fiscal year was primarily the result of lower cash and available-for-sale debt securities as a result of the acquisitions in late fiscal 2011.
Impairment Loss on Investments in Unconsolidated Entities
The Company has a 16.8% ownership interest in Nephromics LLC (Nephromics). The Company accounts for its investment in Nephromics under the equity method of accounting as Nephromics is a limited liability company. During fiscal 2012, Nephromics signed an agreement to sell substantially all of its assets. The sale price included a payment at closing, future payment contingent upon the issuance of certain patents, and royalties on future sublicense income. As a result of the agreement, the Company determined that a portion of its investment in Nephromics was other-than-temporarily impaired and wrote off $2.4 million of this investment in fiscal 2012. The Company's net investment in Nephromics was $505,000 at both June 30, 2013 and 2012, respectively.
The Company held an ownership interest in ACTGen, Inc. (ACTGen), a development stage biotechnology company located in Japan through October 2012. During fiscal 2012, the Company determined that the Company's investment in ACTGen was other-than-temporarily impaired and wrote off its remaining investment of $854,000.
20
Other Non-operating Expense, Net
Other non-operating expense, net, consists of foreign currency transaction gains and losses, rental income, building expenses related to rental property and the Company's share of gains and losses from equity method investees as follows (in thousands):
| Year Ended June 30, | ||||||||||||
| 2013 | 2012 | 2011 | ||||||||||
Foreign currency gains (losses) | $ | 339 | $ | (1,362 | ) | $ | 844 | |||||
Rental income | 830 | 693 | 549 | |||||||||
Real estate taxes, depreciation and utilities | (2,192 | ) | (2,127 | ) | (2,293 | ) | ||||||
Net gain (loss) from equity method investees | 570 | (603 | ) | (926 | ) | |||||||
|
|
|
|
|
| |||||||
| $ | (453 | ) | $ | (3,399 | ) | $ | (1,826 | ) | ||||
|
|
|
|
|
| |||||||
The Company has a 6.5% ownership percentage in H2Equity (formerly Hemerus Medical, LLC). The Company accounts for its investment in H2Equity under the equity method of accounting as H2Equity is a limited liability company. During fiscal 2012, H2Equity entered into an agreement to sell substantially all of its assets. The sale closed in April 2013. The Company received a $1.1 million distribution at closing and recorded a gain of $708,000 which is included in "Net gain (loss) from equity investments" above.
Income Taxes
Income taxes for fiscal 2013, 2012 and 2011 were provided at rates of 29.9%, 30.7% and 31.9%, respectively, of consolidated earnings before income taxes. In January 2013, the U.S. federal credit for research and development was reinstated for the period of January 2012 through December 2013. As a result, a credit of $431,000 for January 2012 to June 2012 was included in fiscal 2013 income taxes.
Included in income taxes in fiscal 2012 was a $3.0 million benefit due to the reversal of a deferred tax valuation allowance on the excess tax basis in the Company's investments in unconsolidated entities. The Company determined such valuation allowance was no longer necessary and included the benefit in fiscal 2012 income taxes. Excluding this benefit, the effective tax rate for fiscal 2012 would have been 32.6%. In addition, the fiscal 2012 consolidated tax rate was negatively impacted by the expiration of the U.S. research and development credit on December 31, 2011.
The fiscal 2011 consolidated tax rate was positively impacted by the renewal of the U.S. research and development credit for the January to December 2011 period. Fiscal 2011 included $431,000 of credit for research and development for the January to June 2010 period.
U.S. federal taxes have been reduced by the manufacturer's deduction provided for under the American Jobs Creation Act of 2004 and the U.S. federal credit for research and development. Foreign income taxes have been provided at rates which approximate the tax rates in the countries in which R&D Europe, Tocris and R&D China operate. The Company expects income tax rates for fiscal 2014 to range from 30% to 32%.
21
Net Earnings
Adjusted consolidated net earnings are as follows (in thousands):
| Year Ended June 30, | ||||||||||||
| 2013 | 2012 | 2011 | ||||||||||
Net earnings | $ | 112,561 | $ | 112,331 | $ | 112,302 | ||||||
Identified adjustments: | ||||||||||||
Costs recognized upon sale of acquired inventory | 4,501 | 7,573 | 1,835 | |||||||||
Amortization of intangibles | 5,061 | 5,094 | 1,465 | |||||||||
Professional and other acquisition related costs | 607 | 0 | 1,735 | |||||||||
Impairment loss on investments | 0 | 3,254 | 0 | |||||||||
Tax impact of above adjustments | (2,596 | ) | (4,668 | ) | (1,119 | ) | ||||||
Tax impact of research and development credit | (1,392 | ) | (465 | ) | (1,329 | ) | ||||||
Tax impact of foreign source income | (710 | ) | 1,058 | 1,130 | ||||||||
Tax benefit from reversal of valuation allowance | 0 | (3,016 | ) | 0 | ||||||||
|
|
|
|
|
| |||||||
Adjusted net earnings | $ | 118,032 | $ | 121,161 | $ | 116,019 | ||||||
|
|
|
|
|
| |||||||
Adjusted net earnings growth | (2.6 | %) | 4.4 | % | 9.5 | % | ||||||
QUARTERLY FINANCIAL INFORMATION (Unaudited)
(in thousands, except per share data)
| Fiscal 2013 | Fiscal 2012 | |||||||||||||||||||||||||||||||
| First Qtr. | Second Qtr. | Third Qtr. | Fourth Qtr. | First Qtr. | Second Qtr. | Third Qtr. | Fourth Qtr . | |||||||||||||||||||||||||
Net sales | $ | 75,025 | $ | 75,083 | $ | 80,992 | $ | 79,475 | $ | 77,596 | $ | 74,662 | $ | 83,621 | $ | 78,681 | ||||||||||||||||
Gross margin | 55,583 | 55,263 | 61,147 | 59,117 | 58,387 | 55,170 | 63,383 | 58,864 | ||||||||||||||||||||||||
Earnings before taxes | 37,986 | 37,446 | 44,466 | 40,764 | 40,500 | 37,873 | 43,205 | (1) | 40,617 | |||||||||||||||||||||||
Income taxes | 12,318 | 12,082 | 11,348 | 12,353 | 12,979 | 12,060 | 11,449 | (2) | 13,376 | |||||||||||||||||||||||
Net earnings | 25,668 | 25,364 | 33,118 | 28,411 | 27,521 | 25,813 | 31,756 | 27,241 | ||||||||||||||||||||||||
Basic earnings per share | 0.70 | 0.69 | 0.90 | 0.77 | 0.74 | 0.70 | 0.86 | 0.74 | ||||||||||||||||||||||||
Diluted earnings per share | 0.70 | 0.69 | 0.90 | 0.77 | 0.74 | 0.70 | 0.86 | 0.74 | ||||||||||||||||||||||||
| (1) | Includes $3.3 million impairment loss on investments in unconsolidated entities. |
| (2) | Includes $3.0 million benefit from reversal of deferred tax valuation allowance. |
LIQUIDITY AND CAPITAL RESOURCES
Cash, cash equivalents and available-for-sale investments at June 30, 2013 were $465 million compared to $413 million at June 30, 2012. Included in available-for-sale investments at June 30, 2013 and 2012 was the fair value of the Company's investment in ChemoCentryx, Inc. (CCXI) of $89.6 million and $94.7 million, respectively.
At June 30, 2013, approximately 78%, 21%, and 1% of the Company's cash and equivalent account balances of $164 million are located in the U.S., United Kingdom and China, respectively. At June 30, 2013, approximately 95% of the Company's available-for-sale investment accounts are located in the U.S., with the remaining 5% in China. The Company has either paid U.S. taxes on its undistributed foreign earnings or intends to indefinitely reinvest the undistributed earnings in the foreign operations. Management of the Company expects to be able to meet its foreseeable future cash and working capital requirements for operations, facility expansion, capital additions and acquisitions at each of its geographical locations through currently available funds, cash generated from operations and maturities of available-for-sale investments.
22
Cash Flows From Operating Activities
The Company generated cash from operations of $124 million, $127 million and $127 million in fiscal 2013, 2012 and 2011, respectively. The decrease in cash generated from operating activities in fiscal 2013 as compared to fiscal 2012 was mainly the result of decrease in net earnings and changes in working capital.
The slight decrease in cash generated from operating activities in fiscal 2012 as compared to fiscal 2011 was mainly the result of an increase in net earnings after adjustment for non-cash expenses, offset by a decrease in income taxes payable due to the timing of tax deposits.
Cash Flows From Investing Activities
The Company's net purchases (sales) of available-for-sale investments in fiscal 2013, 2012 and 2011 were $9.1 million, $15.3 million and ($22.2) million, respectively. The Company's investment policy is to place excess cash in municipal and corporate bonds with the objective of obtaining the highest possible return while minimizing risk and keeping the funds accessible.
Capital additions consist of the following (in thousands):
| Year Ended June 30, | ||||||||||||
| 2013 | 2012 | 2011 | ||||||||||
Laboratory, manufacturing, and computer equipment | $ | 2,882 | $ | 2,521 | $ | 2,605 | ||||||
Construction/renovation | 19,572 | 3,496 | 1,025 | |||||||||
|
|
|
|
|
| |||||||
| $ | 22,454 | $ | 6,017 | $ | 3,630 | |||||||
|
|
|
|
|
| |||||||
Construction/renovation for fiscal 2013 included $18.0 million related to the renovation of a building on the Company's Minneapolis campus which is expected to be completed by mid-fiscal 2014.
Capital additions planned for fiscal 2014 are as follows (in millions):
Laboratory, manufacturing, and computer equipment | $ | 6.7 | ||
Renovation in Minneapolis, Minnesota | 9.3 | |||
|
| |||
| $ | 16.0 | |||
|
|
Capital additions are expected to be financed through currently available cash and cash generated from operations.
In fiscal 2013 the Company received a $1.1 million distribution from H2Equity due to the sale by H2Equity of substantially all of its assets. The Company's investment in H2Equity was $26,000 and $551,000 at June 30, 2013 and 2012, respectively. In fiscal 2012 the Company received $463,000 in distributions from Nephromics. At both June 30, 2013 and 2012, the Company's net investment in Nephromics was $505,000.
On April 1, 2011, the Company acquired the assets of Boston Biochem, a leading developer and manufacturer of innovative ubiquitin-related biotechnology research products, for approximately $7.9 million. On April 28, 2011, the Company acquired 100% ownership of Tocris, a leading supplier of reagents for non-clinical life science research for £75 million (approximately $124 million). The acquisitions were financed through cash and cash equivalents on hand and sales of available-for-sale investments.
Subsequent to June 30, 2013, the Company acquired 100% ownership of Bionostics Holdings Limited for approximately $104 million cash. The acquisition was financed through cash on hand at June 30, 2013.
23
Cash Flows From Financing Activities
In fiscal 2013, 2012 and 2011, the Company paid cash dividends of $43.5 million, $41.0 million and $39.7 million, respectively. The Board of Directors periodically considers the payment of cash dividends.
The Company received $1.1 million, $847,000 and $4.8 million for the exercise of options for 22,000, 17,000 and 114,000 shares of common stock in fiscal 2013, 2012 and 2011, respectively. The Company recognized excess tax benefits from stock option exercises of $75,000, $51,000 and $847,000 in fiscal 2013, 2012 and 2011, respectively.
In fiscal 2013, 2012 and 2011, the Company purchased 8,324, 13,140 and 4,923 shares of common stock, respectively, for its employee stock bonus plans at a cost of $573,000, $907,000 and $294,000, respectively.
In April 2009, the Board of Directors authorized a plan for the repurchase and retirement of $60 million of its common stock. In October 2012, the Board of Directors increased the amount authorized under the plan by $100 million. The plan does not have an expiration date. In fiscal 2013 and 2012, the Company purchased and retired 28,000 and 344,000 shares of common stock, respectively, at market values of $1.8 million and $23.6 million. There were no stock repurchases in fiscal 2011. At June 30, 2013, approximately $125 million remained available for purchase under the above authorizations.
CONTRACTUAL OBLIGATIONS
The following table summarizes the Company's contractual obligations and commercial commitments as of June 30, 2013 (in thousands):
| Payments Due by Period | ||||||||||||||||||||
| Total | Less than 1 Year | 1-3 Years | 3-5 Years | After 5 Years | ||||||||||||||||
Operating leases | $ | 3,039 | $ | 712 | $ | 1,079 | $ | 965 | $ | 283 | ||||||||||
Minimum royalty payments | 169 | 169 | 0 | 0 | 0 | |||||||||||||||
|
|
|
|
|
|
|
|
|
| |||||||||||
| $ | 3,208 | $ | 881 | $ | 1,079 | $ | 965 | $ | 283 | |||||||||||
|
|
|
|
|
|
|
|
|
| |||||||||||
OFF-BALANCE SHEET ARRANGEMENTS
The Company is not a party to any off-balance sheet transactions, arrangements or obligations that have, or are reasonably likely to have, a current or future material effect on the Company's financial condition, changes in the financial condition, revenues or expenses, results of operations, liquidity, capital expenditures or capital resources.
CRITICAL ACCOUNTING POLICIES
Management's discussion and analysis of the Company's financial condition and results of operations are based upon the Company's Consolidated Financial Statements, which have been prepared in accordance with accounting principles generally accepted in the United States of America (U.S. GAAP). The preparation of these financial statements requires management to make estimates and judgments that affect the reported amounts of assets, liabilities, revenues and expenses, and related disclosure of contingent assets and liabilities. On an ongoing basis, management evaluates its estimates. Management bases its estimates on historical experience and on various other assumptions that are believed to be reasonable under the circumstances, the results of which form the basis for making judgments about the carrying values of assets and liabilities that are not readily apparent from other sources. Actual results may differ from these estimates under different assumptions or conditions.
The Company has identified the policies outlined below as critical to its business operations and an understanding of results of operations. The listing is not intended to be a comprehensive list of all accounting policies.
24
Valuation of Available-For-Sale Investments
The Company considers all of its marketable securities available-for-sale and reports them at fair market value. Fair market values are based on quoted market prices. Unrealized gains and losses on available-for-sale investments are excluded from income, but are included, net of taxes, in other comprehensive income. If an "other-than-temporary" impairment is determined to exist, the difference between the value of the investment recorded in the financial statements and the Company's current estimate of fair value is recognized as a charge to earnings in the period in which the impairment is determined. Net unrealized gains on available-for-sale investments at June 30, 2013 were $60.5 million.
Valuation of Inventory
Inventories are stated at the lower of cost (first-in, first-out method) or market. The Company regularly reviews inventory on hand for slow-moving and obsolete inventory, inventory not meeting quality control standards and inventory subject to expiration.
To meet strict customer quality standards, the Company has established a highly controlled manufacturing process for proteins, antibodies and its chemically-based products. These products require the initial manufacture of multiple batches to determine if quality standards can be consistently met. In addition, the Company will produce larger batches of established products than current sales requirements due to economies of scale. The manufacturing process for these products, therefore, has and will continue to produce quantities in excess of forecasted usage. The Company values its manufactured protein and antibody inventory based on a two-year forecast and its chemically-based products on a five-year forecast. The establishment of a two-year or five-year forecast requires considerable judgment. Inventory quantities in excess of the forecast are not valued due to uncertainty over salability. The value of protein, antibody and chemically-based product inventory not valued at June 30, 2013 was $26.0 million.
The fair value of inventory purchased in fiscal 2011 through the acquisitions of Boston Biochem and Tocris were determined based on quantities acquired, selling prices at the date of acquisition and management's assumptions regarding inventory having future value and the costs to sell such inventories. At the acquisition dates, the value of acquired inventory was increased $25.7 million for a total acquired inventory value of $33.0 million. In addition, the Company acquired inventory that was not valued as part of the purchase price allocation as it was in excess of forecasted usage. The increase in value of the acquired inventory remaining at June 30, 2013 was $10.3 million.
Valuation of Intangible Assets and Goodwill
When a business is acquired, the purchase price is allocated, as applicable, between tangible assets, identifiable intangible assets and goodwill. Determining the portion of the purchase price allocated to intangible assets requires significant estimates. The fair value of intangible assets acquired in fiscal 2011, including developed technologies, trade names, customer relationships and a non-compete agreement, were based on management's forecasted cash inflows and outflows using a relief-from-royalty and multi-period excess earnings method with consideration to other factors including an independent valuation of management's assumptions. Intangible assets are being amortized over their estimated useful lives, ranging from 5 to 15 years. The Company reviews the carrying amount of intangible assets for impairment whenever events or changes in circumstances indicate the carrying amount of an asset may not be recoverable. Intangible assets, net of accumulated amortization, were $40.6 million at June 30, 2013.
Goodwill recognized in connection with a business acquisition represents the excess of the aggregate purchase price over the fair value of net assets acquired. Goodwill is tested for impairment annually or more frequently if changes in circumstance or the occurrence of events suggest impairment exists. Assessing the impairment of goodwill requires the Company to make judgments regarding the fair value of the net assets of its reporting units and the allocation of the carrying amount of shared assets to the reporting units. The Company's annual assessment included a qualitative assessment of whether it is more-likely-than-not that a reporting unit's fair value is less than its carrying value. A significant change in the Company's market capitalization or in the carrying amount of net assets of a reporting unit could result in an impairment charge in future periods. The Company completed its annual impairment testing of goodwill and concluded that no impairment existed as of June 30, 2013, as the fair values of the Company's reporting units exceeded their carrying values. Goodwill at June 30, 2013 was $84.3 million.
25
Valuation of Investments
The Company has made equity investments in several start-up and early development stage companies, among them Nephromics, H2Equity, and ACTGen, Inc (ACTGen). The accounting treatment of each investment (cost method or equity method) is dependent upon a number of factors, including, but not limited to, the Company's share in the equity of the investee and the Company's ability to exercise significant influence over the operating and financial policies of the investee. In determining which accounting treatment to apply, the Company must make judgments based upon the quantitative and qualitative aspects of the investment.
The Company periodically assesses its equity investments for impairment. Development stage companies of the type the Company has invested in are dependent on their ability to raise additional funds to continue research and development efforts and on receiving patent protection and/or U.S. Food and Drug Administration (FDA) clearance to market their products. If such funding were unavailable or inadequate to fund operations or if patent protection or FDA clearance were not received, the Company would potentially recognize an impairment loss to the extent of its remaining net investment.
In fiscal 2012, the Company determined that its investment in Nephromics was partially impaired and wrote off $2.4 million as an impairment loss. The Company's net investment in Nephromics was $505,000 at June 30, 2013. The Company also determined that its investment in ACTGen was fully impaired and wrote off $854,000 as an impairment loss in fiscal 2012. During fiscal 2012, H2Equity entered into an agreement to sell substantially all of its assets. The sale closed in April 2013. The Company received a $1.1 million distribution at closing and recorded a gain of $708,000.
ITEM 7A. QUANTITATIVE AND QUALITATIVE DISCLOSURES
ABOUT MARKET RISK
At the end of fiscal 2013, the Company had a portfolio of fixed income debt securities, excluding those classified as cash and cash equivalents, of $212 million (see Note C to the Consolidated Financial Statements included in Item 8 of this Annual Report on Form 10-K). These securities, like all fixed income instruments, are subject to interest rate risk and will decline in value if market interest rates increase. The Company's investment policy requires all investment in short-term and long-term securities to have at least debt ratings of A1 or A3 (or the equivalent), respectively. As the Company's fixed income securities are classified as available-for-sale, unrealized gains or losses are recognized by the Company in "Other comprehensive income (loss)" on the Consolidated Statement of Earnings and Comprehensive Income. The Company generally holds its fixed income securities until maturity and, historically, has not recorded any material gains or losses on any sale prior to maturity.
The Company operates internationally, and thus is subject to potentially adverse movements in foreign currency exchange rates. Approximately 31% of consolidated net sales are made in foreign currencies, including 15% in euro, 7% in British pound sterling, 4% in Chinese yuan and the remaining 5% in other European currencies. As a result, the Company is exposed to market risk mainly from foreign exchange rate fluctuations of the euro, British pound sterling, and the Chinese yuan as compared to the U.S. dollar as the financial position and operating results of the Company's foreign operations are translated into U.S. dollars for consolidation.
Month-end exchange rates between the British pound sterling, euro and Chinese yuan and the U.S. dollar, which have not been weighted for actual sales volume in the applicable months in the periods, were as follows:
26
| Year Ended June 30, | ||||||||||||
| 2013 | 2012 | 2011 | ||||||||||
British pound: | ||||||||||||
High | $ | 1.62 | $ | 1.64 | $ | 1.67 | ||||||
Low | 1.52 | 1.54 | 1.53 | |||||||||
Average | 1.57 | 1.59 | 1.59 | |||||||||
Euro: | ||||||||||||
High | $ | 1.36 | $ | 1.44 | $ | 1.48 | ||||||
Low | 1.23 | 1.24 | 1.27 | |||||||||
Average | 1.30 | 1.34 | 1.37 | |||||||||
Chinese yuan: | ||||||||||||
High | $ | .163 | $ | .159 | $ | .155 | ||||||
Low | .157 | .155 | .148 | |||||||||
Average | .160 | .158 | .151 | |||||||||
The Company's exposure to foreign exchange rate fluctuations also arises from trade receivables and intercompany payables denominated in one currency in the financial statements, but receivable or payable in another currency. At June 30, 2013, the Company had the following trade receivable and intercompany payables denominated in one currency but receivable or payable in another currency (in thousands):
| Denominated Currency | U. S. Dollar Equivalent | |||||||||||
Accounts receivable in: | ||||||||||||
Euros | £ | 1,304 | $ | 1,984 | ||||||||
Other European currencies | £ | 1,150 | $ | 1,749 | ||||||||
Intercompany payable in: | ||||||||||||
Euros | £ | 304 | $ | 463 | ||||||||
U.S. dollars | £ | 2,777 | $ | 4,223 | ||||||||
U.S. dollars | yuan | 5,906 | $ | 956 | ||||||||
All of the above balances are revolving in nature and are not deemed to be long-term balances.
The Company does not enter into foreign currency forward contracts to reduce its exposure to foreign currency rate changes on forecasted intercompany sales transactions or on intercompany foreign currency denominated balance sheet positions. Foreign currency transaction gains and losses are included in "Other non-operating expense, net" in the Consolidated Statement of Earnings and Comprehensive Income. The effect of translating net assets of foreign subsidiaries into U.S. dollars are recorded on the Consolidated Balance Sheet as part of "Accumulated other comprehensive income (loss)."
The effects of a hypothetical simultaneous 10% appreciation in the U.S. dollar from June 30, 2013 levels against the euro, British pound sterling and Chinese yuan are as follows (in thousands):
Decrease in translation of 2013 earnings into U.S. dollars | $ | 2,445 | ||
Decrease in translation of net assets of foreign subsidiaries | 13,778 | |||
Additional transaction losses | 518 |
27
ITEM 8. FINANCIAL STATEMENTS AND SUPPLEMENTARY DATA
CONSOLIDATED STATEMENTS OF EARNINGS AND COMPREHENSIVE INCOME
Techne Corporation and Subsidiaries
(in thousands, except per share data)
| Year Ended June 30, | ||||||||||||
| 2013 | 2012 | 2011 | ||||||||||
Net sales | $ | 310,575 | $ | 314,560 | $ | 289,962 | ||||||
Cost of sales | 79,465 | 78,756 | 65,025 | |||||||||
|
|
|
|
|
| |||||||
Gross margin | 231,110 | 235,804 | 224,937 | |||||||||
|
|
|
|
|
| |||||||
Operating expenses: | ||||||||||||
Selling, general and administrative | 43,384 | 41,683 | 35,897 | |||||||||
Research and development | 29,257 | 27,912 | 25,985 | |||||||||
|
|
|
|
|
| |||||||
Total operating expenses | 72,641 | 69,595 | 61,882 | |||||||||
|
|
|
|
|
| |||||||
Operating income | 158,469 | 166,209 | 163,055 | |||||||||
|
|
|
|
|
| |||||||
Other income (expense): | ||||||||||||
Interest income | 2,646 | 2,639 | 3,752 | |||||||||
Impairment losses on investments | 0 | (3,254 | ) | 0 | ||||||||
Other non-operating expense, net | (453 | ) | (3,399 | ) | (1,826 | ) | ||||||
|
|
|
|
|
| |||||||
Total other income (expense) | 2,193 | (4,014 | ) | 1,926 | ||||||||
|
|
|
|
|
| |||||||
Earnings before income taxes | 160,662 | 162,195 | 164,981 | |||||||||
Income taxes | 48,101 | 49,864 | 52,679 | |||||||||
|
|
|
|
|
| |||||||
Net earnings | 112,561 | 112,331 | 112,302 | |||||||||
|
|
|
|
|
| |||||||
Other comprehensive income (loss): | ||||||||||||
Foreign currency translation adjustments | (3,538 | ) | (3,804 | ) | 5,028 | |||||||
Unrealized (losses) gains on available-for-sale investments, net of tax of ($2,129), $23,422 and ($44), respectively | (3,684 | ) | 41,870 | (85 | ) | |||||||
|
|
|
|
|
| |||||||
Other comprehensive income (loss) | (7,222 | ) | 38,066 | 4,943 | ||||||||
|
|
|
|
|
| |||||||
Comprehensive income | $ | 105,339 | $ | 150,397 | $ | 117,245 | ||||||
|
|
|
|
|
| |||||||
Earnings per share: | ||||||||||||
Basic | $ | 3.06 | $ | 3.04 | $ | 3.03 | ||||||
Diluted | $ | 3.05 | $ | 3.04 | $ | 3.02 | ||||||
Cash dividends per common share: | $ | 1.18 | $ | 1.11 | $ | 1.07 | ||||||
Weighted average common shares outstanding: | ||||||||||||
Basic | 36,836 | 36,939 | 37,098 | |||||||||
Diluted | 36,900 | 37,006 | 37,172 | |||||||||
See Notes to Consolidated Financial Statements.
28
CONSOLIDATED BALANCE SHEETS
Techne Corporation and Subsidiaries
(in thousands, except share and per share data)
| June 30, | ||||||||
| 2013 | 2012 | |||||||
ASSETS | ||||||||
Current assets: | ||||||||
Cash and cash equivalents | $ | 163,786 | $ | 116,675 | ||||
Short-term available-for-sale investments | 169,151 | 152,311 | ||||||
Trade accounts receivable, less allowance for doubtful accounts of $428 and $455, respectively | 38,183 | 35,668 | ||||||
Other receivables | 1,992 | 2,073 | ||||||
Inventories | 34,877 | 38,277 | ||||||
Prepaid expenses | 1,527 | 1,503 | ||||||
|
|
|
| |||||
Total current assets | 409,516 | 346,507 | ||||||
|
|
|
| |||||
Available-for-sale investments | 132,376 | 143,966 | ||||||
Property and equipment, net | 108,756 | 93,788 | ||||||
Goodwill | 84,336 | 85,682 | ||||||
Intangible assets, net | 40,552 | 46,476 | ||||||
Investments in unconsolidated entities | 531 | 1,056 | ||||||
Other assets | 2,031 | 1,849 | ||||||
|
|
|
| |||||
| $ | 778,098 | $ | 719,324 | |||||
|
|
|
| |||||
LIABILITIES AND SHAREHOLDERS' EQUITY | ||||||||
Current liabilities: | ||||||||
Trade accounts payable | $ | 6,236 | $ | 6,291 | ||||
Salaries, wages and related accruals | 4,025 | 4,699 | ||||||
Accrued expenses | 9,603 | 7,275 | ||||||
Income taxes payable | 2,276 | 3,251 | ||||||
Deferred income taxes | 9,944 | 14,234 | ||||||
|
|
|
| |||||
Total current liabilities | 32,084 | 35,750 | ||||||
|
|
|
| |||||
Deferred income taxes | 8,473 | 9,132 | ||||||
Commitments and contingencies (Note I) | ||||||||
Shareholders' equity: | ||||||||
Undesignated capital stock, no par; authorized 5,000,000 shares; none issued or outstanding | 0 | 0 | ||||||
Common stock, par value $.01 a share; authorized 100,000,000 shares; issued and outstanding 36,834,678 and 36,826,364 shares, respectively | 368 | 368 | ||||||
Additional paid-in capital | 134,895 | 131,851 | ||||||
Retained earnings | 587,725 | 520,448 | ||||||
Accumulated other comprehensive income | 14,553 | 21,775 | ||||||
|
|
|
| |||||
Total shareholders' equity | 737,541 | 674,442 | ||||||
|
|
|
| |||||
| $ | 778,098 | $ | 719,324 | |||||
|
|
|
| |||||
See Notes to Consolidated Financial Statements.
29
CONSOLIDATED STATEMENTS OF SHAREHOLDERS' EQUITY
Techne Corporation and Subsidiaries
(in thousands)
| Common Stock | Additional Paid-in | Retained | Accumulated Other Compre- hensive | |||||||||||||||||||||
| Shares | Amount | Capital | Earnings | Income(Loss) | Total | |||||||||||||||||||
Balances at June 30, 2010 | 37,033 | $ | 370 | $ | 122,537 | $ | 400,119 | $ | (21,234 | ) | $ | 501,792 | ||||||||||||
Net earnings | 112,302 | 112,302 | ||||||||||||||||||||||
Other comprehensive income | 4,943 | 4,943 | ||||||||||||||||||||||
Common stock issued for exercise of options | 129 | 1 | 5,351 | 5,352 | ||||||||||||||||||||
Surrender and retirement of stock to exercise options | (9 | ) | (0 | ) | (561 | ) | (561 | ) | ||||||||||||||||
Cash dividends | (39,691 | ) | (39,691 | ) | ||||||||||||||||||||
Stock-based compensation expense | 1,138 | 1,138 | ||||||||||||||||||||||
Tax benefit from exercise of stock options | 847 | 847 | ||||||||||||||||||||||
|
|
|
|
|
|
|
|
|
|
|
| |||||||||||||
Balances at June 30, 2011 | 37,153 | 371 | 129,312 | 472,730 | (16,291 | ) | 586,122 | |||||||||||||||||
Net earnings | 112,331 | 112,331 | ||||||||||||||||||||||
Other comprehensive income | 38,066 | 38,066 | ||||||||||||||||||||||
Common stock issued for exercise of options | 17 | 0 | 847 | 847 | ||||||||||||||||||||
Repurchase of common stock | (344 | ) | (3 | ) | (23,595 | ) | (23,598 | ) | ||||||||||||||||
Cash dividends | (41,018 | ) | (41,018 | ) | ||||||||||||||||||||
Stock-based compensation expense | 1,641 | 1,641 | ||||||||||||||||||||||
Tax benefit from exercise of stock options | 51 | 51 | ||||||||||||||||||||||
|
|
|
|
|
|
|
|
|
|
|
| |||||||||||||
Balances at June 30, 2012 | 36,826 | 368 | 131,851 | 520,448 | 21,775 | 674,442 | ||||||||||||||||||
Net earnings | 112,561 | 112,561 | ||||||||||||||||||||||
Other comprehensive income | (7,222 | ) | (7,222 | ) | ||||||||||||||||||||
Common stock issued for exercise of options | 22 | 0 | 1,105 | 1,105 | ||||||||||||||||||||
Common stock issued for restricted stock award | 15 | 0 | 0 | |||||||||||||||||||||
Repurchase of common stock | (28 | ) | (0 | ) | (1,821 | ) | (1,821 | ) | ||||||||||||||||
Cash dividends | (43,463 | ) | (43,463 | ) | ||||||||||||||||||||
Stock-based compensation expense | 1,864 | 1,864 | ||||||||||||||||||||||
Tax benefit from exercise of stock options | 75 | 75 | ||||||||||||||||||||||
|
|
|
|
|
|
|
|
|
|
|
| |||||||||||||
Balances at June 30, 2013 | 36,835 | $ | 368 | $ | 134,895 | $ | 587,725 | $ | 14,553 | $ | 737,541 | |||||||||||||
|
|
|
|
|
|
|
|
|
|
|
| |||||||||||||
See Notes to Consolidated Financial Statements.
30
CONSOLIDATED STATEMENTS OF CASH FLOWS
Techne Corporation and Subsidiaries
(in thousands)
| Year Ended June 30, | ||||||||||||
| 2013 | 2012 | 2011 | ||||||||||
Cash flows from operating activities: | ||||||||||||
Net earnings | $ | 112,561 | $ | 112,331 | $ | 112,302 | ||||||
Adjustments to reconcile net earnings to net cash provided by operating activities: | ||||||||||||
Depreciation and amortization | 12,321 | 12,467 | 8,700 | |||||||||
Costs recognized on sale of acquired inventory | 4,501 | 7,573 | 1,835 | |||||||||
Deferred income taxes | (2,534 | ) | (7,363 | ) | 3,194 | |||||||
Stock-based compensation expense | 1,864 | 1,641 | 1,138 | |||||||||
Excess tax benefit from stock option exercises | (75 | ) | (51 | ) | (847 | ) | ||||||
Impairment losses on investments | 0 | 3,254 | 0 | |||||||||
Net (gain) loss from equity method investees | (570 | ) | 603 | 926 | ||||||||
Other | 763 | 230 | 225 | |||||||||
Change in operating assets and liabilities, net of acquisitions: | ||||||||||||
Trade accounts and other receivables | (2,334 | ) | (2,096 | ) | (3,624 | ) | ||||||
Inventories | (2,216 | ) | (1,577 | ) | (1,021 | ) | ||||||
Prepaid expenses | (33 | ) | (476 | ) | 256 | |||||||
Trade accounts payable and accrued expenses | 243 | 1,581 | (591 | ) | ||||||||
Salaries, wages and related accruals | (92 | ) | 686 | 1,268 | ||||||||
Income taxes payable | (837 | ) | (2,057 | ) | 3,433 | |||||||
|
|
|
|
|
| |||||||
Net cash provided by operating activities | 123,562 | 126,746 | 127,194 | |||||||||
|
|
|
|
|
| |||||||
Cash flows from investing activities: | ||||||||||||
Purchase of available-for-sale investments | (112,712 | ) | (147,011 | ) | (151,366 | ) | ||||||
Proceeds from sale of available-for-sale investments | 41,507 | 64,291 | 134,019 | |||||||||
Proceeds from maturities of available-for-sale investments | 62,103 | 67,435 | 39,501 | |||||||||
Additions to property and equipment | (22,454 | ) | (6,017 | ) | (3,630 | ) | ||||||
Distribution from unconsolidated entity | 1,095 | 463 | 0 | |||||||||
Acquisitions, net of cash acquired | 0 | 0 | (131,766 | ) | ||||||||
Increase in other long-term assets | (743 | ) | (829 | ) | (943 | ) | ||||||
|
|
|
|
|
| |||||||
Net cash used in investing activities | (31,204 | ) | (21,668 | ) | (114,185 | ) | ||||||
|
|
|
|
|
| |||||||
Cash flows from financing activities: | ||||||||||||
Cash dividends | (43,463 | ) | (41,018 | ) | (39,691 | ) | ||||||
Proceeds from stock option exercises | 1,105 | 847 | 4,790 | |||||||||
Excess tax benefit from stock option exercises | 75 | 51 | 847 | |||||||||
Purchase of common stock for stock bonus plans | (573 | ) | (907 | ) | (294 | ) | ||||||
Repurchase of common stock | (1,821 | ) | (23,598 | ) | (1,940 | ) | ||||||
|
|
|
|
|
| |||||||
Net cash used in financing activities | (44,677 | ) | (64,625 | ) | (36,288 | ) | ||||||
|
|
|
|
|
| |||||||
Effect of exchange rate changes on cash and cash equivalents | (570 | ) | (1,391 | ) | 6,753 | |||||||
|
|
|
|
|
| |||||||
Net change in cash and cash equivalents | 47,111 | 39,062 | (16,526 | ) | ||||||||
Cash and cash equivalents at beginning of year | 116,675 | 77,613 | 94,139 | |||||||||
|
|
|
|
|
| |||||||
Cash and cash equivalents at end of year | $ | 163,786 | $ | 116,675 | $ | 77,613 | ||||||
|
|
|
|
|
| |||||||
See Notes to Consolidated Financial Statements.
31
NOTES TO CONSOLIDATED FINANCIAL STATEMENTS
Techne Corporation and Subsidiaries
Years ended June 30, 2013, 2012 and 2011
A. Description of Business and Summary of Significant Accounting Policies:
Description of business: Techne Corporation and subsidiaries (the Company) are engaged in the development, manufacture and sale of biotechnology products and clinical diagnostic controls. These activities are conducted domestically through its wholly-owned subsidiaries, R&D Systems, Inc. (R&D Systems), Boston Biochem, Inc. (Boston Biochem) and BiosPacific, Inc. (BiosPacific). The Company develops, manufactures and distributes biotechnology products in Europe through its wholly-owned U.K. subsidiaries, R&D Systems Europe Ltd. (R&D Europe) and Tocris Holdings Limited (Tocris). R&D Europe has a sales subsidiary, R&D Systems GmbH, in Germany and a sales office in France. The Company distributes biotechnology products in China through its wholly-owned subsidiary, R&D Systems China Co., Ltd. (R&D China). R&D China has a sales subsidiary, R&D Systems Hong Kong, Ltd., in Hong Kong.
Estimates: The preparation of consolidated financial statements in conformity with accounting principles generally accepted in the United States of America requires management to make estimates and assumptions that affect the reported amounts of assets and liabilities, disclosures of contingent assets and liabilities at the date of the consolidated financial statements, and the reported amounts of revenues and expenses during the reporting period. These estimates include the valuation of accounts receivable, available-for-sale investments, inventory, intangible assets, stock based compensation and income taxes. Actual results could differ from these estimates.
Principles of consolidation: The consolidated financial statements include the accounts of the Company and its wholly-owned subsidiaries. All intercompany accounts and transactions have been eliminated.
Translation of foreign financial statements: Assets and liabilities of the Company's foreign operations are translated at year-end rates of exchange and the resulting gains and losses arising from the translation of net assets located outside the U.S. are recorded as other comprehensive income (loss) on the consolidated statement of earnings and comprehensive income. The cumulative translation adjustment is a component of accumulated other comprehensive income (loss) on the consolidated balance sheets. Foreign statements of earnings are translated at the average rate of exchange for the year. Foreign currency transaction gains and losses are included in other non-operating expense in the consolidated statements of earnings.
Revenue recognition: The Company recognizes revenue when persuasive evidence of an arrangement exists, delivery has occurred or services have been rendered, the price is fixed or determinable and collectability is reasonably assured. Payment terms for shipments to end-users are generally net 30 days. Payment terms for distributor shipments may range from 30 to 90 days. Products are shipped FOB shipping point. Freight charges billed to end-users are included in net sales and freight costs are included in cost of sales. Freight charges on shipments to distributors are paid directly by the distributor. Any claims for credit or return of goods must be made within 10 days of receipt. Revenues are reduced to reflect estimated credits and returns. Sales, use, value-added and other excise taxes are not included in revenue.
Research and development: Research and development expenditures are expensed as incurred. Development activities generally relate to creating new products, improving or creating variations of existing products, or modifying existing products to meet new applications.
Advertising costs: Advertising expenses (including production and communication costs) were $3.2 million, $3.4 million and $2.9 million for fiscal 2013, 2012 and 2011, respectively. The Company expenses advertising expenses as incurred.
Share-based compensation: The cost of employee services received in exchange for the award of equity instruments is based on the fair value of the award at the date of grant. Separate groups of employees that have similar historical exercise behavior with regard to option exercise timing and forfeiture rates are considered separately in determining option fair value. Compensation cost is recognized using a straight-line method over the vesting period and is net of estimated forfeitures. Stock option exercises and stock awards are satisfied through the issuance of new shares.
32
Income taxes: The Company uses the asset and liability method of accounting for income taxes. Deferred tax assets and liabilities are recognized to record the income tax effect of temporary differences between the tax basis and financial reporting basis of assets and liabilities. Deferred tax assets and liabilities are measured using enacted tax rates expected to apply to taxable income in the years in which those temporary differences are expected to be recovered or settled. The effect on deferred tax assets and liabilities of a change in tax rates is recognized in income in the period that includes the enactment date. Tax positions taken or expected to be taken in a tax return are recognized in the financial statements when it is more likely than not that the position would be sustained upon examination by tax authorities. A recognized tax position is then measured at the largest amount of benefit that is greater than fifty percent likely of being realized upon ultimate settlement. The Company recognizes interest and penalties related to unrecognized tax benefits in income tax expense.
Financial instruments not measured at fair value: Certain of the Company's financial instruments are not measured at fair value but nevertheless are recorded at carrying amounts approximating fair value, based on their short-term nature. These financial instruments include cash and cash equivalents, accounts receivable, accounts payable and other current liabilities.
Cash and equivalents: Cash and cash equivalents include cash on hand and highly-liquid investments with original maturities of three months or less.
Available-for-sale investments: Available-for-sale investments consist of debt instruments with original maturities of generally three months to three years and equity securities. Available-for-sale investments are recorded based on trade-date. The Company considers all of its marketable securities available-for-sale and reports them at fair value. The Company utilizes valuation techniques for determining fair market value which maximize the use of observable inputs and minimize the use of unobservable inputs to the extent possible. The Company determines fair value based on assumptions that market participants would use in pricing an asset or liability in the principal or most advantageous market. When considering market participant assumptions in fair value measurements, the following fair value hierarchy distinguishes between observable and unobservable inputs, which are categorized in one of the following levels:
Level 1 Inputs: Unadjusted quoted prices in active markets for identical assets or liabilities accessible to the reporting entity at the measurement date.
Level 2 Inputs: Other than quoted prices included in Level 1 inputs that are observable for the asset or liability, either directly or indirectly, for substantially the full term of the asset or liability.
Level 3 Inputs: Unobservable inputs for the asset or liability used to measure fair value to the extent that observable inputs are not available, thereby allowing for situations in which there is little, if any, market activity for the asset or liability at measurement date.
Unrealized gains and losses on available-for-sale securities are excluded from income, but are included, net of taxes, in other comprehensive income. If an "other-than-temporary" impairment is determined to exist, the difference between the value of the investment security recorded in the financial statements and the Company's current estimate of the fair value is recognized as a charge to earnings in the period in which the impairment is determined.
Inventories: Inventories are stated at the lower of cost (first-in, first-out method) or market. The Company regularly reviews inventory on hand for slow-moving and obsolete inventory, inventory not meeting quality control standards and inventory subject to expiration. To meet strict customer quality standards, the Company has established a highly controlled manufacturing process for proteins, antibodies and its chemically-based products. These products require the initial manufacture of multiple batches to determine if quality standards can be consistently met. In addition, the Company will produce larger batches of established products than current sales requirements due to economies of scale. The manufacturing process for these products, therefore, has and will continue to produce quantities in excess of forecasted usage. The Company values its manufactured protein and antibody inventory based on a two-year forecast and its chemically-based products on a five-year forecast. Inventory quantities in excess of the forecast are not valued due to uncertainty over salability. Sales of previously unvalued protein, antibody and chemically-based inventory for fiscal years 2013, 2012 and 2011 were not material. Manufacturing costs charged directly to cost of sales were $14.3 million, $13.3 million and $13.7 million for fiscal 2013, 2012 and 2011, respectively.
33
Depreciation and amortization: Equipment is depreciated using the straight-line method over an estimated useful life of five years. Buildings, building improvements and leasehold improvements are amortized over estimated useful lives of 5 to 40 years.
Goodwill: At June 30, 2013 and 2012, the Company had recorded goodwill of $84.3 million and $85.7 million, respectively. All of the goodwill recorded is within the Company's biotechnology segment. The Company tests goodwill at least annually for impairment. The Company completed its annual impairment testing of goodwill and concluded that no impairment existed as of June 30, 2013.
Intangible assets: Intangible assets are being amortized over their estimated useful lives. As of June 30, 2013, the Company has determined that no impairment of its intangible assets exists.
Investments in unconsolidated entities: The Company has equity investments in several start-up and early development stage companies. The accounting treatment of each investment (cost method or equity method) is dependent upon a number of factors, including, but not limited to, the Company's share in the equity of the investee and the Company's ability to exercise significant influence over the operating and financial policies of the investee.
B. Acquisitions:
Boston Biochem, Inc.: On April 1, 2011, the Company's R&D Systems subsidiary acquired for cash the assets of Boston Biochem, Inc., a developer and manufacturer of innovative ubiquitin-related research products based in Cambridge, Massachusetts. These products provide biomedical researchers tools that facilitate and accelerate basic research and drug discovery efforts. R&D Europe simultaneously acquired for cash the assets of Boston Biochem Limited, a United Kingdom based company that served as the European distributor of Boston Biochem, Inc. products.
In connection with the Boston Biochem acquisition, the Company recorded $1.9 million of developed technology intangible assets that have an estimated useful life of 12 years, $1.7 million of trade name intangible assets that have an estimated useful life of 12 years, $400,000 related to a non-compete agreement that has an estimated useful life of 5 years, and $300,000 related to customer relationships that have an estimated useful life of 12 years. The intangible asset amortization is deductible for income tax purposes.
The goodwill recorded as a result of the Boston Biochem acquisition represents the strategic benefits of enhancing and supplementing the depth and breadth of the Company's biotechnology product offering and augmenting its ability to serve research scientists, as well as leveraging its marketing, sales and distribution capabilities with this important product class. The goodwill is deductible for income tax purposes.
Transaction costs of approximately $148,000 were expensed as incurred and were included in the Company's selling, general and administrative costs during the fiscal year ended June 30, 2011.
Tocris Holdings Limited: On April 28, 2011, the Company's subsidiaries, R&D Systems and R&D Europe, acquired for cash all of the outstanding shares of Tocris Holdings Limited and subsidiaries (Tocris). Tocris is a leading supplier of biologically active neuro- and bio-chemical reagents for non-clinical life science research. Its products are used in both in-vitro and in-vivo experiments to understand biological processes and diseases as part of the initial drug discovery process. Tocris is based in Bristol, United Kingdom.
In connection with the acquisition of Tocris, the Company recorded $25.3 million of developed technology intangible assets that have an estimated useful life of 15 years, $16.5 million of trade name intangible assets that have an estimated useful life of 10 years, and $6.6 million related to customer relationships that have an estimated useful life of 13 years. The intangible asset amortization is not deductible for income tax purposes.
The goodwill recorded as a result of the Tocris acquisition represents the strategic benefits of growing the Company's product portfolio and the expected revenue growth from increased market penetration from future products and customers. The goodwill is not deductible for income tax purposes.
Transaction costs of approximately $1.6 million were expensed as incurred and were included in the Company's selling, general and administrative costs during the fiscal year ended June 30, 2011.
34
C. Available-For-Sale Investments:
At June 30, 2013 and 2012, the amortized cost and market value of the Company's available-for-sale securities by major security type were as follows (in thousands):
| June 30, | ||||||||||||||||
| 2013 | 2012 | |||||||||||||||
| Cost | Market | Cost | Market | |||||||||||||
State and municipal debt securities | $ | 179,463 | $ | 179,764 | $ | 161,761 | $ | 162,740 | ||||||||
Corporate debt securities | 12,804 | 12,817 | 22,693 | 22,802 | ||||||||||||
Foreign corporate debt securities | 4,484 | 4,490 | 6,080 | 6,110 | ||||||||||||
Certificates of deposit | 14,809 | 14,809 | 9,961 | 9,961 | ||||||||||||
Equity securities | 29,472 | 89,647 | 29,472 | 94,664 | ||||||||||||
|
|
|
|
|
|
|
| |||||||||
| $ | 241,032 | $ | 301,527 | $ | 229,967 | $ | 296,277 | |||||||||
|
|
|
|
|
|
|
| |||||||||
At June 30, 2013 and 2012, all of the Company's available-for-sale debt securities were valued using Level 2 inputs, while its equity securities were valued using Level 1 inputs. The Company had previously disclosed that available-for-sale debt securities were valued using Level 1 inputs and has determined that such securities should have been categorized as Level 2 securities. Certificates of deposit are carried at cost and are not subject to the fair value hierarchy. There were no transfers between Level 1 and Level 2 securities during fiscal 2013. Gross unrealized gains and unrealized losses on available-for-sale investments were $60.7 million and $218,000, respectively, at June 30, 2013. Gross unrealized gains and unrealized losses on available-for-sale investments were $66.3 million and $33,000, respectively, at June 30, 2012.
The Company's investment in equity securities consists of investments in the common stock and warrants of ChemoCentryx, Inc. (CCXI). The warrants are to purchase 150,000 shares of CCXI common stock at $20 per share and expire in February, 2022. The fair value of the warrants as of June 30, 2013 and 2012 were $1.5 million and $1.1 million, respectively, and were valued using Level 2 inputs. At June 30, 2013, the Company holds an approximate 15% interest in CCXI. Subsequent to June 30, 2013 the share price of CCXI has experienced a significant decline in value.
Unrealized gains and losses on the Company's available-for-sale debt securities are caused by interest rate changes. The Company has the ability and intent to hold its available-for-sale investments that are in an unrealized loss position until a recovery of fair value. The Company does not consider these investments to be other-than-temporarily impaired at June 30, 2013.
At June 30, 2013, the Company's investments in an unrealized loss position that have been determined to be temporarily impaired were as follows (in thousands):
Period of Unrealized Loss: | Fair Value | Unrealized Losses | ||||||
Less than one year | $ | 54,257 | $ | 218 | ||||
Greater than one year | 0 | 0 | ||||||
|
|
|
| |||||
| $ | 54,257 | $ | 218 | |||||
|
|
|
| |||||
Contractual maturities of available-for-sale debt securities are shown below (in thousands). Expected maturities may differ from contractual maturities because borrowers may have the right to recall or prepay obligations with or without call or prepayment penalties.
Year Ending June 30, 2013: | ||||
Due within one year | $ | 79,504 | ||
Due one to five years | 132,376 | |||
|
| |||
| $ | 211,880 | |||
|
| |||
Proceeds from maturities or sales of available-for-sale securities were $103.6 million, $131.7 million and $173.5 million during fiscal 2013, 2012 and 2011, respectively. There were no material realized gains or losses on these sales. Realized gains and losses are determined on the specific identification method.
35
D. Inventories:
Inventories consist of (in thousands):
| June 30, | ||||||||
| 2013 | 2012 | |||||||
Raw materials | $ | 5,885 | $ | 5,678 | ||||
Finished goods | 28,992 | 32,599 | ||||||
|
|
|
| |||||
| $ | 34,877 | $ | 38,277 | |||||
|
|
|
| |||||
At June 30, 2013 and 2012, the Company had $26.0 million and $23.3 million, respectively, of excess protein, antibody and chemically-based inventory on hand which was not valued.
E. Property and Equipment:
Property and equipment consist of (in thousands):
| June 30, | ||||||||
| 2013 | 2012 | |||||||
Cost: | ||||||||
Land | $ | 7,438 | $ | 7,473 | ||||
Buildings and improvements | 142,656 | 123,257 | ||||||
Machinery and equipment | 39,706 | 37,368 | ||||||
|
|
|
| |||||
| 189,800 | 168,098 | |||||||
Accumulated depreciation and amortization | (81,044 | ) | (74,310 | ) | ||||
|
|
|
| |||||
| $ | 108,756 | $ | 93,788 | |||||
|
|
|
| |||||
F. Intangible Assets and Goodwill:
Intangible assets and goodwill consist of (in thousands):
| June 30, | ||||||||||||
| Useful Life | 2013 | 2012 | ||||||||||
Developed technology | 8-12 years | $ | 28,656 | $ | 29,410 | |||||||
Trade names | 12-15 years | 17,659 | 17,871 | |||||||||
Customer relationships | 8-14 years | 8,613 | 8,712 | |||||||||
Non-compete agreement | 5 years | 400 | 400 | |||||||||
|
|
|
| |||||||||
| 55,328 | 56,393 | |||||||||||
Accumulated amortization | (14,776 | ) | (9,917 | ) | ||||||||
|
|
|
| |||||||||
| $ | 40,552 | $ | 46,476 | |||||||||
|
|
|
| |||||||||
Goodwill | $ | 84,336 | $ | 85,682 | ||||||||
|
|
|
| |||||||||
The change in the carrying amount of goodwill for in fiscal 2013 resulted from currency translation.
Changes to the carrying amount of net intangible assets consists of (in thousands)
| Year Ended June 30, | ||||||||
| 2013 | 2012 | |||||||
Beginning balance | $ | 46,476 | $ | 52,282 | ||||
Amortization expense | (5,061 | ) | (5,094 | ) | ||||
Currency translation | (863 | ) | (712 | ) | ||||
|
|
|
| |||||
Ending balance | $ | 40,552 | $ | 46,476 | ||||
|
|
|
| |||||
36
Amortization expense related to technologies included in cost of sales was $3.0 million, $3.0 million and $890,000 in fiscal 2013, 2012 and 2011, respectively. Amortization expense related to trade names, customer relationships, and the non-compete agreement included in selling, general and administrative expense was $2.1 million, $2.1 million and $574,000 in fiscal 2013, 2012 and 2011, respectively.
The estimated future amortization expense for intangible assets as of June 30, 2013 is as follows (in thousands):
Year Ending June 30: | ||||
2014 | $ | 4,289 | ||
2015 | 4,289 | |||
2016 | 4,269 | |||
2017 | 4,209 | |||
2018 | 4,209 | |||
Thereafter | 19,287 | |||
|
| |||
| $ | 40,552 | |||
|
| |||
G. Investments in Unconsolidated Entities:
The Company has a 16.8% ownership interest in Nephromics, LLC (Nephromics) at June 30, 2013. The Company accounts for its investment in Nephromics under the equity method of accounting as Nephromics is a limited liability company. During fiscal 2012, Nephromics signed an agreement to sell substantially all of its assets. The sale price included a payment at closing, future payment contingent upon the issuance of certain patents, and royalties on future sublicense income. As a result of the agreement, the Company determined that a portion of its investment in Nephromics was other than temporarily impaired and wrote off $2.4 million of this investment. The Company's net investment in Nephromics was $505,000 at both June 30, 2013 and 2012.
The Company has a 6.5% ownership percentage in H2Equity, LLC (formerly Hemerus Medical, LLC) at June 30, 2013. The Company accounts for its investment in H2Equity under the equity method of accounting as H2Equity is a limited liability company. During fiscal 2012, H2Equity entered into an agreement to sell substantially all of its assets. The sale closed in April 2013. The Company received a $1.1 million distribution at closing and recorded a gain of $708,000. The Company received an additional distribution in July 2013 of $26,000. The Company's net investment in H2Equity was $26,000 and $551,000 at June 30, 2013 and 2012.
The Company held an ownership percentage in ACTGen, a development stage biotechnology company located in Japan through October, 2012. During fiscal 2012, the Company determined that its investment in ACTGen was other-than-temporarily impaired and wrote off its remaining investment of $854,000.
The Company does not currently provide loans, guarantees or other financial assistance to Nephromics, H2Equity, or ACTGen and has no obligation to provide additional funding.
H. Commitments and Contingencies:
The Company leases office and warehouse space, vehicles and various office equipment under operating leases. At June 30, 2013, aggregate net minimum rental commitments under non-cancelable leases having an initial or remaining term of more than one year are payable as follows (in thousands):
Year Ending June 30: | ||||
2014 | $ | 712 | ||
2015 | 562 | |||
2016 | 517 | |||
2017 | 487 | |||
2018 | 478 | |||
Thereafter | 283 | |||
|
| |||
| $ | 3,039 | |||
|
| |||
37
Total rent expense was approximately $747,000, $793,000 and $416,000 for the years ended June 30, 2013, 2012 and 2011, respectively.
The Company is routinely subject to claims and involved in legal actions which are incidental to the business of the Company. Although it is difficult to predict the ultimate outcome of these matters, management believes that any ultimate liability will not materially affect the consolidated financial position or results of operations of the Company.
I. Share-based Compensation and Other Benefit Plans:
Equity incentive plan: The Company's 2010 Equity Incentive Plan (the 2010 Plan) provides for the granting of incentive and nonqualified stock options, restricted stock, restricted stock units, performance shares, performance units and stock appreciation rights. There are 3.0 million shares of common stock authorized for grant under the 2010 Plan. At June 30, 2013, there were 2.5 million shares of common stock available for grant under the 2010 Plan. The maximum term of incentive options granted under the 2010 Plan is ten years. The 2010 Plan replaced the Company's 1998 Nonqualified Stock Option Plan (the 1998 Plan) and 1997 Incentive Stock Option Plan (the 1997 Plan). The 2010 Plan, the 1998 Plan and the 1997 Plan (collectively, the Plans) are administered by the Board of Directors and its Compensation Committee, which determine the persons who are to receive awards under the Plans, the number of shares subject to each award and the term and exercise price of each award. The number of shares of common stock subject to outstanding awards at June 30, 2013 under the 2010 Plan, the 1998 Plan and the 1997 Plan were 453,000, 234,000, and 43,000, respectively.
Stock option activity, under the Plans for the three years ended June 30, 2013, consists of the following (shares in thousands):
| Shares | Weighted Average Exercise Price | Weighted Avg. Contractual Life (Yrs.) | Aggregate Intrinsic Value | |||||||||||||
Outstanding at June 30, 2010 | 440 | $ | 56.26 | |||||||||||||
Granted | 188 | 71.71 | ||||||||||||||
Exercised | (129 | ) | 41.48 | |||||||||||||
|
| |||||||||||||||
Outstanding at June 30, 2011 | 499 | 64.15 | ||||||||||||||
Granted | 95 | 71.94 | ||||||||||||||
Forfeited | (2 | ) | 76.15 | |||||||||||||
Exercised | (17 | ) | 50.98 | |||||||||||||
|
| |||||||||||||||
Outstanding at June 30, 2012 | 575 | 65.78 | ||||||||||||||
Granted | 175 | 67.80 | ||||||||||||||
Exercised | (22 | ) | 51.17 | |||||||||||||
|
| |||||||||||||||
Outstanding at June 30, 2013 | 728 | $ | 66.70 | 5.5 | $ | 2.8 million | ||||||||||
|
| |||||||||||||||
Exercisable at June 30: | ||||||||||||||||
2011 | 309 | $ | 58.80 | |||||||||||||
2012 | 403 | 62.67 | ||||||||||||||
2013 | 497 | 65.04 | 5.3 | $ | 2.6 million | |||||||||||
The fair values of options granted under the Plans were estimated on the date of grant using the Black-Scholes option-pricing model with the following assumptions used:
| Year Ended June 30, | ||||||||||||
| 2013 | 2012 | 2011 | ||||||||||
Dividend yield | 1.8 | % | 1.5 | % | 1.5 | % | ||||||
Expected volatility | 18%-23 | % | 22%-23 | % | 22%-27 | % | ||||||
Risk-free interest rates | 0.4%-1.4 | % | 0.9%-2.0 | % | 1.3%-2.3 | % | ||||||
Expected lives | 5 years | 6 years | 5 years | |||||||||
38
The dividend yield is based on the Company's historical annual cash dividend divided by the market value of the Company's common stock. The expected annualized volatility is based on the Company's historical stock price over a period equivalent to the expected life of the option granted. The risk-free interest rate is based on U.S. Treasury constant maturity interest rates with a term consistent with the expected life of the options granted.
The weighted average fair value of options granted during fiscal 2013, 2012 and 2011 was $9.72, $14.14 and $14.58, respectively. The total intrinsic value of options exercised during fiscal 2013, 2012 and 2011 were $405,000, $338,000 and $3.1 million, respectively. The total fair value of options vested during fiscal 2013, 2012 and 2011 were $1.5 million, $1.6 million and $1.0 million, respectively.
Fifteen thousand restricted common stock shares were issued in fiscal 2013 at a grant date fair value of $67.46 per share. Five thousand of the restricted shares vest in each of fiscal 2014 to 2016.
Stock-based compensation cost of $1.9 million, $1.6 million and $1.1 million was included in selling, general and administrative expense in fiscal 2013, 2012 and 2011, respectively. As of June 30, 2013, there was $3.0 million of unrecognized compensation cost related to non-vested stock options and restricted stock which will be expensed in fiscal 2014 through 2017. The weighted average period over which the compensation cost is expected to be recognized is 1.1 years.
Profit sharing plans: The Company has profit sharing and savings plans for its U.S. employees, which conform to IRS provisions for 401(k) plans. The Company may make profit sharing contributions at the discretion of the Board of Directors. Operations have been charged for contributions to the plans of $754,000 and $718,000 for the years ended June 30, 2012 and 2011, respectively. No contribution was charged to operations for fiscal 2013. The Company operates defined contribution pension plans for employees of R&D Europe and Tocris. Operations have been charged for contributions to the plans of $603,000, $499,000 and $240,000 for the years ended June 30, 2013, 2012 and 2011, respectively.
Stock bonus plans: The Company may make contributions to its stock bonus plans in the form of common stock, cash or other property at the discretion of the Board of Directors. The Company purchases its common stock at market value for contribution to the plans. For the years ended June 30, 2012 and 2011 operations have been charged for contributions to the plan of $715,000 and $690,000, respectively. No contribution to the plan was charged to operations in fiscal 2013.
Performance incentive program: Under certain employment agreements with executive officers, the Company recorded cash bonuses of $334,000, $31,000 and $39,000 and granted options for 132,852, 22,932 and 3,364 shares of common stock for the years ended June 30, 2013, 2012 and 2011, respectively. In addition, 15,000 restricted common stock shares were issued in fiscal 2013.
J. Income Taxes:
The provisions for income taxes consist of the following (in thousands):
| Year Ended June 30, | ||||||||||||
| 2013 | 2012 | 2011 | ||||||||||
Earnings before income taxes consist of: | ||||||||||||
Domestic | $ | 127,491 | $ | 130,009 | $ | 131,080 | ||||||
Foreign | 33,171 | 32,186 | 33,901 | |||||||||
|
|
|
|
|
| |||||||
| $ | 160,662 | $ | 162,195 | $ | 164,981 | |||||||
|
|
|
|
|
| |||||||
Taxes on income consist of: | ||||||||||||
Currently payable: | ||||||||||||
Federal | $ | 37,666 | $ | 42,288 | $ | 36,600 | ||||||
State | 2,012 | 3,065 | 2,302 | |||||||||
Foreign | 10,758 | 8,891 | 9,854 | |||||||||
Net deferred: | ||||||||||||
Federal | (595 | ) | (4,318 | ) | 3,893 | |||||||
State | (7 | ) | (149 | ) | 19 | |||||||
Foreign | (1,733 | ) | 87 | 11 | ||||||||
|
|
|
|
|
| |||||||
| $ | 48,101 | $ | 49,864 | $ | 52,679 | |||||||
|
|
|
|
|
| |||||||
39
The following is a reconciliation of the federal tax calculated at the statutory rate of 35% to the actual income taxes provided (in thousands):
| Year Ended June 30, | ||||||||||||
| 2013 | 2012 | 2011 | ||||||||||
Computed expected federal income tax expense | $ | 56,232 | $ | 56,768 | $ | 57,743 | ||||||
State income taxes, net of federal benefit | 1,300 | 2,038 | 1,463 | |||||||||
Qualified production activity deduction | (3,774 | ) | (3,917 | ) | (3,889 | ) | ||||||
Research and development tax credit | (1,392 | ) | (465 | ) | (1,329 | ) | ||||||
Tax-exempt interest | (568 | ) | (565 | ) | (858 | ) | ||||||
Foreign tax rate differences | (2,587 | ) | (2,276 | ) | (1,975 | ) | ||||||
Change in deferred tax valuation allowance | 0 | (3,016 | ) | 60 | ||||||||
Other | (1,110 | ) | 1,297 | 1,464 | ||||||||
|
|
|
|
|
| |||||||
| $ | 48,101 | $ | 49,864 | $ | 52,679 | |||||||
|
|
|
|
|
| |||||||
Temporary differences comprising deferred taxes on the Consolidated Balance Sheets are as follows (in thousands):
| June 30 | ||||||||
| 2013 | 2012 | |||||||
Inventory | $ | 9,049 | $ | 6,893 | ||||
Unrealized profit on intercompany sales | 1,973 | 1,686 | ||||||
Excess tax basis in equity investments | 4,760 | 4,776 | ||||||
Deferred compensation | 3,161 | 2,651 | ||||||
Other | 885 | 891 | ||||||
|
|
|
| |||||
Net deferred tax assets | 19,828 | 16,897 | ||||||
Net unrealized gain on available-for-sale investments | (21,662 | ) | (23,791 | ) | ||||
Goodwill and intangible asset amortization | (15,195 | ) | (15,123 | ) | ||||
Depreciation | (701 | ) | (847 | ) | ||||
Other | (687 | ) | (502 | ) | ||||
|
|
|
| |||||
Deferred tax liabilities | (38,245 | ) | (40,263 | ) | ||||
|
|
|
| |||||
Net deferred tax liabilities | $ | (18,417 | ) | $ | (23,366 | ) | ||
|
|
|
| |||||
A deferred tax valuation allowance is required when it is more likely than not that all or a portion of deferred tax assets will not be realized. At June 30, 2011, the Company had provided a valuation allowance for potential capital loss carryovers resulting from excess tax basis in certain of its equity investments. During fiscal 2012, the Company determined that the valuation allowance was no longer necessary as a result of the Company's unrealized gain on its CCXI investment. The Company has the intent and ability to sell a portion of its CCXI investment and realize a long-term capital gain to offset losses on its investments in unconsolidated entities. The Company believes that it is more likely than not that the recorded deferred tax assets will be realized.
During fiscal 2013, the Company's R&D Europe subsidiary declared and paid a dividend of £20 million ($30.7 million) to the Company. The £20 million R&D Europe earnings had previously been taxed in the U.S. and therefore, no additional U.S. tax resulted from the repatriation. Undistributed earnings of the Company's foreign subsidiaries amounted to approximately $144 million as of June 30, 2013. Deferred taxes have not been provided on such undistributed earnings, as the Company has either paid U.S. taxes on the undistributed earnings or intends to indefinitely reinvest the undistributed earnings in the foreign operations.
40
A summary of changes in unrecognized tax benefits is as follows (in thousands):
| June 30 | ||||||||
| 2013 | 2012 | |||||||
Beginning balance | $ | 23 | $ | 34 | ||||
Change due to tax positions related to the current year | 11 | (4 | ) | |||||
Decrease due to lapse of statute of limitations | (4 | ) | (7 | ) | ||||
|
|
|
| |||||
Ending balance | $ | 30 | $ | 23 | ||||
|
|
|
| |||||
The gross unrecognized tax benefit balance as of June 30, 2013, 2012 and 2011 includes $1,000, $2,000 and $3,000, respectively, of unrecognized tax benefits that, if recognized, would affect the effective tax rate. Accrued interest and penalties were not material at June 30, 2013 and 2012.
The Company does not believe it is reasonably possible that the total amounts of unrecognized tax benefits will significantly increase or decrease in the next twelve months. The Company has files income tax returns in the U.S federal tax jurisdiction, the states of Minnesota, Massachusetts and California, and several jurisdictions outside the U.S. U.S. tax returns for 2010 and subsequent years remain open to examination by the tax authorities. The Company's major non-U.S. tax jurisdictions are the United Kingdom, France and Germany, which have tax years open to examination for 2010 and subsequent years, and China, which has calendar year 2013 open to examination.
K. Earnings Per Share:
The number of shares used to calculate earnings per share are as follows (in thousands, except per share data):
| Year Ended June 30, | ||||||||||||
| 2013 | 2012 | 2011 | ||||||||||
Net earnings used for basic and diluted earnings per share | $ | 112,561 | $ | 112,331 | $ | 112,302 | ||||||
|
|
|
|
|
| |||||||
Weighted average shares used in basic computation | 36,836 | 36,939 | 37,098 | |||||||||
Dilutive stock options | 64 | 67 | 74 | |||||||||
|
|
|
|
|
| |||||||
Weighted average shares used in diluted computation | 36,900 | 37,006 | 37,172 | |||||||||
|
|
|
|
|
| |||||||
Basic EPS | $ | 3.06 | $ | 3.04 | $ | 3.03 | ||||||
Diluted EPS | $ | 3.05 | $ | 3.04 | $ | 3.02 | ||||||
The dilutive effect of stock options in the above table excludes all options for which the aggregate exercise proceeds exceeded the average market price for the period. The number of potentially dilutive option shares excluded from the calculation was 329,000, 94,000 and 77,000 at June 30, 2013, 2012 and 2011, respectively.
L. Segment Information:
The Company has two reportable segments based on the nature of its products. R&D Systems' Biotechnology Division, R&D Europe, Tocris, R&D China, BiosPacific and Boston Biochem are included in the biotechnology reporting segment. The Company's biotechnology reporting segment develops, manufactures and sells biotechnology research and diagnostic products world-wide. The Company's clinical controls reporting segment, which consists of R&D Systems' Clinical Controls Division, develops and manufactures controls and calibrators for sale world-wide. No customer of either segment accounted for more than 10% of the Company's consolidated net sales for the years ended June 30, 2013, 2012 and 2011. There are no concentrations of business transacted with a particular customer or supplier or concentrations of revenue from a particular product or geographic area that would severely impact the Company in the near term.
The accounting policies of the segments are the same as those described in Note A. In evaluating segment performance, management focuses on sales and earnings before taxes.
41
Following is financial information relating to the operating segments (in thousands):
| Year Ended June 30, | ||||||||||||
| 2013 | 2012 | 2011 | ||||||||||
External sales | ||||||||||||
Biotechnology | $ | 288,156 | $ | 293,274 | $ | 270,287 | ||||||
Clinical Controls | 22,419 | 21,286 | 19,675 | |||||||||
|
|
|
|
|
| |||||||
Consolidated net sales | $ | 310,575 | $ | 314,560 | $ | 289,962 | ||||||
|
|
|
|
|
| |||||||
Earnings before taxes | ||||||||||||
Biotechnology | $ | 156,910 | $ | 162,763 | $ | 164,332 | ||||||
Clinical Controls | 8,746 | 8,002 | 7,222 | |||||||||
|
|
|
|
|
| |||||||
Segment earnings before taxes | 165,656 | 170,765 | 171,554 | |||||||||
Other | (4,994 | ) | (8,570 | ) | (6,573 | ) | ||||||
|
|
|
|
|
| |||||||
Consolidated earnings before taxes | $ | 160,662 | $ | 162,195 | $ | 164,981 | ||||||
|
|
|
|
|
| |||||||
Goodwill | ||||||||||||
Biotechnology | $ | 84,336 | $ | 85,682 | $ | 86,633 | ||||||
Clinical Controls | 0 | 0 | 0 | |||||||||
|
|
|
|
|
| |||||||
Consolidated goodwill | $ | 84,336 | $ | 85,682 | $ | 86,633 | ||||||
|
|
|
|
|
| |||||||
Intangible assets, net | ||||||||||||
Biotechnology | $ | 40,552 | $ | 46,476 | $ | 52,282 | ||||||
Clinical Controls | 0 | 0 | 0 | |||||||||
|
|
|
|
|
| |||||||
Consolidated intangible assets, net | $ | 40,552 | $ | 46,476 | $ | 52,282 | ||||||
|
|
|
|
|
| |||||||
Assets | ||||||||||||
Biotechnology | $ | 580,085 | $ | 529,392 | $ | 505,087 | ||||||
Clinical Controls | 24,887 | 22,135 | 21,046 | |||||||||
|
|
|
|
|
| |||||||
Segment assets | 604,972 | 551,527 | 526,133 | |||||||||
Other | 173,126 | 167,797 | 91,537 | |||||||||
|
|
|
|
|
| |||||||
Consolidated assets | $ | 778,098 | $ | 719,324 | $ | 617,670 | ||||||
|
|
|
|
|
| |||||||
Depreciation and amortization | ||||||||||||
Biotechnology | $ | 10,781 | $ | 10,920 | $ | 7,165 | ||||||
Clinical Controls | 389 | 411 | 417 | |||||||||
|
|
|
|
|
| |||||||
Segment depreciation and amortization | 11,170 | 11,331 | 7,582 | |||||||||
Other | 1,151 | 1,136 | 1,118 | |||||||||
|
|
|
|
|
| |||||||
Consolidated depreciation and amortization | $ | 12,321 | $ | 12,467 | $ | 8,700 | ||||||
|
|
|
|
|
| |||||||
Capital purchases | ||||||||||||
Biotechnology | $ | 3,248 | $ | 4,021 | $ | 2,707 | ||||||
Clinical Controls | 6,914 | 597 | 149 | |||||||||
|
|
|
|
|
| |||||||
Segment capital purchases | 10,162 | 4,618 | 2,856 | |||||||||
Other | 12,292 | 1,399 | 774 | |||||||||
|
|
|
|
|
| |||||||
Consolidated capital purchases | $ | 22,454 | $ | 6,017 | $ | 3,630 | ||||||
|
|
|
|
|
| |||||||
The other reconciling items include the results of unallocated corporate expenses and assets, and the Company's share of gain (losses) from its equity method investees.
42
Following is financial information relating to geographic areas (in thousands):
| Year Ended June 30, | ||||||||||||
| 2013 | 2012 | 2011 | ||||||||||
External sales | ||||||||||||
United States | $ | 164,308 | $ | 172,310 | $ | 159,857 | ||||||
Europe | 88,297 | 90,142 | 83,676 | |||||||||
China | 14,106 | 11,378 | 8,299 | |||||||||
Other Asia | 28,608 | 25,988 | 24,715 | |||||||||
Rest of world | 15,256 | 14,742 | 13,415 | |||||||||
|
|
|
|
|
| |||||||
Total external sales | $ | 310,575 | $ | 314,560 | $ | 289,962 | ||||||
|
|
|
|
|
| |||||||
Long-lived assets | ||||||||||||
United States | $ | 103,541 | $ | 87,968 | $ | 88,802 | ||||||
Europe | 7,129 | 7,528 | 7,819 | |||||||||
China | 117 | 141 | 96 | |||||||||
|
|
|
|
|
| |||||||
Total long-lived assets | $ | 110,787 | $ | 95,637 | $ | 96,717 | ||||||
|
|
|
|
|
| |||||||
External sales are attributed to countries based on the location of the customer/distributor. Long-lived assets are comprised of land, buildings and improvements and equipment, net of accumulated depreciation and other assets.
M. Supplemental Disclosures of Cash Flow Information and Noncash Investing and Financing Activities:
In fiscal 2013, 2012 and 2011, the Company paid cash for income taxes of $51.6 million, $58.7 million and $46.2 million, respectively.
In fiscal 2011, stock options for 14,834 shares of common stock were exercised by the surrender of 9,096 shares of common stock at fair market value of $561,000.
During fiscal 2012, the Company's cost basis investment in CCXI was converted to an available-for-sale investment carried at fair value.
N. Accumulated Other Comprehensive Income:
Accumulated other comprehensive income (loss) consists of (in thousands):
| June 30, | ||||||||||||
| 2013 | 2012 | 2011 | ||||||||||
Foreign currency translation adjustments | $ | (24,281 | ) | $ | (20,743 | ) | $ | (16,939 | ) | |||
Net unrealized gain on available-for-sale investments, net of tax | 38,834 | 42,518 | 648 | |||||||||
|
|
|
|
|
| |||||||
| $ | 14,553 | $ | 21,775 | $ | (16,291 | ) | ||||||
|
|
|
|
|
| |||||||
O. Subsequent Event:
On July 22, 2013, the Company, through its R&D Systems subsidiary, acquired Bionostics Holdings, Ltd. (Bionostics) and its U.S. operating subsidiary Bionostics, Inc. Bionostics is a global leader in the development, manufacture and distribution of control solutions that verify the proper operation of in-vitro diagnostic devices primarily utilized in point of care blood glucose and blood gas testing. All of the shares of Bionostics, Holdings, Ltd were acquired for approximately $104 million in cash, subject to adjustment following closing based on the final level of working capital of Bionostics. Bionostics will become part of the Company's Clinical Controls segment.
43
REPORT OF INDEPENDENT REGISTERED PUBLIC ACCOUNTING FIRM
The Board of Directors and Stockholders
Techne Corporation:
We have audited the accompanying consolidated balance sheets of Techne Corporation and subsidiaries (The Company) as of June 30, 2013 and 2012, and the related consolidated statements of earnings and comprehensive income, shareholders' equity, and cash flows for each of the years in the three-year period ended June 30, 2013. We also have audited Techne Corporation's internal control over financial reporting as of June 30, 2013, based on criteria established in Internal Control – Integrated Framework (1992) issued by the Committee of Sponsoring Organizations of the Treadway Commission (COSO). Techne Corporation's management is responsible for these consolidated financial statements, for maintaining effective internal control over financial reporting, and for its assessment of the effectiveness of internal control over financial reporting, included in the accompanying Management's Annual report on Internal Controls over Financial Reporting. Our responsibility is to express an opinion on these consolidated financial statements and an opinion on the Company's internal control over financial reporting based on our audits.
We conducted our audits in accordance with the standards of the Public Company Accounting Oversight Board (United States). Those standards require that we plan and perform the audits to obtain reasonable assurance about whether the financial statements are free of material misstatement and whether effective internal control over financial reporting was maintained in all material respects. Our audits of the consolidated financial statements included examining, on a test basis, evidence supporting the amounts and disclosures in the financial statements, assessing the accounting principles used and significant estimates made by management, and evaluating the overall financial statement presentation. Our audit of internal control over financial reporting included obtaining an understanding of internal control over financial reporting, assessing the risk that a material weakness exists, and testing and evaluating the design and operating effectiveness of internal control based on the assessed risk. Our audits also included performing such other procedures as we considered necessary in the circumstances. We believe that our audits provide a reasonable basis for our opinions.
A company's internal control over financial reporting is a process designed to provide reasonable assurance regarding the reliability of financial reporting and the preparation of financial statements for external purposes in accordance with generally accepted accounting principles. A company's internal control over financial reporting includes those policies and procedures that (1) pertain to the maintenance of records that, in reasonable detail, accurately and fairly reflect the transactions and dispositions of the assets of the company; (2) provide reasonable assurance that transactions are recorded as necessary to permit preparation of financial statements in accordance with generally accepted accounting principles, and that receipts and expenditures of the company are being made only in accordance with authorizations of management and directors of the company; and (3) provide reasonable assurance regarding prevention or timely detection of unauthorized acquisition, use, or disposition of the company's assets that could have a material effect on the financial statements.
Because of its inherent limitations, internal control over financial reporting may not prevent or detect misstatements. Also, projections of any evaluation of effectiveness to future periods are subject to the risk that controls may become inadequate because of changes in conditions, or that the degree of compliance with the policies or procedures may deteriorate.
A material weakness is a deficiency, or a combination of deficiencies, in internal control over financial reporting, such that there is a reasonable possibility that a material misstatement of the company's annual or interim financial statements will not be prevented or detected on a timely basis. A material weakness related to the Company's IT general controls has been identified and included in management's assessment (Item 9A(b)). This material weakness was considered in determining the nature, timing, and extent of audit tests applied in our audit of the 2013 consolidated financial statements.
In our opinion, the consolidated financial statements referred to above present fairly, in all material respects, the financial position of Techne Corporation and subsidiaries as of June 30, 2013 and 2012, and the results of its operations and its cash flows for each of the years in the three-year period ended June 30, 2013, in conformity with U.S. generally accepted accounting principles. Also in our opinion, because of the effect of the aforementioned material weakness on the achievement of the objectives of the control criteria, Techne Corporation has not maintained effective internal control over financial reporting as of June 30, 2013, based on criteria established in Internal Control – Integrated Framework (1992) issued by the Committee of Sponsoring Organizations of the Treadway Commission.
KPMG LLP
Minneapolis, Minnesota
August 29, 2013
44
ITEM 9. CHANGES IN AND DISAGREEMENTS WITH ACCOUNTANTS ON
ACCOUNTING AND FINANCIAL DISCLOSURE
None.
ITEM 9A. CONTROLS AND PROCEDURES
Evaluation of Disclosure Controls and Procedures
As required by Rule 13a-15(b) of the Securities Exchange Act of 1934 (the "Exchange Act"), management, with the participation of our Chief Executive Officer and Chief Financial Officer, evaluated, as of the end of the period covered by this report, the effectiveness of our disclosure controls and procedures as defined in Exchange Act Rule 13a-15(e). Based upon that evaluation, our Chief Executive Officer and Chief Financial Officer concluded that due to the material weakness in our internal control over financial reporting that is described below in Management's Report on Internal Control over Financial Reporting, our disclosure controls and procedures were not effective as of June 30, 2013.
MANAGEMENT'S REPORT ON INTERNAL CONTROL OVER FINANCIAL REPORTING
Management is responsible for establishing and maintaining adequate internal control over financial reporting (as defined in Rule 13a-15(f) under the Exchange Act). Our internal control over financial reporting is a process designed to provide reasonable assurance regarding the reliability of financial reporting and the preparation of financial statements for external purposes in accordance with GAAP. Because of its inherent limitations, internal control over financial reporting may not prevent or detect misstatements. Also, projections of any evaluation of effectiveness to future periods are subject to the risk that controls may become inadequate because of changes in conditions, or that the degree of compliance with the policies or procedures may deteriorate.
Management, including our Chief Executive Officer and Chief Financial Officer, assessed the effectiveness of our internal control over financial reporting as of June 30, 2013. In making this assessment, our management used the criteria for effective internal control over financial reporting described in "Internal Control-Integrated Framework (1992)" issued by the Committee of Sponsoring Organizations of the Treadway Commission. Based on this assessment, management has determined that due to the material weaknesses described below, our internal control over financial reporting was not effective as of June 30, 2013.
A material weakness is a deficiency, or a combination of deficiencies, in internal control over financial reporting, such that there is a reasonable possibility that a material misstatement of the Company's annual or interim financial statements will not be prevented or detected on a timely basis. The Company has identified a material weakness in the design, implementation and operating effectiveness of general IT controls (GITCs) intended to ensure that access to financial applications and data was adequately restricted to appropriate personnel, and that program changes to particular financial applications are documented, tested, and moved into the production environment only by individuals separate from the development function. As a result, certain classes of transactions subject to controls that rely upon information generated by the Company's IT systems that are subject to the operation of the GITCs, including the completeness, existence, and accuracy of revenue and accounts receivable, allow for a reasonable possibility that a misstatement is not adequately prevented or detected through the operation of management's system of internal control over financial reporting.
45
Remediation Plan for Material Weakness in Internal Control over Financial Reporting
In light of the material weakness identified above, the Company performed additional analysis and other post-closing procedures to ensure that the Company's consolidated financial statements were prepared in accordance with generally accepted accounting principles and accurately reflect its financial position and results of operation as of and for the year ended June 30, 2013. As a result, notwithstanding the material weakness as described above, management concluded that the consolidated financial statements included in this Form 10-K present fairly, in all material respects, the Company's financial position, results of operations and cash flows for the periods presented.
In response to the material weakness we have developed a plan with the oversight of the Audit Committee of the Board of Directors to remediate the material weakness.
We will enhance our internal testing approach, including related procedures, documentation, and possible expansion of human resources, for select controls to ensure that we have adequately addressed the completeness and accuracy of system generated information used to support the operation of the controls and to improve segregation of duties.
The Company's internal control over financial reporting as of June 30, 2013 has been audited by KPMG LLP, as stated in their report which is included elsewhere herein.
With the actions described in this Item 9A, we conclude that the consolidated financial statements included in this 2013 Annual Report on Form 10-K fairly present, in all material respects, our financial position, results of operations, and cash flows for the periods presented in conformity with accounting principles generally accepted in the United States of America ("GAAP").
Changes in Internal Control over Financial Reporting
There were no other material changes in our internal control over financial reporting identified in connection with the evaluation required by Rule 13a-15(e) that occurred during the quarter ended June 30, 2013 that have materially affected, or are reasonably likely to materially affect, our internal control over financial reporting.
ITEM 9B. OTHER INFORMATION
None.
PART III
ITEM 10. DIRECTORS, EXECUTIVE OFFICERS AND CORPORATE GOVERNANCE
Other than "Executive Officers of the Registrant" which is set forth at the end of Item 1 in Part I of this report, the information required by Item 10 is incorporated herein by reference to the sections entitled "Election of Directors," "Corporate Governance" and "Compliance With Section 16(a) of the Exchange Act" in the Company's Proxy Statement for its 2013 Annual Meeting of Shareholders which will be filed with the Securities and Exchange Commission pursuant to Regulation 14A within 120 days after the close of the fiscal year for which this report is filed.
46
ITEM 11. EXECUTIVE COMPENSATION
The information required by Item 11 is incorporated herein by reference to the section entitled "Corporate Governance" and "Executive Compensation Discussion and Analysis" in the Company's Proxy Statement for its 2013 Annual Meeting of Shareholders which will be filed with the Securities and Exchange Commission pursuant to Regulation 14A within 120 days after the close of the fiscal year for which this report is filed.
ITEM 12. SECURITY OWNERSHIP OF CERTAIN BENEFICIAL
OWNERS AND MANAGEMENT AND RELATED SHAREHOLDER MATTERS
Information about the Company's equity compensation plans at June 30, 2013 is as follows:
Plan Category | Number of Securities to be Issued Upon Exercise of Outstanding Options, Warrants and Rights | Weighted-Average Exercise Price of Outstanding Options, Warrants and Rights | Number of Securities Remaining Available for Future Issuance Under Equity Compensation Plans | |||||||||
Equity compensation plans approved by Shareholders (1) | 728,000 | $ | 66.70 | 2.5 million | ||||||||
Equity compensation plans not approved by Shareholders | 0 | 0 | 0 | |||||||||
| (1) | Includes the Company's 2010 Equity Incentive Plan, 1997 Incentive Stock Option Plan and 1998 Nonqualified Stock Option Plan. |
The remaining information required by Item 12 is incorporated by reference to the sections entitled "Principal Shareholders" and "Management Shareholdings" in the Company's Proxy Statement for its 2013 Annual Meeting of Shareholders which will be filed with the Securities and Exchange Commission pursuant to Regulation 14A within 120 days after the close of the fiscal year for which this report is filed.
ITEM 13. CERTAIN RELATIONSHIPS AND RELATED TRANSACTIONS, AND DIRECTOR INDEPENDENCE
The information required by Item 13 is incorporated by reference to the sections entitled "Corporate Governance" in the Company's Proxy Statement for its 2013 Annual Meeting of Shareholders which will be filed with the Securities and Exchange Commission pursuant to Regulation 14A within 120 days after the close of the fiscal year for which this report is filed.
ITEM 14. PRINCIPAL ACCOUNTING FEES AND SERVICES
The information required by Item 14 is incorporated herein by reference to the section entitled "Audit Matters" in the Company's Proxy Statement for its 2013 Annual Meeting of Shareholders which will be filed with the Securities and Exchange Commission pursuant to Regulation 14A within 120 days after the close of the fiscal year for which this report is filed.
47
PART IV
ITEM 15. EXHIBITS, FINANCIAL STATEMENT SCHEDULES
A. (1) List of Financial Statements.
The following Consolidated Financial Statements are filed as part of this Annual Report on Form 10-K:
Consolidated Statements of Earnings and Comprehensive Income for the Years Ended June 30, 2013, 2012 and 2011 | 28 | |||
Consolidated Balance Sheets as of June 30, 2013 and 2012 | 29 | |||
Consolidated Statements of Shareholders' Equity for the Years Ended June 30, 2013, 2012 and 2011 | 30 | |||
Consolidated Statements of Cash Flows for the Years Ended June 30, 2013, 2012 and 2011 | 31 | |||
Notes to Consolidated Financial Statements for the Years Ended June 30, 2013, 2012 and 2011 | 32 | |||
Report of Independent Registered Public Accounting Firm | 44 | |||
A. (2) Financial Statement Schedules.
All financial statement schedules are omitted because they are not applicable, not material or the required information is shown in the Consolidated Financial Statements or Notes thereto.
A. (3) Exhibits.
See "Exhibit Index" immediately following signature page.
48
SIGNATURES
Pursuant to the requirements of Section 13 or 15(d) of the Securities Exchange Act of 1934, the Registrant has duly caused this Report to be signed on its behalf by the undersigned, thereunto duly authorized.
| TECHNE CORPORATION | ||||||
| Date: August 29, 2013 | /s/ Charles Kummeth | |||||
| By: Charles Kummeth | ||||||
| Its: President | ||||||
Pursuant to the requirements of the Securities Exchange Act of 1934, this Report has been signed by the following persons on behalf of the Registrant and in the capacities and on the dates indicated.
Date | Signature and Title | |||
| August 29, 2013 | /s/ Robert V. Baumgartner | |||
| Robert V. Baumgartner | ||||
| Chairman of the Board and Director | ||||
| August 29, 2013 | /s/ Roger C. Lucas, Ph.D. | |||
| Dr. Roger C. Lucas | ||||
| Vice Chairman and Director | ||||
| August 29, 2013 | /s/ Howard V. O'Connell | |||
| Howard V. O'Connell, Director | ||||
| August 29, 2013 | /s/ Randolph C. Steer, Ph.D., M.D. | |||
| Dr. Randolph C. Steer, Director | ||||
| August 29, 2013 | /s/ Charles A. Dinarello, M.D. | |||
| Dr. Charles A. Dinarello, Director | ||||
| August 29, 2013 | /s/ Karen A. Holbrook, Ph.D. | |||
| Dr. Karen A. Holbrook, Director | ||||
| August 29, 2013 | /s/ John L. Higgins | |||
| John L. Higgins, Director | ||||
| August 29, 2013 | /s/ Roeland Nusse, Ph.D. | |||
| Dr. Roeland Nusse, Director | ||||
| August 29, 2013 | /s/ Charles Kummeth | |||
| Charles Kummeth, Chief Executive Officer | ||||
| (principal executive officer) | ||||
| August 29, 2013 | /s/ Gregory J. Melsen | |||
| Gregory J. Melsen, Chief Financial Officer | ||||
| (principal financial officer) | ||||
| August 29, 2013 | /s/ Kathleen M. Backes | |||
| Kathleen M. Backes, Controller | ||||
49
EXHIBIT INDEX
for Form 10-K for the 2013 Fiscal Year
Exhibit Number | Description | |
| 3.1 | Restated Bylaws of Company, as amended to date-incorporated by reference to Exhibit 3.1 of the Company's Form 8-K dated October 25, 2012.* | |
| 3.2 | Restated Articles of Incorporation of the Company, as amended to date-incorporated by reference to Exhibit 3.2 of the Company's Form 8-K, dated October 25, 2012.* | |
| 10.1** | Agreement with Respect to Inventions, Proprietary Information, and Unfair Competition with Thomas E. Oland-incorporated by reference to Exhibit 10.2 of the Company's Form 10, dated October 27, 1988.* | |
| 10.2** | Company's Profit Sharing Plan-incorporated by reference to Exhibit 10.6 of the Company's Form 10, dated October 27, 1988.* | |
| 10.3** | Company's Stock Bonus Plan-incorporated by reference to Exhibit 10.7 of the Company's Form 10, dated October 27, 1988.* | |
| 10.4** | 1997 Incentive Stock Option Plan-incorporated by reference to Exhibit 10.24 of the Company's Form 10-K for the year ended June 30, 1997.* | |
| 10.5** | Form of Stock Option Agreement for 1997 Incentive Stock Option Plan-incorporated by reference to Exhibit 10.25 of the Company's Form 10-K for the year ended June 30, 1997.* | |
| 10.6 | Investment Agreement between ChemoCentryx, Inc. and Techne Corporation dated November 18, 1997-incorporated by reference to Exhibit 10.1 of the Company's Form 10-Q for the quarter ended December 31, 1997.* | |
| 10.7** | 1998 Nonqualified Stock Option Plan-incorporated by reference to Exhibit 10.1 of the Company's Form 10-Q for the quarter ended September 30, 1998.* | |
| 10.8** | Form of Stock Option Agreement for 1998 Nonqualified Stock Option Plan-incorporated by reference to Exhibit 10.2 of the Company's Form 10-Q for the quarter ended September 30, 1998.* | |
| 10.9 | Investors Rights Agreement dated February 2, 2001 among ChemoCentryx, Inc., the Company and certain investors amending the Investment Agreement between ChemoCentryx, Inc. and the Company dated November 18, 1997-incorporated by reference to Exhibit 10.32 of the Company's 10-K for the year ended June 30, 2001.* | |
| 10.10 | Letter Agreement dated February 2, 2001 between ChemoCentryx, Inc. and the Company amending the terms of warrants held by the Company-incorporated by reference to Exhibit 10.33 of the Company's 10-K for the year ended June 30, 2001.* | |
| 10.11** | Form of Indemnification Agreement entered into with each director and executive officer of the Company-incorporated by reference to Exhibit 10.1 of the Company's 10-Q for the quarter ended December 31, 2002.* | |
50
Exhibit Number | Description | |
| 10.12 | Amended and Restated Investors Rights Agreement dated June 13, 2006 among ChemoCentryx, Inc and the Company and certain investors-incorporated by reference to Exhibit 10.31 of the Company's 10-K for the year ended June 30, 2006.* | |
| 10.13** | Description of Management Incentive Bonus Under the Techne Corporation 2010 Equity Incentive Plan. | |
| 10.14** | 2010 Equity Incentive Plan-incorporated by reference to Exhibit 10.1 of the Company's 8-K dated October 28, 2010.* | |
| 10.15** | Form of Nonqualified Stock Option Agreement for the 2010 Equity Incentive Plan-incorporated by reference to Exhibit 10.2 of the Company's 8-K dated October 28, 2010.* | |
| 10.16** | Form of Incentive Stock Option Agreement for the 2010 Equity Incentive Plan-incorporated by reference to Exhibit 10.3 of the Company's 8-K dated October 28, 2010.* | |
| 10.17 | Share Purchase Agreement by and among Research and Diagnostic Systems, Inc., R&D Systems Europe Ltd., and the shareholders of Tocris Holdings Ltd., dated April 28, 2011-incorporated by reference to Exhibit 2.1 of the Company's 8-K dated April 28, 2011.* | |
| 10.18** | Amended and Restated Employment Agreement, dated July 1, 2011, with Marcel Veronneau-incorporated by reference to Exhibit 10.19 of the Company's 10-K for the year ended June 30, 2011.* | |
| 10.19 | Deed of Assignment and Novation dated January 23, 2012 in connection with a share purchase agreement relating to Tocris Holdings Limited-incorporated by reference to Exhibit 10.1 of the Company's 10-Q for the quarter ended December 31, 2011.* | |
| 10.20** | Amended and Restated Employment Agreement, dated November 30, 2012, with Gregory J. Melsen -incorporated by reference to Exhibit 99.1 of the Company's 8-K Amendment dated October 31, 2012.* | |
| 10.21** | Employment Agreement by and between the Company and Charles Kummeth-incorporated by reference to Exhibit 10.1 of the Company's 8-K dated March 16, 2013.* | |
| 10.22** | Form of Restricted Stock Agreement for the 2010 Equity Incentive Plan-incorporated by reference to Exhibit 10.1 of the Company's 10-Q for the quarter ended March 31, 2013.* | |
| 10.23** | Amendment No. 2 to Amended and Restated Employment Agreement, dated April 12, 2013, with Gregory J. Melsen. | |
| 10.24 | Share Purchase Agreement by and among Research and Diagnostic Systems, Inc., Bionostics Holdings Limited, Bionostics, Inc., the shareholders of Bionostics Holdings Limited, and Harwood Capital, LLP as Sellers' Representative, dated June 17, 2013-incorporated by reference to Exhibit 2.1 of the Company's 8-K dated June 17, 2013.* | |
| 10.25** | Description of Non-employee Director Compensation Plan. | |
| 10.26** | Employment Agreement by and between the Company and Kevin Reagan, dated January 24, 2012. | |
| 10.27** | Employment Agreement by and between the Company and Dr. J. Fernando Bazan, dated August 1, 2013. | |
| 10.28** | Compensation Arrangement for the Executive Officers for Fiscal Year 2014. | |
51
Exhibit Number | Description | |||
| 21 | Subsidiaries of the Company: | |||
Name | State/Country of Incorporation | |||
| Research and Diagnostic Systems, Inc. (R&D Systems) | Minnesota | |||
| BiosPacific, Inc. | Minnesota | |||
| Boston Biochem, Inc. | Minnesota | |||
| Tocris Cookson, Inc. (inactive) | Delaware | |||
| Tocris Holdings Limited (inactive) | United Kingdom | |||
| Tocris Investments Limited (inactive) | United Kingdom | |||
| Tocris Cookson Limited | United Kingdom | |||
| R&D Systems Europe Ltd. | United Kingdom | |||
| R&D Systems GmbH | Germany | |||
| R&D Systems China Co., Ltd. | China | |||
| R&D Systems Hong Kong Ltd. | Hong Kong | |||
| Bionostics Holdings Limited | United Kingdom | |||
| Bionostics Investments Limited | United Kingdom | |||
| Bionostics, Inc. | Massachusetts | |||
| 23 | Consent of KPMG LLP, Independent Registered Public Accounting Firm. | |||
| 31.1 | Certification of Chief Executive Officer pursuant to Section 302 of the Sarbanes-Oxley Act of 2002. | |||
| 31.2 | Certification of Chief Financial Officer pursuant to Section 302 of the Sarbanes-Oxley Act of 2002. | |||
| 32.1 | Certification of Chief Executive Officer pursuant to Section 906 of the Sarbanes-Oxley Act of 2002. | |||
| 32.2 | Certification of Chief Financial Officer pursuant to Section 906 of the Sarbanes-Oxley Act of 2002. | |||
| 99.1 | Consolidated Financial Statements of Tocris Holdings Limited-incorporated by reference to Exhibit 99.1 of the Company's Amended 8-K/A dated April 28, 2011.* | |||
| 99.2 | Pro forma financial information related to Techne's acquisition of Tocris Holdings Limited-incorporated by reference to Exhibit 99.2 of the Company's Amended 8-K/A dated April 28, 2011.* | |||
| 101 | The following financial statements from the Company's Annual Report on Form 10-K for the fiscal year ended June 30, 2013, formatted in Extensible Business Reporting Language (XBRL): (i) the Consolidated Statements of Earnings and Comprehensive Income, (ii) the Consolidated Balance Sheets, (iii) the Consolidated Statements of Shareholders' Equity, (iv) the Consolidated Statements of Cash Flows, and (v) Notes to the Consolidated Financial Statements. | |||
| * | Incorporated by reference; SEC File No. 000-17272 |
| ** | Management contract or compensatory plan or arrangement |
52