Table of Contents
UNITED STATES
SECURITIES AND EXCHANGE COMMISSION
Washington, D.C. 20549
FORM 10-K
ý | | ANNUAL REPORT PURSUANT TO SECTION 13 OR 15(d) OF THE SECURITIES EXCHANGE ACT OF 1934 |
|
|
|
For the fiscal year ended April 30, 2013 | ||
|
|
|
o | | TRANSITION REPORT PURSUANT TO SECTION 13 OR 15(d) OF THE SECURITIES EXCHANGE ACT OF 1934 |
|
|
|
For the transition period from to | ||
Commission File Number: 001-35588
JTH Holding, Inc.
(Exact name of registrant as specified in its charter)
| Delaware (State or other jurisdiction of incorporation or organization) | | 27-3561876 (I.R.S. Employer Identification No.) |
|
| 1716 Corporate Landing Parkway, Virginia Beach, Virginia (Address of principal executive offices) | | 23454 (Zip Code) |
|
Registrant's telephone number, including area code: (757) 493-8855
Securities registered pursuant to Section 12(b) of the Act:
| Class A Common Stock, $0.01 par value per share (Title of Class) | | The NASDAQ Stock Market LLC (Name of Exchange on which registered) |
|
Securities to be registered pursuant to Section 12(g) of the Act:
None
(Title of class)
Indicate by check mark if the registrant is a well-known seasoned issuer, as defined in Rule 405 of the Securities Act. YES o NO ý
Indicate by check mark if the registrant is not required to file reports pursuant to Section 13 or Section 15 (d) of the Act. YES o NO ý
Indicate by check mark whether the registrant (1) has filed all reports required to be filed by Section 13 or 15(d) of the Securities Exchange Act of 1934 during the preceding 12 months (or for such shorter period that the registrant was required to file such reports), and (2) has been subject to such filing requirements for the past 90 days. YES o NO ý
Indicate by check mark whether the registrant has submitted electronically and posted on its corporate Web site, if any, every Interactive Data File required to be submitted and posted pursuant to Rule 405 of Regulation S-T during the preceding 12 months (or for such shorter period that the registrant was required to submit and post such files). YES o NO ý
Indicate by check mark if disclosure of delinquent filers pursuant to Item 405 of Regulation S-K is not contained herein, and will not be contained, to the best of registrant's knowledge, in definitive proxy or information statements incorporated by reference in Part III of this Form 10-K or any amendment to this Form 10-K. o
Indicate by check mark whether the registrant is a large accelerated filer, an accelerated filer, a non-accelerated filer or a smaller reporting company. See the definitions of "large accelerated filer", "accelerated filer" and "smaller reporting company" in Rule 12b-2 of the Exchange Act.
Large accelerated filer o |
| Accelerated filer o |
| Non-accelerated filer o (Do not check if a smaller reporting company) |
| Smaller reporting company ý |
Indicate by check mark whether the registrant is a shell company (as defined in Rule 12b-2 of the Exchange Act). YES o NO ý
As of October 31, 2012, the aggregate market value of the shares of Class A common stock held by non-affiliates of the registrant was $53,212,141 based on the number of shares held by non-affiliates as of October 31, 2012 and based on the last reported sale price of the registrant's Class A common stock on the NASDAQ Global Market of $14.90 on October 31, 2012. The number of shares of the registrant's Class A common stock outstanding as of September 26, 2013 was 12,023,265.
Documents incorporated by reference: None.
Table of Contents
Table of Contents
Part I |
|
|
Item 1. | Business | 8 |
Item 1A. | Risk Factors | 22 |
Item 1B. | Unresolved Staff Comments | 37 |
Item 2. | Properties | 37 |
Item 3. | Legal Proceedings | 38 |
Item 4. | Mine Safety Disclosure s | 38 |
Part II |
|
|
Item 5. | Market for Registrant's Common Equity, Related Stockholder Matters and Issuer Purchases of Equity Securities | 39 |
Item 6. | Selected Financial Data | 40 |
Item 7. | Management's Discussion and Analysis of Financial Condition and Results of Operations | 44 |
Item 7A. | Quantitative and Qualitative Disclosures About Market Risk | 62 |
Item 8. | Financial Statements and Supplementary Data | 62 |
| Report of Independent Registered Public Accounting Firm | F-1 |
| Consolidated Balance Sheets | F-2 |
| Consolidated Income Statements | F-3 |
| Consolidated Statements of Comprehensive Income | F-4 |
| Consolidated Statements of Stockholders' Equity | F-5 |
| Consolidated Statement of Cash Flows | F-8 |
| Notes to Consolidated Financial Statements | F-10 |
Item 9. | Changes in and Disagreements with Accountants on Accounting and Financial Disclosure | 62 |
Item 9A. | Controls and Procedures | 62 |
Item 9B. | Other Information | 64 |
Part III |
|
|
Item 10. | Directors, Executive Officers and Corporate Governance | 65 |
Item 11. | Executive Compensation | 69 |
Item 12. | Security Ownership of Certain Beneficial Owners and Management and Related Stockholder Matters | 81 |
Item 13. | Certain Relationships and Related Transactions, and Director Independence | 82 |
Item 14. | Principal Accounting Fees and Services | 83 |
Part IV |
|
|
Item 15. | Exhibits, Financial Statement Schedules | 85 |
Signatures | 88 | |
3
Table of Contents
EXPLANATORY NOTE REGARDING RESTATEMENT
As previously reported, on August 1, 2013, we determined that our previously issued consolidated financial statements contained in our Annual Report on Form 10-K for the year ended April 30, 2012, and in our quarterly reports on Form 10-Q for the subsequent fiscal quarters ended July 31, 2012, October 31, 2012 and January 31, 2013, should no longer be relied upon and would be restated to reflect certain changes to our accounting policies, primarily with respect to revenue recognition and business combination accounting. These restatements of our previously issued consolidated financial statements are referred to collectively as the "Restatement," and the periods affected by the Restatement are referred to collectively as the "Restated Periods."
In this annual report, the following types of financial information and other disclosures are restated or amended, as applicable, as a result of the Restatement, as of and for the Restated Periods noted in the table below.
Type of Financial Information/Disclosure | Date or Period |
Consolidated balance sheet | As of April 30, 2012 |
Consolidated statements of income, stockholders' equity, comprehensive income and cash flows | Fiscal years ended April 30, 2012 and 2011 |
Selected financial data | Fiscal years ended and as of April 30, 2012, 2011, 2010 and 2009 |
Unaudited quarterly financial information | Each fiscal quarter in the fiscal years ended April 30, 2013 and 2012 |
Management's Discussion and Analysis of Financial Condition and Results of Operations | As of and for the years ended April 30, 2012 and 2011 |
We believe that presenting all of the financial information and other disclosures affected by the Restatement for the Restated Periods in this annual report allows investors to review all pertinent data in a single presentation. We intend to file, subsequent to the filing of this annual report, our quarterly report on Form 10-Q for the quarterly period ended July 31, 2013 and amendments to our quarterly reports on Form 10-Q for each of the quarterly periods ended July 31, 2012, October 31, 2012 and January 31, 2013, but we do not expect to file an amendment to our annual report on Form 10-K for the year ended April 30, 2012 (the "2012 Annual Report"). Accordingly, investors should rely only on the financial information and other disclosures for the Restated Periods included in this annual report, and should not rely on the 2012 Annual Report or any reports, earnings releases or similar communications relating to the Restated Periods.
As presented in more detail throughout this annual report, the Restatement reflects adjustments primarily related to the following areas:
• | We determined that our area developer, or "AD", agreements do not constitute a franchise relationship for accounting purposes. Therefore, instead of recording revenue at the inception of the AD relationship under franchise accounting, we now record these fees over the life of the AD agreement, which is typically ten years. Additionally, our consolidated financial statements now show the portion of franchise fees and royalties that the AD is entitled to receive from us in our revenue captions, with an equal amount of expense shown in a new operating expense caption as "area developer expense." These amounts were previously presented on a net basis. |
• | We changed our revenue recognition policy for franchise fees to record revenue as amounts are received from the franchisee. Previously, we generally recorded these revenues at the time of sale, net of expected note cancellations related to the amount financed. Therefore, under the new revenue recognition policy any portion of franchise fees that is financed is only reflected as revenue when the note payments are made. |
• | We also revised our methodology for the allocation of the purchase price associated with the acquisitions of businesses from franchisees. Historically, we allocated the entire purchase price to an identifiable intangible asset denominated as customer list. The new methodology allocates the purchase price to all identifiable intangible assets, which consist of reacquired rights and customer list. Any unallocated purchase price is recorded as goodwill. |
4
Table of Contents
The following table quantifies in summary format the effect of these restated items on our income before income taxes for the fiscal years ended April 30 of each year:
|
| 2009 |
| 2010 |
| 2011 |
| 2012 |
| 2013 | ||||||||||
|
| (dollars in thousands) | ||||||||||||||||||
As Reported | $ | 20,816 | |
| $ | 17,884 | |
| $ | 26,636 | |
| $ | 27,805 | |
| $ | 29,792 | | |
Adjustments related to the following areas: |
|
|
|
|
|
|
|
|
| |||||||||||
| Area developer agreements | 2,249 | |
| 5,917 | |
| 762 | |
| (1,935 | ) |
| (951 | ) | |||||
| Franchise fees | (541 | ) |
| (894 | ) |
| (2,330 | ) |
| (668 | ) |
| (26 | ) | |||||
| Business combinations | 60 | |
| 139 | |
| (256 | ) |
| 928 | |
| (18 | ) | |||||
As Restated | $ | 22,584 | |
| $ | 23,046 | |
| $ | 24,812 | |
| $ | 26,130 | |
| $ | 28,797 | | |
The following items are not affected by the Restatement:
• | The Restatement does not impact actual cash received or the reported cash balances for any of the Restated Periods. |
• | The Restatement does not impact the receipt of the total reported revenue, but instead changes the time periods over which the revenue was recognized. |
The Restatement and related matters are more fully described in Notes 18 and 19 to our Consolidated Financial Statements included in this Annual Report, as well as under the following items of this Annual Report: "Item 1A-Risk Factors," "Item 6-Selected Financial Data," "Item 7-Management's Discussion and Analysis of Financial Condition and Results of Operations" and "Item 9A-Controls and Procedures."
5
Table of Contents
SPECIAL NOTE REGARDING FORWARD-LOOKING STATEMENTS
This annual report contains forward-looking statements concerning our business, operations and financial performance and condition as well as our plans, objectives and expectations for our business operations and financial performance and condition. Any statements contained herein that are not of historical facts may be deemed to be forward-looking statements. You can identify these statements by words such as "aim," "anticipate," "assume," "believe," "could," "due," "estimate," "expect," "goal," "intend," "may," "objective," "plan," "predict," "potential," "positioned," "should," "target," "will," "would" and other similar expressions that are predictions of or indicate future events and future trends. These forward-looking statements are based on current expectations, estimates, forecasts and projections about our business and the industry in which we operate and our management's beliefs and assumptions and are not guarantees of future performance or development and involve known and unknown risks, uncertainties and other factors that are in some cases beyond our control. As a result, any or all of our forward-looking statements in this annual report may turn out to be inaccurate. Factors that may cause such differences include, but are not limited to, the risks described under "Item 1A-Risk Factors," including:
• | our possible inability to sustain growth at our historical pace; |
• | the seasonality of our business; |
• | our inability to secure reliable sources of the tax settlement products we make available to our customers; |
• | the continued service of our senior management team; |
• | government regulation and oversight, including the regulation of tax settlement products such as electronic refund checks ("ERCs") and loan settlement products; |
• | government initiatives that simplify tax return preparation, improve the timing and efficiency of processing tax returns, limit payments to tax preparers or decrease the number of tax returns filed or the size of the refunds; |
• | government initiatives to pre-populate income tax returns; |
• | increased regulation of the products and services that we offer; |
• | the possible characterization of ERCs as a form of loan or extension of credit; |
• | changes in the tax settlement products offered to our customers that make our services less attractive to customers or more costly to us; |
• | our ability to maintain relationships with our tax settlement product service providers; |
• | our ability and the ability of our franchisees to comply with regulatory requirements; |
• | changes in our franchise sale model that may reduce our revenue; |
• | the ability of our franchisees to open new territories and operate them successfully; |
• | the ability of our franchisees to generate sufficient revenue to repay their indebtedness to us; |
• | our exposure to litigation; |
• | our ability and our franchisees' ability to protect customers' personal information, including from a cyber-security incident; |
• | our ability to access the credit markets and satisfy our covenants to lenders; |
• | challenges in deploying accurate tax software in a timely way each tax season; |
• | competition in the tax preparation market; |
• | our reliance on technology systems, including the deployment of our NextGen project, and electronic communications; |
• | our ability to deploy our NextGen software in time for the 2014 tax season; |
• | potential shareholder litigation as a result of the restatement of our previously issued consolidated financial statements; |
6
Table of Contents
• | risks relating to our management's determination that there was a material weakness in our internal control over financial reporting, and as a result that our disclosure controls and procedures were not effective, as of April 30, 2013; and |
• | other factors, including the risk factors discussed in this annual report. |
Potential investors and other readers are urged to consider these factors carefully in evaluating the forward-looking statements and are cautioned not to place undue reliance on the forward-looking statements. These forward-looking statements speak only as of the date of this annual report. Unless required by law, we do not intend to publicly update or revise any forward-looking statements to reflect new information or future events or otherwise. A potential investor or other vendor should, however, review the factors and risks we describe in the reports we will file from time to time with the U.S. Securities and Exchange Commission, or "SEC", after the date of this annual report.
7
Table of Contents
PART I
Item 1. Business.
Corporate Information
We were originally incorporated in Delaware in September 2010 as JTH Holding, Inc. We are the holding company for JTH Tax, Inc. d/b/a Liberty Tax Service, which was incorporated in Delaware in October 1996. Our principal executive offices are located at 1716 Corporate Landing Parkway, Virginia Beach, Virginia 23454. Our filings with the U.S. Securities and Exchange Commission or "SEC", including annual reports on Form 10-K, quarterly reports on Form 10-Q, current reports on Form 8-K, proxy statements and amendments to these reports, are accessible free of charge at our corporate website, www.libertytax.com.
We are an "emerging growth company" under applicable federal securities laws and are subject to reduced public company reporting requirements.
Definitions and Trademarks
References in this report to "years" are to our fiscal years, which end on April 30 unless otherwise noted, and all references to "tax season" refer to the period between January 1 and April 30 of the referenced year. Unless the context requires otherwise, the terms "Liberty Tax," "Liberty Tax Service," "we," "the Company," "us" and "our" refer to JTH Holding, Inc. and its consolidated subsidiaries.
This annual report includes trademarks, including "Liberty Tax," "Liberty Tax Service," "Liberty Income Tax," "Liberty Canada" and our logo, which are protected under applicable intellectual property laws and are our property and/or the property of our subsidiaries. This annual report also includes trademarks, trade names and service marks that are the property of other organizations.
Market, Industry and Other Data
Unless otherwise indicated, information contained in this annual report concerning our industry and the market in which we operate, including our general expectations and market position, market opportunity and market size, is based on information from various third-party sources, on assumptions that we have made that are based on that data and other similar sources. Some data is also based on our good faith estimates, which are derived from management's knowledge of the industry and independent sources. This data involves a number of assumptions and limitations, and a reader is cautioned not to give undue weight to such estimates. Similarly, we believe our internal research is reliable, even though such research has not been verified by any independent sources. While we believe the market position, market opportunity and market size information included in this annual report is generally reliable, such information is inherently imprecise. In addition, information relating to projections, assumptions and estimates of our future performance and the future performance of the industry in which we operate is necessarily subject to a high degree of uncertainty and risk due to a variety of factors, including those described in "Item 1A-Risk Factors" and elsewhere in this annual report. These and other factors could cause our results to differ materially from those expressed in the estimates made by third parties and by us.
Business Overview
We are one of the leading providers of tax preparation services in the United States and Canada. As measured by both the number of returns prepared and the number of retail offices, we are the third largest and fastest growing national retail preparer of individual tax returns in the United States and the second largest retail preparer of individual tax returns in Canada. From 2001 through 2013 , we have grown the number of U.S. tax returns prepared in our offices from approximately 137,000 to 1.8 million . These services and related financial products that we refer to as "tax settlement" products are offered primarily through franchised locations, although we operate a very limited number of company-owned offices each tax season. All of the offices are operated under the Liberty Tax Service brand. Since the 2001 tax season and through the 2013 tax season, our percentage share of the paid tax preparation market in the United States has increased from 0.2% to more than 2% .
From 2001 through 2013 , we grew our number of tax offices from 508 to 4,520 . We and our franchisees operated 4,262 of those offices in the United States during the 2013 tax season, an 8.7% increase over the 2012 tax season, when we operated 3,920 offices, which was itself a 9.2% increase over the number of offices operated in the 2011 tax season.
The following table indicates the number of offices open at any point during the tax season and the number of total tax returns filed through these offices during the fiscal year ended April 30 of each year.
8
Table of Contents
|
| 2009 |
| 2010 |
| 2011 |
| 2012 |
| 2013 | |||||
Offices - Total |
| 3,091 | |
| 3,531 | |
| 3,845 | |
| 4,183 | |
| 4,520 | |
Tax returns prepared in our offices |
| 1,632,000 | |
| 1,795,000 | |
| 1,946,000 | |
| 2,075,000 | |
| 2,116,000 | |
We provide our customers with value-added federal and state tax preparation services and related tax settlement products both in retail offices and online. Our target customers include taxpayers who for reasons of complexity, convenience or the need for prompt tax refunds desire the assistance of assisted tax preparation services. Our customer growth is driven by our ability to capture an increasing share of a continuously expanding tax preparation market.
We believe that our franchise system is the core of our highly scalable business model and the keystone of our growth. Most of the Liberty Tax offices are operated by franchisees. Because we do not own or operate a significant number of tax offices, we are able to focus on marketing, franchisee coaching and support, financial product development and other initiatives that drive our overall success. In addition, our franchise model allows us to grow our tax system with minimal capital expenditures or fixed cost investments.
Our franchise model has been recognized as an attractive investment opportunity for a variety of entrepreneurs. In May 2011, Entrepreneur Media ranked us as the best tax franchise opportunity, as well as the seventh fastest growing franchise system, based on the number of new franchise units added in the U.S. and Canada from 2009 to 2010. In February 2012, Forbes ranked us the seventh best franchise in their "Top 20 Franchises for the Buck" list, based on the estimated minimum initial investment, store survival rate, training hours offered and the total number of franchise locations. Accounting Today again honored Liberty Tax Service as a "Top Tax Firm" for 2013. We have focused on keeping the cost of establishing a Liberty Tax franchise relatively low compared to other opportunities available to potential franchisees in order to attract motivated entrepreneurs seeking to minimize their initial costs. We believe this low upfront capital requirement, combined with the potential for attractive office level profitability, provides an opportunity for a significant return on investment for our franchisees. We focus on providing best-in-class training and support to both new and existing franchisees.
Our growth is also reflected in our financial performance. Our total revenues grew to $147.6 million in 2013 from $131.2 million in 2012 and $117.9 million in 2011 , and our net income increased to $17.6 million from $16.4 million in 2012 and $14.7 million in 2011 . Our systemwide revenue, which is the base from which we derive franchise royalties, grew to $381.2 million in 2013 , from $359.1 million in 2012 and $338.6 million in 2011 . Our systemwide revenue represents the total tax preparation revenue generated by our franchised and company-owned offices.
Our Industry and Market Opportunity
We believe that Liberty Tax Service is well positioned to increase our share of the paid tax preparation market because of our strong brand, the strength of our franchise model, and our ability to take advantage of industry consolidation.
During calendar year 2013, there were estimated to have been 147.4 million tax returns filed with the Internal Revenue Service ("IRS"), of which 132.6 million tax returns were filed during the 2013 tax season. The IRS expects the number of tax returns to continue to grow, and projects a 4.5% increase in tax return filings from 2013 to 2016, as illustrated below.
9
Table of Contents
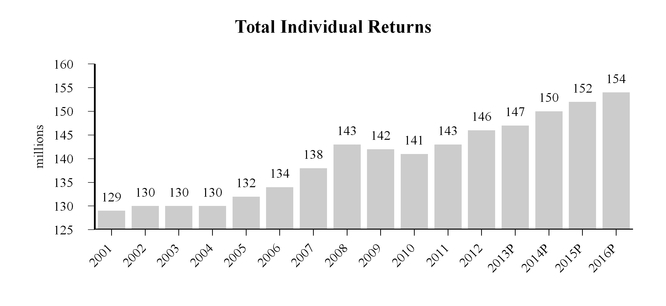
______________________________________________________________________________
Source: IRS Publication 6187 (revised 6-2013). The "P" designation for calendar years 2013 and later reflects IRS projections.
The tax return preparation market is divided into two primary distinct sectors: paid tax preparation and Do It Yourself ("DIY") preparation, which includes traditional "pen and paper" preparation as well as DIY preparation through online and software-based tax products. Although recent years have seen growth in the relative portion of the DIY sector that has been captured by online and software-based tax products, the separate paid tax preparation sector, in which we and our franchisees primarily compete, has also continued to grow. From the 2001 tax season through the 2013 tax season, the percentage of returns prepared in the DIY sector has varied from 37% to 42%, with 40% of returns in the 2013 tax season prepared in the DIY sector.
The percentage of returns filed through paid tax preparers has remained relatively stable over the past decade, with material year-to-year variations generally in years where government tax rebate programs cause a spike in filings by taxpayers who might otherwise not have filed, or where recessionary conditions, as in 2009, temporarily depress filings. The growth in the number of individual returns reflects a consistent trend over many years, and the historical data and projected IRS information indicates that both the number of individual returns prepared and those prepared by paid tax preparers have increased and we believe it will continue to increase at a relatively constant rate over the next several years. Since the 2001 tax season and through the 2013 tax season, our percentage share of the paid tax preparation market in the United States has increased from 0.2% to more than 2.0%, based on IRS data.
We believe, based on available data, that in 2013 less than 25% of the paid tax preparation market was represented by the national retail tax preparation companies: Liberty Tax and our two national competitors, H&R Block and Jackson Hewitt, each operating under a different business model. While most of our offices are operated by franchisees, H&R Block primarily operates company-owned offices and Jackson Hewitt operates a mixture of franchised and company-owned offices. The remaining paid tax preparation market is primarily comprised of tens of thousands of independent tax preparers operating at a local and regional level. We believe most of these independent preparers operate individual or a limited number of locations.
Our Business Strengths
We attribute our success in the retail tax preparation industry to a number of strengths:
We are a market leader in providing retail tax preparation services. We are presently the third largest provider of retail tax preparation services in the United States and the second largest provider of retail tax preparation services in Canada as measured by number of tax returns prepared and the number of retail offices. We currently have a network of 2,211 franchisees and had more than 4,500 offices for the 2013 tax season, the majority of which had been opened within the past five years, and many of which are in the initial stages of growth. We believe that there is no existing smaller competitor in the retail tax preparation market that could challenge our market position on a national scale due to the expense and length of time required to develop the infrastructure, systems and software necessary to create and support a nationwide network of tax preparation offices. As a result, we believe that it would be difficult for an additional national competitor to emerge in our market for the foreseeable future. Moreover, our brand identity and substantial growth have helped us cement strong repeat business in our
10
Table of Contents
offices. Our brand is reinforced by our Liberty logo and our unique advertising techniques, which include personalized and highly visible marketing strategies. We believe our model creates a powerful platform that allows our franchisees to continue to grow their scale and profitability as they become more seasoned.
A highly scalable and attractive franchise business model. Our franchise model enables us to rapidly expand while keeping capital expenditures and fixed cost investments low. Most of our offices are operated by franchisees, which allows us to focus on marketing, training and expanding our value-added services, while our franchisees focus on locating and opening new office locations and increasing the number of customers at existing locations. We believe that our time-tested and proven franchise strategy, when combined with the economics of our low-cost franchise model, enables us to grow our brand by attracting highly motivated entrepreneurs. Our standard franchise fee per territory is $40,000, which is typically lower than other franchise opportunities, and we offer our franchisees flexible structures and financing options for franchise fees and royalty payments. We believe we offer a stable franchise opportunity and have designed our franchise model to closely align our interests with those of our franchisees in an effort to promote their profitability and return on investment. Our status as a market leader is demonstrated by the fact that we continue to be highly ranked in independent national publications that rank the attractiveness of franchise opportunities and franchisee satisfaction.
Our franchisee and consumer-oriented strategy drives our success and enhances our relationships with our franchisee base. We believe that we must deliver value to both our franchisees and their customers to further drive our success. We encourage a collaborative and open culture among our franchise base and are proactive in providing ongoing training opportunities to both new and established franchisees. We actively manage our franchise base by enforcing franchisee performance standards in order to optimize systemwide revenue and the royalties we receive from our franchisees. Because of the room for growth in our franchise system, we provide our high-quality franchisees the opportunity to increase the number of offices they own and operate. Our franchise model appeals to a select group of highly motivated individuals who are attracted to a platform that requires them to be intensely focused during the relatively short tax season but also enables them to pursue other business and personal endeavors throughout the rest of the year. Because the personal success of our franchisees is directly tied to the success of their individual offices, we believe our franchisees are more focused than the operators of our primary competitors' non-franchised offices on both providing a positive customer service experience and delivering value to their customers.
The paid tax preparation business is inherently a neighborhood business, and we support our franchisees in utilizing our model in a way that allows them to maximize the success of their offices. Franchisees interact directly with existing and potential customers, which drives high customer loyalty within their market areas. In addition, we recognize that some of our customers value the wide range of tax settlement products we enable our franchisees to provide. We have consistently endeavored to provide our franchisees access to a full range of competitive products and services, including ERCs, prepaid debit cards loaded with their tax refund amounts, refund-based loans such as "Instant Cash Advances" or "ICAs," along with other electronic filing products and services. We utilize this mix of franchisee support and services to mitigate the challenges of a franchise business model, which include our lack of direct control over day-to-day operations in the tax offices and our reliance on franchisee growth and expansion to grow our business.
The evolving legal and regulatory climate surrounding some of the tax settlement products that we have made available to our franchisees and their customers has required us to adapt quickly to new limitations that made it more difficult to offer customers the same financial product choices as were available in prior tax seasons. We have adapted to these challenges by developing or obtaining alternatives for customers and by ensuring that we are a market leader in this area, and although the law and regulations may continue to change, we expect to be able to continue to give our franchisees and their customers a range of product choices that will be at least as broad as that offered by our competitors.
Our experienced management team has a proven track record. Our senior management team has significant experience in the tax preparation industry. Our founder, Chairman and CEO, John Hewitt, is a pioneer in the tax preparation industry. Prior to Liberty Tax, Mr. Hewitt began his career with H&R Block and was the founder of Jackson Hewitt. Likewise, our Chief Operating Officer, Rufe Vanderpool, has been with Liberty since 2004, and has been in the tax preparation industry since 1998, and our Chief Financial Officer, Mark Baumgartner, has been with us since 2003. Many of our other key personnel also have a long history of working in the tax preparation industry.
Our Growth Strategy
We believe we are uniquely positioned within the retail tax preparation industry to seize the available growth opportunities. Our strategy for growth includes:
We plan to grow our number of franchised office locations within the U.S. We plan to aggressively expand our number of office locations. We believe there is substantial untapped potential for us to add approximately 6,200 additional offices, after which we would be comparable to the size of our largest national competitor, H&R Block. We believe we can
11
Table of Contents
increase the average number of tax offices operated by our franchisees by continuing to offer programs and support designed to encourage franchisees to expand their business. For example, we intend to place new and existing franchisees in remaining undeveloped geographic territories. In 2008, we began to offer existing franchisees the ability to operate in additional territories for one tax season before electing to acquire those territories. We believe we can achieve this growth because we have a significant number of undeveloped territories. We also offer several innovative programs for new and existing franchisees, including a "zero franchise fee" alternative that allows franchisees to minimize their initial investment in exchange for paying higher royalties during the first five years of the franchise term. In addition, in 2012 we entered into an agreement with Walmart that allowed Liberty Tax kiosks to operate in a number of Walmart stores beginning with the 2013 tax season, when we and our franchisees operated kiosks in nearly 300 stores. We anticipate the expansion of that relationship in the 2014 tax season.
We plan to grow our number of returns. Many of our offices are relatively new, and as they continue to become more seasoned, we believe we will be able to add new customers who we expect will become repeat customers. Approximately 38% of our retail offices open during the 2013 tax season were in the first three years of operation, providing substantial room to add additional customers. Our new retail offices typically experience their most rapid growth during their first five years as they develop customer loyalty, operational experience and a referral base within their community. In addition, we believe that our unique marketing programs, customer oriented services, easy to use tax preparation software, and national presence will continue to drive the number of tax returns prepared in our franchised offices.
We are poised to take advantage of anticipated industry consolidation and strategic opportunities to increase our number of offices and returns. We expect to benefit from anticipated industry consolidation as we believe many independent tax preparers will look to exit the industry as they confront increased costs, regulatory requirements and demands to provide tax settlement products. We believe we will be a beneficiary of this consolidation because we are able to more efficiently address changing regulatory requirements due to our scale and also because we have succeeded in providing a fully competitive mix of the kinds of financial products sought by customers. In addition, our reputation in the market should continue to drive new customers to our brand, which will also enhance our position in a consolidating industry. As a result, we believe we will continue to accrete market share by virtue of our attractive platform for preparers and for new franchisees looking to capture customers from exiting independent preparers. We may also consider larger strategic transactions if those opportunities arise.
We may strategically acquire Area Developer ("AD") areas. We operate under a two-tier franchise system, which includes franchisees operating retail offices in "territories" that encompass a target population of approximately 30,000 people and ADs that operate in areas that include large clusters of territories. We use ADs to help us build out our retail franchise base by marketing available franchise territories. We initiated our AD program in 2001, at a time when we were seeking to accelerate the growth of our franchise system. We continued utilizing the AD program in recent years to focus on areas with large underdeveloped groups of territories we believed would benefit from the dedicated sales attention that an AD would bring to our franchise sales process. We presently have 132 ADs, and as of April 30, 2013 , those ADs had 4,000 unsold franchise territories located within their areas. Our arrangements with our ADs require us to pay a substantial portion of the franchise fees and royalties we receive to our ADs. Although we still expect to grow our franchise network through the limited sale of new AD areas, we will continue to seek opportunities to acquire underperforming AD areas or AD areas in more mature markets at favorable terms, offering us better future profitability from the associated franchise locations as a consequence of repurchasing the area rights of those ADs.
We will leverage our financial products leadership to attract and retain customers and to market our competitive advantage to prospective franchisees. We have expended considerable effort since 2009 to ensure that our franchisees are able to offer a complete range of tax settlement products to our customers, and to provide our customers choices in these products. With Republic's departure from refund anticipation loan ("RAL") lending after the 2012 tax season, there are no remaining banks making or facilitating loan-based tax settlement products, and in anticipation of that situation, we began to pilot an ICA refund loan product originated by a third-party lender in a limited number of states in the 2011 and 2012 tax seasons. These ICAs were offered in 27 states in the 2013 tax season, and we are exploring other alternatives to make refund-based loan tax settlement product choices available to consumers. We are also exploring product alternatives in the states where ICAs are not being offered. At the same time, we expect to continue to offer non-loan tax settlement products such as ERCs to customers in all of our offices. We believe that our innovation in offering alternatives to the traditional RAL will allow us to attract and retain customers by meeting customer demand for quicker access to funds. This competitive advantage over some of our competitors who are not offering similar ranges of products should also permit us to demonstrate to prospective new franchisees, as well as franchisees considering expansion, the potential advantages of the Liberty Tax brand.
Our Business
Our business involves the provision of retail federal and state income tax preparation services and related refund settlement products in the United States and Canada. Virtually all of our services are provided through franchised offices, and for the 2013 tax season, our services were offered in 4,520 retail offices, of which 4,262 were in the United States (with the
12
Table of Contents
remainder in Canada) and 4,028 of our retail offices in the United States, or more than 94%, were owned by franchisees. Unlike some of our primary national competitors, we have maintained a relatively simple business model. We have not attempted to diversify into banking or mortgage operations. By building on steady growth since our founding and using our available financing to fund operations between tax seasons, we have avoided excess leverage while ensuring minimal outstanding indebtedness at the end of each tax season. At April 30, 2013 and 2012 , for example, we had no outstanding balance under our revolving credit facility. Our focus since inception has been on growing the number of Liberty Tax offices, increasing the number of tax returns prepared by those offices, and enhancing profitability by offering services and products that continue to build the Liberty Tax brand.
In the 2013 tax season, we and our franchisees in the United States accounted for more than 1.8 million tax returns filed through our retail offices, and almost 160,000 additional tax returns filed through our online tax software, eSmartTax. Because some of our competitors have been unable to offer a full range of tax settlement products over the last three tax seasons, and because we believe we are positioned to maintain a competitive set of tax settlement products to offer, we believe there is a substantial opportunity to combine our retail office growth with an increase in the number of returns we and our franchisees produce on a per office basis.
A typical tax season consists of two primary filing periods: a "first peak" involving filers who file relatively quickly after receiving their Forms W-2, and late-season filers who file during the weeks leading to the usual April 15 federal tax filing deadline. In the 2013 tax season, 62% of returns filed in our retail offices were filed between January 1 and February 28, and an additional 18% were filed between April 1 and April 15. However, the "first peak" during the 2013 tax season was anomalous in that the IRS did not generally open its online filing system until January 30, 2013, almost two weeks later than in most prior years.
Liberty's Franchise Model
We rely on a franchise model for our growth. Although our larger primary competitors maintain a mix of franchise locations and company-owned offices, we have determined that we can best grow our company by increasing our franchisee base, and the number of offices operated by our existing franchisees. We have also included in our franchisee model the sale of AD areas, and under this AD model, we make large clusters of territories available to an AD who is responsible for marketing the available franchise territories within the larger AD area in order to help us fill gaps in our franchise system. As described below, when we utilize an AD to assist us in franchise sales, we receive revenue from the sale of the AD area, but sacrifice a portion of the franchise fees and the royalty stream from the franchises within the AD area.
Franchise territories. We have divided the United States into approximately 10,000 potential franchise territories We attempt to draw territory boundaries so that each territory has a target population of approximately 30,000 people. Franchisees are permitted to open more than one office in a territory, and within the territory they may also be the beneficiary of the opportunity to open offices located in a retail operation in which we have the opportunity to place a tax preparation kiosk. We presently have kiosk arrangements with certain Walmart, Kmart, Sears, Family Dollar and Ace Cash Express stores, and had 468 such kiosks open during the 2013 tax season, an increase from the 121 such kiosks opened during 2012 tax season, which was attributable almost entirely to our Walmart relationship.
As of April 30, 2013 , our largest franchisee operated 27 tax locations, and a majority of our franchisees operated two or fewer tax locations. As part of our growth strategy, we anticipate increasing substantially the average number of offices per franchisee by encouraging more of our franchisees to acquire and open additional franchise territories. We anticipate that a significant number of our franchisees may elect to remain single-office owners, but that others will be attracted to the opportunity to grow their revenue base and overall profitability by enjoying the economies of scale associated with multi-unit operations. Because we continue to have measurably fewer offices than our two largest competitors, we believe that we have a significant number of additional territories available that will allow us to implement this business model, and we are devoting a substantial amount of our sales efforts to providing opportunities to existing franchisees to acquire additional territories.
AD areas. We initiated our AD program in 2001, at a time when we were seeking to accelerate the growth of our franchise system. We presently have 132 ADs, and as of April 30, 2013 , those ADs had approximately 4,000 unsold franchise territories located within their areas. We continued utilizing the AD program in recent years to focus on areas with large underdeveloped groups of territories we believed would benefit from the dedicated sales attention that an AD would bring to our sales process. Our franchise fees for AD areas vary based on our assessment of the revenue potential of each AD area, and also depend on the performance of any existing franchisees within the AD area being sold. Our ADs generally receive 50% of both the franchise fee and royalties derived from franchises located in their AD areas and are required to provide marketing and operational support.
We strategically repurchase AD areas from existing ADs. In fiscal 2013 , we spent $5.9 million to repurchase 13 AD areas. Because AD franchise agreements generally require us to pay 50% of both the franchise fees and royalty revenue derived
13
Table of Contents
from franchises located in their AD areas to our ADs, we expect that the repurchase of those AD areas will lower our AD expense in future periods. In fiscal 2013 , our ADs in the aggregate earned $3.2 million in franchise fee revenue and $21.5 million in franchise royalties.
When we engage in repurchases of AD areas, we generally value the area by using a discounted cash flow calculation, and we purchase the area on a basis that reflects our expected return from recapturing the post-purchase royalty stream that would otherwise have been paid to the AD. By repurchasing areas at a price that provides liquidity to an AD, we are able to pay off indebtedness of that AD to us, where applicable, and secure the full benefit of franchisee royalty streams for periods after the completion of the repurchase.
Franchise sales process. We engage in an active marketing process, both directly and through our ADs, in order to sell additional franchise territories. Our sales process includes sales to new franchisees, as well as the sale of additional territories to existing franchisees willing to expand into additional territories. For new franchisees, the process includes multiple steps that culminate in a week-long training session that we call Effective Operations Training. We generally require a new franchisee to pay the entire franchise fee for the franchisee's first territory at the time of acquisition, although as described below, we often provide funding for additional territory purchases by both new and existing franchisees. In 2011, we announced a new franchise sales program pursuant to which new and existing franchisees could obtain selected unsold territories without the payment of a franchise fee. Territories acquired under this "zero franchise fee" program, as described below, require higher royalty fees during the first five years of the franchise agreement, but involve less initial financial risk to a potential franchisee. We also utilize advertising in national publications, appearances at conventions and trade shows at which we believe potential franchisees may be present, and various direct marketing techniques, in order to obtain and pursue franchisee leads.
During fiscal 2008, we began to offer two new franchise purchase programs, a "rent to own" program and a "try before you buy" program, both of which were designed to allow existing franchisees to acquire additional territories with minimal risk. In both of these programs, which are designed for the purchase of unsold territories, we allow an existing franchisee that is willing to pursue expansion to operate a territory without an obligation to pay a franchisee fee during the first tax season. If the franchisee operates the territory and elects to retain ownership of the territory, the territory becomes subject to a standard franchise agreement and the payment of the standard franchise fee.
Because of the uncertainty surrounding the availability of tax settlement products, the difficulty that many independent and smaller tax preparers are having accessing sources of these products, and an increasingly cumbersome regulatory climate, we believe that there is an opportunity to convert independent tax preparers, including smaller multi-unit operations, to Liberty Tax franchisees. We are expending significant marketing effort to encourage these conversions, and because these operations involve existing tax operations, generally offer more favorable terms to these prospective franchisees than we make available for undeveloped territories.
Our franchise agreements. Under the terms of our standard franchise agreement, each franchisee receives the right to operate a tax return preparation business under the Liberty Tax Service brand within a designated geographic area. Similarly, our agreements with ADs permit ADs to market franchise territories within a designated multi-territory area. Franchise agreements have an initial term of five years and are renewable. The agreements impose various performance requirements on franchisees, require franchisees to use our proprietary software and equipment designated by us, and obligate our franchisees to operate in their offices in accordance with standards we establish. These standards include specified in-season and out-of-season opening hours, criteria for the location of franchise offices, requirements related to tax preparers and other office employees, and minimum performance standards. Our agreements also require our franchisees to comply with applicable state and federal legal requirements. Although we do not control and are not responsible for any compliance issues that could be caused by our franchisees or their tax preparers, we provide guidance to our franchisees regarding their compliance obligations, including the provision of standard advertising templates, training materials that include detailed compliance information, and systems that alert them to unusual activity. We also use a variety of means to identify potential compliance issues and to require franchisees to address any concerns.
Each year, as part of our active management of our franchise base, we terminate a number of franchisees, and other franchisees voluntarily relinquish their territories, often in exchange for our forbearance on the remaining indebtedness owed to us in connection with the franchise territory. In fiscal 2013 and fiscal 2012 , respectively, approximately 409 and 341 retail tax locations that had been open were subject to voluntary and involuntary franchise terminations. As described below, we generally intend to resell these territories to new or existing franchisees. However, we closed some office locations, and maintained a limited number of office locations that we were not able to resell before the subsequent tax season as company-owned offices. In order to protect our competitive position, we regularly take actions to enforce the non-competition obligations and restrictions regarding customer lists and our trademarks and service marks contained in our franchise agreements.
14
Table of Contents
When a franchisee's right to operate a franchise location is terminated, voluntarily or involuntarily, we evaluate the open office in order to determine whether it will be appropriate to resell that territory, including the existing office location, to a new or existing franchisee. As indicated below, the purchase price for an existing territory differs from the purchase price for an undeveloped territory, because it is based on our assessment of the value of the existing office operation.
Company-Owned Offices. We intentionally operate relatively few company-owned offices. During the 2013 tax season, we operated 261 company-owned offices in the United States and Canada, 155 of which were tax kiosks located in Walmart stores. Tax returns prepared by our company-owned offices represented approximately 2% of the total number of tax returns prepared in the Liberty Tax system in the 2013 tax season. We focus primarily on growing through the opening of new franchise locations, and most of the company-owned offices we operate in a given tax seasons were offices that were previously owned by former franchisees who have ceased operations or did not meet our performance standards. Rather than close offices that we believe have the potential to be successful, we attempt to resell these offices, and when we fail to do so before the beginning of a tax season, we operate company-owned offices through a tax season and until we can resell them at a later time. For this reason, the number of offices that we operate as company-owned offices change substantially from season to season. The significant increase in the number of company-owned offices we operated during the 2013 tax season was attributable to our new Walmart relationship, and our commitment to open a minimum number of tax kiosks in Walmart stores. The Walmart relationship was entered into relatively late during our franchise sales season, and we therefore opened more company-owned kiosks than would be the case in a typical tax season.
Franchise fees and royalties. New franchisees (and existing franchisees acquiring additional territories) presently have several options for acquiring a new undeveloped territory:
• | For new franchisees purchasing their first territory, payment of a franchisee fee of $40,000, a portion of which might be financed (subject to credit approval) by us. |
• | For existing franchisees acquiring additional territories, payment of a franchise fee of $40,000, of which 20% must be paid as a down payment and the balance (subject to credit approval) may be financed by us. |
• | For existing franchisees willing to expand, use of our "try before you buy" or "rent to own" options, which require the same 20% down payment, but allow the franchisees to defer the payment of the down payment until they have operated the territory for most of one tax season and elect to keep the territory. |
• | Alternatively, new and existing franchisees can opt for our new "zero franchise fee" alternative, which allows a new territory to be acquired without the payment of the franchise fee, upon delivery of a minimal security deposit, subject to a franchise agreement that will impose higher royalties, as described below. |
When we resell franchises in existing territories, we generally base the fees payable by a franchisee on the revenue generated by the tax location in prior years, and in some cases may make the "rent to own" or "try before you buy" options available to prospective purchasers. The purchasing franchisee is required to pay what we consider to be a customer list purchase price, representing the value attributable to the prior operations in the franchised office.
Our franchise agreement requires franchisees to pay us:
• | A base royalty equal to 14% of the franchisee's tax preparation revenue, subject to certain specified minimums. |
• | An advertising fee of 5% of the franchisee's tax preparation revenue that we utilize to fund our collective advertising efforts. |
Franchisees acquiring territories under our new "zero franchise fee" alternative will be required to pay us franchise royalties of 25% through the first five tax seasons and thereafter 14% of their tax preparation revenue. These franchisees are also required to pay us advertising fees of 5% each tax season.
Our franchisees generally pay royalties and advertising fees to us during the month following the month in which they accrue. When a franchisee becomes past due on those payments, we have the ability to collect from our franchisees through a "fee intercept" mechanism. Because our franchisees are required to use our electronic systems to make electronic filings for customers, franchise fees and other amounts payable to us by our franchisees can be deducted from the amounts otherwise payable to the franchisee once a tax return is funded by the IRS or state taxing authority. This fee intercept mechanism minimizes our credit risk.
Franchisee loans. We provide a substantial amount of lending to our franchisees (including ADs). In addition to allowing franchisees to defer a portion of their franchise fees, which they pay over time, our franchisees utilize working capital loans to fund their operations between tax seasons, and expenditures they need to make in order to prepare for the following tax season. At April 30, 2013 , our franchisees and ADs were indebted to us in the total amount of $92.3 million , net of
15
Table of Contents
unrecognized revenue of $39.7 million , and we had recorded an allowance for doubtful accounts of $6.7 million . This indebtedness generally takes one of the following forms:
• | The unpaid portion of franchise and AD fees, which does not represent a cash advance by us to the franchisee or AD, but a loan of the franchise or AD fee, generally payable over four (territory franchise fees) to eight years (AD fees). At April 30, 2013 the unrecognized revenue related to these loans was $37.1 million. |
• | Amounts due to us in connection with the purchase price of customer lists for franchisees acquiring previously opened territories. The notes for these amounts are generally payable over five years following the acquisition. At April 30, 2013 the unrecognized revenue related to these loans was $2.6 million. |
• | Annual working capital loans made available to qualified franchisees between May 1 and January 31 each year, which are repayable to us generally by the end of February of the following year. |
• | Amounts payable in connection with promissory notes payable to us for royalty and advertising fee amounts due to us for prior periods, but not paid by a franchisee on a timely basis. |
We utilize our fee intercept mechanism in order to ensure repayment of these amounts by our franchisees, ensuring that repayment occurs from the stream of revenues our franchisees receive from tax preparation and other services. In addition, when a franchise is held by an entity, rather than an individual principal, we generally require an individual guaranty of the franchisee indebtedness.
Franchisee support. We provide substantial support to our franchisees in a variety of ways. Our franchise agreement requires our franchisees to adhere to certain minimum standards, including the use of tax preparation software we provide, the use of computers and other equipment that we select (but that we do not sell to them), training requirements and other criteria. We make substantial training opportunities available to our franchisees and their prospective employees, and we require each franchisee to send representatives to a week-long Effective Operations Training seminar before they are allowed to operate a franchise location. We also make intermediate and advanced training available to our franchisees, offer "Tax School" classes for franchisees and prospective tax preparers, and provide substantial phone and internet-based support, particularly during the tax season. During the tax season, we maintain a fully-staffed operations center, with extended hours, at our corporate headquarters in Virginia Beach, Virginia. During the peak tax season, we hold daily conference calls in which we share and allow other franchisees to share recommendations and techniques for improving office performance, and in which we emphasize the importance of implementing the marketing plan that we recommend as part of our franchisee training.
Our NextGen project is also an integral part of our determination to deliver an improved level of service to our franchisees. In addition to integrating our online and retail-based tax preparation software, we expect the NextGen project, when fully deployed, to improve the ability of our franchisees to comply with financial information protection requirements by moving most tax preparation information to a secure centralized platform, and to provide web-based support services in a way that will be both more accessible to our franchisees and their employees and less expensive for us to provide.
Marketing and Advertising
Our marketing and advertising includes both the marketing efforts we provide and those carried out by our franchisees.
We fund many of our direct marketing efforts using the 5% marketing and advertising fee paid to us by our franchisees. A portion of these fees are made available directly to franchisees to enable them to purchase from third-party vendors marketing and advertising materials that have been developed and approved by us. The remaining fees are used in connection with our provision of advertising and marketing support to our franchisees, including the maintenance of an "ad builder" program that our franchisees use to produce a variety of advertising materials. These fees are also used in connection with our national, regional and local marketing efforts, which are designed to increase brand awareness and attract both early season and late season customers. The direct advertising and marketing support that we provide often includes direct mail and yellow pages advertising (and its online equivalent). We have the capability, and provide the capability to our franchisees, to create sophisticated and demographically targeted advertising programs, and programs that target previous customers.
We embrace and expect our franchisees to adopt what we describe as "guerrilla" marketing techniques, which are intended to create awareness of our franchisee's services and products. For example, we have pioneered the use of "wavers," costumed employees, usually dressed in Lady Liberty costumes, who wave at passing cars and pedestrians and thereby remind potential customers of the availability of Liberty Tax's services. We believe that offices that deploy wavers enjoy substantially greater success than those that decline to utilize this marketing technique. We utilize our website, which includes an office locator, to direct customers to our franchise locations, but because of the significant regulation to which we and our franchisees are subject, do not permit our franchisees to operate independent websites. We also furnish franchisees with complete pre-approved advertising packages, designed to comply with the variety of federal and state regulations that govern the advertising
16
Table of Contents
of our services and products. We also encourage our franchisees to utilize discount coupons and other mechanisms to drive additional customers to their offices.
Tax Courses and Training Preparers
Our franchised and company-owned offices offer a comprehensive catalog of tax education courses. Our basic income tax courses consist of approximately 60 hours of learning and provide students with a general working knowledge of individual income taxes and tax return preparation. We also offer a series of advanced and intermediate courses of varying length to provide a more in depth level of learning to those individuals who already possess a basic understanding of income taxes and income tax return preparation. These courses develop a general interest in tax return preparation and also create public awareness of our brand. Many of the students taking these courses develop an interest in tax return preparation as a career and often become tax preparers for franchisees or our company-owned offices, or later become franchisees. We generally charge our franchisees for the cost of the manuals used to teach our tax preparation courses, and in some jurisdictions, we or our franchisees charge students taking these courses fees that are commensurate with the cost of offering the program and that are designed to ensure that the students taking the courses have a bona fide interest in tax preparation. Our operation of our tax education courses is designed by us to be effectively revenue neutral, and our tax courses are neither a source of significant revenue nor a significant cost in any fiscal year.
Tax Preparation in the Liberty System
Through our franchisees, we offer tax preparation services and related financial products to our tax customers. The services and products that our franchisees implement are designed to provide streamlined tax preparation services for taxpayers who for reasons of complexity, convenience or the need for prompt tax refunds seek assisted tax preparation services.
LibTax software. Our current proprietary tax software program, "LibTax," was first deployed for the 2007 tax season, and offers an interactive question-and-answer format that is easy for our retail office tax preparers to use, and that facilitates tax preparer training. A substantial number of changes are made each year to tax laws, regulations and forms that require us to expend substantial resources every year to develop and maintain tax preparation software, at both the federal level and for every state with income tax filing requirements, that will be ready to be deployed in every Liberty Tax office before the beginning of the tax season.
Electronic filing. The LibTax software also allows tax customers to have their federal and state income tax returns filed electronically. Electronic filing permits taxpayers to receive tax refunds substantially sooner than when a tax return is filed on paper through the mail. Based on information made available by the IRS, we believe that an electronically-filed return for which a refund is direct deposited into a bank account takes an average of 8-15 days for the refund to be made available to a taxpayer, while a refund associated with a mailed return will take 3-5 weeks if the refund is to be direct deposited and 4-6 weeks if the refund is to be mailed to the taxpayer using a government check. Although our software will permit a customer's return to be printed and filed as a paper return, substantially all of our customers utilize the electronic filing option available through our software.
Our financial products. We offer tax settlement financial products to our tax preparation customers because we believe that a substantial portion of our prospective customer base places significant value on the ability to monetize their expected income tax refund more quickly than they would be able to do if they were to file their tax return without utilizing the services of a paid tax preparer. We offer two types of tax settlement products: "refund transfer" products, which involve providing the means by which a customer may receive his or her refund more quickly and conveniently, and refund-based loans.
Refund transfer products. Many of our tax customers seek products that will enable them to obtain access to their tax refunds more quickly than they might otherwise be able to receive those funds. We believe that many of our customers are "unbanked," in that they do not have access to a traditional banking account, and therefore cannot make such an account available to the IRS and other tax authorities for the direct deposit of their tax refunds. Additional customers may have access to a traditional banking account, but for personal reasons, may prefer not to utilize that account for the deposit of their tax refunds. We call our refund transfer product an electronic refund check, or ERC. An ERC involves:
• | a direct deposit of the customer's tax refund into a newly established temporary bank account in the customer's name that we establish with one of our banking partners or other banks that have contracted with JTH Financial, LLC ("JTH Financial"), one of our subsidiaries; or |
• | delivery to the customer of a paper check or a prepaid card containing the balance of the customer's refund after the payment of tax preparation and other fees. |
When the prepaid card option is elected, the card is issued through one of our financial product partners, NetSpend, and is branded with the Liberty Tax logo. In the 2013 tax season, approximately 24,000 of our customers utilized NetSpend cards.
17
Table of Contents
When we deliver a physical refund check to a customer, we are generally able to print the check in one of our retail tax offices on check stock provided by the bank, within a matter of hours after the electronic deposit of the customer's refund has been made to the customer's temporary account. We also enter into check-cashing arrangements with a number of retail establishments, including Walmart, which facilitates the ability of our customers to monetize their check even when they do not have traditional banking relationships.
We offer ERCs in conjunction with other service providers, including providers that have contracted with JTH Financial. Consumer advocacy organizations and some government officials have asserted that non-loan tax settlement products, such as the ERCs we offer, should be treated as loan products or otherwise be more heavily regulated. That argument is also the basis for several lawsuits pending against us. We believe the ERC does not represent a loan or extension of credit, but is merely a means by which a customer's tax refund is delivered after it is received from the taxing authority, but some of these organizations and government officials have alleged that because many customers elect to pay their tax preparation fees out of their tax refunds, such as when their transaction with us is complete because we have delivered the tax refund to them, the "deferral" of the tax preparation fees should be considered a loan or extension of credit, and the fees related to the ERC should be characterized as finance charges. Moreover, as disclosed below, we are subject to a state court decision in California that will require us to disclose the fees related to the ERC as finance charges, although that decision is binding only in California. We do not believe this interpretation will be successful on a broader basis, but if it is successful, it may be more difficult for us to continue to offer ERCs to all our customers. See "Item 1A-Risk Factors-Risks Related to Regulation of Our Industry-Federal and state regulators may impose new regulations on non-loan tax settlement products that would make those products more expensive for us to offer or more difficult for our customers to obtain" and "Item 1A-Risk Factors-Risks Related to Regulation of Our Industry-We may be unsuccessful in litigation that characterizes ERCs as loans, which could subject us to damages and additional regulation, and which could adversely affect our ability to offer tax settlement products and have a material adverse effect on our operations and financial results."
Our ability to offer ERCs depends on the ability and willingness of financial institution service providers to make available the bank accounts into which our customers have their tax refunds deposited. If our financial institution service providers become unable to offer these accounts because of regulatory action, or if our service providers determine that they are unwilling to continue to offer these accounts, or cannot furnish accounts sufficient to meet the demand of our customers, we may not be able to offer ERCs to all our customers. See "Item 1A-Risk Factors-Risks Related to Regulation of Our Industry-If our financial product service providers become unable or unwilling to enable us to offer ERCs, we may be unable to offer tax settlement products to our customers."
Refund-based loans. Through the 2012 tax season, the traditional form of refund-based lending was the RAL, which is a tax refund secured loan that has traditionally been offered by tax preparers through third-party banks.
Prior to the 2010 tax season, some of the larger banks that had previously provided funding for RALs exited the RAL market, in some cases because of regulatory issues unrelated to their RAL lending. We were able to contractually secure additional lending capacity from another bank with which we previously partnered, Republic Bank. For this reason, we were able to offer RALs in all of our eligible offices in both the 2010 and 2011 tax seasons. However, in August 2010, the IRS announced it would no longer provide banks and tax preparers with access to what was known as the debt indicator, or the DI. The DI had previously been made available by the IRS, and provided an indication of whether a taxpayer had an existing lien or other claim against his or her refund that would prevent a RAL from being repaid as expected from the taxpayer's refund. In February 2011, the Federal Deposit Insurance Corporation ("FDIC") initiated an administrative proceeding against Republic Bank seeking to force Republic Bank to cease engaging in RAL lending. In December 2011, Republic Bank settled its administrative proceeding with the FDIC, and as part of that settlement, agreed to discontinue offering RALs following the completion of the 2012 tax season. Given the position taken by the FDIC against Republic Bank in that administrative proceeding, we do not believe that other federally-insured financial institutions are likely to enter the RAL business. See "Item 1A-Risk Factors-Risks Related to Regulation of Our Industry-Federal and state legislators and regulators have increasingly taken an active role in regulating tax settlement products, and because our ability to offer these products in future tax seasons may be limited, demand for our services may be reduced, we may be exposed to additional credit risk and our business may be harmed."
Since the 2011 tax season, we have partnered with non-bank counterparties to develop alternative refund-based loan and non-loan tax settlement products, including ICA loans. During the 2011 tax season, we engaged in pilot projects designed to provide loans through third-party ICAs to customers in one state, and during the 2012 tax season, ICAs were available to customers in seven states. The ICA program expanded for the 2013 tax season to 27 states. However, due largely to the condensed tax season and the issues caused by the fiscal cliff, the ICA program was only offered to our customers for 14 days during the 2013 tax season. In order to make these loans available, we contracted with a non-bank lender and developed our own proprietary system to process these transactions. We receive income from the provision of these products through the payment of fees for services by our financial product partners, but we also take additional risk because we may agree to
18
Table of Contents
repurchase loans that are not repaid or repurchased by the non-bank lender. Moreover, ICA loans cannot be offered in every state, and the program may not be significantly expanded beyond the number of states in which the program was made available during the 2013 tax season.See "Item 1A-Risk Factors-Risks Related to Our Business-The loan products made available through non-bank lenders may be limited in scope, are dependent on the availability of financing, may be more expensive and could subject us to greater risk of loss."
Notwithstanding our inability to offer RALs, and limitations on the ability to offer ICAs in all jurisdictions, we believe the continued availability of ERCs will enable us to continue to offer an adequate mix of tax settlement products to our customers. Although the number of refund-based loans obtained by our customers has declined significantly since the 2010 tax season, the "attachment rate" for tax settlement products, which we define as the rate at which our customers elect one of the financial products we offer, irrespective of whether the product is a loan-based product or an ERC, has remained relatively stable, and was 54% in the 2011 tax season, 51% in the 2012 tax season, and 54% in the 2013 tax season. The stability of this attachment rate reflects the fact that as our customers have obtained fewer refund-based loans (whether voluntarily or as a result of their reduced availability), they have generally shifted their tax settlement product choice to ERCs.
Integration of product offerings. The LibTax software makes each of our product offerings available to our customers, including loan-based products and refund transfer products. We believe that this integration of our products into our tax preparation software is essential to attracting customers to the tax preparation services offered in our retail office locations.
Our NextGen project. Our NextGen project, which we hope to deploy fully in time for the 2014 tax season, will fully integrate our existing LibTax and online tax offerings, so that customers will be able to move between the two offerings, and access all of our tax products and services through both offerings. Additionally, this product will move us from managing software at individual office PC locations to a browser-based system. Through April 30, 2013 , we have incurred $23.9 million in expenditures in connection with the development of our NextGen project, including $9.4 million in fiscal 2013 . We anticipate approximately $6.1 million in additional expenditures to complete the development of this project.
Online Tax Preparation
In the 2013 tax season our online customers prepared approximately 159,000 tax returns using our online tax offering, eSmartTax, an increase from the 113,000 tax returns prepared in the 2012 tax season and the 98,000 returns prepared in the 2011 tax season. Since 2010 we have contracted with a third party to provide the tax software utilized in our online tax offering. Our contract with this party runs through 2013 . In late 2012 , we purchased certain assets of that third party which accounted for a portion of the increase in online returns. For subsequent tax seasons, we expect to be able to deploy the integrated software developed in our NextGen project, and the third party software will no longer be available to us.
Although online tax preparation represents an extremely small portion of tax returns prepared and associated revenue, we believe there is a substantial market for customers who wish to prepare their own tax returns using moderately priced online tax preparation products, and that the continued availability of these products will be an important part of our long-term growth, particularly if we are able to successfully integrate our online and retail tax services. At present, because our online tax customers often reside in territories where we have franchisees, the revenue associated with online customers in franchise territories is split with our franchisees on the same basis as the tax preparation services purchased in retail offices.
Competition
The paid tax preparation market is highly competitive. We compete with tens of thousands of paid tax return preparers, including H&R Block, Jackson Hewitt, regional and local tax return preparation companies, most of which are independent and some of which are franchised, regional and national accounting firms and financial service institutions that prepare tax returns as part of their businesses. We consider the major factors that will affect our ability to successfully compete in our industry to include the following:
• | Our ability to continue to grow our franchise base, in order to broaden our national reach and brand recognition. |
• | Our ability to offer best of class customer and franchisee service and support. |
• | Consolidation in our industry and our ability to capitalize on such consolidation. |
• | Our ability to continue to offer a competitive range of tax settlement financial products. |
• | Our successful deployment of our NextGen software, which will enable us to continue to improve our office interface, customer targeting and the ability to move customers between our online and retail tax offerings. |
We also face increased competitive challenges from the online and software self preparer market, including the Free File Alliance ("FFA"), a consortium of the IRS and online preparation services that provides free online tax return preparation, and
19
Table of Contents
from volunteer organizations that prepare tax returns at no cost for low-income taxpayers. Certain states may also pass legislation to provide free online tax return preparation and filing from time to time. Our ability to compete in the tax return preparation business depends on our product mix, price for services, customer service, the specific site locations of our offices, local economic conditions, quality of on-site office management, the ability to file tax returns electronically with the IRS and the availability of tax settlement products to offer to our customers.
We also compete for the sale of tax return preparation franchises with H&R Block, Jackson Hewitt, and other regional franchisors. In addition, we compete with franchisors of other high-margin services outside of the tax preparation industry that attract entrepreneurs seeking to become franchisees. Our ability to continue to sell franchises is dependent on our brand image, the products and services to be provided through the network, the relative costs of financing and start-up costs, our reputation for quality, and our marketing and advertising support.
Our online tax business, eSmartTax, also competes with a number of companies. Intuit, Inc., the maker of Turbo Tax, is the largest supplier of tax preparation software for online tax preparation services, and H&R Block and TaxAct also have substantial online and software-based products. There are many smaller competitors in the online market, as well as free state-sponsored online filing programs. Price and marketing competition for online tax preparation services is increasing, and many providers offer free tax preparation services to some taxpayers.
Seasonality
The tax return preparation business is highly seasonal, and we historically generate most of our revenues during the period from January 1 through April 30. For example, in fiscal 2013 and fiscal 2012, we earned 26% and 34% of our revenues during our fiscal third quarter ending January 31, respectively, and earned 89% of our revenues during the combined fiscal third and fourth quarters of both 2013 and 2012. We generally operate at a loss during the period from May 1 through December 31, during which we incur costs associated with preparing for the upcoming tax season.
Intellectual Property
We regard our intellectual property as critical to our success, and we rely on trademark, copyright and trade secret laws in the United States to protect our proprietary rights. We pursue the protection of our service mark and trademarks by applying to register key trademarks in the United States. The initial duration of federal trademark registrations is 10 years. Most registrations can be renewed perpetually at 10-year intervals. In addition, we seek to protect our proprietary rights through the use of confidentiality agreements with employees, consultants, vendors, advisors and others. The primary marks we believe to be of material importance to our business include our Lady Liberty logo, the brand "Liberty Tax," "Liberty Tax Service," "Liberty Income Tax," and "Liberty Canada."
Employees
As of April 30, 2013 , we employed 950 full-time employees, consisting of 482 employees in our corporate operations, primarily located in Virginia Beach, Virginia and 468 employees at our company-owned offices. Many of our employees are seasonal, and by contrast, we had 547 corporate employees and 869 company office employees as of January 31, 2013. We consider our relationships with our employees to be good.
Regulation
We and our franchisees must comply with laws and regulations relating to our businesses. Regulations and related regulatory matters specific to our businesses are described below.
Tax return preparation regulation. Federal law requires tax preparers to, among other things, set forth their signatures and identification numbers on all tax returns prepared by them, and retain for three years all tax returns prepared. Federal laws also subject tax preparers to accuracy-related penalties in connection with the preparation of tax returns. Preparers may be enjoined from further acting as tax preparers if they continually or repeatedly engage in specified misconduct. Additionally, all authorized IRS e-file providers must adhere to IRS e-file rules and requirements to continue participation in IRS e-file. Adherence to all rules and regulations is expected of all providers regardless of where published, and includes, but is not limited to, those described in IRS Publication 1345, Handbook for Authorized IRS e-file providers. Various IRS regulations also require tax return preparers to comply with certain due diligence requirements to investigate factual matters in connection with the preparation of tax returns. The IRS conducts audit examinations of authorized IRS e-file providers and tax return preparers, reviewing samples of prepared tax returns to ensure compliance with regulations in connection with tax return preparation activities. From time to time, certain of our franchisees and company-owned offices are the subject of IRS audits to review their tax return preparation activities.
The IRS published final regulations in September 2010 that:
20
Table of Contents
• | require all tax return preparers to use a Preparer Tax Identification Number ("PTIN") as their identifying number on federal tax returns filed after December 31, 2010; |
• | require all tax return preparers to be authorized to practice before the IRS as a prerequisite to obtaining or renewing a PTIN; |
• | caused all previously issued PTINs to expire annually on December 31; |
• | allow the IRS to conduct tax compliance checks on tax return preparers; |
• | define the individuals who are considered "tax return preparers" for the PTIN requirement; and |
• | set the amount of the PTIN user registration fee at $64.25 per year for new registrants and $63.00 for renewals. |
The IRS is also conducting background checks on PTIN applicants. The IRS also published final regulations implementing the individual e-file mandate in March 2011. Additionally, the final regulations require that all individual tax return preparers receive a minimum of 15 hours of continuing professional education ("CPE") each year including ethics and current year tax law update. Although the IRS has not provided final information regarding some aspects of the process for implementing the tax preparer certification requirements, and in fact these requirements are on hold as described below, we believe that the tax preparation training we already provide will comply with IRS requirements, and will enable the tax preparers employed by our franchisees to receive the required certification. Attorneys, certified public accountants and enrolled agents who are active and in good standing with their respective licensing agencies are exempt from the competency test and the IRS CPE requirements. When and if the requirements become effective, all tax return preparers will be required to renew the registration of their PTIN every year, be subject to a renewal fee, a tax compliance check and must self-certify that they have completed the CPE requirements for each year.
The mandatory examination and CPE requirements were not implemented for the 2012 or 2013 tax season. Under the regulations, all preparers were to be required to have passed testing by December 31, 2013, and would be charged $116 to take the test. However, in December 2012, a federal court ruled that the IRS regulations regulating tax return preparers exceeded the IRS' statutory authority, and although that decision is on appeal by the IRS, the regulatory scheme is being held in abeyance pending a ruling by the federal appellate court. Ultimately, if the IRS is successful in its appeal and permitted to implement its regulations, or if the IRS otherwise obtains authority to impose these or similar regulations, we believe that our existing programs for educating, training, and testing to become a Liberty Tax tax preparer will position us well to comply with these new industry-wide standards, Liberty Tax has already been approved as a CPE provider.
With certain exceptions, the IRS prohibits the use or disclosure by tax preparers of income tax return information without the prior written consent of the taxpayer. The IRS may continue to consider further regulations concerning disclosures or uses of tax return information.
In addition, the Gramm-Leach-Bliley Act and related FTC regulations require income tax return preparers to adopt and disclose customer privacy policies and provide customers a reasonable opportunity to opt-out of having personal information disclosed to unaffiliated third parties for marketing purposes. Some states have adopted or proposed stricter opt-in requirements in connection with use or disclosure of consumer information. Federal and state law also requires us and our franchisees to safeguard the privacy and security of our customers' data, including financial information to prevent the compromise or breach of our security that would result in the unauthorized release of customer data.
Financial product regulation. Federal and state statutes and regulations govern the facilitation of refund-based loans and other tax settlement financial products. These laws require us, among other things, to provide specific loan disclosures and advertise loans in a certain manner. In addition, we are subject to federal and state laws that prohibit deceptive claims and require that our marketing practices are fair and not misleading. Federal law also limits the annual percentage rate on loans for active duty service members and their dependents. There are also many states that have statutes regulating, through licensing and other requirements, the activities of brokering loans and offering credit repair services to consumers, as well as local usury laws which could be applicable to our business in certain circumstances. From time to time, we receive inquiries from various state regulators regarding our and our franchisees' facilitation of refund-based loans and other tax settlement products. We have in certain states paid fines, penalties and other payments, as well as agreed to injunctive relief, in connection with resolving these types of inquiries.
Potential regulation of ERCs or treatment of ERCs as loans or extensions of credit. Our ERC products may be subject to additional regulation because of potential regulatory changes as well as due to recent litigation asserting that ERCs constitute a RAL or other type of loan or extension of credit because many customers who receive ERCs elect to defer paying their tax preparation fees until their tax refund is received. With respect to possible new regulation, the broad authority of the CFPB may enable that agency to pursue initiatives that negatively impact our ability to offer tax settlement products by imposing
21
Table of Contents
disclosure requirements or other limitations that make the products more difficult to offer, or reduce their acceptance by potential customers. See "Item 1A-Risk Factors-Risk Related to Regulation of Our Industry-Legislative and regulatory reforms may have a significant impact on our business, results of operations and financial condition" and "-Federal and state regulators may impose new regulations on non-loan tax settlement products that would make those products more expensive for us to offer or more difficult for our customers to obtain."
We are also subject to pending litigation that asserts that the ERC is a loan or extension of credit, and should therefore be subject to loan-related federal and state disclosure requirements. See "Item 3-Legal Proceedings-ERC class action litigation." We are also subject to an injunction in California that treats the ERC as an extension of credit, and that if we continue to charge fees for the ERC product in California, will subject us to loan-related requirements for our California customers. If we are subject to an adverse decision in pending class action litigation that affects our offering of ERCs in other states, our ERCs would be subject to additional regulatory requirements in those states, including federal truth-in-lending disclosure obligations, and possible compliance with statutes and regulations governing RALs that have been adopted in numerous states. This additional regulation would not prohibit us from offering ERCs, but might require us to make interest rate and other disclosures to customers because of the characterization of the ERC as a loan or extension of credit that would make it more difficult to market the ERC product to potential customers or reduce their acceptance by potential customers, and might adversely affect fees charged related to ERCs because of limitations on fees imposed by state RAL statutes and regulations. See "Item 1A-Risk Factors-Risks Related to Regulation of Our Industry-Federal and state regulators may impose new regulations on non-loan tax settlement products that would make those products more expensive for us to offer or more difficult for our customers to obtain" and "-We may be unsuccessful in litigation that characterizes ERCs as loans, which could subject us to damages and additional regulation, and which could adversely affect our ability to offer tax settlement products and have a material adverse effect on our operations and financial results."
Franchise regulation. Our franchising activities are subject to the rules and regulations of the FTC and various state agencies regulating the offer and sale of franchises. These laws require that we furnish to prospective franchisees a franchise disclosure document describing the requirements for purchasing and operating a Liberty Tax franchise. In a number of states in which we are currently franchising we are required to be registered to sell franchises. Several states also regulate the franchisor/franchisee relationship particularly with respect to the duration and scope of non-competition provisions, the ability of a franchisor to terminate or refuse to renew a franchise and the ability of a franchisor to designate sources of supply, and bills have been introduced in Congress from time to time that would provide for federal regulation of the franchisor/franchisee relationship in certain respects.
Tax course regulations. Our tax courses are subject to regulation under proprietary school laws and regulations in many states. Under these regulations, our tax courses may need to be registered and may be subject to other requirements relating to facilities, instructor qualifications, contributions to tuition guaranty funds, bonding and advertising.
Item 1A. Risk Factors.
In addition to the other information contained in this annual report, the following risk factors should be considered carefully in evaluating our business. If any of the risks or uncertainties described below were to occur, our business, financial condition and results of operations may be materially and adversely affected. Additional risks not presently known to us or that we currently deem immaterial may also impair our business and operations.
Risks Related to Our Business
Because much of our growth has been achieved through rapidly establishing new offices, we may not achieve the same level of growth in revenues and profits in future years.
Historically our growth has been driven by selling franchises and entering into agreements with ADs who have assisted us in expanding our geographic reach. Our future viability, profitability and growth will depend upon our ability to successfully operate and continue to expand our operations in the United States and Canada. Furthermore, our business has experienced rapid growth in the number of franchisees and office locations in large geographic markets, and our continued growth in those markets may not continue at the same pace. Our ability to continue to grow our business will be subject to a number of risks and uncertainties, and will depend in large part on:
• | adding new customers and retaining existing customers; |
• | innovating new products and services to meet the needs of our customers; |
• | finding new opportunities in our existing and new markets; |
• | remaining competitive in the tax return preparation industry; |
22
Table of Contents
• | our ability to offer directly and to facilitate through others the sale of tax settlement products; |
• | attracting and retaining capable franchisees and ADs; |
• | our success in replacing independent preparers with franchisees; |
• | hiring, training and retaining skilled managers and seasonal employees; and |
• | expanding and improving the efficiency of our operations and systems. |
In addition, our inability to provide current financial statements while we were in the process of restating our quarterly and annual financial statements impacted our ability to market and sell new franchises and may affect our growth for the 2014 tax season.
There can be no assurance that any of our efforts will prove successful or that we will continue to achieve growth in revenues and profits.
The highly seasonal nature of our business presents a number of financial risks and operational challenges, which if we fail to meet could materially affect our business.
Our business is highly seasonal, with the substantial portion of our revenue earned in the January through April "tax season" in the United States and Canada each year. The concentration of our revenue-generating activity during this relatively short period presents a number of challenges for us and our franchisees, including:
• | cash and resource management during the first eight months of our fiscal year, when we generally operate at a loss and incur fixed costs and costs of preparing for the upcoming tax season; |
• | compliance with financial covenants under our credit facility, particularly if the timing of our revenue generation deviates from our typical revenue patterns, as happened during the third quarter of fiscal 2013; |
• | the availability of seasonal employees willing to work for our franchisees for little more than the minimum wage, with minimal benefits, for periods of less than a year; |
• | the success of our franchisees in hiring, training, and supervising these employees and dealing with turnover rates; |
• | accurate forecasting of revenues and expenses, because we may have little or no time to respond to changes in competitive conditions, markets, pricing, and new product offerings by competitors, which could affect our position during the tax season; |
• | disruptions in one tax season, including any customer dissatisfaction issues, may not be discovered until the following tax season; and |
• | ensuring optimal uninterrupted operations during peak season. |
If we experience significant business disruptions during the tax season or if we or our franchisees are unable to meet the challenges described above, we could experience a loss of business, which could have a material adverse effect on our business, financial condition and results of operations.
Our future success will depend in part upon the continued services of our senior management, including our CEO, as well as our ability to attract and retain capable middle management.
Failure to maintain the continued services of senior management personnel or to attract and maintain capable middle management could have a material adverse effect on us. If any of our senior management were to leave the company, including our Chairman and CEO, John Hewitt, it could be difficult to replace him or her, and our operations and ability to manage day-to-day aspects of our business, as well as our ability to continue to grow our business, may be materially adversely affected. Our future success will also depend in part upon our ability to attract and retain capable middle management, such as regional directors, consultants for franchised offices, training directors, tax advisors and computer personnel, having the specific executive skills necessary to assist us and our franchisees. We face competition for personnel from numerous other entities, including competing tax return preparation firms, some of which have significantly greater resources than us.
23
Table of Contents
Because we are not a financial institution, we can only facilitate the sale of financial products through our arrangements with financial institutions and other financial partners, and if these arrangements are terminated for any reason, we may not be able to replace them on acceptable terms or at all.
In the United States, 21% of our net revenue during our 2013 fiscal year was directly derived from our facilitation of the sale of financial products provided to our customers by financial institutions and other lenders or providers, and we believe that percentage may grow in future tax seasons. Our tax return preparation business is also, to some extent, dependent on our ability to facilitate the sale of these products, because our customers are often attracted to our business by the expectation that these products will be available. Financial products that monetize future tax refunds are specialized financial products, and if our arrangements with the financial institutions and other partners that provide our tax settlement products were to terminate and we were unable to enter into an alternative relationship on acceptable terms, or at all, our financial results could be materially adversely affected. In addition, any changes in our contractual terms with these financial institutions and other partners that result in a reduction in our fee income, if not offset by customer growth associated with lower fees, could adversely affect our profitability. See "-Risks Related to Regulation of Our Industry-We may be unsuccessful in litigation that characterizes ERCs as loans, which could subject us to damages and additional regulation, and which could adversely affect our ability to offer tax settlement products and have a material adverse effect on our operations and financial results."
The loan products made available through non-bank lenders may be limited in scope, are dependent on the availability of financing, may be more expensive and could subject us to greater risk of loss.
During the 2011 tax season, we entered into a relationship with a non-bank lender to offer an ICA product to customers in a limited number of our offices. This program expanded in the 2012 and 2013 tax seasons. Because some tax settlement products such as ICAs are offered by third party lenders that are not subject to federal banking law regulations, the products offered through these lenders may subject us to additional laws and regulation at the state level. These laws and regulations may make the offering of the products more expensive and may increase the cost of these products to our customers. Moreover, we do not expect ICAs to be available in all of the states in which we previously offered RALs through Republic Bank due to certain regulatory restrictions, and the ability to maintain and expand the program will depend on the availability of financing the lender must secure each year. The impact of this additional layer of regulation and the availability of funding may therefore limit our product offerings, and adversely affect our profitability. Moreover, because we are continuing to work with the lenders to develop loan underwriting criteria for ICAs, these third parties may experience a higher rate of loss on these loans. We have agreed to repurchase delinquent loans in the ICA program in the past, and if we incur losses as a result of similar obligations in the future, they could adversely affect our results of operations. To the extent ICAs become a more significant product in our portfolio of tax settlement products, our risk of incurring losses due to these or similar repurchase obligations will also increase.
We have restated our previously issued consolidated financial statements, which may lead to additional risks and uncertainties, including shareholder litigation.
As discussed throughout this report, we have restated our previously issued consolidated financial statements for certain affected periods. The Company's decision to restate these consolidated financial statements was based upon the results of an internal review of the Company's historical revenue recognition and business combination accounting policies and their application.
As a result of the restatement, we have become subject to a number of additional risks and uncertainties, including possible future litigation by investors, employees, or other parties, or other proceedings or actions arising in relation to the restatement. If these events were to occur, we may incur additional substantial defense costs regardless of the outcome of such litigation, proceedings or actions. Such events could also cause a diversion of our management's time and attention. If we do not prevail in any such litigation, proceeding or actions, we may be required to pay substantial damages or settlement costs, which could have a material adverse effect on our business, financial condition, and results of operations.
We face significant competition in the tax return preparation business and face a competitive threat from software providers and internet businesses that enable and encourage taxpayers to prepare their own tax returns.
The tax return preparation industry is characterized by intense competition. We compete with H&R Block and Jackson Hewitt, which are larger and more widely recognized than us, and with smaller independent tax return preparation services, small franchisors, regional tax return preparation businesses, accounting firms and financial service institutions that prepare tax returns as part of their business. Additionally, many taxpayers in our target market prepare their own returns. The availability of these alternative options may reduce demand for our products and limit the fees our franchisees can charge, and competitors may develop or offer more attractive or lower cost products and services than ours, which could erode, our consumer base.
We also face increased competitive challenges from the online and software self-preparer market, including the FFA, a consortium of the IRS and online preparation services that provides free online tax return preparation, and assistance from volunteer organizations that prepare tax returns at no cost for low-income taxpayers. In addition, many of our direct
24
Table of Contents
competitors offer certain free online tax preparation and electronic filing options, and limited in-office promotions of free tax preparation services. Government tax authorities, volunteer organizations and direct competitors may elect to expand free offerings in the future. Intense price competition, including offers of free service, could result in a loss of market share, lower revenues or lower margins. Our ability to compete in the tax return preparation business depends on our product offerings, price for services, customer service, the specific site locations of our offices, local economic conditions, quality of on-site office management, the ability to file tax returns electronically with the IRS and the availability of tax settlement products to our customers.
We rely on our own proprietary tax preparation software, and any difficulties in deploying or utilizing our software each tax season could adversely affect our business.
We have utilized our own tax preparation software, beginning with the 2007 tax season. However, tax changes made by the federal and state governments each year, and changes in tax forms, require us to make substantial changes to our software before the beginning of each tax season. Although we engage in extensive testing of our software before deploying it in our franchisees' tax preparation offices, any problems with the rollout of the new software each season could delay our franchisees' ability to file tax returns at the beginning of the tax season, and could adversely affect our business.
Our online tax business will depend in the future on our ability to deploy our own software, and any delays in deploying that software beginning with the 2014 tax season could adversely affect our business.
In recent years, we have utilized software provided by a third party in order to offer online tax preparation. Our agreement with the third party expires in 2013, and they no longer support that product. We intend to replace the third party software with our NextGen software and to deploy that software in time for the 2014 tax season, but we have not yet completed the development of that software, and there can be no assurance that we will be able to do so in time for the 2014 tax season, or that our new software will function properly when it is deployed. We expect to engage in extensive testing of the software before January 2014, but any problems with our ability to deploy the NextGen software in 2014 or future tax seasons could prevent us from offering an online tax platform, and adversely affect our business.
We are operating an increasing number of company-owned offices, and these offices may not be as successful as our franchised offices.
Historically, almost all Liberty Tax offices have been owned by franchisees, and most of the company-owned offices we have operated during a tax season have been offices previously operated by former franchisees. For the 2013 tax season, we operated a total of 261 company-owned offices, including 155 kiosks in Walmart stores. Our company-owned offices other than the Walmart kiosks tend to be less successful than our typical franchisee-owned offices, because they often represent offices transitioned from a less successful franchisee. For this reason, we are not able to obtain the continuity of staffing in company-owned offices that we expect to experience in our franchisee-owned offices. With respect to kiosks in retail stores such as Walmart, we sometimes view the opportunity to operate in retail stores as strategic, with the understanding that a typical store-based kiosk does not generate the volume of tax returns or profitability that is experienced in a storefront location.
Our failure to protect our intellectual property rights may harm our competitive position, and litigation to protect our intellectual property rights or defend against third party allegations of infringement may be costly.
We regard our intellectual property as critical to the success of our business. Third parties may infringe or misappropriate our trademarks or other intellectual property rights, which could have a material adverse effect on our business, financial condition or operating results. The actions we take to protect our trademarks and other proprietary rights may not be adequate. Litigation may be necessary to enforce our intellectual property rights, protect our trade secrets or determine the validity and scope of the proprietary rights of others. There are no assurances that we will be able to prevent infringement of our intellectual property rights or misappropriation of our proprietary information. Any infringement or misappropriation could harm any competitive advantage we currently derive or may derive from our proprietary rights. In addition, third parties may assert infringement claims against us. Any claims and any resulting litigation could subject us to significant liability for damages. An adverse determination in any litigation of this type could require us to design around a third party's patent or to license alternative technology from another party. Litigation is time-consuming and expensive to defend and could result in the diversion of our time and resources. Any claims from third parties may also result in limitations on our ability to use the intellectual property subject to these claims.
Our business relies on technology systems and electronic communications, which, if disrupted, could significantly affect our business.
Our ability to file tax returns electronically and to facilitate tax settlement products depends on our ability to electronically communicate with all of our offices, the IRS, state tax agencies and the financial institutions that provide the tax settlement products. Our electronic communications network is subject to disruptions of various magnitudes and durations. Any
25
Table of Contents
severe disruption of our network or electronic communications, especially during the tax season, could impair our ability to complete our customers' tax filings, to provide tax settlement products from financial institutions or to maintain our operations, which, in turn, could have a material adverse effect on our business, financial condition and results of operations.
We are dependent on our financing sources and any loss of financing could materially and adversely affect our operating results and our ability to expand our business.
We are dependent upon the continued availability of our credit facility, which consists of a term loan and a revolving loan, in order to fund our seasonal needs and for the further expansion of our business. Were we to default on our financing or otherwise lose access to our sources of credit, our ability to provide financing to our franchisees would be significantly impaired, and may result in certain offices closing if our franchisees are not able to secure alternative financing for their working capital needs. In addition, our ability to expand our business would be impaired. We may need to obtain new credit arrangements and other sources of financing to continue to provide financing to our franchisees, to meet future obligations and to fund our future growth. Our ability to maintain or refinance our debt and fund other obligations depends on our successful financial and operating performance and the availability of funds from credit markets. There is no assurance that when our new credit facility matures in 2017, we will be able to renew or refinance our debt or enter into new credit arrangements on terms similar to those of our existing loans.
Our credit facility contains restrictive covenants and other requirements that may limit our business flexibility by imposing operating and financial restrictions on our operations.
Our credit facility is secured by substantially all of our assets, including the assets of our subsidiaries. We are subject to a number of covenants that could potentially restrict how we carry out our business, or that require us to meet certain periodic tests in the form of financial covenants. The restrictions we consider to be material to our ongoing business include the following:
• | We must satisfy a "leverage ratio" test that is based on our outstanding indebtedness at the end of each fiscal quarter. |
• | We must satisfy a "fixed charge coverage ratio" test at the end of each fiscal quarter. |
• | We must reduce the outstanding balance under our revolving loan to zero for a period of at least 45 consecutive days each fiscal year. |
Our credit facility also contains customary affirmative and negative covenants, including limitations on indebtedness, limitations on liens and negative pledges, delivery of financial statements and other information requirements, limitations on investments, loans and acquisitions, limitations on mergers, consolidations, liquidations and dissolutions, limitations on sales of assets, limitations on certain restricted payments and limitations on transactions with affiliates, among others. Our credit facility also includes change of control provisions that may result in our obligations under that facility accelerating if certain change of control events were to occur, including if John Hewitt, our Chairman and CEO, ceases to control our company.
A breach of any of these covenants, tests or mandatory payments could limit our ability to borrow funds under the revolving loan or result in a default under our loans. In addition, these covenants may prevent us from incurring additional indebtedness to expand our operations and execute our business strategy, including making acquisitions. We may also from time to time seek to refinance all or a portion of our debt or incur additional debt in the future. Any such future debt or other contracts could contain covenants more restrictive than those in our existing credit facility. Our ability to comply with the covenants, tests or mandatory payments in our credit facility may be affected by events beyond our control, including prevailing economic, financial and industry conditions or our ability to make tax settlement products available to our customers. See "Item 7-Management's Discussion and Analysis of Financial Condition and Results of Operations-Liquidity and Capital Resources-Overview of factors affecting our liquidity-Credit facility."
We are dependent on the timing of the tax filing season, and disruptions in the opening of the tax season may have a material adverse affect on our results of operations and liquidity.
Historically, the federal tax filing season has begun in mid-January, and both we and our franchisees have begun to prepare tax returns in early January, with the ability to electronically file those returns beginning in mid-January. For the 2013 season, the IRS postponed the first date on which it generally accepted electronic filings until January 30, 2013, and delayed the availability of a significant number of tax forms until February and March 2013. This delay in the beginning of the tax filing season replicated at the state level, particularly in states in which state tax forms are dependent upon and subject to changes in federal tax forms. The change in the start of the 2013 tax filing season materially affected our revenue during the fiscal quarter ended January 31, 2013, and also required us to engage in additional borrowing in order to support both our operations and those of our franchisees because of the delay in receipt of revenue associated with tax filings. As a consequence of the unanticipated delay, we were not able to satisfy the leverage ratio requirement that is applicable to us under our revolving
26
Table of Contents
credit facility at January 31, 2013. Although we received a one-time waiver of that failure, substantial delays in the opening of the tax filing season in future years would be likely to have an adverse effect on our revenue and liquidity, and we can provide no assurance that we would be able to obtain a similar waiver of our debt covenant requirements in future periods.
Our floating rate debt financing exposes us to interest rate risk.
We may borrow amounts under our credit facility that bear interest at rates that vary with prevailing market interest rates. Accordingly, if we do not adequately hedge our interest rate risk, a rise in market interest rates will adversely affect our financial results. We expect to draw most heavily on our revolving loan from July through January of each year and then repay substantially all of the borrowings by the end of each tax season. Therefore, a significant rise in interest rates during our off-season could have a disproportionate impact on our financial results during these months.
The lines of business in which we operate involve substantial litigation, and such litigation may damage our reputation or result in material liabilities and losses.
We have been named, from time to time, as a defendant in various legal actions, including arbitrations, class actions and other litigation arising in connection with our various business activities. Adverse outcomes related to litigation could result in substantial damages and could cause our net income to decline or may require us to alter our business operations. Negative public opinion can also result from our actual or alleged conduct in such claims, possibly damaging our reputation, which could negatively impact our financial performance and could cause the value of our stock to decline. See "Item 3-Legal Proceedings."
If we fail to protect, or fail to comply with laws and regulations related to, our customers' personal information, we may face significant fines, penalties or damages and our brand and reputation may be harmed.
Privacy concerns relating to the disclosure of consumer financial information have drawn increased attention from federal and state governments in the United States. The IRS generally prohibits the use or disclosure by tax return preparers of taxpayers' information without the prior written consent of the taxpayer. In addition, the Gramm-Leach-Bliley Act and other Federal Trade Commission ("FTC") regulations require financial service providers, including tax return preparers, to adopt and disclose consumer privacy policies and provide consumers with a reasonable opportunity to opt out of having personal information disclosed to unaffiliated third parties for advertising purposes. We and our franchisees manage highly sensitive client information in our operations, and although we have established security procedures to protect against identity theft and require our franchisees to do the same, a cyber security incident resulting in breaches of our customers' privacy may occur. If the measures we have taken prove to be insufficient or inadequate or if our franchisees fail to meet their obligations in this area, we and our franchisees may become subject to litigation or administrative sanctions, which could result in significant fines, penalties or damages and harm to our brand and reputation, which in turn could negatively impact our ability to retain our customers. We may be required to invest additional resources to protect us against damages caused by these actual or perceived disruptions or security breaches in the future. We could also suffer reputational harm from a security breach or inappropriate disclosure of customer information. Changes in these federal and state regulatory requirements could result in more stringent requirements and could result in a need to change business practices, including how information is disclosed. These changes could have a material adverse effect on our business, financial condition and results of operations.
If we and our franchisees are unable to attract and retain qualified employees, our financial performance could be materially adversely affected.
Both we and our franchisees depend on the ability to hire a substantial number of seasonal employees for each tax season. We require seasonal employees in order to staff our franchises and customer call centers and company-owned offices, and our franchisees require employees to implement marketing programs, to act as tax preparers and to otherwise staff their offices. The ability of our franchisees and us to meet our labor needs is subject to many external factors, including competition for qualified personnel, unemployment levels in each of the markets in which we have offices, prevailing wage rates, minimum wage laws, and workplace regulation. Our franchisees require a substantial number of employees who are willing to become trained as tax preparers, and who have the ability to engage in temporary, seasonal employment. Moreover, in addition to our seasonal employees, we hire a substantial number of full-time employees who are required to have the technical skills necessary to participate in software development, database management, and other highly technical tasks. If we and our franchisees are not able to hire a sufficient supply of qualified seasonal employees, or if we are not able to secure employees with the technical skills we require for other purposes, our ability to serve our customers in our offices, to deploy our marketing programs, and to maintain the services that our franchisees require may be compromised and have a material adverse effect on our business.
An increase in the minimum wage may adversely affect the operations of our franchisees.
Many of the seasonal employees hired by our franchisees for each tax season receive compensation at or near the minimum wage. If our franchisees experience increases in payroll expenses as a result of government-mandated increases in
27
Table of Contents
the minimum wage, their costs of operation may increase at a rate greater than their ability to raise the prices of the services they offer. If this occurs, our franchisees may not be able to maintain seasonal employment at levels that will provide an optimal level of customer service and marketing support, their marketing and advertising programs may be less effective, and their results of operations may be adversely affected, which could in turn adversely affect our results of operations.
If credit market volatility affects our financial partners or franchisees, our business and financial performance could be adversely affected.
In recent years, the credit markets experienced unprecedented volatility and disruption, causing many lenders and institutional investors to cease providing funding to even the most creditworthy borrowers or to other financial institutions. If additional credit market volatility prevents our financial partners from providing tax settlement products to our customers, limits the products offered or results in us having to incur further financial obligations to support our financial partners, our revenues or profitability could decline. The cost and availability of funds has also adversely impacted our franchisees ability to grow and operate their businesses, which could cause our revenues or profitability to decline. In addition, continued disruptions in the credit markets could adversely affect our ability to sell territories to new or existing franchisees, causing our revenues or profitability to decline.
Because the tax season is relatively short and straddles two quarters, our quarterly results may not be indicative of our performance.
We experience quarterly variations in revenues and operating income as a result of many factors, including the highly seasonal nature of the tax return preparation business, the timing of off-season activities and the hiring of personnel. Due to the foregoing factors, our quarter-to-quarter results vary significantly. In addition, because our peak period straddles the third and fourth quarters, any delay or acceleration in the number of tax returns processed in January may make our year-to-year quarterly comparisons not as meaningful as year-to-year tax season comparisons. To the extent our quarterly results vary significantly from year to year, our stock value may be subject to significant volatility.
Risks Related to Our Franchise Business
Our success is tied to the growth and operations of our franchises could adversely affect our business.
Our financial success depends on our franchisees and the manner in which they operate and develop their offices. We do not exercise direct control over the day-to-day operations of our franchises, and our franchisees may not operate their offices in a manner consistent with our philosophy and standards and may not increase the level of revenues generated compared to prior tax seasons. Our growth and revenues may therefore be adversely affected. There can be no assurance that the training programs and quality control procedures we have established will be effective in enabling franchisees to run profitable tax preparation businesses or that we will be able to identify problems or take corrective action quickly enough. In addition, failure by a franchisee to provide service at acceptable levels may result in adverse publicity that can materially adversely affect our reputation and ability to compete in the market in which the franchisee is located.
If our franchisees fail to open offices in new territories, or if they are not successful in operating their new offices, our franchise-related revenue and results of operation will be adversely affected.
Each year, we anticipate adding offices to our franchise system, but the opening of these offices depends on the purchase of additional territories by our franchisees, and on the opening of offices in territories previously purchased and newly purchased. Many factors go into opening a new office, including obtaining a suitable office location, the availability of sufficient start-up capital, and the ability to recruit tax preparers and other personnel to work in new offices. If a significant number of offices that we expect to be open in a tax season fail to open, are delayed, or open in unsuitable locations or with insufficient personnel, the revenue we expect to receive from royalty payments and the repayment of indebtedness to us by our franchisees will be adversely affected. Because we utilize an almost exclusively franchise business model, we do not have the same flexibility to open new offices as our competitors that make greater use of company-owned offices.
Our operating results may be adversely affected by the default of our franchisees and ADs on loans made by us or third parties.
We extend financing to certain franchisees for initial franchise fees, as cash advances for their working capital needs and for other purposes. The financing is in the form of promissory notes payable to us. There can be no assurance that any franchisee will generate revenue sufficient to repay any amounts due, nor is there any assurance that any franchisee will be able to repay through other means any amounts due. At April 30, 2013 , the aggregate amount due to us from franchisees for financing was $92.3 million , net of unrecognized revenue of $39.7 million (which includes amounts owed to ADs for their portion of royalties and franchise fees), including accrued interest. Any failure by the franchisees to pay these amounts, if the amounts are not recoverable by us through other means, could have a material adverse effect on our financial performance.
28
Table of Contents
We also extend financing to ADs from time-to-time for a portion of their area development fees. At April 30, 2013 , the amount due to us from ADs for financing was $3.6 million, net of unrecognized revenue of $21.1 million . If our ADs fail to pay these amounts, and if the amounts are not recoverable by us through other means, our business and financial condition may be adversely affected.
Moreover, in some cases, we may be liable for office leases or other contractual obligations that have been assumed by purchasers of company-owned offices and acquired tax practices. If the franchisees default on third-party obligations for which we continue to have liability, our operating results will be adversely affected.
We may be held responsible by third parties, regulators or courts for the action of, or failure to act, by our franchisees, and be exposed to possible fines, other liabilities and bad publicity.
We grant our franchisees a limited license to use our registered service marks and, accordingly, there is risk that one or more of the franchisees may be identified as being controlled by us. Third parties, regulators, or courts may seek to hold us responsible for the actions or failures to act by our franchisees. The failure of our franchisees to comply with laws and regulations may expose us to liability and damages that may have an adverse effect on our business.
The Liberty Tax brand could be impaired due to actions taken by our franchisees or otherwise.
We believe the Liberty Tax brand is one of our most valuable assets in that it provides us with a competitive advantage, particularly over our competitors that do not have a national presence. Our franchisees operate their businesses under our brand. Because our franchisees are independent third parties with their own financial objectives, actions taken by them, including breaches of their contractual obligations, and negative publicity associated with these actions, could adversely affect our reputation and brand more broadly. Any actions as a result of conduct by our franchisees or otherwise which negatively impacts our reputation and brand may result in fewer customers and lower revenues and profits for us.
Our tax return preparation compliance program may not be successful in detecting all problems in our franchisee network.
Although our tax return preparation compliance program seeks to monitor the activities of our franchisees, it is unlikely to detect every problem. While we have implemented a variety of measures to enhance tax return preparation compliance as well as our monitoring of these activities, there can be no assurance that franchisees and tax preparers will follow these procedures. Failure to detect tax return preparation compliance issues could harm our reputation and expose us to the risk of government investigation or litigation and could subject us to remedies that could cause our revenues or profitability to decline.
Disputes with our franchisees may have a material adverse effect on our business.
From time to time, we engage in disputes with some of our franchisees, and some of these disputes result in litigation or arbitration proceedings. Disputes with our franchisees may require us to incur significant legal fees, subject us to damages, and occupy a disproportionate amount of management's time. A material increase in the number of these disputes, or unfavorable outcomes in these disputes, may have a material adverse effect on our business. To the extent we have disputes with our franchisees, our relationships with our franchisees could be negatively impacted, which could hurt our growth prospects or negatively impact our financial performance.
Our operating results depend on the effectiveness of our marketing and advertising programs and franchisee support of these programs.
Our revenues are heavily influenced by brand marketing and advertising. If our marketing and advertising programs are unsuccessful, we may fail to retain existing customers and attract new customers, which could limit the growth of our revenues or profitability or result in a decline in our revenues or profitability. Moreover, because franchisees are required to pay us marketing and advertising fees based on a percentage of their revenues, our marketing fund expenditures are dependent upon sales volumes of our franchisees.
The support of our franchisees is critical for the success of our marketing programs and any new strategic initiatives we seek to undertake. While we can mandate certain strategic initiatives through enforcement of our franchise agreements, we need the active support of our franchisees if the implementation of our marketing programs and strategic initiatives is to be successful. Although certain actions are required of our franchisees under the franchise agreements, there can be no assurance that our franchisees will continue to support our marketing programs and strategic initiatives. The failure of our franchisees to support our marketing programs and strategic initiatives would adversely affect our ability to implement our business strategy and could have a material adverse effect on our business, financial condition and results of operations.
29
Table of Contents
Our new franchise sales model may produce less revenue than our historic sales process.
In June 2011, we introduced a new option for new and existing franchisees to purchase territories without the payment of a franchise fee. This arrangement will require the franchisee to pay higher royalties for the first five years of the new franchise. If this model is successful in generating additional franchise sales, it will reduce our franchise income in the near term, without any assurance that the franchisees will generate future royalties at the higher rate sufficient to offset the revenue we forgo. In addition, franchisees may find it difficult to conduct their operations successfully because a greater percentage of their revenues will be diverted to pay higher royalties. If the new model does not generate new and successful offices, our ability to grow our revenues and profitability may be materially and adversely affected.
Risks Related to Regulation of Our Industry
Federal and state regulators may impose new regulations on non-loan tax settlement products that would make those products more expensive for us to offer or more difficult for our customers to obtain.
Consumer advocacy organizations and some government officials have asserted that non-loan tax settlement products, such as the ERCs we offer, should be treated as loan products or otherwise be more heavily regulated. These groups assert that ERCs and similar products are loans because most customers complete the payment for their tax preparation and related fees at the time their refund is disbursed and therefore the customer has received an extension of credit because of a purported deferral of the tax preparation fees until the refund is received. We are subject to a judgment in the State of California that treats ERC products that we provide in that state as if they were extensions of credit. In addition, certain litigation discussed below involving us and others in the tax industry include claims that ERCs and similar products constitute loans or extensions of credit. If other state or federal courts or agencies successfully require us to treat ERCs as if they are loans or extensions of credit, we may be subject to the cost of additional regulation, including disclosure requirements that could reduce the demand for these products by potential customers, and may be subject to limitations on our ability to offer these products, which could materially adversely affect our operations. See "Item 3-Legal Proceedings" and "Item 1-Business-Regulation-Potential regulation of ERCs or treatment of ERCs as loans or extensions of credit."
We may be unsuccessful in litigation that characterizes ERCs as loans, which could subject us to damages and additional regulation, and which could adversely affect our ability to offer tax settlement products and have a material adverse effect on our operations and financial results.
We were sued in November 2011 in four states, and additional lawsuits have been filed in five other states since the initial filings. These cases have now been consolidated before a single judge in federal court in the Northern District of Illinois. The consolidated complaint alleges violations of state-specific RAL and other consumer statutes, alleging that an ERC represents a form of RAL, because the taxpayer is "loaned" the tax preparation fee, and that an ERC is therefore subject to federal truth-in-lending disclosure and state law requirements regulating RALs. The Company is aware that virtually identical lawsuits have been filed against three of its competitors.
Although this litigation is at an early stage, and no resolution is expected in the near term, we may be subject to damages in the case, which purports to be a class action lawsuit. These damages could be based on fees charged to prior customers, and could be substantial if we are not able to recover those damages from our financial product partners who designed the ERC programs and related disclosures. Moreover, if we are unsuccessful in this case, we may also become subject to existing state regulations governing RALs (in the states that have such regulations) and the costs of additional regulation, including disclosure requirements, and we may be subject to limitations on our ability to offer these products. These additional disclosure requirements could reduce the demand for these products by potential customers, and the possible application of state lending and other RAL-related statutes and regulations might adversely affect our fee income to the extent those statutes or regulations impose limitations on fees that we now charge in connection with ERCs. If it becomes more difficult for us and our franchisees to offer these products to taxpayers, or if we are subject to damages in this litigation, it could materially and adversely affect our operations and financial results. See "Item 1-Business-Regulation-Potential regulation of ERCs or treatment of ERCs as loans or extensions of credit."
The failure by us, our franchisees or the financial institutions and other lenders that provide tax settlement products to our customers through us and our franchisees to comply with legal and regulatory requirements, including with respect to tax return preparation or tax settlement products, could result in substantial sanctions against us or require changes to our business practices that could harm our profitability and reputation.
Our tax return preparation business, including our franchise operations and facilitation of tax settlement products, are subject to extensive regulation and oversight in the United States by the IRS, the FTC and by federal and state regulatory and law enforcement agencies and similar entities in Canada. The profitability of our future operations will therefore depend in large part on our continued ability to comply with federal and state franchise regulations, and in Canada on our continued ability to comply with Canadian and provincial franchise regulations. If governmental agencies with jurisdiction over our
30
Table of Contents
operations were to conclude that our business practices, the practices of our franchisees, or those of financial institutions and other lenders with which we conduct our business, violate applicable laws, we could become subject to sanctions that could have a material adverse effect on our business, financial condition and results of operations. These sanctions may include, without limitation:
• | civil monetary damages and penalties; |
• | criminal penalties; and |
• | injunctions or other restrictions on the manner in which we conduct our business. |
In addition, the financial institutions and other providers of tax settlement products to our customers are also subject to significant regulation and oversight by federal and state regulators, including banking regulators. The failure of these providers to comply with the regulatory requirements of federal and state government regulatory bodies, including banking and consumer protection laws, could affect their ability to continue to provide tax settlement products to our customers, which could have a material adverse effect on our business, financial condition and results of operations.
Our customers' inability to obtain tax settlement products through our tax return preparation offices could cause our revenues or profitability to decline. We also may be required to change business practices, which could alter the way tax settlement products are facilitated and could cause our revenues or profitability to decline.
Federal and state legislators and regulators have increasingly taken an active role in regulating tax settlement products, and because our ability to offer these products in future tax seasons may be limited, demand for our services may be reduced, we may be exposed to additional credit risk and our business may be harmed.
From time to time, government officials at the federal and state levels introduce and enact legislation and regulations proposing to regulate or prevent the facilitation of refund-based loans and other tax settlement products, and take other actions that have the effect of restricting the availability of these products. Certain of the proposed legislation, regulations and activities could increase costs to us, our franchisees and the financial institutions and other parties that provide our tax settlement products, or could negatively impact or eliminate the ability of financial institutions to provide or facilitate tax settlement products through tax return preparation offices.
The financial institutions that provide or otherwise facilitate tax settlement products are subject to significant regulation and oversight by federal and state regulators, including banking regulators. In December 2011, Republic Bank, the last bank continuing to offer RALs in any significant number,reached a settlement with the FDIC that required Republic Bank to cease to offer RALs after the 2012 tax season. For this reason, any refund-related loans (such as the ICA) made available to our customers are offered by non-bank lenders.
In August 2010, the IRS announced that, starting in 2011, it would no longer provide tax preparers or RAL providers with the DI, which was used by financial institutions to determine whether to extend credit to a taxpayer in connection with the facilitation of a RAL. In eliminating the DI, the IRS no longer discloses to financial institutions or tax preparers if a taxpayer owes the federal government any money that will be deducted from the taxpayer's expected income tax refund. The unavailability of the DI subjects a lender that originates refund-related loans to additional risks because those loans are more difficult for a lender to underwrite.
Even if we continue to develop relationships that allow our customers to obtain refund-related loans through non-bank lenders, the laws and regulations that apply to those lenders and us may make these products more expensive to offer, or limit their availability to our customers. The loss of the DI has caused approval rates and loan amounts to be lower than in prior tax seasons, and lenders may issue ICAs and similar products that have a greater probability of not being repaid. We may experience a loss of customers because of this change, and to the extent our arrangements with financial institutions impose any of the risk of customer defaults upon us, our profitability may be reduced. In addition, many states have statutes regulating, through licensing and other requirements, the activities of brokering loans and providing credit services to consumers as well as payday loan laws and local usury laws. Some state regulators are interpreting these laws in a manner that could adversely affect the manner in which tax settlement products are facilitated, or permitted, or result in fines or penalties to us or our franchisees. Some states are introducing and enacting legislation that would seek to directly apply such laws to the facilitators of refund-based loans. Additional states may interpret these laws in a manner that is adverse to how we currently conduct our business or how we have conducted our business in the past and we may be required to change business practices or otherwise comply with these statutes and could be subject to fines or penalties or other payments related to past conduct.
31
Table of Contents
If our financial product service providers become unable or unwilling to enable us to offer ERCs, we may be unable to offer tax settlement products to our customers.
Our ability to offer ERCs (as well as other tax settlement products that require the creation of a customer bank account) is dependent on the ability and willingness of our financial product service providers to make available to our customers the bank accounts into which their tax refunds are deposited. If any of the federal or state regulatory authorities with the power to regulate these service providers prevents or makes it more difficult for our service providers to make these bank accounts available to our customers, or if the service providers determine that they no longer wish to participate in these transactions, we may be unable to find alternative service providers that will be willing to provide the required number of bank accounts to our customers. In 2012, we terminated our relationship with Republic Bank, which provided 78% of our ERC products during the 2012 tax season. We were able to replace that capacity in 2013 with our service providers, but if we are unable to make bank accounts available for ERCs, we will not be able to enable our customers to utilize these accounts for the direct deposit of their federal and state tax returns, which would materially affect our ability to offer tax settlement products to those customers.
Legislative and regulatory reforms may have a significant impact on our business, results of operations and financial condition.
In July 2010, the Dodd-Frank Wall Street Reform and Consumer Protection Act (the "Reform Act") was signed into law, which contains a comprehensive set of provisions designed to govern the practices and oversight of financial institutions and other participants in the financial markets. The full impact of the Reform Act is difficult to assess because many provisions require federal agencies to adopt regulations implementing provisions of the Reform Act. In addition, the Reform Act mandates multiple studies, which could result in additional legislative or regulatory action. The Reform Act, as well as other legislative and regulatory changes, could adversely affect our businesses. There is particular risk associated with the establishment of the Consumer Financial Protection Bureau ("CFPB") with broad authority to implement new consumer protection regulations. For example, the CFPB may pursue initiatives that negatively impact our ability and the ability of others we contract with to offer tax settlement products.
The effect of the Reform Act on our business and operations could be significant, depending upon final implementation of regulations, the initiatives pursued by the CFPB, the actions of our competitors and the behavior of other marketplace participants. Moreover, the Reform Act expanded the authority of state regulators to enforce and promulgate consumer protection laws and regulations, and this expansion of state authority may result in new and broader consumer protection requirements that might be more comprehensive than those at the federal level. In addition, we may be required to invest significant management time and resources to address the various provisions of the Reform Act and the numerous regulations that are required to be issued under it. The Reform Act and any related federal or state legislation or regulations could have a material adverse effect on our business, results of operations and financial condition.
Increased regulation of tax return preparers could make it more difficult to find qualified tax preparers and could harm our business.
From time to time, the federal government and various states consider regulations regarding the education, testing, licensing, certification and registration of tax return preparers. The IRS is in the process of implementing a new model for tax return preparer regulation. Although we believe that our training for preparers already exceeds the requirements the IRS will impose, regulation of tax return preparers could impact our ability to find an adequate number of tax return preparers to meet the demands of our customers and impose additional costs on us and our franchisees to train tax return preparers, which could cause our revenues and profitability to decline.
Risks Related to Changes in Tax Laws and Regulations
Because demand for our products is related to the complexity of tax return preparation and the frequency of tax law changes, government initiatives that simplify tax return preparation, reduce the need for a third party tax return preparer or lower the number of returns required to be filed may decrease demand for our services and financial products.
Many taxpayers seek assistance from paid tax return preparers such as Liberty Tax Service because of the level of complexity involved in tax return preparation and filing, and frequent changes in the tax laws. From time to time politicians and government officials propose measures seeking to simplify the preparation and filing of tax returns. The passage of any measures that significantly simplify tax return preparation or reduce the need for third party tax return preparers may be highly detrimental to our business. In addition, any changes or other initiatives that result in a decrease in the number of tax returns filed or reduce the size of tax refunds could reduce demand for our products and services, causing our revenues or profitability to decline.
For example, several members of Congress have proposed legislation that would authorize or require the IRS to allow taxpayers to access web-based tax preparation tools that would include "pre-populated" tax return forms that would presumably
32
Table of Contents
include data provided to the IRS from other government agencies, such as the Social Security Administration. If these or similar proposals that involve government encroachment on the tax preparation process are enacted, many tax customers might elect those services rather than paid tax preparation or the use of fee-based tax software or online tax preparation.
Initiatives that improve the timing and efficiency of processing tax returns could reduce the attractiveness of the tax settlement products offered to our customers and demand for our services.
Our performance depends on our ability to offer access to tax settlement products that increase the speed and efficiency by which our customers can receive their refunds. The federal government and various state and local municipalities have, from time to time, announced initiatives designed to modernize their operations and improve the timing and efficiency of processing tax returns. For example, during the 2011 tax season, the U.S. Department of Treasury introduced a prepaid debit card pilot program designed to facilitate the refund process. If tax authorities are able to significantly increase the speed and efficiency with which they process tax returns, the value and attractiveness of the tax settlement products offered to our customers and demand for our services could be reduced.
Delays in the passage of tax laws and their implementation by the federal or state governments could harm our business.
The enactment of tax legislation occurring late in the calendar year could result in the beginning of tax filing season being delayed, or make it difficult for us to make necessary changes on a timely basis to the software used by our franchisees to prepare tax returns. Any such delays could impact our revenues and profitability in any given year.
Proposals to make fundamental changes in the way tax refunds are processed or to impose price limitations on tax preparation, if enacted, could result in substantial losses of customers and other risks.
Some regulators have suggested that it would be appropriate to allow taxpayers to "split" their tax refunds, in a manner that would separate the payment of tax preparation fees from the balance of a customer's refund. In describing these proposals, some advocates have called for a cap on tax preparation fees that would adversely affect the ability of tax preparers to charge market prices for tax services and could reduce income to our franchisees, and therefore to us.
There can be no assurance that these proposals will be enacted at all, or in their present form, but if enacted, our growth and revenues could be adversely affected.
Our participation in government programs designed to speed access to tax refunds may result in customer loss when the IRS fails to perform.
The IRS has responded to the increase in electronic filing by developing programs designed to reduce a taxpayer's wait to receive a tax refund. We have participated in some new programs offered by the IRS, including in the 2011 tax season the IRS' Modernized Electronic Filing ("MEF") program. During the early portion of the 2011 tax season, this program did not perform as expected, resulting in significant delays in processing refunds for some of our customers. During the early portion of the 2012 tax season, we were not uniquely affected by these problems because the IRS also required our competitors to participate in the MEF program, but the IRS again experienced substantial delays in processing refunds, and our customers were again adversely affected by these delays. Although we continue to seek to give our customers quicker access to their refunds, doing so involves the risk of customer dissatisfaction and injury to our reputation in the market if the IRS fails to perform, which is outside our control.
Risks Related to Our Class A Common Stock
We are controlled by our Chairman and Chief Executive Officer, whose interests in our business may be different from yours.
John Hewitt, our Chairman and Chief Executive Officer, currently owns all outstanding shares of our Class B common stock. Our Class B common stock has the power to elect, voting as a separate class, the minimum number of directors that constitute a majority of the Board of Directors. As a result, Mr. Hewitt will, for the foreseeable future, have significant influence over our management and affairs, given the Board's authority to appoint or replace our senior management, cause us to issue additional shares of our Class A common stock or repurchase Class A common stock, declare dividends or take other actions. Mr. Hewitt may make decisions regarding our company and business that are opposed to other stockholders' interests or with which they disagree. Mr. Hewitt's ability to elect a majority of the Board of Directors may also delay or prevent a change of control of us, even if that change of control would benefit our stockholders, which could deprive an investor of the opportunity to receive a premium for your Class A common stock. The power to elect a majority of the directors may adversely affect the value of our Class A common stock due to investors' perception that conflicts of interest may exist or arise. To the extent that the interests of our other stockholders are harmed by the actions of Mr. Hewitt, the price of our Class A common stock may be harmed. For information regarding the ownership of our outstanding stock, please see the section titled "Item 12-Security Ownership of Certain Beneficial Owners and Management and Related Stockholder Matters."
33
Table of Contents
Because we are not required to comply with certain NASDAQ corporate governance requirements, you may not have the same protections afforded to stockholders of companies that are subject to all of the corporate governance requirements of the NASDAQ.
Because Mr. Hewitt owns all of the outstanding shares of our Class B common stock and therefore has the ability to elect a majority of our directors, we have elected to be a "controlled company" for the purposes of the NASDAQ listing requirements. As such, we are exempt from certain corporate governance requirements, including the requirements that our Board of Directors be comprised of a majority of directors who are independent under NASDAQ rules and that we have nominating and compensation committees with members meeting the NASDAQ independence requirements. We currently are voluntarily complying with the NASDAQ's corporate governance standards, but may choose not to in the future. If we choose not to comply with certain of the requirements, our Board of Directors may have more directors who do not meet the NASDAQ independence standards than they would if those standards were to apply. We may also elect not to maintain formal nominating/corporate governance and compensation committees or, if we maintain those committees, they may not be comprised of independent directors. In such circumstances, you will not have the same protections afforded to stockholders of companies that are subject to all of the corporate governance requirements of the NASDAQ, and circumstances may occur in which the interests of Mr. Hewitt could conflict with the interests of our other stockholders.
Our stock price may be volatile, and investors may be unable to resell their shares at or above their acquisition price or at all.
Our stock price could be subject to wide fluctuations in response to many risk factors listed in this section, and others beyond our control, including:
• | actual or anticipated variations in our operating results from quarter to quarter; |
• | actual or anticipated variations in our operating results from the expectations of securities analysts and investors; |
• | actual or anticipated variations in our operating results from our competitors; |
• | fluctuations in the valuation of companies perceived by investors to be comparable to us; |
• | sales of Class A common stock or other securities by us or our stockholders in the future; |
• | changes in expectations as to our future financial performance, including financial estimates by securities analysts and investors; |
• | departures of key executives or directors; |
• | announcements by us or our competitors of significant contracts, acquisitions, strategic partnerships, financing efforts or capital commitments; |
• | delays or other changes in our expansion plans; |
• | involvement in litigation or governmental investigations; |
• | stock price and volume fluctuations attributable to inconsistent trading volume levels of our shares; |
• | general market conditions in our industry and the industries of our customers; |
• | general economic and stock market conditions; |
• | regulatory or political developments; and |
• | terrorist attacks or natural disasters. |
Furthermore, the capital markets experience extreme price and volume fluctuations that have affected and continue to affect the market prices of equity securities of many companies. These fluctuations often have been unrelated or disproportionate to the operating performance of those companies. These broad market and industry fluctuations, as well as general economic, political and market conditions such as recessions, interest rate changes or international currency fluctuations, may negatively impact our stock price. Trading price fluctuations may also make it more difficult for us to use our Class A common stock as a means to make acquisitions or to use options to purchase our Class A common stock to attract and retain employees. If our stock price does not exceed the price at which stockholders acquired their shares, investors may not realize any return on their investment. In the past, companies that have experienced volatility in the market price of their stock have been subject to securities class action litigation. We may be the target of this type of litigation in the future. Securities
34
Table of Contents
litigation against us could result in substantial costs and divert our management's attention from other business concerns, which could materially adversely affect our business, results of operations and financial position.
A significant portion of our outstanding shares of Class A common stock may be sold into the market, which could adversely affect our stock price.
Sales of a substantial number of shares of our Class A common stock in the public market could occur at any time, subject to certain securities law restrictions. Sales of shares of our Class A common stock, or the perception in the market that the holders of a large number of shares of Class A common stock intend to sell shares, could reduce our stock price. As of September 26, 2013, we have outstanding 12,023,265 shares of Class A common stock and 900,000 shares of Class B common stock, which are convertible into shares of Class A common stock on a one-for-one basis, assuming no exercise of our outstanding options.
At September 26, 2013, we also have approximately 2,651,635 million shares of our Class A common stock reserved for issuance in connection with options and restricted stock units granted under our 1998 Stock Option Plan and the 2011 Equity and Cash Incentive Plan. These shares may also be freely sold in the public market upon issuance and once vested.
An active trading market in our Class A Common Stock may not develop or be sustained.
The activity in our stock on the NASDAQ Stock Market has been limited, and an active public trading market for our Class A common stock may not develop or be sustained. The lack of an active market may impede the ability of our stockholders to sell shares at the time they wish to sell them, at a price that they consider reasonable or at all. The lack of an active market also may reduce our stock price and impede our ability to acquire other companies using our shares as consideration
Our stock price and trading volume could decline if securities or industry analysts do not publish research or reports about our business or if they publish misleading or unfavorable research or reports about our business.
The trading market for our Class A common stock will depend in part on the research and reports that securities or industry analysts publish about us or our business. As of the date of this report, only two securities analysts had commenced coverage of our Class A common stock, and if few securities or industry analysts commence or maintain such coverage, the trading price and liquidity for our shares could be adversely impacted. In the event we obtain securities or industry analyst coverage, if one or more of the analysts who covers us downgrades our stock or publishes misleading or unfavorable research about our business, our stock price could decline. If one or more of these analysts ceases to cover us or fails to publish reports on us regularly, demand for our stock could decrease, which could cause our stock price or trading volume to decline.
We incur increased costs and our management will face increased demands as a result of operating as a company with public equity.
As a company with public equity, we incur significant legal, accounting and other expenses. In addition, the Sarbanes-Oxley Act, as well as related rules implemented by the SEC and NASDAQ, impose various requirements on companies with public equity. As a public company, we are required to:
• | prepare and distribute periodic public reports and other stockholder communications in compliance with our obligations under the federal securities laws and NASDAQ rules; |
• | create or expand the roles and duties of our Board of Directors and committees of the Board of Directors; |
• | institute more comprehensive financial reporting and disclosure compliance functions; |
• | supplement our internal accounting and auditing function; |
• | enhance and formalize closing procedures at the end of our accounting periods; |
• | enhance our investor relations function; |
• | establish new or enhanced internal policies, including those relating to disclosure controls and procedures; and |
• | involve and retain to a greater degree outside counsel and accountants in the activities listed above. |
Our management and other personnel devote a substantial amount of time to these compliance matters. Also, these rules and regulations have increased our legal and financial compliance costs and have made some activities more time-consuming and costly than would be the case for a private company. For example, these rules and regulations have made it more expensive for us to maintain director and officer liability insurance. As a result, it may be more difficult for us to attract and retain qualified individuals to serve on our Board of Directors or as our executive officers.
35
Table of Contents
In addition, as a result of becoming a public company, we are now subject to financial reporting and other requirements, including NASDAQ continued listing requirements, that are burdensome and costly. Our failure to timely complete our analysis of these reporting requirements, could adversely affect investor confidence in our company and, as a result, the value of our common stock. Further, if we fail to implement these reporting requirements, our ability to report our results of operations on a timely and accurate basis could be impaired. In fact, in connection with restating our previously issued annual and quarterly consolidated financial statements, we recently were delinquent in filing our annual and quarterly reports. Consequently, we received two notices from NASDAQ in connection with the delinquent filings and we may be subject to NASDAQ delisting procedures if we fail to gain compliance with the NASDAQ continued listing requirements.
The exercise price for the stock options granted by us may not reflect the fair value of the underlying shares of Class A common stock.
Because our shares of Class A common stock were not traded on a public market until 2012, the exercise price at which options for our shares may be exercised was determined by our Board of Directors without reference to such a market. Although the Board of Directors has granted options based on its determination of a fair value for the shares of Class A common stock, there can be no assurance that the option exercise price accurately reflects the value at which the shares of Class A common stock may be purchased in an active public market.
We are an "emerging growth company" and our election to delay adoption of new or revised accounting standards applicable to public companies may result in our financial statements not being comparable to those of other public companies. As a result of this and other reduced disclosure and governance requirements applicable to emerging growth companies, our common stock may be less attractive to investors.
We are an "emerging growth company," as defined in the Jumpstart Our Business Startups Act of 2012 (the "JOBS Act") enacted in April 2012, and we intend to take advantage of certain exemptions from various reporting requirements that are applicable to other public companies that are not emerging growth companies including, but not limited to, not being required to comply with the auditor attestation requirements of Section 404 of the Sarbanes-Oxley Act of 2002 (the "Sarbanes-Oxley Act"), the same reduced disclosure obligations regarding executive compensation in our periodic reports and proxy statements that smaller reporting companies are permitted to provide and exemptions from the requirements of holding a nonbinding advisory stockholder vote on executive compensation, frequency of approval of executive compensation and of any golden parachute payments not previously approved. In addition, Section 107 of the JOBS Act also provides that an emerging growth company may take advantage of the extended transition period provided in the Securities Act of 1933 (the "Securities Act") and the Securities Exchange Act of 1934 (the "Exchange Act") for complying with new or revised accounting standards. In other words, an emerging growth company may delay the adoption of certain accounting standards until those standards would otherwise apply to private companies. We are electing to delay such adoption of new or revised accounting standards, and as a result, we may not comply with new or revised accounting standards on the relevant dates on which adoption of such standards is required for non-emerging growth companies. As a result of this election, our financial statements may not be comparable to the financial statements of other public companies. We cannot predict whether investors will find our common stock less attractive because we will rely on these exemptions. We will remain an "emerging growth company" until the earliest of (i) the last day of the fiscal year during which we have total annual gross revenue of $1 billion or more; (ii) the last day of the fiscal year following the fifth anniversary of the sale by us of common equity securities pursuant to an effective registration statement under the Securities Act; (iii) the date on which we have, during the previous three-year period, issued more than $1 billion in non-convertible debt; and (iv) the date on which we are deemed to be a "large accelerated filer," as defined under the Exchange Act.
Although we may desire to pay dividends in the future, our financial condition, debt covenants or Delaware law may prohibit us from doing so.
Although we may desire to pay cash dividends in the future, we have no obligation to do so and the payment of dividends will be at the discretion of our Board of Directors and will depend, among other things, on our earnings, capital requirements and financial condition, and our ability to dividend funds from our principal subsidiary under the terms of our credit facility. Our ability to pay dividends will be subject to compliance with financial covenants that are contained in our credit facility and may be restricted by any future indebtedness that we incur or issuances of preferred stock. In addition, applicable law requires that our Board of Directors determine that we have adequate surplus prior to the declaration of dividends. We cannot assure investors that we will pay dividends at any specific level or at all.
36
Table of Contents
Anti-takeover provisions in our charter documents, Delaware law and our credit facility could make an acquisition of us more difficult, limit attempts by our stockholders to replace or remove our current management and adversely affect the value of our Class A common stock.
Provisions in our amended and restated certificate of incorporation and bylaws may have the effect of delaying or preventing a change of control or changes in our management. We have two classes of common stock, one of which is entitled to elect a majority of our Board of Directors and is controlled by our Chairman and CEO as described above. Our second amended and restated certificate of incorporation and bylaws will also include provisions that:
• | authorize our Board of Directors to issue, without further action by the stockholders, up to approximately 3 million shares of undesignated preferred stock; |
• | specify that special meetings of our stockholders can be called only by our Board of Directors, the Chair of our Board of Directors, or holders of at least 20% of the shares that will be entitled to vote on the matters presented at such special meeting; |
• | establish an advance notice procedure for stockholder proposals to be brought before an annual meeting, including proposed nominations of persons for election to our Board of Directors; and |
• | do not provide for cumulative voting in the election of directors. |
In addition, our credit facility contains covenants that may impede, discourage or prevent a takeover of us. For instance, upon a change of control, we would default on our credit facility. As a result, a potential takeover may not occur unless sufficient funds are available to repay our outstanding debt.
These provisions may frustrate or prevent any attempts by our stockholders to replace or remove our current management by making it more difficult for stockholders to replace members of our Board of Directors, which is responsible for appointing the members of our management. Any provision of our amended and restated certificate of incorporation and bylaws or our debt documents that has the effect of delaying or deterring a change of control could limit the opportunity for our stockholders to receive a premium for their shares of our Class A common stock. Even in the absence of a takeover attempt, the existence of these provisions may adversely affect our stock value if they are viewed as discouraging takeover attempts in the future.
We have identified a material weakness in our internal control over financial reporting, which, if not remediated effectively, may impact our ability to report our financial results accurately, which could harm our business and the value of our Class A common stock.
In August 2013, we announced that we would restate our previously issued annual and quarterly consolidated financial statements for certain affected periods. In conjunction with this restatement, management of the Company has concluded that, as of April 30, 2013, we had a material weakness in our internal control over financial reporting and that, as a result, our disclosure controls and procedures were not effective as of that date. See "Item 9A-Controls and Procedures."
Effective internal controls are necessary for us to provide reliable financial reports and to detect and prevent fraud. A "material weakness" is a deficiency, or a combination of deficiencies, in internal control over financial reporting, such that there is a reasonable possibility that a material misstatement of our annual or interim financial statements will not be prevented or detected on a timely basis. We are in the process of implementing a plan to address the identified deficiencies and material weakness that existed as of April 30, 2013. If we fail to effectively implement our remediation plan and maintain an effective system of internal controls, we could suffer losses, could be subject to costly litigation, investors could lose confidence in our reported financial information and our brand and operating results could be harmed, all of which could have a negative effect on the value of our Class A common stock.
Item 1B. Unresolved Staff Comments.
We have been in discussions with the staff (the "Staff") of the SEC's Division of Corporation Finance regarding comment letters received from the Staff relating to the Company's Form 10-K for the fiscal year ended April 30, 2012 and Form 10-Q for the quarterly period ended January 31, 2013. Through these discussions with the Staff, we believe that we have resolved these comments. Although the filings containing our restated annual and quarterly consolidated financial statements will remain subject to further comments from the Staff, we anticipate that we will receive clearance from the Staff with respect to the outstanding comments.
Item 2. Properties.
Our corporate headquarters are located in three company owned buildings in Virginia Beach, Virginia consisting of approximately 70,000 square feet. At April 30, 2013 , our outstanding mortgage with respect to this property had a principal balance of $2.4 million. We also own additional properties in Ohio, New York, Tennessee and Virginia, which are company-
37
Table of Contents
owned offices or leased to franchisees. The remainder of our company-owned offices are operated under leases. We believe that our offices are in good repair and sufficient to meet our present needs.
Item 3. Legal Proceedings.
The legal proceedings to which we are party include the following:
ERC class action litigation. We were sued in November 2011 in federal courts in Arkansas, California, Florida and Illinois, and additional lawsuits were filed in federal courts in January 2012 in Maryland and North Carolina, in February 2012 in Wisconsin and in May 2012 in New York and in Minnesota. The allegations underlying each of these lawsuits, which were filed by the same set of attorneys, were that an ERC represents a form of RAL, because the taxpayer is "loaned" the tax preparation fee, and that an ERC is therefore subject to federal truth-in-lending disclosure and state law requirements regulating RALs. Each of the cases differed in that it alleged violations of state-specific RAL and other consumer statutes. In December 2011, the plaintiffs in the original cases filed a motion to consolidate all of the then-pending cases.In April 2012, the cases were consolidated before a single judge in federal court in the Northern District of Illinois and in June 2012, the plaintiffs filed a new complaint in the consolidated action. The consolidated complaint alleges violations of state-specific RAL and other consumer statutes. The lawsuit purports to be a class action, and the plaintiffs allege potential damages in excess of $5 million, but we may be able to recover any damages from the providers of the financial products that designed the programs and related disclosures. The Company is aware that virtually identical lawsuits have been filed against several of its competitors. This litigation is at a very early procedural stage.
South Carolina litigation. In November 2010, several former customers of one of our South Carolina franchisees initiated a purported class action against us, our Chief Executive Officer and another of our employees in the United States District Court for the District of South Carolina, in a case styled Martin v. JTH Tax, Inc. The trial court denied class action status in February 2013, and the case was settled in June 2013. The settlement amount is immaterial and has been included in the accompanying consolidated financial statements.
Republic Bank Dispute . In August 2012, the Company terminated an agreement with one of its financial product providers, Republic Bank & Trust Company, which would otherwise have expired in October 2014. The Company's right to terminate the agreement is being disputed by Republic Bank & Trust Company, and the parties conducted a contractually-required mediation in late June 2013, and the mediation process is ongoing. If the mediation does not resolve the parties' dispute, the agreement provides for arbitration of the dispute. At this stage, an arbitration proceeding has not been commenced, but the Company believes that the outcome of this dispute will not significantly impact its results of operation or financial position.
We are also party to claims and lawsuits that we consider to be ordinary, routine litigation incidental to our business, including claims and lawsuits concerning the preparation of customers' income tax returns, the fees charged customers for various products and services, relationships with franchisees, intellectual property disputes, employment matters and contract disputes. While we cannot provide assurance that we will ultimately prevail in each instance, we believe the amount, if any, we are required to pay in the discharge of liabilities or settlements in these claims will not have a material adverse impact on our consolidated results of operations.
Item 4. Mine Safety Disclosures.
Not applicable.
38
Table of Contents
PART II
Item 5. Market for Registrant's Common Equity, Related Stockholder Matters and Issuer Purchases of Equity Securities.
Market Price of Our Class A Common Stock
Our Class A common stock has been listed on The NASDAQ Global Market under the symbol "TAX" since July 2, 2012. We traded on the over-the-counter bulletin board from June 14, 2012 until that date. Prior to that time, there was no public market for our Class A common stock. The following table sets forth for the periods indicated the high and low sale prices of our Class A common stock on the over-the-counter bulletin board through June 29, 2012 and on The NASDAQ Global Market from and after July 2, 2012.
2013 Fiscal Quarter |
| High |
| Low | ||||
First Quarter(1) |
| $ | 14.99 | |
| $ | 10.00 | |
Second Quarter |
| 15.50 | |
| 8.85 | | ||
Third Quarter |
| 16.35 | |
| 12.99 | | ||
Fourth Quarter |
| 17.50 | |
| 14.48 | | ||
_______________________________________________________________________________
(1) Represents period from June 14, 2012, the date on which we began to be traded on the over-the-counter bulletin board, through the end of the quarter on July 31, 2012.
The reported closing price of our Class A common stock on September 26, 2013 was $17.54. Wells Fargo Shareowner Services is the transfer agent and registrar for our Class A common stock.
As of September 26, 2013, we had approximately 261 record holders of our Class A Common Stock, and one holder of our Class B Common Stock.
We have never declared or paid a cash dividend on our capital stock. Although we may pay cash dividends in the future, the payment of dividends will be at the discretion of our Board of Directors and will depend, among other things, on our earnings, capital requirements and financial condition. Our ability to pay dividends will also be subject to compliance with financial covenants that are contained in our credit facility and may be restricted by any future indebtedness that we incur or issuances of preferred stock. In addition, applicable law requires that our Board of Directors determine that we have adequate surplus prior to the declaration of dividends. We cannot provide an assurance that we will pay dividends at any specific level or at all.
As of April 30, 2013 , we had outstanding 12,975,128 shares of Class A common stock, treating as common stock equivalents exchangeable shares that may be exchanged for 1,000,000 shares of Class A common stock. As of April 30, 2013 , we also had outstanding 900,000 shares of Class B common stock, all of which are held by Mr. Hewitt, our Chairman and Chief Executive Officer. As of April 30, 2013 , we had outstanding 10 shares of special voting preferred stock. As of April 30, 2013 , options to acquire 2,534,683 shares of Class A common stock were also outstanding, 2,402,183 of which were exercisable within 60 days of April 30, 2013.
Stock repurchase activity during the three months ended April 30, 2013 was as follows:
Period |
| Total Number of Shares Purchased(1) |
| Average Price Paid per Share |
| Total Number of Shares Purchased as Part of Publicly Announced Plan |
| Maximum Value of Shares that may be Purchased Under the Plan(2) | ||||||
February 1 through February 28, 2013 |
| - | |
| $ | - | |
| - | |
| $ | 4,208,979 | |
March 1 through March 31, 2013 |
| 3,116 | |
| 15.74 | |
| 3,116 | |
| 4,159,919 | | ||
April 1 through April 30, 2013 |
| 299,539 | |
| 15.94 | |
| 299,539 | |
| 1,181,478 | | ||
Total |
| 302,655 | |
|
|
| 302,655 | |
|
| ||||
_______________________________________________________________________________
(1) During the three months ended April 30, 2013, we repurchased shares through both open market purchases and through private transactions under the publicly announced plan described in the following footnote.
39
Table of Contents
(2) On August 29, 2012, we announced that our Board of Directors approved a $5 million authorization for share repurchases, and did not specify an expiration date for that share repurchase program. The first repurchase under this plan took place on September 10, 2012. The repurchases also include deemed repurchases from shareholders exercising options on a net basis. Share repurchases associated with stock option exercises do not reduce the maximum value of shares that may be purchased under the plan.
Item 6. Selected Financial Data.
|
| Fiscal Years Ended and as of April 30, | ||||||||||||||||||
|
| 2009(1) |
| 2010(1) |
| 2011(2) |
| 2012(2) |
| 2013 | ||||||||||
|
| As Restated |
| As Restated |
| As Restated |
| As Restated |
|
| ||||||||||
|
| (dollars in thousands, except per share, per office amounts and fees per tax return) | ||||||||||||||||||
Consolidated Statements of Income Data: |
|
|
|
|
|
|
|
|
|
| ||||||||||
Revenue: |
|
|
|
|
|
|
|
|
|
| ||||||||||
Franchise fees |
| $ | 10,056 | |
| $ | 13,366 | |
| $ | 8,780 | |
| $ | 7,996 | |
| $ | 8,721 | |
Area developer fees |
| 6,881 | |
| 6,476 | |
| 6,335 | |
| 6,702 | |
| 7,699 | | |||||
Royalties and advertising fees |
| 47,874 | |
| 58,361 | |
| 66,182 | |
| 70,016 | |
| 73,129 | | |||||
Financial products |
| 18,560 | |
| 14,175 | |
| 16,507 | |
| 22,903 | |
| 30,345 | | |||||
Tax preparation fees, net of discounts |
| 5,075 | |
| 5,982 | |
| 4,789 | |
| 7,026 | |
| 10,148 | | |||||
Other revenue |
| 12,377 | |
| 14,225 | |
| 15,343 | |
| 16,582 | |
| 17,571 | | |||||
Total revenue |
| 100,823 | |
| 112,585 | |
| 117,936 | |
| 131,225 | |
| 147,613 | | |||||
Total operating expenses |
| (76,781 | ) |
| (91,060 | ) |
| (91,245 | ) |
| (103,245 | ) |
| (116,777 | ) | |||||
Income from operations |
| 24,042 | |
| 21,525 | |
| 26,691 | |
| 27,980 | |
| 30,836 | | |||||
Interest expense |
| (1,769 | ) |
| (1,947 | ) |
| (1,954 | ) |
| (1,854 | ) |
| (2,039 | ) | |||||
Other income |
| 311 | |
| 3,468 | |
| 75 | |
| 4 | |
| - | | |||||
Income before income taxes |
| 22,584 | |
| 23,046 | |
| 24,812 | |
| 26,130 | |
| 28,797 | | |||||
Income tax expense |
| (9,427 | ) |
| (8,657 | ) |
| (10,142 | ) |
| (9,747 | ) |
| (11,170 | ) | |||||
Net income |
| $ | 13,157 | |
| $ | 14,389 | | | $ | 14,670 | |
| $ | 16,383 | |
| $ | 17,627 | |
Earnings per share of Class A common stock and Class B common stock |
|
|
|
|
|
|
|
|
|
| ||||||||||
Basic |
| $ | 0.89 | |
| $ | 0.99 | |
| $ | 0.85 | |
| $ | 1.17 | |
| $ | 1.26 | |
Diluted |
| $ | 0.85 | |
| $ | 0.95 | |
| $ | 0.83 | |
| $ | 1.16 | |
| $ | 1.25 | |
40
Table of Contents
Consolidated Balance Sheet Data: |
|
|
|
|
|
|
|
|
|
| ||||||||||
Amounts due from franchisees and area developers, net of allowances |
| $ | 48,904 | |
| $ | 57,591 | |
| $ | 68,196 | |
| $ | 76,493 | |
| $ | 85,658 | |
Property, equipment and software, net |
| 17,426 | |
| 13,127 | |
| 18,228 | |
| 23,948 | |
| 33,037 | | |||||
Total assets |
| 109,357 | |
| 102,081 | |
| 116,093 | |
| 152,196 | |
| 169,530 | | |||||
Revolving credit facility |
| 10,002 | |
| - | |
| - | |
| - | |
| - | | |||||
Long-term debt, including current installments |
| 5,205 | |
| 4,734 | |
| 4,458 | |
| 28,985 | |
| 27,683 | | |||||
Total stockholders' equity |
| 35,089 | |
| 44,179 | |
| 52,018 | |
| 67,065 | |
| 81,836 | | |||||
Other Financial and Operational Data: |
|
|
|
|
|
|
|
|
|
| ||||||||||
Adjusted EBITDA(3) |
| $ | 31,460 | |
| $ | 34,928 | |
| $ | 33,568 | |
| $ | 36,517 | |
| $ | 42,107 | |
Franchisees |
| 1,801 | |
| 1,901 | |
| 1,941 | |
| 2,098 | |
| 2,211 | | |||||
Offices(4) |
| 3,091 | |
| 3,531 | |
| 3,845 | |
| 4,183 | |
| 4,520 | | |||||
Offices per franchisee |
| 1.72 | |
| 1.86 | |
| 1.98 | |
| 1.99 | |
| 2.04 | | |||||
Tax returns processed |
| 1,766,000 | |
| 1,912,000 | |
| 2,044,000 | |
| 2,188,000 | |
| 2,275,000 | | |||||
Net average fee per tax return prepared(5) |
| $ | 149 | |
| $ | 170 | |
| $ | 174 | |
| $ | 173 | |
| $ | 180 | |
Systemwide revenue(6) |
| $ | 243,600 | |
| $ | 304,300 | |
| $ | 338,600 | |
| $ | 359,100 | |
| $ | 381,200 | |
Systemwide revenue per office(5)(6) |
| $ | 78,809 | |
| $ | 86,180 | |
| $ | 88,062 | |
| $ | 85,847 | |
| $ | 84,336 | |
______________________________________________________________________________
(1) See "Explanatory Note Regarding Restatement" and Note 19 to the Consolidated Financial Statements in Item 15, for a discussion of corrections reflected
in these restated numbers.
(2) The consolidated statements of income data for the years ended April 30, 2010 and 2009 and the consolidated balance sheet data as of April 30, 2011,
2010 and 2009 have been corrected to reflect adjustments and corrections described in footnote 1 above.
(3) We define Adjusted EBITDA as net income, plus: provision for income taxes, interest expense, non-recurring (income) expense, depreciation and
amortization, foreign currency transaction (gain) loss, and stock-based compensation. Please see "Adjusted EBITDA" below for more information and for a reconciliation of Adjusted EBITDA to net income, the most directly comparable financial measure calculated and presented in accordance with U.S. generally accepted accounting principles, or GAAP.
(4) We measure our number of offices per fiscal year based on franchised and company-owned offices open at any point during the tax season.
(5) Systemwide revenue per office and the net average fee per tax return prepared reflect amounts for our franchised and company-owned offices.
(6) Our systemwide revenue represents the total tax preparation revenue generated by our franchised and company-owned offices. It does not represent our
revenue, but because our franchise royalties are derived from the operations of our franchisees, and because we maintain an infrastructure to support
systemwide operations, we consider growth in systemwide revenue to be an important measurement.
41
Table of Contents
|
|
| ||||||||||||||||||||||
|
| 2009 |
| 2010 | ||||||||||||||||||||
|
| As Reported |
| Adjustments |
| As Restated |
| As Reported |
| Adjustments |
| As Restated | ||||||||||||
|
|
|
| (Unaudited) |
| (Unaudited) |
|
|
| (Unaudited) |
| (Unaudited) | ||||||||||||
|
| (dollars in thousands, except per share, per office amounts and fees per tax return) | ||||||||||||||||||||||
Consolidated Statements of Income Data: |
|
|
|
|
|
|
|
|
|
|
|
| ||||||||||||
Franchise fees |
| $ | 11,476 | |
| $ | (1,420 | ) |
| $ | 10,056 | |
| $ | 11,288 | |
| $ | 2,078 | |
| $ | 13,366 | |
Provision for refunds |
| (1,193 | ) |
| 1,193 | |
| - | |
| (1,656 | ) |
| 1,656 | |
| - | | ||||||
Area developer fees |
| - | |
| 6,881 | |
| 6,881 | |
| - | |
| 6,476 | |
| 6,476 | | ||||||
Royalties and advertising fees |
| 33,093 | |
| 14,781 | |
| 47,874 | |
| 41,413 | |
| 16,948 | |
| 58,361 | | ||||||
Interest income |
| 8,783 | |
| 249 | |
| 9,032 | |
| 8,876 | |
| 1,087 | |
| 9,963 | | ||||||
Net gain on sale of customer lists and other assets and other revenue |
| 3,484 | |
| (139 | ) |
| 3,345 | |
| 4,549 | |
| (287 | ) |
| 4,262 | | ||||||
Total revenue |
| 79,278 | |
| 21,545 | |
| 100,823 | |
| 84,627 | |
| 27,958 | |
| 112,585 | | ||||||
General and administrative expenses |
| 16,551 | |
| 1,200 | |
| 17,751 | |
| 17,871 | |
| 1,280 | |
| 19,151 | | ||||||
Area developer expense |
| - | |
| 19,084 | |
| 19,084 | |
| - | |
| 22,031 | |
| 22,031 | | ||||||
Depreciation, amortization, and impairment charges |
| 5,313 | |
| (507 | ) |
| 4,806 | |
| 7,305 | |
| (515 | ) |
| 6,790 | | ||||||
Total operating expenses |
| 57,004 | |
| 19,777 | |
| 76,781 | |
| 68,264 | |
| 22,796 | |
| 91,060 | | ||||||
Income from operations |
| 22,274 | |
| 1,768 | |
| 24,042 | |
| 16,363 | |
| 5,162 | |
| 21,525 | | ||||||
Income before income taxes |
| 20,816 | |
| 1,768 | |
| 22,584 | |
| 17,884 | |
| 5,162 | |
| 23,046 | | ||||||
Income tax expense |
| 8,737 | |
| 690 | |
| 9,427 | |
| 6,882 | |
| 1,775 | |
| 8,657 | | ||||||
Net income |
| 12,079 | |
| 1,078 | |
| 13,157 | |
| 11,002 | |
| 3,387 | |
| 14,389 | | ||||||
Earnings per share of Class A common stock and Class B common stock |
|
|
|
|
|
|
|
|
|
|
|
| ||||||||||||
Basic |
| $ | 0.82 | |
| $ | 0.07 | |
| $ | 0.89 | |
| $ | 0.75 | |
| $ | 0.24 | |
| $ | 0.99 | |
Diluted |
| $ | 0.78 | |
| $ | 0.07 | |
| $ | 0.85 | |
| $ | 0.73 | |
| $ | 0.22 | |
| $ | 0.95 | |
The adjustments reflected in the tables above include:
• | Adjustments to franchise fees includes the reclassification of area developer fees to a separate caption, the net impact of changing our franchise fee recognition policy to receipt of funds and the change to gross presentation for the area developer portion |
• | Adjustments to provision for refunds is due to the change in our franchise fee recognition policy |
• | Adjustments to area developer fees is the net effect of reclassifying AD fees out of franchisee fees and the impact of recognizing revenue over the life of the agreement |
• | Adjustments to royalties and advertising reflects the change to gross presentation for the area developer portion of royalties |
• | Adjustments to interest income reflect the change to gross presentation for the area developer portion of interest and the conversion to cash basis from accrual basis for interest on notes related to unrecognized revenue |
• | Adjustments to general and administrative expense reflects the increase in the provision for bad debts due to the elimination of the provision for refunds |
• | Adjustments to area developer expense reflects the change to a gross presentation for franchise fees, royalties and interest owed to area developer |
• | Adjustments to amortization and impairment charges are the net effect of the change in purchase price allocation for company-owned offices acquired from franchisees and the impact of a smaller balance of area developer rights due to the netting of deferred revenue upon reacquisition |
• | Adjustments to the provision for income taxes reflects the impact of the restatement adjustments |
42
Table of Contents
|
| 2009 |
| 2010 | ||||||||||||||||||||
|
| As Reported |
| Adjustments |
| As Restated |
| As Reported |
| Adjustments |
| As Restated | ||||||||||||
|
|
|
| (Unaudited) |
| (Unaudited) |
|
|
| (Unaudited) |
| (Unaudited) | ||||||||||||
|
| (dollars in thousands) | ||||||||||||||||||||||
Amounts due from franchisees and area developers, net of allowances |
| $ | 81,233 | |
| $ | (32,329 | ) |
| $ | 48,904 | |
| $ | 86,838 | |
| $ | (29,247 | ) |
| $ | 57,591 | |
Property, equipment and software, net |
| 17,426 | |
| - | |
| 17,426 | |
| 13,127 | |
| - | |
| 13,127 | | ||||||
Total assets |
| 132,726 | |
| (23,369 | ) |
| 109,357 | |
| 126,886 | |
| (24,805 | ) |
| 102,081 | | ||||||
Revolving credit facility |
| 10,002 | |
| - | |
| 10,002 | |
| - | |
| - | |
| - | | ||||||
Long-term debt, including current installments |
| 5,205 | |
| - | |
| 5,205 | |
| 4,734 | |
| - | |
| 4,734 | | ||||||
Total stockholders' equity |
| 69,493 | |
| (34,404 | ) |
| 35,089 | |
| 75,196 | |
| (31,017 | ) |
| 44,179 | | ||||||
|
| 2011 |
|
|
| ||||||||||
|
| As Reported |
| Adjustments |
| As Restated |
|
|
| ||||||
|
|
|
| (Unaudited) |
| (Unaudited) |
|
|
| ||||||
|
| (dollars in thousands) |
|
|
| ||||||||||
Amounts due from franchisees and area developers, net of allowances |
| $ | 101,958 | |
| $ | (33,762 | ) |
| $ | 68,196 | |
|
|
|
Property, equipment and software, net |
| 18,228 | |
| - | |
| 18,228 | |
|
|
| |||
Total assets |
| 147,793 | |
| (31,700 | ) |
| 116,093 | |
|
|
| |||
Revolving credit facility |
| - | |
| - | |
| - | |
|
|
| |||
Long-term debt, including current installments |
| 4,458 | |
| - | |
| 4,458 | |
|
|
| |||
Total stockholders' equity |
| 84,127 | |
| (32,109 | ) |
| 52,018 | |
|
|
| |||
The adjustments reflected in the table above include:
• | Adjustments to amounts due from franchisees and area developers, net of allowances, to present notes receivable net of unrecognized revenue and changes to the allowance for doubtful accounts due to changes in our franchise fee revenue recognition policy. |
• | Adjustments to total assets include those noted above in addition to changes in deferred income taxes to reflect the impact of the restatement adjustments and to goodwill and other intangibles, related to the revised purchase price allocation methodology for assets acquired from franchisees. |
• | Adjustments to stockholders' equity reflect the cumulative impact of all of the restatement adjustments. |
Adjusted EBITDA
To provide additional information regarding our financial results, we have disclosed in the table above and within this annual report Adjusted EBITDA. Adjusted EBITDA represents net income, before income taxes, interest expense, depreciation and amortization and certain other items specified below. We have provided a reconciliation below of Adjusted EBITDA to net income, the most directly comparable GAAP financial measure.
We have included Adjusted EBITDA in this annual report because we seek to manage our business to achieve higher levels of Adjusted EBITDA and to improve the level of Adjusted EBITDA as a percentage of revenue. In addition, it is a key basis upon which we assess the performance of our operations and management. We also use Adjusted EBITDA for business planning and the evaluation of acquisition opportunities. In particular, the exclusion of certain expenses in calculating Adjusted EBITDA can provide a useful measure for period-to-period comparisons. We believe the presentation of Adjusted EBITDA enhances an overall understanding of the financial performance of and prospects for our business. Adjusted EBITDA is not a recognized financial measure under GAAP, and may not be comparable to similarly titled measures used by other companies in our industry. Adjusted EBITDA should not be considered in isolation from or as an alternative to net income, operating income (loss) or any other performance measures derived in accordance with GAAP.
The following table presents a reconciliation of Adjusted EBITDA for each of the periods indicated:
43
Table of Contents
|
| Fiscal Years Ended April 30, | ||||||||||||||||||
|
| 2009 |
| 2010 |
| 2011 |
| 2012 |
| 2013 | ||||||||||
|
| As Restated(1) |
| As Restated(1) |
| As Restated(1) |
| As Restated(1) |
|
| ||||||||||
|
| (dollars in thousands) | ||||||||||||||||||
Reconciliation of Adjusted EBITDA to Net Income |
|
|
|
|
|
|
|
|
|
| ||||||||||
Net income |
| $ | 13,157 | |
| $ | 14,389 | |
| $ | 14,670 | |
| $ | 16,383 | |
| $ | 17,627 | |
Interest expense |
| 1,769 | |
| 1,947 | |
| 1,954 | |
| 1,854 | |
| 2,039 | | |||||
Income tax expense |
| 9,427 | |
| 8,657 | |
| 10,142 | |
| 9,747 | |
| 11,170 | | |||||
Depreciation, amortization and impairment charges |
| 4,806 | |
| 6,790 | |
| 5,439 | |
| 5,999 | |
| 6,538 | | |||||
Loss on discontinued use of software |
| - | |
| 5,570 | |
| - | |
| - | |
| - | | |||||
Foreign currency transaction (gain) loss |
| 451 | |
| (1,014 | ) |
| (75 | ) |
| (4 | ) |
| - | | |||||
Net gain on short-term investments |
| (762 | ) |
| (2,454 | ) |
| - | |
| - | |
| - | | |||||
Costs associated with postponed IPO |
| - | |
| - | |
| - | |
| 1,348 | |
| - | | |||||
Restructuring charge |
| - | |
| - | |
| - | |
| - | |
| 425 | | |||||
Litigation settlement |
| 1,557 | |
| 43 | |
| (56 | ) |
| (239 | ) |
| 187 | | |||||
Stock-based compensation expense related to conversion from equity to liability instrument |
| - | |
| - | |
| - | |
| - | |
| 2,625 | | |||||
Stock-based compensation expense |
| 1,055 | |
| 1,000 | |
| 1,494 | |
| 1,429 | |
| 1,496 | | |||||
Adjusted EBITDA |
| $ | 31,460 | |
| $ | 34,928 | |
| $ | 33,568 | |
| $ | 36,517 | |
| $ | 42,107 | |
_______________________________________________________________________________
(1) See "Explanatory Note Regarding Restatement" and Note 19 to the Consolidated Financial Statements in Item 15, for a discussion of corrections reflected in these restated numbers for fiscal 2011, 2012 and 2013. Amounts for fiscal 2009 and 2010 are restated as explained elsewhere in this Item 6.
Item 7. Management's Discussion and Analysis of Financial Condition and Results of Operations.
Restatement
As previously reported, on August 1, 2013, the Audit Committee of our Board of Directors determined that the previously issued consolidated financial statements contained in the 2012 Annual Report, and in our quarterly reports on Form 10-Q for the subsequent fiscal quarters ended July 31, 2012, October 31, 2012 and January 31, 2013, should no longer be relied upon and would be restated. The Restatement determination was made following the Audit Committee's review of our internal accounting policies with respect to revenue recognition and business combination accounting, and was based on the recommendation of management, and after consultation with our independent registered public accounting firm.
Specifically, the following financial information was restated as a result of the Restatement:
• | our consolidated balance sheet as of April 30, 2012 and the consolidated statements of income, stockholders' equity, comprehensive income and cash flows for the fiscal years ended April 30, 2012 and 2011; and |
• | our unaudited quarterly financial information for the first three quarters of fiscal 2013 and each quarter in our fiscal year ended April 30, 2012. |
The Restatement involved adjustments primarily related to the following areas:
• | We determined that our AD agreements do not constitute a franchise relationship for accounting purposes. Therefore, instead of recording revenue at the inception of the AD relationship under franchise accounting, we now record these fees over the life of the AD agreement, which is typically ten years. Additionally, our consolidated financial statements now show the portion of franchise fees and royalties that the AD is entitled to receive from us in our revenue captions, with an equal amount of expense shown in a new operating expense caption as area developer expense. These amounts were previously presented on a net basis. |
• | We changed our revenue recognition policy for franchise fees to record revenue as amounts are received from the franchisee. Previously, we generally recorded these revenues at the time of sale, net of expected note cancellations related to the amount financed. Therefore, under the new revenue recognition policy any portion of franchise fees that is financed is only reflected as revenue when the note payments are made. |
44
Table of Contents
• | We also revised our methodology for the allocation of the purchase price associated with the acquisitions of businesses from franchisees. Historically, we allocated the entire purchase price to an identifiable intangible asset denominated as customer list. The new methodology allocates the purchase price to all identifiable intangible assets, which consist of reacquired rights and customer list. Any unallocated purchase price is recorded as goodwill. |
In general, the Restatement had the effect of shifting revenue and profits from periods prior to 2013 to future periods, and in future periods, revenue from the sale of AD territories and most franchise territories will likewise be recognized over a greater number of years, resulting in the recognition of less current revenue related to those sales in the years in which the sales occur than would have been recognized without the Restatement.
The following items are not affected by the Restatement:
• | The Restatement does impact actual cash received or the reported cash balances for any of the Restated Periods. |
• | The Restatement does not impact the receipt of the total reported revenue, but instead changes the time periods over which the revenue was recognized. |
Management's discussion and analysis of the Company's financial condition and the results of its operations included in this Item 7 reflect the restatements, amendments and adjustments made to certain financial information and other disclosures, as applicable, as a result of the Restatement.
For more information regarding the Restatement and related matters, refer to the "Explanatory Note Regarding Restatement" and Notes 18 and 19 to our Consolidated Financial Statements included in this annual report, as well as the following items of this annual report: "Item 1A-Risk Factors", "Item 6-Selected Financial Data", "Item 7-Management's Discussion and Analysis of Financial Condition and Results of Operations" and "Item 9A-Controls and Procedures".
Overview
We are one of the leading providers of tax preparation services in the United States and Canada. As measured by both the number of returns prepared and the number of retail offices, we are the third largest and fastest growing national retail preparer of individual tax returns in the United States and the second largest retail preparer of individual tax returns in Canada. From 2001 through 2013 , we have grown the number of U.S. tax returns prepared in our offices from approximately 137,000 to 1.8 million . Our tax preparation services and related tax settlement products are offered primarily through franchised locations, although we operate a limited number of company-owned offices each tax season. All of the offices are operated under the Liberty Tax Service brand.
From 2001 through 2013 , we grew our number of tax offices from 508 to more than 4,500. We and our franchisees operated 4,262 offices in the United States during the 2013 tax season, an 8.7% increase over the 2012 tax season, when we operated 3,920 offices, which was itself a 9.2% increase over the number of offices operated in the 2011 tax season. Approximately 61% of our revenue for fiscal year 2013 was derived from franchise fees, area developer fees, royalties and advertising fees, and for this reason, continued growth in and seasoning of our franchise locations is viewed by management as the key to our future performance.
Our revenue primarily consists of the following components:
• | Royalties: We earn royalty revenue from our franchisees. Our franchise agreement requires franchisees to pay us a base royalty equal to 14% of the franchisee's tax preparation revenue, subject to certain specified minimums. Franchisees acquiring territories under our "zero franchise fee" alternative are required to pay us franchise royalties of 25% through their first five tax seasons, and thereafter 14% of their tax preparation revenue. Over time, as our offices continue to "season," we expect that our growth in revenue from royalties will continue to outpace our growth in revenue from franchise fees. We also expect to see steadier growth from our royalty revenue, but our franchise fee revenue may decrease if franchisees choose our "zero franchise fee" alternative. |
Our reported royalties and advertising fees revenue includes the portion of royalties that is paid to us by franchisees but that is contractually due to ADs under our area developer agreements. The amount of royalties due to area developers is recorded as an expense. In fiscal 2013, the amount of royalties due to area developers was $21.5 million.
• | Franchise Fees: Our standard franchise fee per territory is $40,000 and we offer our franchisees flexible structures and financing options for franchise fees. Franchise fee revenue is recognized when our obligations to prepare the franchisee for operation are substantially complete and as cash is received. However, in 2011 we introduced a franchise fee option that forgoes the initial franchise fee payment in favor of a higher royalty rate. See "Item 1-Business-Liberty's Franchise Model." The franchise fee revenue we report includes the portion of franchise fees received by us from |
45
Table of Contents
franchisees but contractually due to area developers. The amount of franchise fees due to area developers is recorded as an expense. In fiscal 2013, the amount of franchise fees due to area developers was $3.2 million.
As described elsewhere in this annual report, we recently revised our accounting policies to change the way in which we recognize franchise fee revenue, but the effect of these changes may be to make it more difficult to discern trends in our franchise sales. We finance a portion of the franchise fee for many of the new territories that we sell, and for that reason, the franchise fee revenue that we recognize will often be spread over the typical four year term of the financing. For this reason, significant increases or reductions in franchise sales from year to year will not necessarily be fully reflected in the revenue that we receive during the year of sale, while each year, franchise revenue recognized in the earliest year in that four year cycle will be replaced by revenue recognized during the current year. We discuss our franchise sales performance for the years addressed by this annual report elsewhere in this annual report, and will highlight material sales trends that we observe even when those trends are not immediately shown in our current period financial results.
• | Area Developer Fees: Our fees for AD areas vary based on our assessment of the revenue potential of each AD area, and also depend on the performance of any existing franchisees within the AD area being sold. Our ADs generally receive 50% of both the franchise fees and royalties derived from territories located in their area. Area development fees received are recognized as revenue on a straight-line basis over the initial contract term of each Area Developer agreement with the cumulative amount of revenue recognized not to exceed the amount of cash received. See "Item 1-Business-Liberty's Franchise Model." |
As with our franchise sales, we have recently revised our policies for the way in which we account for the sales of area developer territories. Because we have determined that area developer agreements are not franchise transactions for accounting purposes, we amortize our revenue from area developer sales over the length of our area developer agreements, which are typically ten years. For this reason, significant year-to-year trends in our area development sales activity are apparent from our comparative financial results only to the extent that the most recent year is so anomalous as to result in a significant variation in recognized area developer revenue. We describe our area developer sales in the periods covered by this annual report elsewhere in this report, and will identify trends in these sales even where they do not represent a material year-to-year difference for purposes of area developer revenue recognition.
We do expect new area developer sales to become a less significant source of new revenue as we continue to build out our franchise network and have less need to utilize ADs to support that effort.
• | Advertising Fees: We earn advertising fee revenue from our franchisees. Our franchise agreement requires all franchisees to pay us an advertising fee of 5% of the franchisee's tax preparation revenue, which we use primarily to fund collective advertising efforts. |
• | Financial Products: We offer two types of tax settlement financial products: "refund transfer" products, such as ERCs, which involve providing a means by which a customer may receive his or her refund more quickly and conveniently, and other tax settlement products, such as ICA refund-based loans. We earn fees from the use of these financial products. During the 2013 tax season ICAs were available in our offices in 27 states, but because of regulatory considerations, the third-party lender that offers the ICAs may not be able to expand the ICA program much further. See "Item 1-Business-Tax Preparation in the Liberty System." However, we believe the negative effect of fewer refund-based loans will be offset by two factors. First, we believe that most customers who previously would have obtained loans have elected to purchase a refund transfer product, and that the continued availability of these products will enable us to experience similar tax settlement product "attachment rates" as in prior years. Second, as we continue to offer more of our financial products through our JTH Financial subsidiary, we expect to be able to realize more of the fee income associated with tax settlement products (although we will also incur greater expenses in connection with offering the products). |
• | Interest Income: We earn interest income from our franchisees and ADs related to both indebtedness for the unpaid portions of their franchise fees and AD territory fees, and for other loans we extend to our franchisees related to the operation of their territories. For franchise fees and AD loans upon which the underlying revenue has not been recognized, we recognize the interest income only to the extent of actual payment. |
• | Tax Preparation Fees: We also earn tax preparation revenue directly from both the operation of company-owned offices and the provision of tax preparation services through our eSmartTax online product. |
For purposes of this section and throughout this annual report, all references to "fiscal 2013 ," "fiscal 2012 ," and "fiscal 2011 " refer to our fiscal years ended April 30, 2013 , 2012 , and 2011 , respectively. For purposes of this section and throughout this annual report, all references to "year" or "years" are the respective fiscal year or years ended April 30 unless otherwise noted
46
Table of Contents
|
| Fiscal Years Ended and as of April 30, | ||||||||||
|
| 2011 |
| 2012 |
| 2013 | ||||||
|
| As Restated |
| As Restated |
|
| ||||||
|
| (dollars in thousands, except net average fee per tax return prepared, systemwide revenue per office and fees per tax return) | ||||||||||
Results of Operations: |
|
|
|
|
|
| ||||||
Total revenue |
| $ | 117,936 | |
| $ | 131,225 | |
| $ | 147,613 | |
Operating income |
| $ | 26,691 | |
| $ | 27,980 | |
| $ | 30,836 | |
Net income |
| $ | 14,670 | |
| $ | 16,383 | |
| $ | 17,627 | |
Other Financial and Operational Data: |
|
|
|
|
|
| ||||||
Franchisees |
| 1,941 | |
| 2,098 | |
| 2,211 | | |||
Number of franchised offices |
| 3,790 | |
| 4,089 | |
| 4,259 | | |||
Number of company-owned offices |
| 55 | |
| 94 | |
| 261 | | |||
Tax returns processed |
| 2,044,000 | |
| 2,188,000 | |
| 2,275,000 | | |||
Net average fee per tax return prepared in our offices |
| $ | 174 | |
| $ | 173 | |
| $ | 180 | |
Systemwide revenue |
| $ | 338,600 | |
| $ | 359,100 | |
| $ | 381,200 | |
Systemwide revenue per office |
| $ | 88,062 | |
| $ | 85,847 | |
| $ | 84,336 | |
Customers obtaining financial products |
| 902,000 | |
| 922,000 | |
| 973,000 | | |||
In evaluating our performance, our management focuses on several metrics that we believe are key to our continued success:
• | Net growth in office locations. Our growth in office locations from year to year is a function of the opening of new offices, offset by locations that our franchisees or we close from year to year. Changes in the number of our offices are a function of both the sale of new territories and the opening of offices in previously sold territories. In fiscal 2013 , our franchisees acquired 405 new territories in the U.S. in which new offices were open for the 2013 tax season (compared to 428 such offices in fiscal 2012 ), and opened an additional 346 offices in U.S. territories that had been sold in prior years. We also operated 167 more company-owned offices in fiscal 2013 than in fiscal 2012, which was largely a consequence of our decision relatively late in the franchise sales season to commit to open tax kiosks in Walmart stores. We operated 155 such kiosks in Walmart stores during the 2013 tax season as company-owned offices. Our net increase in US offices of 342 reflects the fact that because of franchise terminations and other reasons, 409 offices that operated in the 2012 tax season were closed before the 2013 season. However, for the 2014 tax season, we expect to add fewer new franchisees than in prior seasons because the need to restate our financial statements prevented us from engaging in franchise sales activity for more than a month during our peak franchise sales season. |
We also utilize our AD program to focus on areas with large underdeveloped groups of territories we believe would benefit from the dedicated sales attention that an AD brings to our franchise sales process. Although we intend to grow our franchise network through the sale of new AD areas, opportunities often arise to acquire underperforming AD areas or AD areas in more mature markets at favorable terms, offering us better future profitability from the associated franchise locations as a consequence of repurchasing the area rights of those ADs. Moreover, we believe that we will sell fewer ADs in future periods as we build out our franchise network and have less need for a substantial number of new ADs.
• | Growth in the number of returns prepared. We strive to provide our franchisees with the resources and training needed to grow their own revenue, and one of the principal factors in that growth is growth in the number of returns prepared. We and our franchisees prepared a total of approximately 1.8 million returns in our U.S. offices in the 2013 tax season, which was an increase of 1% from the 2012 tax season. Our new retail offices typically experience their most rapid growth during their first five years as they develop customer loyalty, operational experience and a referral base within their community. The seasoning of our U.S. offices shown in the following table highlights the relative young age and majority of our offices, with 2,471 offices of 4,262 operated during tax season 2013 having been operated for five or fewer years, including the 2013 tax season. |
47
Table of Contents
| Tax Season 2013 Office Age in Years | |||||||||||||||||||
| 1 |
| 2 |
| 3 |
| 4 |
| 5 |
| 6+ |
| Total | |||||||
United States |
|
|
|
|
|
|
|
|
|
|
|
|
| |||||||
Franchised storefronts | 402 | |
| 481 | |
| 351 | |
| 427 | |
| 350 | |
| 1,706 | |
| 3,717 | |
Franchised kiosks | 206 | |
| 34 | |
| 22 | |
| 13 | |
| 10 | |
| 26 | |
| 311 | |
Total franchised offices | 608 | |
| 515 | |
| 373 | |
| 440 | |
| 360 | |
| 1,732 | |
| 4,028 | |
|
|
|
|
|
|
|
|
|
|
|
|
| | |||||||
Company-owned storefronts | - | |
| 3 | |
| 2 | |
| 12 | |
| 3 | |
| 57 | |
| 77 | |
Company-owned kiosks | 155 | |
| - | |
| - | |
| - | |
| - | |
| 2 | |
| 157 | |
Total company-owned offices | 155 | |
| 3 | |
| 2 | |
| 12 | |
| 3 | |
| 59 | |
| 234 | |
Total U.S. offices | 763 | |
| 518 | |
| 375 | |
| 452 | |
| 363 | |
| 1,791 | |
| 4,262 | |
|
|
|
|
|
|
|
|
|
|
|
|
| | |||||||
Canada | 31 | |
| 15 | |
| 9 | |
| 6 | |
| 2 | |
| 195 | |
| 258 | |
Total Offices | 794 | |
| 533 | |
| 384 | |
| 458 | |
| 365 | |
| 1,986 | |
| 4,520 | |
• | Growth in systemwide revenue. We earn most of our revenue from franchise fees, AD fees, royalties and advertising fees. Therefore, the growth in systemwide revenue, which represents total revenue of our franchised and company-owned offices is not a direct measure of our performance. However, because our royalty revenue is derived from systemwide revenue, and because our cost structure is based on maintaining resources to support a franchise system, we believe that this information is important in obtaining an understanding of our financial performance. We believe systemwide revenue information aids in understanding how we derive royalty revenue, assists readers in evaluating our performance relative to competitors, indicates the strength of our franchised brand and demonstrates increases in recurring royalty revenue. |
Our systemwide revenue grew by 6.2% from fiscal 2012 to 2013 , and 6.1% from fiscal 2011 to fiscal 2012 . This increase in both years was the result of the continued seasoning of newer offices, and of the additional offices added for the more recent tax season. Additionally, we experienced a 4% increase in average net fee per return from $173 in fiscal 2012 to $180 in fiscal 2013.
• | Growth in the number of tax settlement products obtained by customers in Liberty Tax offices. As we describe elsewhere in this annual report, we and our competitors face a challenging legal and regulatory environment with respect to the types and characteristics of the financial products we can enable our franchised and company-owned offices to make available to their customers. The availability of products in our offices drives customer loyalty and word of mouth referrals, and it is important that we give customers who view our services as an alternative to the lengthy process of receiving a tax refund by mail a full range of appropriate and competitive choices. |
Although we have faced and expect to continue to confront challenges in connection with tax settlement products, we do not anticipate that, absent new regulations or restrictions, additional changes will substantially affect the revenue we derive from financial products. We have observed that as RALs became more difficult to obtain, customers continued to desire other refund-based products, and tended to move from loan-based products to refund transfer products such as ERCs. For example, the total percentage of our U.S. customers obtaining a RAL, another loan-based product or an ERC remained stable at 53.9% in the 2013 tax season compared to 51.5% in the 2012 tax season, and 54.4% during the 2011 tax season, even as the percentage of customers receiving RALs decreased and then RALs ceased to exist after the 2012 tax season. Although ICA loans have been utilized by our customers that product represented only 2.3% of our U.S. customers in fiscal 2013. Furthermore, we are increasingly utilizing our subsidiary, JTH Financial, to offer tax settlement products in certain of our offices through contractual arrangements with new financial product providers. We expect to grow that business, which we expect to enable us to ameliorate some of the less favorable economic terms we receive from our traditional providers by allowing us to receive fees associated with the products offered through JTH Financial. Our use of JTH Financial does involve increased costs in the form of technology and other administrative costs, but our fee structure for tax settlement products should allow us to absorb those costs without any material adverse effect on our operating results. In the 2013 tax season, for example, the share of ERCs offered through our JTH Financial subsidiary increased to 51.2% of the total ERCs utilized by our customers, compared to 20.6% in the 2012 tax season and 3.6% in the 2011 tax season. For a discussion of the risks attendant to our financial products, see "Item 1A-Risk Factors-Risks Related to Regulation of Our Industry."
The Company anticipates that beginning at some point in fiscal 2014, it will place its NextGen software into service, and when that occurs, it will begin to depreciate the capital expenditures in connection with that software project over the
48
Table of Contents
ensuing five years. This expected change in depreciation expense may constitute a trend that should be understood by those reviewing our financial statements. We completed the recognition of depreciation expense for our proprietary LibTax software during fiscal 2013, but will not be recognizing any depreciation expense for our proprietary tax software until the third quarter of fiscal 2014, when the NextGen software is expected to be placed into service. Given the capital expenditures we have made in the NextGen software to date, and our anticipated expenditures to completion of the project, we believe that the depreciation expense that we will recognize beginning late in the third quarter of fiscal 2014 will materially exceed the amounts of depreciation we previously recognized in connection with the LibTax software. The amount of depreciation we will recognize in each period after the NextGen software is placed into service will depend on the final amount of capital expenditures on that project, and that amount has not yet been established.
Results of Operations
Fiscal year 2013 compared to fiscal year 2012
Revenues. The table below sets forth the components and changes in our revenue for the years ended April 30, 2013 and 2012 .
|
| Fiscal Years Ended April 30, | |||||||||||||
|
|
|
|
|
| Change | |||||||||
|
| 2012 |
| 2013 |
| $ |
| % | |||||||
|
| As Restated |
|
|
|
|
|
| |||||||
|
| (dollars in thousands) | |||||||||||||
Franchise fees |
| $ | 7,996 | |
| $ | 8,721 | |
| $ | 725 | |
| 9 | % |
Area developer fees |
| 6,702 | |
| 7,699 | |
| 997 | |
| 15 | % | |||
Royalties |
| 53,922 | |
| 56,121 | |
| 2,199 | |
| 4 | % | |||
Advertising fees |
| 16,094 | |
| 17,008 | |
| 914 | |
| 6 | % | |||
Financial products |
| 22,903 | |
| 30,345 | |
| 7,442 | |
| 32 | % | |||
Interest income |
| 12,406 | |
| 13,848 | |
| 1,442 | |
| 12 | % | |||
Tax preparation fees, net of discounts |
| 7,026 | |
| 10,148 | |
| 3,122 | |
| 44 | % | |||
Other |
| 4,176 | |
| 3,723 | |
| (453 | ) |
| (11 | )% | |||
Total revenues |
| $ | 131,225 | |
| $ | 147,613 | |
| $ | 16,388 | |
| 12 | % |
Our total revenues increased by 12% in fiscal 2013 primarily due to a 32% increase in financial products revenue, a 44% increase in tax preparation fees, a 4% increase in royalties and a 12% increase in interest income.
The substantial increase in financial products revenue was driven by the continuing growth of our subsidiary, JTH Financial, and the fact that we originated 56% of our customer's tax settlement products through this subsidiary in fiscal 2013 as compared to 21% in fiscal 2012 .
The increase in tax preparation fees was due to our operation of 167 additional company-owned offices in 2013 , as compared to 2012 , primarily in order to fulfill our obligations under our new Walmart relationship. We also experienced a 41% increase in the number of online returns prepared, due in part to our acquisition of certain assets from an online provider. The incremental tax preparation fees attributable to that acquisition represented $1.4 million of the $3.1 million increase in tax preparation fees from fiscal 2012 to fiscal 2013.
The 4% increase in royalties, as well as 6% increase in advertising fees, reflected the 6.2% increase in our systemwide revenue in fiscal 2013, which was attributable both to growth in the number of offices and increased productivity in the offices.
We also experienced a 12% increase in our interest income in fiscal 2013 , reflecting additional lending we made to our franchisees and ADs for the acquisition of territories and areas, and to our franchisees for working capital purposes.
Operating expenses. The following table details the amounts and changes in our operating expenses in and from fiscal 2013 and fiscal 2012 .
49
Table of Contents
|
| Fiscal Years Ended April 30, | |||||||||||||
|
|
|
|
|
| Change | |||||||||
|
| 2012 |
| 2013 |
| $ |
| % | |||||||
|
| As Restated |
|
|
|
|
|
| |||||||
|
| (dollars in thousands) | |||||||||||||
Employee compensation and benefits |
| $ | 29,802 | |
| $ | 35,373 | |
| $ | 5,571 | |
| 19 | % |
Stock-based compensation expense due to conversion from equity to liability instrument |
| - | |
| 2,625 | |
| 2,625 | |
| NM | | |||
Advertising |
| 15,346 | |
| 15,293 | |
| (53 | ) |
| - | % | |||
General and administrative |
| 26,878 | |
| 31,212 | |
| 4,334 | |
| 16 | % | |||
Area developer expense |
| 23,872 | |
| 25,736 | |
| 1,864 | |
| 8 | % | |||
Costs associated with postponed IPO |
| 1,348 | |
| - | |
| (1,348 | ) |
| NM | | |||
Depreciation, amortization and impairment charges |
| 5,999 | |
| 6,538 | |
| 539 | |
| 9 | % | |||
Total operating expenses |
| $ | 103,245 | |
| $ | 116,777 | |
| $ | 13,532 | |
| 13 | % |
Our total operating expenses increased by $13.5 million in fiscal 2013 compared to fiscal 2012, representing a 13% increase. A significant portion of the increase, approximately $1.9 million, may be attributed to costs associated with being a public company that were not incurred in 2012. On a more specific basis, the largest components of this increase were:
• | A 19% increase in employee compensation and benefits primarily attributable to the addition of corporate personnel to support the anticipated growth in the number of offices and our becoming a public company, as well as the additional personnel hired to run 167 additional company-owned offices. |
• | A $2.6 million one-time charge to stock-based compensation expense because t he settlement of certain stock option transactions triggered a change in the classification of the related outstanding stock options from an equity instrument to a liability instrument. |
• | A 16% increase in general and administrative expenses, caused primarily by the following: |
◦ | A $1.7 million increase in rent and utility costs to support the increase in company-owned offices; |
◦ | A $1.4 million increase in computer supply and software expense largely due to the increase in our online tax return volume, causing our licensing fee for our online software to be $0.6 million higher. Additionally, our expenses for subscriptions to software as a service related to the use of electronic signatures for customer documents increased because we implemented an electronic signature initiative; |
◦ | A $1.3 million increase in bad debt expense based on our assessment of the appropriate level of the allowance for doubtful accounts; |
◦ | A $0.6 million increase in travel expense for costs primarily related to attracting new franchisees, training existing and new franchisees, and travel to support the increased number of company-owned offices; and |
◦ | An increase in the cost of our ERC programs of $1.3 million which is a result of the increase in the number of tax settlement products originated through JTH Financial in 2013 as compared to 2012. |
These increases were partially offset by a decrease of $3.5 million because we restructured our financial products program for the 2013 tax season to eliminate a franchisee rebate on ERCs (rebate expense was recorded in fiscal 2012) and because of a difference in our contract with the non-bank lender for the ICA program. For 2013, ICA program expenses are shown as a reduction in the related revenue instead as an expense, as in fiscal 2012.
• | An 8% increase in area developer expense primarily related to increases in franchise fee and royalty revenues generated in territories in AD areas. |
• | The non-recurrence in fiscal 2013 of the $1.3 million in one-time costs associated with the postponed IPO that occurred in fiscal 2012 offset some of the increase in operating expenses. |
50
Table of Contents
Income Taxes. The following table sets forth certain information regarding our income taxes for the fiscal years ended April 30, 2012 and 2013 .
|
| Fiscal Years Ended April 30, | |||||||||||||
|
|
|
|
|
| Change | |||||||||
|
| 2012 |
| 2013 |
| $ |
| % | |||||||
|
| As Restated |
|
|
|
|
|
| |||||||
|
| (dollars in thousands) | |||||||||||||
Income before income taxes |
| $ | 26,130 | |
| $ | 28,797 | |
| $ | 2,667 | |
| 10 | % |
Income tax expense |
| 9,747 | |
| 11,170 | |
| 1,423 | |
| 15 | % | |||
Effective tax rate |
| 37.3 | % |
| 38.8 | % |
|
|
|
| | ||||
The increase in our income tax expense from fiscal 2012 to fiscal 2013 relates not only to an increase in income, but also to an increase in our effective tax rate due to a decrease in allowable tax credits and an increase in our state tax rate.
Net income. Our net income increased by 8% in fiscal 2013, reflecting an increase in operating income of 10% coupled with a less favorable effective tax rate.
Fiscal year 2012 compared to fiscal year 2011
Revenues. The table below sets forth the components and changes in our revenue for the years ended April 30, 2012 and 2011.
|
| Fiscal Years Ended April 30, | |||||||||||||
|
|
|
|
|
| Change | |||||||||
|
| 2011 |
| 2012 |
| $ |
| % | |||||||
|
| As Restated |
| As Restated |
|
|
|
| |||||||
|
| (dollars in thousands) | |||||||||||||
Franchise fees |
| $ | 8,780 | |
| $ | 7,996 | |
| $ | (784 | ) |
| (9 | )% |
Area developer fees |
| 6,335 | |
| 6,702 | |
| 367 | |
| 6 | % | |||
Royalties |
| 50,559 | |
| 53,922 | |
| 3,363 | |
| 7 | % | |||
Advertising fees |
| 15,623 | |
| 16,094 | |
| 471 | |
| 3 | % | |||
Financial products |
| 16,507 | |
| 22,903 | |
| 6,396 | |
| 39 | % | |||
Interest income |
| 11,322 | |
| 12,406 | |
| 1,084 | |
| 10 | % | |||
Tax preparation fees, net of discounts |
| 4,789 | |
| 7,026 | |
| 2,237 | |
| 47 | % | |||
Other |
| 4,021 | |
| 4,176 | |
| 155 | |
| 4 | % | |||
Total revenues |
| $ | 117,936 | |
| $ | 131,225 | |
| $ | 13,289 | |
| 11 | % |
Our total revenues increased by 11% in fiscal 2012, primarily due to a 39% increase in financial products revenue, a 47% increase in tax preparation fees, a 7% increase in royalties and a 10% increase in interest income. The substantial increase in financial products revenue was driven by the continuing growth of our subsidiary JTH Financial, and the fact that we originated substantially more of our customer's tax settlement products through this subsidiary in fiscal 2012 than in fiscal 2011. The change also incorporates the expansion of the ICA program to seven states during the 2012 tax season. The increase in tax preparation fees was a consequence of our operation of more company-owned offices in 2012 than in 2011. The increase in royalties fees was caused primarily by continued growth in our number of offices open for the 2012 tax season and the number of returns prepared by those offices. The increase in our interest income in fiscal 2012, reflects an increase in franchisee and area developer loan balances.
Operating expenses. The following table details the amounts and changes in our operating expenses in and from fiscal 2012 and fiscal 2011.
51
Table of Contents
|
| Fiscal Years Ended April 30, | |||||||||||||
|
|
|
|
|
| Change | |||||||||
|
| 2011 |
| 2012 |
| $ |
| % | |||||||
|
| As Restated |
| As Restated |
|
|
|
| |||||||
|
| (dollars in thousands) | |||||||||||||
Employee compensation and benefits |
| $ | 25,162 | |
| $ | 29,802 | |
| $ | 4,640 | |
| 18 | % |
Advertising |
| 15,078 | |
| 15,346 | |
| 268 | |
| 2 | % | |||
General and administrative |
| 22,472 | |
| 26,878 | |
| 4,406 | |
| 20 | % | |||
Area developer expense |
| 23,094 | |
| 23,872 | |
| 778 | |
| 3 | % | |||
Costs associated with postponed IPO |
| - | |
| 1,348 | |
| 1,348 | |
| NM | | |||
Depreciation, amortization and impairment charges |
| 5,439 | |
| 5,999 | |
| 560 | |
| 10 | % | |||
Total operating expenses |
| $ | 91,245 | |
| $ | 103,245 | |
| $ | 12,000 | |
| 13 | % |
Our total operating expenses increased by $12.0 million in fiscal 2012 compared to fiscal 2011, representing a 13% increase. The largest components of this increase were:
• | An 18% increase in employee compensation and benefits attributable to the addition of personnel due to an increase in company-owned offices from the prior year, additional staffing of JTH Financial, and the additional expenses associated with anticipating our becoming a public company. |
• | A 20% increase in general and administrative expenses, caused primarily by the following: |
◦ | A $1.4 million increase in professional fees related to legal and technology projects; |
◦ | A $2.3 million increase in costs associated with the expansion of JTH Financial; and |
◦ | A $0.8 million increase in rent and related costs to support an increase in company-owned offices. |
• | We also incurred charges of $1.3 million related to the expensing of legal, accounting and other professional costs associated with our planned IPO, which we determined to postpone in April 2012. |
Income Taxes. The following table sets forth certain information regarding our income taxes for the fiscal years ended April 30, 2011 and 2012.
|
| Fiscal Years Ended April 30, | |||||||||||||
|
|
|
|
|
| Change | |||||||||
|
| 2011 |
| 2012 |
| $ |
| % | |||||||
|
| As Restated |
| As Restated |
|
|
|
| |||||||
|
| (dollars in thousands) | |||||||||||||
Income before income taxes |
| $ | 24,812 | |
| $ | 26,130 | |
| $ | 1,318 | |
| 5 | % |
Income tax expense |
| 10,142 | |
| 9,747 | |
| (395 | ) |
| (4 | )% | |||
Effective tax rate |
| 40.9 | % |
| 37.3 | % |
|
|
|
| | ||||
The decrease in our income tax expense and our effective tax rate from fiscal 2011 to fiscal 2012 was primarily a result of a research credit related to our software development projects.
Net income. Our net income increased by 12% in fiscal 2012, reflecting an increase in operating income of 5% and a more favorable effective tax rate.
Liquidity and Capital Resources
Overview of factors affecting our liquidity
Seasonality of cash flow. Our tax return preparation business is seasonal, and most of our revenues and cash flow are generated during the period from early February through April 30. Following each tax season, from May 1 through early February of the following year, we rely significantly on excess operating cash flow from the previous season, from cash payments made by franchisees and ADs who purchase new territories and areas prior to the next tax season and make cash payments in connection with those purchases, and on the use of our credit facility to fund our operating expenses and invest in
52
Table of Contents
the future growth of our business. Our business has historically generated a strong operating cash flow from operations on an annual basis. We devote a significant portion of our cash resources during the off season to finance the working capital needs of our franchisees. We have also been incurring significant expenditures in the development of our NextGen project.
Credit facility. In February 2008, JTH Tax, Inc. entered into a revolving credit facility. This revolving credit facility, which provided for maximum allowable borrowings of $125.0 million, was replaced effective April 30, 2012 with a new credit facility that consists of a $25.0 million term loan and a $105.0 million revolving credit facility with an accordian feature permitting the Company to request an increase in availability of up to $70.0 million. The term loan amortizes on a quarterly basis and matures on April 30, 2017, and the revolving loan also expires on April 30, 2017. On December 28, 2012, the Company utilized the accordion feature of the revolving loan, increasing the maximum borrowings under that portion of our credit facility by $38.4 million to $143.4 million . The outstanding borrowings on both loans accrue interest at an adjusted one month LIBOR rate plus a margin that varies from 1.50% to 2.25% (an increase of 25 basis points from our previous revolving credit facility), depending on our leverage ratio. The interest rate at April 30, 2013 was 1.95% . This indebtedness is collateralized by substantially all of our assets, including the assets of our subsidiaries.
Under our credit facility, we are subject to a number of covenants that could potentially restrict how we carry out our business, or that require us to meet certain periodic tests in the form of financial covenants. The restrictions we consider to be material to our ongoing business include the following:
• | We must satisfy a "leverage ratio" test that is based on our outstanding indebtedness at the end of each fiscal quarter. |
• | We must satisfy a "fixed charge coverage ratio" test at the end of each fiscal quarter. |
• | We must reduce the outstanding balance under our revolving loan to zero for a period of at least 45 consecutive days each fiscal year. |
In addition, were we to experience certain types of changes in control affecting Mr. Hewitt's continuing control of us, or certain changes to the composition of our Board of Directors, we might become subject to an event of default under our credit facility, which could result in the acceleration of our obligations under that facility.
Our credit facility also contains customary affirmative and negative covenants, including limitations on indebtedness, limitations on liens and negative pledges, limitations on investments, loans and acquisitions, limitations on mergers, consolidations, liquidations and dissolutions, limitations on sales of assets, limitations on certain restricted payments and limitations on transactions with affiliates, among others.
Franchisee lending and potential exposure to credit loss. A substantial portion of our cash flow during the year is utilized to provide funding to our franchisees and ADs. At April 30, 2013, our total balance of loans to franchises and ADs for working capital and equipment loans, representing cash amounts we had advanced to the franchisees and ADs, was $14.7 million. In addition, at that date, our franchisees and ADs together owed us an additional $77.6 million, net of unrecognized revenue of $39.7 million for unpaid amounts owed to us, typically representing the unpaid purchase price areas comprising clusters of territories, and other amounts owed to us for royalties and other unpaid amounts for which our franchisees and ADs had outstanding payment obligations.
Our actual exposure to potential credit loss associated with franchisee loans is less than the aggregate amount of those loans because a significant portion of those loans are to franchisees located within AD areas, where our AD is ultimately entitled to a substantial portion of the franchise fee and royalty revenues represented by some of these loans. For this reason, the amount of indebtedness of franchisees to us is effectively offset in part by our related payable obligation to ADs in respect of franchise fees and royalties. As of April 30, 2013, the total indebtedness of franchisees to us where the franchisee is located in an AD area was $53.9 million, but $ 18.2 million of that total indebtedness represents amounts ultimately payable to ADs as their share of franchise fees and royalties.
Our franchisees make electronic return filings for their customers utilizing our facilities. Our franchise agreements allow us to obtain repayment of amounts due to us from our franchisees through an electronic fee intercept program before our franchisees receive net proceeds of the tax preparation and other fees they have charged to their customers on tax returns associated with tax settlement products. Therefore, we are able to minimize the nonpayment risk associated with amounts outstanding to franchisees by obtaining direct electronic payment in the ordinary course throughout the tax season. Our credit risk associated with amounts outstanding to ADs is also mitigated by our electronic fee intercept program, which enables us to obtain repayments of amounts that would otherwise flow through to ADs as their share of franchisee fee and royalty payments, to the extent of an AD's indebtedness to us.
The unpaid amounts owed to us from our franchisees and ADs are collateralized by the underlying franchise or area and are guaranteed by the respective franchisee or AD and the related owner(s). Accordingly, to the extent a franchisee or AD does
53
Table of Contents
not satisfy its payment obligations to us, we may repossess the underlying franchise or area in order to resell it in the future. At April 30, 2013 , we had an investment in impaired accounts and notes receivable and related interest receivable of approximately $13.0 million . We consider accounts and notes receivable to be impaired if the amounts due exceed the fair value of the underlying franchise and estimate an allowance for doubtful accounts based on that excess. Amounts due include the recorded value of the accounts and notes receivable reduced by the allowance for uncollected interest, amounts due to ADs for their portion of franchisee receivables, any related deferred revenue and amounts owed to the franchisee or AD by us. In establishing the fair value of the underlying franchise, we consider net fees of open territories and the number of unopened territories. At April 30, 2013 , we recorded an allowance for doubtful accounts for impaired accounts and notes receivable of $6.1 million . There were no significant concentrations of credit risk with any individual franchisee or AD as of April 30, 2013 , and we believe that our allowance for doubtful accounts as of April 30, 2013 is adequate for our existing loss exposure. We closely monitor the performance of our franchisees and ADs, and will adjust our allowances as appropriate if we determine that the existing allowances are inadequate to cover estimated losses.
Restatement Costs. We currently estimate that the direct cost associated with the restatement of our financial statements will be approximately $700,000 to $850,000, and that we will incur and recognize those costs during fiscal 2014. We do not expect those costs to recur in future periods.
Dividends. We have never declared or paid a cash dividend on our capital stock. Although we may pay cash dividends in the future, the payment of dividends will be at the discretion of our Board of Directors and will depend, among other things, on our earnings, capital requirements and financial condition. Our ability to pay dividends will also be subject to compliance with the financial covenants that are contained in our credit facility and may be restricted by any future indebtedness that we incur or issuances of preferred stock. See "Item 5-Market for Registrant's Common Equity, Related Stockholder Matters and Issuer Purchases of Equity Securities."
Sources and uses of cash
Operating activities . In fiscal 2013, we generated $8.0 million more cash from operating activities compared to fiscal 2012. This increase was largely attributable to the following factors:
• | Higher financial product fee receipts of $9.9 million in 2013 compared to 2012 primarily because we originated more tax settlement products through JTH Financial in fiscal 2013 than in fiscal 2012; |
• | Higher tax preparation fees of $3.1 million due to operating more company-owned offices in 2013 than in 2012 and the large increase in the number of online returns; |
• | The non-recurrence, in fiscal 2013, of the $1.3 million in payments related to the postponed IPO in fiscal 2012. |
Some of the factors that partially offset our operating cash flows in fiscal 2013 were:
• | Higher payroll related payments of $6.0 million primarily attributable to the addition of corporate personnel to support the anticipated growth in the number of offices and our becoming a public company, costs related to staffing the additional company-owned offices and increased staffing to support the additional products sold through JTH Financial. |
• | Higher general and administrative payments of $4.0 million as we incurred more costs to support the increase in offices and franchisees, and company-owned offices, as compared to the prior year. |
In fiscal 2012, we generated $4.3 million less cash from operating activities compared to fiscal 2011. This decrease was largely attributable to the following factors:
• | Higher general and administrative payments of $7.5 million because we incurred more costs to support the increase in offices and franchises as compared to the prior year; |
• | Higher payroll-related payments of $4.6 million attributable to the addition of personnel due to an increase in company-owned and franchise offices from the prior year, additional staffing of JTH Financial, and the additional expenses associated with anticipating our becoming a public company. |
• | Higher financial product rebate payments of $2.1 million because we paid 2011 rebates in 2012, but substantially all of the fiscal 2010 financial product rebates had been paid prior to the end of 2010. This change in timing related to our determination that we should delay payment until we could assess our RAL guarantee obligation to Republic Bank for the 2011 tax season, which was the first season the debt indicator had become unavailable. |
• | Payments made of $1.3 million for costs related to the postponement of our initial public offering. |
• | Higher advertising payments of $0.9 million as we increased spending to the match the increase in advertising royalties. |
54
Table of Contents
Some of the factors that improved our operating cash flows in fiscal 2012 and partially offset the factors described above were:
• | Higher financial product fees of $4.7 million in 2012 compared to 2011 primarily because we offered more ERCs through JTH Financial, and ICAs were available in more offices, in fiscal 2012 than in fiscal 2011. |
• | Higher area developer fees of $2.4 million . |
• | Higher tax preparation fees of $2.2 million associated with operating more company-owned offices in 2012 than in 2011. |
• | Higher interest income of $1.3 million associated with an increase in amounts loaned to our franchisees for working capital needs and to purchase company-owned offices. |
• | Lower tax payments of $0.8 million. |
Investing activities. In fiscal 2013, we utilized $2.7 million more in cash for investing activities as compared to fiscal 2012. This increase was largely attributable to the following factors:
• | An increase of $3.0 million for the purchase of equity securities in a strategic business partner. |
• | An increase in purchases of property and equipment of $1.6 million, primarily attributable to an increase in software development costs related to our NextGen project and the purchase of a new corporate building. |
• | An increase of $1.2 million in the acquisition of assets from franchisees and area developers. |
The above uses of cash were offset partially by an increase of $1.9 million in the proceeds from the sale of customer lists and other assets, which was due to AD sales that occurred in 2013, but did not occur in 2012. Additionally, there was a $1.0 million equity investment in a software company that occurred in 2012 that did not recur in 2013.
In fiscal 2012, we utilized $7.0 million more in cash for investing activities as compared to fiscal 2011. This increase was largely attributable to the following factors:
• | An increase of $3.2 million in purchases of property and equipment, primarily attributable to an increase in software development costs primarily related to our NextGen project. |
• | An increase of $1.7 million in the acquisition of assets from franchisees and area developers. |
• | A $1.6 million net increase in the issuance of operating loans to our franchisees (including ADs), net of payments received on operating loans. |
• | An equity interest acquired in a tax software development company for $1.0 million. |
Financing activities. In fiscal 2013, we generated $24.3 million less cash from financing activities compared to fiscal 2012 due to fiscal 2012 borrowings of $25.0 million of term debt on our credit facility that did not recur in 2013, and repurchasing $2.2 million more of stock from our common stockholders in 2013 as compared to 2012. These factors were offset in part by receiving $3.1 million more in proceeds in 2013 related to the exercise of stock options driven by stock option expirations and a higher stock price.
In fiscal 2012, we generated $29.9 million more cash from financing activities as compared to fiscal 2011 due to borrowing $25.0 million of term debt on our credit facility, repurchasing $8.5 million less of stock from our common and preferred stockholders in 2012 as compared to 2011, and receiving $3.1 million less in proceeds related to the exercise of stock options, reflecting a decrease in the number of stock options that expired in 2012 as compared to 2011 and the willingness of some option holders to allow their options to expire.
Future cash needs and capital requirements
Operating cash flow needs. We believe that our new credit facility entered into on April 30, 2012 will be sufficient to support our cash flow needs for the foreseeable future.
The maximum balance of our revolving credit facility during fiscal 2013 was $119.0 million on February 7, 2013, and by April 30, 2013, we were able to repay the entire balance of our revolving credit facility. At April 30, 2013, using the leverage ratio applicable under our loan covenants at the end of each fiscal year, our maximum unused borrowing capacity was $98.6 million . Under our current credit facility, we remain subject to the same leverage ratio test, and our leverage ratio requirement at January 31, 2014 will be 4:1 as compared to the 3:1 ratio applicable as described below for the other quarters of the fiscal year.
55
Table of Contents
Our credit facility also contains a requirement that we reduce the balance of our revolving loan to zero for a period of at least 45 consecutive days each fiscal year. However, because our term loan will remain outstanding during that 45 day period, and given our historic cash flow experience at the end and at the beginning of each fiscal year, we do not anticipate that the unavailability of our revolving loan during that 45 day period each fiscal year will adversely affect our cash flow. As of June 14, 2013, we had had a zero balance on our revolver for the required 45 days and thus have already met the requirement for fiscal 2014.
We believe several factors will affect our cash flow in future periods, including the following:
• | The extent to which we extend additional financing to our franchisees and ADs, beyond the levels of prior periods. |
• | The extent to which we finance any tax settlement products offered by JTH Financial in the future. |
• | The extent and timing of our expenditures related to our NextGen project. Our NextGen project is an integral part of our determination to deliver an improved level of service to our franchisees. In addition to integrating our online and retail-based tax preparation software, we expect the NextGen project, when fully deployed, to improve the ability of our franchisees to comply with financial information protection requirements by moving most tax preparation information to a secure centralized platform, and to provide web-based support services in a way that will be both more accessible to our franchisees and their employees and less expensive for us to provide. |
• | The cash flow effect of selling franchises under our new program allowing franchisees to purchase additional territories without making any cash down payment. |
• | The offsetting impact of the higher royalty rates we receive from franchisees who elect to purchase territories under the no down payment plan. |
• | The extent to which we engage in stock repurchases. |
• | Our ability to generate fee and other income related to tax settlement products in light of regulatory pressures on us and our business partners. |
• | The extent to which we repurchase AD areas, which will involve the use of cash but the countervailing receipt in future periods of what would have been the AD's share of royalties and franchise fees. |
• | The extent, if any, to which our Board of Directors elects to declare dividends on our common stock. |
Effect of our credit facility covenants on our future performance. Our credit facility, which matures on April 30, 2017, imposes several restrictive covenants, consistent with the covenants that applied under the revolving credit facility it replaced. The credit facility contains a covenant that requires us to maintain a "leverage ratio" of not more than 4:1 at the end of each fiscal quarter ending January 31, and a ratio of not more than 3:1 at the end of each other fiscal quarter. The higher permitted leverage ratio at the end of the January 31 quarter reflects the fact that as of that date, we have typically extended significant credit to our franchisees for working capital and other needs that is not reflected in revenue that we receive from our franchisees until the period beginning in February each year. At January 31, 2013 and April 30, 2013, applying the identical requirements of our prior revolving credit facility, we had a leverage ratio of 5.12 :1 and 0.66 :1, respectively.
We were not in compliance with out leverage ratio requirement as of January 31, 2013 because of the unprecedented delay in the IRS commencement of the tax filing season. That delay affected both the income and debt components of our leverage ratio requirement. Our adjusted EBITDA used to compute our leverage ratio was adversely affected by reduced franchise royalties, advertising fees, tax preparation revenues and financial products revenue attributable to the fact that the tax filing season began only two days before the end of the fiscal quarter. In addition, the indebtedness portion of our leverage ratio calculation was adversely affected by increased borrowings needed in order for us to provide assistance to our franchisees, in order to help them meet their payroll and other cash flow needs at the end of January, when they would normally have begun receiving tax preparation revenue but experienced a significant delay in that source of cash flow because of the delay in the tax filing season. This short-term financing of our franchisees was recovered through repayments in February and March 2013. We obtained a waiver of this failure from our bank syndicate, and we do not anticipate the issue recurring in the future.
The accounting policy changes that have resulted in the restatement of our financial statements described elsewhere in this annual report also resulted in our inability to satisfy several credit facility covenants related to the delivery and accuracy of our financial reports. We obtained a waiver of these failures from our bank syndicate in August 2013.
Our leverage ratio at April 30, 2013 was 0.66 :1, reflecting the fact that we had no balance outstanding on our revolving credit facility at that date and a $23.8 million balance under our term loan. However, using the 3:1 test, our available borrowing capacity under the revolving credit facility at April 30, 2013 was $98.6 million . The leverage ratio is measured only at the end of
56
Table of Contents
each fiscal quarter, and so there may be times at which we exceed the quarter-end leverage ratio during the quarter, which we are permitted to do provided that our leverage ratio is within the allowable ratio at quarter-end.
We continue to be obligated under our new credit facility to satisfy a fixed charge coverage ratio test which requires that ratio to be not less than 1.50:1 at the end of every fiscal quarter. At January 31, 2013 and April 30, 2013, our fixed charge coverage ratios were 1.60 and 4.58 , respectively.
We were in compliance with the ratio tests described in this section as of April 30, 2013. We expect to be able to manage our cash flow and our operating activities in such a manner that we will continue to be able to satisfy our obligations under the new credit facility for the remainder of the term of that facility.
As noted above, although we are subject under our credit facility to a requirement that we reduce the balance of our revolving loan to zero for a period of at least 45 consecutive days each fiscal year, because of the addition of a term loan into our credit facility, we do not believe that requirement will affect our cash flow or future performance.
Seasonality of Operations
Given the seasonal nature of the tax return preparation business, we have historically generated and expect to continue to generate most of our revenues during the period from January 1 through April 30. For example, in fiscal 2013 and fiscal 2012, we earned 26% and 34% of our revenues during our fiscal third quarter ending January 31, respectively, and earned 89% of our revenues during the combined fiscal third and fourth quarters, both 2013 and 2012. We historically operate at a loss through the first eight months of each fiscal year, during which we incur costs associated with preparing for the upcoming tax season.
Off Balance Sheet Arrangements
From time to time, we have been party to interest rate swap agreements that allow us to manage fluctuations in cash flow resulting from changes in the interest rate on our credit facility. These swaps effectively change the variable-rate of our credit facility into a fixed rate credit facility. Under the swaps, we receive a variable interest rate based on the one month LIBOR and pay a fixed interest rate. Our interest rate swap agreements expired in March 2013 and we had none outstanding at April 30, 2013. We may enter into interest rate swap agreements in the future if we determine that it is appropriate to hedge our interest rate risk.
We also enter into forward contracts to eliminate exposure related to foreign currency fluctuations in connection with the short-term advances we make to our Canadian subsidiary in order to fund personal income tax refund discounting for our Canadian operations. At April 30, 2013, there were no forward contracts outstanding, but we expect to enter into forward contracts in the future during the Canadian tax season.
Commitments and Contingencies
The following table sets forth certain of our contractual obligations as of April 30, 2013.
|
| Contractual Obligations | ||||||||||||||||||
|
| Total |
| Less than 1 Year |
| 1 - 3 Years |
| 3 - 5 Years |
| More than 5 Years | ||||||||||
|
| (dollars in thousands) | ||||||||||||||||||
Long-term debt obligations(1) |
| $ | 29,570 | |
| $ | 3,954 | |
| $ | 6,147 | |
| $ | 19,469 | |
| $ | - | |
Capital lease obligations |
| 125 | |
| 42 | |
| 77 | |
| 6 | |
| - | | |||||
Operating lease obligations(2) |
| 8,455 | |
| 4,338 | |
| 2,780 | |
| 951 | |
| 386 | | |||||
Purchase obligations(3) |
| 7,877 | |
| 6,414 | |
| 1,463 | |
| - | |
| - | | |||||
Total contractual obligations |
| $ | 46,027 | |
| $ | 14,748 | |
| $ | 10,467 | |
| $ | 20,426 | |
| $ | 386 | |
_______________________________________________________________________________
(1) Amounts include mandatory principal payments on long-term debt, as well as estimated interest of $597, $1,051, $364, and $- for less than 1 year,
1-3 years, 3-5 years, and more than 5 years, respectively. Interest calculated for future periods was based on the interest rate at April 30, 2013. The actual interest rate will vary based on LIBOR and our leverage ratio.
(2) We sublease most of the office spaces represented by this line item, and anticipate sublease receipts from franchisees of $2,393, $1,584, $525, and $110
for less than 1 year, 1-3 years, 3-5 years, and more than 5 years, respectively.
(3) Amounts are primarily for advertising expense and for software licenses, maintenance and development.
57
Table of Contents
Critical Accounting Policies
Our consolidated financial statements are prepared in accordance with accounting principles generally accepted in the United States. The following critical accounting policies may affect reported results.
Revenue Recognition. We recognize franchise fees when our obligations to prepare the franchise for operation have been substantially completed and cash has been received. No franchise fee revenue is recognized related to the Company's sale of a zero franchise fee territory. Direct costs related to territories sold with no franchise fee are deferred until the related royalty revenue is recognized.
Area developer rights are granted for a term of 10 years . Area development fees are deferred until the AD has paid 20% of the fee. Once 20% of the fee has been paid, area developer fees are recognized as revenue on a straight-line basis over the initial contract term of each area developer agreement with the cumulative amount of revenue recognized not to exceed the amount of cash received. Amounts due to ADs for their services under an area development agreement are expensed as the related franchise fees and royalty revenues are recognized.
Royalties and advertising fees are recognized currently as franchise territories generate sales. Tax return preparation fees and financial products revenue are recognized as revenue in the period the related tax return is filed or prepared for the customer. Discounts for promotional programs are recorded at the time the return is prepared and are recorded as reductions to revenues.
Interest income is recognized when cash is received for notes associated with franchise fees or area developer fees. For all other notes, interest income is recognized when earned, and is recorded net of an allowance.
Gains on sales of Company-owned offices are recognized when the purchase price is paid. Losses on sales of Company-owned offices are recognized immediately.
Derivative Instruments and Hedging Activities. We account for derivatives and hedging activities and recognize all derivative instruments as either assets or liabilities on our balance sheet at their respective fair values. For derivatives designated in hedging relationships, changes in fair value are either offset through earnings against the change in fair value of the hedged item attributable to the risk being hedged, or recognized in income to the extent the derivative is effective at offsetting the changes in cash flows being hedged until the hedged item affects earnings. For derivative instruments that are designated and qualify as part of a cash flow hedging relationship, the effective portion of the gain or loss on the derivative is reported as a component of other comprehensive income and reclassified into earnings in the same period or periods during which the hedged transaction affects earnings. Gains and losses on the derivative representing either hedge ineffectiveness or hedge components excluded from the assessment of effectiveness are recognized in current earnings.
We discontinue hedge accounting prospectively when we determine that the derivative is no longer effective in offsetting cash flows attributable to the hedged risk, the derivative expires or is sold, terminated or exercised, the cash flow hedge is de-designated because a forecasted transaction is not probable of occurring, or we determine to remove the designation of the cash flow hedge. Whenever hedge accounting is discontinued and the derivative remains outstanding, we continue to carry the derivative at its fair value on the balance sheet and recognize any subsequent changes in fair value in earnings. When it is no longer probable that a forecasted transaction will occur, we discontinue hedge accounting and recognize immediately earnings gains and losses that were accumulated in other comprehensive income related to the hedging relationship.
Long-Lived Assets. We review our long-lived assets, such as property, plant and equipment, and purchased intangibles subject to amortization, for impairment whenever events or changes in circumstances indicate that the carrying value of an asset may not be recoverable. We measure recoverability by comparison of the carrying value of an asset to its estimated undiscounted future cash flows expected to be generated by the asset. We recognize and measure potential impairment at the lowest level where cash flows are individually identifiable. If the carrying amount of an asset exceeds its estimated future cash flows, we recognize an impairment charge equal to the amount by which the carrying value of the asset exceeds the fair value of the asset. We determine fair value through various valuation techniques, including discounted cash flow models, quoted market values, and third-party independent appraisals. If assets are to be disposed of, we separately present these assets in the balance sheet and report them at the lower of the carrying amount or fair value less selling costs, and no longer depreciate them. When we have assets classified as held for sale, we present them separately in the appropriate asset and liability sections of the balance sheet.
Allowance for Doubtful Accounts. Our allowance for doubtful accounts includes our best estimate of the amount of probable credit losses in our existing accounts receivable and notes receivable. Because the repayment of accounts receivable and notes receivable are dependent on the performance of the underlying franchises, at the end of each reporting period we estimate the amount of the allowance for uncollectible accounts based on a comparison of amounts due to the estimated fair value of the underlying franchise.
58
Table of Contents
Stock Compensation Expense. For equity classified employee stock-based compensation, the Company records costs of its employee stock-based compensation based on the grant-date fair value of awards using the Black-Scholes-Merton option pricing model. For the liability classified awards the company records costs based on the fair value at the reporting date. We recognize compensation costs for an award that has a graded vesting schedule on a straight-line basis over the service period for the entire length of the stock option award.
The following chart indicates the number of stock options granted during fiscal 2013, the fair value of the underlying stock as determined by the Company, and the per share total stock compensation expense that will be recognized by the Company in connection with those shares associated with the stock option grants:
Date and Year of Grant |
| Number of Options Granted |
| Average Exercise Price |
| Fair Value of Underlying Common Stock |
| Per Share Stock Compensation Expense |
| Aggregate Stock Compensation Expense | |||||||||
June 2012 |
| 332,035 | |
| $ | 15.00 | |
| $ | 15.00 | |
| $ | 1.80 | |
| $ | 595,998 | |
In establishing the fair value of our Class A Common Stock for the period indicated above, we considered appropriate accounting literature regarding the valuation of privately-held company equity securities and determined that the values established in contemporaneous transactions provided a reasonable basis for establishing the fair value for stock compensation expense purposes. On this basis, we did not obtain any third party valuation or utilize other valuation methods.
The June 2012 grants were made prior to our becoming a public company; any grants made since we became a public company will be at the closing price of the preceding business day. For the grants made prior to becoming a public company, the $15 grant price was because we concluded that the private transaction information available to us, because of the nature of these transactions, provided a basis for establishing fair value. First, during the period from May 1, 2008 through April 30, 2012, the Company completed an aggregate of $22.3 million in negotiated stock repurchases from stockholders other than directors, executive officers and 5% stockholders, and the weighted average repurchase price in those transactions was $14.76, with no price higher than $15.00. Second, the option grants effected in calendar year 2012 were proximate in time to a very large and arms-length transaction between two of our largest stockholders that was negotiated in January and February, 2011 and closed in late February, 2011. In that transaction, Envest III acquired 266,666 shares from Edison Venture Fund IV, L.P., at a purchase price per share of $15.00. That price was negotiated at arms-length between those two stockholders, and the two stockholders are sophisticated investors and unrelated parties.
In determining fair value with respect to stock option grants prior to becoming a public company, we noted that the price at which the repurchase and third party transactions took place likewise did not vary significantly, notwithstanding our operating results and continued growth during the periods involved, and that the price at which options were granted did not vary among grant dates. We believe that the lack of variability of the price at which these transactions took place reflected stock market conditions since 2009 and the counterbalancing effects of the growth of our business, and the market volatility involving some of our primary publicly traded peers, including the bankruptcy of one of those peers that was filed in 2011 and which had been foreshadowed through public disclosure over an extended period of time. See "-Critical Accounting Estimates" for a further discussion of the factors we considered in determining the fair value of the underlying stock.
We also granted restricted stock units for the first time during fiscal 2013. The following chart indicates the number of restricted stock units granted during fiscal 2013, the fair value of the underlying stock as determined by the Company, and the per share total stock compensation expense that will be recognized by the Company in connection with the shares associated with those restricted stock unit grants:
Date and Year of Grant |
| Number of Restricted Stock Units Granted |
| Fair Value of Underlying Common Stock |
| Per Share Stock Compensation Expense |
| Aggregate Stock Compensation Expense | |||||||
June 2012 |
| 9,305 | |
| $ | 15.00 | |
| $ | 15.00 | | | $ | 139,575 | |
August 2012 |
| 3,166 | |
| 11.80 | |
| 11.80 | | | 37,359 | | |||
August 2012 |
| 3,500 | |
| 11.07 | |
| 11.07 | | | 38,745 | | |||
Restricted stock units are valued at the closing stock price the day preceding the grant date. The stock-based compensation expense for restricted stock units is amortized on a straight-line basis, over the vesting period.
Potential effect of JOBS Act. The JOBS Act contains provisions that, among other things, relax certain reporting requirements for qualifying public companies. We are an "emerging growth company" and under the JOBS Act will be allowed to comply with new or revised accounting pronouncements based on the effective date for private (i.e., not publicly traded)
59
Table of Contents
companies. We are electing the ability to delay the adoption of new or revised accounting standards, and as a result, we may not elect to comply with new or revised accounting standards on the relevant dates on which adoption of those standards is required for non-emerging growth companies.
Critical Accounting Estimates
Our consolidated financial statements are prepared in accordance with GAAP. In connection with the preparation of our financial statements, we are required to make assumptions and estimates about future events, and apply judgments that affect the reported amounts of assets, liabilities, revenue, expenses and the related disclosures. We base our assumptions, estimates and judgments on historical experience, current trends and other factors that management believes to be relevant at the time our consolidated financial statements are prepared. On a regular basis, we review the accounting policies, assumptions, estimates and judgments to ensure that our financial statements are presented fairly and in accordance with GAAP. However, because future events and their effects cannot be determined with certainty, actual results could differ from our assumptions and estimates, and such differences could be material.
Our significant accounting policies are discussed in Note 1, Organization and Significant Accounting Policies , of the Notes to our Consolidated Financial Statements. We believe that the following accounting estimates are the most critical to aid in fully understanding and evaluating our reported financial results, and they require our most difficult, subjective or complex judgments, resulting from the need to make estimates about the effect of matters that are inherently uncertain. We have reviewed these critical accounting estimates and related disclosures with the Audit Committee of our Board of Directors.
Description |
| Judgments and Uncertainties |
| Effect if Actual Results Differ From Assumptions |
Allowance for doubtful accounts |
|
|
|
|
We establish our allowance for doubtful accounts for our trade accounts receivable and notes receivable based on a comparison of the amount due to the estimated fair value of the underlying franchise. In establishing the fair value of the underlying franchise, management considers net fees of open offices and the number of unopened offices. |
| Our calculation of the allowance requires management to make assumptions regarding the fair value of the franchise to which the account relates. |
| A 10% decrease in our valuation of franchise territories at April 30, 2013 would have increased our allowance for doubtful accounts by approximately $1.1 million at that date. |
Long-lived assets |
|
|
|
|
Long-lived assets other than goodwill and indefinite-lived intangible assets, which are separately tested for impairment, are evaluated for impairment whenever events or changes in circumstances indicate that the carrying value may not be recoverable. |
| Our calculation of the allowance requires management to make assumptions regarding the fair value of the franchise to which the account relates. |
| We have not made any material changes in the accounting methodology we use to assess impairment loss during the past three fiscal years. |
60
Table of Contents
Description |
| Judgments and Uncertainties |
| Effect if Actual Results Differ From Assumptions |
When evaluating long-lived assets for potential impairment, we first compare the carrying value of the asset to the asset's estimated future cash flows (undiscounted and without interest charges). If the estimated future cash flows are less than the carrying value of the asset, we calculate an impairment loss. The impairment loss calculation compares the carrying value of the asset to the asset's estimated fair value, which may be based on estimated future cash flows (discounted and with interest charges). We recognize an impairment loss if the amount of the asset's carrying value exceeds the asset's estimated fair value. If we recognize an impairment loss, the adjusted carrying amount of the asset becomes its new cost basis. For a depreciable long-lived asset, the new cost basis will be depreciated (amortized) over the remaining useful life of that asset. |
|
|
| We do not believe there is a reasonable likelihood that there will be a material change in the estimates or assumptions we use to calculate long-lived asset impairment losses. However, if actual results are not consistent with our estimates and assumptions used in estimating future cash flows and asset fair values, we may be exposed to losses that could be material. |
Stock-based compensation |
|
|
|
|
Prior to becoming a public reporting company in June 2012, we based the valuation of the common stock underlying stock options granted to directors and employees on transactions in which the Company had repurchased stock, or in which we had evidence of arms-length transactions between third parties. We have used that valuation to determine the cost of our employee stock-based compensation, rather than obtaining a third party appraisal or using more traditional methods, because we concluded that the number and nature of these transactions in recent periods provided a reasonable basis for the valuation. See "--Critical Accounting Policies--Stock Compensation Expense." |
| Our calculation of the cost of employee stock-based compensation depends on the assumption that the exercise price provided for stock options constitutes the fair value of the awards at the grant date. |
| For each of fiscal 2011, fiscal 2012, and fiscal 2013 we established the fair value of our common stock at the grant date of various stock options. A $1.00 increase in the per share valuation of the stock with respect to options granted during fiscal 2013 would have increased our stock compensation expense by $40,000 and a $1.00 decrease in that valuation would have reduced our stock compensation expense by $37,000. |
Recently Issued Accounting Standards
In June 2011, Financial Accounting Standards Board ("FASB") issued Accounting Standards Update ("ASU") 2011-05, Presentation of Comprehensive Income . This update changes the methods for presenting comprehensive income, and eliminates the method of including comprehensive income in the statement of stockholders' equity. An entity will have the option to present the total of comprehensive income, the components of net income, and the components of other comprehensive income either in a single continuous statement of comprehensive income or in two separate but consecutive statements. The amendments in this ASU do not change the items that must be reported in other comprehensive income or when an item of other comprehensive income must be reclassified to net income. We adopted this guidance in the first quarter of fiscal 2013. Because it only affects presentation, this guidance has not had a material effect on its consolidated financial statements.
In September 2011, FASB issued ASU 2011-08, Intangibles-Goodwill and Other (ASC Topic 350): Testing Goodwill for Impairment. This amendment provides the option of first using a qualitative assessment to determine whether it is more likely than not that the fair value of a reporting unit is less than its carrying amount. If a company concludes that it is more likely than
61
Table of Contents
not that fair value exceeds carrying value, the two-step test for impairment is not required. The amendment includes a revised list of considerations in completing the qualitative assessment. We adopted this ASU in fiscal 2013 and this guidance has had no material effect on our consolidated financial statements.
Item 7A. Quantitative and Qualitative Disclosures About Market Risk.
Foreign exchange risk
We are subject to inherent risks attributed to operating in more than one country. Most of our revenues, expenses and borrowings are denominated in U.S. dollars. Our operations in Canada, including the advances we make to our Canadian subsidiary, are denominated in Canadian dollars, and are therefore subject to foreign currency fluctuations. For fiscal 2013 , a 5% change in the exchange rate of the Canadian dollar relative to the U.S. dollar would have had a $51,000 impact on our net income, and a $699,000 impact on our total assets at April 30, 2013 . We use, and may continue to use in the future, derivative financial instruments, such as forward contracts, to manage foreign currency exchange rate risks. See "Item 7-Management's Discussion and Analysis of Financial Condition and Results of Operations-Off Balance Sheet Arrangements."
Interest rate risk
We are subject to interest rate risk in connection with our credit facility, which provides for borrowings of up to a total of $168.4 million and bears interest at variable rates. Assuming our revolving loan is fully drawn and including the full balance of our term loan, each eighth of a percentage point change in interest rates would result in a $0.2 million change in annual interest expense on our credit facility. From time to time, we have entered into hedging instruments, involving the exchange of floating for fixed rate interest payments, to reduce interest rate volatility. See " Item 7-Management's Discussion and Analysis of Financial Condition and Results of Operations-Off Balance Sheet Arrangements."
Item 8. Financial Statements and Supplementary Data.
Our financial statements are annexed to this report beginning on page F-1.
Item 9. Changes in and Disagreements with Accountants on Accounting and Financial Disclosure.
During the last two fiscal years and through the date of this filing, we have not had a change in our independent registered public accounting firm and have not had any disagreements with our public accounting firm on any matters of accounting principles or practices, financial statement disclosure or auditing scope or procedure.
Item 9A. Controls and Procedures.
Evaluation of Controls and Procedures
We have established disclosure controls and procedures (as defined in Rules 13a-15(e) and 15d-15(e) of the Exchange Act) to ensure that information required to be disclosed in the Company's reports filed under the Exchange Act, is recorded, processed, summarized and reported within the time periods specified in the SEC's rules and forms. Disclosure controls and procedures are also designed to ensure that such information is accumulated and communicated to management, including the Chief Executive Officer and Chief Financial Officer, as appropriate, to allow timely decisions regarding required disclosure. Our disclosure controls and procedures were designed to provide reasonable assurance that the controls and procedures would meet their objectives. Our management, including the Chief Executive Officer and Chief Financial Officer, does not expect that our disclosure controls and procedures will prevent all error and all fraud. A control system, no matter how well designed and operated, can provide only reasonable assurance of achieving the designed control objectives and management is required to apply its judgment in evaluating the cost-benefit relationship of possible controls and procedures. Because of the inherent limitations in all control systems, no evaluation of controls can provide absolute assurance that all control issues and instances of fraud, if any, within the Company have been detected. These inherent limitations include the realities that judgments in decision-making can be faulty and that breakdowns can occur because of simple error or mistake. Additionally, controls can be circumvented by the individual acts of some persons, by collusion of two or more people or by management override of the control. Because of the inherent limitations in a cost-effective, maturing control system, misstatements due to error or fraud may occur and not be detected.
As of the end of the period covered by this report, April 30, 2013, we evaluated the effectiveness of the design and operations of our disclosure controls and procedures. The controls evaluation was done under the supervision and with the participation of management, including our Chief Executive Officer and Chief Financial Officer.
Based on that evaluation and the identification of a material weakness in the Company's internal control over financial reporting (as defined in Rule 13a-15(f) of the Exchange Act), as described below, management, including our Chief Executive Officer and Chief Financial Officer, has concluded that, as of April 30, 2013, our disclosure controls and procedures were not
62
Table of Contents
effective. As described below, management has implemented, or plans to implement, certain remediation measures to address the material weakness in the Company's internal control over financial reporting.
Management's Report on Internal Control over Financial Reporting
The Company's management, under the supervision of its Chief Executive Officer and Chief Financial Officer, is responsible for establishing and maintaining adequate internal control over financial reporting for the Company. A "material weakness" is a deficiency, or a combination of deficiencies, in internal control over financial reporting, such that there is a reasonable possibility that a material misstatement of our annual or interim financial statements will not be prevented or detected on a timely basis. In order to evaluate the effectiveness of internal control over financial reporting as of April 30, 2013, we conducted an assessment using the criteria established in Internal Control - Integrated Framework, issued by the Committee of Sponsoring Organizations of the Treadway Commission.
In connection with management's evaluation of the internal control over financial reporting described above, management has identified the following deficiencies that constituted a material weakness in our internal control over financial reporting as of April 30, 2013:
• | Ineffective controls over revenue recognition, business combinations accounting and accounting for stock-based compensation awards |
Management has identified control deficiencies that constitute a material weakness in our internal controls over financial reporting, specifically regarding revenue recognition, business combinations and accounting for stock-based compensation awards. The deficiencies relate to both the design of the controls (our policies and procedures around revenue recognition, business combination accounting and share based payment accounting were not as detailed as they needed to be) and the operating effectiveness of the controls (ensuring that those executing the controls or who are otherwise involved in the revenue recognition, business combination accounting and accounting for stock-based compensation awards processes have the relevant knowledge and available time to execute the controls effectively).
The material weakness resulted in errors related to franchisee fees, area developer fees, royalties, interest income, area developer expense, amortization, gain on sale of company-owned offices, notes and interest receivable, unrecognized revenue, deferred revenue, due to area developer, retained earnings, stock compensation expense and the liability for liability classified stock-based compensation awards.
The material weakness described above, relating to revenue recognition and business combination accounting resulted in misstatements of the accounts identified above (except for stock-based compensation expense and liability classified stock-based compensation awards), and disclosures that resulted in material misstatements in our annual and interim consolidated financial statements for the affected periods. There was no misstatement of prior period financial statements relating to stock-based compensation awards. Because of this material weakness, the restatement of our previously issued consolidated financial statements previously discussed in this annual report, and the evaluation that we have performed, management has concluded that we did not maintain effective internal control over financial reporting as of April 30, 2013.
Plan for Remediation of Material Weakness
Subsequent to April 30, 2013, as part of our efforts to improve our finance and accounting function and to remediate the material weakness that existed in our internal control over financial reporting, and our disclosure controls and procedures, as of April 30, 2013, we have developed a remediation plan (the "Remediation Plan") pursuant to which we have implemented, or plan to implement, a number of measures. As discussed in more detail below, the Remediation Plan includes streamlining our accounting staffing, revising our revenue recognition policies and procedures, and providing additional training to personnel involved in the revenue recognition process.
The Remediation Plan consists of the following measures:
• | Staffing : We will streamline the Chief Financial Officer's responsibilities by moving responsibility for our financial products business unit to a newly created executive level position. We have also reorganized the day-to-day accounting function under the leadership of a newly created controller position, reporting directly to the chief accounting officer. The controller will have responsibility for overseeing newly dedicated personnel responsible for ensuring our compliance with our revenue recognition policies. |
• | Policies and procedures : We consulted with external accounting experts to assist with enhancing our policies and procedures related to revenue recognition. We are currently expanding our policies surrounding revenue recognition and stock-based compensation awards and the related procedures with more detailed explanations and examples |
63
Table of Contents
specific to our business and operations. Additionally, we are enhancing our review and sign-off process for these policies.
• | Training : We are expanding our accounting policy and procedures training program to include our sales and corporate support teams as well as our accounting team. |
The Remediation Plan will be administered by our Director of Risk Management and will involve key leaders from across the organization, including our Chief Executive Officer and Chief Financial Officer. The Director of Risk Management will report quarterly and as needed to our Audit Committee on the progress made toward completion of the Remediation Plan.
We believe the steps taken to date have improved the effectiveness of our internal control over financial reporting; however we have not completed the corrective processes and procedures identified above.
Accordingly, as we continue to monitor the effectiveness of our internal control over financial reporting in the areas affected by the material weakness described above, we will perform additional procedures prescribed by management and employ any additional tools and resources deemed necessary to ensure that our financial statements continue to be fairly stated in all material respects.
Changes in Internal Control over Financial Reporting
There were no changes in our internal control over financial reporting during the quarter ended April 30, 2013 that materially affected or are reasonably likely to materially affect our internal control over financial reporting. However, as described above under "Plan for Remediation of Material Weakness," we have begun dedicating resources to support our efforts to improve the control environment and to remedy the control weakness described herein.
Item 9B. Other Information.
None.
64
Table of Contents
PART III
Item 10. Directors, Executive Officers and Corporate Governance.
The following table sets forth information regarding our executive officers and directors as of the date of this annual report:
|
|
|
|
|
Name |
| Age |
| Position(s) |
John T. Hewitt |
| 64 |
| Chairman, Chief Executive Officer and President |
Mark F. Baumgartner |
| 51 |
| Chief Financial Officer |
T. Rufe Vanderpool |
| 52 |
| Chief Operating Officer |
James J. Wheaton |
| 53 |
| General Counsel, Vice President of Legal and Governmental Affairs |
Gordon D'Angelo |
| 60 |
| Director |
John R. Garel |
| 55 |
| Director |
Gary P. Golding |
| 56 |
| Director |
Steven Ibbotson |
| 51 |
| Director |
Ross N. Longfield |
| 73 |
| Director |
Ellen M. McDowell |
| 53 |
| Director |
George T. Robson |
| 66 |
| Director |
Executive Officers
John T. Hewitt. Mr. Hewitt has served as our Chairman, Chief Executive Officer and President since October 1996. Mr. Hewitt is a pioneer in the tax preparation industry with a career in the industry spanning over 40 years. From August 1982 until June 1996, Mr. Hewitt was the Founder, President, Chief Executive Officer and Chairman of Jackson Hewitt Inc., in Virginia Beach, Virginia. From December 1969 until June 1981, Mr. Hewitt held the varying positions of Tax Preparer, Assistant District Manager, District Manager, and Regional Director with H&R Block in Buffalo and Elmira, New York and Moorestown, New Jersey. Mr. Hewitt is the brother of Ellen M. McDowell, one of our directors. In serving as Chairman of the Board of Directors as well as Chief Executive Officer, Mr. Hewitt is effectively able to integrate the operating and business strategies of the company, which is an invaluable asset to the Board in formulating our overall strategic direction.
Mark F. Baumgartner. Mr. Baumgartner has served as our Chief Financial Officer since February 2004. From August 2003 until February 2004, Mr. Baumgartner was an independent consultant to us. From May 1999 until August 2003, Mr. Baumgartner served as Chief Financial Officer for InfiNet Company in Norfolk, Virginia. From August 1991 until May 1999, Mr. Baumgartner served as Senior Vice President of Operations for First Coastal Bank in Virginia Beach, Virginia. From June 1986 until August 1991, Mr. Baumgartner worked for Price Waterhouse in Norfolk, Virginia under the varying capacities of Audit Staff, Audit Senior and Audit Manager.
T. Rufe Vanderpool. Mr. Vanderpool has served as our Chief Operating Officer since June 2011 and previously served as our Vice President of Operations from June 2006. From June 2004 to June 2006, Mr. Vanderpool served as our Vice President of Software Development. From April 1998 until May 2004, Mr. Vanderpool served as COO of Orrtax Software, Inc. in Bellevue, Washington. From June 1996 until April 1998, Mr. Vanderpool served as President and CEO of Abacus Software in Edmonton, Canada.
James J. Wheaton. Mr. Wheaton has served as our General Counsel and Vice President of Legal and Governmental Affairs since February 2011. Mr. Wheaton was previously a partner at the law firm of Troutman Sanders LLP, where he practiced at the firm's Virginia Beach, Virginia office from 2001 until joining us in February 2011, and served as the practice group leader for the firm's mergers and acquisitions group. From September 1986 until May 2001, Mr. Wheaton was associated with the law firm of Willcox & Savage, P.C. in Norfolk, Virginia, where he was a shareholder from 1991 until 2001.
65
Table of Contents
Non-Employee Directors
Gordon D'Angelo. Mr. D'Angelo has served as a Director since June 2011. Mr. D'Angelo is the co-founder and Chairman of NEXT Financial Group and related entities, an independent registered broker/dealer that provides financial services such as retirement planning, estate planning and investment management through 550 offices in 49 states. Prior to co-founding NEXT Financial in 1998, Mr. D'Angelo was a director of Jackson Hewitt. Mr. D'Angelo brings to the Board of Directors a wealth of experience in the financial services industry drawing upon his experience from his co-founding of NEXT Financial Group in 1998 where he strengthened his leadership capabilities and management advisory expertise. Mr. D'Angelo also has experience in the tax preparation industry, in that he previously worked for H&R Block before serving as a director of Jackson Hewitt.
John R. Garel. Mr. Garel has served as a Director since May 2003. From June 2000 until the present, Mr. Garel has served as a Senior Managing Director for Envest Holdings, a private equity management company. As a Senior Managing Director of Envest Holdings, which manages two funds that are among our largest stockholders, Mr. Garel has garnered expertise in analysis of investment opportunities and evaluation of business strategies. In his tenure at Envest, Mr. Garel has overseen the deployment of capital across a variety of industries.
Gary P. Golding. Mr. Golding has been a Director since October 2000. Mr. Golding is a General Partner for Edison Partners IV, L.P., a venture capital investment partnership and has served in such position since October 1997. Mr. Golding also serves on the Board of Directors of Vocus, Inc., a provider of cloud-based PR and marketing software for public relations management. As a General Partner of Edison Partners IV, L.P., which manages one of our largest stockholders, Mr. Golding has garnered expertise in analysis of investment opportunities and brings extensive management advisory expertise to the Board through his service as a director of multiple private companies. During his tenure with Edison, Mr. Golding has overseen the deployment of investments across a variety of industries.
Steven Ibbotson. Mr. Ibbotson has served as a Director since June 1999. Mr. Ibbotson has served as General Manager for Farm Business Consultants, Inc. ("FBC") in Calgary, Alberta since September 1997. From September 1995 until September 1997, he served as a General Manager-Western Canada for FBC, Inc. also in Calgary, Alberta. From September 1993 until September 1995 he served as Director of Marketing for FBC in London, Ontario. FBC is a tax preparation and consulting firm serving farmers and small business owners across Canada. Through his service as General Manager and various other positions at FBC, Mr. Ibbotson brings many years of tax preparation industry expertise to our Board. Mr. Ibbotson has developed significant managerial expertise through his career at FBC and is familiar with many of the operational challenges in the tax preparation industry, many of which confront our company. Mr. Ibbotson also serves as the Board of Directors' representative of our largest stockholder, DataTax Business Services Limited.
Ross N. Longfield. Mr. Longfield has served as a Director since December 2001. Mr. Longfield is managing partner of Longfield Consulting, a financial services firm located in Wyoming. From November 2002 through December 2004 Mr. Longfield served as Chairman of the Board of Incurrent Solutions in Parsippany, New Jersey. From June 1998 until December 2000, Mr. Longfield served as a Managing Director for Household International in Bridgewater, New Jersey. He was Chairman and CEO of Beneficial Bank USA from 1990 to 1998, was a pioneer of the RAL concept and has many years of experience in the tax preparation industry. Mr. Longfield brings highly valuable financial and managerial expertise to the Board through his service with Incurrent Solutions, Household International and other public and private companies. Mr. Longfield is highly experienced and knowledgeable in financial analysis, financial statements and risk management which qualifies him as one of our audit committee financial experts.
Ellen M. McDowell. Ms. McDowell has served as a Director since June 2010. From January 1998 until the present, Ms. McDowell has also served as an Attorney and Managing Shareholder at McDowell-Riga-Posternock, P.C., in Maple Shade, New Jersey. Ms. McDowell is the sister of John Hewitt, our Chairman and Chief Executive Officer. Her experience as an attorney provides an important legal perspective for our Board as it considers various operating and business strategies.
George T. Robson. Mr. Robson has served as a Director since April 1999. Mr. Robson, currently retired, served as the Chief Financial Officer for Dendrite International, a sales and software concern in Morristown, New Jersey from June 1997 until June 2002, and as interim Chief Financial Officer from June to November 2005. Mr. Robson also previously served as the principal of Caversham Associates, a financial consulting firm in Bryn Mawr, Pennsylvania, from June 2002 until April 2006. Mr. Robson was the Chief Financial Officer for H&R Block from January 1996 until May 1997. Mr. Robson brings highly valuable financial expertise to the Board through his experience as the Chief Financial Officer of various companies, including service in our industry as the Chief Financial Officer of H&R Block in the mid-1990s. Mr. Robson is highly experienced and knowledgeable in financial analysis, financial statements and risk management which qualifies him as one of our audit
66
Table of Contents
committee financial experts. Mr. Robson also possesses management advisory experience through his service as a director of several companies.
Committees of the Board of Directors
Our Board of Directors currently has three standing committees: the Audit Committee, the Compensation Committee and the Nominating and Corporate Governance Committee. The responsibilities of each committee are described below. Members serve on these committees until their resignation or until otherwise determined by our Board of Directors. The chart below reflects the current composition of each of the standing committees.
Name of Director |
| Audit |
| Compensation |
| Nominating and Corporate Governance |
|
Gordon D'Angelo |
|
|
| X |
| X |
|
John R. Garel |
| X |
|
|
| X | (1) |
Gary P. Golding |
|
|
| X |
| X |
|
John T. Hewitt |
|
|
|
|
|
|
|
Steven Ibbotson |
|
|
| X | (1) | X |
|
Ross N. Longfield |
| X |
|
|
| X |
|
Ellen M. McDowell |
|
|
|
|
|
|
|
George T. Robson |
| X | (1) |
|
| X |
|
______________________________________________________________________________
(1) Chairperson of Committee
Audit Committee
Our Audit Committee provides oversight of our accounting and financial reporting process, the audit of our financial statements and our internal control function. Among other matters, the Audit Committee assists the Board of Directors in oversight of the independent auditors' qualifications, independence and performance; is responsible for the engagement, retention and compensation of the independent auditors; reviews the scope of the annual audit; reviews and discusses with management and the independent auditors the results of the annual audit and the review of our quarterly consolidated financial statements including the disclosures in our annual and quarterly reports filed with the SEC; reviews our risk assessment and risk management processes; establishes procedures for receiving, retaining and investigating complaints received by us regarding accounting, internal accounting controls or audit matters; approves audit and permissible non-audit services provided by our independent auditor; and reviews and approves related party transactions under Item 404 of Regulation S-K. In addition, our Audit Committee oversees our internal audit function.
All members of our Audit Committee meet the requirements for financial literacy under the applicable rules and regulations of the SEC and NASDAQ. Our Board of Directors has determined that Mr. Robson and Mr. Longfield are audit committee financial experts as defined under the applicable rules of the SEC and NASDAQ. All of the members of our audit committee are independent directors as defined under the applicable rules and regulations of the SEC and NASDAQ.
Compensation Committee
Our Compensation Committee adopts and administers the compensation policies, plans and benefit programs for our executive officers and all other members of our executive team. In addition, among other things, our Compensation Committee annually evaluates, in consultation with the Board of Directors, the performance of our Chief Executive Officer, reviews and approves corporate goals and objectives relevant to compensation of our Chief Executive Officer and other executives and evaluates the performance of these executives in light of those goals and objectives. Our Compensation Committee also adopts and administers our equity compensation plans.
All of the members of our Compensation Committee are independent under the applicable rules and regulations of the SEC and NASDAQ, and Section 162(m) of the Internal Revenue Code (the "Code").
Nominating and Corporate Governance Committee
Our Nominating and Corporate Governance Committee is responsible for, among other things, making recommendations regarding corporate governance, the composition of our Board of Directors, identification, evaluation and nomination of director candidates and the structure and composition of committees of our Board of Directors. In addition, our Nominating and Corporate Governance Committee oversees our corporate governance guidelines, approves our Committee charters, oversees compliance with our code of business conduct and ethics, reviews actual and potential conflicts of interest of our directors and officers other than related party transactions reviewed by the Audit Committee and oversees the Board self-evaluation process.
67
Table of Contents
Our Nominating and Corporate Governance Committee is also responsible for making recommendations regarding non-employee director compensation to the full Board of Directors.
Each of the members of the Board of Directors other than our President and Chief Executive Officer, John T. Hewitt, and Ellen McDowell, who is Mr. Hewitt's sister, are members of our Nominating and Corporate Governance Committee. All of the members of our nominating and Corporate Governance Committee are independent under the rules and regulations of NASDAQ.
Non-Employee Director Compensation
In fiscal year 2013, non-employee directors received the option of an annual retainer of $35,000 or an equal amount of compensation in the form of restricted stock units. In addition, for those directors who serve on the Audit Committee, Compensation Committee and Nominating and Corporate Governance Committee, members receive annual retainers of $10,000, $7,500 and $5,000, and the chairpersons receive annual retainers of $20,000, $10,000 and $7,500, respectively. Our committee members are also entitled to receive this cash compensation in the form of restricted stock, if they so elect. We also grant our non-employee directors stock-based compensation in the form of stock options and restricted stock units in a total annual amount of $35,000.
The table below sets forth all compensation paid to our non-employee directors for fiscal 2013. Information regarding Mr. Hewitt's compensation, our only management director, is included under "Executive Compensation."
Name |
| Fees Earned or Paid in Cash |
| Stock Awards (1)(2) |
| Option Awards (3)(4) |
| Total | |||||||||||
Gordon D'Angelo |
| $ | - | |
| $ | 55,659 | |
| $ | - | |
| $ | 55,659 |
| |||
John R. Garel |
| - | |
| 59,340 | |
| 14,407 | |
| 73,747 |
| |||||||
Gary P. Golding |
| 47,500 | |
| 20,595 | | (5 | ) | 14,407 | | (5 | ) | 82,502 |
| |||||
Steven Ibbotson |
| 50,000 | |
| 20,595 | |
| 14,407 | |
| 85,002 |
| |||||||
Ross N. Longfield |
| 50,000 | |
| 20,595 | |
| 14,407 | |
| 85,002 |
| |||||||
Ellen M. McDowell |
| 35,000 | |
| 18,300 | |
| - | |
| 53,300 |
| |||||||
George T. Robson |
| 60,000 | |
| 20,595 | |
| 14,407 | |
| 95,002 |
| |||||||
_______________________________________________________________________________
(1) Amounts in this column reflect the grant date fair value of the restricted stock units (RSUs) granted to each non-employee director under the
Company's 2011 Equity and Cash Incentive Plan, calculated in accordance with FASB Accounting Standards Codification Topic 718 ("ASC Topic 718"), based on the fair market value, as determined by the Board of Directors, of the Company's stock on the effective date of grant. Assumptions used in the calculation of these amounts for fiscal 2013 are included in Note 12 to the Company's audited financial statements for the year ended April 30, 2013.
(2) Represents RSUs granted to non-employee directors, all of which vest and become subject to settlement 18 months after the date of grant. Each RSU
represents the right to receive settlement of one share of the Company's Class A Common Stock. The aggregate amount of RSUs outstanding as of April 30, 2013 for each director was as follows: Mr. D'Angelo, 4,386 RSUs; Mr. Garel, 4,873 RSUs; Edison Venture Fund IV LLP, 1,373 RSUs (Mr. Golding is the manager of Edison Venture Fund IV LLP); Mr. Ibbotson, 1,373 RSUs, Mr. Longfield, 1,373 RSUs, Ms. McDowell, 1,220 RSUs, and Mr. Robson, 1,373 RSUs. Mr. D'Angelo and Ms. McDowell received a different number of RSUs as part of their Board equity compensation for fiscal 2013 because of the valuation of their previously-granted stock options that vested in fiscal 2013, as described in footnote 3. Messrs. D'Angelo and Garel each elected to receive additional RSUs in lieu of their cash compensation for Board and committee service. For each of the RSU awards, the grant date fair value of these awards is calculated using the closing price of the Company's common stock on the date prior to grant.
(3) Amounts in this column reflect the grant date fair value of the options granted to each non-employee director under the company's 2011 Stock Option
Plan calculated in accordance with ASC Topic 718, based on the fair market value, as determined by the Board of Directors of the Company's stock on the date of grant. Assumptions used in the calculation of these amounts for fiscal 2013 are included in Note 12 to the Company's audited financial statements for the year ended April 30, 2013. Mr. D'Angelo and Ms. McDowell each received multi-year stock option grants in prior fiscal years, and so although they did not receive new stock option grants during fiscal 2013, the value imputed to their options that vested during fiscal 2013, based on the Company's compensation expense related to those options, was utilized in determining the number of RSUs to be granted to each of them.
(4) The aggregate number of option awards outstanding as of April 30, 2013 for each director was as follows: Mr. D'Angelo, 30,000 options; Mr. Garel,
8,627 options; Envest II, LLC, 16,500 options; Envest III, LLC, 53,500 options (Mr. Garel is the manager of both Envest II, LLC and Envest III, LLC); Mr. Ibbotson, 38,627 options, Mr. Longfield, 48,627 options, Ms. McDowell, 30,000 options, and Mr. Robson, 48,627 options.
(5) RSUs and options issued to Edison Venture Fund, IV, L.P.
Section 16(a) Beneficial Ownership Reporting Compliance
Section 16(a) of the Exchange Act requires our officers and directors, and persons who own more than 10% of our common stock, to file with the SEC reports detailing their ownership of our common stock and changes in such ownership. Officers, directors and greater than 10% shareholders are required by SEC regulations to furnish us with copies of all Section 16(a) forms they file. To the best of our knowledge, all required reports were filed on time and all transactions by our directors and executive officers were reported on time, except that, due to an administrative error by the Company, Messrs. Ibbotson and Robson each filed a late report for two separate transactions each. Those transactions related solely to the cashless exercise of stock options.
68
Table of Contents
Code of Conduct
We have adopted a Code of Conduct that applies to our directors, officers and employees, including our Chief Executive Officer, Chief Financial Officer, Principal Accounting Officer and others performing similar functions. A copy of our Code of Conduct is available on our website at www.libertytax.com. We intend to provide information on our website regarding amendments to, or waivers under the Code of Conduct.
Item 11. Executive Compensation.
Compensation Discussion and Analysis
The compensation provided to our "named executive officers" for the fiscal year ended April 30, 2013 ("fiscal 2013") is set forth in detail in the Summary Compensation Table for fiscal 2013 and other tables and the accompanying footnotes that follow this section. This section explains our executive compensation philosophy, objectives and design, our compensation-setting process, our executive compensation program components and the decisions made in fiscal 2013 for each of our named executive officers.
Our named executive officers for fiscal 2013 consisted of the following individuals:
John T. Hewitt, who currently serves as our Chairman, President and Chief Executive Officer;
Mark F. Baumgartner, who currently serves as our Vice President and Chief Financial Officer;
T. Rufe Vanderpool, who currently serves as our Chief Operating Officer; and
James J. Wheaton, who currently serves as our General Counsel and Vice President, Legal and
Governmental Affairs.
Compensation overview and objectives
We strive to establish compensation practices that attract, retain and reward our senior management, and strengthen the mutuality of interests between our senior management and our stockholders. We believe that the most effective executive compensation program is one that is conservative, but competitive, and that aligns the compensation of our senior management with the creation of stockholder value. Under the oversight of the Compensation Committee, we have developed and implemented a pay-for-performance executive compensation program that rewards senior management for the achievement of certain financial performance objectives. We achieve the philosophies of pay-for-performance and alignment of senior management compensation with stockholder value creation primarily by providing a substantial portion of each executive's total annual compensation through annual performance bonuses and grants of long-term equity compensation. In the past several years, the Compensation Committee tied the level of bonus payments under our bonus plan to the achievement of certain company-wide financial performance objectives and individual goals other than for the Chief Executive Officer and Chief Financial Officer, whose bonus payments were solely tied to company-wide financial performance objectives. For fiscal 2013, the Compensation Committee tied the level of bonus payments for each of the named executive officers solely to company-wide financial performance objectives.
Determination of compensation
Our Compensation Committee is responsible for determining our compensation and benefit plans generally, and has established and reviewed all compensatory plans and arrangements with respect to our named executive officers. The Compensation Committee meets not less than four times annually to specifically review and determine adjustments, if any, to all elements of compensation, including base salary, annual bonus compensation and long-term equity awards. The Compensation Committee annually evaluates the achievement of performance goals for the prior fiscal year and sets new performance goals for the current fiscal year. The Compensation Committee also meets additionally as needed to discuss compensation-related matters as they arise during the year.
In addition, with respect to the compensation of our named executive officers, other than our Chief Executive Officer, the Compensation Committee seeks the input and recommendation of our Chief Executive Officer. Our Chief Executive Officer reviews each other named executive officer's overall performance and contribution to the Company at the end of each fiscal year and makes recommendations regarding each element of their compensation to the Compensation Committee. Our Chief Executive Officer's compensation is determined solely by the Compensation Committee. Our Chief Executive Officer does not participate in any formal discussion with the Compensation Committee regarding his compensation.
The Compensation Committee does not generally rely on formulaic guidelines for determining the mix or levels of cash and equity-based compensation, but rather maintains a flexible compensation program that allows it to adapt components and levels of compensation to motivate and reward individual executives within the context of our desire to attain certain strategic and financial goals. Subjective factors considered in compensation determinations include an executive's skills and capabilities,
69
Table of Contents
contributions as a member of the executive management team, contributions to our overall performance and the sufficiency of total compensation potential and structure to ensure the retention of an executive when considering the compensation potential that may be available elsewhere.
Except as described in the following paragraph, the Compensation Committee has generally not undertaken any formal benchmarking or reviewed any surveys commissioned by us of compensation for our competitors, but has instead relied primarily on our members' general knowledge of the competitive market. However, the Board of Directors did review salaries at similar companies for similarly-situated executives in fiscal 2011 when determining the base salary level for Mr. Wheaton, our General Counsel and Vice President, Legal and Governmental Affairs, who joined the company in February 2011.
In 2011, we engaged a compensation consultant, Pearl Meyer & Partners ("Pearl Meyer"), to conduct an overall assessment of our compensation programs and practices and to make recommendations regarding changes to our programs and practices as we transition to being a public company. Based upon the market analysis and recommendations of Pearl Meyer, among other factors, our Compensation Committee approved certain increases in the compensation of our named executive officers, effective June 1, 2012.
Components of compensation for fiscal 2013
For fiscal 2013, the compensation provided to our named executive officers consisted of base salary, annual bonus, long-term equity-based compensation, retirement benefits and other benefits, each of which is described in more detail below. We believe that the mix of cash- and equity-based compensation, as well as the relationship of fixed to performance-based compensation, is properly balanced and provides us with an effective means to attract, motivate and retain our named executive officers, as well as reward them for creation of stockholder value.
Base Salary
The base salary payable to each named executive officer is intended to provide a fixed component of compensation reflecting the executive's skill set, experience, role and responsibilities. Base salary amounts are established at the time of each named executive officer's initial employment with the Company, but are subject to upward adjustment by the Compensation Committee after its consideration of, among other factors, the scope of the executive's responsibilities, individual performance for the prior year, the mix of fixed compensation to overall compensation and consistency with what the Compensation Committee considers to be the market standard for compensation paid to similarly-situated executives at other companies.
In fiscal 2013, the Compensation Committee established a company-wide guideline that provided for an average salary increase to all employees of approximately 4% of their fiscal 2012 salary, with the actual amount of any employee's raise determined based on fiscal 2012 performance. However, with respect to each of the named executive officers, each officer's salary was established taking into account prior contractual obligations to Mr. Wheaton and the decision of the Compensation Committee to address the recommendations of Pearl Meyer in conjunction with the transition of the Company to a public company in June 2012. Mr. Wheaton's raise therefore included a contractual $50,000 increase required by his employment agreement upon the effective date of a registration statement under the Securities Act or the Exchange Act, plus the typical 4% increase made available to other employees. The salaries of each of Messrs. Hewitt, Baumgartner and Vanderpool were increased in amounts greater than the 4% made available to all employees based on the Pearl Meyer analysis, the Compensation Committee's assessment of their responsibilities as executive officers of a public company, and in Mr. Hewitt's case, in order to account for a substantial reduction in Mr. Hewitt's bonus eligibility for fiscal 2013 as part of a decision to alter the percentage mix of his salary and bonus compensation.
Based on these considerations, effective June 1, 2013, the base salaries of Messrs. Hewitt, Baumgartner, Vanderpool and Wheaton were increased to $469,000, $331,760, $267,280 and $344,240, respectively.
Annual Bonuses
We have an annual performance bonus plan (a short-term cash incentive bonus plan with annual financial, and in some cases, individual performance goals), through which we provide for cash bonus awards to certain of our senior employees, including all of our named executive officers. Annual bonuses, which are generally paid during June for the prior fiscal year's performance, are intended to compensate executives for achieving annual company-wide financial goals and, in some instances, individual performance goals. Under our bonus plan, our Compensation Committee establishes a target bonus amount (expressed as a percentage of base salary) for each of our executives that would become payable upon the achievement of our corporate performance metrics. Target bonus amounts for fiscal 2012 were 140% of base salary for Mr. Hewitt, 75% of base salary for Mr. Baumgartner, 60% of base salary for Mr. Vanderpool and 30% of base salary for Mr. Wheaton, with actual bonuses being based upon the achievement of the applicable performance objectives. In conjunction with the Company's transition to a public company, the Compensation Committee determined that although Mr. Hewitt's salary should be increased as described above, his target bonus amount should be reduced so that the bonus would not exceed his base salary to better align his compensation mix with what the Compensation Committee believed was market for public companies and to reflect data presented in the Pearl Meyer report. For that reason, target bonus amounts for fiscal 2013 (100% of base salary for Mr.
70
Table of Contents
Hewitt, 75% of base salary for Mr. Baumgartner, 60% of base salary for Mr. Vanderpool and 30% of base salary for Mr. Wheaton) were established by the Compensation Committee in June 2012, with actual bonuses to be based upon achievement of the applicable performance objectives. No bonuses were to be earned under the bonus plan unless we achieved 85% of the target for the company-wide performance metrics described below. Our Compensation Committee also had the discretion to award an additional bonus to the extent that the Company exceeded the target performance metrics.
The target bonus amounts for Messrs. Hewitt, Baumgartner, Vanderpool and Wheaton are determined by our Compensation Committee based on consideration of our overall compensation program and market standards for compensation paid to similarly-situated executives at other companies based on their general knowledge of the competitive market. For fiscal 2013, eligibility for annual bonuses to each of Messrs. Hewitt, Baumgartner, Vanderpool and Wheaton was based entirely upon achievement of company-wide performance goals relating to our revenue and net income. The performance goals for each of our named executive officers used in 2013 in determining the target bonus as a percentage of the officer's base salary are set forth below:
Name |
| Revenue |
| Net Income |
| Total Target Bonus as Percentage of Base Salary | |||
John T. Hewitt |
| 50 | % |
| 50 | % |
| 100 | % |
Mark F. Baumgartner |
| 37.5 | % |
| 37.5 | % |
| 75 | % |
T. Rufe Vanderpool |
| 30 | % |
| 30 | % |
| 60 | % |
James J. Wheaton |
| 15 | % |
| 15 | % |
| 30 | % |
For fiscal 2013, our target revenue goal as established in June 2012 was approximately $129.9 million and our target net income goal as established in June 2012 was $20.5 million (before typical adjustments for nonrecurring items). The Compensation Committee believed that these goals were ambitious but achievable. Accordingly, no bonuses were to be earned under the bonus plan for 2013 unless the following threshold amounts were achieved: (i) our revenue was at least $110.4 million, or (ii) our net income was at least $17.4 million (85% of target goals). Under the bonus plan, once the threshold amounts were achieved, payments were to be made in an amount equal to 25% of the total revenue or net income percentage for each additional 5% of the target achieved up to 100% of the target as illustrated in the table below:
Percentage of Target Achieved |
| Payout | ||
85% |
| 25 | % |
|
90% |
| 50 | % |
|
95% |
| 75 | % |
|
100% |
| 100 | % | (1) |
_______________________________________________________________________________
(1) The Compensation Committee had the discretion to award an additional bonus to the extent we exceeded the target performance metrics.
For example, if we achieved 85% of the revenue target, an officer with a 50% revenue component would receive 12.5% of the revenue bonus component (25% of 50%).
In May 2013, as had been its practice in prior years, the Compensation Committee evaluated the extent to which the named executive officers would be eligible for bonuses with respect to the Company's fiscal 2013 performance, based on the Company's unaudited financial statements available to the Compensation Committee at that time. That analysis indicated that the Company had achieved performance on the revenue and net income targets described above that would provide for each of the named executive officers to receive bonuses in the amount of 75% of their respective targeted payout amounts (i.e. results were 95% of the targeted amount). However, taking into account other metrics not included in the bonus formula, including the Company's relatively low growth in both systemwide revenue during fiscal 2013 and in total customer returns filed, the Compensation Committee considered a recommendation of Mr. Hewitt that the bonus payout for named executive officers be limited to 40% of each officer's targeted payout amount. This reduction to a 40% threshold was also consistent with the manner in which the Company paid incentive-based bonuses to other bonus-eligible employees. On this basis, the Compensation Committee approved the downward departure from the bonus formula to a 40% aggregate payout. On this basis, Messrs. Hewitt, Baumgartner, Vanderpool and Wheaton received bonus payouts in June 2013 of $187,600, $95,846, $61,680 and $39,698 respectively.
71
Table of Contents
The following table shows the calculation of the actual bonus payouts for fiscal 2013 for our named executive officers based on the performance achieved:
|
| Bonus Eligibility as a Percentage of Base Salary |
| Actual Bonus Amount as a Percentage of Base Salary |
| Actual Bonus Amount | |||||||||||
Name |
| Revenue |
| Net Income |
| Total |
| ||||||||||
John T. Hewitt |
| 37.5 | % |
| 37.5 | % |
| 75 | % |
| 40 | % |
| $ | 187,600 | | |
Mark F. Baumgartner |
| 28.1 | % |
| 28.1 | % |
| 56.2 | % |
| 30 | % |
| 95,846 | | ||
T. Rufe Vanderpool |
| 22.5 | % |
| 22.5 | % |
| 45 | % |
| 24 | % |
| 61,680 | | ||
James J. Wheaton |
| 11.25 | % |
| 11.25 | % |
| 22.5 | % |
| 12 | % |
| 39,698 | | ||
In August 2013, subsequent to the Compensation Committee's determination of bonus payouts, the Company's Audit Committee determined that based on an analysis conducted after the Company had engaged in discussion of comments received from the Staff, the Company's prior financial statements should no longer be relied upon. This determination had the effect of delaying the preparation of the Company's audited financial statements for fiscal 2013. The Compensation Committee has now reviewed the fiscal 2013 audited financial statements, and the restated financial statements for prior years in which the named executive officers received bonuses. The Compensation Committee has given due consideration to whether the bonuses awarded in May 2013 for fiscal 2013, and for prior years, should be adjusted to reflect the Company's financial performance in each of those fiscal years, based on the changes in accounting contained in both the fiscal 2013 financial statements and in the restated financial statements for prior years. After carefully considering all of the issues involved, the Compensation Committee has determined that additional adjustment of the fiscal 2013 bonuses paid in June 2013, and the potential recoupment or "clawback" of prior year bonuses, would not be appropriate. The reasons for this determination include the following:
• | Each revenue and net income target utilized for the purpose of the fiscal 2013 bonuses and for bonuses awarded in prior fiscal years was established by the Compensation Committee based on the Company's then-current revenue recognition practices. For this reason, it would be inappropriate for the Compensation Committee to recalculate fiscal 2013 bonus amounts or bonus amounts awarded in prior fiscal years, because of changes in the results in any of those fiscal years attributable to accounting changes, without also adjusting the revenue and net income targets utilized in each of those fiscal years to reflect the accounting changes. |
• | The fact that the primary adjustments contained in the fiscal 2013 financial statements and prior financial statements relate to timing differences in the recognition of revenue, rather than a fundamental change in franchise and area developer sales themselves. For this reason, the changes in revenue and net income in any particular prior fiscal year do not reflect adversely on the relative success of the Company in achieving its growth goals during those years, but merely a shift in timing of revenue recognition. |
• | The Compensation Committee took into account the expected changes to revenue and net income in establishing revised criteria for fiscal 2014 bonuses, in order to adjust for revenue changes that are solely attributable to the changes in accounting practices. |
• | The revenue targets used in fiscal 2013 and prior years did not include the gross-up of revenues to include the area developer's share of franchisee fees and royalties, so using the pre-existing revenue targets would actually increase the bonus payment in all years in which the maximum revenue target had not been achieved. |
• | Taking into account the changes in accounting practices and their effect on the audited fiscal 2013 financial statements, as compared to the unaudited draft financial statements utilized in May for the purposes of determining fiscal 2013 bonuses, the Compensation Committee determined that because of the reduction in the bonus payout to 40% described above, each of the executive officers would have been eligible for a bonus of at least the amount actually awarded even taking into account the difference in the Company's results reflected in the final audited financial statements. |
• | The restatement of financial results was based on an interpretation of accounting requirements related to revenue recognition and did not involve any misconduct. Therefore, the clawback provision contained in section 304 of the Sarbanes-Oxley Act is not applicable to either of Messrs. Hewitt or Baumgartner as the Chief Executive Officer and Chief Financial Officer of the Company. |
At its meeting on May 31, 2013, the Compensation Committee had also established the formula and targets for determining bonuses payable in fiscal 2015 based on fiscal 2014 performance. Those targets have now been adjusted by the Compensation Committee to fully reflect the accounting changes, and actually had the effect of increasing both the revenue and
72
Table of Contents
net income targets upon which the bonuses will be determined next year from those originally established in May 2013. In addition, the Compensation Committee determined that it would be appropriate for the bonus formula in fiscal 2014 to include a new component that will target the Company's systemwide revenue, a non-GAAP measure that reflects the growth in revenue of the Company's franchisee base, and that serves as a proxy for the Company's success in making its franchisees more successful. With the addition of this component, the components for each of our named executive officers to be used in fiscal 2014 in determining the target bonus as a percentage of the officer's base salary are set forth in the table below.
Name |
| Revenue |
| Net Income |
| Systemwide Revenue |
| Total Target Bonus as Percentage of Base Salary | ||||||||
John T. Hewitt |
|
| 30 | % |
|
| 30 | % |
|
| 40 | % |
|
| 100 | % |
Mark F. Baumgartner |
|
| 22.5 | % |
|
| 22.5 | % |
|
| 30 | % |
|
| 75 | % |
T. Rufe Vanderpool |
|
| 18 | % |
|
| 18 | % |
|
| 24 | % |
|
| 60 | % |
James J. Wheaton |
|
| 15 | % |
|
| 15 | % |
|
| 20 | % |
|
| 50 | % |
Long term equity compensation
1998 Stock Option Plan
Originally effective as of May 1, 1998, and as subsequently extended effective May 1, 2008, our 1998 Stock Option Plan, or the 1998 Plan, is designed to assist in attracting, retaining and motivating employees, non-employee directors and other independent contractors of outstanding ability and to promote the identification of their interests with those of the stockholders of the company.
Our Board of Directors administers the 1998 Plan and is authorized to, among other things, designate participants, grant options, determine the terms and conditions relating to options, including vesting, prescribe option agreements, interpret the stock option plan and to make any other determinations that it deems necessary or advisable for the administration of the 1998 Plan.
The Board of Directors has the ability to amend or terminate the 1998 Plan at any time, provided that no amendment or termination will be made without stockholder approval to increase the aggregate number of shares that may be issued under the plan (except in the case of certain corporate transactions as described above), to modify eligibility under the plan or to increase materially the benefits accruing to participants under the plan. The Board of Directors may also suspend or terminate the 1998 Plan at any time, provided such termination does not adversely affect the rights of any option holders. Unless sooner terminated, the 1998 Plan will terminate on April 30, 2018.
With the adoption in August 2011of the 2011 Equity and Cash Incentive Plan described below, no further options are expected to be granted under the 1998 Plan.
In determining the actual number of options awarded to our named executive officers, the Board of Directors considered our past grant practices and determined awards that were consistent with our overall compensation objectives. Those objectives include providing a substantial portion of named executive officer compensation in the form of long-term equity-based compensation and aligning our named executive officers' interests with those of our stockholders. Historically, the Board of Directors determined the actual number of options to be awarded to our named executive officers during a given fiscal year by assessing targeted long-term ownership levels and the relative percentage of total equity outstanding that each option grant represents.
Our 1998 Plan provides that the Board of Directors may determine the vesting schedule of options granted. Multi-year options granted to our senior officers, including our named executive officers, generally vest over multiple years, with a portion vesting in each year over the vesting period; each tranche expires five years from the date of vesting. The stock options granted under the 1998 Plan do not provide for accelerated vesting in the event of a termination or change of control. In the case of Mr. Wheaton, his options vest as to 40,000 shares each year on the last day of each fiscal year beginning with the fiscal year ended April 30, 2011, but vest fully and become exercisable as to all options under the grant upon the termination of Mr. Wheaton's employment by him for "good reason" as defined in his employment agreement. We believe that granting options subject to the vesting schedules described above provides us with an effective mechanism to incentivize and to retain our named executive officers and to align their interest with the long-term interests of our stockholders.
2011 Equity and Cash Incentive Plan
On August 26, 2011, in consideration of the benefits of long-term equity incentive awards and upon the recommendation of our Compensation Committee, our Board of Directors adopted the JTH Holding, Inc. 2011 Equity and Cash Incentive Plan (referred to as the "2011 Equity and Cash Incentive Plan" or the "2011 Plan"). The 2011 Plan was subsequently approved by our stockholders on August 30, 2011. The Plan provides us with the ability to utilize different types of equity incentive awards (compared to only the stock options available under the 1998 Plan) as a part of our overall compensation structure.
73
Table of Contents
Key features of the 2011 Plan include:
• | All stock options, stock appreciation rights and other purchase rights must have an exercise price that is not less than the fair market value of the underlying stock on the grant date. |
• | The maximum number of shares of our Class A Common Stock available under the 2011 Plan is 1,826,994 (as of September 26, 2013, including shares that had been previously available under the 1998 Plan). The maximum number of shares of our Class A Common Stock that may be issued under the 2011 Plan may be issued under any type of award, including incentive stock options. |
• | The 2011 Plan does not include any reload or "evergreen" share replenishment features. |
• | Without stockholder approval, we may not reprice awards or repurchase awards that are subject to forfeiture or have not yet vested. |
• | Any material amendments to the 2011 Plan require stockholder approval. |
• | The 2011 Plan is administered by our Compensation Committee. |
• | No dividends or Dividend Equivalents may be granted in connection with options, SARs or other Stock-Based Awards in the nature of purchase rights (as defined below). No dividends or Dividend Equivalents may be paid in connection with a performance-based award unless and until the underlying performance conditions are achieved, and any such dividends or dividend equivalents will accumulate (without interest) and become payable only at the time and to the extent the applicable award becomes payable or nonforfeitable. |
In fiscal 2013, no equity awards were granted to our named executive officers, because each of them had previously received multi-year option grants that already included options vesting during fiscal 2013.
Retirement Benefits
In fiscal 2013, each of our named executive officers had the opportunity to participate in our 401(k) plan on the same basis as our other employees. We believe that the 401(k) plan provides an enhanced opportunity for our named executive officers to plan for and meet their retirement savings needs. This plan is a tax-qualified retirement plan designed to meet the requirements of Sections 401(a) and 401(k) of the Internal Revenue Code of 1986, as amended (the "Code"). Under the 401(k) plan, participants may elect to make pre-tax savings deferrals of up to 86% of their compensation each calendar year, subject to annual limits on such deferrals (e.g., $17,000 in the 2012 calendar year and $17,500 in the 2013 calendar year) imposed by the Code. Participants who attain age 50 also may elect to make certain catch-up contributions, subject to a separate annual limit on such contributions ($5,500 in both the 2012 and 2013 calendar years) imposed by the Code.
We may in our discretion, on an annual basis, make a matching contribution with respect to a participant's elective deferrals and/or may make additional Company contributions. Historically, we have matched 50% of the amount contributed by a participant, up to 3% of the participant's compensation subject to applicable limits pursuant to Section 401(a)(17) of the Code. Each of our named executive officers participated in our 401(k) plan during fiscal 2013 and received matching contributions.
Perquisites and Other Benefits
In fiscal 2013, our named executive officers were eligible to receive the same benefits, including life and health benefits, which were available to all employees.
Section 162(m) and the Material Terms of the Performance Goals
The Compensation Committee may consider Section 162(m) of the Code when setting performance goals for our named executive officers. Section 162(m) of the Code generally sets a limit of $1 million on the amount of compensation that we may deduct for federal income tax purposes in any given year with respect to the compensation of each of our named executive officers. However, certain "performance-based" compensation that complies with the requirements of Section 162(m) is not included in the calculation of the $1 million cap. The Compensation Committee may consider Section 162(m)'s conditions for deductibility when structuring compensation arrangements for our executive officers, including our named executive officers. However, we believe that the Compensation Committee needs flexibility to pursue its incentive and retention objectives, even if this means that we may not be able to deduct a portion of executive compensation.
Employment/Severance, Non-Competition and Non-Solicitation Agreements
Effective June 1, 2012, we entered into employment agreements with each of Messrs. Hewitt, Baumgartner and Vanderpool, and an amended employment agreement with Mr. Wheaton, pursuant to which they will be entitled to severance benefits upon certain qualifying terminations of their respective employment. The following descriptions are summaries of these agreements and are qualified by reference to the full text of the employment agreements which are filed as exhibits to the Company's Annual Report on Form 10-K for the fiscal year ended April 30, 2012.
74
Table of Contents
Employment Agreements
As indicated above, effective June 1, 2012, we entered into employment agreements with each of the named executive officers, the material terms of which are described below.
2012 Employment Agreements. Effective June 1, 2012, we entered into employment agreements with each of Messrs. Hewitt, Baumgartner and Vanderpool. The employment agreements each provide for an initial term expiring April 30, 2014. The agreements are automatically renewed for successive one-year terms, unless the Company or the named executive officer gives the other written notice of non-renewal at least 90 days prior to the expiration of the term.
Under the new agreements, the base salaries of Messrs. Hewitt, Baumgartner and Vanderpool were increased to $469,000, $319,000 and $257,000, respectively, and those individuals will continue to be eligible to participate in the Company's annual cash bonus plan.
Messrs. Hewitt, Baumgartner and Vanderpool are entitled to employee benefits generally available to all employees. They are also provided with a PDA device.
As discussed below under "-Potential Payments on Change of Control," the employment agreements provide for severance benefits to be paid to Messrs. Hewitt, Baumgartner and Vanderpool upon certain qualifying terminations of their respective employment.
The employment agreements contain customary confidentiality, non-competition and non-solicitation provisions.
James J. Wheaton. Effective June 1, 2012, we entered into an amended and restated employment agreement with Mr. Wheaton that conforms certain terms of his prior employment agreement to the terms of the new form of agreement utilized for Messrs. Hewitt, Baumgartner and Vanderpool. The material changes that were included in the amended and restated employment agreement are discussed below under "-Potential Payments on Change of Control." The other material terms and conditions of the new agreement remain consistent with his original agreement, which was entered into effective February 7, 2011.
The agreement provides for an initial two-year term that began February 7, 2011. The agreement automatically renews for successive one-year terms, unless either party gives the other written notice of non-renewal at least 90 days prior to the expiration of the term.
Mr. Wheaton's employment entitles him to employee benefits generally available to all employees. He is also provided with a PDA device. Mr. Wheaton's employment agreement also provides that the company will pay or reimburse him for any required licenses or bar expenses related to his status as an attorney admitted to the Virginia State Bar, and for other expenses related to his bar leadership positions.
As discussed below under "-Potential Payments on Change of Control," Mr. Wheaton's agreement provides for severance benefits to be paid to him upon certain qualifying terminations.
Mr. Wheaton's employment agreement contains customary confidentiality, non-competition and non-solicitation provisions.
Compensation Risk Assessment
As part of its oversight of our executive compensation program, the Compensation Committee considers the impact of our executive compensation program, and the incentives created by the compensation awards that it administers, on our risk profile. In addition, the Compensation Committee reviews all of our compensation policies and procedures, including the incentives that they create and factors that may increase the likelihood of excessive risk taking, to determine whether they present a significant risk to us. The Compensation Committee believes that our compensation programs are designed with the appropriate balance of risk and reward in relation to our overall business strategy and that the various components of our overall compensation program, taken as a whole, do not encourage excessive risk taking. This conclusion is based on, among other factors, the level of base salaries paid by us, the balance of short-term and long-term incentive compensation, and the establishment of goals and thresholds in compensation plans and awards that are believed to be aggressive, but achievable. The Compensation Committee believes that the risks arising from our employee compensation policies and practices are not reasonably likely to have a material adverse effect on us.
75
Table of Contents
2013 Summary Compensation Table
The following table summarizes information concerning the compensation awarded to, earned by, or paid for services rendered in all capacities by our named executive officers during the years ended April 30, 2013, 2012 and 2011. The compensation described in this table does not include medical, group life insurance or other benefits that are available generally to all of our salaried employees.
Name and Principal Position |
| Fiscal Year Ended April 30, |
| Salary |
| Bonus |
| Option Awards(1) |
| Non-Equity Incentive Plan Compensation (2) |
| All Other Compensation (3) |
| Total | ||||||||||||||||||
John T. Hewitt, Chairman, President and Chief Executive Officer |
|
| 2013 |
| $ | 447,025 | |
|
| $ | - | |
|
| $ | - | |
|
| $ | 187,600 | |
| $ | 5,835 |
|
| $ | 640,460 | | ||
|
| 2012 |
| 299,619 | |
|
| - | |
|
| - | |
|
| 316,045 | |
| 4,127 |
|
| 619,791 | | |||||||||
|
| 2011 |
| 287,790 | |
|
| - | |
|
| 712,500 | |
|
| 303,849 | |
| 7,636 |
|
| 1,311,775 | | |||||||||
Mark F. Baumgartner, Chief Financial Officer |
|
| 2013 |
| 308,826 | |
|
| - | |
|
| - | |
|
| 95,846 | |
| 4,848 |
|
| 409,520 | | ||||||||
|
| 2012 |
| 237,738 | |
|
| - | |
|
| - | |
|
| 135,675 | |
| 5,184 |
|
| 378,597 | | |||||||||
|
| 2011 |
| 204,277 | |
|
| - | |
|
| - | |
|
| 118,800 | |
| 8,961 |
|
| 332,038 | | |||||||||
T. Rufe Vanderpool, Chief Operating Officer |
|
| 2013 |
| 250,854 | |
|
| - | |
|
| - | |
|
| 61,680 | |
| 7,251 |
|
| 319,785 | | ||||||||
|
| 2012 |
| 204,185 | |
|
| - | |
|
| 260,100 | |
|
| 94,500 | |
| 5,750 |
|
| 564,535 | | |||||||||
|
| 2011 |
| 161,856 | |
|
| - | |
|
| 99,900 | |
|
| 61,845 | |
| - |
|
| 323,601 | | |||||||||
James J. Wheaton, General Counsel, Vice President of Legal and Governmental Affairs |
|
| 2013 |
| 323,075 | |
|
| - | |
|
| - | |
|
| 39,698 | |
| 7,041 |
|
| 369,814 | | ||||||||
|
| 2012 |
| 269,200 | |
|
| - | |
|
| - | |
|
| 60,840 | |
| 7,476 |
|
| 337,516 | | |||||||||
|
| 2011 |
| 50,000 | | (4 | ) |
| 90,000 | | (5) |
| 606,000 | |
|
| - | |
| - |
|
| 746,000 | | ||||||||
_______________________________________________________________________________
(1) Amounts in this column reflect the grant date fair value of the options granted to each named executive officer under the Company's 1998 Stock Option Plan, calculated in accordance with ASC Topic 718, based on the fair market value, as determined by the Board of Directors, of the Company's stock on the date of grant. Assumptions used in the calculation of these amounts are included in Note 12 to the Company's audited financial statements for the fiscal year ended April 30, 2013, included in our 2013 Annual Report.
(2) Amounts in this column were paid under the Company's annual cash bonus plans for fiscal 2013, fiscal 2012 and fiscal 2011 performance, respectively.
(3) These amounts reflect the Company's matching contribution under the Company's 401(k) plan.
(4) Mr. Wheaton was employed by the Company beginning February 7, 2011. Mr. Wheaton's initial base salary was $260,000, subject to increase in accordance with the terms of his employment agreement.
(5) This amount reflects a $40,000 signing bonus received by Mr. Wheaton upon the commencement of his employment with the Company and a $50,000 minimum guaranteed bonus under the Company's 2011 annual cash bonus plan.
Grants of Plan Based Awards
The following table sets forth information regarding grants of plan based awards to each of the named executive officers during the fiscal year ended April 30, 2013.
|
|
|
|
| Estimated Future Payouts under Non-Equity Incentive Plan Awards | All Other Option Awards: Number of Securities Underlying Options |
| Exercise Price of Option Awards ($/Share) |
| Grant Date Fair Value of Option Awards | |||||||||||||||||
Name |
| Grant Date |
| ||||||||||||||||||||||||
| Threshold(1) |
| Target |
| Maximum(2) |
| |||||||||||||||||||||
John T. Hewitt |
|
|
| $ | - | | $ | 469,000 |
|
| $ | - |
|
| - | |
| $ | - | |
| $ | - | | |||
Mark F. Baumgartner |
|
|
| - | | 239,250 |
|
| - |
|
| - | |
| - | |
| - | | ||||||||
T. Rufe Vanderpool |
|
|
| - | | 154,200 |
|
| - |
|
| - | |
| - | |
| - | | ||||||||
James J. Wheaton |
|
|
| - | | 99,300 |
|
| - |
|
| - | |
| - | |
| - | | ||||||||
_______________________________________________________________________________
(1) No bonuses were to be earned under the 2013 annual bonus plan unless (i) our revenue was at least $110.4 million, or (ii) our net income was at least
$17.4 million, before typical adjustments for nonrecurring items. These numbers were determined prior to the accounting policy changes reflected in the Company's Consolidated Financial Statements.
(2) The Compensation Committee has the discretion to award an additional bonus to the extent we exceed the target performance metrics.
76
Table of Contents
Outstanding Option Awards at Year End
The following table sets forth information regarding outstanding option awards held by our named executive officers at April 30, 2013. All grants noted below were made under the Company's 1998 Stock Option Plan.
|
| Grant Date |
| Number of Securities Underlying Unexercised Options (#) |
| Option Exercise Price |
| Option Expiration Date |
| |||||||||
Name |
|
| Exercisable |
| Unexercisable |
|
|
| ||||||||||
John T. Hewitt |
|
| 6/16/2008 |
|
| 6,060 |
| - | |
| $ | 16.50 | |
| 6/16/2013 |
| ||
|
|
| 6/16/2008 |
|
| 43,940 |
| - | |
| 15.00 | |
| 6/16/2013 |
| |||
|
|
| 5/29/2009 |
|
| 6,060 |
| - | |
| 16.50 | |
| 5/29/2014 |
| |||
|
|
| 5/29/2009 |
|
| 68,940 |
| - | |
| 15.00 | |
| 5/29/2014 |
| |||
|
|
| 6/4/2010 |
|
| 24,240 |
| - | |
| 16.50 | |
|
| (1) | |||
|
|
| 6/4/2010 |
|
| 275,760 |
| - | |
| 15.00 | |
|
| (1) | |||
Mark F. Baumgartner |
|
| 6/16/2008 |
|
| 200,000 |
| - | |
| 15.00 | |
|
| (2) | |||
T. Rufe Vanderpool |
|
| 6/16/2008 |
|
| 8,000 |
| - | |
| 15.00 | |
| 6/16/2013 |
| |||
|
|
| 5/29/2009 |
|
| 10,000 |
| - | |
| 15.00 | |
| 5/29/2014 |
| |||
|
|
| 6/4/2010 |
|
| 40,000 |
| - | |
| 15.00 | |
|
| (1) | |||
|
|
| 6/3/2011 |
|
| 60,000 |
| 30,000 |
| 15.00 | |
|
| (3) | ||||
James J. Wheaton |
|
| 2/7/2011 |
|
| 120,000 |
| 80,000 |
| 15.00 | |
|
| (4) | ||||
_______________________________________________________________________________
(1) Options vest in equal annual installments in 2010, 2011, 2012 and 2013 with the expiration date for such options being five years after the date that they vest (June 4, 2015, April 15, 2016, 2017 and 2018, respectively).
(2) Options vest in equal annual installments in 2009, 2010, 2011, 2012 and 2013 with the expiration date for such options being five years after the date that they vest (April 15, 2014, 2015, 2016, 2017 and 2018, respectively).
(3) Options vest in equal annual installments in 2012, 2013 and 2014 with the expiration date for such options being five years after the date that they vest (April 15, 2017, 2018 and 2019, respectively).
(4) Options vest in equal annual installments in 2011, 2012, 2013, 2014 and 2015 with the expiration date for such options being five years after the date that they vest (April 15, 2016, 2017, 2018, 2019 and 2020, respectively).
Options Exercised and Stock Vested
The following table sets forth certain information regarding exercised stock options during the year ended April 30, 2013 for each of the named executive officers. We have not granted any other type of stock-based awards.
|
| Option Awards | |||||||
Name |
| Number of Shares Acquired on Exercise (1) |
| Value Realized on Exercise (2) | |||||
John T. Hewitt |
|
| 50,000 | |
|
| $ | 215,909 | |
Mark F. Baumgartner |
|
| 40,000 | |
|
| 411,600 | | |
T. Rufe Vanderpool |
|
| 3,781 | |
|
| 17,015 | | |
James J. Wheaton |
|
| - | |
|
| - | | |
_______________________________________________________________________________
(1) Represents the gross number of shares acquired upon exercise of vested options without taking into account any shares that may have been surrendered or withheld to cover the option exercise price or applicable tax obligations.
(2) Value realized is the gross number of options exercised multiplied by the difference between the fair market value of our Class A common stock on the date of exercise and the exercise price.
Non-Qualified Deferred Compensation for Fiscal Year 2013
In 2012, we adopted our Non-Qualified Deferred Compensation Plan ("NQDCP"), which became effective December 1, 2012. The NQDCP provides that executives who meet minimum compensation requirements are eligible to defer up to 100% of their salaries and up to 100% of their bonuses. We have agreed to credit the participants' contributions with earnings that reflect the performance of certain independent investment funds. The benefits under this plan are unsecured and are general
77
Table of Contents
assets of the Company. Participants are generally eligible to receive payment of their vested benefit at the end of their elected deferral period or after termination of their employment with the Company for any reason or at a later date to comply with the restrictions of Section 409A. Participants may elect to receive their payments in a lump sum or installments. The Company does not make matching or other discretionary contributions to participant accounts.
The following table shows the non-qualified deferred compensation activity for each of the named executive officers who participated in our NQDCP during fiscal 2013.
|
| Executive Contributions in Fiscal 2013 (1) |
| Aggregate Earnings in Fiscal 2013 (2) |
| Aggregate Withdrawals/ Distributions |
| Aggregate Balance at April 30, 2013 (3) | |||||||
Name |
|
| |||||||||||||
James J. Wheaton |
| $ | 8,821 | |
| $ | 490 | |
| $ | - | |
| $ | 9,311 |
_______________________________________________________________________________
(1) Amounts shown in this column for the NQDCP are included in the "Salary" column of the "Summary Compensation Table."
(2) The amounts shown in this column are not included in the "Summary Compensation Table" because they are not preferential or above market.
(3) The following amounts contributed to the NQDCP by the executive have also been reported in the Summary Compensation Table as compensation for fiscal 2013; Mr. Wheaton, $9,311.
Potential Payments on Change of Control
None of our named executive officers has a change in control agreement. However, the employment agreements we have entered into with each of Messrs. Hewitt, Baumgartner, Vanderpool and Wheaton entitle them to certain payments under their respective employment agreements upon certain qualifying terminations.
Messrs. Hewitt, Baumgartner and Vanderpool. Under the employment agreements with Messrs. Hewitt, Baumgartner and Vanderpool, each named executive officer is entitled to certain payments if his employment is terminated by him for Good Reason (as defined under the form of agreement), by us without Cause (as defined under the form of agreement) or as a result of the named executive officer's Employment-Related Death or Disability (as defined under the form of agreement).
If the named executive officer's employment is terminated by him for Good Reason, by us without Cause or as a result of his Employment-Related Death or Disability, he is entitled to the following: (i) the payment of his base salary through the date of termination; (ii) the payment of an amount equal to his monthly base salary multiplied by 18; (iii) the payment of an amount equal to the pro-rated bonus to which he would have been entitled; (iv) the accelerated vesting of any incentive stock awards, including options, that were not vested as of the date of his termination; (v) continued coverage at our expense under any medical, dental, life insurance and disability policies for a period of 18 months, unless the named executive officer becomes reemployed with another employer and is eligible to receive such welfare benefits from that employer; and (vi) any other amounts or benefits required to be paid to the named executive officer or that he is eligible to receive under any plan, program, policy or practice or contract or agreement with us.
If the named executive officer's employment is terminated by him without Good Reason, by us for Cause or due to his Disability (as defined under the form of agreement), other than as a consequence of Employment-Related Death or Disability, the named executive officer is only entitled to the payment of his salary through the date of termination.
If the named executive officer's employment is terminated as a result of his death or Disability (other than as a consequence of Employment-Related Death or Disability), he is entitled to his base salary through the date of his termination, as well as the pro-rata bonus to which he would have been entitled.
Mr. Wheaton. Under his employment agreement, Mr. Wheaton is entitled to certain payments if his employment is terminated by him for Good Reason (as defined under the agreement) or by us without Cause (as defined under the agreement).
If Mr. Wheaton's employment is terminated by him for Good Reason or by us without Cause, he is entitled to the following: (i) the payment of his base salary through the date of termination; (ii) the payment of an amount equal to his monthly base salary multiplied by 24; (iii) the payment of an amount equal to two times the pro-rated bonus to which he would have been entitled; (iv) the accelerated vesting of any incentive stock awards, including options, that were not vested as of the date of his termination; (v) continued coverage at our expense under any medical, dental, life insurance and disability policies for a period of two years, unless Mr. Wheaton becomes reemployed with another employer and is eligible to receive such welfare benefits from that employer; and (vi) any other amounts or benefits required to be paid to Mr. Wheaton or that he is eligible to receive under any plan, program, policy or practice or contract or agreement with us.
If Mr. Wheaton's employment is terminated by him without Good Reason or by us for Cause, Mr. Wheaton is only entitled to the payment of his salary through the date of termination.
78
Table of Contents
If Mr. Wheaton's employment is terminated as a result of his death or disability, he is entitled to his base salary through the date of his termination, as well as the pro-rata bonus to which he would have been entitled. However, Mr. Wheaton would receive the same payments that he receives upon a termination for Good Reason or by us without Cause in the event of his Employment-Related Death or Disability (as defined under his amended and restated agreement).
Mr. Wheaton's employment agreement currently provides that with respect to a termination by him for Good Reason or by us without Cause after February 7, 2014, the monthly base salary component of his severance payment would be reduced to his monthly base salary multiplied by 12. His continuation of benefits would likewise be reduced to a period of one year, and the multiplier on his pro-rated bonus would be eliminated. After February 7, 2016, when Mr. Wheaton will have been employed by us for more than 5 years, his benefits upon a termination by him for Good Reason, by us without Cause or as a result of his Employment-Related Death or Disability would be on the same basis as provided for Messrs. Hewitt, Baumgartner and Vanderpool, as described above.
79
Table of Contents
The following table shows the potential payments upon each named executive officer's termination. The amounts calculated in the table assume the termination occurred on April 30, 2013 and that the executive officer was paid in a lump sum payment.
|
|
|
|
|
|
|
|
|
|
| ||||||||||
| Severance Compensation |
| Benefits and Perquisites |
|
| |||||||||||||||
Executive | Severance | Bonus |
| Unvested Stock Options (1) | Welfare Benefits | Total | ||||||||||||||
John T. Hewitt |
|
|
|
|
|
|
|
|
| |||||||||||
Voluntary termination without Good Reason | $ | - | |
| $ | - | |
| $ | - | |
| $ | - | |
| $ | - |
| |
Voluntary termination for Good Reason | 703,500 | |
| 187,600 | |
| - | |
| 18,096 | |
| 909,196 |
| ||||||
Termination by Company for Cause | - | |
| - | |
| - | |
| - | |
| - |
| ||||||
Termination by Company without Cause | 703,500 | |
| 187,600 | |
| - | |
| 18,096 | |
| 909,196 |
| ||||||
Employment-Related Death or Disability | 703,500 | |
| 187,600 | |
| - | |
| 18,096 | |
| 909,196 |
| ||||||
Other death | - | |
| 187,600 | |
| - | |
| - | |
| 187,600 |
| ||||||
Other disability | - | |
| 187,600 | |
| - | |
| - | |
| 187,600 |
| ||||||
Mark F. Baumgartner |
|
|
|
|
|
|
|
| | |||||||||||
Voluntary termination without Good Reason | - | |
| - | |
| - | |
| - | |
| - |
| ||||||
Voluntary termination for Good Reason | 478,500 | |
| 95,846 | |
| - | |
| 22,017 | |
| 596,363 |
| ||||||
Termination by Company for Cause | - | |
| - | |
| - | |
| - | |
| - |
| ||||||
Termination by Company without Cause | 478,500 | |
| 95,846 | |
| - | |
| 22,017 | |
| 596,363 |
| ||||||
Employment-Related Death or Disability | 478,500 | |
| 95,846 | |
| - | |
| 22,017 | |
| 596,363 |
| ||||||
Other death | - | |
| 95,846 | |
| - | |
| - | |
| 95,846 |
| ||||||
Other disability | - | |
| 95,846 | |
| - | |
| - | |
| 95,846 |
| ||||||
T. Rufe Vanderpool |
|
|
|
|
|
|
|
| | |||||||||||
Voluntary termination without Good Reason | - | |
| - | |
| - | |
| - | |
| - |
| ||||||
Voluntary termination for Good Reason | 385,500 | |
| 61,680 | |
| 67,500 | |
| 27,923 | |
| 542,603 |
| ||||||
Termination by Company for Cause | - | |
| - | |
| - | |
| - | |
| - |
| ||||||
Termination by Company without Cause | 385,500 | |
| 61,680 | |
| 67,500 | |
| 27,923 | |
| 542,603 |
| ||||||
Employment-Related Death or Disability | 385,500 | |
| 61,680 | |
| - | |
| 27,923 | |
| 475,103 |
| ||||||
Other death | - | |
| 61,680 | |
| - | |
| - | |
| 61,680 |
| ||||||
Other disability | - | |
| 61,680 | |
| - | |
| - | |
| 61,680 |
| ||||||
James J. Wheaton |
|
|
|
|
|
|
|
|
| |||||||||||
Voluntary termination without Good Reason | - | |
| - | |
| - | |
| - | |
| - |
| ||||||
Voluntary termination for Good Reason | 662,000 | |
| 39,698 | |
| 180,000 | |
| 37,231 | |
| 918,929 |
| ||||||
Termination by Company for Cause | - | |
| - | |
| - | |
| - | |
| - |
| ||||||
Termination by Company without Cause | 662,000 | |
| 39,698 | |
| 180,000 | |
| 37,231 | |
| 918,929 |
| ||||||
Employment-Related Death or Disability | 662,000 | |
| 39,698 | |
| - | |
| 37,231 | |
| 738,929 |
| ||||||
Other death | - | |
| 39,698 | |
| - | |
| - | |
| 39,698 |
| ||||||
Other disability | - | |
| 39,698 | |
| - | |
| - | |
| 39,698 |
| ||||||
______________________________________________________________________________
(1) Calculated based on the closing price of the Company's Class A Common stock on April 30, 2013, which was $17.25 per share; and the exercise price of unvested options, which is $15.00 per share.
Compensation Committee Interlocks and Insider Participation
Messrs. D'Angelo, Golding and Ibbotson served as members of our Compensation Committee in fiscal 2013. None of the current members of our Compensation Committee is or has at any time during the past year been one of our officers or employees. None of our executive officers currently serves, or in the past year has served, as a member of the Board of Directors or Compensation Committee of any entity that has one or more executive officers serving on our Board of Directors or Compensation Committee. For a description of related party transactions involving members of our Compensation Committee, see "Item 13-Certain Relationships and Related Transactions, and Director Independence."
80
Table of Contents
Item 12. Security Ownership of Certain Beneficial Owners and Management And Related Stockholder Matters.
Securities Authorized for Issuance Under Equity Compensation Plans
We have two compensation plans under which, as of April 30, 2013, our securities are authorized for issuance, as follows:
Plan category | | Number of securities to be issued upon exercise of outstanding options, warrants and rights |
| Weighted-average exercise price of outstanding options, warrants and rights |
| Number of securities remaining available for future issuance under equity compensation plans (excluding securities reflected in column (a)) | ||||
| | (a) |
| (b) |
| (c) | ||||
Equity compensation plans approved by security holders | |
|
|
|
|
| ||||
1998 Stock Option Plan | | 2,270,125 | |
| $ | 14.79 | |
| - | |
2011 Equity and Cash Incentive Plan | | 264,558 | |
| 15.00 | |
| 2,027,439 | | |
Equity compensation plans not approved by security holders | | - | |
| - | |
| - | | |
Total | | 2,534,683 | |
| $ | 14.81 | |
| 2,027,439 | |
Security Ownership of Certain Beneficial Owners and Management
The following table sets forth, as of September 16, 2013, information regarding beneficial ownership of our capital stock by:
• | each person, or group of affiliated persons, known by us to beneficially own more than 5% of our Class A common stock or Class B common stock; |
• each of our directors;
• each of our named executive officers; and
• all of our directors and executive officers as a group.
Beneficial ownership is determined according to the rules of the SEC and generally means that a person has beneficial ownership of a security if he, she or it possesses sole or shared voting or investment power of that security, including options that are currently exercisable or exercisable within 60 days of September 16, 2013. Except as indicated by the footnotes below, we believe, based on the information furnished to us, that the persons named in the table below have sole voting and investment power with respect to all shares of capital stock shown that they beneficially own, subject to community property laws where applicable.
Our calculation of the percentage of beneficial ownership is based on 13,023,265 of our Class A common stock (including shares issuable as a result of the conversion of exchangeable shares) and 900,000 shares of our Class B common stock outstanding as of September 16, 2013.
Class A common stock subject to stock options currently exercisable or exercisable within 60 days of September 16, 2013, are deemed to be outstanding for computing the percentage ownership of the person holding these options and the percentage ownership of any group of which the holder is a member but are not deemed outstanding for computing the percentage of any other person.
Unless otherwise noted below, the address for each of the stockholders in the table below is c/o JTH Holding, Inc., 1716 Corporate Landing Parkway, Virginia Beach, Virginia 23454.
81
Table of Contents
|
| Shares of Common Stock Beneficially Owned | |||||
|
| Number |
| Percent | |||
5% Stockholders: |
|
|
|
|
| ||
Datatax Business Services Limited(1) |
|
| 4,680,000 | |
| 33.6 | % |
Edison Venture Fund IV, L.P.(2) |
|
| 1,204,200 | |
| 8.6 | % |
Envest Funds(3) |
|
| 881,097 | |
| 6.3 | % |
Named Executive Officers and Directors: |
|
|
|
|
| ||
Mark F. Baumgartner(4) |
|
| 285,984 | |
| 2 | % |
Gordon D'Angelo(5) |
|
| 24,000 | |
| * | |
John R. Garel(3) |
|
| 889,724 | |
| 6.4 | % |
Gary P. Golding(2) |
|
| 1,204,200 | |
| 8.6 | % |
John T. Hewitt(6) |
|
| 2,403,422 | |
| 16.6 | % |
Steven Ibbotson(1)(7) |
|
| 4,856,908 | |
| 34.8 | % |
Ross N. Longfield(8) |
|
| 42,530 | |
| * | |
Ellen M. McDowell(9) |
|
| 91,387 | |
| * | |
George T. Robson(10) |
|
| 144,931 | |
| 1 | % |
T. Rufe Vanderpool(11) |
|
| 113,781 | |
| * | |
James J. Wheaton(12) |
|
| 124,000 | |
| * | |
All executive officers and directors as a group (11 persons)(13) |
|
| 10,180,867 | |
| 67.4 | % |
______________________________________________________________________________
* Represents beneficial ownership of less than 1%.
(1) Includes 1,000,000 shares of Class A common stock issuable upon the exchange of the exchangeable shares. Steven Ibbotson, one of our directors, together with his immediate family, owns a 100% interest in Datatax. As a result, pursuant to Rule 13d-3 under the Exchange Act, Mr. Ibbotson is deemed to own the 4,680,000 shares of Class A common stock held by Datatax. The address for Datatax Business Services Limited is 2109 Oxford St., London, Ontario, Canada NSY 553.
(2) Mr. Golding, one of our directors, is a General Partner of Edison Partners IV, L.P., the manager of Edison Venture Fund IV, L.P. and, as a result, pursuant to Rule 13d-3 under the Exchange Act, is deemed to beneficially own the 1,204,200 shares of Class A common stock held by Edison Venture Fund IV, L.P. The address for Edison Venture Fund IV, L.P. is 1009 Lenox Drive #4, Lawrenceville, New Jersey 08648.
(3) Includes (i) 8,627 shares of Class A common stock issuable pursuant to stock options exercisable within 60 days of September 16, 2013 and (ii) 120,134 shares of Class A common stock owned by Envest II, LLC and 11,500 shares of Class A common stock issuable pursuant to stock options exercisable within 60 days of September 16, 2013 held by Envest II, LLC, the voting power of which is held by Envest Management II, LLC, the Manager for Envest II, LLC; and (iii) 710,963 shares of Class A common stock owned by Envest III, LLC and 38,500 shares of Class A common stock issuable pursuant to stock options exercisable within 60 days of September 16, 2013 held by Envest III, LLC, the voting power of which is held by Envest Management III, LLC, the Manager for Envest III, LLC. Mr. Garel, one of our directors, is a manager of both Envest Management II and Envest Management III and, as a result, pursuant to Rule 13d-3 under the Exchange Act, is deemed to beneficially own the 881,097 shares of Class A common stock held by Envest II and Envest III. The address for Envest II and Envest III is 2101 Parks Avenue, Suite 401, Virginia Beach, Virginia 23451.
(4) Includes 10,083 shares of Class A common stock held in our 401(k) plan and 200,000 shares of Class A common stock issuable pursuant to stock options exercisable within 60 days of September 16, 2013.
(5) Includes 20,000 shares of Class A common stock issuable pursuant to stock options exercisable within 60 days of September 16, 2013.
(6) Includes 900,000 shares of Class B common stock, 138,912 shares of Class A common stock held in our 401(k) plan and 375,000 shares of Class A common stock issuable pursuant to stock options exercisable within 60 days of September 16, 2013.
(7) Includes (i) 38,627shares of Class A common stock issuable pursuant to stock options exercisable within 60 days of September 16, 2013 and (ii) 8,400 shares of Class A common stock owned by 714718 Alberta, Ltd. Steven Ibbotson, one of our directors, owns a 100% interest in 714718 Alberta, Ltd. As a result, pursuant to Rule 13d-3 under the Exchange Act, Mr. Ibbotson is deemed to own the 8,400 shares of Class A common stock held by 714718 Alberta, Ltd. The address for 714718 Alberta, Ltd. is #150 3015 5th Avenue NE, Calgary, Alberta Canada, T2A6T8.
(8) Includes 38,627 shares of Class A common stock issuable pursuant to stock options exercisable within 60 days of September 16, 2013.
(9) Includes 30,000 shares of Class A common stock issuable pursuant to stock options exercisable within 60 days of September 16, 2013 and 15,000 shares held in a trust of which she is the trustee.
(10) Includes 38,627 shares of Class A common stock issuable pursuant to stock options exercisable within 60 days of September 16, 2013.
(11) Includes 110,000 shares of Class A common stock issuable pursuant to stock options exercisable within 60 days of September 16, 2013.
(12) Includes 120,000 shares of Class A common stock issuable pursuant to stock options exercisable within 60 days of September 16, 2013.
(13) Includes 900,000 shares of Class B common stock, 148,995 shares of Class A common stock held in our 401(k) plan and 1,029,508 shares of Class A common stock issuable pursuant to stock options exercisable within 60 days of September 16, 2013.
Item 13. Certain Relationships and Related Transactions, and Director Independence.
Other than compensation arrangements, we describe below transactions and series of similar transactions, during our last fiscal year, to which we were a party or will be a party, in which:
• | the amounts involved exceeded or will exceed $120,000; and |
82
Table of Contents
• | any of our directors, executive officers or holders of more than 5% of our common stock, or any member of the immediate family of the foregoing persons, had or will have a direct or indirect material interest. |
Compensation arrangements for our directors and named executive officers are described in other sections of this annual report.
Stock issuances and repurchases
In the fiscal year ended April 30, 2013, we repurchased an aggregate of 166,235 shares of our Class A common stock from certain of our directors, executive officers and holders of more than 5% of our Class A common stock for an aggregate repurchase price of approximately $15.72.
During fiscal 2013, we repurchased shares of our Class A common stock from the following persons in the following amounts: Mark Baumgartner ($436,965), John T. Hewitt ($415,540), Ross Longfield ($105,000), George Robson ($313,560), Rufe Vanderpool ($39,705) and Edison Venture Fund IV, L.P. ($1,302,426). The repurchases for Mark Baumgartner ($436,965), John T. Hewitt ($415,540), George Robson ($208,560) and Edison Venture Fund IV, L.P. ($1,302,426) took place during the fiscal quarter ended April 30, 2013. Information regarding purchases of such shares from affiliates of the Company is provided in other sections of this annual report. Repurchases conducted during fiscal 2013, prior to going public, were at a price of $15.00 per share, which was based on the fair value of our shares at those dates. Repurchases after we were public were effected at a repurchase price of $15.80 per share, which was based on the average closing price of the Class A Common Stock for the five trading days prior to the date of repurchase.
Policy for review of related party transactions
We have adopted a policy that our executive officers, directors, nominees for election as a director, beneficial owners of more than 5% of any class of our common stock and any members of the immediate family of any of the foregoing persons are not permitted to enter into a related person transaction with us without the prior consent of our Audit Committee. Any request for us to enter into a transaction with an executive officer, director, nominee for election as a director, beneficial owner of more than 5% of any class of our common stock or any member of the immediate family of any of the foregoing persons, in which the amount involved exceeds $120,000 and such person would have a direct or indirect interest must first be presented to our Audit Committee for review, consideration and approval. In approving or rejecting any such proposal, our Audit Committee is to consider the material facts of the transaction, including, but not limited to, whether the transaction is on terms no less favorable than terms generally available to an unaffiliated third party under the same or similar circumstances and the extent of the related person's interest in the transaction. All of the transactions described above were entered into after presentation, consideration and approval by our Board of Directors.
Director Independence
Our Board of Directors has undertaken a review of its composition, the composition of its committees and the independence of each director. Based on the review of each director's background, employment and affiliations, including family relationships, the Board of Directors has determined that six of our eight directors are "independent" under the rules and regulations of the SEC and NASDAQ. In making this determination, our Board of Directors considered the current and prior relationships that each non-employee director has with our company and all other facts and circumstances our Board of Directors deemed relevant in determining their independence, including the beneficial ownership of our capital stock. Mr. Hewitt was not deemed independent as a result of his service as our Chief Executive Officer and Ms. McDowell is not deemed independent as a result of her familial relationship with Mr. Hewitt, as described in Item 10.
Item 14. Principal Accounting Fees and Services.
The following table presents fees for professional services rendered by KPMG LLP for the audit of our annual financial statements for the fiscal years ended April 30, 2013 and 2012, and fees billed for other services rendered by KPMG LLP for those years. Fees disclosed below include fees actually billed and expected to be billed for services relating to the applicable fiscal year.
Fiscal Year |
| 2013 |
| 2012 | ||||
Audit fees |
| $ | 662,135 | |
| $ | 587,580 | |
Tax fees |
| 48,274 | |
| 162,654 | | ||
All other fees |
| 1,650 | |
| 1,650 | | ||
Total fees |
| $ | 712,059 | |
| $ | 751,884 | |
Audit fees consist of fees for professional services rendered for the audit of the Company's financial statements and review of financial statements included in our quarterly reports and services typically provided by the independent auditor in connection with statutory and regulatory filings or engagements. In addition, audit fees for fiscal 2013 include $330,000 in fees
83
Table of Contents
incurred in connection with the restatement and audit fees for fiscal 2012 include $285,010 in fees incurred in connection with our planned initial public offering and registration statements filings.
Tax fees consist of fees for services related to tax compliance, tax planning, tax consultation and tax advice. The amounts included in the table above consist of fees incurred relating to tax credit studies and other tax advisory services.
The Audit Committee has adopted policies and procedures for pre-approving audit and non-audit services performed by the independent auditor so that the provision of such services does not impair the auditor's independence. Under the Audit Committee's pre-approval policy, the terms and fees of all engagements require specific Audit Committee approval.
In determining whether to pre-approve audit or non-audit services, the Audit Committee considers whether such services are consistent with the SEC's rules on auditor independence. The Audit Committee also considers whether the independent auditor is best positioned to provide the most effective and efficient service and whether the service might enhance our ability to manage or control risk or improve audit quality. These factors are considered as a whole and no one factor is necessarily determinative. The Audit Committee considers the relationship between fees for audit and non-audit services in deciding whether to pre-approve any such services. The Audit Committee may determine for each fiscal year the appropriate ratio between fees for audit services and fees for audit-related services, tax services and all other services.
The Audit Committee may delegate pre-approval authority to one or more of its members. The member or members to whom such authority is delegated are required to report any pre-approval decisions to the Audit Committee at its next scheduled meeting.
The Audit Committee has concluded that the provision of non-audit services provided to the Company by its independent accountant during the 2013 fiscal year was compatible with maintaining the independent accountant's independence.
84
Table of Contents
PART IV
Item 15. Exhibits and Financial Statement Schedules
(a) | Financial Statements. |
The following financial statements of the Company are included in Item 8 of this Annual Report on Form 10-K:
Audited Financial Statements for the Years Ended April 30, 2013, 2012 and 2011
| Page | |
Report of Independent Registered Public Accounting Firm |
| F-1 |
Consolidated Balance Sheets as of April 30, 2013 and 2012 |
| F-2 |
Consolidated Statements of Income for the Years Ended April 30, 2013, 2012 and 2011 |
| F-3 |
Consolidated Statements of Comprehensive Income for the Years Ended April 30, 2013, 2012 and 2011 |
| F-4 |
Consolidated Statement of Stockholders' Equity for the Year Ended April 30, 2013 |
| F-5 |
Consolidated Statement of Stockholders' Equity for the Year Ended April 30, 2012 |
| F-6 |
Consolidated Statement of Stockholders' Equity for the Year Ended April 30, 2011 |
| F-7 |
Consolidated Statements of Cash Flows for the Years Ended April 30, 2013, 2012 and 2011 |
| F-8 |
Notes to Consolidated Financial Statements |
| F-11 |
85
Table of Contents
(b) | Exhibits. |
Exhibit Number |
| Exhibit Description | |
3.1 | |
| Amended and Restated Certificate of Incorporation of JTH Holding, Inc. (incorporated by reference to Exhibit 3.1 to Form S-1, File No. 333-176655 filed on September 2, 2011). |
3.2 | |
| Amended and Restated Bylaws of JTH Holding, Inc. (incorporated by reference to Exhibit 3.2 to Form S-1, File No. 333-176655 filed on September 2, 2011). |
4.3 | |
| Share Exchange Agreement among DataTax Business Services Limited, Liberty Tax Holding Corporation, Liberty Tax Service Inc. and JTH Tax, Inc. dated as of October 16, 2001 (incorporated by reference to Exhibit 4.3 to Form S-1, File No. 333-176655 filed on September 2, 2011). |
4.4 | |
| Support Agreement between JTH Tax, Inc. and Liberty Tax Holding Corporation dated as of October 16, 2001(incorporated by reference to Exhibit 4.4 to Form S-1, File No. 333-176655 filed on September 2, 2011). |
4.5 | |
| Specimen Common Stock Certificate of JTH Holding, Inc. (Incorporated by reference to Exhibit 4.5 to Amendment No. 2 to Form 10, File No. 000-54660 dated June 1, 2012). |
10.1 | |
| JTH Holding, Inc. 2011 Equity and Cash Incentive Plan (incorporated by reference to Exhibit 10.1 to Amendment No. 3 to Form S-1, File No. 333-176655 filed on February 3, 2012). |
10.2 | |
| JTH Tax, Inc. Stock Option Plan dated as of May 1, 1998 (incorporated by reference to Exhibit 10.2 to Form S-1, File No. 333-176655 filed on September 2, 2011). |
10.3 | |
| Form of Stock Option Agreement under Stock Option Plan (incorporated by reference to Exhibit 10.3 to Form S-1, File No. 333-176655 filed on September 2, 2011). |
10.4 | |
| Form of Incentive Stock Option Agreement for Employees via JTH Holding, Inc. 2011 Equity and Cash Incentive Plan (incorporated by reference to Exhibit 10.7 to Amendment No. 5 to Form S-1, File No. 333-176655 filed on October 15, 2012). |
10.5 | |
| Form of Restricted Stock Unit Agreement for Employees via JTH Holding, Inc. 2011 Equity and Cash Incentive Plan (filed herewith). |
10.6 | |
| Employment Agreement for John T. Hewitt dated June 1, 2012 (incorporated by reference to Exhibit 10.1, of Form 8-K, File No. 000-54660 filed on June 14, 2012). |
10.7 | |
| Employment Agreement for Mark F. Baumgartner dated June 1, 2012 (incorporated by reference to Exhibit 10.2 of Form 8-K, File No. 000-54660 filed on June 14, 2012). |
10.8 | |
| Employment Agreement for T. Rufe Vanderpool dated June 1, 2012 (incorporated by reference to Exhibit 10.3 of Form 8-K, File No. 000-54660 filed on June 14, 2012). |
10.9 | |
| Amended and Restated Employment Agreement for James J. Wheaton dated June 1, 2012 (incorporated by reference to Exhibit 10.4 of Form 8-K, File No. 000-54660 filed on June 14, 2012). |
10.10 | |
| Revolving Credit and Term Loan Agreement dated as of April 30, 2012 among JTH Holding, Inc. and SunTrust Bank (incorporated by reference to Exhibit 10.7 to Amendment No. 1 to Form 10, File No. 000-54660 filed on May 18, 2012). |
10.11 | |
| Security Agreement among JTH Holding, Inc. and certain of its subsidiaries and SunTrust Bank dated as of April 30, 2012 (incorporated by reference to Exhibit 10.8 to Amendment No. 1 to Form 10, File No. 000-54660 filed on May 18, 2012). |
86
Table of Contents
Exhibit Number |
| Exhibit Description | |
10.12 | |
| Pledge Agreement among JTH Holding, Inc. and certain of its subsidiaries and SunTrust Bank dated as of April 30, 2012 (incorporated by reference to Exhibit 10.9 to Amendment No. 1 to Form 10, File No. 000-54660 filed on May 18, 2012). |
10.13 | |
| Subsidiary Guaranty Agreement among certain subsidiaries of JTH Holding, Inc. and SunTrust Bank dated April 30, 2012 (incorporated by reference to Exhibit 10.10 to Amendment No. 1 to Form 10, File No. 000-54660 filed on May 18, 2012). |
10.14 | |
| Waiver and Amendment to Revolving Credit and Term Loan Agreement dated as of December 19, 2012 among JTH Holding, Inc. and SunTrust Bank (incorporated by reference to Exhibit 10.1 to Form 8-K, File No. 000-1104659 filed on December 26, 2012). |
10.15 | |
| Supplement and Joinder Agreement dated as of December 28, 2012 among JTH Holding, Inc. and SunTrust Bank (incorporated by reference to Exhibit 10.1 to Form 8-K, File No. 000-1104659 filed on December 18, 2012). |
10.16 | |
| Waiver to Revolving Credit and Term Loan Agreement with SunTrust Bank as Administrative Agent (incorporated by reference to Exhibit 10.1 to Form 8-K, File No. 000-1104659 filed on March 12, 2013). |
10.17 | |
| Standstill Agreement between JTH Holding, Inc., SunTrust Bank and certain of JTH Holding, Inc.'s subsidiaries dated as of August 5, 2013 (incorporated by reference to Exhibit 10.1 to Form 8-K, File No. 001-35588 filed on August 6, 2013). |
10.18 | |
| Waiver to Revolving Credit and Term Loan Agreement with SunTrust Bank as Administrative Agent dated as of August 29, 2013 (incorporated by reference to Exhibit 10.1 to Form 8-K, File No. 001-35588 filed on August 29, 2013). |
10.19 | | † | Amended and Restated Distributor Agreement between NetSpend Corporation and JTH Tax, Inc. dated as of June 1, 2010 (incorporated by reference to Exhibit 10.17 to Amendment No. 2 to Form S-1, File No. 333-176655 filed on November 7, 2011). |
10.20 | |
| Form of Franchise Agreement for United States Franchisees (filed herewith). |
10.21 | |
| Form of Area Developer Agreement for United States Area Developers (filed herewith). |
21.1 | |
| Subsidiaries of JTH Holding, Inc. (incorporated by reference to Exhibit 21.1 to Form 10, File No. 000-54660 dated April 18, 2012). |
23.1 | |
| Consent of KPMG LLP (filed herewith). |
31.1 | |
| Certification of the Chief Executive Officer pursuant to Section 302 of the Sarbanes Oxley Act of 2002 (filed herewith). |
31.2 | |
| Certification of the Chief Financial Officer pursuant to Section 302 of the Sarbanes Oxley Act of 2002 (filed herewith). |
32.1 | |
| Certification of the Chief Executive Officer pursuant to Section 906 of the Sarbanes Oxley Act of 2002 (filed herewith). |
32.2 | |
| Certification of the Chief Financial Officer pursuant to Section 906 of the Sarbanes Oxley Act of 2002 (filed herewith). |
_______________________________________________________________________________
† Confidential treatment has been requested for the redacted portions of this agreement. A complete copy of the agreement, including the redacted portions, has been filed separately with the Securities and Exchange Commission.
87
Table of Contents
SIGNATURES
Pursuant to the requirements of Section 13 or 15(d) of the Securities Exchange Act of 1934, the registrant has duly caused this report to be signed on its behalf by the undersigned, thereunto duly authorized.
|
| JTH HOLDING, INC.. (Registrant) | ||
Dated: October 1, 2013 |
| By: |
| /s/ JOHN T. HEWITT |
|
|
| John T. Hewitt | |
Dated: October 1, 2013 |
| By: |
| /s/ MARK F. BAUMGARTNER |
|
|
| Mark F. Baumgartner | |
Dated: October 1, 2013 |
| By: |
| /s/ THOMAS S. DANIELS |
|
|
| Thomas S. Daniels | |
KNOW ALL MEN BY THESE PRESENTS, that each of the undersigned whose signature appears below constitutes and appoints John T. Hewitt and Mark F. Baumgartner, his true and lawful attorneys-in-fact, with full power of substitution and resubstitution for him and on his behalf, and in his name, place and stead, in any and all capacities to execute and sign any and all amendments or post-effective amendments to this Annual Report on Form 10-K, and to file the same, with all exhibits thereto, and other documents in connection therewith, with the Securities and Exchange Commission, hereby ratifying and confirming all that said attorneys-in-fact or any of them or their or his substitute or substitutes, may lawfully do or cause to be done by virtue hereof and the registrant hereby confers like authority on its behalf.
Pursuant to the requirements of the Securities Exchange Act of 1934, this report has been signed below by the following persons on behalf of the registrant and in the capacities and on the dates indicated.
Dated: October 1, 2013 |
| By: |
| /s/ JOHN T. HEWITT |
|
|
|
| John T. Hewitt |
Dated: October 1, 2013 |
| By: |
| /s/ MARK F. BAUMGARTNER |
|
|
| Mark F. Baumgartner | |
Dated: October 1, 2013 |
| By: |
| /s/ THOMAS S. DANIELS |
|
|
| Thomas S. Daniels | |
Dated: October 1, 2013 |
| By: |
| /s/ GORDON D'ANGELO |
|
|
| Gordon D'Angelo | |
Dated: October 1, 2013 |
| By: |
| /s/ JOHN R. GAREL |
|
|
| John R. Garel | |
Dated: October 1, 2013 |
| By: |
| /s/ GARY P. GOLDING |
|
|
| Gary P. Golding | |
Dated: October 1, 2013 |
| By: |
| /s/ STEVEN IBBOTSON |
|
|
| Steven Ibbotson | |
88
Table of Contents
Dated: October 1, 2013 |
| By: |
| /s/ ROSS LONGFIELD |
|
|
| Ross Longfield | |
Dated: October 1, 2013 |
| By: |
| /s/ ELLEN MCDOWELL |
|
|
| Ellen McDowell | |
Dated: October 1, 2013 |
| By: |
| /s/ GEORGE T. ROBSON |
|
|
| George T. Robson | |
89
Table of Contents
JTH HOLDING, INC. AND SUBSIDIARIES
Consolidated Financial Statements
As of April 30, 2013 and 2012 and for the years ended April 30, 2013 , 2012 and 2011
(With Report of Independent Registered Public Accounting Firm Thereon)
90
Table of Contents
Report of Independent Registered Public Accounting Firm
The Board of Directors and Stockholders
JTH Holding, Inc.:
We have audited the accompanying consolidated balance sheets of JTH Holding, Inc. and subsidiaries (the Company) as of April 30, 2013 and 2012, and the related consolidated statements of income, comprehensive income, stockholders' equity, and cash flows for each of the years in the three‑year period ended April 30, 2013. These consolidated financial statements are the responsibility of the Company's management. Our responsibility is to express an opinion on these consolidated financial statements based on our audits.
We conducted our audits in accordance with the standards of the Public Company Accounting Oversight Board (United States). Those standards require that we plan and perform the audit to obtain reasonable assurance about whether the financial statements are free of material misstatement. An audit includes examining, on a test basis, evidence supporting the amounts and disclosures in the financial statements. An audit also includes assessing the accounting principles used and significant estimates made by management, as well as evaluating the overall financial statement presentation. We believe that our audits provide a reasonable basis for our opinion.
In our opinion, the consolidated financial statements referred to above present fairly, in all material respects, the financial position of JTH Holding, Inc. and subsidiaries as of April 30, 2013 and 2012, and the results of their operations and their cash flows for each of the years in the three ‑year period ended April 30, 2013, in conformity with U.S. generally accepted accounting principles.
As discussed in note 19 to the consolidated financial statements, the consolidated financial statements as of and for the years ended April 30, 2012 and 2011 have been restated to correct certain misstatements.
/s/ KPMG LLP
Norfolk, Virginia
September 26, 2013
F-1
Table of Contents
JTH HOLDING, INC. AND SUBSIDIARIES
Consolidated Balance Sheets
April 30, 2013 and 2012
(In thousands)
|
| 2013 |
| 2012 | ||||
|
|
|
| As Restated (1) | ||||
Assets |
|
|
|
| ||||
Current assets: |
|
|
|
| ||||
Cash and cash equivalents |
| $ | 19,013 | |
| $ | 19,848 | |
Receivables (note 2): |
|
|
|
| ||||
Trade accounts |
| 41,856 | |
| 38,321 | | ||
Notes |
| 34,156 | |
| 30,283 | | ||
Interest, net |
| 877 | |
| 674 | | ||
Allowance for doubtful accounts |
| (5,583 | ) |
| (4,496 | ) | ||
Total receivables, net |
| 71,306 | |
| 64,782 | | ||
Available-for-sale securities (note 4) |
| 3,619 | |
| - | | ||
Deferred income taxes (note 10) |
| 4,232 | |
| 3,901 | | ||
Other current assets |
| 4,963 | |
| 5,614 | | ||
Total current assets |
| 103,133 | |
| 94,145 | | ||
Property, equipment, and software, net (notes 3 and 8) |
| 33,037 | |
| 23,948 | | ||
Notes receivable, excluding current portion, net of allowance for uncollectible amounts of $1,101 and $794 for 2013 and 2012, respectively (note 2) |
| 14,352 | |
| 11,711 | | ||
Goodwill (note 5) |
| 5,685 | |
| 5,400 | | ||
Other intangible assets, net (note 5) |
| 10,921 | |
| 10,314 | | ||
Deferred income taxes (note 10) |
| - | |
| 4,093 | | ||
Other assets, net |
| 2,402 | |
| 2,585 | | ||
Total assets (note 6) |
| $ | 169,530 | |
| $ | 152,196 | |
Liabilities and Stockholders' Equity |
|
|
|
| ||||
Current liabilities: |
|
|
|
| ||||
Current installments of long-term debt (note 8) |
| $ | 3,400 | |
| $ | 2,736 | |
Accounts payable and accrued expenses (notes 9 and 16) |
| 11,954 | |
| 14,170 | | ||
Due to area developers (note 2) |
| 18,248 | |
| 15,956 | | ||
Income taxes payable (note 10) |
| 5,897 | |
| 6,689 | | ||
Deferred revenue - short-term portion |
| 7,555 | |
| 6,920 | | ||
Total current liabilities |
| 47,054 | |
| 46,471 | | ||
Long-term debt, excluding current installments (note 8) |
| 24,283 | |
| 26,249 | | ||
Revolving credit facility (note 7) |
| - | |
| - | | ||
Deferred revenue - long-term portion |
| 10,381 | |
| 12,411 | | ||
Liability classified stock-based compensation awards (note 12) |
| 5,111 | |
| - | | ||
Deferred income taxes (note 10) |
| 865 | |
| - | | ||
Total liabilities |
| 87,694 | |
| 85,131 | | ||
Stockholders' equity (notes 4, 9, 11, 12, and 14): |
|
|
|
| ||||
Class A preferred stock, $0.01 par value per share, 190,000 shares authorized, 0 and 170,320 shares issued and outstanding at April 30, 2013 and 2012, respectively |
| - | |
| 2,129 | | ||
Special voting preferred stock, $0.01 par value per share, 10 shares authorized, issued and outstanding |
| - | |
| - | | ||
Class A common stock, $0.01 par value per share, 21,200,000 shares authorized, 11,975,128 and 10,343,957 shares issued and outstanding at April 30, 2013 and 2012, respectively |
| 120 | |
| 103 | | ||
Class B common stock, $0.01 par value per share, 1,000,000 shares authorized, 900,000 shares issued and outstanding |
| 9 | |
| 9 | | ||
Exchangeable shares, $0.01 par value, 100,000 shares issued and outstanding |
| 1 | |
| 1 | | ||
Additional paid-in capital |
| 1,920 | |
| 3,182 | | ||
Accumulated other comprehensive income, net of taxes |
| 1,194 | |
| 676 | | ||
Retained earnings |
| 78,592 | |
| 60,965 | | ||
Total stockholders' equity |
| 81,836 | |
| 67,065 | | ||
Commitments, contingencies, and subsequent events (notes 6, 7, 16, and 17) |
| |
| | ||||
Total liabilities and stockholders' equity |
| $ | 169,530 | |
| $ | 152,196 | |
See accompanying notes to consolidated financial statements.
F-2
Table of Contents
JTH HOLDING, INC. AND SUBSIDIARIES
Consolidated Statements of Income
Years ended April 30, 2013 , 2012 , and 2011
(In thousands)
|
| 2013 |
| 2012 |
| 2011 | ||||||
|
|
|
| As Restated (1) |
| As Restated (1) | ||||||
Revenues: |
|
|
|
|
|
| ||||||
Franchise fees |
| $ | 8,721 | |
| $ | 7,996 | |
| $ | 8,780 | |
Area developer fees |
| 7,699 | |
| 6,702 | |
| 6,335 | | |||
Royalties and advertising fees |
| 73,129 | |
| 70,016 | |
| 66,182 | | |||
Financial products |
| 30,345 | |
| 22,903 | |
| 16,507 | | |||
Interest income (note 2) |
| 13,848 | |
| 12,406 | |
| 11,322 | | |||
Tax preparation fees, net of discounts |
| 10,148 | |
| 7,026 | |
| 4,789 | | |||
Net gain on sale of company-owned offices and other revenue |
| 3,723 | |
| 4,176 | |
| 4,021 | | |||
Total revenues |
| 147,613 | |
| 131,225 | |
| 117,936 | | |||
Operating expenses: |
|
|
|
|
|
| ||||||
Employee compensation and benefits |
| 37,998 | |
| 29,802 | |
| 25,162 | | |||
General and administrative expenses |
| 31,212 | |
| 26,878 | |
| 22,472 | | |||
Area developer expense |
| 25,736 | |
| 23,872 | |
| 23,094 | | |||
Advertising expense |
| 15,293 | |
| 15,346 | |
| 15,078 | | |||
Depreciation, amortization, and impairment charges (notes 3 and 5) |
| 6,538 | |
| 5,999 | |
| 5,439 | | |||
Costs associated with postponed IPO |
| - | |
| 1,348 | |
| - | | |||
Total operating expenses |
| 116,777 | |
| 103,245 | |
| 91,245 | | |||
Income from operations |
| 30,836 | |
| 27,980 | |
| 26,691 | | |||
Other income (expense): |
|
| |
|
| |
|
| | |||
Foreign currency transaction gains |
| - | |
| 4 | |
| 75 | | |||
Interest expense (notes 7, 8, and 9) |
| (2,039 | ) |
| (1,854 | ) |
| (1,954 | ) | |||
Income before income taxes |
| 28,797 | |
| 26,130 | |
| 24,812 | | |||
Income tax expense (note 10) |
| 11,170 | |
| 9,747 | |
| 10,142 | | |||
Net income |
| $ | 17,627 | |
| $ | 16,383 | |
| $ | 14,670 | |
Net income per share of Class A and Class B common stock: |
|
|
|
|
|
| ||||||
Basic |
| $ | 1.26 | |
| $ | 1.17 | |
| $ | 0.85 | |
Diluted |
| 1.25 | |
| 1.16 | |
| 0.83 | | |||
(1) As restated - See Note 19 "Restatement of Previously Issued Financial Statements" of Notes to Consolidated Financial Statements.
See accompanying notes to consolidated financial statements.
F-3
Table of Contents
JTH HOLDING, INC. AND SUBSIDIARIES
Consolidated Statements of Comprehensive Income
Years ended April 30, 2013 , 2012 , and 2011
(In thousands)
| 2013 |
| 2012 |
| 2011 | ||||||
|
|
| As Restated (1) |
| As Restated (1) | ||||||
Net income | $ | 17,627 | |
| $ | 16,383 | |
| $ | 14,670 | |
Interest rate swap agreements, net of taxes (note 9) | 438 | |
| 196 | |
| (164 | ) | |||
Unrealized gain on equity securities available-for-sale, net of taxes (note 4) | 387 | |
| - | |
| - | | |||
Foreign currency translation adjustment | (307 | ) |
| 99 | |
| 424 | | |||
Comprehensive income | $ | 18,145 | |
| $ | 16,678 | |
| $ | 14,930 | |
(1) As restated - See Note 19 "Restatement of Previously Issued Financial Statements" of Notes to Consolidated Financial Statements.
See accompanying notes to consolidated financial statements.
F-4
Table of Contents
JTH HOLDING, INC. AND SUBSIDIARIES
Consolidated Statement of Stockholders' Equity
Year ended April 30, 2013
(In thousands)
|
| Class A |
| Class B |
| Class A |
| Special voting preferred stock | ||||||||||||||||||||
|
| Common stock |
| Common stock |
| Preferred stock |
| |||||||||||||||||||||
|
| Shares |
| Amount |
| Shares |
| Amount |
| Shares |
| Amount |
| Shares |
| Amount | ||||||||||||
Balance at May 1, 2012 (As Restated) 1 |
| 10,344 | |
| $ | 103 | |
| 900 | |
| $ | 9 | |
| 170 | |
| $ | 2,129 | |
| - | |
| $ | - | |
Exercise of stock options (note 11) |
| 350 | |
| 4 | |
| - | |
| - | |
| - | |
| - | |
| - | |
| - | | ||||
Repurchase of common stock |
| (422 | ) |
| (4 | ) |
| - | |
| - | |
| - | |
| - | |
| - | |
| - | | ||||
Conversion of preferred stock to common stock |
| 1,703 | |
| 17 | |
| - | |
| - | |
| (170 | ) |
| (2,129 | ) |
| - | |
| - | | ||||
Balance at April 30, 2013 |
| 11,975 | |
| $ | 120 | |
| 900 | |
| $ | 9 | |
| - | |
| $ | - | |
| - | |
| $ | - | |
|
| Exchangeable shares |
| Additional paid-in capital |
| Accumulated other comprehensive income |
| Retained earnings |
|
| |||||||||||||
|
| Shares |
| Amount |
| Total | |||||||||||||||||
Balance at May 1, 2012 (As Restated) 1 |
| 100 | |
| $ | 1 | |
| $ | 3,182 | |
| $ | 676 | |
| $ | 60,965 | |
| $ | 67,065 | |
Exercise of stock options (note 11) |
| - | |
| - | |
| 3,797 | |
| - | |
| - | |
| 3,801 | | |||||
Repurchase of common stock |
| - | |
| - | |
| (6,452 | ) |
| - | |
| - | |
| (6,456 | ) | |||||
Conversion of preferred stock to common stock |
| - | |
| - | |
| 2,112 | |
| - | |
| - | |
| - | | |||||
Stock-based compensation expense (note 11) |
| - | |
| - | |
| 1,704 | |
| - | |
| - | |
| 1,704 | | |||||
Conversion of stock-based compensation awards from equity to liability classification (notes 11 and 12) |
| - | |
| - | |
| (2,694 | ) |
| - | |
| - | |
| (2,694 | ) | |||||
Tax benefit of stock option exercises (note 9) |
| - | |
| - | |
| 271 | |
| - | |
| - | |
| 271 | | |||||
Net income (As Restated) 1 |
| - | |
| - | |
| - | |
| - | |
| 17,627 | |
| 17,627 | | |||||
Interest rate swap agreements, net of taxes (note 8) |
| - | |
| - | |
| - | |
| 438 | |
| - | |
| 438 | | |||||
Foreign currency translation adjustment |
| - | |
| - | |
| - | |
| (307 | ) |
| - | |
| (307 | ) | |||||
Unrealized gain on equity securities available-for-sale, net of taxes |
| - | |
| - | |
| - | |
| 387 | |
| - | |
| 387 | | |||||
Comprehensive income |
|
| |
|
| |
|
| |
|
| |
|
| |
| 18,145 | | |||||
Balance at April 30, 2013 |
| 100 | |
| $ | 1 | |
| $ | 1,920 | |
| $ | 1,194 | |
| $ | 78,592 | |
| $ | 81,836 | |
See accompanying notes to consolidated financial statements.
F-5
Table of Contents
JTH HOLDING, INC. AND SUBSIDIARIES
Consolidated Statement of Stockholders' Equity
Year ended April 30, 2012
(In thousands)
|
| Class A |
| Class B |
| Class A |
| Special voting preferred stock | ||||||||||||||||||||
|
| Common stock |
| Common stock |
| Preferred stock |
| |||||||||||||||||||||
|
| Shares |
| Amount |
| Shares |
| Amount |
| Shares |
| Amount |
| Shares |
| Amount | ||||||||||||
Balance at May 1, 2011 (As Restated) 1 |
| 10,519 | |
| $ | 105 | |
| 900 | |
| $ | 9 | |
| 170 | |
| $ | 2,129 | |
| - | |
| $ | - | |
Exercise of stock options (note 11) |
| 110 | |
| 1 | |
| - | |
| - | |
| - | |
| - | |
| - | |
| - | | ||||
Repurchase of common stock |
| (285 | ) |
| (3 | ) |
| - | |
| - | |
| - | |
| - | |
| - | |
| - | | ||||
Balance at April 30, 2012 (As Restated) 1 |
| 10,344 | |
| $ | 103 | |
| 900 | |
| $ | 9 | |
| 170 | |
| $ | 2,129 | |
| - | |
| $ | - | |
|
| Exchangeable shares |
| Additional paid-in capital |
| Accumulated other comprehensive income |
| Retained earnings |
|
| |||||||||||||
|
| Shares |
| Amount |
|
| Total | ||||||||||||||||
Balance at May 1, 2011 (As Restated) 1 |
| 100 | |
| $ | 1 | |
| $ | 4,811 | |
| $ | 381 | |
| $ | 44,582 | |
| $ | 52,018 | |
Exercise of stock options (note 11) |
| - | |
| - | |
| 741 | |
| - | |
| - | |
| 742 | | |||||
Repurchase of common stock |
| - | |
| - | |
| (4,257 | ) |
| - | |
| - | |
| (4,260 | ) | |||||
Stock-based compensation expense (note 11) |
| - | |
| - | |
| 1,429 | |
| - | |
| - | |
| 1,429 | | |||||
Tax benefit of stock option exercises (note 9) |
| - | |
| - | |
| 458 | |
| - | |
| - | |
| 458 | | |||||
Net income (As Restated) 1 |
| - | |
| - | |
| - | |
| - | |
| 16,383 | |
| 16,383 | | |||||
Interest rate swap agreements, net of taxes (note 8) |
| - | |
| - | |
| - | |
| 196 | |
| - | |
| 196 | | |||||
Foreign currency translation adjustment |
| - | |
| - | |
| - | |
| 99 | |
| - | |
| 99 | | |||||
Comprehensive income |
|
| |
|
| |
|
| |
|
| |
|
| |
| 16,678 | | |||||
Balance at April 30, 2012 (As Restated) 1 |
| 100 | |
| $ | 1 | |
| $ | 3,182 | |
| $ | 676 | |
| $ | 60,965 | |
| $ | 67,065 | |
(1) As restated - See Note 19 "Restatement of Previously Issued Financial Statements" of Notes to Consolidated Financial Statements.
See accompanying notes to consolidated financial statements.
F-6
Table of Contents
JTH HOLDING, INC. AND SUBSIDIARIES
Consolidated Statement of Stockholders' Equity
Year ended April 30, 2011
(In thousands)
|
| Class A |
| Class B |
| Class A |
| Special voting preferred stock | ||||||||||||||||||||
|
| Common stock |
| Common stock |
| Preferred stock |
| |||||||||||||||||||||
|
| Shares |
| Amount |
| Shares |
| Amount |
| Shares |
| Amount |
| Shares |
| Amount | ||||||||||||
Balance at May 1, 2010 (As Reported) |
| 10,730 | |
| $ | 107 | |
| 900 | |
| $ | 9 | |
| 190 | |
| $ | 2,375 | |
| - | |
| $ | - | |
Restatement adjustment |
| - | |
| - | |
| - | |
| - | |
| - | |
| - | |
| - | |
| - | | ||||
Balance at May 1, 2010 (As Restated) 1 |
| 10,730 | |
| 107 | |
| 900 | |
| 9 | |
| 190 | |
| 2,375 | |
| - | |
| - | | ||||
Exercise of stock options (note 11) |
| 460 | |
| 5 | |
| - | |
| - | |
| - | |
| - | |
| - | |
| - | | ||||
Repurchase of common stock |
| (686 | ) |
| (7 | ) |
| - | |
| - | |
| - | |
| - | |
| - | |
| - | | ||||
Repurchase of preferred stock |
| - | |
| - | |
| - | |
| - | |
| (18 | ) |
| (227 | ) |
| - | |
| - | | ||||
Conversion of preferred stock to common stock |
| 15 | |
| - | |
| - | |
| - | |
| (2 | ) |
| (19 | ) |
| - | |
| - | | ||||
Balance at April 30, 2011 (As Restated) 1 |
| 10,519 | |
| $ | 105 | |
| 900 | |
| $ | 9 | |
| 170 | |
| $ | 2,129 | |
| - | |
| $ | - | |
|
| Exchangeable shares |
| Additional paid-in capital |
| Accumulated other comprehensive income |
| Retained earnings |
|
| |||||||||||||
|
| Shares |
| Amount |
|
| Total | ||||||||||||||||
Balance at May 1, 2010 (As Reported) |
| 100 | |
| $ | 1 | |
| $ | 9,159 | |
| $ | 121 | |
| $ | 63,424 | |
| $ | 75,196 | |
Restatement adjustment |
| - | |
| - | |
| - | |
| - | |
| (31,017 | ) |
| (31,017 | ) | |||||
Balance at May 1, 2010 (As Restated) 1 |
| 100 | |
| 1 | |
| 9,159 | |
| 121 | |
| 32,407 | |
| 44,179 | | |||||
Exercise of stock options (note 11) |
| - | |
| - | |
| 3,800 | |
| - | |
| - | |
| 3,805 | | |||||
Repurchase of common stock |
| - | |
| - | |
| (10,069 | ) |
| - | |
| - | |
| (10,076 | ) | |||||
Repurchase of preferred stock |
| - | |
| - | |
| - | |
| - | |
| (2,495 | ) |
| (2,722 | ) | |||||
Conversion of preferred stock to common stock |
| - | |
| - | |
| 19 | |
| - | |
| - | |
| - | | |||||
Stock-based compensation expense (note 11) |
| - | |
| - | |
| 1,494 | |
| - | |
| - | |
| 1,494 | | |||||
Tax benefit of stock option exercises (note 9) |
| - | |
| - | |
| 408 | |
| - | |
| - | |
| 408 | | |||||
Net income (As Restated) 1 |
| - | |
| - | |
| - | |
| - | |
| 14,670 | |
| 14,670 | | |||||
Interest rate swap agreements, net of taxes (note 8) |
| - | |
| - | |
| - | |
| (164 | ) |
| - | |
| (164 | ) | |||||
Foreign currency translation adjustment |
| - | |
| - | |
| - | |
| 424 | |
| - | |
| 424 | | |||||
Comprehensive income |
|
| |
|
| |
|
| |
|
| |
|
| |
| 14,930 | | |||||
Balance at April 30, 2011 (As Restated) 1 |
| 100 | |
| $ | 1 | |
| $ | 4,811 | |
| $ | 381 | |
| $ | 44,582 | |
| $ | 52,018 | |
See accompanying notes to consolidated financial statements.
F-7
Table of Contents
JTH HOLDING, INC. AND SUBSIDIARIES
Consolidated Stat ements of Cash Flows
Years ended April 30, 2013, 2012, and 2011
(In thousands)
|
| 2013 |
| 2012 |
| 2011 | ||||||
|
|
|
| As Restated (1) |
| As Restated (1) | ||||||
Cash flows from operating activities: |
|
|
|
|
|
| ||||||
Net income |
| $ | 17,627 | |
| $ | 16,383 | |
| $ | 14,670 | |
Adjustments to reconcile net income to net cash provided by operating activities: |
|
|
|
|
|
| ||||||
Provision for doubtful accounts |
| 7,098 | |
| 5,788 | |
| 5,497 | | |||
Depreciation and amortization |
| 5,750 | |
| 5,511 | |
| 5,001 | | |||
Amortization of deferred financing costs |
| 301 | |
| 418 | |
| 254 | | |||
Impairment of goodwill and other intangible assets |
| 788 | |
| 488 | |
| 438 | | |||
Stock-based compensation expense related to equity classified awards |
| 1,496 | |
| 1,429 | |
| 1,494 | | |||
Stock-based compensation expense related to liability classified awards |
| 2,625 | |
| - | |
| - | | |||
Gain on sale of company-owned offices |
| (777 | ) |
| (973 | ) |
| (1,109 | ) | |||
Equity in loss of affiliate |
| 193 | |
| 138 | |
| - | | |||
Deferred tax expense |
| 4,119 | |
| 2,304 | |
| 1,671 | | |||
Changes in assets and liabilities increasing (decreasing) cash flows from operating activities: |
|
| |
|
| |
|
| | |||
Trade receivable |
| (27,722 | ) |
| (25,230 | ) |
| (20,803 | ) | |||
Notes and interest receivable |
| 16,505 | |
| 16,401 | |
| 13,466 | | |||
Prepaid expenses and other assets |
| 210 | |
| (95 | ) |
| 149 | | |||
Accounts payable and accrued expenses |
| (1,837 | ) |
| (3,559 | ) |
| 4,041 | | |||
Due to area developers |
| 5,213 | |
| 3,989 | |
| 4,417 | | |||
Income taxes |
| (508 | ) |
| 221 | |
| 61 | | |||
Deferred revenue |
| (2,640 | ) |
| (2,770 | ) |
| (4,472 | ) | |||
Net cash provided by operating activities |
| 28,441 | |
| 20,443 | |
| 24,775 | | |||
Cash flows from investing activities: |
|
|
|
|
|
| ||||||
Issuance of operating loans to franchisees |
| (75,605 | ) |
| (67,969 | ) |
| (56,400 | ) | |||
Payments received on operating loans from franchisees |
| 68,782 | |
| 60,918 | |
| 50,921 | | |||
Purchases of area developer rights and company-owned offices |
| (5,980 | ) |
| (4,741 | ) |
| (3,091 | ) | |||
Proceeds from sale of company-owned offices and area developer rights |
| 4,072 | |
| 2,146 | |
| 1,711 | | |||
Purchase of marketable equity securities |
| (2,980 | ) | | - | | | - | | |||
Purchase of equity method investment |
| - | |
| (1,009 | ) |
| - | | |||
Purchases of property and equipment |
| (11,928 | ) |
| (10,288 | ) |
| (7,051 | ) | |||
Net cash used in investing activities |
| (23,639 | ) |
| (20,943 | ) |
| (13,910 | ) | |||
Cash flows from financing activities: |
|
| |
|
| |
|
| | |||
Proceeds from the exercise of stock options |
| 3,801 | |
| 742 | |
| 3,805 | | |||
Repurchase of common stock |
| (6,456 | ) |
| (4,260 | ) |
| (10,076 | ) | |||
Repurchase of preferred stock |
| - | |
| - | |
| (2,722 | ) | |||
Term debt borrowings |
| - | |
| 25,000 | |
| - | | |||
Repayment of long-term debt |
| (2,953 | ) |
| (2,118 | ) |
| (2,284 | ) | |||
Borrowings under revolving credit facility |
| 121,216 | |
| 124,270 | |
| 135,484 | | |||
Repayments under revolving credit facility |
| (121,216 | ) |
| (124,270 | ) |
| (135,484 | ) | |||
Payment for debt issue costs |
| (289 | ) |
| (1,123 | ) |
| (333 | ) | |||
Tax benefit of stock option exercises |
| 271 | |
| 458 | |
| 408 | | |||
Net cash provided by (used in) financing activities |
| (5,626 | ) |
| 18,699 | |
| (11,202 | ) | |||
Effect of exchange rate changes on cash, net |
| (11 | ) |
| (13 | ) |
| (113 | ) | |||
Net increase (decrease) in cash and cash equivalents |
| (835 | ) |
| 18,186 | |
| (450 | ) | |||
Cash and cash equivalents at beginning of year |
| 19,848 | |
| 1,662 | |
| 2,112 | | |||
Cash and cash equivalents at end of year |
| $ | 19,013 | |
| $ | 19,848 | |
| $ | 1,662 | |
|
|
|
|
|
|
| ||||||
See accompanying notes to consolidated financial statements.
F-8
Table of Contents
JTH HOLDING, INC. AND SUBSIDIARIES
Consolidated Statements of Cash Flows (Continued)
Years ended April 30, 2013 , 2012 , and 2011
(In thousands)
|
| 2013 |
| 2012 |
| 2011 | ||||||
|
|
|
| As Restated (1) |
| As Restated (1) | ||||||
Supplemental disclosures of cash flow information: |
|
|
|
|
|
| ||||||
Cash paid for interest, net of capitalized interest |
| $ | 1,872 | |
| $ | 1,640 | |
| $ | 1,671 | |
Cash paid for taxes, net of refunds |
| 7,328 | |
| 7,222 | |
| 8,032 | | |||
Supplemental disclosures of noncash investing and financing activities: |
|
|
|
|
|
| ||||||
During the years ended April 30, 2013, 2012, and 2011, the Company acquired certain assets from franchisees and area developers as follows: |
|
|
|
|
|
| ||||||
Fair value of assets purchased |
| $ | 10,714 | |
| $ | 12,050 | |
| $ | 6,826 | |
Receivables applied |
| (6,804 | ) |
| (10,120 | ) |
| (5,233 | ) | |||
Accounts payable canceled |
| 2,922 | |
| 2,961 | |
| 2,405 | | |||
Notes payable issued |
| (1,655 | ) |
| (1,540 | ) |
| (1,936 | ) | |||
Elimination of related deferred revenue |
| 803 | |
| 1,390 | |
| 1,029 | | |||
Cash paid to franchisees |
| $ | 5,980 | |
| $ | 4,741 | |
| $ | 3,091 | |
During the years ended April 30, 2013, 2012, and 2011, the Company sold certain assets to franchisees and area developers as follows: |
|
|
|
|
|
| ||||||
Book value of assets sold |
| $ | 6,517 | |
| $ | 5,929 | |
| $ | 4,913 | |
Gain on sale |
| (417 | ) |
| (191 | ) |
| 1 | | |||
Deferred revenue |
| 2,846 | |
| 1,370 | |
| 1,267 | | |||
Applied from acquisitions of franchise territories |
| - | |
| - | |
| (120 | ) | |||
Notes received |
| (4,874 | ) |
| (4,962 | ) |
| (4,350 | ) | |||
Cash received from franchisees |
| $ | 4,072 | |
| $ | 2,146 | |
| $ | 1,711 | |
Accrued capitalized software costs included in accounts payable |
| $ | 733 | |
| $ | 345 | |
| $ | 1,368 | |
(1) As restated - See Note 19 "Restatement of Previously Issued Financial Statements" of Notes to Consolidated Financial Statements.
See accompanying notes to consolidated financial statements.
F-9
Table of Contents
JTH HOLDING, INC. AND SUBSIDIARIES
Notes to Consolidated Financial Statements
April 30, 2013 and 2012
(1) Organization and Significant Accounting Policies
(a) Organization and Plan of Reorganization
JTH Holding, Inc. (the Company), a Delaware corporation, is a holding company engaged through its subsidiaries as a franchisor and operator of a system of income tax preparation offices located in the United States and Canada. The Company's principal operations are conducted through JTH Tax, Inc. (d/b/a Liberty Tax Service) the Company's largest subsidiary. Through this system of income tax preparation offices, the Company also facilitates to its customers refund-based tax settlement financial products such as refund anticipation loans, electronic refund checks, and personal income tax refund discounting. The Company also offers online tax preparation services.
(b) Restatement of Previously Issued Financial Statements
On August 1, 2013, the Company concluded that previously issued consolidated financial statements should not be relied upon due to revenue recognition adjustments. The Company's decision to restate its consolidated financial statements was based upon the results of an internal review of the Company's historical revenue recognition policies and their application. The Company has restated its consolidated balance sheet as of April 30, 2012 and the related statements of income, comprehensive income, stockholders' equity and cash flows for the fiscal years ended April 30, 2012 and 2011. See note 19 for a detailed description of the impact of corrections on previously issued consolidated financial statements.
(c) Principles of Consolidation
The consolidated financial statements include the accounts of JTH Holding, Inc. and its wholly owned subsidiaries. Assets and liabilities of the Company's Canadian operations have been translated into U.S. dollars using the exchange rate in effect at the end of the year. The revenues and expenses have been translated using the average exchange rates in effect each month of the year. Transaction gains and losses are recognized in income when incurred. The Company consolidates entities in which it has a controlling interest, the usual condition of which is ownership of a majority voting interest. The Company also considers for consolidation an entity, in which the Company has certain interest, where a controlling financial interest may be achieved through arrangements that do not involve voting interests. Such an entity, known as a variable interest entity (VIE) is required to be consolidated by its primary beneficiary. The Company does not possess any ownership interests in franchisee entities; however, the Company may provide financial support to franchisee entities. Because the Company's franchise arrangements provide franchisee entities the power to direct the activities that most significantly impact their economic performance, the Company does not consider itself the primary beneficiary of any such entity that might be a VIE. Based on the results of management's analysis of potential VIEs, the Company has not consolidated any franchise or other entities. The Company's maximum exposure to loss resulting from involvement with potential VIEs is attributable to accounts and notes receivables and future lease payments due from franchisees. When the Company does not have a controlling interest in an entity, but exerts significant influence over the entity, the Company applies the equity method of accounting. All significant intercompany balances and transactions have been eliminated in consolidation.
(d) Office Count
The following table shows the U.S. office activity for the years ended April 30, 2013, 2012 and 2011 and the number of Canadian and Company-owned offices at the end of each year:
F-10
JTH HOLDING, INC. AND SUBSIDIARIES
Notes to Consolidated Financial Statements
April 30, 2013 and 2012
(1) Organization and Significant Accounting Policies (Continued)
|
| Tax Season | |||||||
|
| 2013 |
| 2012 |
| 2011 | |||
|
|
|
|
|
|
| |||
Franchised U.S. offices, beginning of period |
| 3,845 | |
| 3,549 | |
| 3,233 | |
U.S. offices opened |
| 596 |
| 676 |
| 622 | |||
U.S. offices purchased from the Company |
| 60 | |
| 37 | |
| 47 | |
U.S. offices acquired by the Company |
| (64 | ) |
| (76 | ) |
| (37 | ) |
U.S. offices closed |
| (409 | ) |
| (341 | ) |
| (316 | ) |
Franchised U.S. offices, end of period |
| 4,028 | |
| 3,845 | |
| 3,549 | |
|
|
|
|
|
|
| |||
Franchised Canadian offices, end of period |
| 231 | |
| 244 | |
| 241 | |
|
|
|
|
|
|
| |||
Total franchised offices |
| 4,259 | |
| 4,089 | |
| 3,790 | |
|
|
|
|
|
|
| |||
Company-owned offices, end of period |
|
|
|
|
|
| |||
U.S. |
| 234 | |
| 75 | |
| 41 | |
Canadian |
| 27 | |
| 19 | |
| 14 | |
Total |
| 261 | |
| 94 | |
| 55 | |
|
|
|
|
|
|
| |||
Total offices |
| 4,520 | |
| 4,183 | |
| 3,845 | |
(e) Cash and Cash Equivalents
For purposes of the consolidated statements of cash flows, the Company considers all highly liquid debt instruments with original maturities of three months or less to be cash equivalents.
(f) Trade Accounts Receivable
Trade accounts receivable are recorded at the invoiced amount less an allowance for doubtful accounts and accrue finance charges at 18% annually if unpaid after 30 days. Account balances are charged off against the allowance after all possible means of collection have been exhausted and the potential for recovery is considered remote. The Company does not have any off-balance-sheet credit exposure related to its accounts receivable.
(g) Notes Receivable
Notes receivable are recorded less unrecognized revenue, net of an allowance for doubtful accounts. Unrecognized revenue relates to the financed portion of franchise fees and area developer (AD) fees and, in the case of sales of company-owned offices, the financed portion of gains related to such sales, in each case where revenue has not yet been recognized. The Company provides an allowance against accrued interest on a delinquent note when a scheduled payment becomes 90 days past due. Notes are written off against the allowance when all possible means of collection have been exhausted and the potential for recovery is considered remote.
(h) Allowance for Doubtful Accounts
The allowance for doubtful accounts includes the Company's best estimate of the amount of probable credit losses in the Company's existing accounts and notes receivable. Because the repayment of accounts and notes receivable is dependent on the performance of the underlying franchises, management estimates the amount of the allowance for doubtful accounts based on a comparison of amounts due to the estimated fair value of the underlying franchises.
F-11
JTH HOLDING, INC. AND SUBSIDIARIES
Notes to Consolidated Financial Statements
April 30, 2013 and 2012
(1) Organization and Significant Accounting Policies (Continued)
(i) Property, Equipment, and Software
Property, equipment, and software are stated at cost less accumulated depreciation and amortization. Depreciation and amortization are calculated using the straight-line method over the estimated useful lives of the depreciable assets, generally three to five years for computer equipment, three to seven years for software, seven years for furniture and fixtures, and twenty to thirty-five years for buildings. Leasehold improvements are amortized over the lesser of the lease term or the estimated useful lives of the assets. Certain allowable costs of software developed or obtained for internal use are capitalized and typically amortized over 36 months.
(j) Goodwill
Goodwill represents the excess of costs over fair value of assets of businesses acquired. Goodwill is not amortized, but instead tested for impairment at least annually. The reporting unit for the acquisition of assets from various franchisees is considered to be the franchise territory, and these assets are operated as company-owned offices. Goodwill is tested for impairment more frequently if events and circumstances indicate that the asset might be impaired. An impairment loss is recognized to the extent that the carrying amount exceeds the asset's fair value. This determination is made at the reporting unit level and consists of two steps. First, the Company determines the fair value of a reporting unit and compares it with its carrying amount. Second, if the carrying amount of a reporting unit exceeds its fair value, an impairment loss is recognized for any excess of the carrying amount of the reporting unit's goodwill over the implied fair value of that goodwill. The implied fair value of goodwill is determined by allocating the fair value of the reporting unit in a manner similar to a purchase price allocation. The residual fair value after this allocation is the implied fair value of the reporting unit goodwill. Fair value of the reporting unit is determined using a discounted cash flow analysis. Fair value of the reporting unit for company-owned offices is determined using the net fees of the offices in the franchise territory. If the fair value of the reporting unit exceeds its carrying value, step two does not need to be performed.
(k) Investments
During 2013, the Company purchased corporate equity securities. The Company classified this investment as available-for-sale securities and recognizes the unrealized gain on the available-for-sale securities, net of tax, in accumulated other comprehensive income in the stockholders' equity section of the balance sheets. Cash flows for the purchase of this investment are classified as investing activities.
(l) Deferred Revenue
Area development fees received are recognized as revenue on a straight-line basis over the initial contract term of each area developer agreement, subject to the cumulative amount of revenue recognized not exceeding the amount of cash received. Deferred revenue represents the amount of cash received for AD fees in excess of the revenue recognized.
(m) Revenue Recognition
The Company typically grants franchise rights to franchisees for a term of 5 years . In exchange for franchise fees and royalties and advertising fees, the Company is obligated by its franchise agreements to provide training, an operations manual, site selection guidance, tax preparation software, operational assistance, tax and technical support, the ability to perform electronic filing and marketing and advertising. Franchise fee revenue for the sales of individual territories is recognized when the obligations of the Company to prepare the franchisee for operation are substantially complete and cash has been received. No franchise fee is recognized related to the Company's sale of a zero franchise fee territory. Direct costs related to territories sold with no franchise fee are deferred until the related royalty revenue is recognized.
Area developer rights are granted for a term of 10 years . Area development fees are deferred until the AD has paid 20% of the fee. Once 20% of the fee has been paid, area developer fees are recognized as revenue on a straight-line basis over the initial contract term of each area developer agreement with the cumulative amount of revenue recognized not to exceed the amount of cash received. Amounts due to ADs for their services under an area development agreement are expensed as the related franchise fees and royalty revenues are recognized.
Royalties and advertising fees are recognized currently as franchise territories generate sales. Tax return preparation fees and financial products revenue are recognized as revenue in the period the related tax return is filed or prepared for the customer. Discounts for promotional programs are recorded at the time the return is prepared and are recorded as reductions to revenues.
F-12
JTH HOLDING, INC. AND SUBSIDIARIES
Notes to Consolidated Financial Statements
April 30, 2013 and 2012
(1) Organization and Significant Accounting Policies (Continued)
Interest income is recognized when cash is received for notes associated with franchise fees or area developer fees. For all other notes, interest income is recognized when earned, and is recorded net of an allowance.
Gains on sales of Company-owned offices are recognized when the purchase price is paid. Losses on sales of Company-owned offices are recognized immediately.
(n) Derivative Instruments and Hedging Activities
The Company accounts for derivatives and hedging activities and recognizes all derivative instruments as either assets or liabilities in the balance sheet at their respective fair values. For derivatives designated in hedging relationships, changes in fair value are either offset through earnings against the change in fair value of the hedged item attributable to the risk being hedged or recognized in accumulated other comprehensive income, to the extent the derivative is effective at offsetting the changes in cash flows being hedged, until the hedged item affects earnings.
The Company only enters into a derivative contract when it intends to designate the contract as a hedge of a forecasted transaction or the variability of cash flows to be received or paid related to a recognized asset or liability (cash flow hedge). For all hedging relationships, the Company formally documents the hedging relationship and its risk-management objective and strategy for undertaking the hedge, the hedging instrument, the hedged transaction, the nature of the risk being hedged, how the hedging instrument's effectiveness in offsetting the hedged risk will be assessed prospectively and retrospectively, and a description of the method used to measure ineffectiveness. The Company also formally assesses, both at the inception of the hedging relationship and on an ongoing basis, whether the derivatives that are used in hedging relationships are highly effective in offsetting changes in cash flows of hedged transactions. For derivative instruments that are designated and qualify as part of a cash flow hedging relationship, the effective portion of the gain or loss on the derivative is reported as a component of other comprehensive income and reclassified into earnings in the same period or periods during which the hedged transaction affects earnings. Gains and losses on the derivative representing either hedge ineffectiveness or hedge components excluded from the assessment of effectiveness are recognized in current earnings.
The Company discontinues hedge accounting prospectively when it determines that the derivative is no longer effective in offsetting cash flows attributable to the hedged risk, the derivative expires or is sold, terminated, or exercised, the cash flow hedge is de-designated because a forecasted transaction is not probable of occurring, or management determines to remove the designation of the cash flow hedge.
In all situations in which hedge accounting is discontinued and the derivative remains outstanding, the Company continues to carry the derivative at its fair value on the balance sheet and recognizes any subsequent changes in its fair value in earnings. When it is no longer probable that a forecasted transaction will occur, the Company discontinues hedge accounting and recognizes immediately in earnings gains and losses that were accumulated in other comprehensive income related to the hedging relationship.
At April 30, 2013 , the Company did not have any outstanding derivative instruments or hedging activities; however, at April 30, 2012 and 2011 , the Company had interest rate swaps in place.
(o) Income Taxes
Income taxes are accounted for under the asset and liability method. Deferred tax assets and liabilities are recognized for the future tax consequences attributable to the differences between the financial statement carrying amounts of existing assets and liabilities and their respective tax bases. Deferred tax assets and liabilities are measured using enacted rates expected to apply to taxable income in the years in which those temporary differences are expected to be recovered or settled. The effect on deferred tax assets and liabilities of a change in tax rates is recognized in income in the period that includes the enactment date.
The Company has elected to classify accrued interest in interest expense, and accrued penalties, if any, in general and administrative expenses.
(p) Long-Lived Assets
The Company's long-lived assets, such as property, plant, and equipment, and purchased intangibles subject to amortization, are reviewed for impairment whenever events or changes in circumstances indicate that the carrying amount of an asset may not be recoverable. Recoverability of assets to be held and used is measured by a comparison of the carrying amount of an asset to estimated undiscounted future cash flows expected to be generated by the asset. Recognition and measurement of
F-13
JTH HOLDING, INC. AND SUBSIDIARIES
Notes to Consolidated Financial Statements
April 30, 2013 and 2012
(1) Organization and Significant Accounting Policies (Continued)
a potential impairment is performed for these assets at the lowest level where cash flows are individually identifiable. If the carrying amount of an asset exceeds its estimated future cash flows, an impairment charge is recognized in the amount by which the carrying amount of the asset exceeds the fair value of the asset. Fair value is determined through various valuation techniques, including discounted cash flow models, quoted market values, and third-party independent appraisals, as considered necessary. Assets to be disposed of are separately presented in the balance sheet and reported at the lower of the carrying amount or fair value less costs to sell, and are no longer depreciated. These assets and liabilities are classified as held-for-sale and are presented separately in the appropriate asset and liability sections of the balance sheet.
(q) Comprehensive Income
Comprehensive income consists of net income, foreign currency translation adjustments, interest rate swap agreements, net of applicable taxes and the unrealized gain on equity securities available for sale, net of taxes, and is presented in the accompanying consolidated statements of stockholders' equity and comprehensive income.
(r) Advertising Expenses
Advertising costs are expensed in the period incurred.
(s) Stock-Based Compensation
For equity classified employee stock-based compensation, the Company records costs of its employee stock-based compensation based on the grant-date fair value of awards using the Black-Scholes-Merton option pricing model. For liability classified awards, the Company records costs based on the fair value at the reporting date. Changes in fair value are recorded to stock compensation expense and additional paid-in capital as appropriate. The Company reflects the excess tax benefits recognized in equity related to stock option exercises as financing cash flows. The Company recognizes compensation costs for an award that has a graded vesting schedule on a straight-line basis over the requisite service period for the entire award.
Compensation costs related to restricted stock units are based on the grant-date fair value and are amortized to compensation expense over the vesting period.
(t) Costs Associated with Postponed IPO
During April 2012, the Company determined it would postpone its planned initial public offering and, accordingly, expensed the direct, incremental fees charged by attorneys, accountants and printers that had been incurred and capitalized to date.
(u) Use of Estimates
Management has made a number of estimates and assumptions relating to the reporting of assets and liabilities and the disclosure of contingent assets and liabilities at the date of the consolidated financial statements and the reported amounts of revenues and expenses during the reporting period to prepare these consolidated financial statements and accompanying notes in conformity with U.S. generally accepted accounting principles. Actual results could differ from those estimates.
(v) Recently Issued Accounting Standards
In June 2011, Financial Accounting Standards Board (''FASB'') issued Accounting Standards Update (''ASU'') 2011-05, Presentation of Comprehensive Income. This update changes the methods for presenting comprehensive income, and eliminates the method of including comprehensive income in the consolidated statements of stockholders' equity. Under ASU 2011-05, an entity has the option to present the total of comprehensive income, the components of net income, and the components of other comprehensive income either in a single continuous statement of comprehensive income or in two separate but consecutive statements. The amendments in this ASU did not change the items that must be reported in other comprehensive income or when an item of other comprehensive income must be reclassified to net income. The Company adopted this guidance in the first quarter of fiscal 2013. Because it only affects presentation, this guidance did not have a material effect on the Company's consolidated financial statements.
In September 2011, FASB issued ASU 2011-08, Intangibles-Goodwill and Other (ASC Topic 350): Testing Goodwill for Impairment. This amendment provides the option of first using a qualitative assessment to determine whether it is more likely than not that the fair value of a reporting unit is less than its carrying amount. If a company concludes that it is more likely than not that fair value exceeds carrying value, the two-step test for impairment is not required. The amendment includes a revised
F-14
JTH HOLDING, INC. AND SUBSIDIARIES
Notes to Consolidated Financial Statements
April 30, 2013 and 2012
(1) Organization and Significant Accounting Policies (Continued)
list of considerations in completing the qualitative assessment. The Company adopted this ASU in fiscal 2013 but doing so did not have a material effect on the Company's consolidated financial statements.
(w) Segment Reporting
Management has identified two operating segments, U.S. operations and Canadian operations. Although there are two operating segments, each segment is engaged in providing tax return preparation and related services and products. These two operating segments, which have similar gross margin and sales trends, have been aggregated into a single reporting segment because both segments are similar in the nature of services offered, production process, type of customer, the distribution methods, and the regulatory environment that they operate in.
Canadian operations contributed $5,936,000 , $5,411,000 and $6,759,000 in revenues for the years ended April 30, 2013 , 2012 and 2011 , respectively.
(x) Supplier Concentration
The Company has used a third-party financial institution to provide certain financial products to its customers, pursuant to an agreement that was scheduled to expire on October 16, 2014. For the year ended April 30, 2012, a significant portion of the Company's customer's financial products were provided by this financial institution. On August 27, 2012, the Company delivered a termination notice with respect to that agreement that became effective September 16, 2012. The parties have agreed to mediation regarding the termination, and the agreement provides for arbitration if the mediation does not resolve the parties' dispute. The Company believes the outcome of these proceedings will not significantly impact its results of operations or financial position. The Company believes there will be little impact on its customers because the Company has been able to offer similar financial products through contractual relationships with other third-parties and internal capabilities.
(2) Notes and Accounts Receivable
|
| 2013 |
| 2012 | ||||
|
|
|
| As Restated | ||||
|
| (In thousands) | ||||||
Balance at beginning of year |
| $ | 79,838 | |
| $ | 70,564 | |
Notes received for: |
|
|
|
| ||||
Sales of franchises and clusters of territories |
| 6,770 | |
| 8,131 | | ||
Sales of certain assets to franchisees and ADs |
| 15,130 | |
| 12,554 | | ||
Franchisee to franchisee note assumptions |
| 11,259 | |
| 7,439 | | ||
Working capital and equipment loans to franchisees |
| 75,642 | |
| 67,969 | | ||
Refinancing of accounts receivable |
| 18,527 | |
| 16,787 | | ||
|
| 127,328 | |
| 112,880 | | ||
Repayment of notes |
| (95,664 | ) |
| (82,258 | ) | ||
Notes canceled |
| (21,981 | ) |
| (21,188 | ) | ||
Foreign currency adjustment |
| (181 | ) |
| (160 | ) | ||
Balance at end of year |
| 89,340 | |
| 79,838 | | ||
Unrecognized revenue portion of notes receivable |
| (39,731 | ) |
| (37,050 | ) | ||
Notes receivable less unrecognized revenue |
| $ | 49,609 | |
| $ | 42,788 | |
Most of the notes receivable are due from the Company's franchisees and ADs and are collateralized by the underlying franchise and are guaranteed by the respective franchisee or AD and franchise or AD owner(s). The franchisees' ability to repay
F-15
JTH HOLDING, INC. AND SUBSIDIARIES
Notes to Consolidated Financial Statements
April 30, 2013 a nd 2012
(2) Notes and Accounts Receivable (Continued)
the notes is dependent upon both the performance of the tax preparation industry as a whole and the individual or ADs' franchises or areas.
The refinancing of accounts receivable results from a franchisee electing to deliver to the Company a promissory note for past-due royalties and advertising fees that have been previously recorded as accounts receivable in the financial statements.
Notes canceled is comprised of the cancellation of existing unpaid notes of selling franchisees in franchisee to franchisee sales that include the assumption of debt by the acquiring franchisee, and any unpaid notes receivable from a franchisee or AD related to specific territories or clusters of territories that the Company reacquires. In the latter transactions, the cancellation of notes is part of the consideration paid by the Company, and any excess of the consideration paid over the fair value of assets acquired is written off to the allowance for doubtful accounts.
Management believes that the recorded allowance is adequate based upon its consideration of the estimated value of the franchises and ADs supporting the receivables. Any adverse change in the tax preparation industry could affect the Company's estimate of the allowance.
Notes and accounts receivable include royalties billed that relate to territories operated by franchisees located in AD territories. The Company has recorded amounts payable to ADs for their share of these receivables of $18,248,000 and $15,956,000 at April 30, 2013 and 2012 , respectively.
Activity in the allowance for doubtful accounts for the years ended April 30, 2013 , 2012 , and 2011 is as follows:
|
| 2013 |
| 2012 |
| 2011 | ||||||
|
|
|
| As Restated |
| As Restated | ||||||
|
| (In thousands) | ||||||||||
Beginning balance |
| $ | 5,290 | |
| $ | 4,827 | |
| $ | 3,455 | |
Additions charged to expense |
| 7,098 | |
| 5,788 | |
| 5,497 | | |||
Write-offs |
| (5,655 | ) |
| (5,595 | ) |
| (4,224 | ) | |||
Foreign currency adjustment |
| (49 | ) |
| 270 | |
| 99 | | |||
Ending balance |
| $ | 6,684 | |
| $ | 5,290 | |
| $ | 4,827 | |
Management considers accounts and notes receivable to be impaired if the amounts due exceed the fair value of the underlying franchise and estimates an allowance for doubtful accounts based on that excess. Amounts due include the recorded value of the accounts and notes receivable less unrecognized revenue and reduced by the allowance for uncollected interest, amounts due ADs, the related deferred revenue and amounts owed to the franchisee by the Company. In establishing the fair value of the underlying franchise, management considers net fees of open offices and the number of unopened offices.
F-16
JTH HOLDING, INC. AND SUBSIDIARIES
Notes to Consolidated Financial Statements
April 30, 2013 a nd 2012
(2) Notes and Accounts Receivable (Continued)
The allowance for doubtful accounts at April 30, 2013 , and 2012 is allocated as follows:
|
| 2013 |
| 2012 | ||||
|
|
|
| As Restated | ||||
|
| (In thousands) | ||||||
Impaired: |
|
|
|
| ||||
Notes receivable including interest less unrecognized revenue |
| $ | 9,399 | |
| $ | 6,728 | |
Accounts receivable |
| 5,907 | |
| 4,375 | | ||
Less allowance for uncollected interest, amounts due ADs, related deferred revenue and amounts due franchisees |
| (2,336 | ) |
| (1,704 | ) | ||
Net amount due |
| $ | 12,970 | |
| $ | 9,399 | |
Allowance for doubtful accounts for impaired notes and accounts receivable |
| $ | 6,120 | |
| $ | 4,488 | |
Nonimpaired: |
|
|
|
| ||||
Notes receivable including interest less unrecognized revenue |
| $ | 42,459 | |
| $ | 37,936 | |
Accounts receivable |
| 37,650 | |
| 35,259 | | ||
Less allowance for uncollected interest, amounts due ADs, related deferred revenue and amounts due franchisees |
| (19,992 | ) |
| (17,432 | ) | ||
Net amount due |
| $ | 60,117 | |
| $ | 55,763 | |
Allowance for doubtful accounts for nonimpaired notes and accounts receivable |
| $ | 564 | |
| $ | 802 | |
Total allowance for doubtful accounts |
| $ | 6,684 | |
| $ | 5,290 | |
The aging of accounts and notes receivable at April 30, 2013 is as follows:
|
| 2013 | ||||||||||||||
|
| Total past due |
| Allowance for uncollected interest |
| Current |
| Total receivables | ||||||||
|
| (In thousands) | ||||||||||||||
Accounts receivable |
| $ | 16,821 | |
| $ | (1,701 | ) |
| $ | 26,736 | |
| $ | 41,856 | |
Notes receivable including interest less unrecognized revenue |
| 9,747 | |
| (1,372 | ) |
| 42,111 | |
| 50,486 | | ||||
Total |
| $ | 26,568 | |
| $ | (3,073 | ) |
| $ | 68,847 | |
| $ | 92,342 | |
The aging of accounts and notes receivable at April 30, 2012 is as follows:
|
| 2012 | ||||||||||||||
|
| As Restated | ||||||||||||||
|
| Total past due |
| Allowance for uncollected interest |
| Current |
| Total receivables | ||||||||
|
| (In thousands) | ||||||||||||||
Accounts receivable |
| $ | 18,419 | |
| $ | (1,313 | ) |
| $ | 21,215 | |
| $ | 38,321 | |
Notes receivable including interest less unrecognized revenue |
| 6,476 | |
| (1,202 | ) |
| 38,188 | |
| 43,462 | | ||||
Total |
| $ | 24,895 | |
| $ | (2,515 | ) |
| $ | 59,403 | |
| $ | 81,783 | |
Accounts receivable are considered to be past due if unpaid after 30 days and notes receivable are considered past due if unpaid after 90 days, at which time the notes are put on nonaccrual status.
F-17
JTH HOLDING, INC. AND SUBSIDIARIES
Notes to Consolidated Financial Statements
April 30, 2013 a nd 2012
(2) Notes and Accounts Receivable (Continued)
The Company's average investment in impaired notes receivable during the years ended April 30, 2013 and 2012 was $8,063,000 and $6,367,000 , respectively. Interest income related to impaired notes was $794,000 , $423,000 , and $519,000 for the years ended April 30, 2013 , 2012 , and 2011 , respectively. The Company's investment in notes receivable on nonaccrual status at April 30, 2013 and 2012 was $8,375,000 and $5,274,000 , respectively.
Unrecognized revenue relates to the financed portion of franchise fees and area developer fees and, in the case of sales of company-owned offices, the financed portion of gains related to such sales, in each case where revenue has not yet been recognized. For franchise fees and gains related to the sale of company-owned offices, revenue is recorded as note payments are received by the Company. Payments on area developer fee notes receivable generate a corresponding increase in deferred revenue, which is amortized into revenue over the life of the area developer contract, generally 10 years. Although the timing of actual payments will determine revenues recognized in future periods, the scheduled contractual note payments on the unrecognized portion of these notes for the next five years and thereafter are as follows:
| 2014 |
| 2015 |
| 2016 |
| 2017 |
| 2018 |
| Thereafter |
| Total | ||||||||||||||
Franchise fees and company-owned offices | $ | 8,082 | |
| $ | 5,066 | |
| $ | 2,934 | |
| $ | 2,458 | |
| $ | 62 | |
| $ | - | |
| $ | 18,602 | |
Area developer fees | 3,982 | |
| 3,670 | |
| 3,758 | |
| 3,652 | |
| 3,086 | |
| 2,981 | |
| 21,129 | | |||||||
Total | $ | 12,064 | |
| $ | 8,736 | |
| $ | 6,692 | |
| $ | 6,110 | |
| $ | 3,148 | |
| $ | 2,981 | |
| $ | 39,731 | |
(3) Property, Equipment, and Software, Net
Property, equipment, and software at April 30, 2013 and 2012 are as follows:
|
| 2013 |
| 2012 | ||||
|
| (In thousands) | ||||||
Land & land improvements |
| $ | 1,328 | |
| $ | 997 | |
Buildings and building improvements |
| 7,602 | |
| 6,826 | | ||
Leasehold improvements |
| 225 | |
| 292 | | ||
Furniture, fixtures, and equipment |
| 6,388 | |
| 5,053 | | ||
Software |
| 36,500 | |
| 27,462 | | ||
|
| 52,043 | |
| 40,630 | | ||
Less accumulated depreciation and amortization |
| 19,006 | |
| 16,682 | | ||
Property, equipment, and software, net |
| $ | 33,037 | |
| $ | 23,948 | |
Total depreciation expense was $3,069,000 , $3,562,000 , and $3,438,000 for the years ended April 30, 2013 , 2012 , and 2011 , respectively.
The software included above includes both internally developed software and purchased software. Included in software are $21,688,000 and $13,243,000 of assets that had not been placed in service at April 30, 2013 and 2012 , respectively.
(4) Investments
During the year ended April 30, 2013 , the Company purchased corporate equity securities, as a strategic investment in a business partner, for $ 2,980,000 . The Company classifies this investment as available-for-sale and recognizes unrealized gain on the available-for-sale securities, net of tax, in accumulated other comprehensive income in the stockholders' equity section of the balance sheets. The unrealized gain, net of tax, on the available-for-sale securities at April 30, 2013 was $ 387,000 .
(5) Goodwill and Intangible Assets
Changes in the carrying amount of goodwill for the years ended April 30, 2013 and 2012 are as follows:
F-18
JTH HOLDING, INC. AND SUBSIDIARIES
Notes to Consolidated Financial Statements
April 30, 2013 and 2012
(5) Goodwill and Intangible Assets (Continued)
|
| Goodwill |
| Accumulated impairment loss |
| Net | ||||||
|
| (In thousands) | ||||||||||
Balance at April 30, 2011 (As Restated) |
| $ | 3,457 | |
| $ | (345 | ) |
| $ | 3,112 | |
Acquisitions of assets from franchisees |
| 4,859 | |
| - | |
| 4,859 | | |||
Disposals and foreign currency changes, net |
| (2,159 | ) |
| 76 | |
| (2,083 | ) | |||
Impairments |
| - | |
| (488 | ) |
| (488 | ) | |||
Balance at April 30, 2012 (As Restated) |
| 6,157 | |
| (757 | ) |
| 5,400 | | |||
Acquisitions of assets from franchisees |
| 3,449 | |
| - | |
| 3,449 | | |||
Disposals and foreign currency changes, net |
| (3,149 | ) |
| 610 | |
| (2,539 | ) | |||
Impairments |
| - | |
| (625 | ) |
| (625 | ) | |||
Balance at April 30, 2013 |
| $ | 6,457 | |
| $ | (772 | ) |
| $ | 5,685 | |
The Company performed its annual impairment review of goodwill and recorded impairment of $625,000 and $488,000 for the years ended April 30, 2013 and 2012, respectively. Goodwill related to assets acquired from franchisees was $3,772,000 and $3,487,000 at April 30, 2013 and 2012, respectively.
Components of intangible assets are as follows:
|
| April 30, 2013 | ||||||||||||
|
| Weighted average amortization period |
| Gross carrying amount |
| Accumulated amortization |
| Net carrying amount | ||||||
|
| (In thousands) | ||||||||||||
Amortizable intangible assets: |
|
|
|
|
|
|
|
| ||||||
Acquired customer lists |
| 7 years |
| $ | 1,603 | |
| $ | (171 | ) |
| $ | 1,432 | |
Assets acquired from franchisees: |
|
|
|
|
|
|
|
| ||||||
Customer lists |
| 4 years |
| 1,834 | |
| (582 | ) |
| 1,252 | | |||
Reacquired rights |
| 2 years |
| 1,640 | |
| (905 | ) |
| 735 | | |||
Area developer rights |
| 10 years |
| 9,842 | |
| (2,340 | ) |
| 7,502 | | |||
Total |
|
|
| $ | 14,919 | |
| $ | (3,998 | ) |
| $ | 10,921 | |
|
| April 30, 2012 | ||||||||||||
|
| As Restated | ||||||||||||
|
| Weighted average amortization period |
| Gross carrying amount |
| Accumulated amortization |
| Net carrying amount | ||||||
|
| (In thousands) | ||||||||||||
Amortizable intangible assets: |
|
|
|
|
|
|
|
| ||||||
Assets acquired from franchisees: |
|
|
|
|
|
|
|
| ||||||
Customer lists |
| 4 years |
| $ | 1,795 | |
| $ | (490 | ) |
| $ | 1,305 | |
Reacquired rights |
| 2 years |
| 1,575 | |
| (705 | ) |
| 870 | | |||
Area developer rights |
| 10 years |
| 10,429 | |
| (2,290 | ) |
| 8,139 | | |||
Total |
|
|
| $ | 13,799 | |
| $ | (3,485 | ) |
| $ | 10,314 | |
For the years ended April 30, 2013 and 2012 , the Company acquired assets from various franchisees for $7,899,000 and $8,446,000 , respectively. These acquisitions were accounted for as business combinations, with the value first being allocated to the identifiable intangible assets (the customer list and the reacquired rights) and the remainder being allocated to goodwill. The acquired businesses are operated as Company-owned offices until a buyer is found.
F-19
JTH HOLDING, INC. AND SUBSIDIARIES
Notes to Consolidated Financial Statements
April 30, 2013 and 2012
(5) Goodwill and Intangible Assets (Continued)
The purchase price of assets acquired from franchisees was allocated as follows:
|
| 2013 |
| 2012 | ||||
|
|
|
| As Restated | ||||
|
| (In thousands) | ||||||
Customer lists |
| $ | 3,234 | |
| $ | 1,913 | |
Reacquired rights |
| 1,216 | |
| 1,674 | | ||
Goodwill |
| 3,449 | |
| 4,859 | | ||
Total |
| $ | 7,899 | |
| $ | 8,446 | |
In December 2012, the Company purchased certain assets of an online tax preparation software provider for $1,603,000 . The entire purchase price has been allocated to identifiable intangible assets.
For the years ended April 30, 2013 , 2012 and 2011 , amortization expense, impairment charges, and write-downs are as follows:
|
| 2013 |
| 2012 |
| 2011 | ||||||
|
|
|
| As Restated |
| As Restated | ||||||
|
| (In thousands) | ||||||||||
Amortization expense, excluding impairment charges |
| $ | 2,681 | |
| $ | 1,949 | |
| $ | 1,563 | |
Impairment charges and write-downs |
| $ | 788 | |
| $ | 488 | |
| $ | 438 | |
The Company expects that the assets will be sold before the end of their estimated useful life. Therefore, during the years ended April 30, 2013 , 2012 and 2011 , impairment analyses were performed for amortizable intangible assets. As a result, the carrying values of assets acquired from franchisees and area developer rights were reduced by the amounts disclosed in the table above, and were recorded to depreciation, amortization, and impairment charges on the consolidated statements of income. The Company estimated the fair value of the assets acquired from franchisees based on historical transactions involving sales of Company-owned offices. Write-downs of assets acquired from franchisees relate to purchases of offices that the Company decided not to operate.
Estimated amortization expense for the next five years is as follows:
| Amortization expense | ||
| (In thousands) | ||
Year ending April 30: |
| ||
2014 | $ | 2,317 | |
2015 | 1,941 | | |
2016 | 1,641 | | |
2017 | 1,354 | | |
2018 | 1,153 | | |
|
| | |
| $ | 8,406 | |
(6) Leases
The Company is obligated under various operating leases for office space that expire at various dates. At April 30, 2013 , future minimum lease payments under noncancelable operating leases with initial or remaining lease terms in excess of one year, together with amounts due from franchisees under subleases, are as follows:
F-20
JTH HOLDING, INC. AND SUBSIDIARIES
Notes to Consolidated Financial Statements
April 30, 2013 and 2012
(6) Leases (Continued)
|
| Lease payments |
| Sublease receipts | ||||
|
| (In thousands) | ||||||
Year ending April 30: |
|
|
|
| ||||
2014 |
| $ | 4,338 | |
| $ | 2,393 | |
2015 |
| 1,915 | |
| 1,094 | | ||
2016 |
| 865 | |
| 490 | | ||
2017 |
| 633 | |
| 389 | | ||
2018 |
| 318 | |
| 136 | | ||
Thereafter |
| 386 | |
| 110 | | ||
Total minimum lease payments |
| $ | 8,455 | |
| $ | 4,612 | |
Total rent expense for operating leases, net of subleases, was $3,220,000 , $2,352,000 , and $1,805,000 for the years ended April 30, 2013 , 2012 , and 2011 , respectively.
(7) Credit Facility
In February 2008, JTH Tax, Inc. entered into a revolving credit facility. This revolving credit facility, which provided for maximum allowable borrowings of $125 million , was replaced effective April 30, 2012. The current credit facility consists of a $25 million term loan and a $105 million revolving credit facility, with an accordion feature permitting the Company to request an increase in availability of up to an additional $70 million . On December 28, 2012 , the Company utilized the accordion feature to increase the borrowing limit under the revolving credit facility by $ 38.4 million , increasing the maximum borrowings under that portion of its credit facility to $143.4 million .
The term loan amortizes on a quarterly basis and matures on April 30, 2017 , and the revolving loan also expires on April 30, 2017 . The outstanding borrowings on both loans accrue interest, which is paid monthly, at an adjusted one-month LIBOR rate plus a margin that varies from 1.50% to 2.25% , depending on the Company's leverage ratio. At April 30, 2013 , the interest rate was 1.95% . A commitment fee that varies from 0.25% to 0.50% depending on the Company's leverage ratio on the unused portion of the credit facility, is paid monthly. This indebtedness is collateralized by substantially all of the Company's assets, including the assets of its subsidiaries.
The credit facility contains certain financial covenants that the Company must meet, including leverage and fixed charge coverage ratios, as well as minimum net worth requirements. In addition, the Company must reduce the outstanding balance under its revolving loan to zero for a period of at least 45 consecutive days each fiscal year. The Company's borrowing availability on the credit facility at April 30, 2013 was $98,638,000 . At April 30, 2013 and 2012 , the Company had no outstanding borrowings under its revolving credit facility, and at April 30, 2013 , the balance of the term loan was $23,750,000 . The Company was in compliance with the financial covenants of its credit facility at April 30, 2013 . At January 31, 2013, the Company was not in compliance with its leverage ratio requirement due to an unprecedented delay in the start of the federal tax season attributable to the last minute fiscal cliff resolution by Congress. In March 2013, the Company obtained a waiver from its creditors for this covenant failure. The accounting policy changes that have resulted in the restatements of our financial statements resulted in our inability to satisfy several credit facility covenants related to the delivery and accuracy of our financial reports. The Company obtained a waiver of these failures from our bank syndicate in August 2013.
The credit facility also contains certain events of default that if they occur may cause the bank syndicate to terminate the credit facility and declare amounts owed to become immediately payable. At April 30, 2013, except for the event of default noted above, the Company has not incurred an event of default.
(8) Long-Term Debt
Long-term debt at April 30, 2013 and 2012 is as follows:
F-21
JTH HOLDING, INC. AND SUBSIDIARIES
Notes to Consolidated Financial Statements
April 30, 2013 and 2012
(8) Long-Term Debt (Continued)
|
| 2013 |
| 2012 | ||||
|
| (In thousands) | ||||||
Term loan payable in quarterly principal installments commencing July 31, 2012 of 1.25%,1.875%, 2.5%, 2.5% and 3.125% of the original amount borrowed for the years ending April 30, 2013, 2014, 2015, 2016 and 2017, respectively |
| $ | 23,750 | |
| $ | 25,000 | |
Mortgage note payable to a bank in monthly installments of $16 including interest at 6.06% through September 2016; at which time a balloon payment of $2,213 is payable; collateralized by land and building |
| 2,370 | |
| 2,411 | | ||
Notes payable for acquired assets from franchisees, interest rates ranging from 0% to 12%; due May 2013 through June 2013 |
| 1,439 | |
| 1,401 | | ||
Other debt |
| 124 | |
| 173 | | ||
Total long-term debt |
| 27,683 | |
| 28,985 | | ||
Less current installments |
| 3,400 | |
| 2,736 | | ||
Total long-term debt, less current installments |
| $ | 24,283 | |
| $ | 26,249 | |
Aggregate maturities of long-term debt at April 30, 2013 are as follows (in thousands):
|
| ||
Year ending April 30: |
| ||
2014 | $ | 3,400 | |
2015 | 2,590 | | |
2016 | 2,582 | | |
2017 | 19,111 | | |
Total long-term debt | $ | 27,683 | |
(9) Derivative Instruments and Hedging Activities
The Company uses interest-rate-related derivative financial instruments to manage its exposure related to changes in interest rates on its variable-rate line of credit and forward contracts to manage its exposure to foreign currency fluctuation related to short-term advances made to its Canadian subsidiary. The Company does not speculate using derivative instruments nor does it enter into derivative instruments for any purpose other than cash flow hedging.
By using derivative financial instruments to hedge exposures to changes in interest rates, the Company exposes itself to credit risk and market risk. Credit risk is the failure of the counterparty to perform under the terms of the derivative contract. When the fair value of a derivative contract is positive, the counterparty owes the Company, which creates credit risk for the Company. When the fair value of a derivative contract is negative, the Company owes the counterparty, and therefore, the Company is not exposed to the counterparty's credit risk in those circumstances. The Company minimizes counterparty credit risk in derivative instruments by entering into transactions with high-quality counterparties. The derivative instruments entered into by the Company do not contain credit-risk-related contingent features.
Market risk is the adverse effect on the value of a derivative instrument that results from a change in interest rates. The market risk associated with interest rates is managed by establishing and monitoring parameters that limit the types and degree of market risk that may be undertaken.
The Company assesses interest rate risk by continually identifying and monitoring changes in interest rates that may adversely impact expected future cash flows and by evaluating hedging opportunities. The Company maintains risk management control systems to monitor interest rate risk attributable to both the Company's outstanding or forecasted debt obligations and forecasted revenues as well as the Company's offsetting hedge positions. The risk management control systems involve the use of analytical techniques, including cash flow sensitivity analysis, to estimate the expected impact of changes in interest rates and foreign currency rates on the Company's future cash flows.
It is the policy of the Company to enter into forward contracts at the time short-term advances are made to its Canadian subsidiary.
F-22
JTH HOLDING, INC. AND SUBSIDIARIES
Notes to Consolidated Financial Statements
April 30, 2013 and 2012
(9) Derivative Instruments and Hedging Activities (Continued)
Interest rate swap agreements. On July 1, 2009, the Company entered into interest rate swap agreements with a financial institution to manage fluctuations in cash flows resulting from changes in the one-month LIBOR interest rate on its line of credit. These swaps effectively changed the variable-rate line of credit into a fixed-rate line of credit. For the notional amounts, the Company received a variable interest rate based on the one-month LIBOR and pays a fixed interest rate of 2.49% to 2.52% , depending on the agreement. The notional amounts of the interest rate swaps varied from $10,000,000 to $70,000,000 per month, in relation to the Company's forecasted seasonal borrowings. These interest rate swaps were designated as cash flow hedges. At April 30, 2012 , the fair value of interest rate swaps was a liability of $694,000 , and was included in accounts payable and accrued expenses. During the years ended April 30, 2013 and 2012 , $0 and $92,000 of income, respectively, were recognized in the consolidated statements of income due to the ineffectiveness of these interest rate swaps. The interest rate swap agreements expired in March 2013.
Forward contracts related to foreign currency exchange rates. In connection with short-term advances made to its Canadian subsidiary related to personal income tax refund discounting, the Company enters into forward contracts to eliminate the exposure related to foreign currency fluctuations. Under the terms of the forward currency contracts, the exchange rate for repayments is fixed at the time advance is made and the advances are repaid prior to April 30 of each year. These forward contracts are designated as cash flow hedges. At April 30, 2013 and 2012 , there were no forward contracts outstanding. During the years ended April 30, 2013 , 2012 , and 2011 , no amounts have been recognized in the statements of income due to the ineffectiveness of these foreign currency hedges.
At April 30, 2013 , there are no deferred gains on derivative instruments accumulated in other comprehensive income that are expected to be reclassified to earnings during the next 12 months.
(10) Income Taxes
Total income taxes were calculated for the years ended April 30, 2013 , 2012 , and 2011 as follows:
|
| 2013 |
| 2012 |
| 2011 | ||||||
|
|
|
| As Restated |
| As Restated | ||||||
|
| (In thousands) | ||||||||||
Income taxes from continuing operations |
| $ | 11,170 | |
| $ | 9,747 | |
| $ | 10,142 | |
Tax benefit of stock option exercises |
| (271 | ) |
| (458 | ) |
| (408 | ) | |||
Interest rate swap agreements |
| 257 | |
| 152 | |
| (104 | ) | |||
Unrealized appreciation on available-for-sale securities |
| 252 | |
| - | |
| - | | |||
Foreign currency translation adjustment |
| - | |
| (550 | ) |
| 167 | | |||
Total income taxes |
| $ | 11,408 | |
| $ | 8,891 | |
| $ | 9,797 | |
F-23
JTH HOLDING, INC. AND SUBSIDIARIES
Notes to Consolidated Financial Statements
April 30, 2013 and 2012
(10) Income Taxes (Continued)
Components of income tax expense for the years ended April 30, 2013 , 2012 , and 2011 are as follows:
|
| 2013 |
| 2012 |
| 2011 | ||||||
|
|
|
| As Restated |
| As Restated | ||||||
|
| (In thousands) | ||||||||||
Current: |
|
|
|
|
|
| ||||||
Federal |
| $ | 5,368 | |
| $ | 5,961 | |
| $ | 6,324 | |
State |
| 1,254 | |
| 1,160 | |
| 1,292 | | |||
Foreign |
| 429 | |
| 322 | |
| 855 | | |||
Current tax expense |
| 7,051 | |
| 7,443 | |
| 8,471 | | |||
Deferred: |
|
|
|
|
|
| ||||||
Federal |
| 3,365 | |
| 1,963 | |
| 1,331 | | |||
State |
| 787 | |
| 382 | |
| 272 | | |||
Foreign |
| (33 | ) |
| (41 | ) |
| 68 | | |||
Deferred tax expense |
| 4,119 | |
| 2,304 | |
| 1,671 | | |||
Total income tax expense |
| $ | 11,170 | |
| $ | 9,747 | |
| $ | 10,142 | |
For the years ended April 30, 2013 , 2012 , and 2011 , income before taxes consists of the following:
|
| 2013 |
| 2012 |
| 2011 | ||||||
|
|
|
| As Restated |
| As Restated | ||||||
|
| (In thousands) | ||||||||||
U.S. operations |
| $ | 27,434 | |
| $ | 24,859 | |
| $ | 22,148 | |
Foreign operations |
| 1,363 | |
| 1,271 | |
| 2,664 | | |||
|
| $ | 28,797 | |
| $ | 26,130 | |
| $ | 24,812 | |
Income tax expense differed from the amounts computed by applying the U.S. federal income tax rate of 35% to pretax income from continuing operations as a result of the following for the years ended April 30, 2013 , 2012 , and 2011 :
|
| 2013 |
| 2012 |
| 2011 | ||||||
|
|
|
| As Restated |
| As Restated | ||||||
|
| (In thousands) | ||||||||||
Computed "expected" income tax expense |
| $ | 10,079 | |
| $ | 9,145 | |
| $ | 8,684 | |
Increase (decrease) in income taxes resulting from: |
|
|
|
|
|
| ||||||
State income taxes, net of federal benefit |
| 1,455 | |
| 1,033 | |
| 1,048 | | |||
Nondeductible items, net |
| 421 | |
| 297 | |
| 356 | | |||
Tax credits |
| (545 | ) |
| (445 | ) |
| - | | |||
Other |
| (240 | ) |
| (283 | ) |
| 54 | | |||
Total income tax expense |
| $ | 11,170 | |
| $ | 9,747 | |
| $ | 10,142 | |
F-24
JTH HOLDING, INC. AND SUBSIDIARIES
Notes to Consolidated Financial Statements
April 30, 2013 and 2012
(10) Income Taxes (Continued)
|
| 2013 | | 2012 | ||||
|
|
|
| As Restated | ||||
|
| (In thousands) | ||||||
Deferred tax assets: |
|
|
|
| ||||
Unexercised nonqualified stock options |
| $ | 2,425 | |
| $ | 1,192 | |
Allowance for doubtful accounts |
| 3,501 | |
| 2,593 | | ||
Interest rate swap agreements |
| - | |
| 257 | | ||
Deferred revenue |
| 4,948 | |
| 7,398 | | ||
Other |
| 441 | |
| 208 | | ||
Total deferred tax assets |
| 11,315 | |
| 11,648 | | ||
Deferred tax liabilities: |
|
|
|
| ||||
Property, equipment, software, and other intangible assets |
| 7,258 | |
| 3,480 | | ||
Prepaid expenses |
| 438 | |
| 174 | | ||
Unrealized appreciation on available-for-sale securities |
| 252 | |
| - | | ||
Total deferred tax liabilities |
| 7,948 | |
| 3,654 | | ||
Net deferred tax asset |
| $ | 3,367 | |
| $ | 7,994 | |
In assessing the realizability of the gross deferred tax assets, management considers whether it is more likely than not that some portion or all of the deferred tax assets will not be realized. The ultimate realization of deferred tax assets is dependent upon the generation of future taxable income during the periods in which those temporary differences become deductible. Management considers the scheduled reversal of deferred tax liabilities, projected future taxable income, and tax planning strategies in making this assessment. Based upon the level of historical taxable income and projections for future taxable income over the periods in which the deferred tax assets are deductible, management believes it is more likely than not that the Company will realize the benefits of these deductible differences.
The Company has adopted the accounting and disclosure requirements for uncertain tax positions, which require a two-step approach to evaluate tax positions. This approach involves recognizing any tax positions that are more likely than not to occur and then measuring those positions to determine the amounts to be recognized in the financial statements. The Company has determined no reserves for uncertain tax positions were required at April 30, 2012 .
Foreign subsidiary net earnings that were considered permanently reinvested were $1,363,000 , $1,271,000 and $2,664,000 for the fiscal years ended April 30, 2013, 2012 and 2011, respectively. Because these foreign subsidiary net earnings are considered permanently reinvested, the amount of deferred tax liability that would need to be provided if these earnings were not reinvested is not reasonably determinable.
At April 30, 2013 , the tax years that remain subject to examination by the Internal Revenue Service are the years ended April 30, 2010, 2011 and 2012 , and years that remain open for other major taxing jurisdictions are the years ended April 30, 2010, 2011 and 2012 .
(11) Stockholders' Equity
(a) | Preferred Stock and Exchangeable Shares |
The Company has 190,000 shares of authorized Class A preferred stock with a par value of $0.01 , of which 170,320 were issued and outstanding at April 30, 2012 and 0 were outstanding at April 30, 2013 because effective June 15, 2012, two of the Company's major shareholders elected to convert 170,320 shares of Class A preferred stock to 1,703,200 shares of Class A
F-25
JTH HOLDING, INC. AND SUBSIDIARIES
Notes to Consolidated Financial Statements
April 30, 2013 and 2012
(11) Stockholders' Equity (Continued)
common stock. For the years ended April 30, 2011 and 2012, the outstanding shares of Class A preferred stock are presented on the consolidated balance sheets at their original purchase price.
The holders of the Class A preferred stock were entitled to a dividend if a dividend is declared for common stock and were to receive a dividend as if each share of preferred stock had been converted to Class A common stock in accordance with the conversion ratio, and a liquidation preference upon the liquidation, dissolution, or consolidation of the Company. In the event of liquidation, dissolution, or consolidation, the holders of Class A preferred stock would be entitled to receive out of the assets of the Company, after payment or provision for payment of the debts or other liabilities of the Company, the original issue price per share for each share of Class A preferred stock then outstanding, plus an amount equal to the original issue price per share multiplied by 10% per annum from the original issue date, compounded annually to the date of such distribution. The liquidation value of a share of outstanding Class A preferred stock was $43.15 as of April 30, 2012.
A holder of the Class A preferred stock, at the holder's option, could elect to convert each share of the Class A preferred stock into 10 shares of fully paid and nonassessable shares of Class A common stock.
During 2011, the Company repurchased 18,146 shares of its Class A preferred stock for $2,722,000 .
In October 2001, the Company acquired the remaining 40% of the outstanding common stock of the Canadian subsidiary in a transaction that was accounted for as a purchase. The Company issued consideration to the minority shareholder consisting of 1,600,000 shares of Class A common stock, 10 shares of special voting preferred stock, and 100,000 shares of exchangeable shares of a Canadian subsidiary in exchange for $2,000,000 in cash and the 40% minority interest in the Canadian subsidiary. The 100,000 exchangeable shares are exchangeable at any time at a 10 : 1 ratio into the Class A common stock of the Company. The special voting preferred shares issued have a $0.01 par value and no liquidation value and entitle the holder to vote each share as if it represented 100,000 shares of Class A common stock. These shares will be canceled as the holder exchanges the exchangeable shares.
(b) | Common Stock |
The Company is authorized to issue 21,200,000 shares of Class A common stock, par value $0.01 per share, and 1,000,000 shares of Class B common stock, par value $0.01 per share. Class A common stock and Class B common stock entitle the holders thereof to the same rights and privileges and are identical in all respects as to all matters, except the holders of Class B common stock are entitled to elect one more director than the number of directors elected by holders of all other classes of stock combined. Also, a holder of Class B common stock may, at the holder's option, elect to convert the Class B common stock into an equal number of fully paid and nonassessable shares of Class A common stock.
(c) | Accumulated Other Comprehensive Income |
The components of accumulated other comprehensive income at April 30, 2013 and 2012 are as follows:
|
| 2013 |
| 2012 | ||||
|
| (In thousands) | ||||||
Foreign currency adjustment |
| $ | 807 | |
| $ | 1,113 | |
Unrealized gain on equity securities available for sale, net of taxes |
| 387 | |
| - | | ||
Interest rate swap agreements, net of tax |
| - | |
| (437 | ) | ||
|
| $ | 1,194 | |
| $ | 676 | |
(d) | Earnings per Share |
Net income per share of Class A and Class B common stock is computed using the two-class method. Basic net income per share is computed by allocating undistributed earnings to common shares and participating securities (Class A preferred stock and exchangeable shares) and using the weighted average number of common shares outstanding during the period.
Diluted net income per share is computed using the weighted average number of common shares and, if dilutive, the potential common shares outstanding during the period. Potential common shares consist of the incremental common shares issuable upon the exercise of stock options and non-vested restricted shares. The dilutive effect of outstanding stock options is reflected in diluted earnings per share by application of the treasury stock method. Additionally, the computation of the diluted net income per share of Class A common stock assumes the conversion of Class B common stock, Class A preferred stock and
F-26
JTH HOLDING, INC. AND SUBSIDIARIES
Notes to Consolidated Financial Statements
April 30, 2013 and 2012
(11) Stockholders' Equity (Continued)
exchangeable shares, while the diluted net income per share of Class B common stock does not assume conversion of those shares.
The rights, including liquidation and dividends rights, of the holders of Class A and Class B common stock are identical, except with respect to voting. As a result, the undistributed earnings for each year are allocated based on the contractual participation rights of the Class A and Class B as if the earnings for the year had been distributed. Participating securities include Class A preferred stock and exchangeable shares, which have dividend rights that are identical to Class A and Class B common stock.
|
| 2013 | ||||||
|
| Class A common stock |
| Class B common stock | ||||
|
| (In thousands, except for share and per share amounts) | ||||||
Basic net income per share: |
|
|
|
| ||||
Numerator: |
|
|
|
| ||||
Allocation of undistributed earnings |
| $ | 16,386 | |
| $ | 1,241 | |
Amounts allocated to participating securities: |
|
|
|
| ||||
Class A preferred stock |
| (247 | ) |
| (18 | ) | ||
Exchangeable shares |
| (1,171 | ) |
| (89 | ) | ||
Net income attributable to common stockholders |
| $ | 14,968 | |
| $ | 1,134 | |
Denominator: |
|
|
|
| ||||
Weighted-average common shares outstanding |
| 11,883,214 | |
| 900,000 | | ||
Basic net income per share |
| $ | 1.26 | |
| $ | 1.26 | |
Diluted net income per share: |
|
|
|
| ||||
Numerator: |
|
|
|
| ||||
Allocation of undistributed earnings for basic computation |
| $ | 14,968 | |
| $ | 1,134 | |
Reallocation of undistributed earnings as a result of assumed conversion of: |
|
|
|
| ||||
Class B common stock to Class A common stock |
| 1,134 | |
| - | | ||
Class A preferred stock to Class A common stock |
| 265 | |
| - | | ||
Exchangeable shares to Class A common stock |
| 1,260 | |
| - | | ||
|
| $ | 17,627 | |
| $ | 1,134 | |
Denominator: |
|
|
|
| ||||
Number of shares used in basic computation |
| 11,883,214 | |
| 900,000 | | ||
Weighted-average effect of dilutive securities and the conversion or exercise of: |
|
|
|
| ||||
Class B common stock to Class A common stock |
| 900,000 | |
| - | | ||
Class A preferred stock to Class A common stock |
| 210,560 | |
| - | | ||
Exchangeable shares to Class A common stock |
| 1,000,000 | |
| - | | ||
Employee stock options |
| 78,584 | |
| 5,054 | | ||
|
| 14,072,358 | |
| 905,054 | | ||
Diluted net income per share |
| $ | 1.25 | |
| $ | 1.25 | |
F-27
JTH HOLDING, INC. AND SUBSIDIARIES
Notes to Consolidated Financial Statements
April 30, 2013 and 2012
(11) Stockholders' Equity (Continued)
|
| 2012 | ||||||
|
| As Restated | ||||||
|
| Class A common stock |
| Class B common stock | ||||
|
| (In thousands, except for share and per share amounts) | ||||||
Basic net income per share: |
|
|
|
| ||||
Numerator: |
|
|
|
| ||||
Allocation of undistributed earnings |
| $ | 15,076 | |
| $ | 1,307 | |
Amounts allocated to participating securities: |
|
|
|
| ||||
Class A preferred stock |
| (1,836 | ) |
| (159 | ) | ||
Exchangeable shares |
| (1,078 | ) |
| (94 | ) | ||
Net income attributable to common stockholders |
| $ | 12,162 | |
| $ | 1,054 | |
Denominator: |
|
|
|
| ||||
Weighted-average common shares outstanding |
| 10,383,780 | |
| 900,000 | | ||
Basic net income per share |
| $ | 1.17 | |
| $ | 1.17 | |
Diluted net income per share: |
|
|
|
| ||||
Numerator: |
|
|
|
| ||||
Allocation of undistributed earnings for basic computation |
| $ | 12,162 | |
| $ | 1,054 | |
Reallocation of undistributed earnings as a result of assumed conversion of: |
|
|
|
| ||||
Class B common stock to Class A common stock |
| 1,054 | |
| - | | ||
Class A preferred stock to Class A common stock |
| 1,995 | |
| - | | ||
Exchangeable shares to Class A common stock |
| 1,172 | |
| - | | ||
|
| $ | 16,383 | |
| $ | 1,054 | |
Denominator: |
|
|
|
| ||||
Number of shares used in basic computation |
| 10,383,780 | |
| 900,000 | | ||
Weighted-average effect of dilutive securities add the conversion or exercise of: |
|
|
|
| ||||
Class B common stock to Class A common stock |
| 900,000 | |
| - | | ||
Class A preferred stock to Class A common stock |
| 1,703,200 | |
| - | | ||
Exchangeable shares to Class A common stock |
| 1,000,000 | |
| - | | ||
Employee stock options |
| 180,956 | |
| 11,644 | | ||
|
| 14,167,936 | |
| 911,644 | | ||
Diluted net income per share |
| $ | 1.16 | |
| $ | 1.16 | |
F-28
JTH HOLDING, INC. AND SUBSIDIARIES
Notes to Consolidated Financial Statements
April 30, 2013 and 2012
(11) Stockholders' Equity (Continued)
|
| 2011 | ||||||
|
| As Restated | ||||||
|
| Class A common stock |
| Class B common stock | ||||
|
| (In thousands, except for share and per share amounts) | ||||||
Basic net income per share: |
|
|
|
| ||||
Numerator: |
|
|
|
| ||||
Allocation of undistributed earnings, based on net income |
| $ | 13,521 | |
| $ | 1,149 | |
Preferred stock redeemed, treated as dividend (Note 19) |
| (2,300 | ) |
| (195 | ) | ||
Allocation of undistributed earnings, as adjusted |
| 11,221 | |
| 954 | | ||
Amounts allocated to participating securities: |
|
|
|
| ||||
Class A preferred stock |
| (1,448 | ) |
| (123 | ) | ||
Exchangeable shares |
| (783 | ) |
| (67 | ) | ||
Net income attributable to common stockholders |
| $ | 8,990 | |
| $ | 764 | |
Denominator: |
|
|
|
| ||||
Weighted-average common shares outstanding |
| 10,588,954 | |
| 900,000 | | ||
Basic net income per share |
| $ | 0.85 | |
| $ | 0.85 | |
Diluted net income per share: |
|
|
|
| ||||
Numerator: |
|
|
|
| ||||
Allocation of undistributed earnings for basic computation |
| $ | 8,990 | |
| $ | 764 | |
Reallocation of undistributed earnings as a result conversion of: |
|
|
|
| ||||
Class B common stock to Class A common stock |
| 764 | |
| - | | ||
Class A preferred stock to Class A common stock |
| 1,572 | |
| - | | ||
Exchangeable shares to Class A common stock |
| 849 | |
| - | | ||
|
| $ | 12,175 | |
| $ | 764 | |
Denominator: |
|
|
|
| ||||
Number of shares used in basic computation |
| 10,588,954 | |
| 900,000 | | ||
Weighted-average effect of dilutive securities add the conversion or exercise of: |
|
|
|
| ||||
Class B common stock to Class A common stock |
| 900,000 | |
| - | | ||
Class A preferred stock to Class A common stock |
| 1,850,800 | |
| - | | ||
Exchangeable shares to Class A common stock |
| 1,000,000 | |
| - | | ||
Employee stock options |
| 322,494 | |
| 20,241 | | ||
|
| 14,662,248 | |
| 920,241 | | ||
Diluted net income per share |
| $ | 0.83 | |
| $ | 0.83 | |
Diluted net income per share excludes the impact of shares of common stock from the exercise of options to purchase 2,402,183 , 2,278,225 and 1,894,250 shares for the years ended April 30, 2013 , 2012 , and 2011 , respectively, because the effect would be antidilutive.
(12) Stock Compensation Plan
(a) Stock Options
In May 1998, the board of directors approved the JTH Holding, Inc. Stock Option Plan (the 1998 Plan). Employees and outside directors were eligible to receive awards under the Plan, and a total of 6,100,000 shares of Class A common stock were authorized for grant under the 1998 Plan. The 1998 Plan was readopted by the board of directors in May 2008 and was replaced by a new plan in August 2011 (the New Plan). At April 30, 2013, 2,027,439 shares of Class A common stock are available for
F-29
JTH HOLDING, INC. AND SUBSIDIARIES
Notes to Consolidated Financial Statements
April 30, 2013 and 2012
(12) Stock Compensation Plan (Continued)
grant under the New Plan. Stock options generally vest from six months to five years from the date of grant and generally expire five years from the vesting date.
The following table summarizes the information for options granted in the years ended April 30, 2013, 2012, and 2011:
|
| 2013 |
| 2012 |
| 2011 |
Weighted average fair value of options granted |
| $1.80 |
| $2.30 |
| $2.54 |
Dividend yield |
| -% |
| -% |
| -% |
Expected volatility |
| 13.0% -14.9% |
| 14.9% - 15.0% |
| 14.6% - 15.7% |
Expected terms |
| 4-6 years |
| 4 - 6 years |
| 4 - 6 years |
Risk-free interest rates |
| 0.6%-1.0% |
| 0.8% - 1.9% |
| 1.2% - 2.3% |
Stock option activity during the years ended April 30, 2013 , 2012 , and 2011 is as follows:
|
| Number of options |
| Weighted average exercise price | |||
Outstanding at April 30, 2010 |
| 1,970,720 | |
| $ | 11.61 | |
Granted |
| 1,048,800 | |
| 15.03 | | |
Exercised |
| (460,162 | ) |
| 8.27 | | |
Canceled |
| (98,020 | ) |
| 10.08 | | |
Outstanding at April 30, 2011 |
| 2,461,338 | |
| 13.77 | | |
Granted |
| 433,670 | |
| 15.00 | | |
Exercised |
| (110,125 | ) |
| 6.74 | | |
Canceled |
| (55,870 | ) |
| 14.88 | | |
Outstanding at April 30, 2012 |
| 2,729,013 | |
| 14.21 | | |
Granted |
| 332,035 | |
| 15.00 | | |
Exercised |
| (349,500 | ) |
| 10.88 | | |
Canceled |
| (176,865 | ) |
| 13.65 | | |
Outstanding at April 30, 2013 |
| 2,534,683 | |
| 14.81 | | |
Stock options were granted to employees of the Company except for options granted to nonemployee directors of 43,135 , 80,000 , and 80,000 stock options during the years ended April 30, 2013 , 2012 , and 2011 , respectively.
The total intrinsic value of options exercised was approximately $1,686,000 , $900,000 , and $3,100,000 during the years ended April 30, 2013 , 2012 , and 2011 , respectively.
F-30
JTH HOLDING, INC. AND SUBSIDIARIES
Notes to Consolidated Financial Statements
April 30, 2013 and 2012
(12) Stock Compensation Plan (Continued)
Nonvested stock options (options that did not vest in the period in which granted) activity during the years ended April 30, 2013 , 2012 , and 2011 are as follows:
|
| Nonvested options |
| Weighted average exercise price | |||
Outstanding at April 30, 2010 |
| 177,500 | |
| $ | 14.65 | |
Granted |
| 702,500 | |
| 15.00 | | |
Vested |
| (275,000 | ) |
| 14.78 | | |
Canceled |
| - | |
| - | | |
Outstanding at April 30, 2011 |
| 605,000 | |
| 15.00 | | |
Granted |
| 433,670 | |
| 15.00 | | |
Vested |
| (577,450 | ) |
| 15.00 | | |
Canceled |
| (8,720 | ) |
| 15.00 | | |
Outstanding at April 30, 2012 |
| 452,500 | |
| 15.00 | | |
Granted |
| 332,035 | |
| 15.00 | | |
Vested |
| (596,935 | ) |
| 15.00 | | |
Canceled |
| (55,100 | ) |
| 15.00 | | |
Outstanding at April 30, 2013 |
| 132,500 | |
| 15.00 | | |
At April 30, 2013 , unrecognized compensation costs related to nonvested stock options are $859,000 . These costs are expected to be recognized between 2014 and 2015 .
The following table summarizes information about stock options outstanding and exercisable at April 30, 2013 :
Number of shares outstanding at April 30, 2013 |
| Range of exercise prices |
| Weighted average exercise price |
| Weighted average remaining contractual life (years) |
| Number of shares exercisable at April 30, 2013 |
| Weighted average exercise price | ||||||||
117,500 | |
| $ | 10.50 | |
| $ | 10.50 | |
| 1.9 |
| 117,500 | |
| $ | 10.50 | |
2,152,625 | |
| 14.00 - 16.50 | |
| 15.02 | |
| 2.9 |
| 2,020,125 | |
| 15.02 | | |||
264,558 | |
| 15.00 | |
| 15.00 | |
| 3.8 |
| 264,558 | |
| 15.00 | | |||
| |
|
|
|
| |
|
|
| 2,402,183 | |
|
| | ||||
During the fiscal year ended April 30, 2013, the cash settlement of certain stock option transactions caused a change in the classification of certain outstanding stock options to a liability instrument from an equity instrument, which resulted in an increase in stock compensation expense of $2,625,000 . At April 30, 2013, the value of the liability for the 997,824 options that changed classifications from an equity to a liability instrument was $5,111,000 . The following table summarizes the information used to value the liability classified stock-based compensation awards:
|
| April 30, 2013 |
Weighted average fair value of options granted |
| $5.12 |
Dividend yield |
| -% |
Expected volatility |
| 36.2% |
Expected terms |
| 2.90 |
Risk-free interest rates |
| 0.36% |
F-31
JTH HOLDING, INC. AND SUBSIDIARIES
Notes to Consolidated Financial Statements
April 30, 2013 and 2012
(12) Stock Compensation Plan (Continued)
(b) Restricted Stock Units
During the year ended April 30, 2013 , the Company awarded 15,971 shares of restricted stock units to its non-employee directors. The weighted average fair value at grant date was $13.50 and the vesting or service period is between 16 - 18 months. Compensation costs associated with these restricted shares are amortized over the service period and recognized as an increase in additional paid-in capital.
The Company uses the following methods and assumptions to estimate the fair value of financial instruments:
Cash equivalents, receivables, other current assets, accounts payable and accrued expenses, and due to area developers: The carrying amounts approximate fair value because of the short maturity of these instruments. At April 30, 2013 and 2012 , the Company had cash equivalents of $16,798,000 and $18,848,000 , respectively, invested in money market accounts.
Notes receivable: The carrying amount of the Company's notes receivable approximates fair value based upon the present value of expected future cash flows discounted at the interest rate currently offered by the Company, which approximates rates currently offered by local lending institutions for loans of similar terms to individuals/entities with comparable credit risk.
Long-term debt: The carrying amount of the Company's long-term debt approximates fair value based on the present value of expected future cash flows discounted at the interest rates offered by the lenders, which approximates rates currently offered by local lending institutions for loans of similar terms to companies with comparable credit risk.
Concentrations of credit risks: Financial instruments that could potentially subject the Company to concentrations of credit risks consist of cash equivalents and accounts and notes receivable with its franchisees.
The Company maintains its cash and cash equivalents in bank deposit accounts, which at times may exceed federally insured limits. The Company has not experienced any losses in such accounts. The Company believes it is not exposed to any significant credit risk on its cash and cash equivalents balances.
The Company manages credit risk by evaluating the financial position of the franchisee, value of the franchises, as well as the personal guarantee of the individual franchisees. At April 30, 2013 and 2012 , there were no significant concentrations of credit risk associated with any individual franchisee or group of franchisees. The Company maintains an allowance for potential losses based on its expected collectibility of the receivables, which the Company believes is adequate for its credit loss exposure. The consolidated financial statements include various estimated fair value information at April 30, 2013 and 2012.
Fair value is defined as the price that would be received to sell an asset or paid to transfer a liability in an orderly transaction between market participants at the measurement date. Financial assets and liabilities subject to fair value measurements on a recurring basis are classified according to a three-tier fair value hierarchy, which prioritizes the inputs used in measuring fair value.
• | Level 1-Quoted prices for identical assets and liabilities in active markets. |
• | Level 2-Quoted prices for similar assets and liabilities in active markets, quoted prices for identical or similar assets and liabilities in markets that are not active, and model-based valuations in which all significant inputs are observable in the market. |
• | Level 3-Unobservable inputs in which little or no market data exists, therefore requiring an entity to develop its own assumptions. |
At April 30, 2013 and 2012 , the following tables present, for each of the fair value hierarchy levels, the assets and liabilities that are measured at fair value on a recurring and nonrecurring basis:
F-32
JTH HOLDING, INC. AND SUBSIDIARIES
Notes to Consolidated Financial Statements
April 30, 2013 and 2012
(13) Fair Value of Financial Instruments
|
|
|
| April 30, 2013 Fair value measurements using | ||||||||||||
|
| Total |
| Level 1 |
| Level 2 |
| Level 3 | ||||||||
|
|
|
| (In thousands) | ||||||||||||
Assets: |
|
|
|
|
|
|
|
| ||||||||
Recurring: |
|
|
|
|
|
|
|
| ||||||||
Cash equivalents |
| $ | 16,798 | |
| $ | 16,798 | |
| $ | - | |
| $ | - | |
Equity securities, available for sale |
| 3,619 | |
| 3,619 | |
| - | |
| - | | ||||
|
| $ | 20,417 | |
| $ | 20,417 | |
| $ | - | |
| $ | - | |
Nonrecurring: |
|
|
|
|
|
|
|
| ||||||||
Impaired accounts and notes receivable |
| $ | 7,973 | |
| $ | - | |
| $ | - | |
| $ | 7,973 | |
Impaired goodwill |
| 1,254 | |
| - | |
| - | |
| 1,254 | | ||||
Impaired reacquired rights |
| 286 | |
| - | |
| - | |
| 286 | | ||||
Impaired customer lists |
| 453 | |
| - | |
| - | |
| 453 | | ||||
|
| $ | 9,966 | |
| $ | - | |
| $ | - | |
| $ | 9,966 | |
Liabilities: |
|
|
|
|
|
|
|
| ||||||||
Recurring: |
|
|
|
|
|
|
|
| ||||||||
Liability classified stock-based compensation awards |
| $ | 5,111 | |
| $ | - | |
| $ | 5,111 | |
| $ | - | |
|
|
|
| April 30, 2012 As Restated Fair value measurements using | ||||||||||||
|
| Total |
| Level 1 |
| Level 2 |
| Level 3 | ||||||||
|
|
|
| (In thousands) | ||||||||||||
Assets: |
|
|
|
|
|
|
|
| ||||||||
Recurring: |
|
|
|
|
|
|
|
| ||||||||
Cash equivalents |
| $ | 18,848 | |
| $ | 18,848 | |
| $ | - | |
| $ | - | |
|
|
|
|
|
|
|
|
| ||||||||
Nonrecurring: |
|
|
|
|
|
|
|
| ||||||||
Impaired accounts and notes receivable |
| $ | 5,746 | |
| $ | - | |
| $ | - | |
| $ | 5,746 | |
Impaired goodwill |
| 1,477 | |
| - | |
| - | |
| 1,477 | | ||||
Impaired reacquired rights |
| 412 | |
| - | |
| - | |
| 412 | | ||||
Impaired customer lists |
| 564 | |
| - | |
| - | |
| 564 | | ||||
|
| $ | 8,199 | |
| $ | - | |
| $ | - | |
| $ | 8,199 | |
Liabilities: |
|
|
|
|
|
|
|
| ||||||||
Recurring: |
|
|
|
|
|
|
|
| ||||||||
Interest rate swap agreements |
| $ | 694 | |
| $ | - | |
| $ | 694 | |
| $ | - | |
The Company's policy is to recognize transfers between levels of the fair value hierarchy on the date of the event or change in circumstances that caused the transfer. There were no transfers into or out of Level 1 or 2 recurring fair value measurements for the years ended April 30, 2013 and 2012 .
Management considers accounts and notes receivable to be impaired if the amounts due exceed the fair value of the underlying franchise. In establishing the estimated fair value of the underlying franchise consideration is given to the net fees of open offices and the number of unopened offices.
F-33
JTH HOLDING, INC. AND SUBSIDIARIES
Notes to Consolidated Financial Statements
April 30, 2013 and 2012
(13) Fair Value of Financial Instruments (Continued)
Management considers intangible assets, reacquired rights, customer list and goodwill, associated with a Company-owned office to be impaired if the net carrying amount exceeds the fair value of the underlying office. In establishing the fair value of a customer list, consideration is given to historical transactions involving sales of Company-owned offices and the net fees of the underlying office.
The fair value of the Company's interest swap agreements is the difference between the present value of interest payments due under the current swap agreements and similar swap agreements using a market rate of interest on date of valuation.
(14) Related-Party Transactions
The Company considers directors and their affiliated companies, executive officers and their immediate family members to be related parties. For the years ended April 30, 2013 , 2012 , and 2011 , the Company repurchased common and Class A preferred stock from related parties as follows:
|
| 2013 |
| 2012 |
| 2011 | ||||||
Common stock: |
|
|
|
|
|
| ||||||
Shares repurchased |
| 191,000 | |
| 52,000 | |
| 98,000 | | |||
Amount |
| $ | 3,010,000 | |
| $ | 787,000 | |
| $ | 1,471,000 | |
Preferred stock: |
|
|
|
|
|
| ||||||
Shares repurchased |
| - | |
| - | |
| 18,000 | | |||
Amount |
| $ | - | |
| $ | - | |
| $ | 2,722,000 | |
At April 30, 2013 and 2012 , notes receivable from related parties are as follows:
|
| 2013 |
| 2012 | ||||
Note receivable |
| $ | 22,000 | |
| $ | 21,000 | |
Repayments received during the year |
| 2,000 | |
| 971,000 | | ||
Interest rates on these notes approximate prevailing market rates at the time of their issuance.
(15) Employee 401(k) Plan
The Company sponsors a defined-contribution 401(k) profit sharing plan. Under the plan, employees who are 18 years of age and have completed 90 days of service are eligible to make voluntary contributions to the plan. The Company matches 50% of each employee's contribution up to 3% of the employee's salary. Total compensation expense related to these contributions was $412,000 , $375,000 , and $305,000 for the years ended April 30, 2013 , 2012 , and 2011 , respectively.
(16) Commitments and Contingencies
ERC class action litigation. The Company was sued in November 2011 in federal courts in Arkansas, California, Florida and Illinois, and additional lawsuits were filed in federal courts in January 2012 in Maryland and North Carolina, in February 2012 in Wisconsin, and in May 2012 in New York and Minnesota, since the initial filings. In April 2012, a motion to consolidate all of the then-pending cases before a single judge in federal court in the Northern District of Illinois was granted, and in June 2012, the plaintiffs filed a new complaint in the consolidated action. The consolidated complaint alleges that an electronic refund check (ERC) represents a form of refund anticipation loan (RAL) because the taxpayer is "loaned" the tax preparation fee, and that an ERC is therefore subject to federal truth-in-lending disclosure and state law requirements regulating RALs. The plaintiffs therefore allege violations of state-specific RAL and other consumer statutes. The lawsuit purports to be a class action, and the plaintiffs allege potential damages in excess of $5 million , but we may be able to recover any damages from the providers of the financial products that designed the programs and related disclosures. The Company is aware that virtually identical lawsuits have been filed against several of its competitors. The Company has not concluded that a loss related to this matter is probable, nor has the Company accrued a loss contingency related to this matter. The Company believes it has meritorious defenses to the claims in this case, and intends to defend the case vigorously, but there can be no assurances as to the outcome or the impact on the Company's consolidated financial position, results of operations and cash flows. The case is at an early procedural stage.
F-34
JTH HOLDING, INC. AND SUBSIDIARIES
Notes to Consolidated Financial Statements
April 30, 2013 and 2012
(16) Commitments and Contingencies (Continued)
South Carolina litigation. In November 2010, several former customers of one of the Company's South Carolina franchisees initiated a purported class action against the Company, its chief executive officer and another of the Company's employees in the United States District Court for the District of South Carolina, in a case styled Martin v. JTH Tax, Inc. Class action status was denied in February 2013, and the case was settled in June 2013. The settlement amount is immaterial and has been included in the accompanying consolidated financial statements.
Republic Bank Dispute . In August 2012, the Company terminated an agreement with one of its financial product providers, Republic Bank & Trust Company, which would otherwise have expired in October 2014. The Company's right to terminate the agreement is being disputed by Republic Bank & Trust Company, and the parties conducted a contractually-required mediation in late June 2013. If the mediation does not resolve the parties' dispute, the agreement provides for arbitration of the dispute. At this stage, an arbitration proceeding has not been commenced, but the Company believes that the outcome of this dispute will not significantly impact its results of operation or financial position.
The Company is also party to claims and lawsuits that are considered to be ordinary, routine litigation incidental to the business, including claims and lawsuits concerning the preparation of customers' income tax returns, the fees charged to customers for various products and services, relationships with franchisees, intellectual property disputes, employment matters and contract disputes. Although the Company cannot provide assurance that it will ultimately prevail in each instance, the Company believes the amount, if any, it will be required to pay in the discharge of liabilities or settlements in these claims will not have a material adverse impact on its consolidated results of operations.
(17) Subsequent Events
On May 31, 2013 , the Company authorized the grant of 16,348 restricted stock units and 9,490 stock options to the nonemployee directors of the Company. The grant price of the restricted stock units and the exercise price of the options is $16.38 . The options will vest after six months and can be exercised over a five -year period after the vesting date. The restricted stock will have a vesting period of 18 months .
On September 20, 2013 , the Company authorized the grant of 397,284 options and 7,134 restricted stock units to certain employees and non-employee directors of the Company. The exercise price of the options will be $17.95 per share, which is the fair value at grant date. The options will vest between six months and three years and may generally be exercised over a five -year period after the vesting date. The restricted stock units will generally have a vesting period that expires on June 30, 2015 .
(18) Quarterly Financial Data (Unaudited)
As discussed in greater detail in Note 19, the Company determined the need to restate its previously issued consolidated financial information for the quarterly periods ended July 31, 2012, October 31, 2012, January 31, 2013 and each of the quarterly periods in the year ended April 30, 2012.
|
| Three Months Ended | ||||||||||||||
|
| July 31, 2012 |
| October 31, 2012 |
| January 31, 2013 |
| April 30, 2013 | ||||||||
|
| As Restated |
| As Restated |
| As Restated |
|
| ||||||||
|
| (In thousands, except per share amounts) | ||||||||||||||
Revenue |
| $ | 7,244 | |
| $ | 9,482 | |
| $ | 37,921 | |
| $ | 92,966 | |
Net income (loss) |
| $ | (6,363 | ) |
| $ | (6,111 | ) |
| $ | 1,673 | |
| $ | 28,428 | |
Net income (loss) per share of Class A and Class B common stock: |
|
|
|
|
|
|
|
| ||||||||
Basic |
| $ | (0.52 | ) |
| $ | (0.47 | ) |
| $ | 0.12 | |
| $ | 2.04 | |
Diluted |
| $ | (0.52 | ) |
| $ | (0.47 | ) |
| $ | 0.12 | |
| $ | 2.01 | |
F-35
JTH HOLDING, INC. AND SUBSIDIARIES
Notes to Consolidated Financial Statements
April 30, 2013 and 2012
(18) Quarterly Financial Data (Unaudited) (Continued)
|
| Three Months Ended | ||||||||||||||
|
| July 31, 2011 |
| October 31, 2011 |
| January 31, 2012 |
| April 30, 2012 | ||||||||
|
| As Restated |
| As Restated |
| As Restated |
| As Restated | ||||||||
|
| (In thousands, except per share amounts) | ||||||||||||||
Revenue |
| $ | 6,332 | |
| $ | 8,248 | |
| $ | 44,226 | |
| $ | 72,419 | |
Net income (loss) |
| $ | (4,551 | ) |
| $ | (5,366 | ) |
| $ | 5,266 | |
| $ | 21,034 | |
Net income (loss) per share of Class A and Class B common stock: |
|
|
|
|
|
|
|
| ||||||||
Basic |
| $ | (0.40 | ) |
| $ | (0.48 | ) |
| $ | 0.38 | |
| $ | 1.51 | |
Diluted |
| $ | (0.40 | ) |
| $ | (0.48 | ) |
| $ | 0.37 | |
| $ | 1.49 | |
Because most of the Company's customers file their tax returns during the period from January through April of each year, most of the Company's revenues are earned during this period. As a result, the Company generally operates at a loss through the first eight months of the fiscal year.
The following tables summarize the effects of the restatement and presentation reclassifications on our previously issued unaudited condensed consolidated financial statements:
|
| Three Months Ended January 31, 2013 | ||||||||||
|
| As Reported |
| Adjustments |
| As Restated | ||||||
|
| (In thousands, except per share amounts) | ||||||||||
Revenue |
| $ | 30,538 | |
| $ | 7,383 | |
| $ | 37,921 | |
Net income |
| $ | 1,112 | |
| $ | 561 | |
| $ | 1,673 | |
Net income per share of Class A and Class B common stock: |
|
|
|
|
| | ||||||
Basic |
| $ | 0.08 | |
| $ | 0.04 | |
| $ | 0.12 | |
Diluted |
| $ | 0.08 | |
| $ | 0.04 | |
| $ | 0.12 | |
|
| Three Months Ended October 31, 2012 |
| Three Months Ended July 31, 2012 | ||||||||||||||||||||
|
| As Reported |
| Adjustments |
| As Restated |
| As Reported |
| Adjustments |
| As Restated | ||||||||||||
|
| (In thousands, except per share amounts) | ||||||||||||||||||||||
Revenue |
| $ | 7,289 | |
| $ | 2,193 | |
| $ | 9,482 | |
| $ | 6,786 | |
| $ | 458 | |
| $ | 7,244 | |
Net income (loss) |
| $ | (6,698 | ) |
| $ | 587 | |
| $ | (6,111 | ) |
| $ | (6,152 | ) |
| $ | (211 | ) |
| $ | (6,363 | ) |
Net income (loss) per share of Class A and Class B common stock: |
|
|
|
|
|
|
|
|
|
|
|
| ||||||||||||
Basic |
| $ | (0.51 | ) |
| $ | 0.04 | |
| $ | (0.47 | ) |
| $ | (0.51 | ) |
| $ | (0.01 | ) |
| $ | (0.52 | ) |
Diluted |
| $ | (0.51 | ) |
| $ | 0.04 | |
| $ | (0.47 | ) |
| $ | (0.51 | ) |
| $ | (0.01 | ) |
| $ | (0.52 | ) |
JTH HOLDING, INC. AND SUBSIDIARIES
Notes to Consolidated Financial Statements
April 30, 2013 and 2012
(18) Quarterly Financial Data (Unaudited) (Continued)
|
| Three Months Ended April 30, 2012 |
| Three Months Ended January 31, 2012 | ||||||||||||||||||||
|
| As Reported |
| Adjustments |
| As Restated |
| As Reported |
| Adjustments |
| As Restated | ||||||||||||
|
| (In thousands, except per share amounts) | ||||||||||||||||||||||
Revenue |
| $ | 59,789 | |
| $ | 12,630 | |
| $ | 72,419 | |
| $ | 35,650 | |
| $ | 8,576 | |
| $ | 44,226 | |
Net income (loss) |
| $ | 22,039 | |
| $ | (1,005 | ) |
| $ | 21,034 | |
| $ | 4,677 | |
| $ | 589 | |
| $ | 5,266 | |
Net income (loss) per share of Class A and Class B common stock: |
|
|
|
|
|
|
|
|
|
|
|
| ||||||||||||
Basic |
| $ | 1.58 | |
| $ | (0.07 | ) |
| $ | 1.51 | |
| $ | 0.33 | |
| $ | 0.05 | |
| $ | 0.38 | |
Diluted |
| $ | 1.56 | |
| $ | (0.07 | ) |
| $ | 1.49 | |
| $ | 0.33 | |
| $ | 0.04 | |
| $ | 0.37 | |
|
| Three Months Ended October 31, 2011 |
| Three Months Ended July 31, 2011 | ||||||||||||||||||||
|
| As Reported |
| Adjustments |
| As Restated |
| As Reported |
| Adjustments |
| As Restated | ||||||||||||
|
| (In thousands, except per share amounts) | ||||||||||||||||||||||
Revenue |
| $ | 8,793 | |
| $ | (545 | ) |
| $ | 8,248 | |
| $ | 4,868 | |
| $ | 1,464 | |
| $ | 6,332 | |
Net income (loss) |
| $ | (4,326 | ) |
| $ | (1,040 | ) |
| $ | (5,366 | ) |
| $ | (4,979 | ) |
| $ | 428 | |
| $ | (4,551 | ) |
Net income (loss) per share of Class A and Class B common stock: |
|
|
|
|
|
|
|
|
|
|
|
| ||||||||||||
Basic |
| $ | (0.38 | ) |
| $ | (0.10 | ) |
| $ | (0.48 | ) |
| $ | (0.44 | ) |
| $ | 0.04 | |
| $ | (0.40 | ) |
Diluted |
| $ | (0.38 | ) |
| $ | (0.10 | ) |
| $ | (0.48 | ) |
| $ | (0.44 | ) |
| $ | 0.04 | |
| $ | (0.40 | ) |
The adjustments reflected in the table above include the following:
• | Adjustments to revenue to include the change to gross presentation for the AD portion of franchise fees and royalties, the net impact of charging our franchise fee recognition policy to receipt of funds and the net impact of recognizing area developer fees over the life of the agreement instead of upfront. |
• | Adjustments to net income include the revenue adjustments mentioned above, expense adjustments for the gross presentation of amounts due ADs, changes to the provision for bad debt due to the elimination of the provision for refunds, adjustments to amortization due to the purchase price allocation for company-owned offices and adjustments to the provision for income taxes due to the restatement adjustments. |
(19) Restatement of Previously Issued Financial Statements
On August 1, 2013, the Company concluded that previously issued consolidated financial statements should not be relied upon due to revenue recognition adjustments. The Company's decision to restate its consolidated financial statements was based upon the results of an internal review of the Company's historical revenue recognition policies and their application. The Company has restated its consolidated balance sheet as of April 30, 2012 and the related consolidated statements of income, comprehensive income, stockholders' equity and cash flows for the fiscal years ended April 30, 2012 and 2011. Additionally, the Company has restated the unaudited quarterly financial information for each quarter in the fiscal year ended April 30, 2012 and for the first three quarters of the year ended April 30, 2013 as shown in Note 18.
Impact of Corrections on Previously Issued Consolidated Financial Statements
Adjustments were made for the following items:
• | We determined that our area developer agreements do not constitute a franchise relationship for accounting purposes. Therefore, instead of recording revenue at the inception of the area developer relationship under franchise accounting, we now record these fees over the life of the area developer contract, which is typically 10 years. Additionally, our financial statements now show the portion of franchise fees, interest and royalties that the AD is entitled to receive from us in our revenue captions, with an equal amount of expense shown in a new operating expense caption, area developer expense. These amounts were previously presented on a net basis. |
JTH HOLDING, INC. AND SUBSIDIARIES
Notes to Consolidated Financial Statements
April 30, 2013 and 2012
(19) Restatement of Previously Issued Financial Statements (Continued)
• | We changed our revenue recognition policy for franchise fees to record revenue as amounts are received from the franchisee. Previously, we generally recorded such revenues at the time of sale, net of expected note cancellations related to the amount financed. Therefore, under the new revenue recognition policy any portion of franchise fees that is financed is only reflected as revenue as the note payments are made. |
• | We also revised our methodology for the allocation of the purchase price associated with the acquisitions of businesses from franchisees. Historically, we allocated the entire purchase price to an identifiable intangible asset, customer list. The new methodology allocates the purchase price to all identifiable intangible assets, which consist of reacquired rights and customer list. Any unallocated purchase price is recorded as goodwill. |
The following table presents the effect of the restatement adjustments on the consolidated balance sheets:
| April 30, 2012 | ||||||||||
| As Reported |
| Adjustments |
| As Restated | ||||||
| (in thousands) | ||||||||||
Receivables: |
|
|
|
|
| ||||||
Notes | $ | 41,889 | |
| $ | (11,606 | ) | | $ | 30,283 | |
Interest | 1,610 | |
| (936 | ) | | 674 | | |||
Allowance for doubtful accounts | (5,044 | ) |
| 548 | | | (4,496 | ) | |||
Total receivables, net | 76,776 | |
| (11,994 | ) | | 64,782 | | |||
Deferred income taxes | 41 | |
| 3,860 | | | 3,901 | | |||
Total current assets | 102,279 | |
| (8,134 | ) | | 94,145 | | |||
Notes receivable, excluding current portion | 37,949 | |
| (25,444 | ) | | 12,505 | | |||
Allowance for uncollectible amounts for long-term notes receivable | (2,086 | ) |
| 1,292 | | | (794 | ) | |||
Goodwill | 1,913 | |
| 3,487 | | | 5,400 | | |||
Other intangibles, net | 22,158 | |
| (11,844 | ) | | 10,314 | | |||
Deferred income taxes | - | |
| 4,093 | |
| 4,093 | | |||
Other assets, net | 2,580 | |
| 5 | | | 2,585 | | |||
Total assets | 188,741 | |
| (36,545 | ) | | 152,196 | | |||
Due to area developers | 21,893 | |
| (5,937 | ) | | 15,956 | | |||
Deferred income taxes | 1,222 | |
| (1,222 | ) | | - | | |||
Deferred revenue - short-term portion | 3,270 | |
| 3,650 | | | 6,920 | | |||
Total current liabilities | 49,980 | |
| (3,509 | ) | | 46,471 | | |||
Deferred revenue - long-term portion | - | |
| 12,411 | | | 12,411 | | |||
Deferred income taxes | 12,310 | |
| (12,310 | ) | | - | | |||
Total liabilities | 88,539 | |
| (3,408 | ) | | 85,131 | | |||
Retained earnings | 94,102 | |
| (33,137 | ) | | 60,965 | | |||
Total stockholders' equity | 100,202 | |
| (33,137 | ) | | 67,065 | | |||
Total liabilities and stockholders' equity | 188,741 | |
| (36,545 | ) | | 152,196 | | |||
The adjustments reflected in the table above include:
• | Adjustments to notes receivable to present balance net of the unrecognized revenue portion of notes |
• | Adjustments to interest receivable to convert from accrual basis to cash basis for notes related to unrecognized revenue |
• | Adjustments to allowance for doubtful accounts includes the impact of the change in our franchise fee revenue recognition policy |
F-38
JTH HOLDING, INC. AND SUBSIDIARIES
Notes to Consolidated Financial Statements
April 30, 2013 and 2012
(19) Restatement of Previously Issued Financial Statements (Continued)
• | Adjustments to deferred income taxes, long-term portion shown in other assets, net and income taxes payable reflect the impact of the restatement adjustments |
• | Adjustments to goodwill and a portion of the other intangibles, net relate to the revised purchase price allocation methodology for businesses acquired from franchisees |
• | Adjustments to other intangibles includes the net impact of the elimination of the deferred revenue balance of repurchased area developer areas |
• | Adjustments to due to area developer to conform to net presentation for notes related to unrecognized revenue |
• | Adjustments to deferred revenue to reflect the recognition of area developer fees over the life of their agreement |
• | Adjustments to stockholders' equity reflects the cumulative impact of all of the restatement adjustments |
The following tables present the effect of the restatement adjustments on the consolidated statements of income:
| April 30, 2012 | ||||||||||
| As Reported |
| Adjustments |
| As Restated | ||||||
Franchise fees | $ | 15,073 | |
| $ | (7,077 | ) | | $ | 7,996 | |
Provision for refunds | 928 | |
| (928 | ) | | - | | |||
Area developer fees | - | |
| 6,702 | | | 6,702 | | |||
Royalties and advertising fees | 49,964 | |
| 20,052 | | | 70,016 | | |||
Interest income | 11,437 | |
| 969 | | | 12,406 | | |||
Net gain on sale of company-owned offices and other assets and other revenue | 3,625 | |
| 551 | | | 4,176 | | |||
Total revenues | 109,100 | |
| 22,125 | | | 131,225 | | |||
General and administrative expenses | 25,780 | |
| 1,098 | | | 26,878 | | |||
Area developer expense | - | |
| 23,872 | | | 23,872 | | |||
Depreciation, amortization, and impairment charges | 7,169 | |
| (1,170 | ) | | 5,999 | | |||
Total operating expenses | 79,445 | |
| 23,800 | | | 103,245 | | |||
Income from operations | 29,655 | |
| (1,675 | ) | | 27,980 | | |||
Income before income taxes | 27,805 | |
| (1,675 | ) | | 26,130 | | |||
Income tax expense | 10,394 | |
| (647 | ) | | 9,747 | | |||
Net income | 17,411 | |
| (1,028 | ) | | 16,383 | | |||
Net income per share of Class A and Class B common stock: |
|
|
|
|
| ||||||
Basic | $ | 1.24 | |
| $ | (0.07 | ) | | $ | 1.17 | |
Diluted | $ | 1.23 | |
| $ | (0.07 | ) | | $ | 1.16 | |
F-39
JTH HOLDING, INC. AND SUBSIDIARIES
Notes to Consolidated Financial Statements
April 30, 2013 and 2012
(19) Restatement of Previously Issued Financial Statements (Continued)
| April 30, 2011 | ||||||||||
| As Reported |
| Adjustments |
| As Restated | ||||||
Franchise fees | $ | 14,354 | |
| $ | (5,574 | ) | | $ | 8,780 | |
Provision for refunds | 1,206 | |
| (1,206 | ) | | - | | |||
Area developer fees | - | |
| 6,335 | | | 6,335 | | |||
Royalties and advertising fees | 46,879 | |
| 19,303 | | | 66,182 | | |||
Interest income | 10,110 | |
| 1,212 | | | 11,322 | | |||
Net gain on sale of company-owned offices and other assets and other revenue | 4,091 | |
| (70 | ) | | 4,021 | | |||
Total revenues | 95,524 | |
| 22,412 | | | 117,936 | | |||
General and administrative expenses | 20,707 | |
| 1,765 | | | 22,472 | | |||
Area developer expense | - | |
| 23,094 | | | 23,094 | | |||
Depreciation, amortization, and impairment charges | 6,062 | |
| (623 | ) | | 5,439 | | |||
Total operating expenses | 67,009 | |
| 24,236 | | | 91,245 | | |||
Income from operations | 28,515 | |
| (1,824 | ) | | 26,691 | | |||
Income before income taxes | 26,636 | |
| (1,824 | ) | | 24,812 | | |||
Income tax expense | 10,874 | |
| (732 | ) | | 10,142 | | |||
Net income | 15,762 | |
| (1,092 | ) | | 14,670 | | |||
Net income per share of Class A and Class B common stock: |
|
|
|
|
| ||||||
Basic | $ | 1.10 | |
| $ | (0.25 | ) | | $ | 0.85 | |
Diluted | $ | 1.08 | |
| $ | (0.25 | ) | | $ | 0.83 | |
The adjustments reflected in the tables above include:
• | Adjustments to franchise fees includes the reclassification of area developer fees to a separate caption, the net impact of changing our franchise fee recognition policy to receipt of funds and the change to gross presentation for the area developer portion |
• | Adjustments to provision for refunds is due to the change in our franchise fee recognition policy |
• | Adjustments to area developer fees is the net effect of reclassifying AD fees out of franchisee fees and the impact of recognizing revenue over the life of the agreement |
• | Adjustments to royalties and advertising reflects the change to gross presentation for the area developer portion of royalties |
• | Adjustments to interest income reflect the change to gross presentation for the area developer portion of interest and the conversion to cash basis from accrual basis for interest on notes related to unrecognized revenue |
• | Adjustments to general and administrative expense reflects the increase in the provision for bad debts due to the elimination of the provision for refunds |
• | Adjustments to area developer expense reflects the change to a gross presentation for franchise fees, royalties and interest owed to area developer |
• | Adjustments to amortization and impairment charges are the net effect of the change in purchase price allocation for company-owned offices acquired from franchisees and the impact of a smaller balance of area developer rights due to the netting of deferred revenue upon reacquisition |
• | Adjustments to the provision for income taxes reflects the impact of the restatement adjustments |
• | Adjustment for the year ended April 30, 2011 to the basic and diluted net income per share of Class A and Class B common stock reflects the repurchase of preferred stock as a reduction of net income attributable to common stockholders |
F-40
JTH HOLDING, INC. AND SUBSIDIARIES
Notes to Consolidated Financial Statements
April 30, 2013 and 2012
(19) Restatement of Previously Issued Financial Statements (Continued)
| April 30, 2012 | ||||||||||
| As Reported |
| Adjustments |
| As Restated | ||||||
Net income | $ | 17,411 | |
| $ | (1,028 | ) | | $ | 16,383 | |
Comprehensive income | $ | 17,706 | |
| $ | (1,028 | ) | | $ | 16,678 | |
|
|
|
|
|
| ||||||
| April 30, 2011 | ||||||||||
| As Reported |
| Adjustments |
| As Restated | ||||||
Net income | $ | 15,762 | |
| $ | (1,092 | ) | | $ | 14,670 | |
Comprehensive income | $ | 16,022 | |
| $ | (1,092 | ) | | $ | 14,930 | |
The explanations for the restatement adjustments shown above are detailed on the previous pages.
The restatement had no impact on net operating, investing or financing activities within the consolidated statements of cash flows.
F-41