UNITED STATES SECURITIES AND EXCHANGE COMMISSION
Washington, D.C. 20549
________________
Form 10-K
(Mark One) |
|
☑ | ANNUAL REPORT PURSUANT TO SECTION 13 OR 15(d) OF THE SECURITIES EXCHANGE ACT OF 1934 |
For the fiscal year ended June 30, 2018
OR
¨ | TRANSITION REPORT PURSUANT TO SECTION 13 OR 15(d) OF THE SECURITIES EXCHANGE ACT OF 1934 |
Commission File Number 1-6544
________________
Sysco Corporation
(Exact name of registrant as specified in its charter)
DELAWARE (State or other jurisdiction of incorporation or organization) 1390 Enclave Parkway Houston, Texas (Address of principal executive offices) |
| 74-1648137 (I.R.S. Employer Identification No.) 77077-2099 (Zip Code) |
Registrant's Telephone Number, Including Area Code:
(281) 584-1390
Securities Registered Pursuant to Section 12(b) of the Act:
Title of Each Class |
| Name of each exchange on which registered |
Common Stock, $1.00 Par Value |
| New York Stock Exchange |
1.25% Notes due June 2023 |
| New York Stock Exchange |
Securities Registered Pursuant to Section 12(g) of the Act: None
Indicate by checkmark if the registrant is a well-known seasoned issuer, as defined in Rule 405 of the Securities Act. Yes ☑ No ☐
Indicate by checkmark if the registrant is not required to file reports pursuant to Section 13 or Section 15(d) of the Act. Yes ☐ No ☑
Indicate by check mark whether the registrant (1) has filed all reports required to be filed by Section 13 or 15(d) of the Securities Exchange Act of 1934 during the preceding 12 months (or for such shorter period that the registrant was required to file such reports), and (2) has been subject to such filing requirements for the past 90 days. Yes ☑ No ☐
Indicate by check mark whether the registrant has submitted electronically and posted on its corporate Web site, if any, every Interactive Data File required to be submitted and posted pursuant to Rule 405 of Regulation S-T during the preceding 12 months (or for such shorter period that the registrant was required to submit and post such files).
Yes ☑ No ☐
Indicate by check mark if disclosure of delinquent filers pursuant to Item 405 of Regulation S-K is not contained herein, and will not be contained, to the best of registrant's knowledge, in definitive proxy or information statements incorporated by reference in Part III of this Form 10-K or any amendment to this Form 10-K. ☐
Indicate by check mark whether the registrant is a large accelerated filer, an accelerated filer, a non-accelerated filer or a smaller reporting company. See definition of "large accelerated filer," "accelerated filer" and "smaller reporting company" in Rule 12b-2 of the Exchange Act. (Check one):
Large Accelerated Filer ☑ |
| Accelerated Filer ☐ |
Non-accelerated Filer ☐ (Do not check if a smaller reporting company) |
| Smaller Reporting Company ☐ |
Indicate by check mark whether the registrant is a shell company (as defined in Rule 12b-2 of the Exchange Act). Yes ☐ No ☑
The aggregate market value of the voting stock of the registrant held by stockholders who were not affiliates (as defined by regulations of the Securities and Exchange Commission) of the registrant was approximately $28,886,944,016 as of December 30, 2017 (based on the closing sales price on the New York Stock Exchange Composite Tape on December 29, 2017 , as reported by The Wall Street Journal (Southwest Edition)). As of August 10, 2018 , the registrant had issued and outstanding an aggregate of 519,774,992 shares of its common stock.
DOCUMENTS INCORPORATED BY REFERENCE:
Portions of the company's 2018 Proxy Statement to be filed with the Securities and Exchange Commission no later than 120 days after the end of the fiscal year covered by this Form 10-K are incorporated by reference into Part III.
TABLE OF CONTENTS
|
|
|
| PART I | Page No. |
Item 1. | Business | 1 |
Item 1A. | Risk Factors | 7 |
Item 1B. | Unresolved Staff Comments | 16 |
Item 2. | Properties | 16 |
Item 3. | Legal Proceedings | 16 |
Item 4. | Mine Safety Disclosures | 16 |
| PART II |
|
Item 5. | Market for Registrant's Common Equity, Related Stockholder Matters and Issuer Repurchases of Equity Securities | 1 |
Item 6. | Selected Financial Data | 3 |
Item 7. | Management's Discussion and Analysis of Financial Condition and Results of Operations | 3 |
Item 7A. | Quantitative and Qualitative Disclosures about Market Risk | 36 |
Item 8. | Financial Statements and Supplementary Data | 39 |
Item 9. | Changes in and Disagreements with Accountants on Accounting and Financial Disclosure | 96 |
Item 9A. | Controls and Procedures | 97 |
Item 9B. | Other Information | 97 |
| PART III |
|
Item 10. | Directors, Executive Officers and Corporate Governance | 97 |
Item 11. | Executive Compensation | 97 |
Item 12. | Security Ownership of Certain Beneficial Owners and Management and Related Stockholder Matters | 97 |
Item 13. | Certain Relationships and Related Transactions, and Director Independence | 97 |
Item 14. | Principal Accounting Fees and Services | 97 |
| PART IV |
|
Item 15. | Exhibits | 98 |
Item 16. | Form 10-K Summary | 98 |
Signatures |
| |
PART I
Item 1. Business
Unless this Form 10-K indicates otherwise or the context otherwise requires, the terms "we," "our," "us," "Sysco," or "the company" as used in this Form 10-K refer to Sysco Corporation together with its consolidated subsidiaries and divisions.
Overview
Sysco Corporation, acting through its subsidiaries and divisions, is the largest global distributor of food and related products primarily to the foodservice or food-away-from-home industry. We provide products and related services to over 600,000 customer locations, including restaurants, healthcare and educational facilities, lodging establishments and other foodservice customers.
Founded in 1969, Sysco commenced operations as a public company in March 1970 when the stockholders of nine companies exchanged their stock for Sysco common stock. Since our formation, we have grown from $115 million to $58.7 billion in annual sales, both through internal expansion of existing operations and through acquisitions.
Sysco's fiscal year ends on the Saturday nearest to June 30th. This resulted in a 52 -week year ending June 30, 2018 for fiscal 2018 , a 52 -week year ending July 1, 2017 for fiscal 2017 , and a 53 -week year ending July 2, 2016 for fiscal 2016 . We will have a 52 -week year ending June 29, 2019 for fiscal 2019 .
Sysco Corporation is organized under the laws of Delaware. The address and telephone number of our executive offices are 1390 Enclave Parkway, Houston, Texas 77077-2099, (281) 584-1390. This annual report on Form 10-K, as well as all other reports filed or furnished by Sysco pursuant to Section 13(a) or 15(d) of the Securities Exchange Act of 1934, as amended, are available free of charge on Sysco's website at www.sysco.com as soon as reasonably practicable after they are electronically filed with or furnished to the Securities and Exchange Commission.
Reporting Segments
Sysco distributes food and related products to restaurants, healthcare and educational facilities, lodging establishments and other foodservice customers. Our primary operations are located in North America and Europe. Under the accounting provisions related to disclosures about segments of an enterprise, we have aggregated certain operating segments into three reportable segments. "Other" financial information is attributable to the company's other operating segments that do not meet the quantitative disclosure thresholds.
• | U.S. Foodservice Operations - primarily includes U.S. Broadline operations, which distribute a full line of food products, including custom-cut meat, seafood, specialty produce, specialty imports and a wide variety of non-food products; |
• | International Foodservice Operations - includes operations in the Americas and Europe, which distribute a full line of food products and a wide variety of non-food products. The Americas primarily consists of operations in Canada, Bahamas, Mexico, Costa Rica and Panama, as well as our operations that distribute to international customers. Our European operations primarily consist of operations in the United Kingdom (U.K.), France, Ireland and Sweden; |
• | SYGMA - our U.S. customized distribution subsidiary; and |
• | Other - primarily our hotel supply operations and Sysco Labs, which includes our suite of technology solutions that help support the business needs of our customers and provide support for some of our business technology needs. |
Broadline operating companies distribute a full line of food products and a wide variety of non-food products to both traditional and chain restaurant customers, hospitals, schools, hotels, industrial caterers and other venues where foodservice products are served. SYGMA operating companies distribute a full line of food products and a wide variety of non-food products to certain chain restaurant customer locations. Selected financial data for each of our reportable segments, as well as financial information concerning geographic areas, can be found in Note 20 , "Business Segment Information," in the Notes to Consolidated Financial Statements in Item 8.
1
Customers and Products
Sysco's customers in the foodservice industry include restaurants, hospitals and nursing homes, schools and colleges, hotels and motels, industrial caterers and other similar venues where foodservice products are served. Services to our customers are supported by similar physical facilities, vehicles, material handling equipment and techniques, and administrative and operating staffs.
The products we distribute include:
• | a full line of frozen foods, such as meats, seafood, fully prepared entrées, fruits, vegetables and desserts; |
• | a full line of canned and dry foods; |
• | fresh meats and seafood; |
• | dairy products; |
• | beverage products; |
• | imported specialties; and |
• | fresh produce. |
We also supply a wide variety of non-food items, including:
• | paper products such as disposable napkins, plates and cups; |
• | tableware such as china and silverware; |
• | cookware such as pots, pans and utensils; |
• | restaurant and kitchen equipment and supplies; and |
• | cleaning supplies. |
A comparison of the sales mix in the principal product categories during the last three years is presented below:
Principal product categories | 2018 |
| 2017 |
| 2016 | |||
Fresh and frozen meats | 20 | % |
| 19 | % |
| 20 | % |
Canned and dry products | 17 | |
| 16 | |
| 17 | |
Frozen fruits, vegetables, bakery and other | 15 | |
| 15 | |
| 13 | |
Poultry | 10 | |
| 11 | |
| 11 | |
Dairy products | 10 | |
| 11 | |
| 11 | |
Fresh produce | 8 | |
| 8 | |
| 8 | |
Paper and disposables | 7 | |
| 6 | |
| 7 | |
Seafood | 6 | |
| 6 | |
| 5 | |
Beverage products | 3 | |
| 4 | |
| 4 | |
Janitorial products | 2 | |
| 2 | |
| 2 | |
Equipment and smallwares | 1 | |
| 1 | |
| 1 | |
Medical supplies | 1 | |
| 1 | |
| 1 | |
Totals | 100 | % |
| 100 | % |
| 100 | % |
Our distribution centers, which we refer to as operating companies, distribute branded merchandise, as well as products packaged under our private brands. Products packaged under our private brands have been manufactured for Sysco according to specifications that have been developed by our quality assurance team. In addition, our quality assurance team certifies the manufacturing and processing plants where these products are packaged, enforces our quality control standards and identifies supply sources that satisfy our requirements.
We believe that prompt and accurate delivery of orders, competitive pricing, close contact with customers and the ability to provide a full array of products and services to assist customers in their foodservice operations are of primary importance in the marketing and distribution of foodservice products to our customers. Our operating companies offer daily delivery to certain customer locations and have the capability of delivering special orders on short notice. Through the sales and marketing representatives and support staff of Sysco and our operating companies, we stay informed of the needs of our customers and acquaint them with new products and services. Our operating companies also provide ancillary services relating to foodservice distribution, such as providing customers with product usage reports and other data, menu-planning advice, food safety training
2
and assistance in inventory control, as well as access to various third party services designed to add value to our customers' businesses.
No single customer accounted for 10% or more of Sysco's total sales for the fiscal year ended June 30, 2018 .
We estimate that our sales by type of customer during the past three fiscal years were as follows:
Type of Customer | 2018 |
| 2017 |
| 2016 | |||
Restaurants | 62 | % |
| 61 | % |
| 63 | % |
Healthcare | 9 | |
| 9 | |
| 9 | |
Education, government | 8 | |
| 9 | |
| 8 | |
Travel, leisure, retail | 8 | |
| 9 | |
| 8 | |
Other (1) | 13 | |
| 12 | |
| 12 | |
Totals | 100 | % |
| 100 | % |
| 100 | % |
(1) | Other includes cafeterias that are not stand alone restaurants, bakeries, caterers, churches, civic and fraternal organizations, vending distributors, other distributors and international exports. None of these types of customers, as a group, exceeded 5% of total sales in any of the years for which information is presented. |
Sources of Supply
We purchase from thousands of suppliers, both domestic and international, none of which individually accounts for more than 10% of our purchases. These suppliers consist generally of large corporations selling brand name and private label merchandise, as well as independent regional brand and private label processors and packers. We also provide specialty and seasonal products from small to mid-sized producers to meet a growing demand for locally sourced products. Our locally sourced products, including produce, meats, cheese and other products, help differentiate our customers' offerings, satisfy demands for new products, and support local communities. Purchasing is generally carried out through both centrally developed purchasing programs, domestically and internationally, and direct purchasing programs established by our various operating companies.
We administer a consolidated product procurement program designed to develop, obtain and ensure consistent quality food and non-food products. The program covers the purchasing and marketing of branded merchandise, as well as products from a number of national brand suppliers, encompassing substantially all product lines. Some of our products are purchased internationally within global procurement centers in order to build strategic relationships with international suppliers and to optimize our supply chain network. Sysco's operating companies purchase product from the suppliers participating in these consolidated programs and from other suppliers, although Sysco Brand products are only available to the operating companies through these consolidated programs. We also focus on increasing profitability by lowering operating costs and by lowering aggregate inventory levels, which reduces future facility expansion needs at our Broadline operating companies, while providing greater value to our suppliers and customers.
Working Capital Practices
Our growth is funded through a combination of cash flow from operations, commercial paper issuances and long-term borrowings. See the discussion in Item 7 "Management's Discussion and Analysis of Financial Condition and Results of Operations - Liquidity and Capital Resources" regarding our liquidity, financial position and sources and uses of funds.
We extend credit terms to our customers that can vary from cash on delivery to 30 days or more based on our assessment of each customer's credit worthiness. We monitor each customer's account and will suspend shipments if necessary.
A majority of our sales orders are filled within 24 hours of when customer orders are placed. We generally maintain inventory on hand to be able to meet customer demand. The level of inventory on hand will vary by product depending on shelf-life, supplier order fulfillment lead times and customer demand. We also make purchases of additional volumes of certain products based on supply or pricing opportunities.
We take advantage of suppliers' cash discounts where appropriate and otherwise generally receive payment terms from our suppliers ranging from weekly to 45 days or more.
3
Corporate Headquarters and Shared Services Center
Our corporate staff makes available a number of services to our operating companies and our shared services center performs support services for employees, suppliers and customers. Members of these groups possess experience and expertise in, among other areas, customer and vendor contract administration, accounting and finance, treasury, legal, information technology, payroll and employee benefits, risk management and insurance, sales and marketing, merchandising, inbound logistics, human resources, strategy and tax compliance services. The corporate office also makes available supply chain expertise, such as in warehousing and distribution services, which provide assistance in operational best practices, including space utilization, energy conservation, fleet management and work flow.
Capital Improvements
During fiscal 2018 , 2017 and 2016 , $687.8 million , $686.4 million and $527.3 million , respectively, were invested in delivery fleet, facilities, technology and other capital asset enhancements. From time to time, we dispose of assets in the normal course of business; we consider proceeds from these asset sales to be an offset to capital expenditures. During fiscal 2018 , 2017 and 2016 , capital expenditures, net of proceeds from sales of assets, were $665.6 million , $662.7 million and $503.8 million , respectively. Capital expenditures as a percentage of sales during fiscal 2018 , 2017 and 2016 were 1.1% , 1.2% and 1.0% , respectively. We estimate our capital expenditures, net of proceeds from sales of assets, in fiscal 2019 should be approximately 1.2% to 1.3% of sales. During the three years ended June 30, 2018 , capital expenditures were financed primarily by internally generated funds, our commercial paper program and bank and other borrowings. We expect to finance our fiscal 2019 capital expenditures from the same sources.
Employees
As of June 30, 2018 , we had approximately 67,000 employees, approximately 24% of whom were represented by unions, primarily the International Brotherhood of Teamsters and unions in France and Sweden. Contract negotiations are handled by each individual operating company. Approximately 19% of our union employees who are covered by collective bargaining agreements have or will have expired contracts during fiscal 2019 , which contracts are subject to renegotiation. Since June 30, 2018 , there have been no contract renegotiations. We consider our labor relations to be satisfactory.
Competition
There are a large number of companies engaged in the distribution of food and non-food products to the foodservice industry. Our customers may also choose to purchase products directly from wholesale or retail outlets, including club, cash and carry and grocery stores, online retailers, or negotiate prices directly with our suppliers. While we compete primarily with local and regional distributors, some organizations compete with us on a multi-region basis. In addition, these local, regional and multi-regional distributors can create purchasing cooperatives and marketing groups to enhance their competitive abilities by expanding their product mix, improving purchasing power and extending their geographic capabilities. We believe that the principal competitive factors in the foodservice industry are effective customer contacts, the ability to deliver a wide range of quality products and related services on a timely and dependable basis and competitive prices. Our customers are accustomed to purchasing from multiple suppliers and channels concurrently. Product needs, service requirements and price are just a few of the factors they evaluate when deciding where to purchase. Customers can choose from many broadline foodservice distributors, specialty distributors that focus on specific categories such as produce, meat or seafood, other wholesale channels, club stores, cash and carry stores, grocery stores and numerous online retailers. Since switching costs are very low, customers can make supplier and channel changes very quickly. There are few barriers to market entry. Existing foodservice competitors can extend their shipping distances and add truck routes and warehouses relatively quickly to serve new markets or customers.
We estimate that we serve about 16% of an approximately $289 billion annual foodservice market in the United States (U.S.) based on a measurement as of the end of calendar 2017 , based on industry data obtained from Technomic, Inc. We also serve certain international geographies that vary in size and amount of market share. We believe, based upon industry trade data, that our sales to the U.S. and Canada food-away-from-home industry were the highest of any foodservice distributor during fiscal 2018 . While comprehensive industry statistics are not available, we believe that, in most instances, our operations in the U.S. and Canada are among the leading distributors of food and related non-food products to foodservice customers in those trading areas. We believe our competitive advantages include our marketing associates; our diversified product base, which includes quality-assured Sysco brand products; the suite of services we provide to our customers such as business reviews and menu analysis; and our multi-regional presence in North America and Europe, which mitigates some of the impact of regional economic declines that may occur over time.
4
We believe our liquidity and access to capital provides us the ability to continuously invest in business improvements. There are a small number of companies competing in the food-away-from-home industry in the U.S. with publicly traded equity. While our public company status provides us with some advantages over many of our competitors, including access to capital, we believe it also puts us at a disadvantage, in that most of our competitors do not face the obligations and additional costs related to complying with regulatory requirements applicable to public companies.
Government Regulation
Our company is required to comply, and it is our policy to comply, with all applicable laws in the numerous countries throughout the world in which we do business.
In the U.S., as a marketer and distributor of food products, we are subject to the Federal Food, Drug and Cosmetic Act and regulations promulgated thereunder by the U.S. Food and Drug Administration (FDA). The FDA regulates food safety and quality through various statutory and regulatory mandates, including manufacturing and holding requirements for foods through good manufacturing practice regulations, hazard analysis and critical control point (HACCP) requirements for certain foods, and the food and color additive approval process. The agency also specifies the standards of identity for certain foods, prescribes the format and content of information required to appear on food product labels, regulates food contact packaging and materials, and maintains a Reportable Food Registry for the industry to report when there is a reasonable probability that an article of food will cause serious adverse health consequences. For certain product lines, we are also subject to the Federal Meat Inspection Act, the Poultry Products Inspection Act, the Perishable Agricultural Commodities Act, the Packers and Stockyard Act and regulations promulgated by the U.S. Department of Agriculture (USDA) to interpret and implement these statutory provisions. The USDA imposes standards for product safety, quality and sanitation through the federal meat and poultry inspection program. The USDA reviews and approves the labeling of these products and also establishes standards for the grading and commercial acceptance of produce shipments from our suppliers. We are also subject to the Public Health Security and Bioterrorism Preparedness and Response Act of 2002, which imposes certain registration and record keeping requirements on facilities that manufacture, process, pack or hold food for human or animal consumption, as well as Food Defense, which is a responsibility of the Department of Homeland Security.
The recently published rules under the Food Safety Modernization Act (FSMA) will significantly expand our food safety requirements. Among other things, FDA regulations implementing the FSMA require us to establish and maintain comprehensive, prevention-based controls across the food supply chain that are both verified and validated. The FSMA further imposes new requirements for food products imported into the U.S. and provides the FDA with mandatory recall authority. In particular, the final rule on the sanitary transportation of food, which became effective for Sysco in the fourth quarter of fiscal 2017, required us to enhance certain of our systems to ensure that we met the rule's new standards for maintaining the safety of food during transportation.
We and our products are also subject to state and local regulation through such measures as the licensing of our facilities; enforcement by state and local health agencies of state and local standards for our products; and regulation of our trade practices in connection with the sale of our products. Our facilities are subject to regulations issued pursuant to the U.S. Occupational Safety and Health Act by the U.S. Department of Labor. These regulations require us to comply with certain manufacturing, health and safety standards to protect our employees from accidents and to establish hazard communication programs to transmit information on the hazards of certain chemicals present in products we distribute.
Our processing and distribution facilities must be registered with the FDA biennially and are subject to periodic government agency inspections by the FDA and USDA. Our facilities are generally inspected at least annually by federal and/or state authorities. We also must establish communication programs to transmit information about the hazards of certain chemicals present in some of the products we distribute.
Our customers include several departments of the federal government, including the Department of Defense and Department of Veterans Affairs facilities, as well as certain state and local entities. These customer relationships subject us to additional regulations applicable to government contractors.
We are also subject to regulation by numerous federal, state and local regulatory agencies, including, but not limited to, the U.S. Department of Labor, which sets employment practice standards for workers, and the U.S. Department of Transportation, as well as its agencies, the Surface Transportation Board, the Federal Highway Administration, the Federal Motor Carrier Safety Administration, and the National Highway Traffic Safety Administration, which collectively regulate our trucking operations through the regulation of operations, safety, insurance and hazardous materials. We must comply with the safety and fitness regulations promulgated by the Federal Motor Carrier Safety Administration, including those relating to drug and alcohol testing and hours-of service. Such matters as weight and dimension of equipment also fall under federal and state regulations. We are
5
subject to regulations of the Federal Aviation Administration covering items transported by air. In addition, we are subject to the U.S. False Claims Act, and similar state statutes, which prohibit the submission of claims for payment to the government that are false and the knowing retention of overpayments.
The U.S. Foreign Corrupt Practices Act (FCPA) prohibits bribery of public officials to obtain or retain business in foreign jurisdictions. The FCPA also requires us to keep accurate books and records and to maintain internal accounting controls to detect and prevent bribery and to ensure that transactions are properly authorized. We have implemented and continue to develop a robust anti-corruption compliance program applicable to our global operations to detect and prevent bribery and to comply with these and other anti-corruption laws in countries where we operate.
Our business is subject to competition laws in the various jurisdictions where we operate, including the Sherman Antitrust Act and related federal and state antitrust laws in the U.S. These laws and regulations generally prohibit competitors from fixing prices, boycotting competitors, or engaging in other conduct that unreasonably restrains competition. In many jurisdictions, compliance with these competition laws is of special importance to us, and our operations may come under special scrutiny by competition law authorities, due to our competitive position in those jurisdictions.
Outside the U.S., our business is subject to numerous similar statutes and regulations, as well as other legal and regulatory requirements. For example, we are subject to legal and regulatory requirements of the European Union (the EU), as well as those of EU countries where we conduct business (including the U.K., Ireland, France and Sweden), which requirements relate to, among other things, competition, product composition, packaging, labeling, advertisement and the safety of food products, as well as the health, safety and working conditions of employees. We are subject to privacy laws in the EU, including the new regulation that became effective in May 2018, the General Data Protection Regulation (GDPR), which requires companies to meet new requirements regarding the handling of personal data. In addition, our business is subject to the U.K. Modern Slavery Act 2015, which requires certain companies that operate in the U.K. to prepare a report describing steps taken to ensure that slavery and human trafficking is not taking place in its supply chain or business, as well as the U.K. Bribery Act 2010, an anti-corruption law that restricts the offer or payment of anything of value to both government officials as well as to other non-governmental persons with the intent of gaining favorable government action, business or an advantage.
All of our company's facilities and other operations in the U.S. and elsewhere around the world are subject to various environmental protection statutes and regulations, including those in the U.S. and the EU, relating to: (1) the use of water resources and the discharge of wastewater; (2) the discharge of pollutants into the air, including vehicle emissions; (3) proper handling, treatment and disposing of solid and hazardous wastes; and (4) protecting against and appropriately investigating and remediating spills and releases. Further, most of our distribution facilities have ammonia-based refrigeration systems and tanks for the storage of diesel fuel and other petroleum products which are subject to laws regulating such systems and storage tanks (including the investigation and remediation of soil and groundwater contamination associated with the use of underground storage tanks). See "Item 1A. Risk Factors - Business and Operational Risks - We may incur significant costs to comply with environmental laws and regulations, and we may be subject to substantial fines, penalties, or third-party claims for non-compliance."
General
We have numerous trademarks that are of significant importance, including the SYSCO® and Brakes® trademarks, in addition to our privately branded product trademarks that include these trademarks. These trademarks and the private brands on which they are used are widely recognized within the foodservice industry. In North America, approximately half of our privately branded sales are from products labeled with our SYSCO® trademark without any other trademark. We believe the loss of the SYSCO® trademark would have a material adverse effect on our results of operations. In Europe, approximately 26% of our privately branded European sales are from products labeled with the Brakes® trademark. Both our U.S. and European trademarks are effective for a ten-year period and the company generally renews its trademarks before their expiration dates unless a particular trademark is no longer in use. The company does not have any material patents or licenses.
We are not engaged in material research and development activities relating to the development of new products or the improvement of existing products.
Our sales do not generally fluctuate significantly on a seasonal basis; therefore, the business of the company is not deemed to be seasonal.
As of June 30, 2018 , we operated 332 distribution facilities throughout North America and Europe.
6
Item 1A. Risk Factors
The following discussion of "risk factors" identifies the most significant factors that may adversely affect our business, operations, financial position or future financial performance. This information should be read in conjunction with Management's Discussion and Analysis of Financial Condition and Results of Operations and the consolidated financial statements and related notes contained in this report. The following discussion of risks is not all inclusive, but is designed to highlight what we believe are the most significant factors to consider when evaluating our business. These factors could cause our future results to differ from our expectations expressed in the forward-looking statements identified within "Management's Discussion and Analysis of Financial Condition and Results of Operations," and from historical trends.
Industry and General Economic Risks
Our industry is characterized by low margins, and periods of significant or prolonged inflation or deflation affect our product costs and may negatively impact our profitability.
The foodservice distribution industry is characterized by relatively high inventory turnover with relatively low profit margins. Volatile food costs have a direct impact on our industry. Periods of significant product cost inflation may have a negative impact on our results of operations to the extent that we are unable to pass on all or a portion of such product cost increases to our customers in a timely manner. In addition, periods of rapidly increasing inflation may negatively impact our business due to the impact of such inflation on discretionary spending by consumers and our limited ability to increase prices in the current, highly competitive environment. Conversely, our business may be adversely impacted by periods of product cost deflation, because we make a significant portion of our sales at prices that are based on the cost of products we sell plus a percentage margin. As a result, our results of operations may be negatively impacted during periods of product cost deflation, even though our gross profit percentage may remain relatively constant.
Unfavorable macroeconomic conditions in North America and Europe, as well as unfavorable conditions in particular local markets, may adversely affect our results of operations and financial condition.
The foodservice industry is characterized by relatively low profit margins with modest demand growth expected in the near-term, and, consequently, our results of operations are susceptible to regional, national and international economic trends and uncertainties. Economic conditions can affect us in the following ways:
• | Unfavorable conditions can depress sales and/or gross margins in a given market. |
• | Food cost and fuel cost inflation experienced by the consumer can lead to reductions in the frequency of dining out and the amount spent by consumers for food-away-from-home purchases, which could negatively impact our business by reducing demand for our products. |
• | Heightened uncertainty in the financial markets negatively affects consumer confidence and discretionary spending, which can cause disruptions with our customers and suppliers. |
• | Liquidity issues and the inability of our customers to consistently access credit markets to obtain cash to support their operations can cause temporary interruptions in our ability to conduct day-to-day transactions involving the collection of funds from such customers. |
• | Liquidity issues and the inability of our suppliers to consistently access credit markets to obtain cash to support their operations can cause temporary interruptions in our ability to obtain the foodservice products and supplies needed by us in the quantities and at the prices requested. |
Historically, North America and Europe have experienced, from time to time, deteriorating economic conditions and heightened uncertainty in their financial markets, which adversely impacted business and consumer confidence and spending and depressed capital investment and economic activity in the affected regions. If similar unfavorable economic conditions were to arise in the future, our results of operations and financial condition could be adversely affected.
Economic and political instability and potential unfavorable changes in laws and regulations resulting from the U.K.'s exit from the European Union (the EU) could adversely affect our results of operations and financial condition.
The U.K.'s anticipated exit from the EU and the resulting significant change to the U.K.'s relationship with the EU and with countries outside the EU (and its laws and regulations impacting business conducted between them) could disrupt the overall stability of the U.K. and the EU and otherwise negatively impact our European operations. If changes occur in laws and regulations impacting the flow of goods, services and workers between the U.K. and the EU, our European operations could also be negatively impacted. The completion of the U.K.'s exit from the EU could adversely affect the value of our euro- and pound-denominated assets and obligations. Exchange rates related to the British pound sterling have been more volatile since the U.K. announced it
7
would exit the EU and such volatility may continue in the future. Future fluctuations in the exchange rate between the British pound sterling and the local currencies of our suppliers may have the effect of increasing our cost of goods sold in the U.K., which increases we may not be able to pass on to our customers. In addition, the U.K.'s exit from the EU could cause financial and capital markets within and outside the EU to constrict, thereby negatively impacting our ability to finance our business, and could cause a substantial dip in consumer confidence and spending that could negatively impact the foodservice distribution industry. Any one of these impacts could have an adverse effect on our financial condition and results of operations.
Competition and the impact of GPOs may reduce our margins and make it difficult for us to maintain our market share, growth rate and profitability .
The foodservice distribution industry is fragmented and highly competitive, with local, regional and multi-regional distributors and specialty competitors. Local and regional companies often align themselves with other smaller distributors through purchasing cooperatives and marketing groups, with the goal of enhancing their geographic reach, private label offerings, overall purchasing power, cost efficiencies and ability to meet customer distribution requirements. These suppliers may also rely on local presence as a source of competitive advantage, and they may have lower costs and other competitive advantages due to geographic proximity. Furthermore, barriers to entry by new competitors, or geographic or product line expansion by existing competitors, are low. Additionally, increased competition from non-traditional sources (such as club stores and commercial wholesale outlets with lower cost structures), online direct food wholesalers and cash and carry operations have served to further increase pressure on the industry's profit margins, and continued margin pressure within the industry may have a material adverse effect on our results of operations.
Moreover, some of our customers purchase their products from us through group purchasing organizations, or "GPOs," in an effort to lower the prices paid by these customers on their foodservice orders. GPOs have a relatively larger presence in the healthcare, lodging and foodservice management customer segments. If these GPOs are able to add a significant number of our customers as members, it may negatively affect our business, financial condition, or results of operations.
Finally, demand for food-away-from-home products is volatile and price sensitive, imposing limits on our customers' ability to absorb cost increases. New and increasing competitive sources may result in increased focus on pricing and on limiting price increases, or may require increased discounting or other concessions. Such competition or other industry pressures may result in margin erosion and/or make it difficult for us to attract and retain customers.
If we are unable to effectively differentiate ourselves from our competitors, our results of operations could be adversely impacted. In addition, even if we are able to effectively differentiate ourselves, we may only be able to do so through increased expenditures or decreased prices, which could also adversely impact our results of operations.
We may not be able to fully compensate for increases in fuel costs, and fuel hedging arrangements intended to contain fuel costs could result in above market fuel costs .
Volatile fuel prices have a direct impact on our industry. We require significant quantities of fuel for our delivery vehicles and are exposed to the risk associated with fluctuations in the market price for fuel. The price and supply of fuel can fluctuate significantly based on international, political and economic circumstances, as well as other factors outside our control, such as actions by the Organization of the Petroleum Exporting Countries, or OPEC, and other oil and gas producers, regional production patterns, weather conditions and environmental concerns. The cost of fuel affects the price paid by us for products, as well as the costs we incur to deliver products to our customers. Although we have been able to pass along a portion of increased fuel costs to our customers in the past through, among other things, our fuel surcharge program, there is no guarantee that we will be able to do so in the future. If fuel costs increase in the future, we may experience difficulties in passing all or a portion of these costs along to our customers, which may have a negative impact on our results of operations.
We routinely enter into fuel hedging arrangements, including fuel derivatives, to hedge our exposure to volatile fuel prices. There can be no assurance that our fuel hedging transactions will be effective to protect us from changes in fuel prices, and if fuel prices decrease significantly, these hedging arrangements would result in our paying higher than market costs for a portion of our diesel fuel. In addition, our future use of fuel derivatives would expose us to the risk that one of our counterparties fails to perform its obligations, whether due to its insolvency or otherwise, which could result in financial losses.
Business and Operational Risks
Conditions beyond our control can interrupt our supplies and increase our product costs .
8
We obtain substantially all of our foodservice and related products from third-party suppliers. Although our purchasing volume can provide benefits when dealing with suppliers, suppliers may not provide the foodservice products and supplies needed by us in the quantities and at the prices requested. We are also subject to delays caused by interruptions in production and increases in product costs based on conditions outside of our control. These conditions include shortages of qualified labor for our suppliers, work slowdowns, work interruptions, strikes or other job actions by employees of suppliers, short-term weather conditions or more prolonged climate change, crop and other agricultural conditions, water shortages, animal disease outbreaks, transportation interruptions, unavailability of fuel or increases in fuel costs, product recalls, competitive demands, terrorist attacks or international hostilities and natural disasters or other catastrophic events (including, but not limited to, food-borne illnesses). Further, increased frequency or duration of extreme weather conditions could also impair production capabilities, disrupt our supply chain or impact demand for our products. Input costs could increase at any point in time for a large portion of the products that we sell for a prolonged period. Additionally, we procure products from suppliers outside of the United States (U.S.), and we are subject to the risks associated with political or financial instability, trade restrictions, tariffs, currency exchange rates, transport capacity and costs and other factors relating to foreign trade, any or all of which could delay our receipt of product or increase our input costs. Our inability to obtain adequate supplies of foodservice and related products as a result of any of the foregoing factors or otherwise could mean that we could not fulfill our obligations to customers, and customers may turn to other distributors.
In addition, as a foodservice distributor, it is necessary for us to maintain an inventory of products, and declines in product pricing levels between the time we purchase the product from our suppliers and the time we sell the product to our customers could reduce our margin on that inventory, adversely affecting our results of operations.
Adverse publicity about us or lack of confidence in our products could negatively impact our reputation and reduce earnings .
Maintaining a good reputation and public confidence in the safety of the products we distribute is critical to our business. Sysco's brand names, trademarks and logos and our reputation are powerful sales and marketing tools, and we devote significant resources to promoting and protecting them. Anything that damages our reputation or public confidence in our products, whether or not justified, including adverse publicity about the quality, safety, sustainability or integrity of our products or relating to illegal or unethical activities by our employees, suppliers or agents, could tarnish our reputation and diminish the value of our brand, which could adversely affect our results of operations.
Reports, whether true or not, of food-borne illnesses (such as e-coli, avian flu, bovine spongiform encephalopathy, hepatitis A, trichinosis, salmonella, listeria or swine flu) or injuries caused by food tampering could also severely injure our reputation or negatively impact public confidence in our products. If patrons of our restaurant customers become ill from food-borne illnesses, our customers could be forced to temporarily close restaurant locations and our sales and profitability would be correspondingly decreased. In addition, instances of food-borne illnesses or food tampering or other health concerns (even those unrelated to the use of Sysco products) or public concern regarding the safety of our products, can result in negative publicity about the food service distribution industry and cause our results of operations to decrease dramatically.
Damage to our reputation and loss of brand equity could reduce demand for our products and services. This reduction in demand, together with the dedication of time and expense necessary to defend our reputation, would have an adverse effect on our financial condition and results of operations, as well as require additional resources to rebuild our reputation and restore the value of our brand. Our business prospects, financial condition and results of operations could be adversely affected if our public image or reputation were to be tarnished by negative publicity, including dissemination via print, broadcast or social media, or other forms of Internet-based communications. Adverse publicity about regulatory or legal action against us could damage our reputation and image, undermine our customers' confidence and reduce short-term or long-term demand for our products and services, even if the regulatory or legal action is unfounded or not material to our operations. Any of these events could have a material adverse effect on our results of operations and financial condition.
Our relationships with long-term customers may be materially diminished or terminated.
We have long-standing relationships with a number of our customers, many of whom could unilaterally terminate their relationship with us or materially reduce the amount of business they conduct with us at any time. Market competition, customer requirements, customer financial condition and customer consolidation through mergers or acquisitions also could adversely affect our ability to continue or expand these relationships. There is no guarantee that we will be able to retain or renew existing agreements, maintain relationships with any of our customers on acceptable terms, or at all, or collect amounts owed to us from insolvent customers. Our customer agreements are generally terminable upon written notice by either us or the customer, which provides our customers with the opportunity to renegotiate their contracts with us on less favorable terms or to award more business to our competitors. The loss of one or more of our major customers could adversely affect our business, financial condition, and results of operations.
9
Unfavorable changes to the mix of locally managed customers versus multi-unit customers could have a material adverse effect on our results of operations and financial condition.
Increasing the volume of our sales to locally managed customers is very important for our business and our results of operations. Gross margin from our multi-unit customers is generally lower than that of our locally managed customers because we typically sell higher volumes of products to these customers and provide a relatively lower level of value-added services than we do to locally managed customers. If sales to our locally managed customers do not grow at the same or a greater rate as sales to our multi-unit customers, our operating margins may decline.
Moreover, if sales to our multi-unit customers increase at a faster pace of growth than sales to our locally managed customers, we will become more dependent on multi-unit customers as they begin to represent a greater proportion of our total sales. Additionally, the loss of sales to the larger of these multi-unit customers could have a material negative impact on our results of operations and financial condition. Additionally, as a result of our greater dependence on these customers, we could be pressured by them to lower our prices and/or offer expanded or additional services at the same prices. In that event, if we were unable to achieve additional cost savings to offset these price reductions and/or cost increases, our results of operations could be materially adversely affected. We may be unable to change our cost structure and pricing practices rapidly enough to successfully compete in such an environment.
Changes in consumer eating habits could materially and adversely affect our business, financial condition, or results of operations.
Changes in consumer eating habits (such as a decline in consuming food away from home, a decline in portion sizes, or a shift in preferences toward restaurants that are not our customers) could reduce demand for our products. Consumer eating habits could be affected by a number of factors, including changes in attitudes regarding diet and health or new information regarding the health effects of consuming certain foods. There is a growing consumer preference for sustainable, organic and locally grown products, and a shift towards plant-based proteins and/or animal proteins derived from animals that were humanely treated and anti-biotic free.
Changing consumer eating habits also occur due to generational shifts. Millennials, the largest demographic group in terms of spend, seek new and different, as well as more ethnic, menu options and menu innovation. If consumer eating habits change significantly, we may be required to modify or discontinue sales of certain items in our product portfolio, and we may experience higher costs and/or supply shortages associated with our efforts to accommodate those changes as our suppliers adapt to the new eating preferences. Changing consumer eating habits may reduce the frequency with which consumers purchase meals outside of the home. Additionally, changes in consumer eating habits may result in the enactment or amendment of laws and regulations that impact the ingredients and nutritional content of our food products, or laws and regulations requiring us to disclose the nutritional content of our food products. Compliance with these laws and regulations, as well as others regarding the ingredients and nutritional content of our food products, may be costly and time-consuming. We cannot make any assurances regarding our ability to effectively respond to changes in consumer health perceptions or resulting new laws or regulations or to adapt our menu offerings to trends in eating habits.
We may not be able to achieve our three-year financial targets by the end of fiscal year 2020.
In fiscal 2018, we set new three-year financial targets to grow operating income, accelerate earnings per share growth faster than operating income growth and improve return on invested capital. Our ability to meet these financial targets depends largely on our successful execution of our business plan including various related initiatives. There are various risks related to these efforts, including the risk that these efforts may not provide the expected benefits in our anticipated time frame, if at all, and may prove costlier than expected; and the risk of adverse effects to our business, results of operations and liquidity if past and future undertakings, and the associated changes to our business, do not prove to be cost effective or do not result in the cost savings and other benefits at the levels that we anticipate. Our intentions and expectations with regard to the execution of our business plan, and the timing of any related initiatives, are subject to change at any time based on management's subjective evaluation of our overall business needs. If we are unable to successfully execute our business plan, whether due to our failure to realize the anticipated benefits from our various business initiatives in the anticipated time frame or otherwise, we may be unable to achieve our three-year financial targets.
Expanding into international markets and complementary lines of business presents unique challenges, and our expansion efforts with respect to international operations and complementary lines of business may not be successful .
An element of our strategy includes further expansion of operations into international markets and the establishment of international procurement organizations. Our ability to successfully operate in international markets may be adversely affected
10
by political, economic and social conditions beyond our control, local laws and customs, and legal and regulatory constraints, including compliance with applicable anti-corruption and currency laws and regulations, of the countries or regions in which we currently operate or intend to operate in the future. Risks inherent in our existing and future international operations also include, among others, the costs and difficulties of managing international operations, difficulties in identifying and gaining access to local suppliers, suffering possible adverse tax consequences from changes in tax laws or the unfavorable resolution of tax assessments or audits, maintaining product quality and greater difficulty in enforcing intellectual property rights. Additionally, foreign currency exchange rates and fluctuations thereof may have an adverse effect on the financial results of our international operations.
Another element of our strategy includes the possibility of expansion into businesses that are closely related or complementary to, but not currently part of, our core foodservice distribution business. Our ability to successfully operate in these complementary business markets may be adversely affected by legal and regulatory constraints, including compliance with regulatory programs to which we become subject. Risks inherent in branching out into such complementary markets also include the costs and difficulties of managing operations outside of our core business, which may require additional skills and competencies, as well as difficulties in identifying and gaining access to suppliers or customers in new markets.
Changes in applicable tax laws or regulations and the resolution of tax disputes could negatively affect our financial results.
As a multinational corporation, we are subject to income taxes, as well as non-income based taxes, in both the U.S. and various foreign jurisdictions. Significant judgment is required in determining our worldwide provision for income taxes and other tax liabilities. Changes in tax laws or tax rulings may have a significant adverse impact on our effective tax rate. For example, the U.S. and many countries in the EU where we do business are actively considering or have recently enacted changes in relevant tax, accounting and other laws, regulations and interpretations, including changes to tax laws applicable to corporate multinationals.
In particular, the U.S. government enacted in December 2017 comprehensive tax legislation commonly referred to as the Tax Cuts and Jobs Act of 2017 (the Tax Act). The Tax Act makes broad and complex changes to the U.S. tax code, the estimated impacts of which are disclosed elsewhere in this report. The final effects of the Tax Act may differ materially from our estimates, due to, among other things, changes in interpretations of the Tax Act, any further legislative actions to address questions that arise because of the Tax Act, any changes in accounting standards for income taxes or related interpretations in response to the Tax Act, and/or any updates to estimates the company has utilized to calculate the effects. In addition, as discussed more fully at Note 18 , "Income Taxes," our accounting for certain elements of the Tax Act is provisional, and we have recorded reasonable estimates of the effects of those elements in our financial statements included in this Annual Report on Form 10-K. Completion of our accounting for such elements could result in charges or other adjustments that would impact our financial results for fiscal 2019.
Further, in the ordinary course of a global business, there are many intercompany transactions and calculations where the ultimate tax determination could change if tax laws or tax rulings were to be modified. We are also subject to non-income based taxes, such as payroll, sales, use, value-added, net worth, property and goods and services taxes, in both the U.S. and various foreign jurisdictions. Although we believe that our income and non-income based tax estimates are appropriate, there is no assurance that the final determination of tax audits or tax disputes will not be different from what is reflected in our historical income tax provisions and accruals.
Given the breadth and complexity of the Tax Act, as well as the unpredictability of possible further changes to the U.S. or foreign tax laws and regulations and their potential interdependency, it is very difficult to predict the cumulative effect of such tax laws and regulations on our results of operations and cash flow, but such laws and regulations (and changes thereto) could adversely impact our financial results.
If the products distributed by us are alleged to have caused injury or illness, or to have failed to comply with governmental regulations, we may need to recall our products and may experience product liability claims.
We, like any other foodservice distributor, may be subject to product recalls, including voluntary recalls or withdrawals, if the products we distribute are alleged to have caused injury or illness, to have been mislabeled, misbranded, or adulterated or to otherwise have violated applicable governmental regulations. We may also choose to voluntarily recall or withdraw products that we determine do not satisfy our quality standards, whether for taste, appearance or otherwise, in order to protect our brand and reputation. Any future product recall or withdrawal that results in substantial and unexpected expenditures, destruction of product inventory, damage to our reputation and/or lost sales due to the unavailability of the product for a period of time could materially adversely affect our results of operations and financial condition.
We also face the risk of exposure to product liability claims in the event that the use of products sold by Sysco are alleged to have caused injury or illness. We cannot be sure that consumption of our products will not cause a health-related illness in the future or that we will not be subject to claims or lawsuits relating to such matters. Further, even if a product liability claim is
11
unsuccessful or is not fully pursued, the negative publicity surrounding any assertion that our products caused illness or injury could adversely affect our reputation with existing and potential customers and our corporate and brand image. With respect to product liability claims, we believe we have sufficient primary or excess umbrella liability insurance. However, this insurance may not continue to be available at a reasonable cost or, if available, may not be adequate to cover all of our liabilities. We generally seek contractual indemnification and insurance coverage from parties supplying our products, but this indemnification or insurance coverage is limited, as a practical matter, to the creditworthiness of the indemnifying party and the insured limits of any insurance provided by suppliers. If Sysco does not have adequate insurance or contractual indemnification available, product liability relating to defective products could materially adversely affect our results of operations and financial condition.
If we fail to comply with requirements imposed by applicable law or other governmental regulations, we could become subject to lawsuits, investigations and other liabilities and restrictions on our operations that could significantly and adversely affect our business .
We are subject to regulation by various federal, state, provincial, regional and local governments in the countries in which we operate with respect to many aspects of our business, such as food safety and sanitation, ethical business practices, transportation, minimum wage, overtime, wage payment, wage and hour and employment discrimination, immigration, human health and safety, and due to the services we provide in connection with governmentally funded entitlement programs. For a detailed discussion of the laws and regulations to which our business is subject, please refer to "Business - Government Regulation" in Part I, Item 1 of this Annual Report on Form 10-K.
From time to time, both federal and state governmental agencies have conducted audits of our billing practices as part of investigations of providers of services under governmental contracts, or otherwise. We also receive requests for information from governmental agencies in connection with these audits. While we attempt to comply with all applicable laws and regulations, we cannot represent that we are in full compliance with all applicable laws and regulations or interpretations of these laws and regulations at all times or that we will be able to comply with any future laws, regulations or interpretations of these laws and regulations.
If we fail to comply with applicable laws and regulations or encounter disagreements with respect to our contracts subject to governmental regulations, including those referred to above, we may be subject to investigations, criminal sanctions or civil remedies, including fines, injunctions, prohibitions on exporting, or seizures or debarments from contracting with such government. The cost of compliance or the consequences of non-compliance, including debarments, could have an adverse effect on our results of operations. In addition, governmental units may make changes in the regulatory frameworks within which we operate that may require us to incur substantial increases in costs in order to comply with such laws and regulations.
We may incur significant costs to comply with environmental laws and regulations, and we may be subject to substantial fines, penalties or third-party claims for non-compliance.
Our operations are subject to various federal, state, provincial, regional and local laws, rules and regulations in the various countries in which we operate relating to the protection of the environment, including those governing:
• | the discharge of pollutants into the air, soil, and water; |
• | the management and disposal of solid and hazardous materials and wastes; |
• | employee exposure to hazards in the workplace; and |
• | the investigation and remediation of contamination resulting from releases of petroleum products and other regulated materials. |
In the course of our operations, we operate, maintain and fuel fleet vehicles; store fuel in on-site above and underground storage tanks; operate refrigeration systems; and use and dispose of hazardous substances and food wastes. We could incur substantial costs, including fines or penalties and third-party claims for property damage or personal injury, as a result of any violations of environmental or workplace safety laws and regulations or releases of regulated materials into the environment. In addition, we could incur investigation, remediation or other costs related to environmental conditions at our currently or formerly owned or operated properties.
For example, most of our distribution facilities have ammonia-based refrigeration systems and tanks for the storage of diesel fuel and other petroleum products, which are subject to laws regulating such systems and storage tanks (including the investigation and remediation of soil and groundwater contamination associated with the use of underground storage tanks). Certain of these laws and regulations in the EU may impose liability for costs of investigation or remediation of contamination (which could be material), regardless of fault or the legality of the original disposal, and even if such contamination was present prior to the commencement of our operations at the site and was not caused by our activities. In addition, many of our facilities
12
have propane and battery powered forklifts. Proposed or recently enacted legal requirements, such as those requiring the phase-out of certain ozone-depleting substances, and proposals for the regulation of greenhouse gas emissions, may require us to upgrade or replace equipment, or may increase our transportation or other operating costs.
We must finance and integrate acquired businesses effectively .
Historically, a portion of our growth has come through acquisitions. If we are unable to integrate acquired businesses successfully or realize anticipated economic, operational and other benefits and synergies in a timely manner, our earnings per share may be materially adversely affected. Integration of an acquired business may be more difficult when we acquire a business in a market in which we have limited expertise, or with a culture different from Sysco's. A significant expansion of our business and operations, in terms of geography or magnitude, could strain our administrative and operational resources. Significant acquisitions may also require the issuance of material additional amounts of debt or equity, which could materially alter our debt-to-equity ratio, increase our interest expense and decrease earnings per share, and make it difficult for us to obtain favorable financing for other acquisitions or capital investments. In addition, our failure to implement effective internal control over financial reporting and disclosure controls and procedures with respect to a significant acquired business could result in material weaknesses and/or a failure to file our periodic reports with the Securities and Exchange Commission on a timely basis.
We need access to borrowed funds to grow, and any default by us under our indebtedness could have a material adverse effect on our cash flow and liquidity .
A substantial part of our growth historically has been the result of acquisitions and capital expansion. We anticipate additional acquisitions and capital expansion in the future. As a result, our inability to finance acquisitions and capital expenditures through borrowed funds could restrict our ability to expand. Moreover, any default under the documents governing our indebtedness could have a significant adverse effect on our cash flows, as well as the market value of our common stock.
Our level of indebtedness and the terms of our indebtedness could adversely affect our business and liquidity position .
As described in Note 11 , "Debt and Other Financing Arrangements," as of June 30, 2018 , we had approximately $8.3 billion of total indebtedness. This amount included senior notes and issuances under a commercial paper program allowing us to issue short-term unsecured notes in an aggregate amount not to exceed $2.0 billion . We also have a revolving credit facility supporting our U.S. commercial paper program in the amount of $2.0 billion scheduled to expire on November 2, 2021 , and various other smaller bank facilities.
Our level of indebtedness could have important consequences for us, including:
• | limiting our ability to obtain additional financing, if needed, for working capital, capital expenditures, acquisitions, debt service requirements or other purposes; |
• | increasing our vulnerability to adverse economic, industry or competitive developments; |
• | limiting our flexibility in planning for, or reacting to, changes in our business and our industry; and |
• | placing us at a competitive disadvantage compared to our competitors that have less debt. |
Our indebtedness may further increase from time to time for various reasons, including fluctuations in operating results, working capital needs, capital expenditures, potential acquisitions, joint ventures and/or share repurchase programs. Our increased level of indebtedness and the ultimate cost of such indebtedness could have a negative impact on our liquidity, cost of future debt financing and financial results, and our credit ratings may be adversely affected as a result of the incurrence of additional indebtedness. In the future, our cash flow and capital resources may not be sufficient for payments of interest on and principal of our debt, and any alternative financing measures available may not be successful and may not permit us to meet our scheduled debt service obligations.
13
We rely on technology in our business and any cybersecurity incident, other technology disruption or delay in implementing new technology could negatively affect our business and our relationships with customers .
We use technology in substantially all aspects of our business operations, and our ability to serve customers most effectively depends on the reliability of our technology systems. We use software and other technology systems, among other things, to generate and select orders, to load and route trucks, to make purchases, to manage our warehouses and to monitor and manage our business on a day-to-day basis. We also use mobile devices, social networking and other online platforms to connect with our employees, suppliers, business partners and customers. Further, our business involves the storage and transmission of numerous classes of sensitive and/or confidential information and intellectual property, including customers' and suppliers' personal information, private information about employees and financial and strategic information about the company and our business partners.
These technology systems and our uses thereof are vulnerable to disruption from circumstances beyond our control, including fire, natural disasters, power outages, systems failures, security breaches, espionage, cyber-attacks, viruses, theft and inadvertent release of information. Any such disruption to these software and other technology systems, or the technology systems of third parties on which we rely, the failure of these systems to otherwise perform as anticipated, or the theft, destruction, loss, misappropriation, or release of sensitive and/or confidential information or intellectual property, could result in business disruption, negative publicity, brand damage, violation of privacy laws, loss of customers, potential liability, including litigation or other legal actions against us or the imposition of penalties, fines, fees or liabilities, which may not be covered by our insurance policies, and competitive disadvantage, any or all of which would potentially adversely affect our customer service, decrease the volume of our business and result in increased costs and lower profits. Moreover, a cybersecurity breach could require us to devote significant management resources to address the problems associated with the breach and to expend significant additional resources to upgrade further the security measures we employ to protect personal information against cyber-attacks and other wrongful attempts to access such information, which could result in a disruption of our operations.
Further, as we pursue our strategy to grow through acquisitions and to pursue new initiatives that improve our operations and cost structure, we are also expanding and improving our information technologies, resulting in a larger technological presence and corresponding exposure to cybersecurity risk. If we fail to assess and identify cybersecurity risks associated with acquisitions and new initiatives, we may become increasingly vulnerable to such risks.
While Sysco has invested, and continues to invest, in technology security initiatives and other measures to prevent security breaches and cyber incidents, as well as disaster recovery plans, these initiatives and measures may not be entirely effective to insulate us from technology disruption that could result in adverse effects on our results of operations. Additionally, information technology systems continue to evolve and, in order to remain competitive, we must implement new technologies in a timely and efficient manner. If our competitors implement new technologies more quickly or successfully than we do, such competitors may be able to provide lower cost or enhanced services of superior quality compared to those we provide, which could have an adverse effect on our results of operations.
In addition, data privacy is subject to frequently changing rules and regulations, which sometimes conflict among the various jurisdictions and countries where we do business. For example, the EU adopted a new regulation that became effective in May 2018, the General Data Protection Regulation (GDPR), which requires companies to meet new requirements regarding the handling of personal data. Our failure to successfully implement or comply with appropriate processes to adhere to the requirements of GDPR and other laws and regulations in this area could result in substantial fines or penalties and legal liability and could tarnish our reputation.
We may be required to pay material amounts under multiemployer defined benefit pension plans .
We contribute to several multiemployer defined benefit pension plans based on obligations arising under collective bargaining agreements covering union-represented employees. Approximately 13% of our current U.S. employees are participants in such multiemployer plans. In fiscal 2018 , our total contributions to these plans were approximately $46.4 million . The costs of providing benefits through such plans have increased in recent years. The amount of any increase or decrease in our required contributions to these multiemployer plans will depend upon many factors, including the outcome of collective bargaining, actions taken by trustees who manage the plans, government regulations, the actual return on assets held in the plans and the potential payment of a withdrawal liability if we choose to exit. Based upon the information available to us from plan administrators, we believe that several of these multiemployer plans are underfunded. The unfunded liabilities of these plans may result in increased future payments by us and the other participating employers. Underfunded multiemployer pension plans may impose a surcharge requiring additional pension contributions. Our risk of such increased payments may be greater if any of the participating employers in these underfunded plans withdraws from the plan due to insolvency and is not able to contribute an amount sufficient to fund the unfunded liabilities associated with its participants in the plan. We could also be treated as partially withdrawing from
14
participation in one of these plans if the number of our employees participating in a given plan is reduced to a certain percentage over a certain period of time. Such reductions in the number of employees participating in these plans could occur as a result of changes in our business operations, such as facility closures or consolidations. Based on the latest information available from plan administrators, we estimate our share of the aggregate withdrawal liability on the multiemployer plans in which we participate could have been as much as $131 million as of June 30, 2018 . A significant increase to funding requirements could adversely affect the company's financial condition, results of operations or cash flows.
Our funding requirements for our company-sponsored qualified pension plan may increase should financial markets experience future declines .
At the end of fiscal 2012 , we decided to freeze future benefit accruals under the company-sponsored qualified pension plan (U.S. Retirement Plan) as of December 31, 2012 for all U.S. based salaried and non-union hourly employees. Effective January 1, 2013 , these employees were eligible for additional contributions under an enhanced, defined contribution plan. While these actions will serve to limit future growth in our pension liabilities, we had a sizable pension obligation of $4.0 billion as of June 30, 2018 ; therefore, financial market factors could impact our funding requirements. See Note 13 , "Company-Sponsored Employee Benefit Plans" to the Consolidated Financial Statements in Item 8 for a discussion of the funded status of the U.S. Retirement Plan.
The amount of our annual contribution to the U.S. Retirement Plan is dependent upon, among other things, the returns on the U.S. Retirement Plan's assets and discount rates used to calculate the plan's liability. In fiscal 2018, the company made voluntary contributions of $380 million to the U.S. Retirement Plan allowing the company to set an investment strategy that more closely aligns the duration of the U.S. Retirement Plan's assets with the duration of its liabilities. As a result, our U.S. Retirement Plan holds a greater amount of investments in fixed income securities, but also holds equity securities. Fluctuations in asset values can cause the amount of our anticipated future contributions to the plan to increase. The projected liability of the U.S. Retirement Plan will be impacted by the fluctuations of interest rates on high quality bonds in the public markets as these are inputs in determining our minimum funding requirements. Specifically, decreases in these interest rates may have an adverse effect on our funding obligations. To the extent financial markets experience significant future declines, and/or interest rates on high quality bonds in the public markets decline, our required contributions may increase for future years as our funded status decreases, which could have an adverse effect on our financial condition.
Failure to successfully renegotiate union contracts could result in work stoppages .
As of June 30, 2018 , we had approximately 67,000 employees, approximately 24% of whom were represented by unions, primarily the International Brotherhood of Teamsters and unions in France and Sweden. Contract negotiations are handled by each individual operating company. Approximately 19% of our union employees who are covered by collective bargaining agreements have or will have expired contracts during fiscal 2019 , which contracts are subject to renegotiation. Failure of our operating companies to effectively renegotiate these contracts could result in work stoppages. Although our operating subsidiaries have not experienced any significant labor disputes or work stoppages to date, and we believe they have satisfactory relationships with their unions, a work stoppage due to failure of multiple operating subsidiaries to renegotiate union contracts could have a material adverse effect on us.
A shortage of qualified labor could negatively affect our business and materially reduce earnings .
The future success of our operations, including the achievement of our strategic objectives, depends on our ability, and the ability of third-parties on which we rely to supply and to deliver our products, to identify, recruit, develop and retain qualified and talented individuals, and any shortage of qualified labor could significantly affect our business. Employee recruitment, development and retention efforts undertaken by us and/or such third-parties may not be successful, resulting in a shortage of qualified individuals in future periods. Any such shortage could decrease Sysco's ability to effectively serve our customers and achieve our strategic objectives. Such a shortage would also likely lead to higher wages for employees (or higher costs to purchase the services of such third parties) and a corresponding reduction in our results of operations.
Our authorized preferred stock provides anti-takeover benefits that may not be viewed as beneficial to stockholders .
Under our Restated Certificate of Incorporation, Sysco's Board of Directors is authorized to issue up to 1,500,000 shares of preferred stock without stockholder approval. Issuance of these shares could make it more difficult for anyone to acquire Sysco without approval of the Board of Directors, depending on the rights and preferences of the stock issued. In addition, if anyone attempts to acquire Sysco without approval of the Board of Directors of Sysco, the existence of this undesignated preferred stock could allow the Board of Directors to adopt a shareholder rights plan without obtaining stockholder approval, which could result
15
in substantial dilution to a potential acquirer. As a result, hostile takeover attempts that might result in an acquisition of Sysco, which could otherwise have been financially beneficial to our stockholders, could be deterred.
Item 1B. Unresolved Staff Comments
None.
Item 2. Properties
The table below shows the number of distribution facilities occupied by Sysco in each country and the aggregate square footage devoted to cold and dry storage as of June 30, 2018 .
Location | Number of Facilities |
| Square Feet (in thousands) |
| Segment Served (1) | ||
Bahamas | 1 | |
| 200 | |
| I |
Canada | 34 | |
| 4,412 | |
| I, O |
Costa Rica (2) | 2 | |
| 268 | |
| I |
France | 38 | |
| 1,192 | |
| I |
Ireland and Northern Ireland | 4 | |
| 371 | |
| I |
Mexico | 6 | |
| 294 | |
| I |
Panama | 1 | |
| 44 | |
| I |
Spain | 2 | |
| 26 | |
| I |
Sweden | 9 | |
| 788 | |
| I |
United Kingdom | 68 | |
| 2,828 | |
| I, O |
United States and its territories (3) | 167 | |
| 38,537 | |
| U, I, S, O |
Totals | 332 | |
| 48,960 | |
|
|
(1) | Segments served include U.S. Foodservice (U), International Foodservice (I), SYGMA (S), and Other (O). |
(2) | Costa Rica facility count does not include 15 cash and carry locations. |
(3) | Florida, California, and Texas account for 19 , 18 , and 14 , respectively, of the facilities located in the U.S. |
We own approximately 38,134,000 square feet of our distribution facilities (or 77.9% of the total square feet), and the remainder is occupied under leases expiring at various dates from fiscal 2019 to fiscal 2063 , exclusive of renewal options.
We own our approximately 625,000 square foot headquarters office complex in Houston, Texas. In addition, we own our approximately 669,000 square foot complex in Cypress, Texas that houses shared business services and other corporate services.
We are currently constructing expansions or build-outs for our distribution facilities in Georgia, Florida and Quebec . These operating companies, in the aggregate, accounted for 2% of fiscal 2018 sales.
As of June 30, 2018 , our fleet of approximately 14,000 delivery vehicles consisted of tractor and trailer combinations, vans and panel trucks, most of which are either wholly or partially refrigerated for the transportation of frozen or perishable foods. We own approximately 88% of these vehicles and lease the remainder.
Item 3. Legal Proceedings
None.
Item 4. Mine Safety Disclosures
Not applicable.
16
PART II – FINANCIAL INFORMATION
Item 5. Market for Registrant's Common Equity, Related Stockholder Matters and Issuer Repurchases of Equity Securities
The principal market for Sysco's common stock (SYY) is the New York Stock Exchange. The table below sets forth the high and low sales prices per share for our common stock as reported on the New York Stock Exchange Composite Tape and the cash dividends declared for the periods indicated.
| Common Stock Prices |
| Dividends Declared Per Share | ||||||||
| High |
| Low |
| |||||||
Fiscal 2017: |
|
|
|
|
| ||||||
First Quarter | $ | 53.97 | |
| $ | 48.70 | |
| $ | 0.31 | |
Second Quarter | 57.07 | |
| 47.14 | |
| 0.33 | | |||
Third Quarter | 55.95 | |
| 49.90 | |
| 0.33 | | |||
Fourth Quarter | 56.10 | |
| 49.22 | |
| 0.33 | | |||
Fiscal 2018: |
|
|
|
|
| ||||||
First Quarter | $ | 54.47 | |
| $ | 48.85 | |
| $ | 0.33 | |
Second Quarter | 62.79 | |
| 52.30 | |
| 0.36 | | |||
Third Quarter | 64.27 | |
| 56.01 | |
| 0.36 | | |||
Fourth Quarter | 68.87 | |
| 58.12 | |
| 0.36 | | |||
The number of record owners of Sysco's common stock as of August 10, 2018 was 9,169 .
We currently expect that comparable quarterly cash dividends will continue to be paid in the future; however, future declarations of dividends and the establishment of future record and payment dates are subject to the final determination of our Board of Directors.
We made the following share repurchases during the fourth quarter of fiscal 2018 :
ISSUER PURCHASES OF EQUITY SECURITIES | ||||||||||||
Period | (a) Total Number of Shares Purchased (1) |
| (b) Average Price Paid per Share |
| (c) Total Number of Shares Purchased as Part of Publicly Announced Plans or Programs |
| (d) Maximum Number of Shares that May Yet Be Purchased Under the Plans or Programs | |||||
Month #1 |
|
|
|
|
|
|
| |||||
April 1 – April 28 | 309,951 | |
| $ | 60.65 | |
| 309,951 | |
| - | |
Month #2 |
|
|
|
|
|
|
| |||||
April 29 – May 26 | 346,365 | |
| 63.33 | |
| 346,365 | |
| - | | |
Month #3 |
|
|
|
|
|
|
| |||||
May 27 – June 30 | 413,197 | |
| 66.07 | |
| 411,692 | |
| - | | |
Totals | 1,069,513 | |
| $ | 63.61 | |
| 1,068,008 | |
| - | |
(1) | The total number of shares purchased includes 0 , 0 , and 1,505 shares tendered by individuals in connection with stock option exercises in month #1, month #2, and month #3, respectively. All other shares were purchased pursuant to the publicly announced program described below. |
In February 2017 , our Board of Directors approved a repurchase program authorizing the repurchase of shares of the company's common stock not to exceed $1.0 billion through the end of fiscal 2019 . In November 2017 , our Board of Directors approved a repurchase program to authorize the repurchase of the company's common stock not to exceed $1.5 billion through the end of fiscal 2020 . These repurchase programs are intended to allow Sysco to continue offsetting dilution resulting from shares issued under the company's benefit plans and to make opportunistic repurchases. These share repurchase programs were approved using a dollar value limit and, therefore, are not included in the table above for "Maximum Number of Shares that May Yet Be Purchased Under the Plans or Programs."
We purchased 17,930,114 shares under these plans in fiscal 2018 , resulting in a remaining authorization under these programs of approximately $1.5 billion as of June 30, 2018. There were 35,744,589 shares repurchased under our then outstanding plans in fiscal 2017 . We purchased approximately 1,344,000 additional shares under these authorizations through August 10, 2018 .
1
The Board of Directors has authorized us to enter into agreements from time to time to extend our ongoing repurchase program to include repurchases during company announced "blackout periods" of such securities in compliance with Rule 10b5-1 promulgated under the Securities Exchange Act of 1934, as amended (Exchange Act).
Stock Performance Graph
The following performance graph and related information shall not be deemed "soliciting material" or to be "filed" with the Securities and Exchange Commission, nor shall such information be incorporated by reference into any future filing under the Securities Act of 1933 or the Exchange Act, each as amended, except to the extent that Sysco specifically incorporates such information by reference into such filing.
The following stock performance graph compares the performance of Sysco's Common Stock to the S&P 500 Index and to the S&P 500 Food/Staple Retail Index for Sysco's last five fiscal years.
The graph assumes that the value of the investment in our Common Stock, the S&P 500 Index, and the S&P 500 Food/Staple Retail Index was $100 on the last trading day of fiscal 2013 , and that all dividends were reinvested. Performance data for Sysco, the S&P 500 Index and the S&P 500 Food/Staple Retail Index is provided as of the last trading day of each of our last five fiscal years.
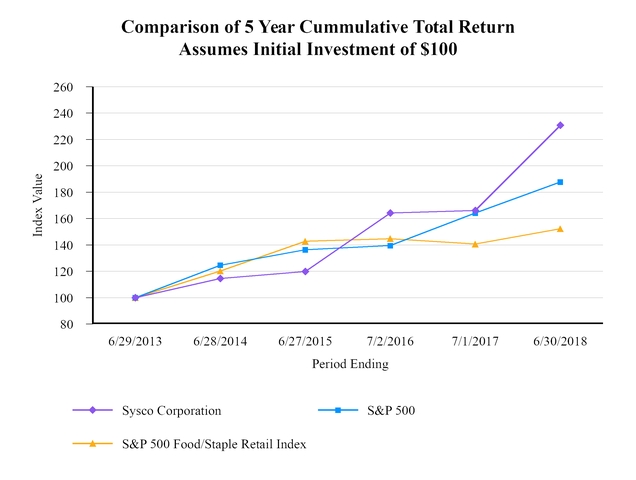
|
| 6/29/2013 |
| 6/28/2014 |
| 6/27/2015 |
| 7/2/2016 |
| 7/1/2017 |
| 6/30/2018 |
Sysco Corporation |
| $100 |
| $115 |
| $120 |
| $164 |
| $166 |
| $231 |
S&P 500 |
| 100 |
| 125 |
| 136 |
| 140 |
| 164 |
| 188 |
S&P 500 Food/Staple Retail Index |
| 100 |
| 120 |
| 143 |
| 145 |
| 141 |
| 152 |
2
Item 6. Selected Financial Data
| Fiscal Year | ||||||||||||||||||
| 2018 (1) |
| 2017 (1) |
| 2016 (1)(2) |
| 2015 (1) |
| 2014 (1) | ||||||||||
| (In thousands except for per share data) | ||||||||||||||||||
Sales | $ | 58,727,324 | |
| $ | 55,371,139 | |
| $ | 50,366,919 | |
| $ | 48,680,752 | |
| $ | 46,516,712 | |
|
|
|
|
|
|
|
|
|
| ||||||||||
Operating income | 2,328,974 | |
| 2,053,171 | |
| 1,850,500 | |
| 1,229,362 | |
| 1,587,122 | | |||||
|
|
|
|
|
|
|
|
|
| ||||||||||
Earnings before income taxes | 1,956,224 | |
| 1,766,230 | |
| 1,433,007 | |
| 1,008,147 | |
| 1,475,624 | | |||||
Income taxes | 525,458 | |
| 623,727 | |
| 483,385 | |
| 321,374 | |
| 544,091 | | |||||
Net earnings | $ | 1,430,766 | |
| $ | 1,142,503 | |
| $ | 949,622 | |
| $ | 686,773 | |
| $ | 931,533 | |
|
|
|
|
|
|
|
|
|
| ||||||||||
Net earnings: |
|
|
|
|
|
|
|
|
| ||||||||||
Basic earnings per share | $ | 2.74 | |
| $ | 2.10 | |
| $ | 1.66 | |
| $ | 1.16 | |
| $ | 1.59 | |
Diluted earnings per share | 2.70 | |
| 2.08 | |
| 1.64 | |
| 1.15 | |
| 1.58 | | |||||
|
|
|
|
|
|
|
|
|
| ||||||||||
Dividends declared per share | $ | 1.41 | |
| $ | 1.30 | |
| $ | 1.23 | |
| $ | 1.19 | |
| $ | 1.15 | |
|
|
|
|
|
|
|
|
|
| ||||||||||
Total assets | $ | 18,070,404 | |
| $ | 17,756,655 | |
| $ | 16,721,804 | |
| $ | 17,989,281 | |
| $ | 13,141,113 | |
Capital expenditures | 687,815 | |
| 686,378 | |
| 527,346 | |
| 542,830 | |
| 523,206 | | |||||
|
|
|
|
|
|
|
|
|
| ||||||||||
Current maturities of long-term debt (3) | $ | 782,329 | |
| $ | 530,075 | |
| $ | 8,909 | |
| $ | 4,979,301 | |
| $ | 304,777 | |
Long-term debt | 7,540,765 | |
| 7,660,877 | |
| 7,336,930 | |
| 2,271,825 | |
| 2,357,330 | | |||||
Total long-term debt | 8,323,094 | |
| 8,190,952 | |
| 7,345,839 | |
| 7,251,126 | |
| 2,662,107 | | |||||
Shareholders' equity | 2,506,957 | |
| 2,381,516 | |
| 3,479,608 | |
| 5,260,224 | |
| 5,266,695 | | |||||
Total capitalization | $ | 10,830,051 | |
| $ | 10,572,468 | |
| $ | 10,825,447 | |
| $ | 12,511,350 | |
| $ | 7,928,802 | |
Ratio of long-term debt to capitalization (3) | 76.9 | % |
| 77.5 | % |
| 67.9 | % |
| 58.0 | % |
| 33.6 | % | |||||
|
|
|
|
|
|
|
|
|
| ||||||||||
Supplemental Information: |
|
|
|
|
|
|
|
|
| ||||||||||
Fiscal 2019 expected retroactive impact to other income (expense), historically included in operating expense (4) | $ | 15,003 | |
| $ | (1,294 | ) |
| $ | 8,935 | |
| $ | 26,522 | |
| $ | 4,887 | |
(1) | Our results of operations are impacted by Certain Items that have resulted in reduced earnings on a GAAP basis. See "Non-GAAP Reconciliations," within Management's Discussion and Analysis of Financial Condition and Results of Operations, for a description of these items and our results on an adjusted basis that exclude Certain Items. |
(2) | Sysco's fiscal year ends on the Saturday nearest to June 30 th . This resulted in a 53-week year ending July 2, 2016 for fiscal 2016. |
(3) | Specific to fiscal 2015, our current maturities of long-term debt included senior notes issued for the proposed merger with US Foods that were required to be redeemed due to the termination of the merger agreement. We redeemed these notes in July 2015 . |
(4) | In the first quarter of fiscal 2019, Sysco will adopt Accounting Standards Update 2017-07 requiring that an employer report all of the components except the service cost component of pension and postretirement benefits outside of operating income. This will be applied retroactively. As a result, the company expects to report amounts for net periodic income (expense) in other income (expense) that were previously included in operating expense. |
Item 7. Management's Discussion and Analysis of Financial Condition and Results of Operations
Our discussion below of our results includes certain non-GAAP financial measures that we believe provide important perspective with respect to underlying business trends. Other than free cash flow, any non-GAAP financial measures will be
3
denoted as adjusted measures and exclude the impact from restructuring costs consisting of: (1) expenses associated with our revised business technology strategy announced in fiscal 2016, as a result of which we incurred costs to convert to a modernized version of our established platform as opposed to completing the implementation of an Enterprise Resource Planning (ERP) system; (2) professional fees related to our three-year strategic plans; (3) restructuring expenses within our Brakes Group operations; (4) severance charges related to restructuring; and (5) foreign non-income based taxes. In addition, fiscal 2018 results of operations are impacted by business technology transformation initiative costs, facility closure charges, multiemployer pension (MEPP) withdrawal charges and debt extinguishment charges, which are also excluded from our non-GAAP financial measures.
The non-GAAP financial measures presented in this report also exclude the impact of the following acquisition-related items: (1) intangible amortization expense and (2) integration costs. All acquisition-related costs in fiscal 2018 and 2017 that have been excluded relate to the fiscal 2017 acquisition of Cucina Lux Investments Limited (the Brakes Acquisition), discussed in Note 4 , "Acquisitions." The Brakes Acquisition also resulted in non-recurring tax expense in fiscal 2017, primarily from non-deductible transaction costs.
The non-GAAP financial measures presented in this report further exclude certain impacts of the Tax Cuts and Jobs Act of 2017 (the Tax Act) enacted on December 22, 2017 . The impact for fiscal 2018 includes: a provisional estimate of a one-time transition tax on certain unrepatriated earnings of foreign subsidiaries and a net benefit from remeasuring Sysco's accrued income taxes, deferred tax liabilities and deferred tax assets due to the changes in tax rates. Other tax-related items impacting results of operations include foreign withholding taxes on repatriated earnings, net of foreign tax credits, and a benefit from contributions made to fund Sysco's tax-qualified United States (U.S.) pension plan (the U.S. Retirement Plan).
The fiscal 2018 and fiscal 2017 items described above and excluded from our non-GAAP measures are collectively referred to as "Certain Items." In addition, our three-year plan that ended in fiscal 2018, included an adjusted return on invested capital target that excluded the Brakes Acquisition, and therefore, our invested capital is adjusted for the accumulation of debt incurred for the Brakes Acquisition that would not have been borrowed absent this acquisition.
Sysco's fiscal year ends on the Saturday nearest to June 30th. This resulted in a 52-week year ending June 30, 2018 for fiscal 2018, a 52-week year ending July 1, 2017 for fiscal 2017, and a 53-week year ending July 2, 2016 for fiscal 2016. Because fiscal 2016 contained one additional week as compared to fiscal 2017, our Consolidated Results of Operations for fiscal 2017 are not directly comparable to fiscal 2016. Management believes that adjusting the fiscal 2016 Consolidated Results of Operations for the estimated impact of the additional week provides more comparable financial results on a year-over-year basis. Sysco's results of operations and related metrics within this section will be disclosed on both a 52-week and 53-week basis for fiscal 2017 as compared to fiscal 2016. This is calculated by deducting one-fourteenth of the total metric for the fourth quarter of fiscal 2016.
Any metric within this section referred to as "adjusted" will reflect the applicable impact of Certain Items. More information on the rationale for the use of these measures and reconciliations to GAAP numbers can be found under "Non-GAAP Reconciliations."
Overview
Sysco distributes food and related products to restaurants, healthcare and educational facilities, lodging establishments and other foodservice customers. Our primary operations are located in North America and Europe. The company has aggregated certain of its operating segments into three reportable segments. "Other" financial information is attributable to the company's other operating segments that do not meet the quantitative disclosure thresholds.
• | U.S. Foodservice Operations - primarily includes U.S. Broadline operations, which distribute a full line of food products, including custom-cut meat, seafood, specialty produce, specialty imports and a wide variety of non-food products; |
• | International Foodservice Operations - includes operations in the Americas and Europe, which distribute a full line of food products and a wide variety of non-food products. The Americas primarily consists of operations in Canada, Bahamas, Mexico, Costa Rica and Panama, as well as our operations that distribute to international customers. Our European operations primarily consist of operations in the United Kingdom (U.K.), France, Ireland and Sweden; |
• | SYGMA - our U.S. customized distribution subsidiary; and |
• | Other - primarily our hotel supply operations and Sysco Labs, which includes our suite of technology solutions that help support the business needs of our customers and provide support for some of our business technology needs. |
4
We estimate that we serve about 16% of an approximately $289 billion annual foodservice market in the U.S. based on industry data obtained from Technomic, Inc. From time to time, Technomic may revise the methodology used to calculate the size of the foodservice market and, as a result, our percentage can change not only from our sales results, but also from such revisions. We also serve certain international geographies that vary in size and amount of market share.
According to industry sources, the foodservice, or food-away-from-home, market represents approximately 51% of the total dollars spent on food purchases made at the consumer level in the U.S. as of the end of calendar 2017 . Industry sources estimate the total foodservice market in the U.S. experienced a real sales increase of approximately 1.4% in both calendar year 2017 and calendar year 2016 . Real sales changes do not include the impact of inflation or deflation.
Highlights and Trends
Comparison of results from fiscal 2018 to fiscal 2017 :
• | Sales: |
◦ | increased 6.1% , or $3.4 billion , to $58.7 billion ; |
• | Operating income: |
◦ | increased 13.4% , or $275.8 million , to $2.3 billion ; |
◦ | adjusted operating income increased 8.4% , or $196.5 million , to $2.5 billion ; |
• | Net earnings: |
◦ | increased 25.2% , or $288.3 million , to $1.4 billion ; |
◦ | adjusted net earnings increased 22.1% , or $300.8 million , to $1.7 billion ; |
• | Basic earnings per share: |
◦ | increase d 30.5% , or $0.64 , to $2.74 from the comparable prior year amount of $2.10 per share; |
• | Diluted earnings per share: |
◦ | increased 29.8% , or $0.62 , to $2.70 from the comparable prior year amount of $2.08 per share; and |
◦ | adjusted diluted earnings per share were $3.14 in fiscal 2018 , a 26.6% increase from the comparable prior year amount of $2.48 per share. |
Fiscal 2015 - Fiscal 2018 Three-Year Plan Highlights
| 3-year Plan Target |
| 2018 |
| 2015 |
| 3-year Plan Change $ Results |
| CAGR |
GAAP: |
|
|
|
|
|
|
|
|
|
Sales | N/A |
| $58.7 billion |
| $48.7 billion |
| $10.0 billion |
|
|
Gross profit | N/A |
| $11.1 billion |
| $8.6 billion |
| $2.5 billion |
| 9.0% |
Operating expense | N/A |
| $8.8 billion |
| $7.3 billion |
| $1.4 billion |
| 6.1% |
Operating Income | N/A |
| $2.3 billion |
| $1.2 billion |
| $1.1 billion |
| 23.7% |
ROIC | N/A |
| 13.0% |
|
|
|
|
|
|
|
|
|
|
|
|
|
|
|
|
Adjusted Results (Non-GAAP) (1) : |
|
|
|
|
|
|
|
|
|
Sales |
|
| $53.1 billion |
| $48.7 billion |
| $4.4 billion |
|
|
Gross profit | 4.0% CAGR |
| $9.7 billion |
| $8.6 billion |
| $1.1 billion |
| 4.2% |
Operating expense | 3.0% CAGR |
| $7.2 billion |
| $6.8 billion |
| $463.0 million |
| 2.2% |
Operating Income | $600 - $650 million |
| $2.5 billion |
| $1.8 billion |
| $665.1 million |
| 11.1% |
ROIC | 15.0% |
| 20.2% |
|
|
|
|
|
|
(1) | Adjusted financial results used to measure the progress on Sysco's initial three-year plan exclude certain items, which primarily include restructuring, acquisition-related costs, loss on debt extinguishment, tax benefits from a retirement plan contribution, the impact of repatriating certain international earnings, and certain impacts of tax law changes, and also exclude the results of the Brakes Group. |
Fiscal 2018 marked the completion of our initial three-year plan that was established in fiscal 2016. As a result of our efforts in connection with the three-year plan, we accelerated local case growth by 3.0% , achieved adjusted gross profit CAGR of 4.2% , and managed adjusted operating expense CAGR to 2.2% . This gap between adjusted gross profit dollar growth and adjusted expense dollar growth created adjusted operating leverage of 2.0 percentage points, which generated adjusted operating income growth of $665.1 million, exceeding the target range of $600 million to $650 million. Adjusted ROIC was 20.2% , surpassing our target of 15.0%, and we achieved a five day improvement in working capital, which was one day above the original goal. On
5
a GAAP basis, comparing fiscal 2018 to fiscal 2015, the company achieved gross profit CAGR of 9.0% , and operating expense CAGR of 6.1% , generating operating income growth of $1.1 billion . ROIC was 13.0% . Our operating income goal was established on an adjusted basis given Certain Item charges that were applicable in fiscal 2015, which were primarily due to termination costs in connection with the merger that had been proposed with US Foods and financing costs related to the senior notes that were issued in fiscal 2015 to fund the proposed US Foods merger. See "Non-GAAP Reconciliations" for an explanation of these non-GAAP financial measures.
The overall macroeconomic trends continue to be positive in the U.S., and the underlying economic picture remains encouraging, including a strong employment market. This has resulted in a healthy consumer that is helping to drive a positive trend in restaurant sales. We also see continued growth with local customers, as they increase their reach through flexible menus, innovative concepts and additional delivery options to reach consumers. The U.K market continues to experience acute product inflation in the mid-to-high single digits.
Throughout fiscal 2018 , we improved our customer experience through enhanced service levels, improved sales retention and higher customer loyalty, enhanced associate engagement through improved workplace safety and improved associate retention through attractive career growth opportunities. These were all key targeted steps towards achieving our initial three-year plan financial objectives.
Our sales and gross profit performance can be influenced by multiple factors, including price, volume and product mix. The modest level of growth in the foodservice market has created additional competitive pricing pressures, which can impact our profitability. The majority of our sales are to locally managed customers and national customers. Our locally managed customers, including independent restaurant customers, comprise a greater percentage of our profitability as compared to national customers. Case growth with our locally managed broadline business is important to drive gross profit dollar growth. Our sales to national customers, including chain restaurants and multi-locational restaurants, also comprise a significant portion of our overall volumes. Gross margin on sales to our national customers is generally lower than on sales to other types of customers due to the higher volumes we sell to these customers. In fiscal 2018, we accelerated our cases with local customers through improved processes, enhanced training of our marketing associates and continued growth in our digital platform.
We offer an assortment of Sysco-branded products that we can differentiate from privately branded products, which enables us to achieve higher gross profits. As a result, we focus on sales growth for these products, now comprising 46% of U.S. Broadline sales, especially with locally managed customers. Cutting Edge Solutions, our product innovation platform, which features our exclusive product offerings, has now delivered one million cases of new, on trend, innovative products to our customers. We have experienced continued success in category management, as we introduce new categories to capture value. Inflation is a factor that contributes to the level of sales and gross profit growth and can be a factor that contributes to gross margin pressure. We experienced inflation at a rate of 2.6% for fiscal 2018 . Inflation in fiscal 2018 occurred primarily in the meat, dairy, paper and disposables and frozen potatoes and vegetables categories, partially offset by modest deflation in poultry. In the fourth quarter of fiscal 2018, the meat category was no longer experiencing inflation. We expect inflation to continue for the balance of calendar 2018 . Periods of high inflation, either overall or in certain product categories, can have an unfavorable effect on us and our customers, as high food costs can be difficult to pass on to our customers. A portion of the cost to obtain product includes inbound freight. These costs have risen in fiscal 2018, driven by overall industry factors such as driver shortages and adjusting to electronic regulation of hours driven.
Changes in exchange rates can impact our foreign sales as we convert them to U.S. dollars. In fiscal 2018, we experienced a foreign exchange benefit to total sales of 1.0% .
We have experienced higher operating expenses in fiscal 2018 , as compared to fiscal 2017 , driven by ongoing strategic investments in the business that impacted the year, including the investment in marketing associates in the U.S. and the continued investment in technology that will translate to a more enriching experience for our customers. We expect operating expenses to increase in fiscal 2019, primarily driven by anticipated growth in case volume. We also expect transportation costs to increase due to higher fuel prices and a tight labor market. We continue to make investments in Europe including the supply chain transformation occurring in the U.K., technology and other integrations within Europe.
In the second quarter of fiscal 2018, the U.S. government enacted the Tax Act, comprehensive tax legislation that decreased the federal corporate tax rate from 35% to 21%. For fiscal 2018, Sysco had a 28% tax rate, rather than 21%, because the law was enacted during the midpoint of the company's fiscal year, requiring us to use a blended average rate. The company's U.S. federal statutory tax rate for fiscal 2019 and beyond will be 21%, and we expect our effective tax rate to be approximately 25%. This rate is expected to be similar to the fiscal 2018 effective tax rate due to certain tax benefits that occurred in fiscal 2018 that will not fully repeat in fiscal 2019. Our fiscal 2018 effective tax rate is lower than this range as a result of capital allocation initiatives. As
6
discussed in Note 18 , "Income Taxes," we have recorded provisional estimates for some components of the Tax Act and will refine estimates and determine applicability for other components in future periods.
We continue to be focused on mergers and acquisitions as a part of our strategy and have completed several acquisitions in fiscal 2018, including two within U.S. Foodservice Operations and two within International Foodservice Operations. Within U.S. Foodservice Operations, we acquired HFM Foodservice (HFM), a Hawaii-based broadline distributor with approximately $290 million in annual sales. Acquiring HFM provided Sysco with direct access to the growing Hawaiian market and was in clear alignment with our strategy for disciplined, profitable growth of the business. We also acquired Doerle Food Services (Doerle), a leading Louisiana broadline distributor with approximately $250 million in annual foodservice distribution sales. Acquiring Doerle provided Sysco with a distributor that services parts of a six-state area, including Oklahoma, Texas, Arkansas, Louisiana, Mississippi and Alabama.
Within our International Foodservice Operations, we acquired Kent Frozen Foods (KFF), a U.K.-based distributor that distributes chilled, frozen, and ambient food products to the catering industry in the U.K. Acquiring KFF provided Sysco Europe with an enhanced presence with independent customers in the U.K. market. We also acquired Eko F å gel, Fisk & Mittemellan, a leading fresh fish preparation and distribution business in Stockholm, Sweden. In addition to the two acquisitions noted above, in the second quarter of fiscal 2018, we purchased the remaining 50% interest in our joint venture in Costa Rica. Sysco initially acquired a 50% interest in the foodservice company in fiscal 2015.
Strategy and Fiscal 2020 Three-Year Financial Targets
Our objective to improve the overall customer experience is a core element of our success over the past few years and will continue to be a key focus as we move forward. We have identified four strategic priorities that will accelerate our current growth and guide us into the future. These priorities are to enrich the customer experience, deliver operational excellence, optimize our business and activate the power of our people.
In fiscal 2018, we outlined our new three-year financial targets to be achieved by the end of fiscal 2020, including:
• | Reaching $650 million to $700 million of adjusted operating income growth as compared to fiscal 2017; |
• | Growing earnings per share faster than operating income; and |
• | Achieving 16% in adjusted return on invested capital improvement for existing businesses. |
In accomplishing these goals, we believe that, by fiscal 2020, we could also achieve, as compared to fiscal 2017, (1) sales growth of 4% to 4.5%; (2) adjusted operating income growth of 9%; and (3) adjusted diluted earnings per share results in the range of $3.85 to $3.95 in fiscal 2020, representing an increase of approximately 16%. The objectives targeted in our new three-year plan include the impact of the recently enacted U.S. tax reform. The key levers to achieve these targets include an emphasis on accelerating locally managed customer case growth and driving leverage between gross profit growth and expense growth. Our operating income goal was established on an adjusted basis given Certain Item charges that were applicable in fiscal 2018, which primarily were due to restructuring and Brakes-related acquisitions costs.
See "Non-GAAP Reconciliations" for an explanation of these non-GAAP financial measures.
7
Results of Operations
The following table sets forth the components of our consolidated results of operations expressed as a percentage of sales for the periods indicated:
| 2018 |
| 2017 |
| 2016 | |||
Sales | 100.0 | % |
| 100.0 | % |
| 100.0 | % |
Cost of sales | 81.1 | |
| 80.9 | |
| 82.1 | |
Gross profit | 18.9 | |
| 19.1 | |
| 17.9 | |
Operating expenses | 14.9 | |
| 15.4 | |
| 14.3 | |
Operating income | 4.0 | |
| 3.7 | |
| 3.7 | |
Interest expense | 0.7 | |
| 0.5 | |
| 0.6 | |
Other expense (income), net | - | |
| - | |
| 0.2 | |
Earnings before income taxes | 3.3 | |
| 3.2 | |
| 2.8 | |
Income taxes | 0.9 | |
| 1.1 | |
| 1.0 | |
Net earnings | 2.4 | % |
| 2.1 | % |
| 1.9 | % |
The following table sets forth the change in the components of our consolidated results of operations expressed as a percentage increase or decrease over the comparable period in the prior year:
| 2018 |
| 2017 | ||
Sales | 6.1 | % |
| 9.9 | % |
Cost of sales | 6.3 | |
| 8.4 | |
Gross profit | 5.0 | |
| 16.8 | |
Operating expenses | 3.0 | |
| 18.3 | |
Operating income | 13.4 | |
| 11.0 | |
Interest expense | 30.6 | |
| (1.1 | ) |
Other expense (income), net (1) | 42.6 | |
| (114.3 | ) |
Earnings before income taxes | 10.8 | |
| 23.3 | |
Income taxes | (15.8 | ) |
| 29.0 | |
Net earnings | 25.2 | % |
| 20.3 | % |
Basic earnings per share | 30.5 | % |
| 26.5 | % |
Diluted earnings per share | 29.8 | |
| 26.8 | |
Average shares outstanding | (3.8 | ) |
| (5.2 | ) |
Diluted shares outstanding | (3.5 | ) |
| (5.0 | ) |
(1) | Other expense (income), net was income of $22.7 million in fiscal 2018 and income of $15.9 million in fiscal 2017 . |
8
Segment Results
The following represents our results by reportable segments:
| 52-Week Period Ended Jun. 30, 2018 | ||||||||||||||||||||||
| U.S. Foodservice Operations |
| International Foodservice Operations |
| SYGMA |
| Other |
| Corporate |
| Consolidated | ||||||||||||
| (In thousands) | ||||||||||||||||||||||
Sales | $ | 39,642,263 | |
| $ | 11,518,565 | |
| $ | 6,557,033 | |
| $ | 1,009,463 | |
| $ | - | |
| $ | 58,727,324 | |
Sales increase (decrease) | 5.4 | % |
| 8.5 | % |
| 6.1 | % |
| 3.6 | % |
|
|
| 6.1 | % | |||||||
Percentage of total | 67.5 | % |
| 19.6 | % |
| 11.2 | % |
| 1.7 | % |
|
|
| 100.0 | % | |||||||
|
|
|
|
|
|
|
|
|
|
|
| ||||||||||||
Operating income | $ | 3,051,991 | |
| $ | 193,240 | |
| $ | 24,318 | |
| $ | 39,485 | |
| $ | (980,060 | ) |
| $ | 2,328,974 | |
Operating income increase (decrease) | 5.5 | % |
| (20.5 | )% |
| 4.4 | % |
| 30.7 | % |
|
|
| 13.4 | % | |||||||
Percentage of total segments | 92.2 | % |
| 5.8 | % |
| 0.7 | % |
| 1.2 | % |
|
|
| 100.0 | % | |||||||
Operating income as a percentage of sales | 7.7 | % |
| 1.7 | % |
| 0.4 | % |
| 3.9 | % |
|
|
| 4.0 | % | |||||||
| 52-Week Period Ended Jul. 1, 2017 | ||||||||||||||||||||||
| U.S. Foodservice Operations |
| International Foodservice Operations |
| SYGMA |
| Other |
| Corporate |
| Consolidated | ||||||||||||
| (In thousands) | ||||||||||||||||||||||
Sales | $ | 37,604,698 | |
| $ | 10,613,059 | |
| $ | 6,178,909 | |
| $ | 974,473 | |
| $ | - | |
| $ | 55,371,139 | |
Sales increase (decrease) | (0.5 | )% |
| 95.2 | % |
| 1.3 | % |
| (7.4 | )% |
|
|
| 9.9 | % | |||||||
Percentage of total | 67.9 | % |
| 19.2 | % |
| 11.2 | % |
| 1.7 | % |
|
|
| 100.0 | % | |||||||
|
|
|
|
|
|
|
|
|
|
|
| ||||||||||||
Operating income | $ | 2,891,612 | |
| $ | 243,116 | |
| $ | 23,299 | |
| $ | 30,218 | |
| $ | (1,135,074 | ) |
| $ | 2,053,171 | |
Operating income increase (decrease) | 4.3 | % |
| 37.2 | % |
| (15.2 | )% |
| (7.3 | )% |
|
|
| 11.0 | % | |||||||
Percentage of total segments | 90.7 | % |
| 7.6 | % |
| 0.7 | % |
| 0.9 | % |
|
|
| 100.0 | % | |||||||
Operating income as a percentage of sales | 7.7 | % |
| 2.3 | % |
| 0.4 | % |
| 3.1 | % |
|
|
| 3.7 | % | |||||||
| 53-Week Period Ended Jul. 2, 2016 | ||||||||||||||||||||||
| U.S. Foodservice Operations |
| International Foodservice Operations |
| SYGMA |
| Other |
| Corporate |
| Consolidated | ||||||||||||
| (In thousands) | ||||||||||||||||||||||
Sales | $ | 37,776,443 | |
| $ | 5,436,209 | |
| $ | 6,102,328 | |
| $ | 1,051,939 | |
| $ | - | |
| $ | 50,366,919 | |
Percentage of total | 75.0 | % |
| 10.8 | % |
| 12.1 | % |
| 2.1 | % |
|
|
| 100.0 | % | |||||||
|
|
|
|
|
|
|
|
|
|
|
| ||||||||||||
Operating income | $ | 2,771,932 | |
| $ | 177,159 | |
| $ | 27,469 | |
| $ | 32,586 | |
| $ | (1,158,646 | ) |
| $ | 1,850,500 | |
Percentage of total segments | 92.1 | % |
| 5.9 | % |
| 0.9 | % |
| 1.1 | % |
|
|
| 100.0 | % | |||||||
Operating income as a percentage of sales | 7.3 | % |
| 3.3 | % |
| 0.5 | % |
| 3.1 | % |
|
|
| 3.7 | % | |||||||
Based on information in Note 20 , "Business Segment Information" in fiscal 2018 , U.S. Foodservice Operations and International Foodservice Operations represented approximately 67.5% and 19.6% , respectively, of Sysco's overall sales, compared to 67.9% and 19.2% , respectively, in fiscal 2017. In fiscal 2018 , U.S. Foodservice Operations and International Foodservice Operations represented approximately 92.2% and 5.8% , respectively, of the total segment operating income, compared to 90.7% and 7.6% , respectively in fiscal 2017 . This illustrates that these segments represent a substantial majority of our total segment results when compared to other reportable segments.
9
Cost of sales primarily includes our product costs, net of vendor consideration, and includes in-bound freight. Operating expenses include the costs of facilities, product handling, delivery, selling and general and administrative activities. Fuel surcharges are reflected within sales and gross profit; fuel costs are reflected within operating expenses. Along with sales, operating income is the most relevant measure for evaluating segment performance and allocating resources, as operating income includes cost of goods sold, as well as the costs to warehouse and deliver goods, which are significant and relevant costs when evaluating a distribution business.
Results of U.S. Foodservice Operations
In fiscal 2018 , the U.S. Foodservice Operations operating results represented approximately 67.5% of Sysco's overall sales and 92.2% of the aggregated operating income of Sysco's reporting segments. There are several factors that contribute to these higher operating results as compared to the other operating segments. We have invested substantial amounts in assets, operating methods, technology and management expertise in this segment. The breadth of its sales force, geographic reach of its distribution area and its purchasing power enable this segment to generate its relatively stronger results of operations.
The following tables set forth a summary of the components of operating income and adjusted operating income expressed as a percentage increase or decrease over the prior year:
| 2018 |
| 2017 |
| Change in Dollars |
| % Change | |||||||
| (In thousands) | |||||||||||||
Sales | $ | 39,642,263 | |
| $ | 37,604,698 | |
| $ | 2,037,565 | |
| 5.4 | % |
Gross profit | 7,900,276 | |
| 7,556,392 | |
| 343,884 | |
| 4.6 | | |||
Operating expenses | 4,848,285 | |
| 4,664,780 | |
| 183,505 | |
| 3.9 | | |||
Operating income | $ | 3,051,991 | |
| $ | 2,891,612 | |
| $ | 160,379 | |
| 5.5 | % |
|
|
|
|
|
|
|
| |||||||
Gross profit | $ | 7,900,276 | |
| $ | 7,556,392 | |
| $ | 343,884 | |
| 4.6 | % |
Adjusted operating expenses (Non-GAAP) | 4,846,585 | |
| 4,628,710 | |
| 217,875 | |
| 4.7 | | |||
Adjusted operating income (Non-GAAP) | $ | 3,053,691 | |
| $ | 2,927,682 | |
| $ | 126,009 | |
| 4.3 | % |
| 2017 |
| 2016 |
| Change in Dollars |
| % Change | |||||||
| (In thousands) | |||||||||||||
Sales | $ | 37,604,698 | |
| $ | 37,776,443 | |
| $ | (171,745 | ) |
| (0.5 | )% |
Gross profit | 7,556,392 | |
| 7,413,436 | |
| 142,956 | |
| 1.9 | | |||
Operating expenses | 4,664,780 | |
| 4,641,504 | |
| 23,276 | |
| 0.5 | | |||
Operating income | $ | 2,891,612 | |
| $ | 2,771,932 | |
| $ | 119,680 | |
| 4.3 | % |
|
|
|
|
|
|
|
| |||||||
Gross profit | $ | 7,556,392 | |
| $ | 7,266,692 | |
| $ | 289,700 | |
| 4.0 | % |
Adjusted operating expenses (Non-GAAP) | 4,628,710 | |
| 4,549,830 | |
| 78,880 | |
| 1.7 | | |||
Adjusted operating income (Non-GAAP) | $ | 2,927,682 | |
| $ | 2,716,862 | |
| $ | 210,820 | |
| 7.8 | % |
Sales
The following table sets forth the percentage and dollar value increase or decrease in sales over the prior year in order to demonstrate the cause and magnitude of change.
10
| Increase (Decrease) |
| Increase (Decrease) | ||||||||||
| 2018 |
| 2017 | ||||||||||
| (In millions) | ||||||||||||
Cause of change | Percentage |
| Dollars |
| Percentage |
| Dollars | ||||||
Case volume | 2.0 | % |
| $ | 756.8 | |
| 1.0 | % |
| $ | 377.7 | |
Inflation (deflation) | 2.9 | |
| 1,096.4 | |
| (0.4 | ) |
| (134.6 | ) | ||
Acquisitions | 0.8 | |
| 300.6 | |
| 0.3 | |
| 100.7 | | ||
Other (1) | (0.3 | ) |
| (116.2 | ) |
| (1.4 | ) |
| (515.5 | ) | ||
Total sales increase | 5.4 | % |
| $ | 2,037.6 | |
| (0.5 | )% |
| $ | (171.7 | ) |
(1) | Case volume excludes the volume impact from our custom-cut meat and seafood companies that do not measure volume in cases. Any impact in volumes from these operations are included within "Other." |
Sales were 5.4% higher in fiscal 2018 than in fiscal 2017 . The largest drivers of the increase were the impact of product cost inflation and case volume growth in our U.S. Broadline operations. Case volumes for the company's U.S. Broadline operations (including acquisitions within the last 12 months) increased 2.9% in fiscal 2018 compared to fiscal 2017 and included a 3.6% improvement in locally managed customer case growth, along with an increase of 1.9% in national customer case volume, including chain restaurants and multi-locational restaurants. Sales from acquisitions within the last 12 months favorably impacted locally managed customer sales by 0.8% ; therefore, organic local case volume, which excludes acquisitions, grew 2.8% , resulting in 17 consecutive quarters of growth.
Sales were 0.5% lower in fiscal 2017 than in fiscal 2016 . The largest driver of the decrease was the extra week in fiscal 2016 , which we estimate contributed 0.8% of the sales decline in fiscal 2017 . Case volumes for the company's U.S. Broadline operations including acquisitions within the last 12 months declined 1.0% in fiscal 2017 compared to fiscal 2016 . We estimate that the extra week contributed 2.0% of the 1.0% case decline. Absent the impact of the extra week in fiscal 2016 , case volume grew primarily from locally managed customers. Other items impacting the change in sales, but to a lesser extent, were pricing management of product cost deflation and product mix.
Operating Income
Operating income increased by 5.5% in fiscal 2018 over fiscal 2017 , primarily due to our gross profits growing at a faster pace than operating expenses.
Gross profit dollars increased in fiscal 2018 , as compared to fiscal 2017 , primarily due to a customer mix that has continued to improve as we accelerated local case growth as compared to national cases. Additionally, growth in sales of Sysco-branded products contributed positively to gross profit dollar growth. Our case growth for Sysco-branded sales to local customers increased 61 basis points for fiscal 2018 . The change in product costs, an internal measure of inflation or deflation, was estimated as inflation of 2.6% during fiscal 2018 for our U.S. Broadline operations. Inflation in fiscal 2018 occurred primarily in the meat, dairy, paper and disposables, produce and frozen potatoes and vegetables categories, partially offset by modest deflation in poultry. Partially offsetting the gross profit increase was an increase in inbound freight costs that have risen due to overall industry factors such as driver shortages and adjusting to electronic regulation of hours driven.
Operating expenses increased in fiscal 2018 , as compared to fiscal 2017 , primarily due to increased supply chain costs in both transportation and warehouse. These costs were largely due to a combination of a tight labor market, rising fuel costs, weather impacts through the year and ramp up costs for new business. Our ongoing investment in our selling organization to help grow the business has also contributed to the increase in operating expenses.
Operating income increased by 4.3% in fiscal 2017 over fiscal 2016 , primarily due to our gross profits growing at a faster pace than operating expenses. Higher gross profits were achieved as we managed the deflationary environment in the first part of the year and operating expense increases were limited, reflecting favorable expense management. We estimate that the extra week in fiscal 2016 partially offset, by 2.0% , the year-over-year operating income growth.
Gross profit dollars increased in fiscal 2017 , as compared to fiscal 2016 , primarily due to effective management of deflation, a more beneficial mix of local customer case growth and increased sales of Sysco-branded products to local customers. Our case growth for Sysco-branded sales to local customers increased 62 basis points for fiscal 2017 . The change in product costs, an internal measure of inflation or deflation, was estimated as deflation of 0.4% during fiscal 2017 for our U.S. Broadline
11
operations. Deflation in fiscal 2017 occurred primarily in the meat, dairy and produce categories, partially offset by modest inflation in other categories.
Operating expenses increased in fiscal 2017 , as compared to fiscal 2016 , primarily due to costs associated with multiemployer pension plan withdrawal costs in fiscal 2017 and indirect spend. These increases were partially offset by the impact of the extra week in fiscal 2016 , reduced fuel costs and pay-related expenses. Indirect spend includes costs such as fleet maintenance and supplies.
Results of International Foodservice Operations
In fiscal 2018 , the International Foodservice Operations operating results represented approximately 19.6% of Sysco's overall sales and 5.8% of the aggregated operating income of Sysco's segments, which excludes corporate expenses and adjustments.
The following tables set forth a summary of the components of operating income and adjusted operating income expressed as a percentage increase or decrease over the prior year:
| 2018 |
| 2017 |
| Change in Dollars |
| % Change | |||||||
| (In thousands) | |||||||||||||
Sales | $ | 11,518,565 | |
| $ | 10,613,059 | |
| $ | 905,506 | |
| 8.5 | % |
Gross profit | 2,436,968 | |
| 2,275,819 | |
| 161,149 | |
| 7.1 | | |||
Operating expenses | 2,243,728 | |
| 2,032,703 | |
| 211,025 | |
| 10.4 | | |||
Operating income | $ | 193,240 | |
| $ | 243,116 | |
| $ | (49,876 | ) |
| (20.5 | )% |
|
|
|
|
|
|
|
| |||||||
Gross profit | $ | 2,436,968 | |
| $ | 2,275,819 | |
| $ | 161,149 | |
| 7.1 | % |
Adjusted operating expenses (Non-GAAP) | 2,117,057 | |
| 1,929,350 | |
| 187,707 | |
| 9.7 | | |||
Adjusted operating income (Non-GAAP) | $ | 319,911 | |
| $ | 346,469 | |
| $ | (26,558 | ) |
| (7.7 | )% |
| 2017 |
| 2016 |
| Change in Dollars |
| % Change | |||||||
| (In thousands) | |||||||||||||
Sales | $ | 10,613,059 | |
| $ | 5,436,209 | |
| $ | 5,176,850 | |
| 95.2 | % |
Gross profit | 2,275,819 | |
| 938,942 | |
| 1,336,877 | |
| 142.4 | | |||
Operating expenses | 2,032,703 | |
| 761,783 | |
| 1,270,920 | |
| 166.8 | | |||
Operating income | $ | 243,116 | |
| $ | 177,159 | |
| $ | 65,957 | |
| 37.2 | % |
|
|
|
|
|
|
|
| |||||||
Adjusted gross profit (Non-GAAP) (1) | $ | 941,967 | |
| $ | 920,256 | |
| $ | 21,711 | |
| 2.4 | % |
Adjusted operating expenses (Non-GAAP) (1) | 738,555 | |
| 738,210 | |
| 345 | |
| - | | |||
Adjusted operating income (Non-GAAP) (1) | $ | 203,412 | |
| $ | 182,046 | |
| $ | 21,366 | |
| 11.7 | % |
(1) Fiscal 2017 excludes the impact of the Brakes Acquisition.
12
Sales
The following table sets forth the percentage and dollar value increase or decrease in sales over the comparable prior year period in order to demonstrate the cause and magnitude of change.
| Increase (Decrease) |
| Increase (Decrease) | ||||||||||
| 2018 |
| 2017 | ||||||||||
| (In millions) | ||||||||||||
Cause of change | Percentage |
| Dollars |
| Percentage |
| Dollars | ||||||
Inflation | 3.9 | % |
| $ | 417.6 | |
| - | % |
| $ | - | |
Acquisitions (1) | 0.5 | |
| 50.9 | |
| 99.0 | |
| 5,273.8 | | ||
Foreign currency | 5.1 | |
| 537.2 | |
| (0.7 | ) |
| (38.5 | ) | ||
Other (2) | (0.9 | ) |
| (100.2 | ) |
| (3.1 | ) |
| (58.4 | ) | ||
Total sales increase | 8.6 | % |
| $ | 905.5 | |
| 95.2 | % |
| $ | 5,176.9 | |
(1) | The impact of the Brakes Acquisition is included within this line only for fiscal 2017. |
(2) | The impact of volumes as a component of sales growth from international operations are included within "Other." Volume in our foreign operations includes volume metrics that differ from country to country and cannot be aggregated on a consistent comparable basis. |
Sales were 8.5% higher in fiscal 2018 than in fiscal 2017 . The increase for fiscal 2018 was primarily due to favorable changes in exchange rates used to translate our foreign sales into U.S. dollars, as well as product cost inflation in Europe and Canada and a modest increase in volumes in our Canadian operations. The increase was partially offset by a small decline in volumes in Europe due to softer market conditions.
Sales were 95.2% higher in fiscal 2017 than in fiscal 2016 . The increase for fiscal 2017 was primarily due to the acquisition of the Brakes Group, which added $5.2 billion during the year. The increase was partially offset by the impact of the extra week in fiscal 2016, a small decline in volume, primarily in Canada, and unfavorable changes in exchange rates used to translate our foreign sales into U.S. dollars. We had a modest decrease in sales in Canada due to softer market conditions.
Operating Income
Operating income decreased by 20.5% in fiscal 2018 from fiscal 2017 , primarily as a result of the strategic investments we are making in our European supply chain. We continue to focus on executing against our long-term plans by investing in necessary capabilities across the International Foodservice business.
Gross profit dollars increased $161.1 million in fiscal 2018 , as compared to fiscal 2017 , primarily due to a combination of product costs increasing and currency translation in the U.K. along with local case growth in our Canadian operations.
Operating expenses increased $211.0 million in fiscal 2018 , as compared to fiscal 2017 , primarily due to supply chain transformation costs in the U.K. and increased supply chain costs in Canada. The supply chain transformation work in the U.K. to transition from a single temperature warehouse and fleet into a multi-temperature network is progressing well. In Canada, the increase in supply chain costs was driven by increased case volumes and the resulting increase in transportation costs. We have concluded the merger of Brake France and Davigel to form Sysco France, which will provide new capabilities and the unique multi-temperature service that will better adapt to our customers' growing needs, as well as access to new customer segments. Integration of these businesses in France will continue through fiscal 2019. Additionally, the integration of Pallas and Brakes in Ireland is nearly complete, and we have achieved strong cost synergies throughout the year. Across Europe, we are also making technology investments to improve the infrastructure and to enhance our suite of customer facing tools. In Mexico, we absorbed the cost of adding a new large customer during the year.
Operating income increased by 37.2% in fiscal 2017 from fiscal 2016 , primarily attributable to the Brakes Acquisition. The Brakes Group is progressing in its supply chain transformational efforts as it moves to multi-temperature capability across the U.K. Growth in France remains steady. Excluding the Brakes Group, non-GAAP operating income, adjusted for the impact of the extra week in fiscal 2016, increased 11.7% in fiscal 2017 as compared to fiscal 2016, primarily from managing costs effectively in Canada within a deflationary and somewhat softer market environment. Our joint venture in Costa Rica also experienced improved operating income performance.
13
Gross profit dollars increased $1.3 billion in fiscal 2017 as compared to fiscal 2016 , primarily due to the Brakes Acquisition. Adjusted gross profit dollars, excluding the impact of Brakes and on a comparable 52 week basis, increased 2.4% . Adjusted gross profit dollar growth was higher due to improved sales execution and implementation of our customer focused initiatives, such as category management and revenue management in our Canadian operations.
Operating expenses increased $1.3 billion in fiscal 2017 as compared to fiscal 2016 , largely due to the Brakes Acquisition. Adjusted operating expenses excluding Brakes were flat in fiscal 2017 , as compared to fiscal 2016 , as a result of our effectively managing costs by streamlining administrative expenses to improve productivity in the Canadian business.
Results of SYGMA and Other Segment
SYGMA operating companies distribute a full line of food products and a wide variety of non-food products to certain chain restaurant customer locations.
Sales
Sales were 6.1% higher in fiscal 2018 than in fiscal 2017 . The increase for fiscal 2018 was primarily attributable to case growth and product cost inflation. Case growth was primarily the result of increased volume from existing customers, as well as new business acquired during the year. SYGMA experienced product cost inflation of 2.5% during fiscal 2018 .
Sales were 1.3% higher in fiscal 2017 than in fiscal 2016 . The increase for fiscal 2017 was primarily attributable to case growth. Case growth was primarily the result of increased volume from existing customers, with additional new business also contributing to such growth.
Operating Income
Operating income increased by 4.4% in fiscal 2018 , as compared to fiscal 2017 , primarily driven by sales growth and partially offset by operating expense growth exceeding gross profit dollar growth. Gross profit dollars increased 8.5% , driven by higher product margins, while operating expenses increased 8.7% in fiscal 2018 , as compared to fiscal 2017 . Operating expenses increased in fiscal 2018 largely due to increased transportation expenses resulting from driver hiring challenges and outsourced delivery costs to meet the high service level expectations of our customers.
Operating income decreased by 15.2% in fiscal 2017 as compared to fiscal 2016 , primarily driven by operating expense growth exceeding gross profit dollar growth. Gross profit dollars increased 3.3% , while operating expenses increased 4.5% in fiscal 2017 as compared to fiscal 2016 . Gross profit dollar growth was lower due to higher product margins. Operating expenses increased in fiscal 2017 largely due to higher pay-related expenses.
"Other" segment information is attributable to the company's other operating segments that do not meet the quantitative disclosure thresholds, primarily including our hotel supply operations and Sysco Labs, which includes our suite of technology solutions that help support the business needs of our customers and provides support for some of our business technology needs.
Operating income increased 30.7% , or $9.3 million , in fiscal 2018 , as compared to fiscal 2017 . The increase was primarily attributable to favorable results from our hotel supply operations and improved results from Sysco Labs.
Operating income decreased 7.3% , or $2.4 million , in fiscal 2017 , as compared to fiscal 2016 . The decrease was primarily attributable to the extra week applicable to fiscal 2016, partially offset by favorable results from our hotel supply operations.
Corporate Expenses
Corporate expenses in fiscal 2018 decreased $155.0 million , or 13.7% , as compared to fiscal 2017 , due primarily to the favorable comparison of depreciation expense. During fiscal 2017 , we incurred $184.1 million of depreciation expense on our previous ERP system, which became fully depreciated at the end of fiscal 2017 . A portion of this depreciation expense was included in Certain Items during fiscal 2017 . The decrease in depreciation expenses, along with a reduction in our estimates for our reserves for our self-insurance program (which covers portions of workers' compensation, general and vehicle liability), were partially offset by an increase in business technology costs.
Included in corporate expenses are Certain Items that totaled $91.0 million in fiscal 2018 , as compared to $159.2 million in fiscal 2017 . Certain Items impacting fiscal 2018 were primarily expenses associated with our business technology transformation
14
initiatives, professional fees on three-year financial objectives, Brakes integration costs and severance charges. Certain Items impacting fiscal 2017 were primarily expenses associated with our revised business technology strategy announced in fiscal 2016, as a result of which we recorded accelerated depreciation of $111.3 million on our existing ERP system, and we incurred expenses of $11.2 million in fiscal 2017 to convert to a modernized version of our established platform.
Corporate expenses in fiscal 2017 decreased $23.6 million , or 2.0% , as compared to fiscal 2016 , due primarily to lower pay-related expenses, partially offset by an increase in our estimates for our reserves for our self-insurance program (which covers portions of workers' compensation, general and vehicle liability), resulting from wage increases and unfavorable claims developments.
Interest Expense
Interest expense increased $92.6 million in fiscal 2018 , as compared to fiscal 2017 , due to the partial redemption of senior notes and debentures due 2027, 2028, 2035 and 2039 pursuant to a tender offer in fiscal 2018. Interest charges related to the redemption costs noted above are considered Certain Items. Excluding Certain Items, our interest expense increased $39.5 million in fiscal 2018 from fiscal 2017 , due to higher borrowing levels attributable to senior notes issued in fiscal 2018 and fiscal 2017 primarily to fund a $330 million pension contribution and to pay off our then outstanding commercial paper borrowings.
Interest expense decreased $3.3 million for fiscal 2017 , as compared to fiscal 2016 due to Certain Item interest costs specific to fiscal 2016 , partially offset by higher relative debt levels in fiscal 2017 . Fiscal 2016 included a loss of $86.5 million in connection with the redemption of the notes issued in fiscal 2015 to fund the merger that was proposed with US Foods. These items, along with interest expense incurred in fiscal 2016 through the date the senior notes were redeemed and interest cost incurred from financing the Brakes Acquisition, are included in our Certain Items. Excluding Certain Items, our interest expense increased $120.7 million for fiscal 2017 from fiscal 2016 due to higher debt balances from senior notes that were issued in fiscal 2016 and commercial paper borrowings issued in fiscal 2017 .
Net Earnings
Net earnings increased 25.2% in fiscal 2018 , as compared to the prior year, due primarily to the items noted above, as well as items impacting our income taxes that are discussed in Note 18 , "Income Taxes." Adjusted net earnings increased 22.1% in fiscal 2018 , primarily due to strong local case growth, gross margin expansion and reduced administrative expense, partially offset by increased supply chain costs and interest expense, which resulted in earnings growth that exceeded our operating income growth.
Net earnings increased 20.3% in fiscal 2017 as compared to the prior year due primarily to the items noted above, as well as items impacting our income taxes that are discussed in Note 18 , "Income Taxes." Adjusted net earnings increased 11.9% in fiscal 2017 , primarily due to strong local case growth, gross profit growth with margin expansion, strong expense management and the results of Sysco Europe, partially offset by increased interest expense, which resulted in earnings growth that was lower than our operating income growth. Adjusted net earnings, on a comparable 52-week basis and excluding Brakes, increased 8.0% in fiscal 2017 as compared to fiscal 2016 .
Earnings Per Share
Basic earnings per share in fiscal 2018 were $2.74 , a 30.5% increase from the comparable prior year amount of $2.10 per share. Diluted earnings per share in fiscal 2018 were $2.70 , a 29.8% increase from the fiscal 2017 amount of $2.08 per share. Adjusted diluted earnings per share in fiscal 2018 were $3.14 , a 26.6% increase from the fiscal 2017 amount of $2.48 per share. These results were primarily attributable to the factors discussed above related to net earnings and a decrease in outstanding shares that resulted from our share repurchases in fiscal 2018 and fiscal 2017 .
Basic earnings per share in fiscal 2017 were $2.10 , a 26.5% increase from the comparable prior year amount of $1.66 per share. Diluted earnings per share in fiscal 2017 were $2.08 , a 26.8% increase from the fiscal 2016 amount of $1.64 per share. Adjusted diluted earnings per share in fiscal 2017 were $2.48 , an 18.1% increase from the fiscal 2016 amount of $2.10 per share. Adjusted diluted earnings per share, on a comparable 52-week basis and excluding Brakes, were $2.34 , a 13.8% increase from the fiscal 2016 amount of $2.06 per share. These results were primarily attributable to the factors discussed above related to net earnings and a decrease in outstanding shares that resulted from our share repurchases in fiscal 2017 and fiscal 2016 .
15
Non-GAAP Reconciliations
Our discussion below and elsewhere herein of our results includes certain non-GAAP financial measures that we believe provide important perspective with respect to underlying business trends. Other than free cash flow, any non-GAAP financial measures will be denoted as adjusted measures and exclude the impact from restructuring costs consisting of: (1) expenses associated with our revised business technology strategy announced in fiscal 2016, as a result of which we incurred costs to convert to a modernized version of our established platform as opposed to completing the implementation of an ERP; (2) professional fees related to our three-year strategic plans; (3) restructuring expenses within our Brakes Group operations; (4) severance charges related to restructuring; and (5) foreign non-income based taxes. In addition, fiscal 2018 results of operations are impacted by business technology transformation initiative costs, facility closure charges, MEPP withdrawal charges and debt extinguishment charges, which are also excluded from our non-GAAP financial measures.
The non-GAAP financial measures presented in this report also exclude the impact of the following acquisition-related items: (1) intangible amortization expense and (2) integration costs. All acquisition-related costs in fiscal 2018 and 2017 that have been excluded relate to the Brakes Acquisition, discussed in Note 4 , "Acquisitions." The Brakes Acquisition also resulted in non-recurring tax expense in fiscal 2017, primarily from non-deductible transaction costs.
The non-GAAP financial measures presented in this report further exclude the impact of the Tax Act enacted on December 22, 2017 . The impact for fiscal 2018 includes: a provisional estimate of a one-time transition tax on certain unrepatriated earnings of foreign subsidiaries and a net benefit from remeasuring Sysco's accrued income taxes, deferred tax liabilities and deferred tax assets due to the changes in tax rates. Other tax-related items impacting results of operations include foreign withholding taxes on repatriated earnings, net of foreign tax credits and a benefit from contributions made to fund Sysco's U.S. Retirement Plan.
The fiscal 2018 and fiscal 2017 items described above and excluded from our non-GAAP measures are collectively referred to as "Certain Items." In addition, with respect to the adjusted return on invested capital targets, our invested capital is adjusted for the accumulation of debt incurred for the Brakes Acquisition that would not have been borrowed absent this acquisition.
Management believes that adjusting its operating expenses, operating income, operating margin as a percentage of sales, interest expense, net earnings and diluted earnings per share to remove these Certain Items provides an important perspective with respect to our underlying business trends and results and provides meaningful supplemental information to both management and investors that (1) is indicative of the performance of the company's underlying operations and facilitates comparisons on a year-over-year basis and (2) removes those items that are difficult to predict and are often unanticipated, and which as a result, are difficult to include in analysts' financial models and our investors' expectations with any degree of specificity. Sysco's fiscal year ends on the Saturday nearest to June 30th. This resulted in a 52 -week year ending June 30, 2018 for fiscal 2018 , a 52 -week year ending July 1, 2017 for fiscal 2017 , and a 53 -week year ending July 2, 2016 for fiscal 2016 . Because the fourth quarter of fiscal 2016 contained an additional week as compared to fiscal 2017, our Consolidated Results of Operations for fiscal 2017, and any related case growth metrics, are not directly comparable to fiscal 2016. Management believes that adjusting the fiscal 2016 results for the estimated impact of the additional week provides more comparable financial results on a year-over-year basis. As a result, the operating metrics for fiscal 2017 presented in the tables below reflect a comparison to fiscal 2016 as adjusted by one-fourteenth of the total metric for the fourth quarter. Failure to make these adjustments causes the year-over-year changes in these metrics to be understated.
Although Sysco has a history of growth through acquisitions, the Brakes Group is significantly larger than the companies historically acquired by Sysco, with a proportionately greater impact on Sysco's consolidated financial statements. Accordingly, Sysco is also excluding from certain of its non-GAAP financial measures for the relevant periods, solely those acquisition costs specific to the Brakes Acquisition. We believe this approach significantly enhances the comparability of Sysco's adjusted results for fiscal 2017 and 2016. As the Brakes Acquisition took place at the beginning of fiscal 2017, and given the significance of the Brakes Acquisition, management believes that presenting Sysco's adjusted financial measures, excluding the Brakes Group operating results (including, for this purpose, Brakes Group financing costs, which are not included in the Brakes Group operating results and are also not Certain Items), enhances comparability of the period over period financial performance of Sysco's legacy business and allows investors to more effectively measure Sysco's results against the financial goals under Sysco's initial three-year strategic plan that concluded in fiscal 2018.
The company uses these non-GAAP measures when evaluating its financial results, as well as for internal planning and forecasting purposes. These financial measures should not be used as a substitute for GAAP measures in assessing the company's results of operations for periods presented. An analysis of any non-GAAP financial measure should be used in conjunction with results presented in accordance with GAAP. As a result, in the table below, each period presented is adjusted for the impact
16
described above. In the table below, individual components of diluted earnings per share may not add to the total presented due to rounding. Adjusted diluted earnings per share is calculated using adjusted net earnings divided by diluted shares outstanding.
| 2018 |
| 2017 |
| Change in Dollars |
| % Change | |||||||
| (In thousands, except for share and per share data) | |||||||||||||
Operating expenses (GAAP) | $ | 8,756,417 | |
| $ | 8,504,336 | |
| $ | 252,081 | |
| 3.0 | % |
Impact of MEPP charge | (1,700 | ) |
| (35,600 | ) |
| 33,900 | |
| (95.2 | ) | |||
Impact of restructuring costs (1) | (109,524 | ) |
| (161,011 | ) |
| 51,487 | |
| (32.0 | ) | |||
Impact of acquisition-related costs (2) | (108,136 | ) |
| (102,049 | ) |
| (6,087 | ) |
| 6.0 | | |||
Operating expenses adjusted for Certain Items (Non-GAAP) | $ | 8,537,057 | |
| $ | 8,205,676 | |
| $ | 331,381 | |
| 4.0 | % |
|
|
|
|
|
|
|
| |||||||
Operating income (GAAP) | $ | 2,328,974 | |
| $ | 2,053,171 | |
| $ | 275,803 | |
| 13.4 | % |
Impact of MEPP charge | 1,700 | |
| 35,600 | |
| (33,900 | ) |
| (95.2 | ) | |||
Impact of restructuring costs (1) | 109,524 | |
| 161,011 | |
| (51,487 | ) |
| (32.0 | ) | |||
Impact of acquisition-related costs (2) | 108,136 | |
| 102,049 | |
| 6,087 | |
| 6.0 | | |||
Operating income adjusted for Certain Items (Non-GAAP) | $ | 2,548,334 | |
| $ | 2,351,831 | |
| $ | 196,503 | |
| 8.4 | % |
|
|
|
|
|
|
|
| |||||||
Interest expense (GAAP) | $ | 395,483 | |
| $ | 302,878 | |
| $ | 92,605 | |
| 30.6 | % |
Impact of loss on extinguishment of debt | (53,104 | ) |
| - | |
| (53,104 | ) |
| NM | | |||
Interest expense adjusted for Certain Items (Non-GAAP) | $ | 342,379 | |
| $ | 302,878 | |
| $ | 39,501 | |
| 13.0 | % |
|
|
|
|
|
|
|
| |||||||
Net earnings (GAAP) | $ | 1,430,766 | |
| $ | 1,142,503 | |
| $ | 288,263 | |
| 25.2 | % |
Impact of MEPP charge | 1,700 | |
| 35,600 | |
| (33,900 | ) |
| (95.2 | ) | |||
Impact of restructuring costs (1) | 109,524 | |
| 161,011 | |
| (51,487 | ) |
| (32.0 | ) | |||
Impact of acquisition-related costs (2) | 108,136 | |
| 102,049 | |
| 6,087 | |
| 6.0 | | |||
Impact of loss on extinguishment of debt | 53,104 | |
| - | |
| 53,104 | |
| NM | | |||
Tax impact of MEPP charge | (573 | ) |
| (11,903 | ) |
| 11,330 | |
| (95.2 | ) | |||
Tax impact of restructuring costs (5) | (34,024 | ) |
| (51,184 | ) |
| 17,160 | |
| (33.5 | ) | |||
Tax impact of acquisition-related costs (5) | (26,172 | ) |
| (19,003 | ) |
| (7,169 | ) |
| 37.7 | | |||
Tax impact of loss on extinguishment of debt | (18,225 | ) |
| - | |
| (18,225 | ) |
| NM | | |||
Tax impact of U.S. Retirement Plan contribution | (44,424 | ) |
| - | |
| (44,424 | ) |
| NM | | |||
Impact of US transition tax | 80,000 | |
| - | |
| 80,000 | |
| NM | | |||
Impact of US balance sheet remeasurement from tax law change | (14,477 | ) |
| - | |
| (14,477 | ) |
| NM | | |||
Impact of France, U.K. and Sweden tax law changes | (9,706 | ) |
| - | |
| (9,706 | ) |
| NM | | |||
Impact of repatriation of certain international earnings (4) | 24,208 | |
| - | |
| 24,208 | |
| NM | | |||
Net earnings adjusted for Certain Items (Non-GAAP) | $ | 1,659,837 | |
| $ | 1,359,073 | |
| $ | 300,764 | |
| 22.1 | % |
|
|
|
|
|
|
|
| |||||||
Diluted earnings per share (GAAP) | $ | 2.70 | |
| $ | 2.08 | |
| $ | 0.62 | |
| 29.8 | % |
Impact of MEPP charge | - | |
| 0.06 | |
| (0.06 | ) |
| NM | | |||
Impact of restructuring costs (1) | 0.21 | |
| 0.29 | |
| (0.08 | ) |
| (27.6 | ) | |||
Impact of acquisition-related costs (2) | 0.20 | |
| 0.19 | |
| 0.01 | |
| 5.3 | | |||
Impact of loss on extinguishment of debt | 0.10 | |
| - | |
| 0.10 | |
| NM | | |||
Tax impact of MEPP charge (3) | - | |
| (0.02 | ) |
| 0.02 | |
| NM | | |||
Tax impact of restructuring costs (3) | (0.06 | ) |
| (0.09 | ) |
| 0.03 | |
| (33.3 | ) | |||
Tax impact of acquisition-related costs (3) | (0.05 | ) |
| (0.03 | ) |
| (0.02 | ) |
| 66.7 | | |||
Tax impact of loss on extinguishment of debt | (0.03 | ) |
| - | |
| (0.03 | ) |
| NM | | |||
Tax impact of U.S. Retirement Plan contribution | (0.08 | ) |
| - | |
| (0.08 | ) |
| NM | | |||
Impact of US transition tax | 0.15 | |
| - | |
| 0.15 | |
| NM | | |||
17
| 2018 |
| 2017 |
| Change in Dollars |
| % Change | |||||||
| (In thousands, except for share and per share data) | |||||||||||||
Impact of US balance sheet remeasurement from tax law change | (0.03 | ) |
| - | |
| (0.03 | ) |
| NM | | |||
Impact of France, U.K. and Sweden tax law changes | (0.02 | ) |
| - | |
| (0.02 | ) |
| NM | | |||
Impact of repatriation of certain international earnings (4) | 0.05 | |
| - | |
| 0.05 | |
| NM | | |||
Diluted EPS adjusted for Certain Items (Non-GAAP) (5) | $ | 3.14 | |
| $ | 2.48 | |
| $ | 0.66 | |
| 26.6 | % |
(1) | Fiscal 2018 includes business technology transformation initiative costs, restructuring expenses within our Brakes Group operations, professional fees on three-year financial objectives, severance charges related to restructuring, costs to convert to legacy systems in conjunction with our revised business technology strategy and facility closure charges. Fiscal 2017 includes $111 million in accelerated depreciation associated with our revised business technology strategy and $46 million related to restructuring expenses within our Brakes operations, costs to convert to legacy systems in conjunction with our revised business technology strategy, professional fees on 3-year financial objectives and severance charges. |
(2) | Fiscal 2018 and fiscal 2017 include $67 million and $76 million, respectively, related to intangible amortization expense from the Brakes Acquisition, which is included in the results of our Brakes Group operations, and $18 million and $24 million in integration costs, respectively. Fiscal 2018 includes a $14 million write-off for an intangible asset due to restructuring in France. |
(3) | The tax impact of adjustments for Certain Items are calculated by multiplying the pretax impact of each Certain Item by the statutory rates in effect for each jurisdiction where the Certain Item was incurred. The Brakes Acquisition also resulted in non-recurring tax expense in fiscal 2017, primarily from non-deductible transaction costs. |
(4) | Represents the expense from foreign withholding tax incurred obtained through the repatriation of certain international earnings, partially offset by tax credits. |
(5) | Individual components of diluted earnings per share may not add to the total presented due to rounding. Total diluted earnings per share is calculated using adjusted net earnings divided by diluted shares outstanding. |
NM represents that the percentage change is not meaningful.
| 2017 |
| 2016 |
| Change in Dollars |
| % Change | |||||||
| (In thousands, except for share and per share data) | |||||||||||||
Sales (GAAP) | $ | 55,371,139 | |
| $ | 50,366,919 | |
| $ | 5,004,220 | |
| 9.9 | % |
Impact of Brakes | (5,170,787 | ) |
| - | |
| (5,170,787 | ) |
| NM | | |||
Less 1 week fourth quarter sales | - | |
| (974,849 | ) |
| 974,849 | |
| NM | | |||
Comparable sales using a 52 weeks basis and exclu ding the impact of Brakes (Non-GAAP) | $ | 50,200,352 | |
| $ | 49,392,070 | |
| $ | 808,282 | |
| 1.6 | % |
|
|
|
|
|
|
|
| |||||||
Gross Profit (GAAP) | $ | 10,557,507 | |
| $ | 9,040,472 | |
| $ | 1,517,035 | |
| 16.8 | % |
Impact of Brakes | (1,333,852 | ) |
| - | |
| (1,333,852 | ) |
| NM | | |||
Less 1 week fourth quarter gross profit | - | |
| (178,774 | ) |
| 178,774 | |
| NM | | |||
Comparable gross profit using a 52 week basis and exclud ing the impact of Brakes (Non-GAAP) | $ | 9,223,655 | |
| $ | 8,861,698 | |
| $ | 361,957 | |
| 4.1 | % |
|
|
|
|
|
|
|
| |||||||
Gross margin (GAAP) | 19.1 | % |
| 17.9 | % |
|
|
| 112 bps | | ||||
Impact of Brakes | 0.7 | |
| - | |
|
|
| 69 bps | | ||||
Less 1 week fourth quarter sales | - | |
| - | |
|
|
| -1 bps | | ||||
Gross margin using a 52 week basis and excluding the impact of Brakes (Non-GAAP) | 18.4 | % |
| 17.9 | % |
|
|
| 43 bps | | ||||
|
|
|
|
|
|
|
| |||||||
Operating expenses (GAAP) | $ | 8,504,336 | |
| $ | 7,189,972 | |
| $ | 1,314,364 | |
| 18.3 | % |
Impact of MEPP charge | (35,600 | ) |
| - | |
| (35,600 | ) |
| NM | | |||
Impact of restructuring costs (1) | (161,011 | ) |
| (123,134 | ) |
| (37,877 | ) |
| 30.8 | | |||
Impact of acquisition-related costs (2) | (102,049 | ) |
| (35,614 | ) |
| (66,435 | ) |
| NM | | |||
Operating expenses adjusted for Certain Items (Non-GAAP) | $ | 8,205,676 | |
| $ | 7,031,224 | |
| $ | 1,174,452 | |
| 16.7 | % |
18
| 2017 |
| 2016 |
| Change in Dollars |
| % Change | |||||||
| (In thousands, except for share and per share data) | |||||||||||||
Impact of Brakes | $ | (1,282,800 | ) |
| $ | - | |
| $ | (1,282,800 | ) |
| NM | |
Impact of Brakes restructuring costs (3) | 13,732 | |
| - | |
| 13,732 | |
| NM | | |||
Impact of Brakes acquisition-related costs (2) | 78,273 | |
| - | |
| 78,273 | |
| NM | | |||
Less 1 week fourth quarter operating expens e | - | |
| (133,899 | ) |
| 133,899 | |
| NM | | |||
Operating expenses adjusted for Certain Items, extra week and excluding the impact of Brakes (Non-GAAP) | $ | 7,014,881 | |
| $ | 6,897,325 | |
| $ | 117,556 | |
| 1.7 | % |
|
|
|
|
|
|
|
| |||||||
Operating income (GAAP) | $ | 2,053,171 | |
| $ | 1,850,500 | |
| $ | 202,671 | |
| 11.0 | % |
Impact of MEPP charge | 35,600 | |
| - | |
| 35,600 | |
| NM | | |||
Impact of restructuring costs (1) | 161,011 | |
| 123,134 | |
| 37,877 | |
| 30.8 | | |||
Impact of acquisition-related costs (2) | 102,049 | |
| 35,614 | |
| 66,435 | |
| NM | | |||
Operating income adjusted for Certain Items (Non-GAAP) | $ | 2,351,831 | |
| $ | 2,009,248 | |
| $ | 342,583 | |
| 17.1 | % |
Impact of Brakes | (51,053 | ) |
| - | |
| (51,053 | ) |
| NM | | |||
Impact of Brakes restructuring costs (3) | (13,732 | ) |
| - | |
| (13,732 | ) |
| NM | | |||
Impact of Brakes acquisition-related costs (2) | (78,273 | ) |
| - | |
| (78,273 | ) |
| NM | | |||
Less 1 week fourth quarter operating income | - | |
| (44,876 | ) |
| 44,876 | |
| NM | | |||
Operating income adjusted for Certain Items, extra week and excluding the impact of Brakes (Non-GAAP) | $ | 2,208,773 | |
| $ | 1,964,372 | |
| $ | 244,401 | |
| 12.4 | % |
|
|
|
|
|
|
|
| |||||||
Operating margin (GAAP) | 3.71 | % |
| 3.67 | % |
| | |
| 4 bps | | |||
Operating margin excluding Certain Items (Non-GAAP) | 4.25 | % |
| 3.99 | % |
| | |
| 26 bps | | |||
Operating margin excluding Certain Items, extra w eek and Brakes (Non-GAAP) | 4.40 | % |
| 3.98 | % |
| | |
| 42 bps | | |||
|
|
|
|
|
|
|
| |||||||
Interest expense (GAAP) | $ | 302,878 | |
| $ | 306,146 | |
| $ | (3,268 | ) |
| (1.1 | )% |
Impact of acquisition financing costs (3) | - | |
| (123,990 | ) |
| 123,990 | |
| NM | | |||
Interest expense adjusted for Certain Items (Non-GAAP) | $ | 302,878 | |
| $ | 182,156 | |
| $ | 120,722 | |
| 66.3 | % |
Less 1 week fourth quarter other (income) expenses | - | |
| (3,975 | ) |
| 3,975 | |
| NM | | |||
Interest expenses adjusted for Certain Items and extra week (Non-GAAP) | $ | 302,878 | |
| $ | 178,181 | |
| $ | 124,697 | |
| 70.0 | % |
|
|
|
|
|
|
|
| |||||||
Other (income) expense (GAAP) | $ | (15,937 | ) |
| $ | 111,347 | |
| $ | (127,284 | ) |
| NM | |
Impact of foreign currency remeasurement and hedging | - | |
| (146,950 | ) |
| 146,950 | |
| NM | | |||
Other (income) expense adjusted for Certain Items (Non-GAAP) | $ | (15,937 | ) |
| $ | (35,603 | ) |
| $ | 19,666 | |
| (55.2 | )% |
Less 1 week fourth quarter other (income) expense | - | |
| 403 | |
| (403 | ) |
| NM | | |||
Other (income) expense adjusted for Certain Items, extra week and Brakes (N on-GAAP) | $ | (15,937 | ) |
| $ | (35,200 | ) |
| $ | 19,263 | |
| (54.7 | )% |
|
|
|
|
|
|
|
| |||||||
Net earnings (GAAP) | $ | 1,142,503 | |
| $ | 949,622 | |
| $ | 192,881 | |
| 20.3 | % |
Impact of MEPP charge | 35,600 | |
| - | |
| 35,600 | |
| NM | | |||
Impact of restructuring costs (1) | 161,011 | |
| 123,134 | |
| 37,877 | |
| 30.8 | | |||
Impact of acquisition-related costs (2) | 102,049 | |
| 35,614 | |
| 66,435 | |
| NM | | |||
Impact of acquisition financing costs | - | |
| 123,990 | |
| (123,990 | ) |
| NM | | |||
Impact of foreign currency remeasurement and hedging | - | |
| 146,950 | |
| (146,950 | ) |
| NM | | |||
Tax impact of MEPP charge | (11,903 | ) |
| - | |
| (11,903 | ) |
| NM | | |||
Tax impact of restructuring costs (5) | (51,184 | ) |
| (47,333 | ) |
| (3,851 | ) |
| 8.1 | | |||
Tax impact of acquisition-related costs (5) | (19,003 | ) |
| (13,690 | ) |
| (5,313 | ) |
| 38.8 | | |||
Tax impact of acquisition financing costs (5) | - | |
| (47,662 | ) |
| 47,662 | |
| NM | | |||
19
| 2017 |
| 2016 |
| Change in Dollars |
| % Change | |||||||
| (In thousands, except for share and per share data) | |||||||||||||
Tax impact of foreign currency remeasurement and hedging | - | |
| (56,488 | ) |
| 56,488 | |
| NM | | |||
Net earnings adjusted for Certain Items (Non-GAAP) | $ | 1,359,073 | |
| $ | 1,214,137 | |
| $ | 144,936 | |
| 11.9 | % |
Impact of Brakes | (46,988 | ) |
| - | |
| (46,988 | ) |
| NM | | |||
Impact of Brakes restructuring costs (3) | (11,794 | ) |
| - | |
| (11,794 | ) |
| NM | | |||
Impact of Brakes acquisition-related costs (2) | (67,221 | ) |
| - | |
| (67,221 | ) |
| NM | | |||
Impact of interest expense on debt issued for the Brakes acquisition (6) | 83,633 | |
| - | |
| 83,633 | |
| NM | | |||
Tax impact of interest expense on debt issued for the Brakes acquisition (5) | (33,880 | ) |
| - | |
| (33,880 | ) |
| NM | | |||
Less 1 week fourth quarter net earnings | - | |
| (26,119 | ) |
| 26,119 | |
| NM | | |||
Net earnings adjusted for Certain Items, extra week and Brakes (N on-GAAP) | $ | 1,282,823 | |
| $ | 1,188,018 | |
| $ | 94,805 | |
| 8.0 | % |
|
|
|
|
|
|
|
| |||||||
Diluted earnings per share (GAAP) (1) | $ | 2.08 | |
| $ | 1.64 | |
| $ | 0.44 | |
| 26.8 | % |
Impact of MEPP charge | 0.06 | |
| - | |
| 0.06 | |
| NM | | |||
Impact of restructuring costs (1) | 0.29 | |
| 0.21 | |
| 0.08 | |
| 38.1 | | |||
Impact of acquisition-related costs (2) | 0.19 | |
| 0.06 | |
| 0.13 | |
| NM | | |||
Impact of foreign currency remeasurement and hedging | - | |
| 0.25 | |
| (0.25 | ) |
| NM | | |||
Impact of acquisition financing costs (3) | - | |
| 0.21 | |
| (0.21 | ) |
| NM | | |||
Tax impact of MEPP charge | (0.02 | ) |
| - | |
| (0.02 | ) |
| NM | | |||
Tax impact of restructuring costs (5) | (0.09 | ) |
| (0.08 | ) |
| (0.01 | ) |
| 12.5 | | |||
Tax impact of acquisition-related costs (5) | (0.03 | ) |
| (0.02 | ) |
| (0.01 | ) |
| 50.0 | | |||
Tax impact of acquisition financing costs (5) | - | |
| (0.08 | ) |
| 0.08 | |
| NM | | |||
Tax impact of foreign currency remeasurement and hedging | - | |
| (0.10 | ) |
| 0.10 | |
| NM | | |||
Diluted EPS adjusted for Certain Items (Non-GAAP) (4) | $ | 2.48 | |
| $ | 2.10 | |
| $ | 0.38 | |
| 18.1 | % |
Impact of Brakes | (0.09 | ) |
| - | |
| (0.09 | ) |
| NM | | |||
Impact of Brakes restructuring costs (3) | (0.02 | ) |
| - | |
| (0.02 | ) |
| NM | | |||
Impact of Brakes acquisition-related costs (2) | (0.12 | ) |
| - | |
| (0.12 | ) |
| NM | | |||
Impact of interest expense on debt issued for the Brakes acquisition (6) | 0.15 | |
| - | |
| 0.15 | |
| NM | | |||
Tax impact of interest expense on debt issued for the Brakes acquisition (5) | (0.06 | ) |
| - | |
| (0.06 | ) |
| NM | | |||
Total impact of Brakes Certain Items | $ | (0.05 | ) |
| $ | - | |
| $ | (0.05 | ) |
| NM | |
Total Brakes accretion (Non-GAAP) | (0.14 | ) |
| - | |
| (0.14 | ) |
| NM | | |||
Less 1 week impact of fourth quarter diluted earnings per share | - | |
| (0.05 | ) |
| 0.05 | |
| NM | | |||
Diluted EPS adjusted for Certain Items, extra week and Brakes (Non-GAAP) (4) | $ | 2.34 | |
| $ | 2.06 | |
| $ | 0.29 | |
| 13.8 | % |
|
|
|
|
|
|
|
| |||||||
Diluted EPS adjusted for Certain Items (Non-GAAP) (4) | $ | 2.48 | |
| $ | 2.10 | |
| $ | 0.38 | |
| 18.1 | % |
Less 1 week impact of fourth quarter diluted earnings per share | - | |
| (0.05 | ) |
| 0.05 | |
| NM | | |||
Diluted EPS adjusted for Certain Items and extra week (Non-GAAP) (4) | $ | 2.48 | |
| $ | 2.06 | |
| $ | 0.42 | |
| 20.4 | % |
(1) | Fiscal 2017 includes $111 million in accelerated depreciation associated with our revised business technology strategy and $46 million related to professional fees on 3-year financial objectives, restructuring expenses within our Brakes Group operations, costs to convert to legacy systems in conjunction with our revised business technology strategy and severance charges related to restructuring. |
(2) | Fiscal 2017 includes $76 million related to intangible amortization expense from the Brakes Acquisition, which is included in the results of the Brakes Group and $24 million in integration costs. |
(3) | Includes Brakes Acquisition restructuring charges. |
20
(4) | Individual components of diluted earnings per share may not add to the total presented due to rounding. Total diluted earnings per share is calculated using adjusted net earnings divided by diluted shares outstanding. |
(5) | The tax impact of adjustments for Certain Items are calculated by multiplying the pretax impact of each Certain Item by the statutory rates in effect for each jurisdiction where the Certain Item was incurred. The adjustments also include $7 million in non-deductible transaction costs and $4 million in other one-time costs related to the Brakes Acquisition. |
(6) | Represents the expense from foreign withholding tax incurred obtained through the repatriation of certain international earnings, partially offset by tax credits. |
(7) | Sysco Corporation issued debt to fund the Acquisition. The interest expense arising from the debt issued is attributed to the incremental impact of Brakes operating results, even though it is not a direct obligation of the Brakes Group and is not considered a Certain Item. |
NM represents that the percentage change is not meaningful.
Set forth below is a reconciliation by segment of actual operating expenses and operating income to adjusted results for these measures for the periods presented:
U.S. FOODSERVICE OPERATIONS | 2018 |
| 2017 |
| Change in Dollars |
| %/bps Change | |||||||
Operating expenses (GAAP) | $ | 4,848,285 | |
| $ | 4,664,780 | |
| $ | 183,505 | |
| 3.9 | % |
Impact of MEPP charge | (1,700 | ) |
| (35,600 | ) |
| 33,900 | |
| (95.2 | ) | |||
Impact of restructuring costs | - | |
| (470 | ) |
| 470 | |
| NM | | |||
Operating expenses adjusted for Certain Items (Non-GAAP) | $ | 4,846,585 | |
| $ | 4,628,710 | |
| $ | 217,875 | |
| 4.7 | % |
|
|
|
|
|
|
|
| |||||||
Operating income (GAAP) | $ | 3,051,991 | |
| $ | 2,891,612 | |
| $ | 160,379 | |
| 5.5 | % |
Impact of MEPP charge | 1,700 | |
| 35,600 | |
| (33,900 | ) |
| (95.2 | ) | |||
Impact of restructuring costs | - | |
| 470 | |
| (470 | ) |
| NM | | |||
Operating income adjusted for Certain Items (Non-GAAP) | $ | 3,053,691 | |
| $ | 2,927,682 | |
| $ | 126,009 | |
| 4.3 | % |
|
|
|
|
|
|
|
| |||||||
INTERNATIONAL FOODSERVICE OPERATIONS |
|
|
|
|
|
|
| |||||||
Operating expenses (GAAP) | $ | 2,243,728 | |
| $ | 2,032,703 | |
| $ | 211,025 | |
| 10.4 | % |
Impact of restructuring costs (1) | (36,667 | ) |
| (25,080 | ) |
| (11,587 | ) |
| 46.2 | | |||
Impact of acquisition-related costs (2) | (90,004 | ) |
| (78,273 | ) |
| (11,731 | ) |
| 15.0 | | |||
Operating expenses adjusted for Certain Items (Non-GAAP) | $ | 2,117,057 | |
| $ | 1,929,350 | |
| $ | 187,707 | |
| 9.7 | % |
|
|
|
|
|
|
|
| |||||||
Operating income (GAAP) | $ | 193,240 | |
| $ | 243,116 | |
| $ | (49,876 | ) |
| (20.5 | )% |
Impact of restructuring costs (1) | 36,667 | |
| 25,080 | |
| 11,587 | |
| 46.2 | | |||
Impact of acquisition related costs (2) | 90,004 | |
| 78,273 | |
| 11,731 | |
| 15.0 | | |||
Operating income adjusted for Certain Items (Non-GAAP) | $ | 319,911 | |
| $ | 346,469 | |
| $ | (26,558 | ) |
| (7.7 | )% |
|
|
|
|
|
|
|
| |||||||
CORPORATE |
|
|
|
|
|
|
| |||||||
Operating expenses (GAAP) | $ | 953,566 | |
| $ | 1,127,807 | |
| $ | (174,241 | ) |
| (15.4 | )% |
Impact of restructuring costs (3) | (72,857 | ) |
| (135,461 | ) |
| 62,604 | |
| (46.2 | ) | |||
Impact of acquisition-related costs (4) | (18,132 | ) |
| (23,776 | ) |
| 5,644 | |
| (23.7 | ) | |||
Operating expenses adjusted for Certain Items (Non-GAAP) | $ | 862,577 | |
| $ | 968,570 | |
| $ | (105,993 | ) |
| (10.9 | )% |
|
|
|
|
|
|
|
| |||||||
Operating income (GAAP) | $ | (980,060 | ) |
| $ | (1,135,074 | ) |
| $ | 155,014 | |
| (13.7 | )% |
Impact of restructuring costs (3) | 72,857 | |
| 135,461 | |
| (62,604 | ) |
| (46.2 | ) | |||
Impact of acquisition-related costs (4) | 18,132 | |
| 23,776 | |
| (5,644 | ) |
| (23.7 | ) | |||
Operating income adjusted for Certain Items (Non-GAAP) | $ | (889,071 | ) |
| $ | (975,837 | ) |
| $ | 86,766 | |
| (8.9 | )% |
(1) | Includes Brakes Acquisition-related restructuring charges, facility closure charges and other severance charges related to restructuring. |
21
(2) | Fiscal 2018 and fiscal 2017 include $67 million and $76 million , respectively, related to intangible amortization expense from the Brakes Acquisition, which is included in the results of the Brakes Group. Fiscal 2018 includes a $14 million write-off for an intangible asset due to restructuring in France. |
(3) | Fiscal 2018 includes business technology transformation initiative costs, professional fees on three-year financial objectives, severance charges related to restructuring, costs to convert to legacy systems in conjunction with our revised business technology strategy and facility closure charges. Fiscal 2017 includes $111 million in accelerated depreciation associated with our revised business technology strategy and $46 million related to restructuring expenses within our Brakes Group operations, costs to convert to legacy systems in conjunction with our revised business technology strategy, professional fees on 3-year financial objectives and severance charges. |
(4) | Fiscal 2018 and fiscal 2017 include $18 million and $24 million , respectively, related to integration costs from the Brakes Acquisition. |
NM represents that the percentage change is not meaningful.
U.S. FOODSERVICE OPERATIONS | 2017 |
| 2016 |
| Change in Dollars |
| %/bps Change | |||||||
Sales | $ | 37,604,698 | |
| $ | 37,776,443 | |
| $ | (171,745 | ) |
| (0.5 | )% |
Less 1 week fourth quarter sales | - | |
| (728,270 | ) |
| 728,270 | |
| NM | | |||
Comparable sales using a 52 week basis (Non-GAAP) | $ | 37,604,698 | |
| $ | 37,048,173 | |
| $ | 556,525 | |
| 1.5 | % |
|
|
|
|
|
|
|
| |||||||
Gross Profit | $ | 7,556,392 | |
| $ | 7,413,436 | |
| $ | 142,956 | |
| 1.9 | % |
Less 1 week fourth quarter sales | - | |
| (146,744 | ) |
| 146,744 | |
| NM | | |||
Comparable gross profit using a 52 week basis (Non-GAAP) | $ | 7,556,392 | |
| $ | 7,266,692 | |
| $ | 289,700 | |
| 4.0 | % |
|
|
|
|
|
|
|
| |||||||
Gross Margin | 20.09 | % |
| 19.62 | % |
|
|
| 47 bps | | ||||
Less 1 week fourth quarter sales | - | |
| 0.01 | |
|
|
| NM | | ||||
Comparable gross margin using a 52 week basis (Non-GAAP) | 20.09 | % |
| 19.61 | % |
|
|
| 48 bps | | ||||
|
|
|
|
|
|
|
| |||||||
Operating expenses (GAAP) | $ | 4,664,780 | |
| $ | 4,641,504 | |
| $ | 23,276 | |
| 0.5 | % |
Impact of MEPP charge | (35,600 | ) |
| - | |
| (35,600 | ) |
| NM | | |||
Impact of restructuring costs | (470 | ) |
| (3,351 | ) |
| 2,881 | |
| (86.0 | ) | |||
Operating expenses adjusted for Certain Items (Non-GAAP) | $ | 4,628,710 | |
| $ | 4,638,153 | |
| $ | (9,443 | ) |
| (0.2 | )% |
Less 1 week fourth quarter operating expenses | - | |
| (88,323 | ) |
| 88,323 | |
| NM | | |||
Operating expenses adjusted for extra week (Non-GAAP) | $ | 4,628,710 | |
| $ | 4,549,830 | |
| $ | 78,880 | |
| 1.7 | % |
|
|
|
|
|
|
|
| |||||||
Operating income (GAAP) | $ | 2,891,612 | |
| $ | 2,771,932 | |
| $ | 119,680 | |
| 4.3 | % |
Impact of MEPP charge | 35,600 | |
| - | |
| 35,600 | |
| NM | | |||
Impact of restructuring costs | 470 | |
| 3,351 | |
| (2,881 | ) |
| (86.0 | ) | |||
Operating income adjusted for Certain Items (Non-GAAP) | $ | 2,927,682 | |
| $ | 2,775,283 | |
| $ | 152,399 | |
| 5.5 | % |
Less 1 week fourth quarter operating income | - | |
| (58,421 | ) |
| 58,421 | |
| NM | | |||
Operating income adjusted for extra week (Non-GAAP) | $ | 2,927,682 | |
| $ | 2,716,862 | |
| $ | 210,820 | |
| 7.8 | % |
|
|
|
|
|
|
|
| |||||||
INTERNATIONAL FOODSERVICE OPERATIONS |
|
|
|
|
|
|
| |||||||
Sales | $ | 10,613,059 | |
| $ | 5,436,209 | |
| $ | 5,176,850 | |
| 95.2 | % |
Impact of Brakes | (5,170,787 | ) |
| - | |
| (5,170,787 | ) |
| NM | | |||
Less 1 week fourth quarter sales | - | |
| (108,097 | ) |
| 108,097 | |
| NM | | |||
Comparable sales using a 52 week basis (Non-GAAP) | $ | 5,442,272 | |
| $ | 5,328,112 | |
| $ | 114,160 | |
| 2.1 | % |
|
|
|
|
|
|
|
| |||||||
Gross Profit | $ | 2,275,819 | |
| $ | 938,942 | |
| $ | 1,336,877 | |
| NM | |
Impact of Brakes | (1,333,852 | ) |
| - | |
| (1,333,852 | ) |
| NM | | |||
Less 1 week fourth quarter sales | - | |
| (18,686 | ) |
| 18,686 | |
| NM | | |||
Comparable gross profit using a 52 week basis (Non-GAAP) | $ | 941,967 | |
| $ | 920,256 | |
| $ | 21,711 | |
| 2.4 | % |
22
|
|
|
|
|
|
|
| |||||||
Gross Margin | 21.44 | % |
| 17.27 | % |
|
|
| 417 bps | | ||||
Impact of Brakes | 4.14 | |
| - | |
|
|
| NM | | ||||
Less 1 week fourth quarter sales | - | |
| - | |
|
|
| NM | | ||||
Comparable gross margin using a 52 week basis (Non-GAAP) | 17.30 | % |
| 17.27 | % |
|
|
| 3 bps | | ||||
|
|
|
|
|
|
|
| |||||||
Operating expenses (GAAP) | $ | 2,032,703 | |
| $ | 761,783 | |
| $ | 1,270,920 | |
| NM | |
Impact of restructuring costs (1) | (25,080 | ) |
| (8,945 | ) |
| (16,135 | ) |
| NM | | |||
Impact of acquisition-related costs (2) | (78,273 | ) |
| - | |
| (78,273 | ) |
| NM | | |||
Operating expenses adjusted for Certain Items (Non-GAAP) | $ | 1,929,350 | |
| $ | 752,838 | |
| $ | 1,176,512 | |
| NM | |
Impact of Brakes | (1,282,800 | ) |
| - | |
| (1,282,800 | ) |
| NM | | |||
Impact of Brakes restructuring costs | 13,732 | |
| - | |
| 13,732 | |
| NM | | |||
Impact of Brakes acquisition-related costs | 78,273 | |
| - | |
| 78,273 | |
| NM | | |||
Less 1 week fourth quarter operating expenses | - | |
| (14,628 | ) |
| 14,628 | |
| NM | | |||
Operating expenses adjusted for extra week (Non-GAAP) | $ | 738,555 | |
| $ | 738,210 | |
| $ | 345 | |
| - | % |
|
|
|
|
|
|
|
| |||||||
Operating income (GAAP) | $ | 243,116 | |
| $ | 177,159 | |
| $ | 65,957 | |
| 37.2 | % |
Impact of restructuring costs (1) | 25,080 | |
| 8,945 | |
| 16,135 | |
| NM | | |||
Impact of acquisition related costs (2) | 78,273 | |
| - | |
| 78,273 | |
| NM | | |||
Operating income adjusted for Certain Items (Non-GAAP) | $ | 346,469 | |
| $ | 186,104 | |
| $ | 160,365 | |
| 86.2 | % |
Impact of Brakes | (51,053 | ) |
| - | |
| (51,053 | ) |
| NM | | |||
Impact of Brakes restructuring costs | (13,732 | ) |
| - | |
| (13,732 | ) |
| NM | | |||
Impact of Brakes acquisition-related costs | (78,273 | ) |
| - | |
| (78,273 | ) |
| NM | | |||
Less 1 week fourth quarter operating income | - | |
| (4,058 | ) |
| 4,058 | |
| NM | | |||
Operating income adjusted for extra week (Non-GAAP) | $ | 203,411 | |
| $ | 182,046 | |
| $ | 21,365 | |
| 11.7 | % |
(1) | Fiscal 2017 includes Brakes Acquisition-related restructuring charges and other severance charges related to restructuring. |
(2) | Fiscal 2017 includes $76 million related to intangible amortization expense from the Brakes Acquisition, which is included in the results of the Brakes Group. |
NM represents that the percentage change is not meaningful.
23
Three-Year Financial Targets
Sysco management considers adjusted ROIC to be a measure that provides useful information to management and investors in evaluating the efficiency and effectiveness of the company's long-term capital investments. We calculate ROIC as net earnings divided by (i) stockholder's equity at the beginning of the year and at the end of each fiscal quarter during the year, excluding the impact of foreign currency translation adjustments; and (ii) long-term debt, computed as the average of the long-term debt at the beginning of the year and at the end of each fiscal quarter during the year. All components of our adjusted ROIC calculation would be impacted by Certain Items. As a result, we calculate adjusted ROIC as adjusted net earnings divided by (i) stockholders' equity, computed as the average of adjusted stockholders' equity at the beginning of the year and at the end of each fiscal quarter during the year; and (ii) long-term debt, computed as the average of the long-term debt at the beginning of the year and at the end of each fiscal quarter during the year. With respect to the adjusted return on invested capital targets, our invested capital is adjusted for the accumulation of debt incurred for the Brakes Acquisition that would not have been borrowed absent this acquisition.
| 2018 | ||
Net earnings (GAAP) | $ | 1,430,766 | |
Impact of Certain Items on net earnings | 229,071 | | |
Adjusted net earnings (Non-GAAP) | $ | 1,659,837 | |
Impact of Brakes | 6,544 | | |
Adjusted net earnings excluding Brakes (Non-GAAP) | $ | 1,653,293 | |
|
| ||
Invested Capital (GAAP) | $ | 11,042,773 | |
Adjustments to invested capital (1) | 275,125 | | |
Adjusted Invested capital (Non-GAAP) | $ | 11,317,898 | |
Impact of Brakes | 3,115,912 | | |
Adjusted invested capital excluding Brakes | $ | 8,201,986 | |
|
| ||
Return on invested capital (GAAP) | 13.0 | % | |
Return on invested capital (Non-GAAP) | 14.7 | % | |
Return on invested capital excluding Brakes (Non-GAAP) | 20.2 | % | |
(1) Shareholders' equity adjustments include the impact of Certain Items from earnings and removal of foreign currency adjustments that arose in the fiscal year.
In addition, we have targets and expectations under our new three-year plan that are based on adjusted results, including an adjusted ROIC target of 16% . We cannot predict with certainty when we will achieve these results or whether the calculation of our ROIC in such future period will be on an adjusted basis due to the effect of Certain Items, which would be excluded from such calculation. Due to these uncertainties, to the extent our future calculation of ROIC is on an adjusted basis excluding Certain Items, we cannot provide a quantitative reconciliation of this non-GAAP measure to the most directly comparable GAAP measure without unreasonable effort. However, we would expect to calculate adjusted ROIC, if applicable, in the same manner as we have calculated this historically.
24
We have completed the final year of our initial three-year plan that was established in fiscal 2016 and have measured our operating income performance against our targets on an adjusted basis. The following reconciles gross profit, operating expenses and operating income cumulative growth from an adjusted to a GAAP basis.
| Year Ended |
|
|
|
| |||||||||
| June 30, 2018 |
| June 27, 2015 |
| 3-year Plan Change $ Results |
| CAGR | |||||||
Sales (GAAP) | $ | 58,727,324 | |
| $ | 48,680,752 | |
| $ | 10,046,572 | |
|
| |
Impact of Brakes | (5,612,400 | ) |
| - | |
| (5,612,400 | ) |
|
| ||||
Sales excluding the impact of Brakes (Non-GAAP) | $ | 53,114,924 | |
| $ | 48,680,752 | |
| $ | 4,434,172 | |
|
| |
|
|
|
|
|
|
|
| |||||||
Gross profit (GAAP) | $ | 11,085,391 | |
| $ | 8,551,516 | |
| $ | 2,533,875 | |
| 9.0 | % |
Impact of Brakes | (1,405,748 | ) |
| - | |
| (1,405,748 | ) |
|
| ||||
Gross profit excluding the impact of Brakes (Non-GAAP) | $ | 9,679,643 | |
| $ | 8,551,516 | |
| $ | 1,128,127 | |
| 4.2 | % |
|
|
|
|
|
|
|
| |||||||
Gross margin (GAAP) | 18.88 | % |
| 17.57 | % |
| 131 bps | |
|
| ||||
Impact of Brakes | 0.65 | |
| - | |
| 65 bps | |
|
| ||||
Gross margin excluding the impact of Brakes (Non-GAAP) | 18.23 | % |
| 17.57 | % |
| 66 bps | |
|
| ||||
|
|
|
|
|
|
|
| |||||||
Operating expenses (GAAP) | $ | 8,756,417 | |
| $ | 7,322,154 | |
| $ | 1,434,263 | |
| 6.1 | % |
MEPP Charge | (1,700 | ) |
| - | |
| (1,700 | ) |
|
| ||||
Impact of restructuring costs (1) | (109,524 | ) |
| (7,801 | ) |
| (101,723 | ) |
|
| ||||
Impact of acquisition-related costs (2) | (108,136 | ) |
| (554,667 | ) |
| 446,531 | |
|
| ||||
Operating expenses adjusted for Certain Items (Non-GAAP) | $ | 8,537,057 | |
| $ | 6,759,686 | |
| $ | 1,777,371 | |
|
| |
Impact of Brakes | (1,427,732 | ) |
| - | |
| (1,427,732 | ) |
|
| ||||
Impact of Brakes restructuring costs (3) | 23,346 | |
| - | |
| 23,346 | |
|
| ||||
Impact of Brakes acquisition-related costs (2) | 90,004 | |
| - | |
| 90,004 | |
|
| ||||
Operating expenses adjusted for Certain Items and excluding the impact of Brakes (Non-GAAP) | $ | 7,222,675 | |
| $ | 6,759,686 | |
| $ | 462,989 | |
| 2.2 | % |
|
|
|
|
|
|
|
| |||||||
Operating leverage (GAAP) (4) |
|
|
|
|
|
| 2.9 | % | ||||||
Operating leverage adjusted for Certain Items and excluding the impact of Brakes (Non-GAAP ) (4) |
|
|
|
|
|
| 2.0 | % | ||||||
|
|
|
|
|
|
|
| |||||||
Operating income (GAAP) | $ | 2,328,974 | |
| $ | 1,229,362 | |
| $ | 1,099,612 | |
| 23.7 | % |
MEPP Charge | 1,700 | |
| - | |
| 1,700 | |
|
| ||||
Impact of restructuring costs (1) | 109,524 | |
| 7,801 | |
| 101,723 | |
|
| ||||
Impact of acquisition-related costs (2) | 108,136 | |
| 554,667 | |
| (446,531 | ) |
|
| ||||
Operating income adjusted for Certain Items (Non-GAAP) | $ | 2,548,334 | |
| $ | 1,791,830 | |
| $ | 756,504 | |
|
| |
Impact of Brakes | 21,985 | |
| - | |
| 21,985 | |
|
| ||||
Impact of Brakes restructuring costs (3) | (23,346 | ) |
| - | |
| (23,346 | ) |
|
| ||||
Impact of Brakes acquisition-related costs (2) | (90,004 | ) |
| - | |
| (90,004 | ) |
|
| ||||
Operating income adjusted for Certain Items and excluding the impact of Brakes (Non-GAAP) | $ | 2,456,969 | |
| $ | 1,791,830 | |
| $ | 665,139 | |
| 11.1 | % |
(1) | Fiscal 2018 includes business technology transformation initiative costs, restructuring expenses within our Brakes operations, professional fees on three-year financial objectives, severance charges related to restructuring, costs to convert to legacy systems in conjunction with our revised business technology strategy and facility closure charges. Fiscal 2015 includes US Foods merger and integration planning costs. |
(2) | Fiscal 2018 includes $67 million related to intangible amortization expense from the Brakes acquisition, which is included in the results of the Brakes Group and $18 million in integration costs. Fiscal 2018 includes a $14.0 million write-off for an intangible asset due to restructuring in France. Fiscal 2015 includes US Foods merger integration and termination costs. |
(3) | Includes Brakes Acquisition restructuring charges. |
(4) | Operating leverage is calculated as the difference between gross profit growth and operating expense growth. |
25
Due to uncertainties in projecting Certain Items during the period covered under our new three-year strategic plan, we cannot provide a quantitative reconciliation of these non-GAAP measures to the most directly comparable GAAP measures without unreasonable effort. However, we would expect to calculate these adjusted results in the same manner as the reconciliations provided for the historical periods that are presented herein. The impact of future Certain Items could cause projected non-GAAP amounts to differ significantly from our GAAP results.
Liquidity and Capital Resources
Highlights
Comparisons of the cash flows from fiscal 2018 to fiscal 2017 :
• | Cash flows from operations were $2.2 billion in fiscal 2018 and fiscal 2017 ; |
• | Net capital expenditures totaled $665.6 million in fiscal 2018 compared to $662.7 million in fiscal 2017 ; |
• | Free cash flow was $1.5 billion in fiscal 2018 compared to $1.6 billion in fiscal 2017 (see "Non-GAAP reconciliation" below under the heading "Free Cash Flow"); |
• | Cash used for acquisition of businesses was $248.1 million in fiscal 2018 compared to $2.9 billion in fiscal 2017 ; |
• | Dividends paid were $722.2 million in fiscal 2018 compared to $698.6 million in fiscal 2017 ; and |
• | We repurchased $978.9 million of shares in fiscal 2018 compared to $1.9 billion in fiscal 2017 . |
In addition, for our senior notes:
• | We issued an aggregate of $1.0 billion and $750.0 million in new senior notes in fiscal 2018 and 2017 , respectively; and |
• | We repaid senior notes in the amount of $500.0 million and redeemed senior notes and debentures in the amount of $230.5 million in fiscal 2018 , using cash on hand, proceeds from borrowings under our commercial paper program and a portion of net proceeds from our senior notes offering. |
Sources and Uses of Cash
Sysco's strategic objectives include continuous investment in our business; these investments are funded by a combination of cash from operations and access to capital from financial markets. Our operations historically have produced significant cash flow. Cash generated from operations is generally allocated to:
• | working capital requirements; |
• | investments in facilities, systems, fleet, other equipment and technology; |
• | cash dividends; |
• | acquisitions compatible with our overall growth strategy; |
• | contributions to our various retirement plans; and |
• | debt repayments and share repurchases. |
Any remaining cash generated from operations may be invested in high-quality, short-term instruments. As a part of our ongoing strategic analysis, we regularly evaluate business opportunities, including potential acquisitions and sales of assets and businesses, and our overall capital structure. Any transactions resulting from these evaluations may materially impact our liquidity, borrowing capacity, leverage ratios and capital availability.
We continue to generate substantial cash flows from operations and remain in a strong financial position; however, our liquidity and capital resources can be influenced by economic trends and conditions that impact our results of operations. We believe our mechanisms to manage working capital, such as credit monitoring, optimizing inventory levels and maximizing payment terms with vendors, and our mechanisms to manage the items impacting our gross profits have been sufficient to limit a significant unfavorable impact on our cash flows from operations. We believe these mechanisms will continue to prevent a significant unfavorable impact on our cash flows from operations. Seasonal trends also impact our cash flows from operations and free cash
26
flow, as we use more cash earlier in the fiscal year and then see larger, sequential quarterly increases throughout the remainder of the year.
As of June 30, 2018 , we had $552.3 million in cash and cash equivalents, approximately 68.0% of which was held by our international subsidiaries generated from our earnings of international operations. If these earnings were transferred among countries or repatriated to the U.S., such amounts may be subject to withholding and additional foreign tax obligations. Additionally, Sysco Corporation has provided intercompany loans to certain of its international subsidiaries, and when interest and principal payments are made, some of this cash will move to the U.S.
Upon the enactment of the Tax Act, Sysco's undistributed foreign income of certain consolidated foreign subsidiaries of approximately $1.4 billion became subject to U.S. transition tax. As a result, in the fourth quarter, the company repatriated $1.0 billion of foreign earnings of certain non-U.S. subsidiaries and recognized foreign income and non-income based taxes of $50.2 million .
In December 2017, Sysco established a wholly owned captive insurance subsidiary (the Captive). The primary purpose of the Captive is to enhance Sysco's risk financing strategies by providing Sysco the opportunity to negotiate insurance premiums in the non-retail insurance market. The Captive must maintain a sufficient level of cash to fund future reserve payments. As of June 30, 2018 , we had $163.5 million of restricted cash and restricted cash equivalents primarily held by the Captive in a cash deposit account in order to meet solvency requirements.
We believe the following sources will be sufficient to meet our anticipated cash requirements for the next twelve months, while maintaining sufficient liquidity for normal operating purposes:
• | our cash flows from operations; |
• | the availability of additional capital under our existing commercial paper programs, supported by our revolving credit facility and bank line of credit; and |
• | our ability to access capital from financial markets, including issuances of debt securities, either privately or under our shelf registration statement filed with the Securities and Exchange Commission (SEC). |
Due to our strong financial position, we believe that we will continue to be able to effectively access the commercial paper market and long-term capital markets, if necessary.
Cash Flows
Operating Activities
Fiscal 2018 vs. Fiscal 2017
We generated $2.2 billion in cash flows from operations in fiscal 2018 and in fiscal 2017 . These comparable amounts include year-over-year unfavorable comparisons on other long term liabilities and decreased working capital, offset by favorable comparisons on accrued income taxes and higher operating results. The cash impact of our Certain Items increased $51.8 million year-over-year. The cash impact of Certain Items will differ from the earnings impact of Certain Items, as the payments for these items may occur in a different period from the period in which the Certain Item charges were recognized in the Statement of Consolidated Results of Operations.
Included in the change in other long-term liabilities was a negative comparison, primarily from pension contributions. Pension contributions were $415.0 million in fiscal 2018 , including $380.0 million in contributions to our U.S. Retirement Plan in fiscal 2018 , which resulted in a decrease to other long-term liabilities. Pension contributions were $57.6 million in fiscal 2017 , including a $25 million contribution to our U.S. Retirement Plan, which resulted in a decrease to other long-term liabilities. The level and timing of any contribution to our U.S. Retirement Plan in fiscal 2019 is still being determined.
Changes in working capital, specifically accounts receivable and accounts payable, had a negative impact of $279.9 million on the period over period comparison of cash flow from operations. There was an unfavorable comparison on accounts payable and accounts receivable, which was partially offset by favorable comparisons on inventory. Sales growth impacted all components of working capital; however, deflation contributed to lower levels of increase in fiscal 2018 as compared to fiscal 2017 .
27
Our tax payments in fiscal 2018 were lower than in fiscal 2017 due to the impacts of the Tax Act, primarily due to the reduction of the U.S. federal corporate tax rate from 35% to 21% and the full expensing of qualified capital expenditures. In addition, cash taxes for fiscal 2018 were reduced due to the tax benefits derived from our $380.0 million in contributions to our U.S. Retirement Plan. Additionally, Sysco's fourth quarter U.S. estimated federal tax payment for fiscal 2017 was deferred to the second quarter of fiscal 2018 due to a disaster area designation for companies located in the Houston area, the location of our corporate headquarters. We made tax payments of approximately $268.4 million in fiscal 2018 . We expect future tax payments to grow with our earnings.
Fiscal 2017 vs. Fiscal 2016
We generated $2.2 billion in cash flows from operations in fiscal 2017 compared to cash flow generation of $2.0 billion in fiscal 2016 . This increase of $251.0 million year-over-year was largely attributable to higher operating results, improved working capital management and a favorable comparison on accrued expenses and other long-term liabilities. These were partially offset by an unfavorable comparison on accrued income taxes and deferred income taxes. The cash impact of our Certain Items increased $193.9 million year-over-year. The cash impact of Certain Items will differ from the earnings impact of Certain Items, as the payments for these items may occur in a different period from the period in which the Certain Item charges were recognized in the Statement of Consolidated Results of Operations.
Included in the change in other long-term liabilities was a positive comparison primarily from pension contributions. Pension contributions were $57.6 million in fiscal 2017 , including a $25.0 million contribution to our U.S. Retirement Plan in fiscal 2017 , which resulted in a decrease to other long-term liabilities. Pension contributions were $157.5 million in fiscal 2016 , including a $130.0 million contribution to the U.S. Retirement Plan in fiscal 2016 , which resulted in a decrease to other long-term liabilities.
Changes in working capital, specifically accounts receivable and accounts payable, had a positive impact of $166.1 million on the period over period comparison of cash flow from operations, primarily from improvements in accounts payable management. This was partially offset by inventory. Sales growth impacted all components of working capital; however, deflation contributed to lower levels of increase in fiscal 2017 as compared to fiscal 2016 .
The positive comparison on accrued expenses was primarily due to $312.5 million in US Foods merger termination fees that were paid in fiscal 2016 , partially offset by a $39.4 million decrease from incentive payments. Our annual incentive payments, for performance in the prior fiscal year, are paid in the first quarter of each succeeding fiscal year. Incentive payments paid in fiscal 2017 were higher than amounts paid in fiscal 2016 due to larger payouts achieved from fiscal 2016 performance.
Our tax payments in fiscal 2016 were lower than in fiscal 2017 due to changes in tax elections allowing us to accelerate tax deductions from method changes which, in turn, significantly reduced our estimated payments in fiscal 2016 by delaying the timing of these payments to future periods. Additionally, Sysco's fourth quarter U.S. estimated federal tax payment for fiscal 2016 was deferred to the second quarter of fiscal 2017 due to a disaster area designation for companies located in the Houston area, the location of our corporate headquarters. We made tax payments of approximately $761.4 million in fiscal 2017 , including an approximate $120 million for the deferred tax payment from the fourth quarter of fiscal 2016 .
Investing Activities
Fiscal 2018 capital expenditures included:
• | fleet replacements; |
• | buildings and building improvements; |
• | investments in technology; and |
• | warehouse equipment. |
Fiscal 2017 capital expenditures included:
• | fleet replacements; |
• | investments in technology; |
• | replacement or significant expansion of facilities in Costa Rica, Georgia, Missouri, Maryland, and Texas; and |
• | warehouse equipment. |
Fiscal 2016 capital expenditures included:
28
• | fleet replacements; |
• | investments in technology; |
• | replacement or significant expansion of facilities in California, Maryland, Texas, and Virginia; and |
• | construction of fold-out facilities in Ireland and Texas. |
The level of capital expenditures in fiscal 2018 increased $1.4 million as compared to fiscal 2017 . Capital expenditures in fiscal 2017 increased by $159.0 million .
We estimate our capital expenditures, net of proceeds from sales of assets, in fiscal 2019 to be approximately 1.2% to 1.3% of fiscal sales. Fiscal 2019 expenditures will include facility, fleet and other equipment replacements and expansions; new facility construction; and investments in technology.
During fiscal 2018 , the company paid cash of $248.1 million for acquisitions, net of cash acquired, including HFM Foodservice and Doerle Food Services within U.S. Foodservice operations, and Kent Frozen Foods, Eko Fågel, Fisk & Mittemellan and the remaining 50% interest in our joint venture in Costa Rica within our International Foodservice operations.
During fiscal 2017 , the company paid cash of $2.9 billion for acquisitions, net of cash acquired, including the Brakes Group and also acquired a small produce company in Sweden.
During fiscal 2016 , the company paid cash of $219.2 million for acquisitions including a leading luxury personal care amenity provider in the hospitality industry, a distributor of high-quality fresh and frozen seafood based in Florida and an innovative e-commerce platform providing restaurant supplies and equipment exclusively to Sysco customers. During fiscal 2016 , we paid $103.5 million and received $57.5 million for options to hedge against the impact of foreign currency fluctuations on the purchase price of the Brakes Acquisition.
Free Cash Flow
Free cash flow represents net cash provided from operating activities, less purchases of plant and equipment, plus proceeds from sales of plant and equipment. Sysco considers free cash flow to be a non-GAAP liquidity measure that provides useful information to management and investors about the amount of cash generated by the business after the purchases and sales of buildings, fleet, equipment and technology, which may potentially be used to pay for, among other things, strategic uses of cash, including dividend payments, share repurchases and acquisitions. However, free cash flow may not be available for discretionary expenditures, as it may be necessary that we use it to make mandatory debt service or other payments. As a result of our contributions to our U.S. Retirement Plan, free cash flow for fiscal 2018 decreased 5.3% , or $83.6 million , to $1.5 billion , as compared to fiscal 2017 . Our cash requirements for our Certain Items were $51.8 million higher in fiscal 2018 than in fiscal 2017 . As a result of increased cash provided by operating activities, free cash flow for fiscal 2017 increased 6.2% , or $92.2 million , to $1.6 billion , as compared to fiscal 2016 .
29
Free cash flow should not be used as a substitute for the most comparable GAAP measure in assessing the company's liquidity for the periods presented. An analysis of any non-GAAP financial measure should be used in conjunction with results presented in accordance with GAAP. In the table that follows, free cash flow for each period presented is reconciled to net cash provided by operating activities.
| 2018 |
| 2017 |
| Change in Dollars |
| % Change | |||||||
| (In thousands) | |||||||||||||
Net cash provided by operating activities (GAAP) | $ | 2,158,632 | |
| $ | 2,239,354 | |
| $ | (80,722 | ) |
| (3.6 | )% |
Additions to plant and equipment | (687,815 | ) |
| (686,378 | ) |
| (1,437 | ) |
| 0.2 | | |||
Proceeds from sales of plant and equipment | 22,255 | |
| 23,715 | |
| (1,460 | ) |
| (6.2 | ) | |||
Free Cash Flow (Non-GAAP) | $ | 1,493,072 | |
| $ | 1,576,691 | |
| $ | (83,619 | ) |
| (5.3 | )% |
| 2017 |
| 2016 |
| Change in Dollars |
| % Change | |||||||
| (In thousands) | |||||||||||||
Net cash provided by operating activities (GAAP) | $ | 2,239,354 | |
| $ | 1,988,347 | |
| $ | 251,007 | |
| 12.6 | % |
Additions to plant and equipment | (686,378 | ) |
| (527,346 | ) |
| (159,032 | ) |
| 30.2 | | |||
Proceeds from sales of plant and equipment | 23,715 | |
| 23,511 | |
| 204 | |
| 0.9 | | |||
Free Cash Flow (Non-GAAP) | $ | 1,576,691 | |
| $ | 1,484,512 | |
| $ | 92,179 | |
| 6.2 | % |
Financing Activities
Equity Transactions
Proceeds from exercises of share-based compensation awards were $268.8 million in fiscal 2018 , $204.8 million in fiscal 2017 and $282.5 million in fiscal 2016 . The level of option exercises, and thus proceeds, will vary from period to period and is largely dependent on movements in our stock price and the time remaining before option grants expire.
We routinely engage in share repurchase programs. The number of shares acquired and their cost during fiscal 2018 were 17,930,114 shares for $978.9 million , with 35,744,589 shares repurchased in fiscal 2017 for $1.9 billion , and 44,716,180 shares repurchased in fiscal 2016 for $1.9 billion . In February 2017, our Board of Directors approved a repurchase program authorizing the repurchase of shares of the company's common stock not to exceed $1.0 billion through the end of fiscal 2019. In November 2017, our Board of Directors approved a separate repurchase program to authorize the repurchase of the company's common stock not to exceed $1.5 billion through the end of fiscal 2020. All share repurchases in fiscal 2018 were made under the February 2017 authorization. We repurchased approximately 1,344,000 additional shares for $93.6 million through August 10, 2018 . These repurchase programs are intended to allow Sysco to continue offsetting dilution resulting from shares issued under the company's benefit plans and to make opportunistic repurchases. The number of shares we repurchase during fiscal 2019 will be dependent on many factors, including the level of future stock option exercises, as well as competing uses for available cash. We intend to continue purchasing shares under our current repurchase programs through open market purchases to align with our capital allocation strategy, which will involve opportunistic purchases and purchases to offset dilution resulting from shares issued under the company's benefit plans.
We have made dividend payments to our shareholders in each fiscal year since our company's inception. Dividends paid were $722.2 million , or $1.38 per share, in fiscal 2018 , $698.6 million , or $ 1.28 per share, in fiscal 2017 , and $698.9 million , or $1.22 per share, in fiscal 2016 . In May 2018 , we declared our regular quarterly dividend for the fourth quarter of fiscal 2018 of $0.36 per share, which was paid in July 2018 . We expect to continue to grow our dividend in fiscal 2019 .
In August 2015, we filed a universal shelf registration statement with the SEC under which we, as a well-known seasoned issuer, had the ability to issue and sell an indeterminate amount of various types of debt and equity securities. We intend to file a new universal shelf registration statement to replace our existing universal shelf registration statement in August 2018. The specific terms of any securities we issue under this registration statement will be provided in the applicable prospectus supplements.
30
In November 2000, we filed with the SEC a shelf registration statement covering 30,000,000 shares of common stock to be offered from time to time in connection with acquisitions. As of August 10, 2018 , 29,477,835 shares remained available for issuance under this registration statement.
Debt Activity and Borrowing Availability
Our debt activity, including issuances and repayments, and our borrowing availability is described in Note 11 , "Debt and Other Financing Arrangements." Our outstanding borrowings at June 30, 2018 , and repayment activity since the close of fiscal 2018 are disclosed within those notes. Updated amounts through August 10, 2018 , include:
• | $409.1 million outstanding from our commercial paper program; and |
• | No amounts outstanding from the credit facility supporting the company's U.S. commercial paper program. |
Our aggregate commercial paper issuances and short-term bank borrowings had weighted average interest rates of 1.71% for fiscal 2018 , 0.97% for fiscal 2017 , and 0.49% for fiscal 2016 .
Included in current maturities of long-term debt as of June 30, 2018 are the 5.375% senior notes totaling $250 million, which mature in March 2019 and the 1.9% senior notes totaling $500 million, which mature in April 2019. It is our intention to fund the repayment of these notes at maturity through cash on hand, cash flow from operations, issuances of commercial paper, issuances of senior notes or a combination thereof.
Off-Balance Sheet Arrangements
We have no off-balance sheet arrangements.
Contractual Obligations
The following table sets forth, as of June 30, 2018 , certain information concerning our obligations and commitments to make contractual future payments:
| Payments Due by Period | ||||||||||||||||||
|
|
|
|
|
|
|
|
| More Than | ||||||||||
| Total |
| < 1 Year |
| 1-3 Years |
| 3-5 Years |
| 5 Years | ||||||||||
| (In thousands) | ||||||||||||||||||
Recorded Contractual Obligations: |
|
|
|
|
|
|
|
|
| ||||||||||
Principal payments of long-term debt | $ | 8,328,612 | |
| $ | 750,000 | |
| $ | 750,000 | |
| $ | 1,534,150 | |
| $ | 5,294,462 | |
Capital leases | 108,481 | |
| 38,309 | |
| 41,903 | |
| 18,864 | |
| 9,405 | | |||||
Deferred compensation (1) | 108,979 | |
| 8,315 | |
| 11,661 | |
| 7,405 | |
| 81,598 | | |||||
International pension plans | 148,484 | |
| 10,279 | |
| 22,664 | |
| 26,260 | |
| 89,281 | | |||||
SERP and other postretirement plans (2) | 319,157 | |
| 31,656 | |
| 63,250 | |
| 64,673 | |
| 159,578 | | |||||
Unrecognized tax benefits and interest (3) | 20,654 | |
| - | |
| - | |
| - | |
| - | | |||||
One-time transition tax liability (4) | 80,000 | |
| 6,400 | |
| 12,800 | |
| 12,800 | |
| 48,000 | | |||||
Unrecorded Contractual Obligations: |
|
|
|
|
|
|
|
|
| ||||||||||
Interest payments related to debt (5) | 3,719,918 | |
| 292,583 | |
| 532,766 | |
| 468,596 | |
| 2,425,973 | | |||||
Operating lease obligations | 665,358 | |
| 111,560 | |
| 171,331 | |
| 116,330 | |
| 266,137 | | |||||
Purchase obligations (6) | 3,514,546 | |
| 2,963,355 | |
| 479,196 | |
| 48,124 | |
| 23,871 | | |||||
Total contractual cash obligations | $ | 17,014,189 | |
| $ | 4,212,457 | |
| $ | 2,085,571 | |
| $ | 2,297,202 | |
| $ | 8,398,305 | |
(1) | The estimate of the timing of future payments under the Executive Deferred Compensation Plan and Management Savings Plan involves the use of certain assumptions, including retirement ages and payout periods. |
(2) | Includes estimated contributions to the unfunded Supplemental Executive Retirement Plan (SERP) and other postretirement benefit plans made in amounts needed to fund benefit payments for vested participants in these plans through fiscal 2028 , based on actuarial assumptions. |
(3) | Unrecognized tax benefits relate to uncertain tax positions recorded under accounting standards related to uncertain tax positions. As of June 30, 2018 , we had a liability of $12.2 million for unrecognized tax benefits for all tax jurisdictions and |
31
$8.5 million for related interest that could result in cash payment. We are not able to reasonably estimate the timing of payments or the amount by which the liability will increase or decrease over time. Accordingly, the related balances have not been reflected in the "Payments Due by Period" section of the table.
(4) | Represents a one-time transition tax liability that we are required to pay over an eight-year period beginning in the first quarter of fiscal 2019 due to provisions enacted as part of the Tax Act. As noted in Note 18 , "Income Taxes," our transition tax liability is currently a provisional estimate. |
(5) | Includes payments on floating rate debt based on rates as of June 30, 2018 , assuming amount remains unchanged until maturity, and payments on fixed rate debt based on maturity dates. The impact of our outstanding fixed-to-floating interest rate swap on the fixed rate debt interest payments is included as well based on the floating rates in effect as of June 30, 2018 . |
(6) | For purposes of this table, purchase obligations include agreements for purchases of product in the normal course of business, for which all significant terms have been confirmed, including minimum quantities resulting from our category management initiative. As we progress with this initiative, our purchase obligations are increasing. Such amounts included in the table above are based on estimates. Purchase obligations also includes amounts committed with various third-party service providers to provide information technology services for periods up to fiscal 2023 (see discussion under Note 19 , "Commitments and Contingencies," to the Notes to Consolidated Financial Statements in Item 8). Purchase obligations exclude full requirements electricity contracts where no stated minimum purchase volume is required. |
Certain acquisitions involve contingent consideration, typically payable only in the event that certain operating results are attained or certain outstanding contingencies are resolved. Aggregate contingent consideration amounts outstanding as of June 30, 2018 were $15.6 million . This amount is not included in the table above.
Critical Accounting Policies and Estimates
The preparation of financial statements in conformity with GAAP requires us to make estimates and assumptions that affect the reported amounts of assets, liabilities, sales and expenses in the accompanying financial statements. Significant accounting policies employed by Sysco are presented in the notes to the financial statements.
Critical accounting policies and estimates are those that are most important to the portrayal of our financial position and results of operations. These policies require our most subjective or complex judgments, often employing the use of estimates about the effect of matters that are inherently uncertain. We have reviewed with the Audit Committee of the Board of Directors the development and selection of the critical accounting policies and estimates and this related disclosure. Our most critical accounting policies and estimates pertain to the company-sponsored pension plans, income taxes, goodwill and intangible assets and share-based compensation.
Company-Sponsored Pension Plans
Amounts related to defined benefit plans recognized in the financial statements are determined on an actuarial basis. Two of the more critical assumptions in the actuarial calculations are the discount rate for determining the current value of plan benefits and the expected rate of return on plan assets. Our U.S. Retirement Plan is largely frozen and is only open to a small number of employees. Our SERP is frozen and is not open to any employees. Our U.K. pension plan (the U.K. Retirement Plan) is also frozen to new participants. None of these plans have a significant sensitivity to changes in discount rates. Due to the low level of active employees in our retirement plans, our assumption for the rate of increase in future compensation is not a critical assumption.
The expected long-term rate of return on plan assets of the U.S. Retirement Plan decreased 25 basis points to 7.00% for fiscal 2018 . The expectations of future returns are derived from a mathematical asset model that incorporates assumptions as to the various asset class returns, reflecting a combination of historical performance analysis and the forward-looking views of the financial markets regarding the yield on bonds, historical returns of the major stock markets and returns on alternative investments. Although not determinative of future returns, the effective annual rate of return on the U.S. Retirement Plan assets, developed using geometric/compound averaging, was approximately 6.6% , 5.9% , 9.1% , and 18.8% , over the 20-year, 10-year, 5-year and 1-year periods ended U.S. Plan , respectively. The rate of return assumption is reviewed annually and revised as deemed appropriate.
The expected return on plan assets impacts the recorded amount of net pension costs. The expected long-term rate of return on plan assets of the U.S. Retirement Plan is 5.00% for fiscal 2019 , compared to 7.00% for fiscal 2018. Investments in the portfolio have been reallocated to a higher portion of fixed income assets, resulting in a lower expected long-term rate of return. A 100 basis point increase (decrease) in the assumed rate of return in the Plan for fiscal 2019 would decrease (increase) Sysco's net company-sponsored pension costs for fiscal 2018 by approximately $36 million .
Pension accounting standards require the recognition of the funded status of our defined benefit plans in the statement
32
of financial position, with a corresponding adjustment to accumulated other comprehensive income, net of tax. The amount reflected in accumulated other comprehensive loss related to the recognition of the funded status of our defined benefit plans as of June 30, 2018 was a charge, net of tax, of $1.1 billion . The amount reflected in accumulated other comprehensive loss related to the recognition of the funded status of our defined benefit plans as of July 1, 2017 was a charge, net of tax, of $1.0 billion .
Income Taxes
The determination of our provision for income taxes requires significant judgment, the use of estimates and the interpretation and application of complex tax laws. Our provision for income taxes primarily reflects a combination of income earned and taxed in the various U.S. federal and state, as well as foreign, jurisdictions. Jurisdictional tax law changes, increases or decreases in permanent differences between book and tax items, accruals or adjustments of accruals for unrecognized tax benefits or valuation allowances, and our change in the mix of earnings from these taxing jurisdictions all affect the overall effective tax rate.
Our liability for unrecognized tax benefits contains uncertainties because management is required to make assumptions and to apply judgment in estimating the exposures associated with our various filing positions. We believe that the judgments and estimates discussed herein are reasonable; however, actual results could differ, and we may be exposed to losses or gains that could be material. To the extent we prevail in matters for which a liability has been established, or pay amounts in excess of recorded liabilities, our effective income tax rate in a given financial statement period could be materially affected. An unfavorable tax settlement generally would require use of our cash and may result in an increase in our effective income tax rate in the period of resolution. A favorable tax settlement may be recognized as a reduction in our effective income tax rate in the period of resolution.
As discussed in Note 18 , "Income Taxes," on December 22, 2017, the U.S. government enacted the Tax Act. The Tax Act made broad and complex changes to the U.S. tax code that effected the company's fiscal year ending June 30, 2018. The SEC staff issued Staff Accounting Bulletin No. 118, Income Tax Accounting Implications of the Tax Cut and Jobs Act (SAB 118), which provides guidance on accounting for the tax effects of the Tax Act. See Note 18 , "Income Taxes" for a description of SAB 118.
Goodwill and Intangible Assets
We account for acquired businesses using the acquisition method of accounting, which requires that, once control of a business is obtained, 100% of the assets acquired and liabilities assumed are recorded at the date of acquisition at their respective fair values. We use multiple valuation methods to determine the fair value of assets acquired and liabilities assumed. For intangible assets, we generally use the income method, which uses a forecast of the expected future net cash flows associated with each asset. These cash flows are then adjusted to present value by applying an appropriate discount rate that reflects the risk factors associated with the cash flow streams. Some of the more significant estimates and assumptions inherent in the income method or other methods include the amount and timing of projected future cash flows and the discount rate selected to measure the risks inherent in the future cash flows. Determining the useful life of an intangible asset also requires judgment, as different types of intangible assets will have different useful lives. Any excess of the purchase price over the estimated fair values of the net assets acquired is recorded as goodwill. More information on our acquisitions can be found in Note 4 , "Acquisitions" in the Notes to Consolidated Financial Statements in Item 8.
Annually in our fourth quarter, we assess the recoverability of goodwill and indefinite-lived intangibles by determining whether the fair values exceed the carrying values of these assets. Impairment reviews, outside our annual review time frame, are performed if events or circumstances occur that include changes in macroeconomic conditions, industry and market considerations, cost factors, overall financial performance, other relevant entity-specific events, specific events affecting the reporting unit or sustained decrease in share price. Our testing may be performed utilizing either a qualitative or quantitative assessment; however, if a qualitative assessment is performed and we determine that the fair value of a reporting unit is more likely than not (i.e., a likelihood of more than 50 percent) to be less than its carrying amount, a quantitative test is performed.
When using a quantitative test, we arrive at our estimates of fair value using a combination of discounted cash flow and earnings or revenue multiple models. The results from each of these models are then weighted and combined into a single estimate of fair value for each reporting unit. We generally use a higher weighting for our discounted cash flow valuation compared to the earnings multiple models because the forecasted operating results that serve as a basis for the analysis incorporate management's outlook and anticipated changes for the businesses consistent with a market participant. When reporting units represent recently acquired operations, we generally use a higher weighting for our earnings multiple models than our discounted cash flow valuation as we believe this aligns with how acquired operations are valued in the market place. The primary assumptions used in these various models include estimated earnings multiples of comparable acquisitions in the industry, including control premiums, earnings or revenue multiples on acquisitions completed by Sysco in the past, future cash flow estimates of the reporting units, which are dependent on internal forecasts and projected growth rates, and weighted average cost of capital, along with working
33
capital and capital expenditure requirements. When possible, we use observable market inputs in our models to arrive at the fair values of our reporting units.
Our estimates of fair value contain uncertainties requiring management to make assumptions and to apply judgment to estimate industry economic factors and the profitability of future business strategies. Actual results could differ from these assumptions and projections, resulting in the company revising its assumptions and, if required, recognizing an impairment loss. There were no impairments of goodwill recorded as a result of assessment in fiscal 2018 , 2017 and 2016 . In fiscal 2018, a $14 million write-off for an intangible asset was recorded, as it was no longer being used due to restructuring in France. Our past estimates of fair value for fiscal 2017 and 2016 would not have been materially different when revised to include subsequent years' actual results. Sysco has not made any material changes in its impairment assessment methodology during the past three fiscal years. We do not believe the estimates used in the analysis are reasonably likely to change materially in the future, but we will continue to assess the estimates in the future based on the expectations of the reporting units. In the fiscal 2018 assessment, the estimated fair values exceeded the carrying values for two international reporting units would have been applicable if our estimates of fair value were decreased by 15% and 18% , respectively, with goodwill of $341.0 million in the aggregate as of June 30, 2018 , recorded for these reporting units.
Certain reporting units (such as those noted above) have a greater proportion of goodwill recorded to estimated fair value as compared to the U.S. Broadline, Canada Broadline or SYGMA reporting units. This is primarily due to these businesses having been more recently acquired, and as a result there has been less history of organic growth than in the U.S. Broadline, Canadian Broadline and SYGMA reporting units. As such, these reporting units have a greater risk of future impairment if their operations were to suffer a significant downturn.
Share-Based Compensation
Sysco provides compensation benefits to employees and non-employee directors under several share-based payment arrangements including various employee stock option plans, a non-employee director plan and the 2015 Employee Stock Purchase Plan (ESPP).
As of June 30, 2018 , there was $121.3 million of total unrecognized compensation cost related to share-based compensation arrangements. That cost is expected to be recognized over a weighted-average period of 1.8 years .
The fair value of each option award is estimated on the date of grant using a Black-Scholes option pricing model. Expected volatility is based on historical volatility of Sysco's stock, implied volatilities from traded options on Sysco's stock and other factors. We utilize historical data to estimate option exercise and employee termination behavior within the valuation model; separate groups of employees that have similar historical exercise behavior are considered separately for valuation purposes. Expected dividend yield is estimated based on the historical pattern of dividends and the average stock price for the year preceding the option grant. The risk-free rate for the expected term of the option is based on the U.S. Treasury yield curve in effect at the time of grant.
The fair value of each restricted stock unit award and performance share unit award granted with a dividend equivalent is based on the company's stock price as of the date of grant. For restricted stock units and performance share units granted without dividend equivalents, the fair value is reduced by the present value of expected dividends during the vesting period. Expense recognized on performance share unit awards is subsequently adjusted based on forecasted performance compared to planned targets until the performance period concludes and the actual number of shares of Sysco common stock to be received upon the vesting of the performance share units is known.
The fair value of the stock issued under the ESPP is calculated as the difference between the stock price and the employee purchase price.
The fair value of restricted stock granted to employees or non-employee directors is based on the stock price on grant date. The application of a discount to the fair value of a restricted stock grant is dependent upon whether or not each individual grant contains a post-vesting restriction.
The compensation cost related to these share-based awards is recognized over the requisite service period. The requisite service period is generally the period during which an employee is required to provide service in exchange for the award. The compensation cost related to stock issuances resulting from employee purchases of stock under the ESPP is recognized during the quarter in which the employee payroll withholdings are made.
34
Our share-based awards are generally subject to graded vesting over a service period. We will recognize compensation cost on a straight-line basis over the requisite service period for the entire award.
In addition, certain of our share-based awards provide that the awards continue to vest as if the award holder continued to be an employee or director if the award holder meets certain age and years of service thresholds upon retirement. In these cases, we will recognize compensation cost for such awards over the period from the grant date to the date the employee or director first becomes eligible to retire with the options continuing to vest after retirement.
Our option grants include options that qualify as incentive stock options for income tax purposes. In the period the compensation cost related to incentive stock options is recorded, a corresponding tax benefit is not recorded as it is assumed that we will not receive a tax deduction related to such incentive stock options. We may be eligible for tax deductions in subsequent periods to the extent that there is a disqualifying disposition of the incentive stock option. In such cases, we would record a tax benefit related to the tax deduction in an amount not to exceed the corresponding cumulative compensation cost recorded in the financial statements on the particular options multiplied by the statutory tax rate.
Forward-Looking Statements
Certain statements made herein that look forward in time or express management's expectations or beliefs with respect to the occurrence of future events are forward-looking statements under the Private Securities Litigation Reform Act of 1995. Forward-looking statements provide current expectations of future events based on certain assumptions and include any statement that does not directly relate to any historical or current fact. Forward-looking statements can also be identified by words such as "future," "anticipates," "believes," "estimates," "expects," "intends," "plans," "predicts," "will," "would," "could," "can," "may," "projected," "continues," "continuously," variations of such terms, and similar terms and phrases denoting anticipated or expected occurrences or results.
Examples of forward-looking statements include, but are not limited to, statements about our liquidity and our possible or assumed future results of operations or economic performance, as well as descriptions of our plans, projections and strategies, including those described in the following paragraph, and our ability to meet those goals and expectations. Such statements in this document include, but are not limited to, statements regarding our four strategic priorities, including, but not limited to, enriching the customer experience, delivering operational excellence, optimizing the business and activating the power of our people; projections of future performance under our three-year strategic financial plan, including, for example, our expectation that we will reach $650 to $700 million of adjusted operating income growth, our goal of growing earnings per share faster than operating income, achieving 16% in adjusted return on invested capital improvement for existing businesses, and our goals of sales growth of 4% to 4.5%, adjusted operating growth of 9% and adjusted diluted earnings per share results in the range of $3.85 to $3.95 in fiscal 2020; our expectations regarding the calculation of adjusted return on invested capital; our expectations regarding the impact of future Certain Items on our projected future non-GAAP and GAAP results; statements regarding the acceleration of locally managed customer case growth and driving leverage between gross profit and expense growth; statements regarding increased investments in capabilities across the International Foodservice business; statements regarding the positive impact of the merger of Brakes France and Davigel to Sysco France, specifically, our ability to provide new capabilities and a unique multi-temperature service; statements regarding local customer growth; our belief that overall macroeconomic trends continue to be positive in the U.S. and that the underlying economic picture remains encouraging, including a strong employment market; statements regarding our continued success in category management and our introduction of new categories to capture value; our expectation that inflation will continue for the balance of calendar 2018; our expectation that operating expenses will increase in fiscal 2019; our estimates of anticipated capital expenditures for fiscal 2019, including estimates provided net of estimated proceeds from sales of assets, and our ability to fund them; statements regarding our multi-regional presence in North America and Europe and its mitigating impact on regional economic declines; statements regarding our belief that our liquidity and access to capital provides us the ability to continuously invest in business improvements; our expectations regarding payments of future quarterly cash dividends and our ability to grow our dividend in fiscal 2019; statements regarding our focus on mergers and acquisitions as a part of our strategy; statements regarding our plans to continue purchasing shares under our current repurchase programs through open market purchases to align with our capital allocation strategy; our discussions of various types of market risks, including interest rate risks, floating rate debt projections and the effectiveness of our interest rate swaps; discussions about trends in transportation costs, including fuel pricing and the labor market; statements regarding the adequacy and anticipated amounts and uses of our cash flows, including our future ability to effectively access the commercial paper market and long-term capital market; our expectations regarding our effective tax rate and the positive impact of the Tax Act generally; our expectation that accounting for the income tax effects of the Tax Act is not expected to extend beyond one year of the Tax Act; our expectations that future tax payments will grow with our earnings; our intention to repay our long-term debt with cash on hand, cash flow from operations, issuances of commercial paper, issuances of senior notes or a combination thereof; our expectations and beliefs regarding our fair value estimates; our expectations regarding the recognition of compensation costs related to share-based compensation
35
arrangements; statements regarding our investments in Europe, including the supply chain transformation occurring in the U.K., technology and other integrations within Europe; and projections regarding the rate of return on retirement plan assets.
Forward-looking statements are not guarantees of future performance, and our actual results may differ materially from the results discussed in our forward-looking statements. Important factors that might cause such differences include, but are not limited to, those discussed in Part I, Item 1A of this Form 10-K under the heading "Risk Factors." Additional forward-looking statements and some important risks that could cause outcomes to vary materially from those expected include the following: The success of our three-year strategic financial objectives could be affected by conditions in the economy and the industry as well as internal factors, such as the ability to control expenses, including fuel costs. Our expectations regarding case growth may be impacted by factors beyond our control, including actions by our competitors and/or customers. Our expectations for deflation and inflation could be impacted by market events and supplier costs. Company-sponsored pension plan liabilities are impacted by a number of factors including the discount rate for determining the current value of plan benefits and the expected rate of return on plan assets. The amount of shares repurchased in a given period is subject to a number of factors, including available cash and our general working capital needs at the time. Meeting our dividend target objectives depends on our level of earnings, available cash and the success of our various strategic initiatives. Our expectations regarding earnings per share and various items impacting earnings is subject to a number of factors, including our ability to manage operating expenses and the impact of Certain Items. Our plans with respect to growth in international markets and adjacent areas that complement our core business are subject to our other strategic initiatives, the allocation of resources, and plans and economic conditions generally. Legal proceedings and the adequacy of insurance are impacted by events, circumstances and individuals beyond our control. Expectations of cash tax payments can be impacted by our performance. The need for additional borrowing or other capital is impacted by various factors, including capital expenditures or acquisitions in excess of those currently anticipated, levels of share repurchases, or other unexpected cash requirements. Plans regarding the repayment of debt are subject to change at any time based on management's assessment of the overall needs of the company. Capital expenditures may vary from those projected based on changes in business plans and other factors, including risks related to the timing and successful completion of acquisitions, construction schedules and the possibility that other cash requirements could result in delays or cancellations of capital spending. Our ability to finance capital expenditures as anticipated may be influenced by our results of operations, our borrowing capacity, share repurchases, dividend levels and other factors. Expectations regarding tax rates and the transfer of cash held in foreign jurisdictions are subject to various factors beyond our control and decisions of management throughout the fiscal year that are subject to change based on our business needs. The anticipated impact of compliance with laws and regulations also involves the risk that estimates may turn out to be materially incorrect, and laws and regulations, as well as methods of enforcement, are subject to change.
Item 7A. Quantitative and Qualitative Disclosures about Market Risk
Our market risks consist of interest rate risk, foreign currency exchange rate risk, fuel price risk and investment risk.
Interest Rate Risk
We do not utilize financial instruments for trading purposes. Our use of debt directly exposes us to interest rate risk. Floating rate debt, where the interest rate fluctuates periodically, exposes us to short-term changes in market interest rates. Fixed rate debt, where the interest rate is fixed over the life of the instrument, exposes us to changes in market interest rates reflected in the fair value of the debt and to the risk that we may need to refinance maturing debt with new debt at higher rates.
We manage our debt portfolio to achieve an overall desired position of fixed and floating rates and may employ interest rate swaps as a tool to achieve that position. The major risks from interest rate derivatives include changes in the interest rates affecting the fair value of such instruments, potential increases in interest expense due to market increases in floating interest rates and the creditworthiness of the counterparties in such transactions.
At June 30, 2018 , there were no commercial paper issuances outstanding. Total debt as of June 30, 2018 was $8.3 billion , of which approximately 74% was at fixed rates of interest, including the impact of our interest rate swap agreements.
At July 1, 2017 , there were $119.7 million commercial paper issuances outstanding. Total debt as of July 1, 2017 was $8.2 billion , of which approximately 71% was at fixed rates of interest, including the impact of our interest rate swap agreements.
36
Details of our outstanding swap agreements as of June 30, 2018 are below:
Maturity Date of Swap |
| Notional Value |
| Fixed Coupon Rate on Hedged Debt |
| Floating Interest Rate on Swap |
| Floating Rate Reset Terms |
| Location of Fair Value on Balance Sheet |
| Fair Value | |||||
April 1, 2019 |
| $ | 500,000,000 | |
| 1.90 | % |
| Three-month LIBOR |
| Every three months in advance |
| Other long-term liabilities |
| $ | (6,820 | ) |
October 1, 2020 |
| 750,000,000 | |
| 2.60 | |
| Three-month LIBOR |
| Every three months in advance |
| Other long-term liabilities |
| (23,654 | ) | ||
July 15, 2021 |
| 500,000,000 | |
| 2.50 | |
| Three-month LIBOR |
| Every three months in advance |
| Other long-term liabilities |
| (23,147 | ) | ||
March 15, 2025 |
| 500,000,000 | |
| 3.55 | |
| Three-month LIBOR |
| Every three months in advance |
| Other long-term liabilities |
| (2,933 | ) | ||
We receive or pay amounts on these interest rate swap agreements on a semi-annual basis.
The following tables present our interest rate position as of June 30, 2018 . All amounts are stated in U.S. dollar equivalents.
| Interest Rate Position as of June 30, 2018 | ||||||||||||||||||||||||||||||
| Principal Amount by Expected Maturity | ||||||||||||||||||||||||||||||
| Average Interest Rate | ||||||||||||||||||||||||||||||
| 2019 |
| 2020 |
| 2021 |
| 2022 |
| 2023 |
| Thereafter |
| Total |
| Fair Value | ||||||||||||||||
| (Dollars in thousands) | ||||||||||||||||||||||||||||||
U.S. $ Denominated: |
|
|
|
|
|
|
|
|
|
|
|
|
|
|
| ||||||||||||||||
Fixed Rate Debt | $ | 250,000 | |
| $ | - | |
| $ | - | |
| $ | 450,000 | |
| $ | - | |
| $ | 4,794,462 | |
| $ | 5,494,462 | |
| $ | 5,471,453 | |
Average Interest Rate | 5.4 | % |
| - | % |
| - | % |
| 2.6 | % |
| - | % |
| 4.2 | % |
| 4.1 | % |
|
| | ||||||||
Floating Rate Debt (1) | $ | 500,000 | |
| $ | - | |
| $ | 750,000 | |
| $ | 500,000 | |
| $ | - | |
| $ | 500,000 | |
| $ | 2,250,000 | |
| $ | 2,250,000 | |
Average Interest Rate | 1.9 | % |
| - | % |
| 2.6 | % |
| 2.5 | % |
| - | % |
| 3.6 | % |
| 2.6 | % |
|
| | ||||||||
Euro Denominated: |
| |
|
| |
|
| |
|
| |
|
| |
|
| |
|
| |
|
| | ||||||||
Fixed Rate Debt | $ | - | |
| $ | - | |
| $ | - | |
| $ | - | |
| $ | 584,150 | |
| $ | - | |
| $ | 584,150 | |
| $ | 587,045 | |
Average Interest Rate | - | % |
| - | % |
| - | % |
| - | % |
| 1.3 | % |
| - | % |
| 1.3 | % |
|
| | ||||||||
(1) | Includes fixed rate debt that has been converted to floating rate debt through an interest rate swap agreement. |
| Interest Rate Position as of June 30, 2018 | ||||||||||||||||||||||||||||||
| Notional Amount by Expected Maturity | ||||||||||||||||||||||||||||||
| Average Interest Swap Rate | ||||||||||||||||||||||||||||||
| 2019 |
| 2020 |
| 2021 |
| 2022 |
| 2023 |
| Thereafter |
| Total |
| Fair Value | ||||||||||||||||
| (Dollars in thousands) | ||||||||||||||||||||||||||||||
Interest Rate Swaps | | |
| | |
| | |
| | |
| | |
| | |
| | |
| | | ||||||||
Related To Debt: |
|
|
|
|
|
|
|
|
|
|
|
|
|
|
| ||||||||||||||||
Pay Variable/Receive Fixed | $ | 500,000 | |
| $ | - | |
| $ | 750,000 | |
| $ | 500,000 | |
| $ | - | |
| $ | 500,000 | |
| $ | 2,250,000 | |
| $ | (56,554 | ) |
Average Variable Rate Paid: |
|
|
|
|
|
|
|
|
|
|
|
|
|
|
| ||||||||||||||||
Rate A Plus | 0.8 | % |
| - | % |
| 1.12 | % |
| 1.13 | % |
| - | % |
| 0.75 | % |
| 0.97 | % |
| - | % | ||||||||
Fixed Rate Received | 1.9 | % |
| - | % |
| 2.6 | % |
| 2.5 | % |
| - | % |
| 3.55 | % |
| 2.63 | % |
| - | % | ||||||||
Rate A – three-month LIBOR
Foreign Currency Exchange Rate Risk
The majority of our foreign subsidiaries use their local currency as their functional currency. To the extent that business transactions are not denominated in a foreign subsidiary's functional currency, we are exposed to foreign currency exchange rate risk. We will also incur gains and losses within our shareholders' equity due to the translation of our financial statements from foreign currencies into U.S. dollars. Our largest currency exposures are with Canadian dollars, British pound sterling and Euro currencies. Our income statement trends may be impacted by the translation of the income statements of our foreign subsidiaries
37
into U.S. dollars. The exchange rates used to translate our foreign sales into U.S. dollars positively impacted sales by 1.0% in fiscal 2018 when compared to fiscal 2017 . The exchange rate used to translate our foreign sales into U.S. dollars positively impacted sales by 0.1% in fiscal 2017 when compared to fiscal 2016 . The impact to our operating income, net earnings and earnings per share was not material in fiscal 2018 or fiscal 2017 . A 10% unfavorable change in the fiscal 2018 weighted year-to-date exchange rate and the resulting impact on our financial statements would have negatively impacted fiscal 2018 sales by 1.9% and would not have materially impacted our operating income, net earnings and earnings per share. We do not routinely enter into material agreements to hedge foreign currency exchange rate risks.
Our investments and loans to our foreign operations created additional foreign currency exposure. In fiscal 2017, we designated €500 million of Euro notes issued in June 2016 and various cross currency swaps as hedges of a portion of our net investment in Euro-denominated and Sterling-denominated foreign operations to reduce foreign currency risk associated with the investment in these operations. Changes in the value of these items resulting from fluctuations in the underlying exchange rates to U.S. Dollar exchange rates are recorded as foreign currency translation adjustments within Accumulated other comprehensive income (loss). In fiscal 2018 and in fiscal 2017, we entered into various cross currency swaps to mitigate the risk of exchange rate changes for intercompany loans that are not in the functional currency of our subsidiaries. These have been designated as cash flow hedges with changes recorded within foreign currency translation adjustments within Accumulated other comprehensive income (loss).
Fuel Price Risk
Due to the nature of our distribution business, we are exposed to potential volatility in fuel prices. The price and availability of diesel fuel fluctuates due to changes in production, seasonality and other market factors generally outside of our control. Increased fuel costs may have a negative impact on our results of operations in three areas. First, the high cost of fuel can negatively impact consumer confidence and discretionary spending and thus reduce the frequency and amount spent by consumers for food-away-from-home purchases. Second, the high cost of fuel can increase the price we pay for product purchases and we may not be able to pass these costs fully to our customers. Third, increased fuel costs impact the costs we incur to deliver product to our customers. Fuel costs related to outbound deliveries represented approximately 0.5% of sales during fiscal 2018 , fiscal 2017 and fiscal 2016.
Our activities to mitigate fuel costs include routing optimization with the goal of reducing miles driven, improving fleet utilization by adjusting idling time and maximum speeds and using fuel surcharges that primarily track with the change in market prices of fuel. We use diesel fuel swap contracts to fix the price of a portion of our projected monthly diesel fuel requirements. As of June 30, 2018 , we had diesel fuel swaps with a total notional amount of approximately 46 million gallons through June 2019 . These swaps will lock in the price of approximately 55% to 60% of our projected fuel purchase needs for fiscal 2019 . Our remaining fuel purchase needs will occur at market rates unless contracted for a fixed price or hedged at a later date. Using current, published quarterly market price projections for diesel and estimates of fuel consumption, a 10% unfavorable change in diesel prices from the market price would result in a potential increase of approximately $10.0 million in our fuel costs on our non-contracted volumes.
Investment Risk
Our U.S. Retirement Plan and U.K. Retirement Plan hold various investments, including public and private equity, fixed income securities and real estate funds. The amount of our annual contribution to the plan is dependent upon, among other things, the return on the plan's assets and discount rates used to calculate the plan's liability. Fluctuations in asset values can cause the amount of our anticipated future contributions to the plan to increase and can result in a reduction to shareholders' equity on our balance sheet as of fiscal year-end, which is when this plan's funded status is measured. Also, the projected liability of the plan will be impacted by the fluctuations of interest rates on high quality bonds in the public markets. To the extent the financial markets experience declines, our anticipated future contributions and funded status will be affected for future years. A 10% unfavorable change in the value of the investments held by our company-sponsored retirement plans at the plan's fiscal year end ( December 31, 2017 ) would not have a material impact on our anticipated future contributions for fiscal 2019 ; however, such an unfavorable change would increase our pension expense for fiscal 2019 by $30.6 million and would reduce our shareholders' equity on our balance sheet as of June 30, 2018 by $366.6 million . An unfavorable change in the fair value of our U.K. Plan assets would not materially increase our fiscal 2019 pension expense and would reduce our shareholders' equity on our balance sheet, as of June 30, 2018 , by $25.9 million .
38
Item 8. Financial Statements and Supplementary Data
SYSCO CORPORATION AND SUBSIDIARIES
INDEX TO CONSOLIDATED FINANCIAL STATEMENTS
| Page |
Consolidated Financial Statements: |
|
Report of Management on Internal Control Over Financial Reporting | 40 |
Report of Independent Registered Public Accounting Firm on Internal Control Over Financial Reporting | 41 |
Report of Independent Registered Public Accounting Firm on Consolidated Financial Statements | 42 |
Consolidated Balance Sheets | 43 |
Consolidated Results of Operations | 44 |
Consolidated Statements of Comprehensive Income | 45 |
Changes in Consolidated Shareholders' Equity | 46 |
Consolidated Cash Flows | 47 |
Notes to Consolidated Financial Statements | 48 |
All schedules are omitted because they are not applicable or the information is set forth in the consolidated financial statements or notes thereto.
39
REPORT OF MANAGEMENT ON INTERNAL CONTROL OVER FINANCIAL REPORTING
The management of Sysco Corporation ("Sysco") is responsible for establishing and maintaining adequate internal control over financial reporting for the company. Sysco's internal control system is designed to provide reasonable assurance regarding the reliability of financial reporting and the preparation and fair presentation of published financial statements. All internal control systems, no matter how well designed, have inherent limitations. Therefore, even those systems determined to be effective can provide only reasonable assurance with respect to financial statement preparation and presentation.
Sysco's management assessed the effectiveness of Sysco's internal control over financial reporting as of June 30, 2018 . In making this assessment, management used the criteria set forth by the Committee of Sponsoring Organizations of the Treadway Commission in Internal Control - Integrated Framework (2013). Based on this assessment, management concluded that, as of June 30, 2018 , Sysco's internal control over financial reporting was effective based on those criteria.
Ernst & Young LLP, the independent registered public accounting firm that audited the company's consolidated financial statements included in this report, has issued an audit report on the effectiveness of Sysco's internal control over financial reporting as of June 30, 2018 .
40
REPORT OF INDEPENDENT REGISTERED PUBLIC ACCOUNTING FIRM
To the Shareholders and the Board of Directors of Sysco Corporation
Opinion on Internal Control over Financial Reporting
We have audited Sysco Corporation and its Consolidated Subsidiaries' (the "Company") internal control over financial reporting as of June 30, 2018 , based on criteria established in Internal Control-Integrated Framework issued by the Committee of Sponsoring Organizations of the Treadway Commission (2013 framework) (the COSO criteria). In our opinion, Sysco Corporation and its Consolidated Subsidiaries maintained, in all material respects, effective internal control over financial reporting as of June 30, 2018 , based on the COSO criteria.
We also have audited, in accordance with the standards of the Public Company Accounting Oversight Board (United States) (PCAOB), the 2018 consolidated financial statements of the Company and our report dated August 24, 2018 , expressed an unqualified opinion thereon.
Basis for Opinion
The Company's management is responsible for maintaining effective internal control over financial reporting and for its assessment of the effectiveness of internal control over financial reporting included in the accompanying Report of Management on Internal Control over Financial Reporting. Our responsibility is to express an opinion on the Company's internal control over financial reporting based on our audit. We are a public accounting firm registered with the PCAOB and are required to be independent with respect to the Company in accordance with the U.S. federal securities laws and the applicable rules and regulations of the Securities and Exchange Commission and the PCAOB.
We conducted our audit in accordance with the standards of the PCAOB. Those standards require that we plan and perform the audit to obtain reasonable assurance about whether effective internal control over financial reporting was maintained in all material respects.
Our audit included obtaining an understanding of internal control over financial reporting, assessing the risk that a material weakness exists, testing and evaluating the design and operating effectiveness of internal control based on the assessed risk, and performing such other procedures as we considered necessary in the circumstances. We believe that our audit provides a reasonable basis for our opinion.
Definition and Limitations of Internal Control over Financial Reporting
A company's internal control over financial reporting is a process designed to provide reasonable assurance regarding the reliability of financial reporting and the preparation of financial statements for external purposes in accordance with generally accepted accounting principles. A company's internal control over financial reporting includes those policies and procedures that (1) pertain to the maintenance of records that, in reasonable detail, accurately and fairly reflect the transactions and dispositions of the assets of the company; (2) provide reasonable assurance that transactions are recorded as necessary to permit preparation of financial statements in accordance with generally accepted accounting principles, and that receipts and expenditures of the company are being made only in accordance with authorizations of management and directors of the company; and (3) provide reasonable assurance regarding prevention or timely detection of unauthorized acquisition, use, or disposition of the company's assets that could have a material effect on the financial statements.
Because of its inherent limitations, internal control over financial reporting may not prevent or detect misstatements. Also, projections of any evaluation of effectiveness to future periods are subject to the risk that controls may become inadequate because of changes in conditions, or that the degree of compliance with the policies or procedures may deteriorate.
/s/ Ernst & Young LLP
Houston, Texas
August 24, 2018
41
REPORT OF INDEPENDENT REGISTERED PUBLIC ACCOUNTING FIRM
To the Shareholders and the Board of Directors of Sysco Corporation
Opinion on the Financial Statements
We have audited the accompanying consolidated balance sheets of Sysco Corporation and its Consolidated Subsidiaries (the "Company") as of June 30, 2018 and July 1, 2017 , the related consolidated results of operations, statements of comprehensive income, changes in shareholders' equity and cash flows for each of the three years in the period ended June 30, 2018 and the related notes (collectively referred to as the "consolidated financial statements"). In our opinion, the consolidated financial statements present fairly, in all material respects, the financial position of the Company at June 30, 2018 and July 1, 2017 , and the results of its operations and its cash flows for each of the three years in the period ended June 30, 2018 , in conformity with U.S. generally accepted accounting principles.
We also have audited, in accordance with the standards of the Public Company Accounting Oversight Board (United States) (PCAOB), the Company's internal control over financial reporting as of June 30, 2018 , based on criteria established in Internal Control-Integrated Framework issued by the Committee of Sponsoring Organizations of the Treadway Commission (2013 framework), and our report dated August 24, 2018 expressed an unqualified opinion thereon.
Basis for Opinion
These financial statements are the responsibility of the Company's management. Our responsibility is to express an opinion on the Company's financial statements based on our audits. We are a public accounting firm registered with the PCAOB and are required to be independent with respect to the Company in accordance with the U.S. federal securities laws and the applicable rules and regulations of the Securities and Exchange Commission and the PCAOB.
We conducted our audits in accordance with the standards of the PCAOB. Those standards require that we plan and perform the audit to obtain reasonable assurance about whether the financial statements are free of material misstatement, whether due to error or fraud. Our audits included performing procedures to assess the risks of material misstatement of the financial statements, whether due to error or fraud, and performing procedures that respond to those risks. Such procedures included examining, on a test basis, evidence regarding the amounts and disclosures in the financial statements. Our audits also included evaluating the accounting principles used and significant estimates made by management, as well as evaluating the overall presentation of the financial statements. We believe that our audits provide a reasonable basis for our opinion.
/s/ Ernst & Young LLP
We have served as the Company's auditor since 2002.
Houston, Texas
August 24, 2018
42
Sysco Corporation and its Consolidated Subsidiaries
CONSOLIDATED BALANCE SHEETS
(In thousands, except for share data)
| June 30, 2018 |
| July 1, 2017 | ||||
ASSETS |
|
|
| ||||
Current assets |
| |
|
| | ||
Cash and cash equivalents | $ | 552,325 | |
| $ | 869,502 | |
Accounts and notes receivable, less allowances of $25,768 and $31,059 | 4,073,723 | |
| 4,012,393 | | ||
Inventories, net | 3,125,413 | |
| 2,995,598 | | ||
Prepaid expenses and other current assets | 187,880 | |
| 139,185 | | ||
Income tax receivable | 64,112 | |
| 16,760 | | ||
Total current assets | 8,003,453 | |
| 8,033,438 | | ||
Plant and equipment at cost, less depreciation | 4,521,660 | |
| 4,377,302 | | ||
Other long-term assets |
| |
|
| | ||
Goodwill | 3,955,485 | |
| 3,916,128 | | ||
Intangibles, less amortization | 979,812 | |
| 1,037,511 | | ||
Deferred income taxes | 83,666 | |
| 142,472 | | ||
Other assets | 526,328 | |
| 249,804 | | ||
Total other long-term assets | 5,545,291 | |
| 5,345,915 | | ||
Total assets | $ | 18,070,404 | |
| $ | 17,756,655 | |
LIABILITIES AND SHAREHOLDERS' EQUITY |
|
|
| ||||
Current liabilities |
| |
|
| | ||
Notes payable | $ | 4,176 | |
| $ | 3,938 | |
Accounts payable | 4,136,482 | |
| 3,971,112 | | ||
Accrued expenses | 1,608,966 | |
| 1,576,221 | | ||
Accrued income taxes | 56,793 | |
| 14,540 | | ||
Current maturities of long-term debt | 782,329 | |
| 530,075 | | ||
Total current liabilities | 6,588,746 | |
| 6,095,886 | | ||
Long-term liabilities |
| |
|
| | ||
Long-term debt | 7,540,765 | |
| 7,660,877 | | ||
Deferred income taxes | 319,124 | |
| 161,715 | | ||
Other long-term liabilities | 1,077,163 | |
| 1,373,822 | | ||
Total long-term liabilities | 8,937,052 | |
| 9,196,414 | | ||
Commitments and contingencies | | |
| | | ||
Noncontrolling interest | 37,649 | |
| 82,839 | | ||
Shareholders' equity |
| |
|
| | ||
Preferred stock, par value $1 per share Authorized 1,500,000 shares, issued none | - | |
| - | | ||
Common stock, par value $1 per share Authorized 2,000,000,000 shares, issued 765,174,900 shares | 765,175 | |
| 765,175 | | ||
Paid-in capital | 1,383,619 | |
| 1,327,366 | | ||
Retained earnings | 10,348,628 | |
| 9,447,755 | | ||
Accumulated other comprehensive loss | (1,409,269 | ) |
| (1,262,737 | ) | ||
Treasury stock at cost, 244,533,248 and 235,135,699 shares | (8,581,196 | ) |
| (7,896,043 | ) | ||
Total shareholders' equity | 2,506,957 | |
| 2,381,516 | | ||
Total liabilities and shareholders' equity | $ | 18,070,404 | |
| $ | 17,756,655 | |
See Notes to Consolidated Financial Statements
43
Sysco Corporation and its Consolidated Subsidiaries
CONSOLIDATED RESULTS OF OPERATIONS
(In thousands, except for share and per share data)
| Year Ended | ||||||||||
| Jun. 30, 2018 |
| Jul. 1, 2017 |
| Jul. 2, 2016 | ||||||
| (In thousands except for share and per share data) | ||||||||||
Sales | $ | 58,727,324 | |
| $ | 55,371,139 | |
| $ | 50,366,919 | |
Cost of sales | 47,641,933 | |
| 44,813,632 | |
| 41,326,447 | | |||
Gross profit | 11,085,391 | |
| 10,557,507 | |
| 9,040,472 | | |||
Operating expenses | 8,756,417 | |
| 8,504,336 | |
| 7,189,972 | | |||
Operating income | 2,328,974 | |
| 2,053,171 | |
| 1,850,500 | | |||
Interest expense | 395,483 | |
| 302,878 | |
| 306,146 | | |||
Other expense (income), net | (22,733 | ) |
| (15,937 | ) |
| 111,347 | | |||
Earnings before income taxes | 1,956,224 | |
| 1,766,230 | |
| 1,433,007 | | |||
Income taxes | 525,458 | |
| 623,727 | |
| 483,385 | | |||
Net earnings | $ | 1,430,766 | |
| $ | 1,142,503 | |
| $ | 949,622 | |
|
|
|
|
|
| ||||||
Net earnings: |
|
|
|
|
| ||||||
Basic earnings per share | $ | 2.74 | |
| $ | 2.10 | |
| $ | 1.66 | |
Diluted earnings per share | 2.70 | |
| 2.08 | |
| 1.64 | | |||
|
|
|
|
|
| ||||||
Average shares outstanding | 522,926,914 | |
| 543,496,816 | |
| 573,057,406 | | |||
Diluted shares outstanding | 529,089,854 | |
| 548,545,027 | |
| 577,391,406 | | |||
Dividends declared per common share | $ | 1.41 | |
| $ | 1.30 | |
| $ | 1.23 | |
See Notes to Consolidated Financial Statements
44
Sysco Corporation and its Consolidated Subsidiaries
CONSOLIDATED STATEMENTS OF COMPREHENSIVE INCOME
(In thousands)
| Year Ended | ||||||||||
| Jun. 30, 2018 |
| Jul. 1, 2017 |
| Jul. 2, 2016 | ||||||
| (In thousands) | ||||||||||
Net earnings | $ | 1,430,766 | |
| $ | 1,142,503 | |
| $ | 949,622 | |
Other comprehensive income (loss): |
| |
|
| |
|
| | |||
Foreign currency translation adjustment | (22,987 | ) |
| (11,243 | ) |
| (39,080 | ) | |||
Items presented net of tax: |
| |
|
| |
|
| | |||
Amortization of cash flow hedges | 8,240 | |
| 7,082 | |
| 7,111 | | |||
Change in net investment hedges | 5,791 | |
| (24,012 | ) |
| - | | |||
Change in cash flow hedges | 14,343 | |
| (6,698 | ) |
| (3,779 | ) | |||
Amortization of prior service cost | 6,905 | |
| 7,004 | |
| 6,992 | | |||
Amortization of actuarial loss, net | 25,110 | |
| 25,965 | |
| 13,352 | | |||
Actuarial gain (loss), net arising in current year | 52,511 | |
| 97,283 | |
| (419,517 | ) | |||
Total other comprehensive income (loss) | 89,913 | |
| 95,381 | |
| (434,921 | ) | |||
Comprehensive income | $ | 1,520,679 | |
| $ | 1,237,884 | |
| $ | 514,701 | |
See Notes to Consolidated Financial Statements
45
Sysco Corporation and its Consolidated Subsidiaries
CHANGES IN CONSOLIDATED SHAREHOLDERS' EQUITY
(In thousands, except for share data)
|
|
|
|
|
|
|
|
| Accumulated Other Comprehensive Loss |
|
|
|
|
|
| ||||||||||||||
| Common Stock |
| Paid-in Capital |
| Retained Earnings |
|
| Treasury Stock |
|
| | ||||||||||||||||||
| Shares |
| Amount |
|
|
|
| Shares |
| Amounts |
| Totals | |||||||||||||||||
| (In thousands except for share data) | ||||||||||||||||||||||||||||
Balance as of June 27, 2015 | 765,174,900 | |
| $ | 765,175 | |
| $ | 1,213,999 | |
| $ | 8,751,985 | |
| $ | (923,197 | ) |
| 170,857,231 | |
| $ | (4,547,738 | ) |
| $ | 5,260,224 | |
Net earnings |
| |
|
| |
|
| |
| 949,622 | |
|
| |
|
| |
|
| |
| 949,622 | | ||||||
Foreign currency translation adjustment |
| |
|
| |
|
| |
|
| |
| (39,080 | ) |
|
| |
|
| |
| (39,080 | ) | ||||||
Amortization of cash flow hedges, net of tax |
| |
|
| |
|
| |
|
| |
| 7,111 | |
|
| |
|
| |
| 7,111 | | ||||||
Change in fair value of cash flow hedges, net of tax |
| |
|
| |
|
| |
|
| |
| (3,779 | ) |
|
| |
|
| |
| (3,779 | ) | ||||||
Reclassification of pension and other postretirement benefit plans amounts to net earnings, net of tax |
| |
|
| |
|
| |
|
| |
| 20,344 | |
|
| |
|
| |
| 20,344 | | ||||||
Pension funded status adjustment, net of tax |
| |
|
| |
|
| |
|
| |
| (419,517 | ) |
|
| |
|
| |
| (419,517 | ) | ||||||
Dividends declared |
| |
|
| |
|
| |
| (695,469 | ) |
|
| |
|
| |
|
| |
| (695,469 | ) | ||||||
Treasury stock purchases |
| |
|
| |
|
| |
|
| |
|
| |
| 44,716,180 | |
| (1,949,445 | ) |
| (1,949,445 | ) | ||||||
Share-based compensation awards |
| |
|
| |
| 67,141 | |
|
| |
|
| |
| (9,995,927 | ) |
| 282,456 | |
| 349,597 | | ||||||
Balance as of July 2, 2016 | 765,174,900 | |
| $ | 765,175 | |
| $ | 1,281,140 | |
| $ | 9,006,138 | |
| $ | (1,358,118 | ) |
| 205,577,484 | |
| $ | (6,214,727 | ) |
| $ | 3,479,608 | |
Net earnings |
| |
|
| |
|
| |
| 1,142,503 | |
|
| |
|
| |
|
| |
| 1,142,503 | | ||||||
Foreign currency translation adjustment |
| |
|
| |
|
| |
|
| |
| (11,243 | ) |
|
| |
|
| |
| (11,243 | ) | ||||||
Amortization of cash flow hedges, net of tax |
| |
|
| |
|
| |
|
| |
| 7,082 | |
|
| |
|
| |
| 7,082 | | ||||||
Change in cash flow hedges, net of tax |
| |
|
| |
|
| |
|
| |
| (6,698 | ) |
|
| |
|
| |
| (6,698 | ) | ||||||
Change in net investment hedge, net of tax |
|
|
|
|
|
|
|
| (24,012 | ) |
|
|
|
|
| (24,012 | ) | ||||||||||||
Reclassification of pension and other postretirement benefit plans amounts to net earnings, net of tax |
| |
|
| |
|
| |
|
| |
| 32,969 | |
|
| |
|
| |
| 32,969 | | ||||||
Pension funded status adjustment, net of tax |
| |
|
| |
|
| |
|
| |
| 97,283 | |
|
| |
|
| |
| 97,283 | | ||||||
Dividends declared |
| |
|
| |
|
| |
| (700,886 | ) |
|
| |
|
| |
|
| |
| (700,886 | ) | ||||||
Treasury stock purchases |
|
|
|
|
|
|
|
|
|
| 36,224,078 | |
| (1,886,121 | ) |
| (1,886,121 | ) | |||||||||||
Increase in ownership interest in subsidiaries |
|
|
|
| (39,991 | ) |
|
|
|
|
|
|
|
|
| (39,991 | ) | ||||||||||||
Share-based compensation awards |
| |
|
| |
| 86,217 | |
|
| |
|
| |
| (6,665,863 | ) |
| 204,805 | |
| 291,022 | | ||||||
Balance as of July 1, 2017 | 765,174,900 | |
| $ | 765,175 | |
| $ | 1,327,366 | |
| $ | 9,447,755 | |
| $ | (1,262,737 | ) |
| 235,135,699 | |
| $ | (7,896,043 | ) |
| $ | 2,381,516 | |
Net earnings |
| |
|
| |
|
| |
| 1,430,766 | |
|
| |
|
| |
|
| |
| 1,430,766 | | ||||||
Increase in ownership interest in subsidiaries |
|
|
|
|
|
| (31,072 | ) |
|
|
|
|
|
|
| (31,072 | ) | ||||||||||||
Reclassification of accumulated other comprehensive loss to retained earnings (1) |
|
|
|
|
|
| 236,445 | |
| (236,445 | ) |
|
|
|
|
| - | | |||||||||||
Foreign currency translation adjustment |
| |
|
| |
|
| |
|
| |
| (22,987 | ) |
|
| |
|
| |
| (22,987 | ) | ||||||
Amortization of cash flow hedges, net of tax |
| |
|
| |
|
| |
|
| |
| 8,240 | |
|
| |
|
| |
| 8,240 | | ||||||
Change in net investment hedges, net of tax |
|
|
|
|
|
|
|
| 5,791 | |
|
|
|
|
| 5,791 | | ||||||||||||
Change in cash flow hedges, net of tax |
|
|
|
|
|
|
|
| 14,343 | |
|
|
|
|
| 14,343 | | ||||||||||||
Reclassification of pension and other postretirement benefit plans amounts to net earnings, net of tax |
| |
|
| |
|
| |
|
| |
| 32,015 | |
|
| |
|
| |
| 32,015 | | ||||||
Pension funded status adjustment, net of tax |
| |
|
| |
|
| |
|
| |
| 52,511 | |
|
| |
|
| |
| 52,511 | | ||||||
Dividends declared |
| |
|
| |
|
| |
| (735,266 | ) |
|
| |
|
| |
|
| |
| (735,266 | ) | ||||||
Treasury stock purchases |
|
|
|
|
|
|
|
|
|
| 17,473,973 | |
| (956,502 | ) |
| (956,502 | ) | |||||||||||
Share-based compensation awards |
| |
|
| |
| 56,253 | |
|
| |
|
| |
| (8,076,424 | ) |
| 271,349 | |
| 327,602 | | ||||||
Balance as of June 30, 2018 | 765,174,900 | |
| $ | 765,175 | |
| $ | 1,383,619 | |
| $ | 10,348,628 | |
| $ | (1,409,269 | ) |
| 244,533,248 | |
| $ | (8,581,196 | ) |
| $ | 2,506,957 | |
(1) | Deferred taxes stranded in accumulated other comprehensive income (AOCI) as a result of the Tax Cuts and Jobs Act of 2017 (the Tax Act) were reclassified to retained earnings as a result of early adopting Accounting Standards Update (ASU) 2018-02. |
See Notes to Consolidated Financial Statements
46
Sysco Corporation and its Consolidated Subsidiaries
CONSOLIDATED CASH FLOWS
(In thousands)
| Year Ended | ||||||||||
| Jun. 30, 2018 |
| Jul. 1, 2017 |
| Jul. 2, 2016 | ||||||
Cash flows from operating activities: |
| |
|
| |
|
| ||||
Net earnings | $ | 1,430,766 | |
| $ | 1,142,503 | |
| $ | 949,622 | |
Adjustments to reconcile net earnings to cash provided by operating activities: |
|
|
| |
|
| | ||||
Share-based compensation expense | 93,841 | |
| 83,883 | |
| 79,466 | | |||
Depreciation and amortization | 765,498 | |
| 901,992 | |
| 662,710 | | |||
Amortization of debt issuance and other debt-related costs | 28,474 | |
| 31,852 | |
| 45,137 | | |||
Loss on extinguishment of debt | 53,104 | |
| - | |
| 86,460 | | |||
Loss on foreign exchange remeasurement | - | |
| - | |
| 101,228 | | |||
Deferred income taxes | 187,908 | |
| (51,846 | ) |
| 93,871 | | |||
Provision for losses on receivables | 21,448 | |
| 20,672 | |
| 20,372 | | |||
Other non-cash items | 3,986 | |
| 6,704 | |
| 23,347 | | |||
Additional changes in certain assets and liabilities, net of effect of businesses acquired: |
|
|
|
|
| ||||||
(Increase) decrease in receivables | (37,457 | ) |
| 20,452 | |
| (27,311 | ) | |||
(Increase) decrease in inventories | (89,737 | ) |
| (113,647 | ) |
| 66,937 | | |||
(Increase) decrease in prepaid expenses and other current assets | (19,643 | ) |
| 8,158 | |
| (8,468 | ) | |||
Increase in accounts payable | 76,897 | |
| 322,775 | |
| 23,863 | | |||
Increase (decrease) in accrued expenses | 47,105 | |
| (4,476 | ) |
| (157,600 | ) | |||
(Decrease) increase in accrued income taxes | (10,652 | ) |
| (74,590 | ) |
| 231,542 | | |||
(Increase) in other assets | (77,852 | ) |
| (36,449 | ) |
| (6,639 | ) | |||
(Decrease) in other long-term liabilities | (315,054 | ) |
| (18,629 | ) |
| (196,190 | ) | |||
Net cash provided by operating activities | 2,158,632 | |
| 2,239,354 | |
| 1,988,347 | | |||
Cash flows from investing activities: |
|
|
|
|
| ||||||
Additions to plant and equipment | (687,815 | ) |
| (686,378 | ) |
| (527,346 | ) | |||
Proceeds from sales of plant and equipment | 22,255 | |
| 23,715 | |
| 23,511 | | |||
Acquisition of businesses, net of cash acquired | (248,105 | ) |
| (2,921,798 | ) |
| (219,218 | ) | |||
Purchase of foreign currency options | - | |
| - | |
| (103,501 | ) | |||
Proceeds from sale of foreign currency options | - | |
| - | |
| 57,452 | | |||
Net cash used for investing activities | (913,665 | ) |
| (3,584,461 | ) |
| (769,102 | ) | |||
Cash flows from financing activities: |
|
|
|
|
| ||||||
Bank and commercial paper borrowings, net | (119,700 | ) |
| 119,700 | |
| - | | |||
Other debt borrowings | 1,000,599 | |
| 753,834 | |
| 5,134,709 | | |||
Other debt repayments | (552,036 | ) |
| (143,664 | ) |
| (126,797 | ) | |||
Tender and redemption premiums for senior notes | (281,762 | ) |
| - | |
| - | | |||
Redemption of senior notes | - | |
| - | |
| (5,050,000 | ) | |||
Proceeds from stock option exercises | 268,751 | |
| 204,805 | |
| 282,455 | | |||
Treasury stock purchases | (978,901 | ) |
| (1,886,121 | ) |
| (1,949,445 | ) | |||
Dividends paid | (722,158 | ) |
| (698,647 | ) |
| (698,869 | ) | |||
Other financing activities | (25,262 | ) |
| (32,494 | ) |
| (51,989 | ) | |||
Net cash used for financing activities | (1,410,469 | ) |
| (1,682,587 | ) |
| (2,459,936 | ) | |||
Effect of exchange rates on cash, cash equivalents and restricted cash | 11,844 | |
| (22,104 | ) |
| (138,327 | ) | |||
Net decrease in cash, cash equivalents and restricted cash | (153,658 | ) |
| (3,049,798 | ) |
| (1,379,018 | ) | |||
Cash, cash equivalents and restricted cash at beginning of period | 869,502 | |
| 3,919,300 | |
| 5,298,318 | | |||
Cash, cash equivalents and restricted cash at end of period | $ | 715,844 | |
| $ | 869,502 | |
| $ | 3,919,300 | |
Supplemental disclosures of cash flow information: |
|
|
|
|
| ||||||
Cash paid during the period for: |
|
|
|
|
| ||||||
Interest | $ | 301,672 | |
| $ | 285,025 | |
| $ | 200,174 | |
Income taxes | 268,384 | |
| 761,384 | |
| 180,565 | | |||
See Notes to Consolidated Financial Statements
47
Sysco Corporation and its Consolidated Subsidiaries
NOTES TO CONSOLIDATED FINANCIAL STATEMENTS
Unless this Form 10-K indicates otherwise or the context otherwise requires, the terms "we," "our," "us," "Sysco," or "the company" as used in this Form 10-K refer to Sysco Corporation together with its consolidated subsidiaries and divisions.
1. SUMMARY OF ACCOUNTING POLICIES
Business and Consolidation
Sysco Corporation, acting through its subsidiaries and divisions (Sysco or the company), is engaged in the marketing and distribution of a wide range of food and related products primarily to the foodservice or food-away-from-home industry. These services are performed for over 600,000 customers from 332 distribution facilities located throughout North America and Europe.
Sysco's fiscal year ends on the Saturday nearest to June 30 th . This resulted in a 52 -week year ended June 30, 2018 for fiscal 2018 , a 52 -week year ended July 1, 2017 for fiscal 2017 , and a 53 -week year ended July 2, 2016 for fiscal 2016 .
The accompanying financial statements include the accounts of Sysco and its consolidated subsidiaries. All significant intercompany transactions and account balances have been eliminated.
The preparation of financial statements in conformity with generally accepted accounting principles (GAAP) requires management to make estimates that affect the reported amounts of assets, liabilities, sales and expenses. Actual results could differ from the estimates used.
Cash and Cash Equivalents
Cash includes cash equivalents such as cash deposits, time deposits, certificates of deposit, commercial paper, high-quality money market funds and all highly liquid instruments with original maturities of three months or less, which are recorded at fair value.
Accounts Receivable
Accounts receivable consist primarily of trade receivables from customers and receivables from suppliers for marketing or incentive programs. Sysco determines the past due status of trade receivables based on contractual terms with each customer. Sysco evaluates the collectability of accounts receivable and determines the appropriate reserve for doubtful accounts based on a combination of factors. The company utilizes specific criteria to determine uncollectible receivables to be written off including whether a customer has filed for or been placed in bankruptcy, has had accounts referred to outside parties for collection or has had accounts past due over specified periods. In these instances, a specific allowance for doubtful accounts is recorded to reduce the receivable to the net amount reasonably expected to be collected. Allowances are recorded for all other receivables based on an analysis of historical trends of write-offs and recoveries.
Inventories
Inventories consisting primarily of finished goods include food and related products and lodging products held for resale and are valued at the lower of cost (first-in, first-out method) and net realizable value. Elements of costs include the purchase price of the product and freight charges to deliver the product to the company's warehouses and are net of certain cash received from vendors (see "Vendor Consideration").
Plant and Equipment
Capital additions, improvements and major replacements are classified as plant and equipment and are carried at cost. Depreciation is recorded using the straight-line method, which reduces the book value of each asset in equal amounts over its estimated useful life, and is included within operating expenses in the consolidated results of operations. Maintenance, repairs and minor replacements are charged to earnings when they are incurred. Upon the disposition of an asset, its accumulated depreciation is deducted from the original cost, and any gain or loss is reflected in current earnings.
48
Long-Lived Assets
Management reviews long-lived assets for indicators of impairment whenever events or changes in circumstances indicate that the carrying value may not be recoverable. Cash flows expected to be generated by the related assets are estimated over the asset's useful life based on updated projections on an undiscounted basis. For assets held for use, Sysco groups assets and liabilities at the lowest level for which cash flows are separately identifiable. If the evaluation indicates that the carrying value of the asset may not be recoverable, the potential impairment is measured using fair value. Impairment losses for assets to be disposed of, if any, are based on the estimated proceeds to be received, less costs of disposal.
Goodwill and Intangibles
Goodwill represents the excess of cost over the fair value of net assets acquired. Goodwill and intangibles with indefinite lives are not amortized. Goodwill is assigned to the reporting units that are expected to benefit from the synergies of a business combination. The recoverability of goodwill and indefinite-lived intangibles is assessed annually, or more frequently as needed when events or changes have occurred that would suggest an impairment of carrying value, by determining whether the fair values of the applicable reporting units exceed their carrying values. This annual testing may be performed utilizing either a qualitative or quantitative assessment; however, if a qualitative assessment is performed and it is determined that the fair value of a reporting unit is more likely than not (i.e., a likelihood of more than 50 percent) to be less than its carrying amount, a quantitative test is performed.
For fiscal 2018 , the company analyzed its 7 operating segments and determined that 18 reporting units existed for purposes of evaluating for goodwill impairment. For certain reporting units, the company utilized a qualitative assessment. For the remaining reporting units, Sysco performed a quantitative test using a combination of the income and market approaches. The evaluation of fair value requires the use of projections, estimates and assumptions as to the future performance of the operations in performing a discounted cash flow analysis, as well as assumptions regarding sales and earnings multiples that would be applied in comparable acquisitions. The company does not believe the estimates used in the analysis are reasonably likely to change materially in the future, but Sysco will continue to assess the estimates in the future based on the expectations of the reporting units. In the fiscal 2018 assessment, the estimated fair values exceeded the carrying values for two international reporting units by 15% and 18% , respectively, with goodwill of $341.0 million in the aggregate as of June 30, 2018 , recorded for these reporting units.
Intangibles with definite lives are amortized over their useful lives in a manner consistent with underlying cash flow, which generally ranges from two to fifteen years. Management reviews finite-lived intangibles for indicators of impairment whenever events or changes in circumstances indicate that the carrying value may not be recoverable. Cash flows expected to be generated by the finite-lived intangibles are estimated over the intangible asset's useful life based on updated projections on an undiscounted basis. If the evaluation indicates that the carrying value of the finite-lived intangible asset may not be recoverable, the potential impairment is measured at fair value.
Derivative Financial Instruments
All derivatives are recognized as assets or liabilities within the consolidated balance sheets at fair value at their gross values. Gains or losses on derivative financial instruments designated as fair value hedges are recognized immediately in the consolidated results of operations, along with the offsetting gain or loss related to the underlying hedged item.
Gains or losses on derivative financial instruments designated as cash flow hedges are recorded as a separate component of shareholders' equity from inception of the hedges and are reclassified to the Consolidated Results of Operations in conjunction with the recognition of the underlying hedged item.
For net investment hedges, the remeasurement gain or loss is recorded in AOCI and will be subsequently reclassified to net earnings when the hedged net investment is either sold or substantially liquidated.
Investments in Corporate-Owned Life Insurance
Investments in corporate-owned life insurance (COLI) policies are recorded at their cash surrender values as of each balance sheet date. Changes in the cash surrender value during the period are recorded as a gain or loss within operating expenses. Sysco has the ability and intent to hold certain of its COLI policies to maturity; therefore, the company does not record deferred tax balances related to cash surrender value gains or losses for these policies. The company invests in two COLI policies relating to its executive deferred compensation plan and Supplemental Executive Retirement Plan (SERP). The total amounts related to
49
the company's investments in COLI policies included in other assets in the consolidated balance sheets were $167.9 million and $163.7 million at June 30, 2018 and July 1, 2017 , respectively.
Treasury Stock
The company records treasury stock purchases at cost. Shares removed from treasury are valued at cost using the average cost method. Sysco routinely repurchases shares in the normal course of business; however, in fiscal 2016, Sysco executed a $1.5 billion accelerated share repurchase program, under which it repurchased a total of 34,716,180 shares.
Foreign Currency Translation
The assets and liabilities of all foreign subsidiaries are translated at current exchange rates. Related translation adjustments are recorded as a component of AOCI (loss).
Revenue Recognition
The company recognizes revenue from the sale of a product when it is considered to be realized or realizable and earned. The company determines these requirements to be met at the point at which the product is delivered to the customer. The company grants certain customers sales incentives such as rebates or discounts and treats these as a reduction of sales at the time the sale is recognized. Sales tax collected from customers is not included in revenue but rather recorded as a liability due to the respective taxing authorities. Purchases and sales of inventory with the same counterparty that are entered into in contemplation of one another are considered to be a single nonmonetary transaction. As such, the company records the net effect of such transactions in the consolidated results of operations within sales.
Vendor Consideration
Sysco recognizes consideration received from vendors as a reduction to cost of sales when the services performed in connection with the monies received are completed and when the related product has been sold by Sysco. There are several types of cash consideration received from vendors. In many instances, the vendor consideration is in the form of a specified amount per case or per pound. In these instances, Sysco will recognize the vendor consideration as a reduction of cost of sales when the product is sold. In the situations in which the vendor consideration is not related directly to specific product purchases, Sysco will recognize these as a reduction of cost of sales when the earnings process is complete, the related service is performed and the amounts are realized.
Shipping and Handling Costs
Shipping and handling costs include costs associated with the selection of products and delivery to customers. Included in operating expenses are shipping and handling costs of approximately $3.6 billion , $3.4 billion and $2.6 billion in fiscal 2018 , 2017 and 2016 , respectively.
Insurance Program
Sysco maintains a self-insurance program covering portions of workers' compensation, general and vehicle liability and property insurance costs. The amounts in excess of the self-insured levels are fully insured by third party insurers. In fiscal 2018, Sysco created a wholly owned captive insurance subsidiary (the Captive) with the primary purpose to enhance Sysco's risk financing strategies by providing Sysco the opportunity to negotiate insurance premiums in the non-retail insurance market. The Captive must maintain a sufficient level of cash to fund future reserve payments and secure the insurer's obligations for workers' compensation, general liability and auto liability programs. The Captive holds restricted cash and restricted cash equivalents in a cash deposit account in order to meet solvency requirements. Further, Sysco has letters of credit available to collateralize the remaining liabilities not covered by restricted cash and restricted cash equivalents. The company also maintains a fully self-insured group medical program. Liabilities associated with these risks are estimated in part by considering historical claims experience, medical cost trends, demographic factors, severity factors and other actuarial assumptions.
Share-Based Compensation
Sysco recognizes expense for its share-based compensation based on the fair value of the awards that are granted. The fair value of performance share unit awards is determined based on the target number of shares of common stock and the company's stock price on the date of grant and subsequently adjusted based on actual and forecasted performance compared to planned targets. The fair value of stock options is estimated at the date of grant using the Black-Scholes option pricing model. Option pricing
50
methods require the input of highly subjective assumptions, including the expected stock price volatility. The fair value of restricted stock and restricted stock unit awards are based on the company's stock price on the date of grant. Measured compensation cost is recognized ratably over the vesting period of the related share-based compensation award. The method for estimating the fair value of stock options has not changed in the past 3 years.
Income Taxes
Sysco recognizes deferred tax assets and liabilities based on the estimated future tax consequences attributable to differences between the financial statement carrying amounts of existing assets and liabilities and their respective tax bases. Deferred tax assets and liabilities are measured pursuant to tax laws using rates expected to apply to taxable income in the years in which those temporary differences are expected to be recovered or settled. The impact on deferred tax assets and liabilities of a change in tax rate is recognized in income in the period that includes the enactment date. Valuation allowances are established when necessary to reduce deferred tax assets to the amount more likely than not to be realized.
The determination of the company's provision for income taxes requires significant judgment, the use of estimates and the interpretation and application of complex tax laws. The company's provision for income taxes primarily reflects a combination of income earned and taxed in the various United States (U.S.) federal and state, as well as various foreign jurisdictions. Jurisdictional tax law changes, increases or decreases in permanent differences between book and tax items, accruals or adjustments of accruals for tax contingencies or valuation allowances, and the company's change in the mix of earnings from these taxing jurisdictions all affect the overall effective tax rate.
In fiscal 2018, the U.S. government enacted the Tax Act, comprehensive tax legislation that decreased the federal corporate tax rate from 35% to 21%. For fiscal 2018, Sysco has a 28% rate, rather than 21%, because the law was enacted during the midpoint of the company's fiscal year, requiring us to use a blended average rate. The company's U.S. federal statutory tax rate for fiscal 2019 and beyond will be 21%. As discussed in Note 18 , "Income Taxes," Sysco has recorded provisional estimates for some components of the Tax Act and will refine estimates and determine applicability for other components in future periods.
Acquisitions
Acquisitions of businesses are accounted for using the acquisition method of accounting, and the financial statements include the results of the acquired operations from the respective dates of acquisition.
The purchase price of the acquired entities is preliminarily allocated to the net assets acquired and liabilities assumed based on the estimated fair value at the dates of acquisition, with any excess of cost over the fair value of net assets acquired, including intangibles, recognized as goodwill. Subsequent changes to preliminary amounts are made prospectively.
Basis of Presentation
The financial statements include consolidated balance sheets, consolidated results of operations, consolidated statements of comprehensive income, changes in consolidated shareholders' equity and consolidated cash flows. In the opinion of management, all adjustments, which consist of normal recurring adjustments, except as otherwise disclosed, necessary to present fairly the financial position, results of operations, comprehensive income and cash flows for all periods presented have been made.
Sysco has interests in various jointly owned foodservice operations in Mexico, Panama and Sweden for which it consolidates the results of the operations; therefore, the financial position, results of operations and cash flows for these companies have been included in Sysco's consolidated financial statements. The value of the noncontrolling interest in each entity is considered redeemable due to certain features of the investment agreement and has, therefore, been presented as mezzanine equity, which is outside of permanent equity, in the consolidated balance sheets. The income attributable to the noncontrolling interest is located within Other expense (income), net, in the consolidated results of operations, as this amount is not material. The non-cash add back for the change in the value of the noncontrolling interest is located within Other non-cash items on the consolidated cash flows.
Reclassifications
Prior year amounts have been reclassified to conform with the current year presentation.
Supplemental Cash Flow Information
51
Within the Consolidated Statement of Cash Flows, certain items have been grouped as other financing activities. These primarily includes cash paid for shares withheld to cover taxes from share-based compensation and debt issuance costs.
The following table sets forth the company's reconciliation of cash, cash equivalents and restricted cash reported within the Consolidated Statement of Cash Flows that sum to the total of the same such amounts shown in the Consolidated Statement of Cash Flows:
| Jun. 30, 2018 |
| Jul. 1, 2017 |
| July 2, 2016 | ||||||
| (In thousands) | ||||||||||
Cash and cash equivalents | $ | 552,325 | |
| $ | 869,502 | |
| $ | 3,919,300 | |
Restricted cash | 163,519 | |
| - | |
| - | | |||
Total cash, cash equivalents and restricted cash shown in the Consolidated Statement of Cash Flows | $ | 715,844 | |
| $ | 869,502 | |
| $ | 3,919,300 | |
2. CHANGES IN ACCOUNTING
Stock Compensation
In March 2016, the Financial Accounting Standards Board (FASB) issued ASU 2016-09, Improvements to Employee Share-Based Payment Accounting (Topic 718) . The ASU identifies areas for simplification involving several aspects of accounting for share-based payment transactions, including the income tax consequences, classification of awards as equity or liabilities, an option to recognize gross stock compensation expense with actual forfeitures recognized as they occur, as well as certain classifications on the statement of cash flows. The company adopted this ASU in the first quarter of fiscal 2018. The company elected to maintain the current policy to estimate forfeitures expected to occur to determine stock-based compensation expense. Further, the company adopted the provisions that have changed its accounting for excess tax benefits or detriments. Excess tax benefits or detriments were previously included within additional paid-in capital in the consolidated balance sheet and were a part of the diluted share calculation. On a prospective basis, excess tax benefits or detriments are included within income tax expense in the consolidated results of operations and are no longer a part of the diluted share calculation. Prior periods have not been adjusted. In fiscal 2018 , the company recognized excess tax benefits of $52.1 million from stock option exercises and restricted stock unit vestings that occurred during the period.
The standard also requires several presentation changes with regard to the statement of cash flows, which the company adopted on a retrospective basis; therefore, amounts presented for fiscal 2017 and 2016 in the statement of cash flows reflect the guidance required by this ASU. Cash flows related to excess tax benefits or detriments are included in net cash provided by operating activities, rather than as a financing activity. The standard further requires that cash paid by an employer, when directly withholding shares for tax withholding purposes, should be classified as a financing activity and applied retrospectively. Cash payments to tax authorities in connection with shares withheld to meet statutory income tax withholding requirements are presented as a financing activity in the consolidated statement of cash flows.
Restricted Cash
In August 2016, the FASB issued ASU 2016-18, Statement of Cash Flows: Restricted Cash (Topic 230) . The ASU clarifies the presentation of restricted cash on the statement of cash flows. Amounts generally described as restricted cash and restricted cash equivalents should be included with cash and cash equivalents when reconciling between the beginning and ending cash balances on the statement of cash flows. We retrospectively adopted the standard in the second quarter of fiscal 2018, which was one year earlier than required. The adoption increases the ending cash balance within our statement of cash flows by the aggregate amount of our restricted cash balances and requires a new disclosure to reconcile the cash balances within our statement of cash flows to the balance sheets for each period presented. See Supplemental Cash Flow Information within Note 1 , "Summary of Accounting Policies." For fiscal 2018, $163.5 million of restricted cash is included with cash, cash equivalents and restricted cash. There were no material restricted cash balances in fiscal 2017 and, therefore, there is no material impact to amounts reported for that period.
Simplifying the Test for Goodwill Impairment
In January 2017, the FASB issued ASU 2017-04, Goodwill and Other (Topic 350): Simplifying the Test for Goodwill Impairment , which simplifies the subsequent measurement of goodwill by eliminating Step 2 from the goodwill impairment test. The amendments also eliminate the requirements for any reporting unit with a zero or negative carrying amount to perform a
52
qualitative assessment and, if it fails that qualitative test, to perform Step 2 of the goodwill impairment test. An entity still has the option to perform the qualitative assessment for a reporting unit to determine if the quantitative impairment test is necessary. The company early adopted this ASU in the first quarter of fiscal 2018.
Targeted Improvements to Accounting for Hedging Activities
In August 2017, the FASB issued ASU 2017-12, Derivatives and Hedging (Topic 815): Targeted Improvements to Accounting for Hedging , which expands and refines hedge accounting for both financial and non-financial risk components, aligns the recognition and presentation of the effects of hedging instruments and hedge items in the financial statements, and includes certain targeted improvements to ease the application of current guidance related to the assessment of hedge effectiveness. Sysco has early adopted the standard using the modified retrospective approach to existing hedging relationships as of the second quarter of fiscal 2018, rather than in fiscal 2020, as required by the ASU. Sysco believes that the early adoption of the hedging standard provides a better alignment between risk management activities and hedge accounting, and reduce total cost of ownership of the risk management program. All transition requirements have been applied to hedging relationships existing on the date of adoption and the effect of the adoption is reflected as of the beginning of fiscal 2018. The cumulative effect of the accounting change on the opening balance of retained earnings was immaterial to Sysco's consolidated balance sheet. All required disclosures under ASU 2017-12 have been made in Note 9 , "Derivative Financial Instruments."
Reporting Comprehensive Income
In February 2018, the FASB issued ASU 2018-02, Income Statement - Reporting Comprehensive Income (Topic 220), to allow a reclassification from AOCI to retained earnings for stranded tax effects resulting from the Tax Act. The amendments in this update eliminate the stranded tax effects resulting from the Tax Act; however, the underlying guidance that requires that the effect of a change in tax laws or rates be included in income from continuing operations is not affected. The guidance is effective for fiscal years beginning after December 15, 2018, and interim periods within those fiscal years, which is fiscal 2020 for Sysco, with early adoption permitted. The company early adopted this ASU in the fourth quarter of fiscal 2018, resulting in $236.4 million of accumulated other comprehensive loss being reclassified into retained earnings.
3. NEW ACCOUNTING STANDARDS
Revenue from Contracts with Customers
In May 2014, the FASB issued ASU 2014-09, Revenue from Contracts with Customers (Topic 606), and has issued subsequent amendments to this guidance. This new standard will replace all current guidance on this topic and eliminate all industry-specific guidance. The new revenue recognition standard provides a unified model to determine when and how revenue is recognized. The core principle is that a company should recognize revenue to depict the transfer of promised goods or services to customers in an amount that reflects the consideration for which the entity expects to be entitled in exchange for those goods or services. The guidance is effective for interim and annual periods within new fiscal years beginning after December 15, 2017, which is fiscal 2019 for Sysco. The standard may be applied either retrospectively to each period presented or as a cumulative-effect adjustment as of the date of adoption.
The company has substantially completed its assessment of the accounting required under Topic 606. Sysco does not expect that the implementation of the new standard will have a material effect on the company's financial statements. The company will adopt the standard in the first quarter of fiscal 2019 using the modified retrospective method. Enhanced disclosures, including revenue recognition policies to identify performance obligations to customers and significant judgments in measurement and recognition, are required.
Leases
In February 2016, the FASB issued ASU 2016-02, Leases (Topic 842) , specifying the accounting for leases, which supersedes the leases requirements in Topic 840, Leases . The objective of Topic 842 is to establish the principles that lessees and lessors shall apply to report useful information to users of financial statements about the amount, timing, and uncertainty of cash flows arising from a lease. Lessees are permitted to make an accounting policy election to not recognize the asset and liability for leases with a term of twelve months or less. Lessors' accounting is largely unchanged from the previous accounting standard. In addition, Topic 842 expands the disclosure requirements of lease arrangements. Topic 842 currently requires lessees and lessors to use a modified retrospective transition approach, which includes a number of practical expedients. This guidance is effective for fiscal years, and interim periods within those fiscal years, beginning after December 15, 2018, which is fiscal 2020 for Sysco, with early adoption permitted.
53
In July 2018, the FASB issued ASU 2018-11, Leases (Topic 842): Targeted Improvements , to simplify the lease standard's implementation. The amended guidance relieves businesses and other organizations of the requirement to present prior comparative years' results when they adopt the new lease standard. Instead of recasting prior year results using the new accounting when they adopt the guidance, companies can choose to recognize the cumulative effect of applying the new standard to leased assets and liabilities as an adjustment to the opening balance of retained earnings. The company is currently reviewing the provisions of the new leases standards.
Financial Instruments - Credit Losses
In June 2016, the FASB issued ASU 2016-13, Financial Instruments - Credit Losses (Topic 326): Measurement of Credit Losses on Financial Instruments , which introduces a forward-looking approach, based on expected losses, to estimate credit losses on certain types of financial instruments, including trade receivables. The estimate of expected credit losses will require entities to incorporate considerations of historical information, current information and reasonable and supportable forecasts. This ASU also expands the disclosure requirements to enable users of financial statements to understand the entity's assumptions, models and methods for estimating expected credit losses. This guidance is effective for fiscal years-and interim periods within those fiscal years-beginning after December 15, 2019, which is the first quarter of fiscal 2021 for Sysco, with early adoption permitted. The company is currently reviewing the provisions of the new standard.
Guidance in Presentation of Cash Flows - Classification of Certain Cash Receipts and Cash Payments
In August 2016, the FASB issued ASU 2016-15, Statement of Cash Flows (Topic 230) : Classification of Certain Cash Receipts and Cash Payments , to address eight specific cash flow issues with the objective of reducing the existing diversity in practice. The eight specific issues are: (1) Debt Prepayment or Debt Extinguishment Costs; (2) Settlement of Zero-Coupon Debt Instruments or Other Debt Instruments with Coupon Interest Rates That Are Insignificant in Relation to the Effective Interest Rate of the Borrowing; (3) Contingent Consideration Payments Made after a Businesses Combination; (4) Proceeds from the Settlement of Insurance Claims; (5) Proceeds from the Settlement of Corporate-Owned Life Insurance Policies, including Bank-Owned Life Insurance Policies; (6) Distributions Received from Equity Method Invitees; (7) Beneficial Interests in Securitization Transactions; and (8) Separately Identifiable Cash and Application of the Predominance Principle. The guidance is effective for annual periods beginning after December 15, 2017 and interim periods within those annual periods, which is the first quarter of fiscal 2019 for Sysco. The company has completed its assessment of the accounting required under ASU 2016-15 and does not expect that the implementation of the new standard will have a material effect on the company's cash flow statement.
Improving the Presentation of Net Periodic Pension Cost and Net Periodic Postretirement Benefit Cost
In March 2017, the FASB issued ASU 2017-07, Compensation - Retirement Benefits ( Topic 715 ): Improving the Presentation of Net Periodic Pension Cost and Net Periodic Postretirement Benefit Cost , requiring that an employer report the service cost component of pension and postretirement benefits in the same line item or items as other compensation costs. The other components of net benefit cost are required to be presented in the income statement separately from the service cost component and outside of a subtotal of income from operations. In addition, only the service cost component will be eligible for capitalization as applicable. The guidance is effective for annual periods beginning after December 15, 2017 and interim periods within those annual periods, which is the first quarter of fiscal 2019 for Sysco, and will be applied retroactively. The company has substantially completed its assessment of the accounting required under ASU 2017-07, concluding it will result in net periodic income of $15.0 million for fiscal 2018 and net periodic cost of $1.3 million for fiscal 2017 being recorded in other expense (income) that was previously included in operating expense.
4. ACQUISITIONS
During fiscal 2018 , the company paid cash of $248.1 million for acquisitions. These acquisitions did not have a material effect on the company's operating results, cash flows or financial position. Certain acquisitions involve contingent consideration that may include earnout agreements that are typically payable over periods of up to three years in the event that certain operating results are achieved. As of June 30, 2018 , aggregate contingent consideration outstanding was $15.6 million , of which $10.6 million was recorded as earnout liabilities.
Brakes Group
On July 5, 2016 , Sysco consummated its acquisition of Cucina Lux Investments Limited (a private company limited by shares organized under the laws of England and Wales), a holding company of the Brakes Group, pursuant to an agreement for the sale and purchase of securities in the capital of the Brakes Group, dated as of February 19, 2016 , by and among Sysco, entities
54
affiliated with Bain Capital Investors, LLC, and members of management of the Brakes Group (the Brakes Acquisition). The company paid cash of $2.9 billion, net of cash acquired, for the Brakes Acquisition. Following the closing of the Brakes Acquisition, the Brakes Group became a wholly owned subsidiary of Sysco. Purchase accounting for this acquisition was finalized in fiscal 2017.
The Brakes Group is a large European foodservice business supplying fresh, refrigerated and frozen food products, as well as non-food products and supplies, to foodservice customers ranging from large customers, including leisure, pub, restaurant, hotel and contract catering groups, to smaller customers, including independent restaurants, hotels, fast food outlets, schools and hospitals. Brakes Group businesses include: Brakes, Brakes Catering Equipment, Brake France, Country Choice, Davigel, Fresh Direct, Freshfayre, M&J Seafood, Menigo Foodservice, Pauley's, Wild Harvest and Woodward Foodservice. The Brakes Group's largest businesses are in the United Kingdom (U.K.), France, and Sweden, in addition to a presence in Ireland, Belgium, Spain and Luxembourg.
5. FAIR VALUE MEASUREMENTS
Fair value is defined as the price that would be received to sell an asset or paid to transfer a liability in an orderly transaction between market participants at the measurement date (i.e., an exit price). The accounting guidance includes a fair value hierarchy that prioritizes the inputs to valuation techniques used to measure fair value. The three levels of the fair value hierarchy are as follows:
• | Level 1 – Unadjusted quoted prices for identical assets or liabilities in active markets; |
• | Level 2 – Inputs other than quoted prices in active markets for identical assets and liabilities that are observable either directly or indirectly for substantially the full term of the asset or liability; and |
• | Level 3 – Unobservable inputs for the asset or liability, which include management's own assumption about the assumptions market participants would use in pricing the asset or liability, including assumptions about risk. |
Sysco's policy is to invest in only high-quality investments. Cash equivalents primarily include cash deposits, time deposits, certificates of deposit, commercial paper, high-quality money market funds and all highly liquid instruments with original maturities of three months or less.
The following is a description of the valuation methodologies used for assets and liabilities measured at fair value:
• | Cash deposits included in cash equivalents are valued at amortized cost, which approximates fair value. These are included within cash equivalents as a Level 1 measurement in the tables below. |
• | Time deposits and commercial paper included in cash equivalents are valued at amortized cost, which approximates fair value. These are included within cash equivalents as a Level 2 measurement in the tables below. |
• | Money market funds are valued at the closing price reported by the fund sponsor from an actively traded exchange. These are included within cash equivalents as Level 1 measurements in the tables below. |
• | The interest rate swap agreements are valued using a swap valuation model that utilizes an income approach using observable market inputs including interest rates, LIBOR swap rates and credit default swap rates. |
• | The foreign currency swap agreements, including cross-currency swaps, are valued using a swap valuation model that utilizes an income approach applying observable market inputs, including interest rates, LIBOR swap rates for U.S. dollars, Canadian dollars, pound sterling and Euro currencies, and credit default swap rates. |
• | Foreign currency forwards are valued based on exchange rates quoted by domestic and foreign banks for similar instruments. |
• | Fuel swap contracts are valued based on observable market transactions of forward commodity prices. |
The fair value of the company's derivative instruments are all measured using inputs that are considered a Level 2 measurement, as they are not actively traded and are valued using pricing models that use observable market quotations. The location and the fair value of derivative assets and liabilities designated as hedges in the consolidated balance sheet are disclosed in Note 9 , "Derivative Financial Instruments."
55
The following tables present the company's assets and liabilities measured at fair value on a recurring basis as of June 30, 2018 and July 1, 2017 :
| Assets and Liabilities Measured at Fair Value as of Jun. 30, 2018 | ||||||||||||||
| Level 1 |
| Level 2 |
| Level 3 |
| Total | ||||||||
| (In thousands) | ||||||||||||||
Assets: |
|
|
|
|
|
|
| ||||||||
Cash equivalents |
|
|
|
|
|
|
| ||||||||
Cash and cash equivalents | $ | 169,214 | |
| $ | 30,190 | |
| $ | - | |
| $ | 199,404 | |
Other assets (1) | 163,519 | |
| - | |
| - | |
| 163,519 | | ||||
Total assets at fair value | $ | 332,733 | |
| $ | 30,190 | |
| $ | - | |
| $ | 362,923 | |
(1) Represents restricted cash balance recorded within other assets in the consolidated balance sheet.
| Assets and Liabilities Measured at Fair Value as of Jul. 1, 2017 | ||||||||||||||
| Level 1 |
| Level 2 |
| Level 3 |
| Total | ||||||||
| (In thousands) | ||||||||||||||
Assets: |
|
|
|
|
|
|
| ||||||||
Cash equivalents |
|
|
|
|
|
|
| ||||||||
Cash and cash equivalents | $ | 238,954 | |
| $ | 49,430 | |
| $ | - | |
| $ | 288,384 | |
Total assets at fair value | $ | 238,954 | |
| $ | 49,430 | |
| $ | - | |
| $ | 288,384 | |
The carrying values of accounts receivable and accounts payable approximated their respective fair values due to their short-term maturities. The fair value of Sysco's total debt is estimated based on the quoted market prices for the same or similar issue or on the current rates offered to the company for new debt with the same maturities as existing debt, and is considered a Level 2 measurement. The fair value of total debt was approximately $8.4 billion and $8.6 billion as of June 30, 2018 and July 1, 2017 , respectively. The carrying value of total debt was $8.3 billion and $8.2 billion as of June 30, 2018 and July 1, 2017 , respectively.
6. ALLOWANCE FOR DOUBTFUL ACCOUNTS
A summary of the activity in the allowance for doubtful accounts appears below:
| 2018 |
| 2017 |
| 2016 | ||||||
| (In thousands) | ||||||||||
Balance at beginning of period | $ | 31,059 | |
| $ | 37,880 | |
| $ | 41,720 | |
Charged to costs and expenses | 21,448 | |
| 20,672 | |
| 20,372 | | |||
Customer accounts written off, net of recoveries | (27,120 | ) |
| (26,943 | ) |
| (23,551 | ) | |||
Other adjustments | 381 | |
| (550 | ) |
| (661 | ) | |||
Balance at end of period | $ | 25,768 | |
| $ | 31,059 | |
| $ | 37,880 | |
56
7. PLANT AND EQUIPMENT
A summary of plant and equipment, including the related accumulated depreciation, appears below:
| Jun. 30, 2018 |
| Jul. 1, 2017 |
| Estimated Useful Lives | ||||
| (In thousands) |
|
| ||||||
Plant and equipment at cost: |
| |
|
| |
|
| ||
Land | $ | 495,909 | |
| $ | 477,577 | |
|
|
Buildings and improvements | 4,268,687 | |
| 4,072,339 | |
| 10-30 years | ||
Fleet and equipment | 3,808,133 | |
| 3,595,095 | |
| 3-10 years | ||
Computer hardware and software | 1,628,121 | |
| 1,554,122 | |
| 3-7 years | ||
Total plant and equipment at cost | 10,200,850 | |
| 9,699,133 | |
|
| ||
Accumulated depreciation | (5,679,190 | ) |
| (5,321,831 | ) |
|
| ||
Total plant and equipment, net | $ | 4,521,660 | |
| $ | 4,377,302 | |
|
|
Depreciation expense, including amortization of capital leases, was $614.8 million in 2018 , $765.4 million in 2017 and $608.7 million in 2016 .
In fiscal 2016 , Sysco announced its revised business technology strategy focused on improving the customer experience. In refocusing its technology approach, Sysco created plans to modernize and add new capability and functionality to its existing SUS Enterprise Resource Planning (ERP) system. In connection with this strategy, Sysco created plans to remove the SAP ERP platform then used by 12 of its operating companies by the end of fiscal 2017 . Sysco concluded that the projects under development would not be completed and expensed the $31.6 million in construction in progress in fiscal 2016 within operating expense in the consolidated results of operations. The company tested the internal use software for the SAP ERP platform for impairment on an undiscounted cash flow basis and concluded that those cash flows would be sufficient to recover the full asset value; however, Sysco shortened the remaining life of the internal use assets to fiscal 2017, concurrent with the expected time frame to fully migrate the 12 operating companies to the SUS ERP system, which was completed as of July 1, 2017. For fiscal years 2017 and 2016 , Sysco recognized an additional $111.3 million and $41.9 million , respectively, in accelerated depreciation expense as a result of shortening the useful lives of these assets.
8. GOODWILL AND OTHER INTANGIBLES
The changes in the carrying amount of goodwill by reportable segment for the years presented are as follows:
| U.S. Foodservice Operations |
| International Foodservice Operations |
| SYGMA |
| Other |
| Total | ||||||||||
| (In thousands) | ||||||||||||||||||
Carrying amount as of July 2, 2016 | $ | 1,220,702 | |
| $ | 632,700 | |
| $ | 32,607 | |
| $ | 235,652 | |
| $ | 2,121,661 | |
Goodwill acquired during year | - | |
| 1,815,890 | |
| - | |
| - | |
| 1,815,890 | | |||||
Currency translation/other | 10,343 | |
| (16,082 | ) |
| - | |
| (15,684 | ) |
| (21,423 | ) | |||||
Carrying amount as of July 1, 2017 | $ | 1,231,045 | |
| $ | 2,432,508 | |
| $ | 32,607 | |
| $ | 219,968 | |
| $ | 3,916,128 | |
Goodwill acquired during year | 36,020 | |
| 20,648 | |
| - | |
| - | |
| 56,668 | | |||||
Currency translation/other | (6,165 | ) |
| (12,335 | ) |
| - | |
| 1,189 | |
| (17,311 | ) | |||||
Carrying amount as of June 30, 2018 | $ | 1,260,900 | |
| $ | 2,440,821 | |
| $ | 32,607 | |
| $ | 221,157 | |
| $ | 3,955,485 | |
Amortizable intangible assets acquired during fiscal 2018 were $31.4 million , with a weighted-average amortization period of 14.0 years . Amortizable intangible assets acquired during fiscal 2018 by category were customer relationships and non-compete of $30.6 million and $0.8 million , respectively, with a weighted-average amortization period of 14.4 years and 4.0 years , respectively.
57
Fully amortized intangible assets have been removed in the period fully amortized in the table below, which presents the company's amortizable intangible assets in total by category as follows:
| Jun. 30, 2018 |
| Jul. 1, 2017 | ||||||||||||||||||||
| Gross Carrying Amount |
| Accumulated Amortization |
| Net |
| Gross Carrying Amount |
| Accumulated Amortization |
| Net | ||||||||||||
| (In thousands) | ||||||||||||||||||||||
Customer relationships | $ | 1,119,136 | |
| $ | (307,408 | ) |
| $ | 811,728 | |
| $ | 1,073,577 | |
| $ | (209,253 | ) |
| $ | 864,324 | |
Non-compete agreements | 31,754 | |
| (28,819 | ) |
| 2,935 | |
| 32,385 | |
| (25,384 | ) |
| 7,001 | | ||||||
Trademarks | 10,073 | |
| (7,058 | ) |
| 3,015 | |
| 11,050 | |
| (7,002 | ) |
| 4,048 | | ||||||
Other | 13,623 | |
| (13,548 | ) |
| 75 | |
| 13,622 | |
| (10,704 | ) |
| 2,918 | | ||||||
Total amortizable intangible | $ | 1,174,586 | |
| $ | (356,833 | ) |
| $ | 817,753 | |
| $ | 1,130,634 | |
| $ | (252,343 | ) |
| $ | 878,291 | |
The table below presents the company's indefinite-lived intangible assets by category as follows:
| Jun. 30, 2018 |
| Jul. 1, 2017 | ||||
| (In thousands) | ||||||
Trademarks | $ | 161,093 | |
| $ | 158,251 | |
Licenses | 966 | |
| 969 | | ||
Total indefinite-lived intangible assets | $ | 162,059 | |
| $ | 159,220 | |
Amortization expense for 2018 , 2017 and 2016 was $114.7 million , $112.9 million and $37.3 million , respectively. The estimated future amortization expense for the next five fiscal years on intangible assets outstanding as of June 30, 2018 is shown below:
| Amount | ||
| (In thousands) | ||
2019 | $ | 102,586 | |
2020 | 98,536 | | |
2021 | 89,469 | | |
2022 | 86,878 | | |
2023 | 82,634 | | |
9. DERIVATIVE FINANCIAL INSTRUMENTS
Sysco uses derivative financial instruments to enact hedging strategies for risk mitigation purposes; however, the company does not use derivative financial instruments for trading or speculative purposes. Hedging strategies are used to manage interest rate risk, foreign currency risk and fuel price risk.
Hedging of interest rate risk
Sysco manages its debt portfolio with interest rate swaps from time to time to achieve an overall desired position of fixed and floating rates. In March 2018 , the company entered into an interest rate swap agreement that effectively converted $500.0 million of fixed rate debt maturing in 2025 to floating rate debt.
58
Hedging of foreign currency risk
Sysco entered into cross-currency swap contracts to hedge the foreign currency transaction risk of certain Canadian dollar and pound sterling-denominated intercompany loans in fiscal 2018 and fiscal 2017, respectively. There are no credit-risk related contingent features associated with these swaps, which have been designated as cash flow hedges. In fiscal 2017, the company had also entered into cross-currency swap contracts and Euro-bond denominated debt that hedge the foreign currency exposure of our net investment in certain foreign operations. Additionally, Sysco's operations in Europe have inventory purchases denominated in currencies other than their functional currency, such as the Euro, U.S. dollar, Polish zloty and Danish krone. These inventory purchases give rise to foreign currency exposure between the functional currency of each entity and these currencies. The company enters into foreign currency forward swap contracts to sell the applicable entity's functional currency and buy currencies matching the inventory purchase, which operate as cash flow hedges of the company's foreign currency-denominated inventory purchases.
Sysco uses certain foreign currency contracts to hedge the effects of fluctuations in exchange rates on certain intercompany loans. The company does not formally designate and document such derivative instruments as hedging instruments; however, the instruments are an effective economic hedge of the underlying foreign currency exposure. Both the gain or loss on the derivative instrument and the offsetting gain or loss on the underlying intercompany loans are recognized in earnings immediately, thereby eliminating or reducing the impact of foreign currency exchange rate fluctuations on net earnings.
Hedging of fuel price risk
In fiscal 2017, Sysco began utilizing fuel commodity swap contracts to hedge against the risk of the change in the price of diesel on anticipated future purchases. These swaps have been designated as cash flow hedges.
None of the Company's hedging instruments contain credit-risk-related contingent features. Details of outstanding hedging instruments as of June 30, 2018 are below:
Maturity Date of the Hedging Instrument |
| Currency / Unit of Measure |
| Notional Value |
|
|
|
| (In millions) |
Hedging of interest rate risk |
|
|
|
|
April 2019 |
| U.S. Dollar |
| 500 |
October 2020 |
| U.S. Dollar |
| 750 |
July 2021 |
| U.S. Dollar |
| 500 |
March 2025 |
| U.S. Dollar |
| 500 |
|
|
|
|
|
Hedging of foreign currency risk (1) |
|
|
|
|
June 2019 |
| U.S. Dollar |
| 384 |
June 2021 |
| U.S. Dollar |
| 44 |
June 2021 |
| Canadian Dollar |
| 300 |
July 2021 |
| Canadian Dollar |
| 30 |
July 2021 |
| British Pound Sterling |
| 234 |
August 2021 |
| British Pound Sterling |
| 466 |
June 2023 |
| Euro |
| 500 |
|
|
|
|
|
Hedging of fuel risk |
|
|
|
|
Various (July 2018 to June 2019) |
| Gallons |
| 46 |
(1) | Foreign currency forward contracts used to hedge against foreign exchange exposures related to inventory purchases are not material to Sysco's overall hedging portfolio. |
59
The location and the fair value of derivative instruments designated as hedges in the consolidated balance sheet as of June 30, 2018 , July 1, 2017 and July 2, 2016 are as follows:
|
|
| Derivative Fair Value | ||||||
| Balance Sheet Location |
| Jun. 30, 2018 |
| Jul. 1, 2017 | ||||
|
|
| (In thousands) | ||||||
Fair Value Hedges: |
|
|
|
|
| ||||
Interest rate swaps | Other current assets |
| $ | - | |
| $ | 707 | |
Interest rate swaps | Other current liabilities |
| 6,820 | |
| - | | ||
Interest rate swaps | Other long-term liabilities |
| 49,734 | |
| 21,390 | | ||
|
|
|
|
|
| ||||
Cash Flow Hedges: |
|
|
|
|
| ||||
Fuel Swaps | Other current assets |
| $ | 15,316 | |
| $ | 717 | |
Foreign currency forwards | Other current assets |
| 693 | |
| - | | ||
Cross currency swaps | Other current assets |
| 4,284 | |
| - | | ||
Cross currency swaps | Other assets |
| 3,454 | |
| - | | ||
Fuel Swaps | Other current liabilities |
| - | |
| 6,160 | | ||
Foreign currency forwards | Other current liabilities |
| 71 | |
| 154 | | ||
Fuel swaps | Other long-term liabilities |
| - | |
| 160 | | ||
Cross currency swaps | Other long-term liabilities |
| 14,201 | |
| 5,816 | | ||
|
|
|
|
|
| ||||
Net Investment Hedges: |
|
|
|
|
| ||||
Foreign currency swaps | Other assets |
| $ | 10,709 | |
| $ | - | |
Foreign currency swaps | Other long-term liabilities |
| 39,690 | |
| 12,308 | | ||
Foreign denominated debt | Long-term debt |
| 584,150 | |
| 571,450 | | ||
The location and amount of gains or losses recognized in the consolidated results of operations for fair value and cash flow hedging relationships for each of the periods, presented on a pretax basis, are as follows:
|
| 2018 | ||||||||||
|
| Cost of Goods Sold |
| Operating Expense |
| Interest Expense | ||||||
|
| (In thousands) | ||||||||||
Total amounts of income and expense line items presented in the consolidated results of operations in which the effects of fair value or cash flow hedges are recorded |
| $ | 47,641,933 | |
| $ | 8,756,417 | |
| $ | 395,483 | |
Gain or (loss) on fair value hedging relationships: |
|
|
|
|
|
| ||||||
Interest contracts: |
|
|
|
|
|
| ||||||
Hedged items (1) |
| $ | - | |
| $ | - | |
| $ | (30,418 | ) |
Derivatives designated as hedging instruments |
| - | |
| - | |
| (39,540 | ) | |||
Gain or (loss) on cash flow hedging relationships: |
|
|
|
|
|
| ||||||
Fuel swaps: |
|
|
|
|
|
| ||||||
Gain or (loss) reclassified from AOCI into income |
| $ | - | |
| $ | 13,983 | |
| $ | - | |
Foreign currency contracts: |
|
|
|
|
|
| ||||||
Gain or (loss) reclassified from AOCI into income |
| $ | 1,776 | |
| $ | - | |
| $ | - | |
Interest contracts: |
|
|
|
|
|
| ||||||
Gain or (loss) reclassified from AOCI into income (2) |
| $ | - | |
| $ | - | |
| $ | (11,499 | ) |
(1) | The hedged total includes interest expense of $63.5 million and change in fair value of debt of $33.1 million . |
(2) | Losses reclassified from AOCI into income represent amortization of losses on forward starting interest rate swap agreements that were previously settled. |
60
The location and effect of cash flow and net investment hedge accounting on the consolidated statements of comprehensive income for the fiscal period ended June 30, 2018 , presented on a pretax basis, are as follows:
| 2018 | ||||||||
| Amount of Gain or (Loss) Recognized in Other Comprehensive Income on Derivatives |
| Location of Gain or (Loss) Reclassified from Accumulated Other Comprehensive Income into Income |
| Amount of Gain or (Loss) Reclassified from Accumulated Other Comprehensive Income into Income | ||||
| (In thousands) |
|
|
| (In thousands) | ||||
Derivatives in cash flow hedging relationships: |
|
|
|
|
| ||||
Fuel swaps | $ | 21,878 | |
| Operating expense |
| $ | 13,983 | |
Foreign currency contracts | 1,118 | |
| Cost of goods sold |
| 1,776 | | ||
Total | $ | 22,996 | |
|
|
| $ | 15,759 | |
|
|
|
|
|
| ||||
Derivatives in net investment hedging relationships: |
|
|
|
|
| ||||
Foreign currency contracts | $ | (20,584 | ) |
| N/A |
| $ | - | |
Foreign denominated debt | (12,700 | ) |
| N/A |
| - | | ||
Total | $ | (33,284 | ) |
|
|
| $ | - | |
The location and carrying amount of hedged liabilities in the consolidated balance sheet as of June 30, 2018 are as follows:
| Jun. 30, 2018 | ||||||
| Carrying Amount of Hedged Assets (Liabilities) |
| Cumulative Amount of Fair Value Hedging Adjustments Included in the Carrying Amount of Hedged Assets (Liabilities) | ||||
| (In thousands) | ||||||
Balance sheet location: |
|
|
| ||||
Current maturities of long-term debt | $ | (499,610 | ) |
| $ | 5,097 | |
Long-term debt | (1,743,732 | ) |
| 47,555 | | ||
10. SELF-INSURED LIABILITIES
Sysco maintains a self-insurance program covering portions of workers' compensation, general and vehicle liability and property insurance costs. The amounts in excess of the self-insured levels are fully insured by third party insurers. The company also maintains a fully self-insured group medical program. A summary of the activity in self-insured liabilities appears below:
| 2018 |
| 2017 |
| 2016 | ||||||
| (In thousands) | ||||||||||
Balance at beginning of period | $ | 245,811 | |
| $ | 199,059 | |
| $ | 193,312 | |
Charged to costs and expenses | 461,867 | |
| 523,674 | |
| 418,917 | | |||
Payments | (436,692 | ) |
| (476,922 | ) |
| (413,170 | ) | |||
Balance at end of period | $ | 270,986 | |
| $ | 245,811 | |
| $ | 199,059 | |
The long-term portion of the self-insured liability balance was $167.1 million and $153.1 million as of June 30, 2018 and July 1, 2017, respectively.
61
11. DEBT AND OTHER FINANCING ARRANGEMENTS
Sysco's debt consists of the following:
| Jun. 30, 2018 |
| Jul. 1, 2017 | ||||
| (In thousands) | ||||||
Commercial paper, interest at 1.42% as of July 1, 2017 | $ | - | |
| $ | 119,691 | |
Senior notes, interest at 5.25%, matured in fiscal 2018 (1) | - | |
| 500,311 | | ||
Senior notes, interest at 1.90%, maturing in fiscal 2019 (1) | 491,700 | |
| 491,260 | | ||
Senior notes, interest at 5.375%, maturing in fiscal 2019 (1) | 249,701 | |
| 249,456 | | ||
Senior notes, interest at 2.60%, maturing in fiscal 2021 (1) | 724,047 | |
| 739,239 | | ||
Senior notes, interest at 2.50%, maturing in fiscal 2022 (1) | 477,411 | |
| 488,554 | | ||
Senior notes, interest at 2.60%, maturing in fiscal 2022 (1) | 446,681 | |
| 445,853 | | ||
Senior notes, interest at 1.25%, maturing in fiscal 2023 (1) | 580,196 | |
| 566,767 | | ||
Senior notes, interest at 3.55%, maturing in fiscal 2025 (1) | 492,606 | |
| - | | ||
Senior notes, interest at 3.75%, maturing in fiscal 2026 (1) | 746,879 | |
| 746,288 | | ||
Senior notes, interest at 3.30%, maturing in fiscal 2027 (1) | 992,176 | |
| 991,370 | | ||
Debentures, interest at 7.16%, maturing in fiscal 2027 (2) | 44,276 | |
| 50,000 | | ||
Senior notes, interest at 3.25%, maturing in fiscal 2028 (1) | 742,555 | |
| 742,526 | | ||
Debentures, interest at 6.50%, maturing in fiscal 2029 (1) | 162,276 | |
| 223,822 | | ||
Senior notes, interest at 5.375%, maturing in fiscal 2036 (1) | 382,010 | |
| 497,089 | | ||
Senior notes, interest at 6.625%, maturing in fiscal 2039 (1) | 201,766 | |
| 248,396 | | ||
Senior notes, interest at 4.85%, maturing in fiscal 2046 (1) | 495,709 | |
| 495,552 | | ||
Senior notes, interest at 4.50%, maturing in fiscal 2046 (1) | 494,090 | |
| 493,981 | | ||
Senior notes, interest at 4.45%, maturing in fiscal 2048 (1) | 493,165 | |
| - | | ||
Notes payable, capital leases, and other debt, interest averaging 6.33% and maturing at various dates to fiscal 2026 as of June 30, 2018 and 6.14% and maturing at various dates to fiscal 2026 as of July 1, 2017 | 110,026 | |
| 104,735 | | ||
Total debt | 8,327,270 | |
| 8,194,890 | | ||
Less current maturities of long-term debt | (782,329 | ) |
| (530,075 | ) | ||
Less notes payable | (4,176 | ) |
| (3,938 | ) | ||
Net long-term debt | $ | 7,540,765 | |
| $ | 7,660,877 | |
(1) | Represents senior notes that are unsecured, are not subject to any sinking fund requirement and include a redemption provision that allows Sysco to retire the debentures and notes at any time prior to maturity at the greater of par plus accrued interest or an amount designed to ensure that the debenture and note holders are not penalized by the early redemption. |
(2) | This debenture is not subject to any sinking fund requirement and is no longer redeemable prior to maturity. |
As of June 30, 2018 , the principal payments required to be made during the next five fiscal years on long-term debt, excluding notes payable and commercial paper, are shown below:
| Amount | ||
| (In thousands) | ||
2019 | $ | 788,309 | |
2020 | 23,764 | | |
2021 | 768,076 | | |
2022 | 962,884 | | |
2023 | 590,112 | | |
Sysco has a commercial paper program allowing the company to issue short-term unsecured notes in an aggregate amount not to exceed $2 billion . As of June 30, 2018 , there were no commercial paper issuances outstanding. Any outstanding amounts are classified within long-term debt, as the program is supported by a long-term revolving credit facility. During the first 52 weeks
62
of 2018 , aggregate outstanding commercial paper issuances and short-term bank borrowings ranged from zero to approximately $1.5 billion .
Senior notes offering
On March 19, 2018 , Sysco issued senior notes (the Notes) totaling $1.0 billion . Details of the Notes are as follows:
Maturity Date |
| Par Value |
| Coupon Rate |
| Pricing | ||||
March 15, 2025 (the 2025 Notes) |
| $ | 500 | |
| 3.55 | % |
| 99.480 | % |
March 15, 2048 (the 2048 Notes) |
| 500 | |
| 4.45 | |
| 99.378 | | |
The Notes initially are fully and unconditionally guaranteed by Sysco's direct and indirect wholly owned subsidiaries that guarantee Sysco's other senior notes issued under the indenture governing the Notes or any of Sysco's other indebtedness. Interest on the Notes will be paid semi-annually on March 15 and September 15, beginning September 15, 2018. At Sysco's option, any or all of the Notes may be redeemed, in whole or in part, at any time prior to maturity. If Sysco elects to redeem (i) the 2025 Notes before the date that is two months prior to the maturity date or (ii) the 2048 Notes before the date that is six months prior to the maturity date, Sysco will pay an amount equal to the greater of 100% of the principal amount of the Notes to be redeemed or the sum of the present values of the remaining scheduled payments of principal and interest on the Notes to be redeemed. If Sysco elects to redeem a series of Notes on or after the applicable date described in the preceding sentence, Sysco will pay an amount equal to 100% of the principal amount of the Notes to be redeemed. Sysco will pay accrued and unpaid interest on the Notes redeemed to the redemption date.
Senior notes and debentures redemption related to the tender offer
Sysco used a portion of the net proceeds of the offering to fund the purchase, pursuant to a tender offer, of $230.5 million in combined aggregate principal amount of the following securities: its 7.160% debentures due 2027, its 6.500% debentures due 2028, its 5.375% senior notes due 2035 and its 6.625% senior notes due 2039. Holders of securities received an early tender payment of $50 per $1,000 principal amount of securities. Holders of such securities also received accrued and unpaid interest from, and including, the last interest payment date for their tendered securities, but not including, the early settlement date, which was March 23, 2018. The tender offer transaction was considered to be a debt extinguishment. As such, Sysco recognized a loss on extinguishment of $53.1 million , which was recorded as a component of interest expense in the accompanying consolidated results of operations. Of this loss, $51.2 million was attributable to the purchase premium paid to the lenders, $1.1 million was attributable to the write-off of unamortized debt issuance costs associated with the redeemed debentures and notes, and $0.8 million was attributable to an accelerated charge on the debt discount related to these debentures and notes.
Details of the debentures and senior notes purchased are as follows:
Maturity Date |
| Par Value |
| Coupon Rate |
| Principal amount tendered |
| Remaining Par Value after tender offer |
| Cash amount paid (including interest) | |||||||||
|
| (Dollars in millions) | |||||||||||||||||
April 15, 2027 |
| $ | 50 | |
| 7.160 | % |
| $ | 5.7 | |
| $ | 44.3 | |
| $ | 7.4 | |
August 1, 2028 |
| 225 | |
| 6.500 | |
| 61.9 | |
| 163.1 | |
| 77.3 | | ||||
September 21, 2035 |
| 500 | |
| 5.375 | |
| 115.9 | |
| 384.1 | |
| 134.3 | | ||||
March 17, 2039 |
| 250 | |
| 6.625 | |
| 47.0 | |
| 203.0 | |
| 63.7 | | ||||
The remaining net proceeds from the offering were used to fund a pension contribution, repay outstanding borrowings under Sysco's commercial paper program and for other general corporate purposes.
In February 2018, Sysco repaid 5.25% senior notes totaling $500.0 million at maturity utilizing commercial paper borrowings.
As of June 30, 2018 and July 1, 2017 , letters of credit outstanding were $221.7 million and $191.3 million , respectively.
63
12. LEASES
Sysco has obligations under capital and operating leases for certain distribution facilities, vehicles, equipment and computers. Total rental expense under operating leases was $184.1 million , $170.5 million , and $100 million in fiscal 2018 , 2017 and 2016 , respectively. Contingent rentals, subleases and assets and obligations under capital leases are not significant.
Aggregate minimum lease payments by fiscal year under existing long-term operating leases are as follows:
| Amount | ||
| (In thousands) | ||
2019 | $ | 111,560 | |
2020 | 94,012 | | |
2021 | 77,319 | | |
2022 | 65,157 | | |
2023 | 51,173 | | |
Thereafter | 266,137 | | |
13. COMPANY-SPONSORED EMPLOYEE BENEFIT PLANS
Sysco has company-sponsored defined benefit and defined contribution retirement plans for its employees. Also, the company provides certain health care benefits to eligible retirees and their dependents.
Defined Contribution Plans
The company operates a defined contribution 401(k) Plan as a Safe Harbor Plan, which is a plan that treats all employees' benefits equally within the plan, under Sections 401(k) and 401(m) of the Internal Revenue Code with respect to non-union employees and those union employees whose unions adopted the Safe Harbor Plan provisions. The company will make a non-elective contribution each pay period equal to 3% of a participant's compensation. Additionally, the company will make matching contributions of 50% of a participant's pretax contribution on the first 6% of the participant's compensation contributed by the participant. The pretax matching contribution limit was increased from 5% to 6% effective January 1, 2018. Certain employees are also eligible for a transition contribution, and the company may also make discretionary contributions. For union employees who are members of unions that did not adopt the Safe Harbor Plan provisions, the plan provides that under certain circumstances the company may make matching contributions of up to 50% of the first 6% of a participant's compensation.
The company also has a nonqualified, unfunded Management Savings Plan (MSP) available to key management personnel who are participants in the Management Incentive Plan (MIP). Participants may defer up to 50% of their annual salary and up to 100% of their annual bonus. The company will make a non-elective contribution each pay period equal to 3% of a participant's compensation. Additionally, the company will make matching contributions of 50% of a participant's pretax contribution on the first 5% of the participant's eligible compensation that is deferred. Certain employees are also eligible for a transition contribution, and the company may also make discretionary contributions. All company contributions to the MSP are limited by the amounts contributed by the company to the participant's 401(k) account.
Sysco's expense related to its defined contribution plans was $151.0 million in fiscal 2018 , $141.2 million in fiscal 2017 , and $ 135.5 million in fiscal 2016 .
Defined Benefit Plans
Sysco maintains various qualified pension plans that pay benefits to participating employees at retirement, using formulas based on a participant's years of service and compensation. The U.S. pension plan (U.S. Retirement Plan) is frozen for all U.S.-based salaried and non-union hourly employees, as these employees are eligible for benefits under the company's defined contribution 401(k) plan. Various defined benefit pension plans cover certain employees, primarily in the U.K., France and Sweden; however, the U.K. pension plan (U.K. Retirement Plan) is frozen to new plan participants. The funding policy for each plan complies with the requirements of relevant governmental laws and regulations.
In addition to receiving benefits upon retirement under the company's U.S. Retirement Plan, certain key management personnel who were participants in the MIP are entitled to receive benefits under the SERP. This plan is a nonqualified, unfunded
64
supplementary retirement plan. This plan is frozen to all participants, and current MIP participants are eligible to participate in the MSP.
The company also provides certain health care benefits to eligible retirees and their dependents. These health care benefits represent Sysco's unfunded other postretirement medical plans. The plan had benefit obligations of $14.3 million as of June 30, 2018 and $13.6 million as of July 1, 2017 .
Funded Status
Accumulated pension assets measured against the obligation for pension benefits represents the funded status of a given plan. The funded status of Sysco's company-sponsored defined benefit plans is presented in the table below. The caption "U.S. Pension Benefits" in the tables below includes both the U.S. Retirement Plan and the SERP.
| U.S. Pension Benefits |
| International Pension Benefits | ||||||||||||
| Jun. 30, 2018 |
| Jul. 1, 2017 |
| Jun. 30, 2018 |
| Jul. 1, 2017 | ||||||||
| (In thousands) | ||||||||||||||
Change in benefit obligation: |
| |
|
| |
|
|
|
| ||||||
Benefit obligation at beginning of year | $ | 4,224,231 | |
| $ | 4,284,776 | |
| $ | 420,735 | |
| $ | 400,028 | |
Service cost | 14,514 | |
| 14,287 | |
| 3,219 | |
| 2,880 | | ||||
Interest cost | 173,827 | |
| 171,282 | |
| 10,667 | |
| 9,951 | | ||||
Amendments | - | |
| 925 | |
| (4,624 | ) |
| (110 | ) | ||||
Curtailments | - | |
| - | |
| - | |
| (611 | ) | ||||
Actuarial (gain) loss, net | (89,253 | ) |
| (86,680 | ) |
| (21,162 | ) |
| 26,528 | | ||||
Total disbursements | (280,308 | ) |
| (160,359 | ) |
| (13,817 | ) |
| (13,879 | ) | ||||
Exchange rate changes | - | |
| - | |
| 3,982 | |
| (4,052 | ) | ||||
Benefit obligation at end of year | 4,043,011 | |
| 4,224,231 | |
| 399,000 | |
| 420,735 | | ||||
Change in plan assets: |
|
|
| |
|
|
|
| |||||||
Fair value of plan assets at beginning of year | 3,341,662 | |
| 3,115,040 | |
| 259,372 | |
| 271,821 | | ||||
Actual return on plan assets | 196,051 | |
| 333,890 | |
| 897 | |
| 1,938 | | ||||
Employer contribution | 409,003 | |
| 53,091 | |
| 7,960 | |
| 4,530 | | ||||
Total disbursements | (280,308 | ) |
| (160,359 | ) |
| (13,817 | ) |
| (13,880 | ) | ||||
Exchange rate changes | - | |
| - | |
| 3,616 | |
| (5,037 | ) | ||||
Fair value of plan assets at end of year | 3,666,408 | |
| 3,341,662 | |
| 258,028 | |
| 259,372 | | ||||
Funded status at end of year | $ | (376,603 | ) |
| $ | (882,569 | ) |
| $ | (140,972 | ) |
| $ | (161,363 | ) |
As of June 30, 2018 and July 1, 2017 , the SERP had benefit obligations of $440.5 million and $463.2 million , respectively. In order to meet a portion of its obligations under the SERP, Sysco has contributed to a rabbi trust, COLI policies on the lives of participants and interests in corporate-owned real estate assets. These assets are not included as plan assets or in the funded status amounts in the tables above and below. The life insurance policies on the lives of the participants had carrying values of $96.5 million as of June 30, 2018 and $95.3 million as of July 1, 2017 . Sysco is the sole owner and beneficiary of such policies.
The amounts recognized on Sysco's consolidated balance sheets related to its company-sponsored defined benefit plans are as follows:
| U.S. Pension Benefits |
| International Pension Benefits | ||||||||||||
| Jun. 30, 2018 |
| Jul. 1, 2017 |
| Jun. 30, 2018 |
| Jul. 1, 2017 | ||||||||
| (In thousands) | ||||||||||||||
Noncurrent assets (Other assets) | $ | 63,945 | |
| $ | - | |
| $ | - | |
| $ | - | |
Current accrued benefit liability (Accrued expenses) | (31,313 | ) |
| (30,538 | ) |
| (1,280 | ) |
| (1,477 | ) | ||||
Noncurrent accrued benefit liability (Other long-term liabilities) | (409,235 | ) |
| (852,031 | ) |
| (139,692 | ) |
| (159,886 | ) | ||||
Net amount recognized | $ | (376,603 | ) |
| $ | (882,569 | ) |
| $ | (140,972 | ) |
| $ | (161,363 | ) |
65
Accumulated other comprehensive loss (income) as of June 30, 2018 consists of the following amounts that had not, as of that date, been recognized in net benefit cost:
| U.S. Pension Benefits |
| International Pension Benefits |
| Total | ||||||
| (In thousands) | ||||||||||
Prior service cost | $ | 19,170 | |
| $ | 2,679 | |
| $ | 21,849 | |
Actuarial losses (gains) | 1,434,160 | |
| (26,106 | ) |
| 1,408,054 | | |||
Total | $ | 1,453,330 | |
| $ | (23,427 | ) |
| $ | 1,429,903 | |
Accumulated other comprehensive loss (income) as of July 1, 2017 consists of the following amounts that had not, as of that date, been recognized in net benefit cost:
| U.S. Pension Benefits |
| International Pension Benefits |
| Total | ||||||
| (In thousands) | ||||||||||
Prior service cost | $ | 28,630 | |
| $ | 114 | |
| $ | 28,744 | |
Actuarial losses (gains) | 1,521,174 | |
| (35,935 | ) |
| 1,485,239 | | |||
Total | $ | 1,549,804 | |
| $ | (35,821 | ) |
| $ | 1,513,983 | |
The accumulated benefit obligation, which does not consider any salary increases for the remaining active union employees in the U.S. Retirement Plan was $4.4 billion and $4.6 billion as of June 30, 2018 and July 1, 2017 , respectively.
Information for plans with accumulated benefit obligation/aggregate benefit obligation in excess of fair value of plan assets is as follows:
| U.S. Pension Benefits (1) |
| International Pension Benefits | |||||||||||
| Jun. 30, 2018 |
| Jul. 1, 2017 |
| Jun. 30, 2018 |
| Jul. 1, 2017 | |||||||
| (In thousands) | |||||||||||||
Accumulated benefit obligation/aggregate benefit obligation | $ | 4,034,383 | |
| $ | 4,213,318 | |
| $ | 392,457 | |
| 413,552 | |
Fair value of plan assets at end of year | 3,666,408 | |
| 3,341,662 | |
| 258,028 | |
| 259,372 | | |||
(1) | Information under Pension Benefits as of June 30, 2018 and July 1, 2017 includes both the U.S. Retirement Plan and the SERP. |
66
Components of Net Benefit Costs and Other Comprehensive Income
The components of net company-sponsored pension costs for each fiscal year are as follows:
| 2018 |
| 2017 |
| 2016 | ||||||||||||||
| U.S. Pension Benefits |
| International Pension Benefits |
| U.S. Pension Benefits |
| International Pension Benefits |
| U.S. Pension Benefits | ||||||||||
| (In thousands) | ||||||||||||||||||
Service cost | $ | 14,514 | |
| $ | 3,219 | |
| $ | 14,287 | |
| $ | 2,880 | |
| $ | 11,815 | |
Interest cost | 173,827 | |
| 10,667 | |
| 171,282 | |
| 9,951 | |
| 174,602 | | |||||
Expected return on plan assets | (233,987 | ) |
| (11,653 | ) |
| (222,699 | ) |
| (10,033 | ) |
| (216,888 | ) | |||||
Amortization of prior service cost | 9,460 | |
| (2,003 | ) |
| 11,202 | |
| (1 | ) |
| 11,201 | | |||||
Amortization of actuarial loss | 35,696 | |
| (67 | ) |
| 41,511 | |
| (38 | ) |
| 22,186 | | |||||
Curtailment loss | - | |
| - | |
| - | |
| (611 | ) |
| - | | |||||
Settlement (gain) / Loss recognized | - | |
| 16 | |
| - | |
| - | |
| - | | |||||
Net pension (benefits) costs | $ | (490 | ) |
| $ | 179 | |
| $ | 15,583 | |
| $ | 2,148 | |
| $ | 2,916 | |
Other changes in plan assets and benefit obligations recognized in other comprehensive income (loss) related to company-sponsored pension plans for each fiscal year are as follows:
| 2018 |
| 2017 |
| 2016 | ||||||||||||||
| U.S. Pension Benefits |
| International Pension Benefits |
| U.S. Pension Benefits |
| International Pension Benefits |
| U.S. Pension Benefits | ||||||||||
| (In thousands) | ||||||||||||||||||
Amortization of prior service cost | $ | 9,460 | |
| $ | (2,003 | ) |
| $ | 11,202 | |
| $ | (1 | ) |
| $ | 11,202 | |
Amortization of actuarial loss | 35,696 | |
| (51 | ) |
| 41,511 | |
| (38 | ) |
| 22,186 | | |||||
Prior service cost arising in current year | - | |
| 4,624 | |
| (925 | ) |
| 110 | |
| - | | |||||
Effect of exchange rates on amounts in AOCI | - | |
| (583 | ) |
| - | |
| (1,269 | ) |
| - | | |||||
Actuarial (loss) gain arising in current year | 51,318 | |
| 10,406 | |
| 197,871 | |
| (34,623 | ) |
| (681,691 | ) | |||||
Net pension costs | $ | 96,474 | |
| $ | 12,393 | |
| $ | 249,659 | |
| $ | (35,821 | ) |
| $ | (648,303 | ) |
Amounts included in accumulated other comprehensive loss (income) as of June 30, 2018 that are expected to be recognized as components of net company-sponsored benefit cost during fiscal 2019 are:
| U.S. Pension Benefits |
| International Pension Benefits |
| Total | ||||||
| (In thousands) | ||||||||||
Amortization of prior service cost | $ | 8,380 | |
| $ | (207 | ) |
| $ | 8,173 | |
Amortization of actuarial losses (gains) | 34,393 | |
| (113 | ) |
| 34,280 | | |||
Total | $ | 42,773 | |
| $ | (320 | ) |
| $ | 42,453 | |
Employer Contributions
The company made cash contributions to its company-sponsored pension plans of $415.0 million and $57.6 million in fiscal years 2018 and 2017 , respectively. Contributions of $380 million to the U.S. Retirement Plan in fiscal 2018 were voluntary, as there were no required contributions to meet ERISA minimum funding requirements in fiscal 2018 . There are no required contributions to the U.S. Retirement Plan to meet ERISA minimum funding requirements in fiscal 2019 . The company's contributions to the SERP plan are made in the amounts needed to fund current year benefit payments. The estimated aggregate fiscal 2019 contribution to fund benefit payments for the SERP plan is $31.3 million . The estimated fiscal 2019 contributions to fund benefit payments for the international retirement plans are $7.3 million .
67
Estimated Future Benefit Payments
Estimated future benefit payments for vested participants, based on actuarial assumptions, are as follows:
| U.S. Pension Benefits |
| International Pension Benefits | ||||
| (In thousands) | ||||||
2019 | $ | 138,963 | |
| $ | 10,279 | |
2020 | 148,968 | |
| 10,359 | | ||
2021 | 159,879 | |
| 12,305 | | ||
2022 | 170,508 | |
| 12,373 | | ||
2023 | 180,863 | |
| 13,887 | | ||
Subsequent five years | 1,041,354 | |
| 89,281 | | ||
Assumptions
Weighted-average assumptions used to determine benefit obligations as of year-end were:
| Jun. 30, 2018 |
| Jul. 1, 2017 | ||
Discount rate - U.S. Retirement Plan | 4.28 | % |
| 4.19 | % |
Discount rate - SERP | 4.41 | |
| 4.08 | |
Discount rate - U.K. Retirement Plan | 2.85 | |
| 2.60 | |
Rate of compensation increase - U.S. Retirement Plan | 2.62 | |
| 2.62 | |
As benefit accruals under the SERP and U.K. Retirement Plan are frozen, future pay is not projected in the determination of the benefit obligation as of June 30, 2018 or July 1, 2017 .
68
Weighted-average assumptions used to determine net company-sponsored pension costs for each fiscal year were:
| 2018 |
| 2017 |
| 2016 | |||
Discount rate - U.S. Retirement Plan | 4.19 | % |
| 4.07 | % |
| 4.84 | % |
Discount rate - SERP | 4.08 | |
| 3.91 | |
| 4.63 | |
Discount rate - U.K. Retirement Plan | 2.60 | |
| 2.80 | |
| N/A | |
Expected rate of return - U.S. Retirement Plan | 7.00 | |
| 7.25 | |
| 7.25 | |
Expected rate of return - U.K. Retirement Plan | 4.55 | |
| 4.15 | |
| N/A | |
Rate of compensation increase - U.S. Retirement Plan | 2.62 | |
| 2.62 | |
| 3.89 | |
For guidance in determining the discount rate for U.S. defined benefit plans, Sysco calculates the implied rate of return on a hypothetical portfolio of high-quality fixed-income investments for which the timing and amount of cash outflows approximates the estimated payouts of the company-sponsored pension plans. Sysco uses an annualized corporate bond yield curve to estimate the rate at which pension benefits could effectively be settled to estimate a discount rate for the U.K. Retirement Plan. The discount rate assumption is updated annually and revised as deemed appropriate. The discount rates to be used for the calculation of fiscal 2019 net company-sponsored benefit costs for the U.S. Retirement Plan and U.K. Retirement Plan are 4.28% and 2.85% , respectively. The discount rate to be used for the calculation of fiscal 2019 net company-sponsored benefit costs for the SERP is 4.41% .
The expected long-term rate of return on plan assets assumption for the retirement plans are net return on assets assumption, representing gross return on assets less plan expenses. The expected return for the U.S. Retirement Plan is derived from a mathematical asset model that incorporates assumptions as to the various asset class returns, reflecting a combination of rigorous historical performance analysis and the forward-looking views of the financial markets regarding the yield on bonds, the historical returns of the major stock markets and returns on alternative investments. The expected return for the U.K. Retirement Plan is derived from a long-term swap yield time horizon adjusted for the expected return based on the plan's current asset allocation and historical results. The rate of return assumption is reviewed annually and revised as deemed appropriate. The expected long-term rate of return to be used in the calculation of fiscal 2019 net company-sponsored benefit costs for the U.S. Retirement Plan and U.K. Retirement Plan are 5.0% and 4.55% , respectively.
Plan Assets
Investment Strategy
The company's overall strategic investment objectives for the U.S. Retirement Plan are to preserve capital for future benefit payments and to balance risk and return commensurate with ongoing changes in the valuation of plan liabilities. In fiscal 2018, the company made voluntary contributions totaling $380 million to the U.S. Retirement Plan, allowing the company to set an investment strategy that more closely aligns the duration of the U.S. Retirement Plan's assets with the duration of its liabilities. In order to accomplish these objectives, the company oversees the U.S. Retirement Plan's investment objectives and policy design, decides proper plan asset class strategies and structures, monitors the performance of plan investment managers and investment funds and determines the proper investment allocation of pension plan contributions. The strategy results in an asset portfolio that more closely matches the behavior of the liability, thereby reducing the volatility of the U.S. Retirement Plan's funded status. This structure ensures the U.S. Retirement Plan's investments are diversified within each asset class, in addition to being diversified across asset classes with the intent to build asset class portfolios that are structured without strategic bias for or against any subcategories within each asset class. The company has also created a set of investment guidelines for the U.S. Retirement Plan's investment managers to specify prohibited transactions, including borrowing of money except for real estate, private equity or hedge fund portfolios where leverage is a key component of the investment strategy and permitted in the investments' governing documents, the purchase of securities on margin unless fully collateralized by cash or cash equivalents or short sales, pledging, mortgaging or hypothecating of any securities, except for loans of securities that are fully collateralized, market timing transactions and the direct purchase of the securities of Sysco or the investment manager. The purchase or sale of derivatives for speculation or leverage is also prohibited; however, investment managers are allowed to use derivative securities so long as they do not increase the risk profile or leverage of the manager's portfolio.
69
The U.S. Retirement Plan's target and actual investment allocation as of June 30, 2018 is as follows:
| U.S. Retirement Plan | ||||
| Target Asset Allocation |
| Actual Asset Allocation | ||
Growth assets | 30 | % |
| 29 | % |
Liability hedging assets | 70 | % |
| 71 | % |
|
|
| 100 | % | |
Sysco's U.S. Retirement Plan investment strategy is implemented through a combination of balanced and specialized investment managers, passive investment funds and actively managed investment funds. Growth assets include, but are not limited to, equities, alternatives, real estate, and growth fixed income intended to generate returns in excess of the liability growth rate. The Liability Hedging assets will be comprised primarily of fixed income investments, including interest rate and credit derivatives, intended to reduce funded status volatility due to changes in interest rates and credit spreads, while generating returns consistent with the projected liability growth rate. The U.S. Retirement Plan's portfolio includes investment funds which are selected based on each fund's stated investment strategy to align with Sysco's overall target mix of investments. Actual asset allocation is regularly reviewed and periodically rebalanced to the target allocation when considered appropriate.
The primary objective for the U.K. Retirement Plan is to provide sufficient assets to pay benefits as they fall due. The U.K. Retirement Plan has a return objective that aims to achieve a return on plan assets of 2.9% in excess of the return on the liability benchmark over rolling five year periods. The liability benchmark is the portfolio of swaps that best matches the liability profile of the U.K. Retirement Plan. The investment objective includes a risk statement that allows for the active risk within the plan asset portfolio to be below 12% per year, which may fluctuate over time as the composition of the portfolio changes and the levels of risk in markets change. The U.K. Retirement Plan's Trustee and Solvency Manager seeks to achieve the Plan's investment objectives by investing in a suitably diversified mix of assets. The U.K. Retirement Plan uses derivatives such as forwards, futures, swaps and options for risk management and for the efficient implementation of the investment strategy.
The company's target and actual investment allocation as of June 30, 2018 is as follows:
| U.K. Retirement Plan | ||||
| Target Asset Allocation |
| Actual Asset Allocation | ||
Common contractual fund | 75 | % |
| 75 | % |
Liability hedging assets | 25 | |
| 25 | |
|
|
| 100 | % | |
The U.K. plan's investment strategy is implemented primarily through a common contractual investment fund and liability hedging assets. The pooled investment fund consists of investment types including (1) equity investments covering a range of geographies and including investment managers that hold long and short positions, (2) credit investments including global investment grade and high yield bonds, loans and other debt and derivative securities, (3) property investments including global direct or indirect real estate holdings, (4) macro-oriented funds that seek to generate return by going long and short in a variety of markets and operate strategies which focus on markets rather than individual stocks and often use derivatives rather than physical assets, and (5) multi-strategy funds which combine a range of different credit, equity and macro-orientated ideas and dynamically allocate funds across asset classes. Actual asset allocation is regularly reviewed and periodically rebalanced to the target allocation when considered appropriate.
As discussed above, the retirement plans' investments in equities, debt instruments and alternative investments provide a range of returns and also expose the plan to investment risk. However, the investment policies put in place by the company require diversification of plan assets across issuers, industries and countries. As such, the retirement plans do not have significant concentrations of risk in plan assets.
Fair Value of Plan Assets
Fair value is defined as the price that would be received to sell an asset or paid to transfer a liability in an orderly transaction between market participants at the measurement date (i.e. an exit price). See Note 5 , "Fair Value Measurements," for a description of the fair value hierarchy that prioritizes the inputs to valuation techniques used to measure fair value. The following is a description of the valuation methodologies used for assets and liabilities held by Sysco's retirement plans measured at fair value.
70
Cash and cash equivalents: Valued at amortized cost, which approximates fair value due to the short-term maturities of these investments. Cash and cash equivalents is included as a Level 1 and Level 2 measurement in the table below.
Equity securities: Valued at the closing price reported on the exchange market. If a stock is not listed on a public exchange, such as an American Depository Receipt or some preferred stocks, the stock is valued using an evaluated bid price based on a compilation of observable market information. Inputs used include yields, the underlying security "best price", adjustments for corporate actions and exchange prices of underlying and common stock of the same issuer. Equity securities valued at the closing price reported on the exchange market are classified as a Level 1 measurement in the table below.
Fixed income securities: Valued using evaluated bid prices based on a compilation of observable market information or a broker quote in a non-active market. Inputs used vary by type of security, but include spreads, yields, rate benchmarks, rate of prepayment, cash flows, rating changes and collateral performance and type. All fixed income securities are included as a Level 2 measurement in the table below.
Investment funds: Represents collective trust and funds holding debt, equity, hedge funds, private equity funds, exchange-traded real estate securities, and common contractual funds which are valued at the net asset value (NAV) provided by the manager of each fund. The NAV for funds within the U.S. and U.K Retirement Plans is calculated as the underlying net assets owned by the fund, divided by the number of shares outstanding. The NAV is based on the fair value of the underlying securities within the fund. Non-exchange traded real estate funds are valued based on the proportionate interest held by the U.S. Retirement Plan, which is based on the valuations of the underlying real estate investments held by each fund. Each real estate investment is valued on the basis of a discounted cash flow approach. Inputs used include future rental receipts, expenses and residual values from a market participant view of the highest and best use of the real estate as rental property. The private equity funds are valued based on the proportionate interest held by the U.S. Retirement Plan, which is based on the valuations of the underlying private equity investments held by each fund. The hedge funds are valued based on the hedge funds' proportionate share of the net assets of the underlying private investment fund as determined by the underlying private investment fund's general partner. Indirectly held investments are valued utilizing the latest financial reports supplied by the fund's portfolio investments. Directly held investments are valued initially based on transaction price and are adjusted utilizing available market data and investment-specific factors, such as estimates of liquidation value, prices of recent transactions in the same or similar issuer, current operating performance and future expectations of the particular investment, changes in market outlook and the financing environment.
Derivatives: Valuation method varies by type of derivative security.
• | Credit default and interest rate swaps: Valued using evaluated bid prices based on a compilation of observable market information. Inputs used for credit default swaps include spread curves and trade data about the credit quality of the counterparty. Inputs used for interest rate swaps include benchmark yields, swap curves, cash flow analysis, and interdealer broker rates. Credit default and interest rate swaps are included as a Level 2 measurement in the table below. |
• | Foreign currency contracts: Valued using a standardized interpolation model that utilizes the quoted prices for standard-length forward foreign currency contracts and adjusts to the remaining term outstanding on the contract being valued. Foreign currency contracts are included as a Level 2 measurement in the table below. |
• | Futures and option contracts: Valued at the closing price reported on the exchange market for exchange-traded futures and options. Over-the-counter options are valued using pricing models that are based on observable market information. Exchange-traded futures and options are included as a Level 1 measurement in the table below; over-the-counter options are included as a Level 2 measurement. |
71
The following table presents the fair value of the U.S. Retirement Plan's assets by major asset category as of June 30, 2018 :
| Assets Measured at Fair Value as of Jun. 30, 2018 | ||||||||||||||||||
| Level 1 |
| Level 2 |
| Level 3 |
| Measured at NAV (7) |
| Total | ||||||||||
| (In thousands) | ||||||||||||||||||
Cash and cash equivalents | $ | 25,810 | |
| $ | 34,430 | |
| $ | - | |
| $ | - | |
| $ | 60,240 | |
Growth assets: |
|
|
|
|
|
|
|
|
| ||||||||||
U.S. equity (1) | 80,719 | |
| - | |
| - | |
| 143,701 | |
| 224,420 | | |||||
International equity (1) | 57,959 | |
| - | |
| - | |
| 109,186 | |
| 167,145 | | |||||
Hedge fund of funds (2) | - | |
| - | |
| - | |
| 388,281 | |
| 388,281 | | |||||
Real estate funds (3) | - | |
| - | |
| - | |
| 146,389 | |
| 146,389 | | |||||
Private equity funds (4) | - | |
| - | |
| - | |
| 84,003 | |
| 84,003 | | |||||
Liability hedging assets: |
|
|
|
|
|
|
|
|
| ||||||||||
Corporate bonds | - | |
| 1,775,324 | |
| - | |
| - | |
| 1,775,324 | | |||||
U.S. government and agency securities (1) | - | |
| 277,986 | |
| - | |
| 469,868 | |
| 747,854 | | |||||
Other (5) | - | |
| 27,324 | |
| - | |
| - | |
| 27,324 | | |||||
High yield and emerging markets fixed income (6) | - | |
| - | |
| - | |
| 45,428 | |
| 45,428 | | |||||
Total investments at fair value | $ | 164,488 | |
| $ | 2,115,064 | |
| $ | - | |
| $ | 1,386,856 | |
| $ | 3,666,408 | |
(1) | Include direct investments in equity securities and within investment funds for which fair value is measured at NAV. There are no unfunded commitments as of June 30, 2018 . The remaining investments may be redeemed once per day with advanced written notice and subject to applicable limits. |
(2) | There were no unfunded commitments as of June 30, 2018 , and there were no redemption restrictions as of June 30, 2018 . The investment may be redeemed once per quarter. |
(3) | The estimate of the liquidation period for these funds varies from 2018 to 2021 . The remaining investments may be redeemed once per day with advanced written notice and subject to applicable limits. |
(4) | Total unfunded commitments as of June 30, 2018 was $22.6 million . The investments cannot be redeemed, but the fund will make distributions through liquidation. The estimate of the liquidation period varies for each fund from 2018 to 2031 . |
(5) | Include foreign government and state and municipal debt securities. |
(6) | There were no unfunded commitments as of June 30, 2018 , and there were no redemption restrictions as of June 30, 2018 . The investment may be redeemed once per day. The daily maximum withdrawal limitation is the greater of $2.0 million or 5% of the asset value. |
(7) | Include certain investments that are measured at fair value using the NAV practical expedient have not been classified in the fair value hierarchy. The fair value amounts presented in this table are intended to permit reconciliation of the fair value hierarchy to the amounts presented in the consolidated balance sheet. |
The following table presents the fair value of the U.K. Retirement Plan's assets by major asset category as of June 30, 2018 :
| Assets Measured at Fair Value as of Jun. 30, 2018 | ||||||||||||||||||
| Level 1 |
| Level 2 |
| Level 3 |
| Measured at NAV (3) |
| Total | ||||||||||
| (In thousands) | ||||||||||||||||||
Liability hedging assets: | | |
| | |
| | |
| | |
| | | |||||
Cash and cash equivalents | $ | 30,987 | |
| $ | - | |
| $ | - | |
| $ | - | |
| $ | 30,987 | |
U.K. government securities | - | |
| 9,336 | |
| - | |
| - | |
| 9,336 | | |||||
Derivatives, net (1) | - | |
| 17,658 | |
| - | |
| - | |
| 17,658 | | |||||
Pooled funds | - | |
| 5,387 | |
| - | |
| - | |
| 5,387 | | |||||
Investment funds: |
|
|
|
|
|
|
|
|
| ||||||||||
Common contractual fund (2) | - | |
| - | |
| - | |
| 194,660 | |
| 194,660 | | |||||
Total investments at fair value | $ | 30,987 | |
| $ | 32,381 | |
| $ | - | |
| $ | 194,660 | |
| $ | 258,028 | |
72
(1) | Include interest rate swaps and zero coupon swaps. The fair value of asset positions totaled $45.2 million ; the fair value of liability positions totaled $27.5 million . |
(2) | There were $20.8 million of unfunded commitments as of June 30, 2018 , and there were no redemption restrictions as of June 30, 2018 . The investment may be redeemed once per week. |
(3) | Include certain investments that are measured at fair value using the NAV practical expedient have not been classified in the fair value hierarchy. The fair value amounts presented in this table are intended to permit reconciliation of the fair value hierarchy to the amounts presented in the consolidated balance sheet |
The following table presents the fair value of the U.S. Retirement Plan's assets by major asset category as of July 1, 2017 :
| Assets Measured at Fair Value as of Jul. 1, 2017 | ||||||||||||||||||
| Level 1 |
| Level 2 |
| Level 3 |
| Measured at NAV (4) |
| Total | ||||||||||
| (In thousands) | ||||||||||||||||||
Cash and cash equivalents | $ | 2,989 | |
| $ | 37,346 | |
| $ | - | |
| $ | - | |
| $ | 40,335 | |
U.S. equity (1) | 331,946 | |
| - | |
| - | |
| 577,626 | |
| 909,572 | | |||||
International equity (1) | 185,502 | |
| - | |
| - | |
| 537,317 | |
| 722,819 | | |||||
Long duration fixed income: |
| |
|
| |
|
| |
|
|
|
| | ||||||
Corporate bonds | - | |
| 628,033 | |
| - | |
| - | |
| 628,033 | | |||||
U.S. government and agency securities | - | |
| 250,940 | |
| - | |
| - | |
| 250,940 | | |||||
Other (2) | - | |
| 6,220 | |
| - | |
| - | |
| 6,220 | | |||||
Derivatives, net (2) | - | |
| - | |
| - | |
| - | |
| - | | |||||
High yield and emerging markets fixed income (3) | - | |
| - | |
| - | |
| 226,358 | |
| 226,358 | | |||||
Alternative investment funds: | | |
| | |
| | |
|
|
|
| |||||||
Hedge fund of funds (5) | - | |
| - | |
| - | |
| 336,812 | |
| 336,812 | | |||||
Real estate funds (6) | - | |
| - | |
| - | |
| 145,208 | |
| 145,208 | | |||||
Private equity funds (7) | - | |
| - | |
| - | |
| 75,365 | |
| 75,365 | | |||||
Total investments at fair value | $ | 520,437 | |
| $ | 922,539 | |
| $ | - | |
| $ | 1,898,686 | |
| $ | 3,341,662 | |
(1) | Include direct investments in equity securities and within investment funds for which fair value is measured at NAV. There are no unfunded commitments as of July 1, 2017 , and there were no redemption restrictions as of July 1, 2017 . |
(2) | Include foreign government and state and municipal debt securities. |
(3) | There was no unfunded commitments as of July 1, 2017 , and there were no redemption restrictions as of July 1, 2017 . The investment may be redeemed once per day. The daily maximum withdrawal limitation is the greater of $2.0 million or 5% of the asset value. |
(4) | Include certain investments that are measured at fair value using the NAV practical expedient have not been classified in the fair value hierarchy. The fair value amounts presented in this table are intended to permit reconciliation of the fair value hierarchy to the amounts presented in the consolidated balance sheet. |
(5) | There was no unfunded commitments as of July 1, 2017 , and there were no redemption restrictions as of July 1, 2017 . The investment may be redeemed once per quarter. |
(6) | For investments in the funds listed in this category, total unfunded commitment as of July 1, 2017 was $10.0 million . Approximately 15% of the investments cannot be redeemed but the fund will make distributions through liquidation. The estimate of the liquidation period for these funds varies from 2018 to 2021 . The remaining investments may be redeemed once per day or once per quarter. |
(7) | Total unfunded commitment as of July 1, 2017 was $30.7 million . The investments cannot be redeemed but the fund will make distributions through liquidation. The estimate of the liquidation period varies for each fund from 2017 to 2031 . |
73
The following table presents the fair value of the U.K. Retirement Plan's assets by major asset category as of July 1, 2017 :
| Assets Measured at Fair Value as of Jul. 1, 2017 | ||||||||||||||||||
| Level 1 |
| Level 2 |
| Level 3 |
| Measured at NAV (3) |
| Total | ||||||||||
| (In thousands) | ||||||||||||||||||
Liability hedging assets: |
|
|
|
|
|
|
|
|
| ||||||||||
Cash and cash equivalents | $ | 26,992 | |
| $ | - | |
| $ | - | |
| $ | - | |
| $ | 26,992 | |
U.K. government securities | - | |
| 9,327 | |
| - | |
| - | |
| 9,327 | | |||||
Derivatives, net (1) | - | |
| 20,900 | |
| - | |
| - | |
| 20,900 | | |||||
Pooled funds | - | |
| 10,296 | |
| - | |
| - | |
| 10,296 | | |||||
Investment funds: |
|
|
|
|
|
|
|
|
| ||||||||||
Common contractual fund (2) | - | |
| - | |
| - | |
| 191,508 | |
| 191,508 | | |||||
Total investments at fair value | $ | 26,992 | |
| $ | 40,523 | |
| $ | - | |
| $ | 191,508 | |
| $ | 259,023 | |
(1) | Include interest rate swaps and zero coupon swaps. The fair value of asset positions totaled $47.4 million ; the fair value of liability positions totaled $26.5 million . |
(2) | There were $9.3 million of unfunded commitments as of July 1, 2017 , and there were no redemption restrictions as of July 1, 2017 . The investment may be redeemed once per week. |
(3) | Include certain investments that are measured at fair value using the NAV practical expedient have not been classified in the fair value hierarchy. The fair value amounts presented in this table are intended to permit reconciliation of the fair value hierarchy to the amounts presented in the consolidated balance sheet |
14. MULTIEMPLOYER EMPLOYEE BENEFIT PLANS
Defined Benefit Pension Plans
Sysco participates in several multiemployer defined benefit pension plans in the U.S. based on obligations arising under collective bargaining agreements covering union-represented employees. Expense is recognized at the time the contribution is made. Sysco does not directly manage these multiemployer plans, which are generally managed by boards of trustees, half of whom are appointed by the unions and the other half appointed by employers contributing to the plan. Approximately 13% of Sysco's current employees in the U.S. are participants in such multiemployer plans as of June 30, 2018 .
The risks of participating in these multiemployer plans are different from single-employer plans in the following aspects:
• | Assets contributed to the multiemployer plan by one employer may be used to provide benefits to employees of other participating employers. |
• | If a participating employer stops contributing to the plan, the unfunded obligations of the plan may be borne by the remaining participating employers. |
• | If Sysco chooses to stop participating in some of its multiemployer plans in the U.S, Sysco may be required to pay those plans an amount based on the underfunded status of the plan, referred to as a withdrawal liability. |
Based upon the information available from plan administrators, management believes that several of these multiemployer plans are underfunded. In addition, pension-related legislation in the U.S. requires underfunded pension plans to improve their funding ratios within prescribed intervals based on the level of their underfunding. As a result, Sysco expects its contributions to these plans to increase in the future. In addition, if a U.S. multiemployer defined benefit plan fails to satisfy certain minimum funding requirements, the Internal Revenue Service (IRS) may impose a nondeductible excise tax of 5% on the amount of the accumulated funding deficiency for those employers contributing to the fund. Under current law regarding multiemployer defined benefit plans, a plan's termination, Sysco's voluntary withdrawal, or the mass withdrawal of all contributing employers from any underfunded multiemployer defined benefit plan would require Sysco to make payments to the plan for Sysco's proportionate share of the multiemployer plan's unfunded vested liabilities.
74
Plan Contributions
Sysco's contributions to multiemployer defined benefit pension plans were as follows for each fiscal year:
| 2018 |
| 2017 |
| 2016 | ||||||
| (In thousands) | ||||||||||
Individually significant plans | $ | 39,121 | |
| $ | 36,653 | |
| $ | 33,787 | |
All other plans | 7,254 | |
| 7,898 | |
| 7,260 | | |||
Total contributions | $ | 46,375 | |
| $ | 44,551 | |
| $ | 41,047 | |
Sysco's Albany operating company withdrew from the New York State Teamsters Conference Pension and Retirement Fund in the fourth quarter of fiscal 2017. As a result, a withdrawal liability of $37.3 million was paid during fiscal 2018.
Individually Significant Plans
The information in the following tables relates to multiemployer defined benefit pension plans which Sysco has determined to be individually significant to the company. To determine individually significant plans, the company evaluated several factors, including Sysco's significance to the plan in terms of employees and contributions, the funded status of the plan and the size of the company's potential withdrawal liability if it were to voluntarily withdraw from the plan.
The following table provides information about the funded status of individually significant plans:
• | The "EIN-PN" column provides the Employer Identification Number (EIN) and the three-digit plan number (PN). |
• | The "Pension Protection Act Zone Status" columns provide the two most recent Pension Protection Act zone statuses available from each plan. The zone status is based on information that the company received from the plan's administrators and is certified by each plan's actuary. Among other factors, plans in the red zone are generally less than 65% funded, plans in the orange zone are both less than 80% funded and have an accumulated funding deficiency or are expected to have a deficiency in any of the next six plan years, plans in the yellow zone are less than 80% funded and plans in the green zone are at least 80% funded. The Multiemployer Protection Act of 2014 created a new zone called "critical and declining." Plans are generally considered "critical and declining" if they are projected to become insolvent within 15 years. |
• | The "FIP/RP Status" column indicates whether a financial improvement plan (FIP) for yellow/orange zone plans or a rehabilitation plan (RP) for red zone plans is pending or implemented in the current year or was put in place in a prior year. A status of "Pending" indicates a FIP/RP has been approved but actual period covered by the FIP/RP has not begun. A status of "Implemented" means the period covered by the FIP/RP began in the current year or is ongoing. |
• | The "Surcharge Imposed" column indicates whether a surcharge was paid during the most recent annual period presented for the company's contributions to each plan in the red zone. If the company's current collective bargaining agreement (CBA) with a plan satisfies the requirements of a pending but not yet implemented RP, then the payment of surcharges is not required and "No" will be reflected in this column. If the company's current CBA with a plan does not yet satisfy the requirements of a pending but not yet implemented RP, then the payment of surcharges is required and "Yes" will be reflected in this column. |
|
|
|
| Pension Protection Act |
|
|
|
|
|
| ||
Pension Fund |
| EIN-PN |
| As of |
| As of |
| FIP/RP |
| Surcharge |
| Expiration |
Western Conference of Teamsters Pension Plan |
| 91-6145047-001 |
| Green |
| Green |
| N/A |
| N/A |
| 9/1/2018 to 1/6/2024 (1) |
Teamsters Pension Trust Fund of Philadelphia and Vicinity |
| 23-1511735-001 |
| Yellow |
| Yellow |
| Implemented |
| N/A |
| 7/20/2020 |
Truck Drivers and Helpers Local Union No. 355 Retirement Pension Fund |
| 52-6043608-001 |
| Yellow |
| Yellow |
| Implemented |
| N/A |
| 2/28/2022 |
Minneapolis Food Distributing Industry Pension Plan |
| 41-6047047-001 |
| Green |
| Green |
| Implemented |
| N/A |
| 8/1/2021 |
75
(1) | Sysco is party to 22 CBAs that require contributions to the Western Conference of Teamsters Pension Trust. Each agreement covers anywhere from less than 1% to 11% of the total contributions Sysco is required to pay the fund. |
The following table provides information about the company's contributions to individually significant plans:
• | The "Sysco Contributions" columns provide contribution amounts based on Sysco's fiscal years, which may not coincide with the plans' fiscal years. |
• | The "Sysco 5% of Total Plan Contributions" columns indicate whether Sysco was listed in the plan's most recently filed Form 5500s as providing more than five percent of the total contributions to the plan, and the plan year-end is noted. |
|
| Sysco Contributions |
| Sysco 5% of Total Plan Contributions | ||||||||||||
Pension Fund |
| 2018 |
| 2017 |
| 2016 |
| Year Ending |
| Year Ending | ||||||
|
| (In thousands) |
|
|
|
| ||||||||||
Western Conference of Teamsters Pension Plan |
| $ | 30,460 | |
| $ | 28,145 | |
| $ | 24,684 | |
| No |
| No |
Teamsters Pension Trust Fund of Philadelphia and Vicinity |
| 3,313 | |
| 3,081 | |
| 2,375 | |
| No |
| No | |||
Truck Drivers and Helpers Local Union No. 355 Retirement Pension Fund |
| 2,245 | |
| 2,430 | |
| 2,237 | |
| Yes |
| Yes | |||
Minneapolis Food Distributing Industry Pension Plan |
| 3,103 | |
| 2,996 | |
| 2,996 | |
| Yes |
| Yes | |||
For all of the plans noted in the table above, minimum contributions outside of the agreed upon contractual rate are not required.
Multiemployer Plan Benefits Other Than Pensions
In addition to the contributions to the defined benefit pension plans described above, Sysco also contributes to several multiemployer plans that provide other postretirement benefits in the U.S. and Canada based on obligations arising under collective bargaining agreements covering union-represented employees. These plans may provide medical, pharmacy, dental, vision, mental health and other benefits to active employees and retirees as determined by the trustees of each plan. Sysco contributed to these plans $27.0 million in fiscal 2018 , $25.8 million in fiscal 2017 and $25.9 million in fiscal 2016 . There have been no significant changes that affect the comparability of fiscal 2018 , fiscal 2017 and fiscal 2016 contributions.
15. EARNINGS PER SHARE
The following table sets forth the computation of basic and diluted earnings per share:
| 2018 |
| 2017 |
| 2016 | ||||||
| (In thousands, except for share and per share data) | ||||||||||
Numerator: |
|
|
|
|
| ||||||
Net earnings | $ | 1,430,766 | |
| $ | 1,142,503 | |
| $ | 949,622 | |
Denominator: |
|
|
| |
|
| |||||
Weighted-average basic shares outstanding | 522,926,914 | |
| 543,496,816 | |
| 573,057,406 | | |||
Dilutive effect of share-based awards | 6,162,940 | |
| 5,048,211 | |
| 4,334,000 | | |||
Weighted-average diluted shares outstanding | 529,089,854 | |
| 548,545,027 | |
| 577,391,406 | | |||
Basic earnings per share | $ | 2.74 | |
| $ | 2.10 | |
| $ | 1.66 | |
Diluted earnings per share | $ | 2.70 | |
| $ | 2.08 | |
| $ | 1.64 | |
The number of securities that were not included in the diluted earnings per share calculation because the effect would have been anti-dilutive was approximately 2,302,946 , 4,194,173 and 3,586,927 for fiscal 2018 , 2017 and 2016 , respectively.
76
Dividends declared were $735.3 million , $700.9 million and $695.5 million in fiscal 2018 , 2017 and 2016 , respectively. Included in dividends declared for each year were dividends declared but not yet paid at year-end of approximately $187.4 million , $174.9 million and $174.1 million in fiscal 2018 , 2017 and 2016 , respectively.
16. OTHER COMPREHENSIVE INCOME
Comprehensive income is net earnings plus certain other items that are recorded directly to shareholders' equity, such as foreign currency translation adjustment, amounts related to cash flow hedging arrangements and certain amounts related to pension and other postretirement plans. Comprehensive income was $1.5 billion , $1.2 billion and $514.7 million for fiscal 2018 , 2017 and 2016 , respectively.
A summary of the components of other comprehensive income (loss) and the related tax effects for each of the periods presented is as follows:
|
|
| 2018 | ||||||||||
| Location of Expense |
| Before Tax |
| Tax |
| Net of Tax | ||||||
|
|
| (In thousands) | ||||||||||
Pension and other postretirement benefit plans: |
|
|
| |
|
| |
|
| | |||
Other comprehensive income before reclassification adjustments: |
|
|
|
|
|
|
| ||||||
Net actuarial gain (loss), arising in the current year |
| $ | 69,476 | |
| $ | 16,965 | |
| $ | 52,511 | | |
Reclassification adjustments: |
|
|
| |
|
| |
|
| | |||
Amortization of prior service cost | Operating expenses |
| 9,636 | |
| 2,731 | |
| 6,905 | | |||
Amortization of actuarial loss (gain), net | Operating expenses |
| 35,044 | |
| 9,934 | |
| 25,110 | | |||
Total reclassification adjustments |
| 44,680 | |
| 12,665 | |
| 32,015 | | ||||
Foreign currency translation: |
|
|
|
|
|
|
| ||||||
Foreign currency translation adjustment | N/A |
| (22,987 | ) |
| - | |
| (22,987 | ) | |||
Hedging instruments: |
|
|
|
|
|
|
| ||||||
Other comprehensive income (loss) before reclassification adjustments: |
|
|
|
|
|
|
| ||||||
Change in cash flow hedges | Operating expenses (1) |
| 23,872 | |
| 9,529 | |
| 14,343 | | |||
Change in net investment hedges | N/A |
| (2,443 | ) |
| (8,234 | ) |
| 5,791 | | |||
Total other comprehensive income (loss) before reclassification adjustments |
|
| 21,429 | |
| 1,295 | |
| 20,134 | | |||
Reclassification adjustments: |
|
|
|
|
|
|
| ||||||
Amortization of cash flow hedges | Interest expense |
| 11,499 | |
| 3,259 | |
| 8,240 | | |||
Total other comprehensive income (loss) |
| $ | 124,097 | |
| $ | 34,184 | |
| $ | 89,913 | | |
(1) | Amount partially impacts operating expense for fuel swaps accounted for as cash flow hedges. |
77
|
|
| 2017 | ||||||||||
| Location of Expense |
| Before Tax |
| Tax |
| Net of Tax | ||||||
|
|
| (In thousands) | ||||||||||
Pension and other postretirement benefit plans: |
|
|
| |
|
| |
|
| | |||
Other comprehensive income before reclassification adjustments: |
|
|
|
|
|
|
| ||||||
Net actuarial (loss) gain, net arising in the current year |
|
| $ | 168,498 | |
| $ | 71,215 | |
| $ | 97,283 | |
Reclassification adjustments: |
|
|
| |
|
| |
|
| | |||
Amortization of prior service cost | Operating expenses |
| 11,370 | |
| 4,366 | |
| 7,004 | | |||
Amortization of actuarial loss (gain), net | Operating expenses |
| 41,689 | |
| 15,724 | |
| 25,965 | | |||
Total reclassification adjustments |
| 53,059 | |
| 20,090 | |
| 32,969 | | ||||
Foreign currency translation: |
|
|
|
|
|
|
| ||||||
Foreign currency translation adjustment | N/A |
| (11,243 | ) |
| - | |
| (11,243 | ) | |||
Hedging instruments: |
|
|
|
|
|
|
| ||||||
Other comprehensive income (loss) before reclassification adjustments: |
|
|
| |
|
| |
|
| | |||
Change in cash flow hedges | Operating expenses (1) |
| (10,871 | ) |
| (4,173 | ) |
| (6,698 | ) | |||
Change in net investment hedges | N/A |
| (34,152 | ) |
| (10,140 | ) |
| (24,012 | ) | |||
Total other comprehensive income (loss) before reclassification adjustments |
|
| (45,023 | ) |
| (14,313 | ) |
| (30,710 | ) | |||
Reclassification adjustments: |
|
|
|
|
|
|
| ||||||
Amortization of cash flow hedges | Interest expense |
| 11,495 | |
| 4,413 | |
| 7,082 | | |||
Total other comprehensive income (loss) |
| $ | 176,786 | |
| $ | 81,405 | |
| $ | 95,381 | | |
(1) | Amount partially impacts operating expense for fuel swaps accounted for as cash flow hedges. |
78
|
|
| 2016 | ||||||||||
| Location of Expense |
| Before Tax |
| Tax |
| Net of Tax | ||||||
|
|
| (In thousands) | ||||||||||
Pension and other postretirement benefit plans: |
|
|
|
|
|
|
| ||||||
Other comprehensive income before reclassification adjustments |
|
|
|
|
|
|
| ||||||
Net actuarial (loss) gain, net arising in the current year |
| $ | (681,034 | ) |
| $ | (261,517 | ) |
| $ | (419,517 | ) | |
Reclassification adjustments: |
|
|
|
|
|
|
| ||||||
Amortization of prior service cost | Operating expenses |
| 11,351 | |
| 4,359 | |
| 6,992 | | |||
Amortization of actuarial loss (gain), net | Operating expenses |
| 21,677 | |
| 8,325 | |
| 13,352 | | |||
Total reclassification adjustments |
| 33,028 | |
| 12,684 | |
| 20,344 | | ||||
Foreign currency translation: |
|
|
|
|
|
|
| ||||||
Foreign currency translation adjustment | N/A |
| (39,080 | ) |
| - | |
| (39,080 | ) | |||
Interest rate swaps: |
|
|
|
|
|
|
| ||||||
Other comprehensive income before reclassification adjustments: |
|
|
|
|
|
|
| ||||||
Change in cash flow hedges |
|
| (6,134 | ) |
| (2,355 | ) |
| (3,779 | ) | |||
Reclassification adjustments: |
|
|
|
|
|
|
| ||||||
Amortization of cash flow hedges | Interest expense |
| 11,543 | |
| 4,432 | |
| 7,111 | | |||
Total other comprehensive loss |
| $ | (681,677 | ) |
| $ | (246,756 | ) |
| $ | (434,921 | ) | |
The following tables provide a summary of the changes in accumulated other comprehensive (loss) income (AOCI) for the periods presented:
| Pension and Other Postretirement Benefit Plans, |
| Foreign Currency Translation |
| Hedging, net of tax |
| Total | ||||||||
| (In thousands) | ||||||||||||||
Balance as of Jun. 27, 2015 | $ | (705,311 | ) |
| $ | (97,733 | ) |
| $ | (120,153 | ) |
| $ | (923,197 | ) |
Other comprehensive income before | (419,517 | ) |
| (39,080 | ) |
| (3,779 | ) |
| (462,376 | ) | ||||
Amounts reclassified from accumulated | 20,344 | |
| - | |
| 7,111 | |
| 27,455 | | ||||
Balance as of Jul. 2, 2016 | (1,104,484 | ) |
| (136,813 | ) |
| (116,821 | ) |
| (1,358,118 | ) | ||||
Other comprehensive income before | 97,283 | |
| (11,243 | ) |
| (30,710 | ) |
| 55,330 | | ||||
Amounts reclassified from accumulated | 32,969 | |
| - | |
| 7,082 | |
| 40,051 | | ||||
Balance as of Jul. 1, 2017 | (974,232 | ) |
| (148,056 | ) |
| (140,449 | ) |
| (1,262,737 | ) | ||||
Other comprehensive income before | 52,511 | |
| (22,987 | ) |
| 20,134 | |
| 49,658 | | ||||
Amounts reclassified from accumulated | 32,015 | |
| - | |
| 8,240 | |
| 40,255 | | ||||
Amounts reclassified to retained earnings (1) | (205,353 | ) |
| - | |
| (31,092 | ) |
| (236,445 | ) | ||||
Balance as of Jun. 30, 2018 | $ | (1,095,059 | ) |
| $ | (171,043 | ) |
| $ | (143,167 | ) |
| $ | (1,409,269 | ) |
(1) | Deferred taxes stranded in AOCI as a result of the Tax Act were reclassified to retained earnings as a result of early adopting ASU 2018-02. |
79
17. SHARE-BASED COMPENSATION
Sysco provides compensation benefits to employees under several share-based payment arrangements, including various long-term employee stock incentive plans and the 2015 Employee Stock Purchase Plan (ESPP).
Stock Incentive Plans
In November 2013, Sysco's Long-term Incentive Plan (2013 Plan) was adopted and reserved up to 55,600,000 shares of Sysco common stock for share-based awards to employees, non-employee directors and key advisors. Of the 55,600,000 authorized shares, the full 55,600,000 shares may be issued as options or stock appreciation rights and up to 17,500,000 shares may be issued as restricted stock, restricted stock units or other types of stock-based awards. To date, Sysco has issued options, restricted stock units and performance share units under the 2013 Plan. Vesting requirements for awards under the 2013 Plan vary by individual grant and may include either time-based vesting or time-based vesting subject to acceleration based on performance criteria for fiscal periods of at least one year. The contractual life of all options granted under the 2013 Plan are and will be no greater than ten years. As of June 30, 2018 , there were 27,297,349 remaining shares authorized and available for grant in total under the 2013 Plan, of which the full 27,297,349 shares may be issued as options or stock appreciation rights, or as a combination of up to 11,197,918 shares that may be issued as restricted stock, restricted stock units or other types of stock-based awards, with the remainder available for issuance as options or stock appreciation rights.
Sysco has also granted employee options under several previous employee stock option plans for which previously granted options remain outstanding as of June 30, 2018 . No new options will be issued under any of the prior plans, as future grants to employees will be made through the 2013 Plan or subsequently adopted plans. Awards under these plans are subject to time-based vesting with vesting periods that vary by individual grant. The contractual life of all options granted under these plans is seven years.
Performance Share Units
During fiscal 2018 and 2017 , performance share units (PSUs) of 895,968 and 829,460 , respectively, were granted to employees. Based on the jurisdiction in which the employee resides, some of these PSUs were granted with forfeitable dividend equivalents. The fair value of each PSU award granted with a dividend equivalent is based on the company's stock price as of the date of grant. For PSUs granted without dividend equivalents, the fair value was reduced by the present value of expected dividends during the vesting period. The weighted average grant-date fair value per performance share unit granted during fiscal 2018 and 2017 was $51.11 and $52.17 , respectively. The PSUs granted will vest and convert into shares of Sysco common stock at the end of the performance periods, which conclude at the end of fiscal 2020 and fiscal 2019, respectively, based on financial performance targets consisting of Sysco's earnings per share, compound annual growth rate and adjusted return on invested capital.
Stock Options
Sysco's option awards are subject to graded vesting over a requisite service period with compensation cost recognized on a straight-line basis over the requisite service period over the duration of the award.
In addition, certain of Sysco's options provide that the options continue to vest as if the optionee continued as an employee or director if the optionee meets certain age and years of service thresholds upon retirement. In these cases, Sysco will recognize compensation cost for such awards over the period from the grant date to the date the employee or director first becomes eligible to retire with the options continuing to vest after retirement.
The fair value of each option award is estimated as of the date of grant using a Black-Scholes option pricing model. Expected dividend yield is estimated based on the historical pattern of dividends and the average stock price for the year preceding the option grant. Expected volatility is based on historical volatility of Sysco's stock, implied volatilities from traded options on Sysco's stock and other factors. The risk-free rate for the expected term of the option is based on the U.S. Treasury yield curve in effect at the time of grant. Sysco utilizes historical data to estimate option exercise and employee termination behavior within the valuation model; separate groups of employees that have similar historical exercise behavior are considered separately in determining the expected life of awards for valuation purposes.
80
The weighted average assumptions discussed above are noted in the table below for relevant periods as follows:
| 2018 |
| 2017 |
| 2016 | |||
Dividend yield | 2.6 | % |
| 2.8 | % |
| 3.1 | % |
Expected volatility | 17.5 | % |
| 16.9 | % |
| 20.4 | % |
Risk-free interest rate | 2.0 | % |
| 1.4 | % |
| 2.0 | % |
Expected Life | 7.0 years | |
| 7.2 years | |
| 7.2 years | |
The following summary presents information regarding outstanding options as of June 30, 2018 and changes during the fiscal year then ended with regard to options under all stock incentive plans:
| Shares Under Option |
| Weighted Average Exercise Price Per Share |
| Weighted Average Remaining Contractual Term (in years) |
| Aggregate Intrinsic Value (in thousands) | |||||
Outstanding as of July 1, 2017 | 21,070,836 | |
| $ | 39.16 | |
|
|
|
| ||
Granted | 4,042,415 | |
| 51.24 | |
|
|
|
| |||
Exercised | 6,400,982 | |
| 32.65 | |
|
|
|
| |||
Forfeited | 299,584 | |
| 48.48 | |
|
|
|
| |||
Expired | 21,075 | |
| 28.87 | |
|
|
|
| |||
Outstanding as of June 30, 2018 | 18,391,610 | |
| $ | 43.92 | |
| 7.23 |
| $ | 448,133 | |
Vested or expected to vest as of June 30, 2018 | 12,006,173 | |
| $ | 46.30 | |
| 7.87 |
| $ | 263,972 | |
Exercisable as of June 30, 2018 | 6,232,851 | |
| $ | 39.23 | |
| 5.96 |
| $ | 181,146 | |
The total number of employee options granted was 4,042,415 , 4,990,396 and 4,367,764 in fiscal years 2018 , 2017 and 2016 , respectively.
During fiscal 2018 , 955,344 and 3,087,071 options were granted to 10 executive officers and approximately 181 other key employees, respectively. During fiscal 2017 , 1,529,997 and 3,460,399 options were granted to 9 executive officers and approximately 187 other key employees, respectively. During fiscal 2016 , 1,495,351 and 2,872,413 options were granted to 8 executive officers and 169 other key employees, respectively.
The weighted average grant date fair value of options granted in fiscal 2018 , 2017 and 2016 was $7.08 , $6.05 and $5.99 , respectively. The total intrinsic value of options exercised during fiscal 2018 , 2017 and 2016 was $17.7 million , $22.1 million and $36.1 million , respectively.
Restricted Stock Units
During fiscal 2018 , 2017 and 2016 , restricted stock units of 660,923 , 631,281 and 1,257,889 were granted to employees, respectively, the majority of which will vest ratably over a three -year period. Some of these restricted stock units were granted with dividend equivalents. The fair value of each restricted stock unit award granted with a dividend equivalent is based on the company's stock price as of the date of grant. For restricted stock unit awards granted without dividend equivalents, the fair value was reduced by the present value of expected dividends as of the date of grant date during the vesting period. The weighted average grant date fair value per share of restricted stock units granted during fiscal 2018 , 2017 and 2016 was $55.81 , $50.04 and $42.78 , respectively. The total fair value of restricted stock units vested during fiscal 2018 , 2017 and 2016 was $40.4 million , $46.0 million and $43.4 million , respectively. The total intrinsic value of options exercised during fiscal 2018 , 2017 and 2016 was $56.4 million , $65.1 million and $53.9 million , respectively.
Non-Employee Director Awards
During fiscal 2018 , 2017 and 2016 , restricted awards of 35,672 , 40,498 and 43,362 were granted to non-employee directors (NEDs), respectively, that will vest over a one -year period. NEDs may elect to receive these awards in restricted stock shares that will vest at the end of the award stated vesting period or as deferred units that convert into shares of Sysco common stock on a date subsequent to the award stated vesting date selected by the NED. The fair value of the restricted awards is based on the company's stock price as of the date of grant. The weighted average grant date fair value of the shares granted during fiscal 2018 , 2017 and 2016 was $54.10 , $53.49 and $40.59 , respectively. The total fair value of restricted stock shares vested and deferred
81
units distributed during fiscal 2018 , 2017 and 2016 was $2.9 million , $2.0 million and $1.6 million , respectively. Restricted stock shares are valued on their vesting date. Vested deferred units are valued on their subsequent conversion and distribution date.
NEDs may elect to receive up to 100% of their annual directors' fees in Sysco common stock on either an annual or deferred basis. Sysco provides a matching grant of 50% of the number of shares received for the stock election subject to certain limitations. As a result of such elections, a total of 21,478 , 22,094 and 25,185 shares with a weighted-average grant date fair value of $54.69 , $51.46 and $39.31 per share were issued in fiscal 2018 , 2017 and 2016 , respectively, in the form of fully vested common stock or deferred units. The total fair value of common stock issued as a result of election shares and deferred units distributed during fiscal 2018 , 2017 and 2016 was $1.2 million , $1.1 million and $1.0 million , respectively. Common stock shares are valued on their vesting date. Vested deferred units are valued on their subsequent conversion and distribution date.
As of June 30, 2018 , there were 70,691 fully vested deferred units outstanding that will convert into shares of Sysco common stock upon dates selected by the respective NED.
Summary of Equity Instruments Other Than Stock Options
The following summary presents information regarding outstanding non-vested awards as of June 30, 2018 and changes during the fiscal year then ended with regard to these awards under the stock incentive plans. Award types represented include restricted stock units granted to employees, restricted awards granted to non-employee directors and PSUs.
| Shares |
| Weighted Average Grant Date Fair Value Per Share | |||
Non-vested as of July 1, 2017 | 2,643,599 | |
| $ | 46.24 | |
Granted | 1,592,564 | |
| 53.13 | | |
Vested | (975,994 | ) |
| 41.44 | | |
Forfeited | (173,285 | ) |
| 50.35 | | |
Non-vested as of June 30, 2018 | 3,086,884 | |
| $ | 51.08 | |
2015 Employee Stock Purchase Plan
The Sysco ESPP permits employees to invest in Sysco common stock by means of periodic payroll deductions at a discount of 15% from the closing price on the last business day of each calendar quarter. The total number of shares which may be sold pursuant to the ESPP may not exceed 79,000,000 shares, of which 7,225,186 remained available as of June 30, 2018 .
During fiscal 2018 , 1,078,597 shares of Sysco common stock were purchased by the participants, as compared to 1,103,995 shares purchased in fiscal 2017 and 1,275,765 shares purchased in fiscal 2016 . The weighted average fair value of employee stock purchase rights issued pursuant to the ESPP was $8.38 , $7.73 and $6.04 per share during fiscal 2018 , 2017 and 2016 , respectively. The fair value of the stock purchase rights was calculated as the difference between the stock price at date of issuance and the employee purchase price.
All Share-Based Payment Arrangements
The total share-based compensation cost included in operating expenses in the consolidated results of operations was $93.8 million , $83.9 million and $79.5 million for fiscal 2018 , 2017 and 2016 , respectively. The total income tax benefit for share-based compensation arrangements was $19.4 million , $30.0 million and $30.7 million for fiscal 2018 , 2017 and 2016 , respectively.
As of June 30, 2018 , there was $121.3 million of total unrecognized share-based compensation cost, which is expected to be recognized over a weighted-average period of 1.8 years .
Cash received from option exercises and purchases of shares under the ESPP was $268.8 million , $204.8 million and $282.4 million during fiscal 2018 , 2017 and 2016 , respectively. The actual tax benefit realized for the tax deductions from option exercises totaled $38.4 million , $38.9 million and $42.5 million during fiscal 2018 , 2017 and 2016 , respectively.
82
18. INCOME TAXES
Income Tax Provisions
For financial reporting purposes, earnings before income taxes consists of the following:
| 2018 |
| 2017 |
| 2016 | ||||||
| (In thousands) | ||||||||||
U.S. | $ | 1,765,793 | |
| $ | 1,569,073 | |
| $ | 1,225,142 | |
Foreign | 190,431 | |
| 197,157 | |
| 207,865 | | |||
Total | $ | 1,956,224 | |
| $ | 1,766,230 | |
| $ | 1,433,007 | |
The income tax provision for each fiscal year consists of the following:
| 2018 |
| 2017 |
| 2016 | ||||||
| (In thousands) | ||||||||||
U.S. federal income taxes | $ | 399,254 | |
| $ | 534,266 | |
| $ | 429,658 | |
State and local income taxes | 62,670 | |
| 69,913 | |
| 34,032 | | |||
Foreign income taxes | 63,534 | |
| 19,548 | |
| 19,695 | | |||
Total | $ | 525,458 | |
| $ | 623,727 | |
| $ | 483,385 | |
The current and deferred components of the income tax provisions for each fiscal year are as follows:
| 2018 |
| 2017 |
| 2016 | ||||||
| (In thousands) | ||||||||||
Current | $ | 337,550 | |
| $ | 675,573 | |
| $ | 389,514 | |
Deferred | 187,908 | |
| (51,846 | ) |
| 93,871 | | |||
Total | $ | 525,458 | |
| $ | 623,727 | |
| $ | 483,385 | |
The deferred tax provisions result from the effects of net changes during the year in deferred tax assets and liabilities arising from temporary differences between the carrying amounts of assets and liabilities for financial reporting purposes and the amounts used for income tax purposes.
83
Deferred Tax Assets and Liabilities
Significant components of Sysco's deferred tax assets and liabilities are as follows:
| Jun. 30, 2018 |
| Jul. 1, 2017 | ||||
| (In thousands) | ||||||
Deferred tax assets: |
|
|
| | |||
Net operating loss carryforwards | $ | 226,274 | |
| $ | 194,287 | |
Pension | 115,361 | |
| 360,864 | | ||
Share-based compensation | 34,486 | |
| 48,077 | | ||
Deferred compensation | 29,512 | |
| 39,830 | | ||
Self-insured liabilities | - | |
| 84,401 | | ||
Receivables | 13,001 | |
| 30,842 | | ||
Inventory | 14,728 | |
| 21,332 | | ||
Foreign currency remeasurement losses and currency hedge | 15,796 | |
| 13,221 | | ||
Other | 33,386 | |
| 54,619 | | ||
Deferred tax assets before valuation allowances | 482,544 | |
| 847,473 | | ||
Valuation allowances | (123,237 | ) |
| (114,151 | ) | ||
Total deferred tax assets | 359,307 | |
| 733,322 | | ||
Deferred tax liabilities: |
|
|
| ||||
Excess tax depreciation and basis differences of assets | 180,950 | |
| 247,510 | | ||
Goodwill and intangible assets | 373,041 | |
| 455,340 | | ||
Other | 40,774 | |
| 49,654 | | ||
Total deferred tax liabilities | 594,765 | |
| 752,504 | | ||
Total net deferred tax assets / (liabilities) | $ | (235,458 | ) |
| $ | (19,182 | ) |
The company's deferred tax asset for net operating loss carryforwards as of June 30, 2018 and July 1, 2017 consisted of state and foreign net operating tax loss carryforwards. The state net operating loss carryforwards outstanding as of June 30, 2018 expire in fiscal years 2019 through 2036. The foreign net operating loss carryforward periods vary by jurisdiction, from 17 years to unlimited.
The company assesses the recoverability of its deferred tax assets each period by considering whether it is more likely than not that all or a portion of the deferred tax assets will not be realized. The company considers all available evidence (both positive and negative) in determining whether a valuation allowance is required. As a result of the company's analysis, it was concluded that, as of June 30, 2018 , a valuation allowance of $123.2 million should be established against the portion of the deferred tax asset attributable to certain foreign losses. The company will continue to monitor facts and circumstances in the reassessment of the likelihood that net operating loss carryforwards will be realized.
Tax Cuts and Jobs Act
On December 22, 2017 , the U.S. government enacted the Tax Act. The Tax Act made broad and complex changes to the U.S. tax code that affected the company's fiscal year ending June 30, 2018, including, but not limited to: (1) reducing the U.S. federal corporate tax rate; (2) requiring a one-time transition tax on certain unrepatriated earnings of foreign subsidiaries that is payable over 8 years ; and (3) bonus depreciation that will allow for full expensing of qualified property placed in service after September 27, 2017 . The Tax Act also establishes new tax laws that could affect Sysco in future fiscal years, including, but not limited to (1) a general elimination of U.S. federal income taxes on dividends from foreign subsidiaries; (2) a new provision designed to tax global intangible low-taxed income (GILTI); (3) creation of the base erosion anti-abuse tax (BEAT), a new minimum tax; (4) a new limitation on deductible interest; (5) repeal of the domestic production activity deduction; and (6) increased limitations on the deductibility of certain executive compensation.
Also, in December 2017, the Securities and Exchange Commission staff issued SAB 118, which provides guidance on accounting for the tax effects of the Tax Act. SAB 118 provides a measurement period that should not extend beyond one year from the Tax Act enactment date for companies to complete the accounting under ASC Topic 740, "Income Taxes" (ASC 740). In accordance with SAB 118, a company must reflect the income tax effects of those aspects of the Tax Act for which the accounting
84
under ASC 740 is complete. To the extent that a company's accounting for certain income tax effects of the Tax Act is incomplete, but it is able to determine a reasonable estimate, it must record a provisional estimate in its financial statements. If a company cannot determine a provisional estimate to be included in the financial statements, it should continue to apply ASC 740 on the basis of the provisions of the tax laws that were in effect immediately before the enactment of the Tax Act. Our accounting for the following elements of the Tax Act is incomplete. However, the company was able to make reasonable estimates of certain effects and, therefore, recorded provisional adjustments, described below, which represent our provisional estimate of each of the following impacts of the Tax Act. Once Sysco has completed its accounting for the income tax effects of the Tax Act, the ultimate impact may differ from the provisional amounts recorded due to additional analysis, changes in interpretations and assumptions the company has made, additional regulatory guidance that may be issued, and actions the company may take as a result of the Tax Act. The accounting is not expected to extend beyond one year from the Tax Act enactment date.
Reduction of U.S. federal corporate tax rate: As noted above, the Tax Act reduces the U.S. federal corporate tax rate to 21% in our fiscal year; however, Section 15 of the Internal Revenue Code stipulates that the reduction in the corporate tax rate is applied to fiscal year taxpayers by computing a blended tax rate, based on the applicable tax rates before and after the effective date of the change in the statutory rate. When applied to Sysco's fiscal year, this blended rate is 28% for fiscal 2018. In fiscal 2018, the company recorded a provisional tax benefit attributable to remeasuring Sysco's deferred tax liabilities and deferred tax assets of $74.1 million .
Transition Tax: In the second quarter of fiscal 2018, the company recorded a discrete tax expense of $115.0 million attributable to the provisional impact of the transition tax. In the fourth quarter of fiscal 2018, this was reduced to $80.0 million due to changes in the provisional estimate. The transition tax is payable in eight annual installments beginning in our first quarter of fiscal 2019. As a result of the 8 year payment period, approximately $73.6 million attributable to the portion of the provisional transition tax not due within 12 months is located within other long-term liabilities in the consolidated balance sheet as of June 30, 2018 .
Our accounting for the following elements of the Tax Act is incomplete, and we were not able to make reasonable estimates of the effects. Therefore, no provisional adjustments were recorded.
GILTI: The Tax Act creates a new requirement that certain income earned by controlled foreign corporations (CFCs) must be included currently in the gross income of the CFCs' U.S. shareholder. GILTI is the excess of the shareholder's "net CFC tested income" over the net deemed tangible income return, which is currently defined as the excess of (1) 10 percent of the aggregate of the U.S. shareholder's pro rata share of the qualified business asset investment of each CFC with respect to which it is a U.S. shareholder over (2) the amount of certain interest expense taken into account in the determination of net CFC-tested income. Sysco will not be subject to the GILTI provisions until fiscal 2019.
Because of the complexity of the new GILTI tax rules, the company is continuing to evaluate this provision of the Tax Act and the application of ASC 740. Under U.S. GAAP, the company is allowed to make an accounting policy choice of either (1) treating taxes due on future U.S. inclusions in taxable income related to GILTI as a current-period expense when incurred (the "period cost method") or (2) factoring such amounts into a company's measurement of its deferred taxes (the "deferred method"). Sysco's selection of an accounting policy with respect to the new GILTI tax rules will depend, in part, on analyzing our global income to determine whether the company expects to have future U.S. inclusions in taxable income related to GILTI and, if so, what the impact is expected to be. Because whether Sysco expects to have future U.S. inclusions in taxable income related to GILTI depends not only on our current structure and estimated future results of global operations but also the company's intent and ability to modify its structure and/or its business, Sysco is not yet able to reasonably estimate the effect of this provision of the Tax Act. Therefore, the company has not made any adjustments related to potential GILTI tax in its financial statements and has not made a policy decision regarding whether to record deferred taxes on GILTI.
Executive Compensation Limitation: The Tax Act expands the definition under Section 162(m) of the Internal Revenue Code ("Section 162(m)") of covered employee and provides that, for specified employees, status as a covered employee continues for all subsequent tax years, including years after the death of the individual, and, among other modifications, repeals the exception for performance-based compensation and commissions from the $1 million deduction limitation. In addition, the Tax Act provides for transitional guidance that will allow certain payments made under written and binding agreements entered into prior to November 2, 2017 to be treated as if they were made under the provisions of Section 162(m) that were in effect prior to enactment of the Tax Act. The company is in the process of gathering information on existing compensation arrangements for covered employees as well as assessing the impact of transitional guidance on the realizability of existing deferred tax assets related to compensation arrangements of its covered employees. As a result, the company has not made any adjustments related to impacts of the new executive compensation limitations in its financial statements.
85
Indefinite Reinvestment Assertion: Prior to the enactment of the Tax Act, the company intended to indefinitely reinvest $1.4 billion of undistributed income of certain consolidated foreign subsidiaries, for which no deferred U.S. income tax provision had been recorded. However, upon enactment of the Tax Act, those undistributed earnings became subject to the U.S. transition tax. As a result, in the fourth quarter, the company repatriated $1.0 billion of foreign earnings of certain non-U.S. subsidiaries and recognized foreign income and non-income based taxes of $50.2 million.
The company is in the process of assessing the impact of the Tax Act on its indefinite reinvestment assertion and the company's plans to determine any associated impact on the financial statements. Therefore, no adjustments have been made in the financial statements with respect to its indefinite reinvestment assertion. An estimate of any U.S. or foreign income or non-income based taxes that may be applicable upon any future actual or deemed repatriation is not practical due to the complexities associated with the hypothetical calculation.
Effective Tax Rates
Reconciliations of the statutory federal income tax rate to the effective income tax rates for each fiscal year are as follows:
| 2018 |
| 2017 |
| 2016 | |||
U.S. statutory federal income tax rate | 28.00 | % |
| 35.00 | % |
| 35.00 | % |
State and local income taxes, net of any | 2.48 | |
| 2.61 | |
| 1.79 | |
Foreign income taxes | 0.07 | |
| (2.81 | ) |
| (2.40 | ) |
Uncertain tax position | (0.22 | ) |
| 0.01 | |
| (1.96 | ) |
Tax benefit of equity-based compensation | (2.66 | ) |
| - | |
| - | |
Impact of US Tax Reform | 0.13 | |
| - | |
| - | |
Other | (0.95 | ) |
| 0.50 | |
| 1.30 | |
Effective income tax rate | 26.85 | % |
| 35.31 | % |
| 33.73 | % |
The effective tax rate of 26.85% for fiscal 2018 was favorably impacted by the adoption of ASU 2016-09, Improvements to Employee Share-Based Payment Accounting (Topic 718), as well as a reduction of the statutory tax rate in the U.S. and certain foreign jurisdictions. Foreign earnings taxed at rates different than our domestic tax rate had the impact of increasing the effective tax rate.
The effective tax rate of 35.31% for fiscal 2017 was favorably impacted by tax credits allowed against U.S. Federal and State income tax liabilities, as well as a reduction of the statutory tax rate in certain foreign jurisdictions. Indefinitely reinvested earnings taxed at foreign statutory rates less than our domestic tax rate also had the impact of reducing the effective tax rate.
The effective tax rate of 33.73% for fiscal 2016 was favorably impacted by the favorable resolution of tax contingencies resulting in tax benefits of $29.6 million ( $10.6 million in tax and $19.0 million in interest). Costs associated with the redemption of the senior notes that had been issued in contemplation of the proposed merger with US Foods and charges incurred from the revision to the Company's business technology strategy resulted in lower state taxes. Indefinitely reinvested earnings taxed at foreign statutory rates less than our domestic tax rate also had the impact of reducing the effective tax rate.
Uncertain Tax Positions
A reconciliation of the beginning and ending amount of gross unrecognized tax benefits, excluding interest and penalties, is as follows:
| 2018 |
| 2017 | ||||
| (In thousands) | ||||||
Unrecognized tax benefits at beginning of year | $ | 16,278 | |
| $ | 24,614 | |
Additions for tax positions related to prior years | 652 | |
| 648 | | ||
Reductions for tax positions related to prior years | (4,033 | ) |
| (2,147 | ) | ||
Reductions due to settlements with taxing authorities | (702 | ) |
| (6,837 | ) | ||
Unrecognized tax benefits at end of year | $ | 12,195 | |
| $ | 16,278 | |
86
As of June 30, 2018 , the gross amount of liability for accrued interest and penalties related to unrecognized tax benefits was $8.5 million . As of July 1, 2017 , the gross amount of liability for accrued interest and penalties related to unrecognized tax benefits was $10.7 million . The expense recorded for interest and penalties related to unrecognized tax benefits was not material in any year presented.
If Sysco were to recognize all unrecognized tax benefits recorded as of June 30, 2018 , approximately $9.6 million of the $12.2 million reserve would reduce the effective tax rate. If Sysco were to recognize all unrecognized tax benefits recorded as of July 1, 2017 , approximately $10.8 million of the $16.3 million reserve would reduce the effective tax rate. It is reasonably possible that the amount of the unrecognized tax benefits with respect to certain of the company's unrecognized tax positions will increase or decrease in the next twelve months either because Sysco's positions are sustained on audit or because the company agrees to their disallowance. Items that may cause changes to unrecognized tax benefits primarily include the consideration of various filing requirements in various jurisdictions and the allocation of income and expense between tax jurisdictions. In addition, the amount of unrecognized tax benefits recognized within the next twelve months may decrease due to the expiration of the statute of limitations for certain years in various jurisdictions; however, it is possible that a jurisdiction may open an audit on one of these years prior to the statute of limitations expiring. Sysco anticipates an immaterial decrease to the reserve within twelve months as a result of lapse of statutes.
Sysco's federal tax returns for 2016 and subsequent tax years have statutes of limitations that remain open for audit. As of June 30, 2018 , Sysco's tax returns in the majority of the state and local and material foreign jurisdictions are no longer subject to audit for the years before 2010.
19. COMMITMENTS AND CONTINGENCIES
Legal Proceedings
Sysco is engaged in various legal proceedings that have arisen but have not been fully adjudicated. The likelihood of loss for these legal proceedings, based on definitions within contingency accounting literature, ranges from remote to reasonably possible to probable. When probable and reasonably estimable, the losses have been accrued. Although the final results of legal proceedings cannot be predicted with certainty, based on estimates of the range of potential losses associated with these matters, management does not believe the ultimate resolution of these proceedings, either individually or in the aggregate, will have a material adverse effect upon the consolidated financial position or results of operations of the company.
Other Commitments
Sysco has committed to aggregate product purchases for resale in order to benefit from a centralized approach to purchasing. A majority of these agreements expire within one year; however, certain agreements have terms through fiscal 2021 . These agreements commit the company to a minimum volume at various pricing terms, including fixed pricing, variable pricing or a combination thereof. Minimum amounts committed to as of June 30, 2018 totaled approximately $2.1 billion . Minimum amounts committed to by year are as follows:
| Amount | ||
| (In thousands) | ||
2019 | $ | 1,762,782 | |
2020 | 339,016 | | |
2021 | 1,459 | | |
Sysco has contracts with various third-party service providers to receive information technology services. The services have been committed for periods up to fiscal 2023 and may be extended. As of June 30, 2018 , the total remaining cost of the services over that period is expected to be approximately $325.0 million . A portion of this committed amount may be reduced by Sysco utilizing less than estimated resources and can be increased by Sysco utilizing more than estimated resources. Certain agreements allow adjustments for inflation. Sysco may also cancel a portion or all of the services provided subject to termination fees that decrease over time. If Sysco were to terminate all of the services in fiscal 2019 , the estimated termination fees incurred in fiscal 2019 would be approximately $76.7 million .
87
20. BUSINESS SEGMENT INFORMATION
The company has aggregated certain of its operating segments into three reportable segments. "Other" financial information is attributable to the company's other operating segments that do not meet the quantitative disclosure thresholds.
• | U.S. Foodservice Operations - primarily includes U.S. Broadline operations, which distribute a full line of food products, including custom-cut meat, seafood, specialty produce, specialty imports and a wide variety of non-food products; |
• | International Foodservice Operations - includes operations in the Americas and Europe, which distribute a full line of food products and a wide variety of non-food products. The Americas primarily consists of operations in Canada, Bahamas, Mexico, Costa Rica and Panama, as well as our operations that distribute to international customers. Our European operations primarily consist of operations in the United Kingdom (U.K.), France, Ireland and Sweden; |
• | SYGMA - our U.S. customized distribution subsidiary; and |
• | Other - primarily our hotel supply operations and Sysco Labs, which includes our suite of technology solutions that help support the business needs of our customers and provide support for some of our business technology needs. |
The accounting policies for the segments are the same as those disclosed by Sysco for its consolidated financial statements. Corporate expenses generally include all expenses of the corporate office and Sysco's shared services center. These also include all share-based compensation costs.
88
The following tables set forth certain financial information for Sysco's business segments.
| Fiscal Year | ||||||||||
| 2018 |
| 2017 |
| 2016 | ||||||
Sales: | (In thousands) | ||||||||||
U.S. Foodservice Operations | $ | 39,642,263 | |
| $ | 37,604,698 | |
| $ | 37,776,443 | |
International Foodservice Operations | 11,518,565 | |
| 10,613,059 | |
| 5,436,209 | | |||
SYGMA | 6,557,033 | |
| 6,178,909 | |
| 6,102,328 | | |||
Other | 1,009,463 | |
| 974,473 | |
| 1,051,939 | | |||
Total | $ | 58,727,324 | |
| $ | 55,371,139 | |
| $ | 50,366,919 | |
|
|
|
|
|
| ||||||
| Fiscal Year | ||||||||||
| 2018 |
| 2017 |
| 2016 | ||||||
Operating income: | (In thousands) | ||||||||||
U.S. Foodservice Operations | $ | 3,051,991 | |
| $ | 2,891,612 | |
| $ | 2,771,932 | |
International Foodservice Operations | 193,240 | |
| 243,116 | |
| 177,159 | | |||
SYGMA | 24,318 | |
| 23,299 | |
| 27,469 | | |||
Other | 39,485 | |
| 30,218 | |
| 32,586 | | |||
Total segments | 3,309,034 | |
| 3,188,245 | |
| 3,009,146 | | |||
Corporate | (980,060 | ) |
| (1,135,074 | ) |
| (1,158,646 | ) | |||
Total operating income | 2,328,974 | |
| 2,053,171 | |
| 1,850,500 | | |||
Interest expense | 395,483 | |
| 302,878 | |
| 306,146 | | |||
Other expense (income), net | (22,733 | ) |
| (15,937 | ) |
| 111,347 | | |||
Earnings before income taxes | $ | 1,956,224 | |
| $ | 1,766,230 | |
| $ | 1,433,007 | |
|
|
|
|
|
| ||||||
| Fiscal Year | ||||||||||
| 2018 |
| 2017 |
| 2016 | ||||||
Depreciation and amortization: | (In thousands) | ||||||||||
U.S. Foodservice Operations | $ | 348,041 | |
| $ | 266,024 | |
| $ | 252,392 | |
International Foodservice Operations | 258,156 | |
| 243,628 | |
| 70,184 | | |||
SYGMA | 36,367 | |
| 34,890 | |
| 31,792 | | |||
Other | 9,599 | |
| 10,678 | |
| 12,450 | | |||
Total segments | 652,163 | |
| 555,220 | |
| 366,818 | | |||
Corporate | 113,335 | |
| 346,772 | |
| 295,892 | | |||
Total | $ | 765,498 | |
| $ | 901,992 | |
| $ | 662,710 | |
|
|
|
|
|
| ||||||
| Fiscal Year | ||||||||||
| 2018 |
| 2017 |
| 2016 | ||||||
Capital Expenditures: | (In thousands) | ||||||||||
U.S. Foodservice Operations | $ | 262,887 | |
| $ | 194,714 | |
| $ | 153,528 | |
International Foodservice Operations | 157,139 | |
| 228,564 | |
| 56,689 | | |||
SYGMA | 45,132 | |
| 50,722 | |
| 31,811 | | |||
Other | 11,406 | |
| 13,237 | |
| 20,702 | | |||
Total segments | 476,564 | |
| 487,237 | |
| 262,730 | | |||
Corporate | 211,251 | |
| 199,141 | |
| 264,616 | | |||
Total | $ | 687,815 | |
| $ | 686,378 | |
| $ | 527,346 | |
89
| Fiscal Year | ||||||||||
| 2018 |
| 2017 |
| 2016 | ||||||
Assets: | (In thousands) | ||||||||||
U.S. Foodservice Operations | $ | 7,039,354 | |
| $ | 6,675,543 | |
| $ | 6,753,056 | |
International Foodservice Operations | 6,112,666 | |
| 6,433,815 | |
| 2,019,406 | | |||
SYGMA | 662,290 | |
| 625,653 | |
| 539,639 | | |||
Other | 452,426 | |
| 448,885 | |
| 459,785 | | |||
Total segments | 14,266,736 | |
| 14,183,896 | |
| 9,771,886 | | |||
Corporate | 3,803,668 | |
| 3,572,759 | |
| 6,949,918 | | |||
Total | $ | 18,070,404 | |
| $ | 17,756,655 | |
| $ | 16,721,804 | |
The sales mix for the principal product categories for each fiscal year is as follows:
| Fiscal Year | ||||||||||
| 2018 |
| 2017 |
| 2016 | ||||||
| (In thousands) | ||||||||||
Fresh and frozen meats | $ | 11,312,969 | |
| $ | 10,605,678 | |
| $ | 10,273,247 | |
Canned and dry products | 9,768,206 | |
| 8,695,829 | |
| 8,402,230 | | |||
Frozen fruits, vegetables, bakery and other | 9,025,762 | |
| 8,444,260 | |
| 6,719,648 | | |||
Dairy products | 6,037,409 | |
| 5,610,101 | |
| 5,276,991 | | |||
Poultry | 5,979,399 | |
| 5,873,944 | |
| 5,392,933 | | |||
Fresh produce | 4,929,366 | |
| 4,701,440 | |
| 4,156,978 | | |||
Paper and disposables | 3,837,943 | |
| 3,596,470 | |
| 3,557,514 | | |||
Seafood | 3,280,308 | |
| 3,089,350 | |
| 2,541,239 | | |||
Beverage products | 1,965,251 | |
| 2,059,453 | |
| 1,849,780 | | |||
Janitorial products | 1,395,100 | |
| 1,331,019 | |
| 1,251,821 | | |||
Equipment and smallwares | 795,406 | |
| 794,087 | |
| 593,595 | | |||
Medical supplies | 400,205 | |
| 569,508 | |
| 350,943 | | |||
Total | $ | 58,727,324 | |
| $ | 55,371,139 | |
| $ | 50,366,919 | |
90
Information concerning geographic areas is as follows:
| Fiscal Year | ||||||||||
| 2018 |
| 2017 |
| 2016 | ||||||
| (In thousands) | ||||||||||
Sales: |
|
|
|
|
| ||||||
United States | $ | 46,812,297 | |
| $ | 44,395,765 | |
| $ | 44,922,937 | |
Canada | 4,661,615 | |
| 4,346,894 | |
| 4,486,282 | | |||
United Kingdom | 3,176,069 | |
| 2,974,133 | |
| - | | |||
France | 1,625,407 | |
| 1,426,973 | |
| - | | |||
Other | 2,451,936 | |
| 2,227,374 | |
| 957,700 | | |||
Total | $ | 58,727,324 | |
| $ | 55,371,139 | |
| $ | 50,366,919 | |
Long-lived assets: |
| |
|
| |
|
| | |||
United States | $ | 3,448,164 | |
| $ | 3,252,980 | |
| $ | 3,461,505 | |
United Kingdom | 319,664 | |
| 303,178 | |
| - | | |||
Canada | 318,410 | |
| 329,090 | |
| 309,027 | | |||
France | 240,507 | |
| 284,611 | |
| - | | |||
Other | 194,915 | |
| 207,443 | |
| 109,910 | | |||
Total | $ | 4,521,660 | |
| $ | 4,377,302 | |
| $ | 3,880,442 | |
21. SUPPLEMENTAL GUARANTOR INFORMATION - SUBSIDIARY GUARANTEES
On January 19, 2011, the wholly owned U.S. Broadline subsidiaries of Sysco Corporation entered into full and unconditional guarantees of all outstanding senior notes and debentures of Sysco Corporation. All subsequent issuances of senior notes and debentures have also been guaranteed by these subsidiaries. As of June 30, 2018 , Sysco had a total of $8.3 billion in senior notes and debentures that was covered by these guarantees.
All subsidiary guarantors are 100% owned by the parent company, all guarantees are full and unconditional and all guarantees are joint and several, except that the guarantee of any subsidiary guarantor with respect to a series of senior notes or debentures may be released under certain customary circumstances. If we exercise our defeasance option with respect to the senior notes or debentures of any series, then any subsidiary guarantor effectively will be released with respect to that series. Further, each subsidiary guarantee will remain in full force and effect until the earliest to occur of the date, if any, on which (1) the applicable subsidiary guarantor shall consolidate with or merge into Sysco Corporation or any successor of Sysco Corporation or (2) Sysco Corporation or any successor of Sysco Corporation consolidates with or merges into the applicable subsidiary guarantor.
In conjunction with the preparation of our September 30, 2017 condensed consolidating financial statements, the company identified certain wholly owned U.S. Broadline subsidiaries that are guarantors of the outstanding senior notes and debentures of Sysco Corporation that were presented within Other Non-Guarantor Subsidiaries during fiscal 2017. The fiscal 2017 Condensed Consolidating Balance Sheet and Statements of Comprehensive Income and Cash Flows included herein have been revised to present such U.S. Broadline subsidiaries as guarantor subsidiaries. The company assessed the materiality of the incorrect guarantor disclosures and concluded that the misstatement was not material to the financial statements as a whole, but has provided revised information below for the sake of consistency with the current period disclosures.
The following condensed consolidating financial statements present separately the financial position, comprehensive income and cash flows of the parent issuer (Sysco Corporation), the guarantors (certain of the company's U.S. Broadline subsidiaries), and all other non-guarantor subsidiaries of Sysco (Other Non-Guarantor Subsidiaries) on a combined basis with eliminating entries.
91
| Condensed Consolidated Balance Sheet | ||||||||||||||||||
| Jun. 30, 2018 | ||||||||||||||||||
| Sysco |
| Certain U.S. |
| Other |
| Eliminations |
| Consolidated | ||||||||||
| (In thousands) | ||||||||||||||||||
Current assets | $ | 157,994 | |
| $ | 4,018,444 | |
| $ | 3,827,015 | |
| $ | - | |
| $ | 8,003,453 | |
Intercompany receivables | 6,621,438 | |
| 270,748 | |
| 5,793,352 | |
| (12,685,538 | ) |
| - | | |||||
Investment in subsidiaries | 4,896,004 | |
| - | |
| 983,625 | |
| (5,879,629 | ) |
| - | | |||||
Plant and equipment, net | 278,855 | |
| 2,181,576 | |
| 2,061,229 | |
| - | |
| 4,521,660 | | |||||
Other assets | 788,473 | |
| 611,004 | |
| 4,593,537 | |
| (447,723 | ) |
| 5,545,291 | | |||||
Total assets | $ | 12,742,764 | |
| $ | 7,081,772 | |
| $ | 17,258,758 | |
| $ | (19,012,890 | ) |
| $ | 18,070,404 | |
Current liabilities | $ | 1,233,541 | |
| $ | 886,305 | |
| $ | 4,468,900 | |
| $ | - | |
| $ | 6,588,746 | |
Intercompany payables | 882,487 | |
| 3,798,134 | |
| 8,004,917 | |
| (12,685,538 | ) |
| - | | |||||
Long-term debt | 7,470,334 | |
| 8,285 | |
| 62,146 | |
| - | |
| 7,540,765 | | |||||
Other liabilities | 649,445 | |
| 508,387 | |
| 686,178 | |
| (447,723 | ) |
| 1,396,287 | | |||||
Noncontrolling interest | - | |
| - | |
| 37,649 | |
| - | |
| 37,649 | | |||||
Shareholders' equity | 2,506,957 | |
| 1,880,661 | |
| 3,998,968 | |
| (5,879,629 | ) |
| 2,506,957 | | |||||
Total liabilities and shareholders' equity | $ | 12,742,764 | |
| $ | 7,081,772 | |
| $ | 17,258,758 | |
| $ | (19,012,890 | ) |
| $ | 18,070,404 | |
| Condensed Consolidated Balance Sheet | ||||||||||||||||||
| Jul. 1, 2017 | ||||||||||||||||||
| Sysco |
| Certain U.S. |
| Other |
| Eliminations |
| Consolidated | ||||||||||
| (In thousands) | ||||||||||||||||||
Current assets | $ | 177,495 | |
| $ | 3,786,055 | |
| $ | 4,069,888 | |
| $ | - | |
| $ | 8,033,438 | |
Intercompany receivables | 4,444,035 | |
| - | |
| - | |
| (4,444,035 | ) |
| - | | |||||
Investment in subsidiaries | 6,451,994 | |
| - | |
| - | |
| (6,451,994 | ) |
| - | | |||||
Plant and equipment, net | 258,527 | |
| 2,039,761 | |
| 2,079,014 | |
| - | |
| 4,377,302 | | |||||
Other assets | 151,743 | |
| 516,126 | |
| 4,678,046 | |
| - | |
| 5,345,915 | | |||||
Total assets | $ | 11,483,794 | |
| $ | 6,341,942 | |
| $ | 10,826,948 | |
| $ | (10,896,029 | ) |
| $ | 17,756,655 | |
Current liabilities | $ | 650,899 | |
| $ | 3,521,661 | |
| $ | 1,923,326 | |
| $ | - | |
| $ | 6,095,886 | |
Intercompany payables | - | |
| 366,802 | |
| 4,077,233 | |
| (4,444,035 | ) |
| - | | |||||
Long-term debt | 7,588,041 | |
| 7,776 | |
| 65,060 | |
| - | |
| 7,660,877 | | |||||
Other liabilities | 863,338 | |
| 103,784 | |
| 568,415 | |
| - | |
| 1,535,537 | | |||||
Noncontrolling interest | - | |
| - | |
| 82,839 | |
| - | |
| 82,839 | | |||||
Shareholders' equity | 2,381,516 | |
| 2,341,919 | |
| 4,110,075 | |
| (6,451,994 | ) |
| 2,381,516 | | |||||
Total liabilities and shareholders' equity | $ | 11,483,794 | |
| $ | 6,341,942 | |
| $ | 10,826,948 | |
| $ | (10,896,029 | ) |
| $ | 17,756,655 | |
92
| Condensed Consolidated Statement of Comprehensive Income | ||||||||||||||||||
| For the 52-Week Period Ended Jun. 30, 2018 | ||||||||||||||||||
| Sysco |
| Certain U.S. |
| Other |
| Eliminations |
| Consolidated | ||||||||||
| (In thousands) | ||||||||||||||||||
Sales | $ | - | |
| $ | 35,963,053 | |
| $ | 24,784,842 | |
| $ | (2,020,571 | ) |
| $ | 58,727,324 | |
Cost of sales | - | |
| 29,102,278 | |
| 20,560,226 | |
| (2,020,571 | ) |
| 47,641,933 | | |||||
Gross profit | - | |
| 6,860,775 | |
| 4,224,616 | |
| - | |
| 11,085,391 | | |||||
Operating expenses | 783,834 | |
| 4,012,391 | |
| 3,960,192 | |
| - | |
| 8,756,417 | | |||||
Operating income (loss) | (783,834 | ) |
| 2,848,384 | |
| 264,424 | |
| - | |
| 2,328,974 | | |||||
Interest expense (income) (1) | 294,401 | |
| (110,715 | ) |
| 211,797 | |
| - | |
| 395,483 | | |||||
Other expense (income), net | (19,135 | ) |
| (2,556 | ) |
| (1,042 | ) |
| - | |
| (22,733 | ) | |||||
Earnings (losses) before income taxes | (1,059,100 | ) |
| 2,961,655 | |
| 53,669 | |
| - | |
| 1,956,224 | | |||||
Income tax (benefit) provision | (135,385 | ) |
| 655,824 | |
| 5,019 | |
| - | |
| 525,458 | | |||||
Equity in earnings of subsidiaries | 2,354,481 | |
| - | |
| - | |
| (2,354,481 | ) |
| - | | |||||
Net earnings | 1,430,766 | |
| 2,305,831 | |
| 48,650 | |
| (2,354,481 | ) |
| 1,430,766 | | |||||
Other comprehensive income (loss) | 89,913 | |
| - | |
| (22,987 | ) |
| 22,987 | |
| 89,913 | | |||||
Comprehensive income | $ | 1,520,679 | |
| $ | 2,305,831 | |
| $ | 25,663 | |
| $ | (2,331,494 | ) |
| $ | 1,520,679 | |
(1) | Interest expense (income) includes $110.7 million of intercompany interest income, net, for certain of the U.S. Broadline subsidiaries, which is intercompany interest expense for Sysco Corporation. There is an immaterial amount of intercompany interest expense related to Sysco Corporation for the Other Non-Guarantor Subsidiaries. |
| Condensed Consolidated Statement of Comprehensive Income | ||||||||||||||||||
| For the 52-Week Period Ended Jul. 1, 2017 | ||||||||||||||||||
| Sysco |
| Certain U.S. |
| Other |
| Eliminations |
| Consolidated | ||||||||||
| (In thousands) | ||||||||||||||||||
Sales | $ | - | |
| $ | 34,325,884 | |
| $ | 22,862,131 | |
| $ | (1,816,876 | ) |
| $ | 55,371,139 | |
Cost of sales | - | |
| 27,690,469 | |
| 18,940,039 | |
| (1,816,876 | ) |
| 44,813,632 | | |||||
Gross profit | - | |
| 6,635,415 | |
| 3,922,092 | |
| - | |
| 10,557,507 | | |||||
Operating expenses | 931,498 | |
| 3,907,829 | |
| 3,665,009 | |
| - | |
| 8,504,336 | | |||||
Operating income (loss) | (931,498 | ) |
| 2,727,586 | |
| 257,083 | |
| - | |
| 2,053,171 | | |||||
Interest expense (income) (1) | 405,030 | |
| (122,012 | ) |
| 19,860 | |
| - | |
| 302,878 | | |||||
Other expense (income), net | (23,740 | ) |
| (1,116 | ) |
| 8,919 | |
| - | |
| (15,937 | ) | |||||
Earnings (losses) before income taxes | (1,312,788 | ) |
| 2,850,714 | |
| 228,304 | |
| - | |
| 1,766,230 | | |||||
Income tax (benefit) provision | (463,598 | ) |
| 1,006,703 | |
| 80,622 | |
| - | |
| 623,727 | | |||||
Equity in earnings of subsidiaries | 1,991,693 | |
| - | |
| - | |
| (1,991,693 | ) |
| - | | |||||
Net earnings | 1,142,503 | |
| 1,844,011 | |
| 147,682 | |
| (1,991,693 | ) |
| 1,142,503 | | |||||
Other comprehensive income (loss) | 95,381 | |
| - | |
| (9,317 | ) |
| 9,317 | |
| 95,381 | | |||||
Comprehensive income | $ | 1,237,884 | |
| $ | 1,844,011 | |
| $ | 138,365 | |
| $ | (1,982,376 | ) |
| $ | 1,237,884 | |
(1) | Interest expense (income) includes $122.0 million of intercompany interest income, net, for certain of the U.S. Broadline subsidiaries, which is intercompany interest expense for Sysco Corporation. There is an immaterial amount of intercompany interest expense related to Sysco Corporation for the Other Non-Guarantor Subsidiaries. |
93
| Condensed Consolidated Statement of Comprehensive Income | ||||||||||||||||||
| For the 53-Week Period Ended Jul. 2, 2016 | ||||||||||||||||||
| Sysco |
| Certain U.S. |
| Other |
| Eliminations |
| Consolidated | ||||||||||
| (In thousands) | ||||||||||||||||||
Sales | $ | - | |
| $ | 33,932,334 | |
| $ | 18,112,973 | |
| $ | (1,678,388 | ) |
| $ | 50,366,919 | |
Cost of sales | - | |
| 27,485,111 | |
| 15,519,724 | |
| (1,678,388 | ) |
| 41,326,447 | | |||||
Gross profit | - | |
| 6,447,223 | |
| 2,593,249 | |
| - | |
| 9,040,472 | | |||||
Operating expenses | 944,457 | |
| 3,857,415 | |
| 2,388,100 | |
| - | |
| 7,189,972 | | |||||
Operating income (loss) | (944,457 | ) |
| 2,589,808 | |
| 205,149 | |
| - | |
| 1,850,500 | | |||||
Interest expense (income) (1) | 381,122 | |
| (145,852 | ) |
| 70,876 | |
| - | |
| 306,146 | | |||||
Other expense (income), net | 128,777 | |
| (1,876 | ) |
| (15,554 | ) |
| - | |
| 111,347 | | |||||
Earnings (losses) before income taxes | (1,454,356 | ) |
| 2,737,536 | |
| 149,827 | |
| - | |
| 1,433,007 | | |||||
Income tax (benefit) provision | (490,579 | ) |
| 923,416 | |
| 50,548 | |
| - | |
| 483,385 | | |||||
Equity in earnings of subsidiaries | 1,913,399 | |
| - | |
| - | |
| (1,913,399 | ) |
| - | | |||||
Net earnings | 949,622 | |
| 1,814,120 | |
| 99,279 | |
| (1,913,399 | ) |
| 949,622 | | |||||
Other comprehensive income (loss) | (434,921 | ) |
| - | |
| (52,306 | ) |
| 52,306 | |
| (434,921 | ) | |||||
Comprehensive income | $ | 514,701 | |
| $ | 1,814,120 | |
| $ | 46,973 | |
| $ | (1,861,093 | ) |
| $ | 514,701 | |
(1) | Interest expense (income) includes $145.9 million of intercompany interest income, net, for certain of the U.S. Broadline subsidiaries, which is intercompany interest expense for Sysco Corporation. There is an immaterial amount of intercompany interest expense related to Sysco Corporation for the Other Non-Guarantor Subsidiaries. |
| Condensed Consolidated Cash Flows | ||||||||||||||||||
| For the 52-Week Period Ended Jun. 30, 2018 | ||||||||||||||||||
| Sysco |
| Certain U.S. |
| Other |
| Elimination (1) |
| Consolidated | ||||||||||
| (In thousands) | ||||||||||||||||||
Cash flows provided by (used for): |
|
|
|
|
|
|
|
|
| ||||||||||
Operating activities | $ | 1,055,228 | |
| $ | 2,548,139 | |
| $ | 799,062 | |
| $ | (2,243,797 | ) |
| $ | 2,158,632 | |
Investing activities | 55,612 | |
| (439,178 | ) |
| (503,745 | ) |
| (26,354 | ) |
| (913,665 | ) | |||||
Financing activities | (1,193,272 | ) |
| (2,015,906 | ) |
| (471,442 | ) |
| 2,270,151 | |
| (1,410,469 | ) | |||||
Effect of exchange rates on cash | - | |
| - | |
| 11,844 | |
| - | |
| 11,844 | | |||||
Net increase (decrease) in cash, cash equivalents and restricted cash | (82,432 | ) |
| 93,055 | |
| (164,281 | ) |
| - | |
| (153,658 | ) | |||||
Cash, cash equivalents and restricted cash at the beginning of period | 111,576 | |
| 18,788 | |
| 739,138 | |
| - | |
| 869,502 | | |||||
Cash, cash equivalents and restricted cash at the end of period | $ | 29,144 | |
| $ | 111,843 | |
| $ | 574,857 | |
| $ | - | |
| $ | 715,844 | |
(1) | Represents primarily inter-company dividends paid from the subsidiaries to the parent, Sysco Corporation, partially offset by intercompany loans issued. |
| Condensed Consolidated Cash Flows | ||||||||||||||||||
| For the 52-Week Period Ended Jul. 1, 2017 | ||||||||||||||||||
| Sysco |
| Certain U.S. |
| Other |
| Elimination (1) |
| Consolidated | ||||||||||
| (In thousands) | ||||||||||||||||||
Cash flows provided by (used for): |
|
|
|
|
|
|
|
|
| ||||||||||
Operating activities | $ | 1,535,725 | |
| $ | 3,023,400 | |
| $ | 658,229 | |
| $ | (2,978,000 | ) |
| $ | 2,239,354 | |
Investing activities | (3,274,566 | ) |
| (261,330 | ) |
| (175,565 | ) |
| 127,000 | |
| (3,584,461 | ) | |||||
Financing activities | (1,525,995 | ) |
| (2,777,661 | ) |
| (229,931 | ) |
| 2,851,000 | |
| (1,682,587 | ) | |||||
Effect of exchange rates on cash | - | |
| - | |
| (22,104 | ) |
| - | |
| (22,104 | ) | |||||
Net increase (decrease) in cash and cash equivalents | (3,264,836 | ) |
| (15,591 | ) |
| 230,629 | |
| - | |
| (3,049,798 | ) | |||||
Cash and cash equivalents at the beginning of period | 3,376,412 | |
| 34,379 | |
| 508,509 | |
| - | |
| 3,919,300 | | |||||
Cash and cash equivalents at the end of period | $ | 111,576 | |
| $ | 18,788 | |
| $ | 739,138 | |
| $ | - | |
| $ | 869,502 | |
(1) | Represents primarily inter-company dividends paid from the subsidiaries to the parent, Sysco Corporation. |
94
| Condensed Consolidated Cash Flows | ||||||||||||||||||
| For the 53-Week Period Ended Jul. 2, 2016 | ||||||||||||||||||
| Sysco |
| Certain U.S. |
| Other |
| Elimination (1) |
| Consolidated | ||||||||||
| (In thousands) | ||||||||||||||||||
Cash flows provided by (used for): |
|
|
|
|
|
|
|
|
| ||||||||||
Operating activities | $ | 1,045,900 | |
| $ | 4,101,840 | |
| $ | 767,607 | |
| $ | (3,927,000 | ) |
| $ | 1,988,347 | |
Investing activities | (145,444 | ) |
| (212,270 | ) |
| (411,388 | ) |
| - | |
| (769,102 | ) | |||||
Financing activities | (2,540,649 | ) |
| (3,881,879 | ) |
| 35,592 | |
| 3,927,000 | |
| (2,459,936 | ) | |||||
Effect of exchange rates on cash | - | |
| - | |
| (138,327 | ) |
| - | |
| (138,327 | ) | |||||
Intercompany activity | - | |
| - | |
| - | |
| - | |
| - | | |||||
Net increase (decrease) in cash and cash equivalents | (1,640,193 | ) |
| 7,691 | |
| 253,484 | |
| - | |
| (1,379,018 | ) | |||||
Cash and cash equivalents at the beginning of period | 5,016,605 | |
| 26,688 | |
| 255,025 | |
| - | |
| 5,298,318 | | |||||
Cash and cash equivalents at the end of period | $ | 3,376,412 | |
| $ | 34,379 | |
| $ | 508,509 | |
| $ | - | |
| $ | 3,919,300 | |
(1) | Represents primarily inter-company dividends paid from the subsidiaries to the parent, Sysco Corporation. |
22. QUARTERLY RESULTS (UNAUDITED)
Sysco's fiscal year includes four quarterly periods that are comprised of thirteen weeks each. Financial information for each quarter in the years ended June 30, 2018 and July 1, 2017 is set forth below:
| Fiscal 2018 Quarter Ended |
|
| ||||||||||||||||
| September 30 |
| December 30 |
| March 31 (1) |
| June 3 0 |
| Fiscal Year | ||||||||||
| (In thousands except for per share data) | ||||||||||||||||||
Sales | $ | 14,650,424 | |
| $ | 14,411,490 | |
| $ | 14,349,504 | |
| $ | 15,315,906 | |
| $ | 58,727,324 | |
Cost of sales | 11,856,756 | |
| 11,712,104 | |
| 11,673,876 | |
| 12,399,197 | |
| 47,641,933 | | |||||
Gross profit | 2,793,668 | |
| 2,699,386 | |
| 2,675,628 | |
| 2,916,709 | |
| 11,085,391 | | |||||
Operating expenses | 2,170,576 | |
| 2,167,104 | |
| 2,189,695 | |
| 2,229,042 | |
| 8,756,417 | | |||||
Operating income | 623,092 | |
| 532,282 | |
| 485,933 | |
| 687,667 | |
| 2,328,974 | | |||||
Interest expense | 80,884 | |
| 85,986 | |
| 136,145 | |
| 92,468 | |
| 395,483 | | |||||
Other expense (income), net | (4,248 | ) |
| (5,432 | ) |
| (15,096 | ) |
| 2,043 | |
| (22,733 | ) | |||||
Earnings before income taxes | 546,456 | |
| 451,728 | |
| 364,884 | |
| 593,156 | |
| 1,956,224 | | |||||
Income taxes | 178,816 | |
| 167,615 | |
| 34,799 | |
| 144,228 | |
| 525,458 | | |||||
Net earnings | $ | 367,640 | |
| $ | 284,113 | |
| $ | 330,085 | |
| $ | 448,928 | |
| $ | 1,430,766 | |
Per share: |
|
|
|
|
|
|
|
|
| ||||||||||
Basic net earnings | $ | 0.70 | |
| $ | 0.55 | |
| $ | 0.63 | |
| $ | 0.86 | |
| $ | 2.74 | |
Diluted net earnings | 0.69 | |
| 0.54 | |
| 0.63 | |
| 0.85 | |
| 2.70 | | |||||
Dividends declared | 0.33 | |
| 0.36 | |
| 0.36 | |
| 0.36 | |
| 1.41 | | |||||
(1) | Sysco's third quarter of fiscal 2018 included a charge for $53.1 million in interest expense related to the redemption of senior notes as well as tax benefits derived from our $380.0 million contribution to our U.S. Retirement Plan. See Note 11 , "Debt and Other Financing Arrangements" and Note 18 , "Income Taxes." |
95
| Fiscal 2017 Quarter Ended |
|
| ||||||||||||||||
| October 1 |
| December 31 |
| April 1 |
| July 1 |
| Fiscal Year | ||||||||||
| (In thousands except for per share data) | ||||||||||||||||||
Sales | $ | 13,968,654 | |
| $ | 13,457,268 | |
| $ | 13,524,172 | |
| $ | 14,421,045 | |
| $ | 55,371,139 | |
Cost of sales | 11,276,735 | |
| 10,885,405 | |
| 10,990,037 | |
| 11,661,455 | |
| 44,813,632 | | |||||
Gross profit | 2,691,919 | |
| 2,571,863 | |
| 2,534,135 | |
| 2,759,590 | |
| 10,557,507 | | |||||
Operating expenses | 2,125,086 | |
| 2,079,446 | |
| 2,098,173 | |
| 2,201,631 | |
| 8,504,336 | | |||||
Operating income | 566,833 | |
| 492,417 | |
| 435,962 | |
| 557,959 | |
| 2,053,171 | | |||||
Interest expense | 73,623 | |
| 72,231 | |
| 81,004 | |
| 76,020 | |
| 302,878 | | |||||
Other expense (income), net | (7,216 | ) |
| (2,320 | ) |
| (4,815 | ) |
| (1,586 | ) |
| (15,937 | ) | |||||
Earnings before income taxes | 500,426 | |
| 422,506 | |
| 359,773 | |
| 483,525 | |
| 1,766,230 | | |||||
Income taxes | 176,539 | |
| 147,339 | |
| 121,495 | |
| 178,354 | |
| 623,727 | | |||||
Net earnings | $ | 323,887 | |
| $ | 275,167 | |
| $ | 238,278 | |
| $ | 305,171 | |
| $ | 1,142,503 | |
Per share: |
| |
|
| |
|
| |
|
| |
|
| | |||||
Basic net earnings | $ | 0.58 | |
| $ | 0.50 | |
| $ | 0.44 | |
| $ | 0.57 | |
| $ | 2.10 | |
Diluted net earnings | 0.58 | |
| 0.50 | |
| 0.44 | |
| 0.57 | |
| 2.08 | | |||||
Dividends declared | 0.31 | |
| 0.33 | |
| 0.33 | |
| 0.33 | |
| 1.30 | | |||||
Item 9. Changes in and Disagreements with Accountants on Accounting and Financial Disclosure
None.
96
Item 9A. Controls and Procedures
Sysco's management, with the participation of our chief executive officer and chief financial officer, evaluated the effectiveness of our disclosure controls and procedures as of June 30, 2018 . The term "disclosure controls and procedures," as defined in Rules 13a-15(e) and 15d-15(e) under the Exchange Act, means controls and other procedures of a company that are designed to ensure that information required to be disclosed by a company in the reports that it files or submits under the Exchange Act is recorded, processed, summarized and reported, within the time periods specified in the Securities and Exchange Commission's rules and forms. Disclosure controls and procedures include, without limitation, controls and procedures designed to ensure that information required to be disclosed by a company in the reports that it files or submits under the Exchange Act is accumulated and communicated to the company's management, including its principal executive and principal financial officers, as appropriate to allow timely decisions regarding the required disclosure. Management recognizes that any controls and procedures, no matter how well designed and operated, can provide only reasonable assurance of achieving their objectives and management necessarily applies its judgment in evaluating the cost-benefit relationship of possible controls and procedures. Sysco's disclosure controls and procedures have been designed to provide reasonable assurance of achieving their objectives. Based on the evaluation of our disclosure controls and procedures as of June 30, 2018 , our chief executive officer and chief financial officer concluded that, as of such date, Sysco's disclosure controls and procedures were effective at the reasonable assurance level.
Management's report on internal control over financial reporting is included in the financial statement pages at page 40 .
There have been no changes in our internal control over financial reporting (as that term is defined in Rules 13a-15(f) and 15d-15(f) under the Exchange Act) that occurred during the fourth quarter ended June 30, 2018 , that have materially affected, or are reasonably likely to materially affect, our internal control over financial reporting.
Item 9B. Other Information
None.
PART III
Item 10. Directors, Executive Officers and Corporate Governance
The information required by this item will be included in our proxy statement for the 2018 Annual Meeting of Stockholders under the following captions, and is incorporated herein by reference thereto: "Corporate Governance," "Executive Officers," "Section 16(a) Beneficial Ownership Reporting Compliance," "Report of the Audit Committee" and "Board of Directors Matters."
Item 11. Executive Compensation
The information required by this item will be included in our proxy statement for the 2018 Annual Meeting of Stockholders under the following captions, and is incorporated herein by reference thereto: "Compensation Discussion and Analysis," "Report of the Compensation Committee," "Director Compensation" and "Executive Compensation."
Item 12. Security Ownership of Certain Beneficial Owners and Management and Related Stockholder Matters
The information required by this item will be included in our proxy statement for the 2018 Annual Meeting of Stockholders under the following captions, and is incorporated herein by reference thereto: "Stock Ownership" and "Equity Compensation Plan Information."
Item 13. Certain Relationships and Related Transactions, and Director Independence
The information required by this item will be included in our proxy statement for the 2018 Annual Meeting of Stockholders under the following caption, and is incorporated herein by reference thereto: "Corporate Governance – Certain Relationships and Related Person Transactions" and "Corporate Governance – Director Independence."
Item 14. Principal Accounting Fees and Services
The information required by this item will be included in our proxy statement for the 2018 Annual Meeting of Stockholders under the following caption, and is incorporated herein by reference thereto: "Fees Paid to Independent Registered Public Accounting Firm."
97
PART IV
Item 15. Exhibits
(a) The following documents are filed, or incorporated by reference, as part of this Form 10-K:
1. All financial statements. See Index to Consolidated Financial Statements on page 39 of this Form 10-K.
2. All financial statement schedules are omitted because they are not applicable or the information is set forth in the consolidated financial statements or notes thereto within Item 8. Financial Statements and Supplementary Data.
3. Exhibits.
The exhibits listed on the Exhibit Index immediately preceding such exhibits, which is hereby incorporated herein by reference, are filed or furnished as part of this Annual Report on Form 10-K.
Item 16. Form 10-K Summary
None.
98
SIGNATURES
Pursuant to the requirements of Section 13 or 15(d) of the Securities Exchange Act of 1934, Sysco Corporation has duly caused this Form 10-K to be signed on its behalf by the undersigned, thereunto duly authorized, on this 24th day of August 2018 .
SYSCO CORPORATION |
|
By: | /s/ THOMAS L. BENÉ |
| Thomas L. Bené |
| President and Chief Executive Officer |
Pursuant to the requirements of the Securities Exchange Act of 1934, this report has been signed below by the following persons on behalf of Sysco Corporation in the capacities indicated and on the date indicated above.
PRINCIPAL EXECUTIVE, FINANCIAL & ACCOUNTING OFFICERS:
/s/ THOMAS L. BENÉ | President and Chief Executive Officer |
Thomas L. Bené | (principal executive officer) |
|
|
/s/ JOEL T. GRADE | Executive Vice President and Chief Financial Officer |
Joel T. Grade | (principal financial officer) |
|
|
/s/ ANITA A. ZIELINSKI | Senior Vice President and Chief Accounting Officer |
Anita A. Zielinski | (principal accounting officer) |
|
|
DIRECTORS:
/s/ THOMAS L. BENÉ | /s/ HANS-JOACHIM KOERBER |
Thomas L. Bené | Hans-Joachim Koerber |
|
|
/s/ DANIEL J. BRUTTO | /s/ NANCY S. NEWCOMB |
Daniel J. Brutto | Nancy S. Newcomb |
|
|
/s/ JOHN M. CASSADAY | /s/ NELSON PELTZ |
John M. Cassaday | Nelson Peltz |
|
|
/s/ JOSHUA D. FRANK | /s/ EDWARD D. SHIRLEY |
Joshua D. Frank | Edward D. Shirley |
|
|
/s/ LARRY C. GLASSCOCK | /s/ SHEILA G. TALTON |
Larry C. Glasscock | Sheila G. Talton |
|
|
/s/ BRADLEY M. HALVERSON | /s/ RICHARD G. TILGHMAN |
Bradley M. Halverson | Richard G. Tilghman |
|
|
/s/ JOHN M. HINSHAW | /s/ JACKIE M. WARD |
John M. Hinshaw | Jackie M. Ward |
99
EXHIBIT INDEX
Exhibits.
2.1 | - | Agreement for the sale and purchase of securities in the capital of Cucina Lux Investments Limited, dated as of February 19, 2016, by and among Sysco Corporation, the Institutional Sellers and the Management Warrantors, incorporated by reference to Exhibit 2.1 to the Form 8-K filed on February 22, 2016 (File No. 1-6544). |
|
|
|
3.1 | - | Restated Certificate of Incorporation, incorporated by reference to Exhibit 3(a) to the Form 10-K for the year ended June 28, 1997 (File No. 1-6544). |
|
|
|
3.2 | - | Certificate of Amendment to Restated Certificate of Incorporation increasing authorized shares, incorporated by reference to Exhibit 3(e) to the Form 10-Q for the quarter ended December 27, 2003 (File No. 1-6544). |
|
|
|
3.3 | - | Form of Amended Certificate of Designation, Preferences and Rights of Series A Junior Participating Preferred Stock, incorporated by reference to Exhibit 3(c) to the Form 10-K for the year ended June 29, 1996 (File No. 1-6544). |
|
|
|
3.4 | - | Amended and Restated Bylaws of Sysco Corporation dated August 26, 2016, incorporated by reference to Exhibit 3.2 to the Form 8-K filed on August 31, 2016 (File No. 1-6544). |
|
|
|
4.1 | - | Senior Debt Indenture, dated as of June 15, 1995, between Sysco Corporation and First Union National Bank of North Carolina, Trustee, incorporated by reference to Exhibit 4(a) to Registration Statement on Form S-3 filed June 6, 1995 (File No. 33-60023). |
|
|
|
4.2 | - | Form of Guarantee of Indebtedness of Sysco Corporation under Exhibits 4.1 through 4.6 as executed by Sysco's U.S. Broadline subsidiaries, incorporated by reference to Exhibit 4.1 to the Form 8-K filed on January 20, 2011 (File No. 1-6544). |
|
|
|
4.3 | - | Thirteenth Supplemental Indenture, including form of Initial Guarantee, dated February 17, 2012 between Sysco Corporation, as Issuer, the Trustee and the Initial Guarantors, incorporated by reference to Exhibit 4(o) to Registration Statement on Form S-3 filed on February 17, 2012 (File No. 1-6544). |
|
|
|
4.4 | - | Indenture dated May 23, 2002 between Sysco International, Co., Sysco Corporation and Wachovia Bank, National Association, incorporated by reference to Exhibit 4.1 to Registration Statement on Form S-4 filed August 21, 2002 (File No. 333-98489). |
|
|
|
4.5 | - | Form of Supplemental Indenture No. 1, dated July 2, 2010, between Sysco International, ULC, as successor by conversion and name change to Sysco International Co., Sysco Corporation, as Guarantor, and the Trustee, incorporated by reference to Exhibit 4.12 to the Form 10-K for the year ended July 3, 2010 filed on August 31, 2010 (File No. 1-6544). |
|
|
|
4.6 | - | Agreement of Resignation, Appointment and Acceptance, dated February 13, 2007, by and among Sysco Corporation and Sysco International Co., a wholly owned subsidiary of Sysco Corporation, U.S. Bank National Association and The Bank of New York Trust Company, N.A., incorporated by reference to Exhibit 4(h) to Registration Statement on Form S-3 filed on February 6, 2008 (File No. 333-149086). |
|
|
|
10.1 | - | Credit Agreement dated November 2, 2016 between Sysco Corporation, JP Morgan Chase Bank, N.A., as Administrative Agent, and certain Lenders and Guarantors party thereto, incorporated by reference to Exhibit 10.1 to the Form 8-K filed on November 7, 2016 (File No. 1-6544). |
|
|
|
10.2 | - | Issuing and Paying Agent Agreement, dated as of October 31, 2014, between Sysco Corporation and U.S. Bank National Association, incorporated by reference to Exhibit 10.1 to the Form 10-Q for the quarter ended December 27, 2014 filed on February 2, 2015 (File No. 1-6544). |
|
|
|
10.3 | - | Amended and Restated Commercial Paper Dealer Agreement, dated as of October 31, 2014, between Sysco Corporation, as issuer, and JPMorgan Morgan Securities LLC, as Dealer, incorporated by reference to Exhibit 10.2 to the Form 10-Q for the quarter ended December 27, 2014 filed on February 2, 2015(File No. 1-6544). |
|
|
|
10.4 | - | Commercial Paper Dealer Agreement, dated as of October 31, 2014, between Sysco Corporation, as issuer, and Goldman, Sachs & Co, as Dealer, incorporated by reference to Exhibit 10.3 to the Form 10-Q for the quarter ended December 27, 2014 filed on February 2, 2015(File No. 1-6544). |
|
|
|
10.5 | - | Commercial Paper Dealer Agreement, dated as of January 18, 2017, between Sysco Corporation, as issuer, and Wells Fargo Securities, LLC, as Dealer, incorporated by reference to Exhibit 10.5 to the Form 10-K for the year ended July 1, 2017 filed on August 30, 2017 (File No. 1-6544). |
|
|
|
10.6 | - | Commercial Paper Dealer Agreement, dated as of February 3, 2017, between Sysco Corporation, as issuer, and Merrill Lynch, Pierce, Fenner & Smith Incorporated, as Dealer, incorporated by reference to Exhibit 10.6 to the Form 10-K for the year ended July 1, 2017 filed on August 30, 2017 (File No. 1-6544). |
|
|
|
100
10.7 | - | Demand Facility Agreement, dated as of June 30, 2011, between SFS Canada I, LP and The Toronto-Dominion Bank, incorporated by reference to Exhibit 10.7 to the Form 10-K for the year ended July 2, 2011 filed on August 30, 2011 (File No. 1-6544). |
|
|
|
10.8 | - | Guaranty Agreement, dated as of June 30, 2011, between Sysco Corporation and The Toronto-Dominion Bank, incorporated by reference to Exhibit 10.8 to the Form 10-K for the year ended July 2, 2011 filed on August 30, 2011 (File No. 1-6544). |
|
|
|
10.9† | - | Sixth Amended and Restated Sysco Corporation Executive Deferred Compensation Plan, incorporated by reference to Exhibit 10.3 to the Form 10-Q for the quarter ended October 2, 2010 filed on November 9, 2010 (File No. 1-6544). |
|
|
|
10.10† | - | First Amendment to the Sixth Amended and Restated Sysco Corporation Executive Deferred Compensation Plan, incorporated by reference to Exhibit 10.2 to the Form 10-Q for the quarter ended March 31, 2012 filed on May 8, 2012 (File No. 1-6544). |
|
|
|
10.11† | - | Seventh Amended and Restated Sysco Corporation Executive Deferred Compensation Plan, incorporated by reference to Exhibit 10.3 to the Form 10-Q for the quarter ended December 29, 2012 filed on February 4, 2013 (File No. 1-6544). |
|
|
|
10.12† | - | Amended and Restated Sysco Corporation Executive Deferred Compensation Plan, effective June 29, 2013, incorporated by reference to Exhibit 10.11 to the Form 10-K for the year ended June 29, 2013 filed on August 27, 2013 (File No. 1-6544). |
|
|
|
10.13† | - | 2015-1 Amendment to the Amended and Restated Sysco Corporation Executive Deferred Compensation Plan, incorporated by reference to Exhibit 10.16 to the Form 10-K for the year ended June 27, 2015 filed on August 25, 2015 (File No. 1-6544). |
|
|
|
10.14† | - | Tenth Amended and Restated Sysco Corporation Supplemental Executive Retirement Plan, incorporated by reference to Exhibit 10.4 to the Form 10-Q for the quarter ended October 2, 2010 filed on November 9, 2010 (File No. 1-6544). |
|
|
|
10.15† | - | First Amendment to Tenth Amended and Restated Sysco Corporation Supplemental Executive Retirement Plan, incorporated by reference to Exhibit 10.15 to the Form 10-K for the year ended July 2, 2011 filed on August 30, 2011 (File No. 1-6544). |
|
|
|
10.16† | - | Second Amendment to Tenth Amended and Restated Sysco Corporation Supplemental Executive Retirement Plan, incorporated by reference to Exhibit 10.1 to the Form 10-Q for the quarter ended March 31, 2012 filed on May 8, 2012 (File No. 1-6544). |
|
|
|
10.17† | - | Eleventh Amended and Restated Sysco Corporation Supplemental Executive Retirement Plan, incorporated by reference to Exhibit 10.2 to the Form 10-Q for the quarter ended December 29, 2012 filed on February 4, 2013 (File No. 1-6544). |
|
|
|
10.18† | - | Amended and Restated Sysco Corporation Supplemental Executive Retirement Plan, including the Amended and Restated Sysco Corporation MIP Retirement Program, attached as Appendix I, effective as of June 29, 2013, incorporated by reference to Exhibit 10.16 to the Form 10-K for the year ended June 29, 2013 filed on August 27, 2013 (File No. 1-6544). |
|
|
|
10.19† | - | First Amendment to the Amended and Restated Sysco Corporation Supplemental Executive Retirement Plan, incorporated by reference to Exhibit 10.2 to the Form 10-Q for the quarter ended March 29, 2014 filed on May 6, 2014 (File No. 1-6544). |
|
|
|
10.20† | - | Amended and Restated Sysco Corporation MIP Retirement Program, effective as of June 29, 2013, incorporated by reference to Exhibit 10.17 to the Form 10-K for the year ended June 29, 2013 filed on August 27, 2013 (File No. 1-6544). |
|
|
|
10.21† | - | First Amendment to the Amended and Restated Sysco Corporation MIP Retirement Program, incorporated by reference to Exhibit 10.3 to the Form 10-Q for the quarter ended March 29, 2014 filed on May 6, 2014 (File No. 1-6544). |
|
|
|
10.22† | - | Sysco Corporation Management Savings Plan, incorporated by reference to Exhibit 10.4 to the Form 10-Q for the quarter ended December 29, 2012 filed on February 4, 2013 (File No. 1-6544). |
|
|
|
10.23† | - | Amended and Restated Sysco Corporation Management Savings Plan, effective as of June 29, 2013, incorporated by reference to Exhibit 10.19 to the Form 10-K for the year ended June 29, 2013 filed on August 27, 2013 (File No. 1-6544). |
|
|
|
10.24† | - | First Amendment to the Amended and Restated Sysco Corporation Management Savings Plan, incorporated by reference to Exhibit 10.1 to the Form 10-Q for the quarter ended March 29, 2014 filed on May 6, 2014 (File No. 1-6544). |
|
|
|
101
10.25† | - | 2016-1 Amendment to the Amended and Restated Sysco Corporation Management Savings Plan, adopted effective November 15, 2016, incorporated by reference to Exhibit 10.1 to the Form 10-Q for the quarter ended December 31, 2016 filed on February 7, 2017 (File No. 1-6544). |
|
|
|
10.26† | - | Amendment 2018-1 to the Sysco Corporation Management Savings Plan, adopted effective January 1, 2018, incorporated by reference to Exhibit 10.1 to the Form 10-Q for the quarter ended December 30, 2017 filed on February 6, 2018 (File No. 1-6544). |
|
|
|
10.27†# | - | Amendment 2018-2 to the Sysco Corporation Management Savings Plan, adopted effective May 25, 2018. |
|
|
|
10.28† | - | 2007 Stock Incentive Plan, as amended, incorporated by reference to Annex B to the Sysco Corporation Proxy Statement filed on October 8, 2009 (File No. 1-6544). |
|
|
|
10.29† | - | Amendment 2017-1 to the Sysco Corporation 2007 Stock Incentive Plan, incorporated by reference to Exhibit 10.2 to the Form 10-Q for the quarter ended December 30, 2017 filed on February 6, 2018 (File No. 1-6544). |
|
|
|
10.30† | - | Form of Stock Option Grant Agreement issued to executive officers under the 2007 Stock Incentive Plan, incorporated by reference to Exhibit 10.6 to the Form 10-Q for the quarter ended December 29, 2007 filed on February 5, 2008 (File No. 1-6544). |
|
|
|
10.31† | - | Sysco Corporation 2013 Long-Term Incentive Plan, incorporated by reference to Exhibit 99.1 to the Form S-8 filed on November 15, 2013 (File No. 1-6544). |
|
|
|
10.32† | - | Amendment 2017-1 to the Sysco Corporation 2013 Long-Term Incentive Plan, incorporated by reference to Exhibit 10.30 to the Form 10-K for the year ended July 1, 2017 filed on August 30, 2017 (File No. 1-6544). |
|
|
|
10.33† | - | Form of Stock Option Grant Agreement issued to executive officers under the Sysco Corporation 2013 Long-Term Incentive Plan, incorporated by reference to Exhibit 10.3 to the Form 10-Q for the quarter ended December 28, 2013 filed on February 4, 2014 (File No. 1-6544). |
|
|
|
10.34† | - | Form of Stock Option Grant Agreement (Fiscal Year 2016) for executive officers under the Sysco Corporation 2013 Long-Term Incentive Plan, incorporated by reference to Exhibit 10.2 to the Form 10-Q for the quarter ended December 26, 2015 filed on February 2, 2016 (File No. 1-6544). |
|
|
|
10.35† | - | Form of Stock Option Grant Agreement (Fiscal Year 2017) for executive officers under the Sysco Corporation 2013 Long-Term Incentive Plan, incorporated by reference to Exhibit 10.3 to the Form 10-Q for the quarter ended October 1, 2016 filed on November 7, 2016 (File No. 1-6544). |
|
|
|
10.36† | - | Form of Stock Option Grant Agreement (Fiscal Year 2018) for executive officers under the Sysco Corporation 2013 Long-Term Incentive Plan, incorporated by reference to Exhibit 10.3 to the Form 10-Q for the quarter ended September 30, 2017 filed on November 9, 2017 (File No. 1-6544). |
|
|
|
10.37† | - | Form of Restricted Stock Unit Award Agreement (Fiscal Year 2016) for executive officers under the Sysco Corporation 2013 Long-Term Incentive Plan, incorporated by reference to Exhibit 10.1 to the Form 10-Q for the quarter ended December 26, 2015 filed on February 2, 2016 (File No. 1-6544). |
|
|
|
10.38† | - | Form of Performance Share Unit Grant Agreement (Fiscal Year 2017) for executive officers under the Sysco Corporation 2013 Long-Term Incentive Plan, incorporated by reference to Exhibit 10.2 to the Form 10-Q for the quarter ended October 1, 2016 filed on November 7, 2016 (File No. 1-6544). |
|
|
|
10.39† | - | Form of Performance Share Unit Grant Agreement (Fiscal Year 2018) for executive officers under the Sysco Corporation 2013 Long-Term Incentive Plan, incorporated by reference to Exhibit 10.2 to the Form 10-Q for the quarter ended September 30, 2017 filed on November 9, 2017 (File No. 1-6544). |
|
|
|
10.40† | - | Form of Sysco Protective Covenants Agreement (RSU Grant) issued to executive officers in connection with a Restricted Stock Unit Award Agreement issued under the 2013 Long-Term Incentive Plan, incorporated by reference to Exhibit 10.5 to the Form 10-Q for the quarter ended December 28, 2013 filed on February 4, 2014 (File No. 1-6544). |
|
|
|
10.41† | - | Form of Sysco Protective Covenants Agreement, adopted August 25, 2016, issued to executive officers in connection with a Performance Share Unit Grant Agreement under the 2013 Long-Term Incentive Plan, incorporated by reference to Exhibit 10.4 to the Form 10-Q for the quarter ended October 1, 2016 filed on November 7, 2016 (File No. 1-6544). |
|
|
|
10.42† | - | Sysco Corporation Fiscal Year 2016 Cash Performance Unit Program (Performance Period Fiscal 2016-2018) adopted effective August 20, 2015, incorporated by reference to Exhibit 10.2 to the Form 10-Q for the quarter ended September 26, 2015 filed on November 3, 2015 (File No. 1-6544). |
|
|
|
10.43† | - | Sysco Corporation Fiscal 2018 Management Incentive Program (MIP) For Corporate MIP Bonus-eligible Positions adopted effective July 27, 2017, incorporated by reference to Exhibit 10.1 to the Form 10-Q for the quarter ended September 30, 2017 filed on November 9, 2017 (File No. 1-6544). |
|
|
|
102
10.44† | - | Description of Sysco Corporation's Executive Relocation Expense Reimbursement Policy, incorporated by reference to Exhibit 10.3 to the Form 10-Q for the quarter ended January 1, 2011 filed on February 8, 2011 (File No. 1-6544). |
|
|
|
10.45† | - | Form of Restricted Stock Award Agreement for Directors pursuant to the 2013 Long-Term Incentive Plan, incorporated by reference to Exhibit 10.4 to the Form 10-Q for the quarter ended December 30, 2017 filed on February 6, 2018 (File No. 1-6544). |
|
|
|
10.46† | - | Form of Restricted Stock Award Agreement for Directors pursuant to the 2013 Long-Term Incentive Plan for directors who elect to defer receipt of shares under the 2009 Board of Directors Stock Deferral Plan, incorporated by reference to Exhibit 10.5 to the Form 10-Q for the quarter ended December 30, 2017 filed on February 6, 2018 (File No. 1-6544). |
|
|
|
10.47† | - | Sysco Corporation Non-Employee Directors Stock Election Policy, incorporated by reference to Exhibit 10.3 to the Form 10-Q for the quarter ended December 30, 2017 filed on February 6, 2018 (File No. 1-6544). |
|
|
|
10.48† | - | 2009 Non-Employee Directors Stock Plan, incorporated by reference to Annex A to the Sysco Corporation Proxy Statement filed October 8, 2009 (File No. 1-6544). |
|
|
|
10.49† | - | Form of Restricted Stock Grant Agreement under the 2009 Non-Employee Directors Stock Plan, incorporated by reference to Exhibit 10.1 to the Form 10-Q for the quarter ended April 2, 2011 filed on May 10, 2011(File No. 1-6544). |
|
|
|
10.50† | - | Form of Restricted Stock Grant Agreement under the 2009 Non-Employee Directors Stock Plan for those individuals who elected to defer receipt of shares under the 2009 Board of Directors Stock Deferral Plan, incorporated by reference to Exhibit 10.2 to the Form 10-Q for the quarter ended April 2, 2011 filed on May 10, 2011(File No. 1-6544). |
|
|
|
10.51† | - | Second Amended and Restated Board of Directors Deferred Compensation Plan dated April 1, 2002, incorporated by reference to Exhibit 10(aa) to the Form 10-K for the year ended June 29, 2002 filed on September 25, 2002 (File No. 1-6544). |
|
|
|
10.52† | - | First Amendment to Second Amended and Restated Board of Directors Deferred Compensation Plan dated July 12, 2002, incorporated by reference to Exhibit 10(bb) to the Form 10-K for the year ended June 29, 2002 filed on September 25, 2002 (File No. 1-6544). |
|
|
|
10.53† | - | Second Amendment to the Second Amended and Restated Sysco Corporation Board of Directors Deferred Compensation Plan, incorporated by reference to Exhibit 10(k) to the Form 10-Q for the quarter ended December 31, 2005 filed on February 9, 2006 (File No. 1-6544). |
|
|
|
10.54† | - | Third Amendment to the Second Amended and Restated Sysco Corporation Board of Directors Deferred Compensation Plan, incorporated by reference to Exhibit 10.4 to the Form 10-Q for the quarter ended March 31, 2012 filed on May 8, 2012 (File No. 1-6544). |
|
|
|
10.55† | - | Second Amended and Restated Sysco Corporation 2005 Board of Directors Deferred Compensation Plan, incorporated by reference to Exhibit 10.59 to the Form 10-K for the year ended June 28, 2008 filed on August 26, 2008 (File No. 1-6544). |
|
|
|
10.56† | - | First Amendment to the Second Amended and Restated Sysco Corporation 2005 Board of Directors Deferred Compensation Plan, incorporated by reference to Exhibit 10.3 to the Form 10-Q for the quarter ended March 31, 2012 filed on May 8, 2012 (File No. 1-6544). |
|
|
|
10.57† | - | 2009 Board of Directors Stock Deferral Plan, incorporated by reference to Exhibit 10.1 to the Form 10-Q for the quarter ended December 26, 2009 filed on February 2, 2010 (File No. 1-6544). |
|
|
|
10.58†# | - | Description of Compensation Arrangements with Non-Employee Directors. |
|
|
|
10.59† | - | Form of Indemnification Agreement with Non-Employee Directors, incorporated by reference to Exhibit 10.61 to the Form 10-K for the year ended July 28, 2008 filed on August 26, 2008 (File No. 1-6544). |
|
|
|
10.60† | - | Transition and Retirement Agreement, dated July 17, 2017, between Sysco Corporation and William J. DeLaney, incorporated by reference to Exhibit 10.54 to the Form 10-K for the year ended July 1, 2017 filed on August 30, 2017 (File No. 1-6544). |
|
|
|
12.1# | - | Statement regarding Computation of Ratio of Earnings to Fixed Charges. |
|
|
|
21.1# | - | Subsidiaries of the Registrant. |
|
|
|
23.1# | - | Consent of Independent Registered Public Accounting Firm. |
|
|
|
31.1# | - | CEO Certification Pursuant to Section 302 of the Sarbanes-Oxley Act of 2002. |
|
|
|
103
31.2# | - | CFO Certification Pursuant to Section 302 of the Sarbanes-Oxley Act of 2002. |
|
|
|
32.1# | - | CEO Certification Pursuant to Section 906 of the Sarbanes-Oxley Act of 2002. |
|
|
|
32.2# | - | CFO Certification Pursuant to Section 906 of the Sarbanes-Oxley Act of 2002. |
|
|
|
101.1# | - | The following financial information from Sysco Corporation's Annual Report on Form 10-K for the year ended June 30, 2018 filed with the SEC on August 24, 2018, formatted in XBRL includes: (i) Consolidated Balance Sheets as of June 30, 2018 and July 1, 2017, (ii) Consolidated Results of Operations for the periods ended June 30, 2018, July 1, 2017 and July 2, 2016, (iii) Consolidated Shareholders' Equity for the periods ended June 30, 2018, July 1, 2017 and July 2, 2016, (iv) Consolidated Cash Flows for the periods ended June 30, 2018, July 1, 2017 and July 2, 2016, and (v) the Notes to Consolidated Financial Statements. |
_________
† Executive Compensation Arrangement pursuant to 601(b)(10)(iii)(A) of Regulation S-K
# Filed Herewith
Note: Debt instruments of Sysco Corporation and its subsidiaries defining the rights of long-term debt holders in principal amounts not exceeding 10% of Sysco Corporation's consolidated assets have been omitted and will be provided to the Securities and Exchange Commission upon request.
104