|
UNITED STATES
SECURITIES AND EXCHANGE COMMISSION
Washington, D.C. 20549
|
FORM 10-K
[X] | ANNUAL REPORT PURSUANT TO SECTION 13 OR 15(d) OF THE SECURITIES EXCHANGE ACT OF 1934 |
For the fiscal year ended December 31, 2017
OR
[ ] | TRANSITION REPORT PURSUANT TO SECTION 13 OR 15(d) OF THE SECURITIES EXCHANGE ACT OF 1934 |
Commission file number: 000-09165

STRYKER CORPORATION
(Exact name of registrant as specified in its charter)
Michigan |
| 38-1239739 |
(State of incorporation) |
| (I.R.S. Employer Identification No.) |
|
|
|
2825 Airview Boulevard Kalamazoo, Michigan |
| 49002 |
(Address of principal executive offices) |
| (Zip Code) |
|
|
|
| (269) 385-2600 |
|
(Registrant's telephone number, including area code) | ||
| ||
Securities registered pursuant to Section 12(b) of the Act: | ||
Common Stock, $.10 par value |
| New York Stock Exchange |
(Title of each class) |
| (Name of each exchange on which registered) |
Securities registered pursuant to Section 12(g) of the Act: None
Indicate by check mark if the registrant is a well-known seasoned issuer, as defined in Rule 405 of the Securities Act. YES [X] NO [ ]
Indicate by check mark if the registrant is not required to file reports pursuant to Section 13 or 15(d) of the Act. YES [ ] NO [X]
Indicate by check mark whether the registrant (1) has filed all reports required to be filed by Section 13 or 15(d) of the Securities and Exchange Act of 1934 during the preceding 12 months (or for such shorter period that the registrant was required to file such reports), and (2) has been subject to such filing requirements for the past 90 days. YES [X] NO [ ]
Indicate by check mark whether the registrant has submitted electronically and posted on its corporate Website, if any, every Interactive Data File required to be submitted and posted pursuant to Rule 405 of Regulation S-T (§232.405 of this chapter) during the preceding 12 months (or for such shorter period that the registrant was required to submit and post such files). YES [X] NO [ ]
Indicate by check mark if disclosure of delinquent filers pursuant to Item 405 of Regulation S-K (§229.405 of this chapter) is not contained herein, and will not be contained, to the best of registrant's knowledge, in definitive proxy or information statements incorporated by reference in Part III of this Form 10-K or any amendment to this Form 10-K. [ ]
Indicate by check mark whether the registrant is a large accelerated filer, an accelerated filer, a non-accelerated filer, a smaller reporting company, or an emerging growth company. See definitions of "large accelerated filer," "accelerated filer," "smaller reporting company," and "emerging growth company" in Rule 12b-2 of the Exchange Act.
Large accelerated filer | [X] |
| Accelerated filer | [ ] |
Non-accelerated filer | [ ] | (Do not check if a smaller reporting company) | Small reporting company | [ ] |
|
|
| Emerging growth company | [ ] |
If an emerging growth company, indicate by check mark if the registrant has elected not to use the extended transition period for complying with any new or revised financial accounting standards provided pursuant to Section 13(a) of the Exchange Act. [ ]
Indicate by check mark whether the registrant is a shell company (as defined in Rule 12b-2 of the Act). YES [ ] NO [X]
Based on the closing sales price of June 30, 2017 , the aggregate market value of the voting stock held by non-affiliates of the registrant was approximately $48,322,392,325 . There were 374,642,060 shares outstanding of the registrant's common stock, $.10 par value, on January 31, 2018 .
DOCUMENTS INCORPORATED BY REFERENCE
Portions of the proxy statement to be filed with the U.S. Securities and Exchange Commission relating to the 2018 Annual Meeting of Shareholders (the 2018 proxy statement) are incorporated by reference into Part III.
|
STRYKER CORPORATION 2017 FORM 10-K
TABLE OF CONTENTS
PART I |
| ||
Item 1. | Business | 1 | |
Item 1A. | Risk Factors | 3 | |
Item 1B. | Unresolved Staff Comments | 6 | |
Item 2. | Properties | 6 | |
Item 3. | Legal Proceedings | 6 | |
Item 4. | Mine Safety Disclosures | 6 | |
|
| ||
PART II |
| ||
Item 5. | Market for the Registrant's Common Equity, Related Stockholder Matters and Issuer Purchases of Equity Securities | 6 | |
Item 6. | Selected Financial Data | 7 | |
Item 7. | Management's Discussion and Analysis of Financial Condition and Results of Operations | 8 | |
Item 7A. | Quantitative and Qualitative Disclosures About Market Risk | 15 | |
Item 8. | Financial Statements and Supplementary Data | 16 | |
| Report of Independent Registered Public Accounting Firm | 16 | |
| Consolidated Statements of Earnings | 17 | |
| Consolidated Statements of Comprehensive Income | 17 | |
| Consolidated Balance Sheets | 18 | |
| Consolidated Statements of Shareholders' Equity | 19 | |
| Consolidated Statements of Cash Flows | 20 | |
| Notes to Consolidated Financial Statements | 21 | |
Item 9. | Changes in and Disagreements With Accountants on Accounting and Financial Disclosure | 31 | |
Item 9A. | Controls and Procedures | 31 | |
Item 9B. | Other Information | 33 | |
|
| ||
PART III |
| ||
Item 10. | Directors, Executive Officers and Corporate Governance | 33 | |
Item 11. | Executive Compensation | 33 | |
Item 12. | Security Ownership of Certain Beneficial Owners and Management and Related Stockholder Matters | 33 | |
Item 13. | Certain Relationships and Related Transactions, and Director Independence | 33 | |
Item 14. | Principal Accounting Fees and Services | 33 | |
|
| ||
PART IV |
| ||
Item 15. | Exhibits, Financial Statement Schedules | 34 | |
Item 16. | Form 10-K Summary | 37 | |
STRYKER CORPORATION 2017 FORM 10-K
PART I |
ITEM 1. | BUSINESS. |
Stryker Corporation (Stryker or the Company) is one of the world's leading medical technology companies and, together with its customers, is driven to make healthcare better. The Company offers innovative products and services in Orthopaedics, Medical and Surgical, and Neurotechnology and Spine that help improve patient and hospital outcomes.
Our core values guide our behaviors and actions and are fundamental to how we execute our mission.

Stryker was incorporated in Michigan in 1946 as the successor company to a business founded in 1941 by Dr. Homer H. Stryker, a prominent orthopaedic surgeon and the inventor of several medical products. Our products are sold in over 85 countries through company-owned subsidiaries and branches, as well as third-party dealers and distributors, and include implants used in joint replacement and trauma surgeries; surgical equipment and surgical navigation systems; endoscopic and communications systems; patient handling, emergency medical equipment and intensive care disposable products; neurosurgical, neurovascular and spinal devices; as well as other products used in a variety of medical specialties. In the United States most of our products are marketed directly to doctors, hospitals and other healthcare facilities.
As used herein, and except where the context otherwise requires, "Stryker," "we," "us," and "our" refer to Stryker Corporation and its consolidated subsidiaries.
Business Segments and Geographic Information
We segregate our operations into three reportable business segments: Orthopaedics, MedSurg and Neurotechnology and Spine. Financial information regarding our reportable business segments and certain geographic information is included under "Results of Operations" in Item 7 of this report and Note 13 to our Consolidated Financial Statements.
Net Sales by Reportable Segment | |||||||||||||||||
| 2017 |
| 2016 |
| 2015 | ||||||||||||
Orthopaedics | $ | 4,713 | | 38 | % |
| $ | 4,422 | | 39 | % |
| $ | 4,223 | | 43 | % |
MedSurg | 5,557 | | 45 | |
| 4,894 | | 43 | |
| 3,895 | | 39 | | |||
Neurotechnology and Spine | 2,174 | | 17 | |
| 2,009 | | 18 | |
| 1,828 | | 18 | | |||
Total | $ | 12,444 | | 100 | % |
| $ | 11,325 | | 100 | % |
| $ | 9,946 | | 100 | % |
Orthopaedics
Orthopaedics products consist primarily of implants used in hip and knee joint replacements and trauma and extremities surgeries. We bring patients and physicians advanced implant designs and
specialized instrumentation that make orthopaedic surgery and recovery simpler, faster and more effective. We support surgeons with the technology and services they need as they develop new surgical techniques. In 2015 we received clearance by the United States Food and Drug Administration (FDA) for our Mako total knee application and completed the full commercial launch in 2017. This expands our Mako product offerings of partial knee and total hip applications to provide a comprehensive solution in the robotic arm-assisted reconstructive surgery line.
Stryker is one of four leading global competitors for joint replacement and trauma and extremities products; the other three being Zimmer Biomet Holdings, Inc. (Zimmer), DePuy Synthes (a Johnson & Johnson company) and Smith & Nephew plc (Smith & Nephew).
Composition of Orthopaedics Net Sales | |||||||||||||||||
| 2017 |
| 2016 |
| 2015 | ||||||||||||
Knees | $ | 1,595 | | 34 | % |
| $ | 1,490 | | 34 | % |
| $ | 1,403 | | 33 | % |
Hips | 1,303 | | 28 | |
| 1,283 | | 29 | |
| 1,263 | | 30 | | |||
Trauma and Extremities | 1,478 | | 31 | |
| 1,364 | | 31 | |
| 1,291 | | 31 | | |||
Other | 337 | | 7 | |
| 285 | | 6 | |
| 266 | | 6 | | |||
Total | $ | 4,713 | | 100 | % |
| $ | 4,422 | | 100 | % |
| $ | 4,223 | | 100 | % |
MedSurg
MedSurg products include surgical equipment and navigation systems (Instruments), endoscopic and communications systems (Endoscopy), patient handling, emergency medical equipment and intensive care disposable products (Medical), reprocessed and remanufactured medical devices (Sustainability) and other medical device products used in a variety of medical specialties.
Stryker is one of five leading global competitors in Instruments; the other four being Zimmer, Medtronic plc., Johnson & Johnson and ConMed Linvatec, Inc. (a subsidiary of CONMED Corporation). In Endoscopy we compete with Smith & Nephew, ConMed Linvatec, Arthrex, Inc., Karl Storz GmbH & Co., Olympus Optical Co. Ltd. and STERIS plc. In Medical our primary competitors are Hill-Rom Holdings, Inc., Zoll Medical Corporation, Medline Industries and Koninklijke Philips N.V.
Composition of MedSurg Net Sales | |||||||||||||||||
| 2017 |
| 2016 |
| 2015 | ||||||||||||
Instruments | $ | 1,678 | | 30 | % |
| $ | 1,553 | | 32 | % |
| $ | 1,466 | | 38 | % |
Endoscopy | 1,652 | | 30 | |
| 1,470 | | 30 | |
| 1,390 | | 36 | | |||
Medical | 1,969 | | 35 | |
| 1,633 | | 33 | |
| 823 | | 21 | | |||
Sustainability | 258 | | 5 | |
| 238 | | 5 | |
| 216 | | 5 | | |||
Total | $ | 5,557 | | 100 | % |
| $ | 4,894 | | 100 | % |
| $ | 3,895 | | 100 | % |
In 2017 Instruments launched System 8, the next generation of power tools comprised of a sagittal saw, reciprocating saw, rotary drill and sternum saw. The new power tools offer improved ergonomics, a quick and efficient keyless chuck system preventing loosening through a secondary locking mechanism and advanced material and coating to prevent sticking and slipping. In addition, the handpieces are built to be actively washed and temporarily submerged prior to sterilization.
Neurotechnology and Spine
Neurotechnology and Spine products include neurosurgical, neurovascular, and spinal implant devices. Our neurotechnology offering includes products used for minimally invasive endovascular techniques; a comprehensive line of products for traditional brain and open skull based surgical procedures; orthobiologic and biosurgery products, including synthetic bone grafts and vertebral augmentation products; and minimally invasive products for the treatment of acute ischemic and hemorrhagic stroke. Our spinal
Dollar amounts in millions except per share amounts or as otherwise specified. | 1 |
STRYKER CORPORATION 2017 FORM 10-K
implant offering includes cervical, thoracolumbar and interbody systems used in spinal injury, deformity and degenerative therapies.
Stryker is one of five leading global competitors in Neurotechnology; the other four being Medtronic, Johnson & Johnson, Terumo Corporation and Penumbra, Inc. Stryker is one of five leading global competitors in Spine; the other four being Medtronic Sofamor Danek, Inc. (a subsidiary of Medtronic), DePuy Synthes, Nuvasive, Inc. and Globus Medical, Inc.
Composition of Neurotechnology and Spine Net Sales | |||||||||||||||||
| 2017 |
| 2016 |
| 2015 | ||||||||||||
Neurotechnology | $ | 1,423 | | 65 | % |
| $ | 1,255 | | 62 | % |
| $ | 1,088 | | 60 | % |
Spine | 751 | | 35 | |
| 754 | | 38 | |
| 740 | | 40 | | |||
Total | $ | 2,174 | | 100 | % |
| $ | 2,009 | | 100 | % |
| $ | 1,828 | | 100 | % |
In 2017 the New England Journal of Medicine published the results of the DAWN Trial, the first to provide compelling evidence in treating late window and wake-up stroke patients with mechanical thrombectomy. The purpose of the study is to demonstrate superior clinical outcomes at 90 days with Trevo™ Retriever plus medical management compared to medical management alone in appropriately selected stroke patients treated six to 24 hours after last seen well (for cases of unknown time of onset). The Trevo™ Retriever's indication within the DAWN Trial, for use in patients treated six to 24 hours after last seen well, is currently under an Investigational Device Exemption (IDE), and the submission for expanding the indication for the later time window is pending.
Raw Materials and Inventory
Raw materials essential to our business are generally readily available from multiple sources; however, certain of our raw materials are currently sourced from single suppliers. Substantially all products we manufacture are stocked in inventory, while certain MedSurg products are assembled to order.
Patents and Trademarks
Patents and trademarks are significant to our business to the extent that a product or an attribute of a product represents a unique design or process. Patent protection of such products restricts competitors from duplicating these unique designs and features. We seek to obtain patent protection on our products whenever appropriate for protecting our competitive advantage. On December 31, 2017 we owned approximately 2,674 United States patents and approximately 3,886 international patents.
Seasonality
Our business is generally not seasonal in nature; however, the number of orthopaedic implant surgeries is typically lower in the summer months, and sales of capital equipment are generally higher in the fourth quarter.
Competition
In each of our product lines we compete with local and global companies. The development of new and innovative products is important to our success in all areas of our business. Competition in research involving the development and improvement of new and existing products and processes is particularly significant. The competitive environment requires substantial investments in continuing research and maintaining sales forces.
We believe our commitment to innovation, quality and service and our reputation differentiates us in the highly competitive product categories in which we operate and enables us to compete effectively. We believe that our competitive position in the future will depend to a large degree on our ability to develop new products and make improvements to existing products.
Research and Development
Continued investment in research and development activities is critical to drive future growth and supports our strategy to make healthcare better through development of products and services that improve patient outcomes. Most of our products and product improvements were developed internally at research facilities in the United States, China, France, Germany, India, Ireland, Puerto Rico, Sweden, Switzerland and United Kingdom. We also invest through acquisitions in technologies developed by third parties that have the potential to expand the markets in which we operate. We maintain close working relationships with physicians and medical personnel in hospitals and universities who assist us in product development efforts. The total cost of research, development and engineering activities were $787 , $715 and $625 in 2017, 2016 and 2015.
Regulation
Our businesses are subject to varying degrees of governmental regulation in the countries in which we operate, and the general trend is toward increasingly stringent regulation.
In the United States the Medical Device Amendments of 1976 to the Federal Food, Drug and Cosmetic Act and its subsequent amendments and the regulations issued and proposed thereunder provide for regulation by the FDA of the design, manufacture and marketing of medical devices, including most of our products. Many of our new products fall into FDA classifications that require notification submitted as a 510(k) and review by the FDA before we begin marketing them. Certain of our products require extensive clinical testing, consisting of safety and efficacy studies, followed by pre-market approval (PMA) applications for specific surgical indications.
The FDA's Quality System regulations set forth standards for our product design and manufacturing processes, require the maintenance of certain records and provide for inspections of our facilities by the FDA. There are also certain requirements of state, local and foreign governments that must be complied with in the manufacture and marketing of our products.
The member states of the European Union (EU) adopted the European Medical Device Directives, which form a single set of medical device regulations for all EU member countries. These regulations require companies that wish to manufacture and distribute medical devices in EU member countries to meet certain quality system requirements and obtain CE marking for their products. We have authorization to apply the CE marking to substantially all of our products. In addition, we comply with the unique regulatory requirements of each of the countries in Europe and other countries in which we market our products.
Initiatives to limit the growth of general healthcare expenses and hospital costs are ongoing in the markets in which we do business. These initiatives are sponsored by government agencies, legislative bodies and the private sector and include price regulation and competitive pricing. It is not possible to predict at this time the long-term impact of such cost containment measures on our future business. In addition, business practices in the healthcare industry are scrutinized, particularly in the United States, by federal and state government agencies. The resulting investigations and prosecutions carry the risk of significant civil and criminal penalties.
Environment
We are subject to various rules and regulation in the United States and internationally related to the protection of human health and the environment. Our operations involve the use of substances regulated under environmental laws, primarily in manufacturing and sterilization processes. We believe our policies, practices and
Dollar amounts in millions except per share amounts or as otherwise specified. | 2 |
STRYKER CORPORATION 2017 FORM 10-K
procedures are properly designed to comply, in all material respects, with applicable environmental laws and regulations. We do not expect compliance with these requirements to have a material effect on purchases of property, plant and equipment, cash flows, net earnings or competitive position.
Employees
On December 31, 2017 we had approximately 33,000 employees globally.
Executive Officers
As of January 31, 2018 | |||
Name | Age | Title | First Became an Executive Officer |
Kevin A. Lobo | 52 | Chairman and Chief Executive Officer | 2011 |
Yin C. Becker | 54 | Vice President of Communication and Public Affairs | 2016 |
William E. Berry Jr. | 52 | Vice President, Corporate Controller and Principal Accounting Officer | 2014 |
Glenn S. Boehnlein | 56 | Vice President, Chief Financial Officer | 2016 |
Lonny J. Carpenter | 56 | Group President, Global Quality and Business Operations | 2008 |
M. Kathryn Fink | 48 | Vice President, Chief Human Resources Officer | 2016 |
David K. Floyd | 57 | Group President, Orthopaedics | 2012 |
Michael D. Hutchinson | 47 | General Counsel | 2014 |
Graham A. McLean | 53 | President, Asia-Pacific | 2017 |
Katherine A. Owen | 47 | Vice President, Strategy and Investor Relations | 2007 |
Bijoy S.N. Sagar | 49 | Vice President, Chief Information Officer | 2014 |
Timothy J. Scannell | 53 | Group President, MedSurg and Neurotechnology | 2008 |
Each of our executive officers was elected by our Board of Directors to serve in the office indicated until the first meeting of the Board of Directors following the annual meeting of shareholders in 2018 or until a successor is chosen and qualified or until his or her resignation or removal. Each of our executive officers held the position above or served Stryker in various executive or administrative capacities for at least five years, except for Ms. Fink and Mr. Sagar. Prior to joining Stryker in October 2013, Ms. Fink held a variety of senior level human resources roles for the previous six years at Johnson & Johnson, most recently as the Worldwide Vice President, Human Resources of Ethicon. While at Stryker, Ms. Fink held two different senior level Human Resource roles. Prior to joining Stryker in May 2014, Mr. Sagar served as the Chief Information officer for Merck Millipore, and before that as Global Head of Information Systems and a member of the divisional board for the chemicals division of Merck KGaA. Mr. McLean was appointed to the position of President, Asia-Pacific, effective January 1, 2017. Prior to this role, Mr. McLean held a variety of senior level leadership roles at Stryker since 2005.
Available Information
Our main corporate website address is www.stryker.com. Copies of our filings with the United States Securities and Exchange Commission (SEC) are available free of charge on our website within the "Investors Relations" section as soon as reasonably practicable after having been electronically filed or furnished to the SEC. All SEC filings are also available at the SEC's website at www.sec.gov .
ITEM 1A. | RISK FACTORS. |
This report contains statements that are not historical facts and are considered "forward-looking statements" within the meaning of the Private Securities Litigation Reform Act of 1995. These statements
are based on current projections about operations, industry conditions, financial condition and liquidity. Words that identify forward-looking statements include words such as "may," "could," "will," "should," "possible," "plan," "predict," "forecast," "potential," "anticipate," "estimate," "expect," "project," "intend," "believe," "may impact," "on track," "goal," "strategy" and words and terms of similar substance used in connection with any discussion of future operating or financial performance, an acquisition or our businesses. In addition, any statements that refer to expectations, projections or other characterizations of future events or circumstances, including any underlying assumptions, are forward-looking statements. Those statements are not guarantees and are subject to risks, uncertainties and assumptions that are difficult to predict. Therefore, actual results could differ materially and adversely from these forward-looking statements. Some important factors that could cause our actual results to differ from our expectations in any forward-looking statements include the risks discussed below.
Our operations and financial results are subject to various risks and uncertainties discussed below that could materially and adversely affect our business, cash flows, financial condition and results of operations. Additional risks and uncertainties not currently known to us or that we currently deem not to be material may also materially and adversely affect our business, cash flows, financial condition or results of operations.
LEGAL AND REGULATORY RISKS
Current economic and political conditions make tax rules in jurisdictions subject to significant change: Our future results of operations could be affected by changes in the effective tax rate as a result of changes in tax laws, regulations and judicial rulings. In December 2017, the Tax Cuts and Jobs Act of 2017 was signed into law in the United States. We are continuing to evaluate the impact of tax reform and expect our effective tax rate to increase. In addition, further changes in the tax laws of foreign jurisdictions could arise, including as a result of the base erosion and profit shifting (BEPS) project undertaken by the Organisation for Economic Cooperation and Development (OECD). The OECD, which represents a coalition of member countries, has issued recommendations that, in some cases, would make substantial changes to numerous long-standing tax positions and principles. These contemplated changes, to the extent adopted by OECD members and/or other countries, could increase tax uncertainty and may adversely affect our provision for income taxes.
The impact of United States healthcare reform legislation on our business remains uncertain: In 2010 the Patient Protection and Affordable Care Act (ACA) was enacted. While the provisions of the ACA are intended to expand access to health insurance coverage and improve the quality of healthcare over time, other provisions of the legislation, including Medicare provisions aimed at decreasing costs, comparative effectiveness research, an independent payment advisory board and pilot programs to evaluate alternative payment methodologies, are having a meaningful effect on the way healthcare is developed and delivered and could have a significant effect on our business. Among other things, the ACA imposed a 2.3 percent excise tax on medical devices that applies only to United States sales, which are a majority of our medical device sales. Congress suspended the excise tax for 2016 and 2017. The suspension was once again upheld in January 2018 for two years. If the excise tax is not repealed or further suspended, the tax will adversely impact future results of operations after the current suspension expires in December 2019. We also face uncertainties that might result from modification or repeal of any of the provisions of the ACA, including as a result of current and future executive orders and legislative actions. We
Dollar amounts in millions except per share amounts or as otherwise specified. | 3 |
STRYKER CORPORATION 2017 FORM 10-K
cannot predict what other healthcare programs and regulations will ultimately be implemented at the federal or state level or the effect of any future legislation or regulation in the United States may have on our business.
We are subject to extensive governmental regulation relating to the manufacturing, labeling and marketing of our products: The manufacturing, labeling and marketing of our products are subject to extensive and evolving regulations and rigorous regulatory enforcement by the FDA, European Union and other governmental authorities in the United States and internationally. The process of obtaining regulatory approvals to market a medical device can be costly and time consuming and approvals might not be granted timely. We have ongoing responsibilities under the laws and regulations applicable to the manufacturing of products within our facilities and those contracted by third parties that are subject to periodic inspections by the FDA and other governmental authorities to determine compliance with the quality system, medical device reporting regulations and other requirements. Costs to comply with regulations, including the regulations set for medical devices regulation enacted by the European Union in May 2017 and effective in 2020, and costs associated with remediation can be significant. If we fail to fully comply with applicable regulatory requirements, we may be subject to a range of sanctions, including substantial fines, warning letters that require corrective action, product seizures, recalls, the suspension of product manufacturing, revocation of approvals, exclusion from future participation in government healthcare programs, substantial fines and criminal prosecution.
We are subject to federal, state and foreign healthcare regulations including anti-bribery and anti-corruption laws, and could face substantial penalties if we fail to fully comply with such regulations and laws: The relationships that we and our distributors and others that market our products have with healthcare professionals, such as physicians and hospitals, are subject to scrutiny under various state and federal laws often referred to collectively as healthcare fraud and abuse laws. In addition, the United States and foreign government regulators have increased the enforcement of the Foreign Corrupt Practices Act and other anti-bribery laws. We also must comply with a variety of other laws that protect the privacy of individually identifiable healthcare information and impose extensive tracking and reporting related to all transfers of value provided to certain healthcare professionals. These laws and regulations are broad in scope and are subject to evolving interpretation and we could be required to incur substantial costs to monitor compliance or to alter our practices if we are found not to be in compliance. Violations of these laws may be punishable by criminal or civil sanctions, including substantial fines, imprisonment of current or former employees and exclusion from participation in governmental healthcare programs.
We may be adversely affected by product liability claims, unfavorable court decisions or legal settlements: We are exposed to potential product liability risks inherent in the design, manufacture and marketing of medical devices, many of which are implanted in the human body for long periods of time or indefinitely. We are currently defendants in a number of product liability matters, including those relating to our Rejuvenate and ABGII Modular-Neck hip stems discussed in Note 6 to our Consolidated Financial Statements. These matters are subject to many uncertainties and outcomes are not predictable. In addition, we may incur significant legal expenses regardless of whether we are found to be liable. We are self-insured for product liability-related claims and expenses.
Intellectual property litigation and infringement claims could cause us to incur significant expenses or prevent us from selling certain of our products: The medical device industry is
characterized by extensive intellectual property litigation and, from time to time, we are the subject of claims of infringement or misappropriation. Regardless of outcome, such claims are expensive to defend and divert management and operating personnel from other business issues. A successful claim or claims of patent or other intellectual property infringement against us could result in payment of significant monetary damages and/or royalty payments or negatively impact our ability to sell current or future products in the affected category.
Dependence on patent and other proprietary rights and failing to protect such rights or to be successful in litigation related to such rights may impact offerings in our product portfolios: Our long-term success largely depends on our ability to market technologically competitive products. If we fail to obtain or maintain adequate intellectual property protection, it could allow others to sell products that directly compete with proprietary features in our product portfolio. Also, our issued patents may be subject to claims challenging their validity and scope and raising other issues. In addition, currently pending or future patent applications may not result in issued patents.
MARKET RISKS
We have exposure to exchange rate fluctuations on cross border transactions and translation of local currency results into United States Dollars: We report our financial results in United States Dollars and 27% of our net sales are denominated in foreign currencies, including the Euro, Japanese Yen, Australian Dollar, British Pound and Canadian Dollar. Cross border transactions with external parties and intercompany relationships result in increased exposure to foreign currency exchange effects. While we use derivative instruments to manage the impact of currency exchange; our hedging strategies may not be successful, and our unhedged exposures continue to be subject to currency fluctuations. In addition, the weakening or strengthening of the United States Dollar results in favorable or unfavorable translation effects when the results of our foreign locations are translated into United States Dollars.
Additional capital that we may require in the future may not be available to us or may only be available to us on unfavorable terms: Our future capital requirements will depend on many factors, including operating requirements, current and future acquisitions and the need to refinance existing debt. Our ability to issue additional debt or enter into other financing arrangements on acceptable terms could be adversely affected by our debt levels, unfavorable changes in economic conditions or uncertainties that affect the capital markets. Changes in credit ratings issued by nationally recognized credit rating agencies could also adversely affect our access to and cost of financing. Higher borrowing costs or the inability to access capital markets could adversely affect our ability to support future growth and operating requirements.
BUSINESS AND OPERATIONAL RISKS
We are subject to cost containment measures in the United States and other countries resulting in pricing pressures: Initiatives to limit the growth of general healthcare expenses and hospital costs are ongoing in the markets in which we do business. These initiatives are sponsored by government agencies, legislative bodies and the private sector and include price regulation and competitive pricing. Pricing pressure has also increased due to continued consolidation among healthcare providers, trends toward managed care, the shift toward governments becoming the primary payers of healthcare expenses, reduction in reimbursement levels and medical procedure volumes and government laws and regulations relating to sales and promotion, reimbursement and pricing generally.
Dollar amounts in millions except per share amounts or as otherwise specified. | 4 |
STRYKER CORPORATION 2017 FORM 10-K
We operate in a highly competitive industry in which competition in the development and improvement of new and existing products is significant: The markets in which we compete are highly competitive. New products and surgical procedures are introduced on an ongoing basis and our present or future products could be rendered obsolete or uneconomical by technological advances by our competitors, who may respond more quickly to new or emerging technologies, undertake more extensive marketing campaigns, have greater financial, marketing and other resources or be more successful in attracting potential customers, employees and strategic partners.
We may be unable to maintain adequate working relationships with healthcare professionals: We seek to maintain close working relationships with respected physicians and medical personnel in hospitals and universities who assist in product research and development. We rely on these professionals to assist us in the development and improvement of proprietary products. If we are unable to maintain these relationships, our ability to develop, market and sell new and improved products could be adversely affected.
We are subject to additional risks associated with our extensive international operations: We develop, manufacture and distribute our products globally. Our international operations are subject to additional risks and potential costs, including changes in reimbursement, changes in regulatory requirements, differing local product preferences and product requirements, diminished protection of intellectual property in some countries, trade protection measures and import or export licensing requirements, difficulty in staffing and managing foreign operations, and political and economic instability. Our business could be adversely impacted if we are unable to successfully manage these and other risks of international operations in an increasingly volatile environment.
We may be unable to capitalize on previous or future acquisitions: In addition to internally developed products, we invest in new products and technologies through acquisitions. Such investments are inherently risky, and we cannot guarantee that any acquisition will be successful or will not have a material unfavorable impact on us. The risks include the activities required and resources allocated to integrate new businesses, diversion of management time that could adversely affect management's ability to focus on other projects, the inability to realize the expected benefits, savings or synergies from the acquisition, the loss of key personnel and exposure to unexpected liabilities of acquired companies. In addition, we cannot be certain that the businesses we acquire will become or remain profitable.
We may incur goodwill impairment charges related to one or more of our business units: We perform our annual impairment test for goodwill in the fourth quarter of each year, or more frequently if indicators are present or changes in circumstances suggest that impairment may exist. In evaluating the potential for impairment we make assumptions regarding revenue projections, growth rates, cash flows, tax rates and discount rates. These assumptions are uncertain and by nature may vary from actual results. A significant reduction in the estimated fair values could result in impairment charges.
We could be negatively impacted by future changes in the allocation of income to each of the income tax jurisdictions in which we operate: We operate in multiple income tax jurisdictions both in the United States and internationally. Accordingly, our management must determine the appropriate allocation of income to each jurisdiction based on current interpretations of complex income tax regulations. Income tax authorities regularly perform audits of our income tax filings. Income tax audits associated with the allocation of income and other complex issues, including
inventory transfer pricing and cost sharing, product royalty and foreign branch arrangements, may require an extended period of time to resolve and may result in significant income tax adjustments.
We could experience a failure of a key information technology system, process or site or a breach of information security, including a cybersecurity breach or failure of one or more key information technology systems, networks, processes, associated sites or service providers: We rely extensively on information technology (IT) systems to conduct business. In addition, we rely on networks and services, including internet sites, data hosting and processing facilities and tools and other hardware, software and technical applications and platforms, some of which are managed, hosted, provided and/or used by third-parties or their vendors, to assist in conducting our business. Numerous and evolving cybersecurity threats pose potential risks to the security of our IT systems, networks and services, as well as the confidentiality, availability and integrity of our data. While we have made investments seeking to address these threats, including monitoring of networks and systems, hiring of experts, employee training and security policies for employees and third-party providers, the techniques used in these attacks change frequently and may be difficult to detect for periods of time and we may face difficulties in anticipating and implementing adequate preventative measures. If our IT systems are damaged or cease to function properly, the networks or service providers we rely upon fail to function properly, or we or one of our third-party providers suffer a loss or disclosure of our business or stakeholder information due to any number of causes ranging from catastrophic events or power outages to improper data handling or security breaches and our business continuity plans do not effectively address these failures on a timely basis, we may be exposed to reputational, competitive and business harm as well as litigation and regulatory action.
An inability to successfully manage the implementation of our new global enterprise resource planning (ERP) system could adversely affect our operations and operating results: We are in the process of implementing a new global ERP system. This system will replace many of our existing operating and financial systems. Such an implementation is a major undertaking, both financially and from a management and personnel perspective. Any disruptions, delays or deficiencies in the design and implementation of our new ERP system could adversely affect our ability to process orders, ship products, provide services and customer support, send invoices and track payments, fulfill contractual obligations or otherwise operate our business.
We may be unable to attract and retain key employees: Our sales, technical and other key personnel play an integral role in the development, marketing and selling of new and existing products. If we are unable to recruit, hire, develop and retain a talented, competitive work force, we may not be able to meet our strategic business objectives.
Interruption of manufacturing operations could adversely affect our business: We and our suppliers have manufacturing sites all over the world; however, the manufacturing of certain of our product lines is concentrated in one or more plants or geographic regions. Orthopaedics has principal manufacturing and distribution facilities in the United States in New Jersey, Indiana, Pennsylvania, Utah and Florida and outside the United States in China, Ireland, Netherlands, Switzerland and Germany. MedSurg has principal manufacturing and distribution facilities in the United States in Michigan, California, Illinois, Washington, Utah, Florida and Texas and outside the United States in Ireland, Germany, Mexico, Puerto Rico, Switzerland, Turkey and the United Kingdom. Neurotechnology and Spine has principal manufacturing and distribution facilities in Illinois, Indiana and California and outside
Dollar amounts in millions except per share amounts or as otherwise specified. | 5 |
STRYKER CORPORATION 2017 FORM 10-K
the United States in China and Netherlands. Damage to these facilities as a result of natural disasters or otherwise, as well as issues in our manufacturing arising from a failure to follow specific internal protocols and procedures, compliance concerns relating to the quality systems regulation, equipment breakdown or malfunction or other factors could adversely affect the availability of our products. In the event of an interruption in manufacturing, we may be unable to move quickly to alternate means of producing affected products to meet customer demand. In the event of a significant interruption, we may experience lengthy delays in resuming production of affected products due to the need for regulatory approvals. We may experience loss of market share, additional expense and harm to our reputation.
We use a variety of raw materials, components or devices in our global supply chains, production and distribution processes; significant shortages or price increases could increase our operating costs, require significant capital expenditures, or adversely impact the competitive position of our products: Our reliance on certain suppliers to secure raw materials, components and finished devices exposes us to product shortages and unanticipated increases in prices. In addition, several raw materials, components, and finished devices are procured from a sole-source due to the quality considerations, unique intellectual property considerations or constraints associated with regulatory requirements. If sole-source suppliers are acquired or were unable or unwilling to deliver these materials, we may not be able to manufacture or have available one or more products during such period of unavailability and our business could suffer. In certain cases we may not be able to establish additional or replacement suppliers for such materials in a timely or cost effective manner, largely as a result of FDA and other regulations that require, among other things, validation of materials and components prior to their use in our products.
ITEM 1B. | UNRESOLVED STAFF COMMENTS. |
None.
ITEM 2. | PROPERTIES. |
We have approximately 24 company-owned and 251 leased locations worldwide including 42 manufacturing locations. We believe that our properties are in good operating condition and adequate for the manufacture and distribution of our products. We do not anticipate difficulty in renewing existing leases as they expire or in finding alternative facilities.
ITEM 3. | LEGAL PROCEEDINGS. |
We are involved in various proceedings, legal actions and claims arising in the normal course of business, including proceedings related to product, labor and intellectual property, and the matters described in more detail in Note 6 to our Consolidated Financial Statements.
ITEM 4. | MINE SAFETY DISCLOSURES. |
Not applicable.
PART II |
ITEM 5. | MARKET FOR THE REGISTRANT'S COMMON EQUITY, RELATED STOCKHOLDER MATTERS AND ISSUER PURCHASES OF EQUITY SECURITIES. |
Our common stock is traded on the New York Stock Exchange under the symbol SYK.
Quarterly Stock Price and Dividend Information | ||||||||||||
2017 Quarter | Mar 31 | Jun 30 | Sep 30 | Dec 31 | ||||||||
Dividends declared per share of common stock | $ | 0.425 | | $ | 0.425 | | $ | 0.425 | | $ | 0.470 | |
Market price of common stock: |
|
|
|
| ||||||||
High | $ | 133.59 | | $ | 145.62 | | $ | 148.84 | | $ | 160.62 | |
Low | $ | 116.50 | | $ | 129.82 | | $ | 137.70 | | $ | 141.68 | |
2016 Quarter |
|
|
|
| ||||||||
Dividends declared per share of common stock | $ | 0.380 | | $ | 0.380 | | $ | 0.380 | | $ | 0.425 | |
Market price of common stock: |
|
|
|
| ||||||||
High | $ | 107.95 | | $ | 119.83 | | $ | 123.55 | | $ | 121.84 | |
Low | $ | 86.68 | | $ | 106.26 | | $ | 109.75 | | $ | 106.48 | |
Our Board of Directors considers payment of cash dividends at its quarterly meetings. On January 31, 2018 there were 2,833 shareholders of record of our common stock.
We did not repurchase any shares in the three months ended December 31, 2017 and the total dollar value of shares that could be acquired under our authorized repurchase program at December 31, 2017 was $1,640 .
We issued 100 shares of our common stock in the fourth quarter of 2017 as performance incentive awards. These shares were not registered under the Securities Act of 1933 based on the conclusion that the awards would not be events of sale within the meaning of Section 2(a)(3) of the Act.
The following graph compares our total returns (including reinvestments of dividends) against the Standard & Poor's (S&P) 500 Index and the S&P 500 Health Care Index. The graph assumes $100 (not in millions) invested on December 31, 2012 in our common stock and each of the indices.
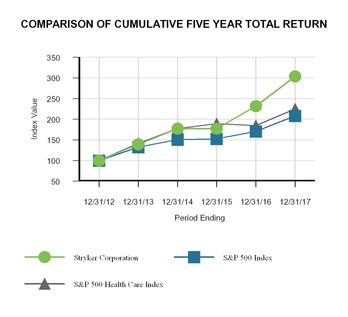
Company / Index | 2012 | 2013 | 2014 | 2015 | 2016 | 2017 | ||||||||||||
Stryker Corporation | $ | 100.00 | | $ | 139.29 | | $ | 177.47 | | $ | 177.51 | | $ | 231.94 | | $ | 303.46 | |
S&P 500 Index | $ | 100.00 | | $ | 132.39 | | $ | 150.51 | | $ | 152.59 | | $ | 170.84 | | $ | 208.14 | |
S&P 500 Health Care Index | $ | 100.00 | | $ | 141.46 | | $ | 177.30 | | $ | 189.52 | | $ | 184.42 | | $ | 225.13 | |
Dollar amounts in millions except per share amounts or as otherwise specified. | 6 |
STRYKER CORPORATION 2017 FORM 10-K
ITEM 6. | SELECTED FINANCIAL DATA. |
Statement of Earnings Data |
| 2017 |
| 2016 |
| 2015 |
| 2014 |
| 2013 | ||||||||||
Net sales |
| $ | 12,444 | |
| $ | 11,325 | |
| $ | 9,946 | |
| $ | 9,675 | |
| $ | 9,021 | |
Cost of sales |
| 4,271 | |
| 3,830 | |
| 3,344 | |
| 3,319 | |
| 3,002 | | |||||
Gross profit |
| $ | 8,173 | |
| $ | 7,495 | |
| $ | 6,602 | |
| $ | 6,356 | |
| $ | 6,019 | |
Research, development and engineering expenses |
| 787 | |
| 715 | |
| 625 | |
| 614 | |
| 536 | | |||||
Selling, general and administrative expenses |
| 4,552 | |
| 4,137 | |
| 3,610 | |
| 3,547 | |
| 3,467 | | |||||
Recall charges, net of insurance proceeds |
| 173 | |
| 158 | |
| 296 | |
| 761 | |
| 622 | | |||||
Amortization of intangible assets |
| 371 | |
| 319 | |
| 210 | |
| 188 | |
| 138 | | |||||
Total operating expenses |
| $ | 5,883 | |
| $ | 5,329 | |
| $ | 4,741 | |
| $ | 5,110 | |
| $ | 4,763 | |
Operating income |
| $ | 2,290 | |
| $ | 2,166 | |
| $ | 1,861 | |
| $ | 1,246 | |
| $ | 1,256 | |
Other income (expense), net |
| (227 | ) |
| (245 | ) |
| (126 | ) |
| (86 | ) |
| (44 | ) | |||||
Earnings before income taxes |
| $ | 2,063 | |
| $ | 1,921 | |
| $ | 1,735 | |
| $ | 1,160 | |
| $ | 1,212 | |
Income taxes |
| 1,043 | |
| 274 | |
| 296 | |
| 645 | |
| 206 | | |||||
Net earnings |
| $ | 1,020 | |
| $ | 1,647 | |
| $ | 1,439 | |
| $ | 515 | |
| $ | 1,006 | |
|
|
|
|
|
|
|
|
|
|
| ||||||||||
Net earnings per share of common stock: |
|
|
|
|
|
|
|
|
|
| ||||||||||
Basic net earnings per share of common stock |
| $ | 2.73 | |
| $ | 4.40 | |
| $ | 3.82 | |
| $ | 1.36 | |
| $ | 2.66 | |
Diluted net earnings per share of common stock |
| $ | 2.68 | |
| $ | 4.35 | |
| $ | 3.78 | |
| $ | 1.34 | |
| $ | 2.63 | |
|
|
|
|
|
|
|
|
|
|
| ||||||||||
Dividends declared per share of common stock |
| $ | 1.745 | |
| $ | 1.565 | |
| $ | 1.415 | |
| $ | 1.26 | |
| $ | 1.10 | |
|
|
|
|
|
|
|
|
|
|
| ||||||||||
Balance Sheet Data |
|
|
|
|
|
|
|
|
|
| ||||||||||
Cash, cash equivalents and current marketable securities |
| $ | 2,793 | |
| $ | 3,384 | |
| $ | 4,079 | |
| $ | 5,000 | |
| $ | 3,980 | |
Accounts receivable, less allowance |
| 2,198 | |
| 1,967 | |
| 1,662 | |
| 1,572 | |
| 1,518 | | |||||
Inventories |
| 2,465 | |
| 2,030 | |
| 1,639 | |
| 1,588 | |
| 1,422 | | |||||
Property, plant and equipment, net |
| 1,975 | |
| 1,569 | |
| 1,199 | |
| 1,098 | |
| 1,081 | | |||||
Total assets |
| 22,197 | |
| 20,435 | |
| 16,223 | |
| 17,258 | |
| 15,383 | | |||||
Accounts payable |
| 487 | |
| 437 | |
| 410 | |
| 329 | |
| 314 | | |||||
Total debt |
| 7,222 | |
| 6,914 | |
| 3,998 | |
| 3,952 | |
| 2,748 | | |||||
Shareholders' equity |
| $ | 9,980 | |
| $ | 9,550 | |
| $ | 8,511 | |
| $ | 8,595 | |
| $ | 9,047 | |
|
|
|
|
|
|
|
|
|
|
| ||||||||||
Cash Flow Data |
|
|
|
|
|
|
|
|
|
| ||||||||||
Net cash provided by operating activities |
| $ | 1,559 | |
| $ | 1,915 | |
| $ | 981 | |
| $ | 1,858 | |
| $ | 1,930 | |
Purchases of property, plant and equipment |
| 598 | |
| 490 | |
| 270 | |
| 233 | |
| 195 | | |||||
Depreciation |
| 271 | |
| 227 | |
| 187 | |
| 190 | |
| 169 | | |||||
Acquisitions, net of cash acquired |
| 831 | |
| 4,332 | |
| 153 | |
| 916 | |
| 2,320 | | |||||
Amortization of intangible assets |
| 371 | |
| 319 | |
| 210 | |
| 188 | |
| 138 | | |||||
Dividends paid |
| 636 | |
| 568 | |
| 521 | |
| 462 | |
| 401 | | |||||
Repurchase of common stock |
| $ | 230 | |
| $ | 13 | |
| $ | 700 | |
| $ | 100 | |
| $ | 317 | |
|
|
|
|
|
|
|
|
|
|
| ||||||||||
Other Data |
|
|
|
|
|
|
|
|
|
| ||||||||||
Number of shareholders of record |
| 2,850 | |
| 3,010 | |
| 3,118 | |
| 3,305 | |
| 3,612 | | |||||
Approximate number of employees |
| 33,000 | |
| 33,000 | |
| 27,000 | |
| 26,000 | |
| 25,000 | | |||||
Certain prior year amounts on the Consolidated Statements of Cash Flows have been reclassified as a result of the adoption of Accounting Standards Update (ASU) 2016-09, Compensation-Stock Compensation: Improvements to Employee Share-Based Payment Accounting, adopted January 1, 2017.
Dollar amounts in millions except per share amounts or as otherwise specified. | 7 |
STRYKER CORPORATION 2017 FORM 10-K
ITEM 7. | MANAGEMENT'S DISCUSSION AND ANALYSIS OF FINANCIAL CONDITION AND RESULTS OF OPERATIONS. |
Overview of 2017
Our goal is to achieve sales growth at the high-end of the medical technology (MedTech) industry and maintain our capital allocation strategy that prioritizes: (1) Acquisitions, (2) Dividends and (3) Share repurchases.
In 2017 we achieved reported net sales growth of 9.9% . Excluding the impact of acquisitions, net sales grew 7.1% in constant currency, in line with our ongoing goal to grow organic sales at the high-end of MedTech. We reported net earnings of $1,020 and net earnings per diluted share of $2.68 . Excluding the impact of certain items, we achieved adjusted net earnings of $2,465 and growth of 11.9% in adjusted net earnings per diluted share (1) .
We continued our capital allocation strategy by investing $831 in acquisitions, paying $636 in dividends to our shareholders and using $230 for share repurchases.
In December 2017 we announced a definitive merger agreement to acquire Entellus Medical, Inc. (Entellus), a high-growth global medical technology company focused on delivering superior patient and physician experiences through products designed for the minimally invasive treatment of various ear, nose and throat (ENT) disease states, for $24.00 per share, or total consideration of approximately $662 . We expect the acquisition to close in February 2018.
In September 2017 we acquired NOVADAQ Technologies Inc. (NOVADAQ) for total consideration of approximately $716 . NOVADAQ is a leading developer of fluorescence imaging
technology that provides surgeons with visualization of blood flow in vessels and related tissue perfusion in cardiac, cardiovascular, gastrointestinal, plastic, microsurgical and reconstructive procedures. Refer to Note 5 to our Consolidated Financial Statements for further information.
In August 2017 we initiated a voluntary product recall involving specific lots of our Sage Products (Sage) Oral Care products. We took this action in response to a Warning Letter received from the United States Food and Drug Administration (FDA) dated July 17, 2017, which set forth concerns regarding the potential for cross-contamination of Oral Care solutions manufactured by a third-party supplier on equipment also used to manufacture non-pharmaceutical products. We discontinued business with the third-party supplier and the Oral Care solutions are now being manufactured in-house. We resumed shipping Oral Care products in October and returned to full supply capacity by the end of 2017.
We also placed Sage cloth-based products on a temporary ship hold during the third quarter in response to concerns set forth in the FDA Warning Letter regarding testing methods used for all Sage products containing solutions. We resumed shipping products manufactured in-house and tested under the testing method required by FDA in September 2017 and returned to full supply capacity by the end of 2017.
In January 2017 we issued $500 of senior unsecured notes. Refer to Note 9 to our Consolidated Financial Statements for further information.
(1) Refer to "Non-GAAP Financial Measures" for a discussion of non-GAAP financial measures used in this report and a reconciliation to the most directly comparable GAAP financial measure.
|
CONSOLIDATED RESULTS OF OPERATIONS
|
|
|
|
| Percent Net Sales |
| Percentage Change | ||||||||||||||
2017 | 2016 | 2015 |
| 2017 | 2016 | 2015 |
| 2017/2016 | 2016/2015 | ||||||||||||
Net sales | $ | 12,444 | | $ | 11,325 | | $ | 9,946 | |
| 100.0 | % | 100.0 | % | 100.0 | % |
| 9.9 | % | 13.9 | % |
Gross profit | 8,173 | | 7,495 | | 6,602 | |
| 65.7 | | 66.2 | | 66.4 | |
| 9.0 | | 13.5 | | |||
Research, development and engineering expenses | 787 | | 715 | | 625 | |
| 6.3 | | 6.3 | | 6.3 | |
| 10.1 | | 14.4 | | |||
Selling, general and administrative expenses | 4,552 | | 4,137 | | 3,610 | |
| 36.6 | | 36.5 | | 36.3 | |
| 10.0 | | 14.6 | | |||
Recall charges, net of insurance proceeds | 173 | | 158 | | 296 | |
| 1.4 | | 1.4 | | 3.0 | |
| 9.5 | | (46.6 | ) | |||
Amortization of intangible assets | 371 | | 319 | | 210 | |
| 3.0 | | 2.8 | | 2.1 | |
| 16.3 | | 51.9 | | |||
Other income (expense), net | (227 | ) | (245 | ) | (126 | ) |
| (1.8 | ) | (2.2 | ) | (1.3 | ) |
| (7.3 | ) | 94.4 | | |||
Income taxes | 1,043 | | 274 | | 296 | |
|
|
|
|
| 280.7 | | (7.4 | ) | ||||||
Net earnings | $ | 1,020 | | $ | 1,647 | | $ | 1,439 | |
| 8.2 | % | 14.5 | % | 14.5 | % |
| (38.1 | )% | 14.5 | % |
|
|
|
|
|
|
|
|
|
|
| |||||||||||
Net earnings per diluted share | $ | 2.68 | | $ | 4.35 | | $ | 3.78 | |
|
|
|
|
| (38.4 | )% | 15.1 | % | |||
Adjusted net earnings per diluted share (1) | $ | 6.49 | | $ | 5.80 | | $ | 5.12 | |
|
|
|
|
| 11.9 | % | 13.3 | % | |||
Geographic and Segment Net Sales |
|
| Percentage Change | ||||||||||||||||
|
| 2017/2016 |
| 2016/2015 | |||||||||||||||
| 2017 | 2016 | 2015 |
| As Reported | Constant |
| As Reported | Constant | ||||||||||
Geographic: |
|
|
|
|
|
|
|
|
| ||||||||||
United States | $ | 9,059 | | $ | 8,230 | | $ | 7,116 | |
| 10.1 | % | 10.1 | % |
| 15.7 | % | 15.6 | % |
International | 3,385 | | 3,095 | | 2,830 | |
| 9.4 | | 9.0 | |
| 9.4 | | 10.8 | | |||
Total | $ | 12,444 | | $ | 11,325 | | $ | 9,946 | |
| 9.9 | % | 9.8 | % |
| 13.9 | % | 14.3 | % |
Segment: |
|
|
|
|
|
|
|
|
| ||||||||||
Orthopaedics | $ | 4,713 | | $ | 4,422 | | $ | 4,223 | |
| 6.6 | % | 6.5 | % |
| 4.7 | % | 5.1 | % |
MedSurg | 5,557 | | 4,894 | | 3,895 | |
| 13.6 | | 13.4 | |
| 25.6 | | 26.3 | | |||
Neurotechnology and Spine | 2,174 | | 2,009 | | 1,828 | |
| 8.2 | | 8.3 | |
| 9.9 | | 9.8 | | |||
Total | $ | 12,444 | | $ | 11,325 | | $ | 9,946 | |
| 9.9 | % | 9.8 | % |
| 13.9 | % | 14.3 | % |
Dollar amounts in millions except per share amounts or as otherwise specified. | 8 |
STRYKER CORPORATION 2017 FORM 10-K
Supplemental Net Sales Growth Information | |||||||||||||||||||||||||||||||||
|
|
| Percentage Change |
|
|
| Percentage Change | ||||||||||||||||||||||||||
|
|
|
|
| United States | International |
|
|
|
|
| United States | International | ||||||||||||||||||||
| 2017 | 2016 | As Reported | Constant Currency | As Reported | As Reported | Constant Currency |
| 2016 | 2015 | As Reported | Constant Currency | As Reported | As Reported | Constant Currency | ||||||||||||||||||
Orthopaedics: |
|
|
|
|
|
|
|
|
|
|
|
|
|
|
| ||||||||||||||||||
Knees | $ | 1,595 | | $ | 1,490 | | 7.0 | % | 6.9 | % | 7.4 | % | 5.9 | % | 5.5 | % |
| $ | 1,490 | | $ | 1,403 | | 6.2 | % | 6.7 | % | 6.8 | % | 4.6 | % | 6.5 | % |
Hips | 1,303 | | 1,283 | | 1.6 | | 1.8 | | 2.0 | | 0.9 | | 1.4 | |
| 1,283 | | 1,263 | | 1.5 | | 2.3 | | 2.0 | | 0.8 | | 2.9 | | ||||
Trauma and Extremities | 1,478 | | 1,364 | | 8.3 | | 8.2 | | 11.0 | | 3.8 | | 3.5 | |
| 1,364 | | 1,291 | | 5.7 | | 5.7 | | 9.1 | | 0.4 | | 0.4 | | ||||
Other | 337 | | 285 | | 18.0 | | 17.6 | | 17.9 | | 18.6 | | 16.4 | |
| 285 | | 266 | | 7.3 | | 7.6 | | 8.1 | | 4.1 | | 5.6 | | ||||
| $ | 4,713 | | $ | 4,422 | | 6.6 | % | 6.5 | % | 7.8 | % | 4.0 | % | 3.8 | % |
| $ | 4,422 | | $ | 4,223 | | 4.7 | % | 5.1 | % | 6.2 | % | 1.8 | % | 3.1 | % |
MedSurg: |
|
|
|
|
|
|
|
|
|
|
|
|
|
|
| ||||||||||||||||||
Instruments | $ | 1,678 | | $ | 1,553 | | 8.1 | % | 8.0 | % | 8.1 | % | 7.9 | % | 7.5 | % |
| $ | 1,553 | | $ | 1,466 | | 5.9 | % | 6.3 | % | 7.2 | % | 1.5 | % | 3.1 | % |
Endoscopy | 1,652 | | 1,470 | | 12.4 | | 12.0 | | 14.2 | | 6.3 | | 5.0 | |
| 1,470 | | 1,390 | | 5.8 | | 6.3 | | 8.8 | | (3.1 | ) | (1.0 | ) | ||||
Medical | 1,969 | | 1,633 | | 20.5 | | 20.4 | | 17.7 | | 31.4 | | 30.4 | |
| 1,633 | | 823 | | 98.4 | | 99.9 | | 92.4 | | 125.3 | | 133.4 | | ||||
Sustainability | 258 | | 238 | | 8.9 | | 8.9 | | 8.9 | | 26.2 | | 24.4 | |
| 238 | | 216 | | 9.9 | | 9.9 | | 9.8 | | 33.3 | | 37.6 | | ||||
| $ | 5,557 | | $ | 4,894 | | 13.6 | % | 13.4 | % | 13.2 | % | 15.1 | % | 14.1 | % |
| $ | 4,894 | | $ | 3,895 | | 25.6 | % | 26.3 | % | 26.8 | % | 21.6 | % | 24.6 | % |
Neurotechnology and Spine: |
|
|
|
|
|
|
|
|
|
|
|
|
|
| |||||||||||||||||||
Neurotechnology | $ | 1,423 | | $ | 1,255 | | 13.4 | % | 13.4 | % | 11.2 | % | 17.4 | % | 17.3 | % |
| $ | 1,255 | | $ | 1,088 | | 15.4 | % | 15.1 | % | 14.5 | % | 17.0 | % | 16.2 | % |
Spine | 751 | | 754 | | (0.4 | ) | (0.4 | ) | (0.6 | ) | 0.1 | | 0.2 | |
| 754 | | 740 | | 1.8 | | 2.0 | | 3.9 | | (4.1 | ) | (3.5 | ) | ||||
| $ | 2,174 | | $ | 2,009 | | 8.2 | % | 8.3 | % | 6.3 | % | 12.4 | % | 12.4 | % |
| $ | 2,009 | | $ | 1,828 | | 9.9 | % | 9.8 | % | 9.8 | % | 9.9 | % | 9.6 | % |
Total | $ | 12,444 | | $ | 11,325 | | 9.9 | % | 9.8 | % | 10.1 | % | 9.4 | % | 9.0 | % |
| $ | 11,325 | | $ | 9,946 | | 13.9 | % | 14.3 | % | 15.6 | % | 9.4 | % | 10.8 | % |
|
Consolidated Net Sales
Consolidated net sales in 2017 increased 9.9% as reported and 9.8% in constant currency, as foreign currency exchange rates positively impacted net sales by 0.1% . Excluding the 2.7% impact of acquisitions, net sales increased in constant currency by 8.2% from increased unit volume partially offset by 1.1% lower prices. The unit volume increase was primarily due to higher shipments of neurotechnology, endoscopy, knees, trauma and extremities and instruments products.
Consolidated net sales in 2016 increased 13.9% as reported and 14.3% in constant currency, as foreign currency exchange rates negatively impacted net sales by 0.4% . Excluding the 7.9% impact of acquisitions, net sales increased in constant currency by 7.8% from increased unit volume partially offset by 1.4% lower prices. The unit volume increase was primarily due to higher shipments of knees, instruments, endoscopy, neurotechnology, trauma and extremities and medical products.
Orthopaedics Net Sales
Orthopaedics net sales in 2017 increased 6.6% as reported and 6.5% in constant currency, as foreign currency exchange rates positively impacted net sales by 0.1% . Excluding the 0.3% impact of acquisitions, net sales increased in constant currency by 8.6% from increased unit volume partially offset by 2.4% lower prices. The unit volume increase was led primarily by higher shipments of knees and trauma and extremities products.
Orthopaedics net sales in 2016 increased 4.7% as reported and 5.1% in constant currency, as foreign currency exchange rates negatively impacted net sales by 0.4% . Excluding the 0.3% impact of acquisitions, net sales increased in constant currency by 6.9% from increased unit volume partially offset by 2.1% lower prices. The unit volume increase was led primarily by higher shipments of knees and trauma and extremities products.
MedSurg Net Sales
MedSurg net sales in 2017 increased 13.6% as reported and 13.4% in constant currency, as foreign currency exchange rates positively impacted net sales by 0.2% . Excluding the 5.6% impact of acquisitions, net sales increased in constant currency by 7.5% from increased unit volume and 0.2% higher prices. The unit volume increase was led primarily by higher shipments of endoscopy, instruments and medical products.
MedSurg net sales in 2016 increased 25.6% as reported and 26.3% in constant currency, as foreign currency exchange rates negatively impacted net sales by 0.7% . Excluding the 19.1% impact of acquisitions, net sales increased in constant currency by 7.8% from increased unit volume partially offset by 0.6% lower prices. The unit volume increase was led primarily by higher shipments of instruments, endoscopy and medical products.
Neurotechnology and Spine Net Sales
Neurotechnology and Spine net sales in 2017 increased 8.2% as reported and 8.3% in constant currency, as foreign currency exchange rates impacted net sales nominally. Excluding the 0.7% impact of acquisitions, net sales in constant currency increased by 9.1% from increased unit volume partially offset by 1.5% lower prices. The unit volume increase was led primarily by higher shipments of neurotechnology products.
Neurotechnology and Spine net sales in 2016 increased 9.9% as reported and 9.8% in constant currency, as foreign currency exchange rates positively impacted net sales by 0.1% . Excluding the 1.4% impact of acquisitions, net sales in constant currency increased by 9.8% from increased unit volume partially offset by 1.4% lower prices. The unit volume increase was led primarily by higher shipments of neurotechnology products.
Gross Profit
Gross profit in 2017 as a percentage of net sales decreased to 65.7% from 66.2% in 2016 primarily due to the impact from restructuring-related charges, the impact of hurricanes, unfavorable mix and inflation, partially offset by higher sales volumes, increased productivity and favorable impact of foreign currency exchange.
Gross profit as a percentage of net sales decreased to 66.2% in 2016 from 66.4% in 2015 as the benefit from the suspension of the medical device excise tax and favorable productivity was more than offset by unfavorable mix, including the impact of acquisitions and the unfavorable impact of foreign currency exchange.
Dollar amounts in millions except per share amounts or as otherwise specified. | 9 |
STRYKER CORPORATION 2017 FORM 10-K
|
|
|
|
| Percent Net Sales | |||||||||||
| 2017 | 2016 | 2015 |
| 2017 | 2016 | 2015 | |||||||||
Reported | $ | 8,173 | | $ | 7,495 | | $ | 6,602 | |
| 65.7 | % | 66.2 | % | 66.4 | % |
Inventory stepped up to fair value | 22 | | 36 | | 7 | |
| 0.2 | | 0.3 | | 0.1 | | |||
Restructuring-related and other charges | 57 | | 15 | | 7 | |
| 0.4 | | 0.1 | | - | | |||
Adjusted | $ | 8,252 | | $ | 7,546 | | $ | 6,616 | |
| 66.3 | % | 66.6 | % | 66.5 | % |
Research, Development and Engineering Expenses
Research, development and engineering expenses represented 6.3% of net sales in 2017 , 2016 and 2015 . Projects to develop new products, investments in new technologies and recent acquisitions contributed to the spending levels, reflecting our continued commitment to innovation.
Selling, General and Administrative Expenses
Selling, general and administrative expenses as a percentage of net sales in 2017 increased to 36.6% from 36.5% in 2016 . Excluding the impact of certain items in the table below, expenses as a percentage of net sales were 34.8% in 2017 and 2016 . This reflects favorable leverage from higher sales volumes and continued focus on operating expense improvement initiatives, including leverage from our recent acquisitions, partially offset by the unfavorable impact of foreign currency exchange.
Selling, general and administrative expenses as a percentage of net sales in 2016 increased to 36.5% from 36.3% in 2015 . Excluding the impact of certain items noted below, selling, general and administrative expenses as a percentage of sales decreased in 2016 due to favorable leverage from the continued focus on operating expense improvement initiatives, cost containment efforts and business mix, including leverage from our recent acquisitions.
|
|
|
|
| Percent Net Sales | |||||||||||
| 2017 | 2016 | 2015 |
| 2017 | 2016 | 2015 | |||||||||
Reported | $ | 4,552 | | $ | 4,137 | | $ | 3,610 | |
| 36.6 | % | 36.5 | % | 36.3 | % |
Other acquisition and integration-related | (42 | ) | (95 | ) | (28 | ) |
| (0.4 | ) | (0.8 | ) | (0.3 | ) | |||
Restructuring-related and other charges | (137 | ) | (110 | ) | (125 | ) |
| (1.1 | ) | (1.0 | ) | (1.2 | ) | |||
Regulatory and legal matters | (39 | ) | 12 | | 53 | |
| (0.3 | ) | 0.1 | | 0.5 | | |||
Adjusted | $ | 4,334 | | $ | 3,944 | | $ | 3,510 | |
| 34.8 | % | 34.8 | % | 35.3 | % |
Recall Charges, Net of Insurance Proceeds
Recall charges, net of insurance proceeds, were $173 , $158 and $296 in 2017 , 2016 and 2015 . Charges were primarily due to the previously disclosed Rejuvenate and ABGII Modular-Neck hip stems voluntary recalls. Refer to Note 6 to our Consolidated Financial Statements for further information.
Amortization of Intangible Assets
Amortization of intangible assets was $371 , $319 and $210 in 2017 , 2016 and 2015 . The increase in 2017 and 2016 was due to acquisitions. Refer to Note 7 to our Consolidated Financial Statements for further information.
Other Income (Expense), Net
Other income (expense), net was ($227) , ($245) and ($126) in 2017 , 2016 and 2015 . The decrease in 2017 was primarily driven by higher interest income and decreased foreign currency transaction losses, partially offset by higher interest expense due to higher debt levels as a result of our January 2017 debt offering. Refer to Note 9 to our Consolidated Financial Statements for further information.
Income Taxes
The effective income tax rate on earnings was 50.6% , 14.3% and
17.1% for 2017 , 2016 and 2015 . The effective income tax rate for 2017 includes the impact of complying with the Tax Cuts and Jobs Act of 2017 signed into law in December 2017, partially offset by the benefits from the adoption of ASU 2016-09 Compensation-Stock Compensation: Improvements to Employee Share-Based Payment Accounting on January 1, 2017 and continued lower effective income tax rates as a result of the European regional headquarters. The establishment of the European regional headquarters contributed to the lower effective income tax rates in 2016 and 2015 .
Net Earnings
Net earnings in 2017 decreased to $1,020 or $2.68 per diluted share from $1,647 or $4.35 per diluted share in 2016 and $1,439 or $3.78 per diluted share in 2015 . The impact of foreign currency exchange rates reduced net earnings per diluted share by approximately $0.07 , $0.11 and $0.26 in 2017 , 2016 and 2015 .
|
|
|
|
| Percent Net Sales | |||||||||||
| 2017 | 2016 | 2015 |
| 2017 | 2016 | 2015 | |||||||||
Reported | $ | 1,020 | | $ | 1,647 | | $ | 1,439 | |
| 8.2 | % | 14.5 | % | 14.5 | % |
Inventory stepped up to fair value | 20 | | 23 | | 4 | |
| 0.2 | | 0.2 | | - | | |||
Other acquisition and integration-related | 31 | | 77 | | 20 | |
| 0.2 | | 0.7 | | 0.2 | | |||
Amortization of intangible assets | 250 | | 221 | | 147 | |
| 2.0 | | 2.0 | | 1.5 | | |||
Restructuring-related and other charges | 155 | | 98 | | 97 | |
| 1.2 | | 0.9 | | 1.0 | | |||
Rejuvenate and other recall matters | 131 | | 127 | | 210 | |
| 1.1 | | 1.1 | | 2.1 | | |||
Regulatory and legal matters | 25 | | (7 | ) | (46 | ) |
| 0.2 | | (0.1 | ) | (0.5 | ) | |||
Tax matters | 833 | | 8 | | 78 | |
| 6.7 | | 0.1 | | 0.8 | | |||
Adjusted | $ | 2,465 | | $ | 2,194 | | $ | 1,949 | |
| 19.8 | % | 19.4 | % | 19.6 | % |
Non-GAAP Financial Measures
We supplement the reporting of our financial information determined under accounting principles generally accepted in the United States (GAAP) with certain non-GAAP financial measures, including percentage sales growth in constant currency; percentage organic sales growth; adjusted gross profit; adjusted selling, general and administrative expenses; adjusted amortization of intangible assets; adjusted operating income; adjusted effective income tax rate; adjusted net earnings; and adjusted net earnings per diluted share (Diluted EPS). We believe that these non-GAAP measures provide meaningful information to assist investors and shareholders in understanding our financial results and assessing our prospects for future performance. Management believes percentage sales growth in constant currency and the other adjusted measures described above are important indicators of our operations because they exclude items that may not be indicative of or are unrelated to our core operating results and provide a baseline for analyzing trends in our underlying businesses. Management uses these non-GAAP financial measures for reviewing the operating results of reportable business segments and analyzing potential future business trends in connection with our budget process and bases certain management incentive compensation on these non-GAAP financial measures.
To measure percentage sales growth in constant currency, we remove the impact of changes in foreign currency exchange rates that affect the comparability and trend of sales. Percentage sales growth in constant currency is calculated by translating current and prior year results at the same foreign currency exchange rate. To measure percentage organic sales growth, we remove the impact of changes in foreign currency exchange rates and acquisitions that
Dollar amounts in millions except per share amounts or as otherwise specified. | 10 |
STRYKER CORPORATION 2017 FORM 10-K
affect the comparability and trend of sales. Percentage organic sales growth is calculated by translating current year results at prior year average foreign currency exchange rates excluding the impact of acquisitions.
To measure earnings performance on a consistent and comparable basis, we exclude certain items that affect the comparability of operating results and the trend of earnings. These adjustments are irregular in timing and may not be indicative of our past and future performance. The following are examples of the types of adjustments that may be included in a period:
1. | Acquisition and integration-related costs . Costs related to integrating recently acquired businesses and specific costs (e.g., inventory step-up and deal costs) related to the consummation of the acquisition process. |
2. | Amortization of purchased intangible assets . Periodic amortization expense related to purchased intangible assets. |
3. | Restructuring-related and other charges . Costs associated with the termination of sales relationships in certain countries, workforce reductions, elimination of product lines, weather-related asset impairments and associated costs and other restructuring-related activities. |
4. | Rejuvenate and other recall matters . Our best estimate of the minimum of the range of probable loss to resolve certain product recalls. |
5. | Regulatory and legal matters . Our best estimate of the |
minimum of the range of probable loss to resolve certain regulatory matters and other legal settlements.
6. | Tax matters . Charges represent the impact of accounting for the compliance with the Tax Cuts and Jobs Act of 2017, certain significant and discrete tax items and adjustments to interest expense related to the settlement of certain tax matters. |
Because non-GAAP financial measures are not standardized, it may not be possible to compare these financial measures with other companies' non-GAAP financial measures having the same or similar names. These adjusted financial measures should not be considered in isolation or as a substitute for reported sales growth, gross profit, cost of sales, selling, general and administrative expenses, amortization of intangible assets, operating income, effective income tax rate, net earnings and net earnings per diluted share, the most directly comparable GAAP financial measures. These non-GAAP financial measures are an additional way of viewing aspects of our operations when viewed with our GAAP results and the reconciliations to corresponding GAAP financial measures at the end of the discussion of Results of Operations below. We strongly encourage investors and shareholders to review our financial statements and publicly-filed reports in their entirety and not to rely on any single financial measure.
The weighted-average basic and diluted shares outstanding used in the calculation of non-GAAP earnings per share are the same as those used in the calculation of the reported per share amounts.
|
Reconciliation of the Most Directly Comparable GAAP Financial Measure to Non-GAAP Financial Measure
2017 | Gross Profit | Selling, General & Administrative Expenses | Amortization of Intangible Assets | Operating Income | Net Earnings | Effective | Diluted EPS | |||||||||||||
Reported | $ | 8,173 | | $ | 4,552 | | $ | 371 | | $ | 2,290 | | $ | 1,020 | | 50.6 | % | $ | 2.68 | |
Acquisition and integration-related charges: |
|
|
|
|
|
|
| |||||||||||||
Inventory stepped up to fair value | 22 | | - | | - | | 22 | | 20 | | (0.1 | ) | 0.05 | | ||||||
Other acquisition and integration-related | - | | (42 | ) | - | | 42 | | 31 | | 0.2 | | 0.09 | | ||||||
Amortization of purchased intangible assets | - | | - | | (371 | ) | 371 | | 250 | | 3.0 | | 0.67 | | ||||||
Restructuring-related and other charges | 57 | | (137 | ) | - | | 194 | | 155 | | 0.4 | | 0.41 | | ||||||
Rejuvenate and other recall matters | - | | - | | - | | 173 | | 131 | | 0.7 | | 0.34 | | ||||||
Regulatory and legal matters | - | | (39 | ) | - | | 39 | | 25 | | 0.4 | | 0.06 | | ||||||
Tax Matters | - | | - | | - | | - | | 833 | | (39.6 | ) | 2.19 | | ||||||
Adjusted | $ | 8,252 | | $ | 4,334 | | $ | - | | $ | 3,131 | | $ | 2,465 | | 15.6 | % | $ | 6.49 | |
2016 | Gross Profit | Selling, General & Administrative Expenses | Amortization of Intangible Assets | Operating Income | Net Earnings | Effective | Diluted EPS | |||||||||||||
Reported | $ | 7,495 | | $ | 4,137 | | $ | 319 | | $ | 2,166 | | $ | 1,647 | | 14.3 | % | $ | 4.35 | |
Acquisition and integration-related charges: |
|
|
|
|
|
|
| |||||||||||||
Inventory stepped up to fair value | 36 | | - | | - | | 36 | | 23 | | 0.4 | | 0.06 | | ||||||
Other acquisition and integration-related | - | | (95 | ) | - | | 95 | | 77 | | 0.1 | | 0.20 | | ||||||
Amortization of purchased intangible assets | - | | - | | (319 | ) | 319 | | 221 | | 2.2 | | 0.59 | | ||||||
Restructuring-related and other charges | 15 | | (110 | ) | - | | 125 | | 98 | | 0.3 | | 0.26 | | ||||||
Rejuvenate and other recall matters | - | | - | | - | | 158 | | 127 | | 0.1 | | 0.34 | | ||||||
Regulatory and legal matters | - | | 12 | | - | | (12 | ) | (7 | ) | (0.2 | ) | (0.02 | ) | ||||||
Tax Matters | - | | - | | - | | - | | 8 | | 0.1 | | 0.02 | | ||||||
Adjusted | $ | 7,546 | | $ | 3,944 | | $ | - | | $ | 2,887 | | $ | 2,194 | | 17.3 | % | $ | 5.80 | |
Dollar amounts in millions except per share amounts or as otherwise specified. | 11 |
STRYKER CORPORATION 2017 FORM 10-K
2015 | Gross Profit | Selling, General & Administrative Expenses | Amortization of Intangible Assets | Operating Income | Net Earnings | Effective | Diluted EPS | |||||||||||||
Reported | $ | 6,602 | | $ | 3,610 | | $ | 210 | | $ | 1,861 | | $ | 1,439 | | 17.1 | % | $ | 3.78 | |
Acquisition and integration-related charges: |
|
|
|
|
|
|
| |||||||||||||
Inventory stepped up to fair value | 7 | | - | | - | | 7 | | 4 | | 0.1 | | 0.01 | | ||||||
Other acquisition and integration-related | - | | (28 | ) | - | | 28 | | 20 | | 0.2 | | 0.05 | | ||||||
Amortization of purchased intangible assets | - | | - | | (210 | ) | 210 | | 147 | | 1.5 | | 0.39 | | ||||||
Restructuring-related and other charges | 7 | | (125 | ) | - | | 132 | | 97 | | 0.7 | | 0.26 | | ||||||
Rejuvenate and other recall matters | - | | - | | - | | 296 | | 210 | | 2.0 | | 0.55 | | ||||||
Regulatory and legal matters | - | | 53 | | - | | (53 | ) | (46 | ) | 0.1 | | (0.12 | ) | ||||||
Tax Matters | - | | - | | - | | - | | 78 | | (4.4 | ) | 0.20 | | ||||||
Adjusted | $ | 6,616 | | $ | 3,510 | | $ | - | | $ | 2,481 | | $ | 1,949 | | 17.3 | % | $ | 5.12 | |
|
FINANCIAL CONDITION AND LIQUIDITY
| 2017 | 2016 | 2015 | ||||||
Net cash provided by operations activities | $ | 1,559 | | $ | 1,915 | | $ | 981 | |
Net cash (used in) provided by investing activities | (1,613 | ) | (4,191 | ) | 1,956 | | |||
Net cash (used in) provided by financing activities | (794 | ) | 2,258 | | (1,223 | ) | |||
Effect of exchange rate changes | 74 | | (45 | ) | (130 | ) | |||
Change in cash and cash equivalents | $ | (774 | ) | $ | (63 | ) | $ | 1,584 | |
We believe our financial condition continues to be of high quality, as evidenced by our ability to generate substantial cash from operations and to readily access capital markets at competitive rates. Operating cash flow provides the primary source of cash to fund operating needs and capital expenditures. Excess operating cash is used first to fund acquisitions to complement our portfolio of businesses. Other discretionary uses include dividends and share repurchases. We supplement operating cash flow with debt to fund our activities as necessary. Our overall cash position reflects our strong business results and a global cash management strategy that takes into account liquidity management, economic factors and tax considerations.
Operating Activities
Cash provided by operations was $1,559 , $1,915 , and $981 in 2017 , 2016 and 2015 . The decrease in cash from operations in 2017 was primarily due to higher Rejuvenate and ABG II recall-related payments compared to 2016 and the unfavorable impact of foreign currency remeasurement. The net of accounts receivable, inventory and accounts payable resulted in the consumption of $461 , $507 , and $231 of cash in 2017 , 2016 and 2015 .
Investing Activities
Cash (used in) provided by investing activities was ($1,613) , ($4,191) and $1,956 in 2017 , 2016 and in 2015 .
Acquisitions, Net of Cash Acquired: Acquisitions resulted in cash consumption of $831 , $4,332 and $153 in 2017 , 2016 and 2015 . In 2017 we acquired NOVADAQ and certain other businesses and related assets. In 2016 the primary acquisitions were Sage and Physio. In 2015 the primary acquisition was CHG Hospital Beds, Inc.
Purchases of Property, Plant and Equipment: Purchases of property, plant and equipment were $598 , $490 and $270 in 2017 , 2016 and 2015 . Capital expenditures in 2017 were primarily due to capital expenditures associated with the development of our global ERP system and investments in new and existing plants and equipment to support sales growth.
Marketable Securities, Net: Net cash (used in) provided by the (purchase) sale of marketable securities was ($183) , $634 , and $2,379 in 2017 , 2016 and 2015 . Cash provided by the sale of marketable securities in 2016 was used to repay all of our senior unsecured notes that were due in September 2016 . Cash provided by sales of marketable securities in 2015 was primarily used to make recall-related payments.
Financing Activities
Dividends and Share Repurchases: Dividends paid per common share increased 11.8% to $1.70 per share in 2017 compared to $1.52 per share in 2016 , an increase of 10.1% from $1.38 in 2015 .
| 2017 | 2016 | 2015 | ||||||
Dividends paid per common share | $ | 1.70 | | $ | 1.52 | | $ | 1.38 | |
Total dividends paid to common shareholders | $ | 636 | | $ | 568 | | $ | 521 | |
Total amount paid to repurchase common stock | $ | 230 | | $ | 13 | | $ | 700 | |
Shares of repurchased common stock (in millions) | 1.9 | | 0.1 | | 7.4 | | |||
Borrowings and Repayments of Debt: We maintain debt levels that we consider appropriate after evaluating a number of factors including cash requirements for ongoing operations, investment and financing plans (including acquisitions and share repurchase activities) and overall cost of capital.
Net proceeds from borrowings were $299 , $2,912 and $48 in 2017 , 2016 and 2015 . In 2017 the proceeds were primarily from the issuance of $500 of senior unsecured notes in January 2017 partially offset by payment of $200 of commercial paper. In 2016 the proceeds were primarily from the issuance of $3,500 of senior unsecured notes in March 2016 partially offset by repayment of $750 of our senior unsecured notes due in September 2016. Refer to Note 9 to our Consolidated Financial Statements for further information.
Liquidity
Cash, cash equivalents and marketable securities were $2,793 and $3,384 , and our current assets exceeded current liabilities by $4,508 and $4,713 on December 31, 2017 and 2016 . We anticipate being able to support our short-term liquidity and operating needs, including acquisitions and recall-related payments, from a variety of sources, including cash from operations, commercial paper and existing credit lines. We have raised funds in the capital markets and may continue to do so from time to time. As a result of the issuance of senior unsecured notes in March 2016, Moody's downgraded our unsecured note ratings to Baa1 from A3, and Standard & Poor's downgraded our corporate credit and long-term issue-level rating to A from A+ and our short-term rating to A-1 from A-1+. Nevertheless, we continue to have strong investment-grade short-term and long-term debt ratings that we believe should enable us to refinance our debt as needed.
We have existing credit facilities should additional funds be required. We have a borrowing capacity available under our main credit facility of $1,500 . The amount of commercial paper we have issuable under the commercial paper program is $1,500 .
Our cash, cash equivalents and marketable securities held in locations outside the United States was approximately 62% and 84% on December 31, 2017 and 2016 . The majority of our cash held in locations outside the United States is considered to be indefinitely reinvested. We intend to use this cash to expand operations organically and through acquisitions.
Dollar amounts in millions except per share amounts or as otherwise specified. | 12 |
STRYKER CORPORATION 2017 FORM 10-K
Guarantees and Other Off-Balance Sheet Arrangements
We do not have guarantees or other off-balance sheet financing arrangements, including variable interest entities, of a magnitude that we believe could have a material impact on our financial condition or liquidity.
CONTRACTUAL OBLIGATIONS AND FORWARD-LOOKING CASH REQUIREMENTS
As further described in Note 6 to our Consolidated Financial Statements, in 2017 we recorded additional charges to earnings totaling $104 related to the Rejuvenate and ABG II recalls. Based on the information received, the actuarially determined range of probable loss to resolve this matter was estimated to be approximately $2,072 to $2,307 ( $2,304 to $2,539 before $232 of third-party insurance recoveries). The final outcome of this matter is dependent on many variables that are difficult to predict. The ultimate cost to entirely resolve this matter may be materially different than the amount of the current estimate and could have a material adverse effect on our financial position, results of operations and cash flows. We are not able to reasonably estimate the future periods in which payments will be made.
As further described in Note 10 to our Consolidated Financial Statements, on December 31, 2017 we had a reserve for uncertain income tax positions of $540 . Due to uncertainties regarding the ultimate resolution of income tax audits, we are not able to reasonably estimate the future periods in which any income tax payments to settle these uncertain income tax positions will be made.
As further described in Note 11 to our Consolidated Financial Statements, on December 31, 2017 our defined benefit pension plans were underfunded by $338 , of which approximately $331 related to plans outside the United States. Due to the rules affecting tax-deductible contributions in the jurisdictions in which the plans are offered and the impact of future plan asset performance, changes in interest rates and potential changes in legislation in the United States and other foreign jurisdictions, we are not able to reasonably estimate the amounts that may be required to fund defined benefit pension plans.
Contractual Obligations | |||||||||||||||
| Total | 2018 | 2019 - 2020 | 2021 - 2022 | After 2022 | ||||||||||
Total debt | $ | 7,250 | | $ | 600 | | $ | 1,750 | | $ | 750 | | $ | 4,150 | |
Interest payments | 2,995 | | 230 | | 406 | | 331 | | 2,028 | | |||||
Unconditional purchase obligations | 1,144 | | 1,046 | | 97 | | 1 | | - | | |||||
Operating leases | 326 | | 106 | | 108 | | 52 | | 60 | | |||||
Other | 133 | | 13 | | 13 | | 7 | | 100 | | |||||
Total | $ | 11,848 | | $ | 1,995 | | $ | 2,374 | | $ | 1,141 | | $ | 6,338 | |
CRITICAL ACCOUNTING POLICIES AND ESTIMATES
In preparing our financial statements in accordance with generally accepted accounting principles, there are certain accounting policies, which may require substantial judgment or estimation in their application. We believe these accounting policies and the others set forth in Note 1 to our Consolidated Financial Statements are critical to understanding our results of operations and financial condition. Actual results could differ from our estimates and assumptions, and any such differences could be material to our results of operations and financial condition.
Inventory Reserves
We maintain reserves for excess and obsolete inventory resulting from the potential inability to sell certain products at prices in excess of current carrying costs. We make estimates regarding the future recoverability of the costs of these products and record provisions based on historical experience, expiration of sterilization dates and expected future trends. If actual product life cycles, product demand or acceptance of new product introductions are less favorable than projected by management, additional inventory write downs may be required, which could unfavorably affect future operating results.
Income Taxes
Our annual tax rate is determined based on our income, statutory tax rates and the tax impacts of items treated differently for tax purposes than for financial reporting purposes. Tax law requires certain items be included in the tax return at different times than the items are reflected in the financial statements. Some of these differences are permanent, such as expenses that are not deductible in our tax return, and some differences are temporary and reverse over time, such as depreciation expense. These temporary differences create deferred tax assets and liabilities.
Deferred tax assets generally represent the tax effect of items that can be used as a tax deduction or credit in future years for which we have already recorded the tax benefit in our income statement. Deferred tax liabilities generally represent tax expense recognized in our financial statements for which payment was deferred, the tax effect of expenditures for which a deduction was taken in our tax return but has not yet been recognized in our financial statements or assets recorded at fair value in business combinations for which there was no corresponding tax basis adjustment.
Inherent in determining our annual tax rate are judgments regarding business plans, tax planning opportunities and expectations about future outcomes. Realization of certain deferred tax assets is dependent upon generating sufficient taxable income in the appropriate jurisdiction prior to the expiration of the carryforward periods. Although realization is not assured, management believes it is more likely than not that our deferred tax assets, net of valuation allowances, will be realized.
We operate in multiple jurisdictions with complex tax policy and regulatory environments. In certain of these jurisdictions, we may take tax positions that management believes are supportable but are potentially subject to successful challenge by the applicable taxing authority. These differences of interpretation with the respective governmental taxing authorities can be impacted by the local economic and fiscal environment. We evaluate our tax positions and establish liabilities in accordance with the applicable accounting guidance on uncertainty in income taxes. We review these tax uncertainties in light of changing facts and circumstances, such as the progress of tax audits, and adjust them accordingly. We have a number of audits in process in various jurisdictions. Although the resolution of these tax positions is uncertain, based on currently available information, we believe that it is more likely than not that the ultimate outcomes will not have a material adverse effect on our financial position, results of operations or cash flows.
Due to the number of estimates and assumptions inherent in calculating the various components of our tax provision, certain changes or future events, such as changes in tax legislation, geographic mix of earnings, completion of tax audits or earnings repatriation plans, could have an impact on those estimates and our effective tax rate.
Dollar amounts in millions except per share amounts or as otherwise specified. | 13 |
STRYKER CORPORATION 2017 FORM 10-K
Acquisitions, Goodwill and Intangibles, and Long-Lived Assets
Our financial statements include the operations of an acquired business starting from the completion of the acquisition. In addition, the assets acquired and liabilities assumed are recorded on the date of acquisition at their respective estimated fair values, with any excess of the purchase price over the estimated fair values of the net assets acquired recorded as goodwill.
Significant judgment is required in estimating the fair value of intangible assets and in assigning their respective useful lives. Accordingly, we typically obtain the assistance of third-party valuation specialists for significant items. The fair value estimates are based on available historical information and on future expectations and assumptions deemed reasonable by management but are inherently uncertain. We typically use an income method to estimate the fair value of intangible assets, which is based on forecasts of the expected future cash flows attributable to the respective assets. Significant estimates and assumptions inherent in the valuations reflect a consideration of other marketplace participants and include the amount and timing of future cash flows (including expected growth rates and profitability), the underlying product or technology life cycles, the economic barriers to entry and the discount rate applied to the cash flows. Unanticipated market or macroeconomic events and circumstances may occur that could affect the accuracy or validity of the estimates and assumptions.
Determining the useful life of an intangible asset also requires judgment. With the exception of certain trade names, the majority of our acquired intangible assets (e.g., certain trademarks or brands, customer and distributor relationships, patents and technologies) are expected to have determinable useful lives. Our assessment as to the useful lives of these intangible assets is based on a number of factors including competitive environment, market share, trademark, brand history, underlying product life cycles, operating plans and the macroeconomic environment of the countries in which the trademarked or branded products are sold. Our estimates of the useful lives of determinable-lived intangibles are primarily based on these same factors. Determinable-lived intangible assets are amortized to expense over their estimated useful life.
In some of our acquisitions, we acquire in-process research and development (IPRD) intangible assets. IPRD is considered to be an indefinite-lived intangible asset until the research is completed (then it becomes a determinable-lived intangible asset) or determined to have no future use (then it is impaired).
The value of indefinite-lived intangible assets and goodwill is not amortized but is tested at least annually for impairment. Our impairment testing for goodwill is performed separately from our impairment testing of indefinite-lived intangibles. We perform our annual impairment test for goodwill in the fourth quarter of each year. We consider qualitative indicators of the fair value of a reporting unit when it is unlikely that a reporting unit has impaired goodwill. In certain circumstances, we also use a discounted cash flow analysis that requires certain assumptions and estimates be made regarding market conditions and our future profitability. In those circumstances we test goodwill for impairment by reviewing the book value compared to the fair value at the reporting unit level. We test individual indefinite-lived intangibles by reviewing the individual book values compared to the fair value. We determine the fair value of our reporting units and indefinite-lived intangible assets based on the income approach. Under the income approach, we calculate the fair value of our reporting units and indefinite-lived intangible assets based on the present value of estimated future
cash flows. Considerable management judgment is necessary to evaluate the impact of operating and macroeconomic changes and to estimate future cash flows to measure fair value. Assumptions used in our impairment evaluations, such as forecasted growth rates and cost of capital, are consistent with internal projections and operating plans. We believe such assumptions and estimates are also comparable to those that would be used by other marketplace participants.
We did not recognize any impairment charges for goodwill in the years presented, as our annual impairment testing indicated that all reporting unit goodwill fair values exceeded their respective recorded values. Future changes in the judgments, assumptions and estimates that are used in our impairment testing for goodwill and indefinite-lived intangible assets, including discount and tax rates and future cash flow projections, could result in significantly different estimates of the fair values. A significant reduction in the estimated fair values could result in impairment charges that could materially affect our results of operations.
We review our other long-lived assets for indicators of impairment whenever events or changes in circumstances indicate that the carrying amount may not be recoverable. The evaluation is performed at the lowest level of identifiable cash flows, which is at the individual asset level or the asset group level. The undiscounted cash flows expected to be generated by the related assets are estimated over their useful life based on updated projections. If the evaluation indicates that the carrying amount of the assets may not be recoverable, any potential impairment is measured based upon the fair value of the related assets or asset group as determined by an appropriate market appraisal or other valuation technique. Assets classified as held for sale, if any, are recorded at the lower of carrying amount or fair value less costs to sell.
Legal and Other Contingencies
We are involved in various ongoing proceedings, legal actions and claims arising in the normal course of business, including proceedings related to product, labor and intellectual property, and other matters that are more fully described in Note 6 to our Consolidated Financial Statements. The outcomes of these matters will generally not be known for prolonged periods of time. In certain of the legal proceedings, the claimants seek damages, as well as other compensatory and equitable relief, that could result in the payment of significant claims and settlements and/or the imposition of injunctions or other equitable relief. For legal matters for which management had sufficient information to reasonably estimate our future obligations, a liability representing management's best estimate of the probable loss, or the minimum of the range of probable losses when a best estimate within the range is not known, for the resolution of these legal matters is recorded. The estimates are based on consultation with legal counsel, previous settlement experience and settlement strategies. If actual outcomes are less favorable than those projected by management, additional expense may be incurred, which could unfavorably affect future operating results. We are currently self-insured for product liability-related claims and expenses. The ultimate cost to us with respect to product liability claims could be materially different than the amount of the current estimates and accruals and could have a material adverse effect on our financial position, results of operations and cash flows.
NEW ACCOUNTING PRONOUNCEMENTS
Refer to Note 1 to our Consolidated Financial Statements for further information.
Dollar amounts in millions except per share amounts or as otherwise specified. | 14 |
ITEM 7A. | QUANTITATIVE AND QUALITATIVE DISCLOSURES ABOUT MARKET RISK. |
We sell our products globally and, as a result, our financial results could be significantly affected by factors such as weak economic conditions or changes in foreign currency exchange rates. Our operating results are primarily exposed to changes in exchange rates among the United States Dollar, European currencies, in particular the Euro, Swiss Franc and the British Pound, the Japanese Yen, the Australian Dollar and the Canadian Dollar. We develop and manufacture products in the United States, Canada, China, France, Germany, Ireland, Japan, Mexico, Puerto Rico, Sweden, Switzerland and Turkey and incur costs in the applicable local currencies. This global deployment of facilities serves to partially mitigate the impact of currency exchange rate changes on our cost of sales. Refer to Notes 1, 3 and 4 to our Consolidated Financial Statements for information regarding our use of derivative instruments to mitigate these risks. A hypothetical 10% change in foreign currencies relative to the United States Dollar would change the December 31, 2017 fair value by approximately $349 .
Dollar amounts in millions except per share amounts or as otherwise specified. | 15 |
STRYKER CORPORATION 2017 FORM 10-K
ITEM 8. | FINANCIAL STATEMENTS AND SUPPLEMENTARY DATA. |
REPORT OF INDEPENDENT REGISTERED PUBLIC ACCOUNTING FIRM
To the Shareholders and the Board of Directors of Stryker Corporation
Opinion on the Financial Statements
We have audited the accompanying consolidated balance sheets of Stryker Corporation and subsidiaries (the Company) as of December 31, 2017 and 2016, the related consolidated statements of earnings and comprehensive income, shareholder's equity, and cash flows, for each of the three years in the period ended December 31, 2017, and the related notes and the financial statement schedule listed in the Index at Item 15(a) (collectively referred to as the "financial statements"). In our opinion, the financial statements present fairly, in all material respects, the consolidated financial position of the Company at December 31, 2017 and 2016, and the consolidated results of its operations and its cash flows for each of the three years in the period ended December 31, 2017, in conformity with U.S. generally accepted accounting principles.
We also have audited, in accordance with the standards of the Public Company Accounting Oversight Board (United States) (PCAOB), the Company's internal control over financial reporting as of December 31, 2017, based on criteria established in Internal Control-Integrated Framework issued by the Committee of Sponsoring Organizations of the Treadway Commission (2013 framework) and our report dated February 8, 2018 expressed an unqualified opinion thereon.
Basis for Opinion
These financial statements are the responsibility of the Company's management. Our responsibility is to express an opinion on the Company's financial statements based on our audits. We are a public accounting firm registered with the PCAOB and are required to be independent with respect to the Company in accordance with the U.S. federal securities laws and the applicable rules and regulations of the Securities and Exchange Commission and the PCAOB.
We conducted our audits in accordance with the standards of the PCAOB. Those standards require that we plan and perform the audit to obtain reasonable assurance about whether the financial statements are free of material misstatement, whether due to error or fraud. Our audits included performing procedures to assess the risks of material misstatement of the financial statements, whether due to error or fraud, and performing procedures that respond to those risks. Such procedures included examining, on a test basis, evidence regarding the amounts and disclosures in the financial statements. Our audits also included evaluating the accounting principles used and significant estimates made by management, as well as evaluating the overall presentation of the financial statements. We believe that our audits provide a reasonable basis for our opinion.
/s/ ERNST & YOUNG LLP
We have served as the Company's auditor since 1974
Grand Rapids, Michigan
February 8, 2018
| 16 |
STRYKER CORPORATION 2017 FORM 10-K
Stryker Corporation and Subsidiaries
CONSOLIDATED STATEMENTS OF EARNINGS
| 2017 |
| 2016 |
| 2015 | ||||||
Net sales | $ | 12,444 | |
| $ | 11,325 | |
| $ | 9,946 | |
Cost of sales | 4,271 | |
| 3,830 | |
| 3,344 | | |||
Gross profit | $ | 8,173 | |
| $ | 7,495 | |
| $ | 6,602 | |
Research, development and engineering expenses | 787 | |
| 715 | |
| 625 | | |||
Selling, general and administrative expenses | 4,552 | |
| 4,137 | |
| 3,610 | | |||
Recall charges, net of insurance proceeds | 173 | |
| 158 | |
| 296 | | |||
Amortization of intangible assets | 371 | |
| 319 | |
| 210 | | |||
Total operating expenses | $ | 5,883 | |
| $ | 5,329 | |
| $ | 4,741 | |
Operating income | $ | 2,290 | |
| $ | 2,166 | |
| $ | 1,861 | |
Other income (expense), net | (227 | ) |
| (245 | ) |
| (126 | ) | |||
Earnings before income taxes | $ | 2,063 | |
| $ | 1,921 | |
| $ | 1,735 | |
Income taxes | 1,043 | |
| 274 | |
| 296 | | |||
Net earnings | $ | 1,020 | |
| $ | 1,647 | |
| $ | 1,439 | |
|
|
|
|
|
| ||||||
Net earnings per share of common stock: |
|
|
|
|
| ||||||
Basic net earnings per share of common stock | $ | 2.73 | |
| $ | 4.40 | |
| $ | 3.82 | |
Diluted net earnings per share of common stock | $ | 2.68 | |
| $ | 4.35 | |
| $ | 3.78 | |
|
|
|
|
|
| ||||||
Weighted-average shares outstanding: |
|
|
|
|
| ||||||
Basic | 374.0 | |
| 374.1 | |
| 376.6 | | |||
Effect of dilutive employee stock options | 6.1 | |
| 4.4 | |
| 4.3 | | |||
Diluted | 380.1 | |
| 378.5 | |
| 380.9 | | |||
Anti-dilutive shares excluded from the calculation of dilutive employee stock options were de minimis in all periods.
CONSOLIDATED STATEMENTS OF COMPREHENSIVE INCOME
| 2017 |
| 2016 |
| 2015 | ||||||
Net earnings | $ | 1,020 | |
| $ | 1,647 | |
| $ | 1,439 | |
Other comprehensive income (loss), net of tax |
|
|
|
|
| ||||||
Marketable securities | (4 | ) |
| - | |
| (3 | ) | |||
Pension plans | (2 | ) |
| (13 | ) |
| 17 | | |||
Unrealized gains (losses) on designated hedges | 4 | |
| 20 | |
| (9 | ) | |||
Financial statement translation | 210 | |
| (129 | ) |
| (390 | ) | |||
Total other comprehensive income (loss), net of tax | $ | 208 | |
| $ | (122 | ) |
| $ | (385 | ) |
Comprehensive income | $ | 1,228 | |
| $ | 1,525 | |
| $ | 1,054 | |
See accompanying notes to Consolidated Financial Statements.
Dollar amounts in millions except per share amounts or as otherwise specified. | 17 |
STRYKER CORPORATION 2017 FORM 10-K
Stryker Corporation and Subsidiaries
CONSOLIDATED BALANCE SHEETS
| 2017 |
| 2016 | ||||
Assets |
|
|
| ||||
Current assets |
|
|
| ||||
Cash and cash equivalents | $ | 2,542 | |
| $ | 3,316 | |
Marketable securities | 251 | |
| 68 | | ||
Accounts receivable, less allowance of $59 ($56 in 2016) | 2,198 | |
| 1,967 | | ||
Inventories: |
|
|
| ||||
Materials and supplies | 528 | |
| 425 | | ||
Work in process | 148 | |
| 130 | | ||
Finished goods | 1,789 | |
| 1,475 | | ||
Total inventories | $ | 2,465 | |
| $ | 2,030 | |
Prepaid expenses and other current assets | 537 | |
| 480 | | ||
Total current assets | $ | 7,993 | |
| $ | 7,861 | |
Property, plant and equipment: |
|
|
| ||||
Land, buildings and improvements | 936 | |
| 820 | | ||
Machinery and equipment | 2,864 | |
| 2,341 | | ||
Total property, plant and equipment | 3,800 | |
| 3,161 | | ||
Less allowance for depreciation | 1,825 | |
| 1,592 | | ||
Property, plant and equipment, net | $ | 1,975 | |
| $ | 1,569 | |
Goodwill | 7,168 | |
| 6,356 | | ||
Other intangibles, net | 3,477 | |
| 3,508 | | ||
Other noncurrent assets | 1,584 | |
| 1,141 | | ||
Total assets | $ | 22,197 | |
| $ | 20,435 | |
|
|
|
| ||||
Liabilities and shareholders' equity |
|
|
| ||||
Current liabilities |
|
|
| ||||
Accounts payable | $ | 487 | |
| $ | 437 | |
Accrued compensation | 838 | |
| 767 | | ||
Income taxes | 143 | |
| 40 | | ||
Dividend payable | 178 | |
| 159 | | ||
Accrued recall expenses | 196 | |
| 594 | | ||
Accrued expenses and other liabilities | 1,011 | |
| 923 | | ||
Current maturities of debt | 632 | |
| 228 | | ||
Total current liabilities | $ | 3,485 | |
| $ | 3,148 | |
Long-term debt, excluding current maturities | 6,590 | |
| 6,686 | | ||
Income taxes | 1,261 | |
| 287 | | ||
Other noncurrent liabilities | 881 | |
| 764 | | ||
Total liabilities | $ | 12,217 | |
| $ | 10,885 | |
Shareholders' equity |
|
|
| ||||
Common stock, $0.10 par value | 37 | |
| 37 | | ||
Additional paid-in capital | 1,496 | |
| 1,432 | | ||
Retained earnings | 8,986 | |
| 8,842 | | ||
Accumulated other comprehensive loss | (553 | ) |
| (761 | ) | ||
Total Stryker shareholders' equity | $ | 9,966 | |
| $ | 9,550 | |
Noncontrolling interest | 14 | |
| - | | ||
Total shareholders' equity | $ | 9,980 | |
| $ | 9,550 | |
Total liabilities & shareholders' equity | $ | 22,197 | |
| $ | 20,435 | |
See accompanying notes to Consolidated Financial Statements.
Dollar amounts in millions except per share amounts or as otherwise specified. | 18 |
STRYKER CORPORATION 2017 FORM 10-K
Stryker Corporation and Subsidiaries
CONSOLIDATED STATEMENTS OF SHAREHOLDERS' EQUITY
| 2017 |
| 2016 |
| 2015 | ||||||||||||
| Shares | Amount |
| Shares | Amount |
| Shares | Amount | |||||||||
Common stock |
|
|
|
|
|
|
|
| |||||||||
Beginning | 374.6 | | $ | 37 | |
| 373.0 | | $ | 37 | |
| 378.6 | | $ | 38 | |
Issuance of common stock under stock option and benefit plans | 1.7 | | - | |
| 1.7 | | - | |
| 1.8 | | - | | |||
Repurchase of common stock | (1.9 | ) | - | |
| (0.1 | ) | - | |
| (7.4 | ) | (1 | ) | |||
Ending | 374.4 | | $ | 37 | |
| 374.6 | | $ | 37 | |
| 373.0 | | $ | 37 | |
Additional paid-in capital |
|
|
|
|
|
|
|
| |||||||||
Beginning |
| $ | 1,432 | |
|
| $ | 1,321 | |
|
| $ | 1,252 | | |||
Issuance of common stock under stock option and benefit plans |
| (42 | ) |
|
| 15 | |
|
| 8 | | ||||||
Repurchase of common stock |
| (7 | ) |
|
| (1 | ) |
|
| (25 | ) | ||||||
Share-based compensation |
| 113 | |
|
| 97 | |
|
| 86 | | ||||||
Ending |
| $ | 1,496 | |
|
| $ | 1,432 | |
|
| $ | 1,321 | | |||
Retained earnings |
|
|
|
|
|
|
|
| |||||||||
Beginning |
| $ | 8,842 | |
|
| $ | 7,792 | |
|
| $ | 7,559 | | |||
Net earnings |
| 1,020 | |
|
| 1,647 | |
|
| 1,439 | | ||||||
Repurchase of common stock |
| (223 | ) |
|
| (12 | ) |
|
| (674 | ) | ||||||
Cash dividends declared |
| (653 | ) |
|
| (585 | ) |
|
| (532 | ) | ||||||
Ending |
| $ | 8,986 | |
|
| $ | 8,842 | |
|
| $ | 7,792 | | |||
Accumulated other comprehensive (loss) income |
|
|
|
|
|
|
|
| |||||||||
Beginning |
| $ | (761 | ) |
|
| $ | (639 | ) |
|
| $ | (254 | ) | |||
Other comprehensive income (loss) |
| 208 | |
|
| (122 | ) |
|
| (385 | ) | ||||||
Ending |
| $ | (553 | ) |
|
| $ | (761 | ) |
|
| $ | (639 | ) | |||
Total Stryker shareholders' equity |
| $ | 9,966 | |
|
| $ | 9,550 | |
|
| $ | 8,511 | | |||
Non-controlling interest |
|
|
|
|
|
|
|
| |||||||||
Beginning |
| $ | - | |
|
| $ | - | |
|
| $ | - | | |||
Acquisitions |
| 114 | |
|
| - | |
|
| - | | ||||||
Interest purchased |
| (99 | ) |
|
| - | |
|
| - | | ||||||
Net earnings attributable to noncontrolling interest |
| - | |
|
| - | |
|
| - | | ||||||
Foreign currency exchange translation adjustment |
| (1 | ) |
|
| - | |
|
| - | | ||||||
Ending |
| $ | 14 | |
|
| - | |
|
| $ | - | | ||||
Total shareholders' equity |
| $ | 9,980 | |
|
| $ | 9,550 | |
|
| $ | 8,511 | | |||
See accompanying notes to Consolidated Financial Statements.
Dollar amounts in millions except per share amounts or as otherwise specified. | 19 |
STRYKER CORPORATION 2017 FORM 10-K
Stryker Corporation and Subsidiaries
CONSOLIDATED STATEMENTS OF CASH FLOWS
| 2017 |
| 2016 |
| 2015 | ||||||
Operating activities |
|
|
|
|
| ||||||
Net earnings | $ | 1,020 | |
| $ | 1,647 | |
| $ | 1,439 | |
Adjustments to reconcile net earnings to net cash provided by operating activities: |
|
|
|
|
| ||||||
Depreciation | 271 | |
| 227 | |
| 187 | | |||
Amortization of intangible assets | 371 | |
| 319 | |
| 210 | | |||
Share-based compensation | 113 | |
| 97 | |
| 86 | | |||
Recall charges | 173 | |
| 158 | |
| 349 | | |||
Sale of inventory stepped up to fair value at acquisition | 22 | |
| 36 | |
| 7 | | |||
Deferred income tax benefit (expense) | 36 | |
| (46 | ) |
| 87 | | |||
Changes in operating assets and liabilities: |
|
|
|
|
| ||||||
Accounts receivable | (162 | ) |
| (192 | ) |
| (151 | ) | |||
Inventories | (320 | ) |
| (299 | ) |
| (115 | ) | |||
Accounts payable | 21 | |
| (16 | ) |
| 35 | | |||
Accrued expenses and other liabilities | 90 | |
| 241 | |
| 129 | | |||
Recall-related payments | (526 | ) |
| (190 | ) |
| (1,206 | ) | |||
Income taxes | 704 | |
| (128 | ) |
| (238 | ) | |||
Other, net | (254 | ) |
| 61 | |
| 162 | | |||
Net cash provided by operating activities | $ | 1,559 | |
| $ | 1,915 | |
| $ | 981 | |
Investing activities |
|
|
|
|
| ||||||
Acquisitions, net of cash acquired | (831 | ) |
| (4,332 | ) |
| (153 | ) | |||
Purchases of marketable securities | (270 | ) |
| (151 | ) |
| (1,715 | ) | |||
Proceeds from sales of marketable securities | 87 | |
| 785 | |
| 4,094 | | |||
Purchases of property, plant and equipment | (598 | ) |
| (490 | ) |
| (270 | ) | |||
Other investing, net | (1 | ) |
| (3 | ) |
| - | | |||
Net cash (used in) provided by investing activities | $ | (1,613 | ) |
| $ | (4,191 | ) |
| $ | 1,956 | |
Financing activities |
|
|
|
|
| ||||||
Proceeds from borrowings | 733 | |
| 1,094 | |
| 1,576 | | |||
Payments on borrowings | (933 | ) |
| (1,635 | ) |
| (2,272 | ) | |||
Proceeds from issuance of long-term debt, net | 499 | |
| 3,453 | |
| 744 | | |||
Dividends paid | (636 | ) |
| (568 | ) |
| (521 | ) | |||
Repurchase of common stock | (230 | ) |
| (13 | ) |
| (700 | ) | |||
Cash paid for taxes from withheld shares | (95 | ) |
| (67 | ) |
| (56 | ) | |||
Payments to purchase noncontrolling interest | (99 | ) |
| - | |
| - | | |||
Other financing, net | (33 | ) |
| (6 | ) |
| 6 | | |||
Net cash (used in) provided by financing activities | $ | (794 | ) |
| $ | 2,258 | |
| $ | (1,223 | ) |
Effect of exchange rate changes on cash and cash equivalents | 74 | |
| (45 | ) |
| (130 | ) | |||
Change in cash and cash equivalents | $ | (774 | ) |
| $ | (63 | ) |
| $ | 1,584 | |
Cash and cash equivalents at beginning of year | 3,316 | |
| 3,379 | |
| 1,795 | | |||
Cash and cash equivalents at end of year | $ | 2,542 | |
| $ | 3,316 | |
| $ | 3,379 | |
|
|
|
|
|
| ||||||
Supplemental cash flow disclosure: |
|
|
|
|
| ||||||
Cash paid for income taxes, net of refunds | $ | 312 | |
| $ | 510 | |
| $ | 497 | |
Cash paid for interest on debt | $ | 264 | |
| $ | 180 | |
| $ | 101 | |
See accompanying notes to Consolidated Financial Statements.
Dollar amounts in millions except per share amounts or as otherwise specified. | 20 |
STRYKER CORPORATION 2017 FORM 10-K
NOTES TO CONSOLIDATED FINANCIAL STATEMENTS
NOTE 1 - SIGNIFICANT ACCOUNTING POLICIES
Nature of Operations: Stryker Corporation (the "Company," "we," "us," or "our") is one of the world's leading medical technology companies and, together with its customers, is driven to make healthcare better. The Company offers innovative products and services in Orthopaedics, Medical and Surgical, and Neurotechnology and Spine that improve patient and hospital outcomes. Our products include implants used in joint replacement and trauma surgeries; surgical equipment and surgical navigation systems; endoscopic and communications systems; patient handling, emergency medical equipment and intensive care disposable products; neurosurgical, neurovascular and spinal devices; as well as other products used in a variety of medical specialties.
Basis of Presentation and Consolidation: The Consolidated Financial Statements include the Company and its subsidiaries. All significant intercompany accounts and transactions are eliminated in consolidation. We have no material interests in variable interest entities and none that require consolidation. Certain prior year amounts have been reclassified to conform to the presentation of our Consolidated Financial Statements in 2017 .
Use of Estimates: The preparation of financial statements in conformity with accounting principles generally accepted in the United States (GAAP) requires management to make estimates and assumptions that affect the reported amounts of assets and liabilities and disclosure of contingent assets and liabilities on the date of the financial statements and the reported amounts of net sales and expenses in the reporting period. Actual results could differ from those estimates.
Revenue Recognition: Sales are recognized when revenue is realized or realizable and has been earned. Our policy is to recognize revenue when title to the product, ownership and risk of loss transfer to the customer, which can be on the date of shipment, the date of receipt by the customer or, for most Orthopaedics products, when we receive appropriate notification that the product has been used or implanted. A provision for estimated sales returns, discounts, rebates and other sales incentives is recorded as a reduction of net sales in the same period that the revenue is recognized. Shipping and handling costs charged to customers are included in net sales.
Cost of Sales: Cost of sales is primarily comprised of direct materials and supplies consumed in the manufacture of product, as well as manufacturing labor, depreciation expense and direct overhead expense necessary to acquire and convert the purchased materials and supplies into finished product. Cost of sales also includes the cost to distribute products to customers, inbound freight costs, warehousing costs and other shipping and handling activity.
Research, Development and Engineering Expenses: Research and development costs are charged to expense as incurred. Costs include research, development and engineering activities relating to the development of new products, improvement of existing products, technical support of products and compliance with governmental regulations for the protection of customers and patients. Costs primarily consist of salaries, wages, consulting and depreciation and maintenance of research facilities and equipment.
Selling, General and Administrative Expenses: Selling, general and administrative expense is primarily comprised of selling expenses, marketing expenses, administrative and other indirect overhead costs, amortization of loaner instrumentation, depreciation and amortization expense of non-manufacturing assets and other miscellaneous operating items.
Currency Translation: Financial statements of subsidiaries outside the United States generally are measured using the local currency as the functional currency. Adjustments to translate those statements into United States Dollars are recorded in other comprehensive income (OCI). Transactional exchange gains and losses are included in earnings.
Cash Equivalents: Highly liquid investments with remaining stated maturities of three months or less when purchased are considered cash equivalents and recorded at cost.
Marketable Securities: Marketable securities consist of marketable debt securities, certificates of deposit and mutual funds. Mutual funds are acquired to offset changes in certain liabilities related to deferred compensation arrangements and are expected to be used to settle these liabilities. Pursuant to our investment policy, all individual marketable security investments must have a minimum credit quality of single A (Standard & Poor's and Fitch) and A2 (Moody's Corporation) at the time of acquisition, while the overall portfolio of marketable securities must maintain a minimum average credit quality of double A (Standard & Poor's and Fitch) or Aa (Moody's Corporation). In the event of a rating downgrade below the minimum credit quality subsequent to purchase, the marketable security investment is evaluated to determine the appropriate action to take to minimize the overall risk to our marketable security investment portfolio. Our marketable securities are classified as available-for-sale and trading securities. Investments in trading securities represent participant-directed investments of deferred employee compensation.
Accounts Receivable: Accounts receivable consists of trade and other miscellaneous receivables. An allowance is maintained for doubtful accounts for estimated losses in the collection of accounts receivable. Estimates are made regarding the ability of customers to make required payments based on historical credit experience and expected future trends. Accounts receivable are written off when all reasonable collection efforts are exhausted.
Inventories: Inventories are stated at the lower of cost or market, with cost generally determined using the first-in, first-out (FIFO) cost method. For excess and obsolete inventory resulting from the potential inability to sell specific products at prices in excess of current carrying costs, reserves are maintained to reduce current carrying cost to market prices.
Financial Instruments: Our financial instruments consist of cash, cash equivalents, marketable securities, accounts receivable, other investments, accounts payable, debt and foreign currency exchange contracts. The carrying value of our financial instruments, with the exception of our senior unsecured notes, approximates fair value on December 31, 2017 and 2016 . Refer to Note 2 and 9 for further details.
All marketable securities are recognized at fair value. Adjustments to the fair value of marketable securities that are classified as available-for-sale are recorded as increases or decreases, net of income taxes, within accumulated other comprehensive income (AOCI) in shareholders' equity and adjustments to the fair value of marketable securities that are classified as trading are recorded in earnings. The amortized cost of marketable debt securities is adjusted for amortization of premiums and discounts to maturity computed under the effective interest method. Such amortization and interest and realized gains and losses are included in other income (expense), net. The cost of securities sold is determined by the specific identification method.
We review declines in the fair value of our investments classified as available-for-sale to determine whether the decline in fair value is an other-than-temporary impairment. The resulting losses from
Dollar amounts in millions except per share amounts or as otherwise specified. | 21 |
STRYKER CORPORATION 2017 FORM 10-K
other-than-temporary impairments of available-for-sale marketable securities are included in earnings.
Derivatives: All derivatives are recognized at fair value and reported on a gross basis. We enter into forward currency exchange contracts to mitigate the impact of currency fluctuations on transactions denominated in nonfunctional currencies, thereby limiting our risk that would otherwise result from changes in exchange rates. The periods of the forward currency exchange contracts correspond to the periods of the exposed transactions, with realized gains and losses included in the measurement and recording of transactions denominated in the nonfunctional currencies. All forward currency exchange contracts are recorded at their fair value each period.
Forward currency exchange contracts designated as cash flow hedges are designed to hedge the variability of cash flows associated with forecasted transactions denominated in a foreign currency that will take place in the future. These nonfunctional currency exposures principally relate to forecasted intercompany purchases of manufactured products and generally have maturities up to eighteen months. Changes in value of derivatives designated as cash flow hedges are recorded in AOCI on the Consolidated Balance Sheets until earnings are affected by the variability of the underlying cash flows. At that time, the applicable amount of gain or loss from the derivative instrument that is deferred in shareholders' equity is reclassified into earnings and is included in other income (expense), net or cost of goods sold in the Consolidated Statements of Earnings, depending on the underlying transaction that is being hedged. Cash flows associated with these hedges are included in cash from operations in the same category as the cash flows from the items being hedged.
Derivative forward contracts are used to offset our exposure to the change in value of specific foreign currency denominated assets and liabilities, primarily intercompany payables and receivables. These derivatives are not designated as hedges and, therefore, changes in the value of these forward contracts are recognized in earnings, thereby offsetting the current earnings effect of the related changes in value of foreign currency denominated assets and liabilities. The estimated fair value of our forward currency exchange contracts represents the measurement of the contracts at month-end spot rates as adjusted by current forward points.
We designated certain long-term intercompany loans payable and forward exchange contracts as net investment hedges of our investments in certain international subsidiaries that use the Euro as their functional currency. For derivative instruments that are designated and qualify as a net investment hedge, the effective portion of the derivative's gain or loss is recognized in OCI and reported as a component of AOCI. We use the forward method to measure ineffectiveness. Under this method the change in the carrying value of the Euro-denominated amounts due to remeasurement of the effective portion is reported as a component of AOCI. The remaining change in the carrying value of the ineffective portion, if any, is recognized in other income (expense), net. The gain or loss related to settled net investment hedges will be subsequently reclassified into net earnings when the hedged net investment is either sold or substantially liquidated.
Forward starting interest rate derivative instruments designated as cash flow hedges are used to manage the exposure to interest rate volatility with regard to future issuance and refinancing of debt. The effective portion of the gain or loss on a forward starting interest rate derivative instrument that is designated and qualifies as a cash flow hedge is reported as a component of AOCI. Beginning in the period in which the debt refinancing occurs and the related derivative instruments is terminated, the effective portion of the
gains or losses is then reclassified into interest expense over the term of the related debt.
Interest rate derivative instruments designated as fair value hedges are being used to manage the exposure to interest rate movements and to reduce borrowing costs by converting fixed-rate debt into floating-rate debt. Under these agreements, we agree to exchange, at specified intervals, the difference between fixed and floating interest amounts calculated by reference to an agreed-upon notional principal amount.
Property, Plant and Equipment: Property, plant and equipment is stated at cost. Depreciation is generally computed by the straight-line method over the estimated useful lives of three to 30 years for buildings and improvements and three to 10 years for machinery and equipment.
Goodwill and Other Intangible Assets: Goodwill represents the excess of purchase price over fair value of tangible net assets of acquired businesses at the acquisition date, after amounts allocated to other identifiable intangible assets. Factors that contribute to the recognition of goodwill include synergies that are specific to our business and not available to other market participants and are expected to increase net sales and profits; acquisition of a talented workforce; cost savings opportunities; the strategic benefit of expanding our presence in core and adjacent markets; and diversifying our product portfolio.
The fair values of other identifiable intangible assets are primarily determined using the income approach. Other intangible assets include, but are not limited to, developed technology, customer and distributor relationships (which reflect expected continued customer or distributor patronage) and trademarks and patents. Intangible assets with determinable useful lives are amortized on a straight-line basis over their estimated useful lives of four to 40 years. Certain acquired trade names are considered to have indefinite lives and are not amortized, but are assessed annually for potential impairment as described below.
In some of our acquisitions, we acquire in-process research and development (IPRD), which is an indefinite-lived intangible asset. IPRD where research has been completed becomes a determinable-lived intangible asset and IPRD determined to have no future use becomes impaired.
Goodwill, Intangibles and Long-Lived Asset Impairment Tests: We perform our annual impairment test for goodwill in the fourth quarter of each year. We consider qualitative indicators of the fair value of a reporting unit when it is unlikely that a reporting unit has impaired goodwill. In certain circumstances, we may also utilize a discounted cash flow analysis that requires certain assumptions and estimates be made regarding market conditions and our future profitability. Indefinite-lived intangible assets are also tested at least annually for impairment by comparing the individual carrying values to the fair value.
We review long-lived assets for indicators of impairment whenever events or changes in circumstances indicate that the carrying amount may not be recoverable. The evaluation is performed at the lowest level of identifiable cash flows. Undiscounted cash flows expected to be generated by the related assets are estimated over the asset's useful life based on updated projections. If the evaluation indicates that the carrying amount of the asset may not be recoverable, any potential impairment is measured based upon the fair value of the related asset or asset group as determined by an appropriate market appraisal or other valuation technique. Assets classified as held for sale are recorded at the lower of carrying amount or fair value less costs to sell.
Dollar amounts in millions except per share amounts or as otherwise specified. | 22 |
STRYKER CORPORATION 2017 FORM 10-K
Share-Based Compensation: We use share based compensation in the form of stock options, restricted stock units (RSUs) and performance-based restricted stock units (PSUs). Stock options are granted under long-term incentive plans to certain key employees and non-employee directors at an exercise price not less than the fair market value of the underlying common stock, which is the quoted closing price of our common stock on the day prior to the date of grant. The options are granted for periods of up to 10 years and become exercisable in varying installments.
We grant RSUs to key employees and non-employee directors and PSUs to certain key employees under our long-term incentive plans. The fair value of RSUs is determined based on the number of shares granted and the quoted closing price of our common stock on the date of grant, adjusted for the fact that RSUs do not include anticipated dividends. RSUs generally vest in one-third increments over a three -year period and are settled in stock. PSUs are earned over a three -year performance cycle and vest in March of the year following the end of that performance cycle. The number of PSUs that will ultimately be earned is based on our performance relative to pre-established goals in that three -year performance cycle. The fair value of PSUs is determined based on the quoted closing price of our common stock on the day of grant.
Compensation expense is recognized in the Consolidated Statements of Earnings based on the estimated fair value of the awards on the grant date. Compensation expense recognized reflects an estimate of the number of awards expected to vest after taking into consideration an estimate of award forfeitures based on actual experience and is recognized on a straight-line basis over the requisite service period, which is generally the period required to obtain full vesting. Management expectations related to the achievement of performance goals associated with PSU grants is assessed regularly and that assessment is used to determine whether PSU grants are expected to vest. If performance-based milestones related to PSU grants are not met or not expected to be met, any compensation expense recognized associated with such grants will be reversed.
Income Taxes: Deferred income tax assets and liabilities are determined based on differences between financial reporting and income tax bases of assets and liabilities and are measured using the enacted income tax rates in effect for the years in which the differences are expected to reverse. Deferred income tax benefits generally represent the change in net deferred income tax assets and liabilities in the year. Other amounts result from adjustments related to acquisitions and foreign currency as appropriate.
We operate in multiple income tax jurisdictions both within the United States and internationally. Accordingly, management must determine the appropriate allocation of income to each of these jurisdictions based on current interpretations of complex income tax regulations. Income tax authorities in these jurisdictions regularly perform audits of our income tax filings. Income tax audits associated with the allocation of this income and other complex issues, including inventory transfer pricing and cost sharing, product royalty and foreign branch arrangements, may require an extended period of time to resolve and may result in significant income tax adjustments if changes to the income allocation are required between jurisdictions with different income tax rates.
New Accounting Pronouncements Not Yet Adopted
In August 2017 the Financial Accounting Standards Board (FASB) issued Accounting Standards Update (ASU) 2017-12, Derivatives and Hedging - Targeted Improvements to Accounting for Hedging Activities, which amends and simplifies hedge accounting guidance, as well as improves presentation and disclosure to align the economic effects of risk management strategies in the financial
statements. The update is effective for fiscal years beginning after December 15, 2018 including interim periods within those fiscal years. Early adoption is permitted. We have performed a preliminary assessment of the impact from this update and do not expect the adoption of this standard to have a material impact on our Consolidated Financial Statements. We are currently evaluating our timing of adopting this standard.
In May 2017 the FASB issued ASU 2017-09, Compensation - Stock Compensation, which revises the guidance related to changes in terms or conditions of a share-based payment award. We plan to adopt this update on January 1, 2018 and do not expect the adoption to have a material impact on our Consolidated Financial Statements.
In March 2017 the FASB issued ASU 2017-07, Compensation - Retirement Benefits, which revises the recognition and presentation of the elements of net pension benefit costs. We plan to adopt this update on January 1, 2018 and do not expect the adoption to have a material impact on our Consolidated Financial Statements.
In February 2016 the FASB issued ASU 2016-02, Leases. This update requires an entity to recognize assets and liabilities on the balance sheet for leases with terms greater than 12 months. We are in the process of evaluating the impact on our Consolidated Financial Statements and anticipate most of our current operating leases, as well as some service contracts, will result in the recognition of right to use assets and corresponding lease liabilities in our Consolidated Balance Sheets. We also anticipate changes in classification between financial statement line items in our Consolidated Statements of Earnings and Consolidated Statements of Cash Flows, but do not anticipate adoption of the update will have a material impact on net earnings and cash flows. We plan to adopt this update on January 1, 2019.
In October 2016 the FASB issued ASU 2016-16, Income Taxes, Intra-Entity Transfers of Assets Other Than Inventory, which requires companies to account for the income tax effect of intercompany sales and transfers of assets other than inventory when the transfer occurs. Under current guidance, we defer the income tax effects of intercompany transfers of assets until the asset has been sold to an outside party or otherwise recognized. We will adopt this update on January 1, 2018. We have finalized our assessment of the impact from this update and have recorded a cumulative-effect adjustment to decrease retained earnings in the amount of approximately $696 as of January 1, 2018.
In May 2014 the FASB issued ASU 2014-09, Revenue from Contracts with Customers. This update outlines a single, comprehensive model for accounting for revenue from contracts with customers. The guidance permits two methods of adoption: retrospectively to each prior reporting period presented (full retrospective method) or retrospectively with the cumulative effect of initially applying the guidance recognized at the date of initial application (modified retrospective method). We plan to adopt this update on January 1, 2018 using the modified retrospective approach by recognizing the cumulative effect of initially applying the standard as an adjustment to the opening balance of retained earnings for 2018. We have finalized our assessment of the impact from this update and have recorded a cumulative-effect adjustment to decrease retained earnings in the amount of $55 as of January 1, 2018. We expect the impact from adoption of this standard will be recognized in our Consolidated Statements of Earnings in 2018.
Accounting Pronouncements Recently Adopted
On January 1, 2017 we adopted ASU 2016-09, Compensation-Stock Compensation: Improvements to Employee Share-Based Payment Accounting. The impact on our Consolidated Statements of Earnings in 2017 was a tax benefit of $57 . In our prior year
Dollar amounts in millions except per share amounts or as otherwise specified. | 23 |
STRYKER CORPORATION 2017 FORM 10-K
Consolidated Statements of Cash Flow we reclassified $36 from other financing to income taxes within operating activities to conform to current year presentation.
On January 1, 2017 we adopted ASU 2016-15, Statement of Cash Flows: Classification of Certain Cash Receipts and Cash Payments. The adoption of this update did not have a material impact on our Consolidated Financial Statements.
No other new accounting pronouncements were issued or became effective in the period that had, or are expected to have, a material impact on our Consolidated Financial Statements.
NOTE 2 - FAIR VALUE MEASUREMENTS
Fair value is defined as the price that would be received to sell an asset or paid to transfer a liability in an orderly transaction between market participants at the measurement date. Financial assets and liabilities carried at fair value are classified in their entirety based on the lowest level of input and disclosed in one of the following three categories:
Level 1 | Quoted market prices in active markets for identical assets or liabilities. |
Level 2 | Observable market-based inputs or unobservable inputs that are corroborated by market data. |
Level 3 | Unobservable inputs reflecting our assumptions or external inputs from active markets. |
Use of observable market data, when available, is required in making fair value measurements. When inputs used fall within different levels of the hierarchy, the level within which the fair value measurement is categorized is based on the lowest level input that is significant to the fair value measurement. We determine fair value for Level 1 instruments using exchange-traded prices for identical instruments. We determine fair value of Level 2 instruments using exchange-traded prices of similar instruments, where available, or utilizing other observable inputs that take into account our credit risk and that of our counterparties. Foreign currency exchange contracts and interest rate hedges are included in Level 2 and we use inputs other than quoted prices that are observable for the asset or liability. The Level 2 derivative instruments are primarily valued using standard calculations and models that use readily observable market data as their basis. Our Level 3 liabilities are comprised of contingent consideration arising from recently completed acquisitions. We determine fair value of these Level 3 liabilities using a discounted cash flow technique or the Black-Scholes option pricing model. Significant unobservable inputs were used in our assessment of fair value, including assumptions regarding future business results, discount rates, discount periods and probability assessments based on likelihood of reaching various targets. We remeasure the fair value of our assets and liabilities each reporting period. We record the changes in fair value within selling, general and administrative expense and the changes in the time value of money within other income (expense), net.
Assets Measured at Fair Value | ||||||
| 2017 | 2016 | ||||
Cash and cash equivalents | $ | 2,542 | | $ | 3,316 | |
Trading marketable securities | 121 | | 94 | | ||
Level 1 - Assets | $ | 2,663 | | $ | 3,410 | |
Available-for-sale marketable securities: |
|
| ||||
Corporate and asset-backed debt securities | $ | 125 | | $ | 25 | |
Foreign government debt securities | 2 | | - | | ||
United States agency debt securities | 27 | | 9 | | ||
United States treasury debt securities | 70 | | 16 | | ||
Certificates of deposit | 27 | | 18 | | ||
Total available-for-sale marketable securities | $ | 251 | | $ | 68 | |
Foreign currency exchange forward contracts | 15 | | 45 | | ||
Interest rate swap asset | 49 | | 57 | | ||
Level 2 - Assets | $ | 315 | | $ | 170 | |
Total assets measured at fair value | $ | 2,978 | | $ | 3,580 | |
Liabilities Measured at Fair Value | ||||||
| 2017 | 2016 | ||||
Deferred compensation arrangements | $ | 121 | | $ | 94 | |
Level 1 - Liabilities | $ | 121 | | $ | 94 | |
Foreign currency exchange forward contracts | $ | 37 | | $ | 18 | |
Level 2 - Liabilities | $ | 37 | | $ | 18 | |
Contingent consideration: |
|
| ||||
Beginning | $ | 86 | | $ | 56 | |
Additions | 3 | | 49 | | ||
Change in estimate | 2 | | (7 | ) | ||
Settlements | (59 | ) | (12 | ) | ||
Ending | $ | 32 | | $ | 86 | |
Level 3 - Liabilities | $ | 32 | | $ | 86 | |
Total liabilities measured at fair value | $ | 190 | | $ | 198 | |
Fair Value of Available for Sale Securities by Maturity | ||||||
| 2017 | 2016 | ||||
Due in one year or less | $ | 107 | | $ | 36 | |
Due after one year through three years | $ | 144 | | $ | 32 | |
On December 31, 2017 the aggregate difference between the cost and fair value of available-for-sale marketable securities was nominal. Interest receivable was $1 and less than $1 in 2017 and 2016 related to our marketable security portfolio. Interest and marketable securities income was $60 , $29 , and $14 in 2017 , 2016 , and 2015 , which was recorded in other income (expense), net.
Our investments in available-for-sale marketable securities had a minimum credit quality rating of A2 (Moody's), A (Standard & Poor's) and A (Fitch). We do not plan to sell the investments, and it is not more likely than not that we will be required to sell the investments before recovery of their amortized cost basis, which may be maturity. We do not consider these investments to be other-than-temporarily impaired on December 31, 2017 . On December 31, 2017 substantially all our investments with unrealized losses that were not deemed to be other-than-temporarily impaired were in a continuous unrealized loss position for less than twelve months, and the losses were nominal.
Securities in a Continuous Unrealized Loss Position | ||||
| Number of Investments | Fair Value | ||
Corporate and Asset-Backed | 118 | $ | 108 | |
Foreign government | 1 | 2 | | |
United States Agency | 15 | 20 | | |
United States Treasury | 20 | 70 | | |
Certificate of Deposit | 28 | 23 | | |
Total | 182 | $ | 223 | |
NOTE 3 - DERIVATIVE INSTRUMENTS
Foreign Currency Hedges
We use operational and economic hedges, foreign currency exchange forward contracts, net investment hedges (both long-term
Dollar amounts in millions except per share amounts or as otherwise specified. | 24 |
STRYKER CORPORATION 2017 FORM 10-K
intercompany loans payable and forward exchange contracts) and interest rate derivative instruments to manage the impact of currency exchange and interest rate fluctuations on earnings and cash flow. We do not enter into derivative instruments for speculative purposes. We are exposed to credit loss in the event of nonperformance by counterparties on our outstanding derivative instruments but do not anticipate nonperformance by any of our counterparties. Should a counterparty default, our maximum exposure to loss is the asset balance of the instrument.
2017 | Designated | Non-Designated | Total | ||||||
Gross notional amount | $ | 1,104 | | $ | 4,767 | | $ | 5,871 | |
Maximum term in days |
|
| 548 | | |||||
Fair value: |
|
|
| ||||||
Other current assets | $ | 11 | | $ | 4 | | $ | 15 | |
Other noncurrent assets | 1 | | - | | 1 | | |||
Other current liabilities | (7 | ) | (29 | ) | (36 | ) | |||
Other noncurrent liabilities | (1 | ) | - | | (1 | ) | |||
Total fair value | $ | 4 | | $ | (25 | ) | $ | (21 | ) |
2016 |
|
|
| ||||||
Gross notional amount | $ | 1,058 | | $ | 2,841 | | $ | 3,899 | |
Maximum term in days |
|
| 548 | | |||||
Fair value: |
|
|
| ||||||
Other current assets | $ | 24 | | $ | 17 | | $ | 41 | |
Other noncurrent assets | 4 | | - | | 4 | | |||
Other current liabilities | (9 | ) | (7 | ) | (16 | ) | |||
Other noncurrent liabilities | (2 | ) | - | | (2 | ) | |||
Total fair value | $ | 17 | | $ | 10 | | $ | 27 | |
On December 31, 2017 the total after-tax amount in AOCI related to our designated net investment hedges was $30 . We evaluate the effectiveness of our net investment hedges quarterly. We have not recognized any ineffectiveness in 2017 .
Net Currency Exchange Rate Gains (Losses) | |||||||||
Recorded in: | 2017 | 2016 | 2015 | ||||||
Cost of sales | $ | (6 | ) | $ | - | | $ | 19 | |
Other income (expense), net | (9 | ) | (19 | ) | (22 | ) | |||
Total | $ | (15 | ) | $ | (19 | ) | $ | (3 | ) |
On December 31, 2017 pretax gains recorded in AOCI on derivatives designated as hedges that are expected to be reclassified to earnings within 12 months of the balance sheet date were $7 compared with less than $1 on December 31, 2016 . This reclassification is primarily due to the sale of inventory that includes previously hedged purchases. There were de minimis ineffective portions of derivatives, which are included in the table above.
Interest Rate Hedges
On December 31, 2017 we had interest rate swaps with notional amounts of $600 designated as forward starting interest rate swaps in anticipation of future debt issuances. The market value of outstanding interest rate swap agreements on December 31, 2017 was $44 , which was recorded in other current assets with an offsetting amount recorded in AOCI. Upon the probable issuance of the debt, these amounts will be released to interest expense over the term of the debt. The cash flow effect of this hedge is recorded in cash flow from operations.
On December 31, 2017 we had interest rate swaps with gross notional amounts of $500 designated as fair value hedges of underlying fixed rate obligations representing a portion of our $600 senior unsecured notes due in 2024. There was no hedge ineffectiveness recorded as a result of these fair value hedges in 2017 .
Fair Value Interest Rate Hedge Instruments | |||||||
| 2017 |
| 2016 | ||||
Gross notional amount | $ | 500 | |
| $ | 500 | |
Fair value: |
|
|
| ||||
Other noncurrent assets | 5 | |
| 9 | | ||
Long-term debt | (5 | ) |
| (9 | ) | ||
Total | $ | - | |
| $ | - | |
NOTE 4 - ACCUMULATED OTHER COMPREHENSIVE (LOSS) INCOME (AOCI)
| Marketable Securities | Pension Plans | Hedges | Financial Statement Translation | Total | ||||||||||
2015 | $ | - | | $ | (119 | ) | $ | 4 | | $ | (524 | ) | $ | (639 | ) |
OCI | 3 | | (20 | ) | 35 | | (112 | ) | (94 | ) | |||||
Income taxes | (1 | ) | 3 | | (15 | ) | (17 | ) | (30 | ) | |||||
Reclassifications to: |
|
|
|
|
| ||||||||||
Cost of Sales | - | | 6 | | - | | - | | 6 | | |||||
Other income | (3 | ) | - | | - | | - | | (3 | ) | |||||
Income taxes | 1 | | (2 | ) | - | | - | | (1 | ) | |||||
Net OCI | - | | (13 | ) | 20 | | (129 | ) | (122 | ) | |||||
2016 | $ | - | | $ | (132 | ) | $ | 24 | | $ | (653 | ) | $ | (761 | ) |
OCI | (7 | ) | (27 | ) | (4 | ) | 163 | | 125 | | |||||
Income taxes | 1 | | 19 | | 4 | | 47 | | 71 | | |||||
Reclassifications to: |
|
|
|
|
| ||||||||||
Cost of Sales | - | | 8 | | 6 | | - | | 14 | | |||||
Other Income | 2 | | - | | - | | - | | 2 | | |||||
Income taxes | - | | (2 | ) | (2 | ) | - | | (4 | ) | |||||
Net OCI | (4 | ) | (2 | ) | 4 | | 210 | | 208 | | |||||
2017 | $ | (4 | ) | $ | (134 | ) | $ | 28 | | $ | (443 | ) | $ | (553 | ) |
NOTE 5 - ACQUISITIONS
In 2017 and 2016 total cash paid for acquisitions was $831 and $4,332 . We acquired stock in companies and various assets that continue to support our capital deployment and product development strategies.
In December 2017 we announced a definitive merger agreement to acquire Entellus Medical, Inc. (Entellus), a high-growth global medical technology company focused on delivering superior patient and physician experiences through products designed for the minimally invasive treatment of various ear, nose and throat (ENT) disease states, for $24.00 per share, or total consideration of approximately $662 . Entellus, which had net sales of approximately $75 in 2016, will be integrated into the Instruments business within MedSurg. We expect the acquisition to close in February 2018.
In September 2017 we completed the acquisition of NOVADAQ Technologies Inc. (NOVADAQ) for total consideration of approximately $716 . NOVADAQ is a leading developer of fluorescence imaging technology that provides surgeons with visualization of blood flow in vessels and related tissue perfusion in cardiac, cardiovascular, gastrointestinal, plastic, microsurgical, and reconstructive procedures. This acquisition enhances product offerings within our MedSurg segment. Goodwill related to the NOVADAQ acquisition is not deductible for tax purposes.
Dollar amounts in millions except per share amounts or as otherwise specified. | 25 |
STRYKER CORPORATION 2017 FORM 10-K
Purchase Price Allocation of Acquired Net Assets | ||||||||||
| 2017 |
| 2016 | |||||||
| NOVADAQ |
| Sage | Physio | ||||||
Purchase price paid | $ | 716 | |
| $ | 2,870 | | $ | 1,299 | |
Contingent consideration | - | |
| 5 | | - | | |||
Total consideration | $ | 716 | |
| $ | 2,875 | | $ | 1,299 | |
Tangible assets acquired: | ||||||||||
Cash | 42 | |
| 91 | | 32 | | |||
Accounts receivable | 11 | |
| 29 | | 107 | | |||
Inventory | 39 | |
| 63 | | 61 | | |||
Other assets | 9 | |
| 80 | | 103 | | |||
Liabilities | (58 | ) |
| (83 | ) | (364 | ) | |||
Intangible assets: |
|
|
|
| ||||||
Customer relationship | 18 | |
| 930 | | 344 | | |||
Trade name | 1 | |
| 70 | | 160 | | |||
Developed technology and patents | 133 | |
| 173 | | 226 | | |||
IPRD | - | |
| - | | 7 | | |||
Goodwill | 521 | |
| 1,522 | | 623 | | |||
| $ | 716 | |
| $ | 2,875 | | $ | 1,299 | |
Weighted average life of intangible assets | 14 | |
| 15 | | 14 | | |||
Purchase price allocations for NOVADAQ and other acquisitions in 2017 and 2016 were based on preliminary valuations. Our estimates and assumptions are subject to change within the measurement period. The purchase price allocation for the acquisitions of Sage Products, LLC (Sage) and Physio-Control International, Inc. (Physio) was finalized in 2017. Goodwill related to the Sage acquisition is deductible for tax purposes.
NOTE 6 - CONTINGENCIES AND COMMITMENTS
We are involved in various ongoing proceedings, legal actions and claims arising in the normal course of business, including proceedings related to product, labor, intellectual property and other matters that are more fully described below. The outcomes of these matters will generally not be known for prolonged periods of time. In certain of the legal proceedings, the claimants seek damages as well as other compensatory and equitable relief that could result in the payment of significant claims and settlements and/or the imposition of injunctions or other equitable relief. For legal matters for which management had sufficient information to reasonably estimate our future obligations, a liability representing management's best estimate of the probable loss, or the minimum of the range of probable losses when a best estimate within the range is not known, is recorded. The estimates are based on consultation with legal counsel, previous settlement experience and settlement strategies. If actual outcomes are less favorable than those estimated by management, additional expense may be incurred, which could unfavorably affect future operating results. We are self-insured for product liability claims and expenses. The ultimate cost to us with respect to product liability claims could be materially different than the amount of the current estimates and accruals and could have a material adverse effect on our financial position, results of operations and cash flows.
In June 2012 we voluntarily recalled our Rejuvenate and ABG II Modular-Neck hip stems and terminated global distribution of these hip products. Product liability lawsuits relating to this voluntary recall have been filed against us. On November 3, 2014 we announced that we had entered into a settlement agreement to compensate eligible United States patients who had revision surgery to replace their Rejuvenate and/or ABG II Modular-Neck hip stem prior to that date and in December 2016 the settlement program was extended to patients who had revision surgery prior to December 19, 2016. We continue to offer support for recall-related care and reimburse patients who are not eligible to enroll in the settlement program for testing and treatment services, including any necessary revision surgeries. In addition, some lawsuits will remain and we will continue
to defend against them. Based on the information that has been received, the actuarially determined range of probable loss to resolve this matter globally is currently estimated to be approximately $2,072 to $2,307 ( $2,304 to $2,539 before $232 of third-party insurance recoveries). We recorded additional charges to earnings of $104 in 2017 , representing the excess of the minimum of the range over the previously recorded reserves. The final outcome of this matter is dependent on many factors that are difficult to predict including the number of enrollees in the settlement program and the total awards to them, the number and costs of patients not eligible for the settlement program who seek testing and treatment services and require revision surgery and the number and actual costs to resolve the remaining lawsuits. Accordingly, the ultimate cost to resolve this entire matter globally may be materially different than the amount of the current estimate and accruals and could have a material adverse effect on our financial position, results of operations and cash flows.
In 2010 we filed a lawsuit in federal court against Zimmer Biomet Holdings, Inc. (Zimmer), alleging that a Zimmer product infringed on three of our patents. In 2013 following a jury trial favorable to us, the trial judge entered a final judgment that, among other things, awarded us damages of $76 and ordered Zimmer to pay us enhanced damages. Zimmer appealed this ruling. In December 2014 the Federal Circuit affirmed the damages awarded to us, reversed the order for enhanced damages and remanded the issue of attorney fees to the trial court. In May 2015 the trial court entered a stipulated judgment that, among other things, required Zimmer to pay us the base amount of damages and interest, while the issues of enhanced damages and attorney fees continue to be pursued. In June 2015 we recorded a $54 gain, net of legal costs, which was recorded within selling, general and administrative expenses. On June 13, 2016 the United States Supreme Court vacated the decision of the Federal Circuit that reversed our judgment for enhanced damages and remanded the case to the Federal Circuit to reconsider the issue. On September 12, 2016 the Federal Circuit issued an opinion that, among other things, remanded the issue of enhanced damages to the trial court. On July 12, 2017 the trial court reaffirmed its award of enhanced damages and entered a judgment of $164 in our favor. On July 24, 2017 Zimmer filed a notice of appeal of this decision.
Future Obligations
We have purchase commitments for materials, supplies, services and property, plant and equipment as part of the normal course of business. In addition, we lease various manufacturing, warehousing and distribution facilities, administrative and sales offices as well as equipment under operating leases. Rent expense totaled $125 , $112 , and $101 in 2017 , 2016 and 2015 . Refer to Note 9 for more information on the debt obligations.
Future Obligations | ||||||||||||||||||
| 2018 | 2019 | 2020 | 2021 | 2022 | Thereafter | ||||||||||||
Debt repayments | $ | 600 | | $ | 1,250 | | $ | 500 | | $ | 750 | | $ | - | | $ | 4,150 | |
Purchase obligations | $ | 1,046 | | $ | 95 | | $ | 2 | | $ | 1 | | $ | - | | $ | - | |
Minimum lease payments | $ | 106 | | $ | 63 | | $ | 45 | | $ | 31 | | $ | 21 | | $ | 60 | |
NOTE 7 - GOODWILL AND OTHER INTANGIBLE ASSETS
We completed our annual impairment tests of goodwill in 2017 and 2016 and concluded in each year that no impairments exist.
Dollar amounts in millions except per share amounts or as otherwise specified. | 26 |
STRYKER CORPORATION 2017 FORM 10-K
Summary of Other Intangible Assets | ||||||||||
| Weighted Average Amortization Period (Years) | Gross | Less | Net | ||||||
Developed technologies | ||||||||||
2017 | 12 | $ | 2,416 | | $ | 917 | | $ | 1,499 | |
2016 | 14 | 2,091 | | 706 | | 1,385 | | |||
Customer relationships | ||||||||||
2017 | 15 | $ | 2,088 | | $ | 561 | | $ | 1,527 | |
2016 | 15 | 2,049 | | 407 | | 1,642 | | |||
Patents | ||||||||||
2017 | 10 | $ | 340 | | $ | 227 | | $ | 113 | |
2016 | 11 | 317 | | 206 | | 111 | | |||
Trademarks |
|
|
| |||||||
2017 | 18 | $ | 352 | | $ | 84 | | $ | 268 | |
2016 | 18 | 348 | | 59 | | 289 | | |||
In-process research and development | ||||||||||
2017 | N/A | $ | 25 | | - | | $ | 25 | | |
2016 | N/A | 30 | | - | | 30 | | |||
Other | ||||||||||
2017 | 9 | $ | 93 | | $ | 48 | | $ | 45 | |
2016 | 12 | 115 | | 64 | | 51 | | |||
Total | ||||||||||
2017 | 14 | $ | 5,314 | | $ | 1,837 | | $ | 3,477 | |
2016 | 15 | $ | 4,950 | | $ | 1,442 | | $ | 3,508 | |
Changes in the Net Carrying Value of Goodwill by Segment | ||||||||||||
| Orthopaedics | MedSurg | Neurotechnology and Spine | Total | ||||||||
2015 | $ | 2,344 | | $ | 782 | | $ | 1,010 | | $ | 4,136 | |
Additions and adjustments | 72 | | 2,196 | | 62 | | 2,330 | | ||||
Foreign exchange | (44 | ) | (44 | ) | (22 | ) | (110 | ) | ||||
2016 | $ | 2,372 | | $ | 2,934 | | $ | 1,050 | | $ | 6,356 | |
Additions and adjustments | 2 | | 553 | | 109 | | 664 | | ||||
Foreign exchange | 52 | | 22 | | 74 | | 148 | | ||||
2017 | $ | 2,426 | | $ | 3,509 | | $ | 1,233 | | $ | 7,168 | |
Estimated Amortization Expense | ||||||||||||||
2018 | 2019 | 2020 | 2021 | 2022 | ||||||||||
$ | 368 | | $ | 355 | | $ | 330 | | $ | 318 | | $ | 311 | |
NOTE 8 - CAPITAL STOCK
The aggregate number of shares of all classes of stock with which we are authorized to issue is up to 1,000,500,000 , divided into two classes consisting of 500,000 shares of $1 par value preferred stock and 1,000,000,000 shares of common stock with a par value of $0.10 . No shares of preferred stock were outstanding on December 31, 2017 .
In 2017 we repurchased 1.9 million shares at a cost of $230 . The manner, timing and amount of repurchases are determined by management based on an evaluation of market conditions, stock price and other factors and are subject to regulatory considerations. Purchases are made from time-to-time in the open market, in privately negotiated transactions or otherwise. On December 31, 2017 the total dollar value of shares that could be purchased under our authorized repurchase program was $1,640 .
Shares reserved for future compensation grants of our common stock were 37 million and 11 million on December 31, 2017 and 2016 .
Stock Options
We measure the cost of employee stock options based on the grant-date fair value and recognize that cost using the straight-line method over the period in which a recipient is required to provide services in exchange for the options, typically the vesting period. The
weighted-average fair value per share of options is estimated on the date of grant using the Black-Scholes option pricing model.
Option Value and Assumptions | |||||||||||
| 2017 |
| 2016 |
| 2015 | ||||||
Weighted-average fair value per share | $ | 22.43 | |
| $ | 17.73 | |
| $ | 22.55 | |
Assumptions: |
|
|
|
|
| ||||||
Risk-free interest rate | 2.0 | % |
| 1.3 | % |
| 1.8 | % | |||
Expected dividend yield | 1.5 | % |
| 1.6 | % |
| 1.6 | % | |||
Expected stock price volatility | 19.4 | % |
| 20.5 | % |
| 25.5 | % | |||
Expected option life (years) | 6.0 | |
| 6.1 | |
| 7.3 | | |||
The risk-free interest rate for periods within the expected life of options granted is based on the United States Treasury yield curve in effect at the time of grant. Expected stock price volatility is based on the historical volatility of our stock. The expected option life, representing the period of time that options granted are expected to be outstanding, is based on historical option exercise and employee termination data.
2017 Stock Option Activity | ||||||||||||
| Shares |
| Weighted |
| Weighted-Average |
| Aggregate | |||||
Outstanding January 1 | 14.9 | |
| $ | 73.14 | |
|
|
|
| ||
Granted | 2.9 | |
| 122.66 | |
|
|
|
| |||
Exercised | (2.5 | ) |
| 62.66 | |
|
|
|
| |||
Canceled | (0.6 | ) |
| 97.87 | |
|
|
|
| |||
Outstanding December 31 | 14.7 | |
| $ | 83.71 | |
| 5.4 |
| $ | 956.5 | |
Exercisable December 31 | 7.5 | |
| $ | 65.47 | |
| 4.2 |
| $ | 666.8 | |
Options expected to vest | 6.6 | |
| $ | 101.83 | |
| 7.9 |
| $ | 347.9 | |
The aggregate intrinsic value of options, which represents the cumulative difference between the fair market value of the underlying common stock and the option exercise prices, exercised was $184 , $128 , and $98 in 2017 , 2016 and 2015 . Exercise prices for options outstanding ranged from $38.71 to $154.87 on December 31, 2017 . On December 31, 2017 there was $90 of unrecognized compensation cost related to nonvested stock options granted under the long-term incentive plans; that cost is expected to be recognized over the weighted-average period of approximately 1.6 years .
Restricted Stock Units (RSUs) and Performance Stock Units (PSUs) Activity | |||||||||||||
| Shares |
| Weighted Average | ||||||||||
| RSUs |
| PSUs |
| RSUs |
| PSUs | ||||||
Nonvested on January 1 | 1.1 | |
| 0.3 | |
| $ | 90.10 | |
| $ | 91.19 | |
Granted | 0.5 | |
| 0.1 | |
| 117.44 | |
| 122.41 | | ||
Vested | (0.5 | ) |
| (0.1 | ) |
| 87.08 | |
| 81.14 | | ||
Canceled or forfeited | (0.1 | ) |
| - | |
| 102.01 | |
| 92.18 | | ||
Nonvested on December 31 | 1.0 | |
| 0.3 | |
| $ | 104.85 | |
| $ | 104.51 | |
On December 31, 2017 there was $56 of unrecognized compensation cost related to nonvested RSUs. That cost is expected to be recognized as expense over the weighted-average period of approximately one year . The weighted-average grant date fair value per share of RSUs granted was $117.44 and $94.70 in 2017 and 2016 . The fair value of RSUs and PSUs vested in 2017 was $44 and $7 . On December 31, 2017 there was $13 of unrecognized compensation cost related to nonvested PSUs; the cost is expected to be recognized as expense over the weighted-average period of approximately one year .
Dollar amounts in millions except per share amounts or as otherwise specified. | 27 |
STRYKER CORPORATION 2017 FORM 10-K
Employee Stock Purchase Plans (ESPP)
Full- and part-time employees may participate in our ESPP provided they meet certain eligibility requirements. The purchase price for our common stock under the terms of the ESPP is defined as 95% of the closing stock price on the last trading day of a purchase period. We issued 163,415 and 159,329 shares under the ESPP in 2017 and 2016 .
NOTE 9 - DEBT AND CREDIT FACILITIES
In January 2017 we issued $500 of senior unsecured notes with a fixed interest rate of 1.800% due on January 15, 2019. Our commercial paper program allows us to have a maximum of $1,500 in commercial paper outstanding with maturities up to 397 days from the date of issuance. On December 31, 2017 there were no amounts outstanding under our commercial paper program.
We have lines of credit issued by various financial institutions that are available to fund our day-to-day operating needs. Certain of our credit facilities require us to comply with financial and other covenants. We were in compliance with all covenants on December 31, 2017 .
Summary of Total Debt | |||||||||||
|
| 2017 |
| 2016 | |||||||
Senior unsecured notes: |
|
|
|
| |||||||
| Rate |
| Due |
|
|
|
| ||||
| 1.300% |
| April 1, 2018 | $ | 600 | |
| $ | 598 | | |
| 1.800% |
| January 15, 2019 | 499 | |
| - | | |||
| 2.000% |
| March 8, 2019 | 748 | |
| 746 | | |||
| 4.375% |
| January 15, 2020 | 498 | |
| 497 | | |||
| 2.625% |
| March 15, 2021 | 746 | |
| 745 | | |||
| 3.375% |
| May 15, 2024 | 598 | |
| 602 | | |||
| 3.375% |
| November 1, 2025 | 745 | |
| 744 | | |||
| 3.500% |
| March 15, 2026 | 988 | |
| 987 | | |||
| 4.100% |
| April 1, 2043 | 391 | |
| 391 | | |||
| 4.375% |
| May 15, 2044 | 394 | |
| 395 | | |||
| 4.625% |
| March 15, 2046 | 980 | |
| 979 | | |||
Commercial paper |
| - | |
| 200 | | |||||
Other |
| 35 | |
| 30 | | |||||
Total debt |
| $ | 7,222 | |
| $ | 6,914 | | |||
Less current maturities |
| 632 | |
| 228 | | |||||
Total long-term debt |
| $ | 6,590 | |
| $ | 6,686 | | |||
|
|
|
|
| |||||||
Unamortized debt issuance costs | $ | 39 | |
| $ | 45 | | ||||
Borrowing capacity on existing facilities | $ | 1,547 | |
| $ | 1,551 | | ||||
Fair value of senior unsecured notes | $ | 7,521 | |
| $ | 6,762 | | ||||
The fair value of the senior unsecured notes was estimated using quoted interest rates, maturities and amounts of borrowings based on quoted active market prices and yields that took into account the underlying terms of the debt instruments. Substantially all of our debt is classified within Level 2 of the fair value hierarchy.
Interest expense, including required fees incurred on outstanding debt and credit facilities that were included in other expense, totaled $247 , $228 , and $108 in 2017 , 2016 and 2015 .
NOTE 10 - INCOME TAXES
Our effective tax rate was 50.6% , 14.3% and 17.1% for 2017 , 2016 and 2015 . The effective income tax rate for 2017 reflects the impact of complying with the Tax Cuts and Jobs Act of 2017, signed into law in December 2017, partially offset by the benefits from the adoption of ASU 2016-09 Compensation-Stock Compensation: Improvements to Employee Share-Based Payment Accounting on January 1, 2017 and continued lower effective income tax rates as a result of the European headquarters. The establishment of the European regional headquarters contributed to the lower effective income tax rates in 2016 and 2015.
Effective Income Tax Rate Reconciliation | ||||||||
| 2017 |
| 2016 |
| 2015 | |||
United States federal statutory rate | 35.0 | % |
| 35.0 | % |
| 35.0 | % |
United States state and local income taxes, less federal deduction | 1.2 | |
| 1.7 | |
| 2.1 | |
Foreign income tax at rates other than 35% | (21.0 | ) |
| (22.2 | ) |
| (17.6 | ) |
Tax Cuts and Jobs Act of 2017 transition tax | 38.0 | |
| - | |
| - | |
Tax Cuts and Jobs Act of 2017 deferred tax changes | 2.3 | |
| - | |
| - | |
Tax related to repatriation of foreign earnings | - | |
| (0.3 | ) |
| (3.9 | ) |
Other | (4.9 | ) |
| 0.1 | |
| 1.5 | |
Effective income tax rate | 50.6 | % |
| 14.3 | % |
| 17.1 | % |
In December 2017 the Tax Cuts and Jobs Act of 2017 (the Act) was signed into law in the United States. The law includes significant changes to the United States corporate income tax system, including a federal corporate rate reduction, limitations on the deductibility of certain expenses, and the transition of United States international taxation from a worldwide tax system to a territorial tax system. As part of the transition to a territorial tax system, the Act requires taxpayers to calculate a one-time transition tax based on undistributed earnings of foreign subsidiaries. We recorded the transition tax in our current year results which significantly impacted our effective tax rate. Additionally, we recorded additional tax expense to adjust certain deferred tax accounts to the new corporate tax rate.
These amounts are our best estimate based on the current information and guidance available at this time and represent provisional estimates of the transition tax related charge and change in deferred tax accounts charge associated with the Act and will be finalized in 2018.
Earnings Before Income Taxes | |||||||||||
| 2017 |
| 2016 |
| 2015 | ||||||
United States | $ | 499 | |
| $ | 542 | |
| $ | 475 | |
International | 1,564 | |
| 1,379 | |
| 1,260 | | |||
Total | $ | 2,063 | |
| $ | 1,921 | |
| $ | 1,735 | |
Components of Income Tax Expense | |||||||||||
Current income tax expense: | 2017 |
| 2016 |
| 2015 | ||||||
United States federal | $ | 836 | |
| $ | 94 | |
| $ | 78 | |
United States state and local | 38 | |
| 50 | |
| 23 | | |||
International | 133 | |
| 176 | |
| 108 | | |||
Total current income tax expense | $ | 1,007 | |
| $ | 320 | |
| $ | 209 | |
Deferred income tax expense (benefit): |
|
|
|
|
| ||||||
United States federal | $ | 84 | |
| $ | (17 | ) |
| $ | 2 | |
United States state and local | (9 | ) |
| (12 | ) |
| 8 | | |||
International | (39 | ) |
| (17 | ) |
| 77 | | |||
Total deferred income tax expense (benefit) | $ | 36 | |
| $ | (46 | ) |
| $ | 87 | |
Total income tax expense | $ | 1,043 | |
| $ | 274 | |
| $ | 296 | |
Interest and penalties included in other income (expense), net were expense of ($28) , ($1) and ($4) in 2017 , 2016 and 2015 . The United States federal deferred income tax expense (benefit) includes the utilization of net operating loss carryforwards of $32 , $28 and $79 in 2017 , 2016 and 2015 .
Dollar amounts in millions except per share amounts or as otherwise specified. | 28 |
STRYKER CORPORATION 2017 FORM 10-K
Deferred Income Tax Assets and Liabilities | |||||||
Deferred income tax assets: | 2017 |
| 2016 | ||||
Inventories | $ | 480 | |
| $ | 583 | |
Product-related liabilities | 34 | |
| 115 | | ||
Other accrued expenses | 204 | |
| 248 | | ||
State income taxes | 46 | |
| 52 | | ||
Share-based compensation | 46 | |
| 80 | | ||
Net operating loss carryforwards | 52 | |
| 74 | | ||
Other | 105 | |
| 117 | | ||
Total deferred income tax assets | $ | 967 | |
| $ | 1,269 | |
Less valuation allowances | (49 | ) |
| (51 | ) | ||
Net deferred income tax assets | $ | 918 | |
| $ | 1,218 | |
Deferred income tax liabilities: |
|
|
| ||||
Depreciation and amortization | $ | (598 | ) |
| $ | (871 | ) |
Undistributed earnings | (81 | ) |
| (50 | ) | ||
Other | (3 | ) |
| (50 | ) | ||
Total deferred income tax liabilities | $ | (682 | ) |
| $ | (971 | ) |
Net deferred income tax assets | $ | 236 | |
| $ | 247 | |
Reported as: |
|
|
| ||||
Noncurrent assets-Other | $ | 283 | |
| $ | 302 | |
Noncurrent liabilities-Other liabilities | (47 | ) |
| (55 | ) | ||
Total | $ | 236 | |
| $ | 247 | |
Accrued interest and penalties were $60 and $34 on December 31, 2017 and 2016 , which were reported in current and non-current accrued expenses and other liabilities.
Net operating loss carryforwards totaling $219 on December 31, 2017 are available to reduce future taxable earnings of certain domestic and foreign subsidiaries. United States loss carryforwards of $106 expire through 2028. International loss carryforwards of $113 began to expire in 2017 ; however, some have no expiration. Of these carryforwards, $36 are subject to a full valuation allowance. We also have a tax credit carryforward of $43 with $40 being subject to a full valuation allowance. The credits with a full valuation allowance have no expiration; however, we do not anticipate generating income tax in excess of the credits in the foreseeable future.
We recorded a transition tax on undistributed foreign earnings as required by the Act. No other provision was made for income taxes that may result from future remittances of the undistributed earnings of foreign subsidiaries that are determined to be indefinitely reinvested, which were $8,484 on December 31, 2017 . Determination of the total amount of unrecognized deferred income tax on undistributed earnings of foreign subsidiaries is not practicable.
Uncertain Income Tax Positions | |||||||
| 2017 |
| 2016 | ||||
Beginning uncertain tax positions | $ | 287 | |
| $ | 313 | |
Increases related to current year income tax positions | 123 | |
| 47 | | ||
Increases related to prior year income tax positions | 131 | |
| 22 | | ||
Decreases related to prior year income tax positions: |
|
|
| ||||
Settlements and resolutions of income tax audits | (9 | ) |
| (82 | ) | ||
Statute of limitations expirations | (4 | ) |
| (9 | ) | ||
Foreign currency translation | 12 | |
| (4 | ) | ||
Ending uncertain tax positions | $ | 540 | |
| $ | 287 | |
Reported as: |
|
|
| ||||
Noncurrent liabilities-Income taxes | 540 | |
| 287 | | ||
Total | $ | 540 | |
| $ | 287 | |
Our income tax expense would have been reduced by $232 and $209 on December 31, 2017 and 2016 had these uncertain income tax positions been favorably resolved. It is reasonably possible that the amount of unrecognized tax benefits will significantly change due to one or more of the following events in the next twelve months: expiring statutes, audit activity, tax payments, competent authority proceedings related to transfer pricing or final decisions in matters
that are the subject of controversy in various taxing jurisdictions in which we operate, including inventory transfer pricing, cost sharing, product royalty and foreign branch arrangements. We are not able to reasonably estimate the amount or the future periods in which changes in unrecognized tax benefits may be resolved. Interest and penalties incurred associated with uncertain tax positions are included in other income (expense), net.
In the normal course of business, income tax authorities in various income tax jurisdictions both within the United States and internationally conduct routine audits of our income tax returns filed in prior years. These audits are generally designed to determine if individual income tax authorities are in agreement with our interpretations of complex income tax regulations regarding the allocation of income to the various income tax jurisdictions. Income tax years are open from 2012 through the current year for the United States federal jurisdiction. Income tax years open for our other major jurisdictions range from 2005 through the current year.
NOTE 11 - RETIREMENT PLANS
Defined Contribution Plans
We provide certain employees with defined contribution plans and other types of retirement plans. A portion of our retirement plan expense under the defined contribution plans is funded with Stryker common stock. The use of Stryker common stock represents a non-cash operating activity that is not reflected in our Consolidated Statements of Cash Flows.
| 2017 |
| 2016 |
| 2015 | ||||||
Plan expense | $ | 181 | |
| $ | 166 | |
| $ | 148 | |
Expense funded with Stryker common stock | 25 | |
| 22 | |
| 20 | | |||
Stryker common stock held by plan: |
|
|
|
|
| ||||||
Dollar amount | 353 | |
| 272 | |
| 203 | | |||
Shares (in millions) | 2.3 | |
| 2.3 | |
| 2.2 | | |||
Value as a percentage of total plan assets | 11 | % |
| 11 | % |
| 11 | % | |||
Defined Benefit Plans
Certain of our subsidiaries have both funded and unfunded defined benefit pension plans covering some or all of their employees. Substantially all of the defined benefit pension plans have projected benefit obligations in excess of plan assets.
Discount Rate
The discount rates were selected using a hypothetical portfolio of high quality bonds on December 31 that would provide the necessary cash flows to match our projected benefit payments. Effective January 1, 2017, in countries where it was possible, we elected to change the method to calculate the service cost and interest cost components of net periodic benefit costs for our defined benefit plans and will measure these costs by applying the specific spot rates along the yield curve of the projected cash flows for the respective plans. Our defined benefit plans previously utilized the yield curve approach to establish discount rates and we believe the new approach provides a more precise measurement of service and interest costs by improving the correlation between projected cash flows and the corresponding spot yield curve rates. The change does not affect the measurement of our total benefit obligations for those plans and is accounted for as a change in accounting estimate inseparable from a change in accounting principle, which is applied prospectively. The reductions in service and interest costs for 2017 associated with this change in estimate are nominal.
Expected Return on Plan Assets
The expected return on plan assets is determined by applying the target allocation in each asset category of plan investments to the anticipated return for each asset category based on historical and projected returns.
Dollar amounts in millions except per share amounts or as otherwise specified. | 29 |
STRYKER CORPORATION 2017 FORM 10-K
Components of Net Periodic Pension Cost | |||||||||||
Net periodic benefit cost: | 2017 |
| 2016 |
| 2015 | ||||||
Service cost | $ | (42 | ) |
| $ | (33 | ) |
| $ | (36 | ) |
Interest cost | (10 | ) |
| (11 | ) |
| (10 | ) | |||
Expected return on plan assets | 11 | |
| 10 | |
| 11 | | |||
Amortization of prior service credit | 1 | |
| 1 | |
| 1 | | |||
Recognized actuarial loss | (9 | ) |
| (9 | ) |
| (13 | ) | |||
Net periodic benefit cost | $ | (49 | ) |
| $ | (42 | ) |
| $ | (47 | ) |
Changes in assets and benefit obligations recognized in OCI: | |||||||||||
Net actuarial gain (loss) | $ | (25 | ) |
| $ | (26 | ) |
| $ | 26 | |
Recognized net actuarial loss | 9 | |
| 9 | |
| 13 | | |||
Prior service (credit) cost and transition amount | (1 | ) |
| (1 | ) |
| (1 | ) | |||
Total recognized in other comprehensive income (loss) | $ | (17 | ) |
| $ | (18 | ) |
| $ | 38 | |
Total recognized in net periodic benefit cost and OCI | $ | (66 | ) |
| $ | (60 | ) |
| $ | (9 | ) |
|
|
|
|
|
| ||||||
Weighted-average rates used to determine net periodic benefit cost: | |||||||||||
Discount rate | 1.8 | % |
| 2.1 | % |
| 2.0 | % | |||
Expected return on plan assets | 3.3 | % |
| 3.6 | % |
| 4.0 | % | |||
Rate of compensation increase | 2.8 | % |
| 2.3 | % |
| 2.9 | % | |||
Weighted-average discount rate used to determine projected benefit obligations | 1.8 | % |
| 1.8 | % |
| 2.1 | % | |||
Investment Strategy
The investment strategy for our defined benefit pension plans is to meet the liabilities of the plans as they fall due and to maximize the return on invested assets within appropriate risk tolerances.
| 2017 |
| 2016 | ||||
Fair value of plan assets | $ | 370 | |
| $ | 308 | |
Benefit obligations | (708 | ) |
| (588 | ) | ||
Funded status | $ | (338 | ) |
| $ | (280 | ) |
Reported as: |
|
|
| ||||
Current liabilities-accrued compensation | $ | (2 | ) |
| $ | (1 | ) |
Noncurrent liabilities-other liabilities | (336 | ) |
| (279 | ) | ||
Pre-tax amounts recognized in AOCI: |
|
|
| ||||
Unrecognized net actuarial loss | (189 | ) |
| (171 | ) | ||
Unrecognized prior service credit | 12 | |
| 11 | | ||
Total | $ | (177 | ) |
| $ | (160 | ) |
The estimated net actuarial loss for the defined benefit pension plans to be reclassified from AOCI into net periodic benefit cost is $9 in 2018 .The total estimated amortization of prior service credit and transition asset for the defined benefit pension plans to be reclassified from AOCI into net periodic benefit credit is $1 in 2018 .
Change in Benefit Obligations |
|
|
| ||||
| 2017 |
| 2016 | ||||
Beginning projected benefit obligations | $ | 588 | |
| $ | 529 | |
Service cost | 42 | |
| 33 | | ||
Interest cost | 10 | |
| 11 | | ||
Foreign exchange impact | 60 | |
| (18 | ) | ||
Employee contributions | 6 | |
| 6 | | ||
Actuarial losses | 19 | |
| 40 | | ||
Acquisition | - | |
| 7 | | ||
Benefits paid | (17 | ) |
| (20 | ) | ||
Ending projected benefit obligations | $ | 708 | |
| $ | 588 | |
Ending accumulated benefit obligations | $ | 675 | |
| $ | 560 | |
Change in Plan Assets |
|
|
| ||||
| 2017 |
| 2016 | ||||
Beginning fair value of plan assets | $ | 308 | |
| $ | 289 | |
Actual return | 21 | |
| 20 | | ||
Employer contributions | 23 | |
| 18 | | ||
Employee contributions | 6 | |
| 6 | | ||
Foreign exchange impact | 26 | |
| (9 | ) | ||
Acquisition | - | |
| 2 | | ||
Benefits paid | (14 | ) |
| (18 | ) | ||
Ending fair value of plan assets | $ | 370 | |
| $ | 308 | |
Allocation of Plan Assets | |||||||
| 2017 Target | 2017 Actual |
| 2016 Actual | |||
Equity securities | 26 | % | 28 | % |
| 28 | % |
Debt securities | 45 | | 45 | |
| 50 | |
Other | 29 | | 27 | |
| 22 | |
Total | 100 | % | 100 | % |
| 100 | % |
Valuation of Plan Assets | ||||||||||||
2017 | Level 1 | Level 2 | Level 3 | Total | ||||||||
Cash and cash equivalents | $ | 4 | | $ | - | | $ | - | | $ | 4 | |
Equity securities | 104 | | 17 | | - | | 121 | | ||||
Corporate debt securities | 33 | | 1 | | - | | 34 | | ||||
Other | 148 | | 14 | | 49 | | 211 | | ||||
Total | $ | 289 | | $ | 32 | | $ | 49 | | $ | 370 | |
2016 |
|
|
|
| ||||||||
Cash and cash equivalents | $ | 7 | | $ | - | | $ | - | | $ | 7 | |
Equity securities | 83 | | 17 | | - | | 100 | | ||||
Corporate debt securities | 127 | | - | | - | | 127 | | ||||
Other | 23 | | 13 | | 38 | | 74 | | ||||
Total | $ | 240 | | $ | 30 | | $ | 38 | | $ | 308 | |
Our Level 3 pension plan assets consist primarily of guaranteed investment contracts with insurance companies. The insurance contracts guarantee us principal repayment and a fixed rate of return. The $11 increase in Level 3 pension plan assets is primarily related to actual returns and acquired assets. We expect to contribute $24 to our defined benefit pension plans in 2018 .
Estimated Future Benefit Payments | |||||||||||||||||
2018 | 2019 | 2020 | 2021 | 2022 | 2023-2027 | ||||||||||||
$ | 18 | | $ | 17 | | $ | 17 | | $ | 17 | | $ | 17 | | $ | 101 | |
Dollar amounts in millions except per share amounts or as otherwise specified. | 30 |
STRYKER CORPORATION 2017 FORM 10-K
NOTE 12 - SUMMARY OF QUARTERLY DATA (UNAUDITED)
2017 Quarter | Mar 31 | Jun 30 | Sep 30 | Dec 31 | ||||||||
Net sales | $ | 2,955 | | $ | 3,012 | | $ | 3,006 | | $ | 3,471 | |
Gross profit | 1,962 | | 1,990 | | 1,982 | | 2,239 | | ||||
Earnings before income taxes | 499 | | 444 | | 471 | | 649 | | ||||
Net earnings | 444 | | 391 | | 434 | | (249 | ) | ||||
Net earnings per share of common stock: |
|
| ||||||||||
Basic | $ | 1.19 | | $ | 1.04 | | $ | 1.16 | | $ | (0.66 | ) |
Diluted | $ | 1.17 | | $ | 1.03 | | $ | 1.14 | | $ | (0.66 | ) |
Market price of common stock: |
|
|
|
| ||||||||
High | $ | 133.59 | | $ | 145.62 | | $ | 148.84 | | $ | 160.62 | |
Low | $ | 116.50 | | $ | 129.82 | | $ | 137.70 | | $ | 141.68 | |
Dividends declared per share of common stock | $ | 0.425 | | $ | 0.425 | | $ | 0.425 | | $ | 0.47 | |
2016 Quarter | Mar 31 | Jun 30 | Sep 30 | Dec 31 | ||||||||
Net sales | $ | 2,495 | | $ | 2,840 | | $ | 2,833 | | $ | 3,157 | |
Gross profit | 1,694 | | 1,842 | | 1,873 | | 2,086 | | ||||
Earnings before income taxes | 481 | | 433 | | 419 | | 588 | | ||||
Net earnings | 402 | | 380 | | 355 | | 510 | | ||||
Net earnings per share of common stock: |
|
| ||||||||||
Basic | $ | 1.08 | | $ | 1.02 | | $ | 0.95 | | $ | 1.36 | |
Diluted | $ | 1.07 | | $ | 1.00 | | $ | 0.94 | | $ | 1.34 | |
Market price of common stock: |
|
|
|
| ||||||||
High | $ | 107.95 | | $ | 119.83 | | $ | 123.55 | | $ | 121.84 | |
Low | $ | 86.68 | | $ | 106.26 | | $ | 109.75 | | $ | 106.48 | |
Dividends declared per share of common stock | $ | 0.38 | | $ | 0.38 | | $ | 0.38 | | $ | 0.425 | |
NOTE 13 - SEGMENT AND GEOGRAPHIC DATA
We segregate our operations into three reportable business segments: Orthopaedics, MedSurg, and Neurotechnology and Spine.
The Corporate and Other category shown in the table below includes corporate and administration, corporate initiatives and share-based compensation, which includes compensation related to employee stock options, restricted stock units and performance stock unit grants and director stock options and restricted stock unit grants.
Segment Results |
|
|
| ||||||
| 2017 | 2016 | 2015 | ||||||
Orthopaedics | $ | 4,713 | | $ | 4,422 | | $ | 4,223 | |
MedSurg | 5,557 | | 4,894 | | 3,895 | | |||
Neurotechnology & Spine | 2,174 | | 2,009 | | 1,828 | | |||
Net sales | $ | 12,444 | | $ | 11,325 | | $ | 9,946 | |
Orthopaedics | $ | 337 | | $ | 317 | | $ | 290 | |
MedSurg | 315 | | 249 | | 117 | | |||
Neurotechnology & Spine | 142 | | 140 | | 132 | | |||
Segment depreciation and amortization | $ | 794 | | $ | 706 | | $ | 539 | |
Corporate and Other | 65 | | 46 | | 51 | | |||
Total depreciation and amortization | $ | 859 | | $ | 752 | | $ | 590 | |
Orthopaedics | $ | 1,669 | | $ | 1,597 | | $ | 1,487 | |
MedSurg | 1,225 | | 1,085 | | 822 | | |||
Neurotechnology & Spine | 639 | | 557 | | 474 | | |||
Segment operating income | $ | 3,533 | | $ | 3,239 | | $ | 2,783 | |
Items not allocated to segments: |
|
|
| ||||||
Corporate and Other | $ | (402 | ) | $ | (352 | ) | $ | (302 | ) |
Acquisition & integration-related charges | (64 | ) | (131 | ) | (35 | ) | |||
Amortization of intangible assets | (371 | ) | (319 | ) | (210 | ) | |||
Restructuring related-charges | (194 | ) | (125 | ) | (132 | ) | |||
Rejuvenate and related-charges | (173 | ) | (158 | ) | (296 | ) | |||
Regulatory and legal matters | (39 | ) | 12 | | 53 | | |||
Consolidated operating income | $ | 2,290 | | $ | 2,166 | | $ | 1,861 | |
Segment Assets and Capital Spending | |||||||||
Assets: | 2017 | 2016 | 2015 | ||||||
Orthopaedics | $ | 7,486 | | $ | 7,048 | | $ | 6,149 | |
MedSurg | 9,759 | | 8,553 | | 5,341 | | |||
Neurotechnology & Spine | 4,105 | | 4,129 | | 3,904 | | |||
Total segment assets | $ | 21,350 | | $ | 19,730 | | $ | 15,394 | |
Corporate and Other | 847 | | 705 | | 829 | | |||
Total assets | $ | 22,197 | | $ | 20,435 | | $ | 16,223 | |
Capital spending: |
|
|
| ||||||
Orthopaedics | $ | 138 | | $ | 153 | | $ | 95 | |
MedSurg | 194 | | 129 | | 89 | | |||
Neurotechnology & Spine | 50 | | 25 | | 28 | | |||
Total segment capital spending | $ | 382 | | $ | 307 | | $ | 212 | |
Corporate and Other | 216 | | 183 | | 58 | | |||
Total capital spending | $ | 598 | | $ | 490 | | $ | 270 | |
We measure the financial results of our reportable segments using an internal performance measure that excludes acquisition and integration-related charges, restructuring-related charges, reserves for certain product recall matters, reserves for certain legal and regulatory matters and a donation to an educational institution. Identifiable assets are those assets used exclusively in the operations of each business segment or allocated when used jointly. Corporate assets are principally cash and cash equivalents, marketable securities and property, plant and equipment.
The countries in which we have local revenue generating operations have been combined into the following geographic areas: the United States (including Puerto Rico); Europe, Middle East, Africa; Asia Pacific; and other foreign countries, which include Canada and countries in the Latin American region. Net sales are reported based off the geographic area of the Stryker location where the sales to the customer originated.
Geographic Information | ||||||||||||||||
| Net Sales |
| Net Property, Plant and Equipment | |||||||||||||
| 2017 | 2016 | 2015 |
| 2017 | 2016 | ||||||||||
United States | $ | 9,059 | | $ | 8,230 | | $ | 7,116 | |
| $ | 1,102 | | $ | 941 | |
Europe, Middle East, Africa | 1,567 | | 1,437 | | 1,267 | |
| 718 | | 493 | | |||||
Asia Pacific | 1,413 | | 1,325 | | 1,251 | |
| 107 | | 105 | | |||||
Other countries | 405 | | 333 | | 312 | |
| 48 | | 30 | | |||||
Total | $ | 12,444 | | $ | 11,325 | | $ | 9,946 | |
| $ | 1,975 | | $ | 1,569 | |
ITEM 9. | CHANGES IN AND DISAGREEMENTS WITH ACCOUNTANTS ON ACCOUNTING AND FINANCIAL DISCLOSURE. |
Not applicable.
ITEM 9A. | CONTROLS AND PROCEDURES. |
Evaluation of Disclosure Controls and Procedures
The Company's management, with the participation of the Chief Executive Officer and Chief Financial Officer (the Certifying Officers), evaluated the effectiveness of the Company's disclosure controls and procedures (as defined in Rules 13a-15(e) or 15d-15(e) promulgated under the Securities Exchange Act of 1934, as amended) (Exchange Act) at December 31, 2017 . Based on that evaluation, the Certifying Officers concluded that the Company's disclosure controls and procedures were effective as of December 31, 2017 .
Changes in Internal Control over Financial Reporting
There was no change to our internal control over financial reporting during the fourth quarter of 2017 that materially affected, or is reasonably likely to materially affect, our internal control over financial reporting.
Dollar amounts in millions except per share amounts or as otherwise specified. | 31 |
STRYKER CORPORATION 2017 FORM 10-K
MANAGEMENT'S REPORT ON INTERNAL CONTROL OVER FINANCIAL REPORTING
The Company's management is responsible for establishing and maintaining adequate internal control over financial reporting, as such term is defined in Exchange Act Rule 13a-15(f). The Company's internal control over financial reporting was designed to provide reasonable assurance to the Company's management and Board of Directors regarding the reliability of financial reporting and the preparation of financial statements for external purposes in accordance with generally accepted accounting principles and includes those policies and procedures that: (i) pertain to the maintenance of records that in reasonable detail accurately and fairly reflect the transactions and dispositions of the assets of the Company; (ii) provide reasonable assurance that transactions are recorded as necessary to permit preparation of financial statements in accordance with generally accepted accounting principles, and that receipts and expenditures of the Company are being made only in accordance with authorizations of management and directors of the Company; and (iii) provide reasonable assurance regarding prevention or timely detection of unauthorized acquisition, use or disposition of the Company's assets that could have a material effect on the financial statements.
The Company's management assessed the effectiveness of our internal control over financial reporting on December 31, 2017 . In making this assessment, we used the criteria set forth by the Committee of Sponsoring Organizations of the Treadway Commission in Internal Control-Integrated Framework (2013) . Based on this assessment, management concluded that our internal control over financial reporting was effective as of December 31, 2017 . The Company's management excluded NOVADAQ Technologies, Inc. (NOVADAQ) acquired on September 1, 2017 and VEXIM, acquired on October 24, 2017, from its evaluation of internal control over financial reporting as of December 31, 2017 . As of December 31, 2017 NOVADAQ and VEXIM represented approximately 4.2% of our consolidated total assets and a de minimus percentage of our consolidated net sales for 2017.
REPORT OF INDEPENDENT REGISTERED PUBLIC ACCOUNTING FIRM
To the Shareholders and the Board of Directors of Stryker Corporation
Opinion on Internal Control over Financial Reporting
We have audited Stryker Corporation and subsidiaries' internal control over financial reporting as of December 31, 2017, based on criteria established in Internal Control-Integrated Framework issued by the Committee of Sponsoring Organizations of the Treadway Commission (2013 framework) (the COSO criteria). In our opinion, Stryker Corporation and subsidiaries (the Company) maintained, in all material respects, effective internal control over financial reporting as of December 31, 2017, based on the COSO criteria.
As indicated in the accompanying Management's Report on Internal Control Over Financial Reporting, management's assessment of and conclusion on the effectiveness of internal control over financial reporting did not include the internal controls of NOVADAQ and VEXIM which are included in the December 31, 2017 consolidated financial statements of the Company and constituted 4.2% and 0.2% of total assets and net sales, respectively, as of, and for the year-ended, December 31, 2017. Our audit of internal control over financial reporting of the Company also did not include an evaluation of the internal control over financial reporting of NOVADAQ and VEXIM.
We also have audited, in accordance with the standards of the Public Company Accounting Oversight Board (United States)
(PCAOB), the consolidated balance sheets of Stryker Corporation and subsidiaries as of December 31, 2017 and 2016, the related consolidated statements of earnings and comprehensive income, shareholder's equity, and cash flows, for each of the three years in the period ended December 31, 2017, and the related notes and the financial statement schedule listed in the Index at Item 15(a) of the Company and our report dated February 8, 2018 expressed an unqualified opinion thereon.
Basis for Opinion
The Company's management is responsible for maintaining effective internal control over financial reporting and for its assessment of the effectiveness of internal control over financial reporting included in the accompanying Management's Report on Internal Control Over Financial Reporting. Our responsibility is to express an opinion on the Company's internal control over financial reporting based on our audit. We are a public accounting firm registered with the PCAOB and are required to be independent with respect to the Company in accordance with the U.S. federal securities laws and the applicable rules and regulations of the Securities and Exchange Commission and the PCAOB.
We conducted our audit in accordance with the standards of the PCAOB. Those standards require that we plan and perform the audit to obtain reasonable assurance about whether effective internal control over financial reporting was maintained in all material respects.
Our audit included obtaining an understanding of internal control over financial reporting, assessing the risk that a material weakness exists, testing and evaluating the design and operating effectiveness of internal control based on the assessed risk, and performing such other procedures as we considered necessary in the circumstances. We believe that our audit provides a reasonable basis for our opinion.
Definition and Limitations of Internal Control Over Financial Reporting
A company's internal control over financial reporting is a process designed to provide reasonable assurance regarding the reliability of financial reporting and the preparation of financial statements for external purposes in accordance with generally accepted accounting principles. A company's internal control over financial reporting includes those policies and procedures that (1) pertain to the maintenance of records that, in reasonable detail, accurately and fairly reflect the transactions and dispositions of the assets of the company; (2) provide reasonable assurance that transactions are recorded as necessary to permit preparation of financial statements in accordance with generally accepted accounting principles, and that receipts and expenditures of the company are being made only in accordance with authorizations of management and directors of the company; and (3) provide reasonable assurance regarding prevention or timely detection of unauthorized acquisition, use, or disposition of the company's assets that could have a material effect on the financial statements.
Because of its inherent limitations, internal control over financial reporting may not prevent or detect misstatements. Also, projections of any evaluation of effectiveness to future periods are subject to the risk that controls may become inadequate because of changes in conditions, or that the degree of compliance with the policies or procedures may deteriorate.
/s/ ERNST & YOUNG LLP
Grand Rapids, Michigan
February 8, 2018
Dollar amounts in millions except per share amounts or as otherwise specified. | 32 |
ITEM 9B. | OTHER INFORMATION. |
Not applicable.
PART III |
ITEM 10. | DIRECTORS, EXECUTIVE OFFICERS AND CORPORATE GOVERNANCE. |
Information regarding our executive officers appears under the caption "Executive Officers" in Part I, Item 1 of this report.
Information regarding our directors and certain corporate governance and other matters appearing under the captions "Information About the Board of Directors and Corporate Governance Matters," "Proposal 1-Election of Directors," and "Additional Information-Section 16(a) Beneficial Ownership Reporting Compliance" in the 2018 proxy statement is incorporated herein by reference.
The Corporate Governance Guidelines adopted by our Board of Directors, as well as the charters of each of the Audit Committee, the Governance and Nominating Committee and the Compensation Committee and the Code of Ethics applicable to the principal executive officer, principal financial officer and principal accounting officer or controller or persons performing similar functions are posted on the "Investors-Corporate Governance" section of our website at www.stryker.com .
ITEM 11. | EXECUTIVE COMPENSATION. |
Information regarding the compensation of our management appearing under the captions "Compensation Discussion and Analysis," "Compensation Committee Report," "Executive Compensation" and "Compensation of Directors" in the 2018 proxy statement is incorporated herein by reference.
ITEM 12. | SECURITY OWNERSHIP OF CERTAIN BENEFICIAL OWNERS AND MANAGEMENT AND RELATED STOCKHOLDER MATTERS. |
The information under the caption "Stock Ownership" in the 2018 proxy statement is incorporated herein by reference.
On December 31, 2017 we had an equity compensation plan under which options were granted at a price not less than fair market value at the date of grant and under which awards of restricted stock units (RSUs) and performance stock units (PSUs) were made. Options and RSUs were also awarded under a previous plan. Additional information regarding our equity compensation plans appears in Note 1 and Note 8 to our Consolidated Financial Statements. On December 31, 2017 we also had a stock performance incentive award program pursuant to which shares of our common stock were and may be issued to certain employees with respect to performance. The status of these plans, each of which were previously submitted to and approved by our shareholders, on December 31, 2017 is as follows:
Plan | Number of | Weighted-average exercise price of outstanding | Number of securities remaining available for future issuance under equity compensation | ||||
1998 Stock Option Plan | 342,030 | | $ | 67.80 | | - | |
2006 Long-Term Incentive Plan | 5,200,126 | | $ | 55.77 | | - | |
2008 Employee Stock Purchase Plan | N/A | N/A | 4,918,415 | | |||
2011 Long-Term Incentive Plan (1) | 10,392,780 | | $ | 88.21 | | 36,624,093 | |
2011 Performance Incentive Award Plan | N/A | N/A | 349,129 | | |||
Total | | | 41,891,637.0 | | |||
(1) The 2011 Long-Term Incentive Plan securities to be issued upon exercise includes 954,574 RSUs and 288,608 PSUs. The weighted average exercise prices does not take these awards into account.
ITEM 13. | CERTAIN RELATIONSHIPS AND RELATED TRANSACTIONS, AND DIRECTOR INDEPENDENCE. |
The information under the caption "Information About the Board of Directors and Corporate Governance Matters-Independent Directors" and "Information About the Board of Directors and Corporate Governance Matters-Certain Relationships and Related Party Transactions" in the 2018 proxy statement is incorporated herein by reference.
ITEM 14. | PRINCIPAL ACCOUNTING FEES AND SERVICES. |
The information under the caption "Proposal 2-Ratification of Appointment of Our Independent Registered Public Accounting Firm" in the 2018 proxy statement is incorporated herein by reference.
Dollar amounts in millions except per share amounts or as otherwise specified. | 33 |
STRYKER CORPORATION 2017 FORM 10-K
|
PART IV |
ITEM 15. | EXHIBITS, FINANCIAL STATEMENT SCHEDULES. |
(a) 1. | Financial Statements |
|
|
|
|
|
|
|
|
|
| ||||||||||
| The following Consolidated Financial Statements are set forth in Part II, Item 8 of this report. |
|
| ||||||||||||||||||
| Report of Independent Registered Public Accounting Firm |
| 16 | | |||||||||||||||||
| Consolidated Statements of Earnings for 2017, 2016, and 2015 |
| 17 | | |||||||||||||||||
| Consolidated Statements of Comprehensive Income for 2017, 2016, and 2015 |
| 17 | | |||||||||||||||||
| Consolidated Balance Sheets on 2017 and 2016 |
| 18 | | |||||||||||||||||
| Consolidated Statements of Shareholders' Equity for 2017, 2016, and 2015 |
| 19 | | |||||||||||||||||
| Consolidated Statements of Cash Flows for 2017, 2016, and 2015 |
| 20 | | |||||||||||||||||
| Notes to Consolidated Financial Statements |
| 21 | | |||||||||||||||||
|
| ||||||||||||||||||||
(a) 2. | Financial Statement Schedules | ||||||||||||||||||||
| The Consolidated Financial Statement schedule of Stryker Corporation and its subsidiaries is: | ||||||||||||||||||||
| SCHEDULE II - VALUATION AND QUALIFYING ACCOUNTS | ||||||||||||||||||||
|
|
|
|
| Additions |
| Deductions |
|
| ||||||||||||
| Description |
| Balance at |
| Charged to |
| Uncollectible Amounts Written Off, Net of Recoveries |
| Effect of Changes in Foreign Currency Exchange Rates |
| Balance | ||||||||||
| DEDUCTED FROM ASSET ACCOUNTS |
|
|
|
|
|
|
|
|
|
| ||||||||||
| Allowance for Doubtful Accounts: |
|
|
|
|
|
|
|
|
|
| ||||||||||
| Year ended December 31, 2017 |
| $ | 56 | |
| $ | 15 | |
| $ | 14 | |
| $ | (2 | ) |
| $ | 59 | |
| Year ended December 31, 2016 |
| $ | 61 | |
| $ | 10 | |
| $ | 14 | |
| $ | 1 | |
| $ | 56 | |
| Year ended December 31, 2015 |
| $ | 59 | |
| $ | 21 | |
| $ | 15 | |
| $ | 4 | |
| $ | 61 | |
|
|
|
|
|
|
|
|
|
|
|
| ||||||||||
| All other schedules for which provision is made in the applicable accounting regulation of the U.S. Securities and Exchange Commission are not required under the related instructions or are inapplicable and, therefore, have been omitted. | ||||||||||||||||||||
(a) 3. | Exhibits |
|
|
|
|
|
|
|
|
|
| ||||||||||
Dollar amounts in millions except per share amounts or as otherwise specified. | 34 |
STRYKER CORPORATION 2017 FORM 10-K
FORM 10-K-ITEM 15(a) 3. AND ITEM 15(c)
STRYKER CORPORATION AND SUBSIDIARIES
EXHIBIT INDEX
Exhibit 2- |
| Plan of Acquisition, Reorganization, Arrangement, Liquidation or Succession |
(i) |
| Agreement, dated as of January 31, 2016, by and among Star Acquisition Sub Inc., Stryker Corporation, Sage Products Holdings II, LLC, Madison Dearborn Capital Partners VI-C, L.P., MDCP VI-C Sage Holdings, Inc., TG SP Holdings Corp., Madison Dearborn Partners VI-B, L.P., and MDP Sage Holdings, LLC. - Incorporated by reference to Exhibit 2(ii) to the Company's Form 10-K for the year ended December 31, 2015 (Commission File No. 000-09165). |
(ii) |
| Agreement and Plan of Merger, dated February 13, 2016, by and among Stryker Corporation, Computer Merger Sub Corp., Charger Holding Corp. and Bain Capital Partners, LP, solely in its capacity as the representative as set forth therein. - Incorporated by reference to Exhibit 2.1 to the Company's Form 8-K dated February 13, 2016 (Commission File No. 000-09615). |
|
|
|
Exhibit 3- |
| Articles of Incorporation and By-Laws |
(i) |
| Restated Articles of Incorporation - Incorporated by reference to Exhibit 3.1 to our Form 10-K for the year ended December 31, 2012 (Commission File No. 00-09165). |
(ii) |
| By-Laws - Incorporated by reference to Exhibit 3(ii) to our Form 8-K dated October 28, 2008 (Commission File No. 000-09165). |
|
| |
Exhibit 4- |
| Instruments defining the rights of security holders, including indentures-We agree to furnish to the Commission upon request a copy of each instrument pursuant to which long-term debt of Stryker Corporation and its subsidiaries not exceeding 10% of the total assets of Stryker Corporation and its consolidated subsidiaries is authorized. |
(i) |
| Credit Agreement, dated as of August 19, 2016, among Stryker Corporation and certain subsidiaries, as designated borrowers; the lenders party thereto; and Bank of America, N.A., as administrative agent-Incorporated by reference to Exhibit 4.1 to our 8-K dated August 19, 2016 (Commission File no. 000-09165). |
(ii) |
| Indenture, dated January 15, 2010, between Stryker Corporation and U.S. Bank National Association.-Incorporated by reference to Exhibit 4.1 to our Form 8-K dated January 15, 2010 (Commission File No. 000-09165). |
(iii) |
| Second Supplemental Indenture (including the form of 2020 note), dated January 15, 2010, between Stryker Corporation and U.S. Bank National Association.-Incorporated by reference to Exhibit 4.3 to our Form 8-K dated January 15, 2010 (Commission File No. 000-09165). |
(v) |
| Fourth Supplemental Indenture (including the form of 2018 note) dated March 25, 2013, between Stryker Corporation and U.S. Bank National Association.-Incorporated by reference to Exhibit 4.2 to our Form 8-K dated March 25, 2013 (Commission File No. 000-09165). |
(vi) |
| Fifth Supplemental Indenture (including the form of 2043 note) dated March 25, 2013, between Stryker Corporation and U.S. Bank National Association.-Incorporated by reference to Exhibit 4.3 to our Form 8-K dated March 25, 2013 (Commission File No. 000-09165). |
(vii) |
| Sixth Supplemental Indenture (including the form of 2024 note), dated May 1, 2014, between Stryker Corporation and U.S. Bank National Association.-Incorporated by reference to Exhibit 4.2 to the Company's Form 8-K dated May 1, 2014 (Commission File No. 000-09165). |
(viii) |
| Seventh Supplemental Indenture (including the form of 2044 note), dated May 1, 2014, between Stryker Corporation and U.S. Bank National Association.-Incorporated by reference to Exhibit 4.3 to the Company's Form 8-K dated May 1, 2014 (Commission File No. 000-09165). |
(ix) |
| Eighth Supplemental Indenture (including the form of 2025 note), dated October 29, 2015, between Stryker Corporation and U.S. Bank National association.-Incorporated by reference to Exhibit 4.2 to the Company's Form 8-K dated October 29, 2015 (Commission File No. 000-09165). |
(x) |
| Ninth Supplemental Indenture (including the form of the note), dated March 10, 2016, between Stryker Corporation and U.S. Bank National Association. - Incorporated by reference to Exhibit 4.2 to the Company's Form 8-K dated March 10, 2016 (Commission File No. 000-09615). |
(xi) |
| Tenth Supplemental Indenture (including the form of the note), dated March 10, 2016, between Stryker Corporation and U.S. Bank National Association. - Incorporated by reference to Exhibit 4.3 to the Company's Form 8-K dated March 10, 2016 (Commission File No. 000-09615). |
(xii) |
| Eleventh Supplemental Indenture (including the form of the note), dated March 10, 2016, between Stryker Corporation and U.S. Bank National Association.- Incorporated by reference to Exhibit 4.4 to the Company's Form 8-K dated March 10, 2016 (Commission File No. 000-09615). |
(xiii) |
| Twelfth Supplemental Indenture (including the form of the note), dated March 10, 2016, between Stryker Corporation and U.S. Bank National Association. - Incorporated by reference to Exhibit 4.5 to the Company's Form 8-K dated March 10, 2016 (Commission File No. 000-09615). |
(xiv) |
| Thirteenth Supplemental Indenture (including the form of the note), dated January 18, 2017, between Stryker Corporation and U.S. Bank National Association. - Incorporated by reference to Exhibit 4.2 to the Company's Form 8-K dated January 12, 2017 (Commission File No. 000-09615). |
|
|
|
Exhibit 10- |
| Material contracts |
(i)* | † | 2011 Long-Term Incentive Plan (as amended effective February 6, 2018). |
(ii)* | † | Form of grant notice and terms and conditions for stock options granted in 2018 under the 2011 Long-Term Incentive Plan. |
(iii)* | † | Form of grant notice and terms and conditions for restricted stock units granted in 2018 under the 2011 Long-Term Incentive Plan. |
(iv)* | † | Form of grant notice and terms and conditions for performance stock units granted in 2018 under the 2011 Long-Term Incentive Plan. |
(v)* |
| 2006 Long-Term Incentive Plan (as amended effective February 7, 2017)- Incorporated by reference to Exhibit 10(ii) to our Form 10-K for the year ended December 31, 2016 (Commission File No. 000-09165). |
(vi)* |
| 1998 Stock Option Plan (as amended February 7, 2017)- Incorporated by reference to Exhibit 10(iii) to our Form 10-K for the year ended December 31, 2016 (Commission File No. 000-09165). |
(vii)* |
| Form of grant notice and terms and conditions for stock options granted in 2017 under the 2011 Long-Term Incentive Plan- Incorporated by reference to Exhibit 10(iv) to our Form 10-K for the year ended December 31, 2016 (Commission File No. 000-09165). |
| 35 |
STRYKER CORPORATION 2017 FORM 10-K
(viii)* |
| Form of grant notice and terms and conditions for restricted stock units granted in 2017 under the 2011 Long-Term Incentive Plan- Incorporated by reference to Exhibit 10(v) to our Form 10-K for the year ended December 31, 2016 (Commission File No. 000-09165). |
(ix)* |
| Form of grant notice and terms and conditions for performance stock units granted in 2017 under the 2011 Long-Term Incentive Plan- Incorporated by reference to Exhibit 10(vi) to our Form 10-K for the year ended December 31, 2016 (Commission File No. 000-09165). |
(x)* |
| Form of grant notice and terms and conditions for stock options and restricted stock units granted in 2017 under the 2011 Long-Term Incentive Plan to non-employee directors- Incorporated by reference to Exhibit 10(vi) to our Form 10-K for the year ended December 31, 2016 (Commission File No. 000-09165). |
(xi)* |
| Form of grant notice and terms and conditions for stock options granted in 2016 under the 2011 Long-Term Incentive Plan-Incorporated by reference to Exhibit 10(iii) to our Form 10-K for the year ended December 31, 2015 (Commission File No. 000-09165). |
(xii)* |
| Form of grant notice and terms and conditions for restricted stock units granted in 2016 under the 2011 Long-Term Incentive Plan-Incorporated by reference to Exhibit 10(iv) to our Form 10-K for the year ended December 31, 2015 (Commission File No. 000-09165). |
(xiii)* |
| Form of grant notice and terms and conditions for performance stock units granted in 2016 under the 2011 Long-Term Incentive Plan-Incorporated by reference to Exhibit 10(v) to our Form 10-K for the year ended December 31, 2015 (Commission File No. 000-09165). |
(xiv)* |
| Form of grant notice and terms and conditions for stock options and restricted stock units granted in 2016 under the 2011 Long-Term Incentive Plan to non-employee directors-Incorporated by reference to Exhibit 10(vi) to our Form 10-K for the year ended December 31, 2015 (Commission File No. 000-09165). |
(xv)* |
| Form of grant notice and terms and conditions for stock options granted in 2015 under the 2011 Long-Term Incentive Plan-Incorporated by reference to Exhibit 10(iii) to our Form 10-K for the year ended December 31, 2014 (Commission File No. 000-09165). |
(xvi)* |
| Form of grant notice and terms and conditions for restricted stock units granted in 2015 under the 2011 Long-Term Incentive Plan-Incorporated by reference to Exhibit 10(iv) to our Form 10-K for the year ended December 31, 2014 (Commission File No. 000-09165). |
(xvii)* |
| Form of grant notice and terms and conditions for performance stock units granted in 2015 under the 2011 Long-Term Incentive Plan-Incorporated by reference to Exhibit 10(v) to our Form 10-K for the year ended December 31, 2014 (Commission File No. 000-09165). |
(xviii)* |
| Form of grant notice and terms and conditions for stock options and restricted stock units granted in 2015 under the 2011 Long-Term Incentive Plan to non-employee directors.-Incorporated by reference to Exhibit 10.vi to our Form 10-K for the year ended December 31, 2014 (Commission File No. 000-09165). |
(xix)* |
| Supplemental Savings and Retirement Plan (as amended effective January 1, 1995)-Incorporated by reference to Exhibit 10(iii) to our Form 10-K for the year ended December 31, 1994 (Commission File No.000-09165). |
(xx)* |
| Stryker Corporation Executive Bonus Plan-Incorporated by reference to Exhibit 10.1 to our Form 8-K dated February 21, 2007 (Commission File No. 000-09165). |
(xxi) |
| Form of Indemnification Agreement for Directors-Incorporated by reference to Exhibit 10 (xiv) to our Form 10-K for the year ended December 31, 2008 (Commission File No. 000-09165). |
(xxii) |
| Form of Indemnification Agreement for Certain Officers-Incorporated by reference to Exhibit 10 (xv) to our Form 10-K for the year ended December 31, 2008 (Commission File No. 000-09165). |
(xxiii) |
| Settlement Agreement between Howmedica Osteonics Corp. and the counsel listed on the signature pages thereto, dated as of November 3, 2014 (Rejuvenate and ABF II Hip Implant Products Liability Litigation)- Incorporated by reference to Exhibit 10xxiii to our Form 10-K for the year ended December 31, 2014 (Commission File No. 000-09165). |
(xxiv)* |
| Letter Agreement between Stryker Corporation and William Jellison - Incorporated by reference to Exhibit 10.1 of our Current Report on Form 8-K filed with the SEC on April 11, 2013 (Commission File No. 000-09165). |
(xxv)* |
| Separation Agreement and Release between Ramesh Subrahmanian and Stryker Corporation, dated as of September 16, 2015-Incorporated by reference to Exhibit 10.1 to our Form 8-K dated September 13, 2015 (Commission File No. 000-09165). |
(xxvi)* |
| Transition Agreement between Stryker Corporation and William R. Jellison - Incorporated by reference to Exhibit 10.1 to the Company's Form 8-K dated January 22, 2016 (Commission File No. 000-09165). |
(xxvii)* |
| Letter Agreement between Stryker Corporation and Glenn Boehnlein - Incorporated by reference to Exhibit 10.2 to the Company's Form 8-K dated January 22, 2016 (Commission File No. 000-09165). |
|
|
|
Exhibit 11- |
| Statement re: computation of per share earnings |
(i) |
| Consolidated Statement of Earnings in Item 8 of this report. |
|
| |
Exhibit 21- |
| Subsidiaries of the registrant |
(i) | † | List of Subsidiaries. |
|
| |
Exhibit 23- |
| Consent of experts and counsel |
(i) | † | Consent of Independent Registered Public Accounting Firm. |
| 36 |
STRYKER CORPORATION 2017 FORM 10-K
Exhibit 31- |
| Rule 13a-14(a) Certifications |
(i) | † | Certification by Principal Executive Officer of Stryker Corporation. |
(ii) | † | Certification by Principal Financial Officer of Stryker Corporation. |
|
| |
Exhibit 32- |
| 18 U.S.C. Section 1350 Certifications |
(i) | † | Certification by Principal Executive Officer of Stryker Corporation. |
(ii) | † | Certification by Principal Financial Officer of Stryker Corporation. |
|
|
|
Exhibit 101- |
| XBRL (Extensible Business Reporting Language) Documents |
101.INS |
| XBRL Instance Document |
101.SCH |
| XBRL Schema Document |
101.CAL |
| XBRL Calculation Linkbase Document |
101.DEF |
| XBRL Definition Linkbase Document |
101.LAB |
| XBRL Label Linkbase Document |
101.PRE |
| XBRL Presentation Linkbase Document |
* | Compensation arrangement |
† | Furnished with this Form 10-K |
© | Schedules have been omitted pursuant to Item 601(b)(2) of Regulation S-K. Stryker hereby agrees to furnish supplementally a copy of any omitted schedule upon request by the U.S. Securities and Exchange Commission. |
ITEM 16. | FORM 10-K SUMMARY. |
None.
| 37 |
STRYKER CORPORATION 2017 FORM 10-K
SIGNATURES
Pursuant to the requirements of Section 13 or 15(d) of the Securities Exchange Act of 1934, the registrant has duly caused this report to be signed on its behalf by the undersigned, thereunto duly authorized.
STRYKER CORPORATION
Date: February 8, 2018 /s/ GLENN S. BOEHNLEIN
Glenn S. Boehnlein
Vice President, Chief Financial Officer
Pursuant to the requirements of the Securities Exchange Act of 1934, this report has been signed below by the following persons on the date indicated above on behalf of the registrant and in the capacities indicated.
|
|
|
/s/ KEVIN A. LOBO |
| /s/ GLENN S. BOEHNLEIN |
Kevin A. Lobo |
| Glenn S. Boehnlein |
Chairman and Chief Executive Officer |
| Vice President, Chief Financial Officer |
(Principal Executive Officer) |
| (Principal Financial Officer) |
|
|
|
/s/ WILLIAM E. BERRY JR. |
|
|
William E. Berry, Jr. |
|
|
Vice President, Corporate Controller |
|
|
(Principal Accounting Officer) |
|
|
|
|
|
/s/ MARY K. BRAINERD |
| /s/ LOUISE L. FRANCESCONI |
Mary K. Brainerd |
| Louise L. Francesconi |
Director |
| Director |
|
|
|
/s/ HOWARD E. COX, JR. |
| /s/ ALLAN C. GOLSTON |
Howard E. Cox, Jr. |
| Allan C. Golston |
Director |
| Director |
|
|
|
/s/ SRIKANT M. DATAR |
| /s/ ANDREW K. SILVERNAIL |
Srikant M. Datar, Ph.D. |
| Andrew K. Silvernail |
Director |
| Director |
|
|
|
/s/ ROCH DOLIVEUX |
| /s/ RONDA E. STRYKER |
Roch Doliveux, DVM |
| Ronda E. Stryker |
Director |
| Director |
| 38 |