Table of Contents
UNITED STATES
SECURITIES AND EXCHANGE COMMISSION
Washington, D.C. 20549
_____________________________________________________________________________
FORM 10-K
_____________________________________________________________________________
(Mark One)
x | ANNUAL REPORT PURSUANT TO SECTION 13 OR 15(d) OF THE SECURITIES EXCHANGE ACT OF 1934 |
For the fiscal year ended November 30, 2015
OR
¨ | TRANSITION REPORT PURSUANT TO SECTION 13 OR 15(d) OF THE SECURITIES EXCHANGE ACT OF 1934 |
For the transition period from to
Commission File Number: 001-31892
_____________________________________________________________________________
SYNNEX CORPORATION
(Exact name of registrant as specified in its charter)
_____________________________________________________________________________
Delaware |
| 94-2703333 |
(State or other jurisdiction of incorporation or organization) |
| (IRS Employer Identification No.) |
|
|
|
44201 Nobel Drive Fremont, California |
| 94538 |
(Address of principal executive offices) |
| (Zip Code) |
(510) 656-3333
(Registrant's telephone number, including area code)
Securities registered pursuant to Section 12(b) of the Act:
Title of each classes: |
| Name of Stock Exchange on which registered: |
Common Stock, par value $0.001 per share |
| New York Stock Exchange |
Securities registered pursuant to Section 12(g) of the Act: None
Indicate by check mark if the registrant is a well-known seasoned issuer, as defined in Rule 405 of the Securities Act. Yes x No ¨
Indicate by check mark if the registrant is not required to file reports pursuant to Section 13 or Section 15(d) of the Act. Yes ¨ No x
Indicate by check mark whether the registrant (1) has filed all reports required to be filed by Section 13 or 15(d) of the Securities Exchange Act of 1934 during the preceding 12 months (or for such shorter period that the registrant was required to file such reports), and (2) has been subject to such filing requirements for the past 90 days. Yes x No ¨
Indicate by check mark whether the registrant has submitted electronically and posted on its corporate Web site, if any, every Interactive Data File required to be submitted and posted pursuant to Rule 405 of Regulation S-T (§232.405 of this chapter) during the preceding 12 months (or for such shorter period that the registrant was required to submit and post such files). Yes x No ¨
Indicate by check mark if disclosure of delinquent filers pursuant to Item 405 of Regulation S-K is not contained herein, and will not be contained, to the best of registrant's knowledge, in definitive proxy or information statements incorporated by reference in Part III of this Form 10-K or any amendment to this Form 10-K x
Indicate by check mark whether the registrant is a large accelerated filer, an accelerated filer, or a non-accelerated filer, or a smaller reporting company. See the definitions of "large accelerated filer," "accelerated filer" and "smaller reporting company" in Rule 12b-2 of the Exchange Act. (Check one).
Large accelerated filer x | Accelerated filer ¨ | Non-accelerated filer ¨ | Smaller reporting company ¨ |
|
Indicate by check mark whether the registrant is a shell company (as defined in Rule 12b-2 of the Exchange Act). Yes ¨ No x
The aggregate market value of Common Stock held by non-affiliates of the registrant (based upon the closing sale price on the New York Stock Exchange as of May 29, 2015, the last business day of the registrant's most recently completed second fiscal quarter) was $2,381,747,170 . Shares held by each executive officer, director and by each person who owns 10% or more of the outstanding Common Stock have been excluded in that such persons may be deemed to be affiliates. This determination of affiliate status is not necessarily a conclusive determination for other purposes.
As of January 20, 2016 , there were 39,682,824 shares of Common Stock, $0.001 per share par value, outstanding.
DOCUMENTS INCORPORATED BY REFERENCE
Items 10 (as to directors and Section 16(a) Beneficial Ownership Reporting Compliance), 11, 12 (as to Beneficial Ownership), 13 and 14 of Part III incorporate by reference information from the registrant's proxy statement to be filed with the Securities and Exchange Commission in connection with the solicitation of proxies for the registrant's 2016 Annual Meeting of Stockholders to be held on March 22, 2016.
Table of Contents
SYNNEX CORPORATION
TABLE OF CONTENTS
2015 FORM 10-K
|
|
|
|
| Page |
PART I | 1 | |
Item 1. | Business | 1 |
Item 1A. | Risk Factors | 8 |
Item 1B. | Unresolved Staff Comments | 20 |
Item 2. | Properties | 20 |
Item 3. | Legal Proceedings | 21 |
Item 4. | Mine Safety Disclosures | 21 |
|
| |
PART II | 22 | |
Item 5. | Market for Registrant's Common Equity, Related Stockholder Matters and Issuer Purchases of Equity Securities | 22 |
Item 6. | Selected Financial Data | 24 |
Item 7. | Management's Discussion and Analysis of Financial Condition and Results of Operations | 24 |
Item 7A. | Quantitative and Qualitative Disclosures about Market Risk | 40 |
Item 8. | Financial Statements and Supplementary Data | 42 |
Item 9. | Changes in and Disagreements with Accountants on Accounting and Financial Disclosure | 82 |
Item 9A. | Controls and Procedures | 82 |
Item 9B. | Other Information | 82 |
|
| |
PART III | 83 | |
Item 10. | Directors, Executive Officers and Corporate Governance | 83 |
Item 11. | Executive Compensation | 83 |
Item 12. | Security Ownership of Certain Beneficial Owners and Management and Related Stockholder Matters | 83 |
Item 13. | Certain Relationships and Related Transactions, and Director Independence | 83 |
Item 14. | Principal Accounting Fees and Services | 84 |
|
| |
PART IV | 84 | |
Item 15. | Exhibits and Financial Statement Schedules | 84 |
Table of Contents
PART I
When used in this Annual Report on Form 10-K (the "Report"), the words "believes," "plans," "estimates," "anticipates," "expects," "intends," "allows," "can," "may," "designed," "will," and similar expressions are intended to identify forward-looking statements. These are statements that relate to future periods and include statements about our business model and our services, our market strategy, including expansion of our product and service lines, our infrastructure, our investment in our information technology, or IT, systems, our employee hiring, impact of MiTAC Holdings Corporation, or MiTAC Holdings, ownership interest in us, our revenue, sources of revenue and operating results, our gross margins, inventory, competition, including with Synnex Technology International Corp., our future needs for additional financing, concentration of customers and suppliers, customer contract terms, adequacy of our facilities, our legal proceedings, our operations and trends related thereto, international operations, expansion of our operations and related effects, our strategic acquisitions and divestitures of businesses and assets, adequacy of our cash resources to meet our capital needs, our debt and financing arrangements, cash held by our foreign subsidiaries, our tax liabilities, adequacy of our disclosure controls and procedures, dependency on personnel, pricing pressures, impact of rules and regulations affecting public companies, impact of our pricing policies, impact of economic changes and changes to the market in which we compete, foreign currency and interest rate changes, our share repurchase and dividend program, impact of our accounting policies, and statements regarding our securitization program, term loans and revolving credit lines. Forward-looking statements are subject to risks and uncertainties that could cause actual results to differ materially from those projected. These risks and uncertainties include, but are not limited to, those risks discussed below, as well as the seasonality of the buying patterns of our customers, concentration of sales to large customers, dependence upon and trends in capital spending budgets in the IT and consumer electronics, or CE, industries, fluctuations in general economic conditions and risks set forth below under Part I, Item 1A, "Risk Factors." These forward-looking statements speak only as of the date hereof. We expressly disclaim any obligation or undertaking to release publicly any updates or revisions to any forward-looking statements contained herein to reflect any change in our expectations with regard thereto or any change in events, conditions or circumstances on which any such statement is based.
In the sections of this Report entitled "Business" and "Management's Discussion and Analysis of Financial Condition and Results of Operations," all references to "SYNNEX," "we," "us," "our" or the "Company" mean SYNNEX Corporation and its subsidiaries, except where it is made clear that the term means only the parent company or one of its segments.
SYNNEX, the SYNNEX Logo, CONCENTRIX, HYVE SOLUTIONS, NEW AGE ELECTRONICS, the NEW AGE ELECTRONICS Logo, JACK OF ALL GAMES, the JACK OF ALL GAMES Logo, and all other SYNNEX company, product and service names and slogans are trademarks or registered trademarks of SYNNEX Corporation. SYNNEX, the SYNNEX Logo, CONCENTRIX, and HYVE SOLUTIONS Reg. U.S. Pat. & Tm. Off. Other names and marks are the property of their respective owners.
Item 1. Business
We are a Fortune 500 corporation and a leading business process services company, offering a comprehensive range of services to resellers, retailers, original equipment manufacturers, or OEMs, financial and insurance institutions and several other industry verticals worldwide. Our primary business process services are wholesale IT integration and distribution and outsourcing services focused on end-to-end customer engagement strategy and process optimization that help to create improved business outcomes. We operate in two segments: Technology Solutions and Concentrix. Our Technology Solutions segment distributes peripherals, IT systems including data center server and storage solutions, system components, software, networking/communications/security equipment, consumer electronics, or CE, and complementary products. Within our Technology Solutions segment, we also provide systems design and integration solutions. Our Concentrix segment offers a portfolio of strategic solutions and end-to-end business services focused on customer engagement strategy, process optimization, technology innovation, front and back-office automation and business transformation to clients in ten identified industry verticals.
In our Technology Solutions segment, we purchase peripherals, IT systems, system components, software, networking/communications/security equipment, CE and complementary products from our suppliers and sell them to our reseller and retail customers. We perform a similar function for our distribution of licensed software products. We distribute more than 30,000 technology products (as measured by active SKUs) from more than 300 IT, CE and OEM suppliers to more than 20,000 resellers, system integrators, and retailers throughout the United States, Canada and Japan. Our reseller customers include value-added resellers, or VARs, corporate resellers, government resellers, system integrators, direct marketers, and national and regional retailers. We combine our core strengths in distribution with demand generation, supply chain management and design and integration solutions to help our customers achieve greater efficiencies in time to market, cost minimization, real-time linkages in the supply chain and after-market product support. We also provide comprehensive IT solutions in key vertical markets such as government and healthcare and we provide specialized service offerings that increase efficiencies in the areas of print management, renewals, networking, logistics services and supply chain management. Additionally, we provide our
1
Table of Contents
customers with systems design and integration solutions for data center servers, storage and networking solutions built specific to our customers' workloads and data center environments.
Our Technology Solutions business is characterized by low gross profit as a percentage of revenue, or gross margin, and low income from operations as a percentage of revenue, or operating margin. The market for IT and CE products is generally characterized by declining unit prices and short product life cycles. We set our sales price based on the market supply and demand characteristics for each particular product or bundle of products we distribute and services we provide.
In our Technology Solutions segment, we are highly dependent on the end-market demand for IT and CE products and services. This end-market demand is influenced by many factors including the introduction of new IT and CE products and software by OEMs, replacement cycles for existing IT and CE products, overall economic growth and general business activity. A difficult and challenging economic environment may also lead to consolidation or decline in the IT and CE industries and increased price-based competition.
In our Concentrix segment, we provide a comprehensive range of strategic services and solutions to enhance our clients' customer life cycles to acquire, support and renew customer relationships, to automate and optimize processes, to maximize the value of every customer interaction and to improve business outcomes. Our portfolio of services includes end-to-end process outsourcing to customers in various industry vertical markets delivered through omni-channels that include both voice and non-voice mediums and in more than 40 languages. Our portfolio of solutions and services support our clients and their customers globally.
Our Concentrix segment generates revenue from performing services that are generally tied to our clients' products and services and how they are received in the marketplace. Any shift in business or size of the market for our customers' products, any failure of technology or failure of acceptance of our customers' products in the market may impact our business. The employee turnover rate in this business and the risk of losing experienced employees is high. Higher turnover rates can increase costs and decrease operating efficiencies and productivity.
Financial information by segment is provided in our Consolidated Financial Statements included elsewhere in this Report.
As of November 30, 2015 , we had over 78,000 full-time and temporary employees worldwide. From a geographic perspective, approximately 74% , 72% , and 74% of our total revenue was from the United States for fiscal years 2015 , 2014 and 2013 , respectively. The revenue attributable to countries is based on the geographical locations from where products are delivered and from where customer service contracts are managed.
We have been in business since 1980 and are headquartered in Fremont, California. We have significant operations in North and South America, Asia-Pacific and Europe. We were originally incorporated in the State of California as COMPAC Microelectronics, Inc. in November 1980, and we changed our name to SYNNEX Information Technologies, Inc. in February 1994. We later reincorporated in the State of Delaware under the name of SYNNEX Corporation in October 2003.
Our Products and Suppliers
In our Technology Solutions segment, we distribute a broad line of IT products, including peripherals, IT systems, system components, software and networking equipment from more than 300 OEM suppliers, enabling us to offer comprehensive solutions to our reseller and retail customers. Our Technology Solutions segment represented 89% , 92% and 98% of our consolidated revenue for fiscal years 2015 , 2014 and 2013 , respectively.
For fiscal year 2015 , our product mix by category was in the following ranges:
Product Category: |
|
Peripherals | 28% - 32% |
IT Systems | 27% - 31% |
System Components and Integration Solutions | 20% - 24% |
Software | 10% - 14% |
Networking Equipment | 5% - 9% |
Our suppliers include leading peripherals, IT systems, system components, software, networking equipment and CE manufacturers. Our primary OEM suppliers are Asus Tek Computer Inc., HP Inc. (formerly Hewlett-Packard Company) ("HP"), Hewlett Packard Enterprise Company, Intel Corporation, Lenovo Group Ltd, Lexmark International Inc., Microsoft Corporation, Panasonic Corporation, Samsung Electronics Co. Ltd., Seagate Technologies LLC and Xerox Corporation.
2
Table of Contents
Our largest OEM supplier is HP. Revenue from the sale of products and services provided by HP represented approximately 25% , 25% and 31% of our consolidated revenue for fiscal years 2015 , 2014 and 2013 , respectively. As is typical with our OEM supplier agreements, our United States Business Development Partner Agreement with HP is short-term and may be terminated without cause upon short notice. In the event of any breach of the agreement by us, HP may terminate the agreement and we may be required to refund HP any discounts or program payments paid during the period we were in breach of the agreement and reimburse HP for reasonable attorneys' fees. In the event the agreement is terminated for cause or if we fail to perform our obligations under the agreement, our agreement with HP for the resale of products, support and services will automatically terminate upon such default or termination. If either party becomes insolvent or bankrupt, the other party may terminate the agreement without notice and cancel any unfulfilled obligations, except for payment obligations. Some of our subsidiaries also have territorial supplier agreements with subsidiaries of HP located in the respective countries.
We have distribution agreements with most of our suppliers, including HP. These agreements usually provide for nonexclusive distribution rights and pertain to specific geographic territories. The agreements are also generally short-term, subject to periodic renewal, and often contain provisions permitting termination by either our supplier or us without cause upon relatively short notice. An OEM supplier that elects to terminate a distribution agreement will generally repurchase its products carried in our inventory.
Our Technology Solutions business subjects us to the risk that the value of our inventory will be affected adversely by suppliers' price reductions or by technological changes affecting the usefulness or desirability of the products comprising our inventory. Many of our OEM suppliers offer us limited protection from the loss in value of our inventory due to technological change or a supplier's price reduction. Under many of these agreements, we have a limited period of time to return or exchange products or claim price protection credits. We monitor our inventory levels and attempt to time our purchases to maximize our protection under supplier programs.
Our Customers
In our Technology Solutions segment, we distribute IT products to more than 20,000 resellers, system integrators and retailers. Resellers are classified primarily by their end-user customers. End-users include large corporations or enterprises, federal, state and local governments, small/medium sized businesses, or SMBs, and individual consumers. In addition, resellers vary greatly in size and geographic reach. Our reseller customers buy from us and other distributors. Our larger reseller customers also buy certain products directly from OEM suppliers. System integrators offer services in addition to product resale, primarily in systems customization, integration, and deployment. Retailers serve mostly individual end-users and to a small degree, small office/home office customers. We also provide system design and integration solutions for data center servers and storage solutions built for our customers' data center environments.
In our Concentrix segment, we serve over 300 clients, primarily in ten industry verticals: automotive, banking & financial services, CE, government & public sector, healthcare & pharmaceuticals, insurance, media & communications, retail & e-commerce, travel transportation & tourism and technology.
In fiscal years 2015 , 2014 and 2013 , no customer accounted for 10% or more of our consolidated revenue.
Our Services and Solutions
We offer a variety of business process services to our customers. These services can be purchased individually or they can be purchased in combination with others in the form of supply chain solutions and after-market product support. The two major categories of services and solutions include Technology Solutions and Concentrix:
Technology Solutions. We have sophisticated pick, pack and ship operations, which allows us to efficiently receive shipments from our OEM suppliers and quickly fill orders for our reseller and retail customers. We generally stock or otherwise have access to the inventory of our OEM suppliers to satisfy the demands of our reseller and retail customers. In addition, we design and integrate energy efficient and cost effective data center servers and storage solutions which are built specific to the data center environments and actual workloads of our large scale data center customers.
The above services are complemented by the following:
Systems Design and Integration Solutions. We provide our customers with systems design and full rack integration solutions, build-to-order, and configure-to-order assembly capabilities. In both of these cases, we offer design, integration, test and other production value-added solutions such as thermal testing, power-draw efficiency testing, burn-in, quality and logistics support.
Logistics Services. We provide logistics support to our reseller customers such as outsourced fulfillment, virtual distribution and direct ship to end-users. Other logistics support activities we provide include generation of customized
3
Table of Contents
shipping documents, multi-level serial number tracking for customized, configured products and online order and shipment tracking. We also offer full turn-key logistics solutions designed to address the needs of large volume or specialty logistics services. Our full turn-key service offering is modular in nature and is designed to cover all aspects of the logistics life cycle including, transportation management, inventory optimization, complementary product matching, reverse logistics, asset refurbishment and disposal and strategic procurement.
Online Services. We maintain electronic data interchange, or EDI, extensible markup language or XML, web-based communication links and mobile applications with many of our reseller and retail customers. These links improve the speed and efficiency of our transactions with our customers by enabling them to search for products, check inventory availability and prices, configure systems, place and track orders, receive invoices, review account status and process returns. We also have web-based application software that allows our customers or their end-user customers to order software and take delivery online.
Financing Services. We offer our reseller customers a wide range of financing options, including net terms, third party leasing, floor plan financing and letters-of-credit backed financing and arrangements where we collect payments directly from the end-user. The availability and terms of our financing services are subject to our credit policies or those of third party financing providers to our customers.
Marketing Services. We offer our OEM suppliers a full range of marketing activities targeting resellers, system integrators and retailers including direct mail, external media advertising, reseller product training, targeted telemarketing campaigns, national and regional trade shows, trade groups, database analysis, print on demand services and web-based marketing.
Concentrix. Our Concentrix segment represented 11% of our consolidated revenue in fiscal year 2015 , 8% in fiscal year 2014 and 2% in fiscal year 2013 . We offer a portfolio of comprehensive solutions and end-to-end business services to enhance our clients' customer life cycles, to acquire, support and renew customer relationships, to automate and optimize processes, to maximize the value of every customer interaction, and to improve business outcomes, primarily in ten identified industry verticals. Our Concentrix segment portfolio also includes technology assets and embedded analytics. We operate approximately 90 delivery centers and administrative facilities in numerous countries throughout North and South America, Asia-Pacific and Europe. Services are provided from these global locations to customers worldwide in more than 40 languages.
Sales and Marketing
In our Technology Solutions segment, we serve our large commercial, government reseller, and retail customers through dedicated sales professionals. We market to smaller resellers and OEMs through dedicated regional sales teams. In addition, we have dedicated product management and business development specialists that focus on the sale and promotion of products and services of selected suppliers or for specific end-market verticals. These specialists are also directly involved in establishing new relationships with leading OEMs to create demand for their products and services and with resellers for their customers' needs. Our sales and marketing professionals are complemented by members of our executive management team who are integral in identifying potential new customer opportunities, promoting sales growth and ensuring customer satisfaction. We have sales and marketing professionals in close geographic proximity to our reseller, retail and OEM customers.
In our Concentrix segment, we market our services through a sales force organized by industry vertical and geography. The length of our selling cycle varies depending on the type of engagement. Our efforts may begin in response to our lead generation program, a perceived opportunity, a reference by an existing client, a request for proposal or otherwise. The sales cycle varies depending on the type of services work as well as whether there is an existing relationship with the client.
We have designated client partners or global relationship managers for each of our strategic relationships. The relationship manager is supported by process improvement, quality, transition, finance, human resources, information technology and industry/ subject matter expert teams to ensure the best possible solution is provided to our clients.
We also strive to foster relationships between our senior leadership team and our clients' senior management. These "C-level" relationships ensure that both parties are focused on establishing priorities, aligning objectives and driving client value from the top down. High-level executive relationships have been particularly constructive as a means of increasing business from our existing clients. It also provides us with a forum for addressing client concerns. We constantly measure our client satisfaction levels to ensure that we maintain high service levels for each client.
Our Operations
In our Technology Solutions segment, we operate approximately 40 distribution and administrative facilities in the United States, Canada, Japan, China and Mexico. Our distribution processes are highly automated to reduce errors, ensure timely order fulfillment and enhance the efficiency of our warehouse operations and back office administration. Our distribution facilities
4
Table of Contents
are geographically dispersed to be near reseller customers and their end-users. This decentralized, regional strategy enables us to benefit from lower shipping costs and shorter delivery lead times to our customers. Furthermore, we track several performance measurements to continuously improve the efficiency and accuracy of our distribution operations. Our regional locations also enable us to make local deliveries and provide will-call fulfillment to more customers than if our distribution operations were more centralized, resulting in better service to our customers. Our workforce is comprised of permanent and temporary employees, enabling us to respond to short-term changes in order activity.
Our proprietary IT systems and processes enable us to automate many of our distribution operations. We use radio frequency and bar code scanning technologies in all of our warehouse operations to maintain real-time inventory records, facilitate frequent cycle counts and improve the accuracy of order fulfillment.
To enhance the accuracy of our distribution order fulfillment and protect our inventory from shrinkage, our distribution systems also incorporate numerous controls. These controls include order weight checks, bar code scanning, and serial number profile verification. We also use digital video imaging to record our small package shipping activities by order. These images and other warehouse and shipping data are available online to our customer service representatives, enabling us to quickly respond to order inquiries by our customers.
We operate our principal system design and integration solutions facilities in the United States and we operate an integration facility in the United Kingdom. We generally design and integrate IT systems, data center servers, storage and networking solutions and IT appliances, by incorporating system components purchased directly from vendors or obtained from our distribution inventory. Additionally, we perform other production value-added services, including thermal testing, power-draw efficiency testing, burn-in, quality and logistics support. Our design and integration solutions facilities are ISO 9001:2008 and ISO 14001:2004 certified.
In our Concentrix segment, we operate approximately 90 delivery centers and administrative facilities in numerous countries throughout North and South America, Asia-Pacific and Europe. Services are provided from these global locations to customers worldwide in multiple languages. These services are supported by proprietary technology to enable efficient and secure customer contact through various methods including voice, chat, web, email, social media and digital print.
Concentrix has global delivery capability which allows us to scale people and other resources from around the world, including foreign language fluency, proximity to clients and time-zone advantages. A critical component of this capability are our approximately 90 delivery centers in 25 countries. Our delivery centers improve the efficiency of our engagement teams through the reuse of processes, solution designs and infrastructure by leveraging the experience of delivery center professionals.
International Operations
Approximately 26% of our total revenue for fiscal year 2015 , 28% for fiscal year 2014 and 26% for fiscal year 2013 , originated outside of the United States. Approximately 11% of our total revenue for fiscal year 2015 , 12% for fiscal year 2014 and 14% for fiscal year 2013 were generated in Canada. Approximately 8% of our total revenue for fiscal year 2015 and 10% for both fiscal years 2014 and 2013 were generated in Japan. During the fiscal years ended November 30, 2015 , 2014 and 2013 , no other country represented more than 10% of total revenue. A key element in our business strategy has been to locate our Concentrix services in markets that are cost beneficial, but low risk. Our end market strategy for our Technology Solutions business, while focused on North America, is expanded internationally on a selective basis in order to provide our distribution capabilities to OEMs in locations that meet their regional requirements.
Sales concentrations in foreign jurisdictions subject us to various risks, including the impact of changes in the value of these foreign currencies relative to the US Dollar, which in turn can impact reported sales.
Approximately 48% and 50% of our net property and equipment were located in the United States and approximately 11% and 13% of our net property and equipment were located in the Philippines as of November 30, 2015 and 2014, respectively. As of both November 30, 2015 and 2014, no other country represented more than 10% of our net property and equipment.
Seasonality
Our operating results in the Technology Solutions segment are affected by the seasonality of the IT and CE products industries. We have historically experienced higher sales in our fourth fiscal quarter due to patterns in capital budgeting, federal government spending and purchasing cycles of our customers and end-users. These patterns may not be repeated in subsequent periods.
5
Table of Contents
Our revenues in the Concentrix segment are typically higher in the third and fourth quarters than in other quarters, as a result of several factors. We generally find that demand for customer engagement services increases in the third and fourth quarter based on seasonal patterns in our clients' businesses. In addition, contracts for customer relationship engagements are often signed in the first and second quarters as clients begin new budget cycles. Volumes under such contracts then increase in the latter part of the year.
Purchasing
In our Technology Solutions segment, product cost represents our single largest expense and IT and CE product inventory is one of our largest working capital investments. Furthermore, product procurement from our OEM suppliers is a highly complex process that involves incentive programs, rebate programs, price protection, volume and early payment discounts and other arrangements. Consequently, efficient and effective purchasing operations are critical to our success.
Our purchasing group works closely with many areas of our organization, especially our product managers who work closely with our OEM suppliers and our sales force, to understand the volume and mix of IT products that should be purchased. In addition, the purchasing group utilizes an internally developed, proprietary information systems application tool that further aids in forecasting future product demand based on several factors, including historical sales levels, expected product life cycle and current and projected economic conditions. Our information system tool also tracks warehouse and channel inventory levels and open purchase orders on a real-time basis enabling us to stock inventory at a regional level closer to the customer as well as to actively manage our working capital resources. This level of automation promotes greater efficiencies of inventory management by replenishing and turning inventory, as well as placing purchase orders on a more frequent basis. Furthermore, our system tool also allows for automated checks and controls to prevent the generation of inaccurate orders.
Managing our OEM supplier incentive programs is another critical function of our purchasing and product management teams. We attempt to maximize the benefits of incentives, rebates and volume and early payment discounts that our OEM suppliers offer us from time to time. We carefully evaluate these supplier incentive benefits relative to our product handling and carrying costs so that we do not over-invest in our inventory. We also closely monitor inventory levels on a product-by-product basis and plan purchases to take advantage of OEM supplier provided price protection. By managing inventory levels and monitoring customer purchase patterns at each of our regional distribution facilities, we believe we can minimize our shipping costs by stocking products near our resellers and retailers, and their end-user customers.
Financial Services
In our Technology Solutions segment, we offer various financing options to our customers as well as prepayment, credit card and cash on delivery terms. In issuing credit terms to our reseller and retail customers, we closely and regularly monitor their creditworthiness through our information systems, credit ratings information and periodic detailed credit file reviews by our financial services staff. We have also purchased credit insurance in some geographies to further control credit risks. Finally, we establish reserves for estimated credit losses in the normal course of business based on the overall quality and aging of our accounts receivable portfolio, the existence of a limited amount of credit insurance and specifically identified customer risks.
We also sell to certain reseller customers pursuant to third party floor plan financing. The expenses charged by these financing companies are subsidized either by our OEM suppliers or paid by us. We generally receive payment from these financing companies within 15 to 30 days from the date of sale, depending on the specific arrangement.
Information Technology
Within our Technology Solutions segment, our IT systems manage the entire order cycle, including processing customer orders, customer billing and payment tracking. These internally developed IT systems make our operations more efficient and provide visibility into our operations. We believe our IT infrastructure is scalable to support further growth. We continue to enhance and invest in our IT systems to improve product and inventory management, streamline order and fulfillment processes, and increase operational flexibility. Within our Concentrix segment, we invest in IT systems and infrastructure to enhance workforce management and improve productivity.
To allow our customers and suppliers to communicate and transact business with us in an efficient and consistent manner, we have implemented a mix of proprietary and off-the-shelf software programs that integrate our IT systems with those of our customers and suppliers. In particular, we maintain EDI, XML, web-based communication links and mobile platform applications with many of our reseller and retail customers to enable them to search for products, check real-time pricing, inventory availability and specifications, place and track orders, receive invoices and process returns.
6
Table of Contents
Competition
We operate in a highly competitive global environment. The IT product industry is characterized by intense competition, based primarily on product availability, credit terms, price, speed and accuracy of delivery, effectiveness of sales and marketing programs, ability to tailor specific solutions to customer needs, quality and depth of product lines, pre and post-sale technical support, flexibility and timely response to design changes, technological capabilities and product quality, service and support. We compete with a variety of regional, national and international IT product distributors and manufacturers.
Our major competitors in our Technology Solutions segment include Arrow Electronics, Inc., Avnet, Inc., Ingram Micro, Inc., ScanSource, Inc., Tech Data Corporation and WestconGroup Inc. and, to a lesser extent, regional distributors. We also face competition from our OEM suppliers that sell directly to resellers, retailers and end-users. The distribution industry has historically undergone, and continues to undergo, consolidation. Over the years, a number of providers within the IT distribution industry exited or merged with other providers. We have participated in this consolidation through our acquisitions of Supercom Canada Limited, Marubeni Infotec Corporation, Jack of All Games and New Age Electronics, and we continue to evaluate other opportunities.
As we enter new business areas, we may encounter increased competition from our current competitors and/or new competitors. Some of our competitors are substantially larger and may have greater financial, operating, manufacturing and marketing resources than us. Some of our competitors may have broader geographic breadth and range of services than us. Some may have more developed relationships with their existing customers. We attempt to offset our comparative scale differences by focusing on a limited number of leading OEMs in the Technology Solutions segment, by running a more efficient and low cost operation, and by offering a high level of value-added and customer services in both the Technology Solutions and Concentrix segments.
In our Concentrix segment, we operate in a highly competitive and rapidly evolving global marketplace. Our competitors are both regional players as well as global companies. Our major competitors include Accenture, Convergys Corporation, Genpact Limited, SITEL Worldwide Corporation (a wholly-owned subsidiary of Groupe Acticall), Sutherland Global Services, Inc. (a privately owned company), Sykes Enterprises Inc., Teleperformance and TeleTech Holdings, Inc. In addition, a client or potential client may choose not to outsource its business, by setting up captive outsourcing operations or by performing formerly outsourced services for themselves.
We constantly seek to expand our business into areas primarily related to our core distribution and outsourced business services as well as other support, logistics and related value-added services.
Employees
As of November 30, 2015 , we had approximately 72,500 full-time employees. Given the variability in our business and the quick response time required by customers, it is critical that we are able to rapidly ramp-up and ramp-down our operational capabilities to maximize efficiency. As a result, we frequently use temporary or contract workers, who totaled approximately 6,000 , on a full-time equivalent basis, as of November 30, 2015 . Except for our employees in China, our employees are not represented by a labor union, nor are they covered by a collective bargaining agreement. We consider our employee relations to be good.
Available Information
Our website is http://www.synnex.com. We make available free of charge, on or through our website, our Annual Report on Form 10-K, quarterly reports on Form 10-Q, current reports on Form 8-K and amendments to those reports, if any, or other filings filed or furnished pursuant to Section 13(a) or 15(d) of the Exchange Act as soon as reasonably practicable after electronically filing or furnishing these reports with the Securities and Exchange Commission, or SEC. Information contained on our website is not a part of this Report. We have adopted a code of ethics applicable to our employees including our principal executive, financial and accounting officers, and it is available free of charge, on our website's investor relations page.
The SEC maintains an Internet site at http://www.sec.gov that contains our Annual Report on Form 10-K, quarterly reports on Form 10-Q, current reports on Form 8-K and amendments to those reports, if any, or other filings filed or furnished pursuant to Section 13(a) or 15(d) of the Exchange Act, and our proxy and information statements. All reports that we file with the SEC may be read and copied at the SEC's Public Reference Room at 100 F Street, N.E., Washington, DC, 20549. Information about the operation of the Public Reference Room can be obtained by calling the SEC at 1-800-SEC-0330.
7
Table of Contents
Item 1A. Risk Factors
The following are certain risk factors that could affect our business, financial results and results of operations. These risk factors should be considered in connection with evaluating the forward-looking statements contained in this Annual Report on Form 10-K because these factors could cause the actual results and conditions to differ materially from those projected in the forward-looking statements. Before you invest in our Company, you should know that making such an investment involves some risks, including the risks described below. The risks that have been highlighted here are not the only ones that we face. If any of the risks actually occur, our business, financial condition and results of operations could be negatively affected. In that case, the trading price of our common stock could decline, and you may lose all or part of your investment.
Risks Related to Our Business
We anticipate that our revenue and operating results will fluctuate, which could adversely affect the enterprise value of our Company and our securities.
Our operating results have fluctuated and will fluctuate in the future as a result of many factors, including:
• | the impact of the business acquisitions and dispositions we make; |
• | general economic conditions and level of IT and CE spending; |
• | the loss or consolidation of one or more of our significant OEM suppliers or customers; |
• | Consolidation of our Concentrix competitors including insourcing by clients; |
• | market acceptance, quality, pricing, availability and useful life of our products and services, as well as the mix of our products and services sold; |
• | competitive conditions in our industry; |
• | pricing, margin and other terms with our OEM suppliers; |
• | decline in inventory value as a result of product obsolescence and market acceptance; |
• | variations in our levels of excess inventory, vendor reserves and doubtful accounts; |
• | fluctuations in rates in the currencies in which we transact; |
• | changes in the terms of OEM supplier-inventory protections, such as price protection and return rights; and |
• | the expansion of our design and integration solutions sales and operations, globally. |
Although we attempt to control our expense levels, these levels are based, in part, on anticipated revenue. Therefore, we may not be able to control spending in a timely manner to compensate for any unexpected revenue shortfall.
Our operating results in the Technology Solutions segment also are affected by the seasonality of the IT and CE products and services industry. We have historically experienced higher sales in our fourth fiscal quarter due to patterns in the capital budgeting, federal government spending and purchasing cycles of end-users. Our revenues in the Concentrix segment are typically higher in the third and fourth quarters than in other quarters, as a result of several factors. We generally find that demand for customer engagement services increases in the third and fourth quarter based on seasonal patterns in our clients' businesses. In addition, contracts for customer relationship engagements are often signed in the first and second quarters as clients begin new budget cycles. Volumes under such contracts then increase in the latter part of the year. These patterns may not be repeated in subsequent periods. You should not rely on period-to-period comparisons of our operating results as an indication of future performance. In future years, our operating results may be below our expectations or those of our public market analysts or investors, which would likely cause our share price to decline.
In our Technology Solutions segment, we depend on a small number of OEMs to supply the IT and CE products and services that we sell and the loss of, or a material change in, our business relationship with a major OEM supplier, could adversely affect our business, financial position and operating results.
Our future success is highly dependent on our relationships with a small number of OEM suppliers. For example, sales of HP products and services comprised approximately 25% , 25% , and 31% of our total revenue for fiscal years 2015 , 2014 , and 2013 , respectively. Our OEM supplier agreements typically are short-term and may be terminated without cause upon short notice. The loss or deterioration of our relationship with HP or any other major OEM supplier, the authorization by OEM
8
Table of Contents
suppliers of additional distributors, the sale of products by OEM suppliers directly to our reseller and retail customers and end-users, or our failure to establish relationships with new OEM suppliers or to expand the distribution and supply chain services that we provide OEM suppliers could adversely affect our business, financial position and operating results. In addition, OEM suppliers may face liquidity or solvency issues that in turn could negatively affect our business and operating results.
Our business is also highly dependent on the terms provided by our OEM suppliers. Generally, each OEM supplier has the ability to change the terms and conditions of its distribution agreements, such as reducing the amount of price protection and return rights or reducing the level of purchase discounts, incentive rebates and marketing programs available to us.
From time to time we may conduct business with a supplier without a formal agreement because the agreement has expired or was otherwise terminated. In such case, we are subject to additional risk with respect to products, warranties and returns, and other terms and conditions. If we are unable to pass the impact of these changes through to our reseller and retail customers, our business, financial position and operating results could be adversely affected.
In our Technology Solutions segment our gross margins are low, which magnifies the impact of variations in gross margin, operating costs and bad debt on our operating results.
As a result of significant price competition in the IT and CE products and services industry, our gross margins are low, and we expect them to continue to be low in the future. Increased competition arising from industry consolidation and low demand for certain IT and CE products and services may hinder our ability to maintain or improve our gross margins. These low gross margins magnify the impact of variations in revenue, operating costs, inventory obsolescence and bad debt on our operating results. A portion of our operating expense is relatively fixed, and planned expenditures are based in part on anticipated orders that are forecasted with limited visibility of future demand. As a result, we may not be able to reduce our operating expense to sufficiently mitigate any further reductions in gross profit or margin in the future. If we cannot proportionately decrease our cost structure in response to competitive price pressures, our business and operating results could suffer.
We also receive purchase discounts and rebates from OEM suppliers based on various factors, including sales or purchase volume and breadth of customers. A decrease in net sales could negatively affect the level of volume rebates received from our OEM suppliers and thus, our gross margin. Because some rebates from OEM suppliers are based on percentage increases in sales of products, it may become more difficult for us to achieve the percentage growth in sales required for larger discounts due to the current size of our revenue base. A decrease or elimination of purchase discounts and rebates from our OEM suppliers would adversely affect our business and operating results.
We are subject to uncertainties and variability in demand by our Technology Solutions customers, which could decrease revenue and adversely affect our operating results.
In our Technology Solutions segment, we sell to our customers on a purchase order basis, rather than pursuant to long-term contracts or contracts with minimum purchase requirements. Consequently, our sales are subject to demand variability by our customers. The level and timing of orders placed by our customers vary for a variety of reasons, including seasonal buying by end-users, the introduction of new hardware and software technologies and general economic conditions. Customers submitting a purchase order may cancel, reduce or delay their orders. If we are unable to anticipate and respond to the demands of our reseller, retail and design and integration solutions customers, we may lose customers because we have an inadequate supply of products, or we may have excess inventory, either of which could harm our business, financial position and operating results.
With regard to our design and integration solutions customers, unique parts are purchased based both on purchase orders and forecasted demand. We have limited protection against excess inventory should anticipated demand not materialize.
We are subject to the risk that our inventory value may decline, and protective terms under our OEM supplier agreements may not adequately cover the decline in value, which in turn may harm our business, financial position and operating results.
The IT and CE products industry is subject to rapid technological change, new and enhanced product specification requirements, and evolving industry standards. These changes may cause inventory on hand to decline substantially in value or to rapidly become obsolete. Most of our OEM suppliers offer limited protection from the loss in value of inventory. For example, we can receive a credit from many OEM suppliers for products held in inventory in the event of a supplier price reduction. In addition, we have a limited right to return a certain percentage of purchases to most OEM suppliers. These policies are often subject to time restrictions and do not protect us in all cases from declines in inventory value. In addition, our OEM suppliers may become unable or unwilling to fulfill their protection obligations to us. The decrease or elimination of price protection, or the inability of our OEM suppliers to fulfill their protection obligations, could lower our gross margins and
9
Table of Contents
cause us to record inventory write-downs. If we are unable to manage our inventory with our OEM suppliers with a high degree of precision, we may have insufficient product supplies or we may have excess inventory, resulting in inventory write-downs, either of which could harm our business, financial position and operating results.
We depend on OEM suppliers to maintain an adequate supply of products to fulfill customer orders on a timely basis, and any supply shortages or delays could cause us to be unable to timely fulfill orders, which in turn could harm our business, financial position and operating results.
Our ability to obtain particular products in the required quantities and to fulfill reseller and retail customer orders on a timely basis is critical to our success. In most cases, we have no guaranteed price or delivery agreements with our OEM suppliers. We occasionally experience a supply shortage of certain products as a result of strong demand or problems experienced by our OEM suppliers. If shortages or delays persist, the price of those products may increase, or the products may not be available at all. Such delays could also impact our ability to procure critical components required to complete customer orders. In addition, our OEM suppliers may decide to distribute, or to substantially increase their existing distribution business, through other distributors, their own dealer networks, or directly to resellers, retailers or end-users. Accordingly, if we are not able to secure and maintain an adequate supply of products to fulfill our customer orders on a timely basis, our business, financial position and operating results could be adversely affected.
Our delivery center activities in our Concentrix business are significantly concentrated in India and the Philippines, which may expose us to operational risks.
Operations in our Concentrix segment are based on a global delivery model with client services provided from delivery centers located in several countries with a significant percentage of our workforce located in India and the Philippines. Socio-economic situations which are specific to these countries can severely disrupt our operations and impact our ability to fulfill our contractual obligations to our clients. If these regions experience severe natural calamities or political unrest, our personnel resources may be affected, our IT and communication infrastructure may be at risk and the client processes that we manage may be adversely affected. Changes in governments, laws, regulations and taxation rules may severely impact our ability to do business in these countries, our business practices, our operating costs and our results of operations.
Our systems design and integration solutions business has customer concentration and intense competition which could adversely impact our revenue.
The systems design and integration solutions business of our Technology Solutions segment has customer concentration, requires investments in working capital and infrastructure, and has customer contracts that often offer limited or no volume guarantees or protection for end-of-life investments. The loss of a customer or reduction in order volumes could adversely impact our revenue, provision for inventory losses, the absorption of fixed overhead costs and our future expansion plans. In addition, our ability to deliver customized solutions on a timely basis is critical to our success. Any delay could impact our competitive position and result in loss of customer orders, which could adversely impact our financial position and operating results.
The market for CE products that we distribute is characterized by short product life cycles. Increased competition for limited retailer shelf space, decreased promotional support from resellers or retailers or increased popularity of downloadable or online content and services could adversely impact our revenue.
The market for CE products, such as personal computers and tablets, mobile devices, wearable devices, video game titles and hardware, and audio or visual equipment, is characterized by short product life cycles and frequent introductions of new products. For example, the life cycle of a video game is short and typically provides a relatively high level of sales only for the first few months after introduction of the game. The markets in which we compete frequently introduce new products to meet changing consumer preferences and trends. As a result, competition is intense for resellers' and retailers' limited shelf space and promotions. If our vendors' new products are not introduced in a timely manner or do not achieve significant market acceptance, we may not generate sufficient sales or profitability. Further, if we are unable to successfully compete for resellers' or retailers' space and promotional resources, this could negatively impact market acceptance of our products and negatively impact our business and operating results. In addition, increased consumer use of downloadable content and online services and the further integration of technological tasks currently requiring several different CE products may negatively affect our CE products distribution business and operating results, as they may reduce consumer demand for having several different electronics devices and other physical products. For example, the popularity of downloadable and online games has increased and, if the trend continues, could adversely affect our over-the-counter retail video games sales.
The terms and conditions of our customer contracts within our Concentrix segment contain provisions which, if triggered, could cause fluctuations in our revenue, which in turn would adversely affect our financial results.
10
Table of Contents
In our Concentrix segment, we provide global business services to our customers under contracts with provisions that, if triggered, could impact our profitability. For example, many of our contracts may be terminated with a short amount of notice, and to the extent our customers terminate these contracts, we could experience unexpected fluctuations in our revenue and operating results from period to period. Additionally, some contracts have performance-related bonus or penalty provisions, whereby we could receive a bonus if we satisfy certain performance levels or have to pay a penalty for failing to do so. Whether we receive a bonus or are required to pay a penalty is unpredictable, and may cause additional fluctuations in our financial results. In addition, our customers may not guarantee a minimum volume; however, we hire employees based on anticipated average volumes. If we fail to anticipate volumes correctly, our operations and financial results may suffer. The reduction of volume, loss of customers, payment of penalties or inability to terminate any unprofitable contracts could have an adverse impact on our operations and financial results.
Our Concentrix business is subject to dynamic changes in its business model and intense competition, which in turn could cause our operations to suffer.
The customer engagement services industry is highly competitive, highly fragmented and subject to rapid change. We believe that the principal competitive factors in this market are breadth and depth of process and domain expertise, service quality, the ability to attract, train and retain qualified people, compliance rigor, global delivery capabilities, price and marketing and sales capabilities. We compete for business with a variety of companies, including in-house captives of potential clients. If our customers place more focus in this area and internalize these operations, this could also cause a significant reduction in the size of the available market for third party service providers like us. Similarly, if competitors offer their services at below market margin rates to gain market share, this could cause a significant decrease in the available market for us. In addition, if a cloud-based solution or some other technology were introduced, this new technology could cause an adverse shift in the way our existing business operations are conducted or decrease the size of the available market.
If we are unable to hire and retain employees with domain expertise for our Concentrix business, our operations will be disrupted, and such disruption may impact our ability to manage our costs, which in turn could impact our profitability.
The success of our operations and the quality of our services are highly dependent on our ability to attract and retain skilled personnel in all of our international delivery centers. The industry is characterized by high employee attrition rates and we face competition in hiring, retaining and motivating talented and skilled leaders and employees with domain experience.
In addition, our profitability is directly affected by the utilization rate of our personnel resources. If we are unable to achieve optimum utilization of our personnel resources, we may experience erosions in our profit margins. However, if our utilization is too high, it may result in a deterioration in the quality of services provided to our clients and may also result in higher attrition rates. If we are unable to manage our employee attrition rates, adequately motivate our employees or utilize our personnel resources efficiently, our operations will be disrupted, and such disruption may impact our ability to manage our costs, which in turn could impact our profitability.
If we fail to maintain effective internal controls over operations we perform for our clients in our Concentrix business or if our information systems are breached or client data are compromised, client relations may suffer, which in turn may adversely affect our revenue and results of operations.
Our customer engagement services business involves us representing our clients in certain critical operations of their business processes such as sales, marketing and customer support. If our clients experience disruptions in these operations or are dissatisfied with the quality of service provided, our client relationships may suffer and we may face possible legal action.
In addition, in management of our clients operations, we manage large volumes of customer information and confidential data. We may be liable and our operations may be disrupted if there is a breach of confidentiality of client data, if an employee violates policies and regulations governing the management of personal information, if we lose our client's data or if the security of our IT systems is compromised.
We may also be liable if we do not maintain adequate internal controls over the processes we manage for our clients or if we fail to comply with the laws and regulations applicable to the operations in which we represent our clients. Our clients may request us to obtain audit reports over our internal controls. If we are unable to complete these audit reports or if internal control deficiencies are identified in the audit process, our client relationships may suffer.
If we are unable to successfully manage our delivery centers in the Concentrix business, our results of operations could be adversely affected.
Our Concentrix business, which has extensive international operations, may be adversely impacted if we are unable to manage and communicate with the resources located internationally. Service quality may be placed at risk and our ability to
11
Table of Contents
optimize our resources may be compromised if we are unable to manage our resources remotely. Our Concentrix business uses a wide variety of technologies to allow us to manage a large volume of work. These technologies are designed to keep our employees productive. Any failure in technology may have a negative impact on our operations. The success of our services primarily depends on the performance of our employees and resulting customer satisfaction. Any increase in average waiting time or handling time or lack of promptness or technical expertise of our employees will directly impact customer satisfaction. Any adverse customer satisfaction may impact the overall business. If we are unable to successfully manage our delivery centers, our results of operations could be adversely affected.
Changes in foreign currency exchange rates and limitations on the convertibility of foreign currencies could adversely affect our business and operating results.
Approximately 26% of our total revenue in fiscal year 2015 , 28% for fiscal year 2014 and 26% for fiscal year 2013 were generated outside the United States. Most of our international revenue, cost of revenue and operating expenses are denominated in foreign currencies. We presently have currency exposure arising from both sales and purchases denominated in foreign currencies. Changes in exchange rates between foreign currencies and the U.S. dollar may adversely affect our operating margins. For example, if these foreign currencies appreciate against the U.S. dollar, it will be more expensive in terms of U.S. dollars to purchase inventory or pay expenses with foreign currencies. This could have a negative impact on us if revenue related to these purchases is transacted in U.S. dollars. In addition, currency devaluation can result in our products, which are usually purchased by us in U.S. dollars, to be relatively more expensive to procure than products manufactured locally. We currently conduct only limited hedging activities, which involve the use of currency forward contracts. Hedging foreign currencies can be risky. Certain of these hedge positions are undesignated hedges of balance sheet exposures, such as intercompany loans, and typically have maturities of less than one year.
In our Concentrix segment, our customer engagement services are delivered from several delivery centers located around the world, with significant operations in India and the Philippines. As a result, our revenue may be earned in currencies that are different from the currencies in which we incur corresponding expenses. Fluctuations in the value of currencies, such as the Indian Rupee and the Philippine Peso, against the U.S. Dollar, and inflation in the local economies in which these delivery centers are located, could increase the operating and labor costs in these delivery centers which can result in reduced profitability.
There is also additional risk if the currency is not freely or actively traded. Some currencies, such as the Chinese Renminbi, Indian Rupee and Philippines Peso, are subject to limitations on conversion into other currencies, which can limit our ability to hedge or to otherwise react to rapid foreign currency devaluations. We cannot predict the impact of future exchange rate fluctuations on our business and operating results.
We do not use derivative financial instruments for speculative trading purposes, nor do we hedge our foreign currency exposure in a manner that entirely offsets the effects of changes in foreign exchange rates.
As a general rule, we do not use financial instruments to hedge local currency denominated operating expenses in countries where a natural hedge exists. For example, in many countries, revenue from the local currency services substantially offsets the local currency denominated operating expenses.
Because we conduct substantial operations in China, risks associated with economic, political and social events in China could negatively affect our business and operating results.
A substantial portion of our IT systems operations, including our IT systems support and software development operations, and a portion of our Concentrix services, are located in China. In addition, we also conduct general and administrative activities from our facilities in China. As of November 30, 2015 , we had approximately 5,200 personnel located in China. Our operations in China are subject to a number of risks relating to China's economic and political systems, including:
• | a government controlled foreign exchange rate and limitations on the convertibility of the Chinese Renminbi; |
• | extensive government regulation; |
• | changing governmental policies relating to tax benefits available to foreign-owned businesses; |
• | the telecommunications infrastructure; |
• | a relatively uncertain legal system; and |
• | uncertainties related to continued economic and social reform. |
12
Table of Contents
Our IT systems are an important part of our global operations. Any significant interruption in service, whether resulting from any of the above uncertainties, natural disasters or otherwise, could result in delays in our inventory purchasing, errors in order fulfillment, reduced levels of customer service and other disruptions in operations, any of which could cause our business and operating results to suffer.
We may have higher than anticipated tax liabilities.
We conduct business globally and file income tax returns in various tax jurisdictions. Our effective tax rate could be adversely affected by several factors, many of which are outside of our control, including:
• | changes in income before taxes in various jurisdictions in which we operate that have differing statutory tax rates; |
• | changing tax laws, regulations, and/or interpretations of such tax laws in multiple jurisdictions; |
• | effect of tax rate on accounting for acquisitions and dispositions; |
• | issues arising from tax audit or examinations and any related interest or penalties; and |
• | uncertainty in obtaining tax holiday extensions or expiration or loss of tax holidays in various jurisdictions. |
We report our results of operations based on our determination of the amount of taxes owed in various tax jurisdictions in which we operate. The determination of our worldwide provision for income taxes and other tax liabilities requires estimation, judgment and calculations where the ultimate tax determination may not be certain. Our determination of tax liability is always subject to review or examination by tax authorities in various tax jurisdictions. Any adverse outcome of such review or examination could have a negative impact on our operating results and financial condition. The results from various tax examinations and audit may differ from the liabilities recorded in our financial statements and could adversely affect our financial results and cash flows.
We have pursued and intend to continue to pursue strategic acquisitions or investments in new markets and may encounter risks associated with these activities, which could harm our business and operating results.
We have in the past pursued, and in the future expect to pursue, acquisitions of, or investments in, businesses and assets in new markets, either within or outside the IT and CE products and services industries and the customer engagement services industry, that complement or expand our existing business. Our acquisition strategy involves a number of risks, including:
• | difficulty in successfully integrating acquired operations, IT systems, customers, OEM supplier relationships, products, services and businesses with our operations; |
• | loss of key employees of acquired operations or inability to hire key employees necessary for our expansion; |
• | diversion of our capital and management attention away from other business issues; |
• | increase in our expenses and working capital requirements; |
• | in the case of acquisitions that we may make outside of the United States, difficulty in operating in foreign countries and over significant geographical distances; |
• | other financial risks, such as potential liabilities of the businesses we acquire; and |
• | our due diligence process may fail to identify significant issues with the acquired company's product and service quality, financial disclosures, accounting practices or internal control deficiencies. |
We may incur additional costs and certain redundant expenses in connection with our acquisitions and investments, which may have an adverse impact on our operating margins. Future acquisitions may result in dilutive issuances of equity securities, the incurrence of additional debt, large write-offs, a decrease in future profitability, or future losses. The incurrence of debt in connection with any future acquisitions could restrict our ability to obtain working capital or other financing necessary to operate our business. Our recent and future acquisitions or investments may not be successful, and if we fail to realize the anticipated benefits of these acquisitions or investments, our business and operating results could be harmed.
Because of the capital-intensive nature of our Technology Solutions business, we need continued access to capital, which if not available to us or if not available on favorable terms, could harm our ability to operate or expand our business.
Our Technology Solutions business requires significant levels of capital to finance accounts receivable and product inventory that is not financed by trade creditors. If cash from available sources is insufficient, proceeds from our accounts
13
Table of Contents
receivable securitization and revolving credit programs are limited or cash is used for unanticipated needs, we may require additional capital sooner than anticipated.
In the event we are required, or elect, to raise additional funds, we may be unable to do so on favorable terms, or at all, and may incur expenses in raising the additional funds. Our current and future indebtedness could adversely affect our operating results and severely limit our ability to plan for, or react to, changes in our business or industry. We could also be limited by financial and other restrictive covenants in securitization or credit arrangements, including limitations on our borrowing of additional funds and issuing dividends. Furthermore, the cost of securitization or debt financing could significantly increase in the future, making it cost prohibitive to securitize our accounts receivable or borrow, which could force us to issue new equity securities. If we issue new equity securities, existing stockholders may experience dilution, or the new equity securities may have rights, preferences or privileges senior to those of existing holders of common stock. If we cannot raise funds on acceptable terms, we may not be able to take advantage of future opportunities or respond to competitive pressures or unanticipated requirements. Any inability to raise additional capital when required could have an adverse effect on our business and operating results.
The terms of our debt arrangements impose significant restrictions on our ability to operate which in turn could negatively affect our ability to respond to business and market conditions and therefore could have an adverse effect on our business and operating results.
As of November 30, 2015 , we had $730.9 million in outstanding short and long-term borrowings under term loans, lines of credit, accounts receivable securitization programs and capital leases, excluding trade payables. The terms of one or more of the agreements under which this indebtedness was incurred may limit or restrict, among other things, our ability to:
• | incur additional indebtedness; |
• | make investments; |
• | pay dividends or make certain other restricted payments; |
• | repurchase common stock; |
• | consummate certain asset sales or acquisitions; |
• | enter into certain transactions with affiliates; and |
• | merge, consolidate or sell, assign, transfer, lease, convey or otherwise dispose off all or substantially all of our assets. |
We are also required to maintain specified financial ratios and satisfy certain financial condition tests, including a leverage and a fixed charge coverage ratio as outlined in our senior secured credit agreement and in our accounts receivable securitization program. Our inability to meet these ratios and tests could result in the acceleration of the repayment of the related debt, termination of the facility, an increase in our effective cost of funds or the cross-default of other credit and securitization arrangements. As a result, our ability to operate may be restricted and our ability to respond to business and market conditions may be limited, which could have an adverse effect on our business and operating results.
We may not be able to generate sufficient cash to service all of our indebtedness and may be forced to take other actions to satisfy our obligations, which could adversely affect our business.
Our ability to make scheduled debt payments or to refinance our debt obligations depends on our financial and operating performance, which is subject to prevailing economic and competitive conditions and to certain financial, business and other factors beyond our control. We cannot be certain that we will maintain a level of cash flows from operating activities sufficient to permit us to pay the principal and interest on our indebtedness.
If our cash flows and capital resources are insufficient to fund our debt service obligations, we may be forced to reduce or delay capital expenditures, sell assets or operations, seek additional capital or restructure or refinance our indebtedness. We cannot be certain that we would be able to take any of these actions, that these actions would be successful and permit us to meet our scheduled debt service obligations or that these actions would be permitted under the terms of our existing or future debt agreements. In the absence of such operating results and resources, we could face substantial liquidity problems and might be required to dispose of material assets or operations to meet our debt service and other obligations. Some of our credit facilities restrict our ability to dispose assets and use the proceeds from such disposition. As such, we may not be able to consummate those dispositions or use any resulting proceeds and, in addition, such proceeds may not be adequate to meet any debt service obligations then due.
14
Table of Contents
If we cannot make scheduled payments on our debt, we will be in default and, as a result:
• | our lenders could declare all outstanding principal and interest to be due and payable; |
• | the lenders under our credit agreements could terminate their commitments to loan us money and, in the case of our secured credit agreements, foreclose against the assets securing their borrowings; |
• | we could be forced to raise additional capital through the issuance of additional, potentially dilutive securities; and |
• | we could be forced into bankruptcy or liquidation, which is likely to result in delays in the payment of our indebtedness and in the exercise of enforcement remedies related to our indebtedness. |
If the interest rates on our borrowings increase, our access to capital and net income could be adversely affected.
Our borrowings and securitization arrangements are variable-rate obligations and expose us to interest rate risks. If interest rates increase, debt service obligations and our interest expense will increase even though the amount borrowed remains the same. Our net income and cash flows, including cash available for servicing indebtedness, will correspondingly decrease.
An increase in interest rates may increase our future borrowing costs and restrict our access to capital. Additionally, current market conditions, the recovering global economy, and overall credit conditions could limit our availability of capital, which could cause increases in interest margin spreads over underlying indices, effectively increasing the cost of our borrowing. While some of our credit facilities have contractually negotiated spreads, any changes to these spreads in connection with renegotiations of our credit facilities could adversely affect our results of operations.
In May 2015, we entered into interest rate swaps with financial institutions to effectively convert a portion of our floating rate debt to a fixed interest rate to manage our exposure to fluctuations in interest rates. In the event of the nonperformance by the counterparties, we are exposed to credit losses.
A portion of our revenue is financed by floor plan financing companies and any termination or reduction in these financing arrangements could increase our financing costs and harm our business and operating results.
A portion of our product distribution revenue is financed by floor plan financing companies. Floor plan financing companies are engaged by our customers to finance, or floor, the purchase of products from us. In exchange for a fee, we transfer the risk of loss on the sale of our products to the floor plan companies. We currently receive payment from these financing companies within approximately 15 to 30 days from the date of the sale, which allows our business to operate at much lower relative working capital levels than if such programs were not available. If these floor plan arrangements are terminated or substantially reduced, the need for more working capital and the increased financing cost could harm our business and operating results.
We have significant credit exposure to our customers, and negative trends in their businesses could cause us significant credit loss and negatively impact our cash flow and liquidity position.
We extend credit to our customers for a significant portion of our sales to them and they have a period of time, generally 30 days after the date of invoice, to make payment. However, in certain cases, for some of our larger customers, we offer longer terms of payment. As a result, we are subject to the risk that our customers will not pay on time or at all. The majority of our customers are small and medium sized businesses. Our credit exposure risk may increase due to financial difficulties or liquidity or solvency issues experienced by our customers, resulting in their inability to repay us. The liquidity or solvency issues may increase as a result of an economic downturn or a decrease in IT or CE spending by end-users. If we are unable to collect payments in a timely manner from our customers due to changes in financial or economic conditions, or for other reasons, and we are unable to collect under our credit insurance policies, we may write-off the amount due from the customers. These write-offs may result in credit insurance being more expensive and on terms that are less favorable to us and may negatively impact our ability to utilize accounts receivable-based financing. In addition, the failure of customers to pay within a specified time period after the date of an invoice could result in defaults under our accounts receivable securitization program. These circumstances could negatively impact our cash flow and liquidity position, or result in the cross-default to our other indebtedness and acceleration of the repayment of our indebtedness. Further, we are exposed to higher collection risk as we continue to expand internationally, where the payment cycles are generally longer and the credit rating process may not be as robust as in the United States, and where our access to accounts receivable financing is more limited.
In addition, the revenue from our Mexico operations includes various long-term projects funded by government and other local agencies, which often involve extended payment terms and contractual penalties and could expose us to additional collection risks.
15
Table of Contents
We are dependent on a variety of IT and telecommunications systems and the Internet, and any failure of these systems could adversely impact our business and operating results.
We depend on IT and telecommunications systems and the Internet for our operations. These systems support a variety of functions including inventory management, order processing, shipping, shipment tracking, billing, and our Concentrix business.
Failures or significant downtime of our IT or telecommunications systems could prevent us from taking customer orders, printing product pick-lists, shipping products, billing customers and handling call volume. Sales also may be affected if our reseller and retail customers are unable to access our pricing and product availability information. We also rely on the Internet, and in particular EDI and XML, for a large portion of our orders and information exchanges with our OEM suppliers and reseller and retail customers. The Internet and individual websites have experienced a number of disruptions and slowdowns, some of which were caused by organized attacks. In addition, some websites have experienced security breakdowns. If we were to experience a security breakdown, disruption or breach that compromised sensitive information, it could harm our relationship with our OEM suppliers and reseller and retail customers. Disruption of our website or the Internet in general could impair our order processing or more generally prevent our OEM suppliers and reseller and retail customers from accessing information. Our Concentrix business is dependent upon telephone and data services provided by third party telecommunications service vendors and our IT and telecommunications systems. Any significant increase in our IT and telecommunications costs or temporary or permanent loss of our IT or telecommunications systems could harm our relationships with our customers. The occurrence of any of these events could have an adverse effect on our operations and financial results.
We rely on independent shipping companies for delivery of products, and price increases or service interruptions from these carriers could adversely affect our business and operating results.
We rely almost entirely on arrangements with independent shipping companies, such as FedEx and UPS, for the delivery of our products from OEM suppliers and delivery of products to reseller and retail customers. Freight and shipping charges can have a significant impact on our gross margin. As a result, an increase in freight surcharges due to rising fuel cost or general price increases will have an immediate adverse effect on our margins, unless we are able to pass the increased charges to our reseller and retail customers or renegotiate terms with our OEM suppliers. In addition, in the past, carriers have experienced work stoppages due to labor negotiations with management. An increase in freight or shipping charges, the termination of our arrangements with one or more of these independent shipping companies, the failure or inability of one or more of these independent shipping companies to deliver products, or the unavailability of their shipping services, even temporarily, could have an adverse effect on our business and operating results.
Because of the experience of our key personnel in the IT, CE and the customer engagement services industries and their technological and industry expertise, if we were to lose any of our key personnel, it could inhibit our ability to operate and grow our business successfully.
We are dependent in large part on our ability to retain the services of our key senior executives and other technological and industry experts and personnel. Except for Kevin Murai, our President and Chief Executive Officer, our employees and executives generally do not have employment agreements. Furthermore, we do not carry "key person" insurance coverage for any of our key executives. We compete for qualified senior management and technical personnel. The loss of, or inability to hire, key executives or qualified employees could inhibit our ability to operate and grow our business successfully.
We may experience theft of product from our warehouses, water damage to our properties and other casualty events which could harm our operating results.
From time to time, we have experienced incidents of theft at various facilities, water damages to our properties and other casualty events. These types of incidents may make it more difficult or expensive for us to obtain insurance coverage in the future. Also, the same or similar incidents may occur in the future for which we may not have sufficient insurance coverage or policy limits to be fully compensated for the loss, which may have an adverse effect on our business and financial results.
We may become involved in intellectual property or other disputes that could cause us to incur substantial costs, divert the efforts of our management, and require us to pay substantial damages or require us to obtain a license, which may not be available on commercially reasonable terms, if at all.
From time to time, we receive notifications alleging infringements of intellectual property rights allegedly held by others relating to our business or the products we sell or integrate for our OEM suppliers and others. Litigation with respect to patents or other intellectual property matters could result in substantial costs and diversion of management and other resources and could have an adverse effect on our business. Although we generally have various levels of indemnification protection from our
16
Table of Contents
OEM suppliers and design and integration solutions customers, in many cases any indemnification to which we may be entitled is subject to maximum limits or other restrictions.
In addition, we have developed proprietary IT systems, mobile applications, and cloud-based technology and acquired technologies that play an important role in our business. If any infringement claim is successful against us and if indemnification is not available or sufficient, we may be required to pay substantial damages or we may need to seek and obtain a license of the other party's intellectual property rights. We may be unable to obtain such a license on commercially reasonable terms, if at all.
We are from time to time involved in other litigation in the ordinary course of business. We may not be successful in defending these or other claims. Regardless of the outcome, litigation could result in substantial expense and could divert the efforts of our management.
We have significant operations concentrated in North and South America, Asia-Pacific and Europe and any disruption in the operations of our facilities could harm our business and operating results.
Our worldwide operations could be subject to natural disasters, adverse weather conditions and other business disruptions, which could seriously harm our revenue and financial condition and increase our costs and expenses. We have significant operations in our facilities located in North America, Asia-Pacific and Europe. As a result, any prolonged disruption in the operations of our facilities, whether due to technical difficulties, power failures, break-ins, destruction or damage to the facilities as a result of a natural disaster, fire or any other reason, could harm our operating results. If there are related disruptions in local or international supply chains, we may experience supply shortages or delays in receiving products from our OEM suppliers or experience other delays in shipping to our customers. If we are unable to fulfill customer orders in a timely manner, this could harm our operating results. For example, in March 2011, Japan experienced a 9.0 magnitude earthquake followed by tsunami waves and aftershocks. These events affected the infrastructure in the country, caused power outages and temporarily disrupted the local and international supply chains for some vendors. Our facilities in Japan suffered nominal inventory and facility damages. In addition, our Philippines operation is at greater risk due to adverse weather conditions, such as typhoons, mudslides and floods. We currently have a disaster recovery plan and business interruption insurance; however, they may not be sufficient to compensate for losses that may occur.
Global health and economic, political and social conditions may harm our ability to do business, increase our costs and negatively affect our stock price.
Worldwide economic conditions remain uncertain with slower economic activity across many geographic regions, including China, which may impact our results of operations. External factors, such as potential terrorist attacks, acts of war, geopolitical and social turmoil or epidemics and other similar outbreaks in many parts of the world, could prevent or hinder our ability to do business, increase our costs and negatively affect our stock price, which in turn, may require us to record an impairment in the carrying value of our goodwill. More generally, these geopolitical social and economic conditions could result in increased volatility in the United States and worldwide financial markets and economy. For example, increased instability may adversely impact the desire of employees and customers to travel, the reliability and cost of transportation and our ability to obtain adequate insurance at reasonable rates and may require us to incur increased costs for security measures for our domestic and international operations. We are predominantly uninsured for losses and interruptions caused by terrorism, acts of war and similar events. These uncertainties make it difficult for us and our customers to accurately plan future business activities.
Part of our business is conducted outside of the United States, exposing us to additional risks that may not exist in the United States, which in turn could cause our business and operating results to suffer.
We have significant international operations and presence which subjects us to risks, including:
• | political or economic instability; |
• | extensive governmental regulation; |
• | changes in import/export duties; |
• | trade restrictions; |
• | compliance with the Foreign Corrupt Practices Act, U.K. bribery laws and similar laws; |
• | difficulties and costs of staffing and managing operations in certain foreign countries; |
17
Table of Contents
• | work stoppages or other changes in labor conditions; |
• | difficulties in collecting accounts receivable on a timely basis or at all; |
• | taxes; and |
• | seasonal reductions in business activity in some parts of the world. |
We may continue to expand internationally to respond to competitive pressure and customer and market requirements. Establishing operations in any other foreign country or region presents risks such as those described above as well as risks specific to the particular country or region. In addition, until a payment history is established over time with customers in a new geography or region, the likelihood of collecting accounts receivable generated by such operations could be less than our expectations. As a result, there is a greater risk that reserves set with respect to the collection of such accounts receivable may be inadequate. Furthermore, if our international expansion efforts in any foreign country are unsuccessful, we may decide to cease operations, which would likely cause us to incur additional expense and loss.
In addition, changes in policies or laws of the United States or foreign governments resulting in, among other things, higher taxation, currency conversion limitations, restrictions on fund transfers or the expropriation of private enterprises, could reduce the anticipated benefits of our international expansion. Any actions by countries in which we conduct business to reverse policies that encourage foreign trade or investment could adversely affect our business. If we fail to realize the anticipated growth of our future international operations, our business and operating results could suffer.
Risks Related to Our Relationship with MiTAC Holdings Corporation
The concentration of ownership of our common stock among our executive officers, directors and principal stockholders could allow them to influence all matters requiring stockholder approval and could delay or prevent a change in control of SYNNEX.
As of November 30, 2015 , our executive officers, directors and principal stockholders owned approximately 27% of our outstanding common stock. In particular, MiTAC Holdings Corporation ("MiTAC Holdings") and its affiliates owned approximately 25% of our common stock. MiTAC Holdings is a publicly-traded company on the Taiwan Stock Exchange. As a result, these stockholders have the potential ability to influence or control matters requiring stockholder approval, including the election of directors and the approval of mergers and acquisitions, or exert influence on actions of the Board of Directors. This concentration of ownership may have the effect of delaying, preventing or deterring a change of control of our company, could deprive our stockholders of an opportunity to receive a premium for their common stock as part of a sale of our company and might ultimately affect the market price of our common stock.
There could be potential conflicts of interest between us and MiTAC Holdings and its affiliates, which could affect our business and operating results.
MiTAC Holdings' and its affiliates' continuing beneficial ownership of our common stock could create conflicts of interest with respect to a variety of matters, such as potential acquisitions, competition, issuance or disposition of securities, election of directors, payment of dividends and other business matters. For example, we currently purchase inventories from MiTAC Holdings. Similar risks could exist as a result of Matthew Miau's positions as our Chairman Emeritus, a member of our Board of Directors, the Chairman of MiTAC Holdings and as a director or officer of MiTAC Holdings' affiliates. For fiscal year 2015, Mr. Miau received the same compensation as our independent directors. For fiscal year 2016, Mr. Miau will receive the same compensation as our independent directors. Mr. Miau's compensation as one of our directors is based upon the approval of the Nominating and Corporate Governance Committee, which is solely composed of independent members of the Board of Directors. We also have adopted a policy requiring material transactions in which any of our directors has a potential conflict of interest to be approved by our Audit Committee, which is also composed of independent members of the Board of Directors.
Synnex Technology International Corp., or Synnex Technology International, a publicly-traded company based in Taiwan and affiliated with MiTAC Holdings, currently provides distribution and fulfillment services to various markets in Asia and Australia, and is also a potential competitor of ours. As of November 30, 2015 , MiTAC Incorporated, a privately-held company based in Taiwan and a separate entity from MiTAC Holdings, directly and indirectly owned approximately 13.6% of Synnex Technology International and approximately 7.9% of MiTAC Holdings. As of November 30, 2015 , MiTAC Holdings directly and indirectly owned 0.2% of Synnex Technology International and Synnex Technology International directly and indirectly owned approximately 0.9% of MiTAC Holdings. In addition, MiTAC Holdings directly and indirectly owned approximately 8.7% of MiTAC Incorporated and Synnex Technology International directly and indirectly owned approximately 18.4% of MiTAC Incorporated as of November 30, 2015 . Synnex Technology International indirectly through its ownership of Peer Developments Limited owned approximately 10.8% of our outstanding common stock as of November 30, 2015 . Neither
18
Table of Contents
MiTAC Holdings, nor Synnex Technology International is restricted from competing with us. In the future, we may increasingly compete with Synnex Technology International, particularly if our business in Asia expands or Synnex Technology International expands its business into geographies or customers we serve. Although Synnex Technology International is a separate entity from us, it is possible that there will be confusion as a result of the similarity of our names. Moreover, we cannot limit or control the use of the Synnex name by Synnex Technology International in certain geographies and our use of the Synnex name may be restricted as a result of registration of the name by Synnex Technology International or the prior use in jurisdictions where it currently operates.
Risks Related to Our Industry
Volatility in the IT and CE industries could have a material adverse effect on our business and operating results.
We have in the past, experienced decreases in demand and we anticipate that the industries we operate in will be subject to a high degree of cyclicality in the future. Softening demand for our products and services caused by an ongoing economic downturn and over-capacity may impact our revenue, as well the salability of inventory and collection of reseller and retail customer accounts receivable.
We are subject to intense competition in the Technology Solutions and Concentrix businesses, both in the United States and internationally, and if we fail to compete successfully, we will be unable to gain or retain market share.
We operate in a highly competitive environment, both in the United States and internationally. This competition is based primarily on product and service availability, credit availability, price, speed of delivery, ability to tailor specific solutions to customer needs, quality and depth of product and service lines, pre-sales and post-sales technical support, flexibility and timely response to design changes, and technological capabilities, service and support. We compete with a variety of regional, national and international IT and CE product and service providers and contract manufacturers and assemblers and providers of customer engagement services. In some instances, we also compete with our own customers, our own OEM suppliers and MiTAC Holdings and its affiliates.
Our primary competitors are substantially larger and have greater financial, operating, manufacturing and marketing resources than us. Some of our competitors may have broader geographic breadth and range of services than us and may have more developed relationships with their existing customers. We may lose market share in the United States or in international markets, or may be forced in the future to reduce our prices in response to the actions of our competitors and thereby experience a reduction in our gross margins.
In addition, in our Concentrix business, we also face competition from our customers. For example, some of our customers may have internal capabilities and resources to provide their own customer contact centers. Furthermore, pricing pressures and quality of services could impact our business adversely. Our ability to provide a high quality of service is dependent on our ability to retain and properly train our employees and to continue investing in our infrastructure, including IT and telecommunications systems.
We may initiate other business activities, including the broadening of our supply chain capabilities, and may face competition from companies with more experience in those new areas. In addition, as we enter new areas of business, we may also encounter increased competition from current competitors or from new competitors, including some that may once have been our OEM suppliers or reseller and retail customers. Increased competition and negative reaction from our OEM suppliers or reseller and retail customers resulting from our expansion into new business areas could harm our business and operating results.
Our business may be adversely affected by some OEM suppliers' strategies to increase their direct sales, which in turn could cause our business and operating results to suffer.
Consolidation of OEM suppliers has resulted in fewer sources for some of the products and services that we distribute. This consolidation has also resulted in larger OEM suppliers that have significant operating and financial resources. Some OEM suppliers, including some of the leading OEM suppliers that we service, have been selling products and services directly to reseller and retail customers and end-users, thereby limiting our business opportunities. If large OEM suppliers increasingly sell directly to end-users or our resellers and retailers, rather than use us as the distributor of their products and services, our business and operating results will suffer.
OEMs could limit the number of supply chain service providers with which they do business, which in turn could negatively impact our business and operating results.
19
Table of Contents
A determination by any of our primary OEMs to consolidate their business with other distributors or integration service providers could negatively affect our business and operating results. In particular, the termination of our contract by HP would have a significant negative effect on our revenue and operating results.
The IT and CE industries are subject to rapidly changing technologies and process developments, and we may not be able to adequately adjust our business to these changes, which in turn would harm our business and operating results.
Dynamic changes in the IT and CE industries, including the consolidation of OEM suppliers and reductions in the number of authorized distributors used by OEM suppliers, have resulted in new and increased responsibilities for management personnel and have placed, and continue to place, a significant strain upon our management, operating and financial systems and other resources. We may be unable to successfully respond to and manage our business in light of industry developments and trends. Also crucial to our success in managing our operations is our ability to achieve additional economies of scale. Our failure to achieve these additional economies of scale or to respond to changes in the IT and CE industries could adversely affect our business and operating results.
If we are unable to maintain effective internal control over financial reporting, our ability to report our financial results on a timely and accurate basis may be adversely affected, which in turn could cause the market price of our common stock to decline.
Section 404 of the Sarbanes-Oxley Act of 2002 requires our management to report on, and our independent registered public accounting firm to attest to, the effectiveness of our internal control structure and procedures for financial reporting. We completed an evaluation of the effectiveness of our internal control over financial reporting for fiscal year 2015 , and we have an ongoing program to perform the system and process evaluation and testing necessary to continue to comply with these requirements. However, internal control over financial reporting has inherent limitations, including human error, the possibility that controls could be circumvented or become inadequate because of changed conditions, and fraud. Because of the inherent limitations, misstatements due to error or fraud may occur and may not always be prevented or timely detected. We expect to continue to incur significant expense and to devote management resources to Section 404 compliance. In the event that one of our Chief Executive Officer, Chief Financial Officer or independent registered public accounting firm determines that our internal control over financial reporting is not effective as defined under Section 404, investor perceptions and our reputation may be adversely affected and the market price of our stock could decline.
Changes to financial accounting standards may affect our results of operations and cause us to change our business practices.
We prepare our financial statements to conform to generally accepted accounting principles in the United States. These accounting principles are subject to interpretation by the Financial Accounting Standards Board, American Institute of Certified Public Accountants, the SEC and various bodies formed to interpret and create appropriate accounting policies. A change in those policies can have a significant effect on our reported results and may affect our reporting of transactions completed before a change is announced. Changes to those rules or the questioning of current practices may adversely affect our reported financial results or the way we conduct our business.
For example, in May 2014, the Financial Accounting Standards Board issued a comprehensive new revenue recognition standard for contracts with customers that will supersede most current revenue recognition guidance, including industry-specific guidance. The standard permits the use of either the retrospective or cumulative effect transition method. This guidance will be applicable to us at the beginning of its first quarter of fiscal year 2019.
Item 1B. Unresolved Staff Comments
None.
Item 2. Properties
Our principal executive offices are located in Fremont, California, and are owned by us. We operate distribution, integration, contact center and administrative facilities in different countries.
Our Technology Solutions segment occupies approximately 40 facilities covering approximately 4.2 million square feet and includes warehouse, logistics and administrative facilities. We own approximately 1.3 million square feet of property and lease the remainder.
Our Concentrix segment occupies approximately 90 facilities comprising service and delivery centers and administrative facilities covering approximately 5.3 million square feet. We own approximately one hundred ninety-one thousand square feet and lease the remainder.
20
Table of Contents
We have sublet unused portions of some of our facilities. We believe our facilities are well maintained and adequate for current and near future operating needs.
Item 3. Legal Proceedings
We are from time to time involved in legal proceedings in the ordinary course of business. We do not believe that these proceedings will have a material adverse effect on the results of our operations, our financial position or the cash flows of our business.
In addition, we have been involved in various bankruptcy preference actions where we were a supplier to the companies now in bankruptcy. These preference actions are filed by the bankruptcy trustee on behalf of the bankrupt estate and generally seek to have payments made by the debtor within 90 days prior to the bankruptcy returned to the bankruptcy estate for allocation among all of the bankruptcy estate's creditors. We are not currently involved in any material preference proceedings.
Item 4. Mine Safety Disclosures
Not applicable.
Executive Officers of the Registrant
The following table sets forth information regarding our executive officers as of November 30, 2015 :
Name |
| Age |
| Position |
| |
Kevin Murai |
| 52 | |
| President, Chief Executive Officer and a Director | |
Dennis Polk |
| 49 | |
| Chief Operating Officer and a Director | |
Peter Larocque |
| 54 | |
| President, North American Technology Solutions | |
Marshall Witt |
| 50 | |
| Chief Financial Officer | |
Christopher Caldwell |
| 43 | |
| Executive Vice President; President, Concentrix Corporation | |
Simon Leung |
| 50 | |
| Senior Vice President; General Counsel and Corporate Secretary | |
Kevin Murai is our President and Chief Executive Officer and a Director and joined us in March 2008. He served as Co-Chief Executive Officer until Robert Huang's retirement in December 2008. Prior to SYNNEX, Mr. Murai was employed for nineteen years at Ingram Micro, Inc., where he served in several executive management positions, including President and Chief Operating Officer and also on the Ingram Micro, Inc. Board of Directors. He holds a Bachelor of Applied Science degree in Electrical Engineering from the University of Waterloo in Ontario, Canada.
Dennis Polk is our Chief Operating Officer and has served in this capacity since July 2006. Mr. Polk is also a Director and has served in this capacity since February 2012. He previously served as Chief Financial Officer and Senior Vice President of Corporate Finance since joining us in February 2002. Mr. Polk received a Bachelor of Science degree in Accounting from Santa Clara University.
Peter Larocque is President, North American Technology Solutions and has served in this capacity since November 2013, having previously served as President of U.S. Distribution since July 2006, Executive Vice President of Distribution since June 2001, and Senior Vice President of Sales and Marketing from September 1997 until June 2001. Mr. Larocque is responsible for SYNNEX' North American Technology Solutions business. He received a Bachelor of Science degree in Economics from the University of Western Ontario, Canada.
Marshall Witt is our Chief Financial Officer and has served in this capacity since April 2013. Prior to joining SYNNEX, Mr. Witt was Senior Vice President of Finance and Controller with FedEx Freight. During his fifteen year tenure with FedEx Corporation, Mr. Witt held progressive financial and operational roles. Prior to FedEx Corporation, he held accounting and finance leadership positions including five years with KPMG LLP as an audit manager for banking and transportation clients. Mr. Witt holds a Bachelor of Business Administration in Finance from Pacific Lutheran University and a Masters in Accounting from Seattle University and is a Certified Public Accountant.
Christopher Caldwell is Executive Vice President and President of Concentrix Corporation and has served in this capacity since February 2014. He previously served as President of Concentrix Corporation from June 2012 to February 2014, Senior Vice President and General Manager of Concentrix Corporation from March 2007 to June 2012, and Senior Vice President, Global Business Development from March 2007 to June 2012. Mr. Caldwell joined SYNNEX in 2004 as Vice President, Emerging Business through the acquisition of EMJ Data Systems Ltd. He serves as a Director of Microland Ltd.
21
Table of Contents
Simon Leung is our Senior Vice President, General Counsel and Corporate Secretary and has served in this capacity since May 2001. Mr. Leung joined SYNNEX in November 2000 as Corporate Counsel. Prior to SYNNEX, Mr. Leung was an attorney at the law firm of Paul, Hastings, Janofsky & Walker LLP. Mr. Leung received a Bachelor of Arts degree from the University of California, Davis in International Relations and his Juris Doctor degree from the University of Minnesota Law School.
PART II
Item 5. Market for Registrant's Common Equity, Related Stockholder Matters and Issuer Purchases of Equity Securities
Our common stock, par value $0.001, is traded on the New York Stock Exchange, or NYSE, under the symbol "SNX." The following table sets forth the range of high and low sales prices for our common stock for each of the periods listed, as reported by the NYSE.
| Price Range of Common Stock | ||||||
| Low |
| High | ||||
Fiscal Year 2015 |
|
|
| ||||
First Quarter | $ | 67.65 | |
| $ | 80.24 | |
Second Quarter | $ | 70.14 | |
| $ | 83.98 | |
Third Quarter | $ | 71.00 | |
| $ | 85.25 | |
Fourth Quarter | $ | 76.56 | |
| $ | 96.92 | |
|
|
|
| ||||
Fiscal Year 2014 |
|
|
| ||||
First Quarter | $ | 51.65 | |
| $ | 68.71 | |
Second Quarter | $ | 57.50 | |
| $ | 79.44 | |
Third Quarter | $ | 62.01 | |
| $ | 74.57 | |
Fourth Quarter | $ | 59.27 | |
| $ | 72.77 | |
As of January 20, 2016 , our common stock was held by 635 stockholders of record. Because many of the shares of our common stock are held by brokers and other institutions on behalf of stockholders, we are unable to estimate the total number of beneficial owners represented by these stockholders of record.
Stock Price Performance Graph
The stock price performance graph below, which assumes a $100 investment on November 30, 2010 , compares our cumulative total stockholder return, the NYSE Composite Index, S&P Midcap 400 Index, Computer & Peripheral Equipment index and a peer group of our Concentrix segment for the period beginning November 30, 2010 through November 30, 2015 . The Computer & Peripheral Equipment index is based on the Standard Industrial Classification Code 5045-Wholesale Computer and Computer Peripheral Equipment and Software. The companies selected to form the Concentrix peer group index include Accenture plc, Convergys Corporation, Genpact Limited, Genpact Limited, Teleperformance S.A. and TeleTech Holdings Inc. The closing price per share of our common stock was $94.27 on November 30, 2015 . The comparisons in the table are required by the SEC and are not intended to forecast or be indicative of possible future performance of our common stock.
22
Table of Contents
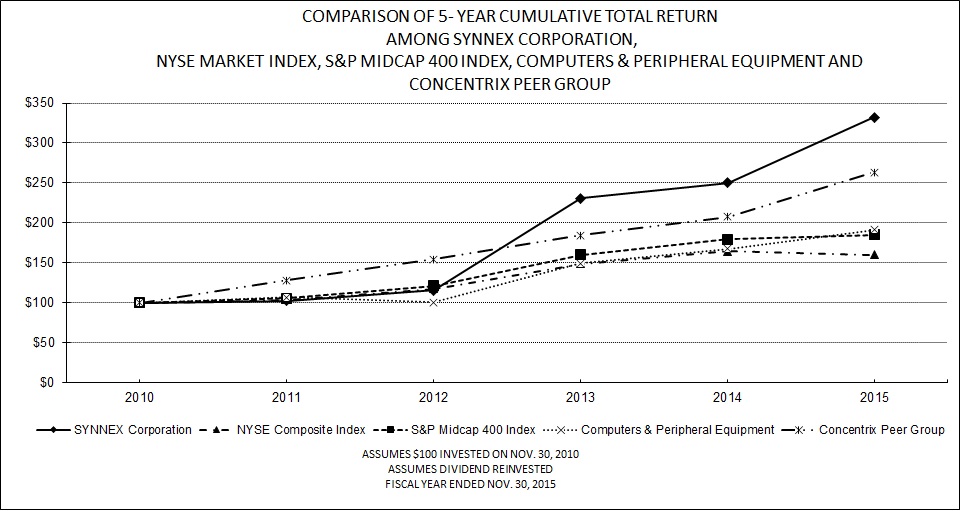
| Fiscal Years Ended | ||||||||||||||||||||||
| 11/30/2010 |
| 11/30/2011 |
| 11/30/2012 |
| 11/30/2013 |
| 11/30/2014 |
| 11/30/2015 | ||||||||||||
SYNNEX Corporation | $ | 100.00 | |
| $ | 102.41 | |
| $ | 115.21 | |
| $ | 230.84 | |
| $ | 249.79 | |
| $ | 332.03 | |
NYSE Composite Index | $ | 100.00 | |
| $ | 103.44 | |
| $ | 117.46 | |
| $ | 148.69 | |
| $ | 164.01 | |
| $ | 159.85 | |
S&P Midcap 400 Index | $ | 100.00 | |
| $ | 105.10 | |
| $ | 120.79 | |
| $ | 159.84 | |
| $ | 179.39 | |
| $ | 184.63 | |
Computers & Peripheral Equipment | $ | 100.00 | |
| $ | 106.33 | |
| $ | 100.45 | |
| $ | 148.94 | |
| $ | 167.68 | |
| $ | 191.20 | |
Concentrix Peer Group | $ | 100.00 | |
| $ | 127.63 | |
| $ | 153.92 | |
| $ | 184.15 | |
| $ | 207.45 | |
| $ | 262.97 | |
Securities Authorized for Issuance under Equity Compensation Plans
Information regarding the Securities Authorized for Issuance under Equity Compensation Plans can be found under Item 12 of this Report.
Dividends
On September 29, 2014, we announced the initiation of a quarterly cash dividend of $0.125 per share to common stockholders. Dividends historically have been declared in January, March, June and September and paid at the end of January, April, July and October. From the initiation of our dividend program through June 2015, the quarterly dividend was $0.125 per share, and was subsequently increased on September 28, 2015 to $0.20 per share. On January 8, 2016, we announced a cash dividend of $0.20 per share to stockholders of record as of January 19, 2016, payable on January 29, 2016. Future dividends are subject to continued capital availability, compliance with the covenants and conditions in our senior secured credit agreement and declaration by our Board of Directors in the best interest of our stockholders.
Purchases of Equity Securities
In June 2011, our Board of Directors authorized a three-year $65 million share repurchase program. We purchased 361,451 shares for a total cost of $11.3 million in the open market before the program expired in June 2014. Those shares are held in treasury for general corporate purposes.
In June 2014, our Board of Directors authorized a three-year $100 million share repurchase program pursuant to which we may repurchase our outstanding common stock from time to time in the open market or through privately negotiated transactions. As of November 30, 2015, we had purchased 120,000 shares for a total cost of $8.7 million. The share purchases were made on the open market and the shares repurchased by us are held in treasury for general corporate purposes. There were no repurchases of equity securities in the fourth quarter of fiscal year 2015.
23
Table of Contents
Item 6. Selected Financial Data
The following selected consolidated financial data are qualified by reference to, and should be read together with, "Management's Discussion and Analysis of Financial Condition and Results of Operations" included in Item 7 of this Report and the Consolidated Financial Statements and related Notes included in Item 8 of this Report. The selected Consolidated Statements of Operations and cash flow data presented below for fiscal years 2015 , 2014 and 2013 and the consolidated balance sheet data as of November 30, 2015 and 2014 have been derived from our audited Consolidated Financial Statements included elsewhere in this Report. The Consolidated Statements of Operations and other data for fiscal years 2012 and 2011 and the Consolidated Balance Sheet data as of November 30, 2013, 2012 and 2011 have been derived from our Consolidated Financial Statements that are not included in this Report. The Consolidated Statements of Operations data include the operating results from our acquisitions from the closing date of each acquisition. Historical operating results are not necessarily indicative of the results that may be expected for any future period. Please see "Management's Discussion and Analysis of Financial Condition and Results of Operations" and Notes 2 and 3 to our Consolidated Financial Statements included elsewhere in this Report for a discussion of factors, such as business combinations, that affect the comparability of the following selected consolidated financial data.
| Fiscal Years Ended November 30, | ||||||||||||||||||
| 2015 |
| 2014 |
| 2013 |
| 2012 |
| 2011 | ||||||||||
Statements of Operations Data: (in thousands, except per share amounts) |
|
|
|
|
|
|
|
|
| ||||||||||
Revenue | $ | 13,338,397 | |
| $ | 13,839,590 | |
| $ | 10,845,164 | |
| $ | 10,285,507 | |
| $ | 10,409,840 | |
Gross profit | 1,191,791 | |
| 1,099,004 | |
| 654,970 | |
| 656,737 | |
| 630,498 | | |||||
Operating income | 354,552 | |
| 308,507 | |
| 240,828 | |
| 255,012 | |
| 256,228 | | |||||
Net income | 208,607 | |
| 180,150 | |
| 152,322 | |
| 152,503 | |
| 150,553 | | |||||
Net income attributable to SYNNEX Corporation | 208,525 | |
| 180,034 | |
| 152,237 | |
| 151,376 | |
| 150,331 | | |||||
Earnings per share attributable to SYNNEX Corporation: |
|
|
|
|
|
|
|
|
| ||||||||||
Basic: | $ | 5.28 | |
| $ | 4.61 | |
| $ | 4.06 | |
| $ | 4.08 | |
| $ | 4.13 | |
Diluted: | $ | 5.24 | |
| $ | 4.57 | |
| $ | 3.02 | |
| $ | 3.96 | |
| $ | 4.04 | |
Cash dividends declared per share | $ | 0.58 | |
| $ | 0.13 | |
| $ | - | |
| $ | - | |
| $ | - | |
For the fiscal year ended November 30, 2013, the numerator for the computation of "Earnings per share attributable to SYNNEX Corporation - Diluted" was adjusted for dilutive changes in the estimated value of the conversion premium of our convertible debt from April 2013 through the final settlement dates. The adjustment to the numerator had the effect of reducing our "Earnings per share attributable to SYNNEX Corporation - Diluted" by $0.97 for the fiscal year ended November 30, 2013.
| As of November 30, | ||||||||||||||||||
| 2015 |
| 2014 |
| 2013 |
| 2012 |
| 2011 | ||||||||||
Balance Sheet Data: (in thousands) |
|
|
|
|
|
|
|
|
| ||||||||||
Cash and cash equivalents | $ | 336,072 | |
| $ | 180,143 | |
| $ | 151,622 | |
| $ | 163,699 | |
| $ | 67,571 | |
Working capital | 1,731,624 | |
| 1,178,260 | |
| 1,142,355 | |
| 1,085,754 | |
| 1,066,162 | | |||||
Total assets | 4,444,147 | |
| 4,713,042 | |
| 3,325,889 | |
| 2,963,262 | |
| 2,833,295 | | |||||
Borrowings, current | 92,093 | |
| 716,257 | |
| 252,523 | |
| 194,134 | |
| 159,200 | | |||||
Long-term borrowings | 638,798 | |
| 264,246 | |
| 65,405 | |
| 81,152 | |
| 223,822 | | |||||
Total equity | 1,799,897 | |
| 1,653,985 | |
| 1,411,641 | |
| 1,319,355 | |
| 1,168,458 | | |||||
| Fiscal Years Ended November 30, | ||||||||||||||||||
| 2015 |
| 2014 |
| 2013 |
| 2012 |
| 2011 | ||||||||||
Other Data: (in thousands) |
|
|
|
|
|
|
|
|
| ||||||||||
Depreciation and amortization | $ | 103,510 | |
| $ | 91,699 | |
| $ | 24,462 | |
| $ | 24,630 | |
| $ | 24,673 | |
Item 7. Management's Discussion and Analysis of Financial Condition and Results of Operations
The following discussion and analysis of our financial condition and results of operations should be read in conjunction with Selected Consolidated Financial Data and the Consolidated Financial Statements and related Notes included elsewhere in this Report.
24
Table of Contents
When used in this Annual Report on Form 10-K or the Report, the words "believes," "plans," "estimates," "anticipates," "expects," "intends," "allows," "can," "may," "designed," "will," and similar expressions are intended to identify forward-looking statements. These are statements that relate to future periods and include statements about market trends, our business model and our services, our market strategy, including expansion of our product lines, our infrastructure, our investment in our information technology, or IT, systems, our employee hiring, impact of MiTAC Holdings Corporation, or MiTAC Holdings, ownership interest in us, our revenue and operating results, our gross margins, our inventory, competition with Synnex Technology International Corp., our future needs for additional financing, concentration of customers, our international operations, including foreign currency exchange rates, expansion of our operations and related effects, including our Concentrix business, our strategic acquisitions and divestitures of businesses and assets, adequacy of our cash resources to meet our capital needs, cash held by our foreign subsidiaries, adequacy of our disclosure controls and procedures, pricing pressures, competition, impact of economic and industry trends, impact of our accounting policies, our tax rates, our share repurchase and dividend program, and statements regarding our securitization programs and revolving credit lines. Forward-looking statements are subject to risks and uncertainties that could cause actual results to differ materially from those projected. These risks and uncertainties include, but are not limited to, those risks discussed herein, as well as the seasonality of the buying patterns of our customers, concentration of sales to large customers, dependence upon and trends in capital spending budgets in the IT, and consumer electronics, or CE, industries, fluctuations in general economic conditions and risks set forth under Part I, Item 1A, "Risk Factors." These forward-looking statements speak only as of the date hereof. We expressly disclaim any obligation or undertaking to release publicly any updates or revisions to any forward-looking statements contained herein to reflect any change in our expectations with regard thereto or any change in events, conditions or circumstances on which any such statement is based.
For an understanding of SYNNEX and the significant factors that influenced the Company's performance during the past three fiscal years, the following discussion should be read in conjunction with the description of the business appearing in Item 1 of this Report and the consolidated financial statements, including the related notes and schedule, and other information appearing in Item 15 of this Report.
Revenue and Cost of Revenue
We derive our Technology Solutions revenue primarily through the distribution of peripherals, IT systems, system components, software, networking/communications/security equipment and CE products, and the provision of servers, storage and networking solutions for our design and integration solutions customers' data centers. Shipping terms are typically F.O.B. shipping point. In our Concentrix segment, we provide high value business services and solutions for the customer relationship life cycle. Our customer contracts typically consist of a master services agreement or statement of work, which contains the terms and conditions of each program or service we offer. Our agreements can range from less than one year to over five years and are subject to early termination by our customers or us for any reason, typically with 30 to 90 days notice.
In fiscal years 2015 , 2014 and 2013 , over 25% of our total revenue was generated from our international operations, and we expect this trend to continue. As a result, our revenue growth has been impacted, and we expect will continue to be impacted, by fluctuations in foreign currency exchange rates.
The market for IT products and services is generally characterized by declining unit prices and short product life cycles. Our overall business is also highly competitive on the basis of price. We set our sales price based on the market supply and demand characteristics for each particular product or bundle of products we distribute and solutions we provide. From time to time, we also participate in the incentive and rebate programs of our OEM suppliers. These programs are important determinants of the final sales price we charge to our reseller customers. To mitigate the risk of declining prices and obsolescence of our distribution inventory, our OEM suppliers generally offer us limited price protection and return rights for products that are marked down or discontinued by them. We carefully manage our inventory to maximize the benefit to us of these supplier provided protections.
A significant portion of our Technology Solutions cost of revenue is the purchase price we pay our OEM suppliers for the products we sell, net of any incentives, rebates and purchase discounts received from our OEM suppliers. Cost of product distribution revenue also consists of provisions for inventory losses and write-downs, freight expenses associated with the receipt in and shipment out of our inventory, and royalties due to OEM vendors. In addition, cost of revenue includes the cost of materials, labor and overhead for our systems design and integration solutions. In our Concentrix segment, cost of revenue consists primarily of personnel costs related to contract delivery.
Revenue and cost of revenue in our Technology Solutions segment relate to products, and revenue and cost of revenue in our Concentrix segment relate to services.
25
Table of Contents
Margins
The Technology Solutions industry in which we operate is characterized by low gross profit as a percentage of revenue, or gross margin, and low income from operations as a percentage of revenue, or operating margin. Our Technology Solutions gross margin has fluctuated annually due to changes in the mix of products we offer, customers we sell to, incentives and rebates received from our OEM suppliers, competition, seasonality and replacement of less profitable business with investments in higher margin, more profitable lines, lower costs associated with increased efficiencies and inventory obsolescence. Should we experience increased competition arising from industry consolidation or low demand for IT products, our ability to maintain or improve our gross margin may be hindered. Generally, when our revenue becomes more concentrated on limited products or customers, our Technology Solutions gross margin tends to decrease due to increased pricing pressure from OEM suppliers or reseller customers. Concentrix gross margins, which are generally higher than those in our Technology Solution segment, can be impacted by additional lead time for programs to be fully scalable and transition and initial set-up costs. Our operating margin has also fluctuated in the past, based primarily on our ability to achieve economies of scale, the management of our operating expenses, changes in the relative mix of our Technology Solutions and Concentrix revenue, and the timing of our acquisitions and investments.
Economic and Industry Trends
Our Technology Solutions revenue is highly dependent on the end-market demand for IT and CE products. This end-market demand is influenced by many factors including the introduction of new IT and CE products and software by OEMs, replacement cycles for existing IT and CE products and overall economic growth and general business activity. A difficult and challenging economic environment may also lead to consolidation or decline in the IT and CE distribution industry and increased price-based competition. Our Technology Solutions business is largely concentrated in the United States, Canada and Japan, so we are affected by demand for our products in those regions and the strengthening or weakening of the Canadian Dollar and Japanese Yen relative to the U.S. Dollar.
The customer engagement services industry is competitive. Customers' performance measures are based on competitive pricing terms and quality of services. Accordingly, we could be subject to pricing pressure and may experience a decline in our average selling prices for our services. Our Concentrix business is largely concentrated in the United States, the United Kingdom, Japan, the Philippines and India, so we will be most directly impacted by economic strength or weakness in these geographies, and strengthening or weakening of local currency relative to U.S. Dollar. During fiscal years 2015 , 2014 and 2013 , the economic environment in the regions of our primary operations was stable and grew modestly.
Critical Accounting Policies and Estimates
The discussions and analysis of our consolidated financial condition and results of operations are based on our Consolidated Financial Statements, which have been prepared in conformity with generally accepted accounting principles in the United States. The preparation of these financial statements requires us to make estimates and assumptions that affect the reported amounts of assets and liabilities, disclosure of any contingent assets and liabilities at the financial statement date, and reported amounts of revenue and expenses during the reporting period. On an ongoing basis, we review and evaluate our estimates and assumptions, including those that relate to accounts receivable, vendor programs, inventories, goodwill and intangible assets, and income taxes. Our estimates are based on our historical experience and a variety of other assumptions that we believe to be reasonable under the circumstances, the results of which form the basis for making our judgment about the carrying values of assets and liabilities that are not readily available from other sources. Actual results could differ from these estimates under different assumptions or conditions.
We believe the following critical accounting policies involve the more significant judgments, estimates and/or assumptions used in the preparation of our Consolidated Financial Statements.
Revenue Recognition. Revenue from our Technology Solutions segment, consisting of the sales of vendor products, is categorized as product revenue in our Consolidated Statements of Operations. Revenue from our Concentrix segment is categorized as services in the Consolidated Statements of Operations.
For the Technology Solutions segment, we generally recognize revenue on the sale of hardware and software products when they are shipped or delivered and on services when they are performed, if persuasive evidence of an arrangement exists, the sales price is fixed or determinable, collection of resulting accounts receivable is reasonably assured, risk of loss and title have transferred and product returns are reasonably estimable. Binding purchase orders from customers together with agreement to our terms and conditions of sale by way of an executed agreement or other signed document constitutes evidence of an arrangement. In cases where payment is contingent on post delivery services and/or fulfillment of certain obligations and meeting certain conditions, revenue and cost of revenue are recognized on a straight-line basis over the term of the contracts as the contingencies are satisfied and payments become due. Where product acceptance provisions exist, assuming all other
26
Table of Contents
revenue recognition criterion are met, revenue is recognized upon the earlier of shipment/delivery for products that have been demonstrated to meet product specifications, customer acceptance or the lapse of acceptance provisions.
Provisions for sales returns and allowances are estimated based on historical data and are recorded concurrently with the recognition of revenue. These provisions are reviewed and adjusted periodically by the Company. Revenue is presented net of taxes collected from customers and remitted to government authorities. Revenue is reduced for early payment discounts and volume incentive rebates offered to customers. We recognize revenue on a net basis on certain contracts, including service contracts, post-contract software support services and extended warranty contracts, where we are not the primary obligor, by recognizing the margins earned in revenue with no associated cost of revenue.
For the Concentrix segment, we recognize revenue from services contracts when evidence of an arrangement exists, services are delivered, fees are fixed or determinable and collectability is reasonably assured. Service contracts may be based on a fixed price or on a fixed unit-price per transaction or other objective measure of output. Revenue on fixed price contracts is recognized on a straight-line basis over the term of the contract as services are provided. Revenue on unit-price transactions is recognized using an objective measure of output including staffing hours or the number of transactions processed by service agents. Customer contract terms typically can range from less than one year to more than five years. Revenue is reported net of any revenue-based taxes assessed by governmental authorities that are imposed on and concurrent with specific revenue-producing transactions.
Cost of Revenue. Cost of products revenue represents cost from our Technology Solutions segment and cost of services revenue represents cost from our Concentrix segment.
For the Technology Solutions segment, cost of revenue includes the product price paid to OEM suppliers, net of any incentives, rebates and purchase discounts received from the OEM suppliers. Cost of revenue also consists of provisions for inventory losses and write-downs, shipping and handling costs and royalties due to OEM vendors. In addition, cost of revenue includes the cost of materials, labor and overhead and warranty for design and integration activities.
For the Concentrix segment, recurring direct operating costs for services are recognized as incurred. Cost of services revenue consists primarily of personnel costs. Where a contract requires an up-front investment, which typically includes transition and set-up costs related to systems and processes, these amounts are allowed to be deferred and costs are amortized on a straight-line basis over the expected period of benefit, not to exceed the fixed term of the contract. We perform periodic reviews to assess the recoverability of deferred contract transition and setup costs. This review is done by comparing the estimated minimum remaining undiscounted cash flows of a contract to the unamortized contract costs. If such minimum undiscounted cash flows are not sufficient to recover the unamortized costs, an impairment loss is recognized for the difference between the estimated fair value and the carrying value.
Allowance for Doubtful Accounts. We provide allowances for doubtful accounts on our accounts receivable for estimated losses resulting from the inability of our customers to make payments for outstanding balances. In estimating the required allowance, we take into consideration the overall quality and aging of the accounts receivable, credit evaluations of customers' financial condition and existence of credit insurance. We also evaluate the collectability of accounts receivable based on specific customer circumstances, current economic trends, historical experience with collections and the value and adequacy of collateral received from customers.
OEM Supplier Programs. We receive funds from OEM suppliers for volume promotion programs, price protection and product rebates and record them as adjustments to cost of product revenue and the carrying value of inventories, as appropriate. Where there is a binding agreement, we track vendor promotional programs for volume discounts on a program-by-program basis and record them as a reduction of cost of revenue based on a systematic and rational allocation. We monitor the balances of vendor receivables on a quarterly basis and adjust the balances due for differences between expected and actual sales volume. Vendor receivables are generally collected through reductions authorized by the vendor to accounts payable. Funds received for specific marketing and infrastructure reimbursements, net of related costs, are recorded as adjustments to "Selling, general and administrative expenses," and any excess reimbursement amount is recorded as an adjustment to cost of product revenue.
Inventories. Our inventory levels are based on our projections of future demand and market conditions. Any sudden decline in demand and/or rapid product improvements and technological changes can cause us to have excess and/or obsolete inventories. On an ongoing basis, we review for estimated obsolete or unmarketable inventories and write-down our inventories to their estimated market value based upon our forecasts of future demand and market conditions. These write-downs are reflected in our cost of revenue. If actual market conditions are less favorable than our forecasts, additional inventory reserves may be required. Our estimates are influenced by the following considerations: sudden decline in demand due to economic downturns, rapid product improvements and technological changes, our ability to return to OEM suppliers a certain percentage of our purchases, and protection from loss in value of inventory under our OEM supplier agreements.
27
Table of Contents
Goodwill and Intangible Assets. Goodwill represents the excess of the purchase price over the fair value of the identifiable net assets acquired in an acquisition. We assess potential impairment of our goodwill and intangible assets when there is evidence that recent events or changes in circumstances have made recovery of an asset's carrying value unlikely. We also assess potential impairment of our goodwill on an annual basis during our fourth quarter, regardless if there is evidence or suspicion of impairment. The amount of an impairment loss would be recognized as the excess of the asset's carrying value over its fair value.
For the purpose of goodwill impairment analysis, we have two reporting units, the Technology Solutions reporting unit and the Concentrix reporting unit. Goodwill is tested for impairment at the reporting unit level by first performing a qualitative assessment to determine whether it is more likely than not that the fair value of the reporting unit is less than its carrying value. The factors that were considered in the qualitative analysis included macroeconomic conditions, industry and market considerations, cost factors such as increases in product cost, labor, or other costs that would have a negative effect on earnings and cash flows, and other relevant entity-specific events and information.
If the reporting unit does not pass the qualitative assessment, then the reporting unit's carrying value is compared to its fair value. The fair values of the reporting units are estimated using market and discounted cash flow approaches. The assumptions used in the market approach are based on the value of a business through an analysis of multiples of guideline companies and recent sales or offerings of a comparable entity. The assumptions used in the discounted cash flow approach are based on historical and forecasted revenue, operating costs, future economic conditions, and other relevant factors. Goodwill is considered impaired if the carrying value of the reporting unit exceeds its fair value. The annual goodwill impairment analysis did not result in an impairment charge for fiscal years 2015 , 2014 and 2013 .
Long-lived assets. We review the recoverability of our long-lived assets, such as intangible assets, property and equipment and certain other assets, when events or changes in circumstances occur that indicate the carrying value of the asset group may not be recoverable. The assessment of possible impairment is based on our ability to recover the carrying value of the asset or asset group from the expected future pre-tax cash flows, undiscounted and without interest charges, of the related operations. If these cash flows are less than the carrying value of such assets, an impairment loss is recognized for the difference between estimated fair value and carrying value.
Determining the fair value of a reporting unit, intangible asset or a long-lived asset is judgmental and involves the use of significant estimates and assumptions. We base our fair value estimates on assumptions that we believe are reasonable, but are uncertain and subject to changes in market conditions.
Income Taxes. We estimate our income taxes in each of the tax jurisdictions in which we operate. Our current tax expense is estimated after adjusting for differences resulting from the different treatment of certain items and foreign tax credits. These differences may result in deferred tax assets and liabilities, which are included in our Consolidated Balance Sheets. We assess the likelihood that our deferred tax assets, which include net operating loss carry forwards and temporary differences that are expected to be deductible in future years, will be recoverable from future taxable income or other tax planning strategies. If recovery is not likely, we provide a valuation allowance based on our estimates of future taxable income in the various tax jurisdictions, and the amount of deferred taxes in excess of amounts that are ultimately considered more likely than not realizable. The provision for current and deferred taxes involves evaluations and judgments of uncertainties in the interpretation of complex tax regulations by various tax authorities. Actual results could differ from our estimates.
We recognize tax benefits from uncertain tax positions only if that tax position is more likely than not to be sustained on examination by the taxing authorities, based on the technical merits of the position. We measure the tax benefits recognized in the financial statements from such positions based on the largest benefit that has a greater than 50% likelihood of being realized upon settlement. We recognize interest and penalties related to unrecognized tax benefits in the provisions for income taxes.
Acquisitions
We continually seek to augment our product and service offerings through both internal expansion and strategic acquisitions of businesses and assets that complement and expand our global operational capabilities. We also divest businesses that we deem no longer strategic to our ongoing operations. Our historical acquisitions have extended the geographic reach of our operations, particularly in targeted markets, and have diversified and expanded the services we provide to our customers and OEM suppliers. Our prior acquisitions have brought us new reseller and retail customers, OEM suppliers, product lines and service offerings and technological capabilities. There were no acquisitions or divestitures during fiscal year 2015.
Acquisitions during fiscal year 2014
In fiscal year 2014, we acquired the assets of the Customer Relationship Management, or CRM, business of International Business Machines, or IBM, for a purchase price of $425.7 million . A portion of the purchase price was settled through the
28
Table of Contents
issuance of 1,266,357 shares of our common stock at a fair value of $71.1 million based on the closing price of our common stock on the date of issuance, with the remaining amount of the purchase price paid in cash. The purchase price allocation consisted of $22.5 million of net tangible assets, $269.0 million of intangible assets and $134.2 million of goodwill.
The acquisition has been integrated into the Concentrix segment. It expands our service portfolio, delivery capabilities and geographic reach, and brings deep process expertise and managerial talent, and contributed approximately $900 million revenue in fiscal year 2014.
Acquisitions during fiscal year 2013
In April 2013, we acquired substantially all of the assets of Supercom Canada Limited, or Supercom Canada, a distributor of IT and consumer electronics products and services in Canada. The purchase price was approximately $36.7 million (CAD37.6 million). Subsequent to the acquisition, we repaid debt and working capital lines in the amount of $53.7 million. Based on the purchase price allocation, we recorded net tangible assets of $26.9 million, goodwill of $5.4 million and intangible assets of $4.4 million in relation to this acquisition. The acquisition is integrated into the Technology Solutions segment and has expanded our existing product and service offerings in Canada.
Results of Operations
The following table sets forth, for the indicated periods, data as percentages of total revenue:
Statements of Operations Data: | Fiscal Years Ended November 30, | |||||||
| 2015 |
| 2014 |
| 2013 | |||
Products revenue | 89.49 | % |
| 92.17 | % |
| 98.35 | % |
Services revenue | 10.51 | |
| 7.83 | |
| 1.65 | |
Total revenue | 100.00 | |
| 100.00 | |
| 100.00 | |
Cost of products revenue | (84.54 | ) |
| (87.26 | ) |
| (92.98 | ) |
Cost of services revenue | (6.52 | ) |
| (4.80 | ) |
| (0.98 | ) |
Gross profit | 8.94 | |
| 7.94 | |
| 6.04 | |
Selling, general and administrative expenses | (6.28 | ) |
| (5.71 | ) |
| (3.82 | ) |
Operating income | 2.66 | |
| 2.23 | |
| 2.22 | |
Interest expense and finance charges, net | (0.20 | ) |
| (0.19 | ) |
| (0.16 | ) |
Other income (expense), net | (0.01 | ) |
| 0.01 | |
| 0.13 | |
Income before income taxes | 2.45 | |
| 2.05 | |
| 2.19 | |
Provision for income taxes | (0.89 | ) |
| (0.75 | ) |
| (0.79 | ) |
Net income | 1.56 | |
| 1.30 | |
| 1.40 | |
Net income attributable to noncontrolling interest | (0.00 | ) |
| (0.00 | ) |
| (0.00 | ) |
Net income attributable to SYNNEX Corporation | 1.56 | |
| 1.30 | |
| 1.40 | |
Certain non-GAAP financial information
In addition to disclosing financial results that are determined in accordance with accounting principles generally accepted in the United States ("GAAP"), the company also discloses certain non-GAAP financial information, including:
• | Revenue in constant currency, which is revenue adjusted for the translation effect of foreign currencies so that certain financial results can be viewed without the impact of fluctuations in foreign currency exchange rates, thereby facilitating period-to-period comparisons of the Company's business performance. Revenue in constant currency is calculated by translating the revenue of fiscal years 2015 and 2014 in local currency using their comparable prior year's currency conversion rate. This approach is used for countries where the functional currency is the local currency. Generally, when the dollar either strengthens or weakens against other currencies, the growth at constant currency rates or adjusting for currency will be higher or lower than growth reported at actual exchange rates. |
• | Non-GAAP operating income, which is operating income as adjusted to exclude intangible asset amortization, and IBM CRM acquisition and other integration expenses; and |
29
Table of Contents
• | Non-GAAP operating margin, which is defined as Non-GAAP operating income (as defined above) divided by revenue. |
• | Adjusted earnings before interest, taxes, depreciation and amortization, or Adjusted EBITDA, which is Non-GAAP operating income as defined above after excluding depreciation expenses. |
• | Non-GAAP diluted earnings per common share ("EPS"), which is defined as diluted EPS excluding the per share, tax effected impact of (i) IBM CRM acquisition and other integration expenses, and (ii) amortization of intangible assets. |
Management believes that providing this additional information is useful to the reader to better assess and understand the company's operating performance, especially when comparing results with previous periods and for planning and forecasting in future periods, primarily because management typically monitors the business adjusted for these items in addition to GAAP results. Management also uses these non-GAAP measures to establish operational goals and, in some cases, for measuring performance for compensation purposes. However, analysis of results on a non-GAAP basis should be used as a complement to, and in conjunction with, data presented in accordance with GAAP. Additionally, because these non-GAAP measures are not calculated in accordance with GAAP, they may not necessarily be comparable to similarly titled measures employed by other companies .
Non-GAAP Financial Information: | Fiscal Years Ended November 30, | ||||||||||
| 2015 |
| 2014 |
| 2013 | ||||||
| (in thousands, except per share amounts) | ||||||||||
Revenue | $ | 13,338,397 | |
| $ | 13,839,590 | |
| $ | 10,845,164 | |
Foreign currency translation | 439,229 | |
| 231,980 | |
| - | | |||
Revenue in constant currency | 13,777,626 | |
| 14,071,570 | |
| 10,845,164 | | |||
|
|
|
|
|
| ||||||
Operating income | $ | 354,552 | |
| $ | 308,507 | |
| $ | 240,828 | |
IBM CRM acquisition and other integration expenses | 10,109 | |
| 43,036 | |
| 8,394 | | |||
Amortization of intangibles | 54,756 | |
| 55,161 | |
| 7,953 | | |||
Non-GAAP operating income | 419,417 | |
| 406,704 | |
| 257,175 | | |||
Depreciation | 48,754 | |
| 36,538 | |
| 16,509 | | |||
Adjusted EBITDA | 468,171 | |
| 443,242 | |
| 273,684 | | |||
|
|
|
|
|
| ||||||
Operating margin | 2.66 | % |
| 2.23 | % |
| 2.22 | % | |||
Non-GAAP operating margin | 3.14 | % |
| 2.94 | % |
| 2.37 | % | |||
|
|
|
|
|
| ||||||
Diluted EPS | $ | 5.24 | |
| $ | 4.57 | |
| $ | 3.02 | |
Impact of conversion premium on EPS (1) | - | |
| - | |
| 0.97 | | |||
IBM CRM acquisition and other integration expenses, net of taxes (2) | 0.16 | |
| 0.70 | |
| 0.16 | | |||
Amortization of intangibles, net of taxes (2) | 0.88 | |
| 0.89 | |
| 0.13 | | |||
Non-GAAP diluted EPS | 6.28 | |
| 6.16 | |
| 4.28 | | |||
__________________________
(1) For fiscal year ended November 30, 2013, net income for the purpose of computation of diluted EPS was adjusted for the change in the estimated value of the conversion premium of the convertible notes from April 2013 through the final settlement date. The convertible notes were settled in the third quarter of fiscal year 2013.
(2) The tax effect of the non-GAAP adjustments was calculated using the applicable effective tax rate during the years, except for IBM CRM acquisition and other integration expenses for fiscal year 2013, which was calculated using the tax deductible portion of the expenses and applying the entity-specific, U.S. Federal and blended state tax rates.
30
Table of Contents
Fiscal Years Ended November 30, 2015 , 2014 and 2013
Revenue
| Fiscal Years Ended November 30, |
| Percent Change | ||||||||||||||
| 2015 |
| 2014 |
| 2013 |
| 2015 to 2014 |
| 2014 to 2013 | ||||||||
|
|
| (in thousands) |
|
|
|
|
|
| ||||||||
Revenue | $ | 13,338,397 | |
| $ | 13,839,590 | |
| $ | 10,845,164 | |
| (3.6 | )% |
| 27.6 | % |
Technology Solutions revenue | 11,936,660 | |
| 12,755,514 | |
| 10,666,215 | |
| (6.4 | )% |
| 19.6 | % | |||
Concentrix revenue | 1,416,670 | |
| 1,096,214 | |
| 189,463 | |
| 29.2 | % |
| 478.6 | % | |||
Inter-segment elimination | (14,933 | ) |
| (12,138 | ) |
| (10,514 | ) |
| | |
| | | |||
In our Technology Solutions segment, we distribute in excess of 30,000 technology products (as measured by active SKUs) from more than 300 IT, CE and OEM suppliers to more than 20,000 resellers. The prices of our products are highly dependent on the volumes purchased within a product category. The products we sell from one period to the next are often not comparable because of rapid changes in product models and features. The revenue generated in our Concentrix segment relates to global business services process optimization, customer engagement strategy and back office automation. Inter-segment elimination represents services and transactions generated between our reportable segments that are eliminated on consolidation.
Revenue in our Technology Solutions segment decreased in fiscal year 2015 from fiscal year 2014 primarily due to the loss of a significant vendor providing consumer retail products, as a result of its acquisition by a third party, and the negative impact of foreign currency translation, primarily from the weakening of the Canadian Dollar and Japanese Yen. On a constant currency basis, revenue in our Technology Solutions segment during fiscal year 2015 decreased by 3.7%, compared to fiscal year 2014.
By product category, our sales of peripherals, IT Systems and software in fiscal year 2015 were lower by 14%, 6% and 1%, respectively, in comparison to fiscal year 2014. The decrease in the sale of peripherals was due to lower sales of audio products as a result of the loss of one significant vendor (mentioned above), partially offset by higher sales of system accessories. The decrease in the sale of IT systems was due to weaker demand for desktops, laptops and tablets. This revenue decrease was offset by a 13% increase in the sale of networking equipment and a 3% increase in integration solutions and systems components sales.
The increase in revenue in our Concentrix segment in fiscal year 2015, compared to fiscal year 2014, was primarily due to the full year impact of the acquisition of the IBM CRM business with the initial closing completed on January 31, 2014 and the subsequent closings completed on April 30, 2014 and September 30, 2015, increased volume and the expansion of services from existing customers and new customer contract signings. This increase was partially offset by unfavorable foreign currency translation, primarily due to the weakening of the British Pound, Japanese Yen, Australian Dollar and the Euro. On a constant currency basis, revenue in our Concentrix segment increased by 37.2% during fiscal year 2015, compared to fiscal year 2014.
Revenue in our Technology Solutions segment in fiscal year 2014 increased from fiscal year 2013 due to strong commercial and consumer electronics retail sales growth in the United States and strong demand for our systems design and integration solutions. Japan experienced strong consumer revenue growth in the first half of 2014 due to the consumption tax increase in April 2014. In comparison to fiscal year 2013, revenue in fiscal year 2014 was negatively impacted by 2.2% for the translation impact of foreign exchange rates, primarily from the weakening of the Japanese Yen and the Canadian Dollar. On a constant currency basis, revenue increased by 21.8% in fiscal year 2014, compared to fiscal year 2013.
By product category, our sales of system components and integration solutions, IT systems, peripherals, software and networking equipment in fiscal year 2014 were higher by 46%, 20%, 13%, 11% and 10%, respectively, in comparison to fiscal year 2013. The increase in the sale of system components and integration was due to the expansion of our system design and integration solutions business. The increase in the sale of IT systems was primarily due to higher sales of laptops, tablets and desktops. The increase in the sale of peripherals was primarily due to higher sales of audio products and system accessories. The increase in the sale of software was primarily due to higher sales from IT system software and gaming products.
The increase in revenue in our Concentrix segment in fiscal year 2014, compared to fiscal year 2013 was primarily due to the acquisition of the IBM CRM business. The acquisition added approximately $900.0 million in revenue to our consolidated results in fiscal year 2014.
31
Table of Contents
Gross Profit
| Fiscal Years Ended November 30, |
| Percent Change | ||||||||||||||
| 2015 |
| 2014 |
| 2013 |
| 2015 to 2014 |
| 2014 to 2013 | ||||||||
|
|
| (in thousands) |
|
|
|
|
|
| ||||||||
Gross profit | $ | 1,191,791 | |
| $ | 1,099,004 | |
| $ | 654,970 | |
| 8.4 | % |
| 67.8 | % |
Gross margin | 8.94 | % |
| 7.94 | % |
| 6.04 | % |
| |
| | |||||
Our gross margin is affected by a variety of factors, including our sources of revenue by segments, competition, average selling prices, mix of products and services we sell, our customers, product costs along with rebate and discount programs from our suppliers, reserves or settlement adjustments, freight costs, charges for inventory losses, acquisitions and divestitures of business units and fluctuations in revenue. Concentrix margins, which are generally higher than those in our Technology Solutions segment, can be impacted by additional lead time for programs to be fully scalable, and transition and initial set-up costs.
The increase in our gross profit in fiscal year 2015 as compared to fiscal year 2014 was primarily due to an increase in our Concentrix segment gross profit of $114.4 million as compared to the prior year. This increase in Concentrix gross profit was partially offset by a decrease in our Technology Solutions gross profit by $19.8 million. This relative change in the mix of our gross profit as well as an increase in our products gross margin resulted in an increase in our gross margin in fiscal year 2015 as compared to fiscal year 2014.
Our Technology Solutions gross profit decreased in fiscal year 2015 as compared to fiscal year 2014 due to a decrease in our products revenue as mentioned earlier. This decrease in gross profit was partially offset by foreign currency exchange benefits associated with our system design and integration solutions and lower inventory reserves. Technology Solutions gross margin in fiscal year 2015 benefited from the aforementioned foreign currency exchange benefit and lower inventory reserves.
The increase in Concentrix gross profit is primarily due to higher revenue driven by the full year impact of our acquisition of the IBM CRM business with the initial closing completed on January 31, 2014 and the second closing completed on April 30, 2014. These increases in gross profit were partially offset by losses of $17.8 million associated with one customer contract and foreign currency translation losses. Gross margin in our Concentrix segment was lower in fiscal year 2015 compared to fiscal year 2014 primarily due to losses from one customer contract as previously mentioned.
The increase in our gross margins in fiscal year 2014, compared to fiscal year 2013, was primarily due to the change in our business mix as a result of our acquisition of the IBM CRM business in fiscal year 2014.
Selling, General and Administrative Expenses
| Fiscal Years Ended November 30, |
| Percent Change | ||||||||||||||
| 2015 |
| 2014 |
| 2013 |
| 2015 to 2014 |
| 2014 to 2013 | ||||||||
| (in thousands) |
|
|
|
| ||||||||||||
Selling, general and administrative expenses | $ | 837,239 | |
| $ | 790,497 | |
| $ | 414,142 | |
| 5.9 | % |
| 90.9 | % |
Percentage of revenue | 6.28 | % |
| 5.71 | % |
| 3.82 | % |
|
|
|
| |||||
Our selling, general and administrative expenses primarily consist of personnel costs such as salaries, commissions, bonuses, share-based compensation and temporary personnel costs. Selling, general and administrative expenses also include costs incurred in relation to the acquisition and integration of businesses, cost of facilities, utility expenses, professional fees, depreciation on our capital equipment, bad debt expense, amortization of our non-technology related intangible assets, and marketing expenses, offset in part by reimbursements from our OEM suppliers.
The increase in our selling, general and administrative expenses in the fiscal year 2015 compared to fiscal year 2014, was primarily due to higher overhead costs to support growth in our Concentrix segment and full year impact of IBM CRM business, partially offset by lower integration expenses in our Concentrix segment related to the IBM CRM business acquisition in fiscal year 2014 and foreign currency exchange rate fluctuation, primarily due to the weakening of Japanese Yen, Canadian Dollar and Indian Rupee. We incurred $10.1 million acquisition-related and integration expenses in fiscal year 2015 compared to $43.0 million in fiscal year 2014. Amortization of intangible assets included in "Selling, general and administrative expenses" was $53.6 million in fiscal year 2015, compared to $54.5 million in fiscal year 2014.
The increase in our selling, general and administrative expenses in fiscal year 2014 compared to fiscal year 2013 both in terms of absolute dollars and a percentage of revenue was primarily the result of our acquisition of the IBM CRM business in
32
Table of Contents
the Concentrix segment, commencing on January 31, 2014 and completed on September 30, 2014. We incurred $43.0 million in acquisition-related and integration expenses in our Concentrix segment related to the IBM CRM business acquisition in fiscal year 2014, compared to $7.5 million during fiscal year 2013. The amortization of our intangible assets was $54.5 million in fiscal year 2014, compared to $8.0 million in fiscal year 2013, primarily as a result of the acquisition of IBM's CRM business. In addition, we incurred higher personnel cost and operating overhead due to higher headcount to support our growth in our Technology Solutions segment. These higher expenses were offset in part by a decrease of $8.5 million as a result of fluctuations in foreign exchange rates, primarily due to the weakening of the Canadian Dollar and the Japanese Yen.
Operating Income
| Fiscal Years Ended November 30, |
| Percent Change | ||||||||||||||
| 2015 |
| 2014 |
| 2013 |
| 2015 to 2014 |
| 2014 to 2013 | ||||||||
|
|
| (in thousands) |
|
|
|
|
|
| ||||||||
Operating income | $ | 354,552 | |
| $ | 308,507 | |
| $ | 240,828 | |
| 14.9 | % |
| 28.1 | % |
Operating margin | 2.66 | % |
| 2.23 | % |
| 2.22 | % |
|
|
|
| |||||
Technology Solutions operating income | 302,950 | |
| 305,499 | |
| 237,290 | |
| (0.8 | )% |
| 28.7 | % | |||
Technology Solutions operating margin | 2.54 | % |
| 2.40 | % |
| 2.22 | % |
|
|
|
| |||||
Concentrix operating income | 51,127 | |
| 2,455 | |
| 3,249 | |
| 1,982.6 | % |
| (24.4 | )% | |||
Concentrix operating margin | 3.61 | % |
| 0.22 | % |
| 1.71 | % |
|
|
|
| |||||
Inter-segment elimination | 475 | |
| 553 | |
| 289 | |
| |
| | | ||||
Our operating margin was higher in fiscal year 2015 compared to fiscal year 2014 primarily due to higher profit in our Concentrix segment. The operating margin in our Technology Solutions segment in fiscal year 2015 increased primarily due to higher margin on products and solutions. Operating margin in our Concentrix segment in fiscal year 2015 increased primarily due to continued investments in our priority verticals, including banking and financial services, healthcare and pharmaceuticals, insurance and technology. In addition, we benefited from lower acquisition-related and integration expenses for the IBM CRM acquisition compared to fiscal year 2014 as mentioned above. IBM CRM acquisition-related and integration expenses were $10.1 million in 2015, compared to $43.0 million in fiscal year 2014.
Our operating margin in fiscal year 2014 was consistent with fiscal year 2013 primarily due to growth of our U.S. Technology Solutions business, offset by higher selling, general and administrative expenses in our Concentrix segment. The operating margin of our Technology Solutions segment increased in fiscal year 2014 compared to fiscal year 2013 primarily due to the growth in our U.S. Technology Solutions business. The operating margin of our Concentrix segment in fiscal year 2014 was adversely affected by $43.0 million in acquisition-related and integration expenses incurred in relation to our acquisition of the IBM CRM business, compared to $8.4 million in fiscal year 2013. In addition, the amortization of our intangible assets in the Concentrix segment was $51.0 million in fiscal year 2014 as compared to $4.0 million as a result of this acquisition.
Interest Expense and Finance Charges, Net
| Fiscal Years Ended November 30, |
| Percent Change | ||||||||||||||
| 2015 |
| 2014 |
| 2013 |
| 2015 to 2014 |
| 2014 to 2013 | ||||||||
|
|
| (in thousands) | |
|
|
|
|
|
| |||||||
Interest expense and finance charges, net | $ | 26,296 | |
| $ | 25,187 | |
| $ | 17,115 | |
| 4.4 | % |
| 47.2 | % |
Percentage of revenue | 0.20 | % |
| 0.19 | % |
| 0.16 | % |
|
|
|
| |||||
Amounts recorded in interest expense and finance charges, net, consist primarily of interest expense paid on our lines of credit and other debt, fees associated with third party accounts receivable flooring arrangements and the sale or pledge of accounts receivable through our securitization facilities, offset by income earned on our cash investments. Interest expense recorded in fiscal year 2013 also includes non-cash interest expense incurred on our convertible debt, which was settled in August 2013.
The increase in our interest expense and finance charges, net in fiscal year 2015, compared to fiscal year 2014, was primarily due to lower interest income from our long term projects in Mexico which ended in fiscal year 2014. Gross interest expense decreased by $0.6 million in fiscal year 2015 as compared to fiscal year 2014 primarily due to lower average borrowings during fiscal year 2015 as compared to fiscal year 2014. This decrease was partially offset by an increase in flooring fees in fiscal year 2015 as compared to fiscal year 2014. In May 2015, we borrowed an additional $411.3 million under
33
Table of Contents
an increase term loan commitment in the United States and paid down our United States securitization arrangement and revolving line of credit to secure higher credit availability. The term loan carries a higher rate of interest than our revolving lines of credit and our accounts receivable securitization arrangement. At the same time, we entered into interest rate swaps, which effectively converted a portion of our floating rate term loan in the United States to a fixed interest rate, which is higher than the prevailing floating rate.
The increase in our interest expense and finance charges, net during fiscal year 2014, compared to fiscal year 2013, is primarily the result of the increase in borrowing levels primarily to fund the acquisition of the IBM CRM business, to infuse working capital into the newly acquired business and to invest in growing our Technology Solutions business. This increase was partially offset by the settlement of the convertible debt in August 2013. The fiscal year 2013 interest expense included approximately $5.3 million in cash and non-cash interest expense components related to the convertible debt.
Other Income (expense), Net
| Fiscal Years Ended November 30, |
| Percent Change | ||||||||||||||
| 2015 |
| 2014 |
| 2013 |
| 2015 to 2014 |
| 2014 to 2013 | ||||||||
|
|
| (in thousands) |
|
|
|
|
|
| ||||||||
Other income (expense), net | $ | (1,061 | ) |
| $ | 962 | |
| $ | 14,339 | |
| (210.3 | )% |
| (93.3 | )% |
Percentage of revenue | (0.01 | )% |
| 0.01 | % |
| 0.13 | % |
|
|
|
| |||||
Amounts recorded as other income (expense), net include foreign currency transaction gains and losses, investment gains and losses (including those in our deferred compensation plan) and other non-operating gains and losses.
The decrease in other income (expense), net in fiscal year 2015, compared to fiscal year 2014, was primarily due to a $2.9 million benefit received in fiscal year 2014 from a class-action legal settlement. This decrease was partially offset by higher foreign exchange gains of $0.9 million in fiscal year 2015.
The decrease in other income (expense), net in fiscal year 2014, compared to fiscal year 2013, was primarily due to a $9.4 million benefit from a class-action legal settlement in fiscal year 2013. In addition, other income (expense), net decreased in fiscal year 2014 compared to fiscal year 2013 due to higher foreign exchange losses.
Provision for Income Taxes
Income taxes consist of our current and deferred tax expense resulting from our income earned in domestic and foreign jurisdictions.
Our effective tax rate in fiscal year 2015 was 36.2% , compared to 36.6% and 36.0% in fiscal years 2014 and 2013 , respectively. The decrease in our effective tax rate in fiscal year 2015, compared to fiscal year 2014, was due to the mix of income in different geographic regions and the reversal of certain tax reserves as a result of the expiration of the statute of limitations in certain tax jurisdiction. The increase in our effective tax rate in fiscal year 2014 compared to fiscal year 2013 was due to mix of income in different geographic regions offset by utilization of certain net operating loss carry-forwards.
Further information on the treatment of undistributed foreign earnings and a reconciliation of the federal statutory income tax rate to our effective tax rate can be found in Note 17 of Part II, Item 8 of this Annual Report on Form 10-K.
Net Income Attributable to Noncontrolling Interests
Net income attributable to noncontrolling interests represents the share of net income attributable to others, which is recognized for the portion of our subsidiaries' equity not owned by us. The change in the net income (loss) attributable to noncontrolling interests as compared to the prior two years was not material to our results of operations.
Liquidity and Capital Resources
Cash Flows
Our business is working capital intensive. Our working capital needs are primarily to finance accounts receivable and inventory. We rely heavily on term loans, accounts receivable arrangements, our securitization programs and our revolver programs for our working capital needs. We have financed our growth and cash needs to date primarily through cash generated from operations and financing activities.
34
Table of Contents
To increase our market share and better serve our customers, we may further expand our operations through investments or acquisitions. We expect that such expansion would require an initial investment in working capital, personnel, facilities and operations. These investments or acquisitions would likely be funded primarily by our existing cash and cash equivalents, additional borrowings, or issuing common stock.
Net cash provided by operating activities was $643.6 million in fiscal year 2015 , primarily generated from our net income of $208.6 million , adjustments for non-cash items of $127.9 million , a decrease in accounts receivable of $292.9 million and a decrease in inventory of $40.1 million , partially offset by a decrease in accounts payable of $26.0 million and an increase in other assets of $14.5 million . The adjustments for non-cash items primarily consist of $103.5 million of depreciation and amortization expense and the amounts associated with share-based compensation.
Net cash used in operating activities was $234.8 million in fiscal year 2014, primarily due to an increase in accounts receivable of $527.9 million, an increase of inventory of $330.2 million and an increase of other assets of $25.8 million, partially offset by net income of $180.2 million, non-cash items of $86.5 million, an increase of accounts payable of $205.1 million and an increase of accrued liabilities of $167.7 million. The increases in our working capital balances were primarily the result of our higher business volumes, the growth of our system design and integration solutions business and the acquisition of the IBM CRM business in fiscal year 2014. The adjustments for non-cash items primarily consist of $91.7 million of depreciation and amortization expense and $14.1 million in share-based compensation expense.
Net cash provided by operating activities was $35.7 million in fiscal year 2013, primarily generated from our net income of $152.3 million, adjustments for non-cash items of $40.2 million and $186.2 million higher accounts payable balances, partially offset by $187.5 million higher accounts receivable balances and $155.2 million higher inventory balances. The increases in our working capital balances were primarily the result of our higher business volumes. The adjustments for non-cash items primarily consist of $24.5 million of depreciation and amortization expense, $9.2 million in share-based compensation expense, $2.3 million accretion of discount on our Convertible Senior Notes and $3.0 million provision for doubtful accounts.
Net cash used in investing activities in fiscal year 2015 was $116.1 million , primarily due to $100.1 million invested in capital expenditures to support our growth as a result of our acquisition of the IBM CRM business and higher organic business volumes and an increase in restricted cash of $54.4 million , partially offset by cash receipts of $37.3 million from IBM towards working capital and other post-closing adjustments related to the acquisition of the IBM CRM business, net of holdback payments to IBM.
Net cash used in investing activities in fiscal year 2014 was $441.7 million, primarily due to cash payment of $384.4 million for the acquisition of the IBM CRM business and $57.4 million invested in capital expenditures to support our growth as a result of our acquisition and higher organic business volumes. These cash outflows were offset in part by $4.2 million proceeds from maturity of our term deposit, net of purchase.
Net cash used in investing activities in fiscal year 2013 was $43.8 million, primarily due to our investment in capital expenditures of $29.0 million and cash paid for acquisitions of $27.1 million. Our capital expenditures included the purchase of a building in Fremont, California for $7.8 million and other investments to support our growth and enhance productivity. Cash paid for acquisitions primarily consisted of $25.7 million paid toward the acquisition of Supercom Canada, net of cash received. These outflows were offset by $4.2 million received from the sale of our equity-method investee SB Pacific Limited in fiscal year 2012, proceeds of $3.1 million from the sale of our deferred compensation investments, net of purchases and a reduction of $5.1 million in our restricted cash balances due to the completion of our obligations to third party contractors under our long-term projects in Mexico.
Net cash used in financing activities in fiscal year 2015 was $355.1 million , consisting primarily of $245.2 million of payments towards our securitization arrangement, revolving lines of credit and term loans, net of receipts and issuance costs, a decrease in our book overdraft of $82.2 million and dividend payments of $22.6 million . During fiscal year 2015, we amended our U.S. credit facility to increase the term loan to $625.0 million and paid in full outstanding borrowings under our U.S. securitization arrangement and our U.S. revolving credit facility. As of November 30, 2015, we repaid $7.8 million for the term loan.
Net cash generated from financing activities in fiscal year 2014 was $701.9 million, consisting primarily of $678.8 million of net receipts from our securitization arrangement, revolving lines of credit and term loans and an increase in our book overdraft of $27.8 million. The increase in borrowings was primarily to fund the acquisition and working capital requirements of the newly acquired IBM CRM business and our working capital requirement related to our systems design and integration solutions business. These cash inflows were partially offset by payment of contingent consideration of $7.5 million for prior acquisitions and dividends paid of $4.9 million.
35
Table of Contents
Net cash used in financing activities in fiscal year 2013 was $8.4 million, consisting primarily of $218.9 million paid for the settlement of the Convertible Senior Notes. In addition, we paid $11.4 million for the fiscal year 2012 purchase of shares of our subsidiary SYNNEX Infotec from the noncontrolling interest. Cash used for the repurchase of treasury stock was $1.9 million. These payments were partially offset by $153.2 million net receipts from our revolving lines of credit and term loans, a $60.5 million higher book overdraft, $5.4 million excess tax benefit from share based compensation and $4.6 million proceeds from the issue of common stock upon the exercise of employee stock awards, net of taxes paid.
We believe our current cash balances and credit availability are sufficient to support our operating activities for at least the next twelve months.
Capital Resources
Our cash and cash equivalents totaled $336.1 million and $180.1 million as of November 30, 2015 and 2014 , respectively. Of our total cash and cash equivalents, the cash held by our foreign subsidiaries was $146.5 million and $174.8 million as of November 30, 2015 and 2014 , respectively. Repatriation of the cash held by our foreign subsidiaries would be subject to United States federal income taxes. Also, repatriation of some foreign balances is restricted by local laws. However, we have historically fully utilized and reinvested all foreign cash to fund our foreign operations and expansion. If in the future our intentions change and we repatriate the cash back to the United States, we will report in our consolidated financial statements the impact of the applicable taxes depending upon the planned timing and manner of such repatriation. Presently, we believe we have sufficient resources, cash flow and liquidity within the United States to fund current and expected future working capital, investment and other general corporate funding requirements.
As of November 30, 2015 , there were approximately $396.2 million of cumulative undistributed earnings of foreign subsidiaries. Repatriation of the undistributed earnings would be subject to United States federal income taxes, less applicable foreign taxes. Also, repatriation of some foreign balances is restricted by local laws. We have not provided for U.S. federal income tax or foreign withholding taxes on foreign subsidiaries' undistributed earnings as currently we have no plan to repatriate those earnings back to the United States. Further, it is not currently practical to estimate the amount of income tax that might be payable if any earnings were to be distributed by individual foreign subsidiaries. However, if in the future we repatriate the undistributed earnings of foreign subsidiaries to the United States in the form of dividend or otherwise, we will include the impact of expected U.S. taxes as well as local taxes and withholding taxes in the provision for income taxes and also in the deferred taxes or tax payable liabilities depending upon the planned timing and manner of such repatriation.
We believe that our available cash and cash equivalents balances, the cash flows expected to be generated from operations and our existing sources of liquidity will be sufficient to satisfy our current and planned working capital and investment needs for the next twelve months in all geographies. We also believe that our longer-term working capital, planned capital expenditures, anticipated stock repurchases, dividend payments and other general corporate funding requirements will be satisfied through cash flows from operations and, to the extent necessary, from our borrowing facilities and future financial market activities.
Historically, we have renewed our accounts receivable securitization program and our U.S. credit facility agreement on, or prior to, their respective expiration dates. We have no reason to believe that these arrangements will not be renewed as we continue to be in good credit standing with the participating financial institutions. We have had similar borrowing arrangements with various financial institutions throughout our years as a public company.
On-Balance Sheet Arrangements
We have an accounts receivable securitization program, or the U.S. Arrangement to finance our operations in the United States. The U.S. Arrangement has a maturity date of November 4, 2016. One of our subsidiaries, which is the borrower under the U.S. Arrangement, can borrow up to a maximum of $600.0 million based upon eligible trade accounts receivable generated by our parent company and one of its United States subsidiaries. The U.S. Arrangement includes an accordion feature to allow requests for an increase in the lenders' commitment by an additional $100.0 million. The effective borrowing cost under the U.S. Arrangement is a blended rate that includes prevailing dealer commercial paper rates and the daily London Interbank Offered Rate, or LIBOR, plus a program fee of 0.375% per annum based on the used portion of the commitment, and a facility fee of 0.40% per annum payable on the aggregate commitment of the lenders. As of November 30, 2015 , there were no outstanding balances under the U.S. Arrangement, and there was $578.0 million outstanding as of November 30, 2014.
Under the terms of the U.S. Arrangement, our parent company and one of its United States subsidiaries sell, on a revolving basis, their receivables (other than certain specifically excluded receivables) to a wholly-owned, bankruptcy-remote subsidiary. The borrowings are funded by pledging all of the rights, title and interest in and to the receivables acquired by our subsidiary as security. Any borrowings under the U.S. Arrangement are recorded as debt on our Consolidated Balance Sheets.
36
Table of Contents
As is customary in trade accounts receivable securitization arrangements, a credit rating agency's downgrade of the third party issuer of commercial paper or of a back-up liquidity provider (which provides a source of funding if the commercial paper market cannot be accessed) could result in an increase in our cost of borrowing or loss of our financing capacity under these programs if the commercial paper issuer or liquidity back-up provider is not replaced, or if the lender whose commercial paper issuer or liquidity back-up provider is not replaced does not elect to offer us an alternate rate. Loss of such financing capacity could have a material adverse effect on our financial condition and results of operations.
In November 2013, we entered into a senior secured credit agreement, or the U.S. Credit Agreement, which was comprised of a $275.0 million revolving credit facility and a $225.0 million term loan, which was advanced to us on February 3, 2014. In May 2015, the U.S. Credit Agreement was amended to increase the term loan to $625.0 million . We may request incremental commitments to increase the principal amount of revolving loans or term loans available under the U.S. Credit Agreement up to $350.0 million . The U.S. Credit Agreement matures in May 2020. Interest on borrowings under the U.S. Credit Agreement can be based on LIBOR or a base rate at our option. Loans borrowed under the U.S. Credit Agreement bear interest, in the case of LIBOR loans, at a per annum rate equal to the applicable LIBOR, plus a margin which may range from 1.50% to 2.25% , based on our consolidated leverage ratios, as determined in accordance with the U.S. Credit Agreement. Loans borrowed under the U.S. Credit Agreement that are not LIBOR loans, and are instead base rate loans, bear interest at a per annum rate equal to (i) the greatest of (A) the Federal Funds Rate plus a margin of 1/2 of 1.0%, (B) LIBOR plus 1.0% per annum, and (C) the rate of interest announced, from time to time, by the agent, Bank of America, N.A, as its "prime rate," plus (ii) a margin which may range from 0.50% to 1.25% , based on our consolidated leverage ratios as determined in accordance with the U.S. Credit Agreement. The outstanding principal amount of the term loan is repayable in quarterly installments, in an amount equal to (a) for each of the first eight full calendar quarters ending after the U.S. Credit Agreement amendment entered in May 2015, 1.25% of the amended principal amount of the term loan, (b) for each of the next four calendar quarters ending thereafter, 1.875% of the amended principal amount of the term loan, (c) for each calendar quarter ending thereafter, 2.50% of the amended principal amount of the term loan and (d) on the May 2020 maturity date of the term loan, the outstanding principal amount of the term loan. Our obligations under the U.S. Credit Agreement are secured by substantially all of the parent company's and its United States domestic subsidiaries' assets and are guaranteed by certain of our United States domestic subsidiaries.
As of November 30, 2015 and November 30, 2014 , balances outstanding under the term loan component of the U.S. Credit Agreement were $617.2 million and $219.4 million, respectively. There were no borrowings outstanding under the revolving credit facility as of November 30, 2015 , and there was $60.0 million outstanding as of November 30, 2014 . In addition, there was $1.5 million outstanding as of both November 30, 2015 and November 30, 2014 , in standby letters of credit under the U.S. Credit Agreement.
SYNNEX Canada Limited, or SYNNEX Canada, has a revolving line of credit arrangement with a group of financial institutions, or the Canadian Revolving Arrangement which has a maximum commitment of CAD100.0 million , or $74.8 million , and includes an accordion feature to increase the maximum commitment by an additional CAD25.0 million , or $18.7 million , to CAD125.0 million , or $93.5 million , at SYNNEX Canada's request. The Canadian Revolving Arrangement also provides a sublimit of $5.0 million for the issuance of standby letters of credit. As of both November 30, 2015 and 2014 , there were no letters of credit outstanding. SYNNEX Canada has granted a security interest in substantially all of its assets in favor of the lender under the Canadian Revolving Arrangement. In addition, we pledged our stock in SYNNEX Canada as collateral for the Canadian Revolving Arrangement. The interest rate applicable under the Canadian Revolving Arrangement is equal to (i) the Canadian base rate plus a margin of 0.75% for a Base Rate Loan in Canadian Dollars, (ii) the US base rate plus a margin of 0.75% for a Base Rate Loan in U.S. Dollars, and (iii) the Bankers' Acceptance rate, or BA, plus a margin of 2.00% for a BA Rate Loan. The Canadian base rate means the greater of (a) the prime rate determined by a major Canadian financial institution and (b) the one month Canadian Dealer Offered Rate, or CDOR, (the average rate applicable to Canadian Dollar bankers' acceptances for the applicable period) plus 1.50%. The US base rate means the greater of (a) a reference rate determined by a major Canadian financial institution for US dollar loans made to Canadian borrowers and (b) the US federal funds rate plus 0.50%. A fee of 0.25% per annum is payable with respect to the unused portion of the commitment. The credit arrangement expires in May 2017. As of November 30, 2015 and 2014 , borrowings outstanding under the Canadian Revolving Arrangement were $9.7 million and $30.7 million , respectively.
SYNNEX Canada has a term loan associated with the purchase of its logistics facility in Guelph, Canada. The interest rate for the unpaid principal amount is a fixed rate of 5.374% per annum. The final maturity date for repayment of the unpaid principal is April 1, 2017. The balances outstanding on the term loan as of November 30, 2015 and 2014 was $4.7 million and $6.2 million , respectively.
In November 2015, SYNNEX Infotec entered into a credit agreement with a group of financial institutions for a maximum commitment of JPY14.0 billion , or $113.7 million , to replace its existing credit facility with another syndicated credit facility. The new credit agreement is comprised of a JPY6.0 billion , or $48.7 million , term loan and a JPY8.0 billion , or
37
Table of Contents
$65.0 million , short-term revolving credit facility. The interest rate for the term loan and revolving credit facility is based on the Tokyo Interbank Offered Rate plus a margin of 0.70% per annum. The unused line fee on the revolving credit facility is 0.10% per annum. This credit facility expires in November 2018. As of November 30, 2015 and November 30, 2014 , the balances outstanding under the related credit facilities were $96.7 million and $54.0 million , respectively. The term loan can be repaid at any time prior to expiration date without penalty. We have guaranteed the obligations of SYNNEX Infotec under this facility.
In 2015, our Indian subsidiaries entered into credit agreements with a financial institution to borrow up to an aggregate amount of $14.0 million for working capital purposes. The interest rate for the credit facility is based on LIBOR plus a margin of 0.90% per annum. The credit facilities expire in June 2016 and will extend upon the financial institution's review and approval. We guarantee up to 100% of the outstanding principal amount to the lenders. As of November 30, 2015, there were no outstanding borrowings under these credit facilities.
In September 2013, SYNNEX Infotec established a short-term revolving credit facility of JPY2.0 billion, or $16.2 million , with a financial institution. The interest rate for the credit facility is based on TIBOR plus a margin of 0.50% per annum. In addition, there is a facility fee of 0.425% per annum. The credit facility can be renewed annually. As of November 30, 2015 , there were no outstanding balances under this credit facility, and there was $16.9 million outstanding as of November 30, 2014 .
SYNNEX Infotec has a short-term revolving credit facility of JPY1.0 billion , or $8.1 million , with a financial institution. The credit facility can be renewed annually and bears an interest rate that is based on TIBOR plus a margin of 1.20% per annum. As of November 30, 2015 , there were no balances outstanding under this credit facility and there was $8.4 million outstanding as of November 30, 2014 .
As of November 30, 2015 and 2014 , we also had $2.6 million and $6.9 million , respectively, in obligations for the sale and financing of approved accounts receivable and notes receivable with recourse provisions to SYNNEX Infotec and outstanding capital lease obligations.
The maximum commitment amounts for local currency credit facilities in Canada and Japan have been translated into United States Dollars at November 30, 2015 exchange rates.
Off-Balance Sheet Arrangements
In Japan, we have a factoring program under which trade accounts receivable of certain customers may be sold, without recourse, to financial institutions. Available capacity under these programs is dependent on the level of our trade accounts receivable eligible to be sold into these programs and the financial institutions' willingness to purchase such receivables. At November 30, 2015 and 2014 , we had a total of $3.1 million and $6.2 million , respectively, of trade accounts receivable sold to and held by the financial institution under this program.
We have third-party revolving short-term financing arrangements intended to facilitate the working capital requirements of certain customers. Under these agreements, the financial institutions pay us the selling price of products sold to various customers, less a discount, within approximately 15 to 30 days from the date of sale. We are contingently liable to repurchase inventory sold under flooring agreements in the event of any default by our customers under the agreement and such inventory being repossessed by the financial institutions. There have been no repurchases through November 30, 2015 under these agreements and we are not aware of any pending customer defaults or repossession obligations. As of November 30, 2015 and 2014 , accounts receivable subject to flooring agreements were $55.3 million and $93.5 million , respectively. For more information on our third-party revolving short-term financing arrangements, see Note 10 to the Consolidated Financial Statements in Item 8, which is incorporated herein by reference.
Covenant Compliance
Our borrowing arrangements have a number of covenants and restrictions that, among other things, require us to comply with certain financial and other covenants. These covenants require us to maintain specified financial ratios and satisfy certain financial condition tests, including leverage and fixed charge coverage ratios. They also limit our ability to incur additional debt, make intercompany loans, pay dividends and make other types of distributions, make certain acquisitions, repurchase our stock, create liens, cancel debt owed to us, enter into agreements with affiliates, modify the nature of our business, enter into sale-leaseback transactions, make certain investments, enter into new real estate leases, transfer and sell assets, cancel or terminate any material contracts and merge or consolidate. As of November 30, 2015 , we were in compliance with all material covenants for the above arrangements.
38
Table of Contents
Contractual Obligations
Our contractual obligations consist of future payments due under our loans, capital leases and operating lease arrangements. The following table summarizes our contractual obligations at November 30, 2015 :
| Payments Due by Period | ||||||||||||||||||
| Total |
| Less than 1 Year |
| 1 - 3 Years |
| 3 - 5 Years |
| > 5 Years | ||||||||||
| (in thousands) | ||||||||||||||||||
Contractual Obligations: |
|
|
|
|
|
|
|
|
| ||||||||||
Principal debt payments | $ | 730,831 | |
| $ | 92,069 | |
| $ | 136,049 | |
| $ | 501,528 | |
| $ | 1,185 | |
Interest on debt | 75,564 | |
| 17,901 | |
| 32,847 | |
| 24,768 | |
| 48 | | |||||
Non-cancellable capital leases | 60 | |
| 24 | |
| 22 | |
| 14 | |
| - | | |||||
Non-cancellable operating leases | 302,693 | |
| 64,531 | |
| 104,374 | |
| 73,492 | |
| 60,296 | | |||||
Total | $ | 1,109,148 | |
| $ | 174,525 | |
| $ | 273,292 | |
| $ | 599,802 | |
| $ | 61,529 | |
We, as the ultimate parent, guaranteed the obligations of SYNNEX Investment Holdings Corporation up to $35.0 million in connection with the sale of China Civilink (Cayman), which operated in China as HiChina Web Solutions, to Alibaba.com Limited. The guarantee expires in fiscal year 2018.
We are contingently liable under agreements to repurchase repossessed inventory acquired by flooring companies as a result of default on a floor plan financing arrangement by our customers. As of November 30, 2015 and November 30, 2014 , accounts receivable subject to flooring agreements were $55.3 million and $93.5 million , respectively.
As of November 30, 2015 , we have established a reserve of $22.8 million for unrecognized tax benefits. As we are unable to reasonably predict the timing of settlement of these guarantees and the reserve for unrecognized tax benefits, the table above excludes such liabilities.
Related Party Transactions
We have a business relationship with MiTAC Holdings, a publicly-traded company in Taiwan, which began in 1992 when MiTAC Holdings became our primary investor through its affiliates. As of both November 30, 2015 and 2014 , MiTAC Holdings and its affiliates beneficially owned approximately 25% of our outstanding common stock. Matthew Miau, our Chairman Emeritus of the Board of Directors and director, is the Chairman of MiTAC Holdings' and a director or officer of MiTAC Holdings' affiliates.
The shares owned by MiTAC Holdings are held by the following entities:
| As of November 30, 2015 | |
| (shares in thousands) | |
MiTAC Holdings (1) | 5,552 | |
Synnex Technology International Corp. (2) | 4,283 | |
Total | 9,835 | |
(1) | Shares are held via Silver Star Developments Ltd., a wholly-owned subsidiary of MiTAC Holdings. Excludes 373 thousand shares directly held by Matthew Miau and 224 thousand shares indirectly held by Mathew Miau through a charitable remainder trust. |
(2) | Synnex Technology International Corp. ("Synnex Technology International") is a separate entity from the Company and is a publicly-traded corporation in Taiwan. Shares are held via Peer Development Ltd., a wholly-owned subsidiary of Synnex Technology International. MiTAC Holdings owns a noncontrolling interest of 8.7% in MiTAC Incorporated, a privately-held Taiwanese company, which in turn holds a noncontrolling interest of 13.6% in Synnex Technology International. Neither MiTAC Holdings nor Mr. Miau is affiliated with any person(s), entity, or entities that hold a majority interest in MiTAC Incorporated. |
MiTAC Holdings generally has significant influence over us regarding matters submitted to stockholders for consideration, including any merger or acquisition of ours. Among other things, this could have the effect of delaying, deterring or preventing a change of control over us.
We purchased inventories from MiTAC Holdings and its affiliates totaling $87.1 million , $102.8 million and $31.4 million during fiscal years 2015 , 2014 and 2013 , respectively. Our sales to MiTAC Holdings and its affiliates during fiscal
39
Table of Contents
years 2015 , 2014 and 2013 totaled $1.3 million , $4.1 million and $4.5 million , respectively. In addition, we received reimbursements of rent and overhead costs for facilities used by MiTAC Holdings and its affiliates amounting to $0.1 million , $0.1 million and $3.1 million during fiscal years ended November 30, 2015 , 2014 and 2013 , respectively.
Our business relationship with MiTAC Holdings and its affiliates has been informal and is not governed by long-term commitments or arrangements with respect to pricing terms, revenue or capacity commitments. We negotiate pricing and other material terms on a case-by-case basis with MiTAC Holdings. While MiTAC Holdings is a related party, we believe that the significant terms under our arrangements with MiTAC Holdings, including pricing, do not materially differ from the terms we could have negotiated with unaffiliated third parties, and we have adopted a policy requiring that material transactions with MiTAC Holdings or its related parties be approved by its Audit Committee, which is composed solely of independent directors. In addition, Matthew Miau's compensation is approved by the Nominating and Corporate Governance Committee, which is also composed solely of independent directors.
Synnex Technology International is a publicly-traded corporation in Taiwan that currently provides distribution and fulfillment services to various markets in Asia and Australia, and is also our potential competitor. MiTAC Holdings and its affiliates are not restricted from competing with us.
Recent Accounting Pronouncements
For a summary of recent accounting pronouncements and the anticipated effects on our consolidated financial statements see Note 2 to the Consolidated Financial Statements, which is incorporated by reference herein.
Item 7A. Quantitative and Qualitative Disclosures about Market Risk
Foreign Currency Risk
We are exposed to foreign currency risk in the ordinary course of business. We manage cash flow exposures for our major countries using a combination of forward contracts. Principal currencies hedged are the Canadian Dollar, British Pound, Indian Rupee and Mexican Peso. These instruments are generally short-term in nature, with typical maturities of less than one year. We do not hold or issue derivative financial instruments for trading purposes.
The following table presents the hypothetical changes in fair values of our outstanding foreign currency derivative instruments as of November 30, 2015 and 2014 , arising from an instantaneous strengthening or weakening of the U.S. dollar by 5%, 10% and 15% (in thousands).
| Loss on Derivative Instruments Given a Weakening of U.S. dollar by X Percent |
| Gain (Loss) Assuming No Change in Exchange Rate |
| Gain on Derivative Instruments Given a Strengthening of U.S. dollar by X Percent | ||||||||||||||||||||||
| 15% |
| 10% |
| 5% |
| 5% |
| 10% |
| 15% | ||||||||||||||||
Forward contracts at November 30, 2015 | $ | (22,488 | ) |
| $ | (13,664 | ) |
| $ | (5,769 | ) |
| $ | 1,287 | |
| $ | 7,766 | |
| $ | 13,611 | |
| $ | 18,947 | |
Forward contracts at November 30, 2014 | $ | (46,841 | ) |
| $ | (27,924 | ) |
| $ | (10,998 | ) |
| $ | 4,387 | |
| $ | 18,017 | |
| $ | 30,547 | |
| $ | 41,987 | |
We do not apply hedge accounting to our forward contracts. Our foreign exchange contracts are marked-to-market and any material gains and losses on our hedge contracts resulting from a hypothetical, instantaneous change in the strength of the U.S. dollar would be significantly offset by mark-to-market gains and losses on the corresponding assets and liabilities being hedged.
Interest Rate Risk
The interest obligations of certain debt obligations have floated relative to major interest rate benchmarks. To manage interest rate risk on the U.S. dollar-denominated floating-rate term loan maturing in 2020, the Company entered into interest rate swaps in May 2015 with an aggregate notional amount of $400 million , which effectively converted a portion of the floating rate debt to a fixed interest rate. The interest rate swaps are accounted as cash flow hedges. A 15% variation in our interest rates would not have a material impact on the fair value of our swaps.
The following tables present hypothetical interest expense related to our outstanding borrowings with variable interest rates (after considering the impact of the above mentioned swaps) for the years ended November 30, 2015 and 2014, arising from hypothetical parallel shifts in the respective countries' yield curves, of plus or minus 5%, 10% and 15% (in thousands).
40
Table of Contents
| Interest Expense Given an Interest Rate Decrease by X Percent |
| Actual Interest Expense Assuming No Change in Interest Rate |
| Interest Expense Given an Interest Rate Increase by X Percent | ||||||||||||||||||||||
| 15% |
| 10% |
| 5% |
| 5% |
| 10% |
| 15% | ||||||||||||||||
SYNNEX US | $ | 4,924 | |
| $ | 4,989 | |
| $ | 5,055 | |
| $ | 5,122 | |
| $ | 5,188 | |
| $ | 5,255 | |
| $ | 5,320 | |
SYNNEX Canada | 285 | |
| 302 | |
| 319 | |
| 336 | |
| 352 | |
| 369 | |
| 386 | | |||||||
SYNNEX Infotec | 833 | |
| 843 | |
| 852 | |
| 822 | |
| 870 | |
| 879 | |
| 889 | | |||||||
Total for the year ended November 30, 2015 | $ | 6,042 | |
| $ | 6,134 | |
| $ | 6,226 | |
| $ | 6,280 | |
| $ | 6,410 | |
| $ | 6,503 | |
| $ | 6,595 | |
| Interest Expense Given an Interest Rate Decrease by X Percent |
| Actual Interest Expense Assuming No Change in Interest Rate |
| Interest Expense Given an Interest Rate Increase by X Percent | ||||||||||||||||||||||
| 15% |
| 10% |
| 5% |
| 5% |
| 10% |
| 15% | ||||||||||||||||
SYNNEX US | $ | 11,331 | |
| $ | 11,727 | |
| $ | 12,122 | |
| $ | 12,518 | |
| $ | 12,913 | |
| $ | 13,309 | |
| $ | 13,704 | |
SYNNEX Canada | 979 | |
| 1,037 | |
| 1,095 | |
| 1,152 | |
| 1,210 | |
| 1,267 | |
| 1,325 | | |||||||
SYNNEX Infotec | 1,064 | |
| 1,072 | |
| 1,079 | |
| 1,086 | |
| 1,094 | |
| 1,101 | |
| 1,108 | | |||||||
Total for the year ended November 30, 2014 | $ | 13,374 | |
| $ | 13,836 | |
| $ | 14,296 | |
| $ | 14,756 | |
| $ | 15,217 | |
| $ | 15,677 | |
| $ | 16,137 | |
Equity Price Risk
The equity price risk associated with our marketable equity securities as of November 30, 2015 and 2014 is not material in relation to our consolidated financial position, results of operations or cash flow. Marketable equity securities include shares of common stock. The investments are classified as either trading or available-for-sale securities. Securities classified as trading are recorded at fair market value, based on quoted market prices and unrealized gains and losses are included in results of operations. Securities classified as available-for-sale are recorded at fair market value, based on quoted market prices and unrealized gains and losses are included in other comprehensive income. Realized gains and losses, which are calculated based on the specific identification method, are recorded in operations as incurred.
41
Table of Contents
Item 8. Financial Statements and Supplementary Data
INDEX
|
|
| Page |
Consolidated Financial Statements of SYNNEX Corporation |
|
Management's Report on Internal Control over Financial Reporting | 43 |
Report of Independent Registered Public Accounting Firm | 44 |
Consolidated Balance Sheets as of November 30, 2015 and 2014 | 45 |
Consolidated Statements of Operations for Fiscal Years Ended November 30, 201 5, 2014 and 2013 | 46 |
Consolidated Statements of Comprehensive Income for Fiscal Years Ended November 30, 201 5, 2014 and 2013 | 47 |
Consolidated Statements of Stockholders' Equity for Fiscal Years Ended November 30, 201 5, 2014 and 2013 | 48 |
Consolidated Statements of Cash Flows for Fiscal Years Ended November 30, 201 5, 2014 and 2013 | 49 |
Notes to Consolidated Financial Statements | 51 |
Selected Quarterly Consolidated Financial Data (Unaudited) | 81 |
|
|
Financial Statement Schedule |
|
Schedule II: Valuation and Qualifying Accounts for Fiscal Years Ended November 30, 201 5, 2014 and 2013 | 82 |
Financial statement schedules not listed above are either omitted because they are not applicable or the required information is shown in the Consolidated Financial Statements or in the Notes thereto.
42
Table of Contents
Management's Report on Internal Control over Financial Reporting
Our management is responsible for establishing and maintaining adequate internal control over financial reporting, as such term is defined in Exchange Act Rules 13a-15(f). Our internal control over financial reporting is designed to provide reasonable assurance regarding the reliability of financial reporting and the preparation of financial statements for external purposes in accordance with generally accepted accounting principles. Our internal control over financial reporting includes those policies and procedures that (i) pertain to the maintenance of records that, in reasonable detail, accurately and fairly reflect the transactions and dispositions of our assets; (ii) provide reasonable assurance that transactions are recorded as necessary to permit preparation of financial statements in accordance with generally accepted accounting principles, and that receipts and expenditures of ours are being made only in accordance with authorizations of management and directors; and (iii) provide reasonable assurance regarding prevention or timely detection of unauthorized acquisition, use, or disposition of our assets that could have a material effect on the financial statements.
Because of its inherent limitations, internal control over financial reporting may not prevent or detect misstatements. Also, projections of any evaluation of effectiveness to future periods are subject to the risk that controls may become inadequate because of changes in conditions, or that the degree of compliance with the policies or procedures may deteriorate.
Under the supervision and with the participation of our management, including our principal executive officer and principal financial officer, we conducted an evaluation of the effectiveness of our internal control over financial reporting based on the framework in Internal Control-Integrated Framework (1992 framework) issued by the Committee of Sponsoring Organizations of the Treadway Commission. Based on this assessment, our management concludes that, as of November 30, 2015 , our internal control over financial reporting was effective based on those criteria.
The effectiveness of our internal control over financial reporting as of November 30, 2015 has been audited by KPMG LLP, an independent registered public accounting firm, as stated in their report which appears on page 44 of this Annual Report on Form 10-K.
43
Table of Contents
Report of Independent Registered Public Accounting Firm
The Board of Directors and Stockholders
SYNNEX Corporation:
We have audited the accompanying consolidated balance sheets of SYNNEX Corporation and subsidiaries (the Company) as of November 30, 2015 and 2014, and the related consolidated statements of operations, comprehensive income, stockholders' equity, and cash flows for each of the years in the three-year period ended November 30, 2015. In connection with our audits of the consolidated financial statements, we also have audited the financial statement schedule of valuation and qualifying accounts as listed in the accompanying index. We also have audited SYNNEX Corporation's internal control over financial reporting as of November 30, 2015, based on criteria established in Internal Control - Integrated Framework (1992) issued by the Committee of Sponsoring Organizations of the Treadway Commission (COSO). SYNNEX Corporation's management is responsible for these consolidated financial statements and financial statement schedule, for maintaining effective internal control over financial reporting, and for its assessment of the effectiveness of internal control over financial reporting, included in the accompanying Management's Report on Internal Control over Financial Reporting . Our responsibility is to express an opinion on these consolidated financial statements and an opinion on the Company's internal control over financial reporting based on our audits.
We conducted our audits in accordance with the standards of the Public Company Accounting Oversight Board (United States). Those standards require that we plan and perform the audits to obtain reasonable assurance about whether the financial statements are free of material misstatement and whether effective internal control over financial reporting was maintained in all material respects. Our audits of the consolidated financial statements included examining, on a test basis, evidence supporting the amounts and disclosures in the financial statements, assessing the accounting principles used and significant estimates made by management, and evaluating the overall financial statement presentation. Our audit of internal control over financial reporting included obtaining an understanding of internal control over financial reporting, assessing the risk that a material weakness exists, and testing and evaluating the design and operating effectiveness of internal control based on the assessed risk. Our audits also included performing such other procedures as we considered necessary in the circumstances. We believe that our audits provide a reasonable basis for our opinions.
A company's internal control over financial reporting is a process designed to provide reasonable assurance regarding the reliability of financial reporting and the preparation of financial statements for external purposes in accordance with generally accepted accounting principles. A company's internal control over financial reporting includes those policies and procedures that (1) pertain to the maintenance of records that, in reasonable detail, accurately and fairly reflect the transactions and dispositions of the assets of the company; (2) provide reasonable assurance that transactions are recorded as necessary to permit preparation of financial statements in accordance with generally accepted accounting principles, and that receipts and expenditures of the company are being made only in accordance with authorizations of management and directors of the company; and (3) provide reasonable assurance regarding prevention or timely detection of unauthorized acquisition, use, or disposition of the company's assets that could have a material effect on the financial statements.
Because of its inherent limitations, internal control over financial reporting may not prevent or detect misstatements. Also, projections of any evaluation of effectiveness to future periods are subject to the risk that controls may become inadequate because of changes in conditions, or that the degree of compliance with the policies or procedures may deteriorate.
In our opinion, the consolidated financial statements referred to above present fairly, in all material respects, the financial position of the Company as of November 30, 2015 and 2014, and the results of its operations and its cash flows for each of the years in the three-year period ended November 30, 2015, in conformity with U.S. generally accepted accounting principles. Also in our opinion, the related financial statement schedule, when considered in relation to the basic consolidated financial statements taken as a whole, presents fairly, in all material respects, the information set forth therein. Also in our opinion, the Company maintained, in all material respects, effective internal control over financial reporting as of November 30, 2015, based on criteria established in Internal Control - Integrated Framework (1992) issued by the Committee of Sponsoring Organizations of the Treadway Commission (COSO).
/s/ KPMG LLP
Santa Clara, California
January 28, 2016
44
Table of Contents
SYNNEX CORPORATION
CONSOLIDATED BALANCE SHEETS
(currency and share amounts in thousands, except for par value)
| November 30, |
| November 30, | ||||
ASSETS |
|
|
| ||||
Current assets: |
|
|
| ||||
Cash and cash equivalents | $ | 336,072 | |
| $ | 180,143 | |
Restricted cash | 88,558 | |
| 34,269 | | ||
Short-term investments | 5,546 | |
| 7,128 | | ||
Accounts receivable, net | 1,759,491 | |
| 2,091,511 | | ||
Receivable from related parties | 114 | |
| 332 | | ||
Inventories | 1,328,967 | |
| 1,398,463 | | ||
Current deferred tax assets | 40,510 | |
| 34,310 | | ||
Other current assets | 90,523 | |
| 153,833 | | ||
Total current assets | 3,649,781 | |
| 3,899,989 | | ||
Property and equipment, net | 248,627 | |
| 200,803 | | ||
Goodwill | 298,785 | |
| 314,213 | | ||
Intangible assets, net | 166,567 | |
| 229,684 | | ||
Deferred tax assets | 19,849 | |
| 10,790 | | ||
Other assets | 60,538 | |
| 57,563 | | ||
Total assets | $ | 4,444,147 | |
| $ | 4,713,042 | |
LIABILITIES AND EQUITY |
|
|
| ||||
Current liabilities: |
|
|
| ||||
Borrowings, current | $ | 92,093 | |
| $ | 716,257 | |
Accounts payable | 1,445,194 | |
| 1,585,606 | | ||
Payable to related parties | 7,661 | |
| 5,129 | | ||
Accrued compensation and benefits | 135,453 | |
| 125,733 | | ||
Other accrued liabilities | 218,687 | |
| 265,875 | | ||
Income taxes payable | 19,069 | |
| 23,129 | | ||
Total current liabilities | 1,918,157 | |
| 2,721,729 | | ||
Long-term borrowings | 638,798 | |
| 264,246 | | ||
Other long-term liabilities | 76,582 | |
| 60,215 | | ||
Deferred tax liabilities | 10,713 | |
| 12,867 | | ||
Total liabilities | 2,644,250 | |
| 3,059,057 | | ||
Commitments and contingencies (Note 18) | |
| | ||||
SYNNEX Corporation stockholders' equity: |
|
|
| ||||
Preferred stock, $0.001 par value, 5,000 shares authorized, no shares issued or outstanding | - | |
| - | | ||
Common stock, $0.001 par value, 100,000 shares authorized, 40,350 and 39,847 shares issued as of November 30, 2015 and 2014, respectively | 40 | |
| 40 | | ||
Additional paid-in capital | 411,687 | |
| 384,625 | | ||
Treasury stock, 1,161 and 923 shares as of November 30, 2015 and 2014, respectively | (51,287 | ) |
| (32,723 | ) | ||
Accumulated other comprehensive income (loss) | (55,237 | ) |
| (6,628 | ) | ||
Retained earnings | 1,494,178 | |
| 1,308,244 | | ||
Total SYNNEX Corporation stockholders' equity | 1,799,381 | |
| 1,653,558 | | ||
Noncontrolling interest | 516 | |
| 427 | | ||
Total equity | 1,799,897 | |
| 1,653,985 | | ||
Total liabilities and equity | $ | 4,444,147 | |
| $ | 4,713,042 | |
The accompanying Notes are an integral part of these Consolidated Financial Statements.
45
Table of Contents
SYNNEX CORPORATION
CONSOLIDATED STATEMENTS OF OPERATIONS
(currency and share amounts in thousands, except for per share amounts)
| Fiscal Years Ended November 30, | ||||||||||
| 2015 |
| 2014 |
| 2013 | ||||||
Revenue: |
|
|
|
|
| ||||||
Products | $ | 11,936,282 | |
| $ | 12,755,264 | |
| $ | 10,665,886 | |
Services | 1,402,115 | |
| 1,084,326 | |
| 179,278 | | |||
Total revenue | 13,338,397 | |
| 13,839,590 | |
| 10,845,164 | | |||
Cost of revenue: |
|
|
|
|
| ||||||
Products | (11,276,819 | ) |
| (12,075,828 | ) |
| (10,084,060 | ) | |||
Services | (869,787 | ) |
| (664,758 | ) |
| (106,134 | ) | |||
Gross profit | 1,191,791 | |
| 1,099,004 | |
| 654,970 | | |||
Selling, general and administrative expenses | (837,239 | ) |
| (790,497 | ) |
| (414,142 | ) | |||
Operating income | 354,552 | |
| 308,507 | |
| 240,828 | | |||
Interest expense and finance charges, net | (26,296 | ) |
| (25,187 | ) |
| (17,115 | ) | |||
Other income (expense), net | (1,061 | ) |
| 962 | |
| 14,339 | | |||
Income before income taxes | 327,195 | |
| 284,282 | |
| 238,052 | | |||
Provision for income taxes | (118,588 | ) |
| (104,132 | ) |
| (85,730 | ) | |||
Net income | 208,607 | |
| 180,150 | |
| 152,322 | | |||
Net income attributable to noncontrolling interest | (82 | ) |
| (116 | ) |
| (85 | ) | |||
Net income attributable to SYNNEX Corporation | $ | 208,525 | |
| $ | 180,034 | |
| $ | 152,237 | |
Earnings attributable to SYNNEX Corporation per common share: |
|
|
|
|
| ||||||
Basic | $ | 5.28 | |
| $ | 4.61 | |
| $ | 4.06 | |
Diluted | $ | 5.24 | |
| $ | 4.57 | |
| $ | 3.02 | |
Weighted-average common shares outstanding: |
|
|
|
|
| ||||||
Basic | 39,061 | |
| 38,490 | |
| 36,888 | | |||
Diluted | 39,352 | |
| 38,845 | |
| 37,633 | | |||
Cash dividends declared per share | $ | 0.58 | |
| $ | 0.13 | |
| $ | - | |
The accompanying Notes are an integral part of these Consolidated Financial Statements.
46
Table of Contents
SYNNEX CORPORATION
CONSOLIDATED STATEMENTS OF COMPREHENSIVE INCOME
(currency in thousands)
| Fiscal Years Ended November 30, | ||||||||||
| 2015 |
| 2014 |
| 2013 | ||||||
Net income | $ | 208,607 | |
| $ | 180,150 | |
| $ | 152,322 | |
Other comprehensive income (loss): |
|
|
|
|
| ||||||
Unrealized gains on available-for-sale securities, net of tax of $(87), $(387) and $0 for fiscal years ended November 30, 2015, 2014 and 2013, respectively | 125 | |
| 280 | |
| 384 | | |||
Change in unrealized gains of defined benefit plan, net of tax of $0, $(159) and $0 for fiscal years ended November 30, 2015, 2014 and 2013, respectively | (103 | ) |
| 685 | |
| (271 | ) | |||
Unrealized losses on cash flow hedges, net of tax of $2,250, $0 and $0 for fiscal years ended November 30, 2015, 2014 and 2013, respectively | (3,539 | ) |
| - | |
| - | | |||
Foreign currency translation adjustments, net of tax of $3,349, $1,020 and $875 for fiscal years ended November 30, 2015, 2014 and 2013, respectively | (45,097 | ) |
| (26,781 | ) |
| (16,364 | ) | |||
Other comprehensive loss | (48,614 | ) |
| (25,816 | ) |
| (16,251 | ) | |||
Comprehensive income: | 159,993 | |
| 154,334 | |
| 136,071 | | |||
Comprehensive income attributable to noncontrolling interest | (77 | ) |
| (96 | ) |
| (71 | ) | |||
Comprehensive income attributable to SYNNEX Corporation | $ | 159,916 | |
| $ | 154,238 | |
| $ | 136,000 | |
The accompanying Notes are an integral part of these Consolidated Financial Statements.
47
Table of Contents
SYNNEX CORPORATION
CONSOLIDATED STATEMENTS OF STOCKHOLDERS' EQUITY
| SYNNEX Corporation Stockholders |
| Noncontrolling interest |
| Total equity | ||||||||||||||||||||||||||||
| Common stock |
| Additional paid-in capital |
| Treasury Stock |
| Accumulated other comprehensive income (loss) |
| Retained earnings |
| |||||||||||||||||||||||
| Shares |
| Amount |
| Shares |
| Amount | ||||||||||||||||||||||||||
Balances, November 30, 2012 | 37,348 | |
| $ | 37 | |
| $ | 324,292 | |
| 720 | |
| $ | (21,611 | ) |
| $ | 35,405 | |
| $ | 980,900 | |
| $ | 332 | |
| $ | 1,319,355 | |
Share-based compensation | - | |
| - | |
| 9,174 | |
| - | |
| - | |
| - | |
| - | |
| - | |
| 9,174 | | |||||||
Tax benefits from exercise of non-qualified stock options | - | |
| - | |
| 5,355 | |
| - | |
| - | |
| - | |
| - | |
| - | |
| 5,355 | | |||||||
Issuance of common stock on exercise of options, for employee stock purchase plan and vesting of restricted stock, net of shares withheld for employee taxes | 704 | |
| 1 | |
| 8,586 | |
| 67 | |
| (3,957 | ) |
| - | |
| - | |
| - | |
| 4,630 | | |||||||
Repurchases of common stock | - | |
| - | |
| - | |
| 55 | |
| (1,882 | ) |
| - | |
| - | |
| - | |
| (1,882 | ) | |||||||
Conversion premium of convertible debt | - | |
| - | |
| (75,120 | ) |
| - | |
| - | |
| - | |
| - | |
| - | |
| (75,120 | ) | |||||||
Deferred tax adjustment for settlement of convertible debt | - | |
| - | |
| 14,033 | |
| - | |
| - | |
| - | |
| - | |
| - | |
| 14,033 | | |||||||
Changes in ownership of noncontrolling interests | - | |
| - | |
| 9 | |
| - | |
| - | |
| - | |
| - | |
| 16 | |
| 25 | | |||||||
Other comprehensive loss | - | |
| - | |
| - | |
| - | |
| - | |
| (16,237 | ) |
| - | |
| (14 | ) |
| (16,251 | ) | |||||||
Net income | - | |
| - | |
| - | |
| - | |
| - | |
| - | |
| 152,237 | |
| 85 | |
| 152,322 | | |||||||
Balances, November 30, 2013 | 38,052 | |
| 38 | |
| 286,329 | |
| 842 | |
| (27,450 | ) |
| 19,168 | |
| 1,133,137 | |
| 419 | |
| 1,411,641 | | |||||||
Share-based compensation | - | |
| - | |
| 14,076 | |
| - | |
| - | |
| - | |
| - | |
| - | |
| 14,076 | | |||||||
Tax benefits from exercise of non-qualified stock options | - | |
| - | |
| 5,524 | |
| - | |
| - | |
| - | |
| - | |
| - | |
| 5,524 | | |||||||
Issuance of common stock on exercise of options, for employee stock purchase plan and vesting of restricted stock, net of shares withheld for employee taxes | 529 | |
| 1 | |
| 7,599 | |
| 81 | |
| (5,273 | ) |
| - | |
| - | |
| - | |
| 2,327 | | |||||||
Common stock issued for the acquisition of the IBM customer relationship management business | 1,266 | |
| 1 | |
| 71,105 | |
| - | |
| - | |
| - | |
| - | |
| - | |
| 71,106 | | |||||||
Cash dividends declared | - | |
| - | |
| - | |
| - | |
| - | |
| - | |
| (4,927 | ) |
| - | |
| (4,927 | ) | |||||||
Changes in ownership of noncontrolling interests | - | |
| - | |
| (8 | ) |
| - | |
| - | |
| - | |
| - | |
| (88 | ) |
| (96 | ) | |||||||
Other comprehensive loss | - | |
| - | |
| - | |
| - | |
| - | |
| (25,796 | ) |
| - | |
| (20 | ) |
| (25,816 | ) | |||||||
Net income | - | |
| - | |
| - | |
| - | |
| - | |
| - | |
| 180,034 | |
| 116 | |
| 180,150 | | |||||||
Balances, November 30, 2014 | 39,847 | |
| 40 | |
| 384,625 | |
| 923 | |
| (32,723 | ) |
| (6,628 | ) |
| 1,308,244 | |
| 427 | |
| 1,653,985 | | |||||||
Share-based compensation | - | |
| - | |
| 13,644 | |
| - | |
| - | |
| - | |
| - | |
| - | |
| 13,644 | | |||||||
Tax benefits from exercise of non-qualified stock options | - | |
| - | |
| 7,487 | |
| - | |
| - | |
| - | |
| - | |
| - | |
| 7,487 | | |||||||
Issuance of common stock on exercise of options, for employee stock purchase plan and vesting of restricted stock, net of shares withheld for employee taxes | 503 | |
| - | |
| 5,959 | |
| 118 | |
| (9,828 | ) |
| - | |
| - | |
| - | |
| (3,869 | ) | |||||||
Repurchases of common stock | - | |
| - | |
| - | |
| 120 | |
| (8,736 | ) |
| - | |
| - | |
| - | |
| (8,736 | ) | |||||||
Cash dividends declared | - | |
| - | |
| - | |
| - | |
| - | |
| - | |
| (22,591 | ) |
| - | |
| (22,591 | ) | |||||||
Changes in ownership of noncontrolling interests | - | |
| - | |
| (28 | ) |
| - | |
| - | |
| - | |
| - | |
| 12 | |
| (16 | ) | |||||||
Other comprehensive loss | - | |
| - | |
| - | |
| - | |
| - | |
| (48,609 | ) |
| - | |
| (5 | ) |
| (48,614 | ) | |||||||
Net income | - | |
| - | |
| - | |
| - | |
| - | |
| - | |
| 208,525 | |
| 82 | |
| 208,607 | | |||||||
Balances, November 30, 2015 | 40,350 | |
| $ | 40 | |
| $ | 411,687 | |
| 1,161 | |
| $ | (51,287 | ) |
| $ | (55,237 | ) |
| $ | 1,494,178 | |
| $ | 516 | |
| $ | 1,799,897 | |
The accompanying Notes are an integral part of these Consolidated Financial Statements.
48
Table of Contents
SYNNEX CORPORATION
CONSOLIDATED STATEMENTS OF CASH FLOWS
(currency in thousands)
| Fiscal Years Ended November 30, | ||||||||||
| 2015 |
| 2014 |
| 2013 | ||||||
Cash flows from operating activities: | |
| |
| | ||||||
Net income | $ | 208,607 | |
| $ | 180,150 | |
| $ | 152,322 | |
Adjustments to reconcile net income to net cash provided by (used in) operating activities: | |
| |
| | ||||||
Depreciation expense | 48,754 | |
| 36,538 | |
| 16,509 | | |||
Amortization of intangible assets | 54,756 | |
| 55,161 | |
| 7,953 | | |||
Accretion of convertible notes discount | - | |
| - | |
| 2,314 | | |||
Share-based compensation | 13,644 | |
| 14,076 | |
| 9,174 | | |||
Provision for doubtful accounts | 542 | |
| 6,411 | |
| 2,952 | | |||
Tax benefits from employee stock plans | 7,487 | |
| 5,524 | |
| 5,355 | | |||
Excess tax benefit from share-based compensation | (7,780 | ) |
| (5,513 | ) |
| (5,445 | ) | |||
Deferred income taxes | (5,497 | ) |
| (25,863 | ) |
| 2,461 | | |||
(Gains) losses on investments | (50 | ) |
| 170 | |
| (1,058 | ) | |||
Unrealized foreign exchange losses | 16,029 | |
| - | |
| - | | |||
Changes in assets and liabilities, net of acquisition of businesses: |
|
|
|
|
| ||||||
Accounts receivable | 292,863 | |
| (527,945 | ) |
| (187,489 | ) | |||
Receivable from related parties | 217 | |
| (188 | ) |
| 139 | | |||
Inventories | 40,121 | |
| (330,153 | ) |
| (155,221 | ) | |||
Other assets | (14,527 | ) |
| (25,815 | ) |
| (5,573 | ) | |||
Accounts payable | (26,019 | ) |
| 205,093 | |
| 186,189 | | |||
Payable to related parties | 2,537 | |
| 1,270 | |
| 2,635 | | |||
Accrued liabilities | 3,002 | |
| 167,666 | |
| 10,939 | | |||
Other liabilities | 8,923 | |
| 8,646 | |
| (8,449 | ) | |||
Net cash provided by (used in) operating activities | 643,609 | |
| (234,772 | ) |
| 35,707 | | |||
Cash flows from investing activities: | |
| |
| | ||||||
Purchases of trading investments | (93 | ) |
| (761 | ) |
| (539 | ) | |||
Proceeds from sale of trading investments | 2,105 | |
| 3,610 | |
| 3,650 | | |||
Purchases of term deposits | (9,973 | ) |
| (13,308 | ) |
| (17,173 | ) | |||
Proceeds from maturity of term deposits | 9,593 | |
| 17,517 | |
| 16,909 | | |||
Acquisition of businesses, net of cash acquired | 37,299 | |
| (384,867 | ) |
| (27,123 | ) | |||
Purchases of property and equipment | (100,106 | ) |
| (57,377 | ) |
| (28,965 | ) | |||
Loans and deposits to third parties, net of payments received | (539 | ) |
| 2,836 | |
| 1,867 | | |||
Purchases of cost investment | - | |
| - | |
| (1,705 | ) | |||
Proceeds from sale of equity-method investment | - | |
| - | |
| 4,153 | | |||
Proceeds from sale of cost investment | - | |
| 1,877 | |
| - | | |||
Changes in restricted cash | (54,435 | ) |
| (11,178 | ) |
| 5,142 | | |||
Net cash used in investing activities | (116,149 | ) |
| (441,651 | ) |
| (43,784 | ) | |||
Cash flows from financing activities: | |
| |
| | ||||||
Proceeds from securitization and revolving lines of credit | 2,389,490 | |
| 4,086,359 | |
| 1,210,315 | | |||
Payments of securitization and revolving lines of credit | (3,028,674 | ) |
| (3,625,995 | ) |
| (1,055,592 | ) | |||
Proceeds from term loans, net of issuance cost | 457,771 | |
| 225,000 | |
| - | | |||
Payments of term loans, capital leases and other borrowings | (63,832 | ) |
| (6,608 | ) |
| (1,479 | ) | |||
Payment of Convertible Senior Notes | - | |
| - | |
| (218,870 | ) | |||
Dividends paid | (22,591 | ) |
| (4,927 | ) |
| - | | |||
Excess tax benefit from share-based compensation | 7,780 | |
| 5,513 | |
| 5,445 | | |||
Increase (decrease) in book overdraft | (82,236 | ) |
| 27,762 | |
| 60,467 | | |||
Payments of acquisition-related contingent consideration | (170 | ) |
| (7,506 | ) |
| - | | |||
Repurchases of common stock | (8,736 | ) |
| - | |
| (1,882 | ) | |||
Proceeds from issuance of common stock | 5,959 | |
| 7,600 | |
| 8,587 | | |||
49
Table of Contents
| Fiscal Years Ended November 30, | ||||||||||
| 2015 |
| 2014 |
| 2013 | ||||||
Repurchases of common stock for tax withholdings on equity awards | (9,828 | ) |
| (5,273 | ) |
| (3,957 | ) | |||
Payments for purchase of shares of subsidiary from noncontrolling interest | - | |
| - | |
| (11,400 | ) | |||
Net cash provided by (used in) financing activities | (355,067 | ) |
| 701,925 | |
| (8,366 | ) | |||
Effect of exchange rate changes on cash and cash equivalents | (16,464 | ) |
| 3,019 | |
| 4,366 | | |||
Net increase (decrease) in cash and cash equivalents | 155,929 | |
| 28,521 | |
| (12,077 | ) | |||
Cash and cash equivalents at beginning of year | 180,143 | |
| 151,622 | |
| 163,699 | | |||
Cash and cash equivalents at end of year | $ | 336,072 | |
| $ | 180,143 | |
| $ | 151,622 | |
|
|
|
|
|
| ||||||
Supplemental disclosures of cash flow information: | |
| | |
| | |||||
Interest paid | $ | 16,319 | |
| $ | 15,443 | |
| $ | 8,386 | |
Income taxes paid | $ | 140,962 | |
| $ | 87,163 | |
| $ | 88,314 | |
|
|
|
|
|
| ||||||
Supplemental disclosure of non-cash investing activities: |
|
|
|
|
| ||||||
Fair value of common stock issued for acquisition of business | $ | - | |
| $ | 71,106 | |
| $ | - | |
Accrued costs for property and equipment purchases | $ | 9,856 | |
| $ | 3,563 | |
| $ | 262 | |
The accompanying Notes are an integral part of these Consolidated Financial Statements.
50
Table of Contents
SYNNEX CORPORATION
NOTES TO CONSOLIDATED FINANCIAL STATEMENTS
(currency and share amounts in thousands, except per share amounts)
NOTE 1-ORGANIZATION AND BASIS OF PRESENTATION:
SYNNEX Corporation (together with its subsidiaries, herein referred to as "SYNNEX" or the "Company") is a business process services company headquartered in Fremont, California and has operations in North and South America, Asia-Pacific and Europe.
The Company operates in two segments: Technology Solutions and Concentrix. The Technology Solutions segment distributes a broad range of information technology ("IT") systems and products and also provides systems design and integration solutions. The Concentrix segment offers a portfolio of strategic solutions and end-to-end global business outsourcing services focused on customer engagement strategy, process optimization, technology innovation, front and back-office automation and business transformation to clients in ten identified industry verticals.
NOTE 2-SUMMARY OF SIGNIFICANT ACCOUNTING POLICIES:
Use of estimates
The preparation of financial statements in conformity with generally accepted accounting principles ("GAAP") in the United States requires management to make estimates and assumptions that affect the reported amounts of assets and liabilities and disclosure of contingent assets and liabilities at the date of the financial statements and the reported amounts of revenue and expense during the reporting period. The Company evaluates these estimates on a regular basis and bases them on historical experience and on various assumptions that the Company believes are reasonable. Actual results could differ from the estimates.
Principles of consolidation
The Consolidated Financial Statements include the accounts of the Company, its wholly-owned subsidiaries, majority-owned subsidiaries in which no substantive participating rights are held by minority stockholders and variable interest entities if the Company is the primary beneficiary. All intercompany accounts and transactions have been eliminated.
The Consolidated Financial Statements include 100% of the assets and liabilities of majority-owned subsidiaries and the ownership interest of minority investors is recorded as noncontrolling interest. Investments in 20% through 50% owned affiliated companies are accounted under the equity method where the Company exercises significant influence over operating and financial affairs of the investee and is not the primary beneficiary. Investments in less than 20% owned companies are recorded under the cost method.
Segment reporting
Operating segments are based on components of the Company that engage in business activity that earns revenue and incurs expenses and (a) whose operating results are regularly reviewed by the Company's chief operating decision maker to make decisions about resource allocation and performance and (b) for which discrete financial information is available. The Company has two reportable segments: Technology Solutions and Concentrix.
The Technology Solutions segment distributes peripherals, IT systems, including data center server and storage solutions, system components, software, networking/communications/security equipment, consumer electronics ("CE") and complementary products to a variety of customers, including value-added resellers, system integrators and retailers. The Company also provides systems design and integration solutions.
The Concentrix segment offers a range of global business services focused on process optimization, customer engagement strategy and back-office automation to clients in ten industry verticals. The portfolio of services offered comprises of end-to-end process outsourcing services that are delivered through omni-channels including both voice and non-voice.
51
Table of Contents
SYNNEX CORPORATION
NOTES TO CONSOLIDATED FINANCIAL STATEMENTS---(continued)
(currency and share amounts in thousands, except per share amounts)
Cash and cash equivalents
The Company considers all highly liquid debt instruments purchased with an original maturity or remaining maturity at date of purchase of three months or less to be cash equivalents. Cash equivalents consist principally of money market deposit accounts that are stated at cost, which approximates fair value. The Company is exposed to credit risk in the event of default by financial institutions to the extent that cash balances with financial institutions are in excess of amounts that are insured.
Restricted cash
Restricted cash balances relate primarily to temporary restrictions caused by the timing of lockbox collections under the Company's borrowing arrangements and the timing of payments under vendor agreements.
Investments
The Company classifies its investments in marketable securities as trading and available-for-sale. Marketable securities related to its deferred compensation plan are classified as trading and are recorded at fair value, based on quoted market prices, and unrealized gains and losses are included in "Other income (expense), net" in the Company's financial statements. All other securities are classified as available-for-sale and are recorded at fair market value, based on quoted market prices, and unrealized gains and losses are included in "Accumulated other comprehensive income," a component of stockholders' equity. Realized gains and losses on available-for-sale securities, which are calculated based on the specific identification method, and declines in value judged to be other-than-temporary, if any, are recorded in "Other income (expense), net" as incurred.
To determine whether a decline in value is other-than-temporary, the Company evaluates several factors, including the current economic environment, market conditions, operational and financial performance of the investee, and other specific factors relating to the business underlying the investment, including business outlook of the investee, future trends in the investee's industry and the Company's intent to carry the investment for a sufficient period of time for any recovery in fair value. If a decline in value is deemed as other-than-temporary, the Company records reductions in carrying values to estimated fair values, which are determined based on quoted market prices if available or on one or more of the valuation methods such as pricing models using historical and projected financial information, liquidation values, and values of other comparable public companies.
The Company classifies its term deposits with financial institutions, with maturities from the date of purchase greater than three months and less than one year , as held-to-maturity investments. These term deposits are held until the maturity date and are not traded.
The Company has investments in equity instruments of privately-held companies and investments for which there are not readily determinable fair values. The investments that are included in "Short-term investments" are accounted for under the cost method of accounting. Long-term investments, which the Company has the ability and intent to hold for more than twelve months, are included in "Other assets" and are accounted for under the cost method of accounting. The Company monitors its cost-method investments for impairment by considering current factors, including the economic environment, market conditions, operational performance and other specific factors relating to the business underlying the investment, and records reductions in carrying values when necessary.
Allowance for doubtful accounts
The allowance for doubtful accounts is an estimate to cover the losses resulting from the inability of customers to make payments for outstanding balances. In estimating the required allowance, the Company takes into consideration the overall quality and aging of the accounts receivable, credit evaluations of customers' financial condition and existence of credit insurance. The Company also evaluates the collectability of accounts receivable based on specific customer circumstances, current economic trends, historical experience with collections and any value and adequacy of collateral received from customers.
Inventories
Inventories are stated at the lower of cost or market. Cost is computed based on the weighted-average method. Inventories are comprised of finished goods and work-in-process. Finished goods include products purchased for resale, system components purchased for both resale and for use in the Company's systems design and integration business, and completed systems. Work-in-process inventories are not material to the Consolidated Financial Statements.
52
Table of Contents
SYNNEX CORPORATION
NOTES TO CONSOLIDATED FINANCIAL STATEMENTS---(continued)
(currency and share amounts in thousands, except per share amounts)
Derivative Financial Instruments
The Company accounts for its derivative instruments as either assets or liabilities and carries them at fair value.
For derivative instruments that hedge the exposure to variability in expected future cash flows that are designated as cash flow hedges, the effective portion of the gain or loss on the derivative instrument is reported as a component of "Accumulated other comprehensive income (loss)" in stockholders' equity and reclassified into earnings in the same period or periods during which the hedged transaction affects earnings. The ineffective portion of the gain or loss on the derivative instrument, if any, is recognized in earnings in the current period. To receive hedge accounting treatment, cash flow hedges must be highly effective in offsetting changes to expected future cash flows on hedged transactions.
Derivatives used to minimize balance sheet exposure to foreign currency risk are not designated as hedging instruments and are adjusted to fair value through earnings in the current period.
Property and equipment
Property and equipment are stated at cost, less accumulated depreciation and amortization. Depreciation and amortization are computed using the straight-line method based upon the shorter of the estimated useful lives of the assets, or the lease term of the respective assets, if applicable. Maintenance and repairs are charged to expense as incurred, and improvements are capitalized. When assets are retired or otherwise disposed of, the cost and accumulated depreciation and amortization are removed from the accounts and any resulting gain or loss is reflected in operations in the period realized. The ranges of estimated useful lives for property and equipment categories are as follows:
Equipment and Furniture | 3-10 years |
Software | 3-7 years |
Leasehold improvements | 2-15 years |
Buildings and building improvements | 10-40 years |
Goodwill and intangible assets
The values assigned to goodwill and intangible assets are based on estimates and judgment regarding expectations for the success and life cycle of products and technologies and length of customer relationship acquired in a business combination. Purchased intangible assets are amortized over the useful lives based on estimates of the use of the economic benefit of the asset or on the straight-line amortization method.
Goodwill is tested for impairment annually in the fourth quarter or more frequently if events of changes in circumstances indicated that it may be impaired. For purposes of its goodwill analysis, the Company has two reporting units, the Technology Solutions reporting unit and the Concentrix reporting unit. Goodwill is tested for impairment at the reporting unit level by first performing a qualitative assessment to determine whether it is more likely than not that the fair value of the reporting unit is less than its carrying value. The factors that were considered in the qualitative analysis included macroeconomic conditions, industry and market considerations, cost factors such as increases in product cost, labor, or other costs that would have a negative effect on earnings and cash flows; and other relevant entity-specific events and information.
If the reporting unit does not pass the qualitative assessment, then the reporting unit's carrying value is compared to its fair value. The fair values of the reporting units are estimated using market and discounted cash flow approaches. The assumptions used in the market approach are based on the value of a business through an analysis of multiples of guideline companies and recent sales or offerings of a comparable entity. The assumptions used in the discounted cash flow approach are based on historical and forecasted revenue, operating costs, future economic conditions, and other relevant factors. Goodwill is considered impaired if the carrying value of the reporting unit exceeds its fair value. No goodwill impairment has been identified for any of the years presented.
53
Table of Contents
SYNNEX CORPORATION
NOTES TO CONSOLIDATED FINANCIAL STATEMENTS---(continued)
(currency and share amounts in thousands, except per share amounts)
Intangible assets consist primarily of customer relationships and lists, vendor lists, technology and trade names. Amortization is based on the pattern in which the economic benefits of the intangible assets will be consumed or on a straight line basis when the consumption pattern is not apparent over the following useful lives:
Customer relationships and lists | 4-10 years |
Vendor lists | 4-10 years |
Technology | 5-10 years |
Other intangible assets | 1-10 years |
Impairment of long-lived assets
The Company reviews the recoverability of its long-lived assets, such as intangible assets, property and equipment and certain other assets, when events or changes in circumstances occur that indicate the carrying value of the asset or asset group may not be recoverable. The assessment of possible impairment is based on the Company's ability to recover the carrying value of the asset or asset group from the expected future pre-tax cash flows, undiscounted and without interest charges, of the related operations. If these cash flows are less than the carrying value of such assets, an impairment loss is recognized for the difference between estimated fair value and carrying value.
Software costs
The Company develops software platforms for internal use and for resale. The Company capitalizes costs incurred to develop software for resale subsequent to the software product reaching technological feasibility. Capitalized costs are amortized over the economic life of the product using the greater of the straight-line amortization or using the ratio of current revenue to future expected revenue.
The Company capitalizes the costs incurred to develop software for internal use when new software is developed, the life of existing software is extended or significant enhancements are added to the features of existing software. The capitalized development costs primarily comprise payroll costs.
Concentration of credit risk
Financial instruments that potentially subject the Company to significant concentration of credit risk consist principally of cash and cash equivalents, accounts receivable and derivative instruments.
The Company's cash and cash equivalents and derivative instruments are transacted and maintained with financial institutions with high credit standing and the compositions and maturities of which are regularly monitored by management. Through November 30, 2015 , the Company had not experienced any credit losses on such deposits and derivative instruments.
Accounts receivable include amounts due from customers and original equipment manufacturer ("OEM") vendors primarily in the technology industry. The Company performs ongoing credit evaluations of its customers' financial condition and limits the amount of credit extended when deemed necessary, but generally requires no collateral. The Company also maintains allowances for potential credit losses. In estimating the required allowances, the Company takes into consideration the overall quality and aging of the receivable portfolio, the existence of a limited amount of credit insurance and specifically identified customer and vendor risks. Through November 30, 2015 , such losses have been within management's expectations.
In fiscal years 2015 , 2014 and 2013 , no customer accounted for 10% or more of the Company's total revenue. Products purchased from the Company's largest OEM supplier, HP Inc. (formerly Hewlett-Packard Company) ("HP"), accounted for approximately 25% , 25% and 31% of the total revenue for fiscal years 2015 , 2014 and 2013 , respectively.
As of November 30, 2015 , no customer comprised 10% of the total consolidated accounts receivable balance. As of November 30, 2014 , one customer comprised 16% of the total consolidated accounts receivable balance.
Revenue recognition
Products revenue represents revenue from the Company's Technology Solutions segment and services revenue represents revenue from the Company's Concentrix segment.
Technology Solutions
54
Table of Contents
SYNNEX CORPORATION
NOTES TO CONSOLIDATED FINANCIAL STATEMENTS---(continued)
(currency and share amounts in thousands, except per share amounts)
The Company generally recognizes revenue on the sale of hardware and software products when they are shipped or delivered and on services when they are performed, if persuasive evidence of an arrangement exists, the sales price is fixed or determinable, collection of resulting accounts receivable is reasonably assured, risk of loss and title have transferred and product returns are reasonably estimable. Binding purchase orders from customers together with agreement to our terms and conditions of sale by way of an executed agreement or other signed document constitutes evidence of an arrangement. In cases where payment is contingent on post delivery services and/or fulfillment of certain obligations and meeting certain conditions, revenue and cost of revenue are recognized on a straight-line basis over the term of the contracts as the contingencies are satisfied and payments become due. Where product acceptance provisions exist, assuming all other revenue recognition criterion are met, revenue is recognized upon the earlier of shipment/delivery for products that have been demonstrated to meet product specifications, customer acceptance or the lapse of acceptance provisions.
Provisions for sales returns and allowances are estimated based on historical data and are recorded concurrently with the recognition of revenue. These provisions are reviewed and adjusted periodically by the Company. Revenue is presented net of taxes collected from customers and remitted to government authorities. Revenue is reduced for early payment discounts and volume incentive rebates offered to customers. The Company recognizes revenue on a net basis on certain contracts, including service contracts, post-contract software support services and extended warranty contracts, where it is not the primary obligor, by recognizing the margins earned in revenue with no associated cost of revenue.
Concentrix
The Company recognizes revenue from services contracts when evidence of an arrangement exists, services are delivered, fees are fixed or determinable and collectability is reasonably assured. Service contracts may be based on a fixed price or on a fixed unit-price per transaction or other objective measure of output. Revenue on fixed price contracts is recognized on a straight-line basis over the term of the contract as services are provided. Revenue on unit-price transactions is recognized using an objective measure of output including staffing hours or the number of transactions processed by service agents. Customer contract terms typically can range from less than one year to more than five years. Revenue is reported net of any revenue-based taxes assessed by governmental authorities that are imposed on and concurrent with specific revenue-producing transactions.
Cost of Revenue
Cost of products revenue represents cost from the Company's Technology Solutions segment and cost of services revenue represents cost from the Company's Concentrix segment.
Technology Solutions
Cost of revenue includes the product price paid to OEM suppliers, net of any incentives, rebates and purchase discounts received from the OEM suppliers. Cost of revenue also consists of provisions for inventory losses and write-downs, shipping and handling costs and royalties due to OEM vendors. In addition, cost of revenue includes the cost of materials, labor and overhead and warranty for design and integration activities.
Concentrix
Recurring direct operating costs for services are recognized as incurred. Cost of services revenue consists primarily of personnel costs. Where a contract requires an up-front investment, which typically includes transition and set-up costs related to systems and processes, these amounts are allowed to be deferred and costs are amortized on a straight-line basis over the expected period of benefit, not to exceed the fixed term of the contract. The Company performs periodic reviews to assess the recoverability of deferred contract transition and setup costs. This review is done by comparing the estimated minimum remaining undiscounted cash flows of a contract to the unamortized contract costs. If such minimum undiscounted cash flows are not sufficient to recover the unamortized costs, an impairment loss is recognized for the difference between the estimated fair value and the carrying value.
Selling, General and Administrative expenses
Selling, general and administrative expenses are charged to income as incurred. Expenses of promoting and selling products and services are classified as selling expense and include such items as compensation, sales commissions and travel. General and administrative expenses include such items as compensation, legal costs, office supplies, non-income taxes, insurance and rental of facilities. In addition, general and administrative expenses include other operating items such as allowances for credit losses.
55
Table of Contents
SYNNEX CORPORATION
NOTES TO CONSOLIDATED FINANCIAL STATEMENTS---(continued)
(currency and share amounts in thousands, except per share amounts)
OEM supplier programs
Funds received from OEM suppliers for volume promotion programs, price protection and product rebates are recorded as adjustments to cost of revenue and the carrying value of inventories, as appropriate. Where there is a binding agreement, the Company tracks vendor promotional programs for volume discounts on a program-by-program basis and records them as a reduction of cost of revenue based on a systematic and rational allocation. The Company monitors the balances of vendor receivables on a quarterly basis and adjusts the balances due for differences between expected and actual sales volume. Vendor receivables are generally collected through reductions authorized by the vendor to accounts payable. Funds received for specific marketing and infrastructure reimbursements, net of related costs, are recorded as adjustments to "Selling, general and administrative expenses," and any excess reimbursement amount is recorded as an adjustment to cost of revenue.
Royalties
The Company's software product purchases include products licensed from OEM vendors, which are subsequently distributed to resellers. Royalties to OEM vendors are accrued and recorded in cost of revenue when software products are shipped and revenue is recognized.
Warranties
The Company's OEM suppliers generally warrant the products distributed by the Company and allow returns of defective products. The Company generally does not independently warrant the products it distributes; however, the Company does warrant the following: (1) products that it builds to order from components purchased from other sources; and (2) its services with regard to products that it assembles for its customers. To date neither warranty expense, nor the accrual for warranty costs has been material to the Company's Consolidated Financial Statements.
Advertising
Costs related to advertising and product promotion expenditures are charged to "Selling, general and administrative expenses" as incurred and are primarily offset by OEM marketing reimbursements. To date, net costs related to advertising and promotion expenditures have not been material.
Income taxes
The asset and liability method is used in accounting for income taxes. Under this method, deferred tax assets and liabilities are recognized for the expected tax consequences of temporary differences between the tax bases of assets and liabilities and their reported amounts in the financial statements using enacted tax rates and laws that will be in effect when the difference is expected to reverse. Valuation allowances are provided against deferred tax assets that are not likely to be realized.
The Company recognizes tax benefits from uncertain tax positions only if that tax position is more likely than not to be sustained on examination by the taxing authorities, based on the technical merits of the position. The tax benefits recognized in the financial statements from such positions are then measured based on the largest benefit that has a greater than 50% likelihood of being realized upon settlement. The Company recognizes interest and penalties related to unrecognized tax benefits in the provisions for income taxes.
Foreign currency translations
The financial statements of the Company's foreign subsidiaries whose functional currencies are the local currencies are translated into U.S. dollars for consolidation as follows: assets and liabilities at the exchange rate as of the balance sheet date, stockholders' equity at the historical rates of exchange, and income and expense amounts at the average exchange rate for the month. Translation adjustments resulting from the translation of the subsidiaries' accounts are included in "Accumulated other comprehensive income." Transactions denominated in currencies other than the applicable functional currency are converted to the functional currency at the exchange rate on the transaction date. At period end, monetary assets and liabilities are remeasured to the functional currency using exchange rates in effect at the balance sheet date. Non-monetary assets and liabilities are remeasured at historical exchange rates. Gains and losses resulting from foreign currency transactions are included within "Other income (expense), net."
Comprehensive income
Comprehensive income is defined as the change in equity of a business enterprise during a period from transactions and other events and circumstances from non-owner sources. The primary components of comprehensive income for the Company
56
Table of Contents
SYNNEX CORPORATION
NOTES TO CONSOLIDATED FINANCIAL STATEMENTS---(continued)
(currency and share amounts in thousands, except per share amounts)
include net income, foreign currency translation adjustments arising from the consolidation of the Company's foreign subsidiaries, unrealized gains and losses on the Company's available-for-sale securities, unrealized gains and losses on cash flow hedges and the changes in unrecognized pension and post-retirement benefits.
Share-based compensation
Share-based compensation is estimated at the grant date based on the fair value of the awards expected to vest and recognized as expense ratably over the requisite service period of the award. The Company uses the Black-Scholes valuation model to estimate fair value of share-based option awards, which requires various assumptions including estimating stock price volatility and expected life.
Pension and post-retirement benefits
Defined benefit pension costs are estimated using various actuarial assumptions including discount rates, expected return on plan assets, inflation, mortality rates and compensation increases. The assumptions used are reviewed on an annual basis. The Company records pension expense related to multi-employer defined benefit plans based on the amount of contributions that are contractually owed during the period.
Earnings per common share
Earnings per share is calculated using the two-class method. The two-class method is an earnings allocation proportional to the respective ownership among holders of common stock and participating securities. Basic earnings per common share is computed by dividing net income attributable to the Company's common stockholders by the weighted average of common shares outstanding during the period. Diluted earnings per common share also considers the dilutive effect of in-the-money stock options and restricted stock units, calculated using the treasury stock method.
Treasury Stock
Repurchases of shares of common stock are accounted for at cost, which includes brokerage fees, and are included as a component of stockholders' equity in the Consolidated Balance Sheets.
Reclassifications
Certain reclassifications have been made to prior period amounts in the Consolidated Balance Sheets, the Consolidated Statements of Cash Flows and notes to the consolidated financial statements to conform to current period presentation. These reclassifications had no effect on the previously reported current and total assets or liabilities and the cash flow from operating, investing and financing activities as previously reported.
In fiscal year 2015, the Company's services revenue exceeded 10% of its consolidated revenues. Accordingly, products and services revenue and related costs of revenue have been presented separately in the Consolidated Statements of Operations for all periods presented.
Recently issued accounting pronouncements
In November 2015, the Financial Accounting Standard Board ("FASB") issued a new accounting standard that requires deferred tax liabilities and assets be classified as noncurrent on a company's balance sheet. The new standard should be applied either prospectively or retrospectively to all periods presented. It is effective for annual reporting periods beginning after December 15, 2016 and interim periods within those annual periods, with early adoption permitted. The Company does not expect the adoption of this standard to have a material impact on its Consolidated Financial Statements.
In September 2015, the FASB issued a new accounting standard that eliminates the requirement to restate prior period financial statements for measurement period adjustments. The new guidance requires that the cumulative impact of a measurement period adjustment (including the impact on prior periods) be recognized in the reporting period in which the adjustment is identified. Consistent with existing guidance, the new guidance requires an acquirer to disclose the nature and amount of measurement period adjustments. In addition, companies are required to present separately on the face of the income statement or disclose in the notes the portion of the adjustment recorded in current-period earnings by line item that would have been recorded in previous reporting periods if the adjustment to the provisional amounts had been recognized as of the acquisition date. The new standard should be applied prospectively to measurement period adjustments that occur after the effective date. For public business entities, the new standard is effective for interim and annual periods beginning after
57
Table of Contents
SYNNEX CORPORATION
NOTES TO CONSOLIDATED FINANCIAL STATEMENTS---(continued)
(currency and share amounts in thousands, except per share amounts)
December 15, 2015, with early adoption permitted. The Company does not expect the adoption of this standard to have a material impact on its Consolidated Financial Statements.
In July 2015, the FASB issued a new accounting standard that simplifies the subsequent measurement of inventory. It replaces the current lower of cost or market test with the lower of cost or net realizable value test. Net realizable value is defined as the estimated selling price in the ordinary course of business, less reasonably predictable costs of completion, disposal, and transportation. The new standard should be applied prospectively and is effective for annual reporting periods beginning after December 15, 2016 and interim periods within those annual periods, with early adoption permitted. The Company does not expect the adoption of this standard to have a material impact on its Consolidated Financial Statements.
In April 2015, the FASB issued new guidance to customers about whether a cloud computing arrangement includes a software license. If the cloud computing arrangement includes a software license, the customer should account for the software license element of the arrangement consistent with the acquisition of other software licenses. If the cloud computing arrangement does not include a software license, the customer should account for the arrangement as a service contract. The new standard may be applied prospectively or retrospectively and is effective for annual reporting periods beginning after December 15, 2015 and interim periods within those annual periods, with early adoption permitted. The Company does not expect the adoption of this standard to have a material impact on its Consolidated Financial Statements.
In April 2015, the FASB issued a new accounting standard that requires that debt issuance costs related to a recognized debt liability be presented in the balance sheet as a direct deduction from the carrying amount of the corresponding debt liability. In August 2015, the FASB clarified that for a line-of-credit arrangement, a company can continue to defer and present the debt issuance costs as an asset and subsequent amortization of debt issuance costs over the term of the line-of-credit arrangement, whether or not there are any outstanding borrowings on the line-of-credit arrangement. The new standard is effective for interim and annual periods beginning after December 15, 2015, with early adoption permitted, and is to be applied on a retrospective basis. The Company does not expect the adoption of this standard to have a material impact on its Consolidated Financial Statements.
In January 2015, the FASB issued a new accounting standard, which eliminates from U.S. GAAP the concept of extraordinary items. The guidance eliminates the separate presentation of extraordinary items on the income statement, net of tax and the related earnings per share, but does not affect the requirement to disclose material items that are unusual in nature or occurring infrequently. The new standard may be applied prospectively or retrospectively and is effective for annual reporting periods beginning after December 15, 2015 and interim periods within those annual periods, with early adoption permitted. The Company does not expect the adoption of this standard to have an impact on its Consolidated Financial Statements.
In May 2014, the FASB issued a comprehensive new revenue recognition standard for contracts with customers that will supersede most current revenue recognition guidance, including industry-specific guidance. The core principle of this standard is that an entity should recognize revenue to depict the transfer of promised goods or services to customers in an amount that reflects the consideration to which the entity expects to be entitled in exchange for those goods or services. To achieve this core principle, the standard provides a five-step analysis of transactions to determine when and how revenue is recognized. Other major provisions include the capitalization and amortization of certain contract costs, ensuring the time value of money is considered in the transaction price, and allowing estimates of variable consideration to be recognized before contingencies are resolved in certain circumstances. This guidance also requires enhanced disclosures regarding the nature, amount, timing and uncertainty of revenue and cash flows arising from an entity's contracts with customers. In August 2015, the FASB amended this accounting standard and postponed the implementation date to fiscal years, and interim periods within those fiscal years, beginning after December 15, 2017. Early application for fiscal years, and interim periods within those years, beginning after December 15, 2016 is permitted. The standard permits the use of either the retrospective or cumulative effect transition method. This accounting standard will be applicable to the Company at the beginning of its first quarter of fiscal year 2019. The Company is currently evaluating the impact on its Consolidated Financial Statements upon the adoption of this new standard.
Recently adopted accounting pronouncements
In July 2013, the FASB issued a new accounting standard that requires the presentation of certain unrecognized tax benefits as reductions to deferred tax assets rather than as liabilities in the Consolidated Balance Sheets when a net operating loss carryforward, a similar tax loss, or a tax credit carryforward exists. The new accounting update was adopted by the Company in the first quarter of fiscal 2015. The adoption of this new standard did not have a material impact on the Company's Consolidated Financial Statements.
58
Table of Contents
SYNNEX CORPORATION
NOTES TO CONSOLIDATED FINANCIAL STATEMENTS---(continued)
(currency and share amounts in thousands, except per share amounts)
NOTE 3-ACQUISITIONS:
Fiscal year 2014 acquisition
In fiscal year 2014, the Company acquired the assets of the customer relationship management business of International Business Machines Corporation, a New York corporation ("IBM"). The transaction was completed in phases with the initial closing completed on January 31, 2014, the second phase closing completed on April 30, 2014 and the final closing completed on September 30, 2014 for an aggregate purchase price of $425,690 after adjustments for working capital and other post-closing adjustments. During fiscal year 2015, the Company collected amounts towards working capital and other post-closing adjustments from IBM. These amounts are reflected in the Consolidated Statements of Cash Flows under investing activities.
The acquisition has been integrated into the Concentrix segment. It expands the Company's service portfolio, delivery capabilities and geographic reach, and brings deep process expertise and managerial talent. As part of the transaction, the Company entered into a multi-year agreement with IBM whereby Concentrix has become an IBM strategic business partner for customer relationship management services.
The acquisition has been accounted for as a business combination. Assets acquired and liabilities assumed were recorded at their fair values as of the respective closing dates. The total purchase price consideration is as follows:
Purchase consideration: | Fair Value | ||
Cash | $ | 352,858 | |
Common stock issued | 71,106 | | |
Fair value of equity awards assumed | 2,335 | | |
Receivable from IBM (1) | (609 | ) | |
| $ | 425,690 | |
_____________________________________
(1) | The receivable from IBM was related to working capital and other post-closing adjustments. The amount has been collected in December 2015. |
The Company issued 1,266 shares of its common stock, at a fair value of $71,106 based on the closing price of the Company's common stock on the New York Stock Exchange Composite Transactions Tape as of the date of issuance. Additionally, the Company assumed unvested restricted IBM stock-based awards with an estimated fair value of $11,125 on the respective closing dates. The Company exchanged the acquisition date fair value of the unvested restricted IBM stock awards of employees with the Company's equity-based awards or cash settled with deferred payouts. The fair value of the replaced IBM awards was based on the market value of the Company's common stock on the respective closing dates. The fair value of the cash settled awards was based on IBM's stock price on the acquisition date, adjusted for the exclusion of dividend equivalents. Of the equity awards issued, a portion relating to the pre-combination service period was allocated to the purchase consideration and the remainder of the estimated fair value will be expensed over the remaining service periods on a straight-line basis.
The total purchase price has been allocated between the acquisition of the IBM CRM business and a separate element representing IBM-initiated prepaid compensation plans. Of the total $16,326 prepaid amount, $13,236 was recorded in "Other current assets" and $3,090 in "Other assets" and is being expensed to "Selling, general and administrative expenses" over the service period.
The portion of the purchase price for the acquisition was allocated to the net tangible and intangible assets based on their fair values as of the respective closing dates. The excess of the purchase price over the net tangible and intangible assets was recorded as goodwill. The goodwill balance is attributed to the assembled workforce and expanded market opportunities due to the comprehensive service portfolio delivery capabilities and geographic reach resulting from the acquisition. Goodwill of $37,919 is deductible for U.S. and foreign income tax purposes.
59
Table of Contents
SYNNEX CORPORATION
NOTES TO CONSOLIDATED FINANCIAL STATEMENTS---(continued)
(currency and share amounts in thousands, except per share amounts)
The total purchase price allocation is as follows:
Purchase price allocation: | Fair Value | ||
Cash | $ | 5,320 | |
Accounts receivable | 22,683 | | |
Other current assets | 24,678 | | |
Property and equipment | 44,245 | | |
Goodwill | 134,191 | | |
Intangible assets | 269,001 | | |
Other assets | 17,028 | | |
Accounts payable | (29,349 | ) | |
Accrued liabilities | (35,635 | ) | |
Other long-term liabilities | (12,680 | ) | |
Deferred tax liabilities, noncurrent | (13,792 | ) | |
| $ | 425,690 | |
The identifiable intangible assets acquired and their estimated useful lives are summarized as follows:
|
| Fair Value |
| Weighted Average Useful Life | ||
Customer relationships |
| $ | 259,001 | |
| 10 years |
Technology |
| 7,500 | |
| 5-10 years | |
Trade names |
| 2,500 | |
| 5 years | |
Total intangibles acquired |
| $ | 269,001 | |
|
|
Amortization of customer relationships and trade names is recorded in selling, general and administrative expenses. Amortization of technology is recorded in cost of revenue for services.
Acquisition and integration expenses were $10,109 , $43,170 and $8,394 during the years ended November 30, 2015 , 2014 and 2013, respectively, and consist of costs incurred to complete the acquisition and retention payments to integrate the business. Substantially all of the acquisition and integration expenses were recorded in "Selling, general and administrative expenses."
Fiscal year 2013 acquisitions
In April 2013, the Company acquired substantially all of the assets of Supercom Canada Limited ("Supercom Canada"), a distributor of IT and consumer electronics products and services in Canada. The purchase price was approximately $36,665 ( CAD37,593 ), in cash, including $4,340 , in deferred payments, subject to certain post-closing conditions, payable within 18 months. The Company has paid the entire deferred payment amount. Subsequent to the acquisition, the Company repaid debt and working capital lines in the amount of $53,721 . Based on the purchase price allocation, the Company recorded net tangible assets of $26,912 , goodwill of $5,384 and intangible assets of $4,369 in relation to this acquisition. This acquisition did not meet the conditions of a material business combination and was not subject to the disclosure requirements of accounting guidance for business combinations utilizing the purchase method of accounting. The acquisition is integrated into the Technology Solutions segment and has expanded the Company's existing product and service offerings in Canada.
60
Table of Contents
SYNNEX CORPORATION
NOTES TO CONSOLIDATED FINANCIAL STATEMENTS---(continued)
(currency and share amounts in thousands, except per share amounts)
NOTE 4-STOCKHOLDERS' EQUITY:
2013 Stock Incentive Plan
The Company's 2013 Stock Incentive Plan was adopted by its Board of Directors and approved by its stockholders in 2013. The 2013 Stock Plan as amended and restated from time to time provides for the direct award or sale of shares of common stock, restricted stock awards, and restricted stock units, the grant of options to purchase shares of common stock and the award of stock appreciation rights to employees and non-employee directors and consultants.
The number of authorized shares under the 2013 Stock Incentive Plan will not exceed the sum of 1,696 shares of common stock, plus any shares under the Amended and Restated 2003 Stock Incentive Plan (the "2003 Stock Incentive Plan") that are subject to outstanding awards granted to the extent those awards expire, terminate or are canceled for any reason prior to exercise without the issuance or delivery of such shares, any shares subject to vesting restrictions that are subsequently forfeited, and any reserved shares not issued or subject to outstanding awards, up to 2,750 shares. No participant in the 2013 Stock Incentive Plan may receive option grants or stock appreciation rights, restricted shares or restricted stock units for more than 1,500 shares per calendar year, or more than 2,500 shares in the participant's first calendar year of service. The option price for incentive stock options will not be less than 100% of the fair market value of the stock on the date of grant.
Under the 2013 Stock Incentive Plan, qualified employees are eligible for the grant of incentive stock options to purchase shares of common stock. Qualified employees and outside directors and consultants are eligible for the grant of nonstatutory stock options, stock appreciation rights, restricted stock grants and restricted stock units. The outstanding stock options and restricted stock awards granted to qualified employees generally vest over a five -year period and the stock options have a contractual term of ten years. Stock options granted to qualified non-employee directors vest as to one third of the stock underlying the stock options on the first anniversary date of the grant and the remaining vest monthly over a two -year period starting one month after the first anniversary of the date of grant. The restricted stock granted to qualified non-employee directors vests one fourth on a quarterly basis over a one -year period. The holders of restricted stock awarded are entitled to the same voting, dividend and other rights as the Company's common stockholders.
Unless terminated sooner, the 2013 Stock Incentive Plan will terminate on March 19, 2023.
2003 Stock Incentive Plan
The Company's 2003 Stock Incentive Plan terminated in March 2013. The number of authorized shares under the 2003 Stock Incentive Plan was 14,120 shares of common stock. The equity awards outstanding under this plan as of November 30, 2015 continue to be governed by their existing terms. The outstanding stock options, restricted stock awards and restricted stock units granted to qualified employees generally vest over a five -year period and the stock options have a contractual term of ten years. Certain restricted stock units could vest subject to the attachment of individual, divisional or Company-wide performance goals. Stock options and restricted stock awards granted to qualified non-employee directors vest over a period ranging from one year to three years. The exercise price of incentive stock option grants was equal to 100% of the fair market value of those shares on the date of the grant. The holders of restricted stock awarded are entitled to the same voting, dividend and other rights as the Company's common stockholders.
2014 Employee Stock Purchase Plan
On January 6, 2014, the Board of Directors approved the adoption of the 2014 Employee Stock Purchase Plan ("2014 ESPP") to succeed the 2003 ESPP. The 2014 ESPP, as amended, commenced on January 1, 2015. The number of authorized shares under the 2014 ESPP is up to 750 shares. Under the 2014 ESPP, there are four offering periods of three months each in a calendar year. Eligible employees' purchase price discount is 5% . The maximum number of shares a participant may purchase is 0.625 during a single accumulation period subject to a maximum purchase limit of $10 in a calendar year. Employees at associate vice president level and above are not eligible to participate in the plan.
2003 Employee Stock Purchase Plan
The Company's 2003 Employee Stock Purchase Plan ("2003 ESPP") was terminated in December 2014. A total of 750 shares of common stock were reserved for issuance under the 2003 ESPP. The maximum number of shares a participant could purchase was 1.25 during a single accumulation period subject to a maximum purchase limit of $10 per calendar year.
The per share weighted-average fair value of purchases under the 2003 ESPP and 2014 ESPP, which were computed using the Black-Scholes valuation model, during fiscal years 2015 , 2014 and 2013 were $5.16 , $4.06 and $1.74 , respectively.
61
Table of Contents
SYNNEX CORPORATION
NOTES TO CONSOLIDATED FINANCIAL STATEMENTS---(continued)
(currency and share amounts in thousands, except per share amounts)
Share Repurchase Programs
In June 2011, the Board of Directors authorized a three -year $65,000 share repurchase program. As of the expiration of the program in June 2014, the Company had purchased 361 shares for a total cost of $11,340 . The share purchases were made on the open market and the shares repurchased by the Company are held in treasury for general corporate purposes.
In June 2014, the Board of Directors authorized a three -year $100,000 share repurchase program pursuant to which the Company may repurchase its outstanding common stock from time to time in the open market or through privately negotiated transactions. As of November 30, 2015 , the Company had purchased 120 shares for a total cost of $8,736 . The share purchases were made on the open market and the shares repurchased by the Company are held in treasury for general corporate purposes.
Dividends
The Company paid cash dividends of $0.58 , $0.13 and $0.00 per share, totaling $22,591 , $4,927 and $0 , during the years ended November 30, 2015 , 2014 and 2013 respectively. On January 8, 2016, the Company announced a cash dividend of $0.20 per share to stockholders of record as of January 19, 2016, payable on January 29, 2016. Future dividends are subject to declaration by the Board of Directors.
NOTE 5-SHARE-BASED COMPENSATION:
The Company recognizes share-based compensation expense for all share-based awards made to employees and directors, including employee stock options, restricted stock awards, restricted stock units and employee stock purchases, based on estimated fair values.
The Company recorded share-based compensation expense in the consolidated statements of operations for fiscal years 2015 , 2014 and 2013 as follows:
| Fiscal Years Ended November 30, | ||||||||||
| 2015 |
| 2014 |
| 2013 | ||||||
Cost of revenue | $ | 571 | |
| $ | 646 | |
| $ | - | |
Selling, general and administrative expenses | 13,133 | |
| 13,430 | |
| 9,174 | | |||
Total share-based compensation | 13,704 | |
| 14,076 | |
| 9,174 | | |||
Tax effect on share-based compensation | (4,967 | ) |
| (5,156 | ) |
| (3,304 | ) | |||
Net effect on net income | $ | 8,737 | |
| $ | 8,920 | |
| $ | 5,870 | |
Valuation Assumptions
The Company estimates the fair value of share-based payment awards on the date of grant. The value of the portion of the award that is ultimately expected to vest is recognized as expense over the requisite service period in the Company's financial statements.
The Company uses the Black-Scholes valuation model to estimate fair value of stock options. The Black-Scholes option-pricing model was developed for use in estimating the fair value of short-lived exchange traded options that have no vesting restrictions and are fully transferable. In addition, option-pricing models require the input of highly subjective assumptions, including the option's expected life and the price volatility of the underlying stock. The expected stock price volatility assumption was determined using historical volatility of the Company's common stock.
The fair value of stock awards is determined based on the stock price at the date of grant. For grants that do not accrue dividends or dividend equivalents, the fair value is the stock price reduced by the present value of estimated dividends over the vesting period or performance period.
The Company is required to estimate forfeitures and only record compensation costs for those awards that are expected to vest. The assumptions for forfeitures were determined based on type of award and historical experience. Forfeiture assumptions are adjusted at the point in time a significant change is identified, with any adjustment recorded in the period of change, and the final adjustment at the end of the requisite service period to equal actual forfeitures.
62
Table of Contents
SYNNEX CORPORATION
NOTES TO CONSOLIDATED FINANCIAL STATEMENTS---(continued)
(currency and share amounts in thousands, except per share amounts)
The following assumptions were used in the Black-Scholes valuation model in fiscal years 2015 , 2014 and 2013 :
| Fiscal Years Ended November 30, | |||||||
| 2015 |
| 2014 |
| 2013 | |||
Stock option plan: |
|
|
|
|
| |||
Expected life (years) | 5.9 | |
| 5.5 | |
| 5.6 | |
Risk free interest rate | 1.63 | % |
| 1.74 | % |
| 1.61 | % |
Expected volatility | 31.78 | % |
| 33.40 | % |
| 38.71 | % |
Dividend yield | 0.90 | % |
| 0.80 | % |
| 0.00 | % |
Employee stock purchase plan: | |
| |
| | |||
Expected life (years) | 0.3 | |
| 0.3 | |
| 0.3 | |
Risk free interest rate | 0.00% - 0.03% | |
| 0.02% - 0.07% | |
| 0.02 | % |
Expected volatility | 29.68% - 38.63% | |
| 28.39% - 37.40% | |
| 27.96 | % |
Dividend yield | 0.16% - 0.24% | |
| 0.00% - 0.02% | |
| 0.00 | % |
A summary of the activities under the Company's stock option plan is set forth below:
| Shares Available |
| Options Outstanding | ||||
Number of |
| Weighted-Average | |||||
Balances, November 30, 2014 | 2,146 | |
| 750 | |
| $34.17 |
Restricted stock awards granted | (157 | ) |
| - | |
| - |
Restricted stock units granted | (30 | ) |
| - | |
| - |
Restricted stock cancelled/forfeited | 86 | |
| - | |
| - |
Options granted | (78 | ) |
| 78 | |
| $89.21 |
Options exercised | - | |
| (170 | ) |
| $23.38 |
Options cancelled/forfeited/expired | 1 | |
| (1 | ) |
| $17.17 |
Balances, November 30, 2015 | 1,968 | |
| 657 | |
| $43.50 |
Employee Stock Options
The weighted-average grant-date fair values of the stock options granted during fiscal years 2015 , 2014 and 2013 were $26.70 , $19.34 , and $23.62 , respectively. As of November 30, 2015 , 657 options were outstanding and expected to vest with a weighted average life of 6.28 years , a weighted average exercise price of $43.50 per option and an aggregate pre-tax intrinsic value of $33,330 . As of November 30, 2015 , 430 options were vested and exercisable with a weighted average life of 5.00 years , a weighted average exercise price of $31.43 per share and an aggregate pre-tax intrinsic value of $27,009 .
The cash received from the exercise of options and the intrinsic values of options exercised during fiscal years 2015 , 2014 and 2013 were as follows:
| Fiscal Years Ended November 30, | ||||||||||
| 2015 |
| 2014 |
| 2013 | ||||||
Intrinsic value of options exercised | $ | 9,338 | |
| $ | 11,500 | |
| $ | 10,749 | |
Cash received from exercise of options | 3,984 | |
| 5,873 | |
| 7,163 | | |||
The Company settles employee stock option exercises with newly issued common shares.
As of November 30, 2015 , the unamortized share-based compensation expense related to unvested stock options under the 2003 Stock Incentive Plan and 2013 Stock Incentive Plan was $5,015 which will be recognized over an estimated weighted-average amortization period of 3.80 years .
63
Table of Contents
SYNNEX CORPORATION
NOTES TO CONSOLIDATED FINANCIAL STATEMENTS---(continued)
(currency and share amounts in thousands, except per share amounts)
Restricted Stock Awards and Restricted Stock Units
A summary of the changes in the Company's nonvested restricted stock awards and stock units during the fiscal year 2015 is presented below:
| Number of |
| Weighted-average, |
Nonvested as of November 30, 2014 | 921 |
| $45.33 |
Awards granted | 157 |
| $87.44 |
Units granted | 30 |
| $84.57 |
Awards and units vested | (303) |
| $41.25 |
Awards and units cancelled/forfeited | (86) |
| $48.31 |
Nonvested as of November 30, 2015 | 719 |
| $58.36 |
As of November 30, 2015 , there was $32,756 of total unamortized share-based compensation expense related to nonvested restricted stock awards and stock units granted under the 2003 Stock Incentive Plan and the 2013 Stock Incentive Plan. That cost is expected to be recognized over an estimated weighted-average amortization period of 3.64 years .
NOTE 6-BALANCE SHEET COMPONENTS:
| As of November 30, | ||||||
| 2015 |
| 2014 | ||||
Accounts receivable, net: |
|
|
| ||||
Accounts receivable | $ | 1,818,123 | |
| $ | 2,163,690 | |
Less: Allowance for doubtful accounts | (14,417 | ) |
| (16,870 | ) | ||
Less: Allowance for sales returns | (44,215 | ) |
| (55,309 | ) | ||
| $ | 1,759,491 | |
| $ | 2,091,511 | |
Allowance for doubtful trade receivables: |
| ||
Balance at November 30, 2012 | $ | 18,229 | |
Additions | 2,952 | | |
Write-offs and deductions | (7,171 | ) | |
Balance at November 30, 2013 | 14,010 | | |
Additions | 6,411 | | |
Write-offs and deductions | (3,551 | ) | |
Balance at November 30, 2014 | 16,870 | | |
Additions | 542 | | |
Write-offs and deductions | (2,995 | ) | |
Balance at November 30, 2015 | $ | 14,417 | |
64
Table of Contents
SYNNEX CORPORATION
NOTES TO CONSOLIDATED FINANCIAL STATEMENTS---(continued)
(currency and share amounts in thousands, except per share amounts)
| As of November 30, | ||||||
| 2015 |
| 2014 | ||||
Property and equipment, net: |
|
|
| ||||
Land | $ | 21,581 | |
| $ | 22,402 | |
Equipment, computers and software | 202,310 | |
| 157,931 | | ||
Furniture and fixtures | 45,470 | |
| 38,113 | | ||
Buildings, building improvements and leasehold improvements | 167,893 | |
| 134,291 | | ||
Construction-in-progress | 11,799 | |
| 12,783 | | ||
Total property and equipment, gross | 449,053 | |
| 365,520 | | ||
Less: Accumulated depreciation | (200,426 | ) |
| (164,717 | ) | ||
| $ | 248,627 | |
| $ | 200,803 | |
Goodwill: | Fiscal Year Ended November 30, 2015 |
| Fiscal Year Ended November 30, 2014 | ||||||||||||||||||||
| Technology Solutions |
| Concentrix |
| Total |
| Technology Solutions |
| Concentrix |
| Total | ||||||||||||
Balance, beginning of year | $ | 102,911 | |
| $ | 211,302 | |
| $ | 314,213 | |
| $ | 108,218 | |
| $ | 80,317 | |
| $ | 188,535 | |
Additions/adjustments from acquisitions | - | |
| (98 | ) |
| (98 | ) |
| - | |
| 133,910 | |
| 133,910 | | ||||||
Foreign exchange translation | (6,964 | ) |
| (8,366 | ) |
| (15,330 | ) |
| (5,307 | ) |
| (2,925 | ) |
| (8,232 | ) | ||||||
Balance, end of year | $ | 95,947 | |
| $ | 202,838 | |
| $ | 298,785 | |
| $ | 102,911 | |
| $ | 211,302 | |
| $ | 314,213 | |
The additions/adjustments to "Goodwill" recorded during fiscal years ended November 30, 2015 and 2014 relate to the acquisition of the IBM CRM business in the Concentrix segment. See Note 3 - Acquisitions.
Intangible assets, net: | As of November 30, 2015 |
| As of November 30, 2014 | ||||||||||||||||||||
| Gross |
| Accumulated |
| Net |
| Gross |
| Accumulated |
| Net | ||||||||||||
Customer relationships and lists | $ | 277,122 | |
| $ | (120,478 | ) |
| $ | 156,644 | |
| $ | 299,439 | |
| $ | (83,316 | ) |
| $ | 216,123 | |
Vendor lists | 36,815 | |
| (33,255 | ) |
| 3,560 | |
| 36,815 | |
| (31,717 | ) |
| 5,098 | | ||||||
Technology | 7,500 | |
| (2,000 | ) |
| 5,500 | |
| 7,500 | |
| (1,000 | ) |
| 6,500 | | ||||||
Other intangible assets | 6,598 | |
| (5,735 | ) |
| 863 | |
| 6,865 | |
| (4,902 | ) |
| 1,963 | | ||||||
| $ | 328,035 | |
| $ | (161,468 | ) |
| $ | 166,567 | |
| $ | 350,619 | |
| $ | (120,935 | ) |
| $ | 229,684 | |
Amortization expense for fiscal years 2015 , 2014 and 2013 , was $54,756 , $55,161 and $7,953 respectively.
Estimated future amortization expense of the Company's intangible assets is as follows:
Fiscal years ending November 30, |
| ||
2016 | $ | 46,986 | |
2017 | 36,050 | | |
2018 | 27,097 | | |
2019 | 17,839 | | |
2020 | 13,782 | | |
Thereafter | 24,813 | | |
Total | $ | 166,567 | |
65
Table of Contents
SYNNEX CORPORATION
NOTES TO CONSOLIDATED FINANCIAL STATEMENTS---(continued)
(currency and share amounts in thousands, except per share amounts)
Accumulated other comprehensive income (loss)
The components of accumulated other comprehensive income (loss), net of taxes, excluding noncontrolling interests were as follows:
|
| Unrealized gains on available-for-sale securities, net of taxes |
| Unrecognized defined benefit plan costs, net of taxes |
| Unrealized losses on cash flow hedges, net of taxes |
| Foreign currency translation adjustment, net of taxes |
| Total | ||||||||||
Balance, beginning of year |
| $ | 821 | |
| $ | 319 | |
| $ | - | |
| $ | (7,768 | ) |
| $ | (6,628 | ) |
Other comprehensive income (loss) |
| 125 | |
| (102 | ) |
| (3,539 | ) |
| (45,093 | ) |
| (48,609 | ) | |||||
Balance, end of year |
| $ | 946 | |
| $ | 217 | |
| $ | (3,539 | ) |
| $ | (52,861 | ) |
| $ | (55,237 | ) |
NOTE 7-INVESTMENTS:
The carrying amount of the Company's investments is shown in the table below:
| As of November 30, 2015 |
| As of November 30, 2014 | ||||||||||||||||||||
| Cost Basis |
| Unrealized |
| Carrying |
| Cost Basis |
| Unrealized |
| Carrying | ||||||||||||
Short-term investments: |
|
|
|
|
|
|
|
|
|
|
| ||||||||||||
Trading securities | $ | - | |
| $ | - | |
| $ | - | |
| $ | 1,614 | |
| $ | 373 | |
| $ | 1,987 | |
Held-to-maturity investments | 5,546 | |
| - | |
| 5,546 | |
| 5,141 | |
| - | |
| 5,141 | | ||||||
| $ | 5,546 | |
| $ | - | |
| $ | 5,546 | |
| $ | 6,755 | |
| $ | 373 | |
| $ | 7,128 | |
Long-term investments in other assets: |
|
|
|
|
|
|
|
|
|
|
| ||||||||||||
Available-for-sale securities | $ | 837 | |
| $ | 1,073 | |
| $ | 1,910 | |
| $ | 843 | |
| $ | 897 | |
| $ | 1,740 | |
Cost-method investments | 4,555 | |
| - | |
| 4,555 | |
| 4,578 | |
| - | |
| 4,578 | | ||||||
Short-term trading securities generally consist of equity securities relating to the Company's deferred compensation plan. Held-to-maturity investments primarily consist of term deposits with maturities from the date of purchase greater than three months and less than one year. These term deposits are held until the maturity date and are not traded. Long-term available-for-sale securities primarily consist of investments in other companies' equity securities. Long-term cost-method investments consist of investments in equity securities of private entities.
Trading securities and available-for-sale securities are recorded at fair value in each reporting period and therefore the carrying value of these securities equals their fair value. For cost-method investments, the Company records an impairment charge when the decline in fair value is determined to be other-than-temporary. The fair value of cost-method investments is based on an internal valuation of the investees.
The following table summarizes the total gains recorded in "Other income (expense), net" in the Consolidated Statements of Operations for changes in the fair value of the Company's trading investments during fiscal years 2015 , 2014 , and 2013 :
| Fiscal Years Ended November 30, | ||||||||||
| 2015 |
| 2014 |
| 2013 | ||||||
Gains on trading investments | $ | 50 | |
| $ | 397 | |
| $ | 1,868 | |
NOTE 8-DERIVATIVE INSTRUMENTS:
In the ordinary course of business, the Company is exposed to foreign currency risk, interest rate risk, equity risk and credit risk. The Company's transactions in most of its foreign operations are primarily denominated in local currency. The Company enters into transactions, and owns monetary assets and liabilities, that are denominated in currencies other than the legal entity's functional currency. The Company may enter into forward contracts, option contracts, swaps, or other derivative instruments to offset a portion of the risk on expected future cash flows, on net investments in certain foreign subsidiaries and on certain existing assets and liabilities. However, the Company may choose not to hedge certain exposures for a variety of
66
Table of Contents
SYNNEX CORPORATION
NOTES TO CONSOLIDATED FINANCIAL STATEMENTS---(continued)
(currency and share amounts in thousands, except per share amounts)
reasons including, but not limited to, accounting considerations and the prohibitive economic cost of hedging particular exposures. There can be no assurance the hedges will offset more than a portion of the financial impact resulting from movements in foreign currency exchange or interest rates.
All derivatives are recognized on the balance sheet at their fair value. Changes in the fair value of a derivative are recorded in the Consolidated Statements of Operations as "Other income (expense), net" or as a component of "Accumulated other comprehensive income (loss)" in the Consolidated Balance Sheets, as discussed below.
As part of its risk management strategy, the Company uses short-term forward contracts to minimize its balance sheet exposure to foreign currency risk. These forward-exchange contracts are not designated as hedging instruments. The forward exchange contracts are recorded at fair value in each reporting period and any gains or losses, resulting from the changes in fair value, are recorded in earnings in the period of change.
In May 2015, the Company entered into interest rate swaps with an aggregate notional amount of $400,000 to economically convert a portion of its variable-rate debt to fixed-rate debt. The effective portions of cash flow hedges are recorded in "Accumulated other comprehensive income (loss)" until the hedged item is recognized in earnings. Deferred gains and losses associated with cash flow hedges of interest expense are recognized in "Other income (expense), net" in the same period as the related expense is recognized. The ineffective portions and amounts excluded from the effectiveness testing of cash flow hedges are recognized in "Other income (expense), net."
Derivative instruments designated as cash flow hedges must be de-designated as hedges when it is probable the forecasted hedged transaction will not occur in the initially identified time period or within a subsequent two-month time period. Deferred gains and losses in "Accumulated other comprehensive income (loss)" associated with such derivative instruments are reclassified immediately into "Other income (expense), net." Any subsequent changes in fair value of such derivative instruments are reflected in "Other income (expense), net" unless they are re-designated as hedges of other transactions.
Generally, the Company does not use derivative instruments to cover equity risk and credit risk. The Company's policy is not to allow the use of derivatives for trading or speculative purposes. The fair values of the Company's derivative instruments are also disclosed in Note 9.
The following table summarizes the fair value of the Company's derivative instruments as of November 30, 2015 and 2014 :
|
| Fair Value as of | ||||||
Balance Sheet Line Item |
| November 30, 2015 |
| November 30, 2014 | ||||
Derivative instruments not designated as hedging instruments |
|
|
|
| ||||
Foreign exchange forward contracts |
|
|
|
| ||||
Other current assets |
| $ | 1,753 | |
| $ | 4,532 | |
Other accrued liabilities |
| $ | 466 | |
| $ | 145 | |
Derivative instruments designated as cash flow hedges |
|
|
|
| ||||
Interest rate swaps |
|
|
|
| ||||
Other current assets |
| $ | 19 | |
| $ | - | |
Other long-term liabilities |
| $ | 5,808 | |
| $ | - | |
The notional amounts of the foreign exchange forward contracts that were outstanding as of November 30, 2015 and 2014 were $251,677 and $316,365 , respectively. The notional amounts represent the gross amounts of foreign currency, including the Canadian Dollar, British Pound, Indian Rupee, Mexican Peso, Philippine Peso, Euro, Brazilian Real and Australian Dollar, that will be bought or sold at maturity. The contracts mature in six months or less. In relation to its forward contracts not designated as hedging instruments, the Company recorded gains of $18,764 , $22,190 and $8,368 in "Other income (expense), net" in fiscal years 2015 , 2014 and 2013 , respectively. The gains and losses on the Company's foreign currency forward contracts are largely offset by the change in the fair value of the underlying hedged assets or liabilities.
For the fiscal year 2015 , the Company recorded a loss before tax of $5,789 in other comprehensive income related to changes in the fair value of its derivative instruments designated as cash flow hedging instruments. For the fiscal year 2015 ,
67
Table of Contents
SYNNEX CORPORATION
NOTES TO CONSOLIDATED FINANCIAL STATEMENTS---(continued)
(currency and share amounts in thousands, except per share amounts)
there was no hedge ineffectiveness related to these derivative instruments. For the fiscal year 2015 , there were no gains or losses recognized in earnings associated with an underlying exposure that did not, or was not expected to, occur; nor are there any anticipated in the normal course of business within the next twelve months. There were no derivatives designated as hedging instruments during the fiscal year 2014 .
In the Consolidated Balance Sheets, the Company does not offset derivative assets against liabilities in master netting arrangements. If derivative exposures covered by a qualifying master netting agreement had been netted in the Consolidated Statement of Financial Position, the total derivative asset and liability positions would have been reduced by $1,948 each as of November 30, 2015 and $145 each as of November 30, 2014 .
Credit exposure for derivative financial instruments is limited to the amounts, if any, by which the counterparties' obligations under the contracts exceed our obligations to the counterparties. We manage the potential risk of credit losses through careful evaluation of counterparty credit standing and selection of counterparties from a limited group of financial institutions.
The Company's fair value measurements are classified and disclosed in one of the following three categories:
Level 1: Unadjusted quoted prices in active markets that are accessible at the measurement date for identical, unrestricted assets or liabilities;
Level 2: Quoted prices in markets that are not active, or inputs which are observable, either directly or indirectly, for substantially the full term of the asset or liability;
Level 3: Prices or valuation techniques that require inputs that are both significant to the fair value measurement and unobservable (i.e., supported by little or no market activity).
The following table summarizes the valuation of the Company's investments and financial instruments that are measured at fair value on a recurring basis:
| As of November 30, 2015 |
| As of November 30, 2014 | ||||||||||||||||||||||||||||
| Total |
| Fair value measurement category |
| Total |
| Fair value measurement category | ||||||||||||||||||||||||
| Level 1 |
| Level 2 |
| Level 3 |
| Level 1 |
| Level 2 |
| Level 3 | ||||||||||||||||||||
Assets: |
|
|
|
|
|
|
|
|
|
|
|
|
|
|
| ||||||||||||||||
Cash equivalents | $ | 208,597 | |
| $ | 208,597 | |
| $ | - | |
| $ | - | |
| $ | 29,823 | |
| $ | 29,823 | |
| $ | - | |
| $ | - | |
Restricted cash | 88,558 | |
| 88,558 | |
| - | |
| - | |
| 34,269 | |
| 34,269 | |
| - | |
| - | | ||||||||
Trading securities | - | |
| - | |
| - | |
| - | |
| 1,987 | |
| 1,987 | |
| - | |
| - | | ||||||||
Available-for-sale securities | 1,910 | |
| 1,910 | |
| - | |
| - | |
| 1,740 | |
| 1,740 | |
| - | |
| - | | ||||||||
Forward foreign currency exchange contracts | 1,753 | |
| - | |
| 1,753 | |
| - | |
| 4,532 | |
| - | |
| 4,532 | |
| - | | ||||||||
Interest rate swaps | 19 | |
| - | |
| 19 | |
| - | |
| - | |
| - | |
| - | |
| - | | ||||||||
Liabilities: |
|
| |
| |
| |
|
|
| |
| |
| | ||||||||||||||||
Forward foreign currency exchange contracts | $ | 466 | |
| $ | - | |
| $ | 466 | |
| $ | - | |
| $ | 145 | |
| $ | - | |
| $ | 145 | |
| $ | - | |
Interest rate swaps | 5,808 | |
| - | |
| 5,808 | |
| - | |
| - | |
| - | |
| - | |
| - | | ||||||||
Acquisition-related contingent consideration | 433 | |
| - | |
| - | |
| 433 | |
| 867 | |
| - | |
| - | |
| 867 | | ||||||||
The Company's cash equivalents consist primarily of highly liquid investments in money market funds and term deposits with maturity periods of three months or less. Restricted cash relates primarily to temporary restrictions caused by the timing of lockbox collections under the Company's borrowing arrangements and the timing of payments under vendor agreements. The carrying values of the cash equivalents approximate fair value since they are near their maturity. Investments in trading and available-for-sale securities consist of equity securities and are recorded at fair value based on quoted market prices. The fair values of forward exchange contracts are measured based on the foreign currency spot and forward rates quoted by the banks or
68
Table of Contents
SYNNEX CORPORATION
NOTES TO CONSOLIDATED FINANCIAL STATEMENTS---(continued)
(currency and share amounts in thousands, except per share amounts)
foreign currency dealers. Fair values of interest rate swaps are measured using standard valuation models using inputs that are readily available in public markets, or can be derived from observable market transactions, including LIBOR spot and forward rates. The effect of nonperformance risk on the fair value of derivative instruments was not material as of November 30, 2015 and November 30, 2014 .
The acquisition-related contingent consideration liability represents the future potential earn-out payments relating to an acquisition. The fair value of the contingent consideration liability is based on the Company's probability assessment of the established profitability measures during the earn-out period ranging from one year to three years from the date of the acquisition.
The carrying values of held-to-maturity securities, accounts receivable, accounts payable and short-term debt approximate fair value due to their short maturities and interest rates which are variable in nature. The carrying value of the Company's term loans approximate their fair value since they bear interest rates that are similar to existing market rates.
During fiscal years 2015 and 2014 , there were no transfers between the fair value measurement category levels.
NOTE 10-ACCOUNTS RECEIVABLE ARRANGEMENTS:
The Company has an accounts receivable securitization program to finance its operations in the United States (the "U.S. Arrangement"). The U.S. Arrangement has a maturity date of November 4, 2016. One of the Company's subsidiaries, which is the borrower under the U.S. Arrangement, can borrow up to a maximum of $600,000 based upon eligible trade accounts receivable generated by the parent company and one of its United States subsidiaries. The U.S. Arrangement includes an accordion feature to allow requests for an increase in the lenders' commitment by an additional $100,000 . The effective borrowing cost under the U.S. Arrangement is a blended rate that includes prevailing dealer commercial paper rates and the daily London Interbank Offered Rate ("LIBOR"), plus a program fee of 0.375% per annum based on the used portion of the commitment, and a facility fee of 0.40% per annum payable on the aggregate commitment of the lenders. As of November 30, 2015 , there were no borrowings outstanding under the U.S. Arrangement. As of November 30, 2014 , $578,000 was outstanding.
Under the terms of the U.S. Arrangement, the Company and one of the Company's United States subsidiaries sell, on a revolving basis, their receivables (other than certain specifically excluded receivables) to a wholly-owned, bankruptcy-remote subsidiary. The borrowings are funded by pledging all of the rights, title and interest in and to the receivables acquired by the Company's subsidiary as security. Any borrowings under the U.S. Arrangement are recorded as debt on the Company's Consolidated Balance Sheets. As is customary in trade accounts receivable securitization arrangements, a credit rating agency's downgrade of the third party issuer of commercial paper or of a back-up liquidity provider (which provides a source of funding if the commercial paper market cannot be accessed) could result in an increase in the Company's cost of borrowing or loss of the Company's financing capacity under these programs if the commercial paper issuer or liquidity back-up provider is not replaced, or if the lender whose commercial paper issuer or liquidity back-up provider is not replaced does not elect to offer the Company an alternative rate. Loss of such financing capacity could have a material adverse effect on the Company's financial condition and results of operations.
The Company also has other financing agreements in North America with various financial institutions ("Flooring Companies") to allow certain customers of the Company to finance their purchases directly with the Flooring Companies. Under these agreements, the Flooring Companies pay to the Company the selling price of products sold to various customers, less a discount, within approximately 15 to 30 days from the date of sale. The Company is contingently liable to repurchase inventory sold under flooring agreements in the event of any default by its customers under the agreement and such inventory being repossessed by the Flooring Companies. Please see Note 18 - Commitments and Contingencies for further information.
The following table summarizes the net sales financed through the flooring agreements and the flooring fees incurred:
| Fiscal Years Ended November 30, | ||||||||||
| 2015 |
| 2014 |
| 2013 | ||||||
Net sales financed | $ | 1,306,859 | |
| $ | 1,363,095 | |
| $ | 1,023,966 | |
Flooring fees (1) | 8,478 | |
| 7,981 | |
| 5,877 | | |||
(1) | Flooring fees are included within "Interest expense and finance charges, net." |
69
Table of Contents
SYNNEX CORPORATION
NOTES TO CONSOLIDATED FINANCIAL STATEMENTS---(continued)
(currency and share amounts in thousands, except per share amounts)
As of November 30, 2015 and 2014 , accounts receivable subject to flooring agreements were $55,333 and $93,546 , respectively.
SYNNEX Infotec, the Company's Japan Technology Solutions subsidiary, has arrangements with various banks and financial institutions for the sale and financing of approved accounts receivable and notes receivable. The amounts outstanding under these arrangements that were sold, but not collected, as of November 30, 2015 and 2014 were $3,074 and $6,199 , respectively.
NOTE 11-BORROWINGS:
Borrowings consist of the following:
| As of November 30 | ||||||
| 2015 |
| 2014 | ||||
SYNNEX U.S. securitization (see Note 10 - Accounts Receivable Arrangements) | $ | - | |
| $ | 578,000 | |
SYNNEX U.S. credit agreement | 617,188 | |
| 279,375 | | ||
SYNNEX Canada term loan and revolver | 14,449 | |
| 36,956 | | ||
SYNNEX Infotec credit facility | 96,662 | |
| 53,954 | | ||
Other borrowings and capital leases | 2,592 | |
| 32,218 | | ||
Total borrowings | 730,891 | |
| 980,503 | | ||
Less: Current portion | (92,093 | ) |
| (716,257 | ) | ||
Non-current portion | $ | 638,798 | |
| $ | 264,246 | |
SYNNEX U.S. credit agreement
In November 2013, the Company entered into a senior secured credit agreement (the "U.S. Credit Agreement") which was comprised of a $275,000 revolving credit facility and a $225,000 term loan. In May 2015, the U.S. Credit Agreement was amended to increase the term loan to $625,000 . The Company may request incremental commitments to increase the principal amount of revolving loans or term loans available under the U.S. Credit Agreement up to $350,000 . The U.S. Credit Agreement matures in May 2020.
Interest on borrowings under the U.S. Credit Agreement can be based on LIBOR or a base rate at the Company's option. Loans borrowed under the U.S. Credit Agreement bear interest, in the case of LIBOR loans, at a per annum rate equal to the applicable LIBOR, plus a margin which may range from 1.50% to 2.25% , based on the Company's consolidated leverage ratios, as determined in accordance with the U.S. Credit Agreement. Loans borrowed under the U.S. Credit Agreement that are not LIBOR loans, and are instead base rate loans, bear interest at a per annum rate equal to (i) the greatest of (A) the Federal Funds Rate plus a margin of 1/2 of 1.0%, (B) LIBOR plus 1.0% per annum, and (C) the rate of interest announced, from time to time, by the agent, Bank of America, N.A, as its "prime rate," plus (ii) a margin which may range from 0.50% to 1.25% , based on the Company's consolidated leverage ratios as determined in accordance with the U.S. Credit Agreement. The unused revolving credit facility is subject to a commitment fee ranging from 0.20% to 0.35% per annum, based on the Company's consolidated leverage ratios.
The outstanding principal amount of the term loan is repayable in quarterly installments, in an amount equal to (a) for each of the first eight full calendar quarters ending after the U.S. Credit Agreement amendment entered in May 2015, 1.25% of the amended principal amount of the term loan, (b) for each of the next four calendar quarters ending thereafter, 1.875% of the amended principal amount of the term loan, (c) for each calendar quarter ending thereafter, 2.50% of the amended principal amount of the term loan and (d) on the May 2020 maturity date of the term loan, the outstanding principal amount of the term loan. The Company's obligations under the U.S. Credit Agreement are secured by substantially all of the parent company's and its United States domestic subsidiaries' assets and are guaranteed by certain of its United States domestic subsidiaries.
As of November 30, 2015 and November 30, 2014 , balances outstanding under the term loan component of the U.S. Credit Agreement were $617,188 and $219,375 , respectively. There were no borrowings outstanding under the revolving credit facility as of November 30, 2015 , and there was $60,000 outstanding as of November 30, 2014 . In addition, there was $1,500 outstanding as of both November 30, 2015 and 2014 , in standby letters of credit under the U.S. Credit Agreement.
70
Table of Contents
SYNNEX CORPORATION
NOTES TO CONSOLIDATED FINANCIAL STATEMENTS---(continued)
(currency and share amounts in thousands, except per share amounts)
SYNNEX Canada revolving line of credit
SYNNEX Canada Limited ("SYNNEX Canada") has a revolving line of credit arrangement with a group of financial institutions (the "Canadian Revolving Arrangement") which has a maximum commitment of CAD100,000 or $74,833 , and includes an accordion feature to increase the maximum commitment by an additional CAD25,000 , or $18,708 , to CAD125,000 , or $93,541 , at SYNNEX Canada's request. The Canadian Revolving Arrangement also provides a sublimit of $5,000 for the issuance of standby letters of credit. As of both November 30, 2015 and 2014 , there were no letters of credit outstanding.
SYNNEX Canada has granted a security interest in substantially all of its assets in favor of the lender under the Canadian Revolving Arrangement. In addition, the Company pledged its stock in SYNNEX Canada as collateral for the Canadian Revolving Arrangement. The interest rate applicable under the Canadian Revolving Arrangement is equal to (i) the Canadian base rate plus a margin of 0.75% for a Base Rate Loan in Canadian Dollars, (ii) the US base rate plus a margin of 0.75% for a Base Rate Loan in U.S. Dollars, and (iii) the Bankers' Acceptance rate ("BA") plus a margin of 2.00% for a BA Rate Loan. The Canadian base rate means the greater of (a) the prime rate determined by a major Canadian financial institution and (b) the one month Canadian Dealer Offered Rate ("CDOR") (the average rate applicable to Canadian Dollar bankers' acceptances for the applicable period) plus 1.50% . The US base rate means the greater of (a) a reference rate determined by a major Canadian financial institution for US dollar loans made to Canadian borrowers and (b) the US federal funds rate plus 0.50% . A fee of 0.25% per annum is payable with respect to the unused portion of the commitment. The credit arrangement expires in May 2017. As of November 30, 2015 and 2014 , borrowings outstanding under the Canadian Revolving Arrangement were $9,728 and $30,726 , respectively.
SYNNEX Canada term loan
SYNNEX Canada has a term loan associated with the purchase of its logistics facility in Guelph, Canada. The interest rate for the unpaid principal amount is a fixed rate of 5.374% per annum. The final maturity date for repayment of the unpaid principal is April 1, 2017. As of November 30, 2015 and 2014 , the balances outstanding on the term loan were $4,721 and $6,230 , respectively.
SYNNEX Infotec credit facility
In November 2015, SYNNEX Infotec entered into a credit agreement with a group of financial institutions for a maximum commitment of JPY14,000,000 , or $113,719 , to replace its existing credit facility with another syndicated credit facility. The new credit agreement is comprised of a JPY6,000,000 , or $48,737 , term loan and a JPY8,000,000 , or $64,983 , short-term revolving credit facility. The interest rate for the term loan and revolving credit facility is based on the Tokyo Interbank Offered Rate ("TIBOR") plus a margin of 0.70% per annum. The unused line fee on the revolving credit facility is 0.10% per annum. This credit facility expires in November 2018. As of November 30, 2015 and November 30, 2014 , the balances outstanding under the related credit facilities were $96,662 and $53,954 , respectively. The term loan can be repaid at any time prior to expiration date without penalty. The Company has guaranteed the obligations of SYNNEX Infotec under this facility.
India credit facilities
In 2015, the Company's Indian subsidiaries entered into credit agreements with a financial institution to borrow up to an aggregate amount of $14,000 for working capital purposes. The interest rate for the credit facility is based on LIBOR plus a margin of 0.90% per annum. The credit facilities expire in June 2016 and will extend upon the financial institution's review and approval. The Company guarantees up to 100% of the outstanding principal amount to the lenders. As of November 30, 2015, there were no outstanding borrowings under these credit facilities.
Other borrowings and capital leases
In September 2013, SYNNEX Infotec established a short-term revolving credit facility of JPY2,000,000 , or $16,246 , with a financial institution. The interest rate for the credit facility is based on TIBOR plus a margin of 0.50% per annum. In addition, there is a facility fee of 0.425% per annum. The credit facility can be renewed annually. As of November 30, 2015 , there were no outstanding balances under this credit facility, and there was $16,861 outstanding as of November 30, 2014 .
SYNNEX Infotec has a short-term revolving credit facility of JPY1,000,000 , or $8,123 , with a financial institution. The credit facility can be renewed annually and bears an interest rate that is based on TIBOR plus a margin of 1.20% per annum. As of November 30, 2015 , there were no balances outstanding under this credit facility and there was $8,430 outstanding as of November 30, 2014 .
71
Table of Contents
SYNNEX CORPORATION
NOTES TO CONSOLIDATED FINANCIAL STATEMENTS---(continued)
(currency and share amounts in thousands, except per share amounts)
As of November 30, 2015 and 2014 , the Company also had $2,592 and $6,927 , respectively, in obligations for the sale and financing of approved accounts receivable and notes receivable with recourse provisions to SYNNEX Infotec and outstanding capital lease obligations.
The maximum commitment amounts for local currency credit facilities in Canada and Japan have been translated into United States Dollars at November 30, 2015 exchange rates.
Future principal payments
Future principal payments under the above loans and capital leases as of November 30, 2015 are as follows:
Fiscal Years Ending November 30, |
| ||
2016 | $ | 92,093 | |
2017 | 35,836 | | |
2018 | 100,235 | | |
2019 | 63,255 | | |
2020 | 438,287 | | |
Thereafter | 1,185 | | |
| $ | 730,891 | |
Interest expense and finance charges
For fiscal years 2015 , 2014 and 2013 , the total interest expense and finance charges for the Company's borrowings were $27,935 , $28,022 and $20,436 , respectively. In fiscal year 2013, the total interest expense and finance charges included non-cash interest expense of $2,314 for the convertible debt which was settled in August 2013. The variable interest rates ranged between 0.57% and 4.50% , between 0.50% and 4.25% and between 0.63% and 4.08% in fiscal years 2015 , 2014 and 2013 , respectively.
Covenant compliance
The Company's borrowing arrangements have a number of covenants and restrictions that, among other things, require the Company to comply with certain financial and other covenants. These covenants require the Company to maintain specified financial ratios and satisfy certain financial condition tests, including minimum net worth and fixed charge coverage ratios. The covenants also limit the Company's ability to incur additional debt, make or forgive intercompany loans, pay dividends and make other types of distributions, make certain acquisitions, repurchase the Company's stock, create liens, cancel debt owed to the Company, enter into agreements with affiliates, modify the nature of the Company's business, enter into sale-leaseback transactions, make certain investments, enter into new real estate leases, transfer and sell assets, cancel or terminate any material contracts and merge or consolidate.
NOTE 12-CONVERTIBLE DEBT:
In August 2013, the Company settled its Convertible Senior Notes with an aggregate principal amount of $143,750 which were issued in May 2008 in a private placement. The Convertible Senior Notes bore a cash coupon interest rate of 4.0% per annum and the initial conversion rate was 33.9945 shares of common stock per $1 principal amount, equivalent to an initial conversion price of $29.42 per share of common stock. The Convertible Senior Notes were called in the second quarter of fiscal year 2013. No interest was accrued subsequent to May 2013 in accordance with the Indenture. The final settlement amount of $218,870 was paid in cash in August 2013 and was comprised of $143,750 in principal payments and $75,120 in payment of the conversion premium. The conversion premium, which represents the total settlement amount less the principal, was recorded as a reduction of "Additional paid-in capital." The final settlement amount was calculated in accordance with the Indenture based on the volume weighted-average trading price of the Company's common stock over the 60 consecutive trading-day period beginning on and including the third trading day after the related conversion.
Based on a cash coupon interest rate of 4.0% , the Company recorded contractual interest expense of $3,010 for fiscal year ended November 30, 2013. Based on an effective rate of 8.0% , the Company recorded non-cash interest expenses of $2,314 during the fiscal year ended November 30, 2013.
72
Table of Contents
SYNNEX CORPORATION
NOTES TO CONSOLIDATED FINANCIAL STATEMENTS---(continued)
(currency and share amounts in thousands, except per share amounts)
NOTE 13-EARNINGS PER COMMON SHARE:
The following table sets forth the computation of basic and diluted earnings per common share for the periods indicated:
| Fiscal Years Ended November 30, | ||||||||||
| 2015 |
| 2014 |
| 2013 | ||||||
Basic earnings per common share: |
|
|
|
|
| ||||||
Net income attributable to SYNNEX Corporation | $ | 208,525 | |
| $ | 180,034 | |
| $ | 152,237 | |
Less: net income allocated to participating securities (1) | (2,429 | ) |
| (2,407 | ) |
| (2,310 | ) | |||
Net income attributable to SYNNEX Corporation common stockholders | $ | 206,096 | |
| $ | 177,627 | |
| $ | 149,927 | |
Weighted-average number of common shares - basic | 39,061 | |
| 38,490 | |
| 36,888 | | |||
Basic earnings attributable to SYNNEX Corporation per common share | $ | 5.28 | |
| $ | 4.61 | |
| $ | 4.06 | |
|
|
|
|
|
| ||||||
Diluted earnings per common share: |
|
|
|
|
| ||||||
Net income attributable to SYNNEX Corporation | $ | 208,525 | |
| $ | 180,034 | |
| $ | 152,237 | |
Less: net income allocated to participating securities (1) | (2,413 | ) |
| (2,386 | ) |
| (2,266 | ) | |||
Less: impact of conversion premium of convertible debt | - | |
| - | |
| (36,409 | ) | |||
Net income attributable to SYNNEX Corporation common stockholders | $ | 206,112 | |
| $ | 177,648 | |
| $ | 113,562 | |
Weighted average number of common shares - basic | 39,061 | |
| 38,490 | |
| 36,888 | | |||
Effect of dilutive securities: |
|
|
|
|
| ||||||
Stock options and restricted stock units | 291 | |
| 355 | |
| 394 | | |||
Conversion premium of convertible debt | - | |
| - | |
| 351 | | |||
Weighted-average number of common shares - diluted | 39,352 | |
| 38,845 | |
| 37,633 | | |||
Diluted earnings attributable to SYNNEX Corporation per common share | $ | 5.24 | |
| $ | 4.57 | |
| $ | 3.02 | |
|
|
|
|
|
| ||||||
Anti-dilutive shares excluded from diluted earnings per share calculation | 3 | |
| 10 | |
| 10 | | |||
____________________________________
(1) | Restricted stock awards granted to employees and non-employee directors by the Company and its subsidiaries are considered participating securities. |
In August 2013, the Company settled its Convertible Senior Notes with an aggregate principal amount of $143,750 which were issued in May 2008 in a private placement. It was the Company's intent to settle the principal amount of the Convertible Senior Notes in cash; accordingly, the principal amount was excluded from the determination of diluted earnings per share. In April 2013, the Company decided to settle the payment of the conversion premium in cash as discussed in Note 12-Convertible Debt. Through April 2013, the Company accounted for the conversion premium using the treasury stock method by adjusting the diluted weighted-average common shares if the effect was dilutive. For the fiscal year ended November 30, 2013, the numerator for the computation of diluted earnings per common share was adjusted for any dilutive changes in the estimated value of the conversion premium from April 2013 through the final settlement date. For the fiscal year ended November 30, 2013, the adjustment to the numerator had the effect of reducing the diluted earnings per share by $0.97 .
73
Table of Contents
SYNNEX CORPORATION
NOTES TO CONSOLIDATED FINANCIAL STATEMENTS---(continued)
(currency and share amounts in thousands, except per share amounts)
NOTE 14-SEGMENT INFORMATION:
Operating segments
Summarized financial information related to the Company's reportable business segments for fiscal years 2015 , 2014 , and 2013 is shown below:
| Technology Solutions |
| Concentrix |
| Inter-Segment Elimination |
| Consolidated | ||||||||
Fiscal Year ended November 30, 2015: | |
| |
| |
| | ||||||||
Revenue | $ | 11,936,660 | |
| $ | 1,416,670 | |
| $ | (14,933 | ) |
| $ | 13,338,397 | |
External Revenue | 11,936,282 | |
| 1,402,115 | |
| - | |
| 13,338,397 | | ||||
Operating income | 302,950 | |
| 51,127 | |
| 475 | |
| 354,552 | | ||||
Depreciation and amortization expense | 15,105 | |
| 88,881 | |
| (476 | ) |
| 103,510 | | ||||
Total assets | $ | 4,149,080 | |
| $ | 1,057,880 | |
| $ | (762,813 | ) |
| $ | 4,444,147 | |
Fiscal Year ended November 30, 2014: | |
| |
| |
| | ||||||||
Revenue | $ | 12,755,514 | |
| $ | 1,096,214 | |
| $ | (12,138 | ) |
| $ | 13,839,590 | |
External Revenue | 12,755,264 | |
| 1,084,326 | |
| - | |
| 13,839,590 | | ||||
Operating income | 305,499 | |
| 2,455 | |
| 553 | |
| 308,507 | | ||||
Depreciation and amortization expense | 14,354 | |
| 77,821 | |
| (476 | ) |
| 91,699 | | ||||
Total assets | $ | 4,422,841 | |
| $ | 938,450 | |
| $ | (648,249 | ) |
| $ | 4,713,042 | |
Fiscal Year ended November 30, 2013: | |
| |
| |
| | ||||||||
Revenue | $ | 10,666,215 | |
| $ | 189,463 | |
| $ | (10,514 | ) |
| $ | 10,845,164 | |
External Revenue | 10,665,886 | |
| 179,278 | |
| - | |
| 10,845,164 | | ||||
Operating income | 237,290 | |
| 3,249 | |
| 289 | |
| 240,828 | | ||||
Depreciation and amortization expense | 14,710 | |
| 10,114 | |
| (362 | ) |
| 24,462 | | ||||
Total assets | $ | 3,271,804 | |
| $ | 273,135 | |
| $ | (219,050 | ) |
| $ | 3,325,889 | |
Inter-segment elimination represents services and transactions generated between the Company's reportable segments that are eliminated on consolidation.
Geographic information
Shown below is summarized financial information related to the geographic areas in which the Company operated during fiscal years 2015 , 2014 and 2013 . The revenue attributable to countries is based on the geography of entities from where the products are delivered or from where customer service contracts are managed.
| Fiscal Years Ended November 30, | ||||||||||
| 2015 |
| 2014 |
| 2013 | ||||||
Revenue: |
|
|
|
|
| ||||||
United States | $ | 9,869,789 | |
| $ | 9,992,000 | |
| $ | 8,000,690 | |
Canada | 1,429,774 | |
| 1,610,387 | |
| 1,518,964 | | |||
Japan | 1,003,028 | |
| 1,331,111 | |
| 1,104,468 | | |||
Others | 1,035,806 | |
| 906,092 | |
| 221,042 | | |||
Total | $ | 13,338,397 | |
| $ | 13,839,590 | |
| $ | 10,845,164 | |
74
Table of Contents
SYNNEX CORPORATION
NOTES TO CONSOLIDATED FINANCIAL STATEMENTS---(continued)
(currency and share amounts in thousands, except per share amounts)
| As of November 30, | ||||||
| 2015 |
| 2014 | ||||
Property and equipment, net: |
|
|
| ||||
United States | $ | 118,766 | |
| $ | 100,369 | |
Philippines | 28,503 | |
| 27,077 | | ||
Others | 101,358 | |
| 73,357 | | ||
Total | $ | 248,627 | |
| $ | 200,803 | |
During the fiscal years ended November 30, 2015 , 2014 and 2013 , no other country represented more than 10% of total revenue. As of both November 30, 2015 and 2014 , no other country represented more than 10% of the total net property and equipment.
NOTE 15-RELATED PARTY TRANSACTIONS:
The Company has a business relationship with MiTAC Holdings Corporation ("MiTAC Holdings"), a publicly-traded company in Taiwan, which began in 1992 when MiTAC Holdings became the Company's primary investor through its affiliates. As of both November 30, 2015 and 2014 , MiTAC Holdings and its affiliates beneficially owned approximately 25% of the Company's outstanding common stock. Matthew Miau, the Company's Chairman Emeritus of the Board of Directors and a director, is the Chairman of MiTAC Holdings and a director or officer of MiTAC Holdings' affiliates.
Beneficial ownership of the Company's common stock by MiTAC Holdings
As noted above, MiTAC Holdings and its affiliates in the aggregate beneficially owned approximately 25% of the Company's outstanding common stock as of November 30, 2015 . These shares are owned by the following entities:
| As of November 30, 2015 | |
MiTAC Holdings (1) | 5,552 | |
Synnex Technology International Corp. (2) | 4,283 | |
Total | 9,835 | |
(1) | Shares are held via Silver Star Developments Ltd., a wholly-owned subsidiary of MiTAC Holdings. Excludes 373 shares directly held by Matthew Miau and 224 shares indirectly held by Mathew Miau through a charitable remainder trust. |
(2) | Synnex Technology International Corp. ("Synnex Technology International") is a separate entity from the Company and is a publicly-traded corporation in Taiwan. Shares are held via Peer Development Ltd., a wholly-owned subsidiary of Synnex Technology International. MiTAC Holdings owns a noncontrolling interest of 8.7% in MiTAC Incorporated, a privately-held Taiwanese company, which in turn holds a noncontrolling interest of 13.6% in Synnex Technology International. Neither MiTAC Holdings nor Mr. Miau is affiliated with any person(s), entity, or entities that hold a majority interest in MiTAC Incorporated. |
MiTAC Holdings generally has significant influence over the Company regarding matters submitted to stockholders for consideration, including any merger or acquisition of the Company. Among other things, this could have the effect of delaying, deterring or preventing a change of control over the Company.
The Company purchased inventories from MiTAC Holdings and its affiliates totaling $87,149 , $102,800 , and $31,424 during fiscal years ended November 30, 2015 , 2014 and 2013 , respectively. The Company's sales to MiTAC Holdings and its affiliates during fiscal years ended November 30, 2015 , 2014 , and 2013 totaled $1,290 , $4,058 and $4,534 , respectively. In addition, the Company received reimbursements of rent and overhead costs for facilities used by MiTAC Holdings amounting to $126 , $111 and $3,083 during fiscal years ended November 30, 2015 , 2014 and 2013 , respectively.
The Company's business relationship with MiTAC Holdings has been informal and is not governed by long-term commitments or arrangements with respect to pricing terms, revenue or capacity commitments. The Company negotiates pricing and other material terms on a case-by-case basis with MiTAC Holdings. While MiTAC Holdings is a related party, the Company believes that the significant terms under its arrangements with MiTAC Holdings, including pricing, do not materially differ from the terms it could have negotiated with unaffiliated third parties, and it has adopted a policy requiring that material transactions with MiTAC Holdings or its related parties be approved by its Audit Committee, which is composed solely of independent directors. In addition, Matthew Miau's compensation is approved by the Nominating and Corporate Governance Committee, which is also composed solely of independent directors.
75
Table of Contents
SYNNEX CORPORATION
NOTES TO CONSOLIDATED FINANCIAL STATEMENTS---(continued)
(currency and share amounts in thousands, except per share amounts)
Synnex Technology International is a publicly-traded corporation in Taiwan that currently provides distribution and fulfillment services to various markets in Asia and Australia, and is also a potential competitor of the Company. Neither MiTAC Holdings, nor Synnex Technology International is restricted from competing with the Company.
NOTE 16-PENSION AND EMPLOYEE BENEFITS PLANS:
The Company has defined benefit pension or retirement plans for eligible current, retired and resigned employees in certain foreign subsidiaries. Benefits under these plans are primarily based on years of service and compensation during the years immediately preceding retirement or termination of participation in the plans. In addition, the Company provides postemployment benefits to former or inactive employees after employment but before retirement in certain foreign subsidiaries. Net pension costs were $3,897 , $3,349 and $602 in fiscal years 2015, 2014 and 2013, respectively. The Company contributed $2,090 , $2,624 , $655 during fiscal years 2015, 2014 and 2013, respectively. As of November 30, 2015 and 2014, those plans were unfunded by $12,742 and $11,668 , respectively.
Employees of SYNNEX Infotec were also covered by a multi-employer plan. The Company recognized expense for this plan based on scheduled employer contributions. Consistent with generally accepted accounting principles that address participation in multi-employer plans, the Company did not recognize related plan assets or liabilities in its financial statements. The Company's contributions to the plan during fiscal years 2015, 2014 and 2013 were $525 , $1,705 and $1,115 , respectively. Employees also make contributions to this plan.
During fiscal year 2015, the Company withdrew from the multi-employer plan and set up a defined contribution plan to replace the existing plan. During the year ended November 30, 2015 , the company recorded $2,277 toward its funding obligations under this new plan.
The Company has a 401(k) Plan (the "Plan") under which eligible employees may contribute up to the maximum amount as provided by law. Employees become eligible to participate in the Plan on the first day of the month after their employment date. The Company may make discretionary contributions under the Plan. During fiscal years 2015 , 2014 and 2013 , the Company contributed $3,194 , $2,231 and $1,365 , respectively.
The Company has a deferred compensation plan for certain directors and officers. Distributions under the plan are subject to Section 409A of the United States Tax Code. The Company may invest balances in the plan in trading securities reported on recognized exchanges. As of November 30, 2015 and 2014, the deferred compensation liability balance was $8,100 and $10,702 , respectively.
76
Table of Contents
SYNNEX CORPORATION
NOTES TO CONSOLIDATED FINANCIAL STATEMENTS---(continued)
(currency and share amounts in thousands, except per share amounts)
NOTE 17-INCOME TAXES:
The sources of income before the provision for income taxes and non-controlling interest are as follows:
| Fiscal Years Ended November 30, | ||||||||||
| 2015 |
| 2014 |
| 2013 | ||||||
United States | $ | 197,406 | |
| $ | 198,687 | |
| $ | 201,386 | |
Foreign | 129,789 | |
| 85,595 | |
| 36,666 | | |||
| $ | 327,195 | |
| $ | 284,282 | |
| $ | 238,052 | |
Provision for income taxes consists of the following:
| Fiscal Years Ended November 30, | ||||||||||
| 2015 |
| 2014 |
| 2013 | ||||||
Current tax provision: |
|
|
|
|
| ||||||
Federal | $ | 65,101 | |
| $ | 81,927 | |
| $ | 66,491 | |
State | 15,179 | |
| 15,020 | |
| 10,069 | | |||
Foreign | 43,805 | |
| 33,048 | |
| 6,709 | | |||
| $ | 124,085 | |
| $ | 129,995 | |
| $ | 83,269 | |
Deferred tax provision (benefit): |
|
|
|
|
| ||||||
Federal | $ | (3,536 | ) |
| $ | (13,847 | ) |
| $ | 687 | |
State | (173 | ) |
| (2,606 | ) |
| 1,379 | | |||
Foreign | (1,788 | ) |
| (9,410 | ) |
| 395 | | |||
| $ | (5,497 | ) |
| $ | (25,863 | ) |
| $ | 2,461 | |
|
|
|
|
|
| ||||||
Total tax provision | $ | 118,588 | |
| $ | 104,132 | |
| $ | 85,730 | |
The following presents the breakdown between current and non-current net deferred tax assets:
| As of November 30, | ||||||
| 2015 |
| 2014 | ||||
Deferred tax assets - current | $ | 40,510 | |
| $ | 34,310 | |
Deferred tax assets - noncurrent | 19,849 | |
| 10,790 | | ||
Deferred tax liabilities - current | (1,667 | ) |
| (506 | ) | ||
Deferred tax liabilities - noncurrent | (10,713 | ) |
| (12,867 | ) | ||
Total net deferred tax assets | $ | 47,979 | |
| $ | 31,727 | |
77
Table of Contents
SYNNEX CORPORATION
NOTES TO CONSOLIDATED FINANCIAL STATEMENTS---(continued)
(currency and share amounts in thousands, except per share amounts)
Net deferred tax assets and liabilities consist of the following:
| As of November 30, | ||||||
| 2015 |
| 2014 | ||||
Assets: |
|
|
| ||||
Inventory reserves | $ | 9,829 | |
| $ | 9,206 | |
Allowance for doubtful accounts and sales return reserves | 8,040 | |
| 9,174 | | ||
Other reserves and accruals | 21,340 | |
| 11,609 | | ||
State tax credits | 3,798 | |
| 2,878 | | ||
Deferred and prepaid compensation | 9,321 | |
| 9,243 | | ||
Net operating losses | 17,580 | |
| 14,435 | | ||
Deferred revenue | 72 | |
| 2,123 | | ||
Share-based compensation expense | 6,290 | |
| 5,817 | | ||
Unrealized losses on cash flow hedges | 2,250 | |
| - | | ||
Others | 3,473 | |
| 1,914 | | ||
Gross deferred tax assets | 81,993 | |
| 66,399 | | ||
Valuation allowance | (16,891 | ) |
| (7,101 | ) | ||
Total deferred tax assets | $ | 65,102 | |
| $ | 59,298 | |
Liabilities: |
|
|
| ||||
Depreciation and amortization | $ | (5,374 | ) |
| $ | (5,750 | ) |
Intangible assets | (11,131 | ) |
| (19,736 | ) | ||
Unrealized gains on forward contracts | (356 | ) |
| - | | ||
Unrealized gains on investments | - | |
| (346 | ) | ||
Others | (262 | ) |
| (1,739 | ) | ||
Total deferred tax liabilities | $ | (17,123 | ) |
| $ | (27,571 | ) |
Net deferred tax assets | $ | 47,979 | |
| $ | 31,727 | |
The valuation allowance relates primarily to certain foreign net operating loss carry forward, foreign deferred items and state credits. The Company's assessment is that it is not more likely than not that these deferred tax assets will be realized.
A reconciliation of the statutory United States federal income tax rate to the Company's effective income tax rate is as follows:
| Fiscal Years Ended November 30, | |||||||
| 2015 |
| 2014 |
| 2013 | |||
Federal statutory income tax rate | 35.0 | % |
| 35.0 | % |
| 35.0 | % |
State taxes, net of federal income tax benefit | 2.5 | |
| 2.8 | |
| 3.1 | |
Foreign taxes | (1.3 | ) |
| (2.2 | ) |
| (3.0 | ) |
Others | - | |
| 1.0 | |
| 0.9 | |
Effective income tax rate | 36.2 | % |
| 36.6 | % |
| 36.0 | % |
The Company's United States business has sufficient cash flow and liquidity to fund its operating requirements and the Company expects and intends that profits earned outside the United States will be fully utilized and reinvested outside of the United States. Accordingly, the Company has not provisioned United States taxes and foreign withholding taxes on non-U.S. subsidiaries for which the earnings are permanently reinvested. The Company estimates that its total undistributed earnings upon which it has not provided deferred tax is approximately $396,163 as of November 30, 2015 . It is not currently practical to estimate the amount of income tax that might be payable if any earnings were to be distributed by individual foreign subsidiaries.
As of November 30, 2015 , the Company had net operating loss carry forward of approximately $15,702 and $11,724 for federal and state purposes, respectively. The federal net operating loss carry forward will start expiring in fiscal year ending November 30, 2021 if not used and the state net operating loss carry forward will start expiring in fiscal year ending November
78
Table of Contents
SYNNEX CORPORATION
NOTES TO CONSOLIDATED FINANCIAL STATEMENTS---(continued)
(currency and share amounts in thousands, except per share amounts)
30, 2016, if not used. The Company also had $26,208 of foreign net operating loss carry forward, primarily from SYNNEX Infotec Japan that will also start expiring in fiscal year ending November 30, 2016 if not used. In addition, the Company has $771 of various state income tax credit carry forwards that if not used, will begin expiring in fiscal year ending November 30, 2020.
The Company enjoys tax holidays in certain jurisdictions including China, Costa Rica, Nicaragua, India and Philippines. The tax holidays provide for lower or zero rates of taxation and require various thresholds of investment and business activities in those jurisdictions. Some of these tax holidays are in effect currently and scheduled to expire in 2016 if not extended. The estimated range of tax benefits from the above tax holidays on diluted earnings per share for fiscal years 2015 , 2014 , and 2013 were approximately $0.03 to $0.04 , $0.02 to $0.03 and $0.04 to $0.05 respectively.
The aggregate changes in the balances of gross unrecognized tax benefits, excluding accrued interest and penalties, during fiscal years 2015 , 2014 , and 2013 were as follows:
Balance as of November 30, 2012 | $ | 19,995 | |
Additions based on tax positions related to the current year | 2,574 | | |
Additions for tax positions of prior years | 343 | | |
Reductions for tax positions of prior years | (301 | ) | |
Lapse of statute of limitations | (781 | ) | |
Changes due to translation of foreign currencies | 27 | | |
Balance as of November 30, 2013 | 21,857 | | |
Additions based on tax positions related to the current year | 3,943 | | |
Additions for tax positions of prior years | 118 | | |
Reductions for tax positions of prior years | (3,609 | ) | |
Lapse of statute of limitations | (400 | ) | |
Changes due to translation of foreign currencies | (35 | ) | |
Balance as of November 30, 2014 | 21,874 | | |
Additions based on tax positions related to the current year | 3,485 | | |
Additions for tax positions of prior years | 923 | | |
Lapse of statute of limitations | (3,441 | ) | |
Changes due to translation of foreign currencies | (26 | ) | |
Balance as of November 30, 2015 | $ | 22,815 | |
The Company conducts business globally and files income tax returns in various U.S. and foreign tax jurisdictions. The Company is subject to continuous examination and audits by various tax authorities. In the United States, the Company is subject to examination and audits by tax authorities for tax years after fiscal year ended 2009. The Company is currently in appeal for its Federal income tax returns for fiscal years ended November 2009 and 2010. As of November 30, 2015 , the Company is unable to estimate the range of any possible adjustments due to uncertainty in the timing of the resolution of the audit. Although timing of the resolution of audits is highly uncertain, the Company does not believe it is reasonably possible that the total amount of unrecognized tax benefits as of November 30, 2015 will change materially in the next twelve months.
As of November 30, 2015 , the total uncertain tax position is $22,815 , of which $20,901 of the unrecognized tax benefits, net of federal benefit would affect the effective tax rate if realized. The Company's policy is to include interest and penalties related to income taxes, including unrecognized tax benefits, within the provision for income taxes. As of November 30, 2015 and 2014 , the Company had accrued $2,992 and $3,068 , respectively, in income taxes payable related to accrued interest and penalties.
79
Table of Contents
SYNNEX CORPORATION
NOTES TO CONSOLIDATED FINANCIAL STATEMENTS---(continued)
(currency and share amounts in thousands, except per share amounts)
NOTE 18-COMMITMENTS AND CONTINGENCIES:
The Company leases certain of its facilities under operating lease agreements, which expire in various periods through 2025. Future minimum contractually required cash payment obligations under non-cancellable lease agreements as of November 30, 2015 were as follows:
Fiscal Years Ending November 30, |
| ||
2016 | $ | 64,531 | |
2017 | 56,420 | | |
2018 | 47,954 | | |
2019 | 41,436 | | |
2020 | 32,056 | | |
thereafter | 60,296 | | |
Total minimum lease payments | $ | 302,693 | |
Rent expense for the years ended November 30, 2015 , 2014 and 2013 amounted to $93,505 , $62,286 and $22,596 , respectively. Sublease income was immaterial for each of the periods presented and is immaterial for the amounts entitled to be received in future periods under non-cancellable sublease arrangements.
The Company was contingently liable as of November 30, 2015 under agreements to repurchase repossessed inventory acquired by flooring companies as a result of default on floor plan financing arrangements by the Company's customers. These arrangements are described in Note 10 - Accounts Receivable Arrangements. Losses, if any, would be the difference between the repossession cost and the resale value of the inventory. There have been no repurchases through November 30, 2015 under these agreements and the Company is not aware of any pending customer defaults or repossession obligations.
From time to time, the Company receives notices from third parties, including customers and suppliers, seeking indemnification, payment of money or other actions in connection with claims made against them. Also, the Company is involved in various bankruptcy preference actions where the Company was a supplier to the companies now in bankruptcy. In addition, the Company is subject to various other claims, both asserted and unasserted, that arise in the ordinary course of business. The Company is currently not involved in any material proceedings.
In December 2009, the Company sold China Civilink (Cayman), which operated in China as HiChina Web Solutions, to Alibaba.com Limited. In conjunction with this sale, the Company has recorded a contingent indemnification liability of $4,122 .
Guarantees
The Company, as the ultimate parent, guaranteed the obligations of SYNNEX Investment Holdings Corporation up to $35,035 in connection with the sale of China Civilink (Cayman), which operated in China as HiChina Web Solutions, to Alibaba.com Limited. The guarantee expires in fiscal year 2018.
The Company does not believe that the above commitments and contingencies will have a material adverse effect on the Company's results of operations, financial position or cash flows.
80
Table of Contents
SELECTED QUARTERLY CONSOLIDATED FINANCIAL DATA (Unaudited)
The following table presents selected unaudited consolidated financial results for each of the eight quarters in the two-year period ended November 30, 2015 . In the Company's opinion, this unaudited information has been prepared on the same basis as the audited information and includes all adjustments (consisting of only normal recurring adjustments) necessary for a fair statement of the financial information for the periods presented.
| Fiscal Year 2015 Three Months Ended |
| Fiscal Year 2014 Three Months Ended | ||||||||||||||||||||||||||||
Statements of Operations Data: (currency and share amounts in thousands except per share amounts) | Feb. 28, 2015 |
| May 31, 2015 |
| Aug. 31, 2015 |
| Nov. 30, 2015 |
| Feb. 28, 2014 |
| May 31, 2014 |
| Aug. 31, 2014 |
| Nov. 30, 2014 | ||||||||||||||||
Revenue: |
|
|
|
|
|
|
|
|
|
|
|
|
|
|
| ||||||||||||||||
Products | $ | 2,864,131 | |
| $ | 2,915,500 | |
| $ | 2,976,901 | |
| $ | 3,179,750 | |
| $ | 2,902,813 | |
| $ | 3,162,935 | |
| $ | 3,204,484 | |
| $ | 3,485,032 | |
Services | 338,327 | |
| 338,285 | |
| 355,636 | |
| 369,867 | |
| 124,171 | |
| 290,600 | |
| 330,718 | |
| 338,837 | | ||||||||
Total revenue | 3,202,458 | |
| 3,253,785 | |
| 3,332,537 | |
| 3,549,617 | |
| 3,026,984 | |
| 3,453,535 | |
| 3,535,202 | |
| 3,823,869 | | ||||||||
Cost of revenue: |
|
|
|
|
|
|
|
|
|
|
|
|
|
|
| ||||||||||||||||
Products | (2,704,139 | ) |
| (2,743,872 | ) |
| (2,816,516 | ) |
| (3,012,292 | ) |
| (2,749,189 | ) |
| (2,999,073 | ) |
| (3,031,921 | ) |
| (3,295,645 | ) | ||||||||
Services | (210,101 | ) |
| (209,854 | ) |
| (225,243 | ) |
| (224,589 | ) |
| (71,149 | ) |
| (175,448 | ) |
| (203,559 | ) |
| (214,602 | ) | ||||||||
Gross profit | 288,218 | |
| 300,059 | |
| 290,778 | |
| 312,736 | |
| 206,646 | |
| 279,014 | |
| 299,722 | |
| 313,622 | | ||||||||
Selling, general and administrative expenses | (209,271 | ) |
| (210,698 | ) |
| (209,499 | ) |
| (207,771 | ) |
| (144,696 | ) |
| (210,931 | ) |
| (220,920 | ) |
| (213,950 | ) | ||||||||
Operating income | 78,947 | |
| 89,361 | |
| 81,279 | |
| 104,965 | |
| 61,950 | |
| 68,083 | |
| 78,802 | |
| 99,672 | | ||||||||
Interest expense and finance charges, net | (6,441 | ) |
| (5,815 | ) |
| (6,794 | ) |
| (7,246 | ) |
| (4,498 | ) |
| (6,160 | ) |
| (7,602 | ) |
| (6,927 | ) | ||||||||
Other income (expense), net | 67 | |
| (1,584 | ) |
| (150 | ) |
| 606 | |
| 2,968 | |
| (197 | ) |
| (548 | ) |
| (1,261 | ) | ||||||||
Income before income taxes | 72,573 | |
| 81,962 | |
| 74,335 | |
| 98,325 | |
| 60,420 | |
| 61,726 | |
| 70,652 | |
| 91,484 | | ||||||||
Provision for income taxes | (26,271 | ) |
| (30,052 | ) |
| (26,164 | ) |
| (36,101 | ) |
| (21,962 | ) |
| (22,147 | ) |
| (25,647 | ) |
| (34,376 | ) | ||||||||
Net income | 46,302 | |
| 51,910 | |
| 48,171 | |
| 62,224 | |
| 38,458 | |
| 39,579 | |
| 45,005 | |
| 57,108 | | ||||||||
Net income attributable to noncontrolling interest | 21 | |
| (36 | ) |
| - | |
| (67 | ) |
| (41 | ) |
| (28 | ) |
| (19 | ) |
| (28 | ) | ||||||||
Net income attributable to SYNNEX Corporation | $ | 46,323 | |
| $ | 51,874 | |
| $ | 48,171 | |
| $ | 62,157 | |
| $ | 38,417 | |
| $ | 39,551 | |
| $ | 44,986 | |
| $ | 57,080 | |
Net income attributable to SYNNEX Corporation per common share: |
|
|
|
|
|
|
|
|
|
|
|
|
|
|
| ||||||||||||||||
Basic | $ | 1.17 | |
| $ | 1.31 | |
| $ | 1.22 | |
| $ | 1.57 | |
| $ | 1.01 | |
| $ | 1.01 | |
| $ | 1.15 | |
| $ | 1.45 | |
Diluted | $ | 1.16 | |
| $ | 1.30 | |
| $ | 1.21 | |
| $ | 1.56 | |
| $ | 1.00 | |
| $ | 1.00 | |
| $ | 1.14 | |
| $ | 1.44 | |
Weighted-average common shares outstanding - basic | 38,968 | |
| 39,054 | |
| 39,082 | |
| 39,134 | |
| 37,656 | |
| 38,663 | |
| 38,753 | |
| 38,874 | | ||||||||
Weighted-average common shares outstanding - diluted | 39,303 | |
| 39,343 | |
| 39,328 | |
| 39,431 | |
| 38,065 | |
| 39,011 | |
| 39,068 | |
| 39,223 | | ||||||||
Cash dividends declared per share | $ | 0.13 | |
| $ | 0.13 | |
| $ | 0.13 | |
| $ | 0.20 | |
| $ | - | |
| $ | - | |
| $ | - | |
| $ | 0.13 | |
EPS for each quarter is computed using the weighted-average number of shares outstanding during that quarter, while EPS for the fiscal year is computed using the weighted-average of shares outstanding during the fiscal year. The sum of EPS for each of the four quarters may not equal EPS for the fiscal year.
81
Table of Contents
SYNNEX CORPORATION
SCHEDULE II-VALUATION AND QUALIFYING ACCOUNTS
For the Fiscal Years Ended November 30, 2015 , 2014 and 2013
(in thousands)
| Balances at Beginning of Fiscal Year |
| Additions/Deductions Charged to Revenue and Expense |
| Reclassifications and Write-offs |
| Balances at End of Fiscal Year | ||||||||
Fiscal Year Ended November 30, 2013 |
|
|
|
|
|
|
| ||||||||
Allowance for sales returns-gross | $ | 42,480 | |
| $ | 33,266 | |
| $ | (1,030 | ) |
| $ | 74,716 | |
Allowance for deferred tax assets | 6,422 | |
| (1,031 | ) |
| 1,949 | |
| 7,340 | | ||||
Fiscal Year Ended November 30, 2014 |
|
|
|
|
|
|
| ||||||||
Allowance for sales returns-gross | $ | 74,716 | |
| $ | (18,528 | ) |
| $ | (879 | ) |
| $ | 55,309 | |
Allowance for deferred tax assets | 7,340 | |
| (74 | ) |
| (165 | ) |
| 7,101 | | ||||
Fiscal Year Ended November 30, 2015 |
|
|
|
|
|
|
| ||||||||
Allowance for sales returns-gross | $ | 55,309 | |
| $ | (11,696 | ) |
| $ | 602 | |
| $ | 44,215 | |
Allowance for deferred tax assets | 7,101 | |
| 10,476 | |
| (686 | ) |
| 16,891 | | ||||
Item 9. Changes in and Disagreements with Accountants on Accounting and Financial Disclosure
None.
Item 9A. Controls and Procedures
Evaluation of disclosure controls and procedures
We maintain "disclosure controls and procedures," as such term is defined in Rule 13a-15(e) under the Securities Exchange Act of 1934 (the "Exchange Act"), that are designed to ensure that information required to be disclosed by us in reports that we file or submit under the Exchange Act is recorded, processed, summarized, and reported within the time periods specified in Securities and Exchange Commission rules and forms, and that such information is accumulated and communicated to our management, including our Chief Executive Officer and Chief Financial Officer, as appropriate, to allow timely decisions regarding required disclosures. In designing and evaluating our disclosure controls and procedures, management recognized that disclosure controls and procedures, no matter how well conceived and operated, can provide only reasonable, not absolute, assurance that the objectives of the disclosure controls and procedures are met. Our disclosure controls and procedures have been designed to meet reasonable assurance standards. Additionally, in designing disclosure controls and procedures, our management necessarily was required to apply its judgment in evaluating the cost-benefit relationship of possible disclosure controls and procedures. The design of any disclosure controls and procedures also is based in part upon certain assumptions about the likelihood of future events, and there can be no assurance that any design will succeed in achieving its stated goals under all potential future conditions.
Based on their evaluation as of the end of the period covered by this Annual Report on Form 10-K, our Chief Executive Officer and Chief Financial Officer have concluded that, as of such date, our disclosure controls and procedures were effective at the reasonable assurance level.
Management's Report on internal control over financial reporting
Management's Report on internal control over financial reporting on page 4 3 is incorporated herein by reference.
Changes in internal control over financial reporting
In Fiscal 2015, we implemented a global general ledger system for Concentrix and in certain countries, upgraded our human resource and payroll systems. Implementation of these systems has necessitated changes in policies and procedures and the related internal controls and their method of application. However, there have been no changes in our internal control over financial reporting (as defined in Rule 13a-15(f) under the Exchange Act) that occurred during the last fiscal year covered by this report that materially affected, or are reasonably likely to materially affect, our internal control over financial reporting.
Item 9B. Other Information
None.
82
Table of Contents
PART III
Item 10. Directors, Executive Officers of the Registrant and Corporate Governance
The information required by this item (with respect to Directors) is incorporated by reference from the information under the caption "Election of Directors" contained in our Proxy Statement to be filed with the Securities and Exchange Commission in connection with the solicitation of proxies for our 2016 Annual Meeting of Stockholders to be held on March 22, 2016 (the "Proxy Statement"). Certain information required by this item concerning executive officers is set forth in Part I of this Report under the caption "Executive Officers of the Registrant."
Item 405 of Regulation S-K calls for disclosure of any known late filing or failure by an insider to file a report required by Section 16(a) of the Exchange Act. This information is contained in the section called "Section 16(a) Beneficial Ownership Reporting Compliance" in the Proxy Statement and is incorporated herein by reference.
We have adopted a code of ethics that applies to all of our employees, including our principal executive officer, our principal financial and accounting officer, our controllers and persons performing similar functions. This code of ethics, called a Code of Ethics and Business Conduct for Employees, Officers and Directors, is available free of charge on our public website (www.synnex.com) on the investor relations webpage. Future amendments or waivers relating to the code of ethics will be disclosed on the webpage referenced in this paragraph within five (5) business days following the date of such amendment or waiver.
Item 11. Executive Compensation
The information required by this item is incorporated by reference from the information under the captions "Corporate Governance-Directors' Compensation Table," "Executive Compensation," and "Corporate Governance-Compensation Committee Interlocks and Insider Participation" contained in the Proxy Statement.
Item 12. Security Ownership of Certain Beneficial Owners and Management and Related Stockholder Matters
The information required by this item with respect to security ownership of certain beneficial owners and management is incorporated by reference from the information under the caption "Security Ownership of Certain Beneficial Owners and Management" contained in the Proxy Statement.
Equity Compensation Plan Information
The following table sets forth certain information regarding our equity compensation plans as of November 30, 2015 :
Plan Category | Number of securities to be issued upon exercise of outstanding options (a) |
| Weighted- average exercise price of outstanding options (b) |
| Number of securities remaining available for future issuance under equity compensation plans (excluding securities reflected in column (a) (c) | |||||
Equity compensation plan approved by security holders | 656,518 | | (1) | $ | 43.5 | |
| 2,664,180 | | (2)(3) |
___________________________________________
(1) | Includes the number of shares to be issued under our 2003 Stock Incentive Plan and 2013 Stock Incentive Plan. Please see Note 4 - Stockholders' Equity of the Notes to the Consolidated Financial Statements for further information regarding the plans. |
(2) | Includes the number of shares reserved for issuance under our 2013 Stock Incentive Plan. The number of shares authorized for issuance under our 2013 Stock Incentive Plan will not exceed the sum of (1) 1,696,409 shares of common stock plus (2) any shares under the 2003 Stock Incentive Plan that are subject to outstanding awards to the extent those awards expire, terminate or are canceled for any reason prior to exercise without the issuance or delivery of such shares, any shares subject to vesting restrictions that are subsequently forfeited, and any reserved shares not issued or subject to outstanding awards, up to a maximum of 2,750,000 shares. Please see Note 4 - Stockholders' Equity of the Notes to the Consolidated Financial Statements for further information regarding the 2013 Stock Incentive Plan. |
(3) | Includes 696,572 shares available-for-sale pursuant to our 2014 Employee Stock Purchase Plan. Shares of common stock will be purchased at a price equal to 95% of the fair market value per share of common stock on either the first trading day of the offering period or on the last trading day of the accumulation period, whichever is less. Please see Note 4-Stockholders' Equity of the Notes to the Consolidated Financial Statements for further information regarding the 2014 Employee Stock Purchase Plan. |
Item 13. Certain Relationships and Related Transactions, and Director Independence
The information required by this item is incorporated by reference from the information contained under the caption "Certain Relationships and Related Party Transactions" and "Election of Directors-Directors and Nominees" contained in the Proxy Statement.
83
Table of Contents
Item 14. Principal Accounting Fees and Services
The information required by this item is incorporated by reference from the information contained under the caption "Ratification of the Appointment of Independent Registered Public Accountants" contained in the Proxy Statement.
PART IV
Item 15. Exhibits and Financial Statement Schedules
(a) Documents filed as part of this report:
(1) | Financial Statements |
See Index under Item 8.
(2) | Financial Statements Schedule |
See Index under Item 8.
(3) | Exhibits |
See Item 15(b) below. Each compensatory plan required to be filed has been identified.
(b) Exhibits.
Exhibit Number |
| Description of Document |
2.01 |
| Master Asset Purchase Agreement dated as of September 10, 2013, by and between the Company and International Business Machines Corporation, a New York corporation (incorporated by reference to Exhibit 2.01 to the Company's Current Report on Form 8-K filed on September 10, 2013). |
|
|
|
3(i).1 |
| Restated Certificate of Incorporation (incorporated by reference to Exhibit 3(i).3 to Amendment No. 1 to the Company's Registration Statement on Form S-1 (File No. 333-108543)). |
|
| |
3(ii).2 |
| Amended and Restated Bylaws (incorporated by reference to Exhibit 3(ii).1 to the Company's Current Report on Form 8-K filed on April 2, 2008). |
|
| |
4.1 |
| Form of Common Stock Certificate (incorporated by reference to the exhibit of the same number to Amendment No. 2 to the Company's Registration Statement on Form S-1 (File No. 333-108543)). |
|
| |
10.1# |
| Amended and Restated 2003 Stock Incentive Plan and form of agreements thereunder (incorporated by reference to Exhibit 10.1 to the Company's Quarterly Report on Form 10-Q for the quarter ended August 31, 2008). |
|
| |
10.2# |
| Amended and Restated 2003 Employee Stock Purchase Plan (incorporated by reference to Exhibit 10.2 to the Company's Quarterly Report on Form 10-Q for the quarter ended August 31, 2008). |
|
|
|
10.3# |
| Amendment to Amended and Restated 2003 Employee Stock Purchase Plan (incorporated by reference to Exhibit 10.2 to the Company's Quarterly Report on Form 10-Q for the quarter ended August 31, 2008). |
10.4 |
| Form of Indemnification Agreement between the Company and its officers and directors (incorporated by reference to Exhibit 10.6 to the Company's Registration Statement on Form S-1 (File No. 333-108543)). |
|
|
|
10.5# |
| Form of Change of Control Severance Plan (incorporated by reference to Exhibit 10.13 to Amendment No. 1 to the Company's Registration Statement on Form S-1 (File No. 333-108543)). |
|
|
|
10.6 |
| Joint Sales and Marketing Agreement, dated May 6, 2002, between the Company and MiTAC International Corporation (incorporated by reference to Exhibit 10.16 to Amendment No. 2 to the Company's Registration Statement on Form S-1 (File No. 333-108543)). |
|
|
|
10.7 |
| Credit Agreement, dated as of November 27, 2013, by and among the Company, the subsidiaries of the Company named therein, the lenders signatories thereto from time to time, and Bank of America, N.A. (incorporated by reference to Exhibit 10.1 to the Company's Current Report in Form 8-K filed on November 27, 2013). |
84
Table of Contents
Exhibit Number |
| Description of Document |
|
|
|
10.8 |
| Third Amended and Restated Receivables Sale and Servicing Agreement, dated as of January 23, 2009, among the Originator, the Servicer and SIT Funding Corporation (incorporated by reference to Exhibit 10.34 to the Company's Annual Report in Form 10-K for the year ended November 30, 2008). |
|
|
|
10.9 |
| Fourth Amended and Restated Receivables Funding and Administration Agreement, dated as November 12, 2010, among SIT Funding Corporation, the lenders party thereto and The Bank of Nova Scotia (incorporated by reference to Exhibit 10.3 to the Company's Current Report in Form 8-K filed on November 18, 2010). |
|
|
|
10.10# |
| Amendment to SYNNEX Corporation Change of Control Severance Plan (incorporated by reference to Exhibit 10.21 to the Company's Annual Report on Form 10-K for the fiscal year ended November 30, 2007). |
|
|
|
10.11# |
| SYNNEX Corporation Deferred Compensation Plan, as amended and restated effective January 1, 2005 (incorporated by reference to Exhibit 10.22 to the Company's Annual Report on Form 10-K for the fiscal year ended November 30, 2007). |
|
|
|
10.12# |
| Offer Letter, dated as of March 27, 2008, by and between the Company and Kevin Murai (incorporated by reference to Exhibit 10.1 to the Company's Current Report on Form 8-K filed on April 2, 2008). |
|
|
|
10.13# |
| Offer Letter between the Company and Marshall Witt dated April 1, 2013 (incorporated by reference to Exhibit 10.1 to the Company's Current Report on Form 8-K filed on April 3, 2013). |
|
|
|
10.14# |
| Amendment to the Amended and Restated 2003 Stock Incentive Plan, dated November 21, 2008 (incorporated by reference to Exhibit 10.32 to the Company's Annual Report on Form 10-K for the year ended November 30, 2008). |
|
|
|
10.15# |
| Form of Notice of Stock Option Grant (incorporated by reference to Exhibit 10.2 to the Company's Quarterly Report on Form 10-Q for the quarter ended May 31, 2009). |
|
|
|
10.16# |
| Amendment to Amended and Restated 2003 Employee Stock Purchase Plan (incorporated by reference to Exhibit 10.3 to the Company's Quarterly Report on Form 10-Q for the quarter ended May 31, 2009). |
|
|
|
10.17# |
| 2009 Executive Profit Sharing Plan (incorporated by reference to Exhibit 10.4 to the Company's Quarterly Report on Form 10-Q for the quarter ended May 31, 2009). |
|
|
|
10.18# |
| Form of Restricted Stock Award (Directors) (incorporated by reference to Exhibit 10.5 to the Company's Quarterly Report on Form 10-Q for the quarter ended May 31, 2009). |
|
|
|
10.19# |
| Form of Notice of Restricted Stock Unit Award (Performance Vesting) (incorporated by reference to Exhibit 10.1 to the Company's Current Report on Form 8-K filed on November 4, 2010). |
|
|
|
10.20 |
| Stock Purchase Agreement dated as of November 11, 2010, by and among the Registrant, SB Pacific Corporation Limited, a Hong Kong corporation and Marubeni Corporation, a Japanese corporation (incorporated by reference to Exhibit 10.26 to the Company's Annual Report on Form 10-K for the year ended November 30, 2010). |
|
|
|
10.21 |
| Fourth Omnibus Amendment, dated as of January 11, 2010 (incorporated by reference to Exhibit 10.1 to the Company's Current Report on Form 8-K filed on January 15, 2010). |
|
|
|
10.22 |
| Fifth Amendment to Third Amended and Restated Receivables Sale and Servicing Agreement, dated as of January 23, 2009, among the Originator, the Servicer and SIT Funding Corporation (incorporated by reference to Exhibit 10.2 to the Company's Current Report on Form 8-K filed on November 18, 2010). |
|
|
|
10.23# |
| Amendment to Amended and Restated 2003 Stock Incentive Plan (incorporated by reference to Exhibit 10.24 to the Company's Annual Report on Form 10-K for the year ended November 30, 2011). |
|
|
|
10.24# |
| Amendment to SYNNEX Corporation Deferred Compensation Plan (incorporated by reference to Exhibit 10.25 to the Company's Annual Report on Form 10-K for the year ended November 30, 2011). |
|
|
|
10.25# |
| Amendment to SYNNEX Corporation 2009 Executive Profit Sharing Plan (incorporated by reference to Exhibit 10.26 to the Company's Annual Report on Form 10-K for the year ended November 30, 2011). |
|
|
|
85
Table of Contents
Exhibit Number |
| Description of Document |
10.26 |
| Master HP Partner Agreement dated March 1, 2011, by and between the Company and Hewlett-Packard Company (incorporated by reference to Exhibit 10.1 to the Company's Current Report on Form 8-K filed on March 7, 2011). |
|
|
|
10.27 |
| Sixth Amendment to Third Amended and Restated Receivables Sales and Servicing Agreement (incorporated by reference to Exhibit 10.1 to the Company's Current Report on Form 8-K filed on October 24, 2012). |
|
|
|
10.28 |
| Third Amendment to the Fourth Amended and Restated Receivables Funding and Administration Agreement (incorporated by reference to Exhibit 10.2 to the Company's Current Report on Form 8-K filed on October 24, 2012. |
|
|
|
10.29 |
| Omnibus amendment to Fourth Amended and Restated Receivables Funding and Administration Agreement and Third Amended and Restated Receivables Sales and Servicing Agreement, dated as of September 25, 2013, by and among SIT Funding Corporation, the Company, the lenders party thereto and the Bank of Nova Scotia (incorporated by reference to Exhibit 10.3 to the Company's Current Report on Form 8-K filed on September 25, 2013). |
|
|
|
10.30# |
| SYNNEX Corporation 2013 Stock Incentive Plan (incorporated by reference to the Company's 2013 Proxy Statement on Schedule 14A (File No. 001-31892) filed on February 22, 2013). |
|
|
|
10.31 |
| Amendment to Amended and Restated 2003 Employee Stock Purchase Plan (incorporated by reference to Exhibit 10.1 to the Company's Quarterly Report on Form 10-Q for the quarter ended August 31, 2013). |
|
|
|
10.32 |
| Omnibus amendment to Fourth Amended and Restated Receivables Funding and Administration Agreement and Third Amended and Restated Receivables Sales and Servicing Agreement, dated as of September 25, 2013, by and among SIT Funding Corporation, the Company, the lenders party thereto and the Bank of Nova Scotia (incorporated by reference to Exhibit 10.1 to the Company's Current Report on Form 8-K filed on September 25, 2013). |
|
|
|
10.33 |
| Second Omnibus amendment to Fourth Amended and Restated Receivables Funding and Administration Agreement and Third Amended and Restated Receivables Sales and Servicing Agreement, dated as of November 27, 2013, by and among SIT Funding Corporation, the Company, the lenders party thereto and the Bank of Nova Scotia (incorporated by reference to Exhibit 10.2 to the Company's Current Report on Form 8-K filed on November 27, 2013). |
|
|
|
10.34# |
| Promotion Letter to Christopher Caldwell dated February 1, 2014 (incorporated by reference to Exhibit 10.1 to the Company's Quarterly Report on Form 10-Q for the quarter ended February 28, 2014). |
|
|
|
10.35# |
| Form of incentive award agreements related to the SYNNEX Corporation 2013 Stock Incentive Plan (incorporated by reference to Exhibit 10.2 to the Company's Quarterly Report on Form 10-Q for the quarter ended February 28, 2014). |
10.36 |
| Third Omnibus Amendment to Fourth Amended and Restated Receivables Funding and Administration Agreement and Third Amended and Restated Receivables Sale and Services Agreement, dated as of April 25, 2014, by and among SIT Funding Corporation, the Company, the lenders party thereto and the Bank of Nova Scotia (incorporated by reference to Exhibit 10.1 to the Company's Quarterly Report on Form 10-Q for the quarter ended May 31, 2014). |
|
|
|
10.37 |
| First Amendment to Credit Agreement, dated as of May 28, 2014, by and among the Company, the subsidiaries of the Company named therein, the lenders signatories thereto from time to time, and Bank of America, N.A. (incorporated by reference to Exhibit 10.2 to the Company's Quarterly Report on Form 10-Q for the quarter ended May 31, 2014). |
|
|
|
10.38# |
| SYNNEX Corporation 2014 Employee Stock Purchase Plan (incorporated by reference to the Company's 2014 Proxy Statement on Schedule 14A (File No. 001-31892) filed on March 3, 2014). |
|
|
|
10.39# |
| Amendment No. 1 to SYNNEX Corporation 2014 Employee Stock Purchase Plan (incorporated by reference to Exhibit 10.2 to the Company's Quarterly Report on Form 10-Q for the quarter ended August 31, 2014). |
|
|
|
10.40# |
| Amendment No. 2 to the SYNNEX Corporation 2013 Stock Incentive Plan (incorporated by reference to Exhibit 10.3 to the Company's Quarterly Report on Form 10-Q for the quarter ended August 31, 2014). |
|
|
|
86
Table of Contents
Exhibit Number |
| Description of Document |
10.41† |
| Fourth Omnibus Amendment to Fourth Amended and Restated Receivables Funding and Administration Agreement and Third Amended and Restated Receivables Sale and Servicing Agreement, dated as of November 6, 2014, by and among SIT Funding Corporation, SYNNEX Corporation, the lenders party thereto and The Bank of Nova Scotia (incorporated by reference to Exhibit 10.1 to the Company's Current Report on Form 8-K filed on November 13, 2014). |
|
|
|
10.42 |
| Joinder Agreement, dated as of November 29, 2014, by Hyve Solutions Corporation (incorporated by reference to Exhibit 10.46 to the Company's Annual Report on Form 10-K for the year ended November 30, 2014). |
|
|
|
10.43 |
| Second Amendment to Credit Agreement, dated May 21, 2015, by and among SYNNEX Corporation, the subsidiaries of SYNNEX Corporation named therein, the lenders signatories thereto from time to time, and Bank of America, N.A., as agent (incorporated by reference to Exhibit 10.1 to the Company's Current Report on Form 8-K filed on May 22, 2015). |
|
|
|
10.44 |
| Fifth Omnibus Amendment to Fourth Amended and Restated Receivables Funding and Administration Agreement and Third Amended and Restated Receivables Sane and Servicing Agreement, dated as of June 16, 2015, by and among SIT Funding Corporation, SYNNEX Corporation, Hyve Solutions Corporation, the lenders party thereto and The Bank of Nova Scotia (incorporated by reference to Exhibit 10.2 to the Company's Quarterly Report on Form 10-Q for the quarter ended May 31, 2015). |
|
|
|
10.45 |
| Facility Agreement dated as of November 25, 2015, by and among SYNNEX Infotec Corporation, SYNNEX Corporation, the financial institutions party thereto, and The Bank of Tokyo-Mitsubishi, UFJ, Ltd, as agent (incorporated by reference to Exhibit 10.1 to the Company's Current Report on Form 8-K filed on November 25, 2015). |
|
|
|
21.1 |
| Subsidiaries of the Company |
|
|
|
23.1 |
| Consent of KPMG LLP, Independent Registered Public Accounting Firm. |
|
|
|
24.1 |
| Power of Attorney (see page 89 of this Form 10-K). |
|
|
|
31.1 |
| Rule 13a-14(a) Certification of Chief Executive Officer. |
|
|
|
31.2 |
| Rule 13a-14(a) Certification of Chief Financial Officer. |
|
|
|
32.1* |
| Statement of the Chief Executive Officer and Chief Financial Officer under Section 906 of the Sarbanes-Oxley Act of 2002 (18 U.S.C. Section 1350). |
|
|
|
101.INS |
| XBRL Instance Document |
|
|
|
101.SCH |
| XBRL Taxonomy Extension Schema Document |
|
|
|
101.CAL |
| XBRL Taxonomy Extension Calculation Linkbase Document |
|
|
|
101.DEF |
| XBRL Taxonomy Extension Definition Linkbase Document |
|
|
|
101.LAB |
| XBRL Taxonomy Extension Label Linkbase Document |
|
|
|
101.PRE |
| XBRL Taxonomy Extension Presentation Linkbase Document |
_____________________________________________
# Indicates management contract or compensatory plan or arrangement.
* | In accordance with Item 601(b)(32)(ii) of Regulation S-K and SEC Release Nos. 33-8238 and 34-47986, Final Rule: Management's Reports on Internal Control Over Financial Reporting and Certification of Disclosure in Exchange Act Periodic Reports, the certifications furnished in Exhibit 32.1 hereto are deemed to accompany this Form 10-K and will not be deemed "filed" for purpose of Section 18 of the Exchange Act. Such certifications will not be deemed to be incorporated by reference into any filing under the Securities Act or the Exchange Act, except to the extent that the registrant specifically incorporates it by reference. |
† | Portions of this exhibit have been omitted and filed separately with the Securities and Exchange Commission pursuant to a request for confidential treatment. |
87
Table of Contents
(c) Financial Statement Schedules.
See Index under Item 8.
88
Table of Contents
SIGNATURES
Pursuant to the requirements of Section 13 or 15(d) of the Securities Exchange Act of 1934, the registrant has duly caused this report to be signed on its behalf by the undersigned, thereunto duly authorized.
Date: January 28, 2016
SYNNEX C ORPORATION
By: |
| /s/ Kevin M. Murai |
|
|
| Kevin M. Murai President and Chief Executive Officer |
|
POWER OF ATTORNEY
KNOW ALL MEN BY THESE PRESENTS, that each person whose signature appears below constitutes and appoints Kevin Murai and Marshall Witt, and each of them, his true and lawful attorneys-in-fact, each with full power of substitution, for him or her in any and all capacities, to sign any amendments to this report on Form 10-K and to file the same, with exhibits thereto and other documents in connection therewith, with the Securities and Exchange Commission, hereby ratifying and confirming all that each of said attorneys-in-fact or their substitute or substitutes may do or cause to be done by virtue hereof.
Pursuant to the requirements of the Securities Exchange Act of 1934, this report has been signed below by the following persons on behalf of the registrant and in the capacities and on the dates indicated.
Name |
| Title |
| Date |
/s/ Kevin M. Murai |
| President and Chief Executive Officer (Principal Executive Officer) and Director |
| January 28, 2016 |
Kevin M. Murai |
|
|
|
|
|
|
|
|
|
/s/ Marshall W. Witt |
| Chief Financial Officer (Principal Financial and Principal Accounting Officer) |
| January 28, 2016 |
Marshall W. Witt |
|
|
|
|
|
|
|
|
|
/s/ Dwight A. Steffensen |
| Chairman of the Board | January 28, 2016 | |
Dwight A. Steffensen |
|
|
|
|
|
|
|
|
|
/s/ Matthew F.C. Miau |
| Chairman Emeritus of the Board | January 28, 2016 | |
Matthew F.C. Miau |
|
|
|
|
|
|
|
|
|
/s/ Fred A. Breidenbach |
| Director | January 28, 2016 | |
Fred A. Breidenbach |
|
|
|
|
|
|
|
|
|
/s/ Hau Lee |
| Director | January 28, 2016 | |
Hau Lee |
|
|
|
|
|
|
|
|
|
/s/ Dennis Polk |
| Director | January 28, 2016 | |
Dennis Polk |
|
|
|
|
|
|
|
|
|
/s/ Gregory L. Quesnel |
| Director | January 28, 2016 | |
Gregory L. Quesnel |
|
|
|
|
|
|
|
|
|
/s/ Thomas S. Wurster |
| Director | January 28, 2016 | |
Thomas S. Wurster |
|
|
|
|
|
|
| ||
/s/ Duane E. Zitzner |
| Director | January 28, 2016 | |
Duane E. Zitzner |
|
|
|
|
|
|
| ||
/s/ Andrea M. Zulberti |
| Director | January 28, 2016 | |
Andrea M. Zulberti |
|
|
|
|
89
Table of Contents
EXHIBIT INDEX
Exhibit Number |
| Description of Document |
2.01 |
| Master Asset Purchase Agreement dated as of September 10, 2013, by and between the Company and International Business Machines Corporation, a New York corporation (incorporated by reference to Exhibit 2.01 to the Company's Current Report on Form 8-K filed on September 10, 2013). |
|
|
|
3(i).1 |
| Restated Certificate of Incorporation (incorporated by reference to Exhibit 3(i).3 to Amendment No. 1 to the Company's Registration Statement on Form S-1 (File No. 333-108543)). |
|
| |
3(ii).2 |
| Amended and Restated Bylaws (incorporated by reference to Exhibit 3(ii).1 to the Company's Current Report on Form 8-K filed on April 2, 2008). |
|
| |
4.1 |
| Form of Common Stock Certificate (incorporated by reference to the exhibit of the same number to Amendment No. 2 to the Company's Registration Statement on Form S-1 (File No. 333-108543)). |
|
| |
10.1# |
| Amended and Restated 2003 Stock Incentive Plan and form of agreements thereunder (incorporated by reference to Exhibit 10.1 to the Company's Quarterly Report on Form 10-Q for the quarter ended August 31, 2008). |
|
| |
10.2# |
| Amended and Restated 2003 Employee Stock Purchase Plan (incorporated by reference to Exhibit 10.2 to the Company's Quarterly Report on Form 10-Q for the quarter ended August 31, 2008). |
|
|
|
10.3# |
| Amendment to Amended and Restated 2003 Employee Stock Purchase Plan (incorporated by reference to Exhibit 10.2 to the Company's Quarterly Report on Form 10-Q for the quarter ended August 31, 2008). |
10.4 |
| Form of Indemnification Agreement between the Company and its officers and directors (incorporated by reference to Exhibit 10.6 to the Company's Registration Statement on Form S-1 (File No. 333-108543)). |
|
|
|
10.5# |
| Form of Change of Control Severance Plan (incorporated by reference to Exhibit 10.13 to Amendment No. 1 to the Company's Registration Statement on Form S-1 (File No. 333-108543)). |
|
|
|
10.6 |
| Joint Sales and Marketing Agreement, dated May 6, 2002, between the Company and MiTAC International Corporation (incorporated by reference to Exhibit 10.16 to Amendment No. 2 to the Company's Registration Statement on Form S-1 (File No. 333-108543)). |
|
|
|
10.7 |
| Credit Agreement, dated as of November 27, 2013, by and among the Company, the subsidiaries of the Company named therein, the lenders signatories thereto from time to time, and Bank of America, N.A. (incorporated by reference to Exhibit 10.1 to the Company's Current Report in Form 8-K filed on November 27, 2013). |
|
|
|
10.8 |
| Third Amended and Restated Receivables Sale and Servicing Agreement, dated as of January 23, 2009, among the Originator, the Servicer and SIT Funding Corporation (incorporated by reference to Exhibit 10.34 to the Company's Annual Report in Form 10-K for the year ended November 30, 2008). |
|
|
|
10.9 |
| Fourth Amended and Restated Receivables Funding and Administration Agreement, dated as November 12, 2010, among SIT Funding Corporation, the lenders party thereto and The Bank of Nova Scotia (incorporated by reference to Exhibit 10.3 to the Company's Current Report in Form 8-K filed on November 18, 2010). |
|
|
|
10.10# |
| Amendment to SYNNEX Corporation Change of Control Severance Plan (incorporated by reference to Exhibit 10.21 to the Company's Annual Report on Form 10-K for the fiscal year ended November 30, 2007). |
|
|
|
10.11# |
| SYNNEX Corporation Deferred Compensation Plan, as amended and restated effective January 1, 2005 (incorporated by reference to Exhibit 10.22 to the Company's Annual Report on Form 10-K for the fiscal year ended November 30, 2007). |
|
|
|
10.12# |
| Offer Letter, dated as of March 27, 2008, by and between the Company and Kevin Murai (incorporated by reference to Exhibit 10.1 to the Company's Current Report on Form 8-K filed on April 2, 2008). |
|
|
|
10.13# |
| Offer Letter between the Company and Marshall Witt dated April 1, 2013 (incorporated by reference to Exhibit 10.1 to the Company's Current Report on Form 8-K filed on April 3, 2013). |
|
|
|
10.14# |
| Amendment to the Amended and Restated 2003 Stock Incentive Plan, dated November 21, 2008 (incorporated by reference to Exhibit 10.32 to the Company's Annual Report on Form 10-K for the year ended November 30, 2008). |
|
|
|
90
Table of Contents
Exhibit Number |
| Description of Document |
10.15# |
| Form of Notice of Stock Option Grant (incorporated by reference to Exhibit 10.2 to the Company's Quarterly Report on Form 10-Q for the quarter ended May 31, 2009). |
|
|
|
10.16# |
| Amendment to Amended and Restated 2003 Employee Stock Purchase Plan (incorporated by reference to Exhibit 10.3 to the Company's Quarterly Report on Form 10-Q for the quarter ended May 31, 2009). |
|
|
|
10.17# |
| 2009 Executive Profit Sharing Plan (incorporated by reference to Exhibit 10.4 to the Company's Quarterly Report on Form 10-Q for the quarter ended May 31, 2009). |
|
|
|
10.18# |
| Form of Restricted Stock Award (Directors) (incorporated by reference to Exhibit 10.5 to the Company's Quarterly Report on Form 10-Q for the quarter ended May 31, 2009). |
|
|
|
10.19# |
| Form of Notice of Restricted Stock Unit Award (Performance Vesting) (incorporated by reference to Exhibit 10.1 to the Company's Current Report on Form 8-K filed on November 4, 2010). |
|
|
|
10.20 |
| Stock Purchase Agreement dated as of November 11, 2010, by and among the Registrant, SB Pacific Corporation Limited, a Hong Kong corporation and Marubeni Corporation, a Japanese corporation (incorporated by reference to Exhibit 10.26 to the Company's Annual Report on Form 10-K for the year ended November 30, 2010). |
|
|
|
10.21 |
| Fourth Omnibus Amendment, dated as of January 11, 2010 (incorporated by reference to Exhibit 10.1 to the Company's Current Report on Form 8-K filed on January 15, 2010). |
|
|
|
10.22 |
| Fifth Amendment to Third Amended and Restated Receivables Sale and Servicing Agreement, dated as of January 23, 2009, among the Originator, the Servicer and SIT Funding Corporation (incorporated by reference to Exhibit 10.2 to the Company's Current Report on Form 8-K filed on November 18, 2010). |
|
|
|
10.23# |
| Amendment to Amended and Restated 2003 Stock Incentive Plan (incorporated by reference to Exhibit 10.24 to the Company's Annual Report on Form 10-K for the year ended November 30, 2011). |
|
|
|
10.24# |
| Amendment to SYNNEX Corporation Deferred Compensation Plan (incorporated by reference to Exhibit 10.25 to the Company's Annual Report on Form 10-K for the year ended November 30, 2011). |
|
|
|
10.25# |
| Amendment to SYNNEX Corporation 2009 Executive Profit Sharing Plan (incorporated by reference to Exhibit 10.26 to the Company's Annual Report on Form 10-K for the year ended November 30, 2011). |
|
|
|
10.26 |
| Master HP Partner Agreement dated March 1, 2011, by and between the Company and Hewlett-Packard Company (incorporated by reference to Exhibit 10.1 to the Company's Current Report on Form 8-K filed on March 7, 2011). |
|
|
|
10.27 |
| Sixth Amendment to Third Amended and Restated Receivables Sales and Servicing Agreement (incorporated by reference to Exhibit 10.1 to the Company's Current Report on Form 8-K filed on October 24, 2012). |
|
|
|
10.28 |
| Third Amendment to the Fourth Amended and Restated Receivables Funding and Administration Agreement (incorporated by reference to Exhibit 10.2 to the Company's Current Report on Form 8-K filed on October 24, 2012. |
|
|
|
10.29 |
| Omnibus amendment to Fourth Amended and Restated Receivables Funding and Administration Agreement and Third Amended and Restated Receivables Sales and Servicing Agreement, dated as of September 25, 2013, by and among SIT Funding Corporation, the Company, the lenders party thereto and the Bank of Nova Scotia (incorporated by reference to Exhibit 10.3 to the Company's Current Report on Form 8-K filed on September 25, 2013). |
|
|
|
10.30# |
| SYNNEX Corporation 2013 Stock Incentive Plan (incorporated by reference to the Company's 2013 Proxy Statement on Schedule 14A (File No. 001-31892) filed on February 22, 2013). |
|
|
|
10.31 |
| Amendment to Amended and Restated 2003 Employee Stock Purchase Plan (incorporated by reference to Exhibit 10.1 to the Company's Quarterly Report on Form 10-Q for the quarter ended August 31, 2013). |
|
|
|
10.32 |
| Omnibus amendment to Fourth Amended and Restated Receivables Funding and Administration Agreement and Third Amended and Restated Receivables Sales and Servicing Agreement, dated as of September 25, 2013, by and among SIT Funding Corporation, the Company, the lenders party thereto and the Bank of Nova Scotia (incorporated by reference to Exhibit 10.1 to the Company's Current Report on Form 8-K filed on September 25, 2013). |
91
Table of Contents
Exhibit Number |
| Description of Document |
|
|
|
10.33 |
| Second Omnibus amendment to Fourth Amended and Restated Receivables Funding and Administration Agreement and Third Amended and Restated Receivables Sales and Servicing Agreement, dated as of November 27, 2013, by and among SIT Funding Corporation, the Company, the lenders party thereto and the Bank of Nova Scotia (incorporated by reference to Exhibit 10.2 to the Company's Current Report on Form 8-K filed on November 27, 2013). |
|
|
|
10.34# |
| Promotion Letter to Christopher Caldwell dated February 1, 2014 (incorporated by reference to Exhibit 10.1 to the Company's Quarterly Report on Form 10-Q for the quarter ended February 28, 2014). |
|
|
|
10.35# |
| Form of incentive award agreements related to the SYNNEX Corporation 2013 Stock Incentive Plan (incorporated by reference to Exhibit 10.2 to the Company's Quarterly Report on Form 10-Q for the quarter ended February 28, 2014). |
10.36 |
| Third Omnibus Amendment to Fourth Amended and Restated Receivables Funding and Administration Agreement and Third Amended and Restated Receivables Sale and Services Agreement, dated as of April 25, 2014, by and among SIT Funding Corporation, the Company, the lenders party thereto and the Bank of Nova Scotia (incorporated by reference to Exhibit 10.1 to the Company's Quarterly Report on Form 10-Q for the quarter ended May 31, 2014). |
|
|
|
10.37 |
| First Amendment to Credit Agreement, dated as of May 28, 2014, by and among the Company, the subsidiaries of the Company named therein, the lenders signatories thereto from time to time, and Bank of America, N.A. (incorporated by reference to Exhibit 10.2 to the Company's Quarterly Report on Form 10-Q for the quarter ended May 31, 2014). |
|
|
|
10.38# |
| SYNNEX Corporation 2014 Employee Stock Purchase Plan (incorporated by reference to the Company's 2014 Proxy Statement on Schedule 14A (File No. 001-31892) filed on March 3, 2014). |
|
|
|
10.39# |
| Amendment No. 1 to SYNNEX Corporation 2014 Employee Stock Purchase Plan (incorporated by reference to Exhibit 10.2 to the Company's Quarterly Report on Form 10-Q for the quarter ended August 31, 2014). |
|
|
|
10.40# |
| Amendment No. 2 to the SYNNEX Corporation 2013 Stock Incentive Plan (incorporated by reference to Exhibit 10.3 to the Company's Quarterly Report on Form 10-Q for the quarter ended August 31, 2014). |
|
|
|
10.41† |
| Fourth Omnibus Amendment to Fourth Amended and Restated Receivables Funding and Administration Agreement and Third Amended and Restated Receivables Sale and Servicing Agreement, dated as of November 6, 2014, by and among SIT Funding Corporation, SYNNEX Corporation, the lenders party thereto and The Bank of Nova Scotia (incorporated by reference to Exhibit 10.1 to the Company's Current Report on Form 8-K filed on November 13, 2014). |
|
|
|
10.42 |
| Joinder Agreement, dated as of November 29, 2014, by Hyve Solutions Corporation (incorporated by reference to Exhibit 10.46 to the Company's Annual Report on Form 10-K for the year ended November 30, 2014). |
|
|
|
10.43 |
| Second Amendment to Credit Agreement, dated May 21, 2015, by and among SYNNEX Corporation, the subsidiaries of SYNNEX Corporation named therein, the lenders signatories thereto from time to time, and Bank of America, N.A., as agent (incorporated by reference to Exhibit 10.1 to the Company's Current Report on Form 8-K filed on May 22, 2015). |
|
|
|
10.44 |
| Fifth Omnibus Amendment to Fourth Amended and Restated Receivables Funding and Administration Agreement and Third Amended and Restated Receivables Sane and Servicing Agreement, dated as of June 16, 2015, by and among SIT Funding Corporation, SYNNEX Corporation, Hyve Solutions Corporation, the lenders party thereto and The Bank of Nova Scotia (incorporated by reference to Exhibit 10.2 to the Company's Quarterly Report on Form 10-Q for the quarter ended May 31, 2015). |
|
|
|
10.45 |
| Facility Agreement dated as of November 25, 2015, by and among SYNNEX Infotec Corporation, SYNNEX Corporation, the financial institutions party thereto, and The Bank of Tokyo-Mitsubishi, UFJ, Ltd, as agent (incorporated by reference to Exhibit 10.1 to the Company's Current Report on Form 8-K filed on November 25, 2015). |
|
|
|
21.1 |
| Subsidiaries of the Company |
|
|
|
23.1 |
| Consent of KPMG LLP, Independent Registered Public Accounting Firm. |
|
|
|
24.1 |
| Power of Attorney (see page 89 of this Form 10-K). |
92
Table of Contents
Exhibit Number |
| Description of Document |
|
|
|
31.1 |
| Rule 13a-14(a) Certification of Chief Executive Officer. |
|
|
|
31.2 |
| Rule 13a-14(a) Certification of Chief Financial Officer. |
|
|
|
32.1* |
| Statement of the Chief Executive Officer and Chief Financial Officer under Section 906 of the Sarbanes-Oxley Act of 2002 (18 U.S.C. Section 1350). |
|
|
|
101.INS |
| XBRL Instance Document |
|
|
|
101.SCH |
| XBRL Taxonomy Extension Schema Document |
|
|
|
101.CAL |
| XBRL Taxonomy Extension Calculation Linkbase Document |
|
|
|
101.DEF |
| XBRL Taxonomy Extension Definition Linkbase Document |
|
|
|
101.LAB |
| XBRL Taxonomy Extension Label Linkbase Document |
|
|
|
101.PRE |
| XBRL Taxonomy Extension Presentation Linkbase Document |
_________________________________
# Indicates management contract or compensatory plan or arrangement.
* | In accordance with Item 601(b)(32)(ii) of Regulation S-K and SEC Release Nos. 33-8238 and 34-47986, Final Rule: Management's Reports on Internal Control Over Financial Reporting and Certification of Disclosure in Exchange Act Periodic Reports, the certifications furnished in Exhibit 32.1 hereto are deemed to accompany this Form 10-K and will not be deemed "filed" for purpose of Section 18 of the Exchange Act. Such certifications will not be deemed to be incorporated by reference into any filing under the Securities Act or the Exchange Act, except to the extent that the registrant specifically incorporates it by reference. |
† | Portions of this exhibit have been omitted and filed separately with the Securities and Exchange Commission pursuant to a request for confidential treatment. |
93