Table of Contents
UNITED STATES
SECURITIES AND EXCHANGE COMMISSION
Washington, D.C. 20549
|
|
|
FORM 10-K
(Mark One)
ý | ANNUAL REPORT PURSUANT TO SECTION 13 OR 15(d) OF THE SECURITIES EXCHANGE ACT OF 1934 |
For the fiscal year ended October 31,
2017
OR
¨ | TRANSITION REPORT PURSUANT TO SECTION 13 OR 15(d) OF THE SECURITIES EXCHANGE ACT OF 1934 |
For the transition period from to
Commission File Number 0-19807
|
|
|

SYNOPSYS, INC.
(Exact name of registrant as specified in its charter)
Delaware |
| 56-1546236 |
(State or other jurisdiction of incorporation or organization) |
| (I.R.S. Employer Identification No.) |
690 East Middlefield Road, Mountain View, California 94043
(Address of principal executive offices, including zip code)
(650) 584-5000
(Registrant's telephone number, including area code)
Securities Registered Pursuant to Section 12(b) of the Act:
Title of Each Class |
| Name of Each Exchange on Which Registered |
Common Stock, $0.01 par value |
| NASDAQ Global Select Market |
Securities Registered Pursuant to Section 12(g) of the Act: None
|
|
|
Indicate by check mark if the registrant is a well-known seasoned issuer, as defined in Rule 405 of the Securities Act. Yes ý No ¨
Indicate by check mark if the registrant is not required to file reports pursuant to Section 13 or Section 15(d) of the Act. Yes ¨ No ý
Indicate by check mark whether the registrant (1) has filed all reports required to be filed by Section 13 or 15(d) of the Securities Exchange Act of 1934 during the preceding 12 months (or for such shorter period that the registrant was required to file such reports), and (2) has been subject to such filing requirements for the past 90 days. Yes ý No ¨
Indicate by check mark whether the registrant has submitted electronically and posted on its corporate Web site, if any, every Interactive Data File required to be submitted and posted pursuant to Rule 405 of Regulation S-T (§ 232.405 of this chapter) during the preceding 12 months (or for such shorter period that the registrant was required to submit and post such files). Yes ý No ¨
Indicate by check mark if disclosure of delinquent filers pursuant to Item 405 of Regulation S-K (§ 229.405 of this chapter) is not contained herein, and will not be contained, to the best of registrant's knowledge, in definitive proxy or information statements incorporated by reference in Part III of this Form 10-K or any amendment to this Form 10-K. ý
Indicate by check mark whether the registrant is a large accelerated filer, an accelerated filer, a non-accelerated filer, a smaller reporting company, or an emerging growth company. See the definitions of "large accelerated filer," "accelerated filer," "smaller reporting company," and "emerging growth company" in Rule 12b-2 of the Exchange Act. (Check one):
Large accelerated filer x |
| Accelerated filer ¨ |
| Non-accelerated filer ¨ |
| Smaller Reporting Company ¨ |
|
|
|
| (Do not check if a smaller reporting company) |
| Emerging growth company ¨ |
Table of Contents
If an emerging growth company, indicate by check mark if the registrant has elected not to use the extended transition period for complying with any new or revised financial accounting standards provided pursuant to Section 13(a) of the Exchange Act. ¨
Indicate by check mark whether the registrant is a shell company (as defined in Rule 12b-2 of the Act). Yes ¨ No ý
The aggregate market value of the voting and non-voting common equity held by non-affiliates computed by reference to the price at which the common equity was last sold as of the last business day of the registrant's most recently completed second fiscal quarter was approximately $8.0 billion. Aggregate market value excludes an aggregate of approximately 41.4 million shares of common stock held by the registrant's executive officers and directors and by each person known by the registrant to own 5% or more of the outstanding common stock on such date. Exclusion of shares held by any of these persons should not be construed to indicate that such person possesses the power, direct or indirect, to direct or cause the direction of the management or policies of the registrant, or that such person is controlled by or under common control with the registrant.
On December 11 , 2017, 148,713,662 shares of the registrant's Common Stock, $0.01 par value, were outstanding.
DOCUMENTS INCORPORATED BY REFERENCE
Portions of the registrant's Proxy Statement relating to the registrant's 2018 Annual Meeting of Stockholders, scheduled to be held on April 5, 2018 , are incorporated by reference into Part III of this Annual Report on Form 10-K where indicated. Except as expressly incorporated by reference, the registrant's Proxy Statement shall not be deemed to be part of this report.
Table of Contents
SYNOPSYS, INC.
ANNUAL REPORT ON FORM 10-K
Fiscal year ended October 31, 2017
TABLE OF CONTENTS
|
|
|
|
|
|
|
|
| Page No. |
PART I |
|
|
|
|
Item 1. |
| Business |
| 3 |
Item 1A. |
| Risk Factors |
| 12 |
Item 1B. |
| Unresolved Staff Comments |
| 23 |
Item 2. |
| Properties |
| 23 |
Item 3. |
| Legal Proceedings |
| 24 |
Item 4. |
| Mine Safety Disclosures |
| 26 |
|
|
| ||
PART II |
|
|
|
|
Item 5. |
| Market for Registrant's Common Equity, Related Stockholder Matters and Issuer Purchases of Equity Securities |
| 27 |
Item 6. |
| Selected Financial Data |
| 30 |
Item 7. |
| Management's Discussion and Analysis of Financial Condition and Results of Operations |
| 30 |
Item 7A. |
| Quantitative and Qualitative Disclosures About Market Risk |
| 46 |
Item 8. |
| Financial Statements and Supplementary Data |
| 49 |
Item 9. |
| Changes in and Disagreements with Accountants on Accounting and Financial Disclosure |
| 86 |
Item 9A. |
| Controls and Procedures |
| 86 |
Item 9B. |
| Other Information |
| 87 |
|
|
| ||
PART III |
|
|
|
|
Item 10. |
| Directors, Executive Officers and Corporate Governance |
| 88 |
Item 11. |
| Executive Compensation |
| 88 |
Item 12. |
| Security Ownership of Certain Beneficial Owners and Management and Related Stockholder Matters |
| 88 |
Item 13. |
| Certain Relationships and Related Transactions and Director Independence |
| 88 |
Item 14. |
| Principal Accountant Fees and Services |
| 88 |
|
|
| ||
PART IV |
|
|
|
|
Item 15. |
| Exhibits and Financial Statement Schedules |
| 89 |
|
| |||
SIGNATURES |
| 93 | ||
i
Table of Contents
Cautionary Note Regarding Forward-Looking Statements
This Annual Report on Form 10-K (this Form 10-K or Annual Report) contains forward-looking statements within the meaning of Section 27A of the Securities Act of 1933, as amended (the Securities Act), Section 21E of the Securities Exchange Act of 1934, as amended (the Exchange Act), and the Private Securities Litigation Reform Act of 1995. Any statements herein that are not statements of historical fact are forward-looking statements. Words such as "may," "will," "could," "would," "can," "should," "anticipate," "expect," "intend," "believe," "estimate," "project," "continue," "forecast," "likely," "potential," "seek," or the negatives of such terms, and similar expressions are intended to identify forward-looking statements. This Form 10-K includes, among others, forward-looking statements regarding:
• | our business, product and platform strategies; |
• | our business outlook; |
• | the continuation of current industry trends towards customer and vendor consolidation, and the impact of such consolidation; |
• | prior and future acquisitions, including the expected benefits and risks of completed acquisitions; |
• | the impact of macroeconomic conditions on our business and our customers' businesses; |
• | demand for our products and our customers' products; |
• | the expected realization of our backlog; |
• | customer license renewals; |
• | the completion of development of our unfinished products, or further development or integration of our existing products; |
• | technological trends in integrated circuit design; |
• | our ability to successfully compete in the markets in which we serve; |
• | our license mix, our business model, and variability in our revenue; |
• | litigation; |
• | our ability to protect our intellectual property; |
• | our cash, cash equivalents and cash generated from operations; |
• | our available-for-sale securities; and |
• | our future liquidity requirements. |
These statements are based on our current expectations about future events and involve certain known and unknown risks, uncertainties and other factors that could cause our actual results, time frames or achievements to differ materially from those expressed or implied in our forward-looking statements. Accordingly, we caution readers not to place undue reliance on these statements. Such risks and uncertainties include, among others, those listed in Part I, Item 1A, Risk Factors of this Form 10-K. The information included herein represents our estimates and assumptions as of the date of this filing. Unless required by law, we undertake no obligation to update publicly any forward-looking statements, or to update the reasons actual results could differ materially from those anticipated in these forward-looking statements, even if new information becomes available in the future. All subsequent written or oral forward-looking statements attributable to Synopsys, Inc. or persons acting on our behalf are expressly qualified in their entirety by these cautionary statements. Readers are urged to carefully review and consider the various disclosures made in this report and in other documents we file from time to time with the Securities and Exchange Commission (SEC) that attempt to advise interested parties of the risks and factors that may affect our business.
1
Table of Contents
Fiscal Year End
Our fiscal year ends on the Saturday nearest to October 31 and consists of 52 weeks, with the exception that approximately every five years, we have a 53-week year. Fiscal 2017 , 2016 , and 2015 were 52-week years ending on October 28, 2017, October 29, 2016, and October 31, 2015, respectively. Fiscal 2018 will be a 53-week year.
For presentation purposes, this Form 10-K refers to the closest calendar month end.
2
Table of Contents
PART I
Item 1. Business |
Company Overview
Synopsys, Inc. provides software, intellectual property, and services used by designers across the entire silicon to
software spectrum, from engineers creating advanced semiconductors to software developers seeking to ensure
the quality and security of their applications. We are a global leader in supplying the electronic design automation
(EDA) software that engineers use to design and test integrated circuits (ICs), also known as chips. We also offer intellectual property (IP) products, which are pre-designed circuits that engineers use as components of larger chip designs rather than design those circuits themselves. We provide software and hardware used to develop the electronic systems that incorporate chips and the software that runs on them. To complement these offerings, we provide technical services and support to help our customers develop advanced chips and electronic systems. We are also a leading provider of software tools and services that are used to improve the security and quality of software code in a wide variety of industries, including electronics, financial services, media, automotive, medicine, energy and industrials.
Corporate Information
We incorporated in 1986 in North Carolina and reincorporated in 1987 in Delaware. Our headquarters are located at 690 East Middlefield Road, Mountain View, California 94043, and our headquarters' telephone number is (650) 584-5000. We have approximately 112 offices worldwide.
Our annual and quarterly reports on Forms 10-K and 10-Q (including related filings in XBRL format), current reports on Form 8-K, and Proxy Statements relating to our annual meetings of stockholders (including any amendments to these reports, as well as filings made by our executive officers and directors) are available through the Investor Relations page of our website (www.synopsys.com) free of charge as soon as practicable after we file them with, or furnish them to, the SEC (www.sec.gov) . We use our Investor Relations page as a routine channel for distribution of important information, including news releases, analyst presentations, and financial information. The contents of our website are not part of this Form 10-K.
Background
Recent years have seen a remarkable proliferation of consumer and wireless electronic products, particularly mobile devices. The growth of the Internet and cloud computing has provided people with new ways to create, store and share information. At the same time, the increasing use of electronics in cars, buildings, appliances and other consumer products is creating a connected landscape of "smart" devices. Numerous software applications (apps) have been developed to expand the potential of these connected devices.
These developments have been fueled by innovation in the semiconductor and software industries. It is common for a single chip to combine many components (processor, communications, memory, custom logic, input/output) and embedded software into a single system-on-chip (SoC), necessitating highly complex chip designs. The most complex chips today contain more than a billion transistors. Transistors are the basic building blocks for ICs, each of which may have features that are less than 1/1,000th the diameter of a human hair. At such small dimensions, the wavelength of light itself can become an obstacle to production, proving too big to create such dense features and requiring creative and complicated new approaches from designers. Designers have turned to new manufacturing techniques to solve these problems, such as multiple-patterning lithography and FinFET transistors, which in turn have introduced new challenges to design and production.
The popularity of mobile devices and other electronic products has increased demand for chips and systems with greater functionality and performance, reduced size, and lower power consumption. Our customers are the designers of these products and are facing intense pressure to deliver innovative products in shorter timeframes and at lower prices. In other words, innovation in chip and system design often hinges on providing products "better," "sooner," and "cheaper" than competitors. The designs of these chips and systems are extremely complex and necessitate state-of-the-art design solutions.
A similar dynamic is at work in the software arena, where the pace of innovation often requires developers-also our customers-to deliver more secure, high-quality software, which can include millions of lines of code, in
3
Table of Contents
increasingly frequent release cycles. Bugs, defects, and security vulnerabilities in code can be difficult to detect and expensive to fix. But, at a time when software is prevalent in many industries across a growing array of smart devices, it is crucial to have high-quality, secure code to ensure consumers' privacy and safety.
Our Role-The Silicon to Software ™ Partner
Synopsys' products and services enable innovators across a variety of markets-from mobile electronics and finance to media, medical, energy, industrial, and automotive-to develop smart and secure products and applications. Across all industries, our customers face tremendous pressure to build differentiated chips and develop robust code more quickly and cost-effectively than ever before. With the increasing amount of embedded software in today's devices, security and quality are top concerns. Synopsys technologies and services are designed to help our customers - both hardware designers and software developers - to speed time to market, achieve the highest quality of results, mitigate risk, and maximize profitability. Our offerings span from silicon to software .
The task of the chip and system designer is to determine how best to design, locate, and connect the building blocks of chips, and to verify that the resulting design behaves as intended and can be manufactured efficiently and cost-effectively. This task is a complex, multi-step process that is both expensive and time-consuming. We offer a wide range of products that help designers at different steps in the overall design process, both for the design of individual ICs and for the design of larger systems. Our products can increase designer productivity and efficiency by automating tasks, keeping track of large amounts of design data, adding intelligence to the design process, facilitating reuse of past designs and reducing errors. Our IP products offer proven, high-quality pre-configured circuits that are ready-to-use in a chip design, saving customers time and enabling them to direct resources to features that differentiate their products. Our global service and support engineers also provide expert technical support and design assistance to our customers.
The task of the software developer is to write code that not only accomplishes the developer's goal as efficiently as possible, but also runs securely and is free of defects. We offer products that can help developers write higher quality, more secure code by analyzing their code for quality defects and security vulnerabilities, adding intelligence and automation to the software testing process, and helping to eliminate defects in a systematic manner. To the extent that developers make use of open source software in their code, our products can help developers better manage the composition and security of the code. Our products enable software developers to catch flaws earlier in the development cycle, when they are less costly to fix.
Products and Services
Revenue from our products and services is categorized into four groups:
• | Core EDA, which includes digital, custom and Field Programmable Gate Array (FPGA) IC design software, and our verification products; |
• | IP, Systems and Software Integrity, which includes our DesignWare ® IP portfolio, system-level products, and software security and quality testing solutions; |
• | Manufacturing Solutions; and |
• | Professional Services and Other. |
Core EDA
The process of designing ICs contains many complex steps: architecture definition, register transfer level (RTL) design, functional/RTL verification, logic design or synthesis, gate-level verification, floorplanning, and place and route, to name just a few. Designers use our Core EDA products to automate the IC design process and to reduce errors. We offer a platform that features a large number of Core EDA products intended to address the process comprehensively. Our Core EDA products generally fall into the following categories:
• | Digital , custom and FPGA IC design, which includes software tools to design an IC; and |
• | Verification, which includes technology to verify that an IC design behaves as intended . |
Digital and Custom IC Design
Our Galaxy™ Design Platform provides customers with a comprehensive design implementation solution that includes industry-leading products and incorporates common libraries and consistent timing, delay calculation, UPF
4
Table of Contents
power intent descriptions, and constraints throughout the design process. The platform gives designers the flexibility to integrate internally developed and third-party tools. With innovative technologies, a common foundation, and flexibility, our Galaxy Design Platform helps reduce design times, decrease uncertainties in the design steps, and minimize the risks inherent in advanced, complex IC design. Our products span digital, custom, and analog/mixed-signal designs, and support multiple technology nodes, including 16/14nm, 12nm, 10nm, 7/8nm, and many others .
Key design products, available as part of the Galaxy Design Platform or as individual point tools, are our IC Compiler™ II physical design solution, Design Compiler ® logic synthesis product, Custom Compiler™ full custom design solution, PrimeTime ® static timing analysis products, StarRC™ tool for extraction, and IC Validator tool for physical verification.
FPGA Design
FPGAs are complex chips that can be customized or programmed to perform a specific function after they are manufactured. For FPGA design, we offer Synplify ® (Pro ® and Premier) implementation and Identify ® debug software tools.
Verification
Our Verification Continuum™ platform is built from our industry-leading and fastest verification technologies, providing virtual prototyping, static and formal verification, simulation, emulation, FPGA-based prototyping, and debug in a unified environment with verification IP and planning and coverage technology. By providing a consistent model and debug environment across the flow of verification tasks and by enabling seamless transitions between simulation, emulation, and prototyping, the platform helps our customers accelerate hardware verification, bring up software earlier, and get to market sooner with advanced SoCs.
The individual products included in the Verification Continuum platform are reported in our Core EDA and IP, Systems & Software Integrity revenue categories. The solutions reported in our Core EDA revenue include the following:
• | SpyGlass ® family of static verification technologies including lint, CDC (clock domain crossing), RDC (reset domain crossing), DFT (design for test) , and low-power analysis and verification; |
• | VCS ® functional verification solution, our comprehensive RTL and gate-level simulation technology, including Fine-Grained Parallelism (FGP); |
• | Verdi ® debug technology, the industry's most compressive SoC debug; |
• | VC Formal, our next-generation formal verification product; |
• | Verdi Coverage, our verification planning and coverage technology; |
• | ZeBu ® emulation systems, which use high-performance hardware to emulate SoC designs so that designers can accelerate verification of large complex SoCs and perform earlier verification of the SoC together with software; and |
• | Other principal individual verification solutions, including CustomSim™ FastSPICE and FineSim ® SPICE/FastSPICE circuit simulation and analysis products, HSPICE ® circuit simulator, and CustomExplorer™ Ultra mixed-signal regression and analysis environment. |
The verification IP, virtual prototyping and FPGA-based prototyping solutions that are part of our Verification Continuum platform are included in our IP, Systems & Software Integrity category and further described below.
IP, Systems and Software Integrity
IP Products
As more functionality converges into a single device or even a single chip, and as chip designs grow more complex, the number of third-party IP blocks incorporated into designs is rapidly increasing. We are a leading provider of high-quality, silicon-proven IP solutions for SoCs. Our broad DesignWare IP portfolio includes:
5
Table of Contents
• | High-quality solutions for widely used wired and wireless interfaces such as USB, PCI Express, DDR, Ethernet, SATA, MIPI, HDMI, and Bluetooth Low Energy; |
• | Logic libraries and embedded memories, including memory compilers, non-volatile memory, standard cells, and integrated test and repair; |
• | Processor solutions, including configurable ARC ® processor cores, software, Embedded Vision processor cores and application-specific instruction-set processor (ASIP) tools for embedded applications; |
• | IP subsystems for audio, sensor, and data fusion functionality that combine IP blocks, an efficient processor, and software into an integrated, pre-verified subsystem; |
• | Security IP solutions, including cryptographic cores and software, security subsystems, platform security and content protection IP; |
• | Analog IP including data converters and audio codecs; and |
• | SoC infrastructure IP, datapath and building block IP, mathematical and floating point components, ARM ® AMBA ® interconnect fabric and peripherals, and verification IP. |
Our IP Accelerated initiative augments our established, broad portfolio of silicon-proven DesignWare IP with IP Prototyping Kits and customized IP subsystems to accelerate prototyping, software development, and integration of IP into SoCs.
We also offer a broad portfolio of IP that has been optimized to address specific application requirements for the mobile, automotive, digital home, internet of things, and cloud computing markets, enabling designers to quickly develop SoCs in these areas .
Our Verification IP portfolio, part of our Verification Continuum platform, is also part of the IP Products category.
System-Level Solutions
Our System-Level verification solutions include the following elements of our Verification Continuum platform:
• | HAPS ® FPGA-based prototyping systems, which provide design and verification teams an integrated and scalable hardware-software solution for early software development and to improve their SoC schedules; |
• | Virtualizer™ virtual prototyping solutions, which addresses the increasing development challenges associated with software-rich semiconductor and electronic products by accelerating both the development and deployment of virtual prototypes; and |
• | Platform Architect solution, which provides architects and system designers with tools and efficient methods for early analysis and optimization of multi-core SoC architectures for performance and power . |
We also provide a series of tools used in the design of optical systems and photonic devices. Our CODE V ® solution enables engineers to model, analyze and optimize designs for optical imaging and communication systems. Our LightTools ® design and analysis software allows designers to simulate and improve the performance of a broad range of illumination systems, from vehicle lighting to projector systems.
Software Integrity Solutions
Our Software Integrity platform is a comprehensive solution for building integrity-security and quality-into our customers' software development lifecycle and supply chain. These testing tools, services and programs enable our customers to detect and remediate defects across their entire software development lifecycle. Our offerings include security testing, managed services, programs and professional services, and training.
Key offerings in the security testing space include:
6
Table of Contents
• | SecureAssist and Coverity® static analysis tools , which analyze software code to find crash-causing bugs, incorrect program behavior, security vulnerabilities, memory leaks and other performance-degrading flaws; |
• | Defensics® fuzz testing tools, which examine security vulnerabilities in software binaries and libraries, particularly network protocols and file formats, by systematically sending invalid or unexpected inputs to the system under test; |
• | Protecode™ software composition analysis tools, which scan binary and source code for license issues and other known security vulnerabilities stemming from incorporated third-party and open source code; and |
• | Seeker ® IAST tool, which identifies exploitable security vulnerabilities while web applications are running, thereby verifying results and eliminating false positives . |
Managed Services allow developers to test code across many dimensions, and to rapidly respond to changing testing requirements and evolving threats. This includes Mobile AST services to find vulnerabilities in mobile applications as well as DAST services which identify security vulnerabilities while web applications are running, without the need for source code.
Programs and Professional Services address unique security and quality needs with specialized consulting by skilled experts, including Building Security in Maturity Mode (BSIMM), which measures the effectiveness of software security initiatives by assessing the current state as compared to industry benchmarks.
Finally, training includes eLearning and instructor-led training that prepares developers and security professionals to build security and quality into their software development process and remediate found vulnerabilities and defects.
Manufacturing Solutions
Our Manufacturing Solutions software products and technologies enable semiconductor manufacturers to more quickly develop new fabrication processes that produce production-level yields. These products are used in the early research and development phase, as well as in the production phase where designers use these products to help convert IC design layouts into the masks used to manufacture the devices.
Our Manufacturing Solutions include Sentaurus™ technology computer-aided design (TCAD) device and process simulation products, Proteus™ mask synthesis tools, CATS ® mask data preparation software, Yield Explorer ® Odyssey, and Yield-Manager ® yield management solutions.
Professional Services and Other
We provide consulting and design services that address all phases of the SoC development process. These services assist our customers with new tool and methodology adoption, chip architecture and specification development, functional and low-power design and verification, and physical implementation and signoff. We also provide a broad range of expert training and workshops on our latest tools and methodologies. Professional services related to the security and quality of the software embedded on the chip or elsewhere are included in the Software Integrity Solutions category and further described above.
Customer Service and Technical Support
A high level of customer service and support is critical to the adoption and successful use of our products. We provide technical support for our products through both field-based and corporate-based application engineering teams. Customers that purchase Technology Subscription Licenses (TSLs) receive post-contract customer support bundled with their license fee. Customers that purchase perpetual licenses may purchase these services separately. See Product Sales and Licensing Agreements below.
Post-contract customer support includes providing frequent updates and upgrades to maintain the utility of the software due to rapid changes in technology. Post-contract customer support for our EDA and IP products also includes access to the SolvNet ® portal, where customers can explore our complete design knowledge database. Updated daily, the SolvNet portal includes technical documentation, design tips, and answers to user questions.
7
Table of Contents
Customers can also engage, for additional charges, with our worldwide network of applications consultants for additional support needs.
In addition, we offer training workshops designed to increase customer design proficiency and productivity with our products. Workshops cover our EDA products and methodologies used in our design and verification flows, as well as specialized modules addressing system design, logic design, physical design, simulation and testing. We offer regularly scheduled public and private courses in a variety of locations worldwide, as well as online training (live or on-demand) through our Virtual Classrooms.
Product Warranties
We generally warrant our products to be free from defects in media and to substantially conform to material specifications for a period of 90 days for our software products and for up to 6 months for our hardware products. In many cases, we also provide our customers with limited indemnification with respect to claims that their use of our software products infringes on United States patents, copyrights, trademarks or trade secrets. We have not experienced material warranty or indemnity claims to date.
Support for Industry Standards
We actively create and support standards that help our EDA and IP customers increase productivity, facilitate efficient design flows, improve interoperability of tools from different vendors, and ensure connectivity, functionality and interoperability of IP building blocks. Standards in the electronic design industry can be established by formal accredited organizations, industry consortia, company licensing made available to all, de facto usage, or through open source licensing.
Synopsys' EDA products support many standards, including the most commonly used hardware description languages: SystemVerilog, Verilog, VHDL, and SystemC ® . Our products utilize numerous industry-standard data formats, APIs, and databases for the exchange of design data among our tools, other EDA vendors' products, and applications that customers develop internally. We also comply with a wide range of industry standards within our IP product family to ensure usability and interconnectivity.
Our Software Integrity solutions support several existing and emerging industry standards for software coding and security, such as the Motor Industry Software Reliability Association (MISRA) coding standards for the automotive industry. In addition, our products support multiple major programming languages-including Objective C, JavaScript, and security vulnerability coverage for C#-and are compatible with numerous common industry language compilers, development environments, and data and file formats.
Sales, Distribution and Backlog
Our EDA and IP customers are primarily semiconductor and electronics systems companies. The customers for our Software Integrity solutions include many of these companies as well as companies from a wider array of industries, including electronics, financial services, media, automotive, medicine, energy and industrials. We market our products and services principally through direct sales in the United States and our principal foreign markets. We typically distribute our software products and documentation to customers electronically, but provide physical media (e.g., DVD-ROMs) when requested by the customer.
We maintain sales and support centers throughout the United States. Outside the United States, we maintain sales, support or service offices in Canada, multiple countries in Europe, Israel and multiple countries in Asia, including Japan, China, Korea, and Taiwan. Our international headquarters are located in Dublin, Ireland. Our offices are further described under Part I, Item 2, Properties.
8
Table of Contents
• | In fiscal 2017 , 2016 and 2015 , an aggregate of 50% , 50% and 49% , respectively, of our total revenue was derived from sales outside of the United States. Geographic revenue, which is based on where individual "seats" or licenses to our products are located, is shown below as a percentage of total revenue for the last three fiscal years. |
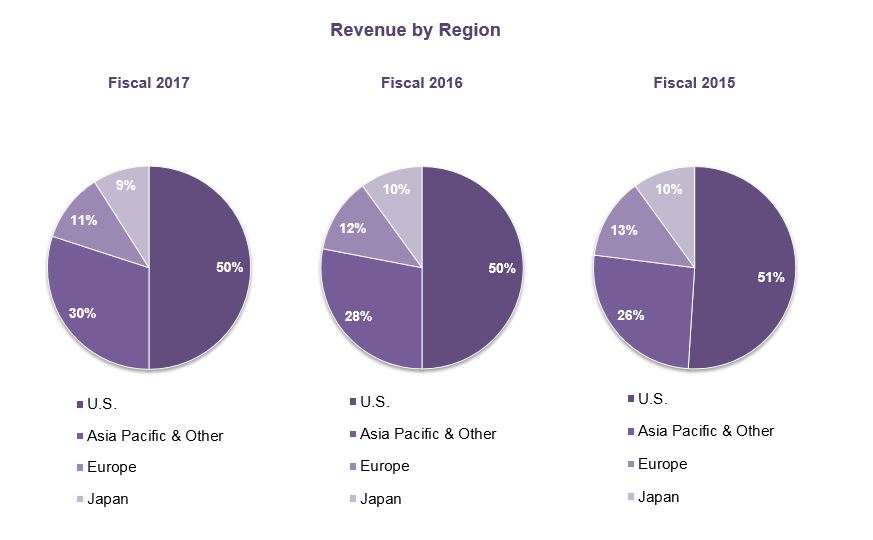
Additional information relating to domestic and foreign operations, including revenue and long-lived assets by geographic area, is contained in Note 13 of Notes to Consolidated Financial Statements in Part II, Item 8, Financial Statements and Supplementary Data . Risks related to our foreign operations are described in Part I, Item 1A, Risk Factors .
Our backlog was approximately $3.7 billion on October 31, 2017 , an increase from backlog of $3.5 billion on October 31, 2016 , resulting primarily from the timing of large multi-year contract renewals. Backlog represents committed orders that are expected to be recognized as revenue over the following three years. We currently expect that $1.5 billion of our backlog will be recognized after fiscal 2018 . Backlog may not be a reliable predictor of our future sales as business conditions may change and technologies may evolve, and customers may seek to renegotiate their arrangements or may default on their payment obligations. For this and other reasons, we may not be able to recognize expected revenue from backlog when anticipated.
9
Table of Contents
Revenue attributable to each of our four product categories is shown below as a percentage of total revenue for the last three fiscal years.
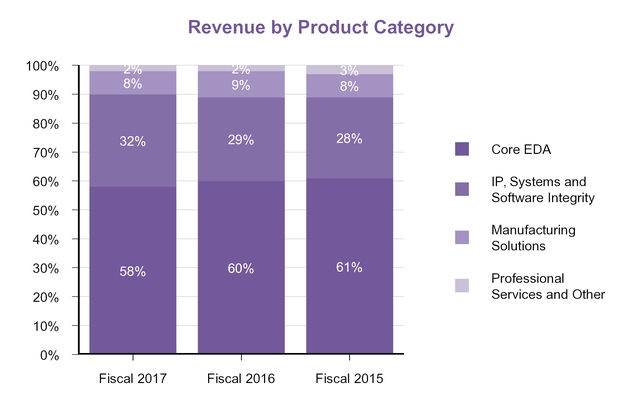
Aggregate revenue derived from Intel Corporation and its subsidiaries through multiple agreements accounted for 17.9% , 15.9% and 12.8% of our total revenue in fiscal 2017 , 2016 and 2015 , respectively. No other customer accounted for more than 10% of our revenue during such periods.
Product Sales and Licensing Agreements
We typically license our software to customers under non-exclusive license agreements that restrict use of our software to specified purposes within specified geographical areas. The majority of our licenses are network licenses that allow a number of individual users to access the software on a defined network, including, in some cases, regional or global networks. License fees depend on the type of license, product mix and number of copies of each product licensed.
In a number of cases, we provide our customers the right to "re-mix" a portion of the software they initially licensed for other specified Synopsys products. For example, a customer may use our front-end design products for a portion of the license term and then exchange such products for back-end place-and-route software for the remainder of the term in order to complete the customer's IC design. This practice helps ensure the customer's access to the complete design flow needed to design their product. Offering remix rights to customers gives us an advantage over competitors who offer a narrower range of products because customers can obtain more of their design flow from a single vendor. At the same time-because in such cases the customer need not obtain a new license and pay an additional license fee for the use of the additional products-the use of these arrangements could result in reduced revenue compared to licensing the individual products separately without re-mix rights.
We currently offer our software products under, primarily, two license types: TSLs and perpetual licenses. For a full discussion of these types of licenses, see Part II, Item 7, Management's Discussion and Analysis of Financial Condition and Results of Operations-Critical Accounting Policies and Estimates and Results of Operations-Revenue Background .
10
Table of Contents
We typically license our DesignWare IP products under nonexclusive license agreements that provide usage rights for specific applications. Fees under these licenses are typically charged on a per design basis plus, in some cases, royalties. Royalty arrangements are not material to our total revenue.
Our hardware products, which principally consist of our prototyping and emulation systems, are either sold or leased to our customers. Our professional services team typically provides design consulting services to our customers under consulting agreements with statements of work specific to each project.
Research and Development
Our future performance depends in large part on our ability to further enhance, extend and expand our product offerings. Research and development of existing and new products is primarily conducted within each product group. We also use targeted acquisitions to augment our own research and development efforts.
Our research and development expenses were $908.8 million , $856.7 million and $776.2 million in fiscal 2017 , 2016 and 2015 , respectively. Our capitalized software development costs were approximately $3.2 million , $4.1 million and $3.7 million in fiscal 2017 , 2016 and 2015 , respectively.
Competition
The EDA industry is highly competitive. We compete against other EDA vendors and against our customers' own design tools and internal design capabilities. In general, we compete principally on technology leadership, product quality and features (including ease-of-use), license terms, price and payment terms, post-contract customer support, and interoperability with our own and other vendors' products. We also deliver a significant amount of engineering and design consulting for our products. No single factor drives an EDA customer's buying decision, and we compete on all fronts to capture a higher portion of our customers' budgets. Our competitors include EDA vendors that offer varying ranges of products and services, such as Cadence Design Systems, Inc. and Mentor Graphics Corporation (which was recently acquired by Siemens AG). We also compete with other EDA vendors, including new entrants to the marketplace, that offer products focused on one or more discrete phases of the IC design process, as well as with customers' internally developed design tools and capabilities.
In the area of IP products, we compete against numerous other IP providers, including Cadence Design Systems, Inc., and our customers' internally developed IP. We generally compete on the basis of product quality, reliability and features, ease of integration with customer designs, compatibility with design tools, license terms, price and payment terms, and customer support.
In the area of Software Integrity solutions, the market is still developing. We compete with other solution providers, many of which focus on specific aspects of software security or quality analysis, as well as with frequent new entrants, which include start-up companies and more established software companies.
Proprietary Rights
We primarily rely upon a combination of copyright, patent, trademark, and trade secret laws and license and non-disclosure agreements to establish and protect our proprietary rights. We have a diversified portfolio of more than 2,700 United States and foreign patents issued, and we will continue to pursue additional patents in the future. Our issued patents have expiration dates through 2037. Our patents primarily relate to our products and the technology used in connection with our products. Our source code is protected both as a trade secret and as an unpublished copyrighted work. However, third parties may independently develop similar technology. In addition, effective copyright and trade secret protection may be unavailable or limited in some foreign countries. While protecting our proprietary technology is important to our success, our business as a whole is not significantly dependent upon any single patent, copyright, trademark, or license.
In many cases, under our customer agreements and other license agreements, we offer to indemnify our customers if the licensed products infringe on a third party's intellectual property rights. As a result, we may from time to time need to defend claims that our customers' use of our products infringes on these third-party rights. We license software and other intellectual property from third parties, including, in several instances, for inclusion in our products. Risks related to our use of third-party technology are described in Part I, Item 1A, Risk Factors .
Employees
As of October 31, 2017 , Synopsys had 11,686 employees, of which 4,196 were based in the United States.
11
Table of Contents
Executive Officers of the Registrant
The executive officers of Synopsys and their ages as of December 13, 2017 were as follows:
Name |
| Age |
| Position |
Aart J. de Geus |
| 63 |
| Co-Chief Executive Officer and Chairman of the Board of Directors |
Chi-Foon Chan |
| 68 |
| Co-Chief Executive Officer and President |
Trac Pham |
| 48 |
| Chief Financial Officer |
Joseph W. Logan |
| 58 |
| Sales and Corporate Marketing Officer |
John F. Runkel, Jr. |
| 62 |
| General Counsel and Corporate Secretary |
Aart J. de Geus co-founded Synopsys and has served as Chairman of our Board of Directors since February 1998 and Chief Executive Officer since January 1994. He has served as Co-Chief Executive Officer with Dr. Chi-Foon Chan since May 2012. Since the inception of Synopsys in December 1986, Dr. de Geus has held a variety of positions, including President, Senior Vice President of Engineering and Senior Vice President of Marketing. He has served as a member of Synopsys' Board of Directors since 1986, and served as Chairman of our Board from 1986 to 1992 and again from 1998 until present. Dr. de Geus has also served on the board of directors of Applied Materials, Inc. since July 2007. Dr. de Geus holds an M.S.E.E. from the Swiss Federal Institute of Technology in Lausanne, Switzerland and a Ph.D. in Electrical Engineering from Southern Methodist University.
Chi-Foon Chan has served as our Co-Chief Executive Officer since May 2012 and as our President and a member of our Board of Directors since February 1998. Prior to his appointment as our Co-Chief Executive Officer in May 2012, he had served as our Chief Operating Officer since April 1997. Dr. Chan joined Synopsys in May 1990 and has held various senior management positions, including Executive Vice President, Office of the President from September 1996 to February 1998 and Senior Vice President, Design Tools Group from February 1994 to April 1997. Dr. Chan has also held senior management and engineering positions at NEC Electronics and Intel Corporation. Dr. Chan holds a B.S. in Electrical Engineering from Rutgers University, and an M.S. and a Ph.D. in Computer Engineering from Case Western Reserve University.
Trac Pham is our Chief Financial Officer. Mr. Pham joined Synopsys in November 2006 as Vice President, Financial Planning and Strategy. He became our Vice President, Corporate Finance, in August 2012, assuming additional responsibility for our tax and treasury functions, before being appointed Chief Financial Officer in December 2014. Mr. Pham holds a Bachelor of Arts in Economics from the University of California, Berkeley and an MPIA (Master of Pacific International Affairs) from the University of California, San Diego. He is an active status California CPA.
Joseph W. Logan serves as our Sales and Corporate Marketing Officer. He became Senior Vice President of Worldwide Sales in September 2006, and assumed responsibility for our Corporate Marketing organization in August 2013. Previously, Mr. Logan was head of sales for Synopsys' North America East region from September 2001 to September 2006. Prior to Synopsys, Mr. Logan was head of North American Sales and Support at Avant! Corporation. Mr. Logan holds a B.S.E.E. from the University of Massachusetts, Amherst.
John F. Runkel, Jr. has served as our General Counsel and Corporate Secretary since May 2014. From October 2008 to March 2013, he was Executive Vice President, General Counsel, and Corporate Secretary of Affymetrix, Inc. He served as Senior Vice President, General Counsel and Corporate Secretary of Intuitive Surgical, Inc. from 2006 to 2007. Mr. Runkel served in several roles at VISX, Inc. from 2001 to 2005, most recently as Senior Vice President of Business Development and General Counsel. Mr. Runkel was also a partner at the law firm of Sheppard, Mullin, Richter & Hampton LLP for 11 years. He holds a Bachelor of Arts and a Juris Doctorate from the University of California, Los Angeles.
There are no family relationships among any Synopsys executive officers or directors.
Item 1A. Risk Factors |
A description of the risk factors associated with our business is set forth below. Investors should carefully consider these risks and uncertainties before investing in our common stock.
12
Table of Contents
The growth of our business depends on the semiconductor and electronics industries.
The growth of the electronic design automation (EDA) industry as a whole, and our EDA and intellectual property (IP) product sales in particular, is dependent on the semiconductor and electronics industries. A substantial portion of our business and revenue depends upon the commencement of new design projects by semiconductor manufacturers and their customers. The increasing complexity of designs of systems-on-chips and integrated circuits, and customers' concerns about managing costs, have previously led and in the future could lead to a decrease in design starts and design activity in general, with some customers focusing more on one discrete phase of the design process or opting for less advanced, but less risky, manufacturing processes that may not require the most advanced EDA products. Demand for our products and services could decrease and our financial condition and results of operations could be adversely affected if growth in the semiconductor and electronics industries slows or stalls. Additionally, as the EDA industry matures, consolidation may result in stronger competition from companies better able to compete as sole source vendors. This increased competition may cause our revenue growth rate to decline and exert downward pressure on our operating margins, which may have an adverse effect on our business and financial condition.
Furthermore, the semiconductor and electronics industries have become increasingly complex ecosystems. Many of our customers outsource the manufacture of their semiconductor designs to foundries. Our customers also frequently incorporate third-party IP, whether provided by us or other vendors, into their designs to improve the efficiency of their design process. We work closely with major foundries to ensure that our EDA, IP, and manufacturing solutions are compatible with their manufacturing processes. Similarly, we work closely with other major providers of semiconductor IP, particularly microprocessor IP, to optimize our EDA tools for use with their IP designs and to assure that their IP and our own IP products, which may each provide for the design of separate components on the same chip, work effectively together. If we fail to optimize our EDA and IP solutions for use with major foundries' manufacturing processes or major IP providers' products, or if our access to such foundry processes or third-party IP products is hampered, then our solutions may become less desirable to our customers, resulting in an adverse effect on our business and financial condition.
Consolidation among our customers and within the industries in which we operate, as well as our dependence on a relatively small number of large customers, may negatively impact our operating results.
A number of business combinations, including mergers, asset acquisitions and strategic partnerships, among our customers in the semiconductor and electronics industries have occurred over the last several years, and more could occur in the future. Consolidation among our customers could lead to fewer customers or the loss of customers, increased customer bargaining power, or reduced customer spending on software and services. Furthermore, we depend on a relatively small number of large customers, and on such customers continuing to renew licenses and purchase additional products from us, for a large portion of our revenue. Reduced customer spending or the loss of a small number of customers, particularly our large customers, could adversely affect our business and financial condition. In addition, we and our competitors from time to time acquire businesses and technologies to complement and expand our respective product offerings. If any of our competitors consolidate or acquire businesses and technologies which we do not offer, they may be able to offer a larger technology portfolio, additional support and service capability, or lower prices, which could negatively impact our business and operating results.
Uncertainty in the global economy, and its potential impact on the semiconductor and electronics industries in particular, may negatively affect our business, operating results and financial condition.
While the global economy has shown improvement in recent years, there are still uncertainties surrounding the strength of the recovery in many regions. Uncertainty caused by challenging global economic conditions could lead some of our customers to postpone their decision-making, decrease their spending and/or delay their payments to us. Such caution by semiconductor companies could, among other things, limit our ability to maintain or increase our sales or recognize revenue from committed contracts.
We cannot predict the stability of the economy as a whole or the industries in which we operate. Further economic instability could adversely affect the banking and financial services industry and result in credit downgrades of the banks we rely on for foreign currency forward contracts, credit and banking transactions, and deposit services, or cause them to default on their obligations. There is uncertainty regarding how proposed, contemplated or future changes to the complex law, and regulations governing our industry, the banking and financial services industry, and the economy could affect our business. In addition, economic conditions could deteriorate in the future, and, in particular, the semiconductor and electronics industries could fail to grow. In the event of future improvements in
13
Table of Contents
economic conditions for our customers, the positive impact on our revenues and financial results may be deferred due to our business model. Any of the foregoing could cause adverse effects on our business, operating results and financial condition, and could cause our stock price to decline.
We may not be able to realize the potential financial or strategic benefits of the acquisitions we complete, or find suitable target businesses and technology to acquire, which could hurt our ability to grow our business, develop new products or sell our products.
Acquisitions are an important part of our growth strategy. We have completed a significant number of acquisitions in recent years. We expect to make additional acquisitions in the future, but we may not find suitable acquisition targets or we may not be able to consummate desired acquisitions due to unfavorable credit markets, commercially unacceptable terms, or other risks, which could harm our operating results. Acquisitions are difficult, time-consuming, and pose a number of risks, including:
• | Potential negative impact on our earnings per share; |
• | Failure of acquired products to achieve projected sales; |
• | Problems in integrating the acquired products with our products; |
• | Difficulties entering into new markets in which we are not experienced or where competitors may have stronger positions; |
• | Potential downward pressure on operating margins due to lower operating margins of acquired businesses, increased headcount costs and other expenses associated with adding and supporting new products; |
• | Difficulties in retaining and integrating key employees; |
• | Substantial reductions of our cash resources and/or the incurrence of debt; |
• | Failure to realize expected synergies or cost savings; |
• | Difficulties in integrating or expanding sales, marketing and distribution functions and administrative systems, including information technology and human resources systems; |
• | Dilution of our current stockholders through the issuance of common stock as part of the merger consideration; |
• | Assumption of unknown liabilities, including tax and litigation, and the related expenses and diversion of resources; |
• | Disruption of ongoing business operations, including diversion of management's attention and uncertainty for employees and customers, particularly during the post-acquisition integration process; |
• | Potential negative impacts on our relationships with customers, distributors and business partners; |
• | Exposure to new operational risks, regulations, and business customs to the extent acquired businesses are located in regions where we are not currently conducting business; |
• | The need to implement controls, processes and policies appropriate for a public company at acquired companies that may have lacked such controls, processes and policies; |
• | Negative impact on our net income resulting from acquisition-related costs; and |
• | Requirements imposed by government regulators in connection with their review of an acquisition, including required divestitures or restrictions on the conduct of our business or the acquired business. |
If we do not manage the foregoing risks, the acquisitions that we complete may have an adverse effect on our business and financial condition.
Our operating results may fluctuate in the future, which may adversely affect our stock price.
Our operating results are subject to quarterly and annual fluctuations, which may adversely affect our stock price. Our historical results should not be viewed as indicative of our future performance due to these periodic fluctuations.
Many factors may cause our revenue or earnings to fluctuate, including:
• | Changes in demand for our products-especially products, such as hardware, generating upfront revenue-due to fluctuations in demand for our customers' products and due to constraints in our customers' budgets for research and development and EDA products and services; |
• | Product competition in the EDA industry, which can change rapidly due to industry or customer consolidation and technological innovation; |
14
Table of Contents
• | Our ability to innovate and introduce new products and services or effectively integrate products and technologies that we acquire; |
• | Failures or delays in completing sales due to our lengthy sales cycle, which often includes a substantial customer evaluation and approval process because of the complexity of our products and services; |
• | Our ability to implement effective cost control measures; |
• | Our dependence on a relatively small number of large customers, and on such customers continuing to renew licenses and purchase additional products from us, for a large portion of our revenue; |
• | Changes in the mix of our products sold, as increased sales of our products with lower gross margins, such as our hardware products, may reduce our overall margins; |
• | Expenses related to our acquisition and integration of businesses and technology; |
• | Changes in tax rules, as well as changes to our effective tax rate, including the tax effects of infrequent or unusual transactions; |
• | Delays, increased costs or quality issues resulting from our reliance on third parties to manufacture our hardware products, which include a sole supplier for certain hardware components; and |
• | General economic and political conditions that affect the semiconductor and electronics industries. |
The timing of revenue recognition may also cause our revenue and earnings to fluctuate, due to factors that include:
• | Cancellations or changes in levels of orders or the mix between upfront products revenue and time-based products revenue; |
• | Delay of one or more orders for a particular period, particularly orders generating upfront products revenue, such as hardware; |
• | Delay in the completion of professional services projects that require significant modification or customization and are accounted for using the percentage of completion method; |
• | Delay in the completion and delivery of IP products in development that customers have paid for early access to; |
• | Customer contract amendments or renewals that provide discounts or defer revenue to later periods; |
• | The levels of our hardware revenues, which are recognized upfront and are primarily dependent upon our ability to provide the latest technology and meet customer requirements, and which may also impact our levels of excess and obsolete inventory expenses; and |
• | Changes in our revenue recognition model. |
These factors, or any other factors or risks discussed herein, could negatively impact our revenue or earnings and cause our stock price to decline. Additionally, our results may fail to meet or exceed the expectations of securities analysts and investors, or such analysts may change their recommendation regarding our stock, which could cause our stock price to decline. Our stock price has been, and may continue to be, volatile, which may make it harder for our stockholders to sell their shares at a time or a price that is favorable to them.
We operate in highly competitive industries, and if we do not continue to meet our customers' demand for innovative technology at lower costs, our business and financial condition will be harmed.
We compete against EDA vendors that offer a variety of products and services, such as Cadence Design Systems, Inc. and Mentor Graphics Corporation (which was recently acquired by Siemens AG). We also compete with other EDA vendors, including new entrants to the marketplace, that offer products focused on one or more discrete phases of the IC design process. Moreover, our customers internally develop design tools and capabilities that compete with our products, including internal designs that compete with our IP products.
In the area of IP products, we compete against numerous other IP providers as well as our customers' internally developed IP. In the area of Software Integrity solutions, we compete with numerous other solution providers, many of which focus on specific aspects of software security or quality analysis. We also compete with frequent new entrants, which include start-up companies and more established software companies.
The industries in which we operate are highly competitive and the demand for our products and services is dynamic and depends on a number of factors, including demand for our customers' products, design starts and our customers' budgetary constraints. Technology in these industries evolves rapidly and is characterized by frequent product introductions and improvements as well as changes in industry standards and customer requirements. Semiconductor device functionality requirements continually increase while feature widths decrease, substantially increasing the complexity, cost and risk of chip design and manufacturing. At the same time, our customers and
15
Table of Contents
potential customers continue to demand an overall lower total cost of design, which can lead to the consolidation of their purchases with one vendor. In order to succeed in this environment, we must successfully meet our customers' technology requirements and increase the value of our products, while also striving to reduce their overall costs and our own operating costs.
We compete principally on the basis of technology, product quality and features (including ease-of-use), license or usage terms, post-contract customer support, interoperability among products, and price and payment terms. Specifically, we believe the following competitive factors affect our success:
• | Our ability to anticipate and lead critical development cycles and technological shifts, innovate rapidly and efficiently, improve our existing products, and successfully develop or acquire new products; |
• | Our ability to offer products that provide both a high level of integration into a comprehensive platform and a high level of individual product performance; |
• | Our ability to enhance the value of our offerings through more favorable terms such as expanded license usage, future purchase rights, price discounts and other unique rights, such as multiple tool copies, post-contract customer support, "re-mix" rights that allow customers to exchange the software they initially licensed for other Synopsys products, and the ability to purchase pools of technology; |
• | Our ability to compete on the basis of payment terms; and |
• | Our ability to provide engineering and design consulting for our products. |
If we fail to successfully manage these competitive factors, fail to successfully balance the conflicting demands for innovative technology and lower overall costs, or fail to address new competitive forces, our business and financial condition will be adversely affected.
We pursue new product and technology initiatives from time to time, and if we fail to successfully carry out these initiatives, our business, financial condition, or results of operations could be adversely impacted.
As part of the evolution of our business, we have made substantial investments to develop new products and enhancements to existing products through our acquisitions and research and development efforts. If we are unable to anticipate technological changes in our industry by introducing new or enhanced products in a timely and cost-effective manner, or if we fail to introduce products that meet market demand, we may lose our competitive position, our products may become obsolete, and our business, financial condition or results of operations could be adversely affected.
Additionally, from time to time, we invest in expansion into adjacent markets, including software quality, testing, and security solutions. Although we believe these solutions are complementary to our EDA tools, we have less experience and a more limited operating history in offering software quality, testing, and security products and services, and our efforts in this area may not be successful. Our success in these new markets depends on a variety of factors, including the following:
• | Our ability to attract a new customer base, including in industries in which we have less experience; |
• | Our successful development of new sales and marketing strategies to meet customer requirements; |
• | Our ability to accurately predict, prepare for, and promptly respond to technological developments in new fields, including, in the case of our software quality, testing, and security tools and services, identifying new security vulnerabilities in software code and ensuring support for a growing number of programming languages; |
• | Our ability to compete with new and existing competitors in these new industries, many of which may have more financial resources, industry experience, brand recognition, relevant intellectual property rights, or established customer relationships than we currently do; |
• | Our ability to skillfully balance our investment in adjacent markets with investment in our existing products and services; |
• | Our ability to attract and retain employees with expertise in new fields; |
• | Our ability to sell and support consulting services at profitable margins; and |
• | Our ability to manage our revenue model in connection with hybrid sales of licensed products and consulting services. |
16
Table of Contents
Difficulties in any of our new product development efforts or our efforts to enter adjacent markets could adversely affect our operating results and financial condition.
Cybersecurity threats or other security breaches could compromise sensitive information belonging to us or our customers and could harm our business and our reputation, particularly that of our security testing solutions.
We store sensitive data, including intellectual property, our proprietary business information and that of our customers, and confidential employee information, in our data centers and on our networks. Despite our security measures, our information technology and infrastructure may be vulnerable to attacks by hackers or breached due to employee error, malfeasance or other disruptions that could result in unauthorized disclosure or loss of sensitive information.
For example, in October 2015, we discovered unauthorized third-party access, which had begun in July 2015, to our products and product license files hosted on our SolvNet customer license and product delivery system. We determined that no customer project or design data had been accessed. No personally identifiable information or payment card information is stored on the system. While we identified and closed the method used to gain access, it is possible our security measures may be circumvented again in the future, and such a breach could harm our business and reputation. The techniques used to obtain unauthorized access to networks, or to sabotage systems, change frequently and generally are not recognized until launched against a target. We may be unable to anticipate these techniques or to implement adequate preventative measures. Furthermore, in the operation of our business we also use third-party vendors that store certain sensitive data, including confidential information about our employees, and these third parties are subject to their own cybersecurity threats. While our standard vendor terms and conditions include provisions requiring the use of appropriate security measures to prevent unauthorized use or disclosure of our data, as well as other safeguards, a breach may still occur. Any security breach of our own or a third-party vendor's systems could cause us to be non-compliant with applicable laws or regulations, subject us to legal claims or proceedings, disrupt our operations, damage our reputation, and cause a loss of confidence in our products and services, any of which could adversely affect our business.
Our software products may also be vulnerable to cyber attacks. An attack could disrupt the proper functioning of our software, cause errors in the output of our customers' work, allow unauthorized access to our or our customers' proprietary information, and other destructive outcomes. As a result, our reputation could suffer, customers could stop buying our products, we could face lawsuits and potential liability, and our financial performance could be negatively impacted.
We offer software security and quality testing solutions. If we fail to identify new and increasingly sophisticated methods of cyberattack, or fail to invest sufficient resources in research and development regarding new threat vectors, our security testing products and services may fail to detect vulnerabilities in our customers' software code. An actual or perceived failure to identify security flaws may harm the perceived reliability of our security testing products and services, and could result in a loss of customers, sales, or an increased cost to remedy a problem. Furthermore, our growth and recent acquisitions in the software security and quality testing space may increase our visibility as a security-focused company and may make us a more attractive target for attacks on our own information technology infrastructure. Successful attacks could damage our reputation as a security-focused company.
The global nature of our operations exposes us to increased risks and compliance obligations that may adversely affect our business.
We derive roughly half of our revenue from sales outside the United States, and we expect our orders and revenue to continue to depend on sales to customers outside the U.S. In addition, we have continually expanded our non-U.S. operations in the past several years. This strategy requires us to recruit and retain qualified technical and managerial employees, manage multiple remote locations performing complex software development projects and ensure intellectual property protection outside of the U.S. Our international operations and sales subject us to a number of increased risks, including:
• | Ineffective or weaker legal protection of intellectual property rights; |
• | Uncertain economic and political conditions in countries where we do business; |
• | Difficulties in adapting to cultural differences in the conduct of business, which may include business practices in which we are prohibited from engaging by the Foreign Corrupt Practices Act or other anti-corruption laws; |
• | Financial risks such as longer payment cycles and difficulty in collecting accounts receivable; |
17
Table of Contents
• | Inadequate local infrastructure that could result in business disruptions; |
• | Government trade restrictions, including tariffs, export licenses, or other trade barriers, and changes to existing trade arrangements between various countries; |
• | Additional taxes, interest, and potential penalties, and uncertainty around changes in tax laws of various countries; and |
• | Other factors beyond our control such as natural disasters, terrorism, civil unrest, war and infectious diseases. |
As our business volume increases in the Asia Pacific region, there is inherent risk, based on the complex relationships between certain Asian countries and the United States, that governmental influences could result in trade disruptions.
If any of the foreign economies in which we do business deteriorate or if we fail to effectively manage our global operations, our business and results of operations will be harmed.
Our global operations are subject to numerous U.S. and foreign laws and regulations, including those related to anti-corruption, tax, corporate governance, imports and exports, financial and other disclosures, privacy and labor relations. These laws and regulations are complex and may have differing or conflicting legal standards, making compliance difficult and costly. In addition, there is uncertainty regarding how proposed, contemplated or future changes to these complex laws and regulations could affect our business. We may incur substantial expense in complying with the new obligations to be imposed by these laws and regulations, and we may be required to make significant changes in our business operations, all of which may adversely affect our revenues and our business overall. If we violate these laws and regulations we could be subject to fines, penalties or criminal sanctions, and may be prohibited from conducting business in one or more countries. Although we have implemented policies and procedures to help ensure compliance with these laws and regulations, there can be no assurance that our employees, contractors, agents or partners will not violate such laws and regulations. Any violation individually or in the aggregate could have a material adverse effect on our operations and financial condition.
Our financial statements are also affected by fluctuations in foreign currency exchange rates. A weakening U.S. dollar relative to other currencies increases expenses of our foreign subsidiaries when they are translated into U.S. dollars in our consolidated statement of operations. Likewise, a strengthening U.S. dollar relative to other currencies, especially the Japanese Yen, reduces revenue of our foreign subsidiaries upon translation and consolidation. Exchange rates are subject to significant and rapid fluctuations, and therefore we cannot predict the prospective impact of exchange rate fluctuations. Although we engage in foreign currency hedging activity, we may be unable to hedge all of our foreign currency risk, which could have a negative impact on our results of operations.
If we fail to protect our proprietary technology, our business will be harmed.
Our success depends in part upon protecting our proprietary technology. Our efforts to protect our technology may be costly and unsuccessful. We rely on agreements with customers, employees and other third-parties as well as intellectual property laws worldwide to protect our proprietary technology. These agreements may be breached, and we may not have adequate remedies for any breach. Additionally, despite our measures to prevent piracy, other parties may attempt to illegally copy or use our products, which could result in lost revenue. Some foreign countries do not currently provide effective legal protection for intellectual property and our ability to prevent the unauthorized use of our products in those countries is therefore limited. Our trade secrets may also be stolen, otherwise become known, or be independently developed by competitors.
We may need to commence litigation or other legal proceedings in order to:
• | Assert claims of infringement of our intellectual property; |
• | Defend our products from piracy; |
• | Protect our trade secrets or know-how; or |
• | Determine the enforceability, scope and validity of the propriety rights of others. |
If we do not obtain or maintain appropriate patent, copyright or trade secret protection, for any reason, or cannot fully defend our intellectual property rights in certain jurisdictions, our business and operating results would be harmed. In addition, intellectual property litigation is lengthy, expensive and uncertain. Legal fees related to such litigation will increase our operating expenses and may reduce our net income.
We may have to invest more resources in research and development than anticipated, which could increase our operating expenses and negatively affect our operating results.
18
Table of Contents
We devote substantial resources to research and development. New competitors, technological advances in the semiconductor industry or by competitors, our acquisitions, our entry into new markets, or other competitive factors may require us to invest significantly greater resources than we anticipate. If we are required to invest significantly greater resources than anticipated without a corresponding increase in revenue, our operating results could decline. Additionally, our periodic research and development expenses may be independent of our level of revenue, which could negatively impact our financial results. Finally, there can be no guarantee that our research and development investments will result in products that create additional revenue.
Our hardware products, which primarily consist of prototyping and emulation systems, subject us to distinct risks.
The growth of our hardware products subject us to several increased risks, including:
• | Increased dependence on a sole supplier for certain hardware components, which may reduce our control over product quality and pricing and may lead to delays in production and delivery of our hardware products, should our supplier fail to deliver sufficient quantities of acceptable components in a timely fashion; |
• | Increasingly variable revenue and decreasingly accurate revenue forecasts, due to fluctuations in hardware revenue, which is recognized upfront upon shipment, as opposed to most sales of software products for which revenue is recognized over time; |
• | Overall reductions in margins, as the gross margin for our hardware products is typically lower than those of our software products; |
• | Longer sales cycles, which create risks of insufficient, excess or obsolete inventory and variations in inventory valuation, which can adversely affect our operating results; |
• | Decreases or delays in customer purchases in favor of next-generation releases, which may lead to excess or obsolete inventory or require us to discount our older hardware products; and |
• | Longer warranty periods than those of our software products, which may require us to replace hardware components under warranty, thus increasing our costs. |
Changes in United States Generally Accepted Accounting Principles (U.S. GAAP) could adversely affect our reported financial results and may require significant changes to our internal accounting systems and processes.
We prepare our consolidated financial statements in conformity with U.S. GAAP. These principles are subject to interpretation by the Financial Accounting Standards Board (FASB), the Securities and Exchange Commission (SEC) and various bodies formed to interpret and create appropriate accounting principles and guidance.
The FASB is currently working together with the International Accounting Standards Board (IASB) to converge certain accounting principles and facilitate more comparable financial reporting between companies that are required to follow U.S. GAAP and those that are required to follow International Financial Reporting Standards (IFRS). In connection with this initiative, the FASB issued new accounting standards for revenue recognition and accounting for leases. For information regarding new accounting standards, please refer to Part II, Item 7, Management's Discussion and Analysis of Financial Condition and Results of Operations-Overview-Effect of New Accounting Pronouncements Not Yet Adopted. These and other such standards may result in different accounting principles, which may significantly impact our reported results or could result in volatility of our financial results. In addition, we may need to significantly change our customer and vendor contracts, accounting systems and processes. The cost and effect of these changes may adversely impact our results of operations.
19
Table of Contents
Our results could be adversely affected by a change in our effective tax rate as a result of tax law changes, changes in our geographical earnings mix, unfavorable government reviews of our tax returns, material differences between our forecasted and actual annual effective tax rates, or by evolving enforcement practices.
Our operations are subject to income and transaction taxes in the United States and in multiple foreign jurisdictions, with a significant amount of our foreign earnings generated by our subsidiaries organized in Ireland and Hungary. Because we have a wide range of statutory tax rates in the multiple jurisdictions in which we operate, any changes in our geographical earnings mix, including those resulting from our intercompany transfer pricing or from changes in the rules governing transfer pricing, could materially impact our effective tax rate. Furthermore, a change in the tax law of the jurisdictions where we do business, including an increase in tax rates or an adverse change in the treatment of an item of income or expense, could result in a material increase in our tax expense and impact our financial position and cash flows. In addition, U.S. income taxes and foreign withholding taxes have not been provided for on undistributed earnings of certain of our non-U.S. subsidiaries to the extent such earnings are considered to be indefinitely reinvested in the operations of those subsidiaries. If our intentions regarding reinvestment of such earnings change, then our income tax expense could increase. In fiscal 2017, we repatriated $825 million of undistributed foreign earnings in anticipation of U.S. corporate tax reform.
In the U.S., a number of proposals for broad reform of the corporate tax system are under evaluation by various legislative and administrative bodies. It is not possible to accurately determine the overall impact of such proposals on our effective tax rate or balance sheet at this time. Proposed changes in corporate tax rates, the taxation of foreign earnings and the deductibility of expenses could have a material impact on the recoverability of our deferred tax assets, could result in significant one-time charges in the period in which tax reform is enacted, or could result in increases to our future U.S. tax expense. Furthermore, proposed changes to the taxation of undistributed foreign earnings could change our future intentions regarding reinvestment of such earnings .
Further changes in the tax laws of foreign jurisdictions could arise as a result of the base erosion and profit shifting (BEPS) project undertaken by the Organisation for Economic Co-operation and Development (OECD), which represents a coalition of member countries. On October 5, 2015, the OECD issued a series of reports recommending changes to numerous long-standing tax principles. Many of these recommendations are being adopted by various countries in which we do business and may increase our taxes in these countries. In addition, the Republic of Ireland has changed its corporate residence rules and will require changes to our tax position by January 1, 2021. On July 26, 2016, Hungary amended its IP regime to bring it in line with the OECD BEPS Project and the changes were effective in fiscal 2017. Changes to these and other areas in relation to international tax reform could increase uncertainty in the corporate tax area and may adversely affect our provision for income taxes.
Our income and non-income tax filings are subject to review or audit by the Internal Revenue Service and state, local and foreign taxing authorities. We exercise significant judgment in determining our worldwide provision for income taxes and, in the ordinary course of our business, there may be transactions and calculations where the ultimate tax determination is uncertain. We are also liable for potential tax liabilities of businesses we acquire. Although we believe our tax estimates are reasonable, the final determination in an audit may be materially different than the treatment reflected in our historical income tax provisions and accruals. An assessment of additional taxes because of an audit could adversely affect our income tax provision and net income in the periods for which that determination is made.
In July 2017, the Hungarian Tax Authority (HTA) issued a final assessment against our Hungarian subsidiary (Synopsys Hungary) for fiscal years 2011 through 2013. The HTA has disallowed Synopsys Hungary's tax positions taken during these years regarding the timing of the deduction of research expenses and applied withholding taxes on certain payments made to affiliates, resulting in an aggregate tax assessment of approximately $47 million and interest and penalties of over $18 million (at current exchange rates). In addition, if the treatment of research expense were applied to fiscal years after 2014, Synopsys Hungary could lose approximately $18 million in tax benefit in tax periods subsequent to fiscal 2017 due to the enacted reduction of Hungary's corporate income tax rate. If the assessment is ultimately canceled, the Hungarian statutory accounting treatment could have an indirect adverse impact on certain tax benefits in the year of the cancellation.
We are also under examination by the tax authorities in certain other jurisdictions. No material assessments have been proposed in these examinations.
We maintain significant deferred tax assets related to federal research credits. Our ability to use these credits is dependent upon having sufficient future taxable income in the relevant jurisdiction. Changes in our forecasts of
20
Table of Contents
future income could result in an adjustment to the deferred tax asset and a related charge to earnings that could materially affect our financial results. In addition, a change in corporate tax rates could have a material impact on the recoverability of our deferred tax assets.
Liquidity requirements in our U.S. operations may require us to raise cash in uncertain capital markets, which could negatively affect our financial condition.
As of October 31, 2017, approximately 47% of our worldwide cash, cash equivalents and short-term investments balance is held by our international subsidiaries. At present, such foreign funds are considered to be indefinitely reinvested abroad, and to the extent they derive from foreign earnings we have indefinitely reinvested in our foreign operations. We intend to meet our U.S. cash spending needs primarily through our existing U.S. cash balances, ongoing U.S. cash flows, and available credit under our term loan and revolving credit facilities. As of October 31, 2017, we had outstanding debt of $144.0 million, net of an immaterial amount of debt issuance costs, under our $150.0 million term loan facility, and no outstanding debt under our $650.0 million revolving credit facility. Should our cash spending needs in the U.S. rise and exceed these liquidity sources, we may be required to incur additional debt at higher than anticipated interest rates or access other funding sources, which could negatively affect our results of operations, capital structure or the market price of our common stock.
From time to time we are subject to claims that our products infringe on third-party intellectual property rights.
We are from time to time subject to claims alleging our infringement of third-party intellectual property rights, including patent rights. For example, we and Emulation & Verification Engineering S.A. (EVE), a company we acquired in October 2012, are party to ongoing patent infringement lawsuits involving Mentor Graphics Corporation. The jury in one of the lawsuits returned a verdict of approximately $36 million in assessed damages against us for patent infringement, and the court in the lawsuit has entered an injunction prohibiting certain sales activities relating to the features found by the jury to infringe. We have appealed from the injunction and the final judgment in the case. Further information regarding the EVE lawsuits is contained in Part I, Item 3, Legal Proceedings and Note 7 in the Notes to Consolidated Financial Statements under the heading "Legal Proceedings." In addition, under our customer agreements and other license agreements, we agree in many cases to indemnify our customers if our products infringe a third party's intellectual property rights. Infringement claims can result in costly and time-consuming litigation, require us to enter into royalty arrangements, subject us to damages or injunctions restricting our sale of products, invalidate a patent or family of patents, require us to refund license fees to our customers or to forgo future payments or require us to redesign certain of our products, any one of which could harm our business and operating results.
We may be subject to litigation proceedings that could harm our business.
We may be subject to legal claims or regulatory matters involving stockholder, consumer, employment, customer, supplier, competition, and other issues on a global basis. Litigation is subject to inherent uncertainties, and unfavorable rulings could occur. An unfavorable ruling could include monetary damages or, in cases for which injunctive relief is sought, an injunction prohibiting us from manufacturing or selling one or more products. If we were to receive an unfavorable ruling on a matter, our business and results of operations could be materially harmed. Further information regarding certain of these matters is contained in Part I, Item 3, Legal Proceedings .
Product errors or defects could expose us to liability and harm our reputation and we could lose market share.
Software products frequently contain errors or defects, especially when first introduced, when new versions are released, or when integrated with technologies developed by acquired companies. Product errors could affect the performance or interoperability of our products, could delay the development or release of new products or new versions of products and could adversely affect market acceptance or perception of our products. In addition, allegations of manufacturability issues resulting from use of our IP products could, even if untrue, adversely affect our reputation and our customers' willingness to license IP products from us. Any such errors or delays in releasing new products or new versions of products or allegations of unsatisfactory performance could cause us to lose customers, increase our service costs, subject us to liability for damages and divert our resources from other tasks, any one of which could materially and adversely affect our business and operating results.
21
Table of Contents
We may not be able to continue to obtain licenses to third-party software and intellectual property on reasonable terms or at all, which may disrupt our business and harm our financial results.
We license third-party software and other intellectual property for use in product research and development and, in several instances, for inclusion in our products. We also license third-party software, including the software of our competitors, to test the interoperability of our products with other industry products and in connection with our professional services. These licenses may need to be renegotiated or renewed from time to time, or we may need to obtain new licenses in the future. Third parties may stop adequately supporting or maintaining their technology, or they or their technology may be acquired by our competitors. If we are unable to obtain licenses to these third-party software and intellectual property on reasonable terms or at all, we may not be able to sell the affected products, our customers' use of the products may be interrupted, or our product development processes and professional services offerings may be disrupted, which could in turn harm our financial results, our customers, and our reputation.
The inclusion of third-party intellectual property in our products can also subject us and our customers to infringement claims. Although we seek to mitigate this risk contractually, we may not be able to sufficiently limit our potential liability. Regardless of outcome, infringement claims may require us to use significant resources and may divert management's attention.
Some of our products and technology, including those we acquire, may include software licensed under open source licenses. Some open source licenses could require us, under certain circumstances, to make available or grant licenses to any modifications or derivative works we create based on the open source software. Although we have tools and processes to monitor and restrict our use of open source software, the risks associated with open source usage may not be eliminated and may, if not properly addressed, result in unanticipated obligations that harm our business.
If we fail to timely recruit and retain senior management and key employees, our business may be harmed.
We depend in large part upon the services of key members of our senior management team to drive our future success. If we were to lose the services of any member of our senior management team, our business could be adversely affected. To be successful, we must also attract and retain key technical, sales and managerial employees, including those who join us in connection with acquisitions. There are a limited number of qualified EDA and IC design engineers, and competition for these individuals is intense and has increased. Our employees are often recruited aggressively by our competitors and our customers. Any failure to recruit and retain key technical, sales and managerial employees could harm our business, results of operations and financial condition. Additionally, efforts to recruit and retain qualified employees could be costly and negatively impact our operating expenses.
We issue stock options and restricted stock units and maintain employee stock purchase plans as a key component of our overall compensation. We face pressure to limit the use of such equity-based compensation due to its dilutive effect on stockholders. If we are unable to grant attractive equity-based packages in the future, it could limit our ability to attract and retain key employees.
Our business is subject to evolving corporate governance and public disclosure regulations that have increased both our compliance costs and the risk of noncompliance, which could have an adverse effect on our stock price.
We are subject to changing rules and regulations promulgated by a number of governmental and self-regulatory organizations, including the SEC, the NASDAQ Stock Market, and the FASB. These rules and regulations continue to evolve in scope and complexity and many new requirements have been created in response to laws enacted by Congress, making compliance more difficult and uncertain. For example, our efforts to comply with the Dodd-Frank Wall Street Reform and Consumer Protection Act and other regulations, including "conflict minerals" regulations affecting our hardware products, have resulted in, and are likely to continue to result in, increased general and administrative expenses and a diversion of management time and attention from revenue-generating activities to compliance activities.
There are inherent limitations on the effectiveness of our controls and compliance programs.
Regardless of how well designed and operated it is, a control system can provide only reasonable assurance that its objectives will be met. Further, the design of a control system must reflect the fact that there are resource constraints, and the benefits of controls must be considered relative to their costs. Because of the inherent limitations in all control systems, no evaluation of controls can provide absolute assurance that all control issues
22
Table of Contents
and instances of fraud, if any, have been detected. Moreover, although we have implemented compliance programs and compliance training for employees, such measures may not prevent our employees, contractors or agents from breaching or circumventing our policies or violating applicable laws and regulations. Failure of our control systems and compliance programs to prevent error, fraud or violations of law could have a material adverse impact on our business.
Our investment portfolio may be impaired by any deterioration of capital markets.
From time to time, our cash equivalent and short-term investment portfolio consists of investment-grade U.S. government agency securities, asset-backed securities, corporate debt securities, commercial paper, certificates of deposit, money market funds, municipal securities and other securities, and bank deposits. Our investment portfolio carries both interest rate risk and credit risk. Fixed rate debt securities may have their market value adversely impacted due to a credit downgrade or a rise in interest rates, while floating rate securities may produce less income than expected if interest rates fall or a credit downgrade occurs. As a result of capital pressures on certain banks, especially in Europe, and the continuing low interest rate environment, some of our financial instruments may become impaired.
Our future investment income may fall short of expectations due to changes in interest rates or if the decline in fair value of investments held by us is judged to be other-than-temporary. In addition, we may suffer losses in principal if we are forced to sell securities that decline in market value due to changes in the issuer's credit quality or changes in interest rates.
In preparing our financial statements we make certain assumptions, judgments and estimates that affect amounts reported in our consolidated financial statements, which, if not accurate, may significantly impact our financial results.
We make assumptions, judgments and estimates for a number of items, including the fair value of financial instruments, goodwill, long-lived assets and other intangible assets, the realizability of deferred tax assets, the recognition of revenue and the fair value of stock awards. We also make assumptions, judgments and estimates in determining the accruals for employee-related liabilities, including commissions and variable compensation, and in determining the accruals for uncertain tax positions, valuation allowances on deferred tax assets, allowances for doubtful accounts, and legal contingencies. These assumptions, judgments and estimates are drawn from historical experience and various other factors that we believe are reasonable under the circumstances as of the date of the consolidated financial statements. Actual results could differ materially from our estimates, and such differences could significantly impact our financial results.
Catastrophic events may disrupt our business and harm our operating results.
Due to the global nature of our business, our operating results may be negatively impacted by catastrophic events throughout the world. We rely on a global network of infrastructure applications, enterprise applications and technology systems for our development, marketing, operational, support and sales activities. A disruption or failure of these systems in the event of a major earthquake, fire, telecommunications failure, cybersecurity attack, terrorist attack, epidemic, or other catastrophic event could cause system interruptions, delays in our product development and loss of critical data and could prevent us from fulfilling our customers' orders. Moreover, our corporate headquarters, a significant portion of our research and development activities, our data centers, and certain other critical business operations are located in California, near major earthquake faults. A catastrophic event that results in the destruction or disruption of our data centers or our critical business or information technology systems would severely affect our ability to conduct normal business operations and, as a result, our operating results would be adversely affected
Item 1B. Unresolved Staff Comments |
None.
Item 2. Properties |
Our principal offices are located in two adjacent buildings in Mountain View, California, which together provide approximately 341,000 square feet of available space. This space is leased through August 2030, and we have two
23
Table of Contents
options to extend the lease term, the first to extend the term by ten years, followed by a second option to extend by approximately nine additional years. We also lease approximately 238,000 square feet of space in three separate buildings in Sunnyvale, California, with lease expiration dates ranging from September 2019 to October 2019. We own one building in Sunnyvale, California with approximately 120,000 square feet of space. These buildings in Mountain View and Sunnyvale are used for research and development, sales and support, marketing, and administrative activities.
We currently lease 33 other offices throughout the United States, and own 2 office buildings in Oregon, one of which is leased to a tenant. These offices are used primarily for sales and support activities as well as research and development.
International Facilities
We lease additional space for sales, service and research and development activities in approximately 29 countries throughout the world, including 25,000 square feet in Dublin, Ireland for our international headquarters, as well as significant sites in Yerevan, Armenia, Bangalore, India, and Shanghai, China. In addition, we own two buildings in Hsinchu, Taiwan with approximately 212,000 square feet of combined space.
We believe that our existing facilities, including both owned and leased properties, are in good condition and suitable for the current conduct of our business.
Item 3. Legal Proceedings |
We are subject to routine legal proceedings, as well as demands, claims and threatened litigation that arise in the normal course of our business. The ultimate outcome of any litigation is uncertain and unfavorable outcomes could have a negative impact on our results of operations and financial condition. Regardless of outcome, litigation can have an adverse impact on Synopsys because of defense costs, diversion of management resources and other factors.
Mentor Patent Litigation
We are engaged in complex patent litigation with Mentor Graphics Corporation (Mentor) involving several actions in different forums. We succeeded to the litigation when we acquired Emulation & Verification Engineering S.A. (EVE) on October 4, 2012. At the time of the acquisition, EVE and EVE-USA, Inc. (collectively, the EVE Parties) had been defendants in three patent infringement lawsuits filed by Mentor. Each lawsuit as well as subsequent lawsuits are further described below.
Background
As mentioned above, at the time of the acquisition, the EVE Parties had been defendants in three patent infringement lawsuits filed by Mentor. Mentor filed suit against the EVE Parties in federal district court in the District of Oregon on August 16, 2010 alleging that EVE's ZeBu products infringed Mentor's United States Patent No. 6,876,962. Mentor filed an additional suit in federal district court in the District of Oregon on August 17, 2012 alleging that EVE's ZeBu products infringed Mentor's United States Patent No. 6,947,882. Both cases sought damages and a permanent injunction. Mentor also filed a patent infringement lawsuit against Nihon EVE K.K. in Tokyo District Court in 2010 alleging that certain ZeBu products infringe Mentor's Japanese Patent No. P3,588,324. The litigation matter in Japan no longer exists, as the Japan IP High Court affirmed the Tokyo District Court ruling that such products did not infringe Mentor's patent.
On September 27, 2012, Synopsys and the EVE Parties filed an action for declaratory relief against Mentor in federal district court in the Northern District of California, seeking a determination that Mentor's United States Patents Nos. 6,009,531, 5,649,176, and 6,240,376, which were the subject of a patent infringement lawsuit filed by Mentor against EVE in 2006 and settled in the same year, are invalid and not infringed by EVE's products. Mentor asserted patent infringement counterclaims in this action based on the same three patents and sought damages and a permanent injunction. In April 2013, this action was transferred to the federal district court in Oregon and consolidated with the two Mentor lawsuits in that district (the Oregon Action), as further described below.
The Oregon Action
24
Table of Contents
After transfer of Synopsys' declaratory relief action to Oregon and consolidation of that action with Mentor's 2010 and 2012 lawsuits, Synopsys asserted patent infringement counterclaims against Mentor based on Synopsys' United States Patents Nos. 6,132,109 and 7,069,526, seeking damages and a permanent injunction. After pre-trial summary judgment rulings in favor of both sides, the only patent remaining at issue in the Oregon Action was Mentor's ‘376 patent.
The Oregon Action went to trial on the remaining Mentor patent, and a jury reached a verdict on October 10, 2014 finding that certain features of the ZeBu products infringed the ‘376 patent and assessing damages of approximately $36 million. On March 12, 2015, the court entered an injunction prohibiting certain sales activities relating to the features found by the jury to infringe. Synopsys released a new version of ZeBu software that does not include such features. Synopsys accrued an immaterial amount as a loss contingency in the year ended October 31, 2015. Both parties appealed from the court's judgment following the jury verdict.
The Federal Circuit heard the parties' respective appeals and issued a decision on March 16, 2017. The panel affirmed the jury verdict and damages award on Mentor's ‘376 patent and reversed the district court's dismissal of Mentor's ‘176, ‘531 and ‘882 patents and Synopsys' ‘109 patent. Due to the affirmation of the verdict by the Federal Circuit, the Company accrued an aggregate amount of $39.0 million as a loss contingency, which is the amount estimated to be the probable loss. The associated charge has been recorded in general and administrative expenses in the income statements for the year ended October 31, 2017.
Proceedings on these patents are resuming in the federal district court in Oregon, including trial of alleged supplemental damages on and willful infringement of the ‘376 patent. On May 1, 2017, Synopsys petitioned for rehearing by all judges currently sitting on the Federal Circuit. On September 1, 2017, the Federal Circuit denied Synopsys' petition for rehearing. On November 30, 2017, Synopsys filed a petition for certiorari with the U.S. Supreme Court seeking review of the Federal Circuit's ruling.
The California Action
On December 21, 2012, Synopsys filed an action for patent infringement against Mentor in federal district court in the Northern District of California, alleging that Mentor's Veloce products infringe Synopsys' United States Patents Nos. 5,748,488, 5,530,841, 5,680,318 and 6,836,420 (the California Action). This case sought damages and a permanent injunction. The court stayed the action as to the ‘420 patent pending the U.S. Patent and Trademark Office's inter partes review of that patent and appeals from that proceeding. On January 20, 2015, the court granted Mentor's motion for summary judgment on the '488, '841, and '318 patents, finding that such patents were invalid. Synopsys appealed the court's ruling and on October 17, 2016, the Federal Circuit affirmed the district court's decision. Synopsys sought review of the Federal Circuit's ruling in the U.S. Supreme Court, and on October 2, 2017, the U.S. Supreme Court denied Synopsys' petition.
PTO Proceedings
On September 26, 2012, Synopsys filed two inter partes review requests with the U.S. Patent and Trademark Office (the PTO) challenging the validity of Mentor's ‘376 and ‘882 patents. The PTO granted review of the ‘376 patent and denied review of the ‘882 patent. On February 19, 2014, the PTO issued its final decision in the review of the ‘376 patent, finding some of the challenged claims invalid and some of the challenged claims valid. On April 22, 2014, Synopsys appealed to the Federal Circuit from the PTO's decision finding certain claims valid. Mentor filed a cross-appeal on May 2, 2014 from the PTO's decision finding certain claims invalid. On February 10, 2016, the Federal Circuit affirmed the PTO's decision in all respects.
On December 21, 2013, Mentor filed an inter partes review request with the PTO challenging the validity of Synopsys' ‘420 patent. On June 11, 2015, the PTO issued its final decision in the review, finding all of the challenged claims invalid. On August 12, 2015, Synopsys appealed to the Federal Circuit from the PTO's decision. On October 11, 2016, the Federal Circuit affirmed the PTO's decision.
On September 30, 2016, Synopsys filed a petition requesting ex parte reexamination of all of the claims of the ‘376 patent asserted in the Oregon Action. Mentor objected on procedural grounds. On November 8, 2016, the PTO instituted reexamination of the ‘376 patent. On December 15, 2016, the PTO vacated its decision to institute reexamination based upon Mentor's procedural objection. Synopsys thereafter filed a renewed request for ex parte reexamination of only claims 24, 26 and 27 of the patent, which was granted by the PTO in February 2017. On May 2, 2017, Synopsys also sued the PTO in federal district court in the Eastern District of Virginia, challenging the PTO's decision not to institute reexamination of claims 1 and 28. On July 28, 2017, cross-motions for summary
25
Table of Contents
judgment were argued, and Synopsys' suit challenging the PTO's decision not to reexamine claims 1 and 28 was dismissed on November 15, 2017. The ex parte reexamination is ongoing.
On May 22, 2017, Synopsys petitioned for ex parte reexamination of certain claims of the ‘882 patent. On June 20, 2017, the PTO instituted reexamination on all of the challenged claims and on October 23, 2017 rejected the challenged claims of the ‘882 patent. The ex parte reexamination and the lawsuit are ongoing.
Further information regarding the accounting impact on Synopsys with respect to the patent litigation with Mentor is contained in Note 7 in the Notes to Consolidated Financial Statements under the heading "Legal Proceedings."
Other Proceedings
In July 2017, the Hungarian Tax Authority (HTA) issued a final assessment against Synopsys' Hungarian subsidiary (Synopsys Hungary) for fiscal years 2011 through 2013. The HTA has disallowed Synopsys Hungary's tax positions taken during these years regarding the timing of the deduction of research expenses and applied withholding taxes on certain payments made to affiliates, resulting in an aggregate tax assessment of approximately $47 million and interest and penalties of over $18 million (at current exchange rates). On August 2, 2017, Synopsys Hungary filed a claim contesting the final assessment with the Hungarian Administrative Court. On November 16, 2017, Synopsys Hungary paid the assessment, while continuing its challenge to the assessment in court. A hearing is scheduled for February 23, 2018.
Item 4. Mine Safety Disclosures |
Not applicable.
26
Table of Contents
PART II
Item 5. Market for Registrant's Common Equity, Related Stockholder Matters and Issuer Purchases of Equity Securities |
Common Stock Market Price
Our common stock trades on the NASDAQ Global Select Market under the symbol "SNPS." The following table sets forth for the periods indicated the high and low sale prices of our common stock, as reported by the NASDAQ Global Select Market.
| Quarter Ended | ||||||||||||||
| January 31, |
| April 30, |
| July 31, |
| October 31, | ||||||||
2017 |
|
|
|
|
|
|
| ||||||||
High | $ | 62.68 | |
| $ | 73.85 | |
| $ | 76.69 | |
| $ | 87.19 | |
Low | $ | 56.84 | |
| $ | 62.62 | |
| $ | 70.93 | |
| $ | 75.65 | |
2016 |
|
|
|
|
|
|
| ||||||||
High | $ | 52.52 | |
| $ | 49.28 | |
| $ | 54.91 | |
| $ | 60.56 | |
Low | $ | 40.53 | |
| $ | 40.96 | |
| $ | 47.45 | |
| $ | 54.13 | |
As of December 11 , 2017, we had 296 stockholders of record. To date, we have paid no cash dividends on our capital stock and have no current intention to do so.
27
Table of Contents
Performance Graph
The following graph compares the five-year total return to stockholders of our common stock relative to the cumulative total returns of the S&P 500 Index, the S&P Information Technology Index and the NASDAQ Composite Index. The graph assumes that $100 was invested in Synopsys common stock on October 27, 2012 (the last trading day before the beginning of our fifth preceding fiscal year) and in each of the indexes on October 27, 2012 (the closest month end) and that all dividends were reinvested. No cash dividends were declared on our common stock during such time. The comparisons in the table are not intended to forecast or be indicative of possible future performance of our common stock.
COMPARISON OF 5 YEAR CUMULATIVE TOTAL RETURN*
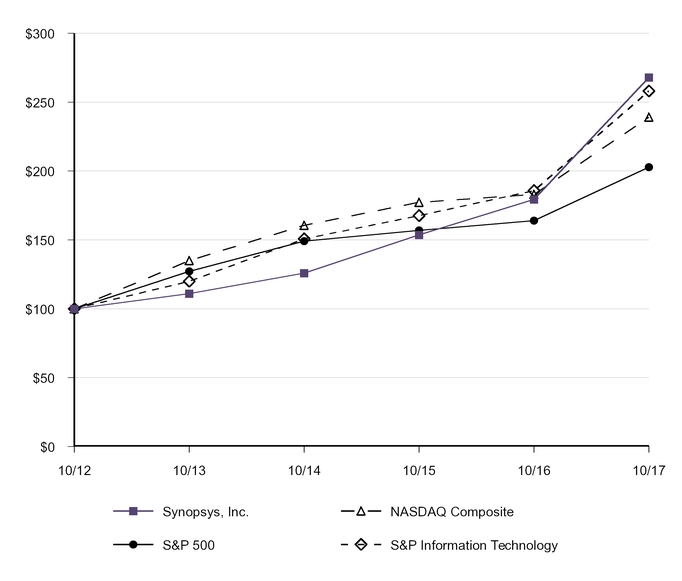
*$100 invested on 10/27/12 in stock or index, including reinvestment of dividends. |
The information presented above in the stock performance graph shall not be deemed to be "soliciting material" or to be "filed" with the SEC or subject to Regulation 14A or 14C, except to the extent that we subsequently specifically request that such information be treated as soliciting material or specifically incorporate it by reference into a filing under the Securities Act or Exchange Act.
28
Table of Contents
Stock Repurchase Program
Our Board of Directors (Board) previously approved a stock repurchase program pursuant to which we were authorized to purchase up to $500.0 million of our common stock, and has periodically replenished the stock repurchase program to such amount. Our Board replenished the stock repurchase program up to $500.0 million on June 15, 2017. The program does not obligate us to acquire any particular amount of common stock, and the program may be suspended or terminated at any time by our Chief Financial Officer or our Board. We repurchase shares to offset dilution caused by ongoing stock issuances from existing equity plans for equity compensation awards and issuances related to acquisitions, and when management believes it is a good use of cash. Repurchases are transacted in accordance with Rule 10b-18 of the Securities Exchange Act of 1934, as amended (the Exchange Act) and may be made through any means including, but not limited to, open market purchases, plans executed under Rule 10b5-1(c) of the Exchange Act and structured transactions. As of October 31, 2017 , $400 million remained available for further repurchases under the program.
In September 2017, we entered into an accelerated share repurchase agreement (the September 2017 ASR) to repurchase an aggregate of $100.0 million of our common stock. Pursuant to the September 2017 ASR, we made a prepayment of $100.0 million and received initial share deliveries valued at $80.0 million . The remaining balance of $20.0 million was settled in November 2017. Total shares purchased under the September 2017 ASR were approximately 1.2 million shares, at an average purchase price of $83.80 per share.
In December 2017, we entered into two simultaneous accelerated share repurchase agreements (the December 2017 ASRs) to repurchase an aggregate of $200.0 million of our common stock. Pursuant to the December 2017 ASRs, we will make a prepayment of $200.0 million to receive initial share deliveries of shares valued at $160.0 million. The remaining balance of $40.0 million is anticipated to be settled on or before May 16, 2018, upon completion of the repurchase. Under the terms of the December 2017 ASRs, the specific number of shares that we ultimately repurchase will be based on the volume-weighted average share price of our common stock during the repurchase period, less a discount.
The table below sets forth information regarding our repurchases of our common stock during the three months ended October 31, 2017 :
Period | Total number of shares purchased (1) |
| Average price paid per share (1) |
| Total number of shares purchased as part of publicly announced programs |
| Maximum dollar value of shares that may yet be purchased under the programs | ||||||
Month #1 |
|
|
|
|
|
|
| ||||||
July 30, 2017 through September 2, 2017 | - | |
| $ | - | |
| - | |
| $ | 500,000,000 | |
Month #2 |
|
|
|
|
|
|
| ||||||
September 3, 2017 through September 30, 2017(2) | 1,011,378 | |
| $ | 79.10 | |
| 1,011,378 | |
| $ | 400,000,000 | |
Month #3 |
|
|
|
|
|
|
| ||||||
October 1, 2017 through October 28, 2017 | - | |
| $ | - | |
| - | |
| $ | 400,000,000 | |
Total | 1,011,378 | |
| $ | 79.10 | |
| 1,011,378 | |
| $ | 400,000,000 | |
(1) | Amounts are calculated based on the trade date. |
(2) | The number of shares purchased and average purchase price paid per share does not include the 181,988 shares and $20.0 million equity forward contract, respectively, from the September 2017 ASR settled in November 2017. |
See Note 9 of Notes to Consolidated Financial Statements for further information regarding our stock repurchase program.
29
Table of Contents
Item 6. Selected Financial Data |
| Fiscal Year Ended October 31,(1) | ||||||||||||||||||
| 2017 |
| 2016 |
| 2015 |
| 2014 |
| 2013 | ||||||||||
| (in thousands, except per share data) | ||||||||||||||||||
Revenue | $ | 2,724,880 | |
| $ | 2,422,532 | |
| $ | 2,242,211 | |
| $ | 2,057,472 | |
| $ | 1,962,214 | |
Income before provisions for income taxes | 383,098 | |
| 329,548 | |
| 281,610 | |
| 272,142 | |
| 275,666 | | |||||
Provision (benefit) for income taxes(2) | 246,535 | |
| 62,722 | |
| 55,676 | |
| 13,018 | |
| 27,866 | | |||||
Net income | 136,563 | |
| 266,826 | |
| 225,934 | |
| 259,124 | |
| 247,800 | | |||||
Net income per share: |
|
|
|
|
|
|
|
|
| ||||||||||
Basic | 0.91 | |
| 1.76 | |
| 1.46 | |
| 1.67 | |
| 1.62 | | |||||
Diluted | 0.88 | |
| 1.73 | |
| 1.43 | |
| 1.64 | |
| 1.58 | | |||||
Working capital(3) | 68,484 | |
| 1,992 | |
| (109,546 | ) |
| 6,527 | |
| 133,000 | | |||||
Total assets | 5,396,414 | |
| 5,240,365 | |
| 5,045,739 | |
| 4,775,499 | |
| 4,358,935 | | |||||
Long-term debt | 134,063 | |
| - | |
| - | |
| 45,000 | |
| 75,000 | | |||||
Stockholders' equity | 3,279,724 | |
| 3,195,146 | |
| 3,133,989 | |
| 3,056,170 | |
| 2,788,277 | | |||||
(1) | Our fiscal year ends on the Saturday nearest to October 31 and consists of 52 weeks, with the exception that approximately every five years, we have a 53-week year. Fiscal 2017 , 2016 , 2015 , 2014 , and 2013 were 52-week years ending on October 28, 2017, October 29, 2016, October 31, 2015, November 1, 2014, and November 2, 2013, respectively. |
(2) | Includes $7.1 million , $16.5 million , $6.3 million , $19.6 million , and $1.1 million in net tax benefits from tax settlements received in fiscal years 2017 , 2016 , 2015 , 2014 , and 2013 , respectively. Fiscal 2017 additionally includes a $166.2 million impact from our repatriation of foreign earnings. See Note 11 of Notes to Consolidated Financial Statements . |
(3) | Includes reclassifications of deferred tax assets and liabilities for fiscal years 2013 through 2015 related to ASU 2015-17 "Income Taxes (Topic 740): Balance Sheet Classification of Deferred Taxes." See Note 11 of Notes to Consolidated Financial Statements . |
Item 7. Management's Discussion and Analysis of Financial Condition and Results of Operations |
Overview
The following summary of our financial condition and results of operations is qualified in its entirety by the more complete discussion contained in this Item 7 and by the risk factors set forth in Item 1A of this Annual Report. Please also see the cautionary language at the beginning of Part I of this Annual Report regarding forward-looking statements.
Business Summary
Synopsys, Inc. provides software, intellectual property, and services used by designers across the entire silicon to
software spectrum, from engineers creating advanced semiconductors to software developers seeking to ensure
the security and quality of their applications. We are a global leader in supplying the electronic design automation
(EDA) software that engineers use to design and test integrated circuits (ICs), also known as chips. We also offer intellectual property (IP) products, which are pre-designed circuits that engineers use as components of larger chip designs rather than design those circuits themselves. We provide software and hardware used to develop the electronic systems that incorporate chips and the software that runs on them. To complement these offerings, we provide technical services and support to help our customers develop advanced chips and electronic systems. We are also a leading provider of software tools and services that are used to improve the security and quality of software code in a wide variety of industries, including electronics, financial services, media, automotive, medicine, energy and industrials.
30
Table of Contents
Our EDA and IP customers are generally semiconductor and electronics systems companies. Our solutions help these companies overcome the challenges of developing increasingly advanced electronics products while also helping them reduce their design and manufacturing costs. While our products are an important part of our customers' development process, their research and development budget and spending decisions may be affected by their business outlook and willingness to invest in new and increasingly complex chip designs. In addition, a number of consolidations have taken place in the semiconductor industry over the past several years. While we do not believe customer consolidations have had a material impact on our results, the future impact of ongoing consolidation is uncertain. For a discussion of potential risks, please see the risk factor titled "Consolidation among our customers and within the industries in which we operate, as well as our dependence on a relatively small number of large customers, may negatively impact our operating results" in Part I, Item 1A, Risk Factors .
Despite global economic uncertainty, we have consistently grown our revenue since 2005. We achieved these results not only because of our solid execution, leading technologies and strong customer relationships, but also because of our time-based revenue business model. Under this model, a substantial majority of our customers pay over time and we typically recognize this revenue over the life of the contract, which averages approximately three years. Time-based revenue consists of time-based products, maintenance and service revenue. The revenue we recognize in a particular period generally results from selling efforts in prior periods rather than the current period. Due to our business model, decreases as well as increases in customer spending do not immediately affect our revenues in a significant way.
Our growth strategy is based on building on our leadership in our EDA products, expanding and proliferating our IP offerings, and driving growth in the software security and quality market. As we continue to expand our product portfolio and our total addressable market, for instance in the software security and quality space, and as hardware product sales grow, we expect to experience increased variability in our total revenue, though we expect time-based revenue to continue to represent at least 90% of all revenue other than hardware revenue. Overall, our business outlook remains solid based on our leading technologies, customer relationships, business model, diligent expense management, and acquisition strategy. We believe that these factors will help us continue to execute our strategies successfully.
Fiscal Year End
Our fiscal year ends on the Saturday nearest to October 31 and consists of 52 weeks, with the exception that approximately every five years, we have a 53-week year. Fiscal 2017 , 2016 , and 2015 were 52-week years ending on October 28, 2017, October 29, 2016, and October 31, 2015, respectively. Fiscal 2018 will be a 53-week year.
For presentation purposes, this Form 10-K refers to the closest calendar month end.
Fiscal 2017 Financial Performance Summary
In fiscal 2017 , compared to fiscal 2016 , our financial performance reflects the following:
• | Revenues were $2.7 billion, an increase of $302.3 million or 12%, primarily driven by the overall growth in our business mainly due to higher TSL revenues, hardware sales, and professional services revenue. |
• | Total cost of revenue and operating expenses were $2.4 billion, an increase of $272.2 million or 13%, primarily due to increases in headcount, including those from acquisitions. |
• | Higher operating income of $347.6 million, an increase of $30.2 million or 10%. |
During fiscal 2017, 88% of our revenue was time-based.
Effect of New Accounting Pronouncements Not Yet Adopted
In May 2014, the Financial Accounting Standards Board (FASB) issued Accounting Standards Update (ASU) 2014-09, "Revenue from Contracts with Customers (Topic 606)," which supersedes the revenue recognition requirements in "Revenue Recognition (Topic 605)." This ASU requires an entity to recognize revenue when goods are transferred or services are provided to customers in an amount that reflects the consideration to which the entity expects to be entitled to in exchange for those goods or services. This ASU also requires disclosures enabling users of financial statements to understand the nature, amount, timing, and uncertainty of revenue and cash flows arising from contracts with customers.
31
Table of Contents
Since the issuance of Topic 606, the FASB has issued several amendments to the ASU, including deferral of the adoption date initially proposed, clarification on accounting for licenses of intellectual property, and identifying performance obligations.
Topic 606 will be effective for us beginning in fiscal 2019, including interim periods within that reporting period. The ASU permits two retrospective methods for adoption. We will adopt Topic 606 using the modified retrospective method under which the cumulative effect of initially applying the guidance is recognized at the date of initial application.
Under the modified retrospective transition method, we will evaluate each contract that is effective on the adoption date as if that contract had been accounted for under Topic 606 from contract inception. Some revenue that would have been recognized in future periods under Topic 605 will be recast under Topic 606 as if the revenue had been recognized in prior periods. As this transition method requires that we do not adjust historical reported revenue amounts, the revenue that would have been recognized under this method prior to the adoption date will be a cumulative catch up adjustment to retained earnings and will not be recognized as revenue in future periods as previously planned. Because we expect that a slightly lower percentage of our revenue will be recognized over time under Topic 606, we expect to have a small percentage of our year-end backlog to be adjusted to retained earnings upon adoption.
We derive the majority of our total revenue from Technology Subscription License (TSL) contracts. We believe that the promised licenses of software (i.e., functional intellectual property) and the promise to provide substantive, timely, and technologically relevant updates and services in our TSL contracts reflect inputs to a combined item that represents a single overall promise to provide customer access to a suite of EDA software in an integrated solution that will evolve as our customers' industries evolve through rapid technology changes. Accordingly, we have concluded that this single overall promise will be recognized as revenue over the term of the contract period. Accordingly, we expect that there will be not be a material change in the nature and timing of revenue recognition for our TSL contracts under Topic 606.
The timing of revenue recognition for our upfront products, maintenance and professional services is expected to remain substantially unchanged.
We continue to assess all potential impacts of Topic 606 on other multiple element software arrangements that combine many software-related deliverables. As the requirement to have VSOE for undelivered elements is not necessary to separate revenue from delivered software licenses, which is an essential criterion for separation under the current revenue standard, revenue would no longer be recognized over the arrangement period for certain of our term licenses and IP licenses. We are currently in the process of evaluating the impact of these changes on the remainder of our arrangements.
Topic 606 also requires the deferral of incremental costs of obtaining a contract with a customer. This will require us to capitalize incremental costs such as commissions and other costs directly related to obtaining customer contracts and amortize those costs over the period the assets are expected to contribute future cash flows. As commissions paid for renewals are commensurate with the amounts paid for initial contracts, the deferred incremental costs will be recognized over the contract term. Under the existing rules, we expense commissions based on shipments.
In February 2016, the FASB issued ASU 2016-2, "Leases (Topic 842)," which supersedes the lease requirements in "Leases (Topic 840)." This ASU requires a lessee to recognize a right-of-use asset and a lease payment liability for most leases in the Consolidated Statement of Financial Position. This ASU also makes some changes to lessor accounting and aligns with the new revenue recognition guidance. This ASU will be effective for fiscal 2020, including interim periods within that reporting period, and earlier adoption is permitted. We are currently in the process of evaluating the impact of adoption on our consolidated financial statements and related disclosures.
In October 2016, the FASB issued ASU 2016-16, "Income Taxes (Topic 740), Intra-Entity Transfers of Assets Other Than Inventory." This ASU requires the immediate recognition of current and deferred income tax effects of intra-entity transfers of assets other than inventory. This ASU will be effective for fiscal 2019, including interim periods within that reporting period, and earlier adoption is permitted. We are currently in the process of evaluating the impact of adoption on our consolidated financial statements.
In August 2017, the FASB issued ASU 2017-12, "Derivatives and Hedging (Topic 815), Targeted Improvements to Accounting for Hedging Activities." This ASU requires expanded hedge accounting for risk components and refining the measurement of hedge results to better reflect an entity's hedging strategies. This ASU also amends the presentation and disclosure requirements and changes how entities assess hedge effectiveness. This ASU will be
32
Table of Contents
effective for fiscal 2020, including interim periods within that reporting period, and earlier adoption is permitted. We are currently in the process of evaluating the impact of adoption on our consolidated financial statements.
Critical Accounting Policies and Estimates
Our discussion and analysis of our financial results under Results of Operations below are based on our audited results of operations, which we have prepared in accordance with U.S. GAAP. In preparing these financial statements, we make assumptions, judgments and estimates that can affect the reported amounts of assets, liabilities, revenues and expenses, and net income. On an ongoing basis, we evaluate our estimates based on historical experience and various other assumptions we believe are reasonable under the circumstances. Our actual results may differ from these estimates. For further information on our significant accounting policies, see Note 2 of Notes to Consolidated Financial Statements .
The accounting policies that most frequently require us to make assumptions, judgments and estimates, and therefore are critical to understanding our results of operations, are:
• | Revenue recognition; |
• | Valuation of business combinations; |
• | Valuation of intangible assets; and |
• | Income taxes. |
Revenue Recognition
We generate our revenue from the sale of products that include software licenses, maintenance and services, and to a lesser extent, hardware products. Software license revenue consists of fees associated with the licensing of our software. Maintenance and service revenue consists of maintenance fees associated with perpetual licenses and hardware products, and professional services fees. Hardware revenue consists of sales of Field Programmable Gate Array (FPGA)-based emulation and prototyping products.
Most of our customer arrangements are complex, involving hundreds of products and various license rights, bundled with post-contract customer support and additional meaningful rights that provide a complete end-to-end solution to the customer. Throughout the contract, our customers are typically using a myriad of products to complete each phase of a chip design and are concurrently working on multiple chip designs, or projects, in different phases of the design. During this time, the customer looks to us to release state-of-the-art technology as we keep up with the pace of change, to address requested enhancements to our tools to meet customer specifications, to provide support at each stage of the customer's design, including the final manufacturing of the chip (the tape-out stage), and other important services.
With respect to software licenses, we primarily utilize two license types:
• | Technology Subscription Licenses (TSLs). TSLs are time-based licenses for a finite term, and generally provide the customer limited rights to receive, or to exchange certain quantities of licensed software for, unspecified future technology. The majority of our arrangements are TSLs due to the nature of the business and customer requirements. In addition to the licenses, the arrangements also include: post-contract customer support, which includes providing frequent updates and upgrades to maintain the utility of the software due to rapid changes in technology; other intertwined services such as multiple copies of the tools; assisting our customers in applying our technology in their development environment; and rights to remix licenses for other licenses. |
• | Perpetual licenses. Perpetual licenses continue as long as the customer renews maintenance plus an additional 20 years. Perpetual licenses do not provide the customer any rights to receive, or to exchange licensed software for, unspecified future technology. Customers purchase maintenance separately for the first year and may renew annually. |
For the two software license types, we recognize revenue as follows:
• | TSLs. We typically recognize revenue from TSL fees ratably over the term of the license period, or as customer installments become due and payable, whichever is later. Revenue attributable to TSLs is reported as "time-based products revenue" in the consolidated statements of operations. |
• | Perpetual licenses. We recognize revenue from perpetual licenses in full upon shipment of the software if payment terms require the customer to pay at least 75% of the license fee and 100% of the maintenance fee within one year from shipment and all other revenue recognition criteria are |
33
Table of Contents
met. Revenue attributable to these perpetual licenses is reported as "upfront products revenue" in the consolidated statements of operations. For perpetual licenses in which less than 75% of the license fee and 100% of the maintenance fee is payable within one year from shipment, we recognize revenue as customer installments become due and payable. Such revenue is reported as "time-based products revenue" in the consolidated statements of operations.
Our maintenance and service revenue consists of maintenance fees associated with perpetual licenses and hardware products, and professional services fees. We recognize revenue from maintenance arrangements ratably over the maintenance period to the extent cash has been received or fees become due and payable, and recognize revenue from professional services and training fees as such services are performed and accepted by the customers as needed. Revenue attributable to maintenance, professional services and training is reported as "maintenance and service revenue" in the consolidated statements of operations.
Hardware revenue consists of sales of FPGA-based emulation and prototyping products. We recognize revenue from sales of hardware products in full upon shipment if all other revenue recognition criteria are met. Revenue attributable to these sales is reported as "upfront products revenue" in the consolidated statements of operations.
We also enter into arrangements in which portions of revenue are contingent upon the occurrence of uncertain future events, for example, royalty arrangements. We refer to this revenue as "contingent revenue." Contingent revenue is recognized if and when the event that removes the contingency occurs. Such revenue is reported as "time-based products revenue" in the consolidated statements of operations. These arrangements are not material to our total revenue.
We infrequently enter into multiple-element arrangements that contain both software and non-software deliverables such as hardware. We have determined that the software and non-software deliverables in our contracts are separate units of accounting. We recognize revenue for the separate units of accounting when all revenue recognition criteria are met. Revenue allocated to hardware units of accounting is recognized upon shipment when all other revenue recognition criteria are met. Revenue allocated to software units of accounting is recognized depending on the software license type (TSL or perpetual license). Such arrangements have not had a material effect on our consolidated financial statements and are not expected to have a material effect in future periods.
We also enter into arrangements to deliver software products, either alone or together with other products or services, that require significant modification or customization of the software. We account for such arrangements using the percentage of completion method as we have the ability to make reasonably dependable estimates that relate to the extent of progress toward completion, contract revenues and costs. We measure the progress towards completion using the labor hours incurred to complete the project. Revenue attributable to these arrangements is reported as "maintenance and service revenue" in the consolidated statements of operations.
We determine the fair value of each element in multiple element software arrangements that only contain software and software-related deliverables based on vendor-specific objective evidence (VSOE). We limit our assessment of VSOE of fair value for each element to the price charged when such element is sold separately. We have analyzed all of the elements included in our multiple-element software arrangements and have determined that we have sufficient VSOE to allocate revenue to the maintenance components of our perpetual license products and to professional services. Accordingly, assuming all other revenue recognition criteria are met, we recognize license revenue from perpetual licenses upon delivery using the residual method, recognize revenue from maintenance ratably over the maintenance term, and recognize revenue from professional services as services are performed and accepted by the customer. With respect to TSL arrangements, due to the complexity of the tools, the complexity of the arrangement terms and intertwined services, the license, maintenance and other services are not separable and are considered as a combined unit. Additionally, we do not have sufficient VSOE of fair value to allocate the fee between these services. Therefore, we recognize revenue from TSLs ratably over the term of the license, assuming all other revenue recognition criteria are met.
Revenue recognition involves certain judgment; specifically, in connection with each transaction involving our products, we must evaluate whether: (1) persuasive evidence of an arrangement exists, (2) delivery of software or services has occurred, (3) the fee for such software or services is fixed or determinable, and (4) collectability of the full license or service fee is probable. All four of these criteria must be met in order for us to recognize revenue with respect to a particular arrangement. We apply these revenue recognition criteria as follows:
• | Persuasive Evidence of an Arrangement Exists. Prior to recognizing revenue on an arrangement, our customary policy is to have a written contract, signed by both the customer and by us, or a |
34
Table of Contents
purchase order from those customers that have previously negotiated a standard end-user license arrangement or purchase agreement.
• | Delivery Has Occurred. We deliver our products to our customers electronically or physically. For electronic deliveries, delivery occurs when we provide access to our customers to take immediate possession of the software through downloading it to the customer's hardware. For physical deliveries, the standard transfer terms are typically Freight on Board (FOB) shipping point. We generally ship our products or license keys promptly after acceptance of customer orders. However, a number of factors can affect the timing of product shipments and, as a result, timing of revenue recognition, including the delivery dates requested by customers and our operational capacity to fulfill product orders at the end of a fiscal quarter. |
• | The Fee Is Fixed or Determinable. Our determination that an arrangement fee is fixed or determinable depends principally on the arrangement's payment terms. Our standard payment terms for perpetual licenses require 75% or more of the license fee and 100% of the maintenance fee to be paid within one year. If the arrangement includes these terms, we regard the fee as fixed or determinable, and recognize all license revenue under the arrangement in full upon delivery (assuming all other revenue recognition criteria are met). If the arrangement does not include these terms, we do not consider the fee to be fixed or determinable and generally recognize revenue when customer installments are due and payable. In the case of a TSL, because of the right to exchange products or receive unspecified future technology and because VSOE for maintenance services does not exist for a TSL, we recognize revenue ratably over the term of the license, but not in advance of when customers' installments become due and payable. |
• | Collectability Is Probable. We judge collectability of the arrangement fees on a customer-by-customer basis pursuant to our credit review policy. We typically sell to customers with whom we have a history of successful collection. For a new customer, or when an existing customer substantially expands its commitments, we evaluate the customer's financial position and ability to pay and typically assign a credit limit based on that review. We increase the credit limit only after we have established a successful collection history with the customer. If we determine at any time that collectability is not probable under a particular arrangement based upon our credit review process or the customer's payment history, we recognize revenue under that arrangement as customer payments are actually received. |
Valuation of Business Combinations
We are required to allocate the purchase price to tangible assets, liabilities and contingencies assumed, and intangible assets acquired in a business combination. Any residual purchase price is recorded as goodwill. The allocation of the purchase price requires management to make estimates in determining the fair values of assets acquired and liabilities assumed, especially with respect to intangible assets which are amortized over various estimated useful lives. Our estimates may include, but are not limited to, future cash flows of an acquired business, the appropriate discounted rate, and the cost savings expected to be derived from an acquisition. These estimates are inherently difficult, subjective and unpredictable, and if different estimates were used, the purchase price allocation to the acquired assets and liabilities could be different. In addition, we make judgments and estimates when we assign useful lives to intangible assets identified as part of our acquisitions. These estimates are also inherently uncertain and if we used different estimates, the useful life over which we amortize intangible assets would be different. Therefore, our assessment of the estimated fair value of each of these assets and liabilities can have a material effect on our consolidated financial statements.
Valuation of Intangible Assets
We evaluate our intangible assets for indications of impairment whenever events or changes in circumstances indicate that the carrying value may not be recoverable. Intangible assets consist of purchased technology, contract rights intangibles, customer relationships, trademarks and trade names, covenants not to compete, capitalized software development, and in-process research and development. Factors that could trigger an impairment review include significant under-performance relative to expected historical or projected future operating results, significant changes in the manner of our use of the acquired assets or the strategy for our overall business or significant negative industry or economic trends. If this evaluation indicates that the value of the intangible asset may be impaired, we make an assessment of the recoverability of the net carrying value of the asset over its remaining useful life. If this assessment indicates that the intangible asset is not recoverable, based on the estimated undiscounted future cash flows of the technology over the remaining useful life, we reduce the net carrying value of the related intangible asset to fair value. Any such impairment charge could be significant and could have a material
35
Table of Contents
adverse effect on our reported financial results. We did not record any impairment charges on our intangible assets during fiscal 2017 , 2016 or 2015 .
Income Taxes
Our estimates and assumptions made in our tax provisions may differ from the actual results as reflected in our income tax returns and we record the required adjustments when they are identified or resolved.
We recognize deferred tax assets and liabilities for the temporary differences between the book and tax bases of assets and liabilities using enacted tax rates in effect for the year in which we expect the differences to reverse, and for tax loss and credit carryovers. We record a valuation allowance to reduce the deferred tax assets to the amount that is more likely than not to be realized. In evaluating our ability to utilize our deferred tax assets, we consider all available positive and negative evidence, including our past operating results, our forecast of future taxable income on a jurisdiction by jurisdiction basis, as well as feasible and prudent tax planning strategies. These assumptions require judgment about the forecasts of future taxable income and are consistent with the plans and estimates we are using to manage the underlying businesses. We believe that the net deferred tax assets of approximately $236.3 million, which are recorded on our balance sheet as of October 31, 2017 based on current tax law, will ultimately be realized. However, if we determine in the future that it is more likely than not we will not be able to realize a portion or the full amount of deferred tax assets, we would record an adjustment to the deferred tax asset or a valuation allowance as a charge to earnings in the period such determination is made.
We apply a two-step approach to recognizing and measuring uncertain tax positions. The first step is to evaluate the tax position for recognition by determining whether it is more likely than not that the position will be sustained on audit, including resolution of related appeals or litigation processes, if any. The second step is to measure the tax benefit as the largest amount that is more than 50% likely of being realized upon ultimate settlement. An uncertain tax position is considered effectively settled on completion of an examination by a taxing authority if certain other conditions are satisfied.
The calculation of tax liabilities involves inherent uncertainty associated with the application of complex tax laws, significant assumptions, judgments and estimates including forward-looking financial projections and geographical mix of earnings. We are also subject to examination by various taxing authorities. We believe we have adequately provided in our financial statements for potential additional taxes. If we ultimately determine that these amounts are not owed, we would reverse the liability and recognize the tax benefit in the period in which we determine that the liability is no longer necessary. If an ultimate tax assessment exceeds our estimate of tax liabilities, we would record an additional charge to earnings.
Results of Operations
Revenue Background
We generate our revenue from the sale of products that include software licenses, maintenance and services, and to a lesser extent, hardware products. Under current accounting rules and policies, we recognize revenue from orders we receive for software licenses, services and hardware products at varying times.
• | In most instances, we recognize revenue on a TSL software license order over the license term and on a term or perpetual software license order in the quarter in which the license is delivered. The weighted-average term of the TSLs and term licenses is typically three years, but varies from quarter to quarter due to the nature and timing of the arrangements entered into during the quarter. The weighted-average term of the TSLs and term licenses we entered into in fiscal 2017 , 2016 , and 2015 was 2.7 years, 3.0 years and 2.7 years, respectively. |
• | Revenue on contracts requiring significant modification or development is accounted for using the percentage of completion method over the period of the development. |
• | Revenue on hardware product orders is generally recognized in full at the time the product is shipped and when title is transferred. |
• | Contingent revenue is recognized if and when the event that removes the contingency occurs. |
• | Revenue on maintenance orders is recognized ratably over the maintenance period (normally one year). |
• | Revenue on professional services orders is generally recognized as the services are performed. |
• | Infrequently, we enter into certain license arrangements wherein licenses are provided for a finite term without any other services or rights, including rights to receive, or to exchange licensed |
36
Table of Contents
software for, unspecified future technology. We recognize revenue from these term licenses in full upon shipment of the software and when all other revenue recognition criteria are met.
Our revenue in any period is equal to the sum of our time-based products, upfront products, and maintenance and services revenues for the period. We derive time-based products revenue largely from TSL orders received and delivered in prior quarters and to a smaller extent from contracts in which revenue is recognized as customer installments become due and payable and from contingent revenue arrangements. We derive upfront products revenue directly from term and perpetual license and hardware product orders mostly booked and shipped during the period. We derive maintenance revenue largely from maintenance orders received in prior periods since our maintenance orders generally yield revenue ratably over a term of one year. We also derive professional services revenue primarily from orders received in prior quarters, since we recognize revenue from professional services as those services are delivered and accepted or on percentage of completion for arrangements requiring significant modification of our software, and not when they are booked.
Our revenue is sensitive to the mix of TSLs and perpetual licenses delivered during a reporting period. A TSL order typically yields lower current quarter revenue but contributes to revenue in future periods. For example, a $120,000 order for a three-year TSL delivered on the last day of a quarter typically generates no revenue in that quarter, but $10,000 in each of the 12 succeeding quarters. Conversely, a $120,000 order for perpetual licenses with greater than 75% of the license fee due within one year from shipment typically generates $120,000 in revenue in the quarter the product is delivered, but no future revenue. Additionally, revenue in a particular quarter may also be impacted by perpetual licenses in which less than 75% of the license fees and 100% of the maintenance fees are payable within one year from shipment as the related revenue will be recognized as revenue in the period when customer payments become due and payable.
Most of our customer arrangements are complex, involving hundreds of products and various license rights, and our customers bargain with us over many aspects of these arrangements. For example, they often demand a broader portfolio of solutions, support and services and seek more favorable terms such as expanded license usage, future purchase rights and other unique rights at an overall lower total cost. No single factor typically drives our customers' buying decisions, and we compete on all fronts to serve customers in a highly competitive EDA market. Customers generally negotiate the total value of the arrangement rather than just unit pricing or volumes.
Year Ended October 31, |
| $ Change |
| % Change |
| $ Change |
| % Change | ||||||||||||||||
2017 |
| 2016 |
| 2015 |
| 2016 to 2017 |
| 2015 to 2016 | ||||||||||||||||
(dollars in millions) | ||||||||||||||||||||||||
$ | 2,724.9 | |
| $ | 2,422.5 | |
| $ | 2,242.2 | |
| $ | 302.4 | |
| 12 | % |
| $ | 180.3 | |
| 8 | % |
The overall growth of our business, including contributions from acquisitions, has been the primary driver of the increase in our revenue. Our revenues are subject to fluctuations, primarily due to customer requirements, including payment terms and the timing and value of contract renewals. For example, we experience variability in our revenue due to factors such as the timing of IP consulting projects, royalties, variability in hardware sales and due to certain contracts where revenue is recognized when customer installment payments are due. As revenue from hardware sales is recognized upfront, customer demand and timing requirements for such hardware may result in increased variability of our total revenue.
The increase in total revenue for fiscal 2017 compared to fiscal 2016 was primarily attributable to the overall growth in our business mainly due to higher TSL revenues, hardware sales, IP consulting projects and to a lesser extent due to revenue from acquired companies.
The increase in total revenue for fiscal 2016 compared to fiscal 2015 was primarily attributable to the overall growth of our business mainly due to higher TSL revenues and hardware sales.
37
Table of Contents
| Year Ended October 31, |
| $ Change |
| % Change |
| $ Change |
| % Change | ||||||||||||||||
| 2017 |
| 2016 |
| 2015 |
| 2016 to 2017 |
| 2015 to 2016 | ||||||||||||||||
| (dollars in millions) | ||||||||||||||||||||||||
| $ | 2,021.8 | |
| $ | 1,910.9 | |
| $ | 1,792.2 | |
| $ | 110.9 | |
| 6 | % |
| $ | 118.7 | |
| 7 | % |
Percentage of total revenue | 74 | % |
| 79 | % |
| 80 | % |
|
|
|
|
|
|
|
| |||||||||
The increase in time-based products revenue for fiscal 2017 compared to fiscal 2016 was primarily attributable to an increase in TSL license revenue due to arrangements booked in prior periods.
The increase in time-based products revenue for fiscal 2016 compared to fiscal 2015 was primarily attributable to an increase in TSL license revenue due to the overall growth in our business, including arrangements booked in prior periods and, to a lesser extent, contributions from acquisitions.
| Year Ended October 31, |
| $ Change |
| % Change |
| $ Change |
| % Change | ||||||||||||||||
| 2017 |
| 2016 |
| 2015 |
| 2016 to 2017 |
| 2015 to 2016 | ||||||||||||||||
| (dollars in millions) | ||||||||||||||||||||||||
| $ | 338.2 | |
| $ | 248.1 | |
| $ | 197.3 | |
| $ | 90.1 | |
| 36 | % |
| $ | 50.8 | |
| 26 | % |
Percentage of total revenue | 12 | % |
| 10 | % |
| 9 | % |
|
|
|
|
|
|
|
| |||||||||
Changes in upfront products revenue are generally attributable to normal fluctuations in customer requirements, which can drive the amount of upfront orders and revenue in any particular period.
The increase in upfront products revenue for fiscal 2017 compared to fiscal 2016, and for fiscal 2016 compared to fiscal 2015, was primarily attributable to an increase in the sale of hardware products driven by timing of customer requirements.
As our sales of hardware products grow, upfront products revenue as a percentage of total revenue will likely
fluctuate modestly. Such fluctuations will continue to be impacted by the timing of shipments due to customer
requirements.
| Year Ended October 31, |
| $ Change |
| % Change |
| $ Change |
| % Change | ||||||||||||||||
| 2017 |
| 2016 |
| 2015 |
| 2016 to 2017 |
| 2015 to 2016 | ||||||||||||||||
| (dollars in millions) | ||||||||||||||||||||||||
Maintenance revenue | $ | 84.1 | |
| $ | 74.4 | |
| $ | 70.1 | |
| $ | 9.7 | |
| 13 | % |
| $ | 4.3 | |
| 6 | % |
Professional service and other revenue | 280.8 | |
| 189.1 | |
| 182.6 | |
| $ | 91.7 | |
| 48 | % |
| $ | 6.5 | |
| 4 | % | |||
Total | $ | 364.9 | |
| $ | 263.5 | |
| $ | 252.7 | |
| $ | 101.4 | |
| 38 | % |
| $ | 10.8 | |
| 4 | % |
Percentage of total revenue | 14 | % |
| 11 | % |
| 11 | % |
|
|
|
|
|
|
|
| |||||||||
The increase in maintenance revenue for fiscal 2017 compared to fiscal 2016, and for fiscal 2016 compared to fiscal 2015, was primarily due to an increase in the volume of arrangements that include maintenance.
The increase in professional services and other revenue for fiscal 2017 compared to fiscal 2016 was primarily due to the increase in, and timing of, IP consulting projects that are accounted for using the percentage of completion method and contributions from acquisitions.
The increase in professional services and other revenue for fiscal 2016 compared to fiscal 2015 was primarily due to the timing of IP consulting projects that are accounted for using the percentage of completion method.
We expect our professional services revenues to increase in future periods as a result of recent acquisitions, but we do not expect the impact to be material to our total revenue.
38
Table of Contents
| Year Ended October 31, |
| $ Change |
| % Change |
| $ Change |
| % Change | ||||||||||||||||
| 2017 |
| 2016 |
| 2015 |
| 2016 to 2017 |
| 2015 to 2016 | ||||||||||||||||
| (dollars in millions) | ||||||||||||||||||||||||
Cost of revenue | $ | 654.2 | |
| $ | 543.0 | |
| $ | 518.9 | |
| $ | 111.2 | |
| 20 | % |
| $ | 24.1 | |
| 5 | % |
Operating expenses | 1,723.1 | |
| 1,562.2 | |
| 1,456.8 | |
| $ | 160.9 | |
| 10 | % |
| $ | 105.4 | |
| 7 | % | |||
Total | $ | 2,377.3 | |
| $ | 2,105.2 | |
| $ | 1,975.7 | |
| $ | 272.1 | |
| 13 | % |
| $ | 129.5 | |
| 7 | % |
Total expenses as a percentage of total revenue | 87 | % |
| 87 | % |
| 88 | % |
|
|
|
| |||||||||||||
Our expenses are generally impacted by changes in personnel-related costs including salaries, benefits, stock-based compensation and variable compensation; changes in amortization; and changes in selling and marketing expenses. The increase in our expenses compared to prior fiscal years was primarily due to an increase in personnel-related costs, driven by increased headcount from our overall growth, including those from acquisitions, and related fixed charges including facilities, as well as higher product costs due to increased hardware sales. We allocate certain human resource programs, information technology and facility expenses among our functional income statement categories based on headcount within each functional area. Annually, or upon a significant change in headcount (such as a workforce reduction, realignment or acquisition) or other factors, management reviews the allocation methodology and expenses included in the allocation pool.
Foreign currency fluctuations, net of hedging, did not have a significant impact on expenses during fiscal 2017 as compared to fiscal 2016, or fiscal 2016 as compared to fiscal 2015. See Note 5 of Notes to Consolidated Financial Statements for details on our foreign exchange hedging programs.
| Year Ended October 31, |
| $ Change |
| % Change |
| $ Change |
| % Change | ||||||||||||||||
| 2017 |
| 2016 |
| 2015 |
| 2016 to 2017 |
| 2015 to 2016 | ||||||||||||||||
| (dollars in millions) | ||||||||||||||||||||||||
Cost of products revenue | $ | 413.2 | |
| $ | 346.9 | |
| $ | 303.6 | |
| $ | 66.3 | |
| 19 | % |
| $ | 43.3 | |
| 14 | % |
Cost of maintenance and service revenue | 164.9 | |
| 94.0 | |
| 105.3 | |
| $ | 70.9 | |
| 75 | % |
| $ | (11.3 | ) |
| (11 | )% | |||
Amortization of intangible assets | 76.1 | |
| 102.1 | |
| 110.0 | |
| $ | (26.0 | ) |
| (25 | )% |
| $ | (7.9 | ) |
| (7 | )% | |||
Total | $ | 654.2 | |
| $ | 543.0 | |
| $ | 518.9 | |
| $ | 111.2 | |
| 20 | % |
| $ | 24.1 | |
| 5 | % |
Percentage of total revenue | 24 | % |
| 22 | % |
| 23 | % |
|
|
|
|
|
|
|
| |||||||||
We divide cost of revenue into three categories: cost of products revenue, cost of maintenance and service revenue, and amortization of intangible assets. We segregate expenses directly associated with consulting and training services from cost of products revenue associated with internal functions providing license delivery and post-customer contract support services. We then allocate these group costs between cost of products revenue and cost of maintenance and service revenue based on products and maintenance and service revenue reported.
Cost of products revenue. Cost of products revenue includes costs related to products sold and software licensed, allocated operating costs related to product support and distribution costs, royalties paid to third-party vendors, and the amortization of capitalized research and development costs associated with software products that had reached technological feasibility.
Cost of maintenance and service revenue. Cost of maintenance and service revenue includes operating costs related to maintaining the infrastructure necessary to operate our services and costs to deliver our consulting services, such as hotline and on-site support, production services and documentation of maintenance updates. We expect our cost of maintenance and service revenue to increase in future periods because of recent acquisitions, but we do not expect the impact to be material to our total cost of revenue.
39
Table of Contents
Amortization of intangible assets. Amortization of intangible assets, which is recorded to cost of revenue and operating expenses, includes the amortization of core/developed technology, trademarks, trade names, customer relationships, covenants not to compete related to acquisitions and certain contract rights related to acquisitions.
The increase in cost of revenue for fiscal 2017 compared to fiscal 2016 was primarily due to increases of $62.4 million in personnel-related costs as a result of headcount increases, including those from acquisitions, $37.5 million in hardware product costs due to increases in, and timing of, shipments, $24.8 million in costs related to servicing IP consulting arrangements, and functionally allocated expenses that were higher by $8.6 million. The increases were partially offset by decreases of $26.0 million in amortization of intangible assets.
The increase in cost of revenue for fiscal 2016 compared to fiscal 2015 was primarily due to increases of $24.2 million in product costs due to increased sales, $19.7 million in personnel-related costs as a result of headcount increases, which were partially offset by decreases of $13.4 million in costs related to our professional services revenue and $7.9 million in amortization of intangible assets.
Changes in other cost of revenue categories for the above-mentioned periods were not individually material.
Operating Expenses
| Year Ended October 31, |
| $ Change |
| % Change |
| $ Change |
| % Change | ||||||||||||||||
| 2017 |
| 2016 |
| 2015 |
| 2016 to 2017 |
| 2015 to 2016 | ||||||||||||||||
| (dollars in millions) | ||||||||||||||||||||||||
| $ | 908.8 | |
| $ | 856.7 | |
| $ | 776.2 | |
| $ | 52.1 | |
| 6 | % |
| $ | 80.5 | |
| 10 | % |
Percentage of total revenue | 33 | % |
| 35 | % |
| 35 | % |
|
|
|
|
|
|
|
| |||||||||
The increase in research and development expense in fiscal 2017 compared to fiscal 2016 was primarily due to increases of $47.4 million in personnel-related costs as a result of headcount increases, including those from acquisitions.
The increase in research and development expense in fiscal 2016 compared to fiscal 2015 was primarily due to increases of $64.3 million in personnel-related costs as a result of headcount increases, including those from acquisitions, $5.7 million in consultant and contractor costs, $5.1 million in research and development supplies, and functionally allocated expenses that were higher by $3.0 million.
Changes in other research and development expense categories for the above-mentioned periods were not individually material.
| Year Ended October 31, |
| $ Change |
| % Change |
| $ Change |
| % Change | ||||||||||||||||
| 2017 |
| 2016 |
| 2015 |
| 2016 to 2017 |
| 2015 to 2016 | ||||||||||||||||
| (dollars in millions) | ||||||||||||||||||||||||
| $ | 549.2 | |
| $ | 502.4 | |
| $ | 474.4 | |
| $ | 46.8 | |
| 9 | % |
| $ | 28.0 | |
| 6 | % |
Percentage of total revenue | 20 | % |
| 21 | % |
| 21 | % |
|
|
|
|
|
|
|
| |||||||||
The increase in sales and marketing expense for fiscal 2017 compared to fiscal 2016, and for fiscal 2016 compared to fiscal 2015, were primarily attributable to increases of $40.8 million and $26.7 million, respectively, in personnel costs as a result of higher headcount and higher variable compensation primarily based on timing of shipments.
Changes in other sales and marketing expense categories for the above-mentioned periods were not individually material.
40
Table of Contents
| Year Ended October 31, |
| $ Change |
| % Change |
| $ Change |
| % Change | ||||||||||||||||
| 2017 |
| 2016 |
| 2015 |
| 2016 to 2017 |
| 2015 to 2016 | ||||||||||||||||
| (dollars in millions) | ||||||||||||||||||||||||
| $ | 196.8 | |
| $ | 166.0 | |
| $ | 165.1 | |
| $ | 30.8 | |
| 19 | % |
| $ | 0.9 | |
| 1 | % |
Percentage of total revenue | 7 | % |
| 7 | % |
| 7 | % |
|
|
|
|
|
|
|
| |||||||||
The increase in general and administrative expenses for fiscal 2017 compared with fiscal 2016 was primarily due to increases of $38.0 million for accrued loss contingencies as a result of litigation, $18.8 million in personnel-related costs as a result of headcount increases and $5.5 million in facilities expenses, partially offset by a $30.4 million gain as a result of a legal settlement.
General and administrative expenses for fiscal 2016 compared with fiscal 2015 remained relatively flat as increases of $5.2 million in maintenance costs and $2.5 million in professional service costs were offset by $7.2 million of lower facilities expenses.
Changes in other general and administrative expense categories for the above-mentioned periods were not individually material.
Change in Fair Value of Deferred Compensation
The income or loss arising from the change in fair value of our non-qualified deferred compensation plan obligation is recorded in cost of sales and each functional operating expense, with the offsetting change in the fair value of the related assets recorded in other income (expense), net. These assets are classified as trading securities. There is no overall impact to our net income from the income or loss of our deferred compensation plan obligation and asset.
Amortization of Intangible Assets
Amortization of intangible assets includes the amortization of contract rights and the amortization of core/developed technology, trademarks, trade names, customer relationships, covenants not to compete, and in-process research and development related to acquisitions completed in prior years. Amortization expense is included in the consolidated statements of operations as follows:
| Year Ended October 31, |
| $ Change |
| % Change |
| $ Change |
| % Change | ||||||||||||||||
| 2017 |
| 2016 |
| 2015 |
| 2016 to 2017 |
| 2015 to 2016 | ||||||||||||||||
| (dollars in millions) | ||||||||||||||||||||||||
Included in cost of revenue | $ | 76.1 | |
| $ | 102.1 | |
| $ | 110.0 | |
| $ | (26.0 | ) |
| (25 | )% |
| $ | (7.9 | ) |
| (7 | )% |
Included in operating expenses | 31.6 | |
| 27.5 | |
| 26.0 | |
| $ | 4.1 | |
| 15 | % |
| $ | 1.5 | |
| 6 | % | |||
Total | $ | 107.7 | |
| $ | 129.6 | |
| $ | 136.0 | |
| $ | (21.9 | ) |
| (17 | )% |
| $ | (6.4 | ) |
| (5 | )% |
Percentage of total revenue | 4 | % |
| 5 | % |
| 6 | % |
|
|
|
|
|
|
|
| |||||||||
The decrease in amortization of intangible assets for fiscal 2017 compared to fiscal 2016, and for fiscal 2016 compared to fiscal 2015, was primarily due to intangible assets that were fully amortized, partially offset by additions of acquired intangible assets.
Restructuring Charges
During fiscal 2017, we recorded $36.6 million of restructuring charges for severance and benefits due to involuntary and voluntary employee termination actions. The restructuring actions were undertaken to position us for future growth, reallocate resources to priority areas and, to a lesser extent, eliminate operational redundancy. These charges consisted primarily of severance and retirement benefits. Payments under the 2017 restructuring plans are expected to be completed by the end of the second quarter of fiscal 2018.
During fiscal 2016, we recorded $9.6 million of restructuring charges for severance and benefits due to involuntary employee terminations. As of October 31, 2016, there was a $5.7 million outstanding balance remaining in
41
Table of Contents
accounts payable and accrued liabilities in the consolidated balance sheets. The remaining balance was paid in fiscal 2017.
During fiscal 2015, we recorded $15.1 million of restructuring charges pursuant to the fiscal 2015 restructuring program, which included a voluntary retirement program (VRP) and a minimal headcount reduction program. The fiscal 2015 restructuring program was completed as of October 31, 2015.
The following is a summary of our restructuring activities:
Fiscal Year | Balance at Beginning of Period |
| Costs Incurred (Reduced) |
| Cash Payments |
| Balance at End of Period | ||||||||
| (in millions) | ||||||||||||||
2017 | $ | 5.7 | |
| $ | 36.6 | |
| $ | (24.8 | ) |
| $ | 17.5 | |
2016 | $ | - | |
| $ | 9.6 | |
| $ | (3.9 | ) |
| $ | 5.7 | |
2015 | $ | - | |
| $ | 15.1 | |
| $ | (15.1 | ) |
| $ | - | |
See Note 2 of Notes to Consolidated Financial Statements .
Other Income (Expense), Net
| Year Ended October 31, |
| $ Change |
| % Change |
| $ Change |
| % Change | ||||||||||||||||
| 2017 |
| 2016 |
| 2015 |
| 2016 to 2017 |
| 2015 to 2016 | ||||||||||||||||
| (dollars in millions) | ||||||||||||||||||||||||
Interest income | $ | 7.2 | |
| $ | 3.7 | |
| $ | 2.8 | |
| $ | 3.5 | |
| 95 | % |
| $ | 0.9 | |
| 32 | % |
Interest expense | (7.3 | ) |
| (3.8 | ) |
| (2.8 | ) |
| (3.5 | ) |
| 92 | % |
| (1.0 | ) |
| 36 | % | |||||
Gain (loss) on assets related to executive deferred compensation plan | 29.6 | |
| 4.4 | |
| 3.7 | |
| 25.2 | |
| 573 | % |
| 0.7 | |
| 19 | % | |||||
Foreign currency exchange gain (loss) | 3.4 | |
| 0.2 | |
| 6.3 | |
| 3.2 | |
| 1,600 | % |
| (6.1 | ) |
| (97 | )% | |||||
Other, net | 2.6 | |
| 7.7 | |
| 5.1 | |
| (5.1 | ) |
| (66 | )% |
| 2.6 | |
| 51 | % | |||||
Total | $ | 35.5 | |
| $ | 12.2 | |
| $ | 15.1 | |
| $ | 23.3 | |
| 191 | % |
| $ | (2.9 | ) |
| (19 | )% |
The net increase in other income (expense) in fiscal 2017 as compared to fiscal 2016 was primarily due to higher gains in the market value of our executive deferred compensation plan assets.
The net decrease in other income (expense) in fiscal 2016 as compared to fiscal 2015 was primarily due to lower gains in foreign currency exchange as a result of the weakened U.S. dollar against the related foreign currencies, partially offset by increased income on foreign exchange hedging contracts that was recorded in Other, net.
Income Taxes
Our effective tax rate for fiscal 2017 was 64.4%, which included income tax expense of $166.2 million relating to a repatriation of foreign earnings of $825 million in anticipation of potential U.S. corporate tax reform, $30.5 million due to an increase in valuation allowance on state deferred tax assets, a settlement with the Korean National Tax Service for the audit of fiscal years 2012 to 2016 of $7.9 million, and tax expense related to the integration of acquired technologies of $36.4 million. These expenses were partially offset by excess tax benefits from stock-based compensation of $38.1 million, a U.S. federal research tax credit of $25.5 million, and a settlement with the Taiwanese tax authorities for fiscal 2014 of $10.9 million. Our effective tax rate for fiscal 2016 was 19.0%, which included tax benefits from a settlement with the Internal Revenue Service (IRS) of $20.7 million for fiscal 2015 and the permanent reinstatement of the U.S. federal research tax credit of approximately $37.1 million, partially offset by tax expense from the integration of acquired technologies of $37.5 million, the impact of undistributed foreign earnings of $9.6 million, and an increase in the valuation allowance on deferred tax assets of $14.0 million as a result of changes in the expected utilization of state tax credits. The reinstatement of the research tax credit resulted in an additional tax credit for ten months of fiscal 2015 and the full year of fiscal 2016, which was recorded in fiscal 2016. Our effective tax rate for fiscal 2015 was 19.8%, which included tax expense from the integration of acquired technologies of $33.0 million partially offset by tax benefits from the reinstatement of the U.S. federal research tax credit of approximately $12.4 million, a settlement with the IRS of $4.0 million for fiscal 2014, and a
42
Table of Contents
settlement with the Taiwanese tax authorities of $2.3 million (net tax benefit resulting from fiscal years 2012 and 2013). The reinstatement of the research tax credit resulted in an additional tax credit for ten months of fiscal 2014 as well as two months of fiscal 2015, which was recorded in fiscal 2015.
The integration of acquired technologies represents the income tax effect resulting from the transfer of certain intangible assets among company-controlled entities. The income tax effect is generally recognized over five years. These intangible assets generally result from the acquisition of technology by a company-controlled entity as part of a business or asset acquisition.
The valuation allowance on state deferred tax assets increased in fiscal 2017 by $43.7 million primarily due to a change in the realizability of deferred tax assets related to the California research credit carryforwards. Most of the change relates to a significant increase in our share price in fiscal 2017, which resulted in a higher tax deduction that reduced the future California sourced taxable income and the amount of California research credits we expect to utilize. The remainder of the increase relates to an agreement that we reached with the California tax authorities in fiscal 2017, which resulted primarily in the recognition of unrecognized tax benefits offset by a corresponding increase in the valuation allowance of $13.2 million. For further discussion of the provision for income taxes, repatriation, and settlements, see Note 11 of Notes to Consolidated Financial Statements .
Liquidity and Capital Resources
Our sources of cash, cash equivalents and short-term investments are funds generated from our business operations and funds that may be drawn down under our revolving credit and term loan facilities.
As of October 31, 2017 , we held an aggregate of $554.6 million in cash, cash equivalents and short-term investments in the United States and an aggregate of $493.8 million in our foreign subsidiaries. In fiscal 2017, we repatriated $825 million of undistributed foreign earnings in anticipation of U.S. corporate tax reform. Additional amounts held outside the U.S. could be repatriated to the U.S. (subject to local law restrictions), but under current U.S. tax law, would be subject to U.S. income taxes less applicable foreign tax credits. We have provided for the U.S. income and foreign withholding taxes on foreign earnings, except for foreign earnings that are considered indefinitely reinvested outside the U.S. However, in the event additional funds from foreign subsidiaries were needed to fund cash needs in the U.S. and if U.S. taxes have not already been previously accrued, we would be required to accrue and pay additional U.S. taxes in order to repatriate these funds.
The following sections discuss changes in our consolidated balance sheets and statements of cash flow, and other commitments of our liquidity and capital resources during fiscal 2017 .
| Year Ended October 31, |
| $ Change |
| % Change | |||||||||
| 2017 |
| 2016 |
| ||||||||||
| (dollars in millions) | |||||||||||||
Cash and cash equivalents | $ | 1,048.4 | |
| $ | 976.6 | |
| $ | 71.8 | |
| 7 | % |
Short-term investments | $ | - | |
| $ | 140.7 | |
| $ | (140.7 | ) |
| (100 | )% |
Total | $ | 1,048.4 | |
| $ | 1,117.3 | |
| $ | (68.9 | ) |
| (6 | )% |
Cash, cash equivalents and short-term investments decreased primarily due to (1) stock repurchases under our accelerated stock repurchase agreements, (2) cash used for acquisitions and intangible assets, (3) purchases of property and equipment, (4) repayment of debt, net of proceeds, and (5) payments for taxes related to net share settlement of equity awards. Cash used was partially offset by cash generated from our operations and cash received from employee stock option exercises.
43
Table of Contents
| Year Ended October 31, |
| $ Change |
| $ Change | ||||||||||||||
| 2017 |
| 2016 |
| 2015 |
| 2016 to 2017 |
| 2015 to 2016 | ||||||||||
| (dollars in millions) | ||||||||||||||||||
Cash provided by operating activities | $ | 634.6 | |
| $ | 586.6 | |
| $ | 495.2 | |
| $ | 48.0 | |
| $ | 91.4 | |
Cash used in investing activities | (189.3 | ) |
| (142.7 | ) |
| (559.6 | ) |
| (46.6 | ) |
| 416.9 | | |||||
Cash used in financing activities | (373.1 | ) |
| (306.9 | ) |
| (62.1 | ) |
| (66.2 | ) |
| (244.8 | ) | |||||
Cash Provided by Operating Activities
We expect cash from our operating activities to fluctuate as a result of a number of factors, including the timing of our billings and collections, our operating results, and the timing and amount of tax and other liability payments. Cash provided by our operations is dependent primarily upon the payment terms of our license agreements. We generally receive cash from upfront arrangements much sooner than from time-based products revenue, in which the license fee is typically paid either quarterly or annually over the term of the license.
Fiscal 2017 compared to fiscal 2016 and fiscal 2016 compared to fiscal 2015. The increase in cash provided by operating activities was primarily driven by higher cash collections, partially offset by higher disbursements for operations, including vendors.
Cash Used in Investing Activities
Fiscal 2017 compared to fiscal 2016. The increase in cash used in investing activities was primarily driven by higher cash paid for acquisitions and intangible assets of $199.1 million, partially offset by higher proceeds from the sales and maturities of short-term investments of $139.3 million.
Fiscal 2016 compared to fiscal 2015. The decrease in cash used in investing activities was primarily driven by lower cash paid for acquisitions and intangible assets of $280.1 million, lower purchases of short-term investments of $70.2 million, higher proceeds from the sales and maturities of short-term investments of $47.2 million, and lower purchases of property and equipment of $20.1 million.
Cash Used in Financing Activities
Fiscal 2017 compared to fiscal 2016. The increase in cash used in financing activities was primarily due to higher debt repayments of $195.6 million, partially offset by higher proceeds from the drawdown of our senior unsecured revolving credit facility of $135.0 million.
Fiscal 2016 compared to fiscal 2015. The increase in cash used in financing activities was primarily due to lower proceeds from the drawdown of our senior unsecured revolving credit facility of $275.0 million and higher stock repurchase activities of $120.0 million, partially offset by lower debt repayments of $145.4 million.
Year Ended October 31, |
|
|
|
| ||
2017 |
| 2016 |
| $ Change |
| % Change |
(dollars in millions) |
|
|
|
| ||
$451.1 |
| $438.9 |
| $12.2 |
| 3% |
Our accounts receivable and days sales outstanding (DSO) are primarily driven by our billing and collections activities. Our DSO was 59 days at October 31, 2017 and 63 days at October 31, 2016 . The decrease in DSO is primarily due to the increase in revenue.
44
Table of Contents
Working Capital
Working capital is comprised of current assets less current liabilities, as shown on our consolidated balance sheets:
| Year Ended October 31, |
|
|
|
| |||||||||
| 2017 |
| 2016 |
| $ Change |
| % Change | |||||||
| (dollars in millions) |
|
|
|
| |||||||||
Current assets | $ | 1,682.6 | |
| $ | 1,716.9 | |
| $ | (34.3 | ) |
| (2 | )% |
Current liabilities | 1,614.1 | |
| 1,714.9 | |
| $ | (100.8 | ) |
| (6 | )% | ||
Working capital | $ | 68.5 | |
| $ | 2.0 | |
| $ | 66.5 | |
| 3,325 | % |
Working capital at the end of fiscal 2017 was higher than at the end of fiscal 2016 primarily due to (1) a decrease of $195.1 million in short-term debt, (2) an increase of $30.2 million in prepaid and other current assets, and (3) a decrease of $21.3 million in deferred revenue. These changes in working capital were partially offset by an increase of $98.4 million in accounts payable and accrued liabilities and a decrease of $69.0 million of cash, cash equivalents and short-term investments as we sold our available-for-sale investment portfolio during the fourth quarter of fiscal 2017.
Other
As of October 31, 2017 , our cash equivalents consisted of taxable money market mutual funds. We follow an established investment policy and set of guidelines to monitor, manage and limit our exposure to interest rate and credit risk.
We proactively manage our cash equivalents balances and closely monitor our capital and stock repurchase expenditures to ensure ample liquidity. Additionally, we believe the overall credit quality of our portfolio is strong, with our global excess cash, and our cash equivalents, invested in banks and securities with a weighted-average credit rating exceeding AA. The majority of our investments are classified as Level 1 or Level 2 investments, as measured under fair value guidance. See Notes 5 and 6 of the Notes to Consolidated Financial Statements .
We believe that our current cash and cash equivalents, cash generated from operations, and available credit under our Revolver (defined below) will satisfy our routine business requirements for at least the next 12 months and the foreseeable future.
Other Commitments - Credit and Term Loan Facilities
On November 28, 2016, we entered into an amended and restated credit agreement with several lenders (the Credit Agreement) providing for (i) a $650.0 million senior unsecured revolving credit facility (the Revolver) and (ii) a $150.0 million senior unsecured term loan facility (the Term Loan). The Credit Agreement amended and restated our previous credit agreement dated May 19, 2015 (the 2015 Agreement), in order to increase the size of the revolving credit facility from $500.0 million to $650.0 million , provide a new $150.0 million senior unsecured term loan facility, and extend the termination date of the revolving credit facility from May 19, 2020 to November 28, 2021. Subject to obtaining additional commitments from lenders, the principal amount of the loans provided under the Credit Agreement may be increased by us by up to an additional $150.0 million . The Credit Agreement contains financial covenants requiring us to operate within a maximum leverage ratio and maintain a minimum interest coverage ratio, as well as other non-financial covenants. As of October 31, 2017 , we were in compliance with all financial covenants.
During the first quarter of fiscal 2017, we received funding of $150.0 million under the Term Loan. As of October 31, 2017 , we had a $144.0 million outstanding balance, net of debt issuance costs, under the Term Loan, of which $134.1 million is classified as long-term liabilities, and no outstanding balance under the Revolver. Outstanding principal payments under the Term Loan are due as follows:
Fiscal year | (in thousands) | ||
2018 | 10,313 | | |
2019 | 14,062 | | |
2020 | 17,813 | | |
2021 | 27,187 | | |
2022 | 75,000 | | |
Total | $ | 144,375 | |
45
Table of Contents
As of October 31, 2016 , we had no outstanding balance under the previous term loan from the 2015 Agreement and a $205.0 million outstanding balance under the previous revolver from the 2015 Agreement, all of which are considered short-term liabilities. Borrowings bear interest at a floating rate based on a margin over our choice of market observable base rates as defined in the Credit Agreement. As of October 31, 2017 , borrowings under the Term Loan bore interest at LIBOR +1.125% and the applicable interest rate for the Revolver was LIBOR +1.000% . In addition, commitment fees are payable on the Revolver at rates between 0.125% and 0.200% per year based on our leverage ratio on the daily amount of the revolving commitment.
Subsequent to fiscal year 2017, we drew down $450.0 million under the Revolver and the total outstanding balance of the Revolver as of December 13, 2017 is $450.0 million.
Acquisition of Black Duck Software. On November 2, 2017, we entered into a definitive agreement pursuant to which we have agreed to acquire privately held Black Duck Software, a leader in automated solutions for securing and managing open source software. The acquisition was completed on December 11, 2017 and under the terms of the definitive agreement, we paid approximately $547 million, net of cash acquired, and assumed certain unvested equity of Black Duck employees. The transaction was funded by U.S. cash.
Contractual Obligations
| Total |
| Fiscal 2018 |
| Fiscal 2019/ Fiscal 2020 |
| Fiscal 2021/ Fiscal 2022 |
| Thereafter |
| Other | ||||||||||||
| (in thousands) |
|
| ||||||||||||||||||||
Lease Obligations: |
|
|
|
|
|
|
|
|
|
|
| ||||||||||||
Operating Leases(1) | 354,329 | |
| 56,879 | |
| 90,944 | |
| 59,235 | |
| 147,271 | |
| - | | ||||||
Purchase Obligations(2) | 172,583 | |
| 107,327 | |
| 65,256 | |
| - | |
| - | |
| - | | ||||||
Term Loan(3) | 144,375 | |
| 10,312 | |
| 31,875 | |
| 102,188 | |
| - | |
| - | | ||||||
Other Long-Term Obligations(4) | 3,450 | |
| 863 | |
| 1,725 | |
| 862 | |
| - | |
| - | | ||||||
Long term accrued income taxes(5) | 33,239 | |
| - | |
| - | |
| - | |
| - | |
| 33,239 | | ||||||
Total | $ | 707,976 | |
| $ | 175,381 | |
| $ | 189,800 | |
| $ | 162,285 | |
| $ | 147,271 | |
| $ | 33,239 | |
(1) | See Note 7 of Notes to Consolidated Financial Statements . |
(2) | Purchase obligations represent an estimate of all open purchase orders and contractual obligations in the ordinary course of business for which we have not received the goods or services as of October 31, 2017 . Although open purchase orders are considered enforceable and legally binding, the terms generally allow us the option to cancel, reschedule and adjust our requirements based on our business needs prior to the delivery of goods or performance of services. |
(3) | This commitment relates to the principal on the Term Loan as discussed in Other Commitments above. |
(4) | These other obligations include fees associated with our Revolver. |
(5) | Long-term accrued income taxes represent uncertain tax benefits as of October 31, 2017 . Currently, a reasonably reliable estimate of timing of payments in individual years beyond fiscal 2017 cannot be made due to uncertainties in timing of the commencement and settlement of potential tax audits. |
The expected timing of payments of the obligations discussed above is estimated based on current information. Timing of payment and actual amounts paid may be different depending on the time of receipt of goods or services or changes to agreed-upon amounts for some obligations.
Off-Balance Sheet Arrangements
As of October 31, 2017 , we did not have any off-balance sheet arrangements, as defined in Item 303(a)(4)(ii) of SEC Regulation S-K.
Item 7A. Quantitative and Qualitative Disclosures About Market Risk |
46
Table of Contents
Interest Rate Risk . Our exposure to market risk for changes in interest rates relates to our cash, cash equivalents, and outstanding debt. As of October 31, 2017 , all of our cash, cash equivalents and debt were at short-term variable and fixed interest rates. While par value generally approximates fair value on variable instruments, rising interest rates over time would increase both our interest income and our interest expense. The primary objective of our investment activities is to preserve the principal while at the same time maximizing yields without significantly increasing the risk. To achieve this objective, we maintain our portfolio of investments in a mix of tax-exempt and taxable instruments that meet high credit quality standards, as specified in our investment policy. None of these investments are held for trading purposes. Our policy also limits the amount of credit exposure to any one issue, issuer and type of instrument.
The following table presents our cash equivalents and debt by fiscal year of expected maturity and average interest rates:
| Maturing in Year Ending October 31, | ||||||||||||||||||||||||||
| 2018 |
| 2019 |
| 2020 |
| 2021 |
| 2022 |
| Total |
| Fair Value | ||||||||||||||
| (in thousands) | ||||||||||||||||||||||||||
Cash & Cash equivalent (variable rate) | $ | 924,839 | |
| $ | - | |
| $ | - | |
| | |
| | |
| $ | 924,839 | |
| $ | 924,839 | | ||
Average interest rate | 0.78 | % |
| - | % |
| - | % |
| |
| |
|
|
|
| |||||||||||
Term Loan | $ | 10,313 | |
| $ | 14,062 | |
| $ | 17,813 | |
| $ | 27,187 | |
| $ | 75,000 | |
| $ | 144,375 | |
| $ | 144,375 | |
Average interest rate | LIBOR + | |
| - | % |
| - | % |
|
|
|
|
|
|
|
| |||||||||||
Actual maturities may differ from the stated maturities because borrowers may have the right to call or prepay certain obligations. These investments are classified as available-for-sale and are recorded on the balance sheet at fair market value with unrealized gains or losses, net of tax, reported as a component of accumulated other comprehensive income (loss), or OCI. The cost of securities sold is based on the specific identification method and realized gains and losses are included in other income (expense), net. Realized gains and losses on sales of available-for-sale securities have not been material in any period presented.
Foreign Currency Risk. We operate internationally and are exposed to potentially adverse movements in currency exchange rates. The functional currency of the majority of our active foreign subsidiaries is the foreign subsidiary's local currency. We enter into hedges in the form of foreign currency forward contracts to reduce our exposure to foreign currency rate changes on non-functional currency denominated forecasted transactions and balance sheet positions including: (1) certain assets and liabilities, (2) shipments forecasted to occur within approximately one month, (3) future billings and revenue on previously shipped orders, and (4) certain future intercompany invoices denominated in foreign currencies. The foreign currency contracts are carried at fair value and denominated in various currencies as listed in the tables below. The duration of forward contracts usually ranges from one month to 22 months . A description of our accounting for foreign currency contracts is included in Note 2 and Note 5 of Notes to Consolidated Financial Statements.
The success of our hedging activities depends upon the accuracy of our estimates of various balances and transactions denominated in non-functional currencies. To the extent our estimates are correct, gains and losses on our foreign currency contracts will be offset by corresponding losses and gains on the underlying transactions. For example, if the Euro were to depreciate by 10% compared to the U.S. dollar prior to the settlement of the Euro forward contracts listed in the table below providing information as of October 31, 2017 , the fair value of the contracts would decrease by approximately $10.4 million , and we would be required to pay approximately $10.4 million to the counterparty upon contract maturity. At the same time, the U.S. dollar value of our Euro-based expenses would decline, resulting in a gain and positive cash flow of approximately $10.4 million that would offset the loss and negative cash flow on the maturing forward contracts.
Net unrealized gain of approximately $4.4 million and loss of $19.9 million , net of tax, are included in accumulated other comprehensive income (loss) in our consolidated balance sheets as of October 31, 2017 and 2016 , respectively.
47
Table of Contents
If estimates of our balances and transactions prove inaccurate, we will not be completely hedged, and we will record a gain or loss, depending upon the nature and extent of such inaccuracy.
We do not use foreign currency forward contracts for speculative or trading purposes. We enter into foreign exchange forward contracts with financial institutions and have not experienced nonperformance by counterparties. Further, we anticipate performance by all counterparties to such agreements.
The following table provides information about the gross notional values of our foreign currency contracts as of October 31, 2017 :
| Gross Notional Amount in U.S. Dollars |
| Average Contract Rate | |||
| (in thousands) |
|
| |||
Forward Contract Values: |
|
|
| |||
Japanese yen | $ | 344,830 | |
| 110.991 | |
Indian Rupee | 114,476 | |
| 67.624 | | |
Euro | 103,952 | |
| 0.866 | | |
Chinese renminbi | 89,521 | |
| 6.921 | | |
Taiwanese dollar | 84,394 | |
| 30.155 | | |
Canadian dollar | 46,180 | |
| 1.294 | | |
Israeli shekel | 34,903 | |
| 3.515 | | |
Hungarian forint | 33,337 | |
| 262.165 | | |
British pound sterling | 23,405 | |
| 0.771 | | |
Korean won | 22,007 | |
| 1,115.929 | | |
Denmark kroner | 20,985 | |
| 6.329 | | |
Armenian dram | 18,450 | |
| 468.662 | | |
Singapore dollar | 9,597 | |
| 1.355 | | |
Swiss franc | 9,102 | |
| 0.939 | | |
| $ | 955,139 | |
|
| |
Equity Risk. We have approximately $7.8 million and $9.8 million of non-marketable equity securities in privately held companies as of October 31, 2017 and 2016 , respectively. These investments are accounted for under the cost or equity methods. The cost basis of securities sold is based on the specific identification method. The securities of privately held companies are reported at carrying value. Investments are written down to the fair value if there are any events or changes in circumstances that indicate any other than temporary decline in the value. We recorded $1.3 million of other-than-temporary impairment during fiscal 2017 and did not recognize any impairment during fiscal 2016 . None of our investments are held for speculation purposes.
48
Table of Contents
Item 8. Financial Statements and Supplementary Data |
Report of Independent Registered Public Accounting Firm
The Board of Directors and Stockholders
Synopsys, Inc.:
We have audited the accompanying consolidated balance sheets of Synopsys, Inc. and subsidiaries as of October 28, 2017 and October 29, 2016, and the related consolidated statements of operations, comprehensive income, stockholders' equity, and cash flows for each of the years in the three-year period ended October 28, 2017. We also have audited the internal control over financial reporting of Synopsys, Inc. as of October 28, 2017, based on criteria established in Internal Control - Integrated Framework (2013) issued by the Committee of Sponsoring Organizations of the Treadway Commission (COSO). The Company's management is responsible for these consolidated financial statements, for maintaining effective internal control over financial reporting, and for its assessment of the effectiveness of internal control over financial reporting, included in the accompanying Management's Report on Internal Control Over Financial Reporting appearing under item 9A(b). Our responsibility is to express an opinion on these consolidated financial statements and an opinion on the internal control over financial reporting of Synopsys, Inc. based on our audits.
We conducted our audits in accordance with the standards of the Public Company Accounting Oversight Board (United States). Those standards require that we plan and perform the audits to obtain reasonable assurance about whether the financial statements are free of material misstatement and whether effective internal control over financial reporting was maintained in all material respects. Our audits of the consolidated financial statements included examining, on a test basis, evidence supporting the amounts and disclosures in the financial statements, assessing the accounting principles used and significant estimates made by management, and evaluating the overall financial statement presentation. Our audit of internal control over financial reporting included obtaining an understanding of internal control over financial reporting, assessing the risk that a material weakness exists, and testing and evaluating the design and operating effectiveness of internal control based on the assessed risk. Our audits also included performing such other procedures as we considered necessary in the circumstances. We believe that our audits provide a reasonable basis for our opinions.
A company's internal control over financial reporting is a process designed to provide reasonable assurance regarding the reliability of financial reporting and the preparation of financial statements for external purposes in accordance with generally accepted accounting principles. A company's internal control over financial reporting includes those policies and procedures that (1) pertain to the maintenance of records that, in reasonable detail, accurately and fairly reflect the transactions and dispositions of the assets of the company; (2) provide reasonable assurance that transactions are recorded as necessary to permit preparation of financial statements in accordance with generally accepted accounting principles, and that receipts and expenditures of the company are being made only in accordance with authorizations of management and directors of the company; and (3) provide reasonable assurance regarding prevention or timely detection of unauthorized acquisition, use, or disposition of the company's assets that could have a material effect on the financial statements.
Because of its inherent limitations, internal control over financial reporting may not prevent or detect misstatements. Also, projections of any evaluation of effectiveness to future periods are subject to the risk that controls may become inadequate because of changes in conditions, or that the degree of compliance with the policies or procedures may deteriorate.
In our opinion, the consolidated financial statements referred to above present fairly, in all material respects, the financial position of Synopsys, Inc. and subsidiaries as of October 28, 2017 and October 29, 2016, and the results of their operations and their cash flows for each of the years in the three-year period ended October 28, 2017, in conformity with U.S. generally accepted accounting principles. Also in our opinion, Synopsys, Inc. maintained, in all material respects, effective internal control over financial reporting as of October 28, 2017, based on criteria established in Internal Control - Integrated Framework (2013) issued by the Committee of Sponsoring Organizations of the Treadway Commission (COSO).
/s/ KPMG LLP
Santa Clara, California
December 13, 2017
49
Table of Contents
SYNOPSYS, INC.
CONSOLIDATED BALANCE SHEETS
(In thousands, except par value amounts)
| October 31, | ||||||
| 2017 |
| 2016 | ||||
ASSETS |
|
|
| ||||
Current assets: |
|
|
| ||||
Cash and cash equivalents | $ | 1,048,356 | |
| $ | 976,620 | |
Short-term investments | - | |
| 140,695 | | ||
Total cash, cash equivalents and short-term investments | 1,048,356 | |
| 1,117,315 | | ||
Accounts receivable, net of allowances of $5,165 and $3,201, respectively | 451,144 | |
| 438,873 | | ||
Income taxes receivable and prepaid taxes | 48,257 | |
| 56,091 | | ||
Prepaid and other current assets | 134,836 | |
| 104,659 | | ||
Total current assets | 1,682,593 | |
| 1,716,938 | | ||
Property and equipment, net | 266,014 | |
| 257,035 | | ||
Goodwill | 2,706,974 | |
| 2,518,245 | | ||
Intangible assets, net | 253,843 | |
| 266,661 | | ||
Long-term prepaid taxes | 20,157 | |
| 13,991 | | ||
Deferred income taxes | 243,989 | |
| 281,926 | | ||
Other long-term assets | 222,844 | |
| 185,569 | | ||
Total assets | $ | 5,396,414 | |
| $ | 5,240,365 | |
LIABILITIES AND STOCKHOLDERS' EQUITY |
|
|
| ||||
Current liabilities: |
|
|
| ||||
Accounts payable and accrued liabilities | $ | 499,846 | |
| $ | 401,451 | |
Accrued income taxes | 39,811 | |
| 22,693 | | ||
Deferred revenue | 1,064,528 | |
| 1,085,802 | | ||
Short-term debt | 9,924 | |
| 205,000 | | ||
Total current liabilities | 1,614,109 | |
| 1,714,946 | | ||
Long-term accrued income taxes | 33,239 | |
| 39,562 | | ||
Long-term deferred revenue | 83,252 | |
| 79,856 | | ||
Long-term debt | 134,063 | |
| - | | ||
Other long-term liabilities | 252,027 | |
| 210,855 | | ||
Total liabilities | 2,116,690 | |
| 2,045,219 | | ||
Stockholders' equity: |
|
|
| ||||
Preferred Stock, $0.01 par value: 2,000 shares authorized; none outstanding | - | |
| - | | ||
Common Stock, $0.01 par value: 400,000 shares authorized; 150,445 and 151,454 shares outstanding, respectively | 1,505 | |
| 1,515 | | ||
Capital in excess of par value | 1,622,429 | |
| 1,644,675 | | ||
Retained earnings | 2,143,873 | |
| 1,947,585 | | ||
Treasury stock, at cost: 6,817 and 5,811 shares, respectively | (426,208 | ) |
| (294,052 | ) | ||
Accumulated other comprehensive income (loss) | (65,979 | ) |
| (104,577 | ) | ||
Total Synopsys stockholders' equity | 3,275,620 | |
| 3,195,146 | | ||
Non-controlling interest | 4,104 | |
| - | | ||
Total stockholders' equity | 3,279,724 | |
| 3,195,146 | | ||
Total liabilities and stockholders' equity | $ | 5,396,414 | |
| $ | 5,240,365 | |
See accompanying notes to consolidated financial statements.
50
Table of Contents
SYNOPSYS, INC.
CONSOLIDATED STATEMENTS OF OPERATIONS
(In thousands, except per share amounts)
| Year Ended October 31, | ||||||||||
| 2017 |
| 2016 |
| 2015 | ||||||
Revenue: |
|
|
|
|
| ||||||
Time-based products | $ | 2,021,812 | |
| $ | 1,910,902 | |
| $ | 1,792,212 | |
Upfront products | 338,204 | |
| 248,137 | |
| 197,325 | | |||
Maintenance and service | 364,864 | |
| 263,493 | |
| 252,674 | | |||
Total revenue | 2,724,880 | |
| 2,422,532 | |
| 2,242,211 | | |||
Cost of revenue: |
|
|
|
|
| ||||||
Products | 413,203 | |
| 346,825 | |
| 303,633 | | |||
Maintenance and service | 164,872 | |
| 94,019 | |
| 105,242 | | |||
Amortization of intangible assets | 76,109 | |
| 102,118 | |
| 110,045 | | |||
Total cost of revenue | 654,184 | |
| 542,962 | |
| 518,920 | | |||
Gross margin | 2,070,696 | |
| 1,879,570 | |
| 1,723,291 | | |||
Operating expenses: |
|
|
|
|
| ||||||
Research and development | 908,841 | |
| 856,705 | |
| 776,229 | | |||
Sales and marketing | 549,248 | |
| 502,368 | |
| 474,407 | | |||
General and administrative | 196,844 | |
| 165,962 | |
| 165,097 | | |||
Amortization of intangible assets | 31,614 | |
| 27,507 | |
| 26,004 | | |||
Restructuring charges | 36,586 | |
| 9,633 | |
| 15,088 | | |||
Total operating expenses | 1,723,133 | |
| 1,562,175 | |
| 1,456,825 | | |||
Operating income | 347,563 | |
| 317,395 | |
| 266,466 | | |||
Other income (expense), net | 35,535 | |
| 12,153 | |
| 15,144 | | |||
Income (loss) before provision for income taxes | 383,098 | |
| 329,548 | |
| 281,610 | | |||
Provision (benefit) for income taxes | 246,535 | |
| 62,722 | |
| 55,676 | | |||
Net income | $ | 136,563 | |
| $ | 266,826 | |
| $ | 225,934 | |
Net income per share: |
|
|
|
|
| ||||||
Basic | $ | 0.91 | |
| $ | 1.76 | |
| $ | 1.46 | |
Diluted | $ | 0.88 | |
| $ | 1.73 | |
| $ | 1.43 | |
Shares used in computing per share amounts: |
|
|
|
|
| ||||||
Basic | 150,457 | |
| 152,017 | |
| 154,957 | | |||
Diluted | 154,874 | |
| 154,721 | |
| 158,065 | | |||
See accompanying notes to consolidated financial statements.
51
Table of Contents
SYNOPSYS, INC.
CONSOLIDATED STATEMENTS OF COMPREHENSIVE INCOME
(In thousands)
| Year Ended October 31, | ||||||||||
| 2017 |
| 2016 |
| 2015 | ||||||
Net income | $ | 136,563 | |
| $ | 266,826 | |
| $ | 225,934 | |
Other comprehensive income (loss): |
|
|
|
|
| ||||||
Change in foreign currency translation adjustment | 14,293 | |
| 5,808 | |
| (39,567 | ) | |||
Change in unrealized gains (losses) on investments, net of tax of $0, for fiscal years 2017, 2016 and 2015 | (19 | ) |
| 47 | |
| (28 | ) | |||
Cash flow hedges: |
|
|
|
|
| ||||||
Deferred gains (losses), net of tax of $(4,380), $4,372, and $7,107 for fiscal years 2017, 2016 and 2015, respectively | 20,760 | |
| (25,767 | ) |
| (18,614 | ) | |||
Reclassification adjustment on deferred (gains) losses included in net income, net of tax of $(168), $(6,253), and $(6,212) for fiscal years 2017, 2016 and 2015, respectively | 3,564 | |
| 20,710 | |
| 14,923 | | |||
Other comprehensive income (loss), net of tax effects | 38,598 | |
| 798 | |
| (43,286 | ) | |||
Comprehensive income | $ | 175,161 | |
| $ | 267,624 | |
| $ | 182,648 | |
See accompanying notes to consolidated financial statements.
52
Table of Contents
SYNOPSYS, INC.
CONSOLIDATED STATEMENTS OF STOCKHOLDERS' EQUITY
(In thousands)
| Common Stock |
| Capital in Excess of Par Value |
| Retained Earnings |
| Treasury Stock |
| Accumulated Other Comprehensive Income (Loss) |
| Total Synopsys Stockholders' Equity |
| Non-controlling Interest |
| Stockholders' Equity | |||||||||||||||||||
| Shares |
| Amount |
| ||||||||||||||||||||||||||||||
Balance at October 31, 2014 | 155,965 | |
| $ | 1,560 | |
| $ | 1,614,603 | |
| $ | 1,551,592 | |
| $ | (49,496 | ) |
| $ | (62,089 | ) |
| $ | 3,056,170 | |
| $ | - | |
| $ | 3,056,170 | |
Net income |
|
|
|
|
|
| 225,934 | |
|
|
|
|
| 225,934 | |
|
|
| 225,934 | | ||||||||||||||
Other comprehensive income (loss), net of tax effects |
|
|
|
|
|
|
|
|
|
| (43,286 | ) |
| (43,286 | ) |
|
|
| (43,286 | ) | ||||||||||||||
Purchases of treasury stock | (5,672 | ) |
| (57 | ) |
| 57 | |
|
|
| (260,000 | ) |
|
|
| (260,000 | ) |
|
|
| (260,000 | ) | |||||||||||
Equity forward contract |
|
|
|
| (20,000 | ) |
|
|
|
|
|
|
| (20,000 | ) |
|
|
| (20,000 | ) | ||||||||||||||
Common stock issued, net of shares withheld for employee taxes | 4,864 | |
| 49 | |
| (74,845 | ) |
| (51,799 | ) |
| 211,121 | |
|
|
| 84,526 | |
|
|
| 84,526 | | ||||||||||
Stock-based compensation |
|
|
|
| 86,400 | |
|
|
|
|
|
|
| 86,400 | |
|
|
| 86,400 | | ||||||||||||||
Other |
|
|
|
| 4,245 | |
|
|
|
|
|
|
| 4,245 | |
|
|
| 4,245 | | ||||||||||||||
Balance at October 31, 2015 | 155,157 | |
| $ | 1,552 | |
| $ | 1,610,460 | |
| $ | 1,725,727 | |
| $ | (98,375 | ) |
| $ | (105,375 | ) |
| $ | 3,133,989 | |
| $ | - | |
| $ | 3,133,989 | |
Net income |
|
|
|
|
|
| 266,826 | |
|
|
|
|
| 266,826 | |
|
|
| 266,826 | | ||||||||||||||
Other comprehensive income (loss), net of tax effects |
|
|
|
|
|
|
|
|
|
| 798 | |
| 798 | |
|
|
| 798 | | ||||||||||||||
Purchases of treasury stock | (8,506 | ) |
| (85 | ) |
| 20,085 | |
|
|
| (420,000 | ) |
|
|
| (400,000 | ) |
|
|
| (400,000 | ) | |||||||||||
Common stock issued, net of shares withheld for employee taxes | 4,803 | |
| 48 | |
| (80,735 | ) |
| (44,968 | ) |
| 224,323 | |
|
|
| 98,668 | |
|
|
| 98,668 | | ||||||||||
Stock-based compensation |
|
|
|
| 97,583 | |
|
|
|
|
|
|
| 97,583 | |
|
|
| 97,583 | | ||||||||||||||
Other |
|
|
|
| (2,718 | ) |
|
|
|
|
|
|
| (2,718 | ) |
|
|
| (2,718 | ) | ||||||||||||||
Balance at October 31, 2016 | 151,454 | |
| $ | 1,515 | |
| $ | 1,644,675 | |
| $ | 1,947,585 | |
| $ | (294,052 | ) |
| $ | (104,577 | ) |
| $ | 3,195,146 | |
| $ | - | |
| $ | 3,195,146 | |
Net income |
|
|
|
|
|
| 136,563 | |
|
|
|
|
| 136,563 | |
|
|
| 136,563 | | ||||||||||||||
Retained earnings adjustment due to adoption of an accounting standard related to stock-based compensation |
|
|
|
| 382 | |
| 106,107 | |
|
|
|
|
| 106,489 | |
|
|
| 106,489 | | |||||||||||||
Other comprehensive income (loss), net of tax effects |
|
|
|
|
|
|
|
|
|
| 38,598 | |
| 38,598 | |
|
|
| 38,598 | | ||||||||||||||
Purchases of treasury stock | (5,413 | ) |
| (54 | ) |
| 54 | |
|
|
| (380,000 | ) |
|
|
| (380,000 | ) |
|
|
| (380,000 | ) | |||||||||||
Equity forward contract |
|
|
|
| (20,000 | ) |
|
|
|
|
|
|
| (20,000 | ) |
|
|
| (20,000 | ) | ||||||||||||||
Common stock issued, net of shares withheld for employee taxes | 4,404 | |
| 44 | |
| (110,976 | ) |
| (46,382 | ) |
| 247,844 | |
|
|
| 90,530 | |
|
|
| 90,530 | | ||||||||||
Stock-based compensation |
|
|
|
| 108,294 | |
|
|
|
|
|
|
| 108,294 | |
|
|
| 108,294 | | ||||||||||||||
Non-controlling interest in an equity investment |
|
|
|
|
|
|
|
|
|
|
|
| - | |
| 4,104 | |
| 4,104 | | ||||||||||||||
Balance at October 31, 2017 | 150,445 | |
| $ | 1,505 | |
| $ | 1,622,429 | |
| $ | 2,143,873 | |
| $ | (426,208 | ) |
| $ | (65,979 | ) |
| $ | 3,275,620 | |
| $ | 4,104 | |
| $ | 3,279,724 | |
See accompanying notes to consolidated financial statements.
53
Table of Contents
SYNOPSYS, INC.
CONSOLIDATED STATEMENTS OF CASH FLOWS
(In thousands)
| Year Ended October 31, | ||||||||||
| 2017 |
| 2016 |
| 2015 | ||||||
Cash flow from operating activities: |
|
|
|
|
| ||||||
Net income | $ | 136,563 | |
| $ | 266,826 | |
| $ | 225,934 | |
Adjustments to reconcile net income to net cash provided by operating activities: |
|
|
|
|
| ||||||
Amortization and depreciation | 189,442 | |
| 207,032 | |
| 211,821 | | |||
Stock-based compensation | 108,294 | |
| 97,583 | |
| 86,400 | | |||
Allowance for doubtful accounts | 2,149 | |
| 950 | |
| 1,300 | | |||
(Gain) loss on sale of investments | 8 | |
| (18 | ) |
| (109 | ) | |||
Write-down of long-term investments | 1,300 | |
| - | |
| - | | |||
Deferred income taxes | 123,052 | |
| (14,037 | ) |
| 36,883 | | |||
Net changes in operating assets and liabilities, net of acquired assets and liabilities: |
|
|
|
|
| ||||||
Accounts receivable | 2,296 | |
| (43,269 | ) |
| (56,533 | ) | |||
Prepaid and other current assets | (28,955 | ) |
| (37,641 | ) |
| (23,106 | ) | |||
Other long-term assets | (40,236 | ) |
| (3,770 | ) |
| (16,259 | ) | |||
Accounts payable and accrued liabilities | 137,631 | |
| 18,977 | |
| 27,568 | | |||
Income taxes | 19,665 | |
| 7,098 | |
| (48,878 | ) | |||
Deferred revenue | (16,644 | ) |
| 86,904 | |
| 50,139 | | |||
Net cash provided by operating activities | 634,565 | |
| 586,635 | |
| 495,160 | | |||
Cash flows from investing activities: |
|
|
|
|
| ||||||
Proceeds from sales and maturities of short-term investments | 295,633 | |
| 156,350 | |
| 109,173 | | |||
Purchases of short-term investments | (155,098 | ) |
| (168,712 | ) |
| (238,902 | ) | |||
Proceeds from sales of long-term investments | 839 | |
| 1,785 | |
| - | | |||
Purchases of long-term investments | - | |
| (1,002 | ) |
| - | | |||
Purchases of property and equipment | (70,328 | ) |
| (66,909 | ) |
| (86,965 | ) | |||
Cash paid for acquisitions and intangible assets, net of cash acquired | (259,202 | ) |
| (60,056 | ) |
| (340,153 | ) | |||
Capitalization of software development costs | (3,226 | ) |
| (4,131 | ) |
| (3,682 | ) | |||
Other | 2,100 | |
| - | |
| 900 | | |||
Net cash used in investing activities | (189,282 | ) |
| (142,675 | ) |
| (559,629 | ) | |||
Cash flows from financing activities: |
|
|
|
|
| ||||||
Proceeds from credit facility | 320,000 | |
| 185,000 | |
| 460,000 | | |||
Repayment of debt | (380,625 | ) |
| (185,000 | ) |
| (330,425 | ) | |||
Issuances of common stock | 126,337 | |
| 125,283 | |
| 109,764 | | |||
Payments for taxes related to net share settlement of equity awards | (36,730 | ) |
| (26,562 | ) |
| (24,860 | ) | |||
Purchase of equity forward contract | (20,000 | ) |
| - | |
| (20,000 | ) | |||
Purchases of treasury stock | (380,000 | ) |
| (400,000 | ) |
| (260,000 | ) | |||
Other | (2,102 | ) |
| (5,658 | ) |
| 3,451 | | |||
Net cash used in financing activities | (373,120 | ) |
| (306,937 | ) |
| (62,070 | ) | |||
Effect of exchange rate changes on cash and cash equivalents | (427 | ) |
| 3,409 | |
| (23,035 | ) | |||
Net change in cash and cash equivalents | 71,736 | |
| 140,432 | |
| (149,574 | ) | |||
Cash and cash equivalents, beginning of year | 976,620 | |
| 836,188 | |
| 985,762 | | |||
Cash and cash equivalents, end of year | $ | 1,048,356 | |
| $ | 976,620 | |
| $ | 836,188 | |
Supplemental disclosure of cash flow information: |
|
|
|
|
| ||||||
Cash paid for income taxes during the year: | $ | 103,478 | |
| $ | 69,447 | |
| $ | 59,731 | |
Interest payments during the year: | $ | 7,095 | |
| $ | 3,708 | |
| $ | 2,710 | |
See accompanying notes to consolidated financial statements.
54
SYNOPSYS, INC.
NOTES TO CONSOLIDATED FINANCIAL STATEMENTS
Note 1. Description of Business
Synopsys, Inc. (Synopsys or the Company) provides software, intellectual property and services used by designers across the entire silicon to software spectrum, from engineers creating advanced semiconductors to software developers seeking to ensure the security and quality of their applications. The Company is a global leader in supplying the electronic design automation (EDA) software that engineers use to design and test integrated circuits (ICs), also known as chips. The Company also offers semiconductor intellectual property (IP) products, which are pre-designed circuits that engineers use as components of larger chip designs rather than design those circuits themselves. The Company provides software and hardware used to develop the electronic systems that incorporate chips and the software that runs on them. To complement these offerings, the Company provides technical services and support to help its customers develop advanced chips and electronic systems. The Company is also a leading provider of software tools and services that improve the security and quality of software code in a wide variety of industries, including electronics, financial services, media, automotive, medicine, energy and industrials.
Note 2. Summary of Significant Accounting Policies
Fiscal Year End. The Company's fiscal year ends on the Saturday nearest to October 31 and consists of 52 weeks, with the exception that approximately every five years, the Company has a 53-week year. Fiscal 2017 , 2016 , and 2015 were 52-week years ending on October 28, 2017, October 29, 2016, and October 31, 2015, respectively. For presentation purposes, the consolidated financial statements and accompanying notes refer to the closest calendar month end. Fiscal 2018 will be a 53-week year.
Principles of Consolidation. The consolidated financial statements include the accounts of the Company and all of its subsidiaries. All significant intercompany accounts and transactions have been eliminated.
Use of Estimates. To prepare financial statements in conformity with U.S. generally accepted accounting principles (U.S. GAAP), management must make estimates and assumptions that affect the amounts reported in the consolidated financial statements and accompanying notes. Actual results could differ from these estimates and may result in material effects on the Company's operating results and financial position.
Foreign Currency Translation. The functional currency of the majority of the Company's active foreign subsidiaries is the foreign subsidiary's local currency. Assets and liabilities that are not denominated in the functional currency are remeasured into the functional currency with any related gain or loss recorded in earnings. The Company translates assets and liabilities of its non-U.S. dollar functional currency foreign operations into the U.S. dollar reporting currency at exchange rates in effect at the balance sheet date. The Company translates income and expense items of such foreign operations into U.S. dollars reporting currency at average exchange rates for the period. Accumulated translation adjustments are reported in stockholders' equity, as a component of accumulated other comprehensive income (loss).
Foreign Currency Contracts. The Company operates internationally and is exposed to potentially adverse movements in currency exchange rates. The Company enters into hedges in the form of foreign currency forward contracts to reduce its exposure to foreign currency rate changes on non-functional currency denominated forecasted transactions and balance sheet positions. The assets or liabilities associated with the forward contracts are recorded at fair value in other current assets or accrued liabilities in the consolidated balance sheet.
The accounting for gains and losses resulting from changes in fair value depends on the use of the foreign currency forward contract and whether it is designated and qualifies for hedge accounting. See Note 5. Financial Assets and Liabilities .
Fair Values of Financial Instruments. The Company's cash equivalents, short-term investments and foreign currency contracts are carried at fair value. The fair value of the Company's accounts receivable and accounts payable approximates the carrying amount due to their short duration. Non-marketable equity securities are carried at cost, net of impairments. The Company performs periodic impairment analysis over these non-marketable equity securities. The carrying amount of the short-term debt approximates the estimated fair value. See Note 6. Fair Value Measures .
Cash, Cash Equivalents and Short-term Investments . The Company classifies investments with original maturities of three months or less when acquired as cash equivalents. All of the Company's short-term investments are classified as available-for-sale and are reported at fair value, with unrealized gains and losses included in stockholders' equity as a component of accumulated other comprehensive income (loss), net of tax. Those
55
Table of Contents
SYNOPSYS, INC.
NOTES TO CONSOLIDATED FINANCIAL STATEMENTS-Continued
unrealized gains or losses deemed other than temporary are reflected in other income (expense), net. The cost of securities sold is based on the specific identification method and realized gains and losses are included in other income (expense), net. See Note 5. Financial Assets and Liabilities.
Concentration of Credit Risk . Financial instruments that potentially subject the Company to significant concentrations of credit risk consist principally of cash equivalents, marketable securities, foreign currency contracts, and accounts receivable from trade customers. The Company maintains cash equivalents primarily in highly rated taxable and tax-exempt money market funds located in the U.S. and in various overseas locations.
The Company sells its products worldwide primarily to customers in the global electronics market. The Company performs on-going credit evaluations of its customers' financial condition and does not require collateral. The Company establishes reserves for potential credit losses and such losses have been within management's expectations and have not been material in any year presented.
Accounts Receivable, Net. The balances consist of accounts receivable billed and unbilled. Unbilled accounts receivable represent amounts recorded as revenue which will be invoiced within one year of the balance sheet date. The following table represents the components of accounts receivable, net:
| October 31, | ||||||
| 2017 |
| 2016 | ||||
| (in thousands) | ||||||
Accounts receivable | $ | 393,229 | |
| $ | 394,314 | |
Unbilled accounts receivable | 63,080 | |
| 47,760 | | ||
Total accounts receivable | 456,309 | |
| 442,074 | | ||
Less allowance for doubtful accounts | (5,165 | ) |
| (3,201 | ) | ||
Total accounts receivable, net | $ | 451,144 | |
| $ | 438,873 | |
Allowance for Doubtful Accounts. Trade accounts receivable are recorded at the invoiced amount and do not bear interest. The Company maintains allowances for doubtful accounts to reduce the Company's receivables to their estimated net realizable value. The Company provides a general reserve on all accounts receivable based on a review of customer accounts. The following table presents the changes in the allowance for doubtful accounts:
Fiscal Year | Balance at Beginning of Period |
| Provisions |
| Write-offs(1) |
| Balance at End of Period | ||||||||
| (in thousands) | ||||||||||||||
2017 | $ | 3,201 | |
| $ | 2,149 | |
| $ | (185 | ) |
| $ | 5,165 | |
2016 | $ | 2,561 | |
| $ | 950 | |
| $ | (310 | ) |
| $ | 3,201 | |
2015 | $ | 2,026 | |
| $ | 1,300 | |
| $ | (765 | ) |
| $ | 2,561 | |
(1) | Balances written off, net of recoveries. |
Income Taxes. The Company accounts for income taxes using the asset and liability method. Deferred tax assets and liabilities are recognized for the future tax consequences attributable to differences between the financial statement carrying amounts of existing assets and liabilities and their respective tax bases and operating loss and tax credit carryforwards. Deferred tax assets and liabilities are measured using enacted tax rates expected to apply to taxable income in the years in which those temporary differences are expected to be recovered or settled. The effect on deferred tax assets and liabilities of a change in tax rates is recognized in income in the period that includes the enactment date.
The Company accounts for uncertainty in income taxes using a two-step approach to recognizing and measuring uncertain tax positions. The first step is to evaluate the tax position for recognition by determining whether it is more likely than not that the position will be sustained on audit, including resolution of related appeals or litigation processes, if any. The second step is to measure the tax benefit as the largest amount which is more than 50% likely of being realized upon ultimate settlement. An uncertain tax position is considered effectively settled on completion of an examination by a taxing authority if certain other conditions are satisfied.
56
Table of Contents
SYNOPSYS, INC.
NOTES TO CONSOLIDATED FINANCIAL STATEMENTS-Continued
Property and Equipment. Property and equipment is recorded at cost less accumulated depreciation. Assets, excluding land, are depreciated using the straight-line method over their estimated useful lives. Leasehold improvements are amortized using the straight-line method over the remaining term of the lease or the economic useful life of the asset, whichever is shorter. Depreciation expenses were $82.8 million , $73.8 million and $71.1 million in fiscal 2017 , 2016 and 2015 , respectively. Repair and maintenance costs are expensed as incurred and such costs were $40.6 million , $38.8 million and $32.3 million in fiscal 2017 , 2016 and 2015 , respectively.
| October 31, | ||||||
| 2017 |
| 2016 | ||||
| (in thousands) | ||||||
Computer and other equipment | $ | 540,257 | |
| $ | 486,109 | |
Buildings | 68,877 | |
| 68,194 | | ||
Furniture and fixtures | 54,882 | |
| 51,589 | | ||
Land | 20,414 | |
| 20,414 | | ||
Leasehold improvements | 153,619 | |
| 136,773 | | ||
| 838,049 | |
| 763,079 | | ||
Less accumulated depreciation and amortization(1) | (572,035 | ) |
| (506,044 | ) | ||
Total | $ | 266,014 | |
| $ | 257,035 | |
(1) | Accumulated depreciation and amortization includes write-offs due to retirement of fully amortized fixed assets. |
The useful lives of depreciable assets are as follows:
| Useful Life in Years |
Computer and other equipment | 3-5 |
Buildings | 30 |
Furniture and fixtures | 5 |
Leasehold improvements (average) | 5 |
Goodwill. Goodwill represents the excess of the aggregate purchase price over the fair value of the net tangible and identifiable intangible assets acquired by the Company. The carrying amount of goodwill is tested for impairment annually as of October 31 or more frequently if facts and circumstances warrant a review. The Company determined that it is a single reporting unit for the purpose of goodwill impairment tests. For purposes of assessing the impairment of goodwill, the Company estimates the value of the reporting unit using its market capitalization as the best evidence of fair value. This fair value is then compared to the carrying value of the reporting unit. During fiscal 2017 , 2016 and 2015 , there were no indicators of impairment to goodwill.
Intangible Assets. Intangible assets consist of acquired technology, certain contract rights, customer relationships, trademarks and trade names, covenants not to compete, capitalized software, and in-process research and development. These intangible assets are acquired through business combinations, direct purchases, or internally developed capitalized software. Intangible assets are amortized on a straight-line basis over their estimated useful lives which range from one to ten years.
The Company continually monitors events and changes in circumstances that could indicate carrying amounts of long-lived assets, including property and equipment and intangible assets, may not be recoverable. When such events or changes in circumstances occur, the Company assesses the recoverability of long-lived assets by determining whether the carrying value of such asset group will be recovered through the undiscounted future cash flow. If the undiscounted future cash flow is less than the carrying amount of the asset group, the Company recognizes an impairment loss based on the excess of the carrying amount over the fair value of the asset group. The Company had no impairments of any long-lived assets in fiscal 2017 , 2016 or 2015 .
57
Table of Contents
SYNOPSYS, INC.
NOTES TO CONSOLIDATED FINANCIAL STATEMENTS-Continued
Restructuring Charges. During fiscal 2017, the Company recorded $36.6 million of restructuring charges for severance and benefits due to involuntary and voluntary employee termination actions. The restructuring actions were undertaken to position the Company for future growth, reallocate resources to priority areas, and to a lesser extent, eliminate operational redundancy. These charges consist primarily of severance and retirement benefits. As of October 31, 2017, there was a $17.5 million outstanding balance remaining in accounts payable and accrued liabilities as payroll and related benefits in the consolidated balance sheets. Payments under the 2017 restructuring plans are expected to be completed by the end of the second quarter of fiscal 2018.
During fiscal 2016, the Company recorded $9.6 million of restructuring charges for severance and benefits due to involuntary employee terminations, of which $3.9 million was paid in fiscal 2016. As of October 31, 2016, there was a $5.7 million outstanding balance remaining in accounts payable and accrued liabilities as payroll and related benefits in the consolidated balance sheets. The remaining balance was paid in fiscal 2017.
Accounts Payable and Accrued Liabilities. The balance consists of:
| October 31, | ||||||
| 2017 |
| 2016 | ||||
| (in thousands) | ||||||
Payroll and related benefits | $ | 382,773 | |
| $ | 321,430 | |
Other accrued liabilities | 97,119 | |
| 66,276 | | ||
Accounts payable | 19,954 | |
| 13,745 | | ||
Total | $ | 499,846 | |
| $ | 401,451 | |
Other Long-term Liabilities. The balance consists of:
| October 31, | ||||||
| 2017 |
| 2016 | ||||
| (in thousands) | ||||||
Deferred compensation liability (See Note 10 ) | $ | 197,542 | |
| $ | 163,185 | |
Other long-term liabilities | 54,485 | |
| 47,670 | | ||
Total | $ | 252,027 | |
| $ | 210,855 | |
Other Comprehensive Income (Loss). Other comprehensive income (loss) (OCI) includes all changes in equity during a period, such as accumulated net translation adjustments, unrealized gain (loss) on certain foreign currency forward contracts that qualify as cash flow hedges, reclassification adjustments related to cash flow hedges and unrealized gain (loss) on investments. See Note 8 . Accumulated Other Comprehensive Income (Loss) .
Revenue Recognition. The Company generates revenue from the sale of products that include software licenses, maintenance and services and to a lesser extent, hardware products. Software license revenue consists of fees associated with the licensing of the Company's software. Maintenance and service revenue consists of maintenance fees associated with perpetual licenses and professional services fees. Hardware revenue consists of sales of Field Programmable Gate Array (FPGA)-based emulation and prototyping products.
Most of the Company's customer arrangements are complex, involving hundreds of products and various license rights, bundled with post-contract customer support and additional meaningful rights that provide a complete end-to-end solution to the customer. Throughout the contract, the Company's customers are typically using a myriad of products to complete each phase of a chip design and are concurrently working on multiple chip designs, or projects, in different phases of the design. During this time, the customer looks to the Company to release state-of-the-art technology to address requested enhancements to the Company's tools to meet customer specifications, to provide support at each stage of the customer's design, including the final manufacturing of the chip (the tape out stage), and other important services.
With respect to software licenses, the Company utilizes primarily two license types:
• | Technology Subscription Licenses (TSLs). TSLs are time-based licenses for a finite term, and generally provide the customer limited rights to receive, or to exchange certain quantities of licensed software for, unspecified future technology. The majority of the Company's arrangements are TSLs due to the nature of the business and customer requirements. In addition to the licenses, the |
58
Table of Contents
SYNOPSYS, INC.
NOTES TO CONSOLIDATED FINANCIAL STATEMENTS-Continued
arrangements also include: post-contract customer support, which includes providing frequent updates and upgrades to maintain the utility of the software due to rapid changes in technology; other intertwined services such as multiple copies of the tools; assisting the Company's customers in applying the Company's technology in their development environment; and rights to remix licenses for other licenses.
• | Perpetual licenses. Perpetual licenses continue as long as the customer renews maintenance plus an additional 20 years. Perpetual licenses do not provide the customer any rights to receive, or to exchange licensed software for, unspecified future technology. Customers purchase maintenance separately for the first year and may renew annually. |
For the two software license types, the Company recognizes revenue as follows:
• | TSLs. The Company typically recognizes revenue from TSL fees ratably over the term of the license period, or as customer installments become due and payable, whichever is later. Revenue attributable to TSLs is reported as "time-based products revenue" in the consolidated statements of operations. |
• | Perpetual licenses. The Company recognizes revenue from perpetual licenses in full upon shipment of the software if payment terms require the customer to pay at least 75% of the license fee and 100% of the maintenance fee within one year from shipment and all other revenue recognition criteria are met. Revenue attributable to these perpetual licenses is reported as "upfront products revenue" in the consolidated statements of operations. For perpetual licenses in which less than 75% of the license fee and 100% of the maintenance fee is payable within one year from shipment, the Company recognizes revenue as customer installments become due and payable. Such revenue is reported as "time-based products revenue" in the consolidated statements of operations. |
The Company's maintenance and service revenue primarily consists of maintenance fees associated with perpetual licenses and hardware products, and professional services fees. The Company recognizes revenue from maintenance arrangements ratably over the maintenance period to the extent cash has been received or fees become due and payable, and recognizes revenue from professional services and training fees as such services are performed and accepted by the customers as needed. Revenue attributable to maintenance, professional services and training is reported as "maintenance and service revenue" in the consolidated statements of operations.
Hardware revenue consists of sales of FPGA-based emulation and prototyping products. The Company recognizes revenue from sales of hardware products in full upon shipment if all other revenue recognition criteria are met. Revenue attributable to these sales is reported as "upfront products revenue" in the consolidated statements of operations.
Infrequently, the Company enters into certain license arrangements wherein licenses are provided for a finite term without any other services or rights, including rights to receive, or to exchange licensed software for, unspecified future technology. The Company recognizes revenue from these term licenses in full upon shipment of the software and when all other revenue recognition criteria are met.
The Company also enters into arrangements in which portions of revenue are contingent upon the occurrence of uncertain future events, for example, royalty arrangements. The Company refers to this revenue as "contingent revenue." Contingent revenue is recognized if and when the event that removes the contingency occurs. Such revenue is reported as "time-based products revenue" in the consolidated statements of operations. These arrangements are not material to the Company's total revenue.
The Company infrequently enters into multiple-element arrangements that contain both software and non-software deliverables such as hardware. The Company has determined that the software and non-software deliverables in the Company's contracts are separate units of accounting. The Company recognizes revenue for the separate units of accounting when all revenue recognition criteria are met. Revenue allocated to hardware units of accounting is recognized upon shipment when all other revenue recognition criteria are met. Revenue allocated to software units of accounting is recognized depending on the software license type (TSL or perpetual license). Such arrangements have not had a material effect on the Company's consolidated financial statements and are not expected to have a material effect in future periods.
59
Table of Contents
SYNOPSYS, INC.
NOTES TO CONSOLIDATED FINANCIAL STATEMENTS-Continued
The Company also enters into arrangements to deliver software products, either alone or together with other products or services, that require significant modification or customization of the software. The Company accounts for such arrangements using the percentage of completion method as the Company has the ability to make reasonably dependable estimates that relate to the extent of progress toward completion, contract revenues and costs. The Company measures the progress towards completion using the labor hours incurred to complete the project. Revenue attributable to these arrangements is reported as "maintenance and service revenue" in the consolidated statements of operations.
The Company determines the fair value of each element in multiple element software arrangements that only contain software and software-related deliverables based on vendor-specific objective evidence (VSOE). The Company limits assessment of VSOE of fair value for each element to the price charged when such element is sold separately. The Company has analyzed all of the elements included in multiple-element software arrangements and has determined that the Company has sufficient VSOE to allocate revenue to the maintenance components of the Company's perpetual license products and to professional services. Accordingly, assuming all other revenue recognition criteria are met, the Company recognizes license revenue from perpetual licenses upon delivery using the residual method, recognizes revenue from maintenance ratably over the maintenance term, and recognizes revenue from professional services as services are performed and accepted by the customer. With respect to TSL arrangements, due to the complexity of the tools, the complexity of the arrangement terms and intertwined services, the license, maintenance and other services are not separable and are considered as a combined unit. Additionally, the Company does not have sufficient VSOE of fair value to allocate the fee between these services. Therefore, the Company recognizes revenue from TSLs ratably over the term of the license, assuming all other revenue recognition criteria are met.
Revenue recognition involves certain judgments, specifically, in connection with each transaction involving the Company's products, the Company must evaluate whether: (1) persuasive evidence of an arrangement exists, (2) delivery of software or services has occurred, (3) the fee for such software or services is fixed or determinable, and (4) collectability is probable. All four of these criteria must be met in order for the Company to recognize revenue with respect to a particular arrangement. The Company applies these revenue recognition criteria as follows:
• | Persuasive Evidence of an Arrangement Exists. Prior to recognizing revenue on an arrangement, the Company's customary policy is to have a written contract, signed by both the customer and by the Company or a purchase order from those customers that have previously negotiated a standard end-user license arrangement or purchase agreement. |
• | Delivery Has Occurred. The Company delivers its products to its customers electronically or physically. For electronic deliveries, delivery occurs when the Company provides access to its customers to take immediate possession of the software through downloading it to the customer's hardware. For physical deliveries, the standard transfer terms are typically Freight on Board (FOB) shipping point. The Company generally ships its products or license keys promptly after acceptance of customer orders. However, a number of factors can affect the timing of product shipments and, as a result, timing of revenue recognition, including the delivery dates requested by customers and the Company's operational capacity to fulfill product orders at the end of a fiscal quarter. |
• | The Fee is Fixed or Determinable. The Company's determination that an arrangement fee is fixed or determinable depends principally on the arrangement's payment terms. The Company's standard payment terms for perpetual licenses require 75% or more of the license fee and 100% of the maintenance fee to be paid within one year. If the arrangement includes these terms, the Company regards the fee as fixed or determinable, and recognizes all license revenue under the arrangement in full upon delivery (assuming all other revenue recognition criteria are met). If the arrangement does not include these terms, the Company does not consider the fee to be fixed or determinable and generally recognizes revenue when customer installments are due and payable. In the case of a TSL, because of the right to exchange products or receive unspecified future technology and because VSOE for maintenance services does not exist for a TSL, the Company recognizes revenue ratably over the term of the license, but not in advance of when customers' installments become due and payable. |
• | Collectability is Probable. The Company judges collectability of the arrangement fees on a customer-by-customer basis pursuant to its credit review policy. The Company typically sells to customers with |
60
Table of Contents
SYNOPSYS, INC.
NOTES TO CONSOLIDATED FINANCIAL STATEMENTS-Continued
whom it has a history of successful collection. For a new customer, or when an existing customer substantially expands its commitments, the Company evaluates the customer's financial position and ability to pay and typically assigns a credit limit based on that review. The Company increases the credit limit only after it has established a successful collection history with the customer. If the Company determines at any time that collectability is not probable under a particular arrangement based upon its credit review process or the customer's payment history, the Company recognizes revenue under that arrangement as customer payments are actually received.
Warranties and Indemnities. The Company generally warrants its products to be free from defects in media and to substantially conform to material specifications for a period of 90 days for software products and for up to six months for hardware systems. In certain cases, the Company also provides its customers with limited indemnification with respect to claims that their use of the Company's software products infringes on United States patents, copyrights, trademarks or trade secrets. The Company is unable to estimate the potential impact of these commitments on the future results of operations. To date, the Company has not been required to pay any material warranty claims.
Net Income Per Share. The Company computes basic income per share by dividing net income available to common shareholders by the weighted average number of common shares outstanding during the period. Diluted net income per share reflects the dilution from potential common shares outstanding such as stock options and unvested restricted stock units and awards during the period using the treasury stock method.
The table below reconciles the weighted average common shares used to calculate basic net income per share with the weighted average common shares used to calculate diluted net income per share:
| Year Ended October 31, | ||||||||||
| 2017 |
| 2016 |
| 2015 | ||||||
| (in thousands) | ||||||||||
Numerator: |
|
|
|
|
| ||||||
Net income | $ | 136,563 | |
| $ | 266,826 | |
| $ | 225,934 | |
Denominator: |
|
|
|
|
| ||||||
Weighted average common shares for basic net income per share | 150,457 | |
| 152,017 | |
| 154,957 | | |||
Dilutive effect of common share equivalents from equity-based compensation | 4,417 | |
| 2,704 | |
| 3,108 | | |||
Weighted average common shares for diluted net income per share | 154,874 | |
| 154,721 | |
| 158,065 | | |||
Net income per share: |
|
|
|
|
| ||||||
Basic | $ | 0.91 | |
| $ | 1.76 | |
| $ | 1.46 | |
Diluted | $ | 0.88 | |
| $ | 1.73 | |
| $ | 1.43 | |
Anti-dilutive employee stock-based awards excluded(1) | 345 | |
| 1,971 | |
| 1,363 | | |||
(1) | These stock options and unvested restricted stock units were anti-dilutive for the respective periods and are excluded in calculating diluted net income per share. While such awards were anti-dilutive for the respective periods, they could be dilutive in the future. |
61
Table of Contents
Note 3. Business Combinations
Fiscal 2017 Acquisitions
During fiscal 2017, the Company completed acquisitions with an aggregated total purchase consideration of $259.7 million , net of cash acquired. The Company assumed unvested stock options with a fair value of $4.4 million using the Black-Scholes option-pricing model and will expense the options over their remaining service periods on a straight-line basis. The Company does not consider these acquisitions to be material, individually or in the aggregate, to the Company's consolidated financial statements. The preliminary purchase price allocations resulted in $178.5 million of goodwill, of which $11.9 million is deductible for tax purposes, and $95.7 million of acquired identifiable intangible assets valued using the income or cost method. The intangible assets are being amortized over their respective useful lives ranging from one to seven years. The acquisition-related costs for these acquisitions totaling $6.5 million were expensed as incurred in the consolidated statement of operations. The Company funded the acquisitions with existing cash and debt.
The preliminary fair value estimates for the assets acquired and liabilities assumed for the acquisitions during the fourth quarter of fiscal 2017 are not yet finalized and may change as additional information becomes available during the respective measurement periods. The primary areas of those preliminary estimates relate to certain tangible assets and liabilities, identifiable intangible assets, and income taxes. Additional information, which existed as of the acquisition date but is yet unknown to the Company, may become known to the Company during the remainder of the measurement period, a period not to exceed 12 months from the acquisition date. Changes to the provisional amounts recorded as assets or liabilities during the measurement period may result in an adjustment to goodwill.
Note 4. Goodwill and Intangible Assets
Goodwill:
| (in thousands) | ||
Balance at October 31, 2015 | $ | 2,471,241 | |
Additions | 39,172 | | |
Adjustments | 435 | | |
Effect of foreign currency translation | 7,397 | | |
Balance at October 31, 2016 | $ | 2,518,245 | |
Additions | 178,545 | | |
Effect of foreign currency translation | 10,184 | | |
Balance at October 31, 2017(1) | $ | 2,706,974 | |
(1) | There is no impairment of goodwill for periods presented. |
Intangible assets as of October 31, 2017 consist of the following:
| Gross Assets |
| Accumulated Amortization |
| Net Assets | ||||||
| (in thousands) | ||||||||||
Core/developed technology | $ | 647,975 | |
| $ | 526,796 | |
| $ | 121,179 | |
Customer relationships | 278,811 | |
| 166,886 | |
| 111,925 | | |||
Contract rights intangible | 174,615 | |
| 172,178 | |
| 2,437 | | |||
Trademarks and trade names | 25,329 | |
| 17,401 | |
| 7,928 | | |||
In-process research and development (IPR&D)(2) | 6,600 | |
| - | |
| 6,600 | | |||
Capitalized software development costs | 32,868 | |
| 29,094 | |
| 3,774 | | |||
Total | $ | 1,166,198 | |
| $ | 912,355 | |
| $ | 253,843 | |
(2) | IPR&D is reclassified to core/developed technology upon completion or is written off upon abandonment. |
62
Table of Contents
SYNOPSYS, INC.
NOTES TO CONSOLIDATED FINANCIAL STATEMENTS-Continued
Intangible assets as of October 31, 2016 consist of the following:
| Gross Assets |
| Accumulated Amortization |
| Net Assets | ||||||
| (in thousands) | ||||||||||
Core/developed technology | $ | 610,812 | |
| $ | 460,722 | |
| $ | 150,090 | |
Customer relationships | 235,997 | |
| 139,932 | |
| 96,065 | | |||
Contract rights intangible | 171,248 | |
| 162,183 | |
| 9,065 | | |||
Trademarks and trade names | 20,729 | |
| 13,821 | |
| 6,908 | | |||
Capitalized software development costs | 29,642 | |
| 25,109 | |
| 4,533 | | |||
Total | $ | 1,068,428 | |
| $ | 801,767 | |
| $ | 266,661 | |
Amortization expense related to intangible assets consisted of the following:
| Year Ended October 31, | ||||||||||
| 2017 |
| 2016 |
| 2015 | ||||||
| (in thousands) | ||||||||||
Core/developed technology | $ | 65,916 | |
| $ | 85,331 | |
| $ | 76,674 | |
Customer relationships | 27,340 | |
| 24,594 | |
| 23,104 | | |||
Contract rights intangible | 10,886 | |
| 16,543 | |
| 33,350 | | |||
Trademarks and trade names | 3,580 | |
| 3,156 | |
| 2,900 | | |||
Capitalized software development costs(3) | 3,986 | |
| 3,697 | |
| 3,653 | | |||
Total | $ | 111,708 | |
| $ | 133,321 | |
| $ | 139,681 | |
(3) | Amortization of capitalized software development costs is included in cost of products revenue in the consolidated statements of operations. |
The following table presents the estimated future amortization of intangible assets:
Fiscal Year | (in thousands) | ||
2018 | $ | 88,907 | |
2019 | 62,940 | | |
2020 | 44,938 | | |
2021 | 26,708 | | |
2022 | 16,648 | | |
2023 and thereafter | 7,102 | | |
IPR&D(4) | 6,600 | | |
Total | $ | 253,843 | |
(4) | IPR&D assets are amortized over their useful lives upon completion or are written off upon abandonment. |
Note 5. Financial Assets and Liabilities
Cash equivalents and short-term investments. The Company classifies time deposits and other investments with maturities less than three months as cash equivalents. Debt securities and other investments with maturities longer than three months are classified as short-term investments. The Company's investments generally have a term of less than three years and are classified as available-for-sale carried at fair value, with unrealized gains and losses included in the consolidated balance sheets as a component of accumulated other comprehensive income (loss), net of tax. Those unrealized gains or losses deemed other than temporary are reflected in other income (expense), net. The cost of securities sold is based on the specific identification method and realized gains and losses are included in other income (expense), net.
63
Table of Contents
SYNOPSYS, INC.
NOTES TO CONSOLIDATED FINANCIAL STATEMENTS-Continued
| Cost |
| Gross |
| Gross |
| Gross |
| Estimated | ||||||||||
| (in thousands) | ||||||||||||||||||
Cash equivalents: |
|
|
|
|
|
|
|
|
| ||||||||||
Money market funds | $ | 560,594 | |
| $ | - | |
| $ | - | |
| $ | - | |
| $ | 560,594 | |
Total: | $ | 560,594 | |
| $ | - | |
| $ | - | |
| $ | - | |
| $ | 560,594 | |
|
|
|
|
|
|
|
|
|
| ||||||||||
Other long-term assets: |
|
|
|
|
|
|
|
|
| ||||||||||
Non-marketable equity securities | $ | 7,826 | |
| $ | - | |
| $ | - | |
| $ | - | |
| $ | 7,826 | |
Total: | $ | 7,826 | |
| $ | - | |
| $ | - | |
| $ | - | |
| $ | 7,826 | |
(1) | See Note 6. Fair Value Measures for further discussion on fair values of cash equivalents and investments. |
64
Table of Contents
SYNOPSYS, INC.
NOTES TO CONSOLIDATED FINANCIAL STATEMENTS-Continued
As of October 31, 2016 , the balances of our cash equivalents and non-marketable equity securities investments are:
| Cost |
| Gross |
| Gross |
| Gross |
| Estimated | ||||||||||
| (in thousands) | ||||||||||||||||||
Cash equivalents: |
|
|
|
|
|
|
|
|
| ||||||||||
Money market funds | $ | 499,274 | |
| $ | - | |
| $ | - | |
| $ | - | |
| $ | 499,274 | |
Commercial paper | 1,498 | |
| - | |
| - | |
| - | |
| $ | 1,498 | | ||||
Certificates of deposit | 4,200 | |
| - | |
| - | |
| - | |
| $ | 4,200 | | ||||
Total: | 504,972 | |
| - | |
| - | |
| - | |
| 504,972 | | |||||
Short-term investments: |
|
|
|
|
|
|
|
|
| ||||||||||
U.S. government agency securities | 13,607 | |
| 4 | |
| (8 | ) |
| - | |
| 13,603 | | |||||
Certificates of deposit | 12,849 | |
| - | |
| - | |
| - | |
| 12,849 | | |||||
Commercial paper | 25,430 | |
| 1 | |
| - | |
| - | |
| 25,431 | | |||||
Corporate debt securities | 58,753 | |
| 43 | |
| (18 | ) |
| - | |
| 58,778 | | |||||
Asset-backed securities | 22,146 | |
| 12 | |
| (12 | ) |
| - | |
| 22,146 | | |||||
Non-U.S. government agency securities | 3,403 | |
| - | |
| (3 | ) |
| - | |
| 3,400 | | |||||
Other | 4,488 | |
| - | |
| - | |
| - | |
| 4,488 | | |||||
Total: | 140,676 | |
| 60 | |
| (41 | ) |
| - | |
| 140,695 | | |||||
|
|
|
|
|
|
|
|
|
| ||||||||||
Other long-term assets: |
|
|
|
|
|
|
|
|
| ||||||||||
Non-marketable equity securities | 9,756 | |
| - | |
| - | |
| - | |
| 9,756 | | |||||
Total: | 9,756 | |
| - | |
| - | |
| - | |
| 9,756 | | |||||
(1) | See Note 6. Fair Value Measures for further discussion on fair values of cash equivalents and investments. |
Non-marketable equity securities. The Company's strategic investment portfolio consists of non-marketable equity securities in privately held companies. The securities accounted for as cost method investments are reported at cost, net of impairment losses. Securities accounted for as equity method investments are recorded at cost plus the proportional share of the issuers' income or loss, which is recorded in the Company's other income (expense), net. The cost basis of securities sold is based on the specific identification method. Refer to Note 6. Fair Value Measures.
Derivatives. The Company recognizes derivative instruments as either assets or liabilities in the consolidated financial statements at fair value and provides qualitative and quantitative disclosures about such derivatives. The Company operates internationally and is exposed to potentially adverse movements in foreign currency exchange rates. The Company enters into hedges in the form of foreign currency forward contracts to reduce its exposure to foreign currency rate changes on non-functional currency denominated forecasted transactions and balance sheet positions including: (1) certain assets and liabilities, (2) shipments forecasted to occur within approximately 1 month, (3) future billings and revenue on previously shipped orders, and (4) certain future intercompany invoices denominated in foreign currencies.
The duration of forward contracts ranges from approximately one month to 22 months , the majority of which are short-term. The Company does not use foreign currency forward contracts for speculative or trading purposes. The Company enters into foreign exchange forward contracts with high credit quality financial institutions that are rated ‘A' or above and to date has not experienced nonperformance by counterparties. Further, the Company anticipates continued performance by all counterparties to such agreements.
65
Table of Contents
SYNOPSYS, INC.
NOTES TO CONSOLIDATED FINANCIAL STATEMENTS-Continued
The assets or liabilities associated with the forward contracts are recorded at fair value in other current assets or accrued liabilities in the consolidated balance sheets. The accounting for gains and losses resulting from changes in fair value depends on the use of the foreign currency forward contract and whether it is designated and qualifies for hedge accounting.
Cash Flow Hedging Activities
Certain foreign exchange forward contracts are designated and qualify as cash flow hedges. These contracts have durations of approximately 22 months or less. Certain forward contracts are rolled over periodically to capture the full length of exposure to the Company's foreign currency risk, which can be up to three years . To receive hedge accounting treatment, all hedging relationships are formally documented at the inception of the hedge, and the hedges must be highly effective in offsetting changes to future cash flows on the hedged transactions. The effective portion of gains or losses resulting from changes in fair value of these hedges is initially reported, net of tax, as a component of other comprehensive income (loss) (OCI), in stockholders' equity and reclassified into revenue or operating expenses, as appropriate, at the time the hedged transactions affect earnings. We expect a majority of the hedge balance in OCI to be reclassified to the statements of operations within the next twelve months.
Hedging effectiveness is evaluated monthly using spot rates, with any gain or loss caused by hedging ineffectiveness recorded in other income (expense), net. The premium/discount component of the forward contracts is recorded to other income (expense), net, and is not included in evaluating hedging effectiveness.
Non-designated Hedging Activities
The Company's foreign exchange forward contracts that are used to hedge non-functional currency denominated balance sheet assets and liabilities are not designated as hedging instruments. Accordingly, any gains or losses from changes in the fair value of the forward contracts are recorded in other income (expense), net. The gains and losses on these forward contracts generally offset the gains and losses associated with the underlying assets and liabilities, which are also recorded in other income (expense), net. The duration of the forward contracts for hedging the Company's balance sheet exposure is approximately one month .
The Company also has certain foreign exchange forward contracts for hedging certain international revenues and expenses that are not designated as hedging instruments. Accordingly, any gains or losses from changes in the fair value of the forward contracts are recorded in other income (expense), net. The gains and losses on these forward contracts generally offset the gains and losses associated with the foreign currency in operating income. The duration of these forward contracts is usually less than one year. The overall goal of the Company's hedging program is to minimize the impact of currency fluctuations on its net income over its fiscal year.
The effects of the changes in the fair values of non-designated forward contracts for fiscal years 2017 , 2016 and 2015 are summarized as follows:
| October 31, | ||||||||||
| 2017 |
| 2016 |
| 2015 | ||||||
| (in thousands) | ||||||||||
Gain (loss) recorded in other income (expense), net | $ | 1,359 | |
| $ | (4,533 | ) |
| $ | (5,554 | ) |
The notional amounts in the table below for derivative instruments provide one measure of the transaction volume outstanding:
| As of October 31, 2017 |
| As of October 31, 2016 | ||||
| (in thousands) | ||||||
Total gross notional amount | $ | 955,139 | |
| $ | 758,246 | |
Net fair value | $ | 14,052 | |
| $ | (15,358 | ) |
The notional amounts for derivative instruments do not represent the amount of the Company's exposure to market gain or loss. The Company's exposure to market gain or loss will vary over time as a function of currency exchange rates. The amounts ultimately realized upon settlement of these financial instruments, together with the gains and losses on the underlying exposures, will depend on actual market conditions during the remaining life of the instruments.
66
Table of Contents
SYNOPSYS, INC.
NOTES TO CONSOLIDATED FINANCIAL STATEMENTS-Continued
The following represents the balance sheet location and amount of derivative instrument fair values segregated between designated and non-designated hedge instruments:
| Fair Values of derivative instruments designated as hedging instruments |
| Fair Values of derivative instruments not designated as hedging instruments | ||||
| (in thousands) | ||||||
As of October 31, 2017 |
|
|
| ||||
Other current assets | $ | 16,582 | |
| $ | 15 | |
Accrued liabilities | $ | 2,485 | |
| $ | 59 | |
As of October 31, 2016 |
|
|
| ||||
Other current assets | $ | 4,625 | |
| $ | 27 | |
Accrued liabilities | $ | 19,910 | |
| $ | 101 | |
The following table represents the income statement location and amount of gains and losses on derivative instrument fair values for designated hedge instruments, net of tax:
| Location of gain (loss) recognized in OCI on derivatives |
| Amount of gain (loss) recognized in OCI on derivatives (effective portion) |
| Location of gain (loss) reclassified from OCI |
| Amount of gain (loss) reclassified from OCI (effective portion) | ||||
| (in thousands) | ||||||||||
Fiscal year ended October 31, 2017 |
|
|
|
|
|
|
| ||||
Foreign exchange contracts | Revenue |
| $ | 7,582 | |
| Revenue |
| $ | (2,759 | ) |
Foreign exchange contracts | Operating expenses |
| 13,346 | |
| Operating expenses |
| (805 | ) | ||
Total |
|
| $ | 20,928 | |
|
|
| $ | (3,564 | ) |
Fiscal year ended October 31, 2016 |
|
|
|
|
|
|
| ||||
Foreign exchange contracts | Revenue |
| $ | (14,580 | ) |
| Revenue |
| $ | (8,585 | ) |
Foreign exchange contracts | Operating expenses |
| (11,259 | ) |
| Operating expenses |
| (12,125 | ) | ||
Total |
|
| $ | (25,839 | ) |
|
|
| $ | (20,710 | ) |
Fiscal year ended October 31, 2015 |
|
|
|
|
|
|
| ||||
Foreign exchange contracts | Revenue |
| $ | 3,982 | |
| Revenue |
| $ | 9,270 | |
Foreign exchange contracts | Operating expenses |
| (22,605 | ) |
| Operating expenses |
| (24,193 | ) | ||
Total |
|
| $ | (18,623 | ) |
|
|
| $ | (14,923 | ) |
The following table represents the ineffective portions and portions excluded from effectiveness testing of the hedge gains (losses) for derivative instruments designated as hedging instruments, which are recorded in other income (expense) income, net:
Foreign exchange contracts | Amount of gain (loss) recognized in income statement on derivatives (ineffective portion)(1) |
| Amount of gain (loss) recognized in income statement on derivatives (excluded from effectiveness testing)(2) | ||||
| (in thousands) | ||||||
Fiscal year ended October 31, 2017 | $ | 311 | |
| $ | 3,018 | |
Fiscal year ended October 31, 2016 | $ | 1,468 | |
| $ | 6,058 | |
Fiscal year ended October 31, 2015 | $ | 878 | |
| $ | 3,704 | |
(1) | The ineffective portion includes forecast inaccuracies. |
(2) | The portion excluded from effectiveness testing includes the discount earned or premium paid for the contracts. |
67
Table of Contents
SYNOPSYS, INC.
NOTES TO CONSOLIDATED FINANCIAL STATEMENTS-Continued
Other Commitments - Credit and Term Loan Facilities
On November 28, 2016, the Company entered into an amended and restated credit agreement with several lenders (the Credit Agreement) providing for (i) a $650.0 million senior unsecured revolving credit facility (the Revolver) and (ii) a $150.0 million senior unsecured term loan facility (the Term Loan). The Credit Agreement amended and restated the Company's previous credit agreement dated May 19, 2015 (the 2015 Agreement), in order to increase the size of the revolving credit facility from $500.0 million to $650.0 million , provide a new $150.0 million senior unsecured term loan facility, and to extend the termination date of the revolving credit facility from May 19, 2020 to November 28, 2021. Subject to obtaining additional commitments from lenders, the principal amount of the loans provided under the Credit Agreement may be increased by the Company by up to an additional $150.0 million . The Credit Agreement contains financial covenants requiring the Company to operate within a maximum leverage ratio and maintain a minimum interest coverage ratio, as well as other non-financial covenants. As of October 31, 2017 , the Company was in compliance with all financial covenants.
During the first quarter of fiscal 2017, the Company received funding of $150.0 million under the Term Loan. As of October 31, 2017 , the Company had a $144.0 million outstanding balance, net of debt issuance costs, under the Term Loan, of which $134.1 million is classified as long-term liabilities, and no outstanding balance under the Revolver. Outstanding principal payments under the Term Loan are due as follows:
Fiscal year | (in thousands) | ||
2018 | 10,313 | | |
2019 | 14,062 | | |
2020 | 17,813 | | |
2021 | 27,187 | | |
2022 | 75,000 | | |
Total | $ | 144,375 | |
As of October 31, 2016 , the Company had no outstanding balance under the previous term loan from the 2015 Agreement and a $205.0 million outstanding balance under the previous revolver from the 2015 Agreement, all of which are considered short-term liabilities. Borrowings bear interest at a floating rate based on a margin over the Company's choice of market observable base rates as defined in the Credit Agreement. As of October 31, 2017 , borrowings under the Term Loan bore interest at LIBOR +1.125% and the applicable interest rate for the Revolver was LIBOR +1.000% . In addition, commitment fees are payable on the Revolver at rates between 0.125% and 0.200% per year based on the Company's leverage ratio on the daily amount of the revolving commitment.
Subsequent to fiscal year 2017, the Company drew down $450.0 million under the Revolver and the total outstanding balance of the Revolver as of December 13, 2017 is $450.0 million .
The carrying amount of the short-term and long-term debt approximates the estimated fair value. These borrowings under the Credit Agreement have a variable interest rate structure and are classified within Level 2 of the fair value hierarchy.
Note 6. Fair Value Measures
Accounting Standards Codification (ASC) 820-10, Fair Value Measurements and Disclosures , defines fair value, establishes guidelines and enhances disclosure requirements for fair value measurements. The accounting guidance requires an entity to maximize the use of observable inputs and minimize the use of unobservable inputs when measuring fair value. The accounting guidance also establishes a fair value hierarchy based on the independence of the source and objective evidence of the inputs used. There are three fair value hierarchies based upon the level of inputs that are significant to fair value measurement:
Level 1 -Observable inputs that reflect quoted prices (unadjusted) for identical instruments in active markets;
Level 2 -Observable inputs other than quoted prices included in Level 1 for similar instruments in active markets, quoted prices for identical or similar instruments in markets that are not active, and model-driven valuations in which all significant inputs and significant value drivers are observable in active markets; and
Level 3 -Unobservable inputs to the valuation derived from fair valuation techniques in which one or more significant inputs or significant value drivers are unobservable.
68
Table of Contents
SYNOPSYS, INC.
NOTES TO CONSOLIDATED FINANCIAL STATEMENTS-Continued
On a recurring basis, the Company measures the fair value of certain of its assets and liabilities, which include cash equivalents, short-term investments, non-qualified deferred compensation plan assets, and foreign currency derivative contracts.
The Company's cash equivalents and short-term investments are classified within Level 1 or Level 2 because they are valued using quoted market prices in an active market or alternative independent pricing sources and models utilizing market observable inputs.
The Company's non-qualified deferred compensation plan assets consist of money market and mutual funds invested in domestic and international marketable securities that are directly observable in active markets and are therefore classified within Level 1.
The Company's foreign currency derivative contracts are classified within Level 2 because these contracts are not actively traded and the valuation inputs are based on quoted prices and market observable data of similar instruments.
The Company's borrowings under its credit and term loan facilities are classified within Level 2 because these borrowings are not actively traded and have a variable interest rate structure based upon market rates currently available to the Company for debt with similar terms and maturities. Refer to Note 5. Financial Assets and Liabilities.
Assets/Liabilities Measured at Fair Value on a Recurring Basis
Assets and liabilities measured at fair value on a recurring basis are summarized below as of October 31, 2017 :
|
|
| Fair Value Measurement Using | ||||||||||||
Description | Total |
| Quoted Prices in Active Markets for Identical Assets (Level 1) |
| Significant Other Observable Inputs (Level 2) |
| Significant Unobservable Inputs (Level 3) | ||||||||
| (in thousands) | ||||||||||||||
Assets |
|
|
|
|
|
|
| ||||||||
Cash equivalents: |
|
|
|
|
|
|
| ||||||||
Money market funds | $ | 560,594 | |
| $ | 560,594 | |
| $ | - | |
| $ | - | |
Prepaid and other current assets: |
|
|
|
|
|
|
| ||||||||
Foreign currency derivative contracts | 16,596 | |
| - | |
| 16,596 | |
| - | | ||||
Other long-term assets: |
|
|
|
|
|
|
| ||||||||
Deferred compensation plan assets | 197,542 | |
| 197,542 | |
| - | |
| - | | ||||
Total assets | $ | 774,732 | |
| $ | 758,136 | |
| $ | 16,596 | |
| $ | - | |
Liabilities |
|
|
|
|
|
|
| ||||||||
Accounts payable and accrued liabilities: |
|
|
|
|
|
|
| ||||||||
Foreign currency derivative contracts | $ | 2,544 | |
| $ | - | |
| $ | 2,544 | |
| $ | - | |
Other long-term liabilities: |
|
|
|
|
|
|
| ||||||||
Deferred compensation plan liabilities | 197,542 | |
| 197,542 | |
| - | |
| - | | ||||
Total liabilities | $ | 200,086 | |
| $ | 197,542 | |
| $ | 2,544 | |
| $ | - | |
69
Table of Contents
SYNOPSYS, INC.
NOTES TO CONSOLIDATED FINANCIAL STATEMENTS-Continued
Assets and liabilities measured at fair value on a recurring basis are summarized below as of October 31, 2016 :
Description | Total |
| Fair Value Measurement Using | ||||||||||||
Quoted Prices in Active Markets for Identical Assets (Level 1) |
| Significant Other Observable Inputs (Level 2) |
| Significant Unobservable Inputs (Level 3) | |||||||||||
| (in thousands) | ||||||||||||||
Assets |
|
|
|
|
|
|
| ||||||||
Cash equivalents: |
|
|
|
|
|
|
| ||||||||
Money market funds | $ | 499,274 | |
| $ | 499,274 | |
| $ | - | |
| $ | - | |
Commercial paper | 1,498 | |
| - | |
| 1,498 | |
| - | | ||||
Certificates of deposit | 4,200 | |
| - | |
| 4,200 | |
| - | | ||||
Short-term investments: |
|
|
|
|
|
|
| ||||||||
U.S. government agency securities | 13,603 | |
| - | |
| 13,603 | |
| - | | ||||
Certificates of deposit | 12,849 | |
| - | |
| 12,849 | |
| - | | ||||
Commercial paper | 25,431 | |
| - | |
| 25,431 | |
| - | | ||||
Corporate debt securities | 58,778 | |
| - | |
| 58,778 | |
| - | | ||||
Asset-backed securities | 22,146 | |
| - | |
| 22,146 | |
| - | | ||||
Non-U.S. government agency securities | 3,400 | |
| - | |
| 3,400 | |
| - | | ||||
Other | 4,488 | |
| 4,488 | |
| - | |
| - | | ||||
Prepaid and other current assets: |
|
|
|
|
|
|
| ||||||||
Foreign currency derivative contracts | 4,652 | |
| - | |
| 4,652 | |
| - | | ||||
Other long-term assets: |
|
|
|
|
|
|
| ||||||||
Deferred compensation plan assets | 163,185 | |
| 163,185 | |
| - | |
| - | | ||||
Total assets | $ | 813,504 | |
| $ | 666,947 | |
| $ | 146,557 | |
| $ | - | |
Liabilities |
|
|
|
|
|
|
| ||||||||
Accounts payable and accrued liabilities: |
|
|
|
|
|
|
| ||||||||
Foreign currency derivative contracts | $ | 20,010 | |
| $ | - | |
| $ | 20,010 | |
| $ | - | |
Other long-term liabilities: |
|
|
|
|
|
|
| ||||||||
Deferred compensation plan liabilities | 163,185 | |
| 163,185 | |
| - | |
| - | | ||||
Total liabilities | $ | 183,195 | |
| $ | 163,185 | |
| $ | 20,010 | |
| $ | - | |
Assets/Liabilities Measured at Fair Value on a Non-Recurring Basis
Non-Marketable Equity Securities
Equity investments in privately-held companies, also called non-marketable equity securities, are accounted for using either the cost or equity method of accounting.
The non-marketable equity securities are measured and recorded at fair value when an event or circumstance which impacts the fair value of these securities indicates an other-than-temporary decline in value has occurred. In such events, these equity investments would be classified within Level 3 as they are valued using significant unobservable inputs or data in an inactive market, and the valuation requires management judgment due to the absence of market price and inherent lack of liquidity. The Company monitors these investments and generally uses the income approach to assess impairments based primarily on the financial conditions of these companies.
The Company recorded $1.3 million of other-than-temporary impairment during fiscal 2017 and did not recognize any impairment during fiscal 2016 and 2015 .
70
Table of Contents
SYNOPSYS, INC.
NOTES TO CONSOLIDATED FINANCIAL STATEMENTS-Continued
| Balance as of October 31, 2017 |
| Significant Unobservable Inputs (Level 3) |
| Total (losses) for Fiscal 2017 | ||||||
| (in thousands) | ||||||||||
Non-marketable equity securities | $ | - | |
| $ | - | |
| $ | (1,300 | ) |
Note 7. Commitments and Contingencies
Lease Commitments
The Company leases certain of its domestic and foreign facilities and certain office equipment under non-cancelable lease agreements. The lease agreements generally require the Company to pay property taxes, insurance, maintenance and repair costs. Rent expenses were $68.1 million , $ 63.9 million and $67.6 million in fiscal 2017 , 2016 and 2015 , respectively. The Company charges operating lease payments to expense using the straight-line method. The Company subleases portions of its facilities and records sublease payments as a reduction of rent expense.
The Company's principal offices are located in two office buildings in Mountain View, California. The buildings together provide approximately 341,000 square feet. This space is leased through August 2030, and the Company has two options to extend the lease term, the first to extend the term by ten years, followed by a second option to extend by approximately nine additional years.
As of October 31, 2017 , anticipated future minimum lease payments on all non-cancellable operating leases with a term in excess of one year, net of sublease income are as follows:
| Minimum Lease Payments |
| Sublease Income |
| Net | ||||||
| (in thousands) | ||||||||||
Fiscal Year |
|
|
|
|
| ||||||
2018 | $ | 56,879 | |
| $ | 2,977 | |
| $ | 53,902 | |
2019 | 51,350 | |
| 3,208 | |
| 48,142 | | |||
2020 | 39,594 | |
| 3,050 | |
| 36,544 | | |||
2021 | 31,797 | |
| 2,184 | |
| 29,613 | | |||
2022 | 27,438 | |
| 1,681 | |
| 25,757 | | |||
Thereafter | 147,271 | |
| 566 | |
| 146,705 | | |||
Total | $ | 354,329 | |
| $ | 13,666 | |
| $ | 340,663 | |
Legal Proceedings
The Company is subject to routine legal proceedings, as well as demands, claims and threatened litigation that arise in the normal course of its business. The ultimate outcome of any litigation is uncertain and unfavorable outcomes could have a negative impact on the Company's results of operations and financial condition. The Company reviews the status of each significant matter and assesses its potential financial exposure. If the potential loss from any claim or legal proceeding is considered probable and the amount is estimable, the Company accrues a liability for the estimated loss. The Company has determined that, except as set forth below, no disclosure of estimated loss is required for a claim against the Company because: (1) there is not a reasonable possibility that a loss exceeding amounts already recognized (if any) may be incurred with respect to such claim; (2) a reasonably possible loss or range of loss cannot be estimated; or (3) such estimate is immaterial.
Mentor Patent Litigation
The Company is engaged in complex patent litigation with Mentor Graphics Corporation (Mentor) involving several actions in different forums. The Company succeeded to the litigation when it acquired Emulation & Verification Engineering S.A. (EVE) on October 4, 2012. At the time of the acquisition, EVE and EVE-USA, Inc. (collectively, the EVE Parties) had been defendants in three patent infringement lawsuits filed by Mentor. Each lawsuit as well as subsequent lawsuits are further described below.
71
Table of Contents
SYNOPSYS, INC.
NOTES TO CONSOLIDATED FINANCIAL STATEMENTS-Continued
Background
As mentioned above, at the time of the acquisition, the EVE Parties had been defendants in three patent infringement lawsuits filed by Mentor. Mentor filed suit against the EVE Parties in federal district court in the District of Oregon on August 16, 2010 alleging that EVE's ZeBu products infringed Mentor's United States Patent No. 6,876,962. Mentor filed an additional suit in federal district court in the District of Oregon on August 17, 2012 alleging that EVE's ZeBu products infringed Mentor's United States Patent No. 6,947,882. Both cases sought damages and a permanent injunction. Mentor also filed a patent infringement lawsuit against Nihon EVE K.K. in Tokyo District Court in 2010 alleging that certain ZeBu products infringe Mentor's Japanese Patent No. P3,588,324. The litigation matter in Japan no longer exists, as the Japan IP High Court affirmed the Tokyo District Court ruling that such products did not infringe Mentor's patent.
On September 27, 2012, the Company and the EVE Parties filed an action for declaratory relief against Mentor in federal district court in the Northern District of California, seeking a determination that Mentor's United States Patents Nos. 6,009,531, 5,649,176, and 6,240,376, which were the subject of a patent infringement lawsuit filed by Mentor against EVE in 2006 and settled in the same year, are invalid and not infringed by EVE's products. Mentor asserted patent infringement counterclaims in this action based on the same three patents and sought damages and a permanent injunction. In April 2013, this action was transferred to the federal district court in Oregon and consolidated with the two Mentor lawsuits in that district (the Oregon Action), as further described below.
The Oregon Action
After transfer of the Company's declaratory relief action to Oregon and consolidation of that action with Mentor's 2010 and 2012 lawsuits, the Company asserted patent infringement counterclaims against Mentor based on the Company's United States Patents Nos. 6,132,109 and 7,069,526, seeking damages and a permanent injunction. After pre-trial summary judgment rulings in favor of both sides, the only patent remaining at issue in the Oregon Action was Mentor's ‘376 patent.
The Oregon Action went to trial on the remaining Mentor patent, and a jury reached a verdict on October 10, 2014 finding that certain features of the ZeBu products infringed the ‘376 patent and assessing damages of approximately $36 million . On March 12, 2015, the court entered an injunction prohibiting certain sales activities relating to the features found by the jury to infringe. The Company released a new version of ZeBu software that does not include such features. The Company accrued an immaterial amount as a loss contingency in the year ended October 31, 2015. Both parties appealed from the court's judgment following the jury verdict.
The Federal Circuit heard the parties' respective appeals and issued a decision on March 16, 2017. The panel affirmed the jury verdict and damages award on Mentor's ‘376 patent and reversed the district court's dismissal of Mentor's ‘176, ‘531 and ‘882 patents and the Company's ‘109 patent. Due to the affirmation of the verdict by the Federal Circuit, the Company accrued an aggregate amount of $39.0 million as a loss contingency, which is the amount estimated to be the probable loss. The associated charge has been recorded in general and administrative expenses in the income statements for the year ended October 31, 2017.
Proceedings on these patents are resuming in the federal district court in Oregon, including trial of alleged supplemental damages on and willful infringement of the ‘376 patent. On May 1, 2017, the Company petitioned for rehearing by all judges currently sitting on the Federal Circuit. On September 1, 2017, the Federal Circuit denied the Company's petition for rehearing. On November 30, 2017, the Company filed a petition for certiorari with the U.S. Supreme Court seeking review of the Federal Circuit's ruling.
The California Action
On December 21, 2012, the Company filed an action for patent infringement against Mentor in federal district court in the Northern District of California, alleging that Mentor's Veloce products infringe the Company's United States Patents Nos. 5,748,488, 5,530,841, 5,680,318 and 6,836,420 (the California Action). This case sought damages and a permanent injunction. The court stayed the action as to the ‘420 patent pending the U.S. Patent and Trademark Office's inter partes review of that patent and appeals from that proceeding. On January 20, 2015, the court granted Mentor's motion for summary judgment on the ‘488, ‘841, and ‘318 patents, finding that such patents were invalid. The Company appealed the court's ruling and on October 17, 2016, the Federal Circuit affirmed the district court's decision. The Company sought review of the Federal Circuit's ruling in the U.S. Supreme Court, and on October 2, 2017, the U.S. Supreme Court denied the Company's petition.
72
Table of Contents
SYNOPSYS, INC.
NOTES TO CONSOLIDATED FINANCIAL STATEMENTS-Continued
PTO Proceedings
On September 26, 2012, the Company filed two inter partes review requests with the U.S. Patent and Trademark Office (the PTO) challenging the validity of Mentor's ‘376 and ‘882 patents. The PTO granted review of the ‘376 patent and denied review of the ‘882 patent. On February 19, 2014, the PTO issued its final decision in the review of the ‘376 patent, finding some of the challenged claims invalid and some of the challenged claims valid. On April 22, 2014, the Company appealed to the Federal Circuit from the PTO's decision finding certain claims valid. Mentor filed a cross-appeal on May 2, 2014 from the PTO's decision finding certain claims invalid. On February 10, 2016, the Federal Circuit affirmed the PTO's decision in all respects.
On December 21, 2013, Mentor filed an inter partes review request with the PTO challenging the validity of the Company's ‘420 patent. On June 11, 2015, the PTO issued its final decision in the review, finding all of the challenged claims invalid. On August 12, 2015, the Company appealed to the Federal Circuit from the PTO's decision. On October 11, 2016, the Federal Circuit affirmed the PTO's decision.
On September 30, 2016, the Company filed a petition requesting ex parte reexamination of all of the claims of the ‘376 patent asserted in the Oregon Action. Mentor objected on procedural grounds. On November 8, 2016, the PTO instituted reexamination of the ‘376 patent. On December 15, 2016, the PTO vacated its decision to institute reexamination based upon Mentor's procedural objection. The Company thereafter filed a renewed request for ex parte reexamination of only claims 24, 26 and 27 of the patent, which was granted by the PTO in February 2017. On May 2, 2017, the Company also sued the PTO in federal district court in the Eastern District of Virginia, challenging the PTO's decision not to institute reexamination of claims 1 and 28. On July 28, 2017, cross-motions for summary judgment were argued, and the Company's suit challenging the PTO's decision not to reexamine claims 1 and 28 was dismissed on November 15, 2017. The ex parte reexamination is ongoing.
On May 22, 2017, the Company petitioned for ex parte reexamination of certain claims of the ‘882 patent. On June 20, 2017, the PTO instituted reexamination on all of the challenged claims and on October 23, 2017 rejected the challenged claims of the ‘882 patent. The ex parte reexamination and the lawsuit are ongoing.
While the Company intends to defend all of the above matters vigorously, the ultimate outcome of any litigation, including the litigation with Mentor, is uncertain and may have an adverse outcome resulting in losses beyond recorded amounts. In the event of an unfavorable final outcome, there exists the possibility of a material adverse impact on the Company's consolidated financial statements for the period in which the effects become reasonably estimable.
Tax Matters
The Company undergoes examination from time to time by U.S. and foreign authorities for non-income based taxes, such as sales, use and value-added taxes, and is currently under examination by tax authorities in certain jurisdictions. If the potential loss from such examinations is considered probable and the amount or the range of loss could be estimated, the Company would accrue a liability for the estimated expense.
In addition to the foregoing, the Company is, from time to time, party to various other claims and legal proceedings in the ordinary course of our business, including with tax and other governmental authorities. For a description of certain of these other matters, refer to Note 11. Income Taxes.
Note 8. Accumulated Other Comprehensive Income (Loss)
Components of accumulated other comprehensive income (loss), on an after-tax basis where applicable, were as follows:
| Year Ended October 31, | ||||||
| 2017 |
| 2016 | ||||
| (in thousands) | ||||||
Cumulative currency translation adjustments | $ | (70,407 | ) |
| $ | (84,700 | ) |
Unrealized gain (loss) on derivative instruments, net of taxes | 4,428 | |
| (19,896 | ) | ||
Unrealized gain (loss) on available-for-sale securities, net of taxes | - | |
| 19 | | ||
Total accumulated other comprehensive income (loss) | $ | (65,979 | ) |
| $ | (104,577 | ) |
73
Table of Contents
The effect of amounts reclassified out of each component of accumulated other comprehensive income (loss) into net income was as follows:
| Year Ended October 31, | ||||||||||
| 2017 |
| 2016 |
| 2015 | ||||||
| (in thousands) | ||||||||||
Reclassifications from accumulated other comprehensive income (loss) into consolidated statement of operations: |
|
|
|
|
| ||||||
Gain (loss) on cash flow hedges, net of taxes |
|
|
|
|
| ||||||
Revenues | $ | (2,759 | ) |
| $ | (8,585 | ) |
| $ | 9,270 | |
Operating expenses | (805 | ) |
| (12,125 | ) |
| (24,193 | ) | |||
Gain (loss) on available-for-sale securities |
|
|
|
|
| ||||||
Other income (expense) | (8 | ) |
| 18 | |
| 41 | | |||
Total reclassifications into net income | $ | (3,572 | ) |
| $ | (20,692 | ) |
| $ | (14,882 | ) |
Amounts reclassified in fiscal 2017 , 2016 and 2015 primarily consisted of gains (losses) from the Company's cash flow hedging activities. See Note 5. Financial Assets and Liabilities.
Note 9. Stock Repurchase Program
The Company's Board of Directors (Board) previously approved a stock repurchase program pursuant to which the Company was authorized to purchase up to $500.0 million of its common stock, and has periodically replenished the stock repurchase program to such amount. The Board replenished the stock repurchase program up to $500.0 million on June 15, 2017. The program does not obligate the Company to acquire any particular amount of common stock, and the program may be suspended or terminated at any time by the Company's Chief Financial Officer or the Board. The Company repurchases shares to offset dilution caused by ongoing stock issuances from existing equity plans for equity compensation awards and issuances related to acquisitions, and when management believes it is a good use of cash. Repurchases are transacted in accordance with Rule 10b-18 of the Securities Exchange Act of 1934, as amended (the Exchange Act) and may be made through any means including, but not limited to, open market purchases, plans executed under Rule 10b5-1(c) of the Exchange Act and structured transactions. As of October 31, 2017 , $400 million remained available for further repurchases under the program .
In December 2016, the Company entered into an accelerated share repurchase agreement (December 2016 ASR) to repurchase an aggregate of $100.0 million of the Company's common stock. Pursuant to the December 2016 ASR, the Company made a prepayment of $100.0 million and received initial share deliveries valued at $80.0 million . The remaining balance of $20.0 million was settled in February 2017. Total shares purchased under the December 2016 ASR were approximately 1.7 million shares, at an average purchase price of $60.53 per share.
In February 2017, the Company entered into an accelerated share repurchase agreement (the February 2017 ASR) to repurchase an aggregate of $100.0 million of the Company's common stock. Pursuant to the February 2017 ASR, the Company made a prepayment of $100.0 million and received initial share deliveries valued at $80.0 million . The remaining balance of $20.0 million was settled in May 2017. Total shares purchased under the February 2017 ASR were approximately 1.4 million shares, at an average purchase price of $72.02 per share.
In May 2017, the Company entered into an accelerated share repurchase agreement (the May 2017 ASR) to repurchase an aggregate of $100.0 million of the Company's common stock. Pursuant to the May 2017 ASR, the Company made a prepayment of $100.0 million and received initial share deliveries valued at $80.0 million . The remaining balance of $20.0 million was settled in July 2017. Total shares purchased under the May 2017 ASR were approximately 1.4 million shares, at an average purchase price of $73.49 per share.
In September 2017, the Company entered into an accelerated share repurchase agreement (the September 2017 ASR) to repurchase an aggregate of $100.0 million of the Company's common stock. Pursuant to the September 2017 ASR, the Company made a prepayment of $100.0 million and received initial share deliveries valued at $80.0 million . The remaining balance of $20.0 million was settled in November 2017. Total shares purchased under the September 2017 ASR were approximately 1.2 million shares, at an average purchase price of $83.80 per share.
The following table summarizes stock repurchase activities as well as the reissuance of treasury stock for employee stock-based compensation purposes:
74
Table of Contents
| Year Ended October 31, | ||||||||||
| 2017 |
| 2016 |
| 2015 | ||||||
| (in thousands, except per share price) | ||||||||||
Shares repurchased(1) | 5,413 | |
| 8,506 | |
| 5,672 | | |||
Average purchase price per share(1) | $ | 70.21 | |
| $ | 49.37 | |
| $ | 45.84 | |
Aggregate purchase price(1) | $ | 380,000 | |
| $ | 420,000 | |
| $ | 260,000 | |
Reissuance of treasury stock | 4,404 | |
| 4,803 | |
| 4,864 | | |||
(1) | Does not include the 181,988 shares and $20.0 million equity forward contract, respectively, from the September 2017 ASR settled in November 2017. |
In December 2017, the Company entered into two simultaneous accelerated share repurchase agreements (the December 2017 ASRs) to repurchase an aggregate of $200.0 million of the Company's common stock. Pursuant to the December 2017 ASRs, the Company made a prepayment of $200.0 million to receive initial share deliveries of shares valued at $160.0 million . The remaining balance of $40.0 million is anticipated to be settled on or before May 16, 2018, upon completion of the repurchase. Under the terms of the December 2017 ASRs, the specific number of shares that the Company ultimately repurchases will be based on the volume-weighted average share price of our common stock during the repurchase period, less a discount.
Note 10. Employee Benefit Plans
Employee Stock Purchase Plan
Under the Company's Employee Stock Purchase Plan (ESPP), employees are granted the right to purchase shares of common stock at a price per share that is 85% of the lesser of the fair market value of the shares at (1) the beginning of a rolling two year offering period or (2) the end of each semi-annual purchase period, subject to a plan limit on the number of shares that may be purchased in a purchase period.
On March 29, 2016, the Company's stockholders approved an amendment to the ESPP to increase the number of shares of common stock authorized for issuance under the plan by 5.0 million shares. During fiscal 2017 , 2016 and 2015 , the Company issued 1.6 million , 1.6 million , and 1.7 million shares, respectively, under the ESPP at average per share prices of $40.85 , $37.77 and $31.55 , respectively. As of October 31, 2017 , 7.1 million shares of common stock were reserved for future issuance under the ESPP.
Equity Compensation Plans
2006 Employee Equity Incentive Plan. On April 25, 2006, the Company's stockholders approved the 2006 Employee Equity Incentive Plan (2006 Employee Plan), which provides for the grant of incentive stock options, non-statutory stock options, restricted stock awards, restricted stock unit awards, stock appreciation rights and other forms of equity compensation, including performance stock awards and performance cash awards, as determined by the plan administrator. The terms and conditions of each type of award are set forth in the 2006 Employee Plan. Options granted under this plan have a contractual term of seven years and generally vest over four years. On April 6, 2017, the Company's stockholders approved an amendment to increase the number of shares of common stock reserved for future issuance under the 2006 Employee Plan by 5.0 million shares. As of October 31, 2017 , an aggregate of 6.1 million stock options and 3.8 million restricted stock units were outstanding, and 12.6 million shares were available for future issuance under the 2006 Employee Plan.
2005 and 2017 Non-Employee Directors Equity Incentive Plans. On April 6, 2017, the Company's stockholders approved the 2017 Non-Employee Directors Equity Incentive Plan (2017 Directors Plan). In connection with stockholder approval of the 2017 Directors Plan, the 2005 Non-Employee Directors Equity Incentive Plan (2005 Directors Plan) was terminated as of April 6, 2017, and no awards can be granted under the 2005 Directors Plan after that date.
Under the 2005 Directors Plan, the Company granted options to purchase 188,709 shares of common stock, which vest over a period of three to four years, with an aggregate grant date fair value of $6.7 million , to non-employee directors during fiscal 2007, fiscal 2011, fiscal 2015, and fiscal 2017. As of October 31, 2017 , 18,354 shares of restricted stock were unvested and 107,207 stock options were outstanding under the 2005 Directors Plan.
The 2017 Directors Plan provides for equity awards to non-employee directors in the form of stock options, restricted stock units, restricted stock or a combination thereof. The Company's stockholders have approved an aggregate of 0.45 million shares of common stock reserved under the 2017 Directors Plan.
75
Table of Contents
As of October 31, 2017 , the Company has issued an aggregate of 19,624 shares of restricted stock awards with an aggregate grant date fair value of approximately $1.4 million under the 2017 Directors Plan. Restricted stock awards vest over a period of three years. As of October 31, 2017 , 19,624 shares of restricted stock were unvested and no stock options were outstanding, and a total of 430,376 shares of common stock were reserved for future grant under the 2017 Directors Plan.
Other Assumed Stock Plans through Acquisitions. In connection with the Company's acquisitions in fiscal 2008, fiscal 2010, fiscal 2012, fiscal 2014, fiscal 2015, and fiscal 2017, the Company assumed certain outstanding stock awards of acquired companies. If these assumed equity awards are canceled, forfeited or expire unexercised, the underlying shares do not become available for future grant. As of October 31, 2017 , 0.4 million shares of the Company's common stock remained subject to such outstanding assumed equity awards.
Restricted Stock Units. Since fiscal 2007, restricted stock units are granted under the 2006 Employee Plan as part of the Company's new hire and annual incentive compensation program. Restricted stock units are valued based on the closing price of the Company's common stock on the grant date. In general, restricted stock units vest over three to four years and are subject to the employee's continuing service with the Company. For each restricted stock unit granted under the 2006 Employee Plan, a share reserve ratio is applied for the purpose of determining the remaining number of shares reserved for future grants under the plan. On April 3, 2012, the Company's stockholders approved an amendment of the 2006 Employee Plan to prospectively change the share reserve ratio from 1.25 to 1.50 . On April 2, 2015, the stockholders approved amending the share reserve ratio from 1.50 to 1.60 . On March 29, 2016, the stockholders approved amending the share reserve ratio from 1.60 to 1.70 .
The following table contains information concerning activities related to restricted stock units:
| Restricted Stock Units |
| Weighted Average Grant Date Fair Value |
| Weighted Average Remaining Contractual Life (In Years) |
| Aggregate Fair Value | |||||
| (in thousands, except per share and life amounts) | |||||||||||
Balance at October 31, 2014 | 3,947 | |
| $ | 35.29 | |
| 1.53 |
|
| ||
Granted | 1,707 | |
| $ | 48.13 | |
|
|
|
| ||
Vested(1) | (1,522 | ) |
| $ | 33.05 | |
|
|
| $ | 73,677 | |
Forfeited | (204 | ) |
| $ | 37.68 | |
|
|
|
| ||
Balance at October 31, 2015 | 3,928 | |
| $ | 41.61 | |
| 1.54 |
|
| ||
Granted | 1,765 | |
| $ | 49.59 | |
|
|
|
| ||
Vested(1) | (1,547 | ) |
| $ | 38.33 | |
|
|
| $ | 79,558 | |
Forfeited | (111 | ) |
| $ | 43.12 | |
|
|
|
| ||
Balance at October 31, 2016 | 4,035 | |
| $ | 46.37 | |
| 1.56 |
|
| ||
Granted | 1,584 | |
| $ | 70.49 | |
|
|
|
| ||
Vested(1) | (1,536 | ) |
| $ | 43.53 | |
|
|
| $ | 110,103 | |
Forfeited | (240 | ) |
| $ | 49.36 | |
|
|
|
| ||
Balance at October 31, 2017 | 3,843 | |
| $ | 57.26 | |
| 1.54 |
|
| ||
(1) | The number of vested restricted stock units includes shares that were withheld on behalf of employees to satisfy the minimum statutory tax withholding requirements. |
76
Table of Contents
The following table contains additional information concerning activities related to stock options and restricted stock units under all equity plans, other than shares available for grant under the 2017 Directors Plan:
| Available for Grant(3) |
| Options(2) | ||||||||||||
| Options Outstanding |
| Weighted- Average Exercise Price per Share |
| Weighted- Average Remaining Contractual Life (In Years) |
| Aggregate Intrinsic Value | ||||||||
| (in thousands, except per share and life amounts) | ||||||||||||||
Balance at October 31, 2014 | 12,155 | |
| 7,750 | |
| $ | 29.81 | |
| 4.66 |
| $ | 86,537 | |
Options granted | (1,908 | ) |
| 1,942 | |
| $ | 45.14 | |
|
|
|
| ||
Options assumed(2) |
|
| 133 | |
| $ | 38.97 | |
|
|
|
| |||
Options exercised |
|
| (2,125 | ) |
| $ | 26.06 | |
|
|
|
| |||
Options canceled/forfeited/expired | 230 | |
| (411 | ) |
| $ | 33.51 | |
|
|
|
| ||
Restricted stock units granted(1) | (2,707 | ) |
|
|
|
|
|
|
|
| |||||
Restricted stock units forfeited(1) | 313 | |
|
|
|
|
|
|
|
| |||||
Additional shares reserved | 3,800 | |
|
|
|
|
|
|
|
| |||||
Balance at October 31, 2015 | 11,883 | |
| 7,289 | |
| $ | 34.94 | |
| 4.67 |
| $ | 109,627 | |
Options granted | (1,685 | ) |
| 1,685 | |
| $ | 47.39 | |
|
|
|
| ||
Options exercised |
|
| (2,154 | ) |
| $ | 30.06 | |
|
|
|
| |||
Options canceled/forfeited/expired | 33 | |
| (65 | ) |
| $ | 35.31 | |
|
|
|
| ||
Restricted stock units granted(1) | (2,967 | ) |
|
|
|
|
|
|
|
| |||||
Restricted stock units forfeited(1) | 180 | |
|
|
|
|
|
|
|
| |||||
Additional shares reserved | 3,800 | |
|
|
|
|
|
|
|
| |||||
Balance at October 31, 2016 | 11,244 | |
| 6,755 | |
| $ | 39.59 | |
| 4.65 |
| $ | 126,850 | |
Options granted | (1,505 | ) |
| 1,536 | |
| $ | 68.18 | |
|
|
|
| ||
Options assumed(2) |
|
| 154 | |
| $ | 34.52 | |
|
|
|
| |||
Options exercised |
|
| (1,770 | ) |
| $ | 34.56 | |
|
|
|
| |||
Options canceled/forfeited/expired | 129 | |
| (145 | ) |
| $ | 47.17 | |
|
|
|
| ||
Restricted stock units granted(1) | (2,694 | ) |
|
|
|
|
|
|
|
| |||||
Restricted stock units forfeited(1) | 409 | |
|
|
|
|
|
|
|
| |||||
Additional shares reserved | 5,000 | |
|
|
|
|
|
|
|
| |||||
Balance at October 31, 2017 | 12,583 | |
| 6,530 | |
| $ | 46.83 | |
| 4.60 |
| $ | 263,555 | |
Vested and expected to vest as of October 31, 2017 |
|
| 6,530 | |
| $ | 46.83 | |
| 4.60 |
| $ | 263,555 | | |
Exercisable at October 31, 2017 |
|
| 3,252 | |
| $ | 39.72 | |
| 3.64 |
| $ | 154,357 | | |
(1) | These amounts do not reflect the actual number of restricted stock units granted or forfeited but rather the effect on the total remaining shares available for future grants after the application of the share reserve ratio. For more information about the share reserve ratio, please see Restricted Stock Units above. |
(2) | The Company assumed options outstanding under various plans through acquisitions. |
(3) | Excluding shares reserved for future issuance under the 2017 Directors Plan. |
The aggregate intrinsic value in the preceding table represents the pretax intrinsic value based on stock options with an exercise price less than the Company's closing stock price of $87.19 as of October 31, 2017 . The pretax intrinsic value of options exercised and their average exercise prices were:
| Year Ended October 31, | ||||||||||
| 2017 |
| 2016 |
| 2015 | ||||||
| (in thousands, except per share price) | ||||||||||
Intrinsic value | $ | 67,089 | |
| $ | 51,408 | |
| $ | 44,104 | |
Average exercise price per share | $ | 34.56 | |
| $ | 30.06 | |
| $ | 26.06 | |
77
Table of Contents
Restricted stock award activities during fiscal 2017 under the 2005 Directors Plan and 2017 Directors Plan are summarized as follows:
| Restricted Shares |
| Weighted-Average Grant Date Fair Value | |||
| (in thousands, except per share) | |||||
Unvested at October 31, 2016 | 43 | |
| $ | 45.97 | |
Granted | 20 | |
| $ | 71.34 | |
Vested | (22 | ) |
| $ | 44.33 | |
Forfeited | (3 | ) |
| $ | 47.65 | |
Unvested at October 31, 2017 | 38 | |
| $ | 59.89 | |
Valuation and Expense of Stock-Based Compensation. The Company estimates the fair value of stock-based awards in the form of stock options and employee stock purchase rights under employee stock purchase plans on the grant date. The value of awards expected to vest is recognized as expense over the applicable service periods. The Company uses the straight-line attribution method to recognize stock-based compensation costs over the service period of the award. The Company uses the Black-Scholes option-pricing model to determine the fair value of stock options, stock appreciation rights and employee stock purchase plan awards . The Black-Scholes option-pricing model incorporates various subjective assumptions including expected volatility, expected term and interest rates. The expected volatility for both stock options and stock purchase rights under the ESPP is estimated by a combination of implied volatility for publicly traded options of the Company's common stock with a term of six months or longer and the historical stock price volatility over the estimated expected term of the Company's stock-based awards. The expected term of the Company's stock-based awards is based on historical experience.
The assumptions presented in the following table were used to estimate the fair value of stock options and employee stock purchase rights granted under the Company's stock plans or stock plans assumed from acquisitions:
| Year Ended October 31, | ||||
| 2017 |
| 2016 |
| 2015 |
Stock Options |
|
|
|
|
|
Expected life (in years) | 4.1 |
| 4.1 |
| 4.3 |
Risk-free interest rate | 1.73% - 2.06% |
| 1.06% - 1.63% |
| 1.24% - 1.58% |
Volatility | 18.51% - 19.67% |
| 19.21%-21.62% |
| 16.92%-21.76% |
Weighted average estimated fair value | $13.56 |
| $8.97 |
| $8.77 |
ESPP |
|
|
|
|
|
Expected life (in years) | 0.5 - 2.0 |
| 0.5 - 2.0 |
| 0.5 - 2.0 |
Risk-free interest rate | 0.82% - 1.37% |
| 0.53% - 0.86% |
| 0.12% - 0.75% |
Volatility | 17.20% - 19.99% |
| 17.03% - 25.46% |
| 18.01% - 21.60% |
Weighted average estimated fair value | $18.77 |
| $12.75 |
| $11.11 |
The following table presents stock-based compensation expense for fiscal 2017 , 2016 and 2015 , respectively:
| Year Ended October 31, | ||||||||||
| 2017 |
| 2016 |
| 2015 | ||||||
| (in thousands) | ||||||||||
Cost of products | $ | 12,553 | |
| $ | 11,006 | |
| $ | 9,162 | |
Cost of maintenance and service | 3,918 | |
| 2,418 | |
| 2,164 | | |||
Research and development expense | 52,933 | |
| 49,511 | |
| 43,431 | | |||
Sales and marketing expense | 21,001 | |
| 19,690 | |
| 17,744 | | |||
General and administrative expense | 17,889 | |
| 14,958 | |
| 13,899 | | |||
Stock-based compensation expense before taxes | 108,294 | |
| 97,583 | |
| 86,400 | | |||
Income tax benefit | (30,950 | ) |
| (25,967 | ) |
| (20,071 | ) | |||
Stock-based compensation expense after taxes | $ | 77,344 | |
| $ | 71,616 | |
| $ | 66,329 | |
78
Table of Contents
The Company elected to early adopt ASU 2016-09, "Compensation-Stock Compensation (Topic 718), Improvements to Employee Share-Based Payment Accounting (ASU 2016-09)" in the first quarter of fiscal 2017. As required by ASU 2016-09, excess tax benefits recognized on stock-based compensation expense are classified as an operating activity in the consolidated statements of cash flows and the Company has elected to apply this provision on a prospective basis. The Company also elected to account for forfeitures as they occur and recorded a one-time adoption expense of $0.4 million to retained earnings.
As of October 31, 2017 , the Company had $215.5 million of total unrecognized stock-based compensation expense relating to options and restricted stock units and awards, which is expected to be recognized over a weighted average period of 2.5 years.
Deferred Compensation Plan. The Company maintains the Synopsys Deferred Compensation Plan (the Deferred Plan), which permits eligible employees to defer up to 50% of their annual cash base compensation and up to 100% of their eligible cash variable compensation. Amounts may be withdrawn from the Deferred Plan pursuant to elections made by the employees in accordance with the terms of the plan. Since the inception of the Deferred Plan, the Company has not made any matching or discretionary contributions to the Deferred Plan. There are no Deferred Plan provisions that provide for any guarantees or minimum return on investments. Undistributed amounts under the Deferred Plan are subject to the claims of the Company's creditors. The securities held by the Deferred Plan are classified as trading securities.
Deferred Plan Assets and Liabilities are as follows:
| As of October 31, 2017 |
| As of October 31, 2016 | ||||
| (In thousands) | ||||||
Plan assets recorded in other long-term assets | $ | 197,542 | |
| $ | 163,185 | |
Plan liabilities recorded in other long-term liabilities(1) | $ | 197,542 | |
| $ | 163,185 | |
(1) | Undistributed deferred compensation balances due to participants. |
Income or loss from the change in fair value of the Deferred Plan assets is recorded in other income (expense), net. The increase or decrease in the fair value of the undistributed Deferred Plan obligation is recorded in total cost of revenue and operating expense. The following table summarizes the impact of the Deferred Plan:
| Year Ended October 31, | ||||||||||
| 2017 |
| 2016 |
| 2015 | ||||||
| (in thousands) | ||||||||||
Increase (reduction) to cost of revenue and operating expense | $ | 29,606 | |
| $ | 4,400 | |
| $ | 3,701 | |
Other income (expense), net | 29,606 | |
| 4,400 | |
| 3,701 | | |||
Net increase (decrease) to net income | $ | - | |
| $ | - | |
| $ | - | |
Other Retirement Plans. The Company sponsors various retirement plans for its eligible U.S. and non-U.S. employees. Total contributions to these plans were $57.4 million , $53.4 million and $40.0 million in fiscal 2017 , 2016 and 2015 , respectively. For employees in the United States and Canada, the Company matches pretax employee contributions up to a maximum of U.S. $3,000 and Canadian $4,000 , respectively, per participant per year.
Note 11. Income Taxes
The domestic and foreign components of the Company's total income (loss) before provision for income taxes are as follows:
| Year Ended October 31, | ||||||||||
| 2017 |
| 2016 |
| 2015 | ||||||
| (in thousands) | ||||||||||
United States | $ | (2,702 | ) |
| $ | 22,134 | |
| $ | 42,571 | |
Foreign | 385,800 | |
| 307,414 | |
| 239,039 | | |||
Total income (loss) before provision for income taxes | $ | 383,098 | |
| $ | 329,548 | |
| $ | 281,610 | |
The components of the provision (benefit) for income taxes were as follows:
79
Table of Contents
SYNOPSYS, INC.
NOTES TO CONSOLIDATED FINANCIAL STATEMENTS-Continued
| Year Ended October 31, | ||||||||||
| 2017 |
| 2016 |
| 2015 | ||||||
| (in thousands) | ||||||||||
Current: |
|
|
|
|
| ||||||
Federal | $ | 25,420 | |
| $ | (6,106 | ) |
| $ | (21,911 | ) |
State | 5,565 | |
| 2,670 | |
| 1,385 | | |||
Foreign | 92,498 | |
| 80,195 | |
| 39,319 | | |||
| 123,483 | |
| 76,759 | |
| 18,793 | | |||
Deferred: |
|
|
|
|
| ||||||
Federal | 95,003 | |
| (23,510 | ) |
| 44,462 | | |||
State | 24,440 | |
| 11,950 | |
| (2,282 | ) | |||
Foreign | 3,609 | |
| (2,477 | ) |
| (5,297 | ) | |||
| 123,052 | |
| (14,037 | ) |
| 36,883 | | |||
Provision (benefit) for income taxes | $ | 246,535 | |
| $ | 62,722 | |
| $ | 55,676 | |
The provision (benefit) for income taxes differs from the taxes computed with the statutory federal income tax rate as follows:
| Year Ended October 31, | ||||||||||
| 2017 |
| 2016 |
| 2015 | ||||||
| (in thousands) | ||||||||||
Statutory federal tax | $ | 134,084 | |
| $ | 115,343 | |
| $ | 98,564 | |
State tax (benefit), net of federal effect | (20,071 | ) |
| (14,492 | ) |
| (7,186 | ) | |||
Tax credits (1) | (24,365 | ) |
| (36,979 | ) |
| (13,301 | ) | |||
Tax on foreign earnings less than U.S. statutory tax | (52,413 | ) |
| (68,246 | ) |
| (56,536 | ) | |||
Tax settlements | (7,057 | ) |
| (16,479 | ) |
| (6,251 | ) | |||
Stock-based compensation | (26,205 | ) |
| 5,709 | |
| 5,406 | | |||
Changes in valuation allowance | 47,745 | |
| 25,590 | |
| 2,206 | | |||
Integration of acquired technologies | 36,443 | |
| 37,525 | |
| 33,015 | | |||
Undistributed earnings of foreign subsidiaries | (9,610 | ) |
| 9,940 | |
| - | | |||
Tax impact of repatriation | 166,152 | |
| - | |
| - | | |||
Other | 1,832 | |
| 4,811 | |
| (241 | ) | |||
Provision (benefit) for income taxes | $ | 246,535 | |
| $ | 62,722 | |
| $ | 55,676 | |
(1) | Tax credits include benefits from the retroactive reinstatement of the U.S. federal research tax credit. The U.S. federal research tax credit was reinstated in fiscal 2015, resulting in a tax benefit of approximately $12.4 million in the above amount for the period January 1 through December 31, 2014. The credit was permanently reinstated in fiscal 2016, resulting in a tax benefit of approximately $37.1 million in the above amount for the period January 1, 2015 through October 31, 2016. |
The integration of acquired technologies represents the income tax effect resulting from the transfer of certain intangible assets among company-controlled entities. The income tax effect is generally recognized over five years. These intangible assets generally result from the acquisition of technology by a company-controlled entity as part of a business or asset acquisition.
80
Table of Contents
SYNOPSYS, INC.
NOTES TO CONSOLIDATED FINANCIAL STATEMENTS-Continued
The significant components of deferred tax assets and liabilities were as follows:
| October 31, | ||||||
| 2017 |
| 2016 | ||||
| (in thousands) | ||||||
Net deferred tax assets: |
|
|
| ||||
Deferred tax assets: |
|
|
| ||||
Accruals and reserves | $ | 36,906 | |
| $ | 34,324 | |
Deferred revenue | 42,420 | |
| 42,497 | | ||
Deferred compensation | 67,145 | |
| 64,321 | | ||
Capitalized costs | 51,679 | |
| 54,123 | | ||
Capitalized research and development costs | 12,508 | |
| 18,896 | | ||
Stock-based compensation | 23,679 | |
| 22,298 | | ||
Tax loss carryovers | 23,623 | |
| 31,748 | | ||
Foreign tax credit carryovers | 7,662 | |
| 10,369 | | ||
Research and other tax credit carryovers | 157,817 | |
| 136,690 | | ||
Other | - | |
| 5,161 | | ||
Gross deferred tax assets | 423,439 | |
| 420,427 | | ||
Valuation allowance | (121,770 | ) |
| (73,909 | ) | ||
Total deferred tax assets | 301,669 | |
| 346,518 | | ||
Deferred tax liabilities: |
|
|
| ||||
Intangible assets | 62,299 | |
| 54,604 | | ||
Undistributed earnings of foreign subsidiaries | 1,300 | |
| 10,888 | | ||
Other | 1,758 | |
| - | | ||
Total deferred tax liabilities | 65,357 | |
| 65,492 | | ||
Net deferred tax assets | $ | 236,312 | |
| $ | 281,026 | |
It is more likely than not that the results of future operations will be able to generate sufficient taxable income to realize the net deferred tax assets. The valuation allowance provided against the Company's deferred tax assets as of October 31, 2017 is mainly attributable to California research credit and international foreign tax credit carryforwards. The valuation allowance increased by a net of $47.9 million in fiscal 2017 primarily due to a change in the realizability of deferred tax assets related to the California research credit carryforwards. Most of the change relates to a significant increase in the Company's share price in fiscal 2017, which results in a higher tax deduction that reduces the future California sourced taxable income and the amount of California research credits the Company expects to utilize. The remainder of the increase relates to an agreement the Company reached with the California tax authorities in fiscal 2017 which resulted primarily in the recognition of unrecognized tax benefits offset by a corresponding increase in the valuation allowance of $13.2 million .
The Company has the following tax loss and credit carryforwards available to offset future income tax liabilities:
Carryforward | Amount |
| Expiration Date | ||
| (in thousands) |
|
| ||
Federal net operating loss carryforward | $ | 57,265 | |
| 2018-2034 |
Federal research credit carryforward | 78,599 | |
| 2019-2036 | |
Federal foreign tax credit carryforward | 2,081 | |
| 2019-2022 | |
International foreign tax credit carryforward | 13,351 | |
| Indefinite | |
California research credit carryforward | 169,038 | |
| Indefinite | |
Other state research credit carryforward | 7,482 | |
| 2023-2032 | |
State net operating loss carryforward | 33,201 | |
| 2024-2035 | |
The federal and state net operating loss carryforward is from acquired companies and the annual use of such loss is subject to significant limitations under Internal Revenue Code Section 382. Foreign tax credits may only be used to offset tax attributable to foreign source income. The federal research tax credit was permanently reinstated in fiscal 2016 .
81
Table of Contents
SYNOPSYS, INC.
NOTES TO CONSOLIDATED FINANCIAL STATEMENTS-Continued
The Company adopted ASU 2016-09 in the first quarter of fiscal 2017. The Company recorded all income tax effects of share-based awards in its provision for income taxes in the condensed consolidated statement of operations on a prospective basis. Prior to adoption, the Company did not recognize excess tax benefits from stock-based compensation as a charge to capital in excess of par value to the extent that the related tax deduction did not reduce income taxes payable. Upon adoption of ASU 2016-09, the Company recorded a deferred tax asset of $106.5 million mainly related to the research tax credit carryover, for the previously unrecognized excess tax benefits with an offsetting adjustment to retained earnings. Adoption of the new standard resulted in net excess tax benefits in the provision for income taxes of $38.1 million for fiscal 2017.
During the fourth quarter of fiscal 2017, the Company repatriated $825 million from its foreign subsidiary. The repatriation was executed in anticipation of potential U.S. corporate tax reform, and the Company plans to indefinitely reinvest the remainder of its undistributed foreign earnings outside the United States. The Company provides for U.S. income and foreign withholding taxes on foreign earnings, except for foreign earnings that are considered indefinitely reinvested outside the U.S. As of October 31, 2017 , there were approximately $598.3 million of earnings upon which U.S. income taxes of approximately $110.0 million have not been provided for.
The gross unrecognized tax benefits decreased by approximately $14.9 million during fiscal 2017 resulting in gross unrecognized tax benefits of $91.6 million as of October 31, 2017 . A reconciliation of the beginning and ending balance of gross unrecognized tax benefits is summarized as follows:
| As of October 31, 2017 |
| As of October 31, 2016 | ||||
| (in thousands) | ||||||
Beginning balance | $ | 106,542 | |
| $ | 132,054 | |
Increases in unrecognized tax benefits related to prior year tax positions | 3,117 | |
| 7,205 | | ||
Decreases in unrecognized tax benefits related to prior year tax positions | (49,456 | ) |
| (43,944 | ) | ||
Increases in unrecognized tax benefits related to current year tax positions | 31,007 | |
| 13,880 | | ||
Decreases in unrecognized tax benefits related to settlements with taxing authorities | (784 | ) |
| (333 | ) | ||
Reductions in unrecognized tax benefits due to lapse of applicable statute of limitations | (2,635 | ) |
| (2,659 | ) | ||
Increases in unrecognized tax benefits acquired | 1,934 | |
| 49 | | ||
Changes in unrecognized tax benefits due to foreign currency translation | 1,912 | |
| 290 | | ||
Ending balance | $ | 91,637 | |
| $ | 106,542 | |
As of October 31, 2017 and 2016 , approximately $88.5 million and $106.5 million , respectively, of the unrecognized tax benefits would affect the Company's effective tax rate if recognized upon resolution of the uncertain tax positions.
Interest and penalties related to estimated obligations for tax positions taken in the Company's tax returns are recognized as a component of income tax expense (benefit) in the consolidated statements of operations and totaled approximately $0.2 million , $0.8 million and $0.6 million for fiscal years 2017 , 2016 and 2015 , respectively. As of October 31, 2017 and 2016 , the combined amount of accrued interest and penalties related to tax positions taken on the Company's tax returns was approximately $3.2 million and $3.1 million , respectively.
The timing of the resolution of income tax examinations, and the amounts and timing of various tax payments that are part of the settlement process, are highly uncertain. Variations in such amounts and/or timing could cause large fluctuations in the balance sheet classification of current and non-current assets and liabilities. The Company believes that in the coming 12 months , it is reasonably possible that either certain audits will conclude or the statute of limitations on certain state and foreign income and withholding taxes will expire, or both. Given the uncertainty as to ultimate settlement terms, the timing of payment and the impact of such settlements on other uncertain tax positions, the range of the estimated potential decrease in underlying unrecognized tax benefits is between $0 and $32 million .
82
Table of Contents
SYNOPSYS, INC.
NOTES TO CONSOLIDATED FINANCIAL STATEMENTS-Continued
The Company and/or its subsidiaries remain subject to tax examination in the following jurisdictions:
|
|
Jurisdiction | Year(s) Subject to Examination |
United States | Fiscal 2017 |
California | Fiscal years after 2014 |
Hungary and Ireland | Fiscal years after 2010 |
Japan and Taiwan | Fiscal years after 2011 |
In addition, the Company has made acquisitions with operations in several of its significant jurisdictions which may have years subject to examination different from the years indicated in the above table.
On July 27, 2015, the United States Tax Court (Tax Court) issued an opinion ( Altera Corp. et al. v. Commissioner ) regarding the treatment of stock-based compensation expense in intercompany cost-sharing arrangements. The U.S. Treasury has not withdrawn the requirement to include stock-based compensation from its regulations and the IRS has initiated an appeal of the Tax Court's opinion. As the final resolution with respect to historical cost-sharing of stock-based compensation, and the potential favorable benefits to the Company, is unclear, the Company is recording no impact at this time and will continue to monitor developments related to this opinion and the potential impact of those developments on the Company's prior fiscal years. Effective February 1, 2016, the Company amended its cost- sharing arrangement to exclude stock-based compensation expense on a prospective basis and has reflected the corresponding benefits in its effective annual tax rate.
IRS Examinations
In fiscal 2017, the Company reached final settlement with the Examination Division of the IRS for fiscal 2016 and recognized approximately $4.6 million in unrecognized tax benefits.
In fiscal 2016, the Company reached final settlement with the Examination Division of the IRS for fiscal 2015 and recognized approximately $20.7 million in unrecognized tax benefits.
In fiscal 2015, the Company reached final settlement with the IRS on the integration of acquired technologies for fiscal 2015 and research tax credit for fiscal 2014 that resulted in $7.0 million and $3.2 million in tax benefits, respectively.
State Examinations
In fiscal 2017, the Company reached an agreement with the California Franchise Tax Board for fiscal 2014, 2013, and 2012. As a result of the agreement, the Company recognized tax expense of $0.4 million , reduced its deferred tax assets by $1.1 million , recognized $14.6 million in unrecognized tax benefits, and increased its valuation allowance by $13.2 million .
In fiscal 2016, the Company reached final settlement with the California Franchise Tax Board for fiscal 2011, 2010, and 2009. As a result of the settlement, the Company reduced its deferred tax assets by $4.9 million , recognized $10.3 million in unrecognized tax benefits, and increased its valuation allowance by $5.4 million .
Non-U.S. Examinations
Hungary
In July 2017, the Hungarian Tax Authority (HTA) issued a final assessment against the Company's Hungarian subsidiary (Synopsys Hungary) for fiscal years 2011 through 2013. The HTA has disallowed Synopsys Hungary's tax positions taken during these years regarding the timing of the deduction of research expenses and applied withholding taxes on certain payments made to affiliates, resulting in an aggregate tax assessment of approximately $47 million and interest and penalties of over $18 million (at current exchange rates). In addition, if the treatment of research expense were applied to fiscal years after 2014, Synopsys Hungary could lose approximately $18 million in tax benefit in tax periods subsequent to fiscal 2017 due to the enacted reduction of Hungary's corporate income tax rate. While the ultimate outcome is not certain, the Company believes there is no merit to the assessment and that it will ultimately prevail against the positions taken by the HTA. To that end, on August 2, 2017, Synopsys Hungary filed a claim contesting the final assessment with the Hungarian Administrative Court. On November 16, 2017, Synopsys Hungary paid the assessment, while continuing its challenge to the assessment in court. A hearing is scheduled for early 2018. If the Company prevails, the assessment of $47 million and associated interest and
83
Table of Contents
SYNOPSYS, INC.
NOTES TO CONSOLIDATED FINANCIAL STATEMENTS-Continued
penalties would be canceled, but the Hungarian statutory accounting treatment could have an indirect adverse impact on certain tax benefits in the year of the cancellation.
Korea
In fiscal 2017, the Company settled certain transfer pricing issues with the Korea National Tax Service for fiscal years 2012 to 2016. As a result of the settlement, the Company recognized income tax expense of $7.9 million .
Taiwan
In fiscal 2017, the Company reached an agreement with the Taiwanese tax authorities on certain tax positions for fiscal year 2014 resulting in an income tax benefit of $10.9 million .
In fiscal 2016, the Company reached final settlement with the Taiwanese tax authorities for fiscal 2011, with regard to certain transfer pricing issues. As a result of the settlement, the Company paid $0.3 million of tax and recognized $0.7 million in unrecognized tax benefits.
In fiscal 2015, the Company reached final settlement with the Taiwanese tax authorities for fiscal 2012 with regard to certain transfer pricing issues. As a result of the settlement, the Company recognized approximately $1.1 million in unrecognized tax benefits. The Company also reached final settlement with the Taiwanese tax authorities for fiscal 2013 with regard to certain transfer pricing issues. As a result of the settlement and the application of the settlement to fiscal 2014, the Company's unrecognized tax benefits decreased by $1.2 million and $1.2 million for fiscal years 2013 and 2014, respectively.
India
In fiscal 2016, the Company agreed to settle certain transfer pricing issues with the Indian tax authorities for various fiscal years. As a result of the settlement, the Company recognized income tax expense, net of foreign tax credits, of $4.6 million .
Note 12. Other Income (Expense), Net
The following table presents the components of other income (expense), net:
| Year Ended October 31, | ||||||||||
| 2017 |
| 2016 |
| 2015 | ||||||
| (in thousands) | ||||||||||
Interest income | $ | 7,241 | |
| $ | 3,715 | |
| $ | 2,785 | |
Interest expense | (7,303 | ) |
| (3,771 | ) |
| (2,814 | ) | |||
Gain (loss) on assets related to deferred compensation plan | 29,606 | |
| 4,400 | |
| 3,701 | | |||
Foreign currency exchange gain (loss) | 3,354 | |
| 156 | |
| 6,363 | | |||
Other, net | 2,637 | |
| 7,653 | |
| 5,109 | | |||
Total | $ | 35,535 | |
| $ | 12,153 | |
| $ | 15,144 | |
Note 13. Segment Disclosure
ASC 280, Segment Reporting, requires disclosures of certain information regarding operating segments, products and services, geographic areas of operation and major customers. Segment reporting is based upon the "management approach," i.e., how management organizes the Company's operating segments for which separate financial information is (1) available and (2) evaluated regularly by the Chief Operating Decision Makers (CODMs) in deciding how to allocate resources and in assessing performance. Synopsys' CODMs are the Company's two Co-Chief Executive Officers.
The Company operates in a single segment to provide software products and consulting services primarily in the EDA software industry. In making operating decisions, the CODMs primarily consider consolidated financial information, accompanied by disaggregated information about revenues by geographic region. Specifically, the CODMs consider where individual "seats" or licenses to the Company's products are located in allocating revenue to particular geographic areas. Revenue is defined as revenues from external customers. Goodwill is not allocated since the Company operates in one reportable operating segment. Revenues and property and equipment, net, related to operations in the United States and other by geographic areas were:
84
Table of Contents
| Year Ended October 31, | ||||||||||
| 2017 |
| 2016 |
| 2015 | ||||||
| (in thousands) | ||||||||||
Revenue: |
|
|
|
|
| ||||||
United States | $ | 1,357,364 | |
| $ | 1,205,880 | |
| $ | 1,143,816 | |
Europe | 308,419 | |
| 287,381 | |
| 300,352 | | |||
Japan | 247,631 | |
| 239,964 | |
| 218,794 | | |||
Asia Pacific and Other | 811,466 | |
| 689,307 | |
| 579,249 | | |||
Consolidated | $ | 2,724,880 | |
| $ | 2,422,532 | |
| $ | 2,242,211 | |
| As of October 31, | ||||||
| 2017 |
| 2016 | ||||
| (in thousands) | ||||||
Property and Equipment, net: |
|
|
| ||||
United States | $ | 189,379 | |
| $ | 186,854 | |
Other countries | 76,635 | |
| 70,181 | | ||
Total | $ | 266,014 | |
| $ | 257,035 | |
Geographic revenue data for multi-regional, multi-product transactions reflect internal allocations and are therefore subject to certain assumptions and to the Company's methodology.
One customer, including its subsidiaries, through multiple agreements accounted for 17.9% , 15.9% , and 12.8% of the Company's consolidated revenue in fiscal 2017 , 2016 , and 2015 , respectively.
Note 14. Subsequent Events
On November 2, 2017, the Company entered into a definitive agreement pursuant to which the Company has agreed to acquire privately held Black Duck Software, a leader in automated solutions for securing and managing open source software. The acquisition was completed on December 11, 2017 and under the terms of the definitive agreement, the Company paid approximately $547 million , net of cash acquired, and assumed certain unvested equity of Black Duck employees. The transaction was funded by U.S. cash.
85
Table of Contents
Supplementary Data - Selected Unaudited Quarterly Financial Data
The table below includes certain unaudited financial information for the last eight fiscal quarters. Refer to Note 2 of Notes to Consolidated Financial Statements for information on our fiscal year end.
| Quarter Ended | ||||||||||||||
| January 31, |
| April 30, |
| July 31, |
| October 31, | ||||||||
| (in thousands, except per share data) | ||||||||||||||
2017 |
|
|
|
|
|
|
| ||||||||
Revenue | $ | 652,786 | |
| $ | 680,069 | |
| $ | 695,381 | |
| $ | 696,644 | |
Gross margin | 497,040 | |
| 518,041 | |
| 525,835 | |
| 529,780 | | ||||
Income before provision for income taxes | 108,361 | |
| 62,020 | |
| 112,791 | |
| 99,926 | | ||||
Net income | 86,588 | |
| 53,306 | |
| 116,751 | |
| (120,082 | ) | ||||
Net income per share |
|
|
|
|
|
|
| ||||||||
Basic | $ | 0.57 | |
| $ | 0.35 | |
| $ | 0.78 | |
| $ | (0.80 | ) |
Diluted | 0.56 | |
| 0.34 | |
| 0.75 | |
| (0.80 | ) | ||||
2016 |
|
|
|
|
|
|
| ||||||||
Revenue | $ | 568,604 | |
| $ | 605,005 | |
| $ | 615,204 | |
| $ | 633,719 | |
Gross margin | 439,160 | |
| 473,375 | |
| 475,527 | |
| 491,508 | | ||||
Income before provision for income taxes | 64,342 | |
| 97,223 | |
| 85,231 | |
| 82,752 | | ||||
Net income | 60,035 | |
| 69,376 | |
| 64,718 | |
| 72,697 | | ||||
Net income per share |
|
|
|
|
|
|
| ||||||||
Basic | $ | 0.39 | |
| $ | 0.46 | |
| $ | 0.43 | |
| $ | 0.48 | |
Diluted | 0.39 | |
| 0.45 | |
| 0.42 | |
| 0.47 | | ||||
Item 9. Changes in and Disagreements with Accountants on Accounting and Financial Disclosure |
Not applicable.
Item 9A. Controls and Procedures |
(a) | Evaluation of Disclosure Controls and Procedures. As of October 31, 2017 , Synopsys carried out an evaluation under the supervision and with the participation of Synopsys' management, including the Co-Chief Executive Officers and Chief Financial Officer, of the effectiveness of the design and operation of Synopsys' disclosure controls and procedures (as such term is defined in Rules 13a-15(e) and 15d-15(e) under the Exchange Act). There are inherent limitations to the effectiveness of any system of disclosure controls and procedures. Accordingly, even effective disclosure controls and procedures can only provide reasonable, not absolute, assurance of achieving their control objectives. Our Co-Chief Executive Officers and Chief Financial Officer have concluded that, as of October 31, 2017 , Synopsys' disclosure controls and procedures were effective to provide reasonable assurance that information required to be disclosed in the reports Synopsys files and submits under the Exchange Act is recorded, processed, summarized and reported as and when required, and that such information is accumulated and communicated to Synopsys' management, including the Co-Chief Executive Officers and Chief Financial Officer, to allow timely decisions regarding its required disclosure. |
(b) | Management's Report on Internal Control Over Financial Reporting . Our management is responsible for establishing and maintaining adequate internal control over financial reporting (as defined in Rules 13a-15(f) and 15d-15(f) under the Exchange Act) for Synopsys. |
Under the supervision and with the participation of our management, including our Co-Chief Executive Officers and Chief Financial Officer, we conducted an evaluation of the effectiveness of our internal control over financial reporting as of October 31, 2017 . In assessing the effectiveness of our internal control over financial reporting, our management used the framework established in Internal Control Integrated Framework (2013) issued by The Committee of Sponsoring Organizations of the Treadway Commission (COSO).
86
Table of Contents
Our management has concluded that, as of October 31, 2017 , our internal control over financial reporting was effective based on these criteria. Our independent registered public accounting firm, KPMG LLP, has issued an auditors' report on the effectiveness of our internal control over financial reporting, which is included herein.
(c) | Changes in Internal Control Over Financial Reporting. There were no changes in Synopsys' internal control over financial reporting during the fiscal quarter ended October 31, 2017 that have materially affected, or are reasonably likely to materially affect, Synopsys' internal control over financial reporting. |
Item 9B. Other Information |
None.
87
Table of Contents
PART III
Item 10. Directors, Executive Officers and Corporate Governance |
For information with respect to our executive officers, see Executive Officers of the Registrant in Part I, Item 1 of this Annual Report.
All other information required by this Item is incorporated herein by reference from our definitive Proxy Statement for the 2018 Annual Meeting of Stockholders (the Proxy Statement) scheduled to be held on April 5, 2018 , as provided under the headings "Proposal 1: Election of Directors," "Audit Committee Report," "Corporate Governance," and "Section 16(a) Beneficial Ownership Reporting Compliance."
Item 11. Executive Compensation |
The information required by this Item is incorporated herein by reference from the Proxy Statement, as provided under the headings "Compensation Discussion and Analysis" (and all subheadings thereunder), "Executive Compensation Tables" (and all subheadings thereunder), "Director Compensation," "Compensation Committee Interlocks and Insider Participation," and "Compensation Committee Report."
Item 12. Security Ownership of Certain Beneficial Owners and Management and Related Stockholder Matters |
The information required by this Item is incorporated herein by reference from the Proxy Statement, as provided under the headings "Equity Compensation Plan Information" and "Security Ownership of Certain Beneficial Owners and Management."
Item 13. Certain Relationships and Related Transactions and Director Independence |
The information required by this Item is incorporated herein by reference from the Proxy Statement, as provided under the headings "Certain Relationships and Related Transactions" and "Corporate Governance" (under the subheading "Director Independence").
Item 14. Principal Accountant Fees and Services |
The information required by this Item is incorporated herein by reference from the Proxy Statement, as provided under the subheadings "Fees and Services of Independent Registered Public Accounting Firm" and "Audit Committee Pre-Approval Policies and Procedures" under the proposal titled "Ratification of Selection of Independent Registered Public Accounting Firm."
88
Table of Contents
PART IV
Item 15. Exhibits and Financial Statement Schedules |
(a) | The following documents are filed as part of this Form 10-K: |
(1) | Financial Statements |
The following documents are included as Part II, Item 8 of this Form 10-K:
| Page |
Report of Independent Registered Public Accounting Firm | 49 |
Consolidated Balance Sheets | 50 |
Consolidated Statements of Operations | 51 |
Consolidated Statements of Comprehensive Income | 52 |
Consolidated Statements of Stockholders' Equity | 53 |
Consolidated Statements of Cash Flows | 50 |
Notes to Consolidated Financial Statements | 55 |
(2) | Financial Statement Schedules |
Schedules not listed above have been omitted because the information required to be set forth therein is not applicable or is shown in the financial statements or notes herein.
(3) | Exhibits |
See Item 15(b) below.
(b) | Exhibits |
EXHIBIT INDEX
Exhibit Number | Exhibit Description |
| Incorporated By Reference |
| Filed or Furnished Herewith | ||||||
Form |
| File No. |
| Exhibit |
| Filing Date |
| ||||
3.1 | Amended and Restated Certificate of Incorporation |
| 10-Q |
| 000-19807 |
| 3.1 |
| 9/15/2003 |
|
|
3.2 | Amended and Restated Bylaws |
| 8-K |
| 000-19807 |
| 3.2 |
| 5/23/2012 |
|
|
4.1 | Specimen Common Stock Certificate |
| S-1 |
| 33-45138 |
| 4.3 |
| 2/24/1992 (effective date) |
|
|
10.1 | Amended and Restated Credit Agreement, dated November 28, 2016, among Synopsys as Borrower, the several Lenders from time to time parties thereto, Bank of America, N.A., the Bank of Tokyo-Mitsubishi UFJ, Ltd. and Wells Fargo Bank, N.A. as Co-Syndication Agents, HSBC Bank USA, N.A. and U.S. Bank N.A. as Co-Documentation Agents, JPMorgan Chase Bank, N.A., as Administrative Agent, and JPMorgan Chase Bank, N.A., Merrill Lynch, Pierce, Fenner & Smith Incorporated, the Bank of Tokyo-Mitsubishi UFJ, Ltd. and Wells Fargo Securities, LLC, as Co-Lead Arrangers and Co-Bookrunners |
| 8-K |
| 000-19807 |
| 10.1 |
| 11/30/2016 |
|
|
89
Table of Contents
Exhibit Number | Exhibit Description |
| Incorporated By Reference |
| Filed or Furnished Herewith | ||||||
Form |
| File No. |
| Exhibit |
| Filing Date |
| ||||
10.2 | Lease Agreement dated October 14, 2011 between Synopsys, Inc. and 690 E. Middlefield Road Fee, LLC, ("The October 14, 2011 Lease") |
| 10-K |
| 000-19807 |
| 10.19 |
| 12/16/2011 |
|
|
10.2(i)† | Notification of Change of Ownership of Leased Premises under The October 14, 2011 Lease-Effective May 9, 2012 |
| 10-K |
| 000-19807 |
| 10.10(i) |
| 12/20/2012 |
|
|
10.2(ii) | First Amendment to The October 14, 2011 Lease |
| 10-Q |
| 000-19807 |
| 10.10(ii) |
| 3/4/2013 |
|
|
10.2(iii) | Second Amendment to The October 14, 2011 Lease |
| 10-Q |
| 000-19807 |
| 10.10(iii) |
| 5/22/2015 |
|
|
10.3 | Lease Agreement, dated January 2, 1996 between Synopsys, Inc. and Tarigo-Paul, a California Limited Partnership, ("The January 2, 1996 Lease") |
| 10-Q |
| 000-19807 |
| 10.28 |
| 5/14/1996 |
|
|
10.3(i) | First Amendment to The January 2, 1996 Lease |
| 8-K |
| 000-19807 |
| 10.42 |
| 9/12/2006 |
|
|
10.3(ii) | Second Amendment to The January 2, 1996 Lease |
| 8-K |
| 000-19807 |
| 10.41 |
| 9/12/2006 |
|
|
10.3(iii) | Third Amendment to The January 2, 1996 Lease |
| 10-K |
| 000-19807 |
| 10.8(iii) |
| 12/20/2012 |
|
|
10.3(iv) | Fourth Amendment to The January 2, 1996 Lease |
| 10-K |
| 000-19807 |
| 10.8(iv) |
| 12/20/2012 |
|
|
10.3(v)† | Notification of Change of Ownership of Leased Premises under The January 2, 1996 Lease-Effective September 25, 2012 |
| 10-K |
| 000-19807 |
| 10.8(v) |
| 12/20/2012 |
|
|
10.4* | 2006 Employee Equity Incentive Plan, as amended |
| 8-K |
| 000-19807 |
| 10.4 |
| 4/10/2017 |
|
|
10.5* | Form of Restricted Stock Unit Grant Notice and Award Agreement under 2006 Employee Equity Incentive Plan |
| 10-Q |
| 000-19807 |
| 10.5 |
| 2/17/2017 |
|
|
10.6* | Form of Notice of Grant of Stock Options and Option Agreement under 2006 Employee Equity Incentive Plan |
| 10-Q |
| 000-19807 |
| 10.6 |
| 2/17/2017 |
|
|
10.7* | Employee Stock Purchase Plan, as amended |
| 8-K |
| 000-19807 |
| 10.7 |
| 4/1/2016 |
|
|
10.8* | 2017 Non-Employee Directors Equity Incentive Plan |
| 8-K |
| 000-19807 |
| 10.8 |
| 4/10/2017 |
|
|
10.9* | Form of Restricted Stock Grant Notice and Award Agreement under 2017 Non-Employee Directors Equity Incentive Plan |
|
|
|
|
|
|
|
|
| X |
90
Table of Contents
Exhibit Number | Exhibit Description |
| Incorporated By Reference |
| Filed or Furnished Herewith | ||||||
Form |
| File No. |
| Exhibit |
| Filing Date |
| ||||
10.10* | Form of Stock Options Grant Notice and Option Agreement under 2017 Non-Employee Directors Equity Incentive Plan |
|
|
|
|
|
|
|
|
| X |
10.11* | Deferred Compensation Plan as restated effective August 1, 2002 |
| 10-Q |
| 000-19807 |
| 10.5 |
| 6/10/2004 |
|
|
10.12* | Synopsys Amended and Restated Deferred Compensation Plan II |
| 10-Q |
| 000-19807 |
| 10.23 |
| 3/9/2009 |
|
|
10.13 | Form of Indemnification Agreement for directors and executive officers |
| 8-K |
| 000-19807 |
| 99.2 |
| 7/14/2011 |
|
|
10.14* | Director's and Officer's Insurance and Company Reimbursement Policy |
| S-1 |
| 33-45138 |
| 10.2 |
| 2/24/1992 (effective date) |
|
|
10.15* | Amended and Restated Employment Agreement, dated December 15, 2016 between Synopsys, Inc. and Dr. Aart de Geus |
| 8-K |
| 000-19807 |
| 10.16 |
| 12/21/2016 |
|
|
10.16* | Amended and Restated Employment Agreement, dated December 15, 2016 between Synopsys, Inc. and Dr. Chi-Foon Chan |
| 8-K |
| 000-19807 |
| 10.17 |
| 12/21/2016 |
|
|
10.17* | Executive Incentive Plan, as amended |
| 8-K |
| 000-19807 |
| 10.18 |
| 12/21/2016 |
|
|
10.18* | Amended and Restated Executive Change of Control Severance Benefit Plan |
| 8-K |
| 000-19807 |
| 10.19 |
| 12/21/2016 |
|
|
10.19* | Compensation Recovery Policy |
| 10-K |
| 000-19807 |
| 10.46 |
| 12/22/2008 |
|
|
21.1 | Subsidiaries of Synopsys, Inc. |
|
|
|
|
|
|
|
|
| X |
23.1 | Consent of KPMG LLP, Independent Registered Public Accounting Firm |
|
|
|
|
|
|
|
|
| X |
24.1 | Power of Attorney (see signature page to this Annual Report on Form 10-K) |
|
|
|
|
|
|
|
|
| X |
31.1 | Certification of Co-Chief Executive Officer pursuant to Rule 13a-14(a) or Rule 15d-14(a) of the Exchange Act |
|
|
|
|
|
|
|
|
| X |
31.2 | Certification of Co-Chief Executive Officer pursuant to Rule 13a-14(a) or Rule 15d-14(a) of the Exchange Act |
|
|
|
|
|
|
|
|
| X |
31.3 | Certification of Chief Financial Officer pursuant to Rule 13a-14(a) or Rule 15d-14(a) of the Exchange Act |
|
|
|
|
|
|
|
|
| X |
91
Table of Contents
Exhibit Number | Exhibit Description |
| Incorporated By Reference |
| Filed or Furnished Herewith | ||||||
Form |
| File No. |
| Exhibit |
| Filing Date |
| ||||
32.1 | Certification of Co-Chief Executive Officers and Chief Financial Officer furnished pursuant to Rule 13a-14(b) or Rule 15d-14(b) of the Exchange Act and Section 1350 of Chapter 63 of Title 18 of the United States Code |
|
|
|
|
|
|
|
|
| X |
101.INS | XBRL Instance Document |
|
|
|
|
|
|
|
|
| X |
101.SCH | XBRL Taxonomy Extension Schema Document |
|
|
|
|
|
|
|
|
| X |
101.CAL | XBRL Taxonomy Extension Calculation Linkbase Document |
|
|
|
|
|
|
|
|
| X |
101.DEF | XBRL Taxonomy Extension Definition Linkbase Document |
|
|
|
|
|
|
|
|
| X |
101.LAB | XBRL Taxonomy Extension Label Linkbase Document |
|
|
|
|
|
|
|
|
| X |
101.PRE | XBRL Taxonomy Extension Presentation Linkbase Document |
|
|
|
|
|
|
|
|
| X |
* Indicates a management contract, compensatory plan or arrangement.
† We have requested confidential treatment for certain portions of this document pursuant to an application for confidential treatment sent to the SEC. We omitted such portions from this filing and filed them separately with the SEC.
92
Table of Contents
SIGNATURES
Pursuant to the requirements of Section 13 or 15(d) of the Securities Exchange Act of 1934, the registrant has duly caused this report to be signed on its behalf by the undersigned, thereunto duly authorized.
|
|
|
| S YNOPSYS , I NC . |
|
|
|
|
|
Date: December 13, 2017 |
| By: |
| /s/ Trac Pham |
|
|
|
| Trac Pham Chief Financial Officer (Principal Financial Officer) |
93
Table of Contents
POWER OF ATTORNEY
KNOW ALL PERSONS BY THESE PRESENTS, that each person whose signature appears below constitutes and appoints Aart J. de Geus, Chi-Foon Chan and Trac Pham, and each of them, as his true and lawful attorneys-in-fact and agents, with full power of substitution and reconstitution, for him and in his name, place and stead, in any and all capacities, to sign any and all amendments to this Annual Report on Form 10-K, and to file the same, with all exhibits thereto, and other documents in connection therewith, with the Securities and Exchange Commission, granting unto said attorneys-in-fact and agents, and each of them, full power and authority to do and perform each and every act and thing requisite and necessary to be done in connection therewith, as fully to all intents and purposes as he might or could do in person, hereby ratifying and confirming all that said attorneys-in-fact and agents, or any of them, or their or his substitute or substitutes, may lawfully do or cause to be done by virtue hereof.
Pursuant to the requirements of the Securities Exchange Act of 1934, this report has been signed below by the following persons on behalf of the registrant and in the capacities and on the dates indicated:
Name |
| Title |
| Date |
|
|
|
|
|
/ S / A ART J. DE G EUS |
| Co-Chief Executive Officer (Co-Principal Executive Officer) and Chairman of the Board of Directors |
| December 13, 2017 |
Aart J. de Geus |
|
|
|
|
|
|
|
|
|
/ S / C HI -F OON C HAN |
| Co-Chief Executive Officer (Co-Principal Executive Officer), President and Director |
| December 13, 2017 |
Chi-Foon Chan |
|
|
|
|
|
|
|
|
|
/ S / T RAC P HAM |
| Chief Financial Officer (Principal Financial Officer) |
| December 13, 2017 |
Trac Pham |
|
|
|
|
|
|
|
|
|
/ S / S UDHINDRA K ANKANWADI |
| Vice President, Corporate Controller (Principal Accounting Officer) |
| December 13, 2017 |
Sudhindra Kankanwadi |
|
|
|
|
|
|
|
|
|
/ S / J ANICE D. C HAFFIN |
| Director |
| December 13, 2017 |
Janice D. Chaffin |
|
|
|
|
|
|
|
|
|
/ S / B RUCE R. C HIZEN |
| Director |
| December 13, 2017 |
Bruce R. Chizen |
|
|
|
|
|
|
|
|
|
/ S / D EBORAH A. C OLEMAN |
| Director |
| December 13, 2017 |
Deborah A. Coleman |
|
|
|
|
|
|
|
|
|
/ S / M ERCEDES J OHNSON |
| Director |
| December 13, 2017 |
Mercedes Johnson |
|
|
|
|
|
|
|
|
|
/ S / C HRYSOSTOMOS L. N IKIAS |
| Director |
| December 13, 2017 |
Chrysostomos L. Nikias |
|
|
|
|
|
|
|
|
|
/ S / J OHN G. S CHWARZ |
| Director |
| December 13, 2017 |
John G. Schwarz |
|
|
|
|
|
|
|
|
|
/ S / R OY V ALLEE |
| Director |
| December 13, 2017 |
Roy Vallee |
|
|
|
|
|
|
|
|
|
/ S / S TEVEN C. W ALSKE |
| Director |
| December 13, 2017 |
Steven C. Walske |
|
|
|
|
94