UNITED STATES
SECURITIES AND EXCHANGE COMMISSION
Washington, D.C. 20549
___________________________
FORM 10-K
[ X ] | ANNUAL REPORT PURSUANT TO SECTION 13 OR 15(d) OF THE SECURITIES EXCHANGE ACT OF 1934 |
For the fiscal year ended June 30, 2017 OR | |
[ ] | TRANSITION REPORT PURSUANT TO SECTION 13 OR 15(d) OF THE SECURITIES EXCHANGE ACT OF 1934
|
Commission File Number: 0-23406
SOUTHERN MISSOURI BANCORP, INC.
(Exact name of registrant as specified in its charter)
Missouri | 43-1665523 | |
2991 Oak Grove Road, Poplar Bluff, Missouri | 63901 |
Registrant's telephone number, including area code: (573) 778-1800
Securities registered pursuant to Section 12(b) of the Act: | |
Title of each class: | Name of each exchange on which registered: |
Indicate by check mark if the registrant is a well-known seasoned issuer, as defined in Rule 405 of the Securities Act. YES NO X
Indicate by check mark if the registrant is not required to file reports pursuant to Section 13 or Section 15(d) of the Act. YES NO X
Indicate by check mark whether the registrant (1) has filed all reports required to be filed by Section 13 or 15(d) of the Securities Exchange Act of 1934 during the preceding 12 months (or for such shorter period that the registrant was required to file such reports), and (2) has been subject to such filing requirements for the past 90 days. YES X NO
Indicate by check mark whether the registrant has submitted electronically and posted on its corporate web site, if any, every interactive data file required to be submitted and posted pursuant to Rule 405 of Regulation S-T (§ 232.405 of this chapter) during the preceding 12 months (or for such shorter period that the registration was required to submit and post such files. YES X NO
Indicate by check mark whether disclosure of delinquent filers pursuant to Item 405 of Regulation S-K is not contained herein, and will not be contained, to the best of the registrant's knowledge, in definitive proxy or other information statements incorporated by reference in Part III of this Form 10-K or any amendments to this Form 10-K.
Indicate by check mark whether the registrant is a large accelerated filer, an accelerated filer, a non-accelerated filer, or a smaller reporting company.
Large accelerated filer Accelerated filer X Non-accelerated filer Smaller reporting company ___
(Do not check if a smaller reporting company)
Indicate by check mark whether the registrant is a shell company (as defined in Rule 12b-2 of the Exchange Act). YES NO X
The aggregate market value of the voting stock held by non-affiliates of the registrant, computed by reference to the average of the high and low traded price of such stock as of the last business day of the registrant's most recently completed second fiscal quarter, was $218.0 million. (The exclusion from such amount of the market value of the shares owned by any person shall not be deemed an admission by the registrant that such person is an affiliate of the registrant.)
As of September 13, 2017, there were issued and outstanding 8,591,363 shares of the Registrant's common stock.
DOCUMENTS INCORPORATED BY REFERENCE
Part III of Form 10-K - Portions of the Proxy Statement for the 2017 Annual Meeting of Stockholders.
PART I
Item 1. Description of Business
General
Southern Missouri Bancorp, Inc. ("Company"), which changed its state of incorporation to Missouri on April 1, 1999, was originally incorporated in Delaware on December 30, 1993 for the purpose of becoming the holding company for Southern Missouri Savings Bank upon completion of Southern Missouri Savings Bank's conversion from a state chartered mutual savings and loan association to a state chartered stock savings bank. As part of the conversion in April 1994, the Company sold 1,803,201 shares of its common stock to the public. The Company's Common Stock is quoted on the NASDAQ Global Market under the symbol "SMBC".
Southern Missouri Savings Bank was originally chartered as a mutual Missouri savings and loan association in 1887. On June 20, 1995, it converted to a federally chartered stock savings bank and took the name Southern Missouri Savings Bank, FSB. On February 17, 1998, Southern Missouri Savings Bank converted from a federally chartered stock savings bank to a Missouri chartered stock savings bank and changed its name to Southern Missouri Bank & Trust Co. On June 4, 2004, Southern Missouri Bank & Trust Co. converted from a Missouri chartered stock savings bank to a Missouri state chartered trust company with banking powers ("Charter Conversion"). On June 1, 2009, the institution changed its name to Southern Bank ("Bank").
The primary regulator of the Bank is the Missouri Division of Finance. The Bank is a member of the Federal Reserve, and the Board of Governors of the Federal Reserve System ("Federal Reserve Board" or "FRB") is the Bank's primary federal regulator. The Bank's deposits continue to be insured up to applicable limits by the Deposit Insurance Fund ("DIF") of the Federal Deposit Insurance Corporation ("FDIC"). With the Bank's conversion to a trust company with banking powers, the Company became a bank holding company regulated by the FRB.
The principal business of the Bank consists primarily of attracting retail deposits from the general public and using such deposits along with wholesale funding from the Federal Home Loan Bank of Des Moines ("FHLB"), and to a lesser extent, brokered deposits, to invest in one- to four-family residential mortgage loans, mortgage loans secured by commercial real estate, commercial non-mortgage business loans, and consumer loans. These funds are also used to purchase mortgage-backed and related securities ("MBS"), U.S. Government Agency obligations, municipal bonds, and other permissible investments.
At June 30, 2017, the Company had total assets of $1.7 billion, total deposits of $1.5 b illion and stockholders' equity of $173.1 million. The Company has not engaged in any significant activity other than holding the stock of the Bank. Accordingly, the information set forth in this report, including financial statements and related data, relates primarily to the Bank. The Company's revenues are derived principally from interest earned on loans, debt securities, MBS, CMOs and, to a lesser extent, banking service charges, bank card interchange fees, gains on sales of loans, loan late charges, increases in the cash surrender value of bank owned life insurance, and other fee income.
Acquisitions
On June 16, 2017, the Company completed its acquisition of Tammcorp, Inc. (Tammcorp) and its subsidiary, Capaha Bank (Capaha), Tamms, Illinois, in a stock and cash transaction. Capaha was merged into the Company's bank subsidiary, Southern Bank, at acquisition. At closing, Tammcorp held total assets of $187 million, loans, net, of $153 million, and deposits of $167 million. The Company acquired Capaha primarily for the purpose of expanding its commercial banking activities to markets where it believes the Company's business model will perform well, and for the long-term value of its core deposit franchise. A Tammcorp note payable of $3.7 million was contractually required to be repaid in conjunction with the acquisition. The goodwill of $4.1 million arising from the acquisition consists largely of synergies and economies of scale expected from combining the operations of the Company and Capaha. Goodwill from this transaction was assigned to the acquisition of the bank holding company, and is not expected to be deductible for tax purposes.
On August 5, 2014, the Company completed its acquisition of Peoples Service Company (PSC) and its subsidiaries, Peoples Banking Company (PBC) and Peoples Bank of the Ozarks (Peoples), Nixa, Missouri, in a stock and cash transaction (the "Peoples Acquisition"). Peoples was merged into the Company's bank subsidiary,
2
Southern Bank, in early December, 2014, in connection with the conversion of Peoples' data system. At closing, PSC held total assets of $267 million, loans, net, of $193 million, and deposits of $221 million. The Company acquired Peoples primarily for the purpose of expanding its commercial banking activities to markets where it believes the Company's business model will perform well, and for the long-term value of its core deposit franchise. Notes payable of $2.9 million were contractually required to be repaid on the date of acquisition. The goodwill of $3.0 million arising from the acquisition consists largely of synergies and economies of scale expected from combining the operations of the Company and Peoples. Goodwill from this transaction was assigned to the acquisition of the bank holding company, and is not expected to be deductible for tax purposes.
The Company completed its acquisition of Ozarks Legacy Community Financial, Inc. (Ozarks Legacy), and its subsidiary, Bank of Thayer, headquartered in Thayer, Missouri, in October 2013. At closing, Ozarks Legacy had total assets of approximately $81 million, loans, net, of $38 million, and deposits of $68 million. The Company completed its acquisition of Citizens State Bankshares of Bald Knob, Inc. (Citizens), and its subsidiary, Citizens State Bank, headquartered in Bald Knob, Arkansas, in February 2014. At closing, Citizens had total assets of approximately $72 million, loans, net, of $12 million, and deposits of $64 million. (The Ozarks Legacy and Citizens acquisitions are referred to as the "Fiscal 2014 Acquisitions" collectively.)
On December 17, 2010, the Bank entered into a Purchase and Assumption Agreement with the FDIC, as receiver, to acquire certain assets and assume certain liabilities of the former First Southern Bank, with headquarters in Batesville, Arkansas, and one branch location in Searcy, Arkansas (the "Fiscal 2011 Acquisition"). As a result of the transaction, the Company acquired loans recorded at a fair value of $115 million and deposits recorded at a fair value of $131 million, at December 17, 2010.
Capital Raising Transactions
On June 20, 2017, the Company completed an at-the-market common stock issuance. A total of 794,762 shares of the Company's common stock were sold at a weighted-average price of approximately $31.46 per share, representing gross proceeds to the Company of approximately $25.0 million. The proceeds from the transaction are expected to be used for general corporate purposes, which may include working capital to support organic growth at Southern Bank, and to support possible acquisitions to the extent available.
On November 22, 2011, the Company completed an underwritten public offering of 1,150,000 shares of common stock at a price to the public of $19.00 per share, for aggregate gross proceeds of $21.9 million. The proceeds from the offering have been used for general corporate purposes, including the funding of loan growth and the purchase of securities.
On July 21, 2011, as part of the Small Business Lending Fund (SBLF) of the United States Department of the Treasury (Treasury), the Company entered into a Small Business Lending Fund-Securities Purchase Agreement (Purchase Agreement) with the Secretary of the Treasury, pursuant to which the Company (i) sold 20,000 shares of the Company's Senior Non-Cumulative Perpetual Preferred Stock, Series A (SBLF Preferred Stock) to the Secretary of the Treasury for a purchase price of $20,000,000. The SBLF Preferred Stock was issued pursuant to the SBLF program, a $30 billion fund established under the Small Business Jobs Act of 2010 that was created to encourage lending to small business by providing capital to qualified community banks with assets of less than $10 billion.
The SBLF Preferred Stock qualified as Tier 1 capital. The SBLF Preferred Stock was entitled to receive non-cumulative dividends, payable quarterly, on each January 1, April 1, July 1 and October 1, beginning October 1, 2011. The dividend rate, as a percentage of the liquidation amount, fluctuated on a quarterly basis during the first 10 quarters during which the SBLF Preferred Stock was outstanding, based upon changes in the Bank's level of Qualified Small Business Lending (QBSL), as defined in the Purchase Agreement. Based upon the increase in the Bank's level of QBSL over the baseline level calculated under the terms of the Purchase Agreement, the dividend rate for the initial dividend period was set at 2.8155%. For the second through ninth calendar quarters, the dividend rate was adjusted to between one percent (1%) and five percent (5%) per annum, to reflect the amount of change in the Bank's level of QBSL. For the tenth calendar quarter through four and one half years after issuance, the dividend rate was fixed at between one percent (1%) and seven percent (7%) based upon the increase in QBSL as compared to the baseline. After four and one half years from issuance, the dividend rate increased to 9% (including a quarterly lending incentive fee of 0.5%).
As required by the Purchase Agreement, $9,635,000 of the proceeds from the sale of the SBLF Preferred Stock was used to redeem the 9,550 shares of the Company's Fixed Rate Cumulative Perpetual Preferred Stock,
3
Series A issued in 2008 to the Treasury in the Troubled Asset Relief Program (TARP), plus the accrued dividends owed on those preferred shares. As part of the 2008 TARP transaction, the Company had issued a ten-year warrant to Treasury to purchase 228,652 shares (split-adjusted) of the Company's common stock at an exercise price (split-adjusted) of $6.27 per share. The Company repurchased the warrant on May 29, 2015, for $2.7 million. Immediately prior to the repurchase, the warrant had been exercisable for the purchase of 231,891 shares (split-adjusted) at an exercise price of $6.18 per share.
The Company noted in a Current Report on Form 8-K filed October 16, 2015, that it redeemed all 20,000 shares of the Company's SBLF Preferred Stock. The shares of SBLF Preferred Stock were redeemed at their liquidation amount of $1,000 per share plus accrued but unpaid dividends to the redemption date.
Recent Events
On August 17, 2017, the Company announced the signing of an agreement and plan of merger whereby Southern Missouri Bancshares, Inc. ("Bancshares"), and its wholly-owned subsidiary, Southern Missouri Bank of Marshfield, will be acquired by the Company in a stock and cash transaction valued at approximately $15.1 million, (representing 140% of Bancshares' anticipated capital, as adjusted, at closing). At June 30, 2017, Bancshares held consolidated assets of approximately $92 million, loans, net, of $69 million, and deposits of $74 million. The transaction is expected to close in the first quarter of calendar year 2018, subject to satisfaction of customary closing conditions, including regulatory and shareholder approvals. The acquired financial institution is expected to be merged with and into Southern Bank simultaneously with the acquisition of Bancshares in the first quarter of calendar year 2018. Through June 30, 2017, the Company incurred $25,000 of third-party acquisition-related costs. The expenses are included in noninterest expense in the Company's consolidated statement of income for the year ended June 30, 2017.
Forward Looking Statements
This document contains statements about the Company and its subsidiaries which we believe are "forward-looking statements" within the meaning of the Private Securities Litigation Reform Act of 1995. These forward-looking statements include, without limitation, statements with respect to anticipated future operating and financial performance, growth opportunities, interest rates, cost savings and funding advantages expected or anticipated to be realized by management. Words such as "may," "could," "should," "would," "believe," "anticipate," "estimate," "expect," "intend," "plan" and similar expressions are intended to identify these forward-looking statements. Forward-looking statements by the Company and its management are based on beliefs, plans, objectives, goals, expectations, anticipations, estimates and the intentions of management and are not guarantees of future performance. The Company disclaims any obligation to update or revise any forward-looking statements based on the occurrence of future events, the receipt of new information, or otherwise. The important factors we discuss below, as well as other factors discussed in this report under the captions "Risk Factors" and "Management's Discussion and Analysis of Financial Condition and Results of Operations" and identified in our other filings with the SEC and those presented elsewhere by our management from time to time, could cause actual results to differ materially from those indicated by the forward-looking statements made in this document:
· | expected cost savings, synergies and other benefits from our merger and acquisition activities might not be realized within the anticipated time frames or at all, and costs or difficulties relating to integration matters, including but not limited to customer and employee retention, might be greater than expected; |
· | the strength of the United States economy in general and the strength of the local economies in which we conduct operations; |
· | fluctuations in interest rates and in real estate values; |
· | monetary and fiscal policies of the FRB and the U.S. Government and other governmental initiatives affecting the financial services industry; |
· | the risks of lending and investing activities, including changes in the level and direction of loan delinquencies and write-offs and changes in estimates of the adequacy of the allowance for loan losses; |
4
· | our ability to access cost-effective funding; |
· | the timely development of and acceptance of our new products and services and the perceived overall value of these products and services by users, including the features, pricing and quality compared to competitors' products and services; |
· | fluctuations in real estate values and both residential and commercial real estate markets, as well as agricultural business conditions; |
· | demand for loans and deposits; |
· | legislative or regulatory changes that adversely affect our business; |
· | changes in accounting principles, policies, or guidelines; |
· | results of regulatory examinations, including the possibility that a regulator may, among other things, require an increase in our reserve for loan losses or write-down of assets; |
· | the impact of technological changes; and |
· | our success at managing the risks involved in the foregoing. |
The Company disclaims any obligation to update or revise any forward-looking statements based on the occurrence of future events, the receipt of new information, or otherwise.
Market Area
The Bank provides its customers with a full array of community banking services and conducts its business from its headquarters in Poplar Bluff, as well as 38 full service branch offices and three limited service branch offices located in Poplar Bluff (4), Van Buren, Dexter, Kennett, Doniphan, Sikeston, Qulin, Matthews, Springfield (3), Thayer (2), West Plains, Alton, Clever, Forsyth, Fremont Hills, Kimberling City, Ozark, Nixa (2), Rogersville, Cape Girardeau (2), and Jackson, Missouri; Jonesboro (2), Paragould, Brookland, Batesville, Searcy, Bald Knob (2) and Bradford, Arkansas; and Anna, Cairo, and Tamms, Illinois.
For purposes of management and oversight of its operations, the Bank has organized its facilities into three regional markets. The Bank's east region includes 17 of its facilities, which are situated in or directly adjacent to Butler, Cape Girardeau, Carter, New Madrid, Ripley, Scott, and Stoddard counties in Missouri, and Alexander and Union counties in Illinois. These counties have a total population of approximately 252,000, and included within this market area is the Cape Girardeau, Missouri, Metropolitan Statistical Area (MSA), which has a population of approximately 98,000. The Bank's south region includes 14 of its facilities, which are situated in Dunklin, Howell, and Oregon counties in Missouri, and Craighead, Greene, Independence, and White counties in Arkansas. These counties have a total population of approximately 348,000, and included within this market area is the Jonesboro, Arkansas, MSA, which has a population of approximately 128,000. The Bank's west region includes 11 of its facilities, which are situated in Christian, Greene, Stone, Taney, and Webster counties in Missouri. These counties have a total population of approximately 497,000, and included within this market area is the Springfield, Missouri, MSA, which has a population of approximately 456,000. Each of these markets also serves a few communities just outside these county borders which do not have a notable impact on the demographics of the market area.
The Bank's east and south regions are generally rural in nature with economies supported by manufacturing activity, agriculture (livestock, dairy, poultry, rice, timber, soybeans, wheat, melons, corn, and cotton), healthcare, and education. Large employers include hospitals, manufacturers, school districts, and colleges. In the west region, the Bank's operations are generally more concentrated in the Springfield, Missouri, MSA, and major employers include healthcare providers, educational institutions, federal, local, and state government, retailers, transportation and distribution firms, and leisure, entertainment, and hospitality interests. For purposes of the Bank's lending policy, the Bank's primary lending area is considered to be the counties where the Bank has a branch facility, and any contiguous county.
5
Competition
The Bank faces strong competition in attracting deposits (its primary source of lendable funds) and originating loans. At June 30, 2017, the Bank was one of 27 bank or saving association groups located in its east region competing for approximately $5.2 billion in deposits at FDIC-insured institutions, one of 35 bank or saving association groups located in its south region (eight of these institutions overlap with the Bank's east region) competing for $7.0 billion in deposits, and one of 40 bank or savings association groups located in its west region (13 of these overlap with the Bank's east or south regions) competing for $9.6 billion in deposits.
Competitors for deposits include commercial banks, credit unions, money market funds, and other investment alternatives, such as mutual funds, full service and discount broker-dealers, equity markets, brokerage accounts and government securities. The Bank's competition for loans comes principally from other financial institutions, mortgage banking companies, mortgage brokers and life insurance companies. The Bank expects competition to continue to increase in the future as a result of legislative, regulatory and technological changes within the financial services industry. Technological advances, for example, have lowered barriers to market entry, allowed banks to expand their geographic reach by providing services over the Internet and made it possible for non-depository institutions to offer products and services that traditionally have been provided by banks. The Gramm-Leach-Bliley Act, which permits affiliation among banks, securities firms and insurance companies, also has changed the competitive environment in which the Bank conducts business.
Internet Website and Information
The Company maintains a website at www.bankwithsouthern.com . The information contained on that website is not included as part of, or incorporated by reference into, this Annual Report on Form 10-K. The Company currently makes available on or through its website at http://investors.bankwithsouthern.com its Annual Report on Form 10-K, Quarterly Reports on Form 10-Q and Current Reports on Form 8-K or amendments to these reports. These materials are also available free of charge on the Securities and Exchange Commission's website at www.sec.gov .
Lending Activities
General. The Bank's lending activities consist of origination of loans secured by mortgages on one- to four-family and multifamily residential real estate, commercial and agricultural real estate, construction loans on residential and commercial properties, commercial and agricultural business loans and consumer loans. The Bank has also occasionally purchased loan participation interests originated by other lenders which are secured by properties generally located in the States of Missouri or Arkansas.
Supervision of the loan portfolio is the responsibility of our Chief Credit Officer, Mark E. Hecker, and our three Regional Presidents: William D. Hribovsek, Justin G. Cox, and Christopher R. ("Robb") Roberts. The Chief Credit Officer is responsible for oversight of underwriting, loan policy, and administration. The Regional Presidents are responsible for oversight of loan production. Loan officers have varying amounts of lending authority depending upon experience and types of loans. Loans beyond their authority are presented to the next level of authority, which may include one of three Regional Small Business Loan Committees, one of three Senior Regional Loan Committees, or our Agricultural Loan Committee.
The Regional Small Business Loan Committees each consists of lenders selected by the respective Regional President, and is authorized to approve lending relationships up to $1.5 million. The Regional Senior Loan Committees each consist of that region's Regional President, and several other senior lending officers. In addition, non-employee directors serve on the Bank's south and west Senior Regional Loan Committees. Each Senior Regional Loan Committee is authorized to approve lending relationships up to $3.0 million. The Bank's Agricultural Loan Committee consists of several senior lending officers and is authorized to approve agricultural lending relationships up to $3.0 million.
Lending relationships above $3.0 require approval of our Bank Senior Loan Committee, comprised of our Chief Lending Officer, Chief Credit Officer, all three Regional Presidents, and an additional senior lender from each region, or the approval of our Executive Loan Committee, comprised of our Chief Executive Officer, Chief Lending Officer, and three Regional Presidents. In addition to the approval of the Bank Senior Loan Committee or the
6
Executive Loan Committee, lending relationships in excess of $4.0 million require the approval of the Discount Committee, which is comprised of all Bank directors. All loans are subject to ratification by the full Board of Directors.
The aggregate amount of loans that the Bank is permitted to make under applicable federal regulations to any one borrower, including related entities, or the aggregate amount that the Bank could have invested in any one real estate project, is based on the Bank's capital levels. See "Regulation - Loans to One Borrower." At June 30, 2017, the maximum amount which the Bank could lend to any one borrower and the borrower's related entities was approximately $47.1 million. At June 30, 2017, the Bank's ten largest credit relationships, as defined by loan to one borrower limitations, ranged from $26.8 million to $14.6 million, net of participation interests sold. As of June 30, 2017, the majority of these credits were commercial real estate, multi-family real estate, or commercial business loans, and all of these relationships were performing in accordance with their terms.
7
Loan Portfolio Analysis. The following table sets forth the composition of the Bank's loan portfolio by type of loan and type of security as of the dates indicated.
At June 30, | ||||||||||||||||||||||||||||||||||||||||
2017 | 2016 | 2015 | 2014 | 2013 | ||||||||||||||||||||||||||||||||||||
Amount | Percent | Amount | Percent | Amount | Percent | Amount | Percent | Amount | Percent | |||||||||||||||||||||||||||||||
(Dollars in thousands) | ||||||||||||||||||||||||||||||||||||||||
Type of Loan : | ||||||||||||||||||||||||||||||||||||||||
Mortgage Loans: | ||||||||||||||||||||||||||||||||||||||||
Residential real estate | $ | 442,463 | 31.66 | % | $ | 392,974 | 34.61 | % | $ | 377,465 | 35.84 | % | $ | 303,901 | 37.94 | % | $ | 233,888 | 36.14 | % | ||||||||||||||||||||
Commercial real estate (1) | 603,922 | 43.21 | 452,052 | 39.81 | 404,720 | 38.43 | 308,520 | 38.51 | 242,304 | 37.44 | ||||||||||||||||||||||||||||||
Construction | 106,782 | 7.63 | 77,369 | 6.82 | 69,204 | 6.57 | 40,738 | 5.09 | 30,725 | 4.75 | ||||||||||||||||||||||||||||||
Total mortgage loans | 1,153,167 | 82.50 | 922,395 | 81.24 | 851,389 | 80.84 | 653,159 | 81.54 | 506,917 | 78.33 | ||||||||||||||||||||||||||||||
Other Loans: | ||||||||||||||||||||||||||||||||||||||||
Automobile loans | 6,378 | 0.46 | 6,221 | 0.55 | 6,333 | 0.60 | 8,276 | 1.03 | 6,779 | 1.05 | ||||||||||||||||||||||||||||||
Commercial business (2) | 247,184 | 17.68 | 202,045 | 17.79 | 191,886 | 18.22 | 141,072 | 17.61 | 130,868 | 20.22 | ||||||||||||||||||||||||||||||
Home equity | 35,222 | 2.52 | 25,146 | 2.21 | 23,472 | 2.23 | 17,929 | 2.24 | 15,775 | 2.44 | ||||||||||||||||||||||||||||||
Other | 22,051 | 1.58 | 15,174 | 1.34 | 16,965 | 1.61 | 9,018 | 1.13 | 5,862 | 0.90 | ||||||||||||||||||||||||||||||
Total other loans | 310,835 | 22.24 | 248,586 | 21.89 | 238,656 | 22.66 | 176,295 | 22.01 | 159,284 | 24.61 | ||||||||||||||||||||||||||||||
Total loans | 1,464,002 | 104.74 | 1,170,981 | 103.13 | 1,090,045 | 103.50 | 829,454 | 103.55 | 666,201 | 102.94 | ||||||||||||||||||||||||||||||
Less: | ||||||||||||||||||||||||||||||||||||||||
Undisbursed loans in process | 50,740 | 3.63 | 21,779 | 1.92 | 24,688 | 2.34 | 19,261 | 2.41 | 10,792 | 1.67 | ||||||||||||||||||||||||||||||
Deferred fees and discounts | (6 | ) | (0.00 | ) | (42 | ) | (0.00 | ) | (87 | ) | (0.01 | ) | (122 | ) | (0.02 | ) | (143 | ) | (0.02 | ) | ||||||||||||||||||||
Allowance for loan losses | 15,538 | 1.11 | 13,791 | 1.21 | 12,298 | 1.17 | 9,259 | 1.16 | 8,386 | 1.29 | ||||||||||||||||||||||||||||||
Net loans receivable | $ | 1,397,730 | 100.00 | % | $ | 1,135,453 | 100.00 | % | $ | 1,053,146 | 100.00 | % | $ | 801,056 | 100.00 | % | $ | 647,166 | 100.00 | % | ||||||||||||||||||||
Type of Security : | ||||||||||||||||||||||||||||||||||||||||
Residential real estate | ||||||||||||||||||||||||||||||||||||||||
One- to four-family | $ | 352,723 | 25.24 | % | $ | 326,186 | 28.73 | % | $ | 316,804 | 30.08 | % | $ | 235,947 | 29.45 | % | $ | 205,281 | 31.72 | % | ||||||||||||||||||||
Multi-family | 151,585 | 10.85 | 128,980 | 11.36 | 118,178 | 11.22 | 87,161 | 10.88 | 47,388 | 7.32 | ||||||||||||||||||||||||||||||
Commercial real estate | 463,890 | 33.19 | 329,781 | 29.04 | 296,082 | 28.11 | 243,090 | 30.35 | 190,563 | 29.45 | ||||||||||||||||||||||||||||||
Land | 184,967 | 13.23 | 137,448 | 12.11 | 120,327 | 11.43 | 86,960 | 10.86 | 63,689 | 9.84 | ||||||||||||||||||||||||||||||
Commercial | 247,184 | 17.68 | 202,045 | 17.79 | 191,884 | 18.22 | 141,072 | 17.61 | 130,867 | 20.22 | ||||||||||||||||||||||||||||||
Consumer and other | 63,653 | 4.55 | 46,541 | 4.10 | 46,770 | 4.44 | 35,224 | 4.40 | 28,413 | 4.39 | ||||||||||||||||||||||||||||||
Total loans | 1,464,002 | 104.74 | 1,170,981 | 103.13 | 1,090,045 | 103.50 | 829,454 | 103.55 | 666,201 | 102.94 | ||||||||||||||||||||||||||||||
Less: | ||||||||||||||||||||||||||||||||||||||||
Undisbursed loans in process | 50,740 | 3.63 | 21,779 | 1.92 | 24,688 | 2.34 | 19,261 | 2.41 | 10,792 | 1.67 | ||||||||||||||||||||||||||||||
Deferred fees and discounts | (6 | ) | (0.00 | ) | (42 | ) | (0.00 | ) | (87 | ) | (0.01 | ) | (122 | ) | (0.02 | ) | (143 | ) | (0.02 | ) | ||||||||||||||||||||
Allowance for loan losses | 15,538 | 1.11 | 13,791 | 1.21 | 12,298 | 1.17 | 9,259 | 1.16 | 8,386 | 1.29 | ||||||||||||||||||||||||||||||
Net loans receivable | $ | 1,397,730 | 100.00 | % | $ | 1,135,453 | 100.00 | % | $ | 1,053,146 | 100.00 | % | $ | 801,056 | 100.00 | % | $ | 647,166 | 100.00 | % | ||||||||||||||||||||
___________________________
(1) | Commercial real estate loan balances included farmland and other agricultural-related real estate loans of $140.0 million , $102.2 million, $82.0 million, $63.8 million and $53.0 million as of June 30, 2017, 2016, 2015, 2014 and 2013, respectively. |
(2) | Commercial business loan balances included agricultural equipment and production loans of $85.7 million , $73.3 million, $57.9 million, $53.4 million and $47.4 million as of June 30, 2017, 2016, 2015, 2014 and 2013, respectively. |
8
The following table shows the fixed and adjustable rate composition of the Bank's loan portfolio at the dates indicated.
At June 30, | ||||||||||||||||||||||||||||||||||||||||
2017 | 2016 | 2015 | 2014 | 2013 | ||||||||||||||||||||||||||||||||||||
Amount | Percent | Amount | Percent | Amount | Percent | Amount | Percent | Amount | Percent | |||||||||||||||||||||||||||||||
(Dollars in thousands) | ||||||||||||||||||||||||||||||||||||||||
Type of Loan : | ||||||||||||||||||||||||||||||||||||||||
Fixed-Rate Loans: | ||||||||||||||||||||||||||||||||||||||||
Residential real estate | $ | 189,054 | 13.53 | % | $ | 172,901 | 15.23 | % | $ | 171,479 | 16.28 | % | $ | 136,357 | 17.01 | % | $ | 111,520 | 17.23 | % | ||||||||||||||||||||
Commercial real estate | 476,132 | 34.06 | 356,613 | 31.41 | 313,361 | 29.75 | 211,833 | 26.44 | 156,349 | 24.16 | ||||||||||||||||||||||||||||||
Construction | 89,542 | 6.40 | 58,330 | 5.14 | 51,973 | 4.94 | 38,928 | 4.86 | 26,788 | 4.14 | ||||||||||||||||||||||||||||||
Consumer | 26,305 | 1.88 | 21,338 | 1.88 | 22,973 | 2.18 | 17,233 | 2.15 | 12,641 | 1.95 | ||||||||||||||||||||||||||||||
Commercial business | 137,613 | 9.85 | 137,426 | 12.10 | 127,017 | 12.06 | 86,961 | 10.86 | 72,739 | 11.24 | ||||||||||||||||||||||||||||||
Total fixed-rate loans | 918,646 | 65.72 | 746,608 | 65.76 | 686,803 | 65.21 | 491,312 | 61.32 | 380,037 | 58.72 | ||||||||||||||||||||||||||||||
Adjustable-Rate Loans: | ||||||||||||||||||||||||||||||||||||||||
Residential real estate | 253,409 | 18.13 | 220,073 | 19.38 | 205,986 | 19.56 | 167,544 | 20.91 | 122,368 | 18.91 | ||||||||||||||||||||||||||||||
Commercial real estate | 127,790 | 9.14 | 95,439 | 8.41 | 91,359 | 8.67 | 96,686 | 12.07 | 85,955 | 13.28 | ||||||||||||||||||||||||||||||
Construction | 17,240 | 1.23 | 19,039 | 1.68 | 17,231 | 1.64 | 1,810 | 0.23 | 3,937 | 0.61 | ||||||||||||||||||||||||||||||
Consumer | 37,346 | 2.67 | 25,203 | 2.22 | 23,797 | 2.26 | 17,990 | 2.25 | 15,775 | 2.44 | ||||||||||||||||||||||||||||||
Commercial business | 109,571 | 7.85 | 64,619 | 5.68 | 64,869 | 6.16 | 54,112 | 6.76 | 58,129 | 8.98 | ||||||||||||||||||||||||||||||
Total adjustable-rate loans | 545,356 | 39.02 | 424,373 | 37.37 | 403,242 | 38.29 | 338,142 | 44.22 | 286,164 | 44.22 | ||||||||||||||||||||||||||||||
Total loans | 1,464,002 | 104.74 | 1,170,981 | 103.13 | 1,090,045 | 103.50 | 829,454 | 103.54 | 666,201 | 102.94 | ||||||||||||||||||||||||||||||
Less: | ||||||||||||||||||||||||||||||||||||||||
Undisbursed loans in process | 50,740 | 3.63 | 21,779 | 1.92 | 24,688 | 2.34 | 19,261 | 2.40 | 10,792 | 1.67 | ||||||||||||||||||||||||||||||
Net deferred loan fees | (6 | ) | (0.00 | ) | (42 | ) | (0.00 | ) | (87 | ) | (0.01 | ) | (122 | ) | (0.02 | ) | (143 | ) | (0.02 | ) | ||||||||||||||||||||
Allowance for loan loss | 15,538 | 1.11 | 13,791 | 1.21 | 12,298 | 1.17 | 9,259 | 1.16 | 8,386 | 1.29 | ||||||||||||||||||||||||||||||
Net loans receivable | $ | 1,397,730 | 100.00 | % | $ | 1,135,453 | 100.00 | % | $ | 1,053,146 | 100.00 | % | $ | 801,056 | 100.00 | % | $ | 647,166 | 100.00 | % | ||||||||||||||||||||
9
Residential Mortgage Lending. The Bank actively originates loans for the acquisition or refinance of one- to four-family residences. These loans are originated as a result of customer and real estate agent referrals, existing and walk-in customers and from responses to the Bank's marketing campaigns. At June 30, 2017, residential loans secured by one- to four-family residences totaled $311.0 million, or 24.1% of net loans receivable.
The Bank currently offers both fixed-rate and adjustable-rate mortgage ("ARM") loans. During the year ended June 30, 2017, the Bank originated $34.5 million of ARM loans and $27.1 million of fixed-rate loans that were secured by one- to four-family residences, for retention in the Bank's portfolio. An additional $33.1 million in fixed-rate one- to four-family residential loans were originated for sale on the secondary market. Substantially all of the one- to four-family residential mortgage originations in the Bank's portfolio are located within the Bank's market area.
The Bank generally originates one- to four-family residential mortgage loans in amounts up to 90% of the lower of the purchase price or appraised value of residential property. For loans originated in excess of 80% loan-to-value, the Bank charges an additional 50-75 basis points, but does not require private mortgage insurance. At June 30, 2017, the remaining balance of loans originated with a loan-to-value ratio in excess of 80% was $74.5 million. For fiscal years ended June 30, 2017, 2016, 2015, 2014 and 2013, originations of one- to four-family loans in excess of 80% loan-to-value have totaled $25.0 million, $16.5 million, $24.3 million, $13.6 million and $13.8 million, respectively, totaling $93.2 million. The remaining balance of those loans at June 30, 2017, was $59.4 million. Originating loans with higher loan-to-value ratios presents additional credit risk to the Bank. Consequently, the Bank limits this product to borrowers with a favorable credit history and a demonstrable ability to service the debt. The majority of new residential mortgage loans originated by the Bank conform to secondary market underwriting standards, however, documentation of loan files may not be adequate to allow for immediate sale. The interest rates charged on these loans are competitively priced based on local market conditions, the availability of funding, and anticipated profit margins. Fixed and ARM loans originated by the Bank are amortized over periods as long as 30 years, but typically are repaid over shorter periods.
Fixed-rate loans secured by one- to four-family residences have contractual maturities up to 30 years, and are generally fully amortizing with payments due monthly. These loans normally remain outstanding for a substantially shorter period of time because of refinancing and other prepayments. A significant change in the interest rate environment can alter the average life of a residential loan portfolio. The one- to four-family fixed-rate loans do not contain prepayment penalties. At June 30, 2017, one- to four-family loans with a fixed rate totaled $147.5 million, and had a weighted-average maturity of 106 months.
The Bank currently originates one- to four-family adjustable rate mortgage ("ARM") loans, which adjust annually, after an initial period of one, three, five, or seven years. Typically, originated ARM loans secured by owner occupied properties reprice at a margin of 2.75% to 3.00% over the weekly average yield on United States Treasury securities adjusted to a constant maturity of one year ("CMT"). Generally, ARM loans secured by non-owner occupied residential properties reprice at a margin of 3.75% over the CMT index. Current residential ARM loan originations are subject to annual and lifetime interest rate caps and floors. As a consequence of using interest rate caps, initial rates which may be at a premium or discount, and a "CMT" loan index, the interest earned on the Bank's ARMs will react differently to changing interest rates than the Bank's cost of funds. At June 30, 2017, one- to four-family loans tied to the CMT index totaled $131.5 million. One- to four-family loans tied to other indices totaled $36.1 million.
In underwriting one- to four-family residential real estate loans, the Bank evaluates the borrower's ability to meet debt service requirements at current as well as fully indexed rates for ARM loans, as well as the value of the property securing the loan. Most properties securing real estate loans made by the Bank during fiscal 2017 had appraisals performed on them by independent fee appraisers approved and qualified by the Board of Directors. The Bank generally requires borrowers to obtain title insurance and fire, property and flood insurance (if indicated) in an amount not less than the amount of the loan. Real estate loans originated by the Bank generally contain a "due on sale" clause allowing the Bank to declare the unpaid principal balance due and payable upon the sale of the security property.
The Bank also originates loans secured by multi-family residential properties that are often located outside the Company's primary market area, but made to borrowers who operate within the primary market area. At June 30, 2017, the Bank had $151.6 million, or 10.9% of net loans receivable, in multi-family residential real estate. The majority of the multi-family residential loans that are originated by the Bank are amortized over periods generally up to 27 years, with balloon maturities up to ten years. Both fixed and adjustable interest rates are offered and it is
10
typical for the Bank to include an interest rate "floor" and "ceiling" in these loan agreements. Variable rate loans typically adjust daily, monthly, quarterly or annually based on the Wall Street prime interest rate. Generally, multi-family residential loans do not exceed 85% of the lower of the appraised value or purchase price of the secured property. The Bank generally requires a Board-approved independent certified fee appraiser to be engaged in determining the collateral value. As a general rule, the Bank requires the unlimited guaranty of all individuals (or entities) owning (directly or indirectly) 20% or more of the stock of the borrowing entity.
The primary risk associated with multifamily loans is the ability of the income-producing property that collateralizes the loan to produce adequate cash flow to service the debt. High unemployment or generally weak economic conditions may result in borrowers having to provide rental rate concessions to achieve adequate occupancy rates. In an effort to reduce these risks, the Bank will evaluate the guarantor's ability to inject personal funds as a tertiary source of repayment.
Commercial Real Estate Lending. The Bank actively originates loans secured by commercial real estate including land (improved and unimproved), shopping centers, retail establishments, nursing homes and other healthcare related facilities, and other businesses generally located in the Bank's market area. At June 30, 2017, the Bank had $603.9 million in commercial real estate loans, which represented 43.2% of net loans receivable. Of this amount, $140.0 million were loans secured by agricultural properties. The increase over the last several fiscal years in agricultural lending is the result of an intentional focus by the Bank on that segment of our market, including the hiring of personnel with knowledge of agricultural lending and experience in that type of business development. The Bank expects to continue to grow its agricultural lending portfolio, but expects that the rate of growth experienced over the last several fiscal years is unlikely to be maintained. The Bank expects to continue to maintain or increase the percentage of commercial real estate loans, inclusive of agricultural properties, in its total portfolio.
Commercial real estate loans originated by the Bank are generally based on amortization schedules of up to 25 years with monthly principal and interest payments. Generally, these loans have fixed interest rates and maturities ranging up to seven years, with a balloon payment due at maturity. Alternatively, for some loans, the interest rate adjusts at least annually after an initial period up to five years, based upon the Wall Street prime rate. The Bank typically includes an interest rate "floor" in the loan agreement. The Bank's fixed-rate commercial real estate portfolio has a weighted average maturity of 38 months. Variable rate commercial real estate originations typically adjust daily, monthly, quarterly or annually based on the Wall Street prime rate. Generally, loans for improved commercial properties do not exceed 80% of the lower of the appraised value or the purchase price of the secured property. Agricultural real estate terms offered differ slightly, with amortization schedules of up to 25 years with an 80% loan-to-value ratio, or 30 years with a 75% loan-to-value ratio. Agricultural real estate loans generally require annual, instead of monthly, payments. Before credit is extended, the Bank analyzes the financial condition of the borrower, the borrower's credit history, and the reliability and predictability of the cash flow generated by the property and the value of the property itself. Generally, personal guarantees are obtained from the borrower in addition to obtaining the secured property as collateral for such loans. The Bank also generally requires appraisals on properties securing commercial real estate to be performed by a Board-approved independent certified fee appraiser.
Generally, loans secured by commercial real estate involve a greater degree of credit risk than one- to four-family residential mortgage loans. These loans typically involve large balances to single borrowers or groups of related borrowers. Because payments on loans secured by commercial real estate are often dependent on the successful operation or management of the secured property, repayment of such loans may be subject to adverse conditions in the real estate market or the economy. See "Asset Quality."
Construction Lending. The Bank originates real estate loans secured by property or land that is under construction or development. At June 30, 2017, the Bank had $106.8 million, or 7.6% of net loans receivable in construction loans outstanding.
Construction loans originated by the Bank are generally secured by mortgage loans for the construction of owner occupied residential real estate or to finance speculative construction secured by residential real estate, land development, or owner-operated or non-owner occupied commercial real estate. At June 30, 2017, $41.7 million of the Bank's construction loans were secured by one- to four-family residential real estate (of which $8.3 million was for speculative construction), $20.1 million of which were secured by multi-family residential real estate, and $44.9 million of which were secured by commercial real estate. During construction, these loans typically require monthly
11
interest-only payments and have maturities ranging from 6 to 12 months. Once construction is completed, permanent construction loans may be converted to monthly payments using amortization schedules of up to 30 years on residential and generally up to 25 years on commercial real estate.
Speculative construction and land development lending generally affords the Bank an opportunity to receive higher interest rates and fees with shorter terms to maturity than those obtainable from residential lending. Nevertheless, construction and land development lending is generally considered to involve a higher level of credit risk than one- to four-family residential lending due to (i) the concentration of principal among relatively few borrowers and development projects, (ii) the increased difficulty at the time the loan is made of accurately estimating building or development costs and the selling price of the finished product, (iii) the increased difficulty and costs of monitoring and disbursing funds for the loan, (iv) the higher degree of sensitivity to increases in market rates of interest and changes in local economic conditions, and (v) the increased difficulty of working out problem loans. Due in part to these risk factors, the Bank may be required from time to time to modify or extend the terms of some of these types of loans. In an effort to reduce these risks, the application process includes a submission to the Bank of accurate plans, specifications and costs of the project to be constructed. These items are also used as a basis to determine the appraised value of the subject property. Loan amounts are generally limited to 80% of the lesser of current appraised value and/or the cost of construction.
Consumer Lending. The Bank offers a variety of secured consumer loans, including home equity, direct and indirect automobile loans, second mortgages, mobile homes and loans secured by deposits. The Bank originates substantially all of its consumer loans in its primary market area. Usually, consumer loans are originated with fixed rates for terms of up to five years, with the exception of home equity lines of credit, which are variable, tied to the prime rate of interest, and are for a period of ten years. At June 30, 2017, the Bank's consumer loan portfolio totaled $63.7 million, or 4.6% of net loans receivable.
Home equity loans represented 55.3% of the Bank's consumer loan portfolio at June 30, 2017, and totaled $35.2 million, or 2.5% of net loans receivable.
Home equity lines of credit (HELOCs) are secured with a deed of trust and are generally issued for up to 90% of the appraised or assessed value of the property securing the line of credit, less the outstanding balance on the first mortgage. Interest rates on the HELOCs are adjustable and are tied to the current prime interest rate, generally with an interest rate floor in the loan agreement. This rate is obtained from the Wall Street Journal and adjusts on a daily basis. Interest rates are based upon the loan-to-value ratio of the property with better rates given to borrowers with more equity. HELOCs, which are secured by residential properties, are generally secured by stronger collateral than other consumer loans and because of the adjustable rate structure, present less interest rate risk to the Bank.
Automobile loans represented 10.0% of the Bank's consumer loan portfolio at June 30, 2017, and totaled $6.4 million, or 0.46% of net loans receivable. Of that total, an immaterial amount was originated by auto dealers. Typically, automobile loans are made for terms of up to 60 months for new and used vehicles. Loans secured by automobiles have fixed rates and are generally made in amounts up to 100% of the purchase price of the vehicle.
Consumer loan terms vary according to the type and value of collateral, length of contract and creditworthiness of the borrower. The underwriting standards employed for consumer loans include employment stability, an application, a determination of the applicant's payment history on other debts, and an assessment of ability to meet existing and proposed obligations. Although creditworthiness of the applicant is a primary consideration, the underwriting process also includes a comparison of the value of the security, if any, in relation to the proposed loan amount.
Consumer loans may entail greater credit risk than do residential mortgage loans, because they are generally unsecured or are secured by rapidly depreciable or mobile assets, such as automobiles. In the event of repossession or default, there may be no secondary source of repayment or the underlying value of the collateral could be insufficient to repay the loan. In addition, consumer loan collections are dependent on the borrower's continuing financial stability, and thus are more likely to be affected by adverse personal circumstances.
12
Furthermore, the application of various federal and state laws, including bankruptcy and insolvency laws, may limit the amount which can be recovered on such loans. The Bank's delinquency levels for these types of loans are reflective of these risks. See "Asset Classification."
Commercial Business Lending. The Bank's commercial business lending activities encompass loans with a variety of purposes and security, including loans to finance accounts receivable, inventory, equipment and operating lines of credit. At June 30, 2017, the Bank had $247.2 million in commercial business loans outstanding, or 17.7% of net loans receivable. Of this amount, $85.7 million were loans related to agriculture, including amortizing equipment loans and annual production lines. The Bank expects to continue to maintain the current percentage of commercial business loans in its total loan portfolio.
The Bank currently offers both fixed and adjustable rate commercial business loans. At year end, the Bank had $137.6 million in fixed rate and $109.6 million of adjustable rate commercial business loans. The adjustable rate business loans typically reprice daily, monthly, quarterly, or annually, in accordance with the Wall Street prime rate of interest. The Bank typically includes an interest rate "floor" in the loan agreement.
Commercial business loan terms vary according to the type and value of collateral, length of contract and creditworthiness of the borrower. Generally, commercial loans secured by fixed assets are amortized over periods up to five years, while commercial operating lines of credit or agricultural production lines are generally for a one year period. The Bank's commercial business loans are evaluated based on the loan application, a determination of the applicant's payment history on other debts, business stability and an assessment of ability to meet existing obligations and payments on the proposed loan. Although creditworthiness of the applicant is a primary consideration, the underwriting process also includes a comparison of the value of the security, if any, in relation to the proposed loan amount.
Unlike residential mortgage loans, which generally are made on the basis of the borrower's ability to make repayment from his or her employment and other income, and which are secured by real property whose value tends to be more easily ascertainable, commercial business loans are of higher risk and typically are made on the basis of the borrower's ability to make repayment from the cash flow of the borrower's business. As a result, the availability of funds for the repayment of commercial business loans may be substantially dependent on the success of the business itself. Further, the collateral securing the loans may depreciate over time, may be difficult to appraise and may fluctuate in value based on the success of the business.
Contractual Obligations and Commitments, Including Off-Balance Sheet Arrangements . The following table discloses our fixed and determinable contractual obligations and commercial commitments by payment date as of June 30, 2017. Commitments to extend credit totaled $251.9 million at June 30, 2017.
Less Than 1 Year | 1-3 Years | 4-5 Years | More Than 5 Years | Total | ||||||||||||||||
(Dollars in thousands) | ||||||||||||||||||||
Federal Home Loan Bank advances | $ | 38,125 | $ | 5,513 | $ | --- | $ | --- | $ | 43,637 | ||||||||||
Certificates of deposit | 326,638 | 162,810 | 47,612 | --- | 537,060 | |||||||||||||||
Total | $ | 364,762 | $ | 168,323 | $ | 47,612 | $ | --- | $ | 580,697 | ||||||||||
Less Than 1 Year | 1-3 Years | 4-5 Years | More Than 5 Years | Total | ||||||||||||||||
(Dollars in thousands) | ||||||||||||||||||||
Construction loans in process | $ | 50,740 | $ | --- | $ | --- | $ | --- | $ | 50,740 | ||||||||||
Other commitments | 159,937 | 14,818 | 6,677 | 19,729 | 201,161 | |||||||||||||||
$ | 210,677 | $ | 14,818 | $ | 6,677 | $ | 19,729 | $ | 251,901 | |||||||||||
Loan Maturity and Repricing
The following table sets forth certain information at June 30, 2017, regarding the dollar amount of loans maturing or repricing in the Bank's portfolio based on their contractual terms to maturity or repricing, but does not include scheduled payments or potential prepayments. Demand loans, loans having no stated schedule of
13
repayments and no stated maturity, and overdrafts are reported as due in one year or less. Mortgage loans that have adjustable rates are shown as maturing at their next repricing date. Listed loan balances are shown before deductions for undisbursed loan proceeds, unearned discounts, unearned income and allowance for loan losses.
Within One Year | After One Year Through 5 Years | After 5 Years Through 10 Years | After | Total | ||||||||||||||||
(Dollars in thousands) | ||||||||||||||||||||
Residential real estate | $ | 184,542 | $ | 203,794 | $ | 26,345 | $ | 27,782 | $ | 442,463 | ||||||||||
Commercial real estate | 188,324 | 329,236 | 83,509 | 2,853 | 603,922 | |||||||||||||||
Construction | 97,756 | 7,904 | 1,122 | --- | 106,782 | |||||||||||||||
Consumer | 44,036 | 18,936 | 629 | 50 | 63,651 | |||||||||||||||
Commercial business | 146,575 | 83,969 | 10,318 | 6,322 | 247,184 | |||||||||||||||
Total loans | $ | 661,233 | $ | 643,839 | $ | 121,923 | $ | 37,007 | $ | 1,464,002 | ||||||||||
As of June 30, 2017, loans with a maturity date after June 30, 2018, with fixed interest rates totaled $658.1 million, and loans with a maturity date after June 30, 2018, with adjustable rates totaled $144.7 million.
Loan Originations, Sales and Purchases
Generally, all loans are originated by the Bank's staff, who are salaried loan officers. All loan officers are eligible for bonuses based on production, market performance, and credit quality. Certain lenders, in particular, those originating higher volume of residential loans for sale on the secondary market, may earn a relatively higher percentage of their total compensation through bonuses. Loan applications are generally taken and processed at each of the Bank's full-service locations, and the Bank in recent years began processing online applications for single-family residential loans. The Bank also offers secondary market loans to its customers.
While the Bank originates both adjustable-rate and fixed-rate loans, the ability to originate loans is dependent upon the relative customer demand for loans in its market. In fiscal 2017, the Bank originated $494.9 million of loans, compared to $425.9 million and $391.2 million, respectively, in fiscal 2016 and 2015. Of these loans, mortgage loan originations were $399.2 million, $334.2 million and $276.0 million in fiscal 2017, 2016 and 2015, respectively. Increases in originations over recent periods is attributed primarily to an expanded market area and customer base following recent acquisitions.
From time to time, the Bank has purchased loan participations consistent with its loan underwriting standards. In fiscal 2017, the Bank purchased $6.5 million of new loan participations. At June 30, 2017, loan participations totaled $12.5 million, or 0.89% of net loans receivable. At June 30, 2017, all of these participations were performing in accordance with their respective terms. The Bank evaluates additional loan participations on an ongoing basis, based in part on local loan demand, liquidity, portfolio and capital levels.
14
The following table shows total loans originated, purchased, sold and repaid during the periods indicated.
Year Ended June 30, | ||||||||||||
2017 | 2016 | 2015 | ||||||||||
(Dollars in thousands) | ||||||||||||
Total loans at beginning of period | $ | 1,170,981 | $ | 1,090,045 | $ | 829,454 | ||||||
Loans originated: | ||||||||||||
One- to four-family residential | 94,733 | 78,356 | 66,876 | |||||||||
Multi-family residential and | ||||||||||||
commercial real estate | 235,427 | 179,253 | 142,147 | |||||||||
Construction loans | 69,087 | 76,579 | 66,975 | |||||||||
Commercial business | 78,342 | 76,257 | 95,438 | |||||||||
Consumer and others | 17,326 | 15,416 | 19,723 | |||||||||
Total loans originated | 494,915 | 425,861 | 391,159 | |||||||||
Loans purchased: | ||||||||||||
Total loans purchased (1) | 158,808 | 5,760 | 198,083 | |||||||||
Loans sold: | ||||||||||||
Total loans sold | (56,131 | ) | (22,898 | ) | (16,556 | ) | ||||||
Principal repayments | (295,615 | ) | (319,510 | ) | (303,625 | ) | ||||||
Participation principal repayments | (7,758 | ) | (7,621 | ) | (6,123 | ) | ||||||
Foreclosures | (1,198 | ) | (656 | ) | (2,347 | ) | ||||||
Net loan activity | 293,021 | 80,936 | 260,591 | |||||||||
Total loans at end of period | $ | 1,464,002 | $ | 1,170,981 | $ | 1,090,045 | ||||||
______________ | ||||||||||||
(1) | Amount reported in fiscal 2017 includes the Company's acquisition of loans from the Capaha acquisition recorded at a $152.2 million fair value. Amount reported in fiscal 2015 includes the Company's acquisition of loans from the Peoples acquisition recorded at a $190.4 million fair value. |
Loan Commitments
The Bank issues commitments for one- to four-family residential mortgage loans, operating or working capital lines of credit, and standby letters-of-credit. Such commitments may be oral or in writing with specified terms, conditions and at a specified rate of interest. The Bank had outstanding net loan commitments of approximately $251.9 million at June 30, 2017. See Note 14 of Notes to the Consolidated Financial Statements contained in Item 8.
Loan Fees
In addition to interest earned on loans, the Bank receives income from fees in connection with loan originations, loan modifications, late payments and for miscellaneous services related to its loans. Income from these activities varies from period to period depending upon the volume and type of loans made and competitive conditions.
Asset Quality
Delinquent Loans. Generally, when a borrower fails to make a required payment on mortgage or installment loans, the Bank begins the collection process by mailing a computer generated notice to the customer. If the delinquency is not cured promptly, the customer is contacted again by notice or telephone. After an account secured by real estate becomes over 60 days past due, the Bank will typically send a 30-day demand notice to the customer which, if not cured or unless satisfactory arrangements have been made, will lead to foreclosure.
15
Foreclosure may not begin until the loan reaches 120 days delinquency in the case of consumer residential loans. For consumer loans, the Missouri Right-To-Cure Statute is followed, which requires issuance of specifically worded notices at specific time intervals prior to repossession or further collection efforts.
The following table sets forth the Bank's loan delinquencies by type and by amount at June 30, 2017.
Loans Delinquent For: | Total Loans | |||||||||||||||||||||||
60-89 Days | 90 Days and Over | Delinquent 60 Days or More | ||||||||||||||||||||||
Numbers | Amounts | Numbers | Amounts | Numbers | Amounts | |||||||||||||||||||
(Dollars in thousands) | ||||||||||||||||||||||||
Residential real estate | 4 | $ | 148 | 9 | $ | 676 | 13 | $ | 824 | |||||||||||||||
Commercial real estate | --- | --- | --- | --- | --- | --- | ||||||||||||||||||
Construction | --- | --- | 3 | 711 | 3 | 711 | ||||||||||||||||||
Consumer | 4 | 16 | 6 | 134 | 10 | 150 | ||||||||||||||||||
Commercial Business | 2 | 53 | 9 | 426 | 11 | 479 | ||||||||||||||||||
Totals | 10 | $ | 217 | 27 | $ | 1,947 | 37 | $ | 2,164 | |||||||||||||||
Non-Performing Assets. The table below sets forth the amounts and categories of non-performing assets in the Bank's loan portfolio. Loans are placed on non-accrual status when the collection of principal and/or interest becomes doubtful, and as a result, previously accrued interest income on the loan is removed from current income. The Bank has no reserves for uncollected interest and does not accrue interest on non-accrual loans. A loan may be transferred back to accrual status once a satisfactory repayment history has been restored. Foreclosed assets held for sale include assets acquired in settlement of loans and are shown net of reserves.
For information regarding accrual of interest on impaired loans, see Note 1 of Notes to the Consolidated Financial Statements contained in Item 8.
The Company generally treats loans acquired with impaired credit quality as an accruing asset, despite reporting such loans as impaired, because these loans are recorded at acquisition at fair value, which includes an accretable discount which is recorded as interest income over the expected life of the obligation.
16
The following table sets forth information with respect to the Bank's non-performing assets as of the dates indicated.
At June 30, | ||||||||||||||||||||
2017 | 2016 | 2015 | 2014 | 2013 | ||||||||||||||||
(Dollars in thousands) | ||||||||||||||||||||
Nonaccruing loans: | ||||||||||||||||||||
Residential real estate | $ | 1,263 | $ | 2,676 | $ | 2,202 | $ | 444 | $ | 414 | ||||||||||
Construction | 35 | 388 | 133 | --- | --- | |||||||||||||||
Commercial real estate | 960 | 1,797 | 1,271 | 673 | 157 | |||||||||||||||
Consumer | 158 | 160 | 88 | 58 | 24 | |||||||||||||||
Commercial business | 409 | 603 | 63 | 91 | 842 | |||||||||||||||
Total | 2,825 | 5,624 | 3,757 | 1,266 | 1,437 | |||||||||||||||
Loans 90 days past due | ||||||||||||||||||||
Residential real estate | 59 | --- | --- | 106 | --- | |||||||||||||||
Construction | --- | --- | --- | --- | --- | |||||||||||||||
Commercial real estate | --- | --- | --- | 18 | --- | |||||||||||||||
Consumer | 13 | 7 | 34 | 6 | --- | |||||||||||||||
Commercial business | 329 | 31 | 11 | --- | --- | |||||||||||||||
Total | 401 | 38 | 45 | 130 | --- | |||||||||||||||
Total nonperforming loans | 3,226 | 5,662 | 3,802 | 1,396 | 1,437 | |||||||||||||||
Nonperforming investments | --- | --- | --- | --- | 125 | |||||||||||||||
Foreclosed assets held for sale: | ||||||||||||||||||||
Real estate owned | 3,014 | 3,305 | 4,440 | 2,912 | 3,030 | |||||||||||||||
Other nonperforming assets | 86 | 61 | 64 | 65 | 46 | |||||||||||||||
Total nonperforming assets | $ | 6,326 | $ | 9,028 | $ | 8,306 | $ | 4,373 | $ | 4,638 | ||||||||||
Total nonperforming loans to net loans | 0.23 | % | 0.50 | % | 0.36 | % | 0.17 | % | 0.22 | % | ||||||||||
Total nonperforming loans to total assets | 0.19 | % | 0.40 | % | 0.29 | % | 0.14 | % | 0.18 | % | ||||||||||
Total nonperforming assets to total assets | 0.37 | % | 0.64 | % | 0.64 | % | 0.43 | % | 0.58 | % | ||||||||||
At June 30, 2017, troubled debt restructurings (TDRs) totaled $11.2 million, of which $338,000 was considered nonperforming and was included in the nonaccrual loan total above. The remaining $10.9 million in TDRs have complied with the modified terms for a reasonable period of time and are therefore considered by the Company to be accrual status loans. At June 30, 2016, TDRs totaled $8.4 million, of which $2.3 million was considered nonperforming and was included in the nonaccrual loan total above. In general, these loans were subject to classification as TDRs at June 30, 2017, on the basis of guidance under ASU 2011-02, which indicates that the Company may not consider the borrower's effective borrowing rate on the old debt immediately before the restructuring in determining whether a concession has been granted.
Real Estate Owned. Real estate properties acquired through foreclosure or by deed in lieu of foreclosure are recorded at the lower of cost or fair value, less estimated disposition costs. If fair value at the date of foreclosure is lower than the balance of the related loan, the difference will be charged-off to the allowance for loan losses at the time of transfer. Management periodically updates real estate valuations and if the value declines, a specific provision for losses on such property is established by a charge to operations. At June 30, 2017, the Company's balance of real estate owned totaled $3.0 million and included $731,000 residential properties and $2.3 million non-residential properties.
Asset Classification. Applicable regulations require that each insured institution review and classify its assets on a regular basis. In addition, in connection with examinations of insured institutions, regulatory examiners have authority to identify problem assets and, if appropriate, require them to be classified. There are three classifications for problem assets: substandard, doubtful and loss. Substandard assets must have one or more defined weaknesses and are characterized by the distinct possibility that the insured institution will sustain some loss if the deficiencies are not corrected. Doubtful assets have the weaknesses of substandard assets with the additional
17
characteristic that the weaknesses make collection or liquidation in full on the basis of currently existing facts, conditions and values questionable, and there is a high possibility of loss. An asset classified loss is considered uncollectible and of such little value that continuance as an asset of the institution is not warranted. When an insured institution classifies problem assets as loss, it charges off the balance of the assets. Assets which do not currently expose the Bank to sufficient risk to warrant classification in one of the aforementioned categories but possess weaknesses, may be designated as special mention. The Bank's determination as to the classification of its assets and the amount of its valuation allowances is subject to review by the FRB and the Missouri Division of Finance, which can order the establishment of additional loss allowances.
On the basis of management's review of the assets of the Company, at June 30, 2017, classified assets totaled $17.5 million, or 1.02% of total assets as compared to $16.0 million, or 1.14% of total assets at June 30, 2016. Of the amount classified as of June 30, 2017, $16.9 million was considered substandard, and $600,000 was considered doubtful. Included in classified assets at June 30, 2017, were various loans totaling $13.3 million (see Note 3 of Notes to the Consolidated Financial Statements contained in Item 8 for more information on classified loans); foreclosed real estate and repossessed assets totaling $3.1 million; and Company investments in pooled trust preferred securities with a book value of $1.1 million. Classified loans are so designated due to concerns regarding the borrower's ability to generate sufficient cash flows to service the debt. The investments in pooled trust preferred securities were classified due to concerns about the ability of the pools to generate sufficient cash flows to service the debt. These securities have previously deferred interest payments. Classified loans totaling $2.5 million had been placed on nonaccrual status at June 30, 2017, of which $1.8 million were more than 30 days delinquent. Of the remaining $10.8 million of classified loans, $251,000 were more than 30 days delinquent.
Other Loans of Concern. In addition to the classified assets above, there was also an aggregate of $13.3 million in loans, with respect to which management has concerns as to the ability of the borrowers to continue to comply with present loan repayment terms, which may ultimately result in the classification of such assets. These loans continued to perform according to terms as of June 30, 2017, but were identified as having elevated risk due to concerns regarding the borrower's ability to continue to generate sufficient cash flows to service the debt.
Allowance for Loan Losses. The Bank's allowance for loan losses is established through a provision for loan losses based on management's evaluation of the risk inherent in the loan portfolio and changes in the nature and volume of loan activity, including those loans which are being specifically monitored. Such evaluation, which includes a review of loans for which full collectability may not be reasonably assured, considers among other matters, the estimated fair value of the underlying collateral, economic conditions, historical loan loss experience and other factors that warrant recognition in provisioning for loan losses. These provisions for loan losses are charged against earnings in the year they are established. The Bank had an allowance for loan losses at June 30, 2017, of $15.5 million, which represented 246% of nonperforming assets as compared to an allowance of $13.8 million, which represented 152% of nonperforming assets at June 30, 2016.
At June 30, 2017, the Bank also had an allowance for credit losses on off-balance sheet credit exposures of $1.1 million, as compared to $745,000 at June 30, 2016. This amount is maintained as a separate liability account to cover estimated potential credit losses associated with off-balance sheet credit instruments such as off-balance sheet loan commitments, standby letters of credit, and guarantees.
Although management believes that it uses the best information available to determine the allowance, unforeseen market conditions could result in adjustments and net earnings could be significantly affected if circumstances differ substantially from assumptions used in making the final determination. Future additions to the allowance will likely be the result of periodic loan, property and collateral reviews and thus cannot be predicted with certainty in advance.
The following table sets forth an analysis of the Bank's allowance for loan losses for the periods indicated. Where specific loan loss reserves have been established, any difference between the loss reserve and the amount of loss realized has been charged or credited to current income.
18
Year Ended June 30, | ||||||||||||||||||||
2017 | 2016 | 2015 | 2014 | 2013 | ||||||||||||||||
(Dollars in thousands) | ||||||||||||||||||||
Allowance at beginning of period | $ | 13,791 | $ | 12,298 | $ | 9,259 | $ | 8,386 | $ | 7,492 | ||||||||||
Recoveries | ||||||||||||||||||||
Residential real estate | 10 | 5 | 11 | 16 | 4 | |||||||||||||||
Construction real estate | 1 | --- | --- | --- | 1 | |||||||||||||||
Commercial real estate | 20 | 46 | 47 | 1 | 5 | |||||||||||||||
Commercial business | 31 | 15 | 33 | 17 | 8 | |||||||||||||||
Consumer | 8 | 8 | 4 | 95 | 16 | |||||||||||||||
Total recoveries | 70 | 74 | 95 | 129 | 34 | |||||||||||||||
Charge offs: | ||||||||||||||||||||
Residential real estate | 211 | 167 | 54 | 169 | 302 | |||||||||||||||
Construction real estate | 31 | --- | --- | --- | 35 | |||||||||||||||
Commercial real estate | 19 | 97 | 9 | 96 | 422 | |||||||||||||||
Commercial business | 337 | 725 | 128 | 59 | 50 | |||||||||||||||
Consumer | 65 | 86 | 50 | 578 | 47 | |||||||||||||||
Total charge offs | 663 | 1,075 | 241 | 902 | 856 | |||||||||||||||
Net charge offs | (593 | ) | (1,001 | ) | (146 | ) | (773 | ) | (822 | ) | ||||||||||
Provision for loan losses | 2,340 | 2,494 | 3,185 | 1,646 | 1,716 | |||||||||||||||
Balance at end of period | $ | 15,538 | $ | 13,791 | $ | 12,298 | $ | 9,259 | $ | 8,386 | ||||||||||
Ratio of allowance to total loans outstanding at the end of the period | 1.10 | % | 1.20 | % | 1.15 | % | 1.14 | % | 1.28 | % | ||||||||||
Ratio of net charge offs to average loans outstanding during the period | 0.05 | % | 0.09 | % | 0.01 | % | 0.10 | % | 0.13 | % | ||||||||||
19
The following table sets forth the breakdown of the allowance for loan losses by loan category for the periods indicated.
At June 30, | ||||||||||||||||||||||||||||||||||||||||
2017 | 2016 | 2015 | 2014 | 2013 | ||||||||||||||||||||||||||||||||||||
Amount | Percent of | Amount | Percent of | Amount | Percent of | Amount | Percent of | Amount | Percent of | |||||||||||||||||||||||||||||||
(Dollars in thousands) | ||||||||||||||||||||||||||||||||||||||||
Residential real estate | $ | 3,230 | 30.22 | % | $ | 3,247 | 33.56 | % | $ | 2,819 | 34.63 | % | $ | 2,462 | 36.64 | % | $ | 1,810 | 35.11 | % | ||||||||||||||||||||
Construction | 964 | 7.30 | 1,091 | 6.61 | 899 | 6.35 | 355 | 4.91 | 273 | 4.61 | ||||||||||||||||||||||||||||||
Commercial real estate | 7,068 | 41.25 | 5,711 | 38.60 | 4,956 | 37.13 | 4,143 | 37.19 | 3,602 | 36.37 | ||||||||||||||||||||||||||||||
Consumer | 757 | 4.35 | 738 | 3.98 | 758 | 4.29 | 519 | 4.25 | 472 | 4.27 | ||||||||||||||||||||||||||||||
Commercial business | 3,519 | 16.88 | 3,004 | 17.25 | 2,866 | 17.60 | 1,780 | 17.01 | 2,229 | 19.64 | ||||||||||||||||||||||||||||||
Total allowance for | $ | 15,538 | 100.00 | % | $ | 13,791 | 100.00 | % | $ | 12,298 | 100.00 | % | $ | 9,259 | 100.00 | % | $ | 8,386 | 100.00 | % | ||||||||||||||||||||
20
Investment Activities
General. Under Missouri law, the Bank is permitted to invest in various types of liquid assets, including U.S. Government and State of Missouri obligations, securities of various federal agencies, certain certificates of deposit of insured banks and savings institutions, banker's acceptances, repurchase agreements, federal funds, commercial paper, investment grade corporate debt securities and obligations of States and their political sub-divisions. Generally, the investment policy of the Company is to invest funds among various categories of investments and repricing characteristics based upon the Bank's need for liquidity, to provide collateral for borrowings and public unit deposits, to help reach financial performance targets and to help maintain asset/liability management objectives.
The Company's investment portfolio is managed in accordance with the Bank's investment policy which was adopted by the Board of Directors of the Bank and is implemented by members of the asset/liability management committee which consists of the President/CEO, the CFO, the COO and four outside directors.
Investment purchases and/or sales must be authorized by the appropriate party, depending on the aggregate size of the investment transaction, prior to any investment transaction. The Board of Directors reviews all investment transactions. All investment purchases are identified as available-for-sale ("AFS") at the time of purchase. The Company has not classified any investment securities as held-to-maturity over the last five years. Securities classified as "AFS" must be reported at fair value with unrealized gains and losses, net of tax, recorded as a separate component of stockholders' equity. At June 30, 2017, AFS securities totaled $144.4 million (excluding FHLB and Federal Reserve Bank membership stock). For information regarding the amortized cost and market values of the Company's investments, see Note 2 of Notes to the Consolidated Financial Statements contained in Item 8.
As of June 30, 2017, the Company had no derivative instruments and no outstanding hedging activities. Management has reviewed potential uses for derivative instruments and hedging activities, but has no immediate plans to employ these tools.
Debt and Other Securities. At June 30, 2017, the Company's debt and other securities portfolio totaled $66.1 million, or 3.87% of total assets as compared to $58.0 million, or 4.13% of total assets at June 30, 2016. During fiscal 2017, the Bank had $6.3 million in maturities and $10.4 million in securities purchases. Of the securities that matured, $5.2 million was called for early redemption. At June 30, 2017, the investment securities portfolio included $10.4 million in U.S. government and government agency bonds, of which $8.4 million is subject to early redemption at the option of the issuer, and $50.0 million in municipal bonds, of which $44.1 million is subject to early redemption at the option of the issuer. The remaining portfolio consists of $5.7 million in other securities (including pooled trust preferred securities with an estimated fair value of $1.2 million). Based on projected maturities, the weighted average life of the debt and other securities portfolio at June 30, 2017, was 45 months. Membership stock held in the FHLB of Des Moines, totaling $3.5 million, FHLB of Chicago totaling $215,000, and the Federal Reserve Bank of St. Louis, totaling $2.4 million, along with equity stock of $533,000 in three correspondent (banker's) banks, was not included in the above totals.
At June 30, 2017, the Company owned four pooled trust preferred securities with an estimated fair value of $1.2 million and a book value of $1.6 million. For three of these securities, the estimated fair value of $824,000 is less than the book value of $1.4 million. The June 30, 2017, cash flow analysis for these three securities indicated it is probable the Company will receive all contracted principal and related interest projected. The cash flow analysis used in making this determination was based on anticipated default, recovery, and prepayment rates, and the resulting cash flows were discounted based on the yield anticipated at the time the securities were purchased. At December 31, 2008, analysis of the fourth pooled trust preferred security indicated other-than-temporary impairment (OTTI). The loss recognized at that time reduced the amortized cost basis for that security, and as of June 30, 2017, the estimated fair value of the security exceeds the new, lower amortized cost basis. See Note 2 of Notes to the Consolidated Financial Statements contained in Item 8.
Mortgage-Backed Securities. At June 30, 2017, mortgage-backed securities ("MBS") totaled $78.3 million, or 4.6%, of total assets, as compared to $71.2 million, or 5.1%, of total assets at June 30, 2016. During fiscal 2017, the Bank had maturities and prepayments of $16.2 million and $21.1 million in purchases of MBS. At June 30, 2017, the MBS portfolio included $51.6 million in fixed-rate MBS, and $26.7 million in fixed rate collateralized mortgage obligations ("CMOs"), all of which passed the Federal Financial Institutions Examination
21
Council's sensitivity test. Based on projected prepayment rates, the weighted average life of the MBS and CMOs at June 30, 2017, was 47 months. Prepayment rates may cause the anticipated average life of MBS portfolio to extend or shorten based upon actual prepayment rates.
Investment Securities Analysis
The following table sets forth the Company's debt and other securities portfolio, at carrying value, and membership stock, at cost, at the dates indicated.
At June 30, | ||||||||||||||||||||||||
2017 | 2016 | 2015 | ||||||||||||||||||||||
Fair Value | Percent of Portfolio | Fair Value | Percent of Portfolio | Fair Value | Percent of Portfolio | |||||||||||||||||||
(Dollars in thousands) | ||||||||||||||||||||||||
U.S. government and government agencies | $ | 10,438 | 14.34 | % | $ | 6,517 | 9.75 | % | $ | 14,814 | 22.28 | % | ||||||||||||
State and political subdivisions | 49,978 | 68.66 | 46,185 | 69.12 | 42,021 | 63.21 | ||||||||||||||||||
Other securities | 5,725 | 7.86 | 5,291 | 7.92 | 2,704 | 4.07 | ||||||||||||||||||
FHLB/FNBB/MIB membership stock | 4,295 | 5.90 | 6,484 | 9.70 | 4,602 | 6.92 | ||||||||||||||||||
Federal Reserve Bank membership stock | 2,357 | 3.24 | 2,343 | 3.51 | 2,340 | 3.52 | ||||||||||||||||||
Total | $ | 72,793 | 100.00 | % | $ | 66,820 | 100.00 | % | $ | 66,481 | 100.00 | % | ||||||||||||
The following table sets forth the maturities and weighted average yields of AFS debt securities in the Company's investment securities portfolio and membership stock at June 30, 2017.
Available for Sale Securities June 30, 2017 | ||||||||||||
Amortized | Fair | Tax-Equiv. | ||||||||||
(Dollars in thousands) | ||||||||||||
U.S. government and government agency securities: | ||||||||||||
Due within 1 year | $ | 1,986 | $ | 1,994 | 1.83 | % | ||||||
Due after 1 year but within 5 years | 7,948 | 7,945 | 1.66 | |||||||||
Due after 5 years but within 10 years | 499 | 499 | 2.21 | |||||||||
Due over 10 years | --- | --- | --- | |||||||||
Total | 10,433 | 10,438 | 1.71 | % | ||||||||
State and political subdivisions: | ||||||||||||
Due within 1 year | 1,008 | 1,016 | 3.33 | % | ||||||||
Due after 1 year but within 5 years | 8,639 | 8,741 | 3.53 | |||||||||
Due after 5 years but within 10 years | 16,333 | 16,557 | 3.70 | |||||||||
Due over 10 years | 23,079 | 23,664 | 3.85 | |||||||||
Total | 49,059 | 49,978 | 3.73 | % | ||||||||
Other securities: | ||||||||||||
Due within 1 year | --- | --- | --- | % | ||||||||
Due after 1 year but within 5 years | 67 | 67 | 1.92 | |||||||||
Due after 5 years but within 10 years | 3,992 | 4,084 | 5.44 | |||||||||
Due over 10 years | 1,958 | 1,574 | 1.91 | |||||||||
Total | 6,017 | 5,725 | 4.25 | % | ||||||||
No stated maturity: | ||||||||||||
FHLB/FNBB/MIB membership stock | 4,295 | 4,295 | 2.10 | % | ||||||||
Federal Reserve Bank membership stock | 2,357 | 2,357 | 6.00 | |||||||||
Total | 6,652 | 6,652 | 3.48 | % | ||||||||
Total debt and other securities | $ | 72,161 | $ | 72,793 | 3.46 | % | ||||||
22
The following table sets forth certain information at June 30, 2017 regarding the dollar amount of MBS and CMOs at amortized cost due, based on their contractual terms to maturity, but does not include scheduled payments or potential prepayments. MBS and CMOs that have adjustable rates are shown at amortized cost as maturing at their next repricing date.
At June 30, 2017 | ||||
(Dollars in thousands) | ||||
Amounts due: | ||||
Within 1 year | $ | --- | ||
After 1 year through 3 years | 200 | |||
After 3 years through 5 years | 776 | |||
After 5 years | 77,112 | |||
Total | $ | 78,088 | ||
The following table sets forth the dollar amount of all MBS and CMOs at amortized cost due, based on their contractual terms to maturity, one year after June 30, 2017, which have fixed, floating, or adjustable interest rates.
At June 30, 2017 | ||||
(Dollars in thousands) | ||||
Interest rate terms on amounts due after 1 year: | ||||
Fixed | $ | 78,088 | ||
Adjustable | --- | |||
Total | $ | 78,088 | ||
The following table sets forth certain information with respect to each MBS and CMO security at the dates indicated.
At June 30, | ||||||||||||||||||||||||
2017 | 2016 | 2015 | ||||||||||||||||||||||
Amortized Cost | Fair Value | Amortized Cost | Fair Value | Amortized Cost | Fair Value | |||||||||||||||||||
(Dollars in thousands) | ||||||||||||||||||||||||
FHLMC certificates | $ | 21,380 | $ | 21,489 | $ | 23,298 | $ | 23,799 | $ | 24,371 | $ | 24,586 | ||||||||||||
GNMA certificates | 1,437 | 1,449 | 1,814 | 1,856 | 2,230 | 2,248 | ||||||||||||||||||
FNMA certificates | 28,457 | 28,628 | 28,292 | 28,931 | 32,391 | 32,668 | ||||||||||||||||||
Collateralized mortgage obligations issued by government agencies | 26,814 | 26,709 | 16,489 | 16,645 | 10,491 | 10,552 | ||||||||||||||||||
Total | $ | 78,088 | $ | 78,275 | $ | 69,893 | $ | 71,231 | $ | 69,483 | $ | 70,054 | ||||||||||||
Deposit Activities and Other Sources of Funds
General. The Company's primary sources of funds are deposits, borrowings, payments of principal and interest on loans, MBS and CMOs, interest and principal received on investment securities and other short-term investments, and funds provided from operating results. Loan repayments are a relatively stable source of funds, while deposit inflows and outflows and loan prepayments are significantly influenced by general market interest rates and overall economic conditions.
Borrowings, including FHLB advances, have been used at times to provide additional liquidity. Borrowings are used on an overnight or short-term basis to compensate for periodic fluctuations in cash flows, and are used on a longer term basis to fund loan growth and to help manage the Company's sensitivity to fluctuating interest rates.
Deposits. The Bank's depositors are generally residents and entities located in the State of Missouri or Arkansas. Deposits are attracted from within the Bank's market area through the offering of a broad selection of deposit instruments, including demand deposit accounts, negotiable order of withdrawal ("NOW") accounts, money market deposit accounts, saving accounts, certificates of deposit and retirement savings plans. Deposit account terms
23
vary according to the minimum balance required, the time periods the funds may remain on deposit and the interest rate, among other factors. In determining the terms of its deposit accounts, the Bank considers current market interest rates, profitability to the Bank, managing interest rate sensitivity and its customer preferences and concerns. The Bank's Asset/Liability Committee regularly reviews its deposit mix and pricing.
The Bank will periodically promote a particular deposit product as part of the Bank's overall marketing plan. Deposit products have been promoted through various mediums, which include radio and newspaper advertisements, as well as "grassroots" marketing techniques, such as sponsorship of – or activity at – community events. The emphasis of these campaigns is to increase consumer awareness and market share of the Bank.
The flow of deposits is influenced significantly by general economic conditions, changes in prevailing interest rates, and competition. Based on its experience, the Bank believes that its deposits are relatively stable sources of funds. However, the ability of the Bank to attract and maintain certificates of deposit, and the rates paid on these deposits, has been and will continue to be significantly affected by market conditions. The following table depicts the composition of the Bank's deposits as of June 30, 2017:
As of June 30, 2017 | |||||||||||||||||
Weighted | Term | Category | Minimum | Balance | Percentage | ||||||||||||
(Dollars in thousands) | |||||||||||||||||
0.00% |
| None | Non-interest Bearing | $ | 100 | $ | 186,203 | 12.79 | % | ||||||||
0.72 | None | NOW Accounts | 100 | 479,488 | 32.94 | ||||||||||||
0.34 | None | Savings Accounts | 100 | 147,247 | 10.12 | ||||||||||||
0.37 | None | Money Market Deposit Accounts | 1,000 | 105,599 | 7.25 | ||||||||||||
Certificates of Deposit | |||||||||||||||||
0.78 | 6 months or less | Fixed Rate/Term | 1,000 | 39,732 | 2.73 | ||||||||||||
0.54 | 6 months or less | IRA Fixed Rate/Term | 1,000 | 2,057 | 0.14 | ||||||||||||
0.89 | 7-12 months | Fixed Rate/Term | 1,000 | 146,158 | 10.04 | ||||||||||||
0.65 | 7-12 months | IRA Fixed Rate/Term | 1,000 | 16,550 | 1.14 | ||||||||||||
1.18 | 13-24 months | Fixed Rate/Term | 1,000 | 142,731 | 9.81 | ||||||||||||
0.94 | 13-24 months | IRA Fixed Rate/Term | 1,000 | 16,563 | 1.13 | ||||||||||||
1.26 | 25-36 months | Fixed Rate/Term | 1,000 | 37,542 | 2.58 | ||||||||||||
1.13 | 25-36 months | IRA Fixed Rate/Term | 1,000 | 5,463 | 0.38 | ||||||||||||
1.68 | 48 months and more | Fixed Rate/Term | 1,000 | 108,378 | 7.45 | ||||||||||||
1.72 | 48 months and more | IRA Fixed Rate/Term | 1,000 | 21,886 | 1.50 | ||||||||||||
$ | 1,455,597 | 100.00 | % | ||||||||||||||
The following table indicates the amount of the Bank's jumbo certificates of deposit by time remaining until maturity as of June 30, 2017. Jumbo certificates of deposit require minimum deposits of $100,000 and rates paid on such accounts are generally negotiable.
Maturity Period | Amount | |||
(Dollars in thousands) | ||||
Three months or less | $ | 55,620 | ||
Over three through six months | 59,033 | |||
Over six through twelve months | 92,029 | |||
Over 12 months | 135,850 | |||
Total | $ | 342,532 | ||
24
Time Deposits by Rates
The following table sets forth the time deposits in the Bank classified by rates at the dates indicated.
At June 30, | ||||||||||||||
2017 | 2016 | 2015 | ||||||||||||
(Dollars in thousands) | ||||||||||||||
0.00 - 0.99% | $ | 200,868 | $ | 205,387 | $ | 234,845 | ||||||||
1.00 - 1.99% | 296,964 | 162,180 | 124,608 | |||||||||||
2.00 - 2.99% | 36,228 | 28,135 | 30,613 | |||||||||||
3.00 - 3.99% | --- | 20 | 5,987 | |||||||||||
4.00 - 4.99% | --- | --- | --- | |||||||||||
5.00 - 5.99% | 3,000 | 3,001 | 5,985 | |||||||||||
Total | $ | 537,060 | $ | 398,723 | $ | 402,038 | ||||||||
The following table sets forth the amount and maturities of all time deposits at June 30, 2017.
Amount Due | ||||||||||||||||||||||||||||||
Percent | ||||||||||||||||||||||||||||||
Less | of Total | |||||||||||||||||||||||||||||
Than One | 1-2 | 2-3 | 3-4 | After | Certificate | |||||||||||||||||||||||||
Year | Years | Years | Years | 4 Years | Total | Accounts | ||||||||||||||||||||||||
(Dollars in thousands) | ||||||||||||||||||||||||||||||
0.00 – 0.99% | $ | 184,096 | $ | 15,405 | $ | 988 | $ | 79 | $ | 300 | $ | 200,868 | 37.40 | % | ||||||||||||||||
1.00 – 1.99% | 130,839 | 105,861 | 27,883 | 16,889 | 15,493 | 296,965 | 55.29 | |||||||||||||||||||||||
2.00 - 2.99% | 8,703 | 1,262 | 11,411 | 5,452 | 9,399 | 36,227 | 6.75 | |||||||||||||||||||||||
3.00 - 3.99% | --- | --- | --- | --- | --- | --- | --- | |||||||||||||||||||||||
4.00 - 4.99% | --- | --- | --- | --- | --- | --- | --- | |||||||||||||||||||||||
5.00 - 5.99% | 3,000 | --- | --- | --- | --- | 3,000 | 0.56 | |||||||||||||||||||||||
Total | $ | 326,638 | $ | 122,528 | $ | 40,282 | $ | 22,420 | $ | 25,192 | $ | 537,060 | 100.00 | % | ||||||||||||||||
25
Deposit Flow
The following table sets forth the balance of deposits in the various types of accounts offered by the Bank at the dates indicated.
At June 30, | ||||||||||||||||||||||||||||||||||||
2017 | 2016 | 2015 | ||||||||||||||||||||||||||||||||||
Amount | Percent of | Increase | Amount | Percent of | Increase | Amount | Percent of | Increase | ||||||||||||||||||||||||||||
(Dollars in thousands) | ||||||||||||||||||||||||||||||||||||
Noninterest bearing | $ | 186,203 | 12.79 | % | $ | 54,207 | $ | 131,996 | 11.78 | % | $ | 14,525 | $ | 117,471 | 11.13 | % | $ | 49,359 | ||||||||||||||||||
NOW checking | 479,488 | 32.94 | 83,383 | 396,105 | 35.34 | 60,008 | 336,097 | 31.85 | 64,941 | |||||||||||||||||||||||||||
Savings accounts | 147,247 | 10.12 | 31,533 | 115,714 | 10.33 | (16,170 | ) | 131,884 | 12.50 | 36,557 | ||||||||||||||||||||||||||
Money market deposit | 105,599 | 7.25 | 27,444 | 78,155 | 6.97 | 10,403 | 67,752 | 6.42 | 39,719 | |||||||||||||||||||||||||||
Fixed-rate certificates which mature (1) : | ||||||||||||||||||||||||||||||||||||
Within one year | 326,638 | 22.44 | 80,734 | 245,904 | 21.94 | 618 | 245,286 | 23.24 | 37,919 | |||||||||||||||||||||||||||
Within three years | 162,810 | 11.19 | 59,011 | 103,799 | 9.26 | (11,184 | ) | 114,983 | 10.90 | 36,536 | ||||||||||||||||||||||||||
After three years | 47,612 | 3.27 | (1,408 | ) | 49,020 | 4.38 | 7,251 | 41,769 | 3.96 | 4,410 | ||||||||||||||||||||||||||
Variable-rate certificates which mature: Within one year | --- | --- | --- | --- | --- | --- | --- | --- | --- | |||||||||||||||||||||||||||
Within three years | --- | --- | --- | --- | --- | --- | --- | --- | --- | |||||||||||||||||||||||||||
Total | $ | 1,455,597 | 100.00 | % | $ | 334,904 | $ | 1,120,693 | 100.00 | % | $ | 65,451 | $ | 1,055,242 | 100.00 | % | $ | 269,441 | ||||||||||||||||||
___________________________
(1) At June 30, 2017, 2016 and 2015, certificates in excess of $100,000 totaled $342.5 million, $234.5 million and $225.2 million, respectively.
26
The following table sets forth the deposit activities of the Bank for the periods indicated.
At June 30, | ||||||||||||
2017 | 2016 | 2015 | ||||||||||
(Dollars in thousands) | ||||||||||||
Beginning Balance | $ | 1,120,693 | $ | 1,055,242 | $ | 785,801 | ||||||
Net increase before interest credited | 326,432 | 58,044 | 262,582 | |||||||||
Interest credited | 8,472 | 7,407 | 6,859 | |||||||||
Net increase in deposits | 334,904 | 65,451 | 269,441 | |||||||||
Ending balance | $ | 1,455,597 | $ | 1,120,693 | $ | 1,055,242 | ||||||
In the unlikely event the Bank is liquidated, depositors will be entitled to payment of their deposit accounts prior to any payment being made to the Company as the sole stockholder of the Bank.
Borrowings. As a member of the FHLB of Des Moines, the Bank has the ability to apply for FHLB advances. These advances are available under various credit programs, each of which has its own maturity, interest rate and repricing characteristics. Additionally, FHLB advances have prepayment penalties as well as limitations on size or term. In order to utilize FHLB advances, the Bank must be a member of the FHLB system, have sufficient collateral to secure the requested advance and own stock in the FHLB equal to 4.45% of the amount borrowed. See "REGULATION – The Bank – Federal Home Loan Bank System."
Although deposits are the Bank's primary and preferred source of funds, the Bank has actively used FHLB advances. The Bank's general policy has been to utilize borrowings to meet short-term liquidity needs, or to provide a longer-term source of funding loan growth when other cheaper funding sources are unavailable or to aide in asset/liability management. As of June 30, 2017, the Bank had $43.6 million in FHLB advances, of which $20.0 million was weekly repurchase agreement borrowings, and another $23.6 million had an original term of ten years, subject to early redemption by the FHLB after an initial period of one to five years. In order for the Bank to borrow from the FHLB, it has pledged $579.3 million of its residential and commercial real estate loans to the FHLB (although the actual collateral required for advances taken and letters of credit issued amounts to $85.4 million) and has purchased $3.5 million in FHLB stock. At June 30, 2017, the Bank had additional borrowing capacity on its pledged residential and commercial real estate loans from the FHLB of $251.8 million, as compared to $138.2 million at June 30, 2016.
Additionally, the Bank is approved to borrow from the Federal Reserve Bank's discount window on a primary credit basis. Primary credit is available to approved institutions on a generally short-term basis at the "discount rate" set by the FOMC. The Bank has pledged agricultural real estate and other loans to farmers as collateral for any amounts borrowed through the discount window. As of June 30, 2017, the Bank was approved to borrow up to $143.9 million through the discount window, but no balance was outstanding.
Also classified as borrowings are the Bank's securities sold under agreements to repurchase ("repurchase agreements"). These agreements are typically entered into with local public units or corporations. Generally, the Bank pays interest on these agreements at a rate similar to those available on repurchase agreements with wholesale funding sources. The Bank views repurchase agreements with local entities as a stable funding source. At June 30, 2017, the Bank had outstanding $10.2 million in repurchase agreements, as compared to $27.1 million at June 30, 2016.
Southern Missouri Statutory Trust I, a Delaware business trust subsidiary of the Company, issued $7.0 million in Floating Rate Capital Securities (the "Trust Preferred Securities") with a liquidation value of $1,000 per share in March, 2004. The securities are due in 30 years, were redeemable after five years and bear interest at a floating rate based on LIBOR. At June 30, 2017, the current rate was 4.02%. The securities represent undivided beneficial interests in the trust, which was established by Southern Missouri Bancorp for the purpose of issuing the securities. The Trust Preferred Securities were sold in a private transaction exempt from registration under the Securities Act of 1933, as amended (the "Act") and have not been registered under the Act. The securities may not be offered or sold in the United States absent registration or an applicable exemption from registration requirements.
Southern Missouri Statutory Trust I used the proceeds of the sale of the Trust Preferred Securities to purchase Junior Subordinated Debentures of Southern Missouri Bancorp. Southern Missouri Bancorp is using the
27
net proceeds for working capital and investment in its subsidiaries. Trust Preferred Securities currently qualify as Tier I Capital for regulatory purposes. See "Regulation" for further discussion on the treatment of the trust-preferred securities.
In its October 2013 acquisition of Ozarks Legacy, the Company assumed $3.1 million in floating rate junior subordinated debt securities. The securities had been issued in June 2005 by Ozarks Legacy in connection with the sale of trust preferred securities, bear interest at a floating rate based on LIBOR, and mature in 2035. At June 30, 2017, the carrying value was $2.6 million, and bore interest at a current coupon rate of 3.70% and an effective rate of 5.41%.
In the Peoples Acquisition, the Company assumed $6.5 million in floating rate junior subordinated debt securities. The debt securities had been issued in 2005 by PBC in connection with the sale of trust preferred securities, bear interest at a floating rate based on LIBOR, are now redeemable at par, and mature in 2035. At June 30, 2017, the carrying value was $5.0 million and bore interest at a current coupon rate of 3.05% and an effective rate of 5.31%.
The following table sets forth certain information regarding short-term borrowings by the Bank at the end of and during the periods indicated:
Year Ended June 30, | ||||||||||||
2017 | 2016 | 2015 | ||||||||||
(Dollars in thousands) | ||||||||||||
Year end balances | ||||||||||||
Short-term FHLB advances | $ | 20,000 | $ | 69,750 | $ | 23,500 | ||||||
Securities sold under agreements to repurchase | 10,212 | 27,085 | 27,332 | |||||||||
$ | 30,212 | $ | 96,835 | $ | 50,832 | |||||||
Weighted average rate at year end | 1.02 | % | 0.45 | % | 0.38 | % | ||||||
The following table sets forth certain information as to the Bank's borrowings for the periods indicated:
Year Ended June 30, | ||||||||||||
2017 | 2016 | 2015 | ||||||||||
(Dollars in thousands) | ||||||||||||
FHLB advances | ||||||||||||
Daily average balance | $ | 96,065 | $ | 65,273 | $ | 80,415 | ||||||
Weighted average interest rate | 1.18 | % | 1.95 | % | 1.59 | % | ||||||
Maximum outstanding at any month end | $ | 140,361 | $ | 100,993 | $ | 118,067 | ||||||
Securities sold under agreements to repurchase | ||||||||||||
Daily average balance | $ | 22,198 | $ | 27,387 | $ | 25,443 | ||||||
Weighted average interest rate | 0.43 | % | 0.44 | % | 0.46 | % | ||||||
Maximum outstanding at any month end | $ | 28,825 | $ | 31,575 | $ | 28,198 | ||||||
Subordinated Debt | ||||||||||||
Daily average balance | $ | 14,800 | $ | 14,705 | $ | 14,112 | ||||||
Weighted average interest rate | 4.37 | % | 3.86 | % | 3.63 | % | ||||||
Maximum outstanding at month end | $ | 14,848 | $ | 14,753 | $ | 14,658 | ||||||
Subsidiary Activities
The Bank has three subsidiaries, SMS Financial Services, Inc., which had no assets or liabilities at June 30, 2017, and is currently inactive, and SB Corning, LLC and SB Real Estate Investments, LLC both active subsidiaries. SB Corning, LLC represents a $1.4 million investment in a limited partnership formed for the purpose of generating low income housing tax credits. SB Real Estate Investments, LLC is a wholly-owned subsidiary of the Bank formed to hold Southern Bank Real Estate Investments, LLC. Southern Bank Real Estate Investments, LLC is a REIT which is majority-owned by the investment subsidiary, but has other preferred shareholders in order to meet the requirements to be a REIT. At June 30, 2017, SB Real Estate Investments, LLC held assets of $447.2 million, while Southern Bank Real Estate Investments, LLC held assets of $435.3 million.
28
REGULATION
The following is a brief description of certain laws and regulations applicable to the Company and the Bank. Descriptions of laws and regulations here and elsewhere in this prospectus do not purport to be complete and are qualified in their entirety by reference to the actual laws and regulations. Legislation is introduced from time to time in the United States Congress or the Missouri state legislature that may affect the operations of the Company and the Bank. In addition, the regulations governing us may be amended from time to time. Any such legislation or regulatory changes in the future could adversely affect our operations and financial condition.
The Dodd-Frank Wall Street Reform and Consumer Protection Act (the "Dodd-Frank Act") imposed various restrictions and an expanded framework of regulatory oversight for financial institutions, including depository institutions. The following discussion summarizes significant aspects of the Dodd-Frank Act that may affect the Bank and the Company.
The following selected aspects of the Dodd-Frank Act are related to the operations of the Bank:
· | The Consumer Financial Protection Bureau ("CFPB"), an independent consumer compliance regulatory agency within the FRB, has been established. The CFPB is empowered to exercise broad regulatory, supervisory and enforcement authority over financial institutions with total assets of over $10 billion with respect to Federal consumer financial protection laws. Financial institutions with assets of less than $10 billion, like the Bank, will continue to be subject to supervision and enforcement by their primary federal banking regulator with respect to federal consumer financial protection laws. The CFPB also has authority to promulgate new consumer financial protection regulations and amend existing consumer financial protection regulations; |
· | The Federal Deposit Insurance Act was amended to require depository institution holding companies to serve as a source of strength for their depository institution subsidiaries; |
· | The prohibition on payment of interest on demand deposits was repealed; |
· | Deposit insurance was permanently increased to $250,000; and |
· | The deposit insurance assessment base for FDIC insurance is the depository institution's average consolidated total assets less the average tangible equity during the assessment period; |
The following aspects of the Dodd-Frank Act are related to the operations of the Company:
· | Tier 1 capital treatment for "hybrid" capital items like trust preferred securities is eliminated, subject to various grandfathering and transition rules. As required by the Act, the federal banking agencies have promulgated new rules on regulatory capital for both depository institutions and their holding companies; |
· | Public companies are required to provide their shareholders with a non-binding vote: (i) at least once every three years on the compensation paid to executive officers, and (ii) at least once every six years on whether shareholders should have a "say on pay" vote every one, two or three years; |
· | A separate, non-binding shareholder vote is required regarding golden parachutes for named executive officers when a shareholder vote takes place on mergers, acquisitions, dispositions or other transactions that would trigger the parachute payments; |
· | Securities exchanges are required to prohibit brokers from using their own discretion to vote shares not beneficially owned by them for certain "significant" matters, which include votes on the election of directors, executive compensation matters, and any other matter determined to be significant; |
· | Stock exchanges are prohibited from listing the securities of any issuer that does not have a policy providing for (i) disclosure of its policy on incentive compensation payable on the basis of financial information reportable under the securities laws, and (ii) the recovery from current or former executive officers, following an accounting restatement triggered by material noncompliance with securities law |
29
| reporting requirements, of any incentive compensation paid erroneously during the three-year period preceding the date on which the restatement was required that exceeds the amount that would have been paid on the basis of the restated financial information; |
· | Smaller reporting companies are exempt from complying with the internal control auditor attestation requirements of Section 404(b) of the Sarbanes-Oxley Act. |
The Bank
General. As a state-chartered, federally-insured trust company with banking powers, the Bank is subject to extensive regulation. Lending activities and other investments must comply with various statutory and regulatory requirements, including prescribed minimum capital standards. The Bank is regularly examined by the FRB and the Missouri Division of Finance and files periodic reports concerning the Bank's activities and financial condition with its regulators. The Bank's relationship with depositors and borrowers also is regulated to a great extent by both federal law and the laws of Missouri, especially in such matters as the ownership of deposit accounts and the form and content of mortgage documents.
Federal and state banking laws and regulations govern all areas of the operation of the Bank, including reserves, loans, mortgages, capital, issuance of securities, payment of dividends, and establishment of branches. Federal and state bank regulatory agencies also have the general authority to limit the dividends paid by insured banks and bank holding companies if such payments should be deemed to constitute an unsafe and unsound practice, and in other circumstances. The FRB as the primary federal regulator of the Company and the Bank has authority to impose penalties, initiate civil and administrative actions and take other steps intended to prevent banks from engaging in unsafe or unsound practices.
State Regulation and Supervision. As a state-chartered trust company with banking powers, the Bank is subject to applicable provisions of Missouri law and the regulations of the Missouri Division of Finance. Missouri law and regulations govern the Bank's ability to take deposits and pay interest thereon, to make loans on or invest in residential and other real estate, to make consumer loans, to invest in securities, to offer various banking services to its customers, and to establish branch offices.
Federal Reserve System. The FRB requires all depository institutions to maintain reserves at specified levels against their transaction accounts (checking, NOW and Super NOW checking accounts). At June 30, 2017, the Bank was in compliance with these reserve requirements.
The Bank is authorized to borrow from the Federal Reserve Bank "discount window." FRB regulations require associations to exhaust other reasonable alternative sources of funds, including FHLB borrowings, before borrowing from the Federal Reserve Bank.
Federal Home Loan Bank System. The Bank is a member of the FHLB of Des Moines, which is one of 11 regional FHLBs that provide home financing credit. Each FHLB serves as a reserve or central bank for its members within its assigned region. It is funded primarily from proceeds derived from the sale of consolidated obligations of the FHLB System. It makes loans or advances to members in accordance with policies and procedures, established by the Board of Directors of the FHLB, which are subject to the oversight of the Federal Housing Finance Agency. All advances from the FHLB are required to be fully secured by sufficient collateral as determined by the FHLB. In addition, all long-term advances are required to provide funds for residential home financing. See Business - Deposit Activities and Other Sources of Funds - Borrowings.
As a member, the Bank is required to purchase and maintain stock in the FHLB of Des Moines. At June 30, 2017, the Bank had $3.5 million in FHLB stock, which was in compliance with this requirement. The Bank received $151,000 and $99,000 in dividends from the FHLB of Des Moines for the years ended June 30, 2017 and 2016, respectively.
The FHLBs continue to contribute to low- and moderately-priced housing programs through direct loans or interest subsidies on advances targeted for community investment and low- and moderate-income housing projects. These contributions have adversely affected the level of FHLB dividends paid and could continue to do so in the future. These contributions could also have an adverse effect on the value of FHLB stock in the future. A reduction in value of the Bank's FHLB stock may result in a corresponding reduction in the Bank's capital.
Federal Deposit Insurance Corporation . The Bank's deposits are insured up to applicable limits by the Deposit Insurance Fund ("DIF") of the FDIC. The general insurance limit is $250,000. As insurer, the FDIC
30
imposes deposit insurance premiums and is authorized to conduct examinations of and to require reporting by FDIC-insured institutions. It also may prohibit any FDIC-insured institution from engaging in any activity the FDIC determines by regulation or order to pose a serious risk to the DIF. The FDIC also has the authority to initiate enforcement actions against a member bank of the FRB after giving the FRB an opportunity to take such action.
The Dodd-Frank Act establishes 1.35% as the minimum reserve ratio (the ratio of the net worth of the DIF to aggregate insured deposits). The FDIC has adopted a plan under which it will meet this ratio by September 30, 2020, the deadline imposed by the Dodd-Frank Act. The FDIC is required to offset the effect of the increase in the reserve ratio on institutions with assets less than $10 billion of the increase in the statutory minimum reserve ratio to 1.35% from the former statutory minimum of 1.15%. In addition to the statutory minimum ratio, the FDIC must designate a reserve ratio, known as the designated reserve ratio or DRR, which may exceed the statutory minimum. The FDIC has established 2.0% as the DRR.
Implementing the Dodd-Frank Act requirement that the FDIC's deposit insurance assessments be based on assets instead of deposits, the FDIC has issued rules specifying that specify that the assessment base for a bank is equal to its total average consolidated assets less average tangible equity. generally Effective for the quarter beginning July 1, 2016, the assessment rates for an institution with assets of less than $10 billion will range from 3 to 30 basis points, based on the institution's weighted average CAMELS component ratings and certain financial ratios. These rates are subject to downward adjustment (not below 1.5 basis points) based on the ratio of unsecured debt the institution has issued to its assessment base, and to upward adjustment based on its holdings of unsecured debt issued by other insured institutions. Assessment rates are expected to decrease in the future as the reserve ratio increases in specified increments. To implement the offset requirement, FDIC regulations require that institutions with assets of $10 billion or more pay a surcharge during a temporary period, and smaller institutions will receive certain credits when the reserve ratio reaches 1.38%. No institution may pay a dividend if it is in default on its federal deposit insurance assessment.
A significant increase in insurance assessment rates would likely have an adverse effect on the operating expenses and results of operations of the Bank. There can be no prediction as to what insurance assessment rates will be in the future. Insurance of deposits may be terminated by the FDIC upon a finding that the institution has engaged in unsafe or unsound practices, is in an unsafe or unsound condition to continue operations or has violated any applicable law, regulation, rule, order or condition imposed by the FDIC. Management of the Bank is not aware of any practice, condition or violation that might lead to termination of the Bank's deposit insurance.
In addition to the assessment for deposit insurance, institutions are required to make payments on bonds issued in the late 1980s by the Financing Corporation to recapitalize a predecessor deposit insurance fund. This payment is established quarterly and during the fourth quarter ended June 30, 2017, was 0.54 basis points (annualized) of assessable deposits.
Prompt Corrective Action. Under the Federal Deposit Insurance Act ("FDIA"), each federal banking agency is required to implement a system of prompt corrective action for depository institutions that it regulates. The federal banking agencies have promulgated substantially similar regulations to implement this system of prompt corrective action. In connection with the capital rules discussed under "Capital Rules" below, an institution is deemed to be "well capitalized" if it has (i) a total risk-based capital ratio of 10.0% or more, (ii) a common equity Tier 1 risk-based capital ratio of 6.5% or more, (iii) a Tier 1 risk-based capital ratio of 8.0% or more, and (iv) a leverage ratio of 5.0% or more, and is not subject to specified requirements to meet and maintain a specific capital level for any capital measure. An institution is deemed to be "adequately capitalized" if it has (i) a total risk-based capital ratio of 8.0% or more, (ii) a common equity Tier 1 risk-based capital ratio of 4.5% or more, (iii) a Tier 1 risk-based capital ratio of 6.0% or more, and (iv) a leverage ratio of 4.0% or more and does not meet the definition of "well capitalized;" "undercapitalized" if it has (i) a total risk-based capital ratio that is less than 8.0%, (ii) a common equity Tier 1 risk-based capital ratio that is less than 4.5%, (iii) a Tier 1 risk-based capital ratio that is less than 6.0%, or (iv) a leverage ratio that is less than 4.0%; "significantly undercapitalized" if it has (i) a total risk-based capital ratio that is less than 6.0%, (ii) a common equity Tier 1 risk-based capital ratio that is less than 3.0%, (iii) a Tier 1 risk-based capital ratio that is less than 4.0%, or (iv) a leverage ratio that is less than 3.0%; and "critically undercapitalized" if it has a ratio of tangible equity to total assets that is equal to or less than 2.0%.
A federal banking agency may reclassify a well capitalized institution as adequately capitalized and may require an adequately capitalized institution or an undercapitalized institution to comply with supervisory actions as if it were in the next lower category if it determines, after notice and opportunity for hearing, that the institution is in an unsafe or unsound condition or has received in its most recent examination, and has not corrected, a less than satisfactory rating for asset quality, management, earnings, liquidity or sensitivity to market risk. (The agency may
31
not, however, reclassify a significantly undercapitalized institution as critically undercapitalized.) An institution that is not well capitalized is subject to certain restrictions on its deposit rates.
An undercapitalized, significantly undercapitalized, or critically undercapitalized institution is required to submit an acceptable capital restoration plan to its appropriate federal banking agency. The plan must specify (i) the steps the institution will take to become adequately capitalized, (ii) the capital levels to be attained each year, (iii) how the institution will comply with any regulatory sanctions then in effect against the institution and (iv) the types and levels of activities in which the institution will engage. The banking agency may not accept a capital restoration plan unless the agency determines, among other things, that the plan is based on realistic assumptions, and is likely to succeed in restoring the institution's capital and would not appreciably increase the risks to which the institution is exposed. An institution that is not well capitalized is subject to restrictions on brokered deposits.
The FDIA provides that the appropriate federal regulatory agency must require an insured depository institution that is significantly undercapitalized or is undercapitalized and either fails to submit an acceptable capital restoration plan within the time period allowed or fails in any material respect to implement a capital restoration plan accepted by the appropriate federal banking agency, or the parent bank holding company of such an institution, to take one or more of the following actions: (i) sell enough voting shares, to become adequately capitalized; (ii) merge with (or be sold to) another institution (or holding company), but only if grounds exist for appointing a conservator or receiver; (iii) restrict certain transactions with banking affiliates as if the "sister bank" exemption of Section 23A of the Federal Reserve Act ("FRA") did not exist; (iv) otherwise restrict transactions with bank or non-bank affiliates; (v) restrict interest rates that the institution pays on deposits to "prevailing rates" in the institution's region; (vi) restrict asset growth or reduce total assets; (vii) alter, reduce or terminate activities; (viii) hold a new election of directors; (ix) require dismissal of any director or senior executive officer who held office for more than 180 days immediately before the institution became undercapitalized; (x) employ qualified senior executive officers; (xi) cease acceptance of deposits from correspondent depository institutions; (xii) divest the institution or certain non-depository holding company subsidiaries which pose a danger to the institution, or divest certain subsidiaries of the institution; (xiii) obtain prior FRB approval for payment of dividends by the parent bank holding company; and (xiv) any other action which the agency determines would better carry out the purposes of the prompt corrective action provision and request the institution to take.
A critically undercapitalized institution is subject to further restrictions and to appointment of a receiver or conservator 90 days after becoming critically undercapitalized unless the FDIC and, in the case of a state member Bank, the FRB concur that other action better serves the purposes of the prompt corrective action provisions.
At June 30, 2017, the Bank was categorized as "well capitalized" under the prompt corrective action regulations of the FRB.
Standards for Safety and Soundness. The federal banking regulatory agencies have prescribed, by regulation, standards for all insured depository institutions relating to: (i) internal controls, information systems and internal audit systems; (ii) loan documentation; (iii) credit underwriting; (iv) interest rate risk exposure; (v) asset growth; (vi) asset quality; (vii) earnings; and (viii) compensation, fees and benefits ("Guidelines"). The Guidelines set forth the safety and soundness standards that the federal banking agencies use to identify and address problems at insured depository institutions before capital becomes impaired. If the FRB determines that the Bank fails to meet any standard prescribed by the Guidelines, the agency may require the Bank to submit to the agency an acceptable plan to achieve compliance with the standard.
Guidance on Subprime Mortgage Lending. The federal banking agencies have issued guidance on subprime mortgage lending to address issues related to certain mortgage products marketed to subprime borrowers, particularly adjustable rate mortgage products that can involve "payment shock" and other risky characteristics. Although the guidance focuses on subprime borrowers, the banking agencies note that institutions should look to the principles contained in the guidance when offering such adjustable rate mortgages to non-subprime borrowers. The guidance prohibits predatory lending programs; provides that institutions should underwrite a mortgage loan on the borrower's ability to repay the debt by its final maturity at the fully-indexed rate, assuming a fully amortizing repayment schedule; encourages reasonable workout arrangements with borrowers who are in default; mandates clear and balanced advertisements and other communications; encourages arrangements for the escrowing of real estate taxes and insurance; and states that institutions should develop strong control and monitoring systems.
The federal banking agencies have announced their intention to carefully review the risk management and consumer compliance processes, policies and procedures of their supervised financial institutions and their intention
32
to take action against institutions that engage in predatory lending practices, violate consumer protection laws or fair lending laws, engage in unfair or deceptive acts or practices, or otherwise engage in unsafe or unsound lending practices.
Guidance on Commercial Real Estate Concentrations . The federal banking agencies have issued guidance on sound risk management practices for concentrations in commercial real estate lending. The particular focus is on exposure to commercial real estate loans that are dependent on the cash flow from the real estate held as collateral and that are likely to be sensitive to conditions in the commercial real estate market (as opposed to real estate collateral held as a secondary source of repayment or as an abundance of caution). A bank that has experienced rapid growth in commercial real estate lending, has notable exposure to a specific type of commercial real estate loan, or is approaching or exceeding the following supervisory criteria may be identified for further supervisory analysis with respect to real estate concentration risk: total loans for construction, land development, and other land represent 100% or more of the bank's total capital; or total commercial real estate loans (as defined in the guidance) greater than 300% of the Bank's total capital and an increase in the bank's commercial real estate portfolio of 50% or more during the prior 36 months.
Capital Rules . The regulatory capital ratios of the federal banking agencies implement the "Basel III" regulatory capital reforms and changes required by the Dodd-Frank Act. "Basel III" refers to various documents released by the Basel Committee on Banking Supervision. The capital regulations became effective January 1, 2015 (with some provisions transitioned into full effectiveness over two to four years). The new requirements created a new ratio for common equity Tier 1 ("CET1") capital, increased the leverage and Tier 1 capital ratios, changed the risk-weights of certain assets for purposes of the risk-based capital ratios, created an additional capital conservation buffer over the minimum capital ratios, and changed what qualifies as regulatory capital.
Under the new requirements, the minimum capital ratios are: a ratio of CET1 capital to total risk-weighted assets of 4.5%, a ratio of Tier 1 capital to risk-weighted assets of 6.0%, a ratio of total capital to risk-weighted assets of 8.0%, and a leverage ratio of 4.0%. The new requirements apply to the Bank and the Company.
Mortgage servicing rights, certain deferred tax assets and investments in unconsolidated subsidiaries over designated percentages of common stock are deducted from capital, subject to a two-year transition period. CET1 capital consists of Tier 1 capital less all capital components that are not considered common equity. Tier 1 capital generally includes accumulated other comprehensive income, which includes all unrealized gains and losses on available for sale debt and equity securities, subject to a two-year transition period. Because of its asset size, Southern Bank had the one-time option and elected in the first quarter of calendar year 2015 to permanently opt-out of the inclusion of accumulated other comprehensive income in its capital calculations, to reduce the impact of market volatility on its regulatory capital levels. For a bank holding company with less than $15 billion in consolidated assets as of December 31, 2009, TARP and cumulative perpetual preferred stock included in Tier 1 capital prior to May 19, 2010 is grandfathered and included as Tier 1 capital under the new capital regulations.
The new requirements also include changes in the risk-weights of certain assets to better reflect credit risk and other risk exposures. These include a 150% risk weight (up from 100%) for certain high volatility commercial real estate acquisition, development and construction loans and for non-residential mortgage loans that are 90 days past due or otherwise in nonaccrual status; a 20% (up from 0%) credit conversion factor for the unused portion of a commitment with an original maturity of one year or less that is not unconditionally cancellable (currently set at 0%); a 250% risk weight (up from 100%) for mortgage servicing and deferred tax assets that are not deducted from capital; and increased risk-weights (0% to 600%) for equity exposures.
In addition to the minimum CET1, Tier 1, and total capital ratios, Southern Bank and the Company must maintain a capital conservation buffer consisting of additional CET1 capital equal to 2.5% of risk-weighted assets above each of the required minimum risk-based capital levels in order to avoid limitations on paying dividends, engaging in share repurchases, and paying certain discretionary bonuses. The capital conservation buffer requirement is phased in beginning in January 2016 at 0.625% of risk-weighted assets and increases each year by that amount until fully implemented in January 2019. If the Company or the Bank fails to meet the buffer requirement, it will be subject to restrictions on the payment of dividends or discretionary bonuses and repurchases of stock.
As of June 30, 2017, Southern Bank and the Company meet all these new requirements, including the full 2.5% capital conservation buffer, as if phased-in requirements had been fully in effect on that date.
Activities and Investments of Insured State-Chartered Banks. Subject to certain regulatory exceptions, the FDIA and FDIC regulations provide that an insured state-chartered bank may not, directly, or indirectly through a
33
subsidiary, engage as "principal" in any activity that is not permissible for a national bank unless the FDIC has determined that such activities would pose no risk to the Deposit Insurance Fund and that the bank is in compliance with applicable regulatory capital requirements.
Under regulations dealing with equity investments, an insured state bank generally may not directly or indirectly acquire or retain any equity investment of a type, or in an amount, that is not permissible for a national bank. An insured state bank is not prohibited from, among other things, (i) acquiring or retaining a majority interest in a subsidiary, (ii) investing as a limited partner in a partnership the sole purpose of which is direct or indirect investment in the acquisition, rehabilitation or new construction of a qualified housing project, provided that such limited partnership investments may not exceed 2% of the bank's total assets, (iii) acquiring up to 10% of the voting stock of a company that solely provides or reinsures directors', trustees' and officers' liability insurance coverage or bankers' blanket bond group insurance coverage for insured depository institutions, and (iv) acquiring or retaining the voting shares of a depository institution if certain requirements are met.
Affiliate Transactions. The Company and the Bank are separate and distinct legal entities. Various legal limitations restrict the Bank from lending to or otherwise engaging in transactions with the Company (or any other affiliate), generally limiting such transactions with an affiliate to 10% of the Bank's capital and surplus and limiting all such transactions with all affiliates to 20% of the Bank's capital and surplus. Such transactions, including extensions of credit, sales of securities or assets and provision of services, also must be on terms and conditions consistent with safe and sound banking practices, including credit standards, that are substantially the same or at least as favorable to the Bank as those prevailing at the time for transactions with unaffiliated companies.
Federally insured banks are subject, with certain exceptions, to certain additional restrictions (including collateralization) on extensions of credit to their parent holding companies or other affiliates, on investments in the stock or other securities of affiliates and on the taking of such stock or securities as collateral from any borrower. In addition, such banks are prohibited from engaging in certain tying arrangements in connection with any extension of credit or the providing of any property or service.
Community Reinvestment Act. Banks are also subject to the provisions of the Community Reinvestment Act of 1977 ("CRA"), which requires the appropriate federal bank regulatory agency, in connection with its regular examination of a bank, to assess the bank's record in meeting the credit needs of the community serviced by the bank, including low and moderate income neighborhoods. The regulatory agency's assessment of the bank's record is made available to the public. Further, such assessment is required of any bank which has applied, among other things, to establish a new branch office that will accept deposits, relocate an existing office or merge or consolidate with, or acquire the assets or assume the liabilities of, a financial institution. The Bank received a "satisfactory" rating during its most recent CRA examination.
Dividends. Dividends from the Bank constitute the major source of funds for dividends that may be paid by the Company. The amount of dividends payable by the Bank to the Company depends upon the Bank's earnings and capital position, and is limited by federal and state laws, regulations and policies.
The amount of dividends actually paid by the Bank during any one period will be strongly affected by the Bank's management policy of maintaining a strong capital position. Dividends can be restricted if the capital conservation buffer is not maintained as described under "Capital Rules" above. Federal law further provides that no insured depository institution may make any capital distribution (which would include a cash dividend) if, after making the distribution, the institution would be "undercapitalized," as defined in the prompt corrective action regulations. Moreover, the federal bank regulatory agencies also have the general authority to limit the dividends paid by insured banks if such payments should be deemed to constitute an unsafe and unsound practice.
The Company
Federal Securities Law. The stock of the Company is registered with the SEC under the Securities Exchange Act of 1934, as amended (the "Exchange Act"). As such, the Company is subject to the information, proxy solicitation, insider trading restrictions and other requirements of the SEC under the Exchange Act.
The Company's stock held by persons who are affiliates (generally officers, directors and principal stockholders) of the Company may not be resold without registration or unless sold in accordance with certain resale restrictions. If the Company meets specified current public information requirements, each affiliate of the Company is able to sell in the public market, without registration, a limited number of shares in any three-month period.
The SEC has adopted rules under which, if certain conditions are met, the holders of 3% of voting shares of the Company who have held their shares for three years may require the Company to include their nominees for
34
board seats in proxy materials distributed by the Company. "Smaller reporting companies", like the Company, will be subject to these new rules after a three-year phase-in period.
Bank Holding Company Regulation. Bank holding companies are subject to comprehensive regulation by the FRB under the Bank Holding Company Act ("BHCA"). As a bank holding company, the Company is required to file reports with the FRB and such additional information as the FRB may require, and the Company and its non-banking affiliates are subject to examination by the FRB. Under FRB policy, a bank holding company must serve as a source of financial strength for its subsidiary banks. Under this policy the FRB may require, and has required in the past, a holding company to contribute additional capital to an undercapitalized subsidiary bank. Under the Dodd-Frank Act, this policy is codified and rules to implement it are to be established. Under the BHCA, a bank holding company must obtain FRB approval before: (i) acquiring, directly or indirectly, ownership or control of any voting shares of another bank or bank holding company if, after such acquisition, it would own or control more than 5% of such shares (unless it already owns or controls the majority of such shares); (ii) acquiring all or substantially all of the assets of another bank or bank holding company; or (iii) merging or consolidating with another bank holding company.
The Company is subject to the activity limitations imposed on bank holding companies that are not financial holding companies. The BHCA prohibits a bank holding company, with certain exceptions, from acquiring direct or indirect ownership or control of more than 5% of the voting shares of any company which is not a bank or bank holding company, or from engaging directly or indirectly in activities other than those of banking, managing or controlling banks, or providing services for its subsidiaries. The principal exceptions to these prohibitions involve certain activities which are permitted, by statute or by FRB regulation or order, have been identified as activities closely related to the business of banking or managing or controlling banks. The list of activities permitted by the FRB includes, among other things, operating a savings institution, mortgage company, finance company, credit card company or factoring company; performing certain data processing operations; providing certain investment and financial advice; underwriting and acting as an insurance agent for certain types of credit-related insurance; leasing property on a full-payout, non-operating basis; selling money orders, travelers' checks and United States Savings Bonds; real estate and personal property appraising; providing tax planning and preparation services; and, subject to certain limitations, providing securities brokerage services for customers.
35
TAXATION
Federal Taxation
General. The Company and the Bank report their income on a fiscal year basis using the accrual method of accounting and are subject to federal income taxation in the same manner as other corporations with some exceptions, including particularly the Bank's reserve for bad debts discussed below. The following discussion of tax matters is intended only as a summary and does not purport to be a comprehensive description of the tax rules applicable to the Bank or the Company.
Bad Debt Reserve. Historically, savings institutions, such as the Bank used to be, which met certain definitional tests primarily related to their assets and the nature of their business ("qualifying thrift"), were permitted to establish a reserve for bad debts and to make annual additions thereto, which may have been deducted in arriving at their taxable income. The Bank's deductions with respect to their loans, which are generally loans secured by certain interests in real property, historically has been computed using an amount based on the Bank's actual loss experience, in accordance with IRC Section 585(B)(2). Due to the Bank's loss experience, the Bank generally recognized a bad debt deduction equal to their net charge-offs.
The Bank's average assets for the current year exceeded $500 million, thus classifying it as a large bank for purposes of IRC Section 585. Under IRC Section 585(c)(3), a bank that becomes a large bank must change its method of accounting from the reserve method to a specific charge-off method under IRC Section 166. The Bank's deductions with respect to their loans are computed under the specific charge-off method. The specific charge-off method will be used in the current year and all subsequent tax years.
Corporate Alternative Minimum Tax. The Internal Revenue Code imposes a tax on alternative minimum taxable income ("AMTI") at a rate of 20%. In addition, only 90% of AMTI can be offset by net operating loss carry-overs. AMTI is increased by an amount equal to 75% of the amount by which the Bank's adjusted current earnings exceeds its AMTI (determined without regard to this preference and prior to reduction for net operating losses).
Dividends-Received Deduction. The Company may exclude from its income 100% of dividends received from the Bank as a member of the same affiliated group of corporations. The corporate dividends-received deduction is generally 70% in the case of dividends received from unaffiliated corporations with which the Company and the Bank will not file a consolidated tax return, except that if the Company or the Bank owns more than 20% of the stock of a corporation distributing a dividend, then 80% of any dividends received may be deducted.
Missouri Taxation
General. Missouri-based banks, such as the Bank, are subject to a Missouri bank franchise and income tax.
Bank Franchise Tax. The Missouri bank franchise tax is imposed on (i) the bank's taxable income at the rate of 7%, less credits for certain Missouri taxes, including income taxes. However, the credits excludes taxes paid for real estate, unemployment taxes, bank tax, and taxes on tangible personal property owned by the Bank and held for lease or rentals to others - income-based calculation; and (ii) the bank's net assets at a rate of .007%. Net assets are defined as total assets less deposits and the investment in greater than 50% owned subsidiaries - asset-based calculation.
Income Tax. The Bank and its holding company and related subsidiaries are subject to an income tax that is imposed on the consolidated taxable income apportioned to Missouri at the rate of 6.25%. The return is filed on a consolidated basis by all members of the consolidated group including the Bank.
Arkansas Taxation
General. Due to its loan activity and the acquisitions of Arkansas banks in recent periods, the Bank is subject to an Arkansas income tax. The tax is imposed on the Bank's apportioned taxable income at a rate of 6%.
Audits
There have been no IRS audits of the Company's Federal income tax returns or audits of the Bank's state income tax returns during the past five years.
For additional information regarding taxation, see Note 11 of Notes to the Consolidated Financial Statements contained in Item 8.
36
PERSONNEL
As of June 30, 2017, the Company had 352 full-time employees and 38 part-time employees. The Company believes that employees play a vital role in the success of a service company and that the Company's relationship with its employees is good. The employees are not represented by a collective bargaining unit.
EXECUTIVE OFFICERS
Greg A. Steffens , the Company's President and Chief Executive Officer, has been with us since 1998. He was hired in 1998 as Chief Financial Officer and was appointed President and CEO in 1999. He has over 27 years of experience in the banking industry, including service from 1993 to 1998 as chief financial officer of Sho-Me Financial Corp (Mount Vernon, Missouri), prior to the sale of that company to Union Planters Corporation. Mr. Steffens also served from 1989 to 1993 as an examiner with the Office of Thrift Supervision.
Matthew T. Funke , the Company's Chief Financial Officer, joined our Company in 2003. He has more than 18 years of banking and finance experience. Mr. Funke was initially hired to establish an internal audit function for the Company, and served as internal auditor and compliance officer until 2006, when he was named Chief Financial Officer. Previously, Mr. Funke was employed with Central Bancompany, Inc. (Jefferson City, Missouri), where he advanced to the role of internal audit manager, and as a fiscal analyst with the Missouri General Assembly.
Kimberly A. Capps , the Company's Chief Operations Officer, has been with us since 1994. She has over 24 years banking experience. Ms. Capps is responsible for the Company's retail deposit operations, product development and marketing, and data processing and network administration functions. Ms. Capps was initially hired by our bank subsidiary as controller, and was named Chief Financial Officer in 2001. In 2006, Ms. Capps was named Chief Operations Officer. Prior to joining the Company, Ms. Capps was employed for more than three years with the accounting firm of Kraft, Miles & Tatum, where she specialized in financial institution audits and taxation.
Lora L. Daves , the Company's Chief Risk Officer, has worked for us since 2006. Ms. Daves is responsible for the oversight of the Company's internal audit, loan review, and compliance functions. Ms. Daves also oversees the Company's quarterly stress testing of its commercial real estate portfolio and the credit analysis of proposed new credits. Ms. Daves served as our Chief Credit Officer from 2006 through 2016. Ms. Daves has over 28 years of banking and finance experience, including 11 years beginning with Mercantile Bank of Poplar Bluff, which merged with and into US Bank, a subsidiary of U.S. Bancorp (Minneapolis, Minnesota) during her tenure there. Ms. Daves' responsibilities with US Bank included credit analysis, underwriting, credit presentation, credit approval, monitoring credit quality, and analysis of the allowance for loan losses. She advanced to hold responsibility for regional credit administration, loan review, compliance, and problem credit management. Ms. Daves' experience also includes four years as Chief Financial Officer of a southeast Missouri healthcare provider which operated a critical access hospital, eight rural health clinics, two retail pharmacies, an ambulatory surgery center, and provided outpatient radiology and physical therapy services; and four years with a national real estate development and management firm, working in their St. Louis-based Midwest regional office as a general accounting manager.
Mark E. Hecker , the Company's Chief Credit Officer, has worked for us since January 23, 2017. Mr. Hecker is responsible for administration of the Company's credit portfolio, including the approval process for proposed new credits and monitoring of the portfolio's credit quality. Mr. Hecker has over 27 years of banking experience, having most recently served twelve years with BankLiberty (Liberty, Missouri) as its Chief Lending Officer. Prior to that, Mr. Hecker served as a commercial banker for Midland Bank (Lee's Summit, Missouri) and its successor organization, Commercial Federal Bank (Omaha, Nebraska) for eight years. Mr. Hecker was employed as an examiner with the FDIC for more than six years and is a Commissioned Bank Examiner.
William D. Hribovsek served as our Chief Lending Officer from 2006 until June 30, 2017. The Company announced May 16, 2017, that Mr. Hribovsek would be retiring as Chief Lending Officer, but would remain employed in his role as a Regional President for the Bank's east region. As a Regional President, Mr. Hribovsek is responsible for loan production activity in the region, and also provides joint oversight of the deposit-taking operation in the region. Mr. Hribovsek has been with us since 1999, having joined the Company as its senior commercial lender. He has over 37 years banking experience. Prior to joining the Company, Mr. Hribovsek was employed as a commercial lender from 1979 to 1999 with Commerce Bank of Poplar Bluff, which was since merged with and into Commerce Bank, N.A., a subsidiary of Commerce Bancshares, Inc. (Kansas City, Missouri). While with Commerce Bank, Mr. Hribovsek oversaw the institution's installment loan department for 12 years.
37
Justin G. Cox is our Regional President for the Bank's west region, in which role he is responsible for loan production activity in the region, and also provides joint oversight of the deposit-taking operation in the region. Mr. Cox joined our Company in 2010 as a lending officer, as an integral part of the team which established our presence in Springfield, Missouri, through the opening of a loan production office in that market. Mr. Cox has more than 14 years banking experience. He previously worked for Metropolitan National Bank (Springfield, Missouri), and advanced to the role of Vice President of Lending for that institution.
Christopher R. ("Robb") Roberts is our Regional President for the Bank's south region. Mr. Roberts joined our Company on August 7, 2017, in this role, in which he will be responsible for loan production activity in the region, and will also provide joint oversight of the deposit-taking operation in the region. Mr. Roberts has more than 20 years banking experience having specialized in credit services, commercial lending, and lending administration. He previously served as Chief Lending Officer for The Citizens Bank (Batesville, Arkansas) from 2008 to 2011, and in the same capacity for First Community Bank (Batesville, Arkansas) from 2011 to 2017. Before that, he was a commercial lender with First Security Bank (Searcy, Arkansas) from 2002 through 2008.
INTERNET WEBSITE
We maintain a website with the address of www.bankwithsouthern.com . The information contained on our website is not included as a part of, or incorporated by reference into, this Annual Report on Form 10-K. This Annual Report on Form 10-K and our other reports, proxy statements and other information, including earnings press releases, filed with the SEC are available at http://investors.bankwithsouthern.com . For more information regarding access to these filings on our website, please contact our Corporate Secretary, Southern Missouri Bancorp, Inc., 2991 Oak Grove Road, Poplar Bluff, Missouri, 63901; telephone number (573) 778-1800.
38
Item 1A. Risk Factors
Risks Relating to Our Business and Operating Environment
An investment in our securities is subject to inherent risks. Before making an investment decision, you should carefully consider the risks and uncertainties described below together with all of the other information included in this report. In addition to the risks and uncertainties described below, other risks and uncertainties not currently known to us or that we currently deem to be immaterial also may materially and adversely affect our business, financial condition and results of operations. The value or market price of our securities could decline due to any of these identified or other risks, and you could lose all or part of your investment.
We may fail to realize all of the anticipated benefits of our acquisition activities.
The success of our acquisition activities depend on, among other things, our ability to realize anticipated cost savings and to combine the businesses of the companies in a manner that does not materially disrupt the existing customer relationships of the companies or result in decreased revenues from customers. If we are unable to achieve these objectives, the anticipated benefits of the acquisitions may not be realized fully, if at all, or may take longer to realize than expected.
Our allowance for loan losses may be insufficient to absorb losses in our loan portfolio.
Lending money is a substantial part of our business. Every loan carries a certain risk that it will not be repaid in accordance with its terms or that any underlying collateral will not be sufficient to ensure repayment. This risk is affected by, among other things:
· | cash flow of the borrower and/or the project being financed; |
· | in the case of a collateralized loan, the changes and uncertainties as to the future value of the collateral; |
· | the credit history of a particular borrower; |
· | changes in economic and industry conditions; and |
· | the duration of the loan. |
We maintain an allowance for loan losses which we believe is appropriate to provide for potential losses in our loan portfolio. The amount of this allowance is determined by our management through a periodic review and consideration of several factors, including, but not limited to:
· | the quality, size and diversity of the loan portfolio; |
· | evaluation of non-performing loans; |
· | historical default and loss experience; |
· | historical recovery experience; |
· | economic conditions; |
· | risk characteristics of the various classifications of loans; and |
· | the amount and quality of collateral, including guarantees, securing the loans. |
If loan losses exceed the allowance for loan losses, our business, financial condition and profitability may suffer.
39
If our nonperforming assets increase, our earnings will be adversely affected.
At June 30, 2017 and June 30, 2016, our nonperforming assets were $6.3 million and $9.0 million, respectively, or 0.37% and 0.64% of total assets, respectively. Our nonperforming assets adversely affect our net income in various ways:
· | We do not accrue interest income on nonaccrual loans, nonperforming investment securities, or other real estate owned. |
· | We must provide for probable loan losses through a current period charge to the provision for loan losses. |
· | Non-interest expense increases when we must write down the value of properties in our other real estate owned portfolio to reflect changing market values or recognize other-than-temporary impairment on nonperforming investment securities. |
· | There are legal fees associated with the resolution of problem assets, as well as carrying costs, such as taxes, insurance, and maintenance fees related to our other real estate owned. |
· | The resolution of nonperforming assets requires the active involvement of management, which can divert management's attention from more profitable activities. |
If additional borrowers become delinquent and do not pay their loans and we are unable to successfully manage our nonperforming assets, our losses and troubled assets could increase significantly, which could have a material adverse effect on our financial condition and results of operations.
Changes in economic conditions, particularly a further economic slowdown in southern Missouri or northern Arkansas, could hurt our business.
Our business is directly affected by market conditions, trends in industry and finance, legislative and regulatory changes, and changes in governmental monetary and fiscal policies and inflation, all of which are beyond our control. In 2008, the housing and real estate sectors experienced an economic slowdown. Further deterioration in economic conditions, particularly within our primary market area in southern Missouri and northern Arkansas, could result in the following consequences, among others, any of which could hurt our business materially:
· | loan delinquencies may increase; |
· | problem assets and foreclosures may increase; |
· | demand for our products and services may decline; |
· | loan collateral may decline in value, in turn reducing a customer's borrowing power and reducing the value of collateral securing our loans; and |
· | the net worth and liquidity of loan guarantors may decline, impairing their ability to honor commitments to us. |
Downturns in the real estate markets in our primary market area could hurt our business.
Our business activities and credit exposure are primarily concentrated in southern Missouri and northern Arkansas. While we did not and do not have a sub-prime lending program, our residential real estate, construction and land loan portfolios, our commercial and multifamily loan portfolios and certain of our other loans could be affected by the downturn in the residential real estate market. We anticipate that significant declines in the real estate markets in our primary market area would hurt our business and would mean that collateral for our loans would hold less value. As a result, our ability to recover on defaulted loans by selling the underlying real estate would be diminished, and we would be more likely to suffer losses on defaulted loans. The events and conditions described in this risk factor could therefore have a material adverse effect on our business, results of operations and financial condition.
40
Our construction lending exposes us to significant risk.
Our construction loan portfolio, which totaled $106.8 million, or 7.30% of loans, net, at June 30, 2017 , includes residential and non-residential construction and development loans. This type of lending is generally considered to have more complex credit risks than traditional single-family residential lending because the principal is concentrated in a limited number of loans with repayment dependent on the successful completion and sale, leasing, or operation of the related real estate project. Consequently, these loans are often more sensitive to adverse conditions in the real estate market or the general economy than other real estate loans. These loans are generally less predictable and more difficult to evaluate and monitor and collateral may be difficult to dispose of in a market decline. Additionally, we may experience significant construction loan losses because independent appraisers or project engineers inaccurately estimate the cost and value of construction loan projects.
Deterioration in our construction portfolio could result in increases in the provision for loan losses and an increase in charge-offs, all of which could have a material adverse effect on our financial condition and results of operations.
Our loan portfolio possesses increased risk due to our percentage of commercial real estate and commercial business loans.
At June 30, 2017, 58.1 % of our loans, net, consisted of commercial real estate and commercial business loans to small and mid-sized businesses, generally located in our primary market area, which are the types of businesses that have a heightened vulnerability to local economic conditions. Over the last ten years, we have increased this type of lending from 49.3% of our portfolio at June 30, 2007, in order to improve the yield on our assets. At June 30, 2017, our loan portfolio included $603.9 million of commercial real estate loans and $247.2 million of commercial business loans compared to $77.7 million and $76.1 million, respectively, at June 30, 2007. The credit risk related to these types of loans is considered to be greater than the risk related to one- to four-family residential loans because the repayment of commercial real estate loans and commercial business loans typically is dependent on the successful operation and income stream of the borrower's business or the real estate securing the loans as collateral, which can be significantly affected by economic conditions. Additionally, commercial loans typically involve larger loan balances to single borrowers or groups of related borrowers compared to residential real estate loans. Commercial loans not collateralized by real estate are often secured by collateral that may depreciate over time, be difficult to appraise and fluctuate in value (such as accounts receivable, inventory and equipment). If loans that are collateralized by real estate become troubled and the value of the real estate has been significantly impaired, then we may not be able to recover the full contractual amount of principal and interest that we anticipated at the time we originated the loan, which could require us to increase our provision for loan losses and adversely affect our operating results and financial condition.
Several of our commercial borrowers have more than one commercial real estate or business loan outstanding with us. Consequently, an adverse development with respect to one loan or one credit relationship can expose us to significantly greater risk of loss compared to an adverse development with respect to any one- to four-family residential mortgage loan. Finally, if we foreclose on a commercial real estate loan, our holding period for the collateral, if any, typically is longer than for one- to four-family residential property because there are fewer potential purchasers of the collateral. Since we plan to continue to increase our originations of these loans, it may be necessary to increase the level of our allowance for loan losses due to the increased risk characteristics associated with these types of loans. Any increase to our allowance for loan losses would adversely affect our earnings. Any delinquent payments or the failure to repay these loans would hurt our earnings.
Included in the commercial real estate loans described above are agricultural real estate loans totaling $140.0 million, or 10.0 % of our loan portfolio, net, at June 30, 2017. Agricultural real estate lending involves a greater degree of risk and typically involves larger loans to single borrowers than lending on single-family residences. Payments on agricultural real estate loans are dependent on the profitable operation or management of the farm property securing the loan. The success of the farm may be affected by many factors outside the control of the farm borrower, including adverse weather conditions that prevent the planting of a crop or limit crop yields (such as hail, drought and floods), loss of livestock due to disease or other factors, declines in market prices for agricultural products (both domestically and internationally) and the impact of government regulations (including changes in price supports, subsidies and environmental regulations). In addition, many farms are dependent on a limited number of key individuals whose injury or death may significantly affect the successful operation of the farm. If the cash flow from a farming operation is diminished, the borrower's ability to repay the loan may be impaired. The primary agricultural activity in our market areas is livestock, dairy, poultry, rice, timber, soybeans,
41
wheat, melons, corn, and cotton . Accordingly, adverse circumstances affecting these activities could have an adverse effect on our agricultural real estate loan portfolio. Our agricultural real estate lending has grown significantly since June 30, 2007, when these loans totaled $9.1 million, or 2.9 % of our loan portfolio.
Included in the commercial business loans described above are agricultural production and equipment loans. At June 30, 2017, these loans totaled $85.7 million, or 6.2%, of our loan portfolio, net. As with agricultural real estate loans, the repayment of operating loans is dependent on the successful operation or management of the farm property. The same risk applies to agricultural operating loans which are unsecured or secured by rapidly depreciating assets such as farm equipment or assets such as livestock or crops. Any repossessed collateral for a defaulted loan may not provide an adequate source of repayment of the outstanding loan balance as a result of the greater likelihood of damage, loss or depreciation to the collateral. Our agricultural operating loans have also grown significantly since June 30, 2007, when such loans totaled $15.9 million, or 5.1% of our loan portfolio.
Lack of seasoning of our commercial real estate and commercial business loan portfolios may increase the risk of credit defaults in the future.
Due to our increasing emphasis on commercial real estate and commercial business lending, a substantial amount of the loans in our commercial real estate and commercial business portfolios and our lending relationships are of relatively recent origin. In general, loans do not begin to show signs of credit deterioration or default until they have been outstanding for some period of time, a process referred to as "seasoning." A portfolio of older loans will usually behave more predictably than a newer portfolio. As a result, because a large portion of our loan portfolio is relatively new, the current level of delinquencies and defaults may not be representative of the level that will prevail when the portfolio becomes more seasoned, which may be higher than current levels. If delinquencies and defaults increase, we may be required to increase our provision for loan losses, which would adversely affect our results of operations and financial condition.
As we approach thresholds defined in interagency guidance on commercial real estate concentrations, we may incur additional expense or slow the growth of certain categories of commercial real estate lending.
The federal banking agencies have issued guidance on sound risk management practices for concentrations in commercial real estate lending (see "REGULATION"). For the purposes of this guidance, "commercial real estate" includes, among other types, multifamily residential loans and non-owner occupied nonresidential loans, two categories which have been a source of loan growth for the Company. A bank that has experienced rapid growth in commercial real estate lending, has notable exposure to a specific type of commercial real estate loan, or is approaching or exceeding the following supervisory criteria may be identified for further supervisory analysis with respect to real estate concentration risk: total loans for construction land development and other land representing 100% or more of the bank's total capital; or total commercial real estate loans (as defined in the guidance) that exceed 300% of the bank's total capital and the bank's commercial real estate portfolio has increased by 50% or more during the prior 36 months. During fiscal 2017, the Bank exceeded the 300% threshold for non-owner occupied commercial real estate loans as a percentage of total regulatory capital for the first time at September 30, 2016, and remained above the threshold for most of the fiscal year, before declining to 271% at June 30, 2017. The Bank's highest level during the fiscal year was 303% at December 31, 2016. The lower level at June 30, 2017, was the result of additional capital invested in the Bank by the Company following the June at-the-market common stock offering completed by the Company, and from additional capital resulting from the acquisition and merger of Tammcorp, Inc., and its bank subsidiary, Capaha Bank, with and into Southern Missouri Bancorp, Inc., while Capaha Bank held a lower percentage of its loans in non-owner occupied commercial real estate loans. The Company's non-owner occupied commercial real estate loans peaked at 293% of total regulatory capital at December 31, 2016, before declining to 256% at June 30, 2017, with this decline also attributable to additional capital provided by the at-the-market common offering completed by the Company in June, as well as the Tammcorp, Inc., acquisition. The Company may again see its non-owner occupied commercial real estate lending grow as a percentage of total regulatory capital, or it may slow the growth of this type of lending activity. Should we continue to grow this category of our loan portfolio, we may incur additional expense to meet the heightened supervisory expectations related to this lending activity. If we slow the growth of commercial real estate loans generally, or particular concentrations of borrowers or categories of properties within that definition, we may be negatively impacted in terms of our asset growth, earnings, leverage, or other targets.
Changes in interest rates may negatively affect our earnings and the value of our assets.
Our earnings and cash flows depend substantially upon our net interest income. Net interest income is the difference between interest income earned on interest-earnings assets, such as loans and investment securities, and interest expense paid on interest-bearing liabilities, such as deposits and borrowed funds. Interest rates are sensitive to many factors that are beyond our control, including general economic conditions, competition and policies of
42
various governmental and regulatory agencies and, in particular, the policies of the Federal Reserve Board. Changes in monetary policy, including changes in interest rates, could influence not only the interest we receive on loans and investment securities and the amount of interest we pay on deposits and borrowings, but these changes could also affect: (i) our ability to originate loans and obtain deposits; (ii) the fair value of our financial assets and liabilities, including our securities portfolio; and (iii) the average duration of our interest-earning assets. This also includes the risk that interest-earning assets may be more responsive to changes in interest rates than interest-bearing liabilities, or vice versa (repricing risk), the risk that the individual interest rates or rate indices underlying various interest-earning assets and interest-bearing liabilities may not change in the same degree over a given time period (basis risk), and the risk of changing interest rate relationships across the spectrum of interest-earning asset and interest-bearing liability maturities (yield curve risk), including a prolonged flat or inverted yield curve environment. Any substantial, unexpected, prolonged change in market interest rates could have a material adverse effect on our financial condition and results of operations.
Liquidity risk could impair our ability to fund operations and jeopardize our financial condition.
Liquidity is essential to our business. An inability to raise funds through deposits, borrowings, the sale of loans and other sources could have a substantial negative effect on our liquidity. Our access to funding sources in amounts adequate to finance our activities or the terms of which are acceptable to us could be impaired by factors that affect us specifically or the financial services industry or economy in general. Factors that could detrimentally impact our access to liquidity sources include a decrease in the level of our business activity as a result of a downturn in the markets in which our loans are concentrated or an adverse regulatory action against us. Our ability to borrow could also be impaired by factors that are not specific to us, such as a disruption in the financial markets or negative views and expectations about the prospects for the financial services industry generally.
We have pursued a strategy of supplementing internal growth by acquiring other financial companies or their assets and liabilities that we believe will help fulfill our strategic objectives and enhance our earnings. There are risks associated with this strategy, including the following:
· | We may be exposed to potential asset quality issues or unknown or contingent liabilities of the banks, businesses, assets and liabilities we acquire. If these issues or liabilities exceed our estimates, our results of operations and financial condition may be adversely affected; |
· | Prices at which acquisitions can be made fluctuate with market conditions. We have experienced times during which acquisitions could not be made in specific markets at prices we considered acceptable and expect that we will experience this condition in the future; |
· | The acquisition of other entities generally requires integration of systems, procedures and personnel of the acquired entity into us to make the transaction economically successful. This integration process is complicated and time consuming and can also be disruptive to the customers of the acquired business. If the integration process is not conducted successfully and with minimal effect on the acquired business and its customers, we may not realize the anticipated economic benefits of particular acquisitions within the expected time frame, and we may lose customers or employees of the acquired business. We may also experience greater than anticipated customer losses even if the integration process is successful. |
· | To the extent our costs of an acquisition exceed the fair value of the net assets acquired, the acquisition will generate goodwill. We are required to assess our goodwill for impairment at least annually, and any goodwill impairment charge could have a material adverse effect on our results of operations and financial condition; |
· | To finance an acquisition, we may borrow funds, thereby increasing our leverage and diminishing our liquidity, or raise additional capital, which could dilute the interests of our existing shareholders; and |
· | We have completed three acquisitions within the past five years and opened additional banking offices in the past few years that enhanced our rate of growth. We do not necessarily expect to be able to maintain our past rate of growth, and may not be able to grow at all in the future. |
43
Our growth or future losses may require us to raise additional capital in the future, but that capital may not be available when it is needed or the cost of that capital may be very high.
We are required by federal and state regulatory authorities to maintain adequate levels of capital to support our operations. While we anticipate that our capital resources will satisfy our capital requirements for the foreseeable future, we may at some point need to raise additional capital to support our operations or continued growth, both internally and through acquisitions. Any capital we obtain may result in the dilution of the interests of existing holders of our common stock, or otherwise adversely affect your investment.
Our ability to raise additional capital, if needed, will depend on conditions in the capital markets at that time, which are outside our control, and on our financial condition and performance. Accordingly, we cannot make assurances of our ability to raise additional capital if needed, or if the terms will be acceptable to us. If we cannot raise additional capital when needed, our ability to further expand our operations through internal growth and acquisitions could be materially impaired and our financial condition and liquidity could be materially and adversely affected.
Legislative or regulatory changes or actions, or significant litigation, could adversely impact us or the businesses in which we are engaged.
The financial services industry is extensively regulated. We are subject to extensive state and federal regulation, supervision and legislation that govern almost all aspects of our operations. Laws and regulations may change from time to time and are primarily intended for the protection of consumers, depositors and the deposit insurance funds, and not to benefit our shareholders. The impact of any changes to laws and regulations or other actions by regulatory agencies may negatively impact us or our ability to increase the value of our business. Regulatory authorities have extensive discretion in connection with their supervisory and enforcement activities, including the imposition of restrictions on the operation of an institution, the classification of assets by the institution and the adequacy of an institution's allowance for loan losses. Additionally, actions by regulatory agencies or significant litigation against us could require us to devote significant time and resources to defending our business and may lead to penalties that materially affect us and our shareholders.
Impairment of investment securities, other intangible assets, or deferred tax assets could require charges to earnings, which could negatively impact our results of operations.
In assessing the impairment of investment securities, we consider the length of time and extent to which the fair value of the securities has been less than the cost of the securities, the financial condition and near-term prospects of the issuers, whether the market decline was affected by macroeconomic conditions and whether we have the intent to sell the debt security or will be required to sell the debt security before its anticipated recovery. In fiscal 2009, we incurred charges to recognize the other-than-temporary impairment (OTTI) of available-for-sale investments related to investments in Freddie Mac preferred stock ($304,000 impairment realized in the first quarter of fiscal 2009) and a pooled trust preferred collateralized debt obligation, Trapeza CDO IV, Ltd., class C2 ($375,000 impairment realized in the second quarter of fiscal 2009). We currently hold three additional collateralized debt obligations (CDOs) which have not been deemed other-than-temporarily impaired, based on our best judgment using information currently available.
Under current accounting standards, goodwill and certain other intangible assets with indeterminate lives are no longer amortized but, instead, are assessed for impairment periodically or when impairment indicators are present. As of June 30, 2017, we determined that none of our goodwill or other intangible assets was impaired.
Deferred tax assets are only recognized to the extent it is more likely than not they will be realized. Should our management determine it is not more likely than not that the deferred tax assets will be realized, a valuation allowance with a charge to earnings would be reflected in the period. At June 30, 2017, our net deferred tax asset was $1.9 million, none of which was disallowed for regulatory capital purposes. Based on the levels of taxable income in prior years and our expectation of profitability in the current year and future years, management has determined that no valuation allowance was required at June 30, 2017. If we are required in the future to take a valuation allowance with respect to our deferred tax asset, our financial condition, results of operations and regulatory capital levels would be negatively affected.
The soundness of other financial institutions could adversely affect us.
Our ability to engage in routine funding transactions could be adversely affected by the actions and commercial soundness of other financial institutions. Financial services institutions are interrelated as a result of
44
trading, clearing, counterparty or other relationships. We have exposure to many different industries and counterparties, and we routinely execute transactions with counterparties in the financial industry. As a result, defaults by, or even rumors or questions about, one or more financial services institutions, or the financial services industry generally, have led to market-wide liquidity problems and could lead to losses or defaults by us or by other institutions. Many of these transactions expose us to credit risk in the event of default of our counterparty or client. In addition, our credit risk may be exacerbated when the collateral we hold cannot be realized upon or is liquidated at prices insufficient to recover the full amount of the loan. We cannot assure you that any such losses would not materially and adversely affect our business, financial condition or results of operations.
Non-compliance with USA Patriot Act, Bank Secrecy Act, or other laws and regulations could result in fines or sanctions.
The USA Patriot and Bank Secrecy Acts require financial institutions to develop programs to prevent financial institutions from being used for money laundering and terrorist activities. If such activities are detected, financial institutions are obligated to file suspicious activity reports with the U.S. Treasury's Office of Financial Crimes Enforcement Network. These rules require financial institutions to establish procedures for identifying and verifying the identity of customers seeking to open new financial accounts. Failure to comply with these regulations could result in fines or sanctions. Several banking institutions have received large fines for non-compliance with these laws and regulations. Although we have developed policies and procedures designed to assist in compliance with these laws and regulations, no assurance can be given that these policies and procedures will be effective in preventing violations of these laws and regulations.
We operate in a highly regulated environment and may be adversely affected by changes in federal and state laws and regulations, some of which is expected to increase our costs of operations.
We are currently subject to extensive examination, supervision and comprehensive regulation by the FDIC and the DFI and by the Federal Reserve. The FDIC, DFI and the Federal Reserve govern the activities in which we may engage, primarily for the protection of depositors and the Deposit Insurance Fund. These regulatory authorities have extensive discretion, including the ability to restrict an institution's operations, require the institution to reclassify assets, determine the adequacy of the institution's allowance for loan losses and determine the level of deposit insurance premiums assessed. Any change in such regulation and oversight, whether in the form of regulatory policy, new regulations or legislation or additional deposit insurance premiums could have a material adverse impact on our operations. Because our business is highly regulated, the laws and applicable regulations are subject to frequent change. Any new laws, rules and regulations could make compliance more difficult or expensive or otherwise adversely affect our business, financial condition or growth prospects. Such changes could subject us to additional costs, limit the types of financial services and products we may offer and/or increase the ability of non-banks to offer competing financial services and products, among other things.
The Dodd-Frank Act has significantly changed the bank regulatory structure and will affect the lending, deposit, investment, trading and operating activities of financial institutions and their holding companies. The Dodd-Frank Act requires various federal agencies to adopt a broad range of new implementing rules and regulations, and to prepare numerous studies and reports for Congress. The federal agencies are given significant discretion in drafting and implementing rules and regulations, and consequently, many of the details and much of the impact of the Dodd-Frank Act may not be known for many months or years.
Certain provisions of the Dodd-Frank Act are expected to have a near term impact on us. For example, a provision of the Dodd-Frank Act eliminates the federal prohibition on paying interest on demand deposits, thus allowing businesses to have interest bearing checking accounts. Depending on competitive responses, this significant change to existing law could have an adverse impact on our interest expense.
The Dodd-Frank Act created a new Consumer Financial Protection Bureau with broad powers to supervise and enforce consumer protection laws. The Consumer Financial Protection Bureau has broad rule-making authority for a wide range of consumer protection laws that apply to all banks and savings institutions, including the authority to prohibit "unfair, deceptive or abusive" acts and practices. The Consumer Financial Protection Bureau has examination and enforcement authority over all banks and savings institutions with more than $10 billion in assets. Financial institutions, such as our subsidiary banks, with $10 billion or less in assets continue to be examined for compliance with the consumer laws by their primary bank regulators.
It is difficult to predict at this time what specific impact the Dodd-Frank Act and the yet to be written implementing rules and regulations will have on community banks. However, it is expected that at a minimum they will increase our operating and compliance costs and could increase our interest expense. Any additional changes in
45
our regulation and oversight, whether in the form of new laws, rules or regulations, could make compliance more difficult or expensive or otherwise materially adversely affect our business, financial condition or prospects.
Significant legal actions could subject us to substantial liabilities.
We are from time to time subject to claims related to our operations. These claims and legal actions, including supervisory actions by our regulators, could involve large monetary claims and significant defense costs. As a result, we may be exposed to substantial liabilities, which could adversely affect our results of operations and financial condition.
Our future success is dependent on our ability to compete effectively in the highly competitive banking industry.
We face substantial competition in all phases of our operations from a variety of competitors. Our future growth and success will depend on our ability to compete effectively in this highly competitive environment. To date, we have grown our business successfully by focusing on our business lines in geographic markets and emphasizing the high level of service and responsiveness desired by our customers. We compete for loans, deposits and other financial services with other commercial banks, thrifts, credit unions, brokerage houses, mutual funds, insurance companies and specialized finance companies. Many of our competitors offer products and services that we do not offer, and many have substantially greater resources and lending limits, name recognition and market presence that benefit them in attracting business. In addition, larger competitors may be able to price loans and deposits more aggressively than we do, and smaller newer competitors may also be more aggressive in terms of pricing loan and deposit products than we are in order to obtain a share of the market. Some of the financial institutions and financial services organizations with which we compete are not subject to the same degree of regulation as is imposed on bank holding companies, federally insured state-chartered banks, national banks and federal savings banks. As a result, these nonbank competitors have certain advantages over us in accessing funding and in providing various services.
We are subject to security and operational risks relating to our use of technology that could damage our reputation and business.
Security breaches in our internet banking activities could expose us to possible liability and damage our reputation. Any compromise of our security also could deter customers from using our internet banking services that involve the transmission of confidential information. We rely on standard internet security systems to provide the security and authentication necessary to effect secure transmission of data. These precautions may not protect our systems from compromises or breaches of our security measures, which could damage our reputation and business.
Risks Relating to Our Common Stock
The price of our common stock may fluctuate significantly, and this may make it difficult for you to resell our common stock when you want or at prices you find attractive.
We cannot predict how our common stock will trade in the future. The market value of our common stock will likely continue to fluctuate in response to a number of factors including the following, most of which are beyond our control, as well as the other factors described in this "Risk Factors" section:
· | actual or anticipated quarterly fluctuations in our operating and financial results; |
· | developments related to investigations, proceedings or litigation; |
· | changes in financial estimates and recommendations by financial analysts; |
· | dispositions, acquisitions and financings; |
· | actions of our current shareholders, including sales of common stock by existing shareholders and our directors and executive officers; |
· | fluctuations in the stock prices and operating results of our competitors; |
· | regulatory developments; and |
· | other developments in the financial services industry. |
46
The market value of our common stock may also be affected by conditions affecting the financial markets in general, including price and trading fluctuations. These conditions may result in (i) volatility in the level of, and fluctuations in, the market prices of stocks generally and, in turn, our common stock and (ii) sales of substantial amounts of our common stock in the market, in each case that could be unrelated or disproportionate to changes in our operating performance. These broad market fluctuations may adversely affect the market value of our common stock.
There may be future sales of additional common stock or other dilution of our shareholders' equity, which may adversely affect the market price of our common stock.
We are not restricted from issuing additional common stock, including any securities that are convertible into or exchangeable for, or that represent the right to receive, common stock or any substantially similar securities. The market value of our common stock could decline as a result of sales by us of a large number of shares of common stock or similar securities in the market or the perception that such sales could occur.
We may issue debt and equity securities that are senior to our common stock as to distributions and in liquidation, which could negatively affect the value of our common stock.
In the future, we may increase our capital resources by entering into debt or debt-like financing or issuing debt or equity securities, which could include issuances of senior notes, subordinated notes, preferred stock or common stock. In the event of the liquidation of Southern Missouri Bancorp, Inc. its lenders and holders of its debt or preferred securities would receive a distribution of the Southern Missouri Bancorp, Inc.'s available assets before distributions to the holders of our common stock. Our decision to incur debt and issue other securities in future offerings will depend on market conditions and other factors beyond our control. We cannot predict or estimate the amount, timing or nature of our future offerings and debt financings. Future offerings could reduce the value of our common stock and dilute the interests of our shareholders.
Regulatory and contractual restrictions may limit or prevent us from paying dividends on and repurchasing our common stock.
Southern Missouri Bancorp, Inc. is an entity separate and distinct from its subsidiary bank, and derives substantially all of its revenue in the form of dividends from the subsidiary. Accordingly, the Company is and will be dependent upon dividends from its subsidiary bank to pay the principal of and interest on its indebtedness, to satisfy its other cash needs and to pay dividends on its common and preferred stock. The bank's ability to pay dividends is subject to its ability to earn net income and to meet certain regulatory requirements. In the event the subsidiary bank is unable to pay dividends to the Company, the Company may not be able to pay dividends on its common or preferred stock. Also, the Company's right to participate in a distribution of assets upon the subsidiary's liquidation or reorganization is subject to the prior claims of the subsidiary's creditors. In addition, holders of our common stock are entitled to receive dividends only when, as and if declared by our board of directors. Although we have historically paid cash dividends on our common stock, we are not required to do so and our board of directors could reduce, suspend or eliminate our common stock cash dividend in the future.
If we defer interest payments on our outstanding junior subordinated debt securities or if certain defaults relating to those debt securities occur, we will be prohibited from declaring or paying dividends or distributions on, and from making liquidation payments with respect to, our common stock.
As of June 30, 2017, we had outstanding $16.8 million aggregate principal amount of junior subordinated debt securities issued in connection with the sale of trust preferred securities by subsidiaries of ours that are statutory business trusts. As of that date, those debt securities were carried at a fair value of $14.8 million.
We guarantee the trust preferred securities described above. The indenture under which the junior subordinated debt securities were issued, together with the guarantee, prohibits us, subject to limited exceptions, from declaring or paying any dividends or distributions on, or redeeming, repurchasing, acquiring or making any liquidation payments with respect to, any of our capital stock at any time when (i) there shall have occurred and be continuing an event of default under the indenture; or (ii) we are in default with respect to payment of any obligations under the guarantee; or (iii) we have elected to defer payment of interest on the junior subordinated debt securities. In that regard, we are entitled, at our option but subject to certain conditions, to defer payments of interest on the junior subordinated debt securities from time to time for up to five years.
47
Events of default under the indenture generally consist of our failure to pay interest on the junior subordinated debt securities under certain circumstances, our failure to pay any principal of or premium on such junior subordinated debt securities when due, our failure to comply with certain covenants under the indenture, and certain events of bankruptcy, insolvency or liquidation relating to us.
As a result of these provisions, if we were to elect to defer payments of interest on the junior subordinated debt securities, or if any of the other events described in clause (i) or (ii) of the first paragraph of this risk factor were to occur, we would be prohibited from declaring or paying any dividends on our common stock, from redeeming, repurchasing or otherwise acquiring any of our common stock, and from making any payments to holders of our common stock in the event of our liquidation, which would likely have a material adverse effect on the market value of our common stock. Moreover, without notice to or consent from the holders of our common stock, we may issue additional series of junior subordinated debt securities in the future with terms similar to those of our existing junior subordinated debt securities or enter into other financing agreements that limit our ability to purchase or to pay dividends or distributions on our capital stock, including our common stock.
Anti-takeover provisions could negatively impact our shareholders.
Provisions of our articles of incorporation and bylaws, Missouri law and various other factors may make it more difficult for companies or persons to acquire control of us without the consent of our board of directors. These provisions include limitations on voting rights of beneficial owners of more than 10% of our common stock, the election of directors to staggered terms of three years and not permitting cumulative voting in the election of directors. Our bylaws also contain provisions regarding the timing and content of shareholder proposals and nominations for service on the Board of Directors.
Item 1B. Unresolved Staff Comments
None.
Item 2. Description of Properties
At June 30, 2017, the Bank operated from its headquarters, 38 full-service branch offices, and three limited-service branch offices. The Bank owns the office building and related land in which its headquarters are located, and 36 of its other branch offices. The remaining five branches are either leased or partially owned.
For additional information regarding our properties, see "Part II, Item 8. Financial Statements and Supplementary Data – Notes to Consolidated Financial Statements – Note 5 – Premises and Equipment".
During fiscal 2016, two significant construction projects were completed. The first project provided a facility to serve as a new corporate headquarters and a full service office, in Poplar Bluff, Missouri. Following completion of the project, the Bank's previous headquarters converted to serve as a full-service branch. The second project renovated leased space in a new branch facility in Springfield to replace an existing leased branch. Management believes that our current facilities are adequate to meet our present and immediately foreseeable needs. However, we will continue to monitor customer growth and expand our branching network, if necessary, to serve our customers' needs.
Item 3. Legal Proceedings
In the opinion of management, the Bank is not a party to any pending claims or lawsuits that are expected to have a material effect on the Bank's financial condition or operations. Periodically, there have been various claims and lawsuits involving the Bank mainly as a defendant, such as claims to enforce liens, condemnation proceedings on properties in which the Bank holds security interests, claims involving the making and servicing of real property loans and other issues incident to the Bank's business. Aside from such pending claims and lawsuits, which are incident to the conduct of the Bank's ordinary business, the Bank is not a party to any material pending legal proceedings that would have a material effect on the financial condition or operations of the Bank.
Item 4. Mine Safety Disclosures
Not applicable.
48
PART II
Item 5. Market for the Registrant's Common Equity, Related Stockholder Matters and Issuer Purchases of
Equity Securities
The common stock of Southern Missouri Bancorp, Inc. is traded under the symbol "SMBC" on the Nasdaq Global Market. The table below shows the high and low closing prices for our common stock for the periods indicated. This information was provided by the Nasdaq. At June 30, 2017, there were 8,591,363 shares of common stock outstanding and approximately 243 common stockholders of record.
Stock Price | Dividends | |||||||||||
2017 Quarters: | High | Low | per Share | |||||||||
Fourth Quarter (ended 6/30/2017) | $ | 35.49 | $ | 30.97 | $ | 0.100 | ||||||
Third Quarter (ended 3/31/2017) | 36.73 | 31.54 | 0.100 | |||||||||
Second Quarter (ended 12/31/2016) | 36.59 | 24.30 | 0.100 | |||||||||
First Quarter (ended 9/30/2016) | 25.20 | 23.84 | 0.100 | |||||||||
2016 Quarters: | ||||||||||||
Fourth Quarter (ended 6/30/2016) | $ | 24.86 | $ | 22.79 | $ | 0.090 | ||||||
Third Quarter (ended 3/31/2016) | 24.02 | 22.95 | 0.090 | |||||||||
Second Quarter (ended 12/31/2015) | 24.40 | 21.26 | 0.090 | |||||||||
First Quarter (ended 9/30/2015) | 21.50 | 18.75 | 0.090 | |||||||||
2015 Quarters: | ||||||||||||
Fourth Quarter (ended 6/30/2015) | $ | 19.49 | $ | 18.44 | $ | 0.085 | ||||||
Third Quarter (ended 3/31/2015) | 19.95 | 18.11 | 0.085 | |||||||||
Second Quarter (ended 12/31/2014) | 20.57 | 17.54 | 0.085 | |||||||||
First Quarter (ended 9/30/2014) | 18.05 | 17.40 | 0.085 | |||||||||
Our cash dividend payout policy is continually reviewed by management and the Board of Directors. The Company intends to continue its policy of paying quarterly dividends; however, future dividend payments will depend upon a number of factors, including capital requirements, regulatory limitations (See "Item 1. Description of Business – Regulation"), the Company's financial condition, results of operations and the Bank's ability to pay dividends to the Company. The Company relies significantly upon such dividends originating from the Bank to accumulate earnings for payment of cash dividends to stockholders. See "Item 1A. Risk Factors – Risks Relating to our Common Stock – Regulatory and Contractual Restrictions may limit or prevent us from paying dividends on and repurchasing our common stock."
Information regarding our equity compensation plans is included in Part II, Item 11 of this Form 10-K.
On January 2, 2015, the Company declared a two-for-one common stock split in the form of 100% common stock dividend payable on January 30, 2015, to shareholders of record on January 16, 2015. The table above, and all references to stock prices and per share information throughout this annual report on Form 10-K, reflect this split for all periods.
The following table summarizes the Company's stock repurchase activity for each month during the three months ended June 30, 2017.
Total # of Shares Purchased | Average Price Paid Per Share | Total # of Shares Purchased as Part of a Publicly Announced Program | Maximum Number of Shares That May Yet Be Purchased | |||||||||||||
06/01/17 - 06/30/17 period | - | - | - | - | ||||||||||||
05/01/17 - 05/31/17 period | - | - | - | - | ||||||||||||
04/01/17 - 04/30/17 period | - | - | - | - | ||||||||||||
49
The following graph and related discussion are being furnished solely to accompany this Annual Report on Form 10-K pursuant to Item 201(e) of Regulation S-K and shall not be deemed to be "soliciting materials" or to be "filed" with the SEC (other than as provided in Item 201) nor shall this information be incorporated by reference into any future filing under the Securities Act or the Exchange Act, whether made before or after the date hereof and irrespective of any general incorporation language contained therein, except to the extent that the Company specifically incorporates it by reference into a filing.
The following graph shows a comparison of stockholder return on Southern Missouri Bancorp, Inc.'s common stock with the cumulative total returns for as shown below the graph, which was compiled by S&P Global Market Intellegience, a division of S&P Global, Inc. The graph assumes an initial investment of $100 and reinvestment of dividends. The graph is historical only and may not be indicative of possible future performance.
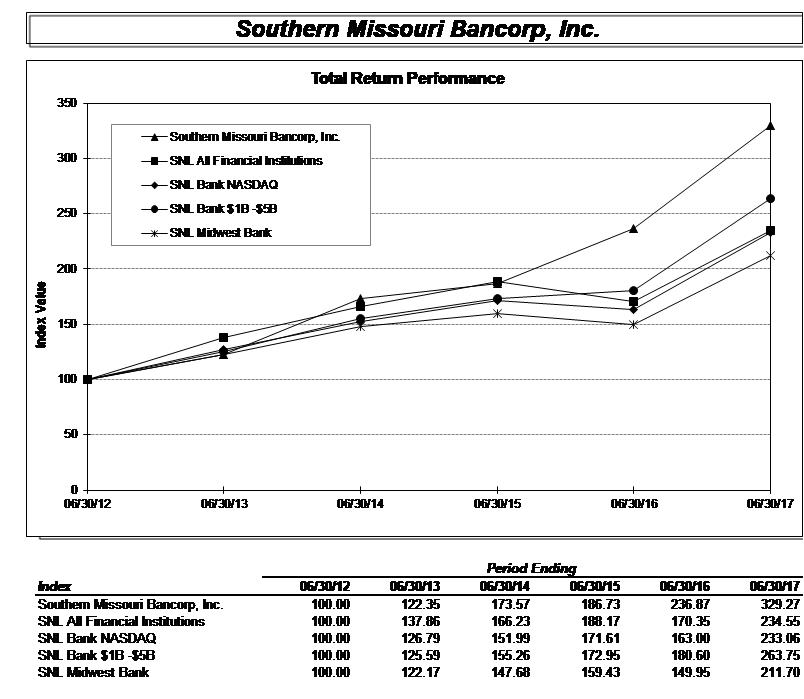
50
Item 6. Selected Financial Data
(Dollars in thousands) | At June 30, | |||||||||||||||||||
Financial Condition Data : | 2017 | 2016 | 2015 | 2014 | 2013 | |||||||||||||||
Total assets | $ | 1,707,712 | $ | 1,403,910 | $ | 1,300,064 | $ | 1,021,422 | $ | 796,391 | ||||||||||
Loans receivable, net | 1,397,730 | 1,135,453 | 1,053,146 | 801,056 | 647,166 | |||||||||||||||
Mortgage-backed securities | 78,275 | 71,231 | 70,054 | 58,151 | 16,714 | |||||||||||||||
Cash, interest-bearing deposits | ||||||||||||||||||||
and investment securities | 97,674 | 81,270 | 78,258 | 88,658 | 77,059 | |||||||||||||||
Deposits | 1,455,597 | 1,120,693 | 1,055,242 | 785,801 | 632,379 | |||||||||||||||
Borrowings | 56,849 | 137,301 | 92,126 | 111,033 | 52,288 | |||||||||||||||
Subordinated debt | 14,848 | 14,753 | 14,658 | 9,727 | 7,217 | |||||||||||||||
Stockholder's equity | 173,083 | 125,966 | 132,643 | 111,111 | 101,829 | |||||||||||||||
(Dollars in thousands, except per share data) | For the Year Ended June 30, | |||||||||||||||||||
Operating Data : | 2017 | 2016 | 2015 | 2014 | 2013 | |||||||||||||||
Interest income | $ | 61,488 | $ | 56,317 | $ | 55,301 | $ | 40,471 | $ | 36,291 | ||||||||||
Interest expense | 10,366 | 9,365 | 8,766 | 7,485 | 7,501 | |||||||||||||||
Net interest income | 51,122 | 46,952 | 46,535 | 32,986 | 28,790 | |||||||||||||||
Provision for loan losses | 2,340 | 2,494 | 3,185 | 1,646 | 1,716 | |||||||||||||||
Net interest income after | ||||||||||||||||||||
provision for loan losses | 48,782 | 44,458 | 43,350 | 31,340 | 27,074 | |||||||||||||||
Noninterest income | 11,084 | 9,758 | 8,659 | 6,132 | 4,468 | |||||||||||||||
Noninterest expense | 38,252 | 32,686 | 32,285 | 23,646 | 17,521 | |||||||||||||||
Income before income taxes | 21,614 | 21,530 | 19,724 | 13,826 | 14,021 | |||||||||||||||
Income taxes | 6,062 | 6,682 | 6,056 | 3,745 | 3,954 | |||||||||||||||
Net Income | 15,552 | 14,848 | 13,668 | 10,081 | 10,067 | |||||||||||||||
Less: charge for early redemption of preferred | ||||||||||||||||||||
stock issued at a discount | --- | --- | --- | --- | --- | |||||||||||||||
Less: effective dividend on preferred stock | --- | 85 | 200 | 200 | 345 | |||||||||||||||
Net income available to common stockholders | $ | 15,552 | $ | 14,763 | $ | 13,468 | $ | 9,881 | $ | 9,722 | ||||||||||
Basic earnings per share available to | ||||||||||||||||||||
common stockholders (2) | $ | 2.08 | $ | 1.99 | $ | 1.84 | $ | 1.49 | $ | 1.48 | ||||||||||
Diluted earnings per share available to | ||||||||||||||||||||
common stockholders (2) | $ | 2.07 | $ | 1.98 | $ | 1.79 | $ | 1.45 | $ | 1.44 | ||||||||||
Dividends per share (2) | $ | 0.40 | $ | 0.36 | $ | 0.34 | $ | 0.32 | $ | 0.30 | ||||||||||
51
At June 30, | ||||||||||||||||||||
Other Data : | 2017 | 2016 | 2015 | 2014 | 2013 | |||||||||||||||
Number of: | ||||||||||||||||||||
Real Estate Loans | 6,800 | 5,554 | 5,428 | 4,459 | 3,637 | |||||||||||||||
Deposit Accounts | 72,186 | 60,839 | 58,927 | 43,159 | 31,980 | |||||||||||||||
Full service offices | 39 | 33 | 32 | 22 | 17 | |||||||||||||||
Limited service offices | 3 | 3 | 3 | 3 | 1 | |||||||||||||||
Loan production offices | --- | --- | --- | --- | --- | |||||||||||||||
At or for the year ended June 30, | ||||||||||||||||||||
Key Operating Ratios : | 2017 | 2016 | 2015 | 2014 | 2013 | |||||||||||||||
Return on assets (net income | ||||||||||||||||||||
divided by average assets) | 1.05 | % | 1.11 | % | 1.07 | % | 1.09 | % | 1.32 | % | ||||||||||
Return on average common equity (net | ||||||||||||||||||||
income available to common stockholders | ||||||||||||||||||||
divided by average common equity) | 11.70 | 12.34 | 12.48 | 11.55 | 12.34 | |||||||||||||||
Average equity to average assets | 8.96 | 9.40 | 10.04 | 11.43 | 12.92 | |||||||||||||||
Interest rate spread (spread between | ||||||||||||||||||||
weighted average rate on all interest-earning | ||||||||||||||||||||
assets and all interest-bearing liabilities) | 3.64 | 3.69 | 3.81 | 3.68 | 3.85 | |||||||||||||||
Net interest margin (net interest income as a | ||||||||||||||||||||
percentage of average interest-earning assets | 3.74 | 3.80 | 3.92 | 3.81 | 4.02 | |||||||||||||||
Noninterest expense to average assets | 2.58 | 2.45 | 2.53 | 2.56 | 2.29 | |||||||||||||||
Average interest-earning assets to | ||||||||||||||||||||
average interest-bearing liabilities | 113.13 | 114.38 | 115.39 | 114.26 | 116.68 | |||||||||||||||
Allowance for loan losses to gross loans (1) | 1.10 | 1.20 | 1.15 | 1.14 | 1.28 | |||||||||||||||
Allowance for loan losses to | ||||||||||||||||||||
nonperforming loans (1) | 481.65 | 243.66 | 323.35 | 663.37 | 583.41 | |||||||||||||||
Net charge-offs (recoveries) to average | ||||||||||||||||||||
outstanding loans during the period | 0.05 | 0.09 | 0.01 | 0.10 | 0.13 | |||||||||||||||
Ratio of nonperforming assets | ||||||||||||||||||||
to total assets (1) | 0.37 | 0.64 | 0.64 | 0.43 | 0.58 | |||||||||||||||
Common shareholder dividend payout ratio | ||||||||||||||||||||
(common dividends as a percentage of | ||||||||||||||||||||
earnings available to common shareholders | 19.14 | 18.12 | 18.69 | 21.44 | 20.31 | |||||||||||||||
| (1) | At end of period |
| (2) | All share and per share amounts have been adjusted for the two-for-one common stock split in the form of a 100% common stock dividend paid January 30, 2015. |
52
Item 7. Management's Discussion and Analysis of Financial Condition and Results of Operations
OVERVIEW
Southern Missouri Bancorp, Inc. is a Missouri corporation originally organized for the principal purpose of becoming the holding company of Southern Bank. The principal business of Southern Bank consists of attracting deposits from the communities it serves and investing those funds in loans secured by one- to four-family residences and commercial real estate, as well as commercial business and consumer loans. These funds have also been used to purchase investment securities, mortgage-backed securities (MBS), U.S. government and federal agency obligations and other permissible securities.
Southern Bank's results of operations are primarily dependent on the levels of its net interest margin and noninterest income, and its ability to control operating expenses. Net interest margin is dependent primarily on the difference or spread between the average yield earned on interest-earning assets (including loans, mortgage-related securities, and investments) and the average rate paid on interest-bearing liabilities (including deposits, securities sold under agreements to repurchase, and borrowings), as well as the relative amounts of these assets and liabilities. Southern Bank is subject to interest rate risk to the degree that its interest-earning assets mature or reprice at different times, or on a varying basis, from its interest-bearing liabilities.
Southern Bank's noninterest income consists primarily of fees charged on transaction and loan accounts, interchange income from customer debit and ATM card use, gains on sales of loans to the secondary market, and increased cash surrender value of bank owned life insurance ("BOLI"). Southern Bank's operating expenses include: employee compensation and benefits, occupancy expenses, legal and professional fees, federal deposit insurance premiums, amortization of intangible assets, and other general and administrative expenses.
Southern Bank's operations are significantly influenced by general economic conditions including monetary and fiscal policies of the U.S. government and the FRB. Additionally, Southern Bank is subject to policies and regulations issued by financial institution regulatory agencies including the FRB, the Missouri Division of Finance, and the FDIC. Each of these factors may influence interest rates, loan demand, prepayment rates and deposit flows. Interest rates available on competing investments as well as general market interest rates influence the Bank's cost of funds. Lending activities are affected by the demand for real estate and other types of loans, which in turn is affected by the interest rates at which such financing may be offered. Lending activities are funded through the attraction of deposit accounts consisting of checking accounts, passbook and statement savings accounts, money market deposit accounts, certificate of deposit accounts with terms of 60 months or less, securities sold under agreements to repurchase, advances from the FHLB of Des Moines, and, to a lesser extent, brokered deposits. The Bank intends to continue to focus on its lending programs for one- to four-family residential real estate, commercial real estate, commercial business and consumer financing on loans secured by properties or collateral located primarily in Missouri and Arkansas.
All share amounts and per share amounts discussed below have been adjusted for the two-for-one common stock split in the form of a 100% common stock dividend paid January 30, 2015.
CRITICAL ACCOUNTING POLICIES
The Company has established various accounting policies, which govern the application of accounting principles generally accepted in the United States of America in the preparation of our financial statements. Our significant accounting policies are described in Item 8 under the Notes to the Consolidated Financial Statements. Certain accounting policies involve significant judgments and assumptions by management that have a material impact on the carrying value of certain assets and liabilities; management considers such accounting policies to be critical accounting policies. The judgments and assumptions used by management are based on historical experience and other factors, which are believed to be reasonable under the circumstances. Because of the nature of the judgments and assumptions made by management, actual results could differ from these judgments and estimates that could have a material impact on the carrying values of assets and liabilities and the results of operations of the Company.
The allowance for losses on loans represents management's best estimate of probable losses in the existing loan portfolio. The allowance for losses on loans is increased by the provision for losses on loans charged to expense and reduced by loans charged off, net of recoveries.
53
The provision for losses on loans is determined based on management's assessment of several factors: reviews and evaluations of specific loans, changes in the nature and volume of the loan portfolio, current economic conditions and the related impact on specific borrowers and industry groups, historical loan loss experience, the level of classified and nonperforming loans and the results of regulatory examinations.
Integral to the methodology for determining the adequacy of the allowance for loan losses is portfolio segmentation and impairment measurement. Under the Company's methodology, loans are first segmented into 1) those comprising large groups of smaller-balance homogeneous loans, including single-family mortgages and installment loans, which are collectively evaluated for impairment and 2) all other loans which are individually evaluated. Those loans in the second category are further segmented utilizing a defined grading system which involves categorizing loans by severity of risk based on conditions that may affect the ability of the borrowers to repay their debt, such as current financial information, collateral valuations, historical payment experience, credit documentation, public information, and current trends. The loans subject to credit classification represent the portion of the portfolio subject to the greatest credit risk and where adjustments to the allowance for losses on loans as a result of provisions and charge-offs are most likely to have a significant impact on operations.
A periodic review of selected credits (based on loan size and type) is conducted to identify loans with heightened risk of probable losses and to assign risk grades. The primary responsibility for this review rests with the loan administration personnel. This review is supplemented with periodic examinations of both selected credits and the credit review process by applicable regulatory agencies. The information from these reviews assists management in the timely identification of problems and potential problems and provides a basis for deciding whether the credit represents a probable loss or risk that should be recognized.
Loans are considered impaired if, based on current information and events, it is probable that Southern Bank will be unable to collect the scheduled payments of principal or interest when due according to the contractual terms of the loan agreement. The measurement of impaired loans is generally based on the fair value of the collateral for collateral-dependent loans. If the loan is not collateral-dependent, the measurement of impairment is based on the present value of expected future cash flows discounted at the historical effective interest rate or the observable market price of the loan. In measuring the fair value of the collateral, management uses the assumptions (i.e., discount rates) and methodologies (i.e., comparison to the recent selling price of similar assets) consistent with those that would be utilized by unrelated third parties. Impairment identified through this evaluation process is a component of the allowance for loan losses. If a loan is not considered impaired, it is grouped together with loans having similar characteristics (i.e., the same risk grade), and an allowance for loan losses is based upon a quantitative factor (historical average charge-offs for similar loans over the past one to five years), and qualitative factors such as changes in lending policies; national, regional, and local economic conditions; changes in mix and volume of portfolio; experience, ability, and depth of lending management and staff; entry to new markets; levels and trends of delinquent, nonaccrual, special mention, and classified loans; concentrations of credit; changes in collateral values; agricultural economic conditions; and regulatory risk. For portfolio loans that are evaluated for impairment as part of homogenous pools, an allowance is maintained based upon similar quantitative and qualitative factors. Changes in the financial condition of individual borrowers, in economic conditions, in historical loss experience and in the conditions of the various markets in which collateral may be sold may all affect the required level of the allowance for losses on loans and the associated provision for losses on loans.
FINANCIAL CONDITION
General. The Company experienced balance sheet growth in fiscal 2017, with total assets of $1.7 billion at June 30, 2017, reflecting an increase of $303.8 million, or 21.6%, as compared to June 30, 2016. Asset growth was funded through deposit growth, and was due in large part to the June 2017 acquisition of Tammcorp, Inc., the parent Company of Capaha Bank (the "Capaha Acquisition").
Cash and equivalents. Cash and cash equivalents were $30.8 million at June 30, 2017, up $8.2 million, or 36.5%, as compared to June 30, 2016, with the change attributed primarily to the Capaha Acquisition. Interest-bearing time deposits were $747,000 at June 30, 2017, up $24,000, or 3.3%, over the same time period.
Investments. Available-for-sale (AFS) securities were $144.4 million at June 30, 2017, an increase of $15.2 million, or 11.8%, as compared to June 30, 2016. The increase was attributable primarily to the Capaha Acquisition, which included securities balances totaling $9.9 million, as well as additional investments made by the Company during the fiscal year. By category, mortgage-backed U.S. government-sponsored entity (GSE) residential securities, other GSE obligations, and obligations of state and political subdivisions saw significant increases.
54
Loans. Loans, net of the allowance for loan losses, were $1.4 billion at June 30, 2017, up $262.3 million, or 23.1%, as compared to June 30, 2016. The increase was attributable primarily to the Capaha Acquisition, which included loan balances totaling $152.2 million, at fair value. Inclusive of the acquisition, loan growth was noted in commercial real estate loans, residential real estate loans, and commercial loans. The increase in commercial real estate loan balances was attributable primarily to the origination and acquisition of loans secured by nonresidential improved property and agricultural real estate. The increase in residential real estate loan balances was attributable primarily to acquired loans secured by 1-4 family property, and origination and acquisition of loans secured by multifamily real estate. The increase in commercial loan balances was attributable to origination and acquisition of commercial and industrial loans, as well as the acquisition of agricultural operating and equipment loans.
Allowance for Loan Losses. The allowance for loan losses was $15.5 million at June 30, 2017, an increase of $1.7 million, or 12.7%, as compared to June 30, 2016. The allowance represented 1.10% of gross loans receivable at June 30, 2017, as compared to 1.20% of gross loans receivable at June 30, 2016. The decrease in the allowance as a percentage of gross loans receivable was attributable to the Capaha Acquisition, in which loans subject to purchase accounting, which the Company carries at fair value instead of establishing an allowance for loan losses, were added to the portfolio late in the fiscal year. See also, Provision for Loan Losses, under Comparison of Operating Results for the Years Ended June 30, 2017 and 2016.
In its quarterly evaluation of the adequacy of its allowance for loan losses, the Company employs historical data, including past due percentages, charge offs, and recoveries for the previous one to five years for each loan category. Average net charge offs are calculated as net charge offs for the period by portfolio type as a percentage of the average balance of the respective portfolio type over the same period. The Company believes that it is prudent to emphasize more recent historical factors in the allowance evaluation.
The following table sets forth the Company's historical net charge offs as of June 30, 2017:
Net charge offs - | Net charge offs - | |||||||
Portfolio segment | 1-year historical | 5-year historical | ||||||
Real estate loans: | ||||||||
Residential | 0.04 | % | 0.05 | % | ||||
Construction | 0.05 | 0.03 | ||||||
Commercial | 0.00 | 0.03 | ||||||
Consumer loans | 0.16 | 0.22 | ||||||
Commercial loans | 0.13 | 0.19 | ||||||
Additionally, in its quarterly evaluation of the adequacy of the allowance for loan losses, the Company evaluates changes in the financial condition of individual borrowers; changes in local, regional, and national economic conditions; the Company's historical loss experience; and changes in market conditions for property pledged to the Company as collateral. The Company has identified specific qualitative factors that address these issues and subjectively assigns a percentage to each factor. Qualitative factors are reviewed quarterly and may be adjusted as necessary to reflect improving or declining trends. At June 30, 2017, these qualitative factors included:
· | Changes in lending policies |
· | National, regional, and local economic conditions |
· | Changes in mix and volume of portfolio |
· | Experience, ability, and depth of lending management and staff |
· | Entry to new markets |
· | Levels and trends of delinquent, nonaccrual, special mention and classified loans |
· | Concentrations of credit |
· | Changes in collateral values |
· | Agricultural economic conditions |
· | Regulatory risk |
55
The qualitative factors are applied to the allowance for loan losses based upon the following percentages by loan type:
Qualitative factor | Qualitative factor | |||||||
applied at | applied at | |||||||
Portfolio segment | June 30, 2017 | June 30, 2016 | ||||||
Real estate loans: | ||||||||
Residential | 0.73 | % | 0.75 | % | ||||
Construction | 1.73 | 1.85 | ||||||
Commercial | 1.33 | 1.32 | ||||||
Consumer loans | 1.36 | 1.40 | ||||||
Commercial loans | 1.37 | 1.35 | ||||||
At June 30, 2017, the amount of our allowance for loan losses attributable to these qualitative factors increased to approximately $13.8 million, as compared to $12.3 million at June 30, 2016, primarily due to the increase in loan balances, in particular, loan balances subject to allowance methodology. The relatively small change in qualitative factors applied was attributable to management's assessment that risks represented by the qualitative factors were little changed, on balance.
Premises and Equipment. Premises and equipment increased to $54.2 million, up $7.2 million, or 15.4%, as compared to June 30, 2016. The increase was due primarily to facilities added through the Capaha Acquisition.
BOLI. The Bank has purchased "key person" life insurance policies (BOLI) on employees at various times since fiscal 2003, and has acquired additional BOLI in connection with certain bank acquisitions. In fiscal 2017, the Bank acquired BOLI with a cash surrender value of $4.0 million in connection with the Capaha Acquisition. At June 30, 2017, the cash surrender value of all such policies had increased to $34.3 million, up $4.3 million, or 14.2%, as compared to June 30, 2016.
Intangible Assets. Intangible assets generated as a result of branch acquisitions in fiscal 2000 and the December 2010 assumption of deposits of the former First Southern Bank were fully amortized as of June 30, 2016. The July 2009 acquisition of the Southern Bank of Commerce resulted in goodwill of $126,000, which is not amortized, but is tested for impairment at least annually. The October 2013 acquisition of Ozarks Legacy resulted in goodwill of $1.5 million, which is not amortized, but is tested for impairment at least annually, and a $1.4 million core deposit intangible, which is being amortized over a five-year period using the straight-line method. The February 2014 acquisition of Citizens resulted in a $624,000 core deposit intangible, which is being amortized over a five-year period using the straight-line method. The August 2014 Peoples Acquisition resulted in goodwill of $3.0 million, which is not amortized, but is tested for impairment at least annually, and a $3.0 million core deposit intangible, which is being amortized over a six-year period using the straight-line method. The Capaha Acquisition resulted in goodwill of $4.1 million, which is not amortized, but is tested for impairment at least annually, and a $3.4 million core deposit intangible, which is being amortized over a seven-year period using the straight-line method.
Deposits. Deposits were $1.5 billion at June 30, 2017, an increase of $334.9 million, or 29.9%, as compared to June 30, 2016. The increase was attributable in part to the Capaha Acquisition, which included $166.8 million in deposits, at fair value. Inclusive of the acquisition, deposit growth was comprised primarily of certificates of deposit, interest-bearing transaction accounts, and noninterest-bearing transaction accounts. Specifically, the Company's public unit deposits increased $45.8 million (with $12.5 million of this growth attributable to the Capaha Acquisition), brokered certificates of deposit increased $68.0 million (with $18.3 million of this growth attributable to the Capaha Acquisition), and brokered nonmaturity deposits increased $8.0 million. Our discussion of brokered deposits excludes those brokered deposits originated through reciprocal arrangements, as our reciprocal brokered deposits are primarily originated by our public unit depositors and utilized as an alternative to pledging securities against those deposits. The average loan-to-deposit ratio for the fourth quarter of fiscal 2017 was 97.7%, as compared to 100.2% for the same period of the prior fiscal year.
Borrowings. FHLB advances were $43.6 million at June 30, 2017, a decrease of $66.6 million, or 60.4%, as compared to June 30, 2016, as the Company repaid $16.5 million in term advances and decreased overnight funding. The decrease was attributable to the increase in deposit balances, including brokered funding and public unit deposits, partially offset by loan growth. Securities sold under agreements to repurchase totaled $10.2 million at June 30, 2017, a decrease of $16.9 million, or 62.3%, as compared to June 30, 2016. The decrease was attributable to several large public unit customers migrating from this product to a reciprocal brokered deposit agreement. At both dates, the full balance of repurchase agreements was due to local small business and government counterparties. In June 2017, the Company entered into a revolving, reducing line of credit with a five-year term,
56
providing available credit of $15.0 million. The line of credit bears interest at a floating rate based on LIBOR, and available credit will be reduced by $3.0 million on each anniversary date of the line of credit. At June 30, 2017, the Company had a drawn balance of $3.0 million.
Subordinated Debt. In March 2004, $7.0 million of Floating Rate Capital Securities of Southern Missouri Statutory Trust I, with a liquidation value of $1,000 per share was issued. The securities bear interest at a floating rate based on LIBOR, are now redeemable at par, and mature in 2034. In connection with its October 2013 acquisition of Ozarks Legacy, the Company assumed $3.1 million in floating rate junior subordinated debt securities. The debt securities had been issued in June 2005 by Ozarks Legacy in connection with the sale of trust preferred securities, bear interest at a floating rate based on LIBOR, are now redeemable at par, and mature in 2035. The carrying value of these debt securities was approximately $2.6 million at June 30, 2017 and 2016. In connection with the Peoples Acquisition, the Company assumed $6.5 million in floating rate junior subordinated debt securities. The debt securities had been issued in 2005 by Peoples, in connection with the sale of trust preferred securities, bear interest at a floating rate based on LIBOR, are now redeemable at par, and mature in 2035. The carrying value of these debt securities was approximately $5.0 million at June 30, 2017 and 2016.
Stockholders' Equity. The Company's stockholders' equity was $173.1 million at June 30, 2017, an increase of $47.1 million, or 37.4%, as compared to June 30, 2016. The increase was attributable to the "at-the-market" offering of the Company's common shares which was conducted in June 2017, the issuance of common shares in the Capaha Acquisition, and the retention of net income, partially offset by payment of dividends on common stock and a decrease in accumulated other comprehensive income.
COMPARISON OF OPERATING RESULTS FOR THE YEARS ENDED JUNE 30, 2017 AND 2016
Net Income. The Company's net income available to common stockholders for the fiscal year ended June 30, 2017, was $15.6 million, an increase of $789,000, or 5.3%, as compared to the prior fiscal year. Before a dividend on preferred shares of $85,000, net income was $14.8 million for the 2016 fiscal year, and increased by $704,000, or 4.7%, to $15.6 million for fiscal 2017.
Net Interest Income . Net interest income for fiscal 2017 was $51.1 million, an increase of $4.2 million, or 8.9%, when compared to the prior fiscal year. The increase, as compared to the prior fiscal year, was attributable to a 10.5% increase in the average balance of interest-earning assets, partially offset by a decrease in the net interest margin, from 3.80% to 3.74%. Accretion of fair value discount on loans and amortization of fair value premiums on time deposits related to the Peoples Acquisition was $1.5 million in fiscal 2017, as compared to $1.7 million in fiscal 2016. This component of net interest income contributed an additional 11 basis points to the net interest margin in fiscal 2017, as compared to a contribution of 14 basis points in fiscal 2016. While the Company expects the impact of fair value discount accretion related to the Peoples Acquisition to decline substantially in fiscal 2018, discount accretion recognized related to the Capaha Acquisition will offset that decrease to some degree.
Interest Income. Interest income for fiscal 2017 was $61.5 million, an increase of $5.2 million, or 9.2%, when compared to the prior fiscal year. The increase was due to an increase of $129.7 million, or 10.5%, in the average balance of interest-earning assets, partially offset by a six basis point decrease in the average yield earned on interest-earning assets, from 4.56% in fiscal 2016, to 4.50% in fiscal 2017.
Interest income on loans receivable for fiscal 2017 was $58.0 million, an increase of $5.1 million, or 9.7%, when compared to the prior fiscal year. The increase was due to a $132.0 million increase in the average balance of loans receivable, partially offset by a 10 basis point decline in the average yield earned on loans receivable. The decline in the average yield was attributed primarily to origination and repricing of loans and borrower refinancing in the continued low rate environment, as well as a reduction in the accretion of fair value discount on loans attributable to the Peoples Acquisition, which declined to $1.3 million in fiscal 2017, as compared to $1.5 million in fiscal 2016.
Interest income on the investment portfolio and other interest-earning assets was $3.5 million for fiscal 2017, an increase of $33,000, or 1.0%, when compared to the prior fiscal year. The increase was due to a seven basis point increase in the average yield earned on these assets, partially offset by a $2.3 million decrease in the average balance of these assets.
Interest Expense. Interest expense was $10.4 million for fiscal 2017, an increase of $1.0 million, or 10.7%, when compared to the prior fiscal year. The increase was due to the $126.6 million increase in the average balance of interest-bearing liabilities, partially offset by a one basis point decrease in the average rate paid on interest-bearing liabilities, from 0.87% in fiscal 2016 to 0.86% in fiscal 2017.
57
Interest expense on deposits was $8.5 million for fiscal 2017, an increase of $1.1 million, or 14.4%, when compared to the prior fiscal year. The increase was due primarily to the $100.5 million increase in the average balance of interest-bearing deposits, combined with a three basis point increase in the average rate paid on those deposits.
Interest expense on FHLB advances was $1.1 million for fiscal 2017, a decrease of $133,000, or 10.4%, when compared to the prior fiscal year. The decrease was due to a $30.8 million decrease in the average balance of FHLB advances, combined with a 76 basis point decrease in the average rate paid on those advances. The decrease in the average rate paid was attributable primarily to the repayment early in the fiscal year of relatively high-cost term advances, combined with an increase in the percentage of total advances outstanding during the year in overnight or other short-term structures with a relatively lower cost.
Provision for Loan Losses. A provision for loan losses is charged to earnings to bring the total allowance for loan losses to a level considered adequate by management to provide for probable loan losses based on prior loss experience, type and amount of loans in the portfolio, adverse situations that may affect the borrower's ability to repay, the estimated value of any underlying collateral, and current economic conditions. Management also considers other factors relating to the collectability of the loan portfolio.
The provision for loan losses was $2.3 million for fiscal 2017, a decrease of $154,000, or 6.2%, as compared to the prior fiscal year. The decrease in provision was attributed to management's analysis of the loan portfolio. In fiscal 2017, net charge offs were $593,000, as compared to $1.0 million for the prior fiscal year. At June 30, 2017, classified loans totaled $13.3 million, or 0.94% of gross loans, as compared to $11.0 million, or 0.96% of gross loans, at June 30, 2016. Classified loans were comprised primarily of commercial and agricultural real estate loans, commercial and agricultural operating loans, and residential real estate loans. All loans so designated were classified due to concerns as to the borrowers' ability to continue to generate sufficient cash flows to service the debt.
The above provision was made based on management's analysis of the various factors which affect the loan portfolio and management's desire to maintain the allowance at a level considered adequate. Management performed a detailed analysis of the loan portfolio, including types of loans, the charge-off history, and an analysis of the allowance for loan losses. Management also considered the continued origination of loans secured by commercial and agricultural real estate, and commercial and agricultural operating loans, which bear an inherently higher level of credit risk. While management believes the allowance for loan losses at June 30, 2017, is adequate to cover losses inherent in the portfolio, there can be no assurance that, in the future, increases in the allowance will not be necessary, or that actual losses will not exceed the allowance.
Noninterest Income. Noninterest income was $11.1 million for fiscal 2017, an increase of $1.3 million, or 13.6%, when compared to the prior fiscal year. The increase was attributed primarily to loan origination fees, bank card interchange income, deposit account service charges, loan servicing fees, increases in the cash value of bank-owned life insurance (BOLI), and net gains realized on the sale of residential loans originated for sale into the secondary market.
Noninterest Expense. Noninterest expense was $38.3 million for fiscal 2017, an increase of $5.6 million, or 17.0%, when compared to the prior fiscal year. The increase in noninterest expense was attributable primarily to increased compensation, occupancy, legal and professional fees, charges to recognize the impairment of fixed assets, expenses attributable to the prepayment of FHLB advances, provisioning for off-balance sheet credit exposures, losses on foreclosed real estate, bank card network expenses, and expenses related to providing debit cards, internet banking, and other deposit services. Fiscal 2017 results included $710,000 in merger-related charges, with no comparable expenses in the prior fiscal year.
Provision for Income Taxes. The Company recorded an income tax provision of $6.1 million for fiscal 2017, a decrease of $620,000 as compared to the prior fiscal year. The effective tax rate for fiscal 2017 was 28.0%, as compared to 31.0% for fiscal 2016. The decrease in the effective tax rate was attributable primarily to formation by the Company of a Real Estate Investment Trust ("REIT") to hold certain qualified assets in order to minimize state tax liability, as well as an increase in tax-advantaged investments, and was partially offset by the inclusion in the current fiscal year's results of some non-deductible expenses related to merger and acquisition activity.
58
COMPARISON OF OPERATING RESULTS FOR THE YEARS ENDED JUNE 30, 2016 AND 2015
Net Income. The Company's net income available to common stockholders for the fiscal year ended June 30, 2016, was $14.8 million, an increase of $1.3 million, or 9.6%, as compared to the prior fiscal year. Before a dividend on preferred shares of $85,000, net income was $14.8 million for the 2016 fiscal year, an increase of $1.2 million, or 8.6%, as compared to the prior fiscal year.
Net Interest Income . Net interest income for fiscal 2016 was $47.0 million, an increase of $417,000, or 0.9%, when compared to the prior fiscal year. The increase, as compared to the prior fiscal year, was attributable to a 4.2% increase in the average balance of interest-earning assets, mostly offset by a decrease in the net interest margin, from 3.92% to 3.80%. Accretion of fair value discount on loans and amortization of fair value premiums on time deposits related to the Peoples Acquisition was $1.7 million in fiscal 2016, as compared to $2.1 million in fiscal 2015. This component of net interest income contributed an additional 14 basis point to the net interest margin in fiscal 2016, as compared to a contribution of 18 basis points in fiscal 2015. The Company expects the impact of the fair value discount accretion to decline even more significantly during fiscal 2017. Purchase accounting adjustments related to other acquisitions closed by the Company in recent periods have had a less significant impact on net interest income in fiscal 2016 and 2015.
Interest Income. Interest income for fiscal 2016 was $56.3 million, an increase of $1.0 million, or 1.8%, when compared to the prior fiscal year. The increase was due to an increase of $49.6 million in the average balance of interest-earning assets, as a result of an increase in loan balances, partially offset by a ten basis point decrease in the average yield earned on interest-earning assets, from 4.66% in fiscal 2015, to 4.56% in fiscal 2016.
Interest income on loans receivable for fiscal 2016 was $52.8 million, an increase of $1.3 million, or 2.6%, when compared to the prior fiscal year. The increase was due to a $72.1 million increase in the average balance of loans receivable, partially offset by a 21 basis point decrease in the average yield earned on loans receivable. The decline in the average yield was attributed to origination of loans and borrower refinancing in the continued low rate environment, as well as a reduction in the accretion of fair value discount on loans attributable to the Peoples Acquisition, which declined to $1.5 million in fiscal 2016, as compared to $1.8 million in fiscal 2015.
Interest income on the investment portfolio and other interest-earning assets was $3.5 million for fiscal 2016, a decrease of $318,000, or 8.4%, when compared to the prior fiscal year. The decrease was due to a $22.5 million decrease in the average balance of these assets, partially offset by a 13 basis point increase in the average yield earned on these assets.
Interest Expense. Interest expense was $9.4 million for fiscal 2016, an increase of $599,000, or 6.8%, when compared to the prior fiscal year. The increase was due to the $52.5 million increase in the average balance of interest-bearing liabilities, combined with a two basis point increase in the average rate paid on interest-bearing liabilities, from 0.85% in fiscal 2015 to 0.87% in fiscal 2016.
Interest expense on deposits was $7.4 million for fiscal 2016, an increase of $548,000, or 8.0%, when compared to the prior fiscal year. The increase was due to the $65.1 million increase in the average balance of interest-bearing deposits, while the average rate paid on those deposits was unchanged.
Interest expense on FHLB advances was $1.3 million for fiscal 2016, a decrease of $7,000, or 0.5%, when compared to the prior fiscal year. The decrease was due to a $15.1 million decrease in the average balance of FHLB advances, partially offset by a 36 basis point increase in the average rate paid on those advances. The increase in the average rate paid was attributable to the lower average balance outstanding in relatively low-cost overnight borrowings.
Provision for Loan Losses. A provision for loan losses is charged to earnings to bring the total allowance for loan losses to a level considered adequate by management to provide for probable loan losses based on prior loss experience, type and amount of loans in the portfolio, adverse situations that may affect the borrower's ability to repay, the estimated value of any underlying collateral, and current economic conditions. Management also considers other factors relating to the collectability of the loan portfolio.
The provision for loan losses was $2.5 million for fiscal 2016, compared to $3.2 million for the prior fiscal year. The decrease in provision was attributed to management's analysis of the loan portfolio. The analysis noted increased balances of loans subject to allowance methodology, as acquired loan balances initially subject to
59
purchase accounting are replaced over time. In fiscal 2016, net charge offs were $1.0 million, compared to $146,000 for the prior fiscal year. At June 30, 2016, classified loans totaled $11.0 million, or 0.96% of gross loans, as compared to $14.8 million, or 1.39% of gross loans, at June 30, 2015. Classified loans were comprised primarily of commercial and residential real estate. At June 30, 2016, classified loans included $1.7 million in purchased credit impaired loans obtained in the Peoples Acquisition, as compared to $4.3 million at June 30, 2015. All loans so designated were classified due to concerns as to the borrowers' ability to continue to generate sufficient cash flows to service the debt.
The above provision was made based on management's analysis of the various factors which affect the loan portfolio and management's desire to maintain the allowance at a level considered adequate. Management performed a detailed analysis of the loan portfolio, including types of loans, the charge-off history, and an analysis of the allowance for loan losses. Management also considered the continued origination of commercial and agricultural real estate, and commercial and agricultural operating loans, which bear an inherently higher level of credit risk. While management believes the allowance for loan losses at June 30, 2016, is adequate to cover losses inherent in the portfolio, there can be no assurance that, in the future, increases in the allowance will not be necessary, or that actual losses will not exceed the allowance.
Noninterest Income. Noninterest income was $9.8 million for fiscal 2016, an increase of $1.1 million, or 12.7%, when compared to the prior fiscal year. The increase was attributed primarily to non-recurring items related to bank-owned life insurance ($323,000), the Company's ownership of stock in Ozark Trust and Investment Corporation, the acquisition of which by Simmons First National Corporation closed during the fiscal year ($301,000), and the Company's sale of its interest in a low-income housing tax credit (LIHTC) limited partnership ($138,000). The remainder of the change was attributable to increases in bank card interchange income and deposit account service charges, partially offset by reduction in loan late charges and losses on disposition of fixed assets.
Noninterest Expense. Noninterest expense was $32.7 million for fiscal 2016, an increase of $402,000, or 1.2%, when compared to the prior fiscal year. The increase in noninterest expense was attributable primarily to increased occupancy, supplies and postage, and advertising, partially offset by declines in legal and professional fees and other operating expense as a result of inclusion in fiscal 2015 results of $508,000 in merger-related charges, with no comparable charge in the current period. Additionally, charges to amortize core deposit intangibles were lower as intangibles resulting from branch acquisitions in 2000 and the December 2010 assumption of deposits of the former First Southern Bank were fully amortized during the fiscal year.
Provision for Income Taxes. The Company recorded an income tax provision of $6.7 million for fiscal 2016, an increase of $627,000 as compared to the prior fiscal year. The effective tax rate for fiscal 2016 was 31.0%, as compared to 30.7% for fiscal 2015. The increase in the effective tax rate was attributable primarily to an increase in pre-tax income and average assets, without corresponding increases in tax-advantaged investments, partially offset by a decrease in non-deductible expenses.
LIQUIDITY AND CAPITAL RESOURCES
Southern Missouri's primary potential sources of funds include deposit growth, securities sold under agreements to repurchase, FHLB advances, amortization and prepayment of loan principal, investment maturities and sales, and ongoing operating results. While scheduled repayments on loans and securities as well as the maturity of short-term investments are a relatively predictable source of funding, deposit flows, FHLB advance redemptions and loan and security prepayment rates are significantly influenced by factors outside of the Bank's control, including general economic conditions and market competition. The Bank has relied on FHLB advances as a source for funding cash or liquidity needs.
Southern Missouri uses its liquid assets as well as other funding sources to meet ongoing commitments, to fund loan demand, to repay maturing certificates of deposit and FHLB advances, to make investments, to fund other deposit withdrawals and to meet operating expenses. At June 30, 2017, the Bank had outstanding commitments to extend credit of $251.9 million (including $170.4 million in unused lines of credit). Total commitments to originate fixed-rate loans with terms in excess of one year were $29.6 million at rates ranging from 3.25% to 8.00%, with a weighted-average rate of 4.59%. Management anticipates that current funding sources will be adequate to meet foreseeable liquidity needs.
60
For the year ended June 30, 2017, Southern Missouri increased deposits by $334.9 million, and reduced securities sold under agreements to repurchase and FHLB advances by $16.9 million and $66.6 million, respectively. During the prior year, Southern Missouri increased deposits and FHLB advances by $65.5 million and $45.4 million, respectively, and reduced securities sold under agreements to repurchase by $247,000. At June 30, 2017, the Bank had pledged $579.3 million of its single-family residential and commercial real estate loan portfolios to the FHLB for available credit of approximately $295.4 million, of which $43.5 million was advanced, while none was used for the issuance of letters of credit to secure public unit deposits. The Bank had also pledged $180.1 million of its agricultural real estate and agricultural operating and equipment loans to the Federal Reserve's discount window for available credit of approximately $143.9 million, as of June 30, 2017, none of which was advanced. In addition, the Bank has the ability to pledge several of its other loan portfolios, including, for example, its multifamily residential real estate, home equity, or commercial business loans. In total, FHLB borrowings are generally limited to 35% of Bank assets, or approximately $522.2 million as most recently reported by the FHLB on June 30, 2017, which means that an amount up to $478.7 million may still be eligible to be borrowed from the FHLB, subject to available collateral. Along with the ability to borrow from the FHLB and Federal Reserve, management believes its liquid resources will be sufficient to meet the Company's liquidity needs.
Liquidity management is an ongoing responsibility of the Bank's management. The Bank adjusts its investment in liquid assets based upon a variety of factors including (i) expected loan demand and deposit flows, (ii) anticipated investment and FHLB advance maturities, (iii) the impact on profitability, and (iv) asset/liability management objectives.
At June 30, 2017, the Bank had $326.6 million in CDs maturing within one year and $928.7 million in other deposits and securities sold under agreements to repurchase without a specified maturity, as compared to the prior year of $245.9 million in CDs maturing within one year and $749.1 million in other deposits and securities sold under agreements to repurchase without a specified maturity. Management believes that most maturing interest-bearing liabilities will be retained or replaced by new interest-bearing liabilities. Also at June 30, 2017, the Bank had no overnight advances and $20.0 million in weekly advances from the FHLB, and $23.5 million in FHLB advances eligible for early redemption by the lender within one year.
REGULATORY CAPITAL
Federally insured financial institutions are required to maintain minimum levels of regulatory capital. Federal Reserve regulations establish capital requirements, including a tier 1 leverage (or core capital) requirement and risk-based capital requirements. The Federal Reserve is also authorized to impose capital requirements in excess of these standards on individual institutions on a case-by-case basis.
At June 30, 2017, the Bank exceeded regulatory capital requirements with tier 1 leverage, total risk-based capital, and tangible common equity capital of $167.3 million, $183.9 million and $167.3 million, respectively. The Bank's tier 1 capital represented 10.98% of total adjusted assets and 11.05% of total risk-weighted assets, while total risk-based capital was 12.15% of total risk-weighted assets, and tangible common equity capital was 11.05% of total risk-weighted assets. To be considered adequately capitalized, the Bank must maintain tier 1 leverage capital levels of at least 4.0% of adjusted total assets and 6.0% of risk-weighted assets, total risk-based capital of 8.0% of risk-weighted assets, and tangible common equity capital of 4.5%. To be considered well capitalized, the Bank must maintain tier 1 leverage capital levels of at least 5.0% of adjusted total assets and 8.0% of risk-weighted assets, total risk-based capital of 10.0% of risk-weighted assets, and tangible common equity capital of 6.5%.
At June 30, 2017, the Company exceeded regulatory capital requirements with tier 1 leverage, total risk-based capital, and tangible common equity capital of $177.7 million, $194.3 million and $163.6 million, respectively. The Company's tier 1 capital represented 11.66% of total adjusted assets and 11.74% of total risk-weighted assets, while total risk-based capital was 12.84% of total risk-weighted assets, and tangible common equity capital was 10.81% of total risk-weighted assets. To be considered adequately capitalized, the Company must maintain tier 1 leverage capital levels of at least 4.0% of adjusted total assets and 6.0% of risk-weighted assets, total risk-based capital of 8.0% of risk-weighted assets, and tangible common equity capital of 4.5%.
See Note 13 of the Notes to the Consolidated Financial Statements contained in Item 8.
61
IMPACT OF INFLATION
The consolidated financial statements and related data presented herein have been prepared in accordance with U.S. generally accepted accounting principles, which require the measurement of financial position and operating results in historical dollars without considering changes in the relative purchasing power of money over time due to inflation. The primary impact of inflation on the operations of the Company is reflected in increased operating costs. Unlike most industrial companies, virtually all of the assets and liabilities of a financial institution are monetary in nature. As a result, changes in interest rates generally have a more significant impact on a financial institution's performance than does inflation. Interest rates do not necessarily move in the same direction or to the same extent as the prices of goods and services. In the current interest rate environment, liquidity and maturity structure of the Company's assets and liabilities are critical to the maintenance of acceptable performance levels.
AVERAGE BALANCE, INTEREST AND AVERAGE YIELDS AND RATES
The table on the following page sets forth certain information relating to the Company's average interest-earning assets and interest-bearing liabilities and reflects the average yield on assets and the average cost of liabilities for the periods indicated. These yields and costs are derived by dividing income or expense by the average balance of assets or liabilities, respectively, for the years indicated. Nonaccrual loans are included with other noninterest-earning assets.
The table also presents information with respect to the difference between the weighted-average yield earned on interest-earning assets and the weighted-average rate paid on interest-bearing liabilities, or interest rate spread, which financial institutions have traditionally used as an indicator of profitability. Another indicator of an institution's net interest income is its net yield (or net interest margin) on interest-earning assets, which is its net interest income divided by the average balance of interest-earning assets. Net interest income is affected by the interest rate spread and by the relative amounts of interest-earning assets and interest-bearing liabilities. When interest-earning assets approximate or exceed interest-bearing liabilities, any positive interest rate spread will generate net interest income.
62
Years Ended June 30, | ||||||||||||||||||||||||||||||||||||
2017 | 2016 | 2015 | ||||||||||||||||||||||||||||||||||
(Dollars in thousands) | Average | Interest | Yield/ | Average | Interest | Yield/ | Average | Interest | Yield/ | |||||||||||||||||||||||||||
Interest-earning assets: | ||||||||||||||||||||||||||||||||||||
Mortgage loans (1) | $ | 975,670 | $ | 45,998 | 4.71 | % | $ | 865,029 | $ | 41,643 | 4.81 | % | $ | 805,928 | $ | 40,485 | 5.02 | % | ||||||||||||||||||
Other loans (1) | 246,335 | 11,990 | 4.87 | 224,930 | 11,207 | 4.98 | 211,907 | 11,030 | 5.20 | |||||||||||||||||||||||||||
Total net loans | 1,222,005 | 57,988 | 4.75 | 1,089,959 | 52,850 | 4.85 | 1,017,835 | 51,515 | 5.06 | |||||||||||||||||||||||||||
Mortgage-backed securities | 72,205 | 1,496 | 2.07 | 66,736 | 1,467 | 2.20 | 76,980 | 1,674 | 2.17 | |||||||||||||||||||||||||||
Investment securities (2) | 67,472 | 1,975 | 2.93 | 67,885 | 1,965 | 2.83 | 71,814 | 1,996 | 2.78 | |||||||||||||||||||||||||||
Other interest-earning assets | 3,427 | 29 | 0.83 | 10,799 | 35 | 0.32 | 19,103 | 116 | 0.61 | |||||||||||||||||||||||||||
TOTAL INTEREST- | ||||||||||||||||||||||||||||||||||||
EARNING ASSETS (1) | 1,365,109 | 61,488 | 4.50 | 1,235,379 | 56,317 | 4.56 | 1,185,732 | 55,301 | 4.66 | |||||||||||||||||||||||||||
Other noninterest-earning assets (3) | 118,809 | --- | --- | 99,463 | --- | --- | 88,000 | --- | --- | |||||||||||||||||||||||||||
TOTAL ASSETS | $ | 1,483,918 | 61,488 | --- | $ | 1,334,842 | 56,317 | --- | $ | 1,273,732 | 55,301 | --- | ||||||||||||||||||||||||
Interest-bearing liabilities: | ||||||||||||||||||||||||||||||||||||
Savings accounts | $ | 121,734 | 413 | 0.34 | $ | 121,741 | 386 | 0.32 | $ | 115,751 | 384 | 0.33 | ||||||||||||||||||||||||
NOW accounts | 428,201 | 3,094 | 0.72 | 375,355 | 2,746 | 0.73 | 307,928 | 2,391 | 0.78 | |||||||||||||||||||||||||||
Money market accounts | 85,285 | 313 | 0.37 | 75,947 | 219 | 0.29 | 75,860 | 180 | 0.24 | |||||||||||||||||||||||||||
Certificates of deposit | 438,011 | 4,652 | 1.06 | 399,685 | 4,056 | 1.01 | 408,092 | 3,904 | 0.96 | |||||||||||||||||||||||||||
TOTAL INTEREST- | ||||||||||||||||||||||||||||||||||||
BEARING DEPOSITS | 1,073,231 | 8,472 | 0.79 | 972,728 | 7,407 | 0.76 | 907,631 | 6,859 | 0.76 | |||||||||||||||||||||||||||
Borrowings: | ||||||||||||||||||||||||||||||||||||
Securities sold under | ||||||||||||||||||||||||||||||||||||
agreements to repurchase | 22,198 | 95 | 0.43 | 27,387 | 119 | 0.44 | 25,443 | 117 | 0.46 | |||||||||||||||||||||||||||
FHLB advances | 96,065 | 1,138 | 1.18 | 65,273 | 1,271 | 1.95 | 80,415 | 1,278 | 1.59 | |||||||||||||||||||||||||||
Note payable | 363 | 13 | 3.67 | --- | --- | --- | --- | --- | --- | |||||||||||||||||||||||||||
Junior subordinated debt | 14,800 | 648 | 4.37 | 14,705 | 568 | 3.86 | 14,112 | 512 | 3.63 | |||||||||||||||||||||||||||
TOTAL INTEREST- | ||||||||||||||||||||||||||||||||||||
BEARING LIABILITIES | 1,206,657 | 10,366 | 0.86 | 1,080,093 | 9,365 | 0.87 | 1,027,601 | 8,766 | 0.85 | |||||||||||||||||||||||||||
Noninterest-bearing | ||||||||||||||||||||||||||||||||||||
demand deposits | 138,881 | --- | --- | 125,503 | --- | --- | 117,157 | --- | --- | |||||||||||||||||||||||||||
Other liabilities | 5,408 | --- | --- | 3,764 | --- | --- | 1,074 | --- | --- | |||||||||||||||||||||||||||
TOTAL LIABILITIES | 1,350,946 | 10,366 | --- | 1,209,360 | 9,365 | --- | 1,145,832 | 8,766 | --- | |||||||||||||||||||||||||||
Stockholders' equity | 132,972 | --- | --- | 125,482 | --- | --- | 127,900 | --- | --- | |||||||||||||||||||||||||||
TOTAL LIABILITIES AND | ||||||||||||||||||||||||||||||||||||
STOCKHOLDERS' EQUITY | $ | 1,483,918 | 10,366 | --- | $ | 1,334,842 | 9,365 | --- | $ | 1,273,732 | 8,766 | --- | ||||||||||||||||||||||||
Net interest income | $ | 51,122 | $ | 46,952 | $ | 46,535 | ||||||||||||||||||||||||||||||
Interest rate spread (4) | 3.64 | % | 3.69 | % | 3.81 | % | ||||||||||||||||||||||||||||||
Net interest margin (5) | 3.74 | % | 3.80 | % | 3.92 | % | ||||||||||||||||||||||||||||||
Ratio of average interest-earning | ||||||||||||||||||||||||||||||||||||
assets to average interest- | ||||||||||||||||||||||||||||||||||||
bearing liabilities | 113.13 | % | 114.38 | % | 115.39 | % | ||||||||||||||||||||||||||||||
_____________________
(1) | Calculated net of deferred loan fees, loan discounts and loans-in-process. Nonaccrual loans are not included in average loans. |
(2) | Includes FHLB membership stock, Federal Reserve membership stock, and related cash dividends. |
(3) | Includes equity securities and related cash dividends. |
(4) | Represents the difference between the average rate on interest-earning assets and the average cost of interest-bearing liabilities. |
(5) | Represents net interest income divided by average interest-earning assets. |
63
YIELDS EARNED AND RATES PAID
The following table sets forth for the periods and at the date indicated, the weighted average yields earned on the Company's assets, the weighted average interest rates paid on the Company's liabilities, together with the net yield on interest-earning assets.
At | For | |||||||||||||||
2017 | 2017 | 2016 | 2015 | |||||||||||||
Weighted-average yield on loan portfolio | 4.75 | % | 4.75 | % | 4.85 | % | 5.06 | % | ||||||||
Weighted-average yield on mortgage-backed securities | 2.18 | 2.07 | 2.20 | 2.17 | ||||||||||||
Weighted-average yield on investment securities (1) | 2.81 | 2.93 | 2.83 | 2.78 | ||||||||||||
Weighted-average yield on other interest-earning assets | 1.41 | 0.83 | 0.32 | 0.61 | ||||||||||||
Weighted-average yield on all interest-earning assets | 4.53 | 4.50 | 4.56 | 4.66 | ||||||||||||
Weighted-average rate paid on interest-bearing deposits | 0.84 | 0.79 | 0.76 | 0.76 | ||||||||||||
Weighted-average rate paid on securities sold under | ||||||||||||||||
agreements to repurchase | 0.53 | 0.43 | 0.44 | 0.46 | ||||||||||||
Weighted-average rate paid on FHLB advances | 2.48 | 1.18 | 1.95 | 1.59 | ||||||||||||
Weighted-average rate paid on note payable | 3.63 | 3.67 | --- | --- | ||||||||||||
Weighted-average rate paid on subordinated debt | 4.70 | 4.37 | 3.86 | 3.63 | ||||||||||||
Weighted-average rate paid on all interest-bearing liabilities | 0.94 | 0.86 | 0.87 | 0.85 | ||||||||||||
Interest rate spread (spread between weighted average rate on all interest-earning assets and all interest- bearing liabilities) | 3.59 | 3.64 | 3.69 | 3.81 | ||||||||||||
Net interest margin (net interest income as a percentage of average interest-earning assets) | 3.72 | 3.74 | 3.80 | 3.92 | ||||||||||||
________________
(1) Includes Federal Home Loan Bank, Federal Reserve Bank stock.
64
RATE/VOLUME ANALYSIS
The following table sets forth the effects of changing rates and volumes on net interest income of the Company. Information is provided with respect to (i) effects on interest income attributable to changes in volume (changes in volume multiplied by prior rate), (ii) effects on interest income attributable to changes in rate (changes in rate multiplied by prior volume), and (iii) changes in rate/volume (change in rate multiplied by change in volume).
Years Ended June 30, | Years Ended June 30, | |||||||||||||||||||||||||||||||
(Dollars in thousands) | Rate | Volume | Rate/ | Net | Rate | Volume | Rate/ | Net | ||||||||||||||||||||||||
Interest-earning assets: | ||||||||||||||||||||||||||||||||
Loans receivable (1) | $ | (1,120 | ) | $ | 6,392 | $ | (134 | ) | $ | 5,138 | $ | (2,124 | ) | $ | 3,649 | $ | (190 | ) | $ | 1,335 | ||||||||||||
Mortgage-backed securities | (84 | ) | 120 | (7 | ) | 29 | 21 | (222 | ) | (6 | ) | (207 | ) | |||||||||||||||||||
Investment securities (2) | 25 | (12 | ) | (3 | ) | 10 | 83 | (109 | ) | (5 | ) | (31 | ) | |||||||||||||||||||
Other interest-earning deposits | 55 | (24 | ) | (37 | ) | (6 | ) | (55 | ) | (51 | ) | 25 | (81 | ) | ||||||||||||||||||
Total net change in income on | ||||||||||||||||||||||||||||||||
interest-earning assets | (1,124 | ) | 6,476 | (181 | ) | 5,171 | (2,075 | ) | 3,267 | (176 | ) | 1,016 | ||||||||||||||||||||
Interest-bearing liabilities: | ||||||||||||||||||||||||||||||||
Deposits | 239 | 803 | 23 | 1,065 | (57 | ) | 499 | 106 | 548 | |||||||||||||||||||||||
Securities sold under | ||||||||||||||||||||||||||||||||
agreements to repurchase | (2 | ) | (23 | ) | 1 | (24 | ) | (4 | ) | 9 | (3 | ) | 2 | |||||||||||||||||||
FHLB advances | (497 | ) | 599 | (235 | ) | (133 | ) | 287 | (241 | ) | (53 | ) | (7 | ) | ||||||||||||||||||
Note payable | --- | --- | 13 | 13 | --- | --- | --- | --- | ||||||||||||||||||||||||
Subordinated debt | 76 | 4 | --- | 80 | 32 | 22 | 2 | 56 | ||||||||||||||||||||||||
Total net change in expense on | ||||||||||||||||||||||||||||||||
interest-bearing liabilities | (184 | ) | 1,383 | (198 | ) | 1,001 | 258 | 289 | 52 | 599 | ||||||||||||||||||||||
Net change in net interest income | $ | (940 | ) | $ | 5,093 | $ | 17 |
| $ | 4,170 | $ | (2,333 | ) | $ | 2,978 | $ | (228 | ) | $ | 417 | ||||||||||||
________________
(1) Does not include interest on loans placed on nonaccrual status.
(2) Does not include dividends earned on equity securities.
65
Item 7A Quantitative and Qualitative Disclosures About Market Risk
The goal of the Company's asset/liability management strategy is to manage the interest rate sensitivity of both interest-earning assets and interest-bearing liabilities in order to maximize net interest income without exposing the Company to an excessive level of interest rate risk. The Company employs various strategies intended to manage the potential effect that changing interest rates may have on future operating results. The primary asset/liability management strategy has been to focus on matching the anticipated repricing intervals of interest-earning assets and interest-bearing liabilities. At times, however, depending on the level of general interest rates, the relationship between long- and short-term interest rates, market conditions and competitive factors, the Company may increase its interest rate risk position in order to maintain its net interest margin.
In an effort to manage the interest rate risk resulting from fixed rate lending, the Company has utilized longer term (up to 10 year maturities), fixed-rate FHLB advances, which may be subject to early redemption, to offset interest rate risk. Other elements of the Company's current asset/liability strategy include: (i) increasing originations of commercial real estate, commercial business loans, agricultural real estate, and agricultural operating lines, which typically provide higher yields and shorter repricing periods, but inherently increase credit risk, (ii) limiting the price volatility of the investment portfolio by maintaining a relatively short weighted average maturity, (iii) actively soliciting less rate-sensitive nonmaturity deposits, and (iv) offering competitively priced money market accounts and CDs with maturities of up to five years. The degree to which each segment of the strategy is achieved will affect profitability and exposure to interest rate risk.
The Company continues to generate long-term, fixed-rate residential loans. During the fiscal year ended June 30, 2017, fixed rate residential loan originations totaled $60.2 million (of which $33.1 million was originated for sale into the secondary market), compared to $50.5 million during the prior year (of which $22.9 million was originated for sale into the secondary market). At June 30, 2017, the fixed-rate residential loan portfolio totaled $147.5 million, with a weighted average maturity of 106 months, compared to $139.9 million with a weighted average maturity of 116 months at June 30, 2016. The Company originated $34.5 million in adjustable rate residential loans during the fiscal year ended June 30, 2017, compared to $27.9 million during the prior fiscal year. At June 30, 2017, fixed rate loans with remaining maturities in excess of 10 years totaled $36.7 million, or 2.6%, of loans receivable, compared to $36.7 million, or 3.2%, of loans receivable, at June 30, 2016. The Company originated $221.8 million in fixed rate commercial and commercial real estate loans during the year ended June 30, 2017, compared to $195.5 million during the prior fiscal year. The Company also originated $92.0 million in adjustable rate commercial and commercial real estate loans during the fiscal year ended June 30, 2017, compared to $60.0 million during the prior fiscal year. At June 30, 2017, adjustable-rate home equity lines of credit totaled $35.2 million, compared to $25.1 million as of June 30, 2016. At June 30, 2017, the Company's weighted average life of its investment portfolio was 3.7 years, compared to 3.7 years at June 30, 2016. At June 30, 2017, CDs with original terms of two years or more totaled $248.8 million, compared to $204.7 million at June 30, 2016.
INTEREST RATE SENSITIVITY ANALYSIS
The following table sets forth as of June 30, 2017 and 2016, management's estimates of the projected changes in net portfolio value in the event of 100, 200, and 300 basis point, instantaneous and permanent increases or decreases in market interest rates.
Computations in the table below are based on prospective effects of hypothetical changes in interest rates and are based on an internally generated model using the actual maturity and repricing schedules for Southern Bank's loans and deposits, adjusted by management's assumptions for prepayment rates and deposit runoff. Further, the computations do not consider any reactions that the Bank may undertake in response to changes in interest rates. These projected changes should not be relied upon as indicative of actual results in any of the aforementioned interest rate changes.
66
Management cannot accurately predict future interest rates or their effect on the Company's NPV and net interest income in the future. Certain shortcomings are inherent in the method of analysis presented in the computation of NPV and net interest income. For example, although certain assets and liabilities may have similar maturities or periods of repricing, they may react in different degrees to changes in market interest rates. Also, the interest rates on certain types of assets and liabilities may fluctuate in advance of changes in market interest rates, while interest rates on other types of assets and liabilities may lag behind changes in market interest rates. Additionally, most of Southern Bank's loans have features which restrict changes in interest rates on a short-term basis and over the life of the asset. Further, in the event of a change in interest rates, prepayment and early withdrawal levels would likely deviate significantly from those assumed in calculating the foregoing table. Finally, the ability of many borrowers to service their debt may decrease in the event of an interest rate increase.
June 30, 2017 | |||||
Change in Rates | | NPV as Percentage of PV of Assets | |||
Value | Change | % Change | NPV Ratio | Change | |
(Dollars in thousands) | (%) | (basis points) | |||
+300 bp | $ 146,140 | $ (26,692) | (15) | 8.99 | -113 |
+200 bp | 154,473 | (18,359) | (11) | 9.35 | -77 |
+100 bp | 162,804 | (10,027) | (6) | 9.70 | -42 |
0 bp | 172,832 | --- | --- | 10.12 | --- |
-100 bp | 189,720 | 16,888 | 10 | 10.91 | 79 |
-200 bp | 209,964 | 37,133 | 21 | 11.91 | 179 |
-300 bp | 215,014 | 42,182 | 24 | 12.16 | 204 |
June 30, 2016 | |||||
Change in Rates | | NPV as Percentage of PV of Assets | |||
Value | Change | % Change | NPV Ratio | Change | |
(Dollars in thousands) | (%) | (basis points) | |||
+300 bp | $ 112,689 | $ (15,234) | (12) | 8.14 | -95 |
+200 bp | 118,137 | (9,785) | (8) | 8.49 | -61 |
+100 bp | 122,921 | (5,001) | (4) | 8.79 | -31 |
0 bp | 127,922 | --- | --- | 9.10 | --- |
-100 bp | 135,662 | 7,740 | 6 | 9.58 | 48 |
-200 bp | 142,772 | 14,850 | 12 | 10.03 | 93 |
-300 bp | 149,773 | 21,850 | 17 | 10.46 | 136 |
The Company has worked to limit its exposure to rising rates in the current historically low rate environment by (a) increasing the share of funding on its balance sheet obtained from non-maturity transaction accounts, (b) limiting FHLB borrowings and (c) limiting the duration of its available-for-sale investment portfolio.
67
Item 8. Financial Statements and Supplementary Information
Report of Independent Registered Public Accounting Firm
Audit Committee, Board of Directors
and Stockholders
Southern Missouri Bancorp, Inc.
Poplar Bluff, Missouri
We have audited the accompanying consolidated balance sheets of Southern Missouri Bancorp, Inc. ("Company") as of June 30, 2017 and 2016, and the related consolidated statements of income, comprehensive income, stockholders' equity and cash flows for each of the years in the three-year period ended June 30, 2017. The Company's management is responsible for these financial statements. Our responsibility is to express an opinion on these financial statements based on our audits.
We conducted our audits in accordance with the standards of the Public Company Accounting Oversight Board (United States). Those standards require that we plan and perform the audits to obtain reasonable assurance about whether the financial statements are free of material misstatement. Our audits also included examining, on a test basis, evidence supporting the amounts and disclosures in the financial statements, assessing the accounting principles used and significant estimates made by management and evaluating the overall financial statement presentation. We believe that our audits provide a reasonable basis for our opinion.
In our opinion, the consolidated financial statements referred to above present fairly, in all material respects, the financial position of Southern Missouri Bancorp, Inc. as of June 30, 2017 and 2016, and the results of its operations and its cash flows for each of the years in the three-year period ended June 30, 2017, in conformity with accounting principles generally accepted in the United States of America.
We also have audited, in accordance with the standards of the Public Company Accounting Oversight Board (United States), Southern Missouri Bancorp, Inc.'s internal control over financial reporting as of June 30, 2017, based on criteria established in Internal Control-Integrated Framework (1992) issued by the Committee of Sponsoring Organizations of the Treadway Commission (COSO) and our report dated September 13, 2017, expressed an unqualified opinion on the effectiveness of the Company's internal control over financial reporting.
/s/ BKD, LLP
Decatur, Illinois
September 13, 2017
68
> CONSOLIDATED BALANCE SHEETS <
JUNE 30, 2017 AND 2016
Southern Missouri Bancorp, Inc.
(dollars in thousands) | 2017 | 2016 | ||||||
Assets | ||||||||
Cash and cash equivalents | $ | 30,786 | $ | 22,554 | ||||
Interest-bearing time deposits | 747 | 723 | ||||||
Available for sale securities (Note 2) | 144,416 | 129,224 | ||||||
Stock in FHLB of Des Moines | 3,547 | 6,009 | ||||||
Stock in Federal Reserve Bank of St. Louis | 2,357 | 2,343 | ||||||
Loans receivable, net of allowance for loan losses of | 1,397,730 | 1,135,453 | ||||||
Accrued interest receivable | 6,769 | 5,512 | ||||||
Premises and equipment, net (Note 5) | 54,167 | 46,943 | ||||||
Bank owned life insurance – cash surrender value | 34,329 | 30,071 | ||||||
Goodwill | 8,631 | 4,556 | ||||||
Other intangible assets, net | 6,759 | 3,295 | ||||||
Prepaid expenses and other assets | 17,474 | 17,227 | ||||||
TOTAL ASSETS | $ | 1,707,712 | $ | 1,403,910 | ||||
Liabilities and Stockholders' Equity | ||||||||
Deposits (Note 6) | $ | 1,455,597 | $ | 1,120,693 | ||||
Securities sold under agreements to repurchase (Note 7) | 10,212 | 27,085 | ||||||
Advances from FHLB of Des Moines (Note 8) | 43,637 | 110,216 | ||||||
Note payable | 3,000 | - | ||||||
Accounts payable and other liabilities | 6,417 | 4,477 | ||||||
Accrued interest payable | 918 | 720 | ||||||
Subordinated debt (Note 9) | 14,848 | 14,753 | ||||||
TOTAL LIABILITIES | 1,534,629 | 1,277,944 | ||||||
Commitments and contingencies (Note 15) | ||||||||
Common stock, $.01 par value; | 86 | 74 | ||||||
Additional paid-in capital | 70,101 | 34,432 | ||||||
Retained earnings | 102,369 | 89,798 | ||||||
Accumulated other comprehensive income | 527 | 1,662 | ||||||
TOTAL STOCKHOLDERS' EQUITY | 173,083 | 125,966 | ||||||
TOTAL LIABILITIES AND STOCKHOLDERS' EQUITY | $ | 1,707,712 | $ | 1,403,910 | ||||
See accompanying notes to consolidated financial statements.
69
> CONSOLIDATED STATEMENTS OF INCOME <
YEARS ENDED JUNE 30, 2017, 2016 AND 2015
Southern Missouri Bancorp, Inc.
(dollars in thousands except per share data) | 2017 | 2016 | 2015 | |||||||||
Interest Income : | ||||||||||||
Loans | $ | 57,988 | $ | 52,850 | $ | 51,515 | ||||||
Investment securities | 1,975 | 1,965 | 1,996 | |||||||||
Mortgage-backed securities | 1,496 | 1,467 | 1,674 | |||||||||
Other interest-earning assets | 29 | 35 | 116 | |||||||||
TOTAL INTEREST INCOME | 61,488 | 56,317 | 55,301 | |||||||||
Interest Expense : | ||||||||||||
Deposits | 8,472 | 7,407 | 6,859 | |||||||||
Securities sold under agreements to repurchase | 95 | 119 | 117 | |||||||||
Advances from FHLB of Des Moines | 1,138 | 1,271 | 1,278 | |||||||||
Notes payable | 13 | - | - | |||||||||
Subordinated debt | 648 | 568 | 512 | |||||||||
TOTAL INTEREST EXPENSE | 10,366 | 9,365 | 8,766 | |||||||||
NET INTEREST INCOME | 51,122 | 46,952 | 46,535 | |||||||||
Provision for loan losses (Note 3) | 2,340 | 2,494 | 3,185 | |||||||||
NET INTEREST INCOME AFTER PROVISION FOR LOAN LOSSES | 48,782 | 44,458 | 43,350 | |||||||||
Noninterest income : | ||||||||||||
Deposit account charges and related fees | 3,824 | 3,588 | 3,456 | |||||||||
Bank card interchange income | 2,864 | 2,580 | 2,294 | |||||||||
Loan late charges | 432 | 351 | 401 | |||||||||
Loan servicing fees | 397 | 176 | 143 | |||||||||
Other loan fees | 1,146 | 806 | 720 | |||||||||
Net realized gains on sale of loans | 840 | 641 | 656 | |||||||||
Net realized gains on sale of AFS securities | - | 5 | 6 | |||||||||
Earnings on bank owned life insurance | 1,135 | 928 | 569 | |||||||||
Other income | 446 | 683 | 414 | |||||||||
TOTAL NONINTEREST INCOME | 11,084 | 9,758 | 8,659 | |||||||||
Noninterest expense : | ||||||||||||
Compensation and benefits | 19,406 | 17,769 | 17,828 | |||||||||
Occupancy and equipment, net | 8,418 | 7,132 | 5,879 | |||||||||
Deposit insurance premiums | 681 | 657 | 686 | |||||||||
Legal and professional fees | 1,233 | 576 | 897 | |||||||||
Advertising | 1,102 | 932 | 904 | |||||||||
Postage and office supplies | 561 | 623 | 577 | |||||||||
Intangible amortization | 911 | 1,025 | 1,253 | |||||||||
Bank card network expense | 1,150 | 971 | 1,019 | |||||||||
Other operating expense | 4,790 | 3,001 | 3,242 | |||||||||
TOTAL NONINTEREST EXPENSE | 38,252 | 32,686 | 32,285 | |||||||||
INCOME BEFORE INCOME TAXES | 21,614 | 21,530 | 19,724 | |||||||||
Income Taxes (Note 11) | ||||||||||||
Current | 4,899 | 6,206 | 6,586 | |||||||||
Deferred | 1,163 | 476 | (530 | ) | ||||||||
6,062 | 6,682 | 6,056 | ||||||||||
NET INCOME | $ | 15,552 | $ | 14,848 | $ | 13,668 | ||||||
Less: dividend on preferred shares | - | 85 | 200 | |||||||||
NET INCOME AVAILABLE TO COMMON STOCKHOLDERS | $ | 15,552 | $ | 14,763 | $ | 13,468 | ||||||
Basic earnings per share available to common stockholders | $ | 2.08 | $ | 1.99 | $ | 1.84 | ||||||
Diluted earnings per share available to common stockholders | $ | 2.07 | $ | 1.98 | $ | 1.79 | ||||||
Dividends paid | $ | 0.40 | $ | 0.36 | $ | 0.34 | ||||||
See accompanying notes to consolidated financial statements.
70
> CONSOLIDATED STATEMENTS OF COMPREHENSIVE INCOME <
YEARS ENDED JUNE 30, 2017, 2016 AND 2015
Southern Missouri Bancorp, Inc.
2017 | 2016 | 2015 | ||||||||||
(dollars in thousands) | ||||||||||||
NET INCOME | $ | 15,552 | $ | 14,848 | $ | 13,668 | ||||||
Other comprehensive income: | ||||||||||||
Unrealized gains (losses) on securities available-for-sale | (1,879 | ) | 1,290 | 512 | ||||||||
Less: reclassification adjustment for realized gains | - | 5 | 6 | |||||||||
Unrealized gains (losses) on available-for-sale securities for | 57 | - | (58 | ) | ||||||||
Defined benefit pension plan net (loss) gain | 13 | (9 | ) | (9 | ) | |||||||
Tax (expense) benefit | 674 | (475 | ) | (166 | ) | |||||||
Total other comprehensive income (loss) | (1,135 | ) | 801 | 273 | ||||||||
COMPREHENSIVE INCOME | $ | 14,417 | $ | 15,649 | $ | 13,941 | ||||||
See accompanying notes to consolidated financial statements.
71
> CONSOLIDATED STATEMENTS OF STOCKHOLDERS' EQUITY <
YEARS ENDED JUNE 30, 2017, 2016 AND 2015
Southern Missouri Bancorp, Inc.
Warrants to Acquire | Additional | Accumulated Other | Total | |||||||||||||||||||||||||
Preferred | Common | Common | Paid-In | Retained | Comprehensive | Stockholders' | ||||||||||||||||||||||
(dollars in thousands) | Stock | Stock | Stock | Capital | Earnings | Income | Equity | |||||||||||||||||||||
BALANCE AS OF JUNE 30, 2014 | $ | 20,000 | $ | 33 | $ | 177 | $ | 23,504 | $ | 66,809 | $ | 588 | $ | 111,111 | ||||||||||||||
Net Income | 13,668 | 13,668 | ||||||||||||||||||||||||||
Change in unrealized gain on available for sale securities | 282 | 282 | ||||||||||||||||||||||||||
Defined benefit pension plan net loss | (9 | ) | (9 | ) | ||||||||||||||||||||||||
Dividends paid on common stock ($.34 per share ) | (2,517 | ) | (2,517 | ) | ||||||||||||||||||||||||
Dividends paid on preferred stock | (200 | ) | (200 | ) | ||||||||||||||||||||||||
Stock option expense | 15 | 15 | ||||||||||||||||||||||||||
Stock grant expense | 275 | 275 | ||||||||||||||||||||||||||
Tax benefit of stock grants | 54 | 54 | ||||||||||||||||||||||||||
Exercise of stock options | 332 | 332 | ||||||||||||||||||||||||||
Repurchase of warrants to acquire common stock | (177 | ) | (2,523 | ) | (2,700 | ) | ||||||||||||||||||||||
Common stock issued | 4 | 12,328 | 12,332 | |||||||||||||||||||||||||
Two-for-one common stock split in the form of a 100% common stock dividend | 37 | (37 | ) | - | ||||||||||||||||||||||||
BALANCE AS OF JUNE 30, 2015 | $ | 20,000 | $ | 74 | $ | - | $ | 33,948 | $ | 77,760 | $ | 861 | $ | 132,643 | ||||||||||||||
Net Income | 14,848 | 14,848 | ||||||||||||||||||||||||||
Change in unrealized gain on available for sale securities | 810 | 810 | ||||||||||||||||||||||||||
Defined benefit pension plan net loss | (9 | ) | (9 | ) | ||||||||||||||||||||||||
Dividends paid on common stock ($.36 per share ) | (2,675 | ) | (2,675 | ) | ||||||||||||||||||||||||
Dividends paid on preferred stock | (135 | ) | (135 | ) | ||||||||||||||||||||||||
Stock option expense | 13 | 13 | ||||||||||||||||||||||||||
Stock grant expense | 268 | 268 | ||||||||||||||||||||||||||
Tax benefit of stock grants | 104 | 104 | ||||||||||||||||||||||||||
Exercise of stock options | 99 | 99 | ||||||||||||||||||||||||||
Redemption of preferred stock | (20,000 | ) | (20,000 | ) | ||||||||||||||||||||||||
BALANCE AS OF JUNE 30, 2016 | $ | - | $ | 74 | $ | - | $ | 34,432 | $ | 89,798 | $ | 1,662 | $ | 125,966 | ||||||||||||||
Net Income | 15,552 | 15,552 | ||||||||||||||||||||||||||
Change in unrealized gain on available for sale securities | (1,148 | ) | (1,148 | ) | ||||||||||||||||||||||||
Defined benefit pension plan net loss | 13 | 13 | ||||||||||||||||||||||||||
Dividends paid on common stock ($.40 per share ) | (2,981 | ) | (2,981 | ) | ||||||||||||||||||||||||
Stock option expense | 11 | 11 | ||||||||||||||||||||||||||
Stock grant expense | 274 | 274 | ||||||||||||||||||||||||||
Tax benefit of stock grants | 225 | 225 | ||||||||||||||||||||||||||
Exercise of stock options | - | - | - | 61 | - | - | 61 | |||||||||||||||||||||
Common stock issued | - | 12 | - | 35,098 | - | - | 35,110 | |||||||||||||||||||||
BALANCE AS OF JUNE 30, 2017 | $ | - | $ | 86 | $ | - | $ | 70,101 | $ | 102,369 | $ | 527 | $ | 173,083 | ||||||||||||||
See accompanying notes to consolidated financial statements.
72
> CONSOLIDATED STATEMENTS OF CASH FLOWS <
YEARS ENDED JUNE 30, 2017, 2016 AND 2015
Southern Missouri Bancorp, Inc.
(dollars in thousands) | 2017 | 2016 | 2015 | |||||||||
Cash Flows From Operating Activities : | ||||||||||||
NET INCOME | $ | 15,552 | $ | 14,848 | $ | 13,668 | ||||||
Items not requiring (providing) cash: | ||||||||||||
Depreciation | 2,982 | 2,513 | 1,988 | |||||||||
Loss on disposal of fixed assets | 332 | 74 | - | |||||||||
Stock option and stock grant expense | 510 | 385 | 344 | |||||||||
Loss on sale/write-down of REO | 324 | 20 | 55 | |||||||||
Amortization of intangible assets | 911 | 1,025 | 1,253 | |||||||||
Amortization of purchase accounting adjustments | (1,116 | ) | (1,803 | ) | (2,527 | ) | ||||||
Increase in cash surrender value of bank owned life insurance (BOLI) | (1,135 | ) | (928 | ) | (569 | ) | ||||||
Provision for loan losses | 2,340 | 2,494 | 3,185 | |||||||||
Gains realized on sale of AFS securities | - | (5 | ) | (6 | ) | |||||||
Net amortization of premiums and discounts on securities | 1,034 | 827 | 897 | |||||||||
Originations of loans held for sale | (33,059 | ) | (22,898 | ) | (16,557 | ) | ||||||
Proceeds from sales of loans held for sale | 33,656 | 22,116 | 17,264 | |||||||||
Gain on sales of loans held for sale | (840 | ) | (641 | ) | (656 | ) | ||||||
Changes in: | ||||||||||||
Accrued interest receivable | (314 | ) | (344 | ) | (133 | ) | ||||||
Prepaid expenses and other assets | 2,717 | 379 | 1,453 | |||||||||
Accounts payable and other liabilities | 622 | (812 | ) | 659 | ||||||||
Deferred income taxes | 964 | 475 | (530 | ) | ||||||||
Accrued interest payable | 138 | (57 | ) | 130 | ||||||||
NET CASH PROVIDED BY OPERATING ACTIVITIES | 25,618 | 17,668 | 19,918 | |||||||||
Cash flows from investing activities : | ||||||||||||
Net increase in loans | (112,372 | ) | (82,544 | ) | (64,354 | ) | ||||||
Net change in interest-bearing deposits | 723 | 1,221 | 9,661 | |||||||||
Proceeds from maturities of available for sale securities | 22,544 | 23,878 | 19,923 | |||||||||
Proceeds from sales of available for sale securities | - | 6,251 | 14,021 | |||||||||
Net redemptions (purchases) of Federal Home Loan Bank stock | 2,462 | (1,882 | ) | 1,370 | ||||||||
Net purchases of Federal Reserve Bank of St. Louis stock | (14 | ) | (3 | ) | (916 | ) | ||||||
Purchases of available-for-sale securities | (31,490 | ) | (29,295 | ) | (2,551 | ) | ||||||
Purchases of premises and equipment | (3,034 | ) | (9,818 | ) | (7,476 | ) | ||||||
Purchases of BOLI | - | (10,000 | ) | - | ||||||||
Net cash (paid for) received in acquisitions | (1,736 | ) | - | 3,221 | ||||||||
Investments in state & federal tax credits | (1,897 | ) | (352 | ) | - | |||||||
Proceeds from sale of fixed assets | 15 | 14 | 14 | |||||||||
Proceeds from sale of foreclosed assets | 835 | 1,663 | 790 | |||||||||
Proceeds from BOLI claim | 848 | 549 | - | |||||||||
NET CASH USED IN INVESTING ACTIVITIES | (123,116 | ) | (100,318 | ) | (26,297 | ) | ||||||
Cash flows from financing activities : | ||||||||||||
Net increase in demand deposits and savings accounts | 115,340 | 68,952 | 50,677 | |||||||||
Net increase (decrease) in certificates of deposits | 52,939 | (3,315 | ) | (2,741 | ) | |||||||
Net (decrease) increase in securities sold under agreements to repurchase | (16,873 | ) | (247 | ) | 1,771 | |||||||
Proceeds from Federal Home Loan Bank advances | 1,350,565 | 396,100 | 335,560 | |||||||||
Repayments of Federal Home Loan Bank advances | (1,416,815 | ) | (350,350 | ) | (371,960 | ) | ||||||
Proceeds from issuance of long term debt | 15,000 | - | - | |||||||||
Repayments of long term debt | (15,650 | ) | - | - | ||||||||
Redemption of common stock warrants | - | - | (2,700 | ) | ||||||||
Redemption of preferred stock | - | (20,000 | ) | - | ||||||||
Common stock issued | 24,144 | - | - | |||||||||
Exercise of stock options | 61 | 99 | 332 | |||||||||
Dividends paid on preferred stock | - | (135 | ) | (200 | ) | |||||||
Dividends paid on common stock | (2,981 | ) | (2,675 | ) | (2,517 | ) | ||||||
NET CASH PROVIDED BY FINANCING ACTIVITIES | 105,730 | 88,429 | 8,222 | |||||||||
Increase in cash and cash equivalents | 8,232 | 5,779 | 1,843 | |||||||||
Cash and cash equivalents at beginning of period | 22,554 | 16,775 | 14,932 | |||||||||
Cash and cash equivalents at end of period | $ | 30,786 | $ | 22,554 | $ | 16,775 | ||||||
Supplemental disclosures of cash flow information : | ||||||||||||
Noncash investing and financing activities : | ||||||||||||
Conversion of loans to foreclosed real estate | $ | 890 | $ | 537 | $ | 1,317 | ||||||
Conversion of foreclosed real estate to loans | 128 | 185 | 58 | |||||||||
Conversion of loans to repossessed assets | 130 | 194 | 128 | |||||||||
Cash paid during the period for : | ||||||||||||
Interest (net of interest credited) | $ | 3,132 | $ | 3,020 | $ | 2,634 | ||||||
Income taxes | 3,132 | 4,695 | 4,429 | |||||||||
See accompanying notes to consolidated financial statements.
73
NOTE 1: Organization and Summary of Significant Accounting Policies
Organization. Southern Missouri Bancorp, Inc., a Missouri corporation (the Company) was organized in 1994 and is the parent company of Southern Bank (the Bank). Substantially all of the Company's consolidated revenues are derived from the operations of the Bank, and the Bank represents substantially all of the Company's consolidated assets and liabilities. SB Real Estate Investments, LLC is a wholly-owned subsidiary of the Bank formed to hold Southern Bank Real Estate Investments, LLC. Southern Bank Real Estate Investments, LLC is a real estate investment trust (REIT) which is controlled by the investment subsidiary, which has other preferred shareholders in order to meet the requirements to be a REIT. At June 30, 2017, assets of the REIT were approximately $435 million, and consisted primarily of loan participations acquired from the Bank.
The Bank is primarily engaged in providing a full range of banking and financial services to individuals and corporate customers in its market areas. The Bank and Company are subject to competition from other financial institutions. The Bank and Company are subject to the regulation of certain federal and state agencies and undergo periodic examinations by those regulatory authorities.
Basis of Financial Statement Presentation. The financial statements of the Company have been prepared in conformity with accounting principles generally accepted in the United States of America and general practices within the banking industry. In the normal course of business, the Company encounters two significant types of risk: economic and regulatory. Economic risk is comprised of interest rate risk, credit risk, and market risk. The Company is subject to interest rate risk to the degree that its interest-bearing liabilities reprice on a different basis than its interest-earning assets. Credit risk is the risk of default on the Company's investment or loan portfolios resulting from the borrowers' inability or unwillingness to make contractually required payments. Market risk reflects changes in the value of the investment portfolio, collateral underlying loans receivable, and the value of the Company's investments in real estate.
Principles of Consolidation. The consolidated financial statements include the accounts of the Company and its wholly-owned subsidiary, the Bank. All significant intercompany accounts and transactions have been eliminated.
Use of Estimates. The preparation of financial statements in conformity with accounting principles generally accepted in the United States of America requires management to make estimates and assumptions that affect the reported amounts of assets and liabilities and disclosures of contingent assets and liabilities at the date of the financial statements and the reported amounts of revenues and expenses during the reporting period. Actual results could differ from those estimates.
Material estimates that are particularly susceptible to significant change relate to the determination of the allowance for loan losses, estimated fair values of purchased loans, other-than-temporary impairments (OTTI), and fair value of financial instruments.
Cash and Cash Equivalents. For purposes of reporting cash flows, cash and cash equivalents includes cash, due from depository institutions and interest-bearing deposits in other depository institutions with original maturities of three months or less. Interest-bearing deposits in other depository institutions were $6.7 million and $10.5 million at June 30, 2017 and 2016, respectively. The deposits are held in various commercial banks in amounts not exceeding the FDIC's deposit insurance limits, as well as at the Federal Reserve and the Federal Home Loan Bank of Des Moines and Chicago.
Interest-bearing Time Deposits. Interest-bearing deposits in banks mature within seven years and are carried at cost.
Available for Sale Securities. Available for sale securities, which include any security for which the Company has no immediate plan to sell but which may be sold in the future, are carried at fair value. Unrealized gains and losses, net of tax, are reported in accumulated other comprehensive income, a component of stockholders' equity. All securities have been classified as available for sale.
Premiums and discounts on debt securities are amortized or accreted as adjustments to income over the estimated life of the security using the level yield method. Realized gains or losses on the sale of securities is based on the specific identification method. The fair value of securities is based on quoted market prices or dealer quotes. If a quoted market price is not available, fair value is estimated using quoted market prices for similar securities.
The Company does not invest in collateralized mortgage obligations that are considered high risk.
74
When the Company does not intend to sell a debt security, and it is more likely than not the Company will not have to sell the security before recovery of its cost basis, it recognizes the credit component of an other-than-temporary impairment of a debt security in earnings and the remaining portion in other comprehensive income. As a result of this guidance, the Company's consolidated balance sheet for the dates presented reflects the full impairment (that is, the difference between the security's amortized cost basis and fair value) on debt securities that the Company intends to sell or would more likely than not be required to sell before the expected recovery of the amortized cost basis. For available-for-sale debt securities that management has no intent to sell and believes that it more likely than not will not be required to sell prior to recovery, only the credit loss component of the impairment is recognized in earnings, while the noncredit loss is recognized in accumulated other comprehensive income. The credit loss component recognized in earnings is identified as the amount of principal cash flows not expected to be received over the remaining term of the security as projected based on cash flow projections.
Federal Reserve Bank and Federal Home Loan Bank Stock. The Bank is a member of the Federal Reserve and the Federal Home Loan Bank (FHLB) systems. Capital stock of the Federal Reserve and the FHLB is a required investment based upon a predetermined formula and is carried at cost.
Loans. Loans are generally stated at unpaid principal balances, less the allowance for loan losses and net deferred loan origination fees.
Interest on loans is accrued based upon the principal amount outstanding. The accrual of interest on loans is discontinued when, in management's judgment, the collectability of interest or principal in the normal course of business is doubtful. The Company complies with regulatory guidance which indicates that loans should be placed in nonaccrual status when 90 days past due, unless the loan is both well-secured and in the process of collection. A loan that is "in the process of collection" may be subject to legal action or, in appropriate circumstances, through other collection efforts reasonably expected to result in repayment or restoration to current status in the near future. A loan is considered delinquent when a payment has not been made by the contractual due date. Interest income previously accrued but not collected at the date a loan is placed on nonaccrual status is reversed against interest income. Cash receipts on a nonaccrual loan are applied to principal and interest in accordance with its contractual terms unless full payment of principal is not expected, in which case cash receipts, whether designated as principal or interest, are applied as a reduction of the carrying value of the loan. A nonaccrual loan is generally returned to accrual status when principal and interest payments are current, full collectability of principal and interest is reasonably assured, and a consistent record of performance has been demonstrated.
The allowance for losses on loans represents management's best estimate of losses probable in the existing loan portfolio. The allowance for losses on loans is increased by the provision for losses on loans charged to expense and reduced by loans charged off, net of recoveries. Loans are charged off in the period deemed uncollectible, based on management's analysis of expected cash flows (for non-collateral dependent loans) or collateral value (for collateral-dependent loans). Subsequent recoveries of loans previously charged off, if any, are credited to the allowance when received. The provision for losses on loans is determined based on management's assessment of several factors: reviews and evaluations of specific loans, changes in the nature and volume of the loan portfolio, current economic conditions and the related impact on specific borrowers and industry groups, historical loan loss experience, the level of classified and nonperforming loans, and the results of regulatory examinations.
Loans are considered impaired if, based on current information and events, it is probable that the Company will be unable to collect the scheduled payments of principal or interest when due according to the contractual terms of the loan agreement. Depending on a particular loan's circumstances, we measure impairment of a loan based upon either the present value of expected future cash flows discounted at the loan's effective interest rate, the loan's observable market price, or the fair value of the collateral less estimated costs to sell if the loan is collateral dependent. Valuation allowances are established for collateral-dependent impaired loans for the difference between the loan amount and fair value of collateral less estimated selling costs. For impaired loans that are not collateral dependent, a valuation allowance is established for the difference between the loan amount and the present value of expected future cash flows discounted at the historical effective interest rate or the observable market price of the loan. Impairment losses are recognized through an increase in the required allowance for loan losses. Cash receipts on loans deemed impaired are recorded based on the loan's separate status as a nonaccrual loan or an accrual status loan.
Some loans are accounted for in accordance with ASC 310-30, Loans and Debt Securities Acquired with Deteriorated Credit Quality. For these loans ("purchased credit impaired loans"), the Company recorded a fair value discount and began carrying them at book value less their face amount (see Note 4). For these loans, we determined the contractual amount and timing of undiscounted principal and interest payments (the "undiscounted contractual cash flows"), and estimated the amount and timing of undiscounted expected principal and interest payments,
75
including expected prepayments (the "undiscounted expected cash flows"). Under acquired impaired loan accounting, the difference between the undiscounted contractual cash flows and the undiscounted expected cash flows is the nonaccretable difference. The nonaccretable difference is an estimate of the loss exposure of principal and interest related to the purchased credit impaired loans, and the amount is subject to change over time based on the performance of the loans. The carrying value of purchased credit impaired loans is initially determined as the discounted expected cash flows. The excess of expected cash flows at acquisition over the initial fair value of the purchased credit impaired loans is referred to as the "accretable yield" and is recorded as interest income over the estimated life of the acquired loans using the level-yield method, if the timing and amount of the future cash flows is reasonably estimable. The carrying value of purchased credit impaired loans is reduced by payments received, both principal and interest, and increased by the portion of the accretable yield recognized as interest income. Subsequent to acquisition, the Company evaluates the purchased credit impaired loans on a quarterly basis. Increases in expected cash flows compared to those previously estimated increase the accretable yield and are recognized as interest income prospectively. Decreases in expected cash flows compared to those previously estimated decrease the accretable yield and may result in the establishment of an allowance for loan losses and a provision for loan losses. Purchased credit impaired loans are generally considered accruing and performing loans, as the loans accrete interest income over the estimated life of the loan when expected cash flows are reasonably estimable. Accordingly, purchased credit impaired loans that are contractually past due are still considered to be accruing and performing as long as there is an expectation that the estimated cash flows will be received. If the timing and amount of cash flows is not reasonably estimable, the loans may be classified as nonaccrual loans.
Loan fees and certain direct loan origination costs are deferred, and the net fee or cost is recognized as an adjustment to interest income using the interest method over the contractual life of the loans.
Foreclosed Real Estate. Real estate acquired by foreclosure or by deed in lieu of foreclosure is initially recorded at fair value less estimated selling costs. Costs for development and improvement of the property are capitalized.
Valuations are periodically performed by management, and an allowance for losses is established by a charge to operations if the carrying value of a property exceeds its estimated fair value, less estimated selling costs.
Loans to facilitate the sale of real estate acquired in foreclosure are discounted if made at less than market rates. Discounts are amortized over the fixed interest period of each loan using the interest method.
Premises and Equipment. Premises and equipment are stated at cost less accumulated depreciation and include expenditures for major betterments and renewals. Maintenance, repairs, and minor renewals are expensed as incurred. When property is retired or sold, the retired asset and related accumulated depreciation are removed from the accounts and the resulting gain or loss taken into income. The Company reviews property and equipment for impairment whenever events or changes in circumstances indicate that the carrying amount of an asset may not be recoverable. If such assets are considered to be impaired, the impairment loss recognized is measured by the amount by which the carrying amount exceeds the fair value of the assets.
Depreciation is computed by use of straight-line and accelerated methods over the estimated useful lives of the assets. Estimated lives are generally seven to forty years for premises, three to seven years for equipment, and three years for software.
Bank Owned Life Insurance. Bank owned life insurance policies are reflected in the consolidated balance sheets at the estimated cash surrender value. Changes in the cash surrender value of these policies, as well as a portion of the insurance proceeds received, are recorded in noninterest income in the consolidated statements of income.
Intangible Assets. The Company's intangible assets at June 30, 2017 included gross core deposit intangibles of $9.2 million with $3.8 million accumulated amortization, gross other identifiable intangibles of $3.8 million with accumulated amortization of $3.8 million, and FHLB mortgage servicing rights of $1.3 million. At June 30, 2016, the Company's intangible assets included gross core deposit intangibles of $5.9 million with $3.0 million accumulated amortization, gross other identifiable intangibles of $3.8 million with accumulated amortization of $3.8 million, and FHLB mortgage servicing rights of $275,000. The Company's core deposit intangible assets are being amortized using the straight line method, over periods ranging from five to seven years, with amortization expense expected to be approximately $1.4 million in fiscal 2018, $1.1 million in fiscal 2019, $982,000 in fiscal 2020, $523,000 in fiscal 2021, and $482,000 in fiscal 2022.
76
Goodwill. The Company's goodwill is evaluated annually for impairment or more frequently if impairment indicators are present. A qualitative assessment is performed to determine whether the existence of events or circumstances leads to a determination that it is more likely than not the fair value is less than the carrying amount, including goodwill. If, based on the evaluation, it is determined to be more likely than not that the fair value is less than the carrying value, then goodwill is tested further for impairment. If the implied fair value of goodwill is lower than its carrying amount, a goodwill impairment is indicated and goodwill is written down to its implied fair value. Subsequent increases in goodwill value are not recognized in the financial statements.
Income Taxes. T he Company accounts for income taxes in accordance with income tax accounting guidance (ASC 740, Income Taxes). The income tax accounting guidance results in two components of income tax expense: current and deferred. Current income tax expense reflects taxes to be paid or refunded for the current period by applying the provisions of the enacted tax law to the taxable income or excess of deductions over revenues. The Company determines deferred income taxes using the liability (or balance sheet) method. Under this method, the net deferred tax asset or liability is based on the tax effects of the differences between the book and tax bases of assets and liabilities, and enacted changes in tax rates and laws are recognized in the period in which they occur.
Deferred income tax expense results from changes in deferred tax assets and liabilities between periods. Deferred tax assets are recognized if it is more likely than not, based on the technical merits, that the tax position will be realized or sustained upon examination. The term more likely than not means a likelihood of more than 50 percent; the terms examined and upon examination also include resolution of the related appeals or litigation processes, if any. A tax position that meets the more-likely-than-not recognition threshold is initially and subsequently measured as the largest amount of tax benefit that has a greater than 50 percent likelihood of being realized upon settlement with a taxing authority that has full knowledge of all relevant information. The determination of whether or not a tax position has met the more-likely-than-not recognition threshold considers the facts, circumstances, and information available at the reporting date and is subject to the management's judgment. Deferred tax assets are reduced by a valuation allowance if, based on the weight of evidence available, it is more likely than not that some portion or all of a deferred tax asset will not be realized.
The Company recognizes interest and penalties on income taxes as a component of income tax expense.
The Company files consolidated income tax returns with its subsidiary.
Incentive Plan. The Company accounts for its Management and Recognition Plan (MRP) and Equity Incentive Plan (EIP) in accordance with ASC 718, "Share-Based Payment." Compensation expense is based on the market price of the Company's stock on the date the shares are granted and is recorded over the vesting period. The difference between the grant-date fair value and the fair value on the date the shares are considered earned represents a tax benefit to the Company that is recorded as an adjustment to additional paid in capital.
Outside Directors' Retirement. The Bank adopted a directors' retirement plan in April 1994 for outside directors. The directors' retirement plan provides that each non-employee director (participant) shall receive, upon termination of service on the Board on or after age 60, other than termination for cause, a benefit in equal annual installments over a five year period. The benefit will be based upon the product of the participant's vesting percentage and the total Board fees paid to the participant during the calendar year preceding termination of service on the Board. The vesting percentage shall be determined based upon the participant's years of service on the Board, whether before or after the reorganization date.
In the event that the participant dies before collecting any or all of the benefits, the Bank shall pay the participant's beneficiary. No benefits shall be payable to anyone other than the beneficiary, and shall terminate on the death of the beneficiary.
Stock Options. C ompensation cost is measured based on the grant-date fair value of the equity instruments issued, and recognized over the vesting period during which an employee provides service in exchange for the award.
Earnings Per Share. Basic earnings per share available to common stockholders is computed using the weighted-average number of common shares outstanding. Diluted earnings per share available to common stockholders includes the effect of all weighted-average dilutive potential common shares (stock options and warrants) outstanding during each year. All per share data has been restated to reflect the two-for-one common stock split in the form of a 100% common stock dividend paid on January 30, 2015.
77
Comprehensive Income. Comprehensive income consists of net income and other comprehensive income, net of applicable income taxes. Other comprehensive income includes unrealized appreciation (depreciation) on available-for-sale securities, unrealized appreciation (depreciation) on available-for-sale securities for which a portion of an other-than-temporary impairment has been recognized in income, and changes in the funded status of defined benefit pension plans.
Transfers Between Fair Value Hierarchy Levels. Transfers in and out of Level 1 (quoted market prices), Level 2 (other significant observable inputs) and Level 3 (significant unobservable inputs) are recognized on the period ending date.
The following paragraphs summarize the impact of new accounting pronouncements:
In March 2017, the Financial Accounting Standards Board (FASB) issued Accounting Standards Update (ASU) 2017-08, Receivables – Nonrefundable Fees and Other Costs: Premium Amortization on Purchased Callable Debt Securities (Subtopic 310-20). The Update amends the amortization period for certain callable debt securities held at a premium. The Update requires the premium to be amortized to the earliest call date. For public companies, the ASU is effective for fiscal years beginning after December 15, 2018, including interim periods. Early adoption is permitted. The Company elected to adopt the ASU early, and there was not a material impact on the Company's consolidated financial statements.
In January 2017, the Financial Accounting Standards Board (FASB) issued Accounting Standards Update (ASU) 2017-04, Intangibles - Goodwill and Other (Topic 350), Simplifying the Test for Goodwill Impairment. The objective of the Update is to expand the simplification of the subsequent measurement of goodwill to include public business entities and not-for-profit entities. The simplification eliminates Step 2 from the goodwill impairment test, which measures a goodwill impairment loss by comparing the implied fair value of the reporting unit's goodwill with the carrying amount of that goodwill. For public companies that are U.S. Securities and Exchange Commission (SEC) filers, the ASU is effective for fiscal years beginning after December 15, 2019, including interim periods, and should be applied on a prospective basis. Early adoption is permitted for interim or annual goodwill impairment tests performed on testing dates after January 1, 2017. Management is evaluating the impact of the new guidance, but does not expect the adoption of this guidance to have a material impact on the Company's consolidated financial statements.
In October 2016, the FASB issued ASU 2016-16, Income Taxes (Topic 740). The Update provides guidance to improve the accounting for the income tax consequences of intra-entity transfers of assets other than inventory. Under the new guidance, companies should recognize the income tax consequences of an intra-entity transfer of an asset other than inventory when the transfer occurs. Intellectual property and property, plant, and equipment, are two common examples of assets included in the scope of this Update. For public companies, the ASU is effective for fiscal years beginning after December 15, 2017, including interim periods within those fiscal years. Management is evaluating the impact of the new guidance, but does not expect the adoption of this guidance to have a material impact on the Company's consolidated financial statements.
In August 2016, the FASB issued ASU 2016-15, Statement of Cash Flows (Topic 230), Classification of Certain Cash Receipts and Cash payments. The Update provides guidance on how certain cash receipts and payments are presented and classified in the statement of cash flows, with the objective of reducing the diversity in practice. The Update addresses eight specific cash flow issues. For public companies, the ASU is effective for fiscal years beginning after December 15, 2017, including interim periods within those fiscal years, and should be applied retrospectively. Management is evaluating the impact of the new guidance, but does not expect the adoption of this guidance to have a material impact on the Company's consolidated financial statements.
In June 2016, the FASB issued ASU 2016-13, Financial Instruments – Credit Losses (Topic 326). The Update amends guidance on reporting credit losses for assets held at amortized cost basis and available for sale debt securities. For assets held at amortized cost basis, Topic 326 eliminates the probable initial recognition threshold in current GAAP and, instead, requires an entity to reflect its current estimate of all expected credit losses. The Update affects loans, debt securities, trade receivables, net investments in leases, off balance sheet credit exposures, and any other financial assets not excluded from the scope that have the contractual right to receive cash. For public companies, the ASU is effective for fiscal years beginning after December 15, 2019, including interim periods within those fiscal years. Early adoption is available beginning after December 15, 2018, including interim periods within those fiscal years. Adoption will be applied on a modified retrospective basis, through a cumulative-effect adjustment to retained earnings. Management is evaluating the impact that this new guidance will have on the Company's consolidated financial statements, and evaluating the data and systems requirements of adoption of the Update.
78
In March 2016, the FASB issued ASU 2016-09, Compensation - Stock Compensation (Topic 718), Improvements to Employee Share-Based Payment Accounting. The objective of the Update is to simplify the accounting for share-based payment transactions, including the accounting for income taxes and forfeitures, statutory tax withholding requirements, classification of awards as either equity or liabilities, and classification on the statement of cash flows. For public companies, the ASU is effective for fiscal years beginning after December 15, 2016, including interim periods within those fiscal years. Management is evaluating the impact of the new guidance, but does not expect the adoption of this guidance to have a material impact on the Company's consolidated financial statements.
In February 2016, the FASB issued ASU 2016-02, "Leases," to revise the accounting related to lease accounting. Under the new guidance, a lessee is required to record a right-of-use (ROU) asset and a lease liability on the balance sheet for all leases with terms longer than 12 months. The ASU is effective for fiscal years beginning after December 15, 2018, including interim periods within those fiscal years. Adoption of the standard requires the use of a modified retrospective transition approach for all periods presented at the time of adoption. Management is evaluating the impact of the new guidance, but does not expect the adoption of this guidance to have a material impact on the Company's consolidated financial statements.
In January 2016, the FASB issued ASU 2016-01, "Recognition and Measurement of Financial Assets and Financial Liabilities," to generally require equity investments be measured at fair value with changes in fair value recognized in net income, simplify the impairment assessment of equity investments without readily-determinable fair value, and change disclosure and presentation requirements regarding financial instruments and other comprehensive income, and clarify that an entity should evaluate the need for a valuation allowance on a deferred tax asset related to available-for-sale securities in combination with the entity's other deferred tax assets. For public entities, the guidance is effective for fiscal years beginning after December 15, 2017, including interim periods within those fiscal years. Management is evaluating the new guidance, but does not expect the adoption of this guidance to have a material impact on the Company's consolidated financial statements.
In August 2015, the FASB issued ASU 2015-14, Revenue from Contracts with Customers (Topic 606): Deferral of the Effective Date, which deferred the effective date of ASU 2014-09. In May 2014, the FASB issued ASU 2014-09, Revenue from Contracts with Customers (Topic 606): Summary and Amendments that Create Revenue from Contracts with Customers (Topic 606) and Other Assets and Deferred Costs-Contracts with Customers (Subtopic 340-40). The guidance in this Update supersedes the revenue recognition requirements in ASC Topic 605, Revenue Recognition, and most industry-specific guidance throughout the industry topics of the codification. For public companies, the original Update was to be effective for interim and annual periods beginning after December 15, 2016. The current ASU states that the provisions of ASU 2014-09 should be applied to annual reporting periods, including interim periods, beginning after December 15, 2017. The Company does not expect the new standard to result in a material change to our accounting for revenue because the majority of our financial instruments are not within the scope of Topic 606, however, it may result in new disclosure requirements.
NOTE 2: Available-for-Sale Securities
The amortized cost, gross unrealized gains, gross unrealized losses and approximate fair value of securities available for sale consisted of the following:
June 30, 2017 | ||||||||||||||||
Gross | Gross | Estimated | ||||||||||||||
Amortized | Unrealized | Unrealized | Fair | |||||||||||||
(dollars in thousands) | Cost | Gains | Losses | Value | ||||||||||||
Debt and equity securities: | ||||||||||||||||
U.S. government and Federal agency obligations | $ | 10,433 | $ | 17 | $ | (12 | ) | $ | 10,438 | |||||||
Obligations of states and political subdivisions | 49,059 | 1,046 | (127 | ) | 49,978 | |||||||||||
Other securities | 6,017 | 306 | (598 | ) | 5,725 | |||||||||||
TOTAL DEBT AND EQUITY SECURITIES | 65,509 | 1,369 | (737 | ) | 66,141 | |||||||||||
Mortgage-backed securities: | ||||||||||||||||
FHLMC certificates | 21,380 | 165 | (56 | ) | 21,489 | |||||||||||
GNMA certificates | 1,437 | 12 | - | 1,449 | ||||||||||||
FNMA certificates | 28,457 | 234 | (63 | ) | 28,628 | |||||||||||
CMOs issues by government agencies | 26,814 | 79 | (184 | ) | 26,709 | |||||||||||
TOTAL MORTGAGE-BACKED SECURITIES | 78,088 | 490 | (303 | ) | 78,275 | |||||||||||
TOTAL | $ | 143,597 | $ | 1,859 | $ | (1,040 | ) | $ | 144,416 | |||||||
79
June 30, 2016 | ||||||||||||||||
Gross | Gross | Estimated | ||||||||||||||
Amortized | Unrealized | Unrealized | Fair | |||||||||||||
(dollars in thousands) | Cost | Gains | Losses | Value | ||||||||||||
Debt and equity securities: | ||||||||||||||||
U.S. government and Federal agency obligations | $ | 6,460 | $ | 57 | $ | - | $ | 6,517 | ||||||||
Obligations of states and political subdivisions | 44,368 | 1,820 | (3 | ) | 46,185 | |||||||||||
Other securites | 5,861 | 206 | (776 | ) | 5,291 | |||||||||||
TOTAL DEBT AND EQUITY SECURITIES | 56,689 | 2,083 | (779 | ) | 57,993 | |||||||||||
Mortgage-backed securities: | ||||||||||||||||
FHLMC certificates | 23,298 | 501 | - | 23,799 | ||||||||||||
GNMA certificates | 1,814 | 42 | - | 1,856 | ||||||||||||
FNMA certificates | 28,292 | 639 | - | 28,931 | ||||||||||||
CMOs issues by government agencies | 16,489 | 160 | (4 | ) | 16,645 | |||||||||||
TOTAL MORTGAGE-BACKED SECURITIES | 69,893 | 1,342 | (4 | ) | 71,231 | |||||||||||
TOTAL | $ | 126,582 | $ | 3,425 | $ | (783 | ) | $ | 129,224 | |||||||
The amortized cost and fair value of available-for-sale securities, by contractual maturity, are shown below. Expected maturities will differ from contractual maturities because borrowers may have the right to call or prepay obligations with or without call or prepayment penalties.
June 30, 2017 | ||||||||
Amortized | Estimated | |||||||
(dollars in thousands) | Cost | Fair Value | ||||||
Within one year | $ | 2,994 | $ | 3,010 | ||||
After one year but less than five years | 16,654 | 16,753 | ||||||
After five years but less than ten years | 20,824 | 21,140 | ||||||
After ten years | 25,037 | 25,238 | ||||||
Total investment securities | 65,509 | 66,141 | ||||||
Mortgage-backed securities | 78,088 | 78,275 | ||||||
Total investments and mortgage-backed securities | $ | 143,597 | $ | 144,416 | ||||
The carrying value of investment and mortgage-backed securities pledged as collateral to secure public deposits and securities sold under agreements to repurchase amounted to $114.1 million and $106.7 million at June 30, 2017 and 2016, respectively. The securities pledged consist of marketable securities, including $6.5 million and $5.5 million of U.S. Government and Federal Agency Obligations, $50.5 million and $52.2 million of Mortgage-Backed Securities, $19.9 million and $13.6 million of Collateralized Mortgage Obligations, $36.8 million and $34.8 million of State and Political Subdivisions Obligations, and $400,000 and $600,000 of Other Securities at June 30, 2017 and 2016, respectively.
Gains of $9,919 and $105,221 were recognized from sales of available-for-sale securities in 2016 and 2015 respectively. Losses of $4,956 and $98,993 were recognized from sales of available-for-sale securities in 2016 and 2015 respectively. There were no sales of available-for-sale securities in 2017.
With the exception of U.S. government agencies, the Company did not hold any securities of a single issuer, payable from and secured by the same source of revenue or taxing authority, the book value of which exceeded 10% of stockholders' equity at June 30, 2017.
Certain investments in debt securities are reported in the financial statements at an amount less than their historical cost. Total fair value of these investments at June 30, 2017, was $52.3 million, which is approximately 36.2% of the Company's available for sale investment portfolio, as compared to $4.7 million or approximately 3.6% of the Company's available for sale investment portfolio at June 30, 2016. Except as discussed below, management believes the declines in fair value for these securities to be temporary.
The tables below show our investments' gross unrealized losses and fair value, aggregated by investment category and length of time that individual securities have been in a continuous unrealized loss position at June 30, 2017 and 2016.
80
Less than 12 months | More than 12 months | Total | ||||||||||||||||||||||
Unrealized | Unrealized | Unrealized | ||||||||||||||||||||||
For the year ended June 30, 2017 | Fair Value | Losses | Fair Value | Losses | Fair Value | Losses | ||||||||||||||||||
(dollars in thousands) | ||||||||||||||||||||||||
U.S. government-sponsored enterprises (GSEs) | $ | 6,457 | $ | 12 | $ | - | $ | - | $ | 6,457 | $ | 12 | ||||||||||||
Obligations of state and political subdivisions | 12,341 | 127 | 256 | - | 12,597 | 127 | ||||||||||||||||||
Other securities | - | - | 1,160 | 598 | 1,160 | 598 | ||||||||||||||||||
Mortgage-backed securities | 29,836 | 267 | 2,285 | 36 | 32,121 | 303 | ||||||||||||||||||
Total investments and mortgage-backed securities | $ | 48,634 | $ | 406 | $ | 3,701 | $ | 634 | $ | 52,335 | $ | 1,040 | ||||||||||||
Less than 12 months | More than 12 months | Total | ||||||||||||||||||||||
Unrealized | Unrealized | Unrealized | ||||||||||||||||||||||
For the year ended June 30, 2016 | Fair Value | Losses | Fair Value | Losses | Fair Value | Losses | ||||||||||||||||||
(dollars in thousands) | ||||||||||||||||||||||||
Obligations of state and political subdivisions | 720 | 3 | - | - | 720 | 3 | ||||||||||||||||||
Other securities | - | - | 1,080 | 776 | 1,080 | 776 | ||||||||||||||||||
Mortgage-backed securities | 2,912 | 4 | - | - | 2,912 | 4 | ||||||||||||||||||
Total investments and mortgage-backed securities | $ | 3,632 | $ | 7 | $ | 1,080 | $ | 776 | $ | 4,712 | $ | 783 | ||||||||||||
The unrealized losses on the Company's investments in U.S. government-sponsored enterprises, mortgage-backed securities, and obligations of state and political subdivisions were caused by increases in market interest rates. The contractual terms of these instruments do not permit the issuer to settle the securities at a price less than the amortized cost basis of the investments. Because the Company does not intend to sell the investments and it is not more likely than not the Company will be required to sell the investments before recovery of their amortized cost basis, which may be maturity, the Company does not consider these investments to be other-than-temporarily impaired at June 30, 2017.
Other securities. At June 30, 2017, there were three pooled trust preferred securities with an estimated fair value of $824,000 and unrealized losses of $590,000 in a continuous unrealized loss position for twelve months or more. These unrealized losses were primarily due to the long-term nature of the pooled trust preferred securities and a reduced demand for these securities, and concerns regarding the financial institutions that issued the underlying trust preferred securities. Rules adopted by the federal banking agencies in December 2013 to implement Section 619 of the Dodd-Frank Act (the "Volcker Rule") generally prohibit banking entities from engaging in proprietary trading and from investing in, sponsoring, or having certain relationships with a hedge fund or private equity fund. All pooled trust preferred securities owned by the Company were included in a January 2014 listing of securities which the agencies considered to be grandfathered with regard to these prohibitions; as such, banking entities are permitted to retain their interest in these securities, provided the interest was acquired on or before December 10, 2013, unless acquired pursuant to a merger or acquisition.
The June 30, 2017, cash flow analysis for these three securities indicated it is probable the Company will receive all contracted principal and related interest projected. The cash flow analysis used in making this determination was based on anticipated default, recovery, and prepayment rates, and the resulting cash flows were discounted based on the yield spread anticipated at the time the securities were purchased. Other inputs include the actual collateral attributes, which include credit ratings and other performance indicators of the underlying financial institutions, including profitability, capital ratios, and asset quality. Assumptions for these three securities included annualized prepayments of 1.3 to 1.7 percent; recoveries of 21 percent on currently deferred issuers within the next two years; new deferrals of 48 to 50 basis points annually; and eventual recoveries of eight to nine percent of new deferrals.
One of these three securities has continued to receive cash interest payments in full since our purchase; two of the three securities received principal-in-kind (PIK), in lieu of cash interest, for a period of time following the recession and financial crisis which began in 2008, but have since resumed cash interest payments. One of the two securities which were in PIK status resumed cash interest payments during fiscal 2014, and the second resumed cash interest payments during fiscal 2017. Our cash flow analysis indicates that cash interest payments are expected to continue for the three securities. Because the Company does not intend to sell these securities and it is not more-likely-than-not that the Company will be required to sell these securities prior to recovery of their amortized cost basis, which may be maturity, the Company does not consider these investments to be other-than-temporarily impaired at June 30, 2017.
At December 31, 2008, analysis of a fourth pooled trust preferred security indicated other-than-temporary impairment (OTTI). The loss recognized at that time reduced the amortized cost basis for the security, and as of June 30, 2017, the estimated fair value of the security exceeds the new, lower amortized cost basis.
81
The Company does not believe any other individual unrealized loss as of June 30, 2017, represents OTTI. However, the Company could be required to recognize OTTI losses in future periods with respect to its available for sale investment securities portfolio. The amount and timing of any additional OTTI will depend on the decline in the underlying cash flows of the securities. Should the impairment of any of these securities become other-than-temporary, the cost basis of the investment will be reduced and the resulting loss recognized in the period the other-than-temporary impairment is identified.
Credit losses recognized on investments. As described above, one of the Company's investments in trust preferred securities experienced fair value deterioration due to credit losses, but is not otherwise other-than-temporarily impaired. During fiscal 2009, the Company adopted ASC 820, formerly FASB Staff Position 157-4, "Determining Fair Value When the Volume and Level of Activity for the Asset or Liability Have Significantly Decreased and Identifying Transactions That Are Not Orderly." The following table provides information about the trust preferred security for which only a credit loss was recognized in income and other losses are recorded in other comprehensive income (loss) for the years ended June 30, 2017 and 2016.
Accumulated Credit Losses | ||||||||
Twelve-Month Period Ended | ||||||||
(dollars in thousands) | June 30, | |||||||
2017 | 2016 | |||||||
Credit losses on debt securities held | ||||||||
Beginning of period | $ | 352 | $ | 365 | ||||
Additions related to OTTI losses not previously recognized | - | - | ||||||
Reductions due to sales | - | - | ||||||
Reductions due to change in intent or likelihood of sale | - | - | ||||||
Additions related to increases in previously-recognized OTTI losses | - | - | ||||||
Reductions due to increases in expected cash flows | (12 | ) | (13 | ) | ||||
End of period | $ | 340 | $ | 352 | ||||
NOTE 3: Loans and Allowance for Loan Losses
Classes of loans are summarized as follows:
(dollars in thousands) | June 30, 2017 | June 30, 2016 | ||||||
Real Estate Loans: | ||||||||
Residential | $ | 442,463 | $ | 392,974 | ||||
Construction | 106,782 | 77,369 | ||||||
Commercial | 603,922 | 452,052 | ||||||
Consumer loans | 63,651 | 46,541 | ||||||
Commercial loans | 247,184 | 202,045 | ||||||
1,464,002 | 1,170,981 | |||||||
Loans in process | (50,740 | ) | (21,779 | ) | ||||
Deferred loan fees, net | 6 | 42 | ||||||
Allowance for loan losses | (15,538 | ) | (13,791 | ) | ||||
Total loans | $ | 1,397,730 | $ | 1,135,453 | ||||
The Company's lending activities consist of origination of loans secured by mortgages on one- to four-family residences and commercial and agricultural real estate, construction loans on residential and commercial properties, commercial and agricultural business loans and consumer loans. The Company has also occasionally purchased loan participation interests originated by other lenders and secured by properties generally located in the states of Missouri and Arkansas.
Residential Mortgage Lending. The Company actively originates loans for the acquisition or refinance of one- to four-family residences. This category includes both fixed-rate and adjustable-rate mortgage ("ARM") loans amortizing over periods of up to 30 years, and the properties securing such loans may be owner-occupied or non-owner-occupied. Single-family residential loans do not generally exceed 90% of the lower of the appraised value or purchase price of the secured property. Substantially all of the one- to four-family residential mortgage originations in the Company's portfolio are located within the Company's primary lending area.
The Company also originates loans secured by multi-family residential properties that are often located outside the Company's primary lending area but made to borrowers who operate within the primary market area. The majority of the multi-family residential loans that are originated by the Bank are amortized over periods generally up to 25 years, with balloon maturities typically up to ten years. Both fixed and adjustable interest rates are
82
offered and it is typical for the Company to include an interest rate "floor" and "ceiling" in the loan agreement. Generally, multi-family residential loans do not exceed 85% of the lower of the appraised value or purchase price of the secured property.
Commercial Real Estate Lending. The Company actively originates loans secured by commercial real estate including land (improved, unimproved, and farmland), strip shopping centers, retail establishments and other businesses. These properties are typically owned and operated by borrowers headquartered within the Company's primary lending area, however, the property may be located outside our primary lending area. Approximately $156.0 million of our $603.9 million in commercial real estate loans are secured by properties located outside our primary lending area.
Most commercial real estate loans originated by the Company generally are based on amortization schedules of up to 25 years with monthly principal and interest payments. Generally, the interest rate received on these loans is fixed for a maturity for up to seven years, with a balloon payment due at maturity. Alternatively, for some loans, the interest rate adjusts at least annually after an initial period up to seven years. The Company typically includes an interest rate "floor" in the loan agreement. Generally, improved commercial real estate loan amounts do not exceed 80% of the lower of the appraised value or the purchase price of the secured property. Agricultural real estate terms offered differ slightly, with amortization schedules of up to 25 years with an 80% loan-to-value ratio, or 30 years with a 75% loan-to-value ratio.
Construction Lending. The Company originates real estate loans secured by property or land that is under construction or development. Construction loans originated by the Company are generally secured by mortgage loans for the construction of owner occupied residential real estate or to finance speculative construction secured by residential real estate, land development, or owner-operated or non-owner occupied commercial real estate. During construction, these loans typically require monthly interest-only payments and have maturities ranging from six to twelve months. Once construction is completed, permanent construction loans may be converted to monthly payments using amortization schedules of up to 30 years on residential and generally up to 25 years on commercial real estate.
While the Company typically utilizes maturity periods ranging from 6 to 12 months to closely monitor the inherent risks associated with construction loans for these loans, weather conditions, change orders, availability of materials and/or labor, and other factors may contribute to the lengthening of a project, thus necessitating the need to renew the construction loan at the balloon maturity. Such extensions are typically executed in incremental three month periods to facilitate project completion. The Company's average term of construction loans is approximately eight months. During construction, loans typically require monthly interest only payments which may allow the Company an opportunity to monitor for early signs of financial difficulty should the borrower fail to make a required monthly payment. Additionally, during the construction phase, the Company typically performs interim inspections which further allows the Company opportunity to assess risk. At June 30, 2017, construction loans outstanding included 50 loans, totaling $10.3 million, for which a modification had been agreed to. At June 30, 2016, construction loans outstanding included 42 loans, totaling $10.3 million, for which a modification had been agreed to. All modifications were solely for the purpose of extending the maturity date due to conditions described above. None of these modifications were executed due to financial difficulty on the part of the borrower and, therefore, were not accounted for as TDRs.
Consumer Lending . The Company offers a variety of secured consumer loans, including home equity, direct and indirect automobile loans, second mortgages, mobile home loans and loans secured by deposits. The Company originates substantially all of its consumer loans in its primary lending area. Usually, consumer loans are originated with fixed rates for terms of up to five years, with the exception of home equity lines of credit, which are variable, tied to the prime rate of interest and are for a period of ten years.
Home equity lines of credit (HELOCs) are secured with a deed of trust and are issued up to 100% of the appraised or assessed value of the property securing the line of credit, less the outstanding balance on the first mortgage and are typically issued for a term of ten years. Interest rates on the HELOCs are generally adjustable. Interest rates are based upon the loan-to-value ratio of the property with better rates given to borrowers with more equity.
Automobile loans originated by the Company include both direct loans and a smaller amount of loans originated by auto dealers. The Company generally pays a negotiated fee back to the dealer for indirect loans. Typically, automobile loans are made for terms of up to 60 months for new and used vehicles. Loans secured by automobiles have fixed rates and are generally made in amounts up to 100% of the purchase price of the vehicle.
83
Commercial Business Lending . The Company's commercial business lending activities encompass loans with a variety of purposes and security, including loans to finance accounts receivable, inventory, equipment and operating lines of credit, including agricultural production and equipment loans. The Company offers both fixed and adjustable rate commercial business loans. Generally, commercial loans secured by fixed assets are amortized over periods up to five years, while commercial operating lines of credit or agricultural production lines are generally for a one year period.
The following tables present the balance in the allowance for loan losses and the recorded investment in loans (excluding loans in process and deferred loan fees) based on portfolio segment and impairment methods as of June 30, 2017 and 2016, and activity in the allowance for loan losses for the fiscal years ended June 30, 2017, 2016, and 2015.
(dollars in thousands) | Residential | Construction | Commercial | |||||||||||||||||||||
June 30, 2017 | Real Estate | Real Estate | Real Estate | Consumer | Commercial | Total | ||||||||||||||||||
Allowance for loan losses: | ||||||||||||||||||||||||
Balance, beginning of period | $ | 3,247 | $ | 1,091 | $ | 5,711 | $ | 738 | $ | 3,004 | $ | 13,791 | ||||||||||||
Provision charged to expense | 184 | (97 | ) | 1,356 | 76 | 821 | 2,340 | |||||||||||||||||
Losses charged off | (211 | ) | (31 | ) | (19 | ) | (65 | ) | (337 | ) | (663 | ) | ||||||||||||
Recoveries | 10 | 1 | 20 | 8 | 31 | 70 | ||||||||||||||||||
Balance, end of period | $ | 3,230 | $ | 964 | $ | 7,068 | $ | 757 | $ | 3,519 | $ | 15,538 | ||||||||||||
Ending Balance: individually | $ | - | $ | - | $ | - | $ | - | $ | - | $ | - | ||||||||||||
Ending Balance: collectively | $ | 3,230 | $ | 964 | $ | 7,068 | $ | 757 | $ | 3,519 | $ | 15,538 | ||||||||||||
Ending Balance: loans acquired | $ | - | $ | - | $ | - | $ | - | $ | - | $ | - | ||||||||||||
Loans: | ||||||||||||||||||||||||
Ending Balance: individually | $ | - | $ | - | $ | - | $ | - | $ | - | $ | - | ||||||||||||
Ending Balance: collectively | $ | 438,981 | $ | 54,704 | $ | 592,427 | $ | 63,651 | $ | 243,369 | $ | 1,393,132 | ||||||||||||
Ending Balance: loans acquired | $ | 3,482 | $ | 1,338 | $ | 11,495 | $ | - | $ | 3,815 | $ | 20,130 | ||||||||||||
(dollars in thousands) | Residential | Construction | Commercial | |||||||||||||||||||||
June 30, 2016 | Real Estate | Real Estate | Real Estate | Consumer | Commercial | Total | ||||||||||||||||||
Allowance for loan losses: | ||||||||||||||||||||||||
Balance, beginning of period | $ | 2,819 | $ | 899 | $ | 4,956 | $ | 758 | $ | 2,866 | $ | 12,298 | ||||||||||||
Provision charged to expense | 590 | 192 | 806 | 58 | 848 | 2,494 | ||||||||||||||||||
Losses charged off | (167 | ) | - | (97 | ) | (86 | ) | (725 | ) | (1,075 | ) | |||||||||||||
Recoveries | 5 | - | 46 | 8 | 15 | 74 | ||||||||||||||||||
Balance, end of period | $ | 3,247 | $ | 1,091 | $ | 5,711 | $ | 738 | $ | 3,004 | $ | 13,791 | ||||||||||||
Ending Balance: individually | $ | - | $ | - | $ | - | $ | - | $ | - | $ | - | ||||||||||||
Ending Balance: collectively | $ | 3,247 | $ | 1,091 | $ | 5,711 | $ | 738 | $ | 3,004 | $ | 13,791 | ||||||||||||
Ending Balance: loans acquired | $ | - | $ | - | $ | - | $ | - | $ | - | $ | - | ||||||||||||
Loans: | ||||||||||||||||||||||||
Ending Balance: individually | $ | - | $ | - | $ | - | $ | - | $ | - | $ | - | ||||||||||||
Ending Balance: collectively | $ | 389,978 | $ | 54,187 | $ | 442,173 | $ | 46,541 | $ | 201,013 | $ | 1,133,892 | ||||||||||||
Ending Balance: loans acquired | $ | 2,996 | $ | 1,403 | $ | 9,879 | $ | - | $ | 1,032 | $ | 15,310 | ||||||||||||
(dollars in thousands) | Residential | Construction | Commercial | |||||||||||||||||||||
June 30, 2015 | Real Estate | Real Estate | Real Estate | Consumer | Commercial | Total | ||||||||||||||||||
Allowance for loan losses: | ||||||||||||||||||||||||
Balance, beginning of period | $ | 2,462 | $ | 355 | $ | 4,143 | $ | 519 | $ | 1,780 | $ | 9,259 | ||||||||||||
Provision charged to expense | 400 | 544 | 775 | 334 | 1,132 | 3,185 | ||||||||||||||||||
Losses charged off | (54 | ) | - | (9 | ) | (128 | ) | (50 | ) | (241 | ) | |||||||||||||
Recoveries | 11 | - | 47 | 33 | 4 | 95 | ||||||||||||||||||
Balance, end of period | $ | 2,819 | $ | 899 | $ | 4,956 | $ | 758 | $ | 2,866 | $ | 12,298 | ||||||||||||
84
Management's opinion as to the ultimate collectability of loans is subject to estimates regarding future cash flows from operations and the value of property, real and personal, pledged as collateral. These estimates are affected by changing economic conditions and the economic prospects of borrowers.
The allowance for loan losses is maintained at a level that, in management's judgment, is adequate to cover probable credit losses inherent in the loan portfolio at the balance sheet date. The allowance for loan losses is established as losses are estimated to have occurred through a provision for loan losses charged to earnings. Loan losses are charged against the allowance when an amount is determined to be uncollectible, based on management's analysis of expected cash flow (for non-collateral dependent loans) or collateral value (for collateral-dependent loans). Subsequent recoveries, if any, are credited to the allowance.
The allowance for loan losses is evaluated on a regular basis by management and is based upon management's periodic review of the collectability of the loans in light of historical experience, the nature and volume of the loan portfolio, adverse situations that may affect the borrower's ability to repay, estimated value of any underlying collateral and prevailing economic conditions. This evaluation is inherently subjective as it requires estimates that are susceptible to significant revision as more information becomes available.
The allowance consists of allocated and general components. The allocated component relates to loans that are classified as impaired. For those loans that are classified as impaired, an allowance is established when the discounted cash flows (or collateral value or observable market price) of the impaired loan is lower than the carrying value of that loan.
Under the Company's allowance methodology, loans are first segmented into 1) those comprising large groups of smaller-balance homogeneous loans, including single-family mortgages and installment loans, which are collectively evaluated for impairment, and 2) all other loans which are individually evaluated. Those loans in the second category are further segmented utilizing a defined grading system which involves categorizing loans by severity of risk based on conditions that may affect the ability of the borrowers to repay their debt, such as current financial information, collateral valuations, historical payment experience, credit documentation, public information, and current trends. The loans subject to credit classification represent the portion of the portfolio subject to the greatest credit risk and where adjustments to the allowance for losses on loans as a result of provisions and charge offs are most likely to have a significant impact on operations.
A periodic review of selected credits (based on loan size and type) is conducted to identify loans with heightened risk or probable losses and to assign risk grades. The primary responsibility for this review rests with loan administration personnel. This review is supplemented with periodic examinations of both selected credits and the credit review process by the Company's internal audit function and applicable regulatory agencies. The information from these reviews assists management in the timely identification of problems and potential problems and provides a basis for deciding whether the credit represents a probable loss or risk that should be recognized.
The Company considers, as the primary quantitative factor in its allowance methodology, average net charge offs over the most recent twelve-month period. The Company also reviews average net charge offs over the most recent five-year period.
A loan is considered impaired when, based on current information and events, it is probable that the scheduled payments of principal or interest will not be able to be collected when due according to the contractual terms of the loan agreement. Factors considered by management in determining impairment include payment status, collateral value and the probability of collecting scheduled principal and interest payments when due. Loans that experience insignificant payment delays and payment shortfalls generally are not classified as impaired. Management determines the significance of payment delays and payment shortfalls on a case-by-case basis, taking into consideration all of the circumstances surrounding the loan and the borrower, including the length of the delay, the reasons for the delay, the borrower's prior payment record and the amount of the shortfall in relation to the principal and interest owed. Impairment is measured on a loan-by-loan basis for commercial and agricultural loans by either the present value of expected future cash flows discounted at the loan's effective interest rate, the loan's obtainable market price or the fair value of the collateral if the loan is collateral dependent.
Groups of loans with similar risk characteristics are collectively evaluated for impairment based on the group's historical loss experience adjusted for changes in trends, conditions and other relevant factors that affect repayment of the loans. Accordingly, individual consumer and residential loans are not separately identified for impairment measurements, unless such loans are the subject of a restructuring agreement due to financial difficulties of the borrower.
85
The general component covers non-classified loans and is based on historical charge-off experience and expected loss given the internal risk rating process. The loan portfolio is stratified into homogeneous groups of loans that possess similar loss characteristics and an appropriate loss ratio adjusted for other qualitative factors is applied to the homogeneous pools of loans to estimate the incurred losses in the loan portfolio.
Included in the Company's loan portfolio are certain loans accounted for in accordance with ASC 310-30, Loans and Debt Securities Acquired with Deteriorated Credit Quality. These loans were written down at acquisition to an amount estimated to be collectible. As a result, certain ratios regarding the Company's loan portfolio and credit quality cannot be used to compare the Company to peer companies or to compare the Company's current credit quality to prior periods. The ratios particularly affected by accounting under ASC 310-30 include the allowance for loan losses as a percentage of loans, nonaccrual loans, and nonperforming assets, and nonaccrual loans and nonperforming loans as a percentage of total loans.
The following tables present the credit risk profile of the Company's loan portfolio (excluding loans in process and deferred loan fees) based on rating category and payment activity as of June 30, 2017 and 2016. These tables include purchased credit impaired loans, which are reported according to risk categorization after acquisition based on the Company's standards for such classification:
(dollars in thousands) | Residential | Construction | Commercial | |||||||||||||||||
June 30, 2017 | Real Estate | Real Estate | Real Estate | Consumer | Commercial | |||||||||||||||
Pass | $ | 438,222 | $ | 55,825 | $ | 588,385 | $ | 63,320 | $ | 240,864 | ||||||||||
Watch | 772 | - | 9,253 | 123 | 2,003 | |||||||||||||||
Special Mention | 148 | - | 926 | 30 | 84 | |||||||||||||||
Substandard | 3,321 | 217 | 5,358 | 178 | 3,631 | |||||||||||||||
Doubtful | - | - | - | - | 602 | |||||||||||||||
Total | $ | 442,463 | $ | 56,042 | $ | 603,922 | $ | 63,651 | $ | 247,184 | ||||||||||
(dollars in thousands) | Residential | Construction | Commercial | |||||||||||||||||
June 30, 2016 | Real Estate | Real Estate | Real Estate | Consumer | Commercial | |||||||||||||||
Pass | $ | 388,733 | $ | 55,202 | $ | 443,933 | $ | 46,341 | $ | 200,252 | ||||||||||
Watch | 583 | - | 3,095 | 24 | 16 | |||||||||||||||
Special Mention | - | - | - | - | - | |||||||||||||||
Substandard | 3,658 | 388 | 5,024 | 176 | 1,777 | |||||||||||||||
Doubtful | - | - | - | - | - | |||||||||||||||
Total | $ | 392,974 | $ | 55,590 | $ | 452,052 | $ | 46,541 | $ | 202,045 | ||||||||||
The above amounts include purchased credit impaired loans. At June 30, 2017, purchased credit impaired loans comprised $10.2 million of credits rated "Pass"; $5.0 million of credits rated "Watch", none rated "Special Mention", $4.9 million of credits rated "Substandard" and none rated "Doubtful". At June 30, 2016, purchased credit impaired loans comprised $9.2 million of credits rated "Pass"; $3.0 million of credits rated "Watch", none rated "Special Mention"; $3.1 million of credits rated "Substandard"; and none rated "Doubtful".
Credit Quality Indicators . The Company categorizes loans into risk categories based on relevant information about the ability of borrowers to service their debt such as: current financial information, historical payment experience, credit documentation, public information, and current economic trends among other factors. The Company analyzes loans individually by classifying the loans as to credit risk. This analysis is performed on all loans at origination, and is updated on a quarterly basis for loans risk rated Watch, Special Mention, Substandard, or Doubtful. In addition, lending relationships of $1 million or more, exclusive of any consumer or owner-occupied residential loan, are subject to an annual credit analysis which is prepared the loan administration department and presented to a loan committee with appropriate lending authority. A sample of lending relationships in excess of $2.5 million are subject to an independent loan review annually, in order to verify risk ratings. The Company uses the following definitions for risk ratings:
Watch – Loans classified as watch exhibit weaknesses that require more than usual monitoring. Issues may include deteriorating financial condition, payments made after due date but within 30 days, adverse industry conditions or management problems.
Special Mention – Loans classified as special mention exhibit signs of further deterioration but still generally make payments within 30 days. This is a transitional rating and loans should typically not be rated Special Mention for more than 12 months.
86
Substandard – Loans classified as substandard possess weaknesses that jeopardize the ultimate collection of the principal and interest outstanding. These loans exhibit continued financial losses, ongoing delinquency, overall poor financial condition, and insufficient collateral. They are characterized by the distinct possibility that the institution will sustain some loss if the deficiencies are not corrected.
Doubtful – Loans classified as doubtful have all the weaknesses of substandard loans, and have deteriorated to the level that there is a high probability of substantial loss.
Loans not meeting the criteria above that are analyzed individually as part of the above described process are considered to be Pass rated loans.
The following tables present the Company's loan portfolio aging analysis (excluding loans in process and deferred loan fees) as of June 30, 2017 and 2016. These tables include purchased credit impaired loans, which are reported according to aging analysis after acquisition based on the Company's standards for such classification:
Greater Than | Greater Than 90 | |||||||||||||||||||||||||||
(dollars in thousands) | 30-59 Days | 60-89 Days | 90 Days | Total | Total Loans | Days Past Due | ||||||||||||||||||||||
June 30, 2017 | Past Due | Past Due | Past Due | Past Due | Current | Receivable | and Accruing | |||||||||||||||||||||
Real Estate Loans: | ||||||||||||||||||||||||||||
Residential | $ | 1,491 | $ | 148 | $ | 676 | $ | 2,315 | $ | 440,148 | $ | 442,463 | $ | 59 | ||||||||||||||
Construction | 35 | - | - | 35 | 56,007 | 56,042 | - | |||||||||||||||||||||
Commercial | 700 | - | 711 | 1,411 | 602,511 | 603,922 | - | |||||||||||||||||||||
Consumer loans | 216 | 16 | 134 | 366 | 63,285 | 63,651 | 13 | |||||||||||||||||||||
Commercial loans | 144 | 53 | 426 | 623 | 246,561 | 247,184 | 329 | |||||||||||||||||||||
Total loans | $ | 2,586 | $ | 217 | $ | 1,947 | $ | 4,750 | $ | 1,408,512 | $ | 1,413,262 | $ | 401 | ||||||||||||||
Greater Than | Greater Than 90 | |||||||||||||||||||||||||||
(dollars in thousands) | 30-59 Days | 60-89 Days | 90 Days | Total | Total Loans | Days Past Due | ||||||||||||||||||||||
June 30, 2016 | Past Due | Past Due | Past Due | Past Due | Current | Receivable | and Accruing | |||||||||||||||||||||
Real Estate Loans: | ||||||||||||||||||||||||||||
Residential | $ | 1,157 | $ | 457 | $ | 1,970 | $ | 3,584 | $ | 389,390 | $ | 392,974 | $ | - | ||||||||||||||
Construction | 165 | - | 207 | 372 | 55,218 | 55,590 | - | |||||||||||||||||||||
Commercial | - | - | 33 | 33 | 452,019 | 452,052 | - | |||||||||||||||||||||
Consumer loans | 169 | 99 | 39 | 307 | 46,234 | 46,541 | 7 | |||||||||||||||||||||
Commercial loans | 209 | 138 | 623 | 970 | 201,075 | 202,045 | 31 | |||||||||||||||||||||
Total loans | $ | 1,700 | $ | 694 | $ | 2,872 | $ | 5,266 | $ | 1,143,936 | $ | 1,149,202 | $ | 38 | ||||||||||||||
At June 30, 2017 and 2016, there were no purchased credit impaired loans that were greater than 90 days past due.
A loan is considered impaired, in accordance with the impairment accounting guidance (ASC 310-10-35-16), when based on current information and events, it is probable the Company will be unable to collect all amounts due from the borrower in accordance with the contractual terms of the loan. Impaired loans include nonperforming loans but also include loans modified in troubled debt restructurings (TDRs) where concessions have been granted to borrowers experiencing financial difficulties. These concessions could include a reduction in the interest rate on the loan, payment extensions, forgiveness of principal, forbearance or other actions intended to maximize collection.
The following tables present impaired loans (excluding loans in process and deferred loan fees) as of June 30, 2017 and 2016. These tables include purchased credit impaired loans. Purchased credit impaired loans are those for which it was deemed probable, at acquisition, that the Company would be unable to collect all contractually required payments receivable. In an instance where, subsequent to the acquisition, the Company determines it is probable, for a specific loan, that cash flows received will exceed the amount previously expected, the Company will recalculate the amount of accretable yield in order to recognize the improved cash flow expectation as additional interest income over the remaining life of the loan. These loans, however, will continue to be reported as impaired loans. In an instance where, subsequent to the acquisition, the Company determines it is probable that, for a specific loan, that cash flows received will be less than the amount previously expected, the Company will allocate a specific allowance under the terms of ASC 310-10-35.
87
(dollars in thousands) | Recorded | Unpaid Principal | Specific | |||||||||
June 30, 2017 | Balance | Balance | Allowance | |||||||||
Loans without a specific valuation allowance: | ||||||||||||
Residential real estate | $ | 3,811 | $ | 4,486 | $ | - | ||||||
Construction real estate | 1,373 | 1,695 | - | |||||||||
Commercial real estate | 14,935 | 16,834 | - | |||||||||
Consumer loans | 1 | 1 | - | |||||||||
Commercial loans | 4,302 | 4,990 | - | |||||||||
Loans with a specific valuation allowance: | ||||||||||||
Residential real estate | $ | - | $ | - | $ | - | ||||||
Construction real estate | - | - | - | |||||||||
Commercial real estate | - | - | - | |||||||||
Consumer loans | - | - | - | |||||||||
Commercial loans | - | - | - | |||||||||
Total: | ||||||||||||
Residential real estate | $ | 3,811 | $ | 4,486 | $ | - | ||||||
Construction real estate | $ | 1,373 | $ | 1,695 | $ | - | ||||||
Commercial real estate | $ | 14,935 | $ | 16,834 | $ | - | ||||||
Consumer loans | $ | 1 | $ | 1 | $ | - | ||||||
Commercial loans | $ | 4,302 | $ | 4,990 | $ | - | ||||||
(dollars in thousands) | Recorded | Unpaid Principal | Specific | |||||||||
June 30, 2016 | Balance | Balance | Allowance | |||||||||
Loans without a specific valuation allowance: | ||||||||||||
Residential real estate | $ | 3,300 | $ | 3,558 | $ | - | ||||||
Construction real estate | 1,404 | 1,777 | - | |||||||||
Commercial real estate | 11,681 | 13,326 | - | |||||||||
Consumer loans | 36 | 36 | - | |||||||||
Commercial loans | 1,461 | 1,532 | - | |||||||||
Loans with a specific valuation allowance: | ||||||||||||
Residential real estate | $ | - | $ | - | $ | - | ||||||
Construction real estate | - | - | - | |||||||||
Commercial real estate | - | - | - | |||||||||
Consumer loans | - | - | - | |||||||||
Commercial loans | - | - | - | |||||||||
Total: | ||||||||||||
Residential real estate | $ | 3,300 | $ | 3,558 | $ | - | ||||||
Construction real estate | $ | 1,404 | $ | 1,777 | $ | - | ||||||
Commercial real estate | $ | 11,681 | $ | 13,326 | $ | - | ||||||
Consumer loans | $ | 36 | $ | 36 | $ | - | ||||||
Commercial loans | $ | 1,461 | $ | 1,532 | $ | - | ||||||
The above amounts include purchased credit impaired loans. At June 30, 2017, purchased credit impaired loans comprised $20.1 million of impaired loans without a specific valuation allowance. At June 30, 2016, purchased credit impaired loans comprised $15.3 million of impaired loans without a specific valuation allowance. The following tables present information regarding interest income recognized on impaired loans:
Fiscal 2017 | ||||||||
Average | ||||||||
(dollars in thousands) | Investment in | Interest Income | ||||||
Impaired Loans | Recognized | |||||||
Residential Real Estate | $ | 3,011 | $ | 119 | ||||
Construction Real Estate | 1,370 | 148 | ||||||
Commercial Real Estate | 10,044 | 782 | ||||||
Consumer Loans | - | - | ||||||
Commercial Loans | 1,529 | 74 | ||||||
Total Loans | $ | 15,954 | $ | 1,123 | ||||
Fiscal 2016 | ||||||||
Average | ||||||||
(dollars in thousands) | Investment in | Interest Income | ||||||
Impaired Loans | Recognized | |||||||
Residential Real Estate | $ | 3,110 | $ | 90 | ||||
Construction Real Estate | 1,587 | 133 | ||||||
Commercial Real Estate | 10,431 | 939 | ||||||
Consumer Loans | 42 | 2 | ||||||
Commercial Loans | 1,058 | 78 | ||||||
Total Loans | $ | 16,228 | $ | 1,242 | ||||
88
Fiscal 2015 | ||||||||
Average | ||||||||
(dollars in thousands) | Investment in | Interest Income | ||||||
Impaired Loans | Recognized | |||||||
Residential Real Estate | $ | 3,417 | $ | 219 | ||||
Construction Real Estate | 1,902 | 142 | ||||||
Commercial Real Estate | 9,651 | 737 | ||||||
Consumer Loans | 159 | 12 | ||||||
Commercial Loans | 904 | 69 | ||||||
Total Loans | $ | 16,033 | $ | 1,179 | ||||
Interest income on impaired loans recognized on a cash basis in the fiscal years ended June 30, 2017, 2016, and 2015 was immaterial.
For the fiscal years ended June 30, 2017, 2016, and 2015, the amount of interest income recorded for impaired loans that represents a change in the present value of future cash flows attributable to the passage of time was approximately $392,000, $435,000, and $139,000, respectively.
The following table presents the Company's nonaccrual loans at June 30, 2017 and 2016. Purchased credit impaired loans are placed on nonaccrual status in the event the Company cannot reasonably estimate cash flows expected to be collected. The table excludes performing troubled debt restructurings.
June 30, | ||||||||
(dollars in thousands) | 2017 | 2016 | ||||||
Residential real estate | $ | 1,263 | $ | 2,676 | ||||
Construction real estate | 35 | 388 | ||||||
Commercial real estate | 960 | 1,797 | ||||||
Consumer loans | 158 | 160 | ||||||
Commercial loans | 409 | 603 | ||||||
Total loans | $ | 2,825 | $ | 5,624 | ||||
The above amounts include purchased credit impaired loans. At June 30, 2017 and 2016, purchased credit impaired loans comprised $0 and $2.6 million of nonaccrual loans, respectively.
Included in certain loan categories in the impaired loans are troubled debt restructurings (TDRs), where economic concessions have been granted to borrowers who have experienced financial difficulties. These concessions typically result from our loss mitigation activities, and could include reductions in the interest rate, payment extensions, forgiveness of principal, forbearance, or other actions. Certain TDRs are classified as nonperforming at the time of restructuring and typically are returned to performing status after considering the borrower's sustained repayment performance for a reasonable period of at least six months.
When loans and leases are modified into a TDR, the Company evaluates any possible impairment similar to other impaired loans based on the present value of expected future cash flows, discounted at the contractual interest rate of the original loan or lease agreement, and uses the current fair value of the collateral, less selling costs, for collateral dependent loans. If the Company determines that the value of the modified loan is less than the recorded investment in the loan (net of previous charge-offs, deferred loan fees or costs, and unamortized premium or discount), impairment is recognized through an allowance estimate or a charge-off to the allowance. In periods subsequent to modification, the Company evaluates all TDRs, including those that have payment defaults, for possible impairment and recognizes impairment through the allowance.
At June 30, 2017, and June 30, 2016, the Company had $5.2 million and $4.1 million, respectively, of commercial real estate loans, $1.8 million and $479,000, respectively, of residential real estate loans, $3.9 million and $1.4 million, respectively, of commercial loans, and $0 and $36,000, respectively, of consumer loans that were modified in TDRs and impaired. All loans classified as TDRs at June 30, 2017 and June 30, 2016, were so classified due to interest rate concessions. During Fiscal 2017, four commercial loans totaling $2.6 million, four commercial real estate loans totaling $2.0 million, one residential real estate loans totaling $39,000, one construction real estate loan totaling $35,000, and three consumer loans totaling $1,000 were modified as TDRs and had payment defaults subsequent to the modification. When loans modified as TDRs have subsequent payment defaults, the defaults are factored into the determination of the allowance for loan losses to ensure specific valuation allowance reflect amounts considered uncollectible.
89
Performing loans classified as troubled debt restructurings at June 30, 2017 and June 30, 2016 segregated by class, are shown in the table below. Nonperforming TDRs are shown as nonaccrual loans.
June 30, 2017 | June 30, 2016 | |||||||||||||||
(dollars in thousands) | Number of | Recorded | Number of | Recorded | ||||||||||||
modifications | Investment | modifications | Investment | |||||||||||||
Residential real estate | 10 | $ | 1,756 | 7 | $ | 479 | ||||||||||
Construction real estate | - | - | - | - | ||||||||||||
Commercial real estate | 13 | 5,206 | 12 | 4,134 | ||||||||||||
Consumer loans | - | - | 1 | 36 | ||||||||||||
Commercial loans | 6 | 3,946 | 5 | 1,429 | ||||||||||||
Total | 29 | $ | 10,908 | 25 | $ | 6,078 | ||||||||||
Following is a summary of loans to executive officers, directors, significant shareholders and their affiliates held by the Company at June 30, 2017 and 2016, respectively:
June 30, | ||||||||
(dollars in thousands) | 2017 | 2016 | ||||||
Beginning Balance | $ | 9,721 | $ | 9,422 | ||||
Additions | 7,304 | 6,693 | ||||||
Repayments | (8,705 | ) | (6,394 | ) | ||||
Change in related party | - | - | ||||||
Ending Balance | $ | 8,320 | $ | 9,721 | ||||
NOTE 4: Accounting for Certain Acquired Loans
The Company acquired loans in transfers during the fiscal years ended June 30, 2011, June 30, 2015 and June 30, 2017. At acquisition, certain transferred loans evidenced deterioration of credit quality since origination and it was probable, at acquisition, that all contractually required payments would not be collected.
Loans purchased with evidence of credit deterioration since origination and for which it is probable that all contractually required payments will not be collected are considered to be credit impaired. Evidence of credit quality deterioration as of the purchase date may include information such as past-due and nonaccrual status, borrower credit scores and recent loan to value percentages. Purchased credit-impaired loans are accounted for under the accounting guidance for loans and debt securities acquired with deteriorated credit quality (ASC 310-30) and initially measured at fair value, which includes estimated future credit losses expected to be incurred over the life of the loan. Accordingly, an allowance for credit losses related to these loans is not carried over and recorded at the acquisition date. Management estimated the cash flows expected to be collected at acquisition using our internal risk models, which incorporate the estimate of current key assumptions, such as default rates, severity and prepayment speeds.
The carrying amount of those loans is included in the balance sheet amounts of loans receivable at June 30, 2017 and June 30, 2016. The amount of these loans is shown below:
June 30, | ||||||||
(dollars in thousands) | 2017 | 2016 | ||||||
Residential real estate | $ | 4,158 | $ | 3,254 | ||||
Construction real estate | 1,660 | 1,777 | ||||||
Commercial real estate | 13,394 | 11,523 | ||||||
Consumer loans | - | - | ||||||
Commercial loans | 4,502 | 1,103 | ||||||
Outstanding balance | $ | 23,714 | $ | 17,657 | ||||
Carrying amount, net of fair value adjustment of | $ | 20,130 | $ | 15,310 | ||||
Accretable yield, or income expected to be collected, is as follows:
90
June 30, | ||||||||||||
(dollars in thousands) | 2017 | 2016 | 2015 | |||||||||
Balance at beginning of period | $ | 656 | $ | 548 | $ | 380 | ||||||
Additions | 208 | - | (4 | ) | ||||||||
Accretion | (391 | ) | (435 | ) | (259 | ) | ||||||
Reclassification from nonaccretable difference | 344 | 543 | 431 | |||||||||
Disposals | - | - | - | |||||||||
Balance at end of period | $ | 817 | $ | 656 | $ | 548 | ||||||
During the fiscal years ended June 30, 2017 and 2016, the Company did not increase or reverse the allowance for loan losses related to these purchased credit impaired loans.
NOTE 5: Premises and Equipment
Following is a summary of premises and equipment:
June 30, | ||||||||
(dollars in thousands) | 2017 | 2016 | ||||||
Land | $ | 12,043 | $ | 9,840 | ||||
Buildings and improvements | 44,256 | 38,060 | ||||||
Construction in progress | 125 | 53 | ||||||
Furniture, fixtures, equipment and software | 12,595 | 13,602 | ||||||
Automobiles | 81 | 106 | ||||||
69,100 | 61,661 | |||||||
Less accumulated depreciation | 14,933 | 14,718 | ||||||
$ | 54,167 | $ | 46,943 | |||||
NOTE 6: Deposits
Deposits are summarized as follows:
June 30, | ||||||||
(dollars in thousands) | 2017 | 2016 | ||||||
Non-interest bearing accounts | $ | 186,203 | $ | 131,996 | ||||
NOW accounts | 479,488 | 396,105 | ||||||
Money market deposit accounts | 105,599 | 78,155 | ||||||
Savings accounts | 147,247 | 115,714 | ||||||
TOTAL NON-MATURITY DEPOSITS | $ | 918,537 | $ | 721,970 | ||||
Certificates | ||||||||
0.00-.99% | 200,868 | 205,387 | ||||||
1.00-1.99% | 296,964 | 162,180 | ||||||
2.00-2.99% | 36,228 | 28,135 | ||||||
3.00-3.99% | - | 20 | ||||||
4.00-4.99% | - | - | ||||||
5.00-5.99% | 3,000 | 3,001 | ||||||
TOTAL CERTIFICATES | 537,060 | 398,723 | ||||||
TOTAL DEPOSITS | $ | 1,455,597 | $ | 1,120,693 | ||||
The aggregate amount of deposits with a minimum denomination of $250,000 was $398.7 million and $259.9 million at June 30, 2017 and 2016, respectively.
Certificate maturities are summarized as follows:
(dollars in thousands) | ||||
July 1, 2017 to June 30, 2018 | $ | 326,638 | ||
July 1, 2018 to June 30, 2019 | 122,528 | |||
July 1, 2019 to June 30, 2020 | 40,282 | |||
July 1, 2020 to June 30, 2021 | 22,420 | |||
July 1, 2021 to June 30, 2022 | 25,192 | |||
Thereafter | - | |||
TOTAL | $ | 537,060 | ||
Deposits from executive officers, directors, significant shareholders and their affiliates (related parties) held by the Company at June 30, 2017 and 2016 totaled approximately $1.6 million and $1.8 million, respectively.
91
NOTE 7: Securities Sold Under Agreements to Repurchase
Securities sold under agreements to repurchase, which are classified as borrowings, generally mature within one to four days. The following table presents balance and interest rate information on the securities sold under agreements to repurchase.
The carrying value of securities sold under agreement to repurchase amounted to $10.2 million and $27.1 million at June 30, 2017 and 2016, respectively. The securities, which are classified as borrowings, generally mature within one to four days. The securities underlying the agreements consist of marketable securities, including $0 and $4.0 million of U.S. Government and Federal Agency Obligations, $9.5 million and $17.0 million of Mortgage-Backed Securities, and $2.1 million and $6.1 million of Collateralized Mortgage Obligations, at June 30, 2017 and 2016, respectively. The right of offset for a repurchase agreement resembles a secured borrowing, whereby the collateral pledged by the Company would be used to settle the fair value of the repurchase agreement should the Company be in default. The collateral is held by the Company in a segregated custodial account. In the event the collateral fair value falls below stipulated levels, the Company will pledge additional securities. The Company closely monitors collateral levels to ensure adequate levels are maintained.
June 30, | ||||||||
(dollars in thousands) | 2017 | 2016 | ||||||
Year-end balance | $ | 10,212 | $ | 27,085 | ||||
Average balance during the year | 22,198 | 27,387 | ||||||
Maximum month-end balance during the year | 28,825 | 31,575 | ||||||
Average interest during the year | 0.43 | % | 0.44 | % | ||||
Year-end interest rate | 0.50 | % | 0.40 | % | ||||
NOTE 8: Advances from Federal Home Loan Bank
Advances from Federal Home Loan Bank are summarized as follows:
| Call Date or | June 30, | |||||||||||
| Quarterly | Interest | 2017 | 2016 | |||||||||
Maturity | Thereafter | Rate | (dollars in thousands) | ||||||||||
11/29/16 | 3.88 | % | - | 5,000 | |||||||||
11/29/16 | 4.36 | % | - | 5,000 | |||||||||
09/28/17 | 09/28/17 | 3.87 | % | 5,035 | 5,170 | ||||||||
11/20/17 | 08/21/17 | 3.82 | % | 3,000 | 3,000 | ||||||||
11/27/17 | 08/28/17 | 3.24 | % | 5,043 | 5,146 | ||||||||
11/29/17 | 4.01 | % | - | 2,500 | |||||||||
01/08/18 | 07/10/17 | 2.75 | % | 5,046 | 5,125 | ||||||||
08/13/18 | 08/14/17 | 3.32 | % | 513 | 525 | ||||||||
08/14/18 | 3.48 | % | - | 4,000 | |||||||||
08/14/18 | 08/14/17 | 3.98 | % | 5,000 | 5,000 | ||||||||
REPO advance | 07/07/17 | 1.28 | % | 20,000 | - | ||||||||
Overnight | 0.47 | % | - | 69,750 | |||||||||
TOTAL | $ | 43,637 | $ | 110,216 | |||||||||
Weighted-average rate | 2.48 | % | 1.65 | % | |||||||||
In addition to the above advances, the Bank had an available line of credit amounting to $251.8 million and $138.2 million with the FHLB at June 30, 2017 and 2016, respectively.
Advances from FHLB of Des Moines are secured by FHLB stock and commercial real estate and one- to four-family mortgage loans pledged. To secure outstanding advances and the Bank's line of credit, loans totaling $579.3 million and $522.9 million were pledged to the FHLB at June 30, 2017 and 2016, respectively. The principal maturities of FHLB advances at June 30, 2017, are below:
June 30, 2017 | ||||
FHLB Advance Maturities | (dollars in thousands) | |||
July 1, 2017 to June 30, 2018 | $ | 38,124 | ||
July 1, 2018 to June 30, 2019 | 5,513 | |||
July 1, 2019 to June 30, 2020 | - | |||
July 1, 2020 to June 30, 2021 | - | |||
July 1, 2021 to June 30, 2022 | - | |||
July 1, 2022 to thereafter | - | |||
TOTAL | $ | 43,637 | ||
92
NOTE 9: Subordinated Debt
Southern Missouri Statutory Trust I issued $7.0 million of Floating Rate Capital Securities (the "Trust Preferred Securities") with a liquidation value of $1,000 per share in March 2004. The securities are due in 30 years, redeemable after five years and bear interest at a floating rate based on LIBOR. At June 30, 2017, the current rate was 4.02%. The securities represent undivided beneficial interests in the trust, which was established by the Company for the purpose of issuing the securities. The Trust Preferred Securities were sold in a private transaction exempt from registration under the Securities Act of 1933, as amended (the "Act") and have not been registered under the Act. The securities may not be offered or sold in the United States absent registration or an applicable exemption from registration requirements.
Southern Missouri Statutory Trust I used the proceeds from the sale of the Trust Preferred Securities to purchase Junior Subordinated Debentures of the Company. The Company used its net proceeds for working capital and investment in its subsidiaries.
In connection with its October 2013 acquisition of Ozarks Legacy Community Financial, Inc. (OLCF), the Company assumed $3.1 million in floating rate junior subordinated debt securities. The debt securities had been issued in June 2005 by OLCF in connection with the sale of trust preferred securities, bear interest at a floating rate based on LIBOR, are now redeemable at par, and mature in 2035. The carrying value of the debt securities was approximately $2.6 million at June 30, 2017, and $2.6 million at June 30, 2016.
In connection with its August 2014 acquisition of Peoples Service Company, Inc. (PSC), the Company assumed $6.5 million in floating rate junior subordinated debt securities. The debt securities had been issued in 2005 by PSC's subsidiary bank holding company, Peoples Banking Company, in connection with the sale of trust preferred securities, bear interest at a floating rate based on LIBOR, are now redeemable at par, and mature in 2035. The carrying value of the debt securities was approximately $5.0 million at June 30, 2017, and $5.0 million at June 30, 2016.
NOTE 10: Employee Benefits
401(k) Retirement Plan. The Bank has a 401(k) retirement plan that covers substantially all eligible employees. The Bank makes "safe harbor" matching contributions of up to 4% of eligible compensation, depending upon the percentage of eligible pay deferred into the plan by the employee. Additional profit-sharing contributions of 4% of eligible salary have been accrued for the plan year ended June 30, 2017, which the board of directors authorizes based on management recommendations and financial performance for fiscal 2017. Total 401(k) expense for fiscal 2017, 2016, and 2015 was $877,000, $834,000, and $752,000. At June 30, 2017, 401(k) plan participants held approximately 403,000 shares of the Company's stock in the plan. Employee deferrals and safe harbor contributions are fully vested. Profit-sharing or other contributions vest over a period of five years.
Management Recognition Plan (MRP) . The Bank adopted an MRP for the benefit of non-employee directors and two MRPs for officers and key employees (who may also be directors) in April 1994. During fiscal 2012, the Bank granted 6,072 shares (split-adjusted) to employees. The shares granted are in the form of restricted stock vested at the rate of 20% of such shares per year. For fiscal 2017, 2016, and 2015, there were 1,214 shares vested each year. Compensation expense, in the amount of the fair market value of the common stock at the date of grant, is recognized pro-rata over the five years during which the shares vest.
The Board of Directors can terminate the MRP plan at any time, and if it does so, any shares not allocated will revert to the Company. The MRP expense for fiscal 2017, 2016, and 2015 was $13,000 for each year. At June 30, 2017, there was no unvested compensation expense related to the MRP, and no shares remained available for award.
Equity Incentive Plan . The Company adopted an Equity Incentive Plan (EIP) in 2008, reserving for awards of 132,000 shares (split-adjusted). EIP shares are available for award to directors, officers, and employees of the Company and its affiliates by a committee of outside directors. The committee has the power to set vesting requirements for each award under the EIP. During fiscal 2012, the Company awarded 73,928 shares (split-adjusted); during fiscal 2014, the Company awarded 24,000 shares (split-adjusted); during fiscal 2015, the Company awarded 8,000 shares (split-adjusted); during fiscal 2016, the Company awarded 3,750 shares; and during fiscal 2017, the Company awarded 13,125 shares. All awards have been in the form of restricted stock, and all will vest at the rate of 20% of such shares per year. Additionally, among the shares awarded during fiscal 2017, there were 8,750 shares which vest only if the Company meets certain profitability targets. During fiscal 2017, 2016, and 2015,
93
there were 21,200, 19,786, and 21,186 EIP shares (split-adjusted), respectively, vested each year. Compensation expense, in the amount of the fair market value of the common stock at the date of grant, is recognized pro-rata over the five years during which the shares vest.
The Board of Directors can terminate the EIP plan at any time, and if it does so, any shares not allocated will revert to the Company. The EIP expense for fiscal 2017, 2016, and 2015 was $284,000, $260,000, and $275,000, respectively. At June 30, 2017, unvested compensation expense related to the EIP was approximately $615,000.
Stock Option Plans . The Company adopted a stock option plan in October 2003. Under the plan, the Company has granted options to purchase 242,000 shares (split-adjusted) to employees and directors, of which, options to purchase 153,000 shares (split-adjusted) have been exercised, options to purchase 45,000 shares (split-adjusted) have been forfeited, and 44,000 remain outstanding. Under the 2003 Plan, exercised options may be issued from either authorized but unissued shares, or treasury shares.
As of June 30, 2017, there was $19,000 in remaining unrecognized compensation expense related to nonvested stock options, which will be recognized over the remaining weighted average vesting period. The aggregate intrinsic value of stock options outstanding at June 30, 2017, was $1.0 million, and the aggregate intrinsic value of stock options exercisable at June 30, 2017, was $920,000. During fiscal 2017, options to purchase 10,000 shares were exercised. The intrinsic value of these options, based on the Company's closing stock price of $32.26, was $262,000. The intrinsic value of options vested in fiscal 2017, 2016, and 2015 was $262,000, $37,000, and $115,000, respectively.
Changes in options outstanding were as follows:
| 2017 | 2016 | 2015 | |||||||||||||||||||||
| Weighted | Weighted | Weighted | |||||||||||||||||||||
| Average | Average | Average | |||||||||||||||||||||
| Price | Number | Price | Number | Price | Number | ||||||||||||||||||
Outstanding at beginning of year | $ | 8.74 | 54,000 | $ | 8.28 | 69,000 | $ | 7.29 | 100,000 | |||||||||||||||
Granted | - | - | - | - | 17.55 | 10,000 | ||||||||||||||||||
Exercised | 6.08 | (10,000 | ) | 6.38 | (15,000 | ) | 8.10 | (41,000 | ) | |||||||||||||||
Forfeited | - | - | - | - | - | - | ||||||||||||||||||
Outstanding at year-end | $ | 9.35 | 44,000 | $ | 8.74 | 54,000 | $ | 8.28 | 69,000 | |||||||||||||||
Options exercisable at year-end | $ | 8.06 | 38,000 | $ | 7.03 | 44,000 | $ | 6.39 | 55,000 | |||||||||||||||
The following is a summary of the assumptions used in the Black-Scholes pricing model in determining the fair values of options granted during fiscal year 2015. (No options were granted in fiscal 2017 or 2016.):
2017 | 2016 | 2015 | ||||||||||
Assumptions: | ||||||||||||
Expected dividend yield | - | - | 1.94 | % | ||||||||
Expected volatility | - | - | 22.48 | % | ||||||||
Risk-free interest rate | - | - | 2.46 | % | ||||||||
Weighted-average expected life (years) | - | - | 10.00 | |||||||||
Weighted average fair value of options granted during the year | - | - | $ | 4.29 | ||||||||
The table below summarizes information about stock options outstanding under the plan at June 30, 2017:
Options Outstanding | Options Exercisable | |||||||||||||||
Weighted | ||||||||||||||||
Average | Weighted | Weighted | ||||||||||||||
Remaining | Average | Average | ||||||||||||||
Contractual | Number | Exercise | Number | Exercise | ||||||||||||
Life | Outstanding | Price | Exercisable | Price | ||||||||||||
30.5 mo. | 30,000 | 6.38 | 30,000 | 6.38 | ||||||||||||
52.7 mo. | 4,000 | 11.18 | 4,000 | 11.18 | ||||||||||||
86.3 mo. | 10,000 | 17.55 | 4,000 | 17.55 | ||||||||||||
94
NOTE 11: Income Taxes
The Company and its subsidiary files income tax returns in the U.S. Federal jurisdiction and various states. The Company is no longer subject to U.S. federal and state tax examinations by tax authorities for years before 2011. The Company recognized no interest or penalties related to income taxes.
The components of net deferred tax assets are summarized as follows:
(dollars in thousands) | June 30, 2017 | June 30, 2016 | ||||||
Deferred tax assets: | ||||||||
Provision for losses on loans | $ | 5,563 | $ | 4,760 | ||||
Accrued compensation and benefits | 1,068 | 885 | ||||||
Other-than-temporary impairment on | 128 | 139 | ||||||
NOL carry forwards acquired | 513 | 631 | ||||||
Minimum Tax Credit | 130 | 130 | ||||||
Unrealized loss on other real estate | 131 | 183 | ||||||
Total deferred tax assets | 7,533 | 6,728 | ||||||
Deferred tax liabilities: | ||||||||
Purchase accounting adjustments | 1,193 | 1,132 | ||||||
Depreciation | 2,734 | 1,781 | ||||||
FHLB stock dividends | 203 | 194 | ||||||
Prepaid expenses | 213 | 177 | ||||||
Unrealized gain on available for sale securities | 295 | 977 | ||||||
Other | 991 | 82 | ||||||
Total deferred tax liabilities | 5,629 | 4,343 | ||||||
Net deferred tax (liability) asset | $ | 1,904 | $ | 2,385 | ||||
As of June 30, 2017, the Company had approximately $1.3 and $3.2 million in federal and state net operating loss carryforwards, respectively, which were acquired in the July 2009 acquisition of Southern Bank of Commerce, the February 2014 acquisition of Citizens State Bankshares of Bald Knob, Inc. and the August 2014 acquisition of Peoples Service Company. The amount reported is net of the IRC Sec. 382 limitation, or state equivalent, related to utilization of net operating loss carryforwards of acquired corporations. Unless otherwise utilized, the net operating losses will begin to expire in 2027.
A reconciliation of income tax expense at the statutory rate to the Company's actual income tax expense is shown below:
For the year ended June 30, | ||||||||||||
(dollars in thousands) | 2017 | 2016 | 2015 | |||||||||
Tax at statutory rate | $ | 7,565 | $ | 7,536 | $ | 6,903 | ||||||
Increase (reduction) in taxes | ||||||||||||
Nontaxable municipal income | (513 | ) | (567 | ) | (530 | ) | ||||||
State tax, net of Federal benefit | 215 | 624 | 523 | |||||||||
Cash surrender value of | (397 | ) | (325 | ) | (193 | ) | ||||||
Tax credit benefits | (367 | ) | (286 | ) | (364 | ) | ||||||
Other, net | (441 | ) | (300 | ) | (283 | ) | ||||||
Actual provision | $ | 6,062 | $ | 6,682 | $ | 6,056 | ||||||
Tax credit benefits are recognized under the flow-through method of accounting for investments in tax credits.
NOTE 12: Accumulated Other Comprehensive Income (AOCI)
The components of AOCI, included in stockholders' equity, are as follows:
95
June 30, | ||||||||
(dollars in thousands) | 2017 | 2016 | ||||||
Net unrealized gain on securities available-for-sale | $ | 607 | $ | 2,486 | ||||
Net unrealized gain on securities available-for-sale | ||||||||
securities for which a portion of an other-than-temporary | ||||||||
impairment has been recognized in income | 212 | 156 | ||||||
Unrealized gain from defined benefit pension plan | 15 | 2 | ||||||
834 | 2,644 | |||||||
Tax effect | (307 | ) | (982 | ) | ||||
Net of tax amount | $ | 527 | $ | 1,662 | ||||
Amounts reclassified from AOCI and the affected line items in the statements of income during the years ended June 30, 2017 and 2016, were as follows:
Amounts Reclassified From AOCI | |||||||||
(dollars in thousands) | 2017 | 2016 | Affected Line Item in the Condensed | ||||||
Unrealized gain on securities available-for-sale | $ | - | $ | 5 | Net realized gains on sale of AFS securities | ||||
Amortization of defined benefit pension items: | 13 | (9 | ) | Compensation and benefits (included in computation of net periodic pension costs) | |||||
Total reclassified amount before tax | 13 | (4 | ) | ||||||
Tax benefit | 5 | (2 | ) | Provision for Income Tax | |||||
Total reclassification out of AOCI | $ | 8 | $ | (2 | ) | Net Income (Loss) | |||
NOTE 13: Stockholders' Equity and Regulatory Capital
The Company and Bank are subject to various regulatory capital requirements administered by the Federal banking agencies. Failure to meet minimum capital requirements can result in certain mandatory-and possibly additional discretionary – actions by regulators that, if undertaken, could have a direct material effect on the Company's financial statements. Under capital adequacy guidelines and the regulatory framework for prompt corrective action, the Company and Bank must meet specific capital guidelines that involve quantitative measures of the Company and the Bank's assets, liabilities, and certain off-balance sheet items as calculated under U.S. GAAP, regulatory reporting requirements and regulatory capital standards. The Company and Bank's capital amounts and classification are also subject to qualitative judgments by the regulators about components, risk weightings, and other factors. Furthermore, the Company and Bank's regulators could require adjustments to regulatory capital not reflected in the condensed consolidated financial statements.
Quantitative measures established by regulatory capital standards to ensure capital adequacy require the Company and the Bank to maintain minimum amounts and ratios (set forth in the table below) of total capital, Tier 1 capital (as defined), and common equity Tier 1 capital (as defined) to risk-weighted assets (as defined) and of Tier 1 capital (as defined) to average total assets (as defined). Management believes, as of June 30, 2017 and 2016, that the Company and the Bank met all capital adequacy requirements to which they are subject.
In July 2013, the Federal banking agencies announced their approval of the final rule to implement the Basel III regulatory reforms, among other changes required by the Dodd-Frank Wall Street Reform and Consumer Protection Act. The approved rule included a new minimum ratio of common equity Tier 1 (CET1) capital of 4.5%, raised the minimum ratio of Tier 1 capital to risk-weighted assets from 4.0% to 6.0%, and included a minimum leverage ratio of 4.0% for all banking institutions. Additionally, the rule created a capital conservation buffer of 2.5% of risk-weighted assets, and prohibited banking organizations from making distributions or discretionary bonus payments during any quarter if its eligible retained income is negative, if the capital conservation buffer is not maintained. This new capital conservation buffer requirement is be phased in beginning in January 2016 at 0.625% of risk-weighted assets and increasing each year until fully implemented in January 2019. The enhanced capital requirements for banking organizations such as the Company and the Bank began January 1, 2015. Other changes included revised risk-weighting of some assets, stricter limitations on mortgage servicing assets and deferred tax assets, and replacement of the ratings-based approach to risk weight securities.
As of June 30, 2017, the most recent notification from the Federal banking agencies categorized the Bank as well capitalized under the regulatory framework for prompt corrective action. To be categorized as well capitalized the Bank must maintain minimum total risk-based, Tier 1 risk-based, common equity Tier 1 risk-based, and Tier 1 leverage ratios as set forth in the table. There are no conditions or events since that notification that management believes have changed the Bank's category.
96
The tables below summarize the Company and Bank's actual and required regulatory capital:
Actual | For Capital Adequacy Purposes | To Be Well Capitalized Under Prompt Corrective Action Provisions | ||||||||||||||||||||||
As of June 30, 2017 | Amount | Ratio | Amount | Ratio | Amount | Ratio | ||||||||||||||||||
(dollars in thousands) | ||||||||||||||||||||||||
Total Capital (to Risk-Weighted Assets) | ||||||||||||||||||||||||
Consolidated | $ | 194,322 | 12.84 | % | $ | 121,086 | 8.00 | % | n/a | n/a | ||||||||||||||
Southern Bank | 183,906 | 12.15 | % | 121,118 | 8.00 | % | 151,397 | 10.00 | % | |||||||||||||||
Tier I Capital (to Risk-Weighted Assets) | ||||||||||||||||||||||||
Consolidated | 177,679 | 11.74 | % | 90,815 | 6.00 | % | n/a | n/a | ||||||||||||||||
Southern Bank | 167,263 | 11.05 | % | 90,838 | 6.00 | % | 121,118 | 8.00 | % | |||||||||||||||
Tier I Capital (to Average Assets) | ||||||||||||||||||||||||
Consolidated | 177,679 | 11.66 | % | 60,975 | 4.00 | % | n/a | n/a | ||||||||||||||||
Southern Bank | 167,263 | 10.98 | % | 60,949 | 4.00 | % | 76,187 | 5.00 | % | |||||||||||||||
Common Equity Tier I Capital (to Risk-Weighted Assets) | ||||||||||||||||||||||||
Consolidated | 163,626 | 10.81 | % | 68,111 | 4.50 | % | n/a | n/a | ||||||||||||||||
Southern Bank | 167,263 | 11.05 | % | 68,129 | 4.50 | % | 98,408 | 6.50 | % | |||||||||||||||
Actual | For Capital Adequacy Purposes | To Be Well Capitalized Under Prompt Corrective Action Provisions | ||||||||||||||||||||||
As of June 30, 2016 | Amount | Ratio | Amount | Ratio | Amount | Ratio | ||||||||||||||||||
(dollars in thousands) | ||||||||||||||||||||||||
Total Capital (to Risk-Weighted Assets) | ||||||||||||||||||||||||
Consolidated | $ | 148,597 | 11.95 | % | $ | 99,441 | 8.00 | % | n/a | n/a | ||||||||||||||
Southern Bank | 142,983 | 11.50 | % | 99,463 | 8.00 | % | 124,328 | 10.00 | % | |||||||||||||||
Tier I Capital (to Risk-Weighted Assets) | ||||||||||||||||||||||||
Consolidated | 134,061 | 10.79 | % | 74,581 | 6.00 | % | n/a | n/a | ||||||||||||||||
Southern Bank | 128,447 | 10.33 | % | 74,597 | 6.00 | % | 99,463 | 8.00 | % | |||||||||||||||
Tier I Capital (to Average Assets) | ||||||||||||||||||||||||
Consolidated | 134,061 | 9.75 | % | 55,010 | 4.00 | % | n/a | n/a | ||||||||||||||||
Southern Bank | 128,447 | 9.37 | % | 54,827 | 4.00 | % | 68,534 | 5.00 | % | |||||||||||||||
Common Equity Tier I Capital (to Risk-Weighted Assets) | ||||||||||||||||||||||||
Consolidated | 119,715 | 9.63 | % | 55,936 | 4.50 | % | n/a | n/a | ||||||||||||||||
Southern Bank | 128,447 | 10.33 | % | 55,948 | 4.50 | % | 80,813 | 6.50 | % | |||||||||||||||
The Bank's ability to pay dividends on its common stock to the Company is restricted to maintain adequate capital as shown in the above tables. Additionally, prior regulatory approval is required for the declaration of any dividends generally in excess of the sum of net income for that calendar year and retained net income for the preceding two calendar years. At June 30, 2017, approximately $10.2 million of the equity of the Bank was available for distribution as dividends to the Company without prior regulatory approval.
NOTE 14: Commitments and Credit Risk
Standby Letters of Credit . In the normal course of business, the Company issues various financial standby, performance standby, and commercial letters of credit for its customers. As consideration for the letters of credit, the institution charges letter of credit fees based on the face amount of the letters and the creditworthiness of the counterparties. These letters of credit are stand-alone agreements, and are unrelated to any obligation the depositor has to the Company.
Standby letters of credit are irrevocable conditional commitments issued by the Company to guarantee the performance of a customer to a third party. Financial standby letters of credit are primarily issued to support public and private borrowing arrangements, including commercial paper, bond financing and similar transactions. Performance standby letters of credit are issued to guarantee performance of certain customers under non-financial contractual obligations. The credit risk involved in issuing standby letters of credit is essentially the same as that involved in extending loans to customers.
The Company had total outstanding standby letters of credit amounting to $3.6 million at June 30, 2017, and $3.5 million at June 30, 2016, with terms ranging from 12 to 24 months. At June 30, 2017, the Company's deferred revenue under standby letters of credit agreements was nominal.
Off-balance-sheet and Credit Risk . The Company's Consolidated Financial Statements do not reflect various financial instruments to extend credit to meet the financing needs of its customers.
97
These financial instruments include commitments to extend credit. These instruments involve, to varying degrees, elements of credit and interest rate risk in excess of the amount recognized in the balance sheets. Lines of credit are agreements to lend to a customer as long as there is no violation of any condition established in the contract. Lines of credit generally have fixed expiration dates. Since a portion of the line may expire without being drawn upon, the total unused lines do not necessarily represent future cash requirements. Each customer's creditworthiness is evaluated on a case-by-case basis. The amount of collateral obtained, if deemed necessary, is based on management's credit evaluation of the counterparty. Collateral held varies but may include accounts receivable, inventory, property, plant and equipment, commercial real estate and residential real estate. Management uses the same credit policies in granting lines of credit as it does for on balance sheet instruments.
The Company had $251.9 million in commitments to extend credit at June 30, 2017, and $163.8 million at June 30, 2016.
At June 30, 2017, total commitments to originate fixed-rate loans with terms in excess of one year were $29.6 million at rates ranging from 3.25% to 8.00%, with a weighted-average rate of 4.59%. Commitments to extend credit and standby letters of credit include exposure to some credit loss in the event of nonperformance of the customer. The Company's policies for credit commitments and financial guarantees are the same as those for extension of credit that are recorded in the balance sheet. The commitments extend over varying periods of time with the majority being disbursed within a thirty-day period.
The Company originates collateralized commercial, real estate, and consumer loans to customers in Missouri and Arkansas. Although the Company has a diversified portfolio, loans aggregating $464.8 million at June 30, 2017, are secured by single and multi-family residential real estate generally located in the Company's primary lending area.
NOTE 15: Earnings Per Share
The following table sets forth the computations of basic and diluted earnings per common share:
Year Ended June 30, | ||||||||||||
(dollars in thousands except per share data) | 2017 | 2016 | 2015 | |||||||||
Net income | $ | 15,552 | $ | 14,848 | $ | 13,668 | ||||||
Less: Effective dividend on preferred shares | - | 85 | 200 | |||||||||
Net income available to common stockholders | $ | 15,552 | $ | 14,763 | $ | 13,468 | ||||||
Denominator for basic earnings per share - | ||||||||||||
Weighted-average shares outstanding | 7,483,350 | 7,430,170 | 7,337,437 | |||||||||
Effect of dilutive securities stock options or awards | 27,530 | 28,589 | 169,795 | |||||||||
Denominator for diluted earnings per share | 7,510,880 | 7,458,759 | 7,507,232 | |||||||||
Basic earnings per share available to common stockholders | $ | 2.08 | $ | 1.99 | $ | 1.84 | ||||||
Diluted earnings per share available to common stockholders | $ | 2.07 | $ | 1.98 | $ | 1.79 | ||||||
NOTE 16: Acquisitions
On June 16, 2017, the Company completed its acquisition of Tammcorp, Inc. (Tammcorp) and its subsidiary, Capaha Bank (Capaha) in a stock and cash transaction. Capaha was merged into the Company's bank subsidiary, Southern Bank, at acquisition. The Company acquired Capaha primarily for the purpose of conducting commercial banking activities in markets where it believes the Company's business model will perform well, and for the long-term value of its core deposit franchise. The fair value of loans acquired is $152.2 million, all of which is expected to be collected. Through June 30, 2017, the Company incurred $635,000 in third-party acquisition-related costs, and an additional $50,000 in additional compensation expenses. Expenses totaling $685,000 are included in noninterest expense in the Company's consolidated statement of income for the year ended June 30, 2017, with no comparable expenses in the prior period. A note payable of $3.7 million was contractually required to be repaid on the date of acquisition. The goodwill of $4.1 million arising from the acquisition consists largely of synergies and economies of scale expected from combining the operations of the Company and Capaha. Goodwill from this transaction was assigned to the acquisition of the bank holding company, and is not expected to be deductible for tax purposes.
98
The following table summarizes the consideration paid for Tammcorp and Capaha, and the amounts of assets acquired and liabilities assumed recognized at the acquisition date:
Cash | $ | 11,109 | ||
Common stock, at fair value | 10,965 | |||
Total consideration | $ | 22,074 | ||
Recognized amounts of identifiable assets acquired | ||||
and liabilities assumed | ||||
Cash and cash equivalents | $ | 9,373 | ||
Interest bearing time deposits | 747 | |||
Investment securities | 9,104 | |||
Loans | 152,169 | |||
Premises and equipment | 7,520 | |||
BOLI | 3,970 | |||
Identifiable intangible assets | 4,100 | |||
Miscellaneous other assets | 2,240 | |||
Deposits | (166,780 | ) | ||
Notes Payable | (3,650 | ) | ||
Miscellaneous other liabilities | (795 | ) | ||
Total identifiable net assets | 17,998 | |||
Goodwill | $ | 4,076 |
NOTE 17: Fair Value Measurements
ASC Topic 820, Fair Value Measurements, defines fair value as the price that would be received to sell an asset or paid to transfer a liability in an orderly transaction between market participants at the measurement date. Topic 820 also establishes a fair value hierarchy which requires an entity to maximize the use of observable inputs and minimize the use of unobservable inputs when measuring fair value. The standard describes three levels of inputs that may be used to measure fair value:
Level 1 – Quoted prices in active markets for identical assets or liabilities
Level 2 – Observable inputs other than Level 1 prices, such as quoted prices for similar assets or liabilities; quoted prices in active markets that are not active; or other inputs that are observable or can be corroborated by observable market data for substantially the full term of the assets or liabilities
Level 3 – Unobservable inputs supported by little or no market activity and significant to the fair value of the assets or liabilities
Recurring Measurements . The following table presents the fair value measurements of assets recognized in the accompanying consolidated balance sheets measured at fair value on a recurring basis and the level within the fair value hierarchy in which the fair value measurements fall at June 30, 2017 and 2016:
Fair Value Measurements at June 30, 2017 , Using: | ||||||||||||||||
(dollars in thousands) | Quoted Prices in Active Markets for Identical Assets | Significant Other Observable Inputs | Significant Unobservable Inputs | |||||||||||||
Fair Value | (Level 1) | (Level 2) | (Level 3) | |||||||||||||
U.S. government sponsored enterprises (GSEs) | $ | 10,438 | $ | - | $ | 10,438 | $ | - | ||||||||
State and political subdivisions | 49,978 | - | 49,978 | - | ||||||||||||
Other securities | 5,725 | - | 5,725 | - | ||||||||||||
Mortgage-backed GSE residential | 78,275 | - | 78,275 | - | ||||||||||||
Fair Value Measurements at June 30, 2016, Using: | ||||||||||||||||
(dollars in thousands) | Quoted Prices in Active Markets for Identical Assets | Significant Other Observable Inputs | Significant Unobservable Inputs | |||||||||||||
Fair Value | (Level 1) | (Level 2) | (Level 3) | |||||||||||||
U.S. government sponsored enterprises (GSEs) | $ | 6,517 | $ | - | $ | 6,517 | $ | - | ||||||||
State and political subdivisions | 46,185 | - | 46,185 | - | ||||||||||||
Other securities | 5,291 | - | 5,291 | - | ||||||||||||
Mortgage-backed GSE residential | 71,231 | - | 71,231 | - | ||||||||||||
99
Following is a description of the valuation methodologies and inputs used for assets measured at fair value on a recurring basis and recognized in the accompanying consolidated balance sheets, as well as the general classification of such assets pursuant to the valuation hierarchy. There have been no significant changes in the valuation techniques during the year ended June 30, 2017.
Available-for-sale Securities . When quoted market prices are available in an active market, securities are classified within Level 1. If quoted market prices are not available, then fair values are estimated using pricing models, or quoted prices of securities with similar characteristics. For these securities, our Company obtains fair value measurements from an independent pricing service. The fair value measurements consider observable data that may include dealer quotes, market spreads, cash flows, the U.S. Treasury yield curve, live trading levels, trade execution data, market consensus prepayment speeds, credit information and the bond's terms and conditions, among other things. In certain cases where Level 1 or Level 2 inputs are not available, securities are classified within Level 3 of the hierarchy.
During fiscal 2011, a pooled trust preferred security was reclassified from Level 2 to Level 3 due to the unavailability of third-party vendor valuations determined by observable inputs – either quoted prices for similar assets; quoted prices in active markets that are not active; or other inputs that are observable or can be corroborated by observable market data for substantially the full terms of the assets. During fiscal 2016, the third-party vendor began providing valuations for this pooled trust preferred security again, so it was reclassified from Level 3 back to Level 2. The following table presents a reconciliation of activity for available for sale securities measured at fair value based on significant unobservable (Level 3) information for the years ended June 30, 2017 and 2016:
(dollars in thousands) | 2017 | 2016 | ||||||
Available-for-sale securities, beginning of period | $ | - | $ | 226 | ||||
Total unrealized gain (loss) included in comprehensive income | - | 26 | ||||||
Transfer from Level 3 to Level 2 | - | (252 | ) | |||||
Available-for-sale securities, end of period | $ | - | $ | - | ||||
Nonrecurring Measurements . The following tables present the fair value measurement of assets measured at fair value on a nonrecurring basis and the level within the ASC 820 fair value hierarchy in which the fair value measurements fell at June 30, 2017 and 2016:
Fair Value Measurements at June 30, 2017 , Using: | ||||||||||||||||
| Quoted Prices in | |||||||||||||||
| Active Markets for | Significant Other | Significant | |||||||||||||
| Identical Assets | Observable Inputs | Unobservable Inputs | |||||||||||||
(dollars in thousands) | Fair Value | (Level 1) | (Level 2) | (Level 3) | ||||||||||||
| ||||||||||||||||
Foreclosed and repossessed assets held for sale | $ | 3,100 | $ | - | $ | - | $ | 3,100 | ||||||||
Fair Value Measurements at June 30, 2016, Using: | ||||||||||||||||
| Quoted Prices in | |||||||||||||||
| Active Markets for | Significant Other | Significant | |||||||||||||
| Identical Assets | Observable Inputs | Unobservable Inputs | |||||||||||||
(dollars in thousands) | Fair Value | (Level 1) | (Level 2) | (Level 3) | ||||||||||||
| ||||||||||||||||
Foreclosed and repossessed assets held for sale | $ | 3,366 | $ | - | $ | - | $ | 3,366 | ||||||||
The following table presents gains and (losses) recognized on assets measured on a non-recurring basis for the years ended June 30, 2017 and 2016:
(dollars in thousands) | 2017 | 2016 | ||||||
Impaired loans (collateral dependent) | $ | - | $ | (465 | ) | |||
Foreclosed and repossessed assets held for sale | (619 | ) | (208 | ) | ||||
Total losses on assets measured on a non-recurring basis | $ | (619 | ) | $ | (673 | ) | ||
The following is a description of valuation methodologies and inputs used for assets measured at fair value on a nonrecurring basis and recognized in the accompanying consolidated balance sheets, as well as the general classification of such assets pursuant to the valuation hierarch. For assets classified within Level 3 of fair value hierarchy, the process used to develop the reported fair value process is described below.
100
Impaired Loans (Collateral Dependent) . A collateral dependent loan is considered to be impaired when it is probable that all of the principal and interest due may not be collected according to its contractual terms. Generally, when a collateral dependent loan is considered impaired, the amount of reserve required is measured based on the fair value of the underlying collateral. The Company makes such measurements on all material collateral dependent loans deemed impaired using the fair value of the collateral for collateral dependent loans. The fair value of collateral used by the Company is determined by obtaining an observable market price or by obtaining an appraised value from an independent, licensed or certified appraiser, using observable market data. This data includes information such as selling price of similar properties and capitalization rates of similar properties sold within the market, expected future cash flows or earnings of the subject property based on current market expectations, and other relevant factors. In addition, management applies selling and other discounts to the underlying collateral value to determine the fair value. If an appraised value is not available, the fair value of the collateral dependent impaired loan is determined by an adjusted appraised value including unobservable cash flows.
On a quarterly basis, loans classified as special mention, substandard, doubtful, or loss are evaluated including the loan officer's review of the collateral and its current condition, the Company's knowledge of the current economic environment in the market where the collateral is located, and the Company's recent experience with real estate in the area. The date of the appraisal is also considered in conjunction with the economic environment and any decline in the real estate market since the appraisal was obtained. For all loan types, updated appraisals are obtained if considered necessary. In instances where the economic environment has worsened and/or the real estate market declined since the last appraisal, a higher distressed sale discount would be applied to the appraised value.
The Company records collateral dependent impaired loans based on nonrecurring Level 3 inputs. If a collateral dependent loan's fair value, as estimated by the Company, is less than its carrying value, the Company either records a charge-off of the portion of the loan that exceeds the fair value or establishes a specific reserve as part of the allowance for loan losses.
Foreclosed and Repossessed Assets Held for Sale . Foreclosed and repossessed assets held for sale are valued at the time the loan is foreclosed upon or collateral is repossessed and the asset is transferred to foreclosed or repossessed assets held for sale. The value of the asset is based on third party or internal appraisals, less estimated costs to sell and appropriate discounts, if any. The appraisals are generally discounted based on current and expected market conditions that may impact the sale or value of the asset and management's knowledge and experience with similar assets. Such discounts typically may be significant and result in a Level 3 classification of the inputs for determining fair value of these assets. Foreclosed and repossessed assets held for sale are continually evaluated for additional impairment and are adjusted accordingly if impairment is identified.
Unobservable (Level 3) Inputs . The following table presents quantitative information about unobservable inputs used in recurring and nonrecurring Level 3 fair value measurements.
(dollars in thousands) | Fair value at | Valuation | Unobservable | Range of | Weighted-average | ||||||||||
Nonrecurring Measurements | |||||||||||||||
Foreclosed and repossessed assets | $ | 3,100 | Third party appraisal | Marketability discount | 0.0% - 66.4 | % | 40.6 | % | |||||||
(dollars in thousands) | Fair value at | Valuation | Unobservable | Range of | Weighted-average | ||||||||||
Nonrecurring Measurements | |||||||||||||||
Foreclosed and repossessed assets | $ | 3,366 | Third party appraisal | Marketability discount | 0.0% - 76.0 | % | 35.6 | % | |||||||
Fair Value of Financial Instruments . The following table presents estimated fair values of the Company's financial instruments and the level within the fair value hierarchy in which the fair value measurements fell at June 30, 2017 and 2016:
101
June 30, 2017 | ||||||||||||||||
Quoted Prices | ||||||||||||||||
in Active | Significant | |||||||||||||||
Markets for | Significant Other | Unobservable | ||||||||||||||
Carrying | Identical Assets | Observable Inputs | Inputs | |||||||||||||
(dollars in thousands) | Amount | (Level 1) | (Level 2) | (Level 3) | ||||||||||||
Financial assets | ||||||||||||||||
Cash and cash equivalents | $ | 30,786 | $ | 30,786 | $ | - | $ | - | ||||||||
Interest-bearing time deposits | 747 | - | 747 | - | ||||||||||||
Stock in FHLB | 3,547 | - | 3,547 | - | ||||||||||||
Stock in Federal Reserve Bank of St. Louis | 2,357 | - | 2,357 | - | ||||||||||||
Loans receivable, net | 1,397,730 | - | - | 1,394,164 | ||||||||||||
Accrued interest receivable | 6,769 | - | 6,769 | - | ||||||||||||
Financial liabilities | ||||||||||||||||
Deposits | 1,455,597 | 918,553 | - | 536,266 | ||||||||||||
Securities sold under agreements to | 10,212 | - | 10,212 | - | ||||||||||||
Advances from FHLB | 43,637 | 20,000 | 23,781 | - | ||||||||||||
Accrued interest payable | 918 | - | 918 | - | ||||||||||||
Subordinated debt | 14,848 | - | - | 11,984 | ||||||||||||
Unrecognized financial instruments (net of contract amount) | ||||||||||||||||
Commitments to originate loans | - | - | - | - | ||||||||||||
Letters of credit | - | - | - | - | ||||||||||||
Lines of credit | - | - | - | - | ||||||||||||
June 30, 2016 | ||||||||||||||||
Quoted Prices | ||||||||||||||||
in Active | Significant | |||||||||||||||
Markets for | Significant Other | Unobservable | ||||||||||||||
Carrying | Identical Assets | Observable Inputs | Inputs | |||||||||||||
(dollars in thousands) | Amount | (Level 1) | (Level 2) | (Level 3) | ||||||||||||
Financial assets | ||||||||||||||||
Cash and cash equivalents | $ | 22,554 | $ | 22,554 | $ | - | $ | - | ||||||||
Interest-bearing time deposits | 723 | - | 723 | - | ||||||||||||
Stock in FHLB | 6,009 | - | 6,009 | - | ||||||||||||
Stock in Federal Reserve Bank of St. Louis | 2,343 | - | 2,343 | - | ||||||||||||
Loans receivable, net | 1,135,453 | - | - | 1,136,723 | ||||||||||||
Accrued interest receivable | 5,512 | - | 5,512 | - | ||||||||||||
Financial liabilities | ||||||||||||||||
Deposits | 1,120,693 | 721,973 | - | 398,505 | ||||||||||||
Securities sold under agreements to | 27,085 | - | 27,085 | - | ||||||||||||
Advances from FHLB | 110,216 | 69,750 | 41,442 | - | ||||||||||||
Accrued interest payable | 720 | - | 720 | - | ||||||||||||
Subordinated debt | 14,753 | - | - | 11,992 | ||||||||||||
Unrecognized financial instruments (net of contract amount) | ||||||||||||||||
Commitments to originate loans | - | - | - | - | ||||||||||||
Letters of credit | - | - | - | - | ||||||||||||
Lines of credit | - | - | - | - | ||||||||||||
The following methods and assumptions were used in estimating the fair values of financial instruments:
Cash and cash equivalents, interest-bearing time deposits, accrued interest receivable, and accrued interest payable are valued at their carrying amounts, which approximates book value. Stock in FHLB and the Federal Reserve Bank of St. Louis is valued at cost, which approximates fair value. Fair value of loans is estimated by discounting the future cash flows using the current rates at which similar loans would be made to borrowers with similar credit ratings and for the same remaining maturities. Loans with similar characteristics are aggregated for purposes of the calculations. The carrying amounts of accrued interest approximate their fair values.
The fair value of fixed-maturity time deposits is estimated using a discounted cash flow calculation that applies the rates currently offered for deposits of similar remaining maturities. Non-maturity deposits and securities sold under agreements are valued at their carrying value, which approximates fair value. Fair value of advances from the FHLB is estimated by discounting maturities using an estimate of the current market for similar instruments. The fair value of subordinated debt is estimated using rates currently available to the Company for debt with similar terms and maturities. The fair value of commitments to originate loans is estimated using the fees currently charged to enter into similar agreements, taking into account the remaining terms of the agreements and the present creditworthiness of the counterparties. For fixed-rate loan commitments, fair value also considers the difference between current levels of interest rates and committed rates. The fair value of letters of credit and lines of credit are based on fees currently charged for similar agreements or on the estimated cost to terminate or otherwise settle the obligations with the counterparties at the reporting date.
102
NOTE 18: Significant Estimates
Accounting principles generally accepted in the United States of America require disclosure of certain significant estimates and current vulnerabilities due to certain concentrations. Estimates related to the allowance for loan losses are described in Note 1.
NOTE 19: Subsequent Event – Business Combination
On August 17, 2017, the Company announced the signing of an agreement and plan of merger whereby Southern Missouri Bancshares, Inc. ("Bancshares"), and its wholly-owned subsidiary, Southern Missouri Bank of Marshfield, will be acquired by the Company in a stock and cash transaction valued at approximately $15.1 million, (representing 140% of Bancshares' anticipated capital, as adjusted, at closing). At June 30, 2017, Bancshares held consolidated assets of $91.6 million, loans, net, of $69.1 million, and deposits of $73.6 million. The transaction is expected to close in the first quarter of calendar year 2018, subject to satisfaction of customary closing conditions, including regulatory and shareholder approvals. The acquired financial institution is expected to be merged with and into Southern Bank simultaneously with the acquisition of Bancshares in the first quarter of calendar year 2018. Through June 30, 2017, the Company incurred $25,000 of third-party acquisition-related costs. The expenses are included in noninterest expense in the Company's consolidated statement of income for the year ended June 30, 2017.
NOTE 20: Condensed Parent Company Only Financial Statements
The following condensed balance sheets, statements of income and comprehensive income and cash flows for Southern Missouri Bancorp, Inc. should be read in conjunction with the consolidated financial statements and the notes thereto:
June 30, | |||||||||||||
Condensed Balance Sheets | (dollars in thousands) | 2017 | 2016 | ||||||||||
Assets | |||||||||||||
Cash and cash equivalents | $ | 10,856 | $ | 4,076 | |||||||||
Other assets | 8,991 | 4,951 | |||||||||||
Investment in common stock of Bank | 172,199 | 132,540 | |||||||||||
TOTAL ASSETS | $ | 192,046 | $ | 141,567 | |||||||||
Liabilities and Stockholders' Equity | |||||||||||||
Accrued expenses and other liabilities | $ | 4,115 | $ | 848 | |||||||||
Subordinated debt | 14,848 | 14,753 | |||||||||||
TOTAL LIABILITIES | 18,963 | 15,601 | |||||||||||
Stockholders' equity | 173,083 | 125,966 | |||||||||||
TOTAL LIABILITIES AND STOCKHOLDERS' EQUITY | $ | 192,046 | $ | 141,567 | |||||||||
Year ended June 30, | |||||||||||||
Condensed Statements of Income | (dollars in thousands) | 2017 | 2016 | 2015 | |||||||||
Interest income | $ | 17 | $ | 14 | $ | 115 | |||||||
Interest expense | 661 | 568 | 512 | ||||||||||
Net interest expense | (644 | ) | (554 | ) | (397 | ) | |||||||
Dividends from Bank | 4,000 | 23,600 | 13,200 | ||||||||||
Operating expenses | 955 | 294 | 940 | ||||||||||
Income before income taxes and | |||||||||||||
equity in undistributed income of the Bank | 2,401 | 22,752 | 11,863 | ||||||||||
Income tax benefit | 455 | 325 | 463 | ||||||||||
Income before equity in undistributed | |||||||||||||
income of the Bank | 2,856 | 23,077 | 12,326 | ||||||||||
Equity in undistributed income of the Bank | 12,696 | (8,229 | ) | 1,342 | |||||||||
NET INCOME | $ | 15,552 | $ | 14,848 | $ | 13,668 | |||||||
COMPREHENSIVE INCOME | $ | 14,417 | $ | 15,649 | $ | 13,941 | |||||||
103
Year ended June 30, | |||||||||||||
Condensed Statements of Cash Flow | (dollars in thousands) | 2017 | 2016 | 2015 | |||||||||
Cash Flows from operating activities: | |||||||||||||
Net income | $ | 15,552 | $ | 14,848 | $ | 13,668 | |||||||
Changes in: | |||||||||||||
Equity in undistributed income of the Bank | (12,696 | ) | 8,229 | (1,342 | ) | ||||||||
Other adjustments, net | 412 | 401 | 78 | ||||||||||
NET CASH PROVIDED BY OPERATING ACTIVITES | 3,268 | 23,478 | 12,404 | ||||||||||
Cash flows from investing activities: | |||||||||||||
Proceeds from loan participations | - | - | 2,593 | ||||||||||
Proceeds from sale of real estate | - | 2,407 | - | ||||||||||
Investments in Bank subsidiaries | (11,062 | ) | - | (11,774 | ) | ||||||||
Retirement of debt in acquisitions | - | - | (2,936 | ) | |||||||||
NET CASH PROVIDED BY (USED IN) INVESTING ACTIVITIES | (11,062 | ) | 2,407 | (12,117 | ) | ||||||||
Cash flows from financing activities: | |||||||||||||
Dividends on preferred stock | - | (135 | ) | (200 | ) | ||||||||
Dividends on common stock | (2,981 | ) | (2,675 | ) | (2,517 | ) | |||||||
Exercise of stock options | 61 | 99 | 332 | ||||||||||
Redemption of common stock warrants | - | - | (2,700 | ) | |||||||||
Redemption of preferred stock | - | (20,000 | ) | - | |||||||||
Proceeds from issuance of common stock | 24,144 | - | - | ||||||||||
Proceeds from issuance of long term debt | 15,000 | - | - | ||||||||||
Repayments of long term debt | (15,650 | ) | - | - | |||||||||
Injection of capital to subsidiary | (6,000 | ) | - | - | |||||||||
NET CASH USED IN FINANCING ACTIVITIES | 14,574 | (22,711 | ) | (5,085 | ) | ||||||||
Net increase (decrease) in cash and cash equivalents | 6,780 | 3,174 | (4,798 | ) | |||||||||
Cash and cash equivalents at beginning of year | 4,076 | 902 | 5,700 | ||||||||||
CASH AND CASH EQUIVALENTS AT END OF YEAR | $ | 10,856 | $ | 4,076 | $ | 902 | |||||||
NOTE 21: Quarterly Financial Data (Unaudited)
Quarterly operating data is summarized as follows (in thousands):
June 30, 2017 | ||||||||||||||||
(dollars in thousands) | First | Second | Third | Fourth | ||||||||||||
Interest income | $ | 15,105 | $ | 15,083 | $ | 14,955 | $ | 16,345 | ||||||||
Interest expense | 2,529 | 2,510 | 2,523 | 2,804 | ||||||||||||
Net interest income | 12,576 | 12,573 | 12,432 | 13,541 | ||||||||||||
Provision for loan losses | 925 | 656 | 376 | 383 | ||||||||||||
Noninterest income | 2,575 | 2,700 | 2,925 | 2,884 | ||||||||||||
Noninterest expense | 9,159 | 8,706 | 9,564 | 10,823 | ||||||||||||
Income before income taxes | 5,067 | 5,911 | 5,417 | 5,219 | ||||||||||||
Income tax expense | 1,358 | 1,735 | 1,463 | 1,506 | ||||||||||||
NET INCOME | $ | 3,709 | $ | 4,176 | $ | 3,954 | $ | 3,713 | ||||||||
June 30, 2016 | ||||||||||||||||
(dollars in thousands) | First | Second | Third | Fourth | ||||||||||||
Interest income | $ | 13,972 | $ | 14,235 | $ | 13,849 | $ | 14,261 | ||||||||
Interest expense | 2,266 | 2,335 | 2,341 | 2,423 | ||||||||||||
Net interest income | 11,706 | 11,900 | 11,508 | 11,838 | ||||||||||||
Provision for loan losses | 618 | 496 | 563 | 817 | ||||||||||||
Noninterest income | 2,202 | 2,791 | 2,178 | 2,587 | ||||||||||||
Noninterest expense | 7,990 | 8,166 | 8,257 | 8,273 | ||||||||||||
Income before income taxes | 5,300 | 6,029 | 4,866 | 5,335 | ||||||||||||
Income tax expense | 1,665 | 1,820 | 1,544 | 1,653 | ||||||||||||
NET INCOME | $ | 3,635 | $ | 4,209 | $ | 3,322 | $ | 3,682 | ||||||||
104
June 30, 2015 | ||||||||||||||||
(dollars in thousands) | First | Second | Third | Fourth | ||||||||||||
Interest income | $ | 13,219 | $ | 14,357 | $ | 13,909 | $ | 13,816 | ||||||||
Interest expense | 2,090 | 2,195 | 2,211 | 2,270 | ||||||||||||
Net interest income | 11,129 | 12,162 | 11,698 | 11,546 | ||||||||||||
Provision for loan losses | 827 | 862 | 837 | 659 | ||||||||||||
Noninterest income | 1,980 | 2,187 | 2,094 | 2,398 | ||||||||||||
Noninterest expense | 7,602 | 8,590 | 8,091 | 8,002 | ||||||||||||
Income before income taxes | 4,680 | 4,897 | 4,864 | 5,283 | ||||||||||||
Income tax expense | 1,381 | 1,460 | 1,497 | 1,718 | ||||||||||||
NET INCOME | $ | 3,299 | $ | 3,437 | $ | 3,367 | $ | 3,565 | ||||||||
105
Item 9. Changes in and Disagreements With Accountants on Accounting and Financial Disclosure
None.
Item 9A. Controls and Procedures
An evaluation of the Company's disclosure controls and procedures (as defined in Rule13a-15(e) under the Securities Exchange Act of 1934 (the "Exchange Act")) as of June 30, 2017, was carried out under the supervision and with the participation of our Chief Executive Officer, our Chief Financial Officer, and several other members of our senior management. Our Chief Executive Officer and Chief Financial Officer concluded that our disclosure controls and procedures were effective as of June 30, 2017 in ensuring that the information required to be disclosed in the reports the Company files or submits under the Exchange Act is (i) accumulated and communicated to our management (including the Chief Executive Officer and Chief Financial Officer) in a timely manner, and (ii) recorded, processed, summarized and reported within the time periods specified in the SEC's rules and forms. We intend to continually review and evaluate the design and effectiveness of the Company's disclosure controls and procedures and to improve the Company's controls and procedures over time and to correct any deficiencies that we may discover in the future. The goal is to ensure that senior management has timely access to all material financial and non-financial information concerning the Company's business. While we believe the present design of the disclosure controls and procedures is effective to achieve its goal, future events affecting its business may cause the Company to modify its disclosure controls and procedures. There have been no changes in our internal control over financial reporting (as defined in Rule 13a-15(f) under the Act) that occurred during the year ended June 30, 2017, that has materially affected, or is reasonably likely to materially affect, our internal control over financial reporting.
The Company does not expect that its disclosure controls and procedures and internal control over financial reporting will prevent all error and all fraud. A control procedure, no matter how well conceived and operated, can provide only reasonable, not absolute, assurance that the objectives of the control procedure are met. Because of the inherent limitations in all control procedures, no evaluation of controls can provide absolute assurance that all control issues and instances of fraud, if any, within the Company have been detected. These inherent limitations include the realities that judgments in decision-making can be faulty, and that breakdowns can occur because of simple error or mistake. Additionally, controls can be circumvented by the individual acts of some persons, by collusion of two or more people, or by management override of the control. The design of any control procedure also is based in part upon certain assumptions about the likelihood of future events, and there can be no assurance that any design will succeed in achieving its stated goals under all potential future conditions; over time, controls may become inadequate because of changes in conditions, or the degree of compliance with the policies or procedures may deteriorate. Because of the inherent limitations in a cost-effective control procedure, misstatements due to error or fraud may occur and not be detected.
Management's Report on Internal Control Over Financial Reporting
The management of Southern Missouri Bancorp, Inc. is responsible for establishing and maintaining adequate internal control over financial reporting, as such term is defined in Exchange Act Rule 13a-15(f). The Company's internal control over financial reporting is a process designed to provide reasonable assurance to the Company's management and board of directors regarding the reliability of financial reporting and the preparation of the financial statements for external purposes in accordance with accounting principles generally accepted in the United States of America.
The Company's internal control over financial reporting includes those policies and procedures that (i) pertain to the maintenance of records that, in reasonable detail, accurately and fairly reflect the transactions and dispositions of the assets of the Company; (ii) provide reasonable assurance that transactions are recorded as necessary to permit preparation of financial statements in accordance with accounting principles generally accepted in the United States of America, and that receipts and expenditures of the Company are being made only in accordance with authorizations of management and directors of the Company; and (iii) provide reasonable assurance regarding prevention or timely detection of unauthorized acquisition, use, or disposition of the Company's assets that could have a material effect on the financial statements.
Because of its inherent limitations, internal controls over financial reporting may not prevent or detect misstatements. All internal control systems, no matter how well designed, have inherent limitations, including the possibility of human error and the circumvention of overriding controls. Accordingly, even effective internal control over financial reporting can provide only reasonable assurance with respect to financial statement preparation. Also,
106
projections of any evaluation of effectiveness to future periods are subject to the risk that controls may become inadequate because of changes in conditions, or that the degree of compliance with the policies or procedures may deteriorate.
Our management assessed the effectiveness of the Company's internal control over financial reporting as of June 30, 2017. In making this assessment, it used the criteria set forth by the Committee of Sponsoring Organizations of the Treadway Commission (COSO) in Internal Control-Integrated Framework (1992) . Based on our assessment, we believe that, as of June 30, 2017, the Company's internal control over financial reporting was effective based on those criteria.
Date: September 13, 2017 | By: | /s/ Greg A. Steffens |
/s/ Matthew T. Funke |
107
Report of Independent Registered Public Accounting Firm
Audit Committee, Board of Directors
and Stockholders
Southern Missouri Bancorp, Inc.
Poplar Bluff, Missouri
We have audited Southern Missouri Bancorp, Inc.'s ("Company") internal control over financial reporting as of June 30, 2017 based on criteria established in Internal Control - Integrated Framework (1992) issued by the Committee of Sponsoring Organizations of the Treadway Commission (COSO) . The Company's management is responsible for maintaining effective internal control over financial reporting and for its assessment of the effectiveness of internal control over financial reporting, included in the accompanying Management's Report on Internal Control Over Financial Reporting. Our responsibility is to express an opinion on the Company's internal control over financial reporting based on our audit.
We conducted our audit in accordance with the standards of the Public Company Accounting Oversight Board (United States). Those standards require that we plan and perform the audit to obtain reasonable assurance about whether effective internal control over financial reporting was maintained in all material respects. Our audit included obtaining an understanding of internal control over financial reporting, assessing the risk that a material weakness exists and testing and evaluating the design and operating effectiveness of internal control based on the assessed risk. Our audit also included performing such other procedures as we considered necessary in the circumstances. We believe that our audit provides a reasonable basis for our opinion.
A company's internal control over financial reporting is a process designed to provide reasonable assurance regarding the reliability of financial reporting and the preparation of financial statements for external purposes in accordance with generally accepted accounting principles. A company's internal control over financial reporting includes those policies and procedures that (1) pertain to the maintenance of records that, in reasonable detail, accurately and fairly reflect the transactions and dispositions of the assets of the company; (2) provide reasonable assurance that transactions are recorded as necessary to permit preparation of financial statements in accordance with generally accepted accounting principles, and that receipts and expenditures of the company are being made only in accordance with authorizations of management and directors of the company; and (3) provide reasonable assurance regarding prevention or timely detection of unauthorized acquisition, use or disposition of the company's assets that could have a material effect on the financial statements.
Because of its inherent limitations, internal control over financial reporting may not prevent or detect misstatements. Also, projections of any evaluation of effectiveness to future periods are subject to the risk that controls may become inadequate because of changes in conditions or that the degree of compliance with the policies or procedures may deteriorate.
In our opinion, the Company maintained, in all material respects, effective internal control over financial reporting as of June 30, 2017 based on criteria established in Internal Control - Integrated Framework (1992) issued by the Committee of Sponsoring Organizations of the Treadway Commission (COSO) .
We have also audited, in accordance with the standards of the Public Company Accounting Oversight Board (United States), the consolidated financial statements of the Company and our report dated September 13, 2017 expressed an unqualified opinion thereon.
/s/ BKD, LLP
Decatur, Illinois
September 13, 2017
108
Changes in Internal Control Over Financial Reporting
There were no changes in our internal control over financial reporting (as defined in SEC Rule 13a-15(f) under the Exchange Act) that occurred during the June 30, 2017, fiscal quarter that have materially affected, or are reasonably likely to materially affect, our internal control over financial reporting.
Item 9B. Other Information
None.
PART III
Item 10. Directors, Executive Officers, Promoters and Control Persons; Compliance with
Section 16(a) of the Exchange Act and Corporate Governance
Directors
Information concerning the directors of the Company required by this item is incorporated herein by reference from the definitive proxy statement for the annual meeting of shareholder to be held in October 2017, a copy of which will be filed not later than 120 days after the close of the fiscal year.
Executive Officers
Information concerning the executive officers of the Company required by this item is contained in Part I of this Annual Report on Form 10-K under the heading "Executive Officers."
Audit Committee Matters and Audit Committee Financial Expert
The Board of Directors of the Company has a standing Audit/Compliance Committee, which has been established in accordance with Section 3(a)(58)(A) of the Exchange Act. The members of that committee are Directors Love (Chairman), Bagby, Black, Schalk, Brooks, Robison, and Tooley, all of whom are considered independent under applicable Nasdaq listing standards. The Board of Directors has determined that Mr. Love is an "audit committee financial expert" as defined in applicable SEC rules. Additional information concerning the audit committee of the Company's Board of Directors is incorporated herein by reference from the Company's definitive proxy statement for its Annual Meeting of Stockholders to be held in October 2017, except for information contained under the heading "Report of the Audit Committee of the Board of Directors", a copy of which will be filed not later than 120 days after the close of the fiscal year.
Section 16(a) Compliance
Information concerning Section 16(a) Compliance required by this item is incorporated by reference from the definitive proxy statement for the annual meeting of shareholders to be held in October 2017, a copy of which will be filed not later than 120 days after the close of the fiscal year.
Code of Ethics
On January 20, 2005, the Company adopted a written Code of Conduct and Ethics (the "Code") based upon the standards set forth under Item 406 of the Securities Exchange Act. The Code was subsequently amended in 2011 and 2016. The Code applies to all of the Company's directors, officers and employees. The Code may be reviewed at the Company's website, www.bankwithsouthern.com , by following the "investor relations" and "corporate governance" links.
Nomination Procedures
There have been no material changes to the procedures by which stockholders may recommend nominees to the Company's Board of Directors.
109
Item 11. Executive Compensation
The information required by this item is incorporated herein by reference from the definitive proxy statement for the annual meeting of shareholders to be held in October 2017, a copy of which will be filed not later than 120 days after the close of the fiscal year.
Item 12. Security Ownership of Certain Beneficial Owners and Management and Related Stockholder Matters
Information concerning security ownership of certain beneficial owners and management required by this item is incorporated herein by reference from the definitive proxy statement for the annual meeting of shareholders to be held in October 2017, a copy of which will be filed not later than 120 days after the close of the fiscal year.
The following table sets forth information as of June 30, 2017, with respect to compensation plans under which shares of common stock may be issued.
Equity Compensation Plan Information
Plan Category | Number of securities to be issued upon exercise of outstanding options warrants and rights | Weighted-average exercise price of outstanding options warrants and rights | Number of Securities remaining available for future issuance under equity compensation plans | |||||||||
Equity Compensation Plans Approved By Security Holders | 44,000 | $ | 9.35 | 211,844 | (1) | |||||||
Equity Compensation Plans Not Approved By Security Holders | --- | $ | --- | --- | ||||||||
44,000 | $ | 9.35 | 211,844 | |||||||||
________________
(1) ) Includes 13,947 shares which may be utilized for awards of restricted stock or restricted stock units under the Company's 2008 Equity Incentive Plan, and 197,897 shares which may be utilized for awards of stock options or stock appreciation rights under the Company's 2003 Stock Option Plan, as of June 30, 2017. Under the terms of the 2003 Stock Option Plan, the total number of shares available for awards under that plan is 200,000 (due to fiscal 2004 and fiscal 2015 two-for-one common stock splits in the form of 100% common stock dividends) plus (1) the number of shares of common stock repurchased by the registrant, in the open market or otherwise, with an aggregate price no greater than the cash proceeds received from the exercise of stock options granted under the 2003 Stock Option Plan, plus (2) any shares surrendered to the Company in payment of the exercise price of options granted under the 2003 Stock Option Plan. The 197,897 shares remaining available for future awards under the 2003 Stock Option Plan, as of June 30, 2017, include the 3,000 shares remaining available under the 200,000 shares authorization and an additional 194,897 shares that became available as a result of cash proceeds realized on stock option exercises and stock repurchases by the Company since the adoption of the 2003 Stock Option Plan.
Item 13. Certain Relationships, Related Transactions, and Director Independence
Information concerning certain relationships and related transactions required by this item is incorporated herein by reference from the definitive proxy statement for the annual meeting of shareholders to be held in October 2017, a copy of which will be filed not later than 120 days after the close of the fiscal year.
Item 14. Principal Accountant Fees and Services
Information concerning fees and services by our principal accountants required by this item is incorporated herein by reference from our definitive Proxy Statement for the 2017 Annual Meeting of Stockholders, a copy of which will be filed not later than 120 days after the close of the fiscal year.
110
PART IV
Item 15. Exhibits and Financial Statement Schedules
(a)(1) Financial Statements:
The following are contained in Item 8 of this Form 10-K:
Report of Independent Registered Public Accounting Firm |
Consolidated Balance Sheets at June 30, 2017 and 2016 |
Consolidated Statements of Income for the Years Ended June 30, 2017, 2016, and 2015 |
Consolidated Statements of Stockholders' Equity for the Years Ended June 30, 2017, 2016, and 2015 |
Consolidated Statements of Comprehensive Income for the Years Ended June 30, 2017, 2016, and 2015 |
Consolidated Statements of Cash Flows for the Years Ended June 30, 2017, 2016, and 2015 |
Notes to the Consolidated Financial Statements, June 30, 2017, 2016, and 2015 |
(a)(2) Financial Statement Schedules:
All financial statement schedules have been omitted as the information is not required under the related instructions or is not applicable.
111
(a)(3) Exhibits:
Regulation S-K Exhibit Number |
Document | ||
3.1(i) | Articles of Incorporation of the Registrant (filed as an exhibit to the Registrant's Annual Report on Form 10-KSB for the fiscal year ended June 30, 1999 and incorporated herein by reference) | ||
| 3.1(i)A | Amendment to Articles of Incorporation of Southern Missouri increasing the authorized capital stock of Southern Missouri (filed as an exhibit to Southern Missouri's Current Report on Form 8-K filed on November 21, 2016 and incorporated herein by reference) | ||
3.1(ii) | Certificate of Designation for the Registrant's Senior Non-Cumulative Perpetual Preferred Stock, Series A (filed as an exhibit to the Registrant's Current Report on Form 8-K filed on July 26, 2011 and incorporated herein by reference) | ||
3.2 | Bylaws of the Registrant (filed as an exhibit to the Registrant's Current Report on Form 8-K filed on December 6, 2007 and incorporated herein by reference) | ||
10 | Material Contracts: | ||
1 . | 2008 Equity Incentive Plan (attached to the Registrant's definitive proxy statement filed on September 19, 2008 and incorporated herein by reference) | ||
2 . | 2003 Stock Option and Incentive Plan (attached to the Registrant's definitive proxy statement filed on September 17, 2003 and incorporated herein by reference) | ||
3. | 1994 Stock Option and Incentive Plan (attached to the Registrant's definitive proxy statement filed on October 21, 1994 and incorporated herein by reference)"P" | ||
4. | Management Recognition and Development Plan (attached to the Registrant's definitive proxy statement filed on October 21, 1994 and incorporated herein by reference)"P" | ||
5. | Employment Agreements | ||
(i) | Employment Agreement with Greg A. Steffens (files as an exhibit to the Registrant's Annual Report on Form 10-KSB for the year ended June 30, 1999) | ||
6. | Director's Retirement Agreements | ||
(i) | Director's Retirement Agreement with Sammy A. Schalk (filed as an exhibit to the Registrant's Quarterly Report on Form 10-QSB for the quarter ended December 31, 2000 and incorporated herein by reference) | ||
(ii) | Director's Retirement Agreement with Ronnie D. Black (filed as an exhibit to the Registrant's Quarterly Report on Form 10-QSB for the quarter ended December 31, 2000 and incorporated herein by reference) | ||
(iii) | Director's Retirement Agreement with L. Douglas Bagby (filed as an exhibit to the Registrant's Quarterly Report on Form 10-QSB for the quarter ended December 31, 2000 and incorporated herein by reference) | ||
(iv) | Director's Retirement Agreement with Rebecca McLane Brooks (filed as an exhibit to the Registrant's Quarterly Report on Form 10-QSB for the quarter ended December 31, 2004 and incorporated herein by reference) | ||
(v) | Director's Retirement Agreement with Charles R. Love (filed as an exhibit to the Registrant's Quarterly Report on Form 10-QSB for the quarter ended December 31, 2004 and incorporated herein by reference) | ||
(vi) | Director's Retirement Agreement with Charles R. Moffitt (filed as an exhibit to the Registrant's Quarterly Report on Form 10-QSB for the quarter ended December 31, 2004 and incorporated herein by reference) | ||
(vii) | Director's Retirement Agreement with Dennis C. Robison (filed as an exhibit to the Registrant's Quarterly Report on Form 10-Q for the quarter ended December 31, 2008 and incorporated herein by reference) | ||
(viii) | Director's Retirement Agreement with David J. Tooley (filed as an exhibit to the Registrant's Quarterly Report on Form 10-Q for the quarter ended December 31, 2011 and incorporated herein by reference) | ||
(ix) | Director's Retirement Agreement with Todd E. Hensley (filed as an exhibit to the Registrant's Annual Report on Form 10-K for the year ended June 30, 2015 and incorporated herein by reference) | ||
7. | Tax Sharing Agreement (filed as an exhibit to the Registrant's Quarterly Report on Form 10-Q for the quarter ended March 31, 2015 and incorporated herein by reference) | ||
10.1 | Named Executive Officer Salary and Bonus Arrangements | ||
10.2 | Director Fee Arrangements for 2017 | ||
11 | Statement Regarding Computation of Per Share Earnings | ||
14 | Code of Conduct and Ethics (filed as an exhibit to the Registrant's Annual Report on Form 10-K for the year ended June 30, 2011) | ||
14.1 | Amended Code of Conduct and Ethics (filed as an exhibit to Registrant's Annual Report on Form 10-K for the year ended June 30, 2016) | ||
21 | Subsidiaries of the Registrant | ||
23 | Consent of Auditors | ||
31.1 | Rule 13a-14(a)/15-d14(a) Certifications | ||
31.1 | Rule 13a-14(a)/15-d14(a) Certifications | ||
32 | Section 1350 Certifications | ||
112
SIGNATURES
Pursuant to the requirements of section 13 or 15(d) of the Securities Exchange Act of 1934, the registrant has duly caused this report to be signed on its behalf by the undersigned, thereunto duly authorized.
SOUTHERN MISSOURI BANCORP, INC. | ||||
Date: | September 13, 2017 | By: | /s/ Greg A. Steffens Greg A. Steffens President and Chief Executive Officer ( Duly Authorized Representative )
| |
Pursuant to the requirements of the Securities Exchange Act of 1934, this report has been signed below by the following persons on behalf of the registrant and in the capacities and on the dates indicated.
By: | /s/ Greg A. Steffens Greg A. Steffens President and Chief Executive Officer ( Principal Executive Officer ) | September 13, 2017 | |
By: | /s/ L. Douglas Bagby L. Douglas Bagby Vice Chairman and Director | September 13, 2017 | |
By: | /s/ Ronnie D. Black Ronnie D. Black Secretary and Director | September 13, 2017 | |
By: | /s/ Sammy A. Schalk Sammy A. Schalk Director | September 13, 2017 | |
By: | /s/ Rebecca McLane Brooks Rebecca McLane Brooks Director | September 13, 2017 | |
By: | /s/ Charles R. Love Charles R. Love Director | September 13, 2017 | |
By: | /s/ John R. Abercrombie John R. Abercrombie Director | September 13, 2017
| |
By: | /s/ Dennis C. Robison Dennis C. Robison Director | September 13, 2017 | |
By: | /s/ David J. Tooley David J. Tooley Director | September 13, 2017 | |
By: | /s/ Todd E. Hensley Todd E. Hensley Director | September 13, 2017 | |
By: | /s/ Matthew T. Funke Matthew T. Funke Chief Financial Officer (Principal Financial and Accounting Officer) | September 13, 2017 |
113
Index to Exhibits
Regulation S-K Exhibit Number |
Document | |
10.1 |
Named Executive Officer Salary and Bonus Agreement for fiscal 2016 | |
10.2 |
Director Fee Arrangements | |
11 |
Statement Regarding Computation of Per Share Earnings
| |
14.1 | Amended Code of Conduct and Ethics
| |
21 |
Subsidiaries of the Registrant | |
23 |
Consent of Auditors | |
31 |
Rule 13a-14(a)/15d-14(a) Certifications | |
32 |
Section 1350 Certifications |
114