Washington, D.C. 20549
Form 10-K
| (Mark One) | ||
x | ANNUAL REPORT PURSUANT TO SECTION 13 OR 15(d) OF THE SECURITIES EXCHANGE ACT OF 1934 | |
| For the fiscal year ended December 31, 2010 | ||
OR | ||
o | TRANSITION REPORT PURSUANT TO SECTION 13 OR 15(d) OF THE SECURITIES EXCHANGE ACT OF 1934 | |
| For the transition period from to | ||
Commission File Number 1-4601
Schlumberger N.V. (Schlumberger Limited)
(Exact name of registrant as specified in its charter)
| Curaçao (State or other jurisdiction of incorporation or organization) | 52-0684746 (IRS Employer Identification No.) | |
| 42, rue Saint-Dominique Paris, France | 75007 | |
| 5599 San Felipe,
17 th Floor Houston, Texas, United States of America | 77056 | |
| Parkstraat 83, The Hague, | ||
| The Netherlands | 2514 JG | |
| (Addresses of principal executive offices) | (Zip Codes) |
Registrant's telephone number in the United States, including area code, is:
(713) 375-3400
Securities registered pursuant to Section 12(b) of the Act:
Title of each class | Name of each exchange on which registered | |
Common Stock, par value $0.01 per share | New York Stock Exchange Euronext Paris The London Stock Exchange SIX Swiss Exchange Ltd. |
Securities registered pursuant to Section 12(g) of the Act:
None
Indicate by check mark if the registrant is a well-known seasoned issuer, as defined in Rule 405 of the Securities Act. YES x NO o
Indicate by check mark if the registrant is not required to file reports pursuant to Section 13 or Section 15(d) of the Act. YES o NO x
Indicate by check mark whether the registrant (1) has filed all reports required to be filed by Section 13 or 15(d) of the Securities Exchange Act of 1934 during the preceding 12 months (or for such shorter period that the registrant was required to file such reports), and (2) has been subject to such filing requirements for the past 90 days. YES x NO o
Indicate by check mark whether the registrant has submitted electronically and posted on its corporate Web site, if any, every Interactive Data File required to be submitted and posted pursuant to Rule 405 of Regulation S-T during the preceding 12 months (or for such shorter period that the registrant was required to submit and post such files. YES x NO o
Indicate by check mark if disclosure of delinquent filers pursuant to Item 405 of Regulation S-K is not contained herein, and will not be contained, to the best of the registrant's knowledge, in definitive proxy or information statements incorporated by reference in Part III of this Form 10-K or any amendment to this Form 10-K. o
Indicate by check mark whether the registrant is a large accelerated filer, an accelerated filer, a non-accelerated filer, or a smaller reporting company. See the definitions of "large accelerated filer," "accelerated filer" and "smaller reporting company" in Rule 12b-2 of the Exchange Act. (Check one):
(Do not check if a smaller reporting company)
Indicate by check mark whether the registrant is a shell company (as defined in Rule 12b-2 of the Act). YES o NO x
As of June 30, 2010, the aggregate market value of the common stock of the registrant held by non-affiliates of the registrant was approximately $65.9 billion.
As of January 31, 2011, the number of shares of common stock outstanding was 1,360,993,901.
DOCUMENTS INCORPORATED BY REFERENCE
Portions of the following document have been incorporated herein by reference into Part III of this Form 10-K to the extent described therein: the definitive proxy statement relating to Schlumberger's 2011 Annual General Meeting of Stockholders ("2011 Proxy Statement").
SCHLUMBERGER LIMITED
Table of Contents
Form 10-K
| Page | ||||||||
| PART I | ||||||||
| Item 1. | Business | 3 | ||||||
| Item 1A. | Risk Factors | 7 | ||||||
| Item 1B. | Unresolved Staff Comments | 12 | ||||||
| Item 2. | Properties | 12 | ||||||
| Item 3. | Legal Proceedings | 12 | ||||||
| Item 4. | [Removed and Reserved] | 12 | ||||||
| PART II | ||||||||
| Item 5. | Market for Schlumberger's Common Stock, Related Stockholder Matters and Issuer Purchases of Equity Securities | 14 | ||||||
| Item 6. | Selected Financial Data | 16 | ||||||
| Item 7. | Management's Discussion and Analysis of Financial Condition and Results of Operations | 17 | ||||||
| Item 7A. | Quantitative and Qualitative Disclosures About Market Risk | 34 | ||||||
| Item 8. | Financial Statements and Supplementary Data | 36 | ||||||
| Item 9. | Changes in and Disagreements with Accountants on Accounting and Financial Disclosure | 75 | ||||||
| Item 9A. | Controls and Procedures | 75 | ||||||
| Item 9B. | Other Information | 75 | ||||||
| PART III | ||||||||
| Item 10. | Directors, Executive Officers and Corporate Governance of Schlumberger | 76 | ||||||
| Item 11. | Executive Compensation | 76 | ||||||
| Item 12. | Security Ownership of Certain Beneficial Owners and Management and Related Stockholder Matters | 76 | ||||||
| Item 13. | Certain Relationships and Related Transactions, and Director Independence | 77 | ||||||
| Item 14. | Principal Accounting Fees and Services | 77 | ||||||
| PART IV | ||||||||
| Item 15. | Exhibits and Financial Statement Schedules | 78 | ||||||
| Signatures | 79 | |||||||
| Certifications | ||||||||
| EX-21 | ||||||||
| EX-23 | ||||||||
| EX-24 | ||||||||
| EX-31.1 | ||||||||
| EX-31.2 | ||||||||
| EX-32.1 | ||||||||
| EX-32.2 | ||||||||
| EX-101 INSTANCE DOCUMENT | ||||||||
| EX-101 SCHEMA DOCUMENT | ||||||||
| EX-101 CALCULATION LINKBASE DOCUMENT | ||||||||
| EX-101 LABELS LINKBASE DOCUMENT | ||||||||
| EX-101 PRESENTATION LINKBASE DOCUMENT | ||||||||
| EX-101 DEFINITION LINKBASE DOCUMENT | ||||||||
Part I, Item 1
PART I
Item 1. Business.
All references in this report to "Registrant," "Company," "Schlumberger," "we" or "our" are to Schlumberger Limited (Schlumberger N.V., incorporated in Curaçao) and its consolidated subsidiaries.
Founded in 1926, Schlumberger is the world's leading supplier of technology, integrated project management and information solutions to the international oil and gas exploration and production industry. Having invented wireline logging as a technique for obtaining downhole data in oil and gas wells, the Company today provides the industry's widest range of products and services from exploration through production. As of December 31, 2010, the Company employed approximately 108,000 people of over 140 nationalities operating in approximately 80 countries. Schlumberger has principal executive offices in Paris, Houston and The Hague.
On August 27, 2010, Schlumberger acquired all of the outstanding shares of Smith International, Inc. ("Smith"), a leading supplier of premium products and services to the oil and gas exploration and production industry. In connection with this transaction, Schlumberger issued 176 million shares of its common stock, valued at approximately $9.8 billion as of the acquisition date. As a result of this transaction, Schlumberger consists of five business segments as of December 31, 2010 – Schlumberger Oilfield Services, WesternGeco, M-I SWACO, Smith Oilfield and Distribution.
Schlumberger Oilfield Services operates in each of the major oilfield service markets, managing its business through its GeoMarket* regions, which are grouped into four geographic areas: North America, Latin America, Europe/CIS/Africa and Middle East & Asia. The GeoMarket structure offers customers a single point of contact at the local level for field operations and brings together geographically focused teams to meet local needs and deliver customized solutions. Within this business structure, Schlumberger Oilfield Services products and services are developed by a number of technology-based product lines, or Technologies, to capitalize on technical synergies. These products and services cover the entire life cycle of the reservoir and correspond to a number of markets in which Schlumberger Oilfield Services holds leading positions. The Technologies are also responsible for overseeing operational processes, resource allocation, personnel and quality in the GeoMarkets.
The Technologies are:
| • | Wireline – provides the information necessary to evaluate the subsurface formation rocks and fluids to plan and monitor well construction, and to monitor and evaluate well production. Wireline offers both open-hole and cased-hole services as well as a range of well remediation services. | |
| • | Drilling & Measurements – supplies engineering support, directional-drilling, measurement-while-drilling and logging-while-drilling services for all well profiles. | |
| • | Testing Services – provides exploration and production pressure and flow-rate measurement services both at the surface and downhole. The Technology also provides tubing-conveyed perforating services. | |
| • | Well Services – provides services used during oil and gas well drilling and completion as well as those used to maintain optimal production throughout the life of a well. The services include pressure pumping, well cementing and stimulation operations as well as intervention activities. The Technology also develops coiled-tubing equipment and services. | |
| • | Completions – supplies well completion services and equipment that includes upper and lower completion systems, sand management systems and permanently installed instrumentation for all types of well completion. | |
| • | Artificial Lift – provides electrical submersible pumps and gas lift equipment together with associated instrumentation, engineering and production optimization services. | |
| • | Data & Consulting Services – supplies interpretation and integration of all exploration and production data types, as well as expert consulting services for reservoir characterization, production enhancement, field development planning and multi-disciplinary reservoir and production solutions. |
3
Part I, Item 1
| • | Schlumberger Information Solutions (SIS) – provides consulting, software, information management and IT infrastructure services that support core oil and gas industry operational processes. | |
| • | Geoservices – supplies mud logging services for geological and drilling surveillance. Geological surveillance includes formation evaluation to provide information on lithology and hydrocarbons encountered while drilling. Drilling surveillance enhances safety and optimizes drilling efficiency using a range of drilling parameter measurements. Geoservices also supplies slickline services for downhole mechanical well intervention and reservoir monitoring and downhole data acquisition. |
Supporting the Technologies are various research and engineering centers. Through this organization, Schlumberger is committed to advanced technology programs that enhance oilfield efficiency, lower finding and producing costs, improve productivity, maximize reserve recovery and increase asset value while accomplishing these goals in a safe and environmentally sound manner.
Schlumberger Oilfield Services also offers customers its services through a business model known as Integrated Project Management (IPM). IPM combines the required services and products of the Technologies with drilling rig management expertise and project management skills to provide a complete solution to well construction and production improvement. IPM projects are typically of multi-year duration and include start-up costs and significant third-party components which cover services that Schlumberger does not provide directly. Projects may be fixed price in nature, contain penalties for non-performance and may also offer opportunities for bonus payments where performance exceeds agreed targets. IPM also provides specialized engineering and project management expertise when Schlumberger is requested to include these capabilities with services and products across the Technologies in a single contract. In no circumstances do IPM projects fail to respect the Schlumberger business profile that precludes any stake in the ownership of oil or gas reserves.
Schlumberger Oilfield Services uses its own personnel to market its offerings. The customer base, business risks and opportunities for growth are essentially uniform across all services. There is a sharing of manufacturing and engineering facilities as well as research centers, and the labor force is interchangeable. Technological innovation, quality of service, and price differentiation are the principal methods of competition, which varies geographically with respect to the different services offered. While there are numerous competitors, both large and small, Schlumberger believes that it is an industry leader in providing wireline logging, well testing, measurement-while-drilling, logging-while-drilling and directional-drilling services, as well as fully computerized logging and geoscience software and computing services. A large proportion of Schlumberger offerings is non-rig related; consequently, revenue does not necessarily correlate to rig count fluctuations.
WesternGeco , the world's most technologically advanced surface seismic company, provides comprehensive reservoir imaging, monitoring and development services with the most extensive seismic crews and data processing centers in the industry as well as a leading multiclient seismic library. Services range from 3D and time-lapse (4D) seismic surveys to multi-component surveys for delineating prospects and reservoir management. WesternGeco benefits from full access to the Schlumberger research, development and technology organization and shares similar business risks, opportunities for growth, principal methods of competition and means of marketing as Schlumberger Oilfield Services. Seismic solutions include proprietary single-sensor technologies for enhanced reservoir description, characterization and monitoring throughout the life of the field – from exploration through enhanced recovery. Other WesternGeco solutions include development of controlled-source electromagnetic and magneto-telluric surveys and their integration with seismic data.
Positioned for meeting a full range of customer needs in land, marine and shallow-water transition-zone services, WesternGeco offers a wide scope of technologies and services:
| • | Land Seismic – provides comprehensive resources for seismic data acquisition on land and across shallow-water transition zones. | |
| • | Marine Seismic – provides industry-standard marine seismic acquisition and processing systems as well as a unique industry-leading, fully calibrated single-sensor marine seismic system that delivers the seismic technology needed for new-generation reservoir management. |
4
Part I, Item 1
| • | Multiclient Services – supplies high-quality seismic data from the multiclient library, including industry-leading Q technology data. | |
| • | Reservoir Services – provides people, tools and technology to help customers capture the benefits of a completely integrated approach to locating, defining and monitoring the reservoir. | |
| • | Data Processing – offers extensive seismic data processing centers for complex data processing projects. | |
| • | Electromagnetics – provides controlled-source electromagnetic and magneto-telluric data processing and interpretation. |
M-I SWACO is the leading supplier of drilling fluid systems engineered to improve drilling performance by anticipating fluids-related problems, fluid systems and specialty tools designed to optimize wellbore productivity, production technology solution to maximize production rates, and environmental solutions that safely manage waste volumes generated in both drilling and production operations. The M-I SWACO solutions offering blends an understanding of technology, application and service to enable its clients to achieve their project-specific goals. Operationally, these solutions are delivered through its GeoMarket regions, which are grouped into geographic areas, similar to Schlumberger Oilfield Services.
M-I SWACO's business is organized into four core solutions offerings: Drilling Solutions, Wellbore Productivity, Production Technologies and Environmental Solutions. These core offerings are organized around the operator's exploration and production activities – drilling, completion and production. Environmental Solutions are designed to include all three of these activities, allowing M-I SWACO to leverage its environmental technologies across all three of the operator's exploration and production activities.
| • | Drilling Solutions – provides a complete offering of oil-, water- and synthetic-based drilling fluids and additives as well as engineering services that include proprietary software systems, knowledge databases and laboratory capabilities. | |
| • | Wellbore Productivity – consists of a suite of services, products and technical support that focus on safeguarding well completions and formation stability by assuring the optimal quality of the wellbore and fluid systems. | |
| • | Production Technologies – provides a line of oilfield specialty chemical, equipment and related technical services that are used to enhance the flow of hydrocarbons from the wellbore. | |
| • | Environmental Solutions – focuses on the best approach to safely managing waste volumes produced during the drilling, completion and production operations in a way that allows clients to achieve their environmental performance standards. |
Prior to its acquisition of Smith, Schlumberger held a 40% interest in M-I SWACO through a joint venture with Smith.
Smith Oilfield provides a comprehensive suite of technologically advanced products, services and engineering used in oil and natural gas development activities. Smith Oilfield is a global leader in the design, manufacture and marketing of drill bits and borehole enlargement tools and is also a leading supplier of drilling tools and services, tubular, completion services and other related downhole solutions. Smith Oilfield also leverages its proprietary suite of modeling and design software and application data together with its comprehensive product and service offerings to optimize the creation of the wellbore.
Distribution operations provide products and services to the energy refining, petrochemical, power generation and mining industries. The segment consists of the operations of Wilson International, Inc., a wholly-owned subsidiary, and a majority owned interest in C.E. Franklin Ltd., a publicly owned Canadian distribution company. Distribution operates an extensive network of supply branches, service centers and sales offices through which it markets pipes, valves and fittings as well as mill, safety and other maintenance products, predominantly in the United States and Canada. Additionally, the Distribution segment provides warehouse management, vendor integration and various inventory management services.
5
Part I, Item 1
Acquisitions
Information about acquisitions made by Schlumberger appears in Note 4 of the Consolidated Financial Statements .
GENERAL
Patents
While Schlumberger seeks and holds numerous patents covering various products and processes, no particular patent or group of patents is considered material to Schlumberger's business.
Seasonality
Although weather and natural phenomena can temporarily affect delivery of oilfield services, the widespread geographic location of such services precludes the overall business from being characterized as seasonal.
Customers and Backlog of Orders
For the year ended December 31, 2010, no single customer exceeded 10% of consolidated revenue. Other than WesternGeco, we have no significant backlog due to the nature of our businesses. The WesternGeco backlog, which is based on signed contracts with customers, was $0.9 billion at December 31, 2010 ($1.0 billion at December 31, 2009).
Employees
As of December 31, 2010, Schlumberger had approximately 108,000 employees.
Financial Information
Financial information by business segment for the years ended December 31, 2010, 2009 and 2008 is provided in Note 17 of the Consolidated Financial Statements .
Available Information
The Schlumberger Internet website is www.slb.com. Schlumberger uses its Investor Relations website, www.slb.com/ir, as a channel for routine distribution of important information, including news releases, analyst presentations, and financial information. Schlumberger makes available free of charge on or through its Investor Relations website at www.slb.com/ir access to its Annual Reports on Form 10-K, Quarterly Reports on Form 10-Q, Current Reports on Form 8-K, its proxy statements and Forms 3, 4 and 5 filed on behalf of directors and executive officers, and amendments to each of those reports, as soon as reasonably practicable after such material is filed with or furnished to the Securities and Exchange Commission ("SEC"). Alternatively, you may access these reports at the SEC's Internet website at www.sec.gov.
Schlumberger's corporate governance materials, including Board Committee Charters, Corporate Governance Guidelines and Code of Ethics, may also be found at www.slb.com/ir. From time to time, corporate governance materials on our website may be updated to comply with rules issued by the SEC and the New York Stock Exchange ("NYSE") or as desirable to promote the effective governance of Schlumberger.
Any stockholder wishing to receive, without charge, a copy of any of Schlumberger's SEC filings should write to the Secretary, Schlumberger Limited, 5599 San Felipe, 17th Floor, Houston, Texas 77056, USA.
Schlumberger has filed the required certifications under Section 302 of the Sarbanes-Oxley Act of 2002 as Exhibits 31.1 and 31.2 to this Form 10-K.
The information on our website or any other website is not incorporated by reference in this Report and should not be considered part of this Report or any other filing Schlumberger makes with the SEC.
6
Part I, Item 1A
Item 1A. Risk Factors.
The following discussion of risk factors contains "forward-looking statements," which are discussed immediately following Item 7A. of this Form 10-K. These risk factors may be important to understanding any statement in this Form 10-K or elsewhere. The following information should be read in conjunction with Item 7. Management's Discussion and Analysis of Financial Condition and Results of Operations, and the consolidated financial statements and related notes included in this Form 10-K.
We urge you to consider carefully the risks described below, as well as in other reports and materials that we file with the SEC and the other information included or incorporated by reference in Form 10-K. If any of the risks described below or elsewhere in this Form 10-K were to materialize, our business, financial condition, results of operations, cash flows or prospects could be materially adversely affected. In such case, the trading price of our common stock could decline and you could lose part or all of your investment. Additional risks and uncertainties not currently known to us or that we currently deem immaterial may also materially adversely affect our financial condition, results of operations and cash flows.
Demand for the majority of our services is substantially dependent on the levels of expenditures by the oil and gas industry. A substantial or an extended decline in oil and gas prices could result in lower expenditures by the oil and gas industry, which could have a material adverse effect on our financial condition, results of operations and cash flows.
Demand for the majority of our services depends substantially on the level of expenditures by the oil and gas industry for the exploration, development and production of oil and natural gas reserves. These expenditures are generally dependent on the industry's view of future oil and natural gas prices and are sensitive to the industry's view of future economic growth and the resulting impact on demand for oil and natural gas. Declines, as well as anticipated declines, in oil and gas prices could also result in project modifications, delays or cancellations, general business disruptions, and delays in, or nonpayment of, amounts that are owed to us. These effects could have a material adverse effect on our results of operations and cash flows.
The prices for oil and natural gas have historically been volatile and may be affected by a variety of factors, including:
| • | demand for hydrocarbons, which is affected by worldwide population growth, economic growth rates and general economic and business conditions; | |
| • | the ability of the Organization of Petroleum Exporting Countries ("OPEC") to set and maintain production levels for oil; | |
| • | oil and gas production by non-OPEC countries; | |
| • | the level of excess production capacity; | |
| • | political and economic uncertainty and sociopolitical unrest; | |
| • | the level of worldwide oil and gas exploration and production activity; | |
| • | the cost of exploring for, producing and delivering oil and gas; | |
| • | technological advances affecting energy consumption; and | |
| • | weather conditions. |
The oil and gas industry has historically experienced periodic downturns, which have been characterized by diminished demand for oilfield services and downward pressure on the prices we charge. A significant downturn in the oil and gas industry could result in a reduction in demand for oilfield services and could adversely affect our financial condition, results of operations and cash flows.
7
Part I, Item 1A
A significant portion of our revenue is derived from our non-United States operations, which exposes us to risks inherent in doing business in each of the approximately 80 countries in which we operate.
Our non-United States operations accounted for approximately 76% of our consolidated revenue in 2010, 84% in 2009 and 78% in 2008. Operations in countries other than the United States are subject to various risks, including:
| • | unsettled political and economic conditions in certain areas; | |
| • | exposure to possible expropriation of our assets or other governmental actions; | |
| • | social unrest, acts of terrorism, war or other armed conflict; | |
| • | confiscatory taxation or other adverse tax policies; | |
| • | deprivation of contract rights; | |
| • | trade restrictions or embargoes imposed by the United States or other countries; | |
| • | restrictions under the United States Foreign Corrupt Practices Act or similar legislation in other countries; | |
| • | restrictions on the repatriation of income or capital; | |
| • | currency exchange controls; | |
| • | inflation; and | |
| • | currency exchange rate fluctuations and devaluations. |
In addition, we are subject to risks associated with our operations in countries, including Iran, Syria, Sudan and Cuba, that are subject to trade and economic sanctions or other restrictions imposed by the United States or other governments or organizations. United States law enforcement authorities are currently conducting a grand jury investigation and an associated regulatory inquiry related to our operations in certain of these countries. Additionally, in 2009 prior to its merger with Schlumberger, Smith received an administrative subpoena with respect to its historical business practices in certain countries that are subject to United States trade and economic sanctions. If any of the risks described above materialize, or if any governmental investigation results in criminal or civil penalties or other remedial measures, it could reduce our earnings and our cash available for operations.
We are also subject to risks related to investment in our common stock in connection with certain US state divestment or investment limitation legislation applicable to companies with operations in these countries, and similar actions by some private investors, which could adversely affect the market price of our common stock.
Our merger with Smith will continue to be dilutive to our earnings per share in the near term, which may negatively affect the market price of our common stock.
Our merger with Smith will continue to be dilutive to earnings per share in the near term. Future events and conditions could decrease or delay any accretion, result in dilution or cause greater dilution than is currently expected, including adverse changes in:
| • | energy market conditions; | |
| • | commodity prices for oil, natural gas and natural gas liquids; | |
| • | production levels; | |
| • | reserve levels; | |
| • | operating results; | |
| • | competitive conditions; | |
| • | laws and regulations affecting the energy business; | |
| • | capital expenditure obligations; and | |
| • | general economic conditions. |
8
Part I, Item 1A
Any dilution of, or decrease or delay of any accretion to, our earnings per share could cause the price of our common stock to decline.
Our offshore oil and gas operations could be adversely impacted by the Deepwater Horizon drilling rig accident and resulting oil spill; changes in and compliance with restrictions or regulations on offshore drilling in the US Gulf of Mexico and in other areas around the world may adversely affect our business and operating results.
On April 20, 2010, a fire and explosion occurred onboard the semisubmersible drilling rig Deepwater Horizon , owned by Transocean Ltd. and under contract to a subsidiary of BP plc. As a result of the incident and related oil spill, the Secretary of the US Department of the Interior directed the Bureau of Ocean Energy Management, Regulation and Enforcement ("BOEMRE") to issue a suspension, until November 30, 2010, of drilling activities for specified drilling configurations and technologies. Although this moratorium was lifted on October 12, 2010, effective immediately, we cannot predict with certainty when drilling operations will fully resume in the US Gulf of Mexico. The BOEMRE has also issued new guidelines and regulations regarding safety, environmental matters, drilling equipment and decommissioning applicable to drilling in the US Gulf of Mexico, and may take other additional steps that could increase the costs of exploration and production, reduce the area of operations and result in permitting delays.
At this time, we cannot predict with any certainty what further impact, if any, the Deepwater Horizon incident may have on the regulation of offshore oil and gas exploration and development activity, or on the cost or availability of insurance coverage to cover the risks of such operations. Ongoing effects of and delays from the lifted suspension of drilling activity in the US Gulf of Mexico, or the enactment of new or stricter regulations in the United States and other countries where we operate, could materially adversely affect our financial condition, results of operations or cash flows.
Environmental compliance costs and liabilities could reduce our earnings and cash available for operations.
We are subject to increasingly stringent laws and regulations relating to importation and use of hazardous materials, radioactive materials and explosives, environmental protection, including laws and regulations governing air emissions, water discharges and waste management. We incur, and expect to continue to incur, capital and operating costs to comply with environmental laws and regulations. The technical requirements of these laws and regulations are becoming increasingly complex, stringent and expensive to implement. These laws may provide for "strict liability" for damages to natural resources or threats to public health and safety. Strict liability can render a party liable for damages without regard to negligence or fault on the part of the party. Some environmental laws provide for joint and several strict liability for remediation of spills and releases of hazardous substances.
We use and generate hazardous substances and wastes in our operations. In addition, many of our current and former properties are, or have been, used for industrial purposes. Accordingly, we could become subject to potentially material liabilities relating to the investigation and cleanup of contaminated properties, and to claims alleging personal injury or property damage as the result of exposures to, or releases of, hazardous substances. In addition, stricter enforcement of existing laws and regulations, new laws and regulations, the discovery of previously unknown contamination or the imposition of new or increased requirements could require us to incur costs or become the basis of new or increased liabilities that could reduce our earnings and our cash available for operations. We believe we are currently in substantial compliance with environmental laws and regulations.
We could be subject to substantial liability claims, which would adversely affect our financial condition, results of operations and cash flows.
Certain equipment used in the delivery of oilfield services, such as directional drilling equipment, perforating systems, subsea completion equipment, radioactive materials and explosives and well completion systems, are used in hostile environments, such as exploration, development and production applications. An accident or a failure of a product could cause personal injury, loss of life, damage to property, equipment or the environment, and suspension of operations. Our insurance may not protect us against liability for some kinds of events, including events involving pollution, or against losses resulting from business interruption. Moreover, in the future we may not be able to maintain insurance at levels of risk coverage or policy limits that we deem adequate. Substantial claims made under our policies could cause our premiums to increase. Any future damages caused by our products that are not covered by insurance, or
9
Part I, Item 1A
are in excess of policy limits or are subject to substantial deductibles, could adversely affect our financial condition, results of operations and cash flows.
If we are unable to maintain technology leadership, this could adversely affect any competitive advantage we hold.
If we are unable to develop and produce competitive technology or deliver it to our clients in the form of service offerings in a timely and cost-competitive manner in the various markets we serve, it could adversely affect our financial condition, results of operations and cash flows.
Limitations on our ability to protect our intellectual property rights, including our trade secrets, could cause a loss in revenue and any competitive advantage we hold.
Some of our products or services, and the processes we use to produce or provide them, have been granted patent protection, have patent applications pending or are trade secrets. Our business may be adversely affected if our patents are unenforceable, the claims allowed under our patents are not sufficient to protect our technology, our patent applications are denied, or our trade secrets are not adequately protected. Our competitors may be able to develop technology independently that is similar to ours without infringing on our patents or gaining access to our trade secrets.
We may be subject to litigation if another party claims that we have infringed upon its intellectual property rights.
The tools, techniques, methodologies, programs and components we use to provide our services may infringe upon the intellectual property rights of others. Infringement claims generally result in significant legal and other costs and may distract management from running our core business. Royalty payments under licenses from third parties, if available, would increase our costs. If a license were not available we might not be able to continue providing a particular service or product, which could adversely affect our financial condition, results of operations and cash flows. Additionally, developing non-infringing technologies would increase our costs.
Failure to obtain and retain skilled technical personnel could impede our operations.
We require highly skilled personnel to operate and provide technical services and support for our business. Competition for the personnel required for our businesses intensifies as activity increases. In periods of high utilization it may become more difficult to find and retain qualified individuals. This could increase our costs or have other adverse effects on our operations.
Severe weather conditions may affect our operations.
Our business may be materially affected by severe weather conditions in areas where we operate. This may entail the evacuation of personnel and stoppage of services. In addition, if particularly severe weather affects platforms or structures, this may result in a suspension of activities until the platforms or structures have been repaired. Any of these events could adversely affect our financial condition, results of operations and cash flows.
Demand for our products and services could be reduced or eliminated by governmental regulation or a change in the law.
International, national, and state governments and agencies are currently evaluating and promulgating climate-related legislation and regulations that are focused on restricting greenhouse gas ("GHG") emissions. In the United States, the Environmental Protection Agency ("EPA") is taking steps to require monitoring and reporting of GHG emissions and to regulate GHGs as pollutants under the Clean Air Act ("CAA"). The EPA's "Mandatory Reporting of Greenhouse Gases" rule established a comprehensive scheme of regulations that require monitoring and reporting of GHG emissions that began in 2010. Furthermore, the EPA recently proposed additional GHG reporting rules specifically for the oil and gas industry. The EPA has also published a final rule, the "Endangerment Finding," finding that GHGs in the atmosphere endanger public health and welfare, and that emissions of GHGs from mobile sources cause or
10
Part I, Item 1A
contribute to the GHG pollution. Following issuance of the Endangerment Finding, the EPA promulgated final motor vehicle GHG emission standards on April 1, 2010. The EPA has asserted that the final motor vehicle GHG emission standards will trigger construction and operating permit requirements for stationary sources. In addition, climate change legislation is pending in the United States Congress. These developments may curtail production and demand for fossil fuels such as oil and gas in areas of the world where our customers operate and thus adversely affect future demand for our services, which may in turn adversely affect future results of operations. Additionally, legislation to reduce greenhouse gases may have an adverse effect on our operations, including payment of additional costs due to carbon emissions. Higher carbon emission activities include transportation, including marine vessels, cement production (by third party suppliers), and electricity generation (by third party suppliers) as well as other activities. Finally, our business could be negatively affected by climate change related physical changes or changes in weather patterns, which could result in damages to or loss of our physical assets, impacts to our ability to conduct operations and/or disruption of our customers' operations.
Legislation may be introduced in the United States Congress that would authorize the EPA to regulate hydraulic fracturing. In addition, a number of states are evaluating the adoption of legislation or regulations governing hydraulic fracturing. Such legislation or regulations could reduce demand for pressure pumping services. If federal and/or state legislation or regulations were enacted, it could adversely affect our financial condition, results of operations and cash flows. We are unable to predict whether the proposed legislation, regulations, or any other proposals will ultimately be enacted.
11
Part I, Item 1B, 2, 3, 4
Item 1B. Unresolved Staff Comments.
None.
Item 2. Properties.
Schlumberger owns or leases numerous manufacturing facilities, administrative offices, service centers, research centers, data processing centers, mines, ore, drilling fluid and production chemical processing centers, sales offices and warehouses throughout the world. Schlumberger views its principal manufacturing, mining and processing facilities, research centers and data processing centers as its "principal owned or leased facilities."
The following sets forth Schlumberger's principal owned or leased facilities by business segment:
Oilfield Services: Beijing, China; Clamart, France; Fuchinobe, Japan; Singapore; Abingdon, Cambridge and Stonehouse, United Kingdom; Novosibirsk, Russia; and within the United States: Boston, Massachusetts; Houston, Rosharon and Sugar Land, Texas; and Lawrence, Kansas.
WesternGeco: Bergen and Oslo, Norway; Gatwick, United Kingdom; Houston, Texas, United States; and Mumbai, India.
M-I SWACO: Aberdeen, Edinburgh, Foss and Aberfly, Scotland; Karmoy, Norway; and within the United States: Battle Mountain and Greystone, Nevada; Greybull, Wyoming; Amelia and Port Fourchon, Louisiana; Galveston and Houston, Texas; Florence, Kentucky; and Tulsa, Oklahoma.
Smith Oilfield: Aberdeen, Scotland; Scurelle, Italy; Neuquen, Argentina; Jebel Ali, Dubai; Changzhou, China and within the United States: Houston, Texas; Ponca City, Oklahoma; Provo, Utah; and Rancho Cucuamonga, California.
Distribution: Edmonton, Canada; and within the United States: LaPorte, Texas; Long Beach, California; and South Plainfield, New Jersey.
Item 3 . Legal Proceedings.
The information with respect to this Item 3 is set forth in Note 16 of the Consolidated Financial Statements .
Item 4. [Removed and Reserved]
Executive Officers of Schlumberger
The following table sets forth, as of January 31, 2011, the names and ages of the executive officers of Schlumberger, including all offices and positions held by each for at least the past five years.
| Name | Age | Present Position and Five-Year Business Experience | ||||
Andrew Gould | 64 | Chairman and Chief Executive Officer, since February 2003. | ||||
Paal Kibsgaard | 43 | Chief Operating Officer since February 2010; President Reservoir Characterization Group, May 2009 to February 2010; Vice President Engineering, Manufacturing and Sustaining, November 2007 to May 2009; Vice President Personnel, April 2006 to November 2007; and President, Drilling and Measurements, January 2003 to April 2006. | ||||
Simon Ayat | 56 | Executive Vice President and Chief Financial Officer, since March 2007; Vice President Treasurer, February 2005 to March 2007; and Vice President, Controller and Business Processes, December 2002 to February 2005. | ||||
Alexander Juden | 50 | Secretary and General Counsel, since April 2009; Director of Compliance, February 2005 to April 2009; and WesternGeco General Counsel, May 2004 to February 2005. | ||||
Ashok Belani | 52 | Vice President, Technology, since January 2011; President, Reservoir Characterization Group, since February 2010; Vice President and Chief Technology Officer, April 2006 to February 2010; Senior Advisor, Technology, January 2006 to April 2006; Director, President and Chief Executive Officer NPTest, May 2002 to December 2005. | ||||
Stephanie Cox | 42 | Vice President Personnel, since May 2009; North Gulf Coast GeoMarket Manager, April 2006 to May 2009; and North & South America Personnel Manager, May 2004 to April 2006. | ||||
Mark Danton | 54 | Vice President - Director of Taxes, since January 1999. | ||||
Howard Guild | 39 | Chief Accounting Officer, since July 2005; and Director of Financial Reporting, October 2004 to July 2005. | ||||
12
Part I, Item 4
| Name | Age | Present Position and Five-Year Business Experience | ||||
Rodney Nelson | 52 | Vice President Communications, Innovation and Collaboration, since October 2007; Vice President Innovation and Collaboration, July 2006 to October 2007; Vice President Strategic Marketing, July 2004 to July 2006; and Vice President Marketing Oilfield Services, February 2003 to July 2004. | ||||
Kjell-Erik Oestdahl | 46 | Vice President Operations, since January 2011; Vice President Supply Chain Services, since May 2009; Vice President Operations WesternGeco, January 2008 to April 2009; Chief Procurement Officer at StatoilHydro ASA, March 2006 to November 2007; GeoMarket Manager, NSG, from January 2005 to February 2006. | ||||
Satish Pai | 49 | Vice President, Operations, Oilfield Services, since May 2008, President Europe Africa & Caspian, March 2006 to May 2008; and Vice President Oilfield Technologies, March 2002 to March 2006. | ||||
Douglas Pferdehirt | 46 | Vice President Corporate Development and Communication, since January 2011; President Reservoir Production Group, from April 2006 to January 2011; and Vice President Communications and Investor Relations, July 2003 to March 2006. | ||||
Jean-Francois Poupeau | 49 | President Drilling Group, since May 2010; President Drilling & Measurements, July 2007 to April 2010; Vice President Communications and Investor Relations, April 2006 to June 2007; and Vice President Oilfield Services Product Marketing, August 2004 to March 2006. | ||||
Patrick Schorn | 42 | President Reservoir Production Group, since January 2011; President Well Services, May 2008 to January 2011; President Completions, April 2006 to April 2008; Marketing Manager Well Services, August 2004 to March 2006. | ||||
Krishna Shivram | 48 | Vice President Treasurer, since January 2011; Controller Drilling Group, May 2010 to January 2011; Manager Mergers & Acquisitions, May 2009 to April 2010; Controller Oilfield Services, August 2006 to April 2009; Vice President Finance WesternGeco, March 2004 to July 2006. | ||||
Malcolm Theobald | 49 | Vice President Investor Relations, since June 2007; and Global Account Director, September 2001 to June 2007. | ||||
13
Part II, Item 5
PART II
| Item 5. | Market for Schlumberger's Common Stock, Related Stockholder Matters and Issuer Purchases of Equity Securities. |
As of January 31, 2011, there were approximately 23,924 stockholders of record. The principal United States market for Schlumberger's common stock is the NYSE, where it is traded under the symbol "SLB".
Schlumberger's common stock is also traded on the Euronext Paris, Euronext Amsterdam, London and SIX Swiss stock exchanges.
Common Stock, Market Prices and Dividends Declared per Share
Quarterly high and low prices for Schlumberger's common stock as reported by the NYSE (composite transactions), together with dividends declared per share in each quarter of 2010 and 2009, were:
| Price Range | Dividends | |||||||||||
| High | Low | Declared | ||||||||||
2010 | ||||||||||||
QUARTERS | ||||||||||||
First | $ | 72.00 | $ | 59.42 | $ | 0.210 | ||||||
Second | 73.99 | 51.67 | 0.210 | |||||||||
Third | 63.72 | 52.91 | 0.210 | |||||||||
Fourth | 84.11 | 60.57 | 0.210 | |||||||||
2009 | ||||||||||||
QUARTERS | ||||||||||||
First | $ | 49.25 | $ | 35.05 | $ | 0.210 | ||||||
Second | 63.78 | 39.11 | 0.210 | |||||||||
Third | 63.00 | 48.13 | 0.210 | |||||||||
Fourth | 71.10 | 56.00 | 0.210 | |||||||||
On January 21, 2011, Schlumberger announced that its Board of Directors had approved an increase in the quarterly dividend of 19%, to $0.25.
There are no legal restrictions on the payment of dividends or ownership or voting of such shares, except as to shares held as treasury stock. Under current legislation, stockholders are not subject to any Curaçao withholding or other Curaçao taxes attributable to the ownership of such shares.
The following graph compares the yearly percentage change in the cumulative total stockholder return on Schlumberger common stock, assuming reinvestment of dividends on the last day of the month of payment into common stock of Schlumberger, with the cumulative total return on the Standard & Poor's 500 Index (S&P 500 Index) and the cumulative total return on the Philadelphia Oil Service Index (OSX) over the five-year period ending on December 31, 2010. The stockholder return set forth below is not necessarily indicative of future performance. The following graph and related information shall not be deemed "soliciting material" or to be "filed" with the SEC, nor shall such information be incorporated by reference into any future filing under the Securities Act of 1933 or the Securities Exchange Act of 1934, except to the extent that Schlumberger specifically incorporates it by reference into such filing.
14
Part II, Item 5
COMPARISON
OF FIVE-YEAR CUMULATIVE TOTAL RETURN AMONG
SCHLUMBERGER COMMON STOCK, THE S&P 500 INDEX AND THE
PHILADELPHIA OIL SERVICE INDEX (OSX)
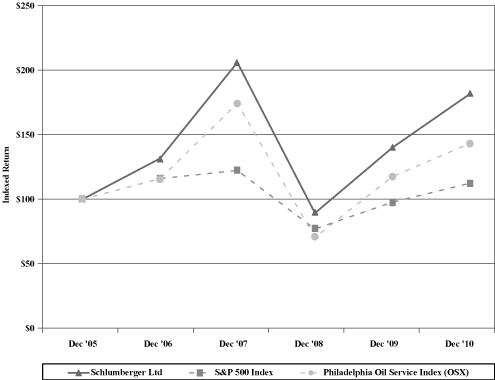
Assumes $100 invested on December 31, 2005 in Schlumberger common stock, in the S&P 500 Index and in the Philadelphia Oil Service Index (OSX). Reflects reinvestment of dividends on the last day of the month of payment.
15
Part II, Item 5, 6
Share Repurchases
On April 17, 2008, the Schlumberger Board of Directors approved an $8 billion share repurchase program for Schlumberger common stock, to be acquired in the open market before December 31, 2011.
Schlumberger's common stock repurchase program activity for the three months ended December 31, 2010 was as follows:
| (Stated in thousands, except per share amounts) | ||||||||||||||||
| Total | Maximum | |||||||||||||||
| number of | value | |||||||||||||||
| shares | of shares | |||||||||||||||
| purchased | that may | |||||||||||||||
| as part of | yet be | |||||||||||||||
| Total number | Average price | publicly | purchased | |||||||||||||
| of shares | paid per | announced | under the | |||||||||||||
| purchased | share | program | program | |||||||||||||
October 1 through October 31, 2010 | 1,931.0 | $ | 63.04 | 1,931.0 | $ | 5,176,181 | ||||||||||
November 1 through November 30, 2010 | 1,050.0 | $ | 73.46 | 1,050.0 | $ | 5,099,043 | ||||||||||
December 1 through December 31, 2010 | 3,074.3 | $ | 81.35 | 3,074.3 | $ | 4,848,944 | ||||||||||
| 6,055.3 | $ | 74.14 | 6,055.3 | |||||||||||||
In connection with the exercise of stock options under Schlumberger's incentive compensation plans, Schlumberger routinely receives shares of its common stock from optionholders in consideration of the exercise price of the stock options. Schlumberger does not view these transactions as requiring disclosure under this Item 5 as the number of shares of Schlumberger common stock received from optionholders is not material.
Unregistered Sales of Equity Securities
None.
| Item 6. | Selected Financial Data. |
The following selected consolidated financial data should be read in conjunction with both "Item 7. Management's Discussion and Analysis of Financial Condition and Results of Operations" and "Item 8. Financial Statements and Supplementary Data" of this Form 10-K in order to understand factors, such as business combinations and charges and credits, which may affect the comparability of the Selected Financial Data:
| (Stated in millions, except per share amounts) | ||||||||||||||||||||
| Year Ended December 31, | ||||||||||||||||||||
| 2010 | 2009 | 2008 | 2007 | 2006 | ||||||||||||||||
Revenue | $ | 27,447 | $ | 22,702 | $ | 27,163 | $ | 23,277 | $ | 19,230 | ||||||||||
Income from Continuing Operations | $ | 4,266 | $ | 3,164 | $ | 5,422 | $ | 5,177 | $ | 3,759 | ||||||||||
Diluted earnings per share from Continuing Operations | $ | 3.38 | $ | 2.61 | $ | 4.42 | $ | 4.20 | $ | 3.01 | ||||||||||
Working capital | $ | 7,233 | $ | 6,391 | $ | 4,811 | $ | 3,551 | $ | 2,731 | ||||||||||
Total assets | $ | 51,767 | $ | 33,465 | $ | 32,094 | $ | 27,853 | $ | 22,832 | ||||||||||
Net debt (1) | $ | 2,638 | $ | 126 | $ | 1,129 | $ | 1,857 | $ | 2,834 | ||||||||||
Long-term debt | $ | 5,517 | $ | 4,355 | $ | 3,694 | $ | 3,794 | $ | 4,664 | ||||||||||
Schlumberger stockholders' equity | $ | 31,226 | $ | 19,120 | $ | 16,862 | $ | 14,876 | $ | 10,420 | ||||||||||
Cash dividends declared per share | $ | 0.84 | $ | 0.84 | $ | 0.84 | $ | 0.70 | $ | 0.50 | ||||||||||
| (1) | "Net Debt" represents gross debt less cash, short-term investments and fixed income investments, held to maturity. Management believes that Net Debt provides useful information regarding the level of Schlumberger indebtedness by reflecting cash and investments that could be used to repay debt. |
16
Part II, Item 7
| Item 7. | Management's Discussion and Analysis of Financial Condition and Results of Operations. |
The following discussion and analysis contains forward-looking statements, including, without limitation, statements relating to our plans, strategies, objectives, expectations, intentions and resources. Such forward-looking statements should be read in conjunction with our disclosures under "Item 1A. Risk Factors" of this Report.
Executive Overview
After two consecutive years of falling oil demand in 2008 and 2009 induced by the global economic recession, a strong recovery occurred in 2010. Consumption averaged 87.7 million barrels per day, including an all-time peak of over 89 million barrels per day in December, and made the year-on-year increase the second largest in three decades. Oil prices remained in the range of $65-$85 per barrel for much of 2010, but recorded a spike above $90 at the end of the year. The major demand forecasts released during 2010 have continued to increase as a result of the improving economic outlook – particularly in the developing economies. On the supply side, the adherence to production quota by the OPEC countries helped keep the market balanced, although such adherence diminished slightly as the year progressed. Strength in non-OPEC production, improvement in new project developments following the investment cuts in 2009, and lower production costs helped provide additional assurance to the markets.
Natural gas markets behaved differently. Decreasing gas demand during the recession, increasing unconventional gas production in North America, and the commissioning of a number of new large liquefied natural gas export facilities around the world led to an over-supplied market with consequent pressure on spot prices. Within the United States – the world's largest natural gas market – natural gas storage levels have remained significantly above the five-year range since March 2010 despite lower volumes of Canadian gas imports and some power generation fuel switching from coal to gas. With natural gas price forecasts from the Energy Information Agency for 2011 slipping by nearly a third compared to initial projections made at the beginning of the year, an increasing portion of the drilling and completion activity in shale reservoirs has shifted to liquid and condensate-rich plays in North America.
Within this market, Schlumberger Oilfield Services full-year revenue in 2010 of $22.08 billion grew 8% versus 2009, driven by recovery in the North America natural gas market through increasing demand and stronger pricing for pressure pumping services. The North America Area also benefited from greater activity in liquids-rich plays in a number of basins. Offshore, the tragic Macondo accident in the US Gulf of Mexico led to a shutdown in deepwater operations that severely impacted US offshore activity and led to slowdowns in other parts of the world, although these were being absorbed as the fourth quarter developed. The Middle East and Asia Area revenue climbed 7% from a number of factors including increasing wireline logging and expanded IPM work. Latin America revenue grew by 2%, with rapid growth in Brazil overcoming weaker activity in Mexico as poor weather, increasing security concerns and reduced client budgets impacted operations. Europe/CIS/Africa revenue decreased 4% versus 2009. Among the Technologies, growth was primarily seen in Well Services activities, both in volume and in price although the acquisition of Geoservices also contributed to the increase.
In addition to growing activity, results were underpinned through continuing market penetration of new-technology services such as Scope* advanced logging-while-drilling measurements, Scanner* wireline technologies, and ACTive* coiled-tubing services. Scanner services were boosted by the commercial introduction of the latest family member, the Dielectric Scanner* tool, which was unveiled during the year. As a unique industry service capable of measuring saturation in a variety of reservoir applications, the service completed a two-year pilot project in Saudi Arabia targeted at reservoir monitoring, where 35 logs were recorded in various fields, both on land and offshore, to assess water flooding sweep efficiency as an aid to field development planning.
In reservoir production, ACTive real-time coiled tubing services saw growth, particularly with ACTive conveyance of Wireline Flow Scanner* production logging technology, and with fiber-optic continuous measurements of temperature and pressure along the well bore. Growing deployment of integrated technologies such as these confirms exciting growth possibilities across the Schlumberger technology portfolio particularly in horizontal and extended-reach wells.
It was however drilling services that displayed early evidence of the opportunities provided by the acquisitions of Geoservices and Smith International that were announced during the first quarter. These successes included the completion of a remote three-well exploration project offshore Greenland that used Schlumberger technologies combined with Smith and M-I SWACO products and services as well as Geoservices mud logging. In Brazil, a similar combination of services helped one well record substantial increases in rates of penetration, while meeting all
17
Part II, Item 7
directional drilling goals. In this particular case the integrated nature of the bottomhole assembly demonstrated how technology optimization can impact performance in the high-cost deepwater drilling environment. A third such operation offshore Indonesia further displayed the value of integrated bottomhole assemblies.
WesternGeco revenue of $1.99 billion in 2010 was 6% lower than 2009 primarily as a result of lower Marine activity and weaker pricing. While Land activity was also weaker, strong Multiclient sales, particularly in the fourth quarter, were able to offset some of these effects. New seismic technology scored some significant successes with penetration of marine single-vessel, full-azimuth coil shooting surveys into a number of the major offshore basins around the world. Coil shooting, unique to Schlumberger, brings better illumination of complex pre-salt, sub-salt and sub-basalt formations in a variety of environments.
The integration of Geoservices and Smith International proceeded smoothly during the year. The complementary nature of many of the product and service lines concerned helped the process while a network of integration teams and Area coordinators rapidly identified revenue and cost-synergy opportunities that contributed to results in 2010 and that augur well for 2011. Total Schlumberger 2010 results reflect four months activity from the acquired Smith businesses, which contributed revenue of $3.30 billion.
In a related move, Schlumberger signed a letter of intent with Eurasia to swap certain assets in Russia to build critical mass in drilling services. Under the terms of this agreement, Eurasia will acquire a number of Schlumberger-owned drilling rigs, while Schlumberger will acquire a range of Eurasia service assets including directional drilling, measurement-while-drilling, well cementing and drilling fluids. Further, both companies agreed to enter a strategic alliance upon completion of the transaction whereby Schlumberger will become the preferred supplier of drilling services to Eurasia Drilling for up to 200 rigs for a 5-year period. This agreement not only increases the market for our services across the rig fleet of the largest Russian drilling company, it also encourages the development of fit-for-purpose bottom-hole assembly technology development as drilling intensity increases in Russia in order to sustain hydrocarbon production.
Two years ago we began a program called "Excellence in Execution". This was designed to create a step change in our service quality and efficiency and, in deepwater, was aimed at enabling clients to reduce the risk and cost of their deepwater operations. The program, in addition to equipment and procedural improvements, provides for competency certification of all personnel involved in deepwater operations. We have been encouraged by the initial results of this multiyear initiative, as well as by our customers' acceptance of it. While additional control and oversight will undoubtedly add cost, this will be offset in the long run by improvements in operating procedures and technology. We therefore welcome current efforts to better understand and control the risks associated with deepwater operations.
For 2011, economic projections for world real GDP growth are converging towards a median estimate of 4.2%, slightly lower than the 2010 level, and still with a significant level of uncertainty. A large gap exists between GDP growth rates of Organization for Economic Cooperation and Development (OECD) and non-OECD countries – particularly in China and in other developing Asian economies. However there is remarkable agreement on various oil demand forecasts for 2011, which all lie within 1.4 million barrels per day of each other.
As we look forward to 2011 it is therefore important to remember that the primary driver of our business has always been, and will remain, the demand for oil and gas. Oil prices have moved into a range that will encourage increased investment, particularly in exploration, which remains the swing factor in operators' budgets. While we do not anticipate any substantial recovery in deepwater US Gulf of Mexico, we do expect a marked increase in deepwater activity in the rest of the world. These factors, coupled with increases in development activity and production enhancement in many other areas, promise stronger growth rates as the year unfolds.
For natural gas, activity in the United States is likely to remain strong – at least through the first half of the year – due to the commitments necessary to retain leases, the backlog of wells to be completed, and the contribution of natural gas liquids to overall project economics. Increased service capacity, however, will negatively affect pricing at some stage during the year.
Overseas, the governing factor on gas activity, particularly in the Middle East, will be the ability of many nations to use gas as a substitute for oil to meet increased local energy demand, thus freeing up more liquids for export. Elsewhere the long lead time necessary to execute large gas projects for LNG exports will ensure that a certain level of activity is maintained.
Unconventional gas resources will continue to attract considerable interest outside North America. The leading activity will continue to be in conventional gas in tight, or low permeability, reservoirs, and in coal-bed methane
18
Part II, Item 7
developments. There will be exploration activity around the potential that shale gas offers in many other parts of the world.
Increased activity coupled with the greater technology needs of higher exploration, deepwater, and tight gas activity – particularly outside North America – will make 2011 a stronger year for Schlumberger. The importance of risk reduction and the minimization of drilling cost make the acquisitions of Geoservices and Smith major contributors to our future growth in this scenario.
The following discussion and analysis of results of operations should be read in conjunction with the Consolidated Financial Statements .
Fourth Quarter 2010 Results
| (Stated in millions) | ||||||||||||||||
| Fourth Quarter 2010 | Third Quarter 2010 | |||||||||||||||
| Income | Income | |||||||||||||||
| before | before | |||||||||||||||
| Revenue | taxes | Revenue | taxes | |||||||||||||
OILFIELD SERVICES | ||||||||||||||||
North America | $ | 1,604 | $ | 385 | $ | 1,259 | $ | 219 | ||||||||
Latin America | 1,050 | 174 | 1,071 | 159 | ||||||||||||
Europe/CIS/Africa | 1,783 | 339 | 1,734 | 317 | ||||||||||||
Middle East & Asia | 1,491 | 434 | 1,402 | 425 | ||||||||||||
Elims/Other | 81 | (1 | ) | 71 | (18 | ) | ||||||||||
| 6,009 | 1,331 | 5,537 | 1,102 | |||||||||||||
WESTERNGECO | 560 | 113 | 478 | 40 | ||||||||||||
M-I SWACO (1) | 1,185 | 149 | 383 | 48 | ||||||||||||
SMITH OILFIELD (1) | 729 | 106 | 228 | 27 | ||||||||||||
DISTRIBUTION (1) | 576 | 21 | 199 | 9 | ||||||||||||
| 9,059 | 1,720 | 6,825 | 1,226 | |||||||||||||
Corporate (2) | 8 | (156 | ) | 20 | (81 | ) | ||||||||||
Interest income (3) | 9 | 10 | ||||||||||||||
Interest expense (4) | (58 | ) | (51 | ) | ||||||||||||
Charges & credits (5) | (180 | ) | 836 | |||||||||||||
| $ | 9,067 | $ | 1,335 | $ | 6,845 | $ | 1,940 | |||||||||
| (1) | The third quarter of 2010 includes one month of post-merger activity following the Smith transaction on August 27, 2010. See Note 4 to the Consolidated Financial Statements for further details. | |
| (2) | Comprised principally of corporate expenses not allocated to the segments, interest on postretirement medical benefits, stock-based compensation costs, amortization expense associated with intangible assets recorded as a result of the merger with Smith and certain other nonoperating items. | |
| (3) | Excludes interest income included in the segments' income (fourth quarter 2010 – $1 million; third quarter 2010 – $2 million). | |
| (4) | Excludes interest expense included in the segments' income (fourth quarter 2010 - $2 million; third quarter 2010 – $- million). | |
| (5) | Charges and credits are described in detail in Note 3 to the Consolidated Financial Statements . |
Oilfield Services
Fourth-quarter revenue of $6.01 billion increased 9% sequentially. Sequentially, North America Area revenue increased 27% on strong activity on land in the US and Canada as well as from the early payout of an IPM gain share project. In the Middle East & Asia Area, revenue grew on year-end equipment, Schlumberger Information Solutions (SIS) software sales, and on higher activity in the Iraq, East Asia and Indonesia GeoMarkets. Europe/CIS/Africa Area revenue increased from stronger activity in the North Sea, West & South Africa, Caspian and Continental Europe GeoMarkets, as well as from year-end SIS software sales. These increases were partially offset by a decrease in Latin America Area revenue primarily due to continuing weakness in the Mexico/Central America GeoMarket.
All Technologies recorded sequential growth, most notably Well Services due to continuing strong activity in North America, and SIS and Artificial Lift from year-end sales. IPM revenue also increased as a result of the early payout on the IPM project in North America.
19
Part II, Item 7
Fourth-quarter pretax operating income of $1.33 billion increased 21% sequentially. Pretax operating margin increased 224 bps sequentially to 22.1% primarily driven by the robust performance in North America and strong contributions from the year-end equipment and software sales.
North America
Fourth-quarter revenue of $1.60 billion increased 27% sequentially and pretax operating income of $385 million was 75% higher.
Sequentially, revenue in US land grew 24% versus a 4% increase in rig count due to a combination of additional service capacity, improved utilization, and high service intensity that mostly benefited Well Services technologies. Canada revenue grew from higher land activity for Well Services, although this was partially offset by a slowdown in offshore activity that impacted Drilling & Measurements services. The US Gulf of Mexico revenue increased through a modest improvement in shelf activity and from Completion Systems equipment sales. An $87 million early payout relating to services on an IPM gain share project – triggered by the customer's sale of the field – also contributed to Area growth.
Pretax operating margin for the Area increased 658 bps sequentially to 24.0%. This increase was largely driven by US land through stronger activity and increased efficiency for Well Services operations. The IPM gain share payout contributed approximately $55 million to Area pretax operating income.
Latin America
Fourth-quarter revenue of $1.05 billion decreased 2% versus the prior quarter. Pretax operating income of $174 million increased 9% compared to the third quarter of 2010.
Sequentially, the Brazil GeoMarket achieved record high revenue on strong deepwater activity, while revenue in the Peru/Colombia/Ecuador GeoMarket grew from higher gain share on IPM activity in Colombia and from Testing Services equipment sales in Peru. These increases, however, were insufficient to offset a significant revenue drop in the Mexico/Central America GeoMarket where continuing security issues and client budgetary constraints further reduced IPM activity levels.
Pretax operating margin improved 171 bps sequentially to 16.6% primarily due to a more favorable revenue mix in the Peru/Colombia/Ecuador and Venezuela/Trinidad & Tobago GeoMarkets.
Europe/CIS/Africa
Fourth-quarter revenue of $1.78 billion increased 3% compared to the third quarter of 2010. Pretax operating income of $339 million increased 7% sequentially.
Sequentially, revenue in the North Sea GeoMarket increased primarily from higher activity in Norway and from year-end SIS software sales. In the West & South Africa GeoMarket, revenue grew on stronger activity that benefited Wireline and Drilling & Measurements services and on higher Completion Systems equipment sales. Caspian GeoMarket revenue increased from the startup of several projects that resulted in higher demand for Drilling & Measurements, Testing Services and Wireline technologies as well as from a Well Services equipment sale. Continental Europe revenue grew on higher activity for Well Services and Testing Services technologies and on year-end SIS software sales. These increases, however, were partially offset by a decrease in Nigeria & Gulf of Guinea GeoMarket revenue from lower Completion Systems equipment sales and from delays that reduced demand for Wireline services. Russia revenue was also lower with the onset of the winter slowdown.
Pretax operating margin improved sequentially by 74 bps to 19.0% primarily from a stronger mix of high-margin Wireline and Drilling & Measurements services in the North Sea and West & South Africa GeoMarkets as well as from year-end SIS software sales across much of the Area. These increases were partially offset by the impact of the activity weakness in the Nigeria & Gulf of Guinea GeoMarket.
Middle East & Asia
Fourth-quarter revenue of $1.49 billion increased 6% sequentially. Pretax operating income of $434 million increased 2% sequentially.
20
Part II, Item 7
Sequentially, revenue growth resulted from the continued ramp up of IPM activity in Iraq and the start of new offshore projects in East Asia. Year-end sales of Artificial Lift and Completion Systems equipment, Well Services products, and SIS software also contributed to Area growth. These increases were partially offset by lower revenue in the Australia/Papua New Guinea GeoMarket resulting from offshore project completions and delays in land activity due to severe flooding, and by lower activity in the Qatar GeoMarket that reduced demand for Wireline and Drilling & Measurements services.
Pretax operating margin decreased 119 bps sequentially to 29.1% as the positive contribution from the year-end sales and a more favorable revenue mix in the Arabian GeoMarket were insufficient to offset the impact of the lower activity in the Australia/Papua New Guinea GeoMarket and startup costs in Iraq.
WesternGeco
Fourth-quarter revenue of $560 million increased 17% sequentially. Pretax operating income of $113 million increased 183% sequentially.
Sequentially, revenue growth was driven by Multiclient, which recorded strong year-end sales from the US Gulf of Mexico. This increase was partially offset by a decrease in Marine revenue due to the seasonal slow-down in activity. Land and Data Processing revenues were flat sequentially.
Pretax operating margin increased 11.8 percentage points sequentially to 20.2% as the result of the high Multiclient sales partially offset by the impact of the lower Marine activity.
Full-Year 2010 Results
| (Stated in millions) | ||||||||||||||||
| 2010 | 2009 | |||||||||||||||
| Income | Income | |||||||||||||||
| before | before | |||||||||||||||
| Revenue | taxes | Revenue | taxes | |||||||||||||
OILFIELD SERVICES | ||||||||||||||||
North America | $ | 5,010 | $ | 802 | $ | 3,707 | $ | 216 | ||||||||
Latin America | 4,321 | 723 | 4,225 | 753 | ||||||||||||
Europe/CIS/Africa | 6,882 | 1,269 | 7,150 | 1,707 | ||||||||||||
Middle East & Asia | 5,586 | 1,696 | 5,234 | 1,693 | ||||||||||||
Elims/Other | 280 | (15 | ) | 202 | (43 | ) | ||||||||||
| 22,079 | 4,475 | 20,518 | 4,326 | |||||||||||||
WESTERNGECO | 1,987 | 267 | 2,122 | 326 | ||||||||||||
M-I SWACO (1) | 1,568 | 197 | ||||||||||||||
SMITH OILFIELD (1) | 957 | 132 | ||||||||||||||
DISTRIBUTION (1) | 774 | 29 | ||||||||||||||
Corporate (2) | 82 | (405 | ) | 62 | (344 | ) | ||||||||||
Interest income (3) | 43 | 52 | ||||||||||||||
Interest expense (4) | (202 | ) | (188 | ) | ||||||||||||
Charges & credits (5) | 620 | (238 | ) | |||||||||||||
| $ | 27,447 | $ | 5,156 | $ | 22,702 | $ | 3,934 | |||||||||
| (1) | 2010 includes four months of post-merger activity following the transaction with Smith on August 27, 2010. See Note 4 to the Consolidated Financial Statements for further details. | |
| (2) | Comprised principally of corporate expenses not allocated to the segments, interest on postretirement medical benefits, stock-based compensation costs, amortization expense associated with intangible assets recorded as a result of the merger with Smith and certain other nonoperating items. | |
| (3) | Excludes interest income included in the segments' income (2010 – $7 million; 2009 – $10 million). | |
| (4) | Excludes interest expense included in the segments' income (2010 – $5 million; 2009 – $33 million). | |
| (5) | Charges and credits are described in detail in Note 3 to the Consolidated Financial Statements . |
Oilfield Services
Full-year 2010 revenue of $22.08 billion was 8% higher than 2009. Revenue growth was strongest in the North America Area mostly as a result of higher activity and pricing for Well Services technologies in US Land but partially offset by
21
Part II, Item 7
reduced activity in the US Gulf of Mexico. Latin America revenue increased on strong activity in the Brazil and Peru/Ecuador/Colombia GeoMarkets partially offset by reduced IPM activity in Mexico/Central America due to client budgetary constraints. Middle East & Asia Area revenue grew from higher drilling activity in the Australia/Papua New Guinea, China/Japan/Korea and East Asia GeoMarkets as well as from increased IPM activity and strong demand for Well Services technologies in the Middle Eastern GeoMarkets. The addition of Geoservices also contributed to the increased revenue. These increases were partially offset by a decrease in Europe/CIS/Africa revenue as reduced activity in the North Africa, Libya, Caspian and Continental GeoMarkets and generally lower pricing across the Area offset higher activity in Russia.
Year-on-year, pretax operating margin declined 82 bps to 20.3% as a significant improvement in North America Area performance was insufficient to offset the reduced activity and weaker pricing in the Europe/CIS/Africa Area and lower IPM activity in Latin America.
North America
Revenue of $5.01 billion was 35% higher than last year primarily due to strong activity in unconventional oil and gas reservoirs, improved pricing in US Land for Well Services technologies and improved activity levels in oil basins in Canada. These increases were partially offset by a decrease in the US Gulf of Mexico revenue as a six-month moratorium on drilling and lingering uncertainty about rules for operating resulted in the stoppage of deepwater drilling activity.
Year-on-year, pretax operating margin increased 10 percentage points to 16.0% mostly due to the stronger activity and improved pricing in the US land, partially offset by the impact of the activity slow-down in the US Gulf of Mexico.
Latin America
Revenue of $4.32 billion was 2% higher than the previous year. Growth was strongest in the Brazil GeoMarket where higher offshore activity increased demand for Wireline and Drilling & Measurements services technologies. Revenue also increased significantly in the Peru/Ecuador/Colombia GeoMarket due to strong IPM activity and higher Artificial Lift systems sales. The addition of Geoservices also contributed to the growth. These increases were partially offset by a decrease in the Mexico/Central America GeoMarket revenue as client budgetary constraints reduced IPM activity.
Year-on-year, pretax operating margin decreased 110 bps to 16.7% primarily due to the reduced activity levels in Mexico/Central America partially offset by the impact of lower costs in Venezuela/Trinidad & Tobago.
Europe/CIS/Africa
Revenue of $6.88 billion was 4% lower year-on-year. This decrease was largely attributable to lower pricing across much of the Area and reduced activity in the North Africa, Libya, Caspian and Continental Europe GeoMarkets. These decreases were partially offset by increases in Russia due to higher IPM activity. The addition of Geoservices also contributed to Area revenue.
Year-on-year, pretax operating margin decreased 543 bps to 18.4% primarily due to the lower overall activity levels and reduced pricing.
Middle East & Asia
Revenue of $5.59 billion was 7% higher than the previous year primarily due to strong drilling activity in Asia, particularly in the Australia/Papua New Guinea, China/Japan/Korea and East Asia GeoMarkets, and to increased IPM activity and strong demand for Well Services technologies in the Middle Eastern GeoMarkets. The addition of Geoservices also increased Area revenue.
Year-on-year, pretax operating margin decreased 199 bps to 30.4% primarily due the impact of lower pricing across the Area.
WesternGeco
Full-year 2010 revenue of $1.99 billion was 6% lower than the prior year primarily due to reduced activity and pricing in Marine. This decrease was partially offset by an increase in Multiclient revenue as the result of increased acquisition and sales of wide-azimuth surveys in the US Gulf of Mexico.
22
Part II, Item 7
Year-on-year, pretax operating margin decreased 194 bps to 13.4% as the result of the lower pricing and activity in Marine and reduced profitability in Land and Data Processing. These decreases were partially offset by an improvement in Multiclient margins on the increased activity.
Full-Year 2009 Results
| (Stated in millions) | ||||||||||||||||
| 2009 | 2008 | |||||||||||||||
| Income | Income | |||||||||||||||
| before | before | |||||||||||||||
| Revenue | taxes | Revenue | taxes | |||||||||||||
OILFIELD SERVICES | ||||||||||||||||
North America | $ | 3,707 | $ | 216 | $ | 5,914 | $ | 1,371 | ||||||||
Latin America | 4,225 | 753 | 4,230 | 858 | ||||||||||||
Europe/CIS/Africa | 7,150 | 1,707 | 8,180 | 2,244 | ||||||||||||
Middle East & Asia | 5,234 | 1,693 | 5,724 | 2,005 | ||||||||||||
Elims/Other | 202 | (43 | ) | 234 | 27 | |||||||||||
| 20,518 | 4,326 | 24,282 | 6,505 | |||||||||||||
WESTERNGECO | 2,122 | 326 | 2,838 | 836 | ||||||||||||
Corporate (1) | 62 | (344 | ) | 43 | (268 | ) | ||||||||||
Interest income (2) | 52 | 112 | ||||||||||||||
Interest expense (3) | (188 | ) | (217 | ) | ||||||||||||
Charges & credits (4) | (238 | ) | (116 | ) | ||||||||||||
| $ | 22,702 | $ | 3,934 | $ | 27,163 | $ | 6,852 | |||||||||
| (1) | Comprised principally of corporate expenses not allocated to the segments, interest on postretirement medical benefits, stock-based compensation costs and certain other nonoperating items. | |
| (2) | Excludes interest income included in the segments' income (2009 – $10 million; 2008 – $7 million). | |
| (3) | Excludes interest expense included in the segments' income (2009 – $33 million; 2008 – $30 million). | |
| (4) | Charges and credits are described in detail in Note 3 to the Consolidated Financial Statements. |
Oilfield Services
Full-year 2009 revenue of $20.52 billion declined 16% versus 2008. Lower natural gas prices and unfavorable market fundamentals resulted in a 37% decline in North America revenue, primarily in the US Land and Canada GeoMarkets. Europe/CIS/Africa revenue decreased 13% mainly due to the weakening of local currencies against the US dollar and reduced activity in the Russia, North Sea, West & South Africa and Caspian GeoMarkets as well as in Framo, which was partially offset by increased activity in the North Africa GeoMarket. Middle East & Asia revenue also fell by 9% primarily due to decreases in the East Asia, East Mediterranean, Arabian and Australia/Papua New Guinea GeoMarkets. Latin America revenue was only marginally lower than last year as the impact of the weakening of local currencies against the US dollar and much lower activity in Venezuela/Trinidad & Tobago and Peru/Colombia/Ecuador were nearly offset by stronger activity in Mexico/Central America and Brazil. Weakening of local currencies against the US dollar reduced 2009 revenue by approximately 4%. Across the Areas, all of the Technologies recorded revenue declines except Testing Services. IPM recorded revenue growth compared to the same period last year.
Full-year 2009 pretax operating margin decreased 5.7 percentage points to 21.1%, on the significant drop in activity and pricing pressure experienced across all the Areas, but most notably in North America.
North America
Revenue of $3.71 billion was 37% lower than last year with reductions across the entire Area. The decreases were highest in US Land and Canada, where lower natural gas prices resulted in a steep drop in activity and consequent pressure on pricing. Canada revenue was also lower as the result of the weakening of the Canadian dollar against the US dollar. Revenue in the US Gulf of Mexico GeoMarket was severely impacted by weaker shelf drilling activity and strong pricing pressure.
Pretax operating margin fell 17.3 percentage points to 5.8% due to the significant decline in activity levels across the Area, combined with the severe pricing erosion.
23
Part II, Item 7
Latin America
Revenue of $4.22 billion was marginally lower compared to 2008. The weakening of local currencies against the US dollar reduced 2009 revenue by approximately 3%. In addition, Venezuela/Trinidad & Tobago revenue fell due to significantly reduced customer spending while Peru/Colombia/Ecuador revenue was lower due to reduced gain share in IPM projects. These decreases were mostly offset by higher IPM activity in Mexico/Central America and increased offshore activity in Brazil.
Pretax operating margin decreased 245 bps to 17.8% primarily as the result of the sharp activity decline in Venezuela/Trinidad & Tobago and the lower gain share in Peru/Colombia/Ecuador.
Europe/CIS/Africa
Revenue of $7.15 billion was 13% lower than last year largely due to the weakening of local currencies against the US dollar, which reduced revenue by approximately 7%. In addition, revenue was negatively impacted by reduced customer spending that resulted in significantly lower activity and pricing erosion in Russia and the North Sea. Revenue in the West & South Africa and Caspian GeoMarkets and in Framo was also negatively impacted by lower activity levels. These decreases were partially offset by a revenue increase in the North Africa GeoMarket due to strong Testing Services product sales.
Pretax operating margins declined 357 bps to 23.9% on a combination of the overall lower activity and heavy pricing pressure across the Area.
Middle East & Asia
Revenue of $5.23 billion was 9% below 2008. Revenue was down across much of the Middle East, especially in the East Mediterranean and Arabian GeoMarkets, due to reduced demand for Drilling & Measurements, Wireline and Testing Services technologies. Revenue in Asia also fell, primarily due to a decrease in offshore exploration activity, which was most significant in the East Asia and Australia/Papua New Guinea GeoMarkets, resulting in lower demand for Testing Services and Wireline technologies as well as Completion Systems products.
Pretax operating margin decreased 268 bps to 32.4% primarily as a result of the lower overall activity and a less favorable revenue mix across the Area.
WesternGeco
Full-year revenue of $2.12 billion was 25% lower than 2008. Revenue decreased across all product lines, with the largest declines experienced in Marine and Multiclient. Marine revenue declined due to lower activity combined with reduced pricing as the result of weak market conditions. Multiclient revenue decreased primarily in North America, as customers continued to reduce discretionary spending. Land revenue fell on lower crew utilization, while Data Processing revenue was down reflecting lower activity primarily in Europe/Africa and in North America.
Pretax margin decreased 14.1 percentage points to 15.4% primarily due to the weaker Marine activity and pricing as well as lower Multiclient sales.
Interest and Other Income
Interest and other income consisted of the following:
| (Stated in millions) | ||||||||||||
| 2010 | 2009 | 2008 | ||||||||||
Interest income | $ | 50 | $ | 61 | $ | 119 | ||||||
Equity in net earnings of affiliated companies: | ||||||||||||
M-I SWACO | 78 | 131 | 210 | |||||||||
Others | 86 | 78 | 83 | |||||||||
Other | – | 3 | – | |||||||||
| $ | 214 | $ | 273 | $ | 412 | |||||||
24
Part II, Item 7
Interest Income
The average return on investments decreased to 1.2% in 2010 from 1.4% in 2009 and the weighted average investment balance of $4.0 billion in 2010 decreased $0.5 billion compared to 2009.
The average return on investments decreased to 1.4% in 2009 from 3.5% in 2008 and the weighted average investment balance of $4.5 billion in 2009 increased $1.1 billion compared to 2008.
Equity in Net Earnings of Affiliated Companies
Equity income from the M-I SWACO joint venture in 2010 represents eight months of equity income through the closing of the Smith transaction. The decrease in equity income relating to this joint venture from 2008 to 2009 was attributable to a significant decline in M-I SWACO activity levels, primarily in its United States and Europe/Africa regions, as well as increased pricing pressures.
Interest Expense
Interest expense of $207 million in 2010 decreased by $14 million compared to 2009 due to a decline in the weighted average borrowing rates, from 3.9% to 3.2%. The weighted average debt balance of $6.4 billion in 2010 increased $0.8 billion compared to 2009.
Interest expense of $221 million in 2009 decreased by $26 million compared to 2008 primarily due to a decline in the weighted average borrowing rates, from 4.5% to 3.9%.
Other
Gross margin was 21.7%, 24.0% and 30.2% in 2010, 2009 and 2008, respectively.
The decline in gross margin in 2010 compared to 2009 was primarily attributable to the inclusion of the acquired Smith businesses as well as pricing pressure for Oilfield Services, particularly in the Europe/CIS/Africa Area, partially offset by improved activity levels and pricing in the North America Area.
The decline in gross margin in 2009 compared to 2008 was primarily attributable to lower activity coupled with the impact of a significant reduction in pricing across all of Oilfield Services, most notably in North America and Europe/CIS/Africa. Weaker Marine activity and pricing and reduced Multiclient sales in WesternGeco also contributed to the margin decline.
Research & engineering and General & administrative expenses, as a percentage of Revenue , were as follows:
| 2010 | 2009 | 2008 | ||||||||||
Research & engineering | 3.3 | % | 3.5 | % | 3.0 | % | ||||||
General & administrative | 2.4 | % | 2.4 | % | 2.1 | % | ||||||
Research & engineering expenditures were as follows:
| (Stated in millions) | ||||||||||||
| 2010 | 2009 | 2008 | ||||||||||
Oilfield Services | $ | 748 | $ | 679 | $ | 686 | ||||||
WesternGeco | 103 | 108 | 118 | |||||||||
Acquired Smith businesses | 58 | – | – | |||||||||
Other | 10 | 15 | 15 | |||||||||
| $ | 919 | $ | 802 | $ | 819 | |||||||
Income Taxes
The Schlumberger effective tax rate was 17.3% in 2010, 19.6% in 2009, and 20.9% in 2008.
The Schlumberger effective tax rate is sensitive to the geographic mix of earnings. When the percentage of pretax earnings generated outside of North America increases, the Schlumberger effective tax rate will generally decrease. Conversely, when the percentage of pretax earnings generated outside of North America decreases, the Schlumberger effective tax rate will generally increase.
25
Part II, Item 7
The effective tax rate for 2010 was significantly impacted by the charges and credits described in Note 3 to the Consolidated Financial Statements . The effective tax rate for 2009 was also impacted by charges, but to a much lesser extent. Excluding charges and credits, the effective tax rate in 2010 was approximately 20.6% compared to 19.2% in 2009. This increase is largely attributable to the geographic mix of earnings as well as the inclusion of four months results from the merger with Smith. Smith, which as a US company has a US tax rate applicable to its worldwide operations and as such, will serve to increase Schlumberger's overall effective tax rate.
The decrease in the Schlumberger effective tax rate in 2009 as compared to 2008 was primarily attributable to the geographic mix of earnings. Schlumberger generated a lower proportion of its pretax earnings in North America in 2009 as compared to 2008. In addition, outside North America, various GeoMarkets with lower tax rates contributed a greater percentage to pretax earnings in 2009 as compared to 2008.
Charges and Credits
Schlumberger recorded significant charges and credits in continuing operations during 2010, 2009 and 2008. These charges and credits, which are summarized below, are more fully described in Note 3 to the Consolidated Financial Statements .
The following is a summary of the 2010 charges and credits:
| (Stated in millions) | ||||||||||||||||||
| Non- | ||||||||||||||||||
| controlling | ||||||||||||||||||
| Pretax | Tax | Interest | Net | Income Statement Classification | ||||||||||||||
Restructuring and Merger-related Charges: | ||||||||||||||||||
Severance and other | $ | 90 | $ | 13 | $ | – | $ | 77 | Restructuring & other | |||||||||
Impairment relating to WesternGeco's first | ||||||||||||||||||
generation Q-Land acquisition system | 78 | 7 | – | 71 | Restructuring & other | |||||||||||||
Other WesternGeco-related charges | 63 | – | – | 63 | Restructuring & other | |||||||||||||
Professional fees and other | 107 | 1 | – | 106 | Merger & integration | |||||||||||||
Merger-related employee benefits | 58 | 10 | – | 48 | Merger & integration | |||||||||||||
Inventory fair value adjustments | 153 | 56 | – | 97 | Cost of revenue | |||||||||||||
Mexico restructuring | 40 | 4 | – | 36 | Restructuring & other | |||||||||||||
Repurchase of bonds | 60 | 23 | 37 | Restructuring & other | ||||||||||||||
Total restructuring and merger-related charges | 649 | 114 | – | 535 | ||||||||||||||
Gain on investment in M-I SWACO | (1,270 | ) | (32) | – | (1,238 | ) | Gain on Investment in M-I SWACO | |||||||||||
Impact of elimination of tax deduction related to Medicare Part D subsidy | – | (40) | – | 40 | Taxes on income | |||||||||||||
| $ | (621 | ) | $ | 42 | $ | – | $ | (663 | ) | |||||||||
The following is a summary of the 2009 charges:
| (Stated in millions) | ||||||||||||||||||
| Non- | ||||||||||||||||||
| controlling | ||||||||||||||||||
| Pretax | Tax | Interest | Net | Income Statement Classification | ||||||||||||||
Workforce reductions | $ | 102 | $ | 17 | $ | – | $ | 85 | Restructuring & other | |||||||||
Postretirement benefits curtailment | 136 | 14 | – | 122 | Restructuring & other | |||||||||||||
| $ | 238 | $ | 31 | $ | – | $ | 207 | |||||||||||
The following is a summary of the 2008 charges:
| (Stated in millions) | ||||||||||||||||||
| Non- | ||||||||||||||||||
| controlling | ||||||||||||||||||
| Pretax | Tax | Interest | Net | Income Statement Classification | ||||||||||||||
Workforce reductions | $ | 74 | $ | 9 | $ | – | $ | 65 | Restructuring & other | |||||||||
Provision for doubtful accounts | 32 | 8 | 6 | 18 | Restructuring & other | |||||||||||||
Other | 10 | – | – | 10 | Interest and other income, net | |||||||||||||
| $ | 116 | $ | 17 | $ | 6 | $ | 93 | |||||||||||
26
Part II, Item 7
Cash Flow
Net Debt represents gross debt less cash, short-term investments and fixed income investments, held to maturity. Management believes that Net Debt provides useful information regarding the level of Schlumberger's indebtedness by reflecting cash and investments that could be used to repay debt.
Details of Net Debt follow:
| (Stated in millions) | ||||||||||||
| 2010 | 2009 | 2008 | ||||||||||
Net Debt, beginning of year | $ | (126 | ) | $ | (1,129 | ) | $ | (1,857 | ) | |||
Net income | 4,266 | 3,142 | 5,460 | |||||||||
Depreciation and amortization (1) | 2,759 | 2,476 | 2,269 | |||||||||
Gain on M-I SWACO investment | (1,270 | ) | – | – | ||||||||
Pension and other postretirement benefits expense | 299 | 306 | 127 | |||||||||
Pension and other postretirement benefits curtailment charge | – | 136 | – | |||||||||
Pension and other postretirement benefits funding | (868 | ) | (1,149 | ) | (318 | ) | ||||||
Excess of equity income over dividends received | (85 | ) | (103 | ) | (235 | ) | ||||||
Stock -based compensation expense | 198 | 186 | 172 | |||||||||
Other non-cash items | 327 | 162 | 128 | |||||||||
Decrease (increase) in working capital | 268 | (204 | ) | (592 | ) | |||||||
Capital expenditures | (2,914 | ) | (2,395 | ) | (3,723 | ) | ||||||
Multiclient seismic data capitalized | (326 | ) | (230 | ) | (345 | ) | ||||||
Dividends paid | (1,040 | ) | (1,006 | ) | (964 | ) | ||||||
Stock repurchase program | (1,717 | ) | (500 | ) | (1,819 | ) | ||||||
Proceeds from employee stock plans | 401 | 206 | 351 | |||||||||
Net debt assumed in merger with Smith | (1,829 | ) | – | – | ||||||||
Geoservices acquisition, net of debt acquired | (1,033 | ) | – | – | ||||||||
Other business acquisitions and minority interest investments | (212 | ) | (514 | ) | (345 | ) | ||||||
Conversion of debentures | 320 | – | 448 | |||||||||
Translation effect on net debt | 30 | (59 | ) | 166 | ||||||||
Other | (86 | ) | 549 | (52 | ) | |||||||
Net Debt, end of year | $ | (2,638 | ) | $ | (126 | ) | $ | (1,129 | ) | |||
| (1) | Includes multiclient seismic data costs. |
| (Stated in millions) | ||||||||||||
| Dec. 31 | Dec. 31 | Dec. 31 | ||||||||||
| Components of Net Debt | 2010 | 2009 | 2008 | |||||||||
Cash | $ | 1,764 | $ | 617 | $ | 609 | ||||||
Short-term investments | 3,226 | 3,999 | 3,083 | |||||||||
Fixed income investments, held to maturity | 484 | 738 | 470 | |||||||||
Short-term borrowings and current | ||||||||||||
portion of long-term debt | (2,595 | ) | (804 | ) | (1,598 | ) | ||||||
Convertible debentures | – | (321 | ) | (321 | ) | |||||||
Long-term debt | (5,517 | ) | (4,355 | ) | (3,372 | ) | ||||||
| $ | (2,638 | ) | $ | (126 | ) | $ | (1,129 | ) | ||||
Key liquidity events during 2010, 2009 and 2008 included:
| • | As a result of the Smith merger, Schlumberger assumed net debt of $1.8 billion. This amount consisted of $2.2 billion of debt (including a $0.4 billion adjustment to increase Smith's long-term fixed rate debt to its estimated fair value) and $0.4 billion of cash. | |
| • | During the second quarter of 2010, Schlumberger completed the acquisition of Geoservices for cash of $0.9 billion. Schlumberger assumed net debt of $0.1 billion in connection with this transaction. |
27
Part II, Item 7
| • | During the third and fourth quarters of 2010, Schlumberger repurchased the following debt: |
| (Stated in millions) | ||||
| Carrying | ||||
| Value | ||||
6.50% Notes due 2012 | $ | 649 | ||
6.75% Senior Notes due 2011 | 224 | |||
9.75% Senior Notes due 2019 | 212 | |||
6.00% Senior Notes due 2016 | 102 | |||
8.625% Senior Notes due 2014 | 88 | |||
| $ | 1,275 | |||
The premium paid in excess of the carrying value to repurchase the $1.275 billion of debt was approximately $67 million.
| • | During the first quarter of 2009, Schlumberger entered into a €3.0 billion Euro Medium Term Note program. This program provides for the issuance of various types of debt instruments such as fixed or floating rate notes in Euro, US dollar or other currencies. |
Schlumberger issued €1.0 billion 2.75% Guaranteed Notes due 2015 in the fourth quarter of 2010 under this program. Schlumberger entered into agreements to swap these euro notes for US dollars on the date of issue until maturity, effectively making this a US denominated debt on which Schlumberger will pay interest in US dollars at a rate of 2.56%. The proceeds from these notes will be used for general corporate purposes.
During the first quarter of 2009, Schlumberger issued €1.0 billion 4.50% Guaranteed Notes due 2014 under this program. Schlumberger entered into agreements to swap these euro notes for US dollars on the date of issue until maturity, effectively making this a US dollar denominated debt on which Schlumberger will pay interest in US dollars at a rate of 4.95%. The proceeds from these notes were used to refinance existing debt obligations and for general corporate purposes.
| • | During the third quarter of 2009, Schlumberger issued $450 million of 3.00% Guaranteed Notes due 2013. The proceeds from these notes were used to refinance existing debt obligations. | |
| • | In September 2008, Schlumberger issued €500 million 5.25% Guaranteed Notes due 2013. Schlumberger entered into agreements to swap these Euro notes for US dollars on the date of issue until maturity, effectively making this a US dollar denominated debt on which Schlumberger will pay interest in US dollars at a rate of 4.74%. The proceeds from these notes were used to repay commercial paper borrowings. | |
| • | On April 20, 2006, the Schlumberger Board of Directors approved a share repurchase program of up to 40 million shares of common stock to be acquired in the open market before April 2010, subject to market conditions. This program was completed during the second quarter of 2008. |
On April 17, 2008, the Schlumberger Board of Directors approved an $8 billion share repurchase program for shares of Schlumberger common stock, to be acquired in the open market before December 31, 2011, of which $3.15 billion had been repurchased as of December 31, 2010.
The following table summarizes the activity under these share repurchase programs during 2010, 2009 and 2008:
| (Stated in thousands except per share amounts and prices) | ||||||||||||
| Total cost | Total number | Average | ||||||||||
| of shares | of shares | price paid | ||||||||||
| purchased | purchased | per share | ||||||||||
2010 | $ | 1,716,675 | 26,624.8 | $ | 64.48 | |||||||
2009 | $ | 500,097 | 7,825.0 | $ | 63.91 | |||||||
2008 | $ | 1,818,841 | 21,064.7 | $ | 86.35 | |||||||
| • | Cash flow provided by operations was $5.5 billion in 2010, $5.3 billion in 2009 and $6.9 billion in 2008. The decline in cash flow from operations in 2009 as compared to 2008 was primarily driven by the decrease in net |
28
Part II, Item 7
| income experienced in 2009 and the significant pension plan contributions made during 2009, offset by an improvement in working capital requirements. |
At times in recent periods, Schlumberger has experienced delays in payments from certain of its customers. Schlumberger operates in approximately 80 countries. At December 31, 2010, only three of those countries individually accounted for greater than 5% of Schlumberger's accounts receivable balance of which only one, the United States, represented greater than 10%.
| • | Dividends paid during 2010, 2009 and 2008 were $1.04 billion, $1.01 billion and $0.96 billion, respectively. |
In January 2011, Schlumberger announced that its Board of Directors had approved an increase in the quarterly dividend of 19%, to $0.25.
| • | Capital expenditures were $2.9 billion in 2010, $2.4 billion in 2009 and $3.7 billion in 2008. Capital expenditures in 2008 reflected the record activity levels experienced in that year. The decrease in capital expenditures in 2009 as compared to 2008 is primarily due to the significant activity decline during 2009. Capital expenditures are expected to approach $4.0 billion for the full year 2011. | |
| • | During 2010, 2009 and 2008 Schlumberger made contributions of $868 million, $1.1 billion and $290 million, respectively, to its postretirement benefit plans. The US pension plans were 95% funded at December 31, 2010 based on the projected benefit obligation. This compares to 92% funded at December 31, 2009. |
Schlumberger's international defined benefit pension plans are a combined 92% funded at December 31, 2010 based on the projected benefit obligation. This compares to 85% funded at December 31, 2009.
Schlumberger currently anticipates contributing approximately $600 million to $650 million to its postretirement benefit plans in 2011, subject to market and business conditions.
| • | During 2010 and 2008, certain holders of Schlumberger Limited 1.5% Series A Convertible Debentures due June 1, 2023 and 2.125% Series B Convertible Debentures due June 1, 2023 converted their debentures into Schlumberger common stock. The following table summarizes these conversions: |
| (Stated in millions) | ||||||||||||||||
| 2010 | 2008 | |||||||||||||||
| Conversions | Shares issued | Conversions | Shares issued | |||||||||||||
1.5% Series A debentures | $ | – | – | $ | 353 | 9.76 | ||||||||||
2.125% Series B debentures | 321 | 8.00 | 95 | 2.36 | ||||||||||||
| $ | 321 | 8.00 | $ | 448 | 12.12 | |||||||||||
At December 31, 2008, there were no outstanding Series A debentures. There were $321 million outstanding Series B debentures at December 31, 2009. During 2010, $320 million of the 2.125% Series B Convertible Debentures due June 1, 2023 were converted by holders into 8.0 million shares of Schlumberger common stock and the remaining $1 million of outstanding Series B debentures were redeemed for cash.
As of December 31, 2010, Schlumberger had approximately $5.0 billion of cash and short-term investments on hand. Schlumberger had separate committed debt facility agreements aggregating $6.0 billion with commercial banks, of which $3.7 billion was available and unused as of December 31, 2010. This included $4.9 billion of committed facilities which support commercial paper borrowings in the United States and Europe. Schlumberger believes that these amounts are sufficient to meet future business requirements for at least the next twelve months.
Schlumberger's total outstanding debt at December 31, 2010 was $8.1 billion and included approximately $1.9 billion of commercial paper borrowings. The total outstanding debt increased approximately $2.6 billion compared to December 31, 2009.
On January 10, 2011, Schlumberger issued $1.1 billion of 4.200% Senior Notes due 2021 and $500 million of 2.650% Senior Notes due 2016.
29
Part II, Item 7
Summary of Major Contractual Obligations
| (Stated in millions) | ||||||||||||||||||||
| Payment Period | ||||||||||||||||||||
| Contractual Obligations | Total | 2011 | 2012 – 2013 | 2014 – 2015 | After 2015 | |||||||||||||||
Debt (1) | $ | 8,112 | $ | 2,595 | $ | 1,608 | $ | 2,915 | $ | 994 | ||||||||||
Operating Leases | 1,334 | 325 | 409 | 223 | 377 | |||||||||||||||
Purchase Obligations (2) | 1,874 | 1,848 | 26 | – | – | |||||||||||||||
| $ | 11,320 | $ | 4,768 | $ | 2,043 | $ | 3,138 | $ | 1,371 | |||||||||||
| (1) | Excludes future payments for interest. | |
| (2) | Represents an estimate of contractual obligations in the ordinary course of business. Although these contractual obligations are considered enforceable and legally binding, the terms generally allow Schlumberger the option to reschedule and adjust its requirements based on business needs prior to the delivery of goods. |
Refer to Note 18 of the Consolidated Financial Statements for details regarding Schlumberger's pension and other postretirement benefit obligations.
As discussed in Note 14 of the Consolidated Financial Statements , included in the Schlumberger Consolidated Balance Sheet at December 31, 2010 is approximately $1.17 billion of liabilities associated with uncertain tax positions in the over 100 jurisdictions in which Schlumberger conducts business. Due to the uncertain and complex application of tax regulations, combined with the difficulty in predicting when tax audits throughout the world may be concluded, Schlumberger cannot make reliable estimates of the timing of cash outflows relating to these liabilities.
Schlumberger has outstanding letters of credit/guarantees which relate to business performance bonds, custom/excise tax commitments, facility lease/rental obligations, etc. These were entered into in the ordinary course of business and are customary practices in the various countries where Schlumberger operates.
Critical Accounting Policies and Estimates
The preparation of financial statements and related disclosures in conformity with accounting principles generally accepted in the United States requires Schlumberger to make estimates and assumptions that affect the reported amounts of assets and liabilities, the disclosure of contingent assets and liabilities and the reported amounts of revenue and expenses. The following accounting policies involve "critical accounting estimates" because they are particularly dependent on estimates and assumptions made by Schlumberger about matters that are inherently uncertain. A summary of all of Schlumberger's significant accounting policies is included in Note 2 to the Consolidated Financial Statements .
Schlumberger bases its estimates on historical experience and on various assumptions that are believed to be reasonable under the circumstances, the results of which form the basis for making judgments about the carrying values of assets and liabilities that are not readily apparent from other sources. Actual results may differ from these estimates under different assumptions or conditions.
Multiclient Seismic Data
The WesternGeco segment capitalizes the costs associated with obtaining multiclient seismic data. The carrying value of the multiclient seismic data library at December 31, 2010 and 2009 was $394 million and $288 million, respectively. Such costs are charged to Cost of revenue based on the percentage of the total costs to the estimated total revenue that Schlumberger expects to receive from the sales of such data. However, under no circumstances will an individual survey carry a net book value greater than a 4-year straight-line amortized value.
The carrying value of surveys is reviewed for impairment annually as well as when an event or change in circumstance indicates an impairment may have occurred. Adjustments to the carrying value are recorded when it is determined that estimated future revenues, which involve significant judgment on the part of Schlumberger, would not be sufficient to recover the carrying value of the surveys. Significant adverse changes in Schlumberger's estimated future cash flows could result in impairment charges in a future period. For purposes of performing the annual impairment test of the multiclient library, future cash flows are analyzed primarily based on two pools of surveys: United States and non-United States. The United States and non-United States pools were determined to be the most appropriate level at which to perform the impairment review based upon a number of factors including (i) various macroeconomic factors that
30
Part II, Item 7
influence the ability to successfully market surveys and (ii) the focus of the sales force and related costs. Certain larger surveys, which are typically prefunded by customers, are analyzed for impairment on a survey by survey basis.
Allowance for Doubtful Accounts
Schlumberger maintains an allowance for doubtful accounts in order to record accounts receivable at their net realizable value. Judgment is involved in recording and making adjustments to this reserve. Allowances have been recorded for receivables believed to be uncollectible, including amounts for the resolution of potential credit and other collection issues such as disputed invoices. Depending on how such potential issues are resolved, or if the financial condition of Schlumberger customers were to deteriorate resulting in an impairment of their ability to make payments, adjustments to the allowance may be required.
Inventory Reserves
Inventory is recorded at the lower of cost or net realizable value. Schlumberger maintains a reserve for excess and obsolete inventory. This requires management to make assumptions about future demand and market conditions. If actual future demand or market conditions are less favorable than those projected by management, additional provisions for excess or obsolete inventory may be required.
Goodwill, Intangible Assets and Long-Lived Assets
Schlumberger records the excess of purchase price over the fair value of the tangible and identifiable intangible assets acquired as goodwill. Goodwill is tested for impairment annually as well as when an event or change in circumstance indicates an impairment may have occurred. Goodwill is tested for impairment by comparing the fair value of Schlumberger's individual reporting units to their carrying amount to determine if there is a potential goodwill impairment. If the fair value of the reporting unit is less than its carrying value, an impairment loss is recorded to the extent that the implied fair value of the goodwill of the reporting unit is less than its carrying value.
For purposes of performing the impairment test for goodwill, Schlumberger's reporting units are primarily the geographic areas comprising the Oilfield Services segment in addition to the WesternGeco, M-I SWACO, Smith Oilfield and Distribution segments. Schlumberger estimates the fair value of these reporting units using a discounted cash flow analysis and/or applying various market multiples. Determining the fair value of a reporting unit is a matter of judgment and often involves the use of significant estimates and assumptions. Schlumberger's estimate of the fair value of each of its reporting units comprising Oilfield Services as well as its WesternGeco reporting unit were substantially in excess of their respective carrying values at the time of their annual goodwill impairment tests for 2010. Due to the fact that the M-I SWACO, Smith Oilfield and Distribution reporting units were acquired on August 27, 2010, just prior to their annual goodwill impairment tests, the fair value of these reporting units approximated their carrying value.
Long-lived assets, including fixed assets and intangible assets, are reviewed for impairment whenever events or changes in circumstances indicate that the carrying value may not be recoverable. In reviewing for impairment, the carrying value of such assets is compared to the estimated undiscounted future cash flows expected from the use of the assets and their eventual disposition. If such cash flows are not sufficient to support the asset's recorded value, an impairment charge is recognized to reduce the carrying value of the long-lived asset to its estimated fair value. The determination of future cash flows as well as the estimated fair value of long-lived assets involves significant estimates on the part of management. If there is a material change in economic conditions or other circumstances influencing the estimate of future cash flows or fair value, Schlumberger could be required to recognize impairment charges in the future. Schlumberger evaluates the remaining useful life of its intangible assets on a periodic basis to determine whether events and circumstances warrant a revision to the remaining estimated amortization period.
Income Taxes
Schlumberger's tax filings are subject to regular audit by the tax authorities in most of the over 100 jurisdictions in which it conducts business. These audits may result in assessments for additional taxes which are resolved with the authorities or, potentially, through the courts. Tax liabilities are recorded based on estimates of additional taxes which will be due upon the conclusion of these audits. Estimates of these tax liabilities are made based upon prior experience
31
Part II, Item 7
and are updated in light of changes in facts and circumstances. However, due to the uncertain and complex application of tax regulations, it is possible that the ultimate resolution of audits may result in liabilities which could be materially different from these estimates. In such an event, Schlumberger will record additional tax expense or tax benefit in the period in which such resolution occurs.
Pension and Postretirement Benefits
Schlumberger's pension and postretirement benefit obligations are described in detail in Note 18 to the Consolidated Financial Statements . The obligations and related costs are calculated using actuarial concepts, which include critical assumptions related to the discount rate, expected return on plan assets and medical cost trend rates. These assumptions are important elements of expense and/or liability measurement and are updated on an annual basis, or upon the occurrence of significant events.
The discount rate Schlumberger uses reflects the prevailing market rate of a portfolio of high-quality debt instruments with maturities matching the expected timing of the payment of the benefit obligations. The following summarizes the discount rates utilized by Schlumberger for its various pension and postretirement benefit plans:
| • | The discount rate utilized to determine the liability for Schlumberger's United States pension plans and postretirement medical plans was 5.50% at December 31, 2010 and 6.00% at December 31, 2009. | |
| • | The weighted-average discount rate utilized to determine the liability for Schlumberger's international pension plans was 5.47% at December 31, 2010 and 5.89% at December 31, 2009. | |
| • | The weighted-average discount rate utilized to determine expense for Schlumberger's United States pension plans and postretirement medical plans decreased from 6.94% in 2009 to 6.00% in 2010. | |
| • | The weighted-average discount rate utilized to determine expense for Schlumberger's international pension plans was decreased from 6.81% in 2009 to 5.89% in 2010. |
A higher discount rate decreases the present value of benefit obligations and decreases expense.
The expected rate of return for our retirement benefit plans represents the average rate of return expected to be earned on plan assets over the period that benefits included in the benefit obligation are expected to be paid. The expected rate of return for Schlumberger's United States pension plans has been determined based upon expectations regarding future rates of return for the investment portfolio, with consideration given to the distribution of investments by asset class and historical rates of return for each individual asset class. The expected rate of return on plan assets for the United States pension plans was 8.50% in both 2010 and 2009. The weighted average expected rate of return on plan assets for the international plans was 8.00% in 2010 and 8.35% in 2009. A lower expected rate of return would increase pension expense.
Schlumberger's medical cost trend rate assumptions are developed based on historical cost data, the near-term outlook and an assessment of likely long-term trends. The overall medical cost trend rate assumption utilized to determine both the 2010 postretirement medical expense as well as the postretirement medical liability as of December 31, 2010 was 8% graded to 5% over the next six years.
The following illustrates the sensitivity to changes in certain assumptions, holding all other assumptions constant, for the United States and international pension plans:
| (Stated in millions) | ||||||||
| Effect on 2010 | Effect on | |||||||
| Pretax Pension | Dec. 31, 2010 | |||||||
| Change in Assumption | Expense | Liability | ||||||
25 basis point decrease in discount rate | +$ | 18 | +$ | 261 | ||||
25 basis point increase in discount rate | -$ | 17 | -$ | 246 | ||||
25 basis point decrease in expected return on plan assets | +$ | 13 | – | |||||
25 basis point increase in expected return on plan assets | -$ | 13 | – | |||||
32
Part II, Item 7
The following illustrates the sensitivity to changes in certain assumptions, holding all other assumptions constant, for Schlumberger's United States postretirement medical plans:
| (Stated in millions) | ||||||||
| Effect on 2010 | Effect on | |||||||
| Pretax Postretirement | Dec. 31, 2010 | |||||||
| Change in Assumption | Medical Expense | Liability | ||||||
25 basis point decrease in discount rate | +$ | 4 | +$ | 39 | ||||
25 basis point increase in discount rate | -$ | 4 | -$ | 37 | ||||
100 basis point decrease per annum in medical cost trend rate | -$ | 22 | -$ | 145 | ||||
100 basis point increase per annum in medical cost trend rate | +$ | 26 | +$ | 177 | ||||
33
Part II, Item 7A
Item 7A. Quantitative and Qualitative Disclosures About Market Risk.
Schlumberger is subject to market risks primarily associated with changes in foreign currency exchange rates, commodity prices and interest rates.
As a multinational company, Schlumberger conducts business in approximately 80 countries. Schlumberger's functional currency is primarily the US dollar, which is consistent with the oil and gas industry. Approximately 80% of Schlumberger's revenue in 2010 was denominated in US dollars. However, outside the United States, a significant portion of Schlumberger's expenses is incurred in foreign currencies. Therefore, when the US dollar weakens in relation to the foreign currencies of the countries in which Schlumberger conducts business, the US dollar-reported expenses will increase.
A 5% increase or decrease in the average exchange rates of all the foreign currencies in 2010 would have changed revenue by approximately 1%. If the 2010 average exchange rates of the US dollar against all foreign currencies had strengthened by 5%, Schlumberger's income from continuing operations would have increased by approximately 2%. Conversely, a 5% weakening of the US dollar average exchange rates would have decreased income from continuing operations by approximately 3%.
Although the functional currency of Schlumberger's operations in Venezuela is the US dollar, a portion of the transactions are denominated in local currency. For financial reporting purposes, such transactions are remeasured into US dollars at the official exchange rate, which until January 2010 was fixed at 2.15 Venezuela bolivares fuertes per US dollar, despite significant inflation in recent periods. In January 2010, Venezuela's currency was devalued and a new exchange rate system was announced. During the first quarter of 2010, Schlumberger began to apply an exchange rate of 4.3 Venezuelan bolivares fuertes per US dollar to its local currency denominated transactions in Venezuela. The devaluation did not have an immediate significant impact to Schlumberger. Further, although this devaluation does result in a reduction in the US dollar reported amount of local currency denominated revenues and expenses, the impact is not material to Schlumberger's consolidated financial statements.
Schlumberger maintains a foreign-currency risk management strategy that uses derivative instruments to protect its interests from unanticipated fluctuations in earnings and cash flows caused by volatility in currency exchange rates. Foreign currency forward contracts and foreign currency options provide a hedge against currency fluctuations either on monetary assets/liabilities denominated in other than a functional currency or on expenses.
At December 31, 2010, contracts were outstanding for the US dollar equivalent of $7.3 billion in various foreign currencies.
Schlumberger is subject to the risk of market price fluctuations of certain commodities, such as metals and fuel. Schlumberger utilizes forward contracts to manage a small percentage of the price risk associated with forecasted metal purchases. As of December 31, 2010, $12 million of commodity forward contracts were outstanding.
Schlumberger is subject to interest rate risk on its debt and its investment portfolio. Schlumberger maintains an interest rate risk management strategy that uses a mix of variable and fixed rate debt combined with its investment portfolio and interest rate swaps to mitigate the exposure to changes in interest rates. At December 31, 2010, Schlumberger had fixed rate debt aggregating approximately $5.4 billion and variable rate debt aggregating approximately $2.8 billion. Schlumberger has entered into interest rate swaps relating to $0.5 billion of its fixed rate debt as of December 31, 2010 whereby Schlumberger will receive interest at a fixed rate and pay interest at a variable rate.
Schlumberger's exposure to interest rate risk associated with its debt is also partially mitigated by its investment portfolio. Both Short-term investments and Fixed income investments , held to maturity , which totaled approximately $3.7 billion at December 31, 2010, are comprised primarily of money market funds, eurodollar time deposits, certificates of deposit, commercial paper, euro notes and Eurobonds and are substantially all denominated in US dollars. The average return on investment was 1.1% in 2010.
34
Part II, Item 7A
The following table represents carrying amounts of Schlumberger's debt at December 31, 2010 by year of maturity:
| (Stated in millions) | ||||||||||||||||||||||||||||||||
| Expected Maturity Dates | ||||||||||||||||||||||||||||||||
| 2011 | 2012 | 2013 | 2014 | 2015 | 2016 | 2019 | Total | |||||||||||||||||||||||||
Fixed rate debt | ||||||||||||||||||||||||||||||||
5.875% Guaranteed Bonds | $ | 334 | $ | 334 | ||||||||||||||||||||||||||||
5.25% Guaranteed Notes | $ | 659 | 659 | |||||||||||||||||||||||||||||
3.00% Guaranteed Notes | 463 | 463 | ||||||||||||||||||||||||||||||
4.50% Guaranteed Notes | $ | 1,319 | 1,319 | |||||||||||||||||||||||||||||
8.625% Senior Notes | 272 | 272 | ||||||||||||||||||||||||||||||
2.75% Guaranteed Notes | $ | 1,310 | 1,310 | |||||||||||||||||||||||||||||
6.00% Senior Notes | $ | 218 | 218 | |||||||||||||||||||||||||||||
9.75% Senior Notes | $ | 776 | 776 | |||||||||||||||||||||||||||||
Total fixed rate debt | $ | 334 | $ | – | $ | 1,122 | $ | 1,591 | $ | 1,310 | $ | 218 | $ | 776 | $ | 5,351 | ||||||||||||||||
Variable rate debt | 2,261 | 445 | 41 | 14 | – | – | – | 2,761 | ||||||||||||||||||||||||
Total | $ | 2,595 | $ | 445 | $ | 1,163 | $ | 1,605 | $ | 1,310 | $ | 218 | $ | 776 | $ | 8,112 | ||||||||||||||||
The fair market value of the outstanding fixed rate debt was approximately $5.5 billion as of December 31, 2010. The weighted average interest rate on the variable rate debt as of December 31, 2010 was approximately 1.0%.
Schlumberger does not enter into derivatives for speculative purposes.
Forward-looking Statements
This Form 10-K and other statements we make contain "forward-looking statements" within the meaning of the federal securities laws, which include any statements that are not historical facts, such as our forecasts or expectations regarding business outlook; growth for Schlumberger as a whole and for each of Oilfield Services and WesternGeco (and for specified products or geographic areas within each segment); the integration of both Smith and Geoservices into our business; the anticipated benefits of those transactions; oil and natural gas demand and production growth; oil and natural gas prices; improvements in operating procedures and technology; capital expenditures by Schlumberger and the oil and gas industry; the business strategies of Schlumberger's customers; future global economic conditions; and future results of operations. These statements are subject to risks and uncertainties, including, but not limited to, the current global economic downturn; changes in exploration and production spending by Schlumberger's customers and changes in the level of oil and natural gas exploration and development; general economic and business conditions in key regions of the world; pricing erosion; seasonal factors; changes in government regulations and regulatory requirements, including those related to offshore oil and gas exploration, radioactive sources, explosives, chemicals, hydraulic fracturing services and climate-related initiatives; continuing operational delays or program reductions as of result of the lifted drilling moratorium in the Gulf of Mexico; the inability to successfully integrate the merged Smith and Geoservices businesses and to realize expected synergies, the inability to retain key employees; and other risks and uncertainties detailed in the Risk Factors section of this Form 10-K and other filings that we make with the Securities and Exchange Commission. If one or more of these or other risks or uncertainties materialize (or the consequences of such a development changes), or should our underlying assumptions prove incorrect, actual outcomes may vary materially from those reflected in our forward-looking statements. Schlumberger disclaims any intention or obligation to update publicly or revise such statements, whether as a result of new information, future events or otherwise.
35
Part II, Item 8
Item 8. Financial Statements and Supplementary Data.
SCHLUMBERGER
LIMITED AND SUBSIDIARIES
CONSOLIDATED STATEMENT OF INCOME
| (Stated in millions, except per share amounts) | ||||||||||||
| Year Ended December 31, | 2010 | 2009 | 2008 | |||||||||
Revenue | $ | 27,447 | $ | 22,702 | $ | 27,163 | ||||||
Interest and other income, net | 214 | 273 | 412 | |||||||||
Gain on investment in M-I SWACO | 1,270 | – | – | |||||||||
Expenses | ||||||||||||
Cost of revenue | 21,499 | 17,245 | 18,957 | |||||||||
Research & engineering | 919 | 802 | 819 | |||||||||
General & administrative | 650 | 535 | 584 | |||||||||
Merger & integration | 169 | – | – | |||||||||
Restructuring & other | 331 | 238 | 116 | |||||||||
Interest | 207 | 221 | 247 | |||||||||
Income from Continuing Operations before taxes | 5,156 | 3,934 | 6,852 | |||||||||
Taxes on income | 890 | 770 | 1,430 | |||||||||
Income from Continuing Operations | 4,266 | 3,164 | 5,422 | |||||||||
Income (Loss) from Discontinued Operations | – | (22 | ) | 38 | ||||||||
Net Income | 4,266 | 3,142 | 5,460 | |||||||||
Net (income) loss attributable to noncontrolling interests | 1 | (8 | ) | (25 | ) | |||||||
Net Income attributable to Schlumberger | $ | 4,267 | $ | 3,134 | $ | 5,435 | ||||||
Schlumberger amounts attributable to: | ||||||||||||
Income from Continuing Operations | $ | 4,267 | $ | 3,156 | $ | 5,397 | ||||||
Income (Loss) from Discontinued Operations | – | (22 | ) | 38 | ||||||||
Net Income | $ | 4,267 | $ | 3,134 | $ | 5,435 | ||||||
Basic earnings per share of Schlumberger: | ||||||||||||
Income from Continuing Operations | $ | 3.41 | $ | 2.63 | $ | 4.51 | ||||||
Income (Loss) from Discontinued Operations | – | (0.02 | ) | 0.03 | ||||||||
Net Income (1) | $ | 3.41 | $ | 2.62 | $ | 4.54 | ||||||
Diluted earnings per share of Schlumberger: | ||||||||||||
Income from Continuing Operations | $ | 3.38 | $ | 2.61 | $ | 4.42 | ||||||
Income (Loss) from Discontinued Operations | – | (0.02 | ) | 0.03 | ||||||||
Net Income | $ | 3.38 | $ | 2.59 | $ | 4.45 | ||||||
Average shares outstanding | ||||||||||||
Basic | 1,250 | 1,198 | 1,196 | |||||||||
Assuming dilution | 1,263 | 1,214 | 1,224 | |||||||||
(1) Amounts may not add due to rounding
See the Notes to Consolidated Financial Statements
36
Part II, Item 8
SCHLUMBERGER
LIMITED AND SUBSIDIARIES
CONSOLIDATED BALANCE SHEET