UNITED STATES
SECURITIES AND EXCHANGE COMMISSION
Washington, D.C. 20549
FORM 10-K
(check one)
☒ | ANNUAL REPORT PURSUANT TO SECTION 13 OR 15(d) OF THE SECURITIES EXCHANGE ACT OF 1934 For the fiscal year ended June 30, 2013 |
OR
☐ | TRANSITION REPORT PURSUANT TO SECTION 13 OR 15(d) OF THE SECURITIES EXCHANGE ACT OF 1934 For the transition period from __________ to __________ |
Commission File No. 1-367
THE L.S. STARRETT COMPANY
(Exact name of registrant as specified in its charter)
|
|
MASSACHUSETTS | 04-1866480 |
(State or other jurisdiction of incorporation or organization) | (I.R.S. Employer Identification No.) |
|
|
121 CRESCENT STREET, ATHOL, MASSACHUSETTS | 01331 |
(Address of principal executive offices) | (Zip Code) |
Registrant's telephone number, including area code 978-249-3551
Securities registered pursuant to Section 12(b) of the Act:
|
|
|
Title of each class |
| Name of each exchange on which registered |
Class A Common - $1.00 Per Share Par Value |
| New York Stock Exchange |
Class B Common - $1.00 Per Share Par Value |
| Not applicable |
Indicate by check mark if the Registrant is a well-known seasoned issuer, as defined in Rule 405 of the Securities Act. Yes ☐ No ☒
Indicate by check mark if the Registrant is not required to file reports pursuant to Section 13 or Section 15(d) of the Act. Yes ☐ No ☒
Indicate by check mark whether the Registrant (1) has filed all reports required to be filed by Section 13 or 15(d) of the Securities Exchange Act of 1934 during the preceding 12 months (or for such shorter period that the Registrant was required to file such reports) and (2) has been subject to such filing requirements for the past 90 days. Yes ☒ No ☐
Indicate by check mark whether the registrant has submitted electronically and posted on its corporate Web site, if any, every Interactive Data File required to be submitted and posted pursuant to Rule 405 of Regulation S-T (§ 232.405 of this chapter) during the preceding 12 months (or for such shorter period that the registrant was required to submit and post such files). Yes ☒ No ☐
Indicate by check mark if disclosure of delinquent filers pursuant to Item 405 of Regulation S-K is not contained herein and will not be contained, to the best of Registrant's knowledge, in definitive proxy or information statements incorporated by reference in Part III of this Form 10-K or amendment to this Form 10-K. ☒
1
Indicate by check mark whether the Registrant is a large accelerated filer, an accelerated filer, a non-accelerated filer or a smaller reporting company. See the definitions of "large accelerated filer," "accelerated filer" and "smaller reporting company" in Rule 12b-2 of the Exchange Act. (Check one)
Large Accelerated Filer ☐ Accelerated Filer ☒
Non-Accelerated Filer ☐ Smaller Reporting Company ☐
(Do not check if a smaller reporting company)
Indicate by check mark whether the Registrant is a shell company (as defined in Rule 12b-2 of the Act). Yes ☐ No ☒
The Registrant had 6,050,572 , and 742,394 shares, respectively, of its $1.00 par value Class A and B common stock outstanding on December 31, 2012. On December 31, 2012, the last business day of the Registrant's second fiscal quarter, the aggregate market value of the common stock held by nonaffiliates was approximately $58,096,831.
There were 6,089,643 and 819,901 shares, respectively, of the Registrant's $1.00 par value Class A and Class B common stock outstanding as of August 31, 2013.
The exhibit index is located on pages 48-50.
DOCUMENTS INCORPORATED BY REFERENCE
The Registrant intends to file a definitive Proxy Statement for the Company's 2013 Annual Meeting of Stockholders within 120 days of the end of the fiscal year ended June 30, 2013. Portions of such Proxy Statement are incorporated by reference in Part III.
2
THE L.S. STARRETT COMPANY
FORM 10-K
FOR THE YEAR ENDED JUNE 30, 2013
TABLE OF CONTENTS
|
| Page Number |
| PART I |
|
|
|
|
ITEM 1. | Business | 4-6 |
ITEM 1A. | Risk Factors | 6-8 |
ITEM 1B. | Unresolved Staff Comments | 8 |
ITEM 2. | Properties | 8 |
ITEM 3. | Legal Proceedings | 9 |
ITEM 4. | Mine Safety Disclosures | 9 |
|
|
|
| PART II |
|
|
|
|
ITEM 5. | Market for the Company's Common Equity, Related Stockholder Matters and Issuer Purchases of Equity Securities | 9-10 |
ITEM 6. | Selected Financial Data | 10 |
ITEM 7. | Management's Discussion and Analysis of Financial Condition and Results of Operations | 11-16 |
ITEM 7A. | Quantitative and Qualitative Disclosures about Market Risk | 11-16 |
ITEM 8. | Financial Statements and Supplementary Data | 17-43 |
ITEM 9. | Changes in and Disagreements with Accountants on Accounting and Financial Disclosure | 43 |
ITEM 9A. | Controls and Procedures | 43 |
ITEM 9B. | Other Information | 46 |
|
|
|
| PART III |
|
|
|
|
ITEM 10. | Directors, Executive Officers and Corporate Governance | 46 |
ITEM 11. | Executive Compensation | 46 |
ITEM 12. | Security Ownership of Certain Beneficial Owners and Management and Related Stockholder Matters | 47 |
ITEM 13. | Certain Relationships and Related Transactions, and Director Independence | 47 |
ITEM 14. | Principal Accounting Fees and Services | 47 |
|
|
|
| PART IV |
|
|
|
|
ITEM 15. | Exhibits and Financial Statement Schedules | 48 |
EXHIBIT INDEX | 48-50 | |
SIGNATURES | 51 | |
All references in this Annual Report to "Starrett", the "Company", "we", "our" and "us" mean The L.S. Starrett Company and its subsidiaries.
3
PART I
Item 1 - Business
General
Founded in 1880 by Laroy S. Starrett and incorporated in 1929, The L.S. Starrett Company (the "Company") is engaged in the business of manufacturing over 5,000 different products for industrial, professional and consumer markets. As a global manufacturer with major subsidiaries in Brazil (1956), Scotland (1958) and China (1997), the Company offers its broad array of products to the market through multiple channels of distribution throughout the world. The Company's products include precision tools, non-contact industrial measurement systems, electronic gages, gage blocks, optical vision and laser measuring equipment, custom engineered granite solutions, tape measures, levels, chalk products, squares, band saw blades, hole saws, hacksaw blades, jig saw blades, reciprocating saw blades, M1® lubricant and precision ground flat stock. The Company's financial reporting is based upon one business segment.
Starrett® is brand recognized around the world for precision, quality and innovation.
Products
The Company's tools and instruments are sold throughout North America and in over 100 other countries. By far the largest consumer of these products is the metalworking industry including aerospace, medical, and automotive but other important consumers are marine and farm equipment shops, do-it-yourselfers and tradesmen such as builders, carpenters, plumbers and electricians.
For 133 years the Company has been a recognized leader in providing measurement solutions consisting of hand measuring tools and precision instruments such as micrometers, vernier calipers, height gages, depth gages, electronic gages, dial indicators, steel rules, combination squares, custom and non-contact gaging and many other items. Skilled personnel, superior products, manufacturing expertise, innovation and unmatched service has earned the Company its reputation as the "Best in Class" provider of measuring application solutions for industry. During fiscal 2013, the Company introduced new products in force measurement and material test equipment, Field of View software under our vision platform and laser based measurement systems.
The Company's saw product lines enjoy strong global brand recognition and market share. These products encompass a breadth of uses. The Company introduced several new products in the recent past including its ADVANZ carbide tipped products and its VERSATIX products with a patent pending tooth geometry designed for the cutting of structurals and small solids. These new product lines were enhanced through the global introduction of new support programs and marketing collateral. These actions are aimed at positioning Starrett for global growth in wide band products for production applications as well as product range expansions for shop applications. In addition, the Company is gaining market share in the food processing industry. A full line of complementary saw products, including hack, jig, reciprocating saw blades and hole saws provide cutting solutions for the building trades and are offered primarily through construction, electrical, plumbing and retail distributors.
4
Personnel
At June 30, 2013, the Company had 1,814 employees, approximately 52% of whom were domestic. This represents a net decrease from June 30, 2012 of 114 employees. The headcount change included a decrease of 81 domestically and a decrease of 33 internationally.
None of the Company's operations are subject to collective bargaining agreements. In general, the Company considers relations with its employees to be excellent. Domestic employees hold a large share of Company stock resulting from various stock purchase plans and employee stock ownership plans. The Company believes that this dual role of owner-employee has strengthened employee morale over the years.
Competition
The Company competes on the basis of its reputation as the best in class for quality, precision and innovation combined with its commitment to customer service and strong customer relationships. To that end, Starrett is increasingly focusing on providing customer centric solutions. Although the Company is generally operating in highly competitive markets, the Company's competitive position cannot be determined accurately in the aggregate or by specific market since none of its competitors offer all of the same product lines offered by the Company or serve all of the markets served by the Company.
The Company is one of the largest producers of mechanics' hand measuring tools and precision instruments. In the United States, there are three major foreign competitors and numerous small companies in the field. As a result, the industry is highly competitive. During fiscal 2013, there were no material changes in the Company's competitive position. The Company's products for the building trades, such as tape measures and levels, are under constant margin pressure due to a channel shift to large national home and hardware retailers. The Company is responding to such challenges by expanding its manufacturing operations in China. Certain large customers offer private labels ("own brand") that compete with Starrett branded products. These products are often sourced directly from low cost countries.
Saw products encounter competition from several domestic and international sources. The Company's competitive position varies by market segment and country. Continued research and development, new patented products and processes, strategic acquisitions and investments and strong customer support have enabled the Company to compete successfully in both general and performance oriented applications.
Foreign Operations
The operations of the Company's foreign subsidiaries are consolidated in its financial statements. The subsidiaries located in Brazil, Scotland and China are actively engaged in the manufacturing and distribution of precision measuring tools, saw blades, optical and vision measuring equipment and hand tools. Subsidiaries in Canada, Australia, New Zealand, Mexico, Germany and Singapore are engaged in distribution of the Company's products. The Company expects its foreign subsidiaries to continue to play a significant role in its overall operations. A summary of the Company's foreign operations is contained in Note 16 to the Company's fiscal 2013 financial statements under the caption "OPERATING DATA" found in Item 8 of this Form 10-K.
Orders and Backlog
The Company generally fills orders from finished goods inventories on hand. Sales order backlog of the Company at any point in time is not significant. Total inventories amounted to $56.5 million at June 30, 2013 and $69.9 million at June 30, 2012.
Intellectual Property
When appropriate, the Company applies for patent protection on new inventions and currently owns a number of patents. Its patents are considered important in the operation of the business, but no single patent is of material importance when viewed from the standpoint of its overall business. The Company relies on its continuing product research and development efforts, with less dependence on its current patent position. It has for many years maintained engineers and supporting personnel engaged in research, product development and related activities. The expenditures for these activities during fiscal years 2013, 2012, and 2011 were approximately $2.3 million, $2.2 million, and $1.9 million, respectively.
The Company uses trademarks with respect to its products and considers its trademark portfolio as one of its most valuable assets. All of the Company's important trademarks are registered and rigorously enforced.
Environmental
Compliance with federal, state, local, and foreign provisions that have been enacted or adopted regulating the discharge of materials into the environment or otherwise relating to protection of the environment is not expected to have a material effect on the capital expenditures, earnings and competitive position of the Company. Specifically, the Company has taken steps to reduce, control and treat water discharges and air emissions. The Company takes seriously its responsibility to the environment, has embraced renewable energy alternatives and received approval from federal and state regulators in fiscal 2013 to begin using its new hydro – generation facility on line at its Athol, MA plant to reduce its carbon foot print and energy costs, an investment in excess of $1.0 million.
5
Strategic Activities
Globalization has had a profound impact on product offerings and buying behaviors of industry and consumers in North America and around the world, forcing the Company to adapt to this new, highly competitive business environment. The Company continuously evaluates most aspects of its business, aiming for new world-class ideas to set itself apart from its competition.
Our strategic concentration is on global brand building and providing unique customer value propositions through technically supported application solutions for our customers. Our job is to recommend and produce the best suited standard product or to design and build custom solutions. The combination of the right tool for the job with value added service gives us a competitive advantage. The Company continues its focus on lean manufacturing, plant consolidations, global sourcing, new software and hardware technologies, and improved logistics to optimize its value chain.
The execution of these strategic initiatives has expanded the Company's manufacturing and distribution in developing economies, resulting in international sales revenues totaling 54.4% of consolidated sales for fiscal 2013.
SEC Filings and Certifications
The Company makes its public filings with the Securities and Exchange Commission ("SEC"), including its Annual Report on Form 10-K, Quarterly Reports on Form 10-Q, Current Reports on Form 8-K and all exhibits and amendments to these reports, available free of charge at its website, www.starrett.com, as soon as reasonably practicable after the Company files such material with the SEC. Information contained on the Company's website is not part of this Annual Report on Form 10-K.
Item 1A – Risk Factors
SAFE HARBOR STATEMENT UNDER THE PRIVATE SECURITIES LITIGATION REFORM ACT OF 1995
This Annual Report on Form 10-K and the Company's 2013 Annual Report to Stockholders, including the President's letter, contain forward-looking statements about the Company's business, competition, sales, gross margins, capital expenditures, foreign operations, plans for reorganization, interest rate sensitivity, debt service, liquidity and capital resources, and other operating and capital requirements. In addition, forward-looking statements may be included in future Company documents and in oral statements by Company representatives to security analysts and investors. The Company is subject to risks that could cause actual events to vary materially from such forward-looking statements, including the following risk factors:
Risks Related to Financial Reporting: If the Company or its independent registered public accounting firm are unable to affirm the effectiveness of internal control over financial reporting in future years, the market value of the Company's common stock could be adversely affected. The Company's independent registered public accounting firm did audit and report on internal controls over financial reporting as of June 30, 2013.
Risks Related to the Economy: The Company's results of operations are materially affected by the conditions in the global economy. The recovery from the recession has been slow in North America, while Europe has not emerged from the recession. Latin America has experienced inflation resulting in weaker local currencies compared to the U. S. dollar. China's growth has also slowed. The Company can provide no assurance that these economic trends will not continue.
Risks Related to Reorganization: The Company continues to evaluate consolidation and reorganization of some of its manufacturing and distribution operations. There can be no assurance that the Company will be successful in these efforts or that any consolidation or reorganization will result in revenue increases or cost savings to the Company. The implementation of these reorganization measures may disrupt the Company's manufacturing and distribution activities, could adversely affect operations, and could result in asset impairment charges and other costs that will be recognized if and when reorganization or restructuring plans are implemented or obligations are incurred.
Risks Related to Technology: Although the Company's strategy includes investment in research and development of new and innovative products to meet technology advances, there can be no assurance that the Company will be successful in competing against new technologies developed by competitors.
Risks Related to Foreign Operations: Approximately 54% of the Company's sales and 61% of net assets related to foreign operations for fiscal 2013. Foreign operations are subject to special risks that can materially affect the sales, profits, cash flows and financial position of the Company, including taxes and other restrictions on distributions and payments, currency exchange rate fluctuations, political and economic instability, inflation, minimum capital requirements and exchange controls. The Company's Brazilian operations can be very volatile, changing from year to year due to the political situation, currency risk and the economy. As a result, the future performance of the Brazilian operations may be difficult to forecast.
6
Risks Related to Regulation of Our International Operations: Due to our global operations, we are subject to many laws governing international relations, including those that prohibit improper payments to government officials and commercial customers, and restrict where we can do business, what information or products we can supply to certain countries and what information we can provide to a non-U.S. government, including but not limited to the Foreign Corrupt Practices Act, U.K. Bribery Act and the U.S. Export Administration Act. Violations of these laws, which are complex, may result in criminal penalties or sanctions that could have a material adverse effect on our business, financial condition and results of operations.
Risks Related to Industrial Manufacturing Sector: The market for most of the Company's products is subject to economic conditions affecting the industrial manufacturing sector, including the level of capital spending by industrial companies and the general movement of manufacturing to low cost foreign countries where the Company does not have a substantial market presence. Accordingly, economic weakness in the industrial manufacturing sector may, and in some cases has, resulted in decreased demand for certain of the Company's products, which adversely affects sales and performance. Economic weakness in the consumer market will also adversely impact the Company's performance. In the event that demand for any of the Company's products declines significantly, the Company could be required to recognize certain costs as well as asset impairment charges on long-lived assets related to those products.
Risks Related to Competition: The Company's business is subject to direct and indirect competition from both domestic and foreign firms. In particular, low cost foreign sources have created severe competitive pricing pressures. Under certain circumstances, including significant changes in U.S. and foreign currency relationships, such pricing pressures tend to reduce unit sales and/or adversely affect the Company's margins.
Risks Related to Insurance Coverage: The Company carries liability, property damage, workers' compensation, medical and other insurance policies that management considers adequate for the protection of its assets and operations. There can be no assurance, however, that the coverage limits of such policies will be adequate to cover all claims and losses. Such uncovered claims and losses could have a material adverse effect on the Company. Depending on the risk, deductibles can be as high as 5% of the loss or $500,000.
Risks Related to Raw Material and Energy Costs: Steel is the principal raw material used in the manufacture of the Company's products. The price of steel has historically fluctuated on a cyclical basis and has often depended on a variety of factors over which the Company has no control. The cost of producing the Company's products is also sensitive to the price of energy. The selling prices of the Company's products have not always increased in response to raw material, energy or other cost increases, and the Company is unable to determine to what extent, if any, it will be able to pass future cost increases through to its customers. The Company's inability to pass increased costs through to its customers could materially and adversely affect its financial condition or results of operations.
Risks Related to Defined Benefit Pension Plans: Currently, the Company's U.S. defined benefit pension plan is underfunded. The Company was required to provide an additional $0.5 million to the domestic pension fund in fiscal 2013 but will not be required to make additional contributions in fiscal 2014.. The Company could be required to fund the domestic plan in the future. The Company's UK plan, which is also underfunded, required Company contributions of $1.2 million, $1.2 million and $0.8 million during fiscal 2013, 2012 and 2011 respectively. The Company will be required to make a $1.2 million contribution to its UK pension plan in fiscal 2014.
Risks Related to Acquisitions: Acquisitions involve special risks, including the potential assumption of unanticipated liabilities and contingencies, difficulty in assimilating the operations and personnel of the acquired businesses, disruption of the Company's existing business, dissipation of the Company's limited management resources, and impairment of relationships with employees and customers of the acquired business as a result of changes in ownership and management. While the Company believes that strategic acquisitions can improve its competitiveness and profitability, the failure to successfully integrate and realize the expected benefits of such acquisitions could have an adverse effect on the Company's business, financial condition and operating results.
Risks Related to Investor Expectations: The Company's share price has been relatively stable in fiscal 2013 fluctuating between $9.56 and $12.99 per share. If the Company fails to meet the expectations of securities analysts or investors, the Company's share price may decline.
Risks Related to the Company's Credit Facility: Under the Company's credit facility with TD Bank, N.A., the Company is required to comply with certain financial covenants. During fiscal 2013, the Company received a waiver of a covenant violation and an amendment of such covenant. While the Company believes that it will be able to comply with the financial covenants in future periods, its failure to do so would result in defaults under the credit facility unless the covenants are amended or waived. An event of default under the credit facility, if not waived, could prevent additional borrowing and could result in the acceleration of the Company's indebtedness. As of June 30, 2013 the Company was in compliance with all the covenants.
7
Risks Related to Information Systems: The efficient operation of the Company's business is dependent on its information systems, including its ability to operate them effectively and to successfully implement new technologies, systems, controls and adequate disaster recovery systems. In addition, the Company must protect the confidentiality of data of its business, employees, customers and other third parties. The failure of the Company's information systems to perform as designed or its failure to implement and operate them effectively could disrupt the Company's business or subject it to liability and thereby harm its profitability. The Company continues to enhance the applications contained in the Enterprise Resource Planning (ERP) system as well as improvements to other operating systems.
Risks Related to Litigation and Changes in Laws, Regulations and Accounting Rules: Various aspects of the Company's operations are subject to federal, state, local or foreign laws, rules and regulations, any of which may change from time to time. Generally accepted accounting principles may change from time to time, as well. In addition, the Company is regularly involved in various litigation matters that arise in the ordinary course of business. Litigation, regulatory developments and changes in accounting rules and principles could adversely affect the Company's business operations and financial performance.
Risks Related to New Regulations Regarding "Conflict Minerals": The Dodd-Frank Wall Street Reform and Consumer Protection Act contains regulations concerning the supply of certain minerals ("conflict minerals") originating from the Democratic Republic of Congo (DRC) and adjoining countries. As a result, in August 2012 the SEC adopted annual disclosure and reporting requirements for those companies who use "conflict minerals" mined from the DRC and adjoining countries in their products. These new requirements will require due diligence efforts in fiscal 2014, with initial disclosure requirements beginning in May 2014. There will be costs associated with complying with these disclosure requirements, including the costs of investigations to determine the sources of raw materials used in our products and the costs of any changes to products, processes or sources of supply as a consequence of the results of such investigations. The implementation of these rules could adversely affect the sourcing, supply and pricing of materials used in our products. As there may be only a limited number of suppliers offering "conflict free" "conflict minerals", we cannot be sure that we will be able to obtain necessary "conflict minerals" from such suppliers in sufficient quantities or at competitive prices. Also, we may face reputational challenges if we determine that certain of our products contain minerals not determined to be "conflict free" or if we are unable to sufficiently verify the origins for all "conflict minerals" used in our products through the procedures we may implement.
Item 1B – Unresolved Staff Comments
None.
Item 2 - Properties
The Company's principal plant and its corporate headquarters are located in Athol, MA on approximately 15 acres of Company-owned land. The plant consists of 25 buildings, mostly of brick construction of varying dates, with approximately 535,000 square feet.
The Company's Webber Gage Division in Cleveland, OH, owns and occupies two buildings totaling approximately 50,000 square feet.
The Company-owned facility in Mt. Airy, NC consists of one building totaling approximately 320,000 square feet. It is occupied by the Company's Saw Division, Ground Flat Stock Division and a distribution center. A separate 36,000 square foot building which formerly housed the distribution center was vacated in November 2008 and is currently listed for sale.
The Company's subsidiary in Itu, Brazil owns and occupies several buildings totaling 209,000 square feet.
The Company's subsidiary in Jedburgh, Scotland owns and occupies a 175,000 square foot building.
A wholly owned manufacturing subsidiary in The People's Republic of China leases a 133,000 square foot building in Suzhou. In fiscal 2012, the Company closed a 5,000 square foot Shanghai distribution center and sales office, consolidated the distribution into the Suzhou facility and leased a new sales office in Shanghai.
The Tru-Stone Division owns and occupies a 106,000 square foot facility in Waite Park, MN.
The Kinemetric Engineering Division occupies a 18,000 square foot leased facility in Laguna Hills, CA.
The Bytewise Division occupies a 10,000 square foot leased facility in Columbus, GA.
8
In addition, the Company operates warehouses and/or sales-support offices in the U.S., Canada, Australia, New Zealand, Mexico, Germany, Singapore and Japan.
In the Company's opinion, all of its property, plant and equipment are in good operating condition, well maintained and adequate for its current and foreseeable needs.
Item 3 - Legal Proceedings
In the ordinary course of business the Company is involved from time to time in litigation that is not considered material to its financial condition or operations.
Item 4 – Mine Safety Disclosures
Not applicable.
PART II
Item 5 - Market for the Company's Common Equity, Related Stockholder Matters and Issuer Purchases of Equity Securities
The Company's Class A common stock is traded on the New York Stock Exchange. Quarterly dividend and high/low closing market price information is presented in the table below. The Company's Class B common stock is generally nontransferable, except to lineal descendants of stockholders, and thus has no established trading market, but it can be converted into Class A common stock at any time. The Class B common stock was issued on October 5, 1988, and the Company has paid the same dividends thereon as have been paid on the Class A common stock since that date. On June 30, 2013, there were approximately 1,358 registered holders of Class A common stock and approximately 1,133 registered holders of Class B common stock.
Quarter Ended | Dividends | High | Low | |||||||||
September 2011 | $ | 0.10 | $ | 12.77 | $ | 10.28 | ||||||
December 2011 | 0.10 | 13.40 | 10.47 | |||||||||
March 2012 | 0.10 | 14.56 | 12.30 | |||||||||
June 2012 | 0.10 | 13.37 | 10.75 | |||||||||
September 2012 | 0.10 | 12.99 | 10.96 | |||||||||
December 2012 | 0.10 | 12.70 | 9.56 | |||||||||
March 2013 | 0.10 | 11.47 | 10.05 | |||||||||
June 2013 | 0.10 | 10.90 | 9.81 | |||||||||
The Company's dividend policy is subject to periodic review by the Board of Directors. Based upon economic conditions, the Board of Directors decided to maintain the quarterly dividend at $0.10 for all quarters of fiscal 2013.
There were no repurchases of shares in the fourth quarter of fiscal 2013.
PERFORMANCE GRAPH
The following graph sets forth information comparing the cumulative total return to holders of the Company's Class A common stock based on the market price of the Company's class A common stock over the last five fiscal years with (1) the cumulative total return of the Russell 2000 Index ("Russell 2000") and (2) a peer group index (the "Peer Group") reflecting the cumulative total returns of certain small cap manufacturing companies as described below. The peer group is comprised of the following companies: Acme United, Q.E.P. Co. Inc., Badger Meter, Federal Screw Works, National Presto Industries, Regal-Beloit Corp., Tecumseh Products Co., Tennant Company, The Eastern Company and WD-40.
9
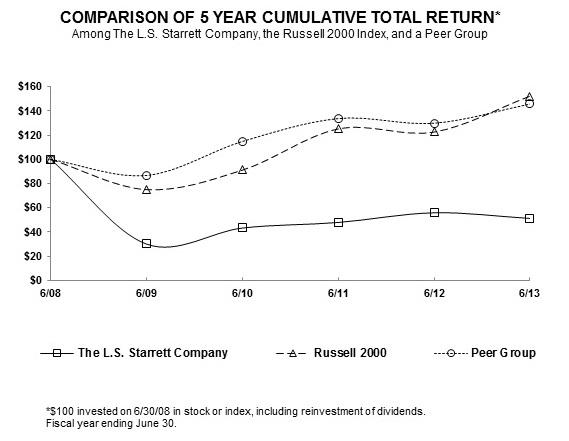
BASE | FY2009 | FY2010 | FY2011 | FY2012 | FY2013 | |||||||||||||||||||
STARRETT | 100.00 | 29.97 | 43.24 | 47.84 | 55.85 | 51.18 | ||||||||||||||||||
RUSSELL 2000 | 100.00 | 74.99 | 91.10 | 125.18 | 122.58 | 152.25 | ||||||||||||||||||
PEER GROUP | 100.00 | 86.72 | 114.81 | 133.74 | 129.91 | 145.72 | ||||||||||||||||||
Item 6 - Selected Financial Data
The following selected financial data have been derived from and should be read in conjunction with "Management Discussion and Analysis of Financial Condition and Results of Operations" and our Consolidated Financial Statements and notes thereto, included elsewhere in this Annual Report on Form 10-K.
Years ended June 30 (in $000s except per share data) | ||||||||||||||||||||
2013 | 2012 | 2011 | 2010 | 2009 | ||||||||||||||||
Net sales | $ | 243,797 | $ | 260,148 | $ | 244,841 | $ | 203,662 | $ | 203,659 | ||||||||||
Net earnings (loss) | (162 | ) | 888 | 6,845 | (8,021 | ) | (23,429 | ) | ||||||||||||
Basic earnings (loss) per share | (0.02 | ) | 0.13 | 1.02 | (1.20 | ) | (3.54 | ) | ||||||||||||
Diluted earnings (loss) per share | (0.02 | ) | 0.13 | 1.02 | (1.20 | ) | (3.54 | ) | ||||||||||||
Long-term debt | 24,252 | 29,387 | 721 | 706 | 1,264 | |||||||||||||||
Total assets | 230,794 | 252,166 | 227,179 | 200,134 | 194,241 | |||||||||||||||
Dividends per share | 0.40 | 0.40 | 0.32 | 0.30 | 0.48 | |||||||||||||||
10
Items 7 and 7A- Management's Discussion and Analysis of Financial Condition and Results of Operations and Quantitative and Qualitative Disclosure about Market Risk
RESULTS OF OPERATIONS
Fiscal 2013 Compared to Fiscal 2012
Overview
Starrett is a global manufacturing company with approximately one-half of consolidated net sales derived outside of North America, predominantly through multiple distribution channels. The Company is exposed to volatility in the markets that it serves. In North America, economic uncertainty and political turmoil dampened manufacturing investment which adversely impacted sales for capital equipment and discouraged our distribution network customers to stock inventory at historical levels. Internationally, sales declined due to a continued recession in the European economies and a significant exchange rate decline in the Brazilian Real against the U.S. dollar.
Net sales for fiscal 2013 declined $16.3 million or 6.3% compared to fiscal 2012, due principally to unfavorable foreign currency exchange rates. Gross margins declined $6.3 million from $78.1 million or 30.0 % of sales in fiscal 2012 to $71.8 million or 29.5% of sales in fiscal 2013 as the savings related to lower pension costs was offset by unfavorable foreign currency exchange rates, reduced sales and higher unabsorbed fixed manufacturing costs. Selling, general and administrative expenses decreased $6.8 million or 9% from $79.9 million in fiscal 2012 to $73.1 million in fiscal 2013 principally due to lower international expenses translated to U. S. dollars and reduced pension expense. Operating income (loss) improved $0.6 million from a loss of $1.9 million in fiscal 2012 to a loss of $1.3 million in fiscal 2013.
Net Sales
Net sales in North America declined $5.6 million or 4% from $129.1 million in fiscal 2012 to $123.5 million in fiscal 2013. The principal factors contributing to the drop in sales were a combined reduction in precision tools and custom granite of $7.8 million, which was partially offset by a $3.3 million increase due to a full year of operations for Bytewise. International sales decreased $10.7 million or 8% from $131.0 million in fiscal 2012 to $120.3 million in fiscal 2013. Foreign currency exchange rate fluctuations represented an unfavorable impact of $16.2 million, while Brazilian sales denominated in local currency increased 6% or $5.5 million.
Gross Margin
Gross margin in North America increased $3.1 million or 10% from $29.8 million in fiscal 2012 to $33.0 million in fiscal 2013 and improved as a percentage of sales from 23% in fiscal 2012 to 27% in fiscal 2013. The improvement was due to lower pension expenses which more than offset inventory production inefficiencies. International gross margins decreased $9.4 million or 20% from $48.3 million in fiscal 2012 to $38.8 million in fiscal 2013 with foreign exchange fluctuations representing $5.1 million or 55% of the shortfall. Reduced sales and manufacturing inefficiencies represented the remaining $4.3 million decrease.
Selling, General and Administrative Expenses
Selling, general and administrative expenses in North American decreased $4.1 million or 10%. Lower pension expense represented $3.0 million of the decrease, while reduced headcount and management bonuses accounted for the remaining $1.1 million in savings. International selling, general and administrative expenses decreased $2.7 million or 7.0% with a $4.3 million savings due to the stronger U. S. dollar offsetting higher employee benefit expenses.
Other Income, Net
Other income, net improved $0.2 million due to the Company's equity share in higher profits of a private software development company. Internationally, a $0.5 million settlement gain related to a lawsuit was offset by a $0.5 million decline in foreign exchange gains as compared to the prior year.
Income Taxes
The Company recorded tax expense of $1.0 million in fiscal 2013 which represented 120% of pre-tax income. The principal reasons the effective tax rate exceeded the U.S. normalized combined federal and state statutory tax rate of approximately 40% was due to losses in two foreign operations which did not receive any tax benefit because of the uncertainty of recovery in the future and a reduction in deferred state tax assets due to a change in the expected effective state tax rate.
11
There were no significant changes in valuation allowances relating to carryforwards for foreign NOL's, foreign tax credits and certain state NOL's. The Company continues to believe that it is more likely than not that it will be able to utilize its domestic federal net operating loss carryforward of approximately $20.0 million.
Fiscal 2012 Compared to Fiscal 2011
Overview
Solid revenue growth continued in fiscal 2012 as sales increased over a strong fiscal 2011. The Company was not immune to the financial volatility over the past twelve months. Lower long-term interest rates driven by Federal Reserve policy led to the discount rate falling to historic lows. As a result the Company recognized a significantly higher pension liability, and a $17.2 million non-cash pension expense, of which $15.2 million was recorded in the fourth quarter of fiscal 2012. The eight fold increase over normal pension expense negatively impacted gross margin and selling, general and administrative expenses and was the prime driver in a net loss in the fourth quarter and near breakeven results for the year. The Company closed its Dominican Republic facility in December 2011 and added advanced metrology technology through its acquisition of Bytewise in November 2011.
Net sales for fiscal 2012 increased $15.3 million or 6.3% compared to fiscal 2011 due to a recovering manufacturing sector and increased market penetration. Gross margins declined $3.7 million from $81.8 million or 33 % of sales in fiscal 2011 to $78.1million or 30% of sales in fiscal 2012. Selling, general and administrative expenses increased $9.2 million or 13% from $70.8 million in fiscal 2011 to $79.9 million in fiscal 2012. Operating income declined $14.3 million from a profit of $12.4 million in fiscal 2011 to a loss of $1.9 million in fiscal 2012. All of these changes, as more fully described below, were significantly affected by the pension expense noted above.
Net Sales
Net sales in North America increased $9.4 million or 8% from $119.7 million in fiscal 2011 to $129.1 million in fiscal 2012. All divisions, excluding Tru Stone, posted gains led by precision tools. The Bytewise acquisition represented $6.1 million of the gain. International sales increased $5.9 million or 5% from $125.1 million in fiscal 2011 to $131.0 million in fiscal 2012. Foreign currency exchange rate fluctuations represented a marginal unfavorable impact of $0.9 million.. All international subsidiaries achieved sales increases and account for over 50% of the Company's global revenues.
Gross Margin
Gross margin in North America decreased $5.4 million or 15% from $35.2 million in fiscal 2011 to $29.8 million in fiscal 2012 and declined as a percentage of sales from 29% in fiscal 2011 to 23% in fiscal 2012. Higher sales and improved efficiencies contributed $1.2 million and $6.8 million, respectively. However, these gains were offset by an increase in non-cash pension expense of $13.4 million. Higher production levels for precision tools and saws were the primary factor influencing the improvement in efficiencies coupled with the contribution of the newly acquired higher margin Bytewise business. International gross margins increased $1.7 million or 4% from $46.6 million in fiscal 2011 to $48.3 million in fiscal 2012 and remained level as a percentage of sales at 37% in both fiscal 2011 and 2012. Foreign exchange rate fluctuations represented an unfavorable charge of $0.3.million. Improvements in China were offset by declines in Europe.
Selling, General and Administrative Expenses
North American selling, general and administrative expenses increased $4.7 million or 13%. Employee benefits increased $4.7 million principally due to a $3.0 million increase in non-cash pension expense, all of which was related to a decrease in the discount rate used to measure the pension benefit obligation. Salaries and insurance expenses increased $0.4 and $0.2 million, respectively. International selling, general and administrative expenses increased $4.5 million or 13% due to a $0.8 million bad debt; a $0.6 million increase in research and development expenses; and increased selling expenses, particularly in South America, related to increased competition including: $0.6 for advertising and marketing, $0.4 million in commissions and $0.3 travel and entertainment. International salaries and benefits also increased $0.7 million.
Operating Loss
Higher sales and improved gross margins were more than offset by a $16.4 million increase in North American non-cash pension expense resulting in a $1.9 million operating loss. The discount rate used for valuing the pension liability declined from 5.44% as of June 30, 2011 to 3.92% as of June 30, 2012 and increased the pension liability by $21.0 million, which was the prime driver behind the increase in pension expense.
12
Other Income, Net
Other income, net increased $1.1 million from $0.8 in fiscal 2011 to $1.9 million in fiscal 2012 primarily due to foreign currency exchange rate changes.
Income Taxes
The effective tax rate was a benefit of 700% for fiscal 2012. The rate reflects federal, state and foreign adjustments for permanent book tax differences. The principal reason for the rate significantly greater than the US normalized combined federal and state tax rate of approximately 40% includes the very low book income which causes even small dollar adjustments to have a very large impact on the tax rate. One significant item which reduced tax expense is income earned in foreign countries taxed at rates lower than the US tax rate.
There were no significant changes in valuation allowances relating to carryforwards for foreign NOL's, foreign tax credits and certain state NOL's. The Company continues to believe that it is more likely than not that it will be able to utilize its domestic federal net operating loss carryforward of approximately $16.8 million.
FINANCIAL INSTRUMENT MARKET RISK
Market risk is the potential change in a financial instrument's value caused by fluctuations in interest and currency exchange rates, and equity and commodity prices. The Company's operating activities expose it to risks that are continually monitored, evaluated and managed. Proper management of these risks helps reduce the likelihood of earnings volatility.
The Company does not engage in tracking, market-making or other speculative activities in derivatives markets. The Company does not enter into long-term supply contracts with either fixed prices or quantities. The Company engages in an immaterial amount of hedging activity to minimize the impact of foreign currency fluctuations and had $1.0 million in forward currency contracts outstanding at June 30, 2013. Net foreign monetary assets are approximately $37.5 million as of June 30, 2013.
A 10% change in interest rates would not have a significant impact on the aggregate net fair value of the Company's interest rate sensitive financial instruments or the cash flows or future earnings associated with those financial instruments. A 10% increase in interest rates would not have a material impact on our borrowing costs. See Note 13 to the Consolidated Financial Statements for details concerning the Company's long-term debt outstanding of $24.3 million.
LIQUIDITY AND CAPITAL RESOURCES
Years ended June 30 ($000) | ||||||||||||
2013 | 2012 | 2011 | ||||||||||
Cash provided by operating activities | $ | 20,331 | $ | 3,524 | $ | 5,189 | ||||||
Cash used in investing activities | (9,476 | ) | (25,870 | ) | (10,141 | ) | ||||||
Cash provided by (used in) financing activities | (7,558 | ) | 20,050 | 3,860 | ||||||||
The Company has a working capital ratio of 5.6:1 as of June 30, 2013 as compared to 5.0:1 as of June 30, 2012. Cash, short-term investments, accounts receivable and inventories represent 91% and 90% of current assets in fiscal 2013 and fiscal 2012, respectively. The Company had accounts receivable turnover of 6 in fiscal 2013 compared to 6 in fiscal 2012 and an inventory turnover ratio of 2.7 in fiscal 2013 compared to 2.8 in fiscal 2012.
Net cash provided by operating activities of $20.3 million in fiscal 2013 is principally due to a reduction in inventory levels partially offset by a decline in operating performance.
The Company invested $9.5 million in fiscal 2013 with investments in plant and equipment representing $ 7.8 million and the remaining amount being attributable to the net increase in short-term investments.
The Company repaid $6.7 million of its long-term debt in fiscal 2013 accounting for most of its $7.6 million of cash used in financing activities. Effects of translation rate changes on cash primarily result from the movement of the U.S. dollar against the British Pound, the Euro and the Brazilian Real. The Company uses a limited number of forward contracts to hedge some of this activity and a natural hedge strategy of paying for foreign purchases in local currency when economically advantageous.
Liquidity and Credit Arrangements
The Company believes it maintains sufficient liquidity and has the resources to fund its operations in the near term. In addition to its cash and short-term investments, the Company has maintained a $23.0 million line of credit, of which $0.6 million is reserved for letters of credit and $11.9 million was outstanding as of June 30, 2013.
13
On June 30, 2009, the Company and certain subsidiaries entered into a Loan and Security Agreement (the "Credit Facility") with TD Bank, N.A.. The amended Credit Facility is scheduled to mature on April 30, 2015 and bears interest at LIBOR plus 1.50%.
The obligations under the Credit Facility are unsecured. However, in the event of certain triggering events, the obligations under the Credit Facility will become secured by the assets of the Company and the subsidiaries party to the Credit Facility. Triggering events are two consecutive quarters of failure to achieve the financial covenants outlined in Note 13 of the Notes to Consolidated Financial Statements.
Availability under the Credit Facility is subject to a borrowing base comprised of accounts receivable and inventory. The Company believes that the borrowing base will consistently produce availability under the Credit Facility in excess of $23.0 million. As of August 31, 2013, the Company had borrowings of $11.9 million under the line of credit.
The Credit Facility contains financial covenants with respect to leverage, tangible net worth, and interest coverage, and also contains customary affirmative and negative covenants, including limitations on indebtedness, liens, acquisitions, asset dispositions, and fundamental corporate changes, and certain customary events of default. Upon the occurrence and continuation of an event of default, the lender may terminate the revolving credit commitment and require immediate payment of the entire unpaid principal amount of the Credit Facility, accrued interest and all other obligations. As of June 30, 2013, the Company was in compliance with the financial covenants under the Credit Facility.
OFF-BALANCE SHEET ARRANGEMENTS
The Company does not have any material off-balance sheet arrangements as defined under the Securities and Exchange Commission rules.
CRITICAL ACCOUNTING POLICIES AND ESTIMATES
The preparation of financial statements and related disclosures in conformity with accounting principles generally accepted in the United States of America requires management to make judgments, assumptions and estimates that affect the amounts reported in the consolidated financial statements and accompanying notes. The second footnote to the Company's Consolidated Financial Statements describes the significant accounting policies and methods used in the preparation of the consolidated financial statements.
Judgments, assumptions, and estimates are used for, but not limited to, the allowance for doubtful accounts receivable and returned goods; inventory allowances; income tax reserves; long lived assets; goodwill; and employee turnover, discount and return rates used to calculate pension obligations.
Future events and their effects cannot be determined with absolute certainty. Therefore, the determination of estimates requires the exercise of judgment. Actual results inevitably will differ from those estimates, and such differences may be material to the Company's Consolidated Financial Statements. The following sections describe the Company's critical accounting policies.
Revenue Recognition and Accounts Receivable : Sales of merchandise and freight billed to customers are recognized when products are delivered, title and risk of loss has passed to the customer, no significant post-delivery obligations remain and collection of the resulting receivable is reasonably assured. Sales are net of provisions for cash discounts, returns, customer discounts (such as volume or trade discounts), cooperative advertising and other sales related discounts. Cooperative advertising payments made to customers are included as advertising expense in selling, general and administrative in the Consolidated Statements of Operations. While the Company does allow its customers the right to return in certain circumstances, revenue is not deferred, but rather a reserve for sales returns is provided based on experience, which historically has not been significant.
The allowance for doubtful accounts of $0.7 million and $1.0 million at the end of fiscal 2013 and 2012, respectively, is based on our assessment of the collectability of specific customer accounts and the aging of our accounts receivable. While the Company believes that the allowance for doubtful accounts is adequate, if there is a deterioration of a major customer's credit worthiness, actual write-offs are higher than our previous experience, or actual future returns do not reflect historical trends, the estimates of the recoverability of the amounts due the Company and net sales could be adversely affected.
Inventory Valuation : Inventory purchases and commitments are based upon future demand forecasts. If there is a sudden and significant decrease in demand for our products the Company may be required to increase the inventory reserve and, as a result, gross profit margin could be adversely affected.
Long-lived Assets and Goodwill : The Company accounts for property, plant and equipment (PP&E) at historical cost less accumulated depreciation. Impairment losses are recorded when indicators of impairment, such as plant closures, are present and the undiscounted cash flows estimated to be generated by those assets are less than the carrying amount. The Company continually reviews for such impairment and believes that PP&E is being carried at its appropriate value.
14
The Company assesses the fair value of its goodwill generally based upon a discounted cash flow methodology. The discounted cash flows are estimated utilizing various assumptions regarding future revenue and expenses, working capital, terminal value, and market discount rates. If the carrying amount of the goodwill is greater than the fair value, an impairment charge is recognized to the extent the recorded goodwill exceeds the implied fair value of goodwill.
The Company performed a qualitative analysis in accordance with ASU 2011-08 for its Bytewise reporting unit for its October 1, 2012 annual assessment of goodwill (commonly referred to as "Step Zero"). From a qualitative perspective, in evaluating whether it is more likely than not that the fair value of the reporting unit is not less than its carrying amount, relevant events and circumstances were taken into account, with greater weight assigned to events and circumstances that most affect the fair value of Bytewise or the carrying amounts of its assets. Items that were considered included, but were not limited to, the following: macroeconomic conditions, industry and market conditions, cost factors, overall financial performance, changes in management or key personnel, and other Bytewise specific events. After assessing these and other factors the Company determined that it was more likely than not that the fair value of the Bytewise reporting unit was not less than the carrying amount as of October 1, 2012.
Our long-lived assets consist primarily of property, plant and equipment. The Company groups long-lived assets for impairment analysis by division and/or product line. Long-lived assets are reviewed for impairment whenever events or changes in circumstances indicate the carrying amount of such an asset may not be recoverable. Such events or circumstances include, but are not limited to, a significant decrease in the fair value of the underlying business or change in utilization of property and equipment.
Recoverability of the net book value of property, plant and equipment is determined by comparison of the carrying amount to estimated future undiscounted net cash flows the assets are expected to generate. Those cash flows include an estimated terminal value based on a hypothetical sale at the end of the assets' depreciation period. Estimating these cash flows and terminal values requires management to make judgments about the growth in demand for our products, sustainability of gross margins, and our ability to achieve economies of scale. If assets are considered to be impaired, the impairment to be recognized is measured as the amount by which the carrying amount of the long-lived asset exceeds its fair value. No events or circumstances arose in fiscal 2013 which required management to perform an impairment analysis.
Depreciation is included in cost of goods sold or selling, general and administrative expenses in the Consolidated Statement of Operations based upon where the assets are contributing to the measurement of cost or expense by functional area. Depreciation of equipment used in the manufacturing process is a component of inventory and included in costs of goods sold. Depreciation of equipment used for office and administrative functions is an expense in selling, general and administrative expenses.
Income Taxes : Accounting for income taxes requires estimates of future benefits and tax liabilities. Due to temporary differences in the timing of recognition of items included in income for accounting and tax purposes, deferred tax assets or liabilities are recorded to reflect the impact arising from these differences on future tax payments. With respect to recorded tax assets, the Company assesses the likelihood that the asset will be realized. If realization is in doubt because of uncertainty regarding future profitability, the Company provides a valuation allowance related to the asset. Should any significant changes in the tax law or the estimate of the necessary valuation allowance occur, the Company would record the impact of the change, which could have a material effect on our financial position or results of operations.
Defined Benefit Pension Plans: The Company has two defined benefit pension plans, one for U.S. employees and another for U.K. employees.
In 2011, we elected to retrospectively change our method of recognizing certain actuarial gains and losses. Previously, the market related value of plan assets for the U.S. plan was equal to fair value, and the market-related value of plan assets for the U.K. plan, was based on a calculated five-year moving average of market value. Actuarial gains and losses were recognized in other comprehensive income as of the measurement date. Net actuarial gains or losses in excess of ten percent (10%) of the greater of the market-related value of plan assets or of the plans' projected benefit obligation ( the corridor ) were amortized in net periodic benefit cost over the average remaining service period (fourteen-years). The primary factors contributing to actuarial gains and losses are changes in the discount rate used to value pension obligations as of the measurement date each year and the differences between expected and actual returns on plan assets.
Under our current accounting method, both plans use fair value as the market-related value of plan assets and continue to recognize actuarial gains or losses within the corridor in other comprehensive income but instead of amortizing net actuarial gains or losses in excess of the corridor in future periods, excess gains and losses are recognized in net periodic benefit cost as of the plan measurement date, which is the same as the fiscal year end of the Company ( MTM adjustment ). This accounting method is a permitted option which results in immediate recognition of excess net actuarial gains and losses in net periodic benefit cost instead of in other comprehensive income. Immediate recognition in net periodic benefit cost could potentially increase the volatility of net periodic benefit cost. The MTM adjustments to net periodic benefit cost for 2013, 2012 and 2011 were $0.0, $15.3, and $0.0 million, respectively.
15
Calculation of pension and postretirement medical costs and obligations are dependent on actuarial assumptions. These assumptions include discount rates, healthcare cost trends, inflation, salary growth, long-term return on plan assets, employee turnover rates, retirement rates, mortality and other factors. These assumptions are made based on a combination of external market factors, actual historical experience, long-term trend analysis, and an analysis of the assumptions being used by other companies with similar plans. Significant differences in actual experience or significant changes in assumptions would affect pension and other postretirement benefit costs and obligations. See also Employee Benefit Plans (Note 12 to the Consolidated Financial Statements).
Cost of Goods Sold : The Company includes material direct and indirect labor and manufacturing overhead in cost of goods sold. Included in these costs are inbound freight, personnel (manufacturing plants only), receiving costs, internal transferring, employee benefits (including pension expense) and inspection costs.
Selling General and Administrative Expenses : The Company includes distribution expenses in selling, general and administrative expenses. Distribution expenses include shipping labor and warehousing costs associated with the storage of finished goods at each manufacturing facility. The Company also includes costs for our dedicated distribution centers as selling expenses. Employee benefits, including pension expense attributable to personnel not involved in the manufacturing process, are also included in selling, general and administrative expenses.
CONTRACTUAL OBLIGATIONS
The following table summarizes future estimated payment obligations by period.
Payments due by period (in millions) | ||||||||||||||||||||
Total | <1yr. | 1-3yrs. | 3-5yrs. | >5yrs. | ||||||||||||||||
Debt obligations | $ | 25.8 | $ | 1.6 | $ | 15.0 | $ | 3.1 | $ | 6.1 | ||||||||||
Capital lease obligations | 0.3 | 0.2 | 0.1 | - | - | |||||||||||||||
Operating lease obligations | 2.1 | 1.6 | 0.5 | - | - | |||||||||||||||
Purchase obligations | 11.1 | 10.8 | 0.2 | 0.1 | - | |||||||||||||||
Total | $ | 39.3 | $ | 14.2 | $ | 15.8 | $ | 3.2 | $ | 6.1 | ||||||||||
While our purchase obligations are generally cancellable without penalty, certain vendors charge cancellation fees or minimum restocking charges based on the nature of the product or service.
ANNUAL NYSE CEO CERTIFICATION AND SARBANES-OXLEY SECTION 302 CERTIFICATIONS
In fiscal 2013, the Company submitted an unqualified "Annual CEO Certification" to the New York Stock Exchange as required by Section 303A.12(a) of the New York Stock Exchange Listed Company Manual. Further, the Company is filing with the Securities and Exchange Commission the certifications required by Section 302 of the Sarbanes-Oxley Act of 2002 as exhibits to the Company's Annual Report on Form 10-K.
16
Item 8 - Financial Statements and Supplementary Data
Contents: |
| Page |
Report of Independent Registered Public Accounting Firm |
| 18 |
Consolidated Balance Sheets |
| 19 |
Consolidated Statements of Operations |
| 20 |
Consolidated Statements of Comprehensive Income (Loss) | 21 | |
Consolidated Statements of Stockholders' Equity |
| 22 |
Consolidated Statements of Cash Flows |
| 23 |
Notes to Consolidated Financial Statements |
| 24-43 |
17
REPORT OF INDEPENDENT REGISTERED PUBLIC ACCOUNTING FIRM
To the Board of Directors and Stockholders
The L.S. Starrett Company
We have audited the accompanying consolidated balance sheets of The L.S. Starrett Company and subsidiaries ("the Company") as of June 30, 2013 and 2012, and the related consolidated statements of operations, comprehensive income (loss), stockholders' equity and cash flows for each of the years in the three-year period ended June 30, 2013. Our audits of the basic consolidated financial statements included the financial statement schedule listed in the index appearing under Item 15 (2) of this Form 10-K. These financial statements and schedule are the responsibility of the Company's management. Our responsibility is to express an opinion on these financial statements and schedule based on our audits.
We conducted our audits in accordance with the standards of the Public Company Accounting Oversight Board (United States). Those standards require that we plan and perform the audit to obtain reasonable assurance about whether the financial statements are free of material misstatement. An audit includes examining, on a test basis, evidence supporting the amounts and disclosures in the financial statements. An audit also includes assessing the accounting principles used and significant estimates made by management, as well as evaluating the overall financial statement presentation. We believe that our audits provide a reasonable basis for our opinion.
In our opinion, the consolidated financial statements referred to above present fairly, in all material respects, the financial position of The L.S. Starrett Company and subsidiaries as of June 30, 2013 and 2012, and the results of their operations and their cash flows for each of the years in the three-year period ended June 30, 2013 in conformity with accounting principles generally accepted in the United States of America. Also, in our opinion, the related financial statement schedule, when considered in relation to the basic consolidated financial statements taken as a whole, presents fairly, in all material respects, the information set forth therein.
We also have audited, in accordance with the standards of the Public Company Accounting Oversight Board (United States), the Company's internal control over financial reporting as of June 30, 2013, based on criteria established in Internal Control-Integrated Framework issued by the Committee of Sponsoring Organizations of the Treadway Commission (COSO) in 1992 and our report dated September 5, 2013 expressed an unqualified opinion.
/s/ Grant Thornton LLP
Boston, Massachusetts
September 5, 2013