UNITED STATES
SECURITIES AND EXCHANGE COMMISSION
Washington, D.C. 20549
FORM 10-K
(Mark One)
| x | ANNUAL REPORT PURSUANT TO SECTION 13 OR 15(d) OF THE SECURITIES EXCHANGE ACT OF 1934 |
For the fiscal year ended February 2, 2013
or
| ¨ | TRANSITION REPORT PURSUANT TO SECTION 13 OR 15(d) OF THE SECURITIES EXCHANGE ACT OF 1934 |
For the transition period from to
Commission file number: 001-35720
RESTORATION HARDWARE HOLDINGS, INC.
(Exact name of registrant as specified in its charter)
| Delaware | 45-3052669 | |
(State or other jurisdiction of incorporation or organization) | (I.R.S. Employer Identification Number) | |
15 Koch Road, Suite J Corte Madera, CA (Address of principal executive offices) | 94925 (Zip Code) |
Registrant's telephone number, including area code: (415) 924-1005
Securities registered pursuant to Section 12(b) of the Act:
| Common Stock, $0.0001 par value | New York Stock Exchange, Inc. | |
| (Title of class) | (Name of each exchange on which registered) |
Securities registered pursuant to Section 12(g) of the Act: None
Indicate by check mark if the registrant is a well-known seasoned issuer, as defined in Rule 405 of the Securities Act. Yes ¨ No x
Indicate by check mark if the registrant is not required to file reports pursuant to Section 13 or Section 15(d) of the Act. Yes ¨ No x
Indicate by check mark whether the registrant (1) has filed all reports required to be filed by Section 13 or 15(d) of the Securities Exchange Act of 1934 during the preceding 12 months (or for such shorter period that the registrant was required to file such reports), and (2) has been subject to such filing requirements for the past 90 days. Yes x No ¨
Indicate by check mark whether the registrant has submitted electronically and posted on its corporate Web site, if any, every Interactive Data File required to be submitted and posted pursuant to Rule 405 of Regulation S-T (§232.405 of this chapter) during the preceding 12 months (or for such shorter period that the registrant was required to submit and post such files). Yes x No ¨
Indicate by check mark if disclosure of delinquent filers pursuant to Item 405 of Regulation S-K (§229.405 of this chapter) is not contained herein, and will not be contained, to the best of registrant's knowledge, in definitive proxy or information statements incorporated by reference in Part III of this Form 10-K or any amendment to this Form 10-K. x
Indicate by check mark whether the registrant is a large accelerated filer, an accelerated filer, a non-accelerated filer, or a smaller reporting company. See definitions of "large accelerated filer," "accelerated filer," and "smaller reporting company" in Rule 12b-2 of the Exchange Act. (Check one):
| Large accelerated filer | ¨ | Accelerated filer | ¨ | |||
| Non-accelerated filer | x (Do not check if a smaller reporting company) | Smaller reporting company | ¨ | |||
Indicate by check mark whether the registrant is a shell company (as defined in Rule 12b-2 of the Exchange Act). Yes ¨ No x
As of July 28, 2012, the last business day of the registrant's most recently completed second quarter, there was no established public market for the registrant's common stock. The registrant's common stock began trading on the New York Stock Exchange on November 2, 2012. As of February 2, 2013, the aggregate value of the registrants common stock held by non-affiliates was approximately $214.9 million, based on the number of shares held by non-affiliates as of February 2, 2013 and the closing price of the registrant's common stock on the New York Stock Exchange on February 2, 2013.
As of April 16, 2013, 38,108,092 shares of registrant's common stock were outstanding.
DOCUMENTS INCORPORATED BY REFERENCE
Portions of the registrant's Proxy Statement for its 2013 Annual Meeting of Stockholders are incorporated by reference in Part III of this Annual Report on Form 10-K where indicated. Such proxy statement will be filed with the Securities and Exchange Commission within 120 days of the registrant's fiscal year ended February 2, 2013.
RE STORATION HARDWARE HOLDINGS, INC.
INDEX TO FORM 10-K
Page | ||||||
| PART I. | ||||||
Item 1. | Business | 1 | ||||
Item 1A. | Risk Factors | 19 | ||||
Item 1B. | Unresolved Staff Comments | 41 | ||||
Item 2. | Properties | 41 | ||||
Item 3. | Legal Proceedings | 43 | ||||
Item 4. | Mine Safety Disclosures | 43 | ||||
| PART II. | ||||||
Item 5. | Market for Registrant's Common Equity, Related Stockholder Matters and Issuer Purchases of Equity Securities | 44 | ||||
Item 6. | Selected Consolidated Financial Data | 45 | ||||
Item 7. | Management's Discussion And Analysis of Financial Condition and Results of Operations | 51 | ||||
Item 7A. | Quantitative and Qualitative Disclosures About Market Risk | 76 | ||||
Item 8. | Financial Statements and Supplementary Data | 77 | ||||
Item 9. | Changes in and Disagreements with Accountants on Accounting and Financial Disclosure | 112 | ||||
Item 9A. | Controls and Procedures | 112 | ||||
Item 9B. | Other Information | 112 | ||||
| PART III. | ||||||
Item 10. | Directors, Executive Officers and Corporate Governance | 113 | ||||
Item 11. | Executive Compensation | 113 | ||||
Item 12. | Security Ownership of Certain Beneficial Owners and Management and Related Stockholder Matters | 113 | ||||
Item 13. | Certain Relationships and Related Transactions and Director Independence | 113 | ||||
Item 14. | Principal Accountant Fees and Services | 113 | ||||
| PART IV. | ||||||
Item 15. | Exhibits and Financial Statement Schedules | 114 | ||||
i
SPECIAL NOTE REGARDING FORWARD-LOOKING STATEMENTS AND MARKET DATA
This annual report contains forward-looking statements that are subject to risks and uncertainties. Forward-looking statements give our current expectations and projections relating to our financial condition, results of operations, plans, objectives, future performance and business. You can identify forward-looking statements by the fact that they do not relate strictly to historical or current facts. These statements may include words such as "anticipate," "estimate," "expect," "project," "plan," "intend," "believe," "may," "will," "should," "likely" and other words and terms of similar meaning in connection with any discussion of the timing or nature of future operating or financial performance or other events.
Forward-looking statements are subject to risk and uncertainties that may cause actual results to differ materially from those that we expected. We derive many of our forward-looking statements from our operating budgets and forecasts, which are based upon many detailed assumptions. While we believe that our assumptions are reasonable, we caution that it is very difficult to predict the impact of known factors and it is impossible for us to anticipate all factors that could affect our actual results. Important factors that could cause actual results to differ materially from our expectations, or cautionary statements, are disclosed in Item 1A - Risk Factors , Item 7 - Management's Discussion and Analysis of Financial Condition and Results of Operations , and elsewhere in this annual report. All forward-looking statements attributable to us, or persons acting on our behalf, are expressly qualified in their entirety by these cautionary statements, as well as other cautionary statements. You should evaluate all forward-looking statements made in this annual report in the context of these risks and uncertainties.
We cannot assure you that we will realize the results or developments we expect or anticipate or, even if substantially realized, that they will result in the consequences or affect us or our operations in the way we expect. The forward-looking statements included in this annual report are made only as of the date hereof. We undertake no obligation to publicly update or revise any forward-looking statement as a result of new information, future events or otherwise, except as otherwise required by law.
ii
PART I
| Item 1. | Business |
Overview
We believe RH is one of the most innovative and fastest growing luxury brands in the home furnishings marketplace. We believe our brand stands alone and is redefining this highly fragmented and growing market, contributing to our superior sales growth and market share gains over the past several years as compared to industry growth rates. Our ability to innovate, curate and integrate products, categories, services and businesses with a completely authentic and distinctive point of view, then rapidly scale them across our fully integrated multi-channel infrastructure is a powerful platform for continued long-term growth. We evolved our brand to become RH, positioning our Company to curate a lifestyle beyond the four walls of the home. Our unique product development, go-to-market and supply chain capabilities, together with our significant scale, enable us to offer a compelling combination of design, quality and value that we believe is unparalleled in the marketplace.
Our business is fully integrated across our multiple channels of distribution, consisting of our stores, catalogs and websites. As of February 2, 2013, we operated a total of 71 retail stores, consisting of 65 Galleries, 3 Full Line Design Galleries and 3 Baby & Child Galleries, as well as 13 outlet stores throughout the United States and Canada. In fiscal 2012, we distributed approximately 32.7 million Source Books, and our websites logged over 18.9 million unique visits.
Over the last several years, we have achieved strong growth in sales and profitability, as illustrated by the following:
| • | From fiscal 2010 to fiscal 2012, we increased our net revenues 54% to $1,193 million, our adjusted EBITDA 135% to $96.6 million and our adjusted EBITDA margin by 280 basis points to 8.1%. |
| • | From fiscal 2010 to fiscal 2012, we increased our adjusted net income by $34.7 million from $3.0 million to $37.7 million. Over the same time period, our GAAP net loss increased from $7.1 million to $12.8 million. |
| • | We have achieved 12 consecutive quarters of double-digit net revenue growth through our fiscal quarter ended February 2, 2013. We achieved this growth as we reduced our store base from 95 retail locations as of January 30, 2010 to 71 locations as of February 2, 2013. |
See "Selected Historical Consolidated Financial and Operating Data" for a discussion of adjusted EBITDA, and a reconciliation of adjusted EBITDA to net income (loss). See "Basis of Presentation and Results of Operations" within Item 7 - Management's Discussion and Analysis of Financial Condition and Results of Operations for a discussion of adjusted net income and a reconciliation of adjusted net income to net income (loss).
Our Competitive Strengths
We attribute our success to the following competitive strengths:
Our Market-Redefining Luxury Brand. We believe RH stands alone as a leading luxury brand of inspired design, and is redefining the highly fragmented home furnishings market. We provide dominant merchandise assortments across a growing number of categories and feature a highly differentiated style, presentation and customer experience. We believe that offering a compelling combination of design, quality and value enables us to remain relevant with our target customer and expand our reach. We believe we are changing the home furnishings landscape by attracting affluent consumers from designer showrooms and high-end boutiques with our compelling value proposition, as well as aspirational consumers trading up to our more sophisticated aesthetic relative to what can be found in department stores and other home furnishings retailers. We believe this has led to our superior sales growth and market share gains over the past several years as compared to industry growth rates. In a market characterized by smaller, independent competitors, we believe our luxury positioning, superior quality and significant scale enable us to grow our market share.
1
Our Unique Development Model. We believe our unique approach to the development of new products, categories and services enables us to gain market share, adapt our business to emerging trends, stay relevant with our customers and enter into new businesses that leverage our strengths. The foundation of our unique development model is:
| • | Innovation . We are dedicated to offering products and services that push established boundaries. We are driven to look beyond current business paradigms and best practices to create new paradigms and next practices. The scope of our innovation is demonstrated in every aspect of our organization, including in our products and services, our stores and presentation, our channel-agnostic go-to-market strategy and our fully integrated supply chain and systems infrastructure. |
| • | Curation . At our core we are not designers, rather we are curators and composers of inspired design and experiences. We travel the world in search of people, ideas, items, experiences and inspiration, and then create a composition that is unique and entirely our own. Through this journey of searching, discovering, re-imagining, curating and composing the ideas, items and experiences that we love, we create a completely unique and authentic expression in the marketplace. |
| • | Integration. Everything we curate and compose must be beautifully and intelligently integrated, enhancing the appeal of our offering and experience. This process involves both "art and science" as we integrate new products that enhance existing products, new categories that enhance existing categories and new services and businesses that enhance existing services and businesses, and as our supporting functions and infrastructure are integrated to achieve our goals. |
Our ability to innovate, curate and integrate products, categories, services and businesses, then rapidly scale them across our fully integrated multi-channel infrastructure is a powerful platform for continued long-term growth.
Our Superior Capabilities . Our product development and multi-channel go-to-market capabilities together with our fully integrated infrastructure and significant scale, enable us to offer a compelling combination of design, quality and value that we believe is unparalleled in the marketplace.
| • | Highly Differentiated Product Development Capabilities . We have architected a proprietary product development platform that is fully integrated from product ideation to presentation. We have established a cross-functional organization centered on product leadership, with teams that collaborate across our product development, sourcing, merchandising, inventory and creative functions. Our product development facility, the RH Center of Innovation & Product Leadership , supports and streamlines the entire product development process. We work closely with our network of artisan partners who possess specialized design and manufacturing capabilities and who we consider an extension of our product development team. Our product development platform and significant scale have enabled us to introduce an increasing number of new products with each collection and dramatically shorten our product lead times from 12 – 18 months to 3 – 9 months and reduce product costs, which allow us to offer greater value to our customers. |
| • | Multi-Channel Go-To-Market Ability. We pursue a market-based rather than a channel-based sales strategy and allocate resources by market to maximize our return on invested capital. Our strategy is to size our product assortments to the potential of the market and to size our stores to the potential of the area that each location serves. We leverage our direct channels to maximize reach, increase brand awareness and allow customers to access our complete product offering. Our channels are fully integrated and complement each other, with our stores acting as showrooms for our brand while our Source Books and our websites act as virtual extensions of our stores. Our stores allow our customers to experience our product collections in lifestyle settings and to consult with our highly qualified sales associates and interior designers to develop design solutions for their homes. We complement our stores with targeted catalog mailings, emails and apps for smartphones and tablets. In our stores, our sales associates use iPads and other devices to allow customers to shop our entire merchandise assortment while in the store. We believe that by offering a seamless experience across our stores and direct channels, we present a consistent brand image and inspire our customers to shop with us more |
2
often. This approach is designed to enhance our customer experience, generate greater sales, increase our market share and deliver higher returns on invested capital. |
| • | Fully Integrated Infrastructure. Our infrastructure is integrated across our multiple channels, providing three key advantages. First, we have strong direct sourcing capabilities and direct vendor relationships that contribute to shortened product lead times and reduced merchandise costs. Second, our inventory is centrally managed across our channels to drive working capital efficiency and optimize product availability. Third, our reconfigured distribution network and new order management, warehouse management and point-of-sale systems contribute to improved customer service levels, including shorter delivery times. Our systems platform has business intelligence reporting capabilities that provide multi-channel information which enable us to make timely and informed decisions across all aspects of our business. We believe our infrastructure provides us with a sophisticated operating platform and significant capabilities to support our future growth. |
Our High-Performance Culture and Team. We have built a high-performance organization driven by a company-wide commitment to our core values of People, Quality, Service and Innovation. The leadership team led by our Chief Executive Officer, Carlos Alberini, has significant expertise across all of our core functions, including brand management, product development, sourcing, supply chain, merchandising, finance and operations. Mr. Alberini is a highly respected financial and operational leader in the retail sector, having most recently served as President and Chief Operating Officer of Guess? from 2000 to 2010. Mr. Alberini is widely recognized in the industry for his role in helping to build Guess? into a leading global brand and business. We also benefit from the vision and advice of Gary Friedman, who serves as our Chairman Emeritus, Creator and Curator. With over 24 years of experience in executive roles in the specialty home industry, Mr. Friedman is recognized as a creative force and design leader. We believe our high-performance culture and team are key drivers of our success and position us well to execute our long-term growth strategy.
Our Growth Strategy
Key elements of our growth strategy are to:
Transform Our Real Estate Platform. We believe we have an opportunity to significantly increase our sales by transforming our real estate platform from our existing retail footprint to a portfolio focused on Full Line Design Galleries. Our Full Line Design Galleries are sized based on the market potential and the size of our assortment. As of February 2, 2013, we had three Full Line Design Galleries that averaged approximately 21,800 selling square feet, more than three times the size of our average Gallery. Our Full Line Design Galleries allow consumers to experience a broader merchandise assortment in a highly differentiated retail setting. We have found that we experience higher sales across all of our channels when we showcase more of our assortment. We have identified approximately 50 key metropolitan markets where we can open new Full Line Design Galleries in iconic or high profile locations that are representative of our luxury brand positioning. We believe, based on our analysis of the market, that we have the opportunity to more than double our current selling square footage in the United States and Canada over the next 5 to 10 years as we transform our real estate platform by opening Full Line Design Galleries in these 50 identified markets.
We opened our first three Full Line Design Galleries in Los Angeles in June 2011, Houston in November 2011 and Scottsdale in November 2012. In the Los Angeles and Houston markets, store demand increased by approximately 90% and 60%, respectively, and direct demand increased by approximately 30% and 45%, respectively, in the first full year of operations of those Full Line Design Galleries. In the Scottsdale market, we experienced an approximate 80% increase in store demand and an approximate 75% increase in direct demand during the months from the store's opening in November 2012 through the end of fiscal 2012. In April 2013 we opened our fourth Full Line Design Gallery in Boston. We plan to open new Full Line Design Galleries in Indianapolis, Greenwich and Atlanta. In addition, we have identified locations, and are in active lease discussions, in approximately 20 markets including New York City, Chicago, Miami, Denver, Dallas and San Diego.
3
Expand Our Offering and Increase Our Market Share. We participate in the domestic housewares and home furnishings market, that based on our research we believe represented $143 billion in sales in 2010. Our annual net revenues currently represent less than 1% of this market, and we believe we have a significant opportunity to increase our market share as more customers are exposed to our growing merchandise assortment and as introductions of new products and services inspire current and new customers to add to their collections. We believe our dominant assortments and continued expansion of product categories enable us to change the highly fragmented luxury home furnishings landscape and grow our market share. We apply our unique design aesthetic and superior product development capabilities to bring a fresh and differentiated perspective to existing and new product categories, new services and new businesses:
| • | Increase Product Categories and Assortments . Over the past few years we have successfully expanded our offering across our categories. We have continued this strong level of innovation with a number of initiatives, including in: (i) indoor and outdoor furniture, where we continued to broaden our assortments in upholstery, dining and occasional, as well as introduced new finishes in our living, dining and bedroom collections; (ii) rugs, where we continued to significantly enhance our collection developed by Ben Soleimani of Mansour Rug, a 4th generation family-owned rug business known for its innovative designs; (iii) lighting, where we significantly expanded our assortment; and (iv) baby and child products, where we continued to expand our assortments in furniture, textiles and décor. We also introduced our collection of smaller living space furnishings, and custom window shades and blinds. |
We are continuing to introduce select new product categories where we can offer a dominant merchandise assortment consistent with our brand positioning in other product categories. We recently launched two new collections through distinct Source Books: Tableware, our collection of dinnerware, flatware and table linens, and Objects of Curiosity, our collection of unique decorative accessories and objects for the home.
We have a successful record of new category introductions, including Outdoor in Spring 2006, Baby & Child in Spring 2008, Outdoor & Garden in Spring 2010 and Small Spaces in Spring 2012. Historically, once a category is tested and proven in our direct business, we selectively roll out an edited collection of the products in our stores. We believe this approach allows us to efficiently launch categories in a disciplined, expeditious and cost-effective manner. For example, our Garden collection took seven months from concept to introduction, with minimal additional resources required to launch.
| • | Expand Services. We plan to provide our customers with a growing range of services designed to enhance the customer experience and optimize sales. We have introduced interior design services, providing our customers with complimentary in-store and in-home design consultations. As of February 2, 2013, we had 39 interior designers in 25 locations, and plan to expand this program. Based on the results achieved to date, we believe that our interior design team will contribute to increased sales as they assist, inspire and influence customers in the manner in which they envision their homes. In addition, an expanded portion of our product offering can be customized to meet individual preferences, including different choices of materials, fabrics and finishes. We are also enhancing our existing registry services and believe that a significant opportunity exists to expand and improve our bridal and gift registry businesses with the expansion of our Baby & Child offering and our introduction of Tableware and Objects of Curiosity. |
| • | Enter New Businesses. We believe we have the ability to leverage our defining strengths of taste, style and innovation across multiple businesses, which can enhance brand awareness, reinforce our lifestyle positioning and enrich the customer experience. We plan to explore and test from time to time new business opportunities complementary to our core business which can capitalize on our unique development model. For example, in 2013 we plan to launch our Contemporary Art business, with our first freestanding art gallery in the Chelsea Arts District in New York, as well as an e-commerce platform. We believe we can scale new businesses rapidly, leveraging our fully integrated multi-channel infrastructure and providing a powerful platform for continued long-term growth. |
4
Increase Brand Awareness. We will continue to increase our brand awareness and customer loyalty through our real estate transformation, our circulation strategy, our digital marketing initiatives and our advertising and public relations efforts.
| • | Real Estate Positioning . Our stores are a critical branding vehicle. We believe the transformation of our real estate platform from a mall-based retail footprint to a portfolio focused on Full Line Design Galleries will contribute to increased brand awareness as our customers experience an enhanced expression of our luxury brand positioning. |
| • | Circulation Strategy . Our catalogs are also an important branding and advertising vehicle. We have found that when we display a greater merchandise assortment in our catalogs, we experience increased sales across all of our channels. Since Spring 2011, we have pursued our Source Book strategy, whereby we distribute to a higher number of households dominant catalogs that feature expanded page counts and present over 80% of our product assortment at the time of publication. This strategy contributed to an 81% increase in the number of catalog pages circulated and a 30% increase in net revenues for our direct business in fiscal 2012. |
| • | Digital Initiatives . We are investing in enhanced marketing initiatives for our e-commerce business, which we believe will result in greater website traffic and sales. Our websites display our most comprehensive product assortment and serve as critical tools for introducing and testing new products. We are continually enhancing the navigation and presentation features of our websites, which enable our customers to develop design solutions for themselves. In order to increase traffic to our websites, we have increased our email marketing efforts and have introduced apps for smartphones and tablets, which provide an additional means for our customers to browse our growing product assortment. |
| • | Advertising and Public Relations Efforts . We proactively market our brand through public relations and print advertisements in brand relevant publications such as Architectural Digest , Vanity Fair , Elle Décor , House Beautiful , Veranda, Town and Country and DuJour . In addition, we plan to continue to host in-store events related to new store openings and product launches. We believe that increased brand awareness will drive higher sales in our stores and our direct business over time. |
Pursue International Expansion. We plan to strategically expand our business into select countries outside of the United States and Canada over the next several years. We believe that our luxury brand positioning and unique aesthetic will have strong international appeal. We expanded into the Canadian market in 1998 and successfully built our presence into a multi-channel business featuring five retail locations and in-market catalog and online capabilities. We intend to leverage this experience as we expand our business internationally.
Increase Operating Margins. We have the opportunity to continue to improve our operating margins by leveraging our fixed occupancy costs and scalable infrastructure. We believe that our real estate transformation will allow us to better leverage our fixed occupancy costs by consolidating multiple Galleries into single Full Line Design Galleries, opening in locations that tend to have lower lease costs per square foot and reducing non-selling backroom space. Our Full Line Design Galleries are architected to offer more compelling unit economics by increasing the selling square footage devoted to our retail assortment and utilizing non-traditional selling space such as rooftops and garden courtyards, which carry much lower occupancy costs than the typical retail space. In addition, because our Full Line Design Galleries are destinations for customers, we believe that they will allow us to improve margins by obtaining more favorable lease arrangements with landlords. We have a well-developed, scalable infrastructure that is positioned to support our revenue growth without a proportionate increase in operating expenses. We also believe that our margins can further benefit over time from the introduction of new, higher-margin product categories, reduced product costs based on greater volumes with our vendors, and opportunities to optimize our shipping expenses.
5
Our High-Performance Culture
We believe that to know our Company, you have to know our culture and our values. We are a team of people who believe we can change the world. We believe in our ability to create an endless reflection of hope, inspiration, passion and love that will ignite the human spirit and transcend our existence.
Our culture is driven by our management team, which instills a company-wide commitment to our core values. Every leader in our Company participates in a training program annually and signs our Leadership Contract, a commitment to model and teach our values. We believe our distinct corporate culture allows us to attract highly talented team members who are passionate and driven and who share our vision. Our Company's core values are:
| • | People -We believe the "right" people are our greatest asset. We value people with high energy, who possess the ability to energize others. People who are smart, creative and have a point of view. People who see the answer in every problem, versus those who see the problem in every answer. People who are driven, determined and won't take "no" for an answer. We value team players, people who are more concerned with what is right, rather than who is right. |
| • | Quality -Quality starts with our people and should be visible in every aspect of our Company. From our people to our products, to our service and our standards, from the way we communicate to our commitment to educate. From the accuracy and efficiency in our distribution facilities, to the marketing and presentation of our products in our stores, catalogs and websites. Being committed to quality means being able to see it in every detail of our organization. |
| • | Service -We believe that service starts inside the organization and embrace a concept called "People First." Simply put, it means "if we expect our people to deliver first class service to our customers, we must first deliver first class service to our people." It is everyone's responsibility to remove the obstacles and provide support so our associates throughout the organization are empowered to "Do the right thing." Our people smile when we smile, our people serve our customers when we serve our people. |
| • | Innovation -We value innovation, taking risks and boldly going where no company has gone before. We believe you're either striving to get better, or allowing yourself to get worse, there is no such thing as staying the same. The power of innovation comes from leveraging the creative minds and spirit of all our people at all levels of the organization. We strive to build an environment that encourages people to challenge, ask "why?" and "why not?" We embrace those people who have the courage to put forth new ideas and breathe new life into our Company. Innovation is at the core of what we do. |
Evolution of Our Business
In 2001, we began to reposition Restoration Hardware from a nostalgic, discovery-items business to a leading home furnishings brand. In 2008, we were taken private by investment funds affiliated with Catterton, Tower Three and Glenhill. Our strategic plan at the time of the going private transaction required significant investments in infrastructure to develop our distribution center in West Jefferson, Ohio and other initiatives to improve our merchandise delivery capabilities. As part of the going private process, we received access to additional equity capital from our investors and as a result we were able to accelerate the transformation of our business and brand and the development of our multi-channel business model and infrastructure. Over the last twelve years, we have built a new company through the following initiatives:
| • | Elevated Our Brand Positioning -We significantly enhanced the quality and design of our merchandise, elevating our brand to a luxury positioning. We believe this strategy, along with our compelling combination of design, quality and value, have allowed us to change the highly fragmented home furnishings landscape and position us to grow our market share. |
| • | Enhanced Our Product Development Process -We established a collaborative organization with cross-functional teams in product development, sourcing, merchandising, inventory and creative, all focused |
6
on product leadership. We built the RH Center of Innovation & Product Leadership, a facility which supports and streamlines the entire product development process. In addition, we have developed direct sourcing relationships with our artisan partners. The transformation of our creative process has dramatically shortened our typical product lead times, reduced our product costs and enhanced our ability to successfully introduce new categories. |
| • | Refined Our Go-To-Market Strategy -We aligned our organization and the way in which we approach the consumer to pursue a market-based rather than channel-based sales strategy across our stores and direct channels. Our strategy is to size our product assortments to the potential of the market and to size our stores to the potential of the area that each location serves. We believe this approach enables us to strategically deploy our resources by market to maximize return on invested capital. In order to expose more customers to a broader product assortment we use our Source Books and websites as virtual extensions of our stores. In Spring 2011, we introduced our new Source Book large catalog format that displays a greater percentage of our product assortment, which we believe is continuing to increase sales across all of our channels because customers respond to the assortments that we emphasize and feature prominently both in our catalogs and in our stores. |
| • | Reconceptualized Our Stores and Developed Full Line Design Gallery Format -In 2009 and 2010, we remodeled substantially all of our existing retail stores into our Gallery format that reconceptualizes the store experience by presenting our products in sophisticated lifestyle settings. We experienced enhanced productivity and profitability as a result of our Gallery conversions. In 2011, we developed our Full Line Design Gallery format. This format is architected to offer more compelling unit economics by increasing the selling square footage devoted to our retail assortment and utilizing non-traditional selling space such as rooftops and garden courtyards, which carry much lower occupancy costs than the typical retail space. |
| • | Built a New Supply Chain and Systems Infrastructure -We invested over $60 million from fiscal 2006 to fiscal 2010 in our supply chain and systems infrastructure, including: (i) reconfiguring and adding to our distribution network; (ii) implementing new point-of-sale, warehouse management, order management and customer service systems; and (iii) enhancing our direct sourcing capabilities. |
| • | Strengthened Our Management Team -We strengthened our management team by adding Mr. Alberini to our team as well as other senior leaders in merchandising, product development, finance, information technology and inventory planning who bring extensive experience in their respective fields. |
We believe these initiatives have contributed to our recent strong performance and increased profitability, and position us for sustained growth and profitability. The following chart illustrates some of the principal aspects of the transformation of the old Restoration Hardware to the new RH:
Old Restoration Hardware | New RH | |||
| Merchandise Strategy | Nostalgic, discovery items | Category dominance, integrated lifestyle presentation | ||
| Product Development | Internally designed and developed (12 – 18 months lead time) | Externally discovered and curated (3 – 9 months lead time) | ||
| Go-to-Market Strategy | Conventional channel-focused marketing | Fully integrated market-based, multi-channel strategy | ||
| Retail Strategy | Multiple small locations in a given market showcasing narrow and redundant assortment | Consolidated markets, generally featuring larger locations showcasing broader assortment | ||
7
Old Restoration Hardware | New RH | |||
| Direct Strategy | 84-page catalog; limited mailing list; nascent e-commerce platform | Over 1,600 pages across our Interiors, Outdoor, Baby & Child, Objects of Curiosity, Small Spaces and Tableware Source Books; broader mailing list; established e-commerce platform | ||
| Sourcing | Traditional agent buying structure | Highly collaborative direct vendor relationships | ||
| Supply Chain & Systems | Channel-specific architecture | Fully integrated multi-channel platform | ||
Our Market
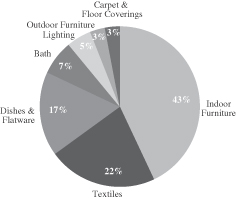
We participate in the large and growing domestic housewares and home furnishings market. Based on our research, we believe this market generated $143 billion in retail sales in 2010 and is projected to grow at a compound annual growth rate of 3% – 4% between 2011 and 2015. Our annual net revenues currently represent less than 1% of this market, providing us with a substantial opportunity to gain market share. We believe the seven major categories in the housewares and home furnishings market are the following: indoor furniture, textiles, dishes and flatware, bath, lighting, outdoor furniture, and carpets and floor coverings. Based on our research, we believe that indoor furniture represented the largest percentage of the market in 2010 at 43%, or $62 billion in total sales, and textiles represented the second largest segment. We believe that our dominant merchandise assortments and differentiated product designs in these key categories will enable us to increase our market share.
According to Euromonitor International, a market research and analysis firm, the U.S. housewares and home furnishings market is highly fragmented. The top 20 companies comprised only 20% of the total market in 2008, with the largest player representing less than 3% of the total market. As a result of the weakening housing market and economic downturn in 2007, many home furnishings retailers were forced to close stores, dramatically scale back operations or lower prices. Companies such as Bombay Company, Smith & Hawken, Linens ‘n Things, Z Gallerie and Levitz declared bankruptcy or liquidated, while many others were weakened. While our sales results were also adversely affected during this period, this disruption also created an opportunity for us to differentiate our brand in the marketplace. We believe we are well positioned to gain market share in the current competitive environment as a result of our compelling combination of design, quality and value.
We target households with incomes of $200,000 and higher, which we believe drive a disproportionate share of spending in the home furnishings market. We believe that these consumers are highly attractive as they tend to be less impacted by an economic downturn and return to spending more quickly in an economic recovery.
8
Our Products
We are merchants of luxury home furnishings offering collections of timeless, updated classics and reproductions. We operate as a curator of products that we regard as the finest historical design. Our luxury products embody our design aesthetic and reflect inspiration from across the centuries and around the globe. Our objective is to position RH as a lifestyle brand and design authority by offering dominant merchandise assortments across a growing number of categories, including furniture, lighting, textiles, bathware, décor, outdoor, garden, and baby and child products.
The following is a description of our primary product categories:
Category | Select Products Offered | Select Product Highlights | ||
| Furniture | • Bedroom • Dining • Upholstery • Home Office • Media • Cabinets | Our bedroom collections reflect classical 18th and 19th century designs with handcrafted artisan details and fine English construction in styles such as the St. James, French Empire, Maison and Rosette. Our dining room collections use architecturally inspired new and salvaged wood in both classic and contemporary designs and include the Russian Oak, Trestle and Farmhouse collections. Our home office products include vintage and industrial-inspired desks, seating and storage solutions reconceived for the home office, including the Aviator Wing Desk, inspired by World War II fighter planes and the Mayfair Steamer Secretary Trunk, created in collaboration with antiques dealer and furniture maker Timothy Oulton of London, England. For Spring 2013, we collaborated with artisans Luay Al-Rawi and Victoria Sala to introduce a new line of aged wood dining and occasional tables. In addition, we added distressed white and antique taupe finishes to many of our wooden furnishings, to complement the natural, brown and ebony finishes we currently carry. | ||
| Lighting | • Ceiling • Table • Floor • Wall • Outdoor | Our lighting designs and reproductions draw from architectural and historical pieces. In Spring 2013, we introduced the Vaille crystal and chain chandelier as well as the 19th century French Empire chain chandelier. We carry a comprehensive assortment of floor, table, wall and ceiling lighting. | ||
| Textiles | • Bed Linens • Bath Linens • Drapery • Rugs • Pillows & Throws | We offer fine Italian bedding, which includes our signature Italian hotel collection, designed in close partnership with Carlo Bertelli, a proprietor of a Florentine atelier recognized for luxurious Italian linen. Our bath linens use fine 100% Turkish cotton terry cloth with meticulous hand sewn detail, and are sourced in partnership with Haluk Eke of Turkey. Our drapes are made of high quality fabrics that include Libeco Lagae Belgian linen, Thai Silk and vintage velvet. We have further expanded our rug collections in Fall 2012 based on the successful introduction in Fall 2011 of rugs designed by Ben Soleimani of Mansour Rug. In Fall 2012, we introduced an exclusive line of custom roman shades and wood blinds with our partner The Shade Store, and a bespoke garment-dyed bed linen assortment designed by Matthew Lenoci. | ||
9
Category | Select Products Offered | Select Product Highlights | ||
| Bathware | • Faucets • Hardware • Furniture • Sinks | Our bath faucets are made from drop forged brass and available in several finishes. Our fittings are German-made and feature drip-free valves. Our furniture and sink collections reflect classic designs and are made of fine materials. In Spring 2013, we added distressed white and antique taupe to our wood bath furniture collections in addition to our natural, coffee and ebony finishes. | ||
| Décor | • Decorative Accessories • Home Accessories • Wall Art • Gifts | Our décor assortment is centered around beautiful accents for the home in objects, frames, candlelight and wall art. Our holiday assortment features vintage inspired ornaments and carefully curated gifts. In Spring 2013, we introduced our 128 page Objects of Curiosity Source Book, partnering with talented artisans around the globe to showcase our collection of unique decorative accessories and objects for the home. | ||
| Tableware | • Dinnerware • Serveware • Glassware • Flatware • Entertaining • Table Linens | We debuted our Tableware collection in Spring 2013 with an 80 page Source Book. This collection features plates in round, square and coupe shapes made of authentic Chinese porcelain, presented in four translucent colored glazes. In addition, we are offering English silver from Sheffield, German Crystal stemware from Riedel, washed Belgian linens in 20 colors, and horn and bone flatware. We plan on showcasing our Tableware assortment in our stores later this year. | ||
| Outdoor & Garden | • Furniture • Textiles • Lighting • Accessories • Fire • Shade | We carry 30 collections of outdoor furniture that feature teak, metal and all-weather wicker available in custom finishes. We partner with Perennials and Sunbrella to create a collection of outdoor fabrics for our cushions and umbrellas. In Spring 2013, we partnered with Copenhagen designer Søren Rose to introduce the Aspen furniture collection made from French oak timbers. Our Garden collection is focused on completing the outdoor space with statuary, fire tables, garden structures, containers and lanterns. | ||
| Baby & Child | • Furniture • Bedding • Window Coverings • Flooring • Lighting • Décor | We developed Baby & Child as an extension of our brand, offering the same level of quality and design for children's furnishings as we offer for the rest of the home. We offer core categories for both nurseries and children's rooms. Our furniture collections are inspired by 18th and 19th century European designs, vintage industrial styles and French antiques, all built with the same level of quality as our home brand. Within textiles, we offer European bedding, Turkish towels, high-quality lined drapery, roman shades, and wool rugs. Our accessories include wall décor, storage solutions and playroom accents, inspired by vintage finds, industrial design and classic style and function. | ||
We are in the process of expanding the following existing categories: (i) indoor and outdoor furniture, where we continue to broaden our assortments in upholstery, dining and occasional, as well as introduced new finishes in our living, dining and bedroom collections; (ii) rugs, where we continue to significantly enhance our collection developed by Ben Soleimani of Mansour Rug, a 4th generation, family rug business known for its innovative
10
designs; (iii) lighting, where we have significantly expanded our assortment; and (iv) baby and child products, where we continue to expand our assortments in furniture, textiles and décor. We have also introduced our collection of smaller living space furnishings, and custom window shades and blinds.
We are continuing to introduce select new product categories where we can offer a dominant merchandise assortment consistent with our brand positioning in other product categories. We recently launched two new collections through distinct Source Books: Tableware, our collection of dinnerware, flatware and table linens, and Objects of Curiosity, our collection of unique decorative accessories and objects for the home.
We have a successful record in introducing complementary product categories, including Outdoor in Spring 2006, Baby & Child in Spring 2008, Garden in Spring 2010 and Small Spaces in Spring 2012. Each of these new product categories was introduced as a new, standalone catalog. Historically, once a category is tested and proven in our direct business, we selectively roll out an edited collection of the products in our stores. We believe this approach allows us to efficiently launch categories in a disciplined, expeditious and cost-effective manner. For example, our Garden collection took seven months from concept to introduction, with minimal additional resources required to launch.
Product Development
Over the past several years we have architected a proprietary product development platform that is fully integrated from ideation to presentation. We have streamlined our product development organization and process to shorten product lead times and enhance our ability to introduce more new products with each collection. We believe that our new product development organization, process and facility allow us to deliver home furnishings with a compelling combination of design, quality and value. Key aspects are:
| • | Organization -We have established a collaborative, cross-functional organization centered on product leadership and coordinated across our product development, sourcing, merchandising, inventory and creative teams. Our product teams are focused on maximizing the sales potential of each product category across all channels, which eliminates the channel conflicts and functional redundancies often found in other retail organizations. |
| • | Process -For many of our products, we work closely with our network of artisan partners who possess specialized product development and manufacturing capabilities and who we consider an extension of our product development team. We collaborate with our global network of specialty vendors and manufacturers to produce artisanal pieces on a large scale with a high level of quality and value, including both distinctive original designs and reinterpretations of antiques. |
| • | Facility -We have built the RH Center of Innovation and Product Leadership , a facility which supports the entire product development process, from product ideation to presentation for all channels. |
As a result of our proprietary organization, process and facility, we have shortened our typical product lead times from 12 – 18 months to 3 – 9 months and enhanced our ability to introduce more new products with each collection. In addition, our product development platform, sourcing capabilities and significant scale have enabled us to reduce our product costs, which allows us to offer greater value to our customers.
Sales Channels
We distribute our products through a fully integrated sales platform comprised of our stores, catalogs and websites. We believe the level of integration among all of our channels and our approach to the market distinguishes us from most other retailers. For fiscal 2012, sales of products originating in our stores represented 54% of our net revenues, while sales from our direct business represented 46% of our net revenues. We believe our channels complement each other and our customers' buying decisions are influenced by their experiences across more than one of our sales channels. We encourage our customers to shop across our channels and have
11
aligned our business and internal organization to be channel agnostic. Our integrated distribution and product delivery network serves all of our channels.
We believe the key advantage of our multiple sales channels is our ability to leverage the unique attributes of each channel in our approach to the market. Our catalog mailings serve as a key driver of sales through both our websites and retail stores. Through our Source Book strategy, we have expanded the page count and circulation of our catalogs to expose more customers to a broader product assortment. Our customers respond to the Source Books across all of our channels, with sales trends closely correlating to the assortments that we emphasize and feature prominently both in our Source Books and in our stores. Our retail stores reinforce our luxury brand aesthetic and showcase product collections in lifestyle settings consistent with the presentation in our direct channels. In addition, our store associates use iPads and other devices to allow customers to shop our entire merchandise assortment while in the store.
We maintain a database of customer information, which include sales patterns, detailed purchasing information, certain demographic information, geographic locations and email addresses of our customers. As of February 2, 2013, our customer database contained 14.0 million names. This database supports our ability to analyze our customers' buying behaviors across sales channels and facilitates the development of targeted marketing strategies. We segment our customer files based on multiple variables, and we tailor our catalog mailings and emails in response to the purchasing patterns and product needs of our customers. We focus on continually improving the segmentation of customer files and the expansion of our customer database.
In addition to our core channels, we are also expanding into professional services channels, including Trade and Contract. In the Trade channel, we work directly with independent interior designers purchasing for their businesses. Separately, we sell directly to customers who make purchases with the assistance of their own interior designers or decorators, which we refer to as "designer-assisted sales." We are also expanding our Contract business, which services hospitality, real estate development, and other business clients. These channels offer additional avenues for reaching new customers, including both businesses and individuals. We believe there is substantial opportunity for us to grow these businesses.
Stores
Retail Stores
As of February 2, 2013, we operated a total of 71 retail stores throughout the United States and Canada, consisting of 65 Galleries, 3 Full Line Design Galleries and 3 Baby & Child Galleries. Our retail stores are located primarily in upscale malls and street locations. We believe situating our stores in desirable locations with high visibility is critical to the success of our business, and we identify store locations based on several store specific aspects including geographic location, demographics, and proximity to other high-end specialty retail stores. We pursue a market based sales strategy, whereby we assess each market's overall sales potential and how best to approach the market across all of our channels. We customize square footage and catalog circulation to maximize each market's sales potential and increase our return on invested capital.
We operate three distinct store types: (1) our Full Line Design Gallery format, which, as of February 2, 2013, averaged approximately 21,800 selling square feet, (2) our Gallery format, which, as of February 2, 2013, averaged approximately 6,800 selling square feet, and (3) our Baby & Child Gallery format. We are transforming our real estate portfolio from our existing retail footprint to a portfolio based on Full Line Design Galleries sized to maximize the potential of each market. In key metropolitan markets, we will continue to open Full Line Design Galleries and in small to mid-sized markets, we expect to continue to open and operate Galleries. Our three stand-alone Baby & Child Galleries are located in Corte Madera (California), Houston, and Santa Monica. We anticipate that our Full Line Design Galleries will include dedicated Baby & Child retail space and, in addition, we will continue to evaluate potential opportunities for additional Baby & Child Galleries as stand-alone locations in other markets.
12
Our store formats convey a design aesthetic and shopping environment that is highly differentiated from other home furnishings retailers. We have reconceptualized the customer experience by showcasing products in a sophisticated lifestyle setting that we believe is on par with world-class interior designers, consistent with the imagery and product presentation featured in our catalogs and on our websites. Products in our stores are presented in fully appointed rooms, emphasizing collections over individual pieces. This presentation encourages a higher average order value as customers are inspired to purchase a full collection of products to replicate the design aesthetic found in our stores. We have optimized our selling space to display a greater number of products, resulting in higher sales productivity and profitability.
On average, our Gallery stores display less than 20% of our current assortment. Based on our historical performance, when a product is presented on the selling floor, we experience a significant increase in sales for that product across all of our channels. Our newer, larger store model, the Full Line Design Gallery, significantly enhances our merchandise presentation and customer experience to capitalize on this opportunity for sales growth.
Full Line Design Galleries are shopping destinations in iconic or high-profile locations with high customer visibility that enhance the RH brand. Our current strategy is to size these new Full Line Design Galleries based on the potential of the market and the size of our assortment. Landlords are currently offering us leases with more favorable terms that are typically available only to anchor tenants. We believe that we can structure these types of anchor tenant leases in a number of high-profile retail shopping centers. We expect that these leases will result in more predictable timing, higher developer contribution to our build-outs, and lower rents.
We expect that our Full Line Design Galleries will capture demand from larger market areas and allow us to close select existing locations, thereby eliminating unnecessary duplication of our assortment, optimizing our working capital investment and reducing occupancy costs and other expenses. We have identified approximately 50 key metropolitan markets where we can open new Full Line Design Galleries. We opened our first three Full Line Design Galleries in Los Angeles in June 2011, Houston in November 2011 and Scottsdale in November 2012. In the Los Angeles and Houston markets, store demand increased by approximately 90% and 60%, respectively, and direct demand increased by approximately 30% and 45%, respectively, in the first full year of operations of those Full Line Design Galleries. In the Scottsdale market, we experienced an approximate 80% increase in store demand and an approximate 75% increase in direct demand during the months from the store's opening in November 2012 through the end of fiscal 2012. In April 2013, we opened our fourth Full Line Design Gallery in Boston. We plan to open new Full Line Design Galleries in Indianapolis, Greenwich and Atlanta. In addition, we have identified locations, and are in active lease discussions, in approximately 20 markets including New York City, Chicago, Miami, Denver, Dallas and San Diego. We believe this strategy will enhance our sales, profitability and return on invested capital in key markets while making a powerful brand statement, as our Full Line Design Galleries heighten the visibility of our brand with customers and underscore our position as a destination for luxury home furnishings.
The table below highlights certain information regarding our retail stores open during the three years ended February 2, 2013.
| Fiscal Year | ||||||||||||
| 2012 | 2011 | 2010 | ||||||||||
Stores open at beginning of period | 74 | 91 | 95 | |||||||||
Stores opened | 5 | 5 | 4 | |||||||||
Stores closed | (8 | ) | (22 | ) | (8 | ) | ||||||
|
|
|
|
|
| |||||||
Stores open at end of period | 71 | 74 | 91 | |||||||||
|
|
|
|
|
| |||||||
We continually analyze opportunities to selectively close stores which have been under-performing, will be consolidated in connection with openings of our Full Line Design Galleries or are no longer consistent with our brand positioning. In many cases, we operated the store until lease expiration in order to effect the closure in a cost-efficient manner. In fiscal 2011, we recorded a charge of approximately $3.2 million, relating primarily to closing stores prior to lease expiration.
13
The following list shows the number of retail stores in each U.S. state and each Canadian province where we operate as of February 2, 2013:
Location | Store | Location | Store | Location | Store | |||||||||||
Alabama | 1 | Massachusetts | 2 | Rhode Island | 1 | |||||||||||
Arizona | 1 | Michigan | 1 | Tennessee | 1 | |||||||||||
California | 17 | Minnesota | 1 | Texas | 6 | |||||||||||
Colorado | 1 | Missouri | 2 | Utah | 1 | |||||||||||
Connecticut | 2 | New Jersey | 2 | Virginia | 2 | |||||||||||
Florida | 4 | New York | 3 | Washington | 1 | |||||||||||
Georgia | 1 | North Carolina | 2 | District of Columbia | 1 | |||||||||||
Illinois | 3 | Ohio | 3 | Alberta | 2 | |||||||||||
Indiana | 1 | Oklahoma | 1 | British Columbia | 1 | |||||||||||
Louisiana | 1 | Oregon | 1 | Ontario | 2 | |||||||||||
Maryland | 1 | Pennsylvania | 2 | |||||||||||||
|
| |||||||||||||||
| Total | 71 | |||||||||||||||
|
| |||||||||||||||
Outlet Stores
As of February 2, 2013, we operated 13 outlet stores in 12 states. Our outlet stores are branded as Restoration Hardware Outlet and located primarily in large outlet malls. Our outlet stores serve as an efficient means to sell discontinued or irregular inventory outside of our core sales channels.
Source Books
We produce a series of catalogs to showcase our merchandise assortment, including our Interiors, Outdoor, Baby & Child, Objects of Curiosity, Small Spaces and Tableware. Our catalogs are one of our primary branding and advertising vehicles. We have been expanding the page counts of our catalogs, which allows us to showcase nearly our entire product assortment. We refer to these larger catalogs as Source Books. For example, our Spring 2013 Source Books presented over 80% of our product assortment at the time of publication. We have found that when we display a greater merchandise assortment in our catalogs, we experience increased sales across all of our channels. As in our retail stores, our catalogs present our merchandise in lifestyle settings that represent our unique design aesthetic. Our Source Books also feature profiles of select artisan vendors and other compelling editorial content regarding home décor. All creative work on our catalogs is coordinated by our in-house personnel in our RH Center of Innovation & Product Leadership , providing us greater control over the brand image presented to our customers, while also reducing our catalog production costs.
We use our catalogs to drive sales across all of our channels, and we generally experience increased sales of the products featured in our catalogs. We mail our catalogs to addresses from our proprietary customer database, as well as to addresses provided to us by third parties. We also use customer data that we collect to determine which prospective customers are most likely to respond to our catalogs.
Our catalogs, in concert with our e-commerce channel, are a cost-effective means of testing new products, and allow us to launch categories in a disciplined, expeditious and cost-effective manner.
E-Commerce
Our primary websites, www.restorationhardware.com and www.rh.com , provide our customers with the ability to purchase our merchandise online. In May 2008, we launched www.rhbabyandchild.com , an e-commerce enabled website devoted to our children's furnishings category. In May 2011, we launched apps for smartphones and tablets that enable customers to browse our growing product assortment.
14
Our e-commerce platform provides simplicity and ease of use while allowing customers to experience the RH lifestyle reflected in our catalogs and throughout our stores. We update our websites on a regular basis to reflect product availability and special offers. In fiscal 2012, our websites logged over 18.9 million unique visits, an increase of 32% over fiscal 2011.
We display substantially all of our current product assortment on our websites. The websites also offer a room-based navigation, which allows the customer to envision and shop items by room or by product, expanding on the richness of the online experience. For example, customers can search our websites for products by size or color, browse through our extensive product categories and see detailed information about each item and collection, such as dimensions, materials and care instructions. Additionally, customers can select color swatches and view merchandise displayed with different color and fabric options.
Marketing and Advertising
We employ a variety of marketing and advertising vehicles to drive customer traffic across all our channels, strengthen and reinforce our brand image and acquire new customers. These include targeted catalog circulation, promotional mailings, email communications, online and print advertisements and public relations activities. We maintain a database of 14.0 million customers, which includes sales patterns, detailed purchasing information, demographic data, geographic locations and postal and email addresses. We use this information to tailor our programs and increase productivity of our marketing and promotion initiatives. We leverage our marketing and advertising expenses across all our channels as we seek to optimize the efficiency of our investment.
Our stores and our catalogs are the primary branding and advertising vehicles for the RH brand. The highly-differentiated design aesthetic and shopping environment of our stores drive customer traffic not only to our stores but also to our direct channels. Our catalogs and targeted emails further reinforce the RH brand image and drive sales across all of our sales channels. We also engage in a wide range of other marketing, promotional and public relations activities to promote our brand. These campaigns include media coverage in design, lifestyle, culture/society and specialty publications, as well as in-store events related to new store openings and product launches. We also engage print advertising in brand-relevant publications such as Architectural Digest, Vanity Fair, Elle Décor , House Beautiful , Veranda, Town and Country, DuJour and others, and from time to time have also engaged in online advertising. We believe that these efforts will drive increased brand awareness, leading to higher sales in our stores and our direct business over time.
Sourcing
We do not own or operate any manufacturing facilities; instead, we contract with third-party vendors for the manufacture of our merchandise. Our sourcing strategy focuses on identifying and using vendors that can provide the quality materials and fine craftsmanship that our customers expect of our brand. To ensure that our high standards of quality and timely delivery of merchandise are met, we work closely with vendors and manufacturers. We seek to ensure the consistent quality of our manufacturers' products by selectively inspecting pre-production samples, conducting periodic site visits to certain of our vendors' production facilities and by selectively inspecting inbound shipments at our distribution facilities. In fiscal 2012, we sourced approximately 75% of our purchase dollar volume from approximately 35 vendors. In fiscal 2012, one vendor accounted for approximately 11% of our purchase dollar volume. Based on total dollar volume of purchases for fiscal 2012, approximately 78% of our products were sourced in Asia, the majority of which originated from China, 15% from the United States and the remainder from other regions.
We have a limited number of long-term merchandise supply contracts but we believe that we generally have strong relationships with our product vendors. Although we transact business primarily on an order by order basis, we typically work with many of our vendors over extended periods of time, and many vendors are making long term capacity investments to serve our increasing demands. Over the last several years, we engaged in a sourcing initiative to develop closer relationships with our vendors in order to achieve better efficiencies and
15
further improve our product development process. Through this process, we have eliminated the use of most third party purchasing agents in favor of a model in which we directly manage our vendors. We have achieved significant cost savings and other efficiencies from this initiative.
Distribution and Delivery
We manage the distribution and delivery of our products through seven facilities, each of which serves all of our sales channels:
| • | Our West Jefferson, Ohio facility is approximately 805,000 square feet. It serves as our distribution center for all of our small package direct-to-customer orders and retail store replenishment, as well as a furniture home delivery hub for the surrounding area. We are planning to expand into an additional 400,000 square feet in May 2013. |
| • | Our Baltimore, Maryland facility is approximately 508,000 square feet. It serves as a furniture distribution center for the Eastern and Central regions of the United States and Canada, as well as a furniture home delivery hub for the greater Baltimore and Washington, D.C. metropolitan areas. |
| • | Our North East, Maryland facility is approximately 1,200,000 square feet and is located near our Baltimore facility. It serves as a second furniture distribution center for the Eastern and Central regions of the United States and Canada. |
| • | Our Mira Loma, California facility is approximately 886,000 square feet. It serves as our furniture distribution center for the Western regions of the United States and Canada, as well as a furniture home delivery hub for the greater Los Angeles metropolitan area. |
| • | Our Tracy, California facility is approximately 151,000 square feet. It serves as a furniture home delivery hub for the San Francisco Bay Area market. In December 2011, we leased approximately 133,000 additional square feet of short-term, temporary storage within the same facility to also serve our furniture distribution network. |
| • | Our Avenel, New Jersey facility is approximately 114,000 square feet. It serves as a furniture delivery hub for the greater New York/New Jersey metropolitan area. |
| • | Our Houston, Texas facility is approximately 71,000 square feet. It serves as a furniture delivery hub for the greater Houston metropolitan area and eastern Texas region. |
In addition, we recently entered into a lease in connection with a planned distribution center in Grand Prairie, Texas which is approximately 860,000 square feet. This new facility will support our furniture merchandise distribution for our Central and Southern regions within the United States and is expected to commence operations in the second half of 2013. This location will also house our new customer service call center. To support the startup of the Grand Prairie distribution center, we have also entered into a short-term lease in the Ft. Worth, Texas area for 300,000 square feet of distribution space. We intend to exit this interim facility shortly after commencing operations at the Grand Prairie facility.
We offer a white glove home delivery service for larger furniture items and items delivered with multiple components, where our delivery personnel assist our customers by properly installing and assembling the product. We operate portions of our home delivery services in five key markets to leverage operating costs and improve our customers' service experience, while reducing returns and damage to our products. We plan to continue this trend of in-sourcing these services in additional markets over time, including three in 2013, while managing deliveries in other markets through third-party vendors.
Through expansions and upgrades to our inventory warehousing, distribution and delivery operations over the last four years, we have improved our supply chain and distribution operations, and have built a scalable infrastructure with significant capabilities to support our future growth. We believe our enhanced supply chain
16
and fulfillment operations allow us to manage customer orders and distribute merchandise to stores and customers in an efficient and cost-effective manner. We also believe that these upgrades have improved customer satisfaction by reducing delivery times, reducing damage to merchandise and improving the customer's overall buying experience.
We intend to continue to strengthen our supply chain operations through a number of key initiatives in 2013 designed to improve our fulfillment and delivery logistics performance and achieve greater efficiencies in the management of our inventories.
Management and Information Technology
We use industry-standard information technology systems to provide customer service, business process support, and business intelligence across our sales channels. Over the past several years, our technology team has systematically upgraded several of our core systems, including:
| • | Implementing new order management and warehouse management systems to improve efficiencies, accuracy and service levels; |
| • | Implementing a platform upgrade to our e-commerce and search software products in support of our marketing strategy and customer ordering preferences; |
| • | Installing new web-based store systems, including in-store iPads, with associated ordering tools, in all of our stores to support secure, in-store purchasing; |
| • | Deploying a new business intelligence and data warehouse system that equips management with more timely analysis of the current business trends, results, and comparisons to our historical performance; and |
| • | Delivering a variety of supply chain enhancements to several key software systems that increase the efficiencies of operations, and enable our associates to deliver quality services. |
We believe these substantial upgrades to our information technology systems provide management with the ability to drive ongoing improvement in our operating model, focus on efficiency opportunities, and increase management control. New access to results through our technology tools also equips management to more timely identify, analyze and respond to business trends.
Over the next several years, we intend to further enhance our IT infrastructure to support our growth. Key initiatives include:
| • | Further upgrading our multi-channel ordering, supply chain and inventory management systems to maximize operating efficiencies; |
| • | Enhancing our in-store, web and mobile commerce capabilities with state-of-the art technology to optimize the customer shopping experience; and |
| • | Continuing our expansion of business intelligence capabilities and data warehouse management to optimize information for timely decision making. |
We are committed to a high level of integration in technology across our business. We believe our approach to technology demonstrates an appropriate balance of strategic planning and innovation to support both today's business and tomorrow's growth.
17
Competition
The home furnishings industry is highly competitive. We primarily compete against a large number of independent retailers that provide unique items and custom-designed product offerings at high price points, including antique dealers and home furnishings retailers who market to the interior design community. We also compete with national and regional home furnishings retailers and department stores, as well as with mail order catalogs and online retailers focused on home furnishings.
We believe we compete primarily on the basis of design, quality, value and customer service. We believe our distinct combination of design, quality and value allows us to compete effectively and we believe we differentiate ourselves from competitors based on the strength of our brand, products and our fully integrated multi-channel business model. We compete with the interior design trade and specialty merchants by providing a broader product assortment at an exceptional value based both upon the price and quality of our products. We compete against certain other home furnishings retailers primarily by offering what we believe is superior quality, highly distinctive design styles and a sophisticated lifestyle presentation in our product offering.
We also believe that our success depends in substantial part on our ability to originate and define product trends, as well as to timely anticipate, gauge and react to changing consumer demands. Certain of our competitors are larger and have greater financial, marketing and other resources than us. However, many smaller specialty retailers may lack the financial resources, infrastructure, scale and national brand identity necessary to compete effectively with us.
Employees
As of February 2, 2013, we had approximately 3,100 employees, of which approximately 1,000 were part-time employees. As of that date, approximately 1,700 of our employees were based in our stores. None of our employees is represented by a union, and we have had no labor-related work stoppages. We believe our relations with our employees are good.
Intellectual Property
The "Restoration Hardware" and "RH" trademarks and certain variations thereon, such as the Restoration Hardware and RH logos, the Baby & Child logo and many trademarks used for our product lines are registered or are the subject of pending trademark applications with the U.S. Patent and Trademark Office and with the trademark registries of many foreign countries. In addition, we own many domain names, including "restorationhardware.com," "rh.com," "rhbabyandchild.com" and others that include our trademarks. We also have pending patent applications for some of our proprietary product designs and own copyrights in our catalogs and websites. We believe that our trademarks, product designs and copyrighted works have significant value and we vigorously protect them against infringement.
Seasonality
Our business is seasonal, and we have historically realized a higher portion of our net sales, net income and operating cash flows in the fourth fiscal quarter, attributable to the impact of the holiday selling season. In addition, some of our product offerings such as outdoor furniture and garden products are seasonal in nature and experience higher sales during our second fiscal quarter. As a result of these factors, our working capital requirements and demands on our product distribution and delivery network fluctuate during the year in response to seasonal trends in our business, and are greatest in the first and third fiscal quarters as we ramp up for the outdoor selling season and the holiday season, respectively.
18
Regulation and Legislation
We are subject to labor and employment laws, laws governing truth-in-advertising, privacy laws, safety regulations and other laws, including consumer protection regulations that regulate retailers and govern the promotion and sale of merchandise and the operation of stores and warehouse facilities. We monitor changes in these laws and believe that we are in material compliance with applicable laws.
Where You Can Find More Information
We are required to file annual, quarterly and current reports, proxy statements and other information required by the Securities Exchange Act of 1934, as amended, with the SEC. You may read and copy the reports and other information we file with the SEC at the SEC's Public Reference Room at 100 F Street, N.E., Room 1580, Washington, D.C. 20549. You may also obtain copies of this information by mail from the public reference section of the SEC, 100 F Street, N.E., Washington, D.C. 20549, at prescribed rates. You may obtain information regarding the operation of the public reference room by calling 1-800-SEC-0330. The SEC also maintains a website that contains reports, proxy statements and other information about issuers, like us, who file electronically with the SEC. The address of that website is http://www.sec.gov .
We maintain public internet sites at www.restorationhardware.com and www.rh.com and make available, free of charge, through these sites our Annual Reports on Form 10-K, Quarterly Reports on Form 10-Q, Current Reports on Form 8-K, Proxy Statements and Forms 3, 4 and 5 filed on behalf of directors and executive officers, as well as any amendments to those reports filed or furnished pursuant to the Exchange Act as soon as reasonably practicable after we electronically file such material with, or furnish it to, the SEC. We also put on our websites the charters for our Board of Directors' Audit Committee, Compensation Committee and Nominating Committee, as well as our Code of Business Conduct, our Corporate Governance Guidelines and Code of Ethics governing our chief executive and senior financial officers and other related materials. The information on our websites is not part of this annual report.
Our Investor Relations Department can be contacted at Restoration Hardware, Inc., 15 Koch Road, Suite J, Corte Madera, CA 94925, Attention: Investor Relations; telephone: 415-945-3500; e-mail: [email protected].
| Item 1A. | Risk Factors |
Certain factors may have a material adverse effect on our business, financial condition, and results of operations. You should consider carefully the risks and uncertainties described below, in addition to other information contained in this Annual Report on Form 10-K, including our consolidated financial statements and related notes. The risks and uncertainties described below are not the only ones we face. Additional risks and uncertainties that we are unaware of, or that we currently believe are not material, may also become important factors that adversely affect our business. If any of the following risks actually occurs, our business, financial condition, results of operations, and future prospects could be materially and adversely affected. In that event, the trading price of our common stock could decline, and you could lose part or all of your investment.
Risks Related to Our Business
Growth in our business may not be sustained and may not generate a corresponding improvement in our results of operations.
We may not be able to maintain or improve the levels of growth that we have experienced in the recent past. In addition, although we have recently experienced strong comparable store sales, if our future comparable store sales fail to meet market expectations or decline, the price of our common stock could decline. Various factors affect comparable store sales, including the number, size and location of stores we open, close, remodel or expand in any period, the overall economic and general retail sales environment, consumer preferences and
19
demand, our ability to efficiently source and distribute products, changes in our product offerings, competition, current local and global economic conditions, changes in catalog circulation and the success of marketing programs. These factors may cause our comparable store sales results to be materially lower than recent periods and our expectations, which could harm our results of operations and result in a decline in the price of our common stock.
Although we have recently experienced sales growth as a result of a number of new business initiatives, this sales growth may not continue and the level of our sales could decrease if customer response to our product offerings is not sustained. Many factors can influence customer response to our product offerings and store formats including responses from our competitors, who may introduce similar products or merchandise formats. In addition, sales levels for particular merchandise or product categories may not continue over time if customer demand levels are not sustained. The level of customer response to our Full Line Design Galleries may vary in different markets and store locations. Similarly, the level of customer response to our Source Book catalog format, in which we display a greater percentage of our product assortment, may vary in different markets. In addition, there can be no assurance that we will be able to migrate customer demand successfully when we choose to close a store in a particular location in favor of a Full Line Design Gallery in the same or an adjacent market location. While our objective is to retain a high percentage of customer demand from store locations that we close, there can be no assurance that we will retain a high percentage of sales from stores closed in the future or that we will continue to retain a high percentage of sales from stores previously closed.
In addition, these developments in our business could result in material changes in our operating costs, including increased merchandise inventory costs and costs for paper and postage associated with the mailing and shipping of catalogs and products. We cannot assure you that we will succeed in offsetting these expenses with increased efficiency or that cost increases associated with our business will not have an adverse effect on our financial results.
If we fail to successfully anticipate consumer preferences and demand, or to manage our inventory commensurate with demand, our results of operations may be adversely affected.
Our success depends in large part on our ability to originate and define home product trends, as well as to anticipate, gauge and react to changing consumer demands in a timely manner. Our products must appeal to a range of consumers whose preferences cannot always be predicted with certainty. We cannot assure you that we will be able to continue to develop products that customers positively respond to or that we will successfully meet consumer demands in the future. Any failure on our part to anticipate, identify or respond effectively to consumer preferences and demand could adversely affect sales of our products. If this occurs, our sales may decline significantly, and we may be required to mark down certain products to sell the resulting excess inventory or to sell such inventory through our outlet stores, either of which could have a material adverse effect on our financial condition and results of operations.
In addition, we must manage our merchandise in stock and inventory levels to track consumer demand. Much of our merchandise requires that we provide vendors with significant ordering lead time, frequently before market factors are known. In addition, the seasonal nature of our products requires us to carry a significant amount of inventory prior to peak selling seasons. If we are not able to anticipate consumer demand for our different product offerings, or successfully manage inventory levels for products that are in demand, we may experience:
| • | back orders, order cancellations and lost sales for products that are in high demand for which we did not stock adequate inventory; and |
| • | overstock inventory levels for products that have lower consumer demand, requiring us to take markdowns or other steps to sell slower-moving merchandise. |
As a result of these and other factors, we are vulnerable to demand and pricing shifts and to misjudgments in the selection and timing of merchandise purchases.
20
Changes in consumer spending or the housing market may significantly harm our revenue and results of operations.
Our business depends on consumer demand for our products and, consequently, is sensitive to a number of factors that influence consumer spending in the retail home furnishings sector, including, among other things, the general state of the economy, capital and credit markets, consumer confidence, general business conditions, the availability and cost of consumer credit, the level of consumer debt, interest rates, level of taxes affecting consumers, housing prices, new construction and other activity in the housing sector and the state of the mortgage industry and other aspects of consumer credit tied to housing, including the availability and pricing of mortgage refinancings and home equity lines of credit. We believe that a number of these factors have had, and may continue to have, an adverse impact on the retail home furnishings sector, and have also affected our business and results, and these factors may make it difficult for us to accurately predict our operating and financial results for future periods. The housing market may be commencing a recovery after a prolonged downtrend, and rising levels of home purchases and remodelings, in turn, may increase consumer spending on home furnishings. However, the overall economic outlook remains uncertain and there can be no assurance that any economic or housing recovery will be sustained or that our business will continue to perform well even in a stronger housing market.
We are undertaking a large number of business initiatives at the same time and if these new initiatives are not successful, they may have a negative impact on our operating results.
We are experiencing rapid growth and undertaking a large number of new business initiatives. For example, we have developed and continue to refine and enhance our Full Line Design Gallery format which involves larger store square footage. We plan to continue to open Full Line Design Galleries in select major metropolitan markets and we expect to close a number of our older stores and replace them with the Full Line Design Gallery format. We also continue to add new product categories and to expand product assortments. For example, we introduced our new Tableware category in Spring 2013. We are currently contemplating other new product lines and extensions and complementary brand-enhancing businesses, as well as expanding sales to international markets. In addition, we are continuing a number of new initiatives in other areas of our business, including product sourcing and distribution and management information systems. For example, we have reduced the use of third-party buying agents in most foreign locations. Further, we continue to evolve our Source Book strategy. We may incur costs for these new initiatives before we realize any corresponding revenue.
The number of current business initiatives could strain our financial, operational and management resources. In addition, these initiatives may not be successful. If we are not successful in managing our current growth and the large number of new initiatives that are underway, we might experience an adverse impact on our financial performance and results of operations. All of the foregoing risks may be compounded in any economic downturn. If we fail to achieve the intended results of our current business initiatives, or if the implementation of these initiatives is delayed or abandoned, diverts management's attention or resources from other aspects of our business or costs more than anticipated, we may experience inadequate return on investment for some of our business initiatives, which would have a negative effect on our operating results.
Our growth strategy and performance depend on our ability to purchase our merchandise in sufficient quantities at competitive prices, including our products that are produced by artisans and specialty vendors, and any disruptions we experience in our ability to obtain our products in a timely fashion or in the quantities required could have a material adverse effect on our business.
We do not own or operate any manufacturing facilities. We instead purchase all of our merchandise from a large number of vendors, many of which are the sole sources for particular products. Our growth strategy includes expanding the amount of products we sell, and our performance depends on our ability to purchase our merchandise in sufficient quantities at competitive prices. However, many of our key products are produced by artisans, specialty vendors and other vendors that may have limited production capacity. In addition, some of our vendors are small and undercapitalized firms. A number of our vendors, particularly our artisan vendors, may
21
have limited resources, production capacities and operating histories. As a result, the capacity of some of our vendors to meet our supply requirements has been, and may in the future be, constrained at various times and our vendors may be susceptible to production difficulties or other factors that negatively affect the quantity or quality of their production during future periods. A disruption in the ability of our significant vendors to access liquidity could also cause serious disruptions or an overall deterioration of their businesses, which could lead to a significant reduction in their ability to manufacture or ship products to us.
Any difficulties that we experience in our ability to obtain products in sufficient quality and quantity from our vendors could have a material adverse effect on our business. In fiscal 2012, we purchased approximately 85% of our merchandise from vendors that are located abroad. Our ability to obtain desired merchandise in sufficient quantities could be impaired by events that adversely affect our vendors or the locations in which they operate, such as difficulties or problems associated with our vendors' operations, business, finances, labor, economic environment, importation of products, costs, production, insurance and reputation. Failure of vendors to produce adequate quantities of merchandise in a timely manner has resulted in back orders and lower revenue in certain periods of our business operation. While we believe our vendors have the capacity to meet our demand, we cannot assure you that our vendors will be able to produce adequate quantities of merchandise in a timely manner in the future.
We also do not have long-term contracts or other contractual assurances of continued supply, pricing or access to new products with our vendors, and generally we transact business with our vendors on an order-by-order basis. Therefore, any vendor could discontinue selling to us at any time. Any disruptions we experience in our ability to obtain our products in a timely fashion or in the quantities required could have a material adverse effect on our business.
We may not be able to locate and develop relationships with a sufficient number of new vendors, which could lead to product shortages and customer backorders, which could harm our business.
In the event that one or more of our vendors is unable to meet the quantity or quality of our product requirements, we may not be able to develop relationships with new vendors in a manner that is sufficient to supply the shortfall. Even if we do identify such new vendors, we may experience product shortages and customer backorders as we transition our product requirements to incorporate the alternative suppliers. In addition, we cannot assure you that any new vendor with which we do business, particularly any new vendor abroad, would not be subject to the same or similar quality and quantity risks as our existing suppliers.
We do not have exclusive relationships with most of our vendors, and there is a risk that our vendors may sell similar or identical products to our competitors, which could harm our business.
Our arrangements with our vendors are generally not exclusive. As a result, most of our vendors might be able to sell similar or identical products to certain of our competitors, some of which purchase products in significantly greater volume. Our competitors may enter into arrangements with suppliers that could impair our ability to sell those suppliers' products, including by requiring suppliers to enter into exclusive arrangements, which could limit our access to such arrangements or products. Our vendors could also initiate or expand sales of their products through their own stores or through the Internet to the retail market and therefore compete with us directly or sell their products through outlet centers or discount stores, increasing the competitive pricing pressure we face.
We may not have adequate remedies with our vendors for defective merchandise, which could damage our reputation and brand image and harm our business.
If products that we purchase from vendors are damaged or prove to be defective, we may not be able to return products to these vendors and obtain refunds of our purchase price or obtain other indemnification from them. Our vendors' limited capacities may result in a vendor's inability to replace any defective merchandise in a timely manner. In addition, our vendors' limited capitalization or liquidity may mean that a vendor that has
22
supplied defective merchandise will not be able to refund the purchase price to us or pay us any penalties or damages associated with any defects.
In addition, our vendors may not adhere to our quality control standards, and we might not identify a quality deficiency before merchandise ships to our stores or customers. Our vendors' failure to manufacture or import quality merchandise in a timely and effective manner could damage our reputation and brand image, and could lead to an increase in product returns or exchanges or customer litigation against us and a corresponding increase in our routine and non-routine litigation costs. Further, any merchandise that does not meet our quality standards or other government requirements could become subject to a recall, which could damage our reputation and brand image and harm our business.
Our former Chairman and Co-Chief Executive Officer, Gary Friedman, resigned from these positions and as a director of the Company last year. There can be no assurance that these developments will not have an adverse impact on us.
Our former Chairman and Co-Chief Executive Officer, Gary Friedman, resigned from these positions and as a director of the Company, effective October 20, 2012, following an investigation by a special committee of non-management directors of the board assisted by independent counsel prompted by disclosure that Mr. Friedman and a Company employee were engaged in a personal relationship, described by the parties as consensual. The investigation concluded that Mr. Friedman engaged in activities that were inconsistent with the board of directors' expectations for executive conduct as previously communicated by the board of directors and failed to comply with certain Company policies. We incurred $4.8 million of expenses related to the investigation. There can be no assurance that we will not incur expenses or claims in the future related to the conduct that was the subject of the investigation or similar conduct that has occurred in the past or, given Mr. Friedman's continued involvement with the Company in his new roles, may occur in the future.
In connection with his resignation as Chairman, Co-Chief Executive Officer and a director, Mr. Friedman and the Company entered into an advisory services agreement that provides for Mr. Friedman to advise the Company in a role described as the Creator and Curator with respect to product development, merchandising and other creative matters. In addition, in connection with our initial public offering, Home Holdings agreed to invest $5 million, consisting of $2.5 million in an initial tranche and $2.5 million in one or more additional tranches, directly or indirectly, in Hierarchy, LLC ("Hierarchy"), a recently formed entity in which Mr. Friedman has a controlling interest. If requested by Home Holdings and agreed to by us, we may make such subsequent tranche investments. We will have the right to acquire all or a portion of Home Holdings' interest in Hierarchy between the second and third anniversaries of our initial public offering, at the greater of the then fair market value and the price paid by Home Holdings. Further, Home Holdings has assigned to us its right of first offer and co-sale right over the sale by Mr. Friedman of his interests in Hierarchy, its right of first offer over the sale of Hierarchy or any of its lines of business and its preemptive rights on issuances of additional interests in Hierarchy. Unless otherwise agreed by Home Holdings, for two years from the date of the Hierarchy operating agreement, Hierarchy's lines of business will be limited to apparel and apparel related businesses. In addition, Hierarchy will be permanently prohibited from entering into lines of business in which we are engaged and certain lines of business in which we may become engaged (other than luggage, which Hierarchy may enter into after such two year period). The agreements among Hierarchy, Home Holdings, Mr. Friedman and the Company contemplate that we will enter into an agreement to provide Hierarchy with back office, logistics, supply chain and administrative support, with pricing determined based on the fair market value of such services. We also transferred to Hierarchy our minimal apparel-related assets at fair market value. Mr. Friedman is also a significant stockholder in the Company and will continue to advise the board of directors in an observer capacity, with the honorary title of Chairman Emeritus.
Mr. Friedman's leadership and creative talents were important contributors to the Company's performance during his tenure as our Chairman and Co-Chief Executive Officer. While we believe that Mr. Alberini, the current sole Chief Executive Officer, and the other management team members can continue to effectively lead the Company, and we expect to continue to benefit from Mr. Friedman's contributions as the Company's Creator and Curator on an advisory basis, and as Chairman Emeritus, there can be no assurance that the absence of Mr. Friedman in his former roles will not have an adverse impact on us.
23
If we lose key personnel or are unable to hire additional qualified personnel, our business may be harmed.
The success of our business depends upon the continued service of our key personnel, including our Chief Executive Officer, Carlos Alberini. In addition, the leadership and creative talents of Gary Friedman, our Chairman Emeritus, who currently serves as our Creator and Curator on an advisory basis, have been and are expected to continue to be important contributors to our performance. The loss of the services of our key personnel or advisor could make it more difficult to successfully operate our business and achieve our business goals. In addition, we do not maintain key man life insurance policies on any of our key personnel. As a result, we may not be able to cover the financial loss we may incur in losing the services of any of our key personnel.
Mr. Alberini's and Mr. Friedman's equity ownership in our Company may give them a substantial amount of personal wealth. As a result, it may be difficult for us to continue to retain and motivate them, and this wealth could affect their decisions about whether or not they continue to perform services for us. If we do not succeed in retaining and motivating Mr. Alberini and Mr. Friedman, we may be unable to achieve our historical growth rates.
Competition for qualified employees and personnel in the retail industry is intense. We may be unable to retain other existing personnel that are important to our business or hire additional qualified personnel. The process of locating personnel with the combination of skills and attributes required to carry out our goals is often lengthy. Our success depends to a significant degree upon our ability to attract, retain and motivate qualified management, marketing and sales personnel, in particular store managers, and upon the continued contributions of these people. We cannot assure you that we will be successful in attracting and retaining qualified executives and personnel.
In addition, our success depends in part upon our ability to attract, motivate and retain a sufficient number of store employees who understand and appreciate our corporate culture and customers. Turnover in the retail industry is generally high. Excessive store employee turnover will result in higher employee costs associated with finding, hiring and training new store employees. If we are unable to hire and retain store personnel capable of consistently providing a high level of customer service, our ability to open new stores may be impaired, the performance of our existing and new stores could be materially adversely affected and our brand image may be negatively impacted.
Our operations have significant liquidity and capital requirements and depend on the availability of adequate financing on reasonable terms, and if we are unable to borrow sufficient capital, it could have a significant negative effect on our business.
Our operations have significant liquidity and capital requirements. Among other things, the seasonality of our businesses requires us to purchase merchandise well in advance of the outdoor selling season in our second fiscal quarter and the holiday selling season in our fourth fiscal quarter. In addition, we have invested significant capital expenditures in remodeling and opening new stores and these capital expenditures have increased and will continue to increase in fiscal 2013 and succeeding fiscal periods as we open additional Full Line Design Galleries, which may require us to undertake upgrades to historical buildings or construction of new buildings. During fiscal 2012, we spent $27.8 million for capital expenditures related to new stores and remodeling, and we incurred $21.3 million of additional capital expenditures related to supply chain investments and systems infrastructure. We anticipate our capital expenditure requirements to be approximately $95 million to $100 million for fiscal 2013. We plan to continue our growth and expansion, including opening Full Line Design Galleries in select major metropolitan markets, pursuing category extensions of our brand, and exploring new business areas. We purchased the building and land for our store in San Francisco but we have relied upon leases with landlords for our other locations to date. As we develop new stores in the future, we may explore other models for our real estate which could include joint ventures or other forms of equity ownership in the real estate interests associated with new sites and buildings. These approaches might require greater capital investment than a traditional store lease with a landlord.
24
We depend on our ability to generate cash flows from operating activities, as well as revolving borrowings under the Restoration Hardware, Inc. revolving line of credit, to finance the carrying costs of our inventory, to pay for capital expenditures and operating expenses and to support our growth strategy. As of February 2, 2013, we had borrowed $82.5 million under the revolving line of credit and had $188.5 million available for borrowing. Various factors may impact our lenders' willingness to provide funds to us, including:
| • | our continuing compliance with the terms of our revolving line of credit; |
| • | the amount of availability under the revolving line of credit, which depends on various factors, including the amount of collateral available under the revolving line of credit, which relies on a borrowing base formula tied principally to the value of our assets, including our inventory; and |
| • | our lenders' financial strength and ability to perform under the revolving line of credit. |
If the cash flows from our operating activities are not sufficient to finance the carrying costs of inventory and to pay for capital expenditures and operating costs, and if we are unable to borrow a sufficient amount under the revolving line of credit to finance or pay for such expenditures and costs, it could have a significant negative effect on our business.
We currently believe that our cash flow from operations and funds available under the revolving line of credit will satisfy our capital and operating requirements for the next twelve months. However, any weakening of, or other adverse developments concerning our sales performance or adverse developments concerning the availability of credit under the revolving line of credit, could limit the overall amount of funds available to us.
In addition, we may experience cash flow shortfalls in the future, and we may otherwise require additional external funding, or we may need to raise funds to take advantage of unanticipated opportunities, to make acquisitions of other businesses or companies or to respond to changing business conditions or unanticipated competitive pressures. However, we cannot assure you that we will be able to raise funds on favorable terms, if at all, or that future financing requirements would not be dilutive to holders of our capital stock. If we fail to raise sufficient additional funds, we may be required to delay or abandon some of our planned future expenditures or aspects of our current operations.
A number of factors that affect our ability to successfully open new stores within the time frames we initially target or optimize our store footprint are beyond our control, and these factors may harm our ability to execute our strategy of sizing stores to the potential of the market, which may negatively affect our results of operations.
We are focused on sizing our assortments and our stores to the potential of the market by adjusting the square footage and number of stores on a geographic market-by-market basis. We plan to optimize our real estate by continuing to open larger square footage Full Line Design Galleries in key markets and relocating or closing selected stores in these or adjacent markets. When we address the introduction of new stores in a particular market or changes to, or closure of, existing stores, we must make a series of decisions regarding the size and location of new stores (or the existing stores slated to undergo changes or closure) and the impact on our other existing stores in the area.
Our ability to maximize the productivity of our retail store base, depends on many factors, including, among others, our ability to:
| • | identify suitable locations, the availability of which is largely outside of our control; |
| • | size the store locations to the market opportunity; |
| • | retain customers in certain geographic markets when we close stores in that market; |
| • | negotiate acceptable new lease terms or lease renewals, modifications or terminations; |
| • | efficiently build and equip new stores or further remodel existing locations; |
25
| • | source sufficient levels of inventory to meet the needs of changes in our store footprint on a timely basis; |
| • | successfully integrate changes in our store base into our existing operations and information technology systems; |
| • | obtain or maintain adequate capital resources on acceptable terms; |
| • | avoid construction or local permit delays and cost overruns in connection with the opening of new stores or the expansion or further remodeling of existing stores; |
| • | maintain adequate distribution facilities, information systems and other operational systems to serve our new stores and remodeled stores; and |
| • | address competitive, merchandising, marketing, distribution and other challenges encountered in connection with expansion into new geographic areas and markets. |
We have experienced delays in opening some new stores within the time frames we initially targeted, and may continue to experience such delays in the future. Any of these challenges could delay or prevent us from completing store openings or the additional remodeling of existing stores or hinder the operations of stores we open or remodel. If any of these challenges delays the opening of a store, our results of operations will be negatively affected as we will incur leasing and other costs during the delay without associated store revenue at such location. New or remodeled stores may not be profitable or achieve our target return on investment. Unfavorable economic and business conditions and other events could also interfere with our plans to expand or modify store footprints. Our failure to effectively address challenges such as those listed above could adversely affect our ability to successfully open new stores or change our store footprint in a timely and cost-effective manner and could have a material adverse effect on our business, results of operations and financial condition.
Our operating results are subject to quarterly and seasonal fluctuations, and results for any quarter may not necessarily be indicative of the results that may be achieved for the full fiscal year.
Our quarterly results have fluctuated in the past and may fluctuate significantly in the future, depending upon a variety of factors, including, among other things, our product offerings, the timing and level of markdowns, promotional events, store openings, store closings, the weather, remodeling or relocations, shifts in the timing of holidays, timing of catalog releases or sales, timing of delivery of orders, competitive factors and general economic conditions.
In addition, we historically have realized, and expect to continue to realize, higher net revenue and profitability in the fourth quarter of our fiscal year due to the holiday selling season and to a lesser extent in the second quarter due to the outdoor selling season. In fiscal 2012, we recorded net revenues of $292.9 million and $398.1 million in the second and fourth fiscal quarters or 24.6% and 33.4%, respectively, of our fiscal 2012 net revenue. In fiscal 2012, our gross profit for the second and fourth quarters was $114.1 million and $145.2 million or 26.1% and 33.3% of our fiscal 2012 gross profit, respectively. In anticipation of increased sales activity for the outdoor selling season during our second fiscal quarter and the holiday selling season during our fourth fiscal quarter, our working capital requirements are typically higher in the first and third fiscal quarters due to inventory-related working capital requirements for the outdoor selling season and the holiday selling season.
Accordingly, our results of operation may fluctuate on a seasonal basis and relative to corresponding periods in prior years. We may take certain pricing, merchandising or marketing actions that could have a disproportionate effect on our business, financial condition and results of operations in a particular quarter or selling season. For example, we periodically engage in sales promotional activities that are designed to increase our sales but can have the effect of reducing our gross margins. These initiatives and promotional activities may disproportionately impact results in a particular quarter and we believe that period to period comparisons of our operating results are not necessarily meaningful and cannot be relied upon as indicators of future performance.
26
27
Our business depends in part on a strong brand image. We continue to invest in the development of our brand and the marketing of our business, and if we are not able to maintain and enhance our brand or market our product offerings, we may be unable to attract a sufficient number of customers or sell sufficient quantities of our products.
We believe that the brand image we have developed, and the lifestyle image associated with our brand, have contributed significantly to the success of our business to date. We also believe that maintaining and enhancing our brand is integral to our business and to the implementation of our strategies for expanding our business. This will require us to continue to make investments in areas such as marketing and advertising, as well as the day-to-day investments required for store operations, catalog mailings, website operations and employee training. Our brand image may be diminished if new products, services or other businesses fail to maintain or enhance our distinctive brand image. Furthermore, our reputation could be jeopardized if we fail to maintain high standards for merchandise and service quality, if we fail to maintain high ethical, social and environmental standards for all of our operations and activities, if we fail to comply with local laws and regulations or if we experience other negative events that affect our image or reputation. Any failure to maintain a strong brand image could have an adverse effect on our sales and results of operations.
We are exploring opportunities to expand into new categories or complementary businesses. If we are not successful in these new categories or business areas, it may have an adverse effect on our results of operations and our reputation.
We are engaged in ongoing efforts to explore new business opportunities that we believe can leverage our current business platform. We have developed a number of new product categories and extensions over the last several years, including Garden & Outdoor, Baby & Child and Small Spaces. We also have introduced other merchandise categories that enhance the customer experience in our Full Line Design Galleries, including fresh cut flowers, magazines and tea. We plan further brand-enhancing offerings, such as the planned introduction of our Contemporary Art business, or a café, wine bar or restaurant adjacent to, or inside of, select Full Line Design Galleries. We are incubating a number of other new ideas for potential expansion of our business, some of which may become new core categories or new store concepts and others of which may be primarily offered as enrichment of the customer experience.
Developing and testing new business opportunities will involve us in business operations and areas of expertise that would be new to our organization and may require management time and resources. We may not achieve wide market acceptance or generate revenue sufficient to recoup the cost of developing and operating such new concepts, which in turn could have a material adverse effect on our results of operations. Any new businesses we enter may expose us to additional laws, regulations and risks, including the risk that we may incur ongoing operating expenses in such businesses in excess of revenues, which could harm our results of operations and financial condition. The financial profile of any such new businesses may be different than our current financial profile, which could affect our financial performance and the market price for our common stock.
Competition in the home furnishings sector of the retail market may adversely affect our future financial performance.
The home furnishings sector within the retail market is highly competitive. We compete with the interior design trade and specialty stores, as well as antique dealers and other merchants that provide unique items and custom-designed product offerings at higher price points. We also compete with national and regional home furnishing retailers and department stores. In addition, we compete with mail order catalogs and online retailers focused on home furnishings. We compete with these and other retailers for customers, suitable retail locations, vendors, qualified employees and management personnel. Many of our competitors have significantly greater financial, marketing and other resources than we do and therefore may be able to adapt to changes in customer preferences more quickly, devote greater resources to the marketing and sale of their products, generate greater national brand recognition or adopt more aggressive pricing policies than we can. In addition, increased catalog
mailings by our competitors may adversely affect response rates to our own catalog mailings. Moreover, increased competition may result, and has resulted in the past, in potential or actual litigation between us and our competitors relating to such activities as competitive sales, hiring practices and other matters. As a result, increased competition may adversely affect our future financial performance, and we cannot assure you that we will be able to compete successfully in the future.
We believe that our ability to compete successfully is determined by several factors, including, among other things, the quality of our product selection, our brand, our merchandise presentation and value proposition, customer service, pricing and store locations. We may not ultimately succeed in competing with other retailers in our market.
Disruptions in the global financial markets may make it difficult for us to borrow a sufficient amount of capital to finance the carrying costs of inventory and to pay for capital expenditures and operating costs, which could negatively affect our business.
Disruptions in the global financial markets and banking systems have made credit and capital markets more difficult for companies to access, even for some companies with established revolving or other credit facilities. Under the credit agreement governing the Restoration Hardware, Inc. revolving line of credit, each financial institution that is part of the syndicate for the revolving line of credit is responsible for providing a portion of the loans to be made under the revolving line of credit. Factors that have previously affected our borrowing ability under the revolving line of credit have included the borrowing base formula limitations, adjustments in the appraised value of our inventory used to calculate the borrowing base and the availability of each of our lenders to advance its portion of requested borrowing drawdowns under the facility. If, in connection with a disruption in the global financial markets or otherwise, any participant, or group of participants, with a significant portion of the commitments in the revolving line of credit fails to satisfy its obligations to extend credit under the facility, and if we are unable to find a replacement for such participant or group of participants on a timely basis (if at all), then our liquidity and our business may be materially adversely affected.
Reductions in the volume of mall traffic or closing of shopping malls as a result of unfavorable economic conditions or changing demographic patterns could significantly reduce our sales and leave us with unsold inventory.
Most of our stores are currently located in shopping malls. Sales at these stores are derived, in part, from the volume of traffic in those malls. These stores benefit from the ability of the malls' "anchor" tenants, generally large department stores and other area attractions, to generate consumer traffic in the vicinity of our stores and the continuing popularity of the malls as shopping destinations. Unfavorable economic conditions, particularly in certain regions, have adversely affected mall traffic and resulted in the closing of certain anchor stores and have threatened the viability of certain commercial real estate firms which operate major shopping malls. A continuation of this trend, including failure of a large commercial landlord or continued declines in the popularity of mall shopping generally among our customers, could reduce our sales and leave us with excess inventory. We may respond by increasing markdowns or initiating marketing promotions to reduce excess inventory, which would further adversely impact our results of operations.
Our business depends upon the successful operation of our distribution facilities, furniture home delivery hubs and customer service center, as well as our ability to fulfill orders and to deliver our merchandise to our customers in a timely manner.
Our business depends upon the successful operation of our distribution centers, furniture home delivery hubs and customer service center, as well as our order management and fulfillment services and the re-stocking of inventories within our stores. The efficient flow of our merchandise requires that our facilities have adequate capacity to support our current level of operations, and any anticipated increased levels that may follow from any growth of our business.
28
If we encounter difficulties associated with any of our facilities or if any of our facilities were to shut down for any reason, including as a result of fire, earthquakes (to which our California-based distribution and home delivery facilities in Tracy and Mira Loma and our corporate headquarters in Corte Madera are particularly vulnerable), power outages or other natural disasters, we could face shortages of inventory resulting in "out of stock" conditions in our stores, significantly higher costs and longer lead times associated with distributing our products to both our stores and online customers and the inability to process orders in a timely manner or ship goods to our customers. Further, any significant interruption in the operation of our customer service center, including the call center, could also reduce our ability to receive and process orders and provide products and services to our stores and customers, which could result in lost sales, cancelled sales and a loss of loyalty to our brand.
In January 2012, we opened a furniture home delivery hub in Avenel, New Jersey and, in February 2012, we opened a furniture distribution center in North East, Maryland. We also recently expanded our West Coast distribution center in Mira Loma, California, reduced the size of our furniture delivery hub in Tracy, California and have entered into a lease in connection with a planned distribution center in Grand Prairie, Texas. We are also planning to expand into an additional 400,000 square feet at our West Jefferson, Ohio distribution center in May 2013, and in-sourcing three home furniture delivery facilities in 2013. As a result of these and other efforts with respect to our distribution facilities, we may encounter operational difficulties with respect to our facilities, such as disruptions in transitioning fulfillment orders to the new distribution facilities and problems associated with operating new facilities or reducing the size and changing functions of existing facilities, and any such difficulties could have a material adverse effect on our business, financial condition and results of operations.
Our results may be adversely affected by fluctuations in raw materials and energy costs.
Increases in the prices of the components and raw materials used in our products could negatively affect the sales of our merchandise and our product margins. These prices may fluctuate based on a number of factors beyond our control, including: commodity prices including prices for oil, lumber and cotton, changes in supply and demand, general economic conditions, labor costs, competition, import duties, tariffs, anti-dumping duties, currency exchange rates and government regulation. In addition, energy costs have fluctuated dramatically in the past. These fluctuations may result in an increase in our transportation costs for freight and distribution, utility costs for our retail stores and overall costs to purchase products from our vendors. Accordingly, changes in the value of the U.S. dollar relative to foreign currencies may increase our vendors' cost of business and ultimately our cost of goods sold and our selling, general and administrative costs. If we are unable to pass such cost increases on to our customers or the higher cost of the products results in decreased demand for our products, our results of operations would be harmed. Any such cost increase could reduce our earnings to the extent we are unable to adjust the prices of our products.
We are subject to risks associated with our dependence on foreign imports for our merchandise.
Based on total volume dollar purchases, in fiscal 2012 we purchased approximately 85% of our merchandise from vendors located outside the United States, including 78% from Asia, the majority of which originated from China. In addition, some of the merchandise we purchase from vendors in the United States also depends, in whole or in part, on vendors located outside the United States. As a result, our business highly depends on global trade, as well as trade and cost factors that impact the specific countries where our vendors are located, including Asia. Our future success will depend in large part upon our ability to maintain our existing foreign vendor relationships and to develop new ones. While we rely on our long-term relationships with our foreign vendors, we have no long-term contracts with them and transact business on an order by order basis. Additionally, many of our imported products are subject to existing duties, tariffs, anti-dumping duties and quotas that may limit the quantity of some types of goods which we may import into the United States. Our dependence on foreign imports also makes us vulnerable to risks associated with products manufactured abroad, including, among other things, risks of damage, destruction or confiscation of products while in transit to our distribution centers located in the United States, charges on or assessment of additional import duties, tariffs, anti-dumping duties and quotas, loss
29
of "most favored nation" trading status by the United States in relation to a particular foreign country, work stoppages, including without limitation as a result of events such as longshoremen strikes, transportation and other delays in shipments, including without limitation as a result of heightened security screening and inspection processes or other port-of-entry limitations or restrictions in the United States, freight cost increases, economic uncertainties, including inflation, foreign government regulations, trade restrictions, including the United States retaliating against protectionist foreign trade practices and political unrest, increased labor costs and other similar factors that might affect the operations of our vendors in specific countries such as China.
An interruption or delay in supply from our foreign sources, or the imposition of additional duties, taxes or other charges on these imports, could have a material adverse effect on our business, financial condition and results of operations unless and until alternative supply arrangements are secured.
In addition, there is a risk that compliance lapses by our vendors could occur which could lead to investigations by U.S. government agencies responsible for international trade compliance. Resulting penalties or enforcement actions could delay future imports/exports or otherwise negatively impact our business. In addition, there remains a risk that one or more of our foreign vendors will not adhere to applicable legal requirements or our global compliance standards such as fair labor standards, the prohibition on child labor and other product safety or manufacturing safety standards. The violation of applicable legal requirements by any of our vendors or the failure to adhere to labor, manufacturing safety and other laws by any of our vendors, or the divergence of the labor practices followed by any of our vendors from those generally accepted in the United States, could disrupt our supply of products from our vendors or the shipment of products to us, result in potential liability to us and harm our reputation and brand and subject us to boycotts by our customers or activist groups, any of which could negatively affect our business and operating results.
We extend unsecured credit to our vendors.
Some of our vendors have limited cash flows and/or access to capital and require us to advance payments in order for them to be able to meet our supply requirements. We typically advance a portion of the payments to be made to such vendors under our purchase orders prior to the delivery of the ordered products. These advance payments are unsecured. These vendors may become insolvent and their failure to repay our advances, and any related failure to deliver products to us, could have a material adverse impact on our results of operations.
We rely upon independent third-party transportation providers for the majority of our product shipments.
We currently rely upon independent third-party transportation providers for our product shipments to our stores and to our customers outside of certain areas. Our utilization of their delivery services for shipments, or those of any other shipping companies we may elect to use, is subject to risks, including increases in fuel prices, which would increase our shipping costs, and strikes, work stoppages and inclement weather, which may impact the shipping companies' abilities to provide delivery services that adequately meet our shipping needs. If we change shipping companies, we could face logistical difficulties that could adversely affect deliveries and we would incur costs and expend resources in connection with such change. Moreover, we may not be able to obtain terms as favorable as those received from the third-party transportation providers we currently use, which in turn would increase our costs.
We may be exposed to risks and costs associated with protecting the integrity and security of our customers' information.
A significant number of customer purchases from us across all of our channels are made using credit cards. Additionally, a significant number of our customer orders are placed through our websites. In order for our business to function successfully, we and other market participants must be able to handle and transmit confidential information, including credit card information, securely. We are not fully compliant with Payment Card Industry, or PCI, Data Security Standards and there can be no assurance that in the future we will be able to
30
operate our facilities and our customer service and sales operations in accordance with PCI or other industry recommended practices. We intend to obtain compliance with PCI Data Security Standards and will incur additional expenses to attain and maintain PCI compliance. Further, there is increased litigation over personally identifiable information and we may be subject to one or more claims or lawsuits related to intentional or unintentional exposure of our customer's personally identifiable information. Even if we are compliant with such standards, we still may not be able to prevent security breaches involving customer transaction data. Any breach could cause consumers to lose confidence in the security of our website and choose not to purchase from us. If a computer hacker or other criminal is able to circumvent our security measures, he or she could destroy or steal valuable information or disrupt our operations. Any security breach could expose us to risks of data loss, fines, litigation and liability and could seriously disrupt our operations and harm our reputation, any of which could adversely affect our business. In addition to the possibility of fines, lawsuits and other claims, we could be required to change our business practices or modify our service offerings in connection with the protection of personally identifiable information, which could have a material adverse effect on our business.
In addition, states and the federal government have enacted additional laws and regulations to protect consumers against identity theft, including laws governing treatment of personally identifiable information. We collect and store personal information from consumers in the course of doing business. These laws have increased the costs of doing business and, if we fail to implement appropriate safeguards or we fail to detect and provide prompt notice of unauthorized access as required by some of these laws, we could be subject to potential claims for damages and other remedies. If we were required to pay any significant amounts in satisfaction of claims under these laws, or if we were forced to cease our business operations for any length of time as a result of our inability to comply fully with any such law, our business, operating results and financial condition could be adversely affected.
Material damage to, or interruptions in, our information systems as a result of external factors, staffing shortages and difficulties in updating our existing software or developing or implementing new software could have a material adverse effect on our business or results of operations.
We depend largely upon our information technology systems in the conduct of all aspects of our operations, many of which we have only adopted and implemented within the past five years in connection with rebuilding our supply chain and infrastructure. Such systems are subject to damage or interruption from power outages, computer and telecommunications failures, computer viruses, security breaches and natural disasters. Damage or interruption to our information systems may require a significant investment to fix or replace them, and we may suffer interruptions in our operations in the interim. Management information system failures or telecommunications system problems may disrupt operations. In addition, costs and potential problems and interruptions associated with the implementation of new or upgraded systems and technology or with maintenance or adequate support of existing systems could also disrupt or reduce the efficiency of our operations. Any material interruptions or failures in our systems may have a material adverse effect on our business or results of operations.
We also rely heavily on our information technology staff. If we cannot meet our staffing needs in this area, we may not be able to fulfill our technology initiatives while continuing to provide maintenance on existing systems.
We rely on certain software vendors to maintain and periodically upgrade many of these systems so that they can continue to support our business. The software programs supporting many of our systems were licensed to us by independent software developers. The inability of these developers or us to continue to maintain and upgrade these information systems and software programs would disrupt or reduce the efficiency of our operations if we were unable to convert to alternate systems in an efficient and timely manner.
We are vulnerable to various risks and uncertainties associated with our websites, including changes in required technology interfaces, website downtime and other technical failures, costs and technical issues as we
31
upgrade our website software, computer viruses, changes in applicable federal and state regulation, security breaches, legal claims related to our website operations and e-commerce fulfillment and other consumer privacy concerns. Our failure to successfully respond to these risks and uncertainties could reduce website sales and have a material adverse effect on our business or results of operations.
Our failure to successfully manage the costs of our catalog and promotional mailings could have a negative impact on our business.
Catalog mailings are an important component of our business. Increases in costs relating to paper, printing, postal rates and other catalog distribution costs would affect the cost of our catalog mailings. In 2012, we significantly expanded the page counts of our catalogs, increased the number of households receiving our catalogs and reduced the number of catalog mailings. We rely on customary discounts from the basic postal rate structure that are available for our catalog mailings, which could be changed or discontinued at any time. The market price for paper has fluctuated significantly during the past three fiscal years and may continue to fluctuate in the future. Future increases in postal rates, paper costs or printing costs would have a negative impact on our operating results to the extent that we are unable to offset such increases by raising prices, by implementing more efficient printing, mailing, delivery and order fulfillment systems or by using alternative direct-mail formats.
We have historically experienced fluctuations in customer response to our catalogs. Customer response to our catalogs depends substantially on product assortment, product availability and creative presentation, the selection of customers to whom the catalogs are mailed, changes in mailing strategies, the page size, page count, frequency and timing of delivery of the catalogs, as well as the general retail sales environment and current domestic and global economic conditions. The failure to effectively produce or distribute our catalogs could affect the timing of catalog delivery. The timing of catalog delivery has been and can be affected by postal service delays. Any delays in the timing of catalog delivery could cause customers to forgo or defer purchases. If the performance of our catalogs declines, if we misjudge the correlation between our catalog circulation and net sales, or if our catalog circulation optimization strategy is not successful, our results of operations could be negatively impacted.
Our failure to successfully anticipate merchandise returns might have a negative impact on our business.
We record a reserve for merchandise returns based on historical return trends together with current product sales performance in each reporting period. If actual returns are greater than those projected and reserved for by management, additional sales returns might be recorded in future periods. In addition, to the extent that returned merchandise is damaged, we often do not receive full retail value from the resale or liquidation of the merchandise. Further, the introduction of new merchandise, changes in merchandise mix, changes in consumer confidence or other competitive and general economic conditions may cause actual returns to exceed merchandise return reserves. Adverse economic conditions in the past have resulted in an increase in our merchandise returns. Any significant increase in merchandise returns that exceeds our reserves could harm our business and operating results.
Certain of our products may be subject to recalls or other actions by regulatory authorities, and any such recalls or similar actions could have a material adverse effect on our business.
Certain of the products we sell are subject to regulation by the federal Consumer Product Safety Commission and similar state and international regulatory authorities, which require certification and testing of certain regulated substances, among other requirements. For example, in August 2008, the Consumer Product Safety Improvement Act of 2008, or CPSIA, was signed into law. In general, the CPSIA bans the sale of children's products containing lead in excess of certain maximum standards, and imposes other restrictions and requirements on the sale of children's products, including importing, testing and labeling requirements. Our products have, from time to time, been subject to recall for product safety reasons, and issues of product safety could result in future product recalls, other actions by applicable government authorities or product liability
32
claims. Product safety concerns may also require us, whether on a voluntary or involuntary basis, to remove selected products from our stores, particularly with respect to our Baby & Child brand. Product recalls and removal of products and defending such product liability claims can result in, among other things, lost sales, diverted resources, potential harm to our reputation and increased customer service costs, any of which could have a material adverse effect on our business and results of operations.
There are claims made against us and/or our management from time to time that can result in litigation or regulatory proceedings which could distract management from our business activities and result in significant liability.
From time to time we and/or our management are involved in litigation, claims and other proceedings relating to the conduct of our business, including but not limited to consumer protection class action litigation, claims related to our collection of reproductions, claims related to our employment practices, claims of intellectual property infringement, including with respect to trademarks and trade dress, and claims asserting unfair competition and unfair business practices by third parties. In addition, from time to time, we are subject to product liability and personal injury claims for the products that we sell and the stores we operate. Subject to certain exceptions, our purchase orders generally require the vendor to indemnify us against any product liability claims; however, if the vendor does not have insurance or becomes insolvent, we may not be indemnified. In addition, we could face a wide variety of employee claims against us, including general discrimination, privacy, labor and employment, ERISA and disability claims. Any claims could result in litigation against us and could also result in regulatory proceedings being brought against us by various federal and state agencies that regulate our business, including the United States Equal Employment Opportunity Commission. Often these cases raise complex factual and legal issues, which are subject to risks and uncertainties and which could require significant management time. Our Chief Executive Officer, Mr. Alberini was employed by Guess?, Inc., which has been subject to a tax audit and assessment proceeding in Italy. There is a related proceeding by a prosecutor in Italy that has been initiated with respect to several current and former members of the Guess Europe management team as well as Mr. Alberini. There can be no assurance as to the exact timing or outcome of the Italian prosecutorial proceeding or that it will not require Mr. Alberini to devote substantial time in addressing this matter prior to its final resolution. Guess?, Inc. has reported a settlement of this tax proceeding in Italy and we expect that the related proceeding regarding Mr. Alberini will be resolved favorably. Litigation and other claims and regulatory proceedings against us or our management could result in unexpected expenses and liability and could also materially adversely affect our operations and our reputation.
Labor activities could cause labor relations difficulties for us.
Currently none of our employees is represented by a union. However, our employees have the right at any time to form or affiliate with a union, and union organizational activities have occurred previously at our Baltimore distribution center. We cannot predict the negative effects that any future organizational activities will have on our business and operations. If we were to become subject to work stoppages, we could experience disruption in our operations and increases in our labor costs, either of which could materially adversely affect our business, financial condition or results of operations.
Intellectual property claims by third parties or our failure or inability to protect our intellectual property rights could diminish the value of our brand and weaken our competitive position.
Third parties have and may in the future assert intellectual property claims against us, particularly as we expand our business to include new products and product categories and move into other geographic markets. Our defense of any claim, regardless of its merit, could be expensive and time consuming and could divert management resources. Successful infringement claims against us could result in significant monetary liability and prevent us from selling some of our products. In addition, resolution of claims may require us to redesign our
33
products, license rights from third parties or cease using those rights altogether, which could have a material adverse impact on our business, financial condition or results of operations.
We currently rely on a combination of copyright, trademark, trade dress and unfair competition laws, as well as confidentiality procedures and licensing arrangements, to establish and protect our intellectual property rights. We believe that our trademarks and other proprietary rights have significant value and are important to identifying and differentiating certain of our products and brand from those of our competitors and creating and sustaining demand for certain of our products. We also cannot assure you that the steps taken by us to protect our intellectual property rights will be adequate to prevent infringement of such rights by others, including imitation of our products and misappropriation of our brand. If we are unable to protect and maintain our intellectual property rights, the value of our brand could be diminished and our competitive position could suffer.
We are subject to risks associated with occupying substantial amounts of space, including future increases in occupancy costs. We may choose in the future to acquire some of our store locations, which will subject us to additional risks.
We lease all but one of our retail store locations and we also lease our outlet stores, our corporate headquarters and our seven distribution and delivery facilities. The initial lease term of our retail stores generally ranges from ten to fifteen years, and certain leases contain renewal options for up to fifteen years. Most leases for our retail stores provide for a minimum rent, typically including escalating rent increases, plus a percentage rent based upon sales after certain minimum thresholds are achieved, as well as common area maintenance charges, real property insurance and real estate taxes. We purchased the building and land for our store in San Francisco, but to date we have relied upon leases with landlords for our other locations. As we develop new stores in the future, we may explore other models for our real estate which could include joint ventures or other forms of equity ownership in the real estate interests associated with new sites and buildings. These approaches might require additional capital investment and could present different risks than a traditional store lease with a landlord, including greater financial exposure if a new store location is not as successful as we originally target in our plans.
If we decide to close an existing or future store, we may nonetheless have continuing obligations with respect to that property pursuant to the applicable lease or ownership arrangements, including, among other things, paying the base rent for the balance of the lease term. Our ability to re-negotiate favorable terms on an expiring lease, to arrange for the sale of an owned property or to negotiate favorable terms for a suitable alternate location could depend on conditions in the real estate market, competition for desirable properties, our relationships with current and prospective landlords and other factors that are not within our control. Our inability to enter into new leases or renew existing leases on terms acceptable to us or be released from our obligations under leases or other obligations for stores that we close could materially adversely affect our business and results of operations.
Compliance with laws may be costly, and changes in laws could make conducting our business more expensive or otherwise change the way we do business.
We are subject to numerous regulations, including labor and employment, customs, truth-in-advertising, consumer protection, privacy, safety, environmental and zoning and occupancy laws and other laws, including consumer protection regulations that regulate retailers generally or govern our business. If these regulations were to change or were violated by us or our vendors or buying agents, the costs of certain goods could increase, or we could experience delays in shipments of our goods, be subject to fines or penalties, or suffer reputational harm, which could reduce demand for our products and harm our business and results of operations.
In addition to increased regulatory compliance requirements, changes in laws could make ordinary conduct of our business more expensive or require us to change the way we do business. For example, as a retail business, changes in laws related to employee benefits and treatment of employees, including laws related to limitations on employee hours, supervisory status, leaves of absence, mandated health benefits or overtime pay, could negatively
34
impact us by increasing compensation and benefits costs for overtime and medical expenses. In addition, newly enacted United States health care laws and potential global and domestic greenhouse gas emission requirements and other environmental legislation and regulations could result in increased direct compliance costs for us (or may cause our vendors to raise the prices they charge us in order to maintain profitable operations because of increased compliance costs), increased transportation costs or reduced availability of raw materials.
Because of our international operations, we could be adversely affected by violations of applicable U.S. federal and state or foreign laws and regulations, such as the United States Foreign Corrupt Practices Act and similar worldwide anti-bribery, anti-corruption and anti-kickback laws.
We source substantially all of our products abroad, and we are increasing the level of our international sourcing activities in an effort to obtain more of our products directly from vendors located abroad. Additionally, we have expanded our business-to-business sales. The foreign and U.S. laws and regulations that are applicable to our operations are complex and may increase the costs of regulatory compliance, or limit or restrict the products or services we sell or subject our business to the possibility of regulatory actions or proceedings. The United States Foreign Corrupt Practices Act, and other similar laws and regulations, generally prohibit companies and their intermediaries from making improper payments to foreign governmental officials for the purpose of obtaining or retaining business. While our policies mandate compliance with applicable laws and regulations, including anti-bribery laws and other anti-corruption laws, we cannot assure you that we will be successful in preventing our employees or other agents from taking actions in violation of these laws or regulations. Such violations, or allegations of such violations, could disrupt our business and result in a material adverse effect on our financial condition, results of operations and cash flows.
Our operations are subject to risks of natural disasters, acts of war, terrorism or widespread illness, any one of which could result in a business stoppage and negatively affect our operating results.
Our business operations depend on our ability to maintain and protect our facilities, computer systems and personnel. Our operations and consumer spending may be affected by natural disasters or other similar events, including floods, hurricanes, earthquakes, widespread illness or fires. In particular, our corporate headquarters is located in Northern California, and other parts of our operations including distribution facilities are located in Northern and Southern California, each of which is in a seismically active region susceptible to earthquakes that could disrupt our operations and affect our operating results. Many of our vendors are also located in areas that may be affected by such events. Moreover, geopolitical or public safety conditions which affect consumer behavior and spending may impact our business. Terrorist attacks in the United States or threats of terrorist attacks in the United States in the future, as well as future events occurring in response to or in connection with them, could again result in reduced levels of consumer spending. Any of these occurrences could have a significant impact on our operating results, revenue and costs.
We have experienced net losses in the past and we may experience net losses in the future.
We experienced a net loss of $7.1 million in fiscal 2010. We achieved profitability in fiscal 2011 with net income of $20.6 million. We experienced a GAAP net loss of $12.8 million in fiscal 2012 as a result of certain non-recurring and other items. We may experience net losses in the future, and we cannot assure you that we will return to profitability in future periods.
Fluctuations in our tax obligations and effective tax rate and realization of our deferred tax assets, including net operating loss carryforwards, may result in volatility of our operating results.
We are subject to income taxes in the United States and certain foreign jurisdictions. We record income tax expense based on our estimates of future payments, which include reserves for uncertain tax positions in multiple tax jurisdictions, and valuation allowances related to certain net deferred tax assets, including net operating loss carryforwards. At any one time, many tax years are subject to audit by various taxing jurisdictions. The results of these audits and negotiations with taxing authorities may affect the ultimate settlement of these issues. Under
35
United States federal and state income tax laws, if over a rolling three-year period, the cumulative change in our ownership exceeds 50%, our ability to utilize our net operating loss carryforwards to offset future taxable income may be limited. Changes in ownership can occur due to transactions in our stock or the issuance of additional shares of our common stock or, in certain circumstances, securities convertible into our common stock. Certain transactions we have completed, including our going private transaction in June 2008, and the sale of shares contemplated in our initial public offering may impact the timing of the utilization of our net operating loss carryforwards. Furthermore, it is possible that transactions in our stock that may not be within our control may cause us to exceed the 50% cumulative change threshold and may impose a limitation on the utilization of our net operating loss carryforwards in the future. Any such limitation on the timing of utilizing our net operating loss carryforwards would increase the use of cash to settle our tax obligations. We expect that throughout the year there could be ongoing variability in our quarterly tax rates as events occur and exposures are evaluated.
In addition, our effective tax rate in a given financial statement period may be materially impacted by changes in the mix and level of earnings, timing of the utilization of net operating loss carryforwards, changes in the valuation allowance for deferred taxes or by changes to existing accounting rules or regulations. Further, tax legislation may be enacted in the future that could negatively impact our current or future tax structure and effective tax rates.
Changes to accounting rules or regulations may adversely affect our results of operations.
New accounting rules or regulations and varying interpretations of existing accounting rules or regulations have occurred and may occur in the future. A change in accounting rules or regulations may even affect our reporting of transactions completed before the change is effective, and future changes to accounting rules or regulations or the questioning of current accounting practices may adversely affect our results of operations. For example, in August 2010, the Financial Accounting Standards Board ("FASB") issued an exposure draft outlining proposed changes to current lease accounting in FASB Accounting Standards Codification ("Codification" or "ASC") 840, "Leases." In July 2011, the FASB made the decision to issue a revised exposure draft, which is expected to occur in the second quarter of 2013. The proposed new accounting pronouncement, if ultimately adopted in its proposed form, could result in significant changes to current accounting, including the capitalization of leases on the balance sheet that currently are recorded off balance sheet as operating leases. While this change would not impact the cash flow related to our store leases, it could adversely impact our balance sheet and could therefore impact our ability to raise financing from banks or other sources.
Our total assets include intangible assets with an indefinite life, goodwill and trademarks, and substantial amounts of long lived assets, principally property and equipment. Changes to estimates or projections used to assess the fair value of these assets, or operating results that are lower than our current estimates at certain store locations, may cause us to incur impairment charges that could adversely affect our results of operations.
Our total assets include intangible assets with an indefinite life, goodwill and trademarks, and substantial amounts of property and equipment. We make certain estimates and projections in connection with impairment analyses for these long lived assets. We also review the carrying value of these assets for impairment whenever events or changes in circumstances indicate that the carrying value of the asset may not be recoverable. We will record an impairment loss when the carrying value of the underlying asset, asset group or reporting unit exceeds its fair value. These calculations require us to make a number of estimates and projections of future results. If these estimates or projections change, we may be required to record additional impairment charges on certain of these assets. If these impairment charges are significant, our results of operations would be adversely affected. In that regard, we recorded a $2.1 million impairment charge on long-lived assets of certain underperforming stores in fiscal 2010, and we recorded charges amounting to $3.2 million related to retail store closures in fiscal 2011. No such related charges were recorded in fiscal 2012.
36
If we are unable to implement and maintain effective internal control over financial reporting in the future, the accuracy and timeliness of our financial reporting may be adversely affected.
We recently initiated steps to implement, evaluate, and test our internal control over financial reporting. We have not completed these procedures and until these controls are fully implemented and tested there is a possibility that a material misstatement would not be prevented or detected on a timely basis. We are not currently required to comply with Section 404 of the Sarbanes-Oxley Act of 2002, as amended (the "Sarbanes-Oxley Act"), and are therefore not currently required to make an assessment of the effectiveness of our internal controls. Our first assessment of the effectiveness of our internal controls will be included within our Annual Report on Form 10-K for the year ending February 1, 2014. During the evaluation and testing processes, if we identify one or more material weaknesses in our internal control over financial reporting, we will be unable to assert that our internal control over financial reporting is effective. In addition, our independent registered public accounting firm will be required to attest to the effectiveness of our internal control over financial reporting beginning with our Annual Report on Form 10-K for the year ending February 1, 2014. Even if our management concludes that our internal control over financial reporting is effective, our independent registered public accounting firm may issue a report that is qualified if it is not satisfied with our controls or the level at which our controls are documented, designed, operated, or reviewed, or if it interprets the relevant requirements differently from us. Material weaknesses may be identified during the audit process or at other times. During the course of the evaluation, documentation, or attestation, we or our independent registered public accounting firm may identify weaknesses and deficiencies that we may not be able to remedy in time to meet the deadline imposed by the Sarbanes-Oxley Act for compliance with Section 404.
Our reporting obligations as a public company will place a significant strain on our management and our operational and financial resources and systems for the foreseeable future. If we fail to timely achieve and maintain the adequacy of our internal control over financial reporting, we may not be able to produce reliable financial reports. Our failure to achieve and maintain effective internal control over financial reporting could prevent us from filing our periodic reports on a timely basis, which could result in the loss of investor confidence in the reliability of our financial statements, harm our business, and negatively impact the trading price of our common stock.
We incur new costs as a newly public company, and our management is required to devote substantial time to new compliance matters.
As a newly public company, we incur significant legal, accounting, and other expenses, including costs resulting from public company reporting obligations under the Exchange Act and the rules and regulations regarding corporate governance practices, including those under the Sarbanes-Oxley Act, the Dodd-Frank Act, and the listing requirements of the stock exchange on which our securities are listed. Our management and other personnel need to devote a substantial amount of time to ensure that we comply with all of these requirements. The reporting requirements, rules, and regulations increase our legal and financial compliance costs and make some activities more time-consuming and costly.
These rules and regulations make it more difficult and more expensive for us to obtain director and officer liability insurance, and we may be required to accept reduced policy limits and coverage or incur substantially higher costs to obtain the same or similar coverage. These factors could also make it more difficult for us to attract and retain qualified persons to serve on our board of directors, particularly to serve on our audit and compensation committees, or as executive officers.
37
Risks Related to Ownership of Our Common Stock
Our common stock price may be volatile or may decline regardless of our operating performance.
The market price for our common stock may be volatile. As a retailer, our results are significantly affected by factors outside our control, particularly consumer spending and consumer confidence, which can significantly affect our stock price. In addition, the market price of our common stock may fluctuate significantly in response to a number of other factors, including those described elsewhere in this "Risk Factors" section, as well as the following:
| • | quarterly variations in our operating results compared to market expectations; |
| • | changes in preferences of our customers; |
| • | announcements of new products or significant price reductions by us or our competitors; |
| • | size of the public float; |
| • | stock price performance of our competitors; |
| • | fluctuations in stock market prices and volumes; |
| • | default on our indebtedness; |
| • | actions by competitors or other shopping center tenants; |
| • | changes in senior management or key personnel; |
| • | changes in financial estimates by securities analysts or failure to meet their expectations; |
| • | actual or anticipated negative earnings or other announcements by us or other retail companies; |
| • | downgrades in our credit ratings or the credit ratings of our competitors; |
| • | natural disasters or other similar events; |
| • | issuances or expected issuances of capital stock; and |
| • | global economic, legal and regulatory changes unrelated to our performance. |
In addition, stock markets have experienced extreme price and volume fluctuations that have affected and continue to affect the market prices of equity securities of many retail companies. In the past, stockholders have instituted securities class action litigation following periods of market volatility. If we were involved in securities litigation, we could incur substantial costs and our resources and the attention of management could be diverted from our business.
Our filings and public disclosures have attracted the attention of a hedge fund manager whose investment strategies we believe include making investments that increase in value when stock prices decline. The fund manager has informed us of the fund's negative view of our Company and business and has threatened to publicize those views. There can be no assurance that this fund manager will not attempt to influence the broader investment community or otherwise attempt to disparage our Company or our brand, which could negatively affect our stock price.
Substantial future sales of our common stock, or the perception in the public markets that these sales may occur, may depress our stock price.
Sales of substantial amounts of our common stock in the public market, or the perception that these sales could occur, could adversely affect the price of our common stock and could impair our ability to raise capital through the sale of additional shares. As of the completion of our initial public offering, we had 36,971,500 shares of common stock issued. These shares of common stock are freely tradable without restriction under the Securities Act of 1933, as amended (the "Securities Act"), except for any shares of our common stock that are held or acquired by our directors, executive officers and other affiliates, as that term is defined in the Securities
38
Act, which are restricted securities under the Securities Act. Restricted securities may not be sold in the public market unless the sale is registered under the Securities Act or an exemption from registration is available. Moreover, under a registration rights agreement, Home Holdings, Catterton and Tower Three have registration rights whereby Home Holdings, Catterton or Tower Three can require us to register under the Securities Act any shares owned by Home Holdings, Catterton or Tower Three as of the date of our initial public offering. If our existing stockholders sell substantial amounts of our common stock in the public market, or if the public perceives that such sales could occur, this could have an adverse impact on the market price of our common stock, even if there is no relationship between such sales and the performance of our business.
We, our executive officers and directors, Home Holdings and certain other stockholders have agreed, subject to certain exceptions, not to sell or transfer any common stock, or securities convertible into, exchangeable for, exercisable for or repayable with common stock, for 180 days after the date of our initial public offering, without first obtaining written consent of Merrill Lynch, Pierce, Fenner & Smith Incorporated and Goldman, Sachs & Co., representatives of the underwriters of our initial public offering.
All of our shares of common stock outstanding as of the date of our initial public offering may be sold in the public market by existing stockholders 180 days after the date of our initial public offering, subject to applicable contractual limitations and limitations imposed under federal securities laws.
In the future, we may also issue our securities in connection with a capital raise or acquisitions. The amount of shares of our common stock issued in connection with a capital raise or acquisition could constitute a material portion of our then-outstanding shares of our common stock, which would result in dilution.
Anti-takeover provisions in our charter documents and Delaware law might discourage or delay acquisition attempts for us that you might consider favorable.
Our certificate of incorporation and bylaws contain provisions that may make the acquisition of our Company more difficult without the approval of our board of directors. These provisions:
| • | establish a classified board of directors so that not all members of our board of directors are elected at one time; |
| • | authorize the issuance of undesignated preferred stock, the terms of which may be established and the shares of which may be issued without stockholder approval, and which may include super voting, special approval, dividend or other rights or preferences superior to the rights of the holders of common stock; |
| • | after the date on which Home Holdings no longer holds a majority of the voting power of our outstanding common stock, prohibit stockholder action by written consent, which requires all stockholder actions to be taken at a meeting of our stockholders; |
| • | provide that our board of directors is expressly authorized to make, alter or repeal our bylaws; and |
| • | establish advance notice requirements for nominations for elections to our board of directors or for proposing matters that can be acted upon by stockholders at stockholder meetings. |
Our certificate of incorporation also contains a provision that provides us with protections similar to Section 203 of the Delaware General Corporation Law ("DGCL"), and prevents us from engaging in a business combination with a person who acquires at least 15% of our common stock for a period of three years from the date such person acquired such common stock unless board or stockholder approval is obtained prior to the acquisition, except that Catterton, Tower Three and Glenhill and any persons to whom Catterton, Tower Three and Glenhill sell their common stock will be deemed to have been approved by our board of directors, and thereby not subject to these restrictions. These anti-takeover provisions and other provisions under Delaware law could discourage, delay or prevent a transaction involving a change in control of our Company, even if doing so
39
would benefit our stockholders. These provisions could also discourage proxy contests and make it more difficult for you and other stockholders to elect directors of your choosing and to cause us to take other corporate actions you desire.
We do not expect to pay any cash dividends for the foreseeable future.
We do not anticipate that we will pay any cash dividends on shares of our common stock for the foreseeable future. Any determination to pay dividends in the future will be at the discretion of our board of directors and will depend upon results of operations, financial condition, contractual restrictions, restrictions imposed by applicable law and other factors our board of directors deems relevant. Accordingly, realization of a gain on your investment will depend on the appreciation of the price of our common stock, which may never occur. Investors seeking cash dividends in the foreseeable future should not purchase our common stock.
Home Holdings, Catterton and Tower Three continue to have significant influence over us, including over decisions that require the approval of stockholders, and their interests in our business may be different from yours.
Home Holdings owns approximately 25.9 million shares, or 66.7%, of our outstanding common stock (including outstanding restricted shares). Of that amount, Catterton beneficially owns approximately 11.8 million shares, or 30.3%, of our outstanding common stock, Tower Three beneficially owns approximately 11.1 million shares, or 28.6%, of our outstanding common stock and Glenhill beneficially owns approximately 3.0 million shares, or 7.8%, of our outstanding common stock.
Home Holdings, and through Home Holdings, Catterton, Tower Three and Glenhill, have significant influence over our reporting and corporate management and affairs and are able to control certain matters requiring stockholder approval. It is possible that the interests of our Principal Equity Holders may in some circumstances conflict with the interests of our other stockholders, including you. We have entered into a stockholders agreement with Home Holdings that provides for certain approval rights for Home Holdings and designation of directors by Home Holdings. The stockholders agreement provides that, for so long as Home Holdings and the Principal Equity Holders hold a majority of the voting power of our outstanding common stock, Home Holdings shall have the right to nominate a majority of the members of our board of directors and as long as Home Holdings and the Principal Equity Holders hold at least 30% of the voting power of our outstanding common stock, Home Holdings shall have the right to nominate two members of our board of directors. For so long as Home Holdings and the Principal Equity Holders own a majority of the voting power of our outstanding common stock, no action may be taken or vote approved by our board of directors or any committee thereof (other than the audit committee or any other committee of directors that may be created with the approval of Home Holdings as not being subject to this provision) without the affirmative vote of the Catterton and Tower Three designated directors. In addition, for so long as Home Holdings and the Principal Equity Holders hold at least 30% of the voting power of our outstanding common stock, certain actions may not be taken without the approval of Home Holdings. The stockholders agreement (and our certificate of incorporation) also provides for a waiver of the corporate opportunity doctrine with respect to Home Holdings and its affiliates, including the Principal Equity Holders. If Home Holdings or its affiliates, including the Principal Equity Holders, participate in any such corporate opportunity, Thomas Mottola and Barry Sternlicht, two of our directors, will also be afforded a waiver of the corporate opportunity doctrine in connection with any participation by them in any such corporate opportunity.
Our Principal Equity Holders are also in the business of making investments in companies and may from time to time acquire and hold interests in businesses that compete directly or indirectly with us. Our Principal Equity Holders may also pursue acquisition opportunities that are complementary to our business and, as a result, those acquisition opportunities may not be available to us. So long as Home Holdings or our Principal Equity Holders, or other funds controlled by or associated with our Principal Equity Holders, continue to indirectly own a significant amount of our outstanding common stock, even if such amount represents less than a majority, Home Holdings and our Principal Equity Holders will continue to be able to strongly influence our decisions.
40
The concentration of ownership in the hands of our Principal Equity Holders may have the effect of delaying, preventing or deterring a change of control of our Company, could deprive stockholders of an opportunity to receive a premium for their common stock as part of a sale of our Company and might ultimately affect the market price of our common stock.
We are a "controlled company" within the meaning of the New York Stock Exchange ("NYSE") listing requirements and, as a result, qualify for, and intend to rely on, exemptions from certain corporate governance requirements. You will not have the same protections afforded to stockholders of companies that are subject to such corporate governance requirements.
Because of the aggregate voting power over our Company held by Home Holdings, we are considered a "controlled company" for the purposes of the NYSE listing requirements. As such, we are exempt from the corporate governance requirements that our board of directors, our compensation committee and our nominating and corporate governance committee meet the standard of independence established by those corporate governance requirements. The independence standards are intended to ensure that directors who meet the independence standard are free of any conflicting interest that could influence their actions as directors.
We intend to utilize these exemptions afforded to a "controlled company." Accordingly, you do not have the same protections afforded to stockholders of companies that are subject to all of the corporate governance requirements of the NYSE.
| Item 1B. | Unresolved Staff Comments |
None.
| Item 2. | Properties |
We leased approximately 935,000 gross square feet for our 65 Galleries, 3 Full Line Design Galleries, 3 Baby & Child Galleries and 13 outlet stores that were open as of February 2, 2013. The initial lease term of our retail stores is generally 10 – 15 years. Certain leases contain renewal options for up to 20 years. Most leases for our retail stores provide for a minimum rent, typically including escalating rent increases, plus a percentage rent based upon sales after certain minimum thresholds are achieved. The leases generally require us to pay insurance, utilities, real estate taxes and repair and maintenance expenses. We also lease approximately 35,000 square feet for offsite storage.
41
Leased Properties
The following table summarizes the location and size of our leased distribution centers and corporate facilities occupied as of February 2, 2013:
| Location | Purpose | Lease Expiration | Occupied Square Footage (Approximate) | |||||
| Distribution Centers | ||||||||
North East, Maryland | Distribution center | February 2028 | 1,200,000 | |||||
Mira Loma, California | Distribution center / Home delivery | June 2020 | 886,000 | |||||
West Jefferson, Ohio | Distribution center / Home delivery | April 2028 | 805,000 | |||||
Baltimore, Maryland | Distribution center / Home delivery | June 2014 | 508,000 | |||||
Ft. Worth, Texas | Distribution center | (1) | 300,000 | |||||
Tracy, California | Home delivery | September 2016 | 151,000 | |||||
Avenel, New Jersey | Home delivery | November 2016 | 114,000 | |||||
Houston, Texas | Home delivery | August 2018 | 71,000 | |||||
| Corporate Facilities | ||||||||
Corte Madera, California | Corporate headquarters | (2) | 240,000 | |||||
Richmond, California | Warehouse | September 2022 | 200,000 | |||||
San Rafael, California | Warehouse | July 2013 | 10,000 | |||||
| (1) | Relates to a short-term lease agreement to support the startup of our new distribution center in Grand Prairie, Texas which is expected to commence operations in the second half of 2013. We intend to exit this interim facility shortly after commencing operations at the Grand Prairie facility. |
| (2) | Lease agreements for our corporate headquarters expire between July 2013 and September 2022. Includes approximately 15,000 square feet of warehouse space. |
Owned Properties
We currently own one store, our approximately 8,000 square foot Gallery in San Francisco's Design District.
We believe that our current offices and facilities are in good condition, are being used productively and are adequate to meet our requirements for the foreseeable future.
42
| Item 3. | Legal Proceedings |
From time to time we and/or our management are involved in litigation, claims and other proceedings relating to the conduct of our business, including but not limited to consumer protection class action litigation, claims related to our collection of reproductions, claims related to our employment practices, claims of intellectual property infringement, including with respect to trademarks and trade dress, and claims asserting unfair competition and unfair business practices by third parties. In addition, from time to time, we are subject to product liability and personal injury claims for the products that we sell and the stores we operate. Subject to certain exceptions, our purchase orders generally require the vendor to indemnify us against any product liability claims; however, if the vendor does not have insurance or becomes insolvent, we may not be indemnified. In addition, we could face a wide variety of employee claims against us, including general discrimination, privacy, labor and employment, ERISA and disability claims. Any claims could result in litigation against us and could also result in regulatory proceedings being brought against us by various federal and state agencies that regulate our business, including the U.S. Equal Employment Opportunity Commission. Often these cases raise complex factual and legal issues, which are subject to risks and uncertainties and which could require significant management time. Litigation and other claims and regulatory proceedings against us could result in unexpected expenses and liability and could also materially adversely affect our operations and our reputation.
| Item 4. | Mine Safety Disclosures |
Not applicable.
43
PART II
| Item 5. | Market For Registrant's Common Equity, Related Stockholder Matters and Issuer Purchases of Equity Securities |
Market Information and Dividend Policy
Our common stock began trading on the NYSE, under the symbol "RH" on November 2, 2012. The price range per share of common stock presented below represent the highest and lowest closing prices for our common stock on the NYSE for each full quarterly period since our initial public offering.
| Highest | Lowest | |||||||
Fiscal 2012 | ||||||||
Fourth Quarter (from November 2, 2012) | $ | 37.99 | $ | 31.10 | ||||
The number of stockholders of record of our common stock as of April 16, 2013 was 114. This number excludes stockholders whose stock is held in nominee or street name by brokers. No dividends have been declared or paid on our common stock. We do not currently anticipate that we will pay any cash dividends on our common stock in the foreseeable future.
Stock Performance Graph
This performance graph shall not be deemed "soliciting material" or to be "filed" with the SEC for purposes of Section 18 of the Securities Exchange Act of 1934, as amended (the "Exchange Act"), or otherwise subject to the liabilities under that Section, and shall not be deemed to be incorporated by reference into any filing of Restoration Hardware Holdings, Inc. under the Securities Act of 1933, as amended, or the Exchange Act.
The following graph and table compare the cumulative total stockholder return for our common stock during the period from November 2, 2012 (the date our common stock commenced trading on the NYSE) through February 2, 2013 in comparison to the NYSE Composite Index and the S&P Retailing Select Index, our peer group index. The graph and the table below assume that $100 was invested at the market close on November 2, 2012 in the common stock of Restoration Hardware Holdings, Inc., the NYSE Composite Index and the S&P Retailing Select Index. Data for the NYSE Composite Index and the S&P Retailing Select Index assumes reinvestments of dividends. The comparisons in the graph and table are required by the SEC and are not intended to be indicative of possible future performance of our common stock.
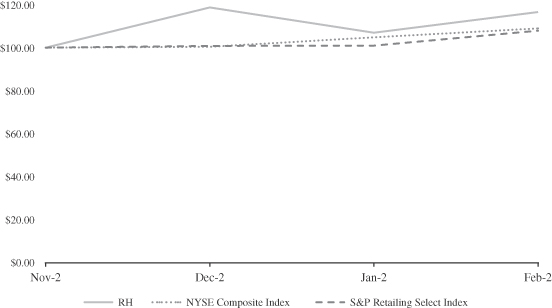
| 11/2/2012 | 12/2/2012 | 1/2/2013 | 2/2/2013 | |||||||||||||
Restoration Hardware Holdings, Inc. | 100.00 | 118.65 | 106.85 | 116.50 | ||||||||||||
NYSE Composite Index | 100.00 | 100.31 | 104.82 | 108.87 | ||||||||||||
S&P Retailing Select Index | 100.00 | 100.80 | 100.85 | 107.88 | ||||||||||||
44
Unregistered Sale of Equity Securities and Issuer Purchases of Equity Securities
On November 1, 2012, Restoration Hardware Holdings, Inc. issued additional shares to Home Holdings, and Restoration Hardware Holdings, Inc. acquired all of the outstanding shares of Restoration Hardware, Inc. from Home Holdings. In addition, shares of our common stock were issued to the participants of the Team Resto Ownership Plan in replacement of prior unit awards under the Team Resto Ownership Plan. As a result of these transactions, as of November 1, 2012 (before giving effect to the initial public offering), 32,188,891 shares of our common stock were outstanding.
Use of Proceeds from the Initial Public Offering
On November 1, 2012, our Registration Statement on Form S-1, as amended (File No. 333-176767), was declared effective, pursuant to which we registered the offering and sale of 4,782,609 shares of common stock by Restoration Hardware Holdings, Inc., the associated sale of 381,723 shares of common stock by selling stockholders, and the sale pursuant to the underwriters' over-allotment option of an additional 774,650 shares of common stock by selling stockholders, at a price of $24.00 per share. On November 7, 2012, Restoration Hardware Holdings, Inc. sold all 4,782,609 shares of common stock for an aggregate offering price of approximately $114.8 million, the selling stockholders sold 1,156,373 shares of common stock, including 774,650 shares pursuant to the underwriters' over-allotment option, for an aggregate offering price of approximately $27.8 million, and the offering terminated. Merrill Lynch, Pierce, Fenner & Smith Incorporated, Goldman, Sachs & Co., Robert W. Baird & Co. Incorporated, William Blair & Company, L.L.C., Piper Jaffray & Co. and Stifel, Nicolaus & Company, Incorporated acted as the underwriters.
As a result of the initial public offering, we raised approximately $97.7 million in net proceeds after deducting underwriting discounts and commissions of approximately $8.1 million and estimated expenses in connection with the offering of $9.1 million. We did not receive any proceeds from the sale of stock by the selling stockholders. On November 7, 2012, we made payments of $75.7 million on Restoration Hardware, Inc.'s revolving line of credit and repaid Restoration Hardware, Inc.'s outstanding term loan of $15.0 million in full. Such payments were funded by the proceeds received as a result of the initial public offering. No payments were made by us to directors, officers or persons owning ten percent or more of our common stock or to their associates, or to our affiliates, other than payments of $7.0 million in the aggregate made on November 7, 2012, to pay management fees to affiliates of Catterton, Tower Three and Glenhill pursuant to the terms of the management services agreement that terminated upon consummation of the initial public offering.
| Item 6. | Selected Consolidated Financial Data |
The following tables present Restoration Hardware Holdings, Inc.'s consolidated financial and operating data as of the dates and for the periods indicated.
Restoration Hardware Holdings was formed as a Delaware corporation on August 18, 2011. On November 7, 2012, Restoration Hardware Holdings, Inc. completed an initial public offering and acquired all of the outstanding shares of capital stock of Restoration Hardware, Inc. In connection with the initial public offering, common stock of Restoration Hardware Holdings, Inc. was issued in replacement of prior unit awards under the Team Resto Ownership Plan. These transactions are referred to as the "Reorganization." Restoration Hardware Holdings, Inc. has not engaged in any business or other activities except in connection with its formation and the Reorganization. Accordingly, all financial and other information herein relating to periods prior to the completion of the Reorganization is that of Restoration Hardware, Inc.
All of the outstanding capital stock of Restoration Hardware, Inc. was acquired on June 16, 2008, by Home Holdings, which we refer to as the "Acquisition." As a result of the Acquisition, a new basis of accounting was created beginning June 17, 2008. The period prior to the Acquisition is referred to as the "Predecessor" period and the periods after the Acquisition are referred to as the "Successor" periods. The Predecessor period presented
45
includes the period from February 3, 2008 through June 16, 2008, reflecting approximately 19 weeks of operations, and the Successor periods include the period from June 17, 2008 through January 31, 2009, reflecting approximately 33 weeks of operations. Due to the Acquisition, the financial statements for the Successor periods are not comparable to those of the Predecessor period.
The selected consolidated financial data as of February 2, 2013 and January 28, 2012 and for the fiscal years ended February 2, 2013 , January 28, 2012 and January 29, 2011, were derived from consolidated financial statements included in Item 8 - Financial Statements and Supplementary Data . The selected consolidated financial data as of January 29, 2011 and as of and for the periods ended January 30, 2010, January 31, 2009 and June 16, 2008, were derived from consolidated financial statements for such years not included herein.
In the third quarter of fiscal 2012, we changed our accounting policy for recognizing stock-based compensation expense which has been applied retrospectively to the periods presented below. For further discussion, see footnote 1 to the table below.
The selected historical consolidated data presented below should be read in conjunction with Item 1A - Risk Factors, Item 7 - Management's Discussion and Analysis of Financial Condition and Results of Operations , our consolidated financial statements and the notes to our consolidated financial statements.
| Successor | Predecessor | |||||||||||||||||||||||||
| Year Ended | Period from June 17, 2008 Through January 31, 2009 | Period from February 3, 2008 Through June 16, 2008 | ||||||||||||||||||||||||
| February 2, 2013 | January 28, 2012 | January 29, 2011 | January 30, 2010 | |||||||||||||||||||||||
| (dollars in thousands, excluding share, per share and per square foot data) | ||||||||||||||||||||||||||
Statement of Operations Data: | ||||||||||||||||||||||||||
Net revenues | $ | 1,193,046 | $ | 958,084 | $ | 772,752 | $ | 625,685 | $ | 498,581 | $ | 195,437 | ||||||||||||||
Cost of goods sold | 756,597 | 601,735 | 501,132 | 412,629 | 308,448 | 140,088 | ||||||||||||||||||||
|
|
|
|
|
|
|
|
|
|
|
| |||||||||||||||
Gross profit | 436,449 | 356,349 | 271,620 | 213,056 | 190,133 | 55,349 | ||||||||||||||||||||
Selling, general and administrative expenses ( 1 ) | 505,485 | 329,506 | 274,836 | 238,889 | 213,011 | 75,396 | ||||||||||||||||||||
|
|
|
|
|
|
|
|
|
|
|
| |||||||||||||||
Income (loss) from operations | (69,036 | ) | 26,843 | (3,216 | ) | (25,833 | ) | (22,878 | ) | (20,047 | ) | |||||||||||||||
Interest expense | (5,776 | ) | (5,134 | ) | (3,150 | ) | (3,241 | ) | (4,907 | ) | (2,731 | ) | ||||||||||||||
|
|
|
|
|
|
|
|
|
|
|
| |||||||||||||||
Income (loss) before income taxes | (74,812 | ) | 21,709 | (6,366 | ) | (29,074 | ) | (27,785 | ) | (22,778 | ) | |||||||||||||||
Income tax expense | (62,023 | ) | 1,121 | 685 | (423 | ) | (201 | ) | 508 | |||||||||||||||||
|
|
|
|
|
|
|
|
|
|
|
| |||||||||||||||
Net income (loss) | $ | (12,789 | ) | $ | 20,588 | $ | (7,051 | ) | $ | (28,651 | ) | $ | (27,584 | ) | $ | (23,286 | ) | |||||||||
|
|
|
|
|
|
|
|
|
|
|
| |||||||||||||||
Weighted-average number of basic and diluted shares outstanding | 9,428,828 | 468 | 100 | 100 | 100 | 38,969,000 | ||||||||||||||||||||
Basic and diluted net income (loss) per share | $ | (1.36 | ) | $ | 43,991 | $ | (70,510 | ) | $ | (286,510 | ) | $ | (275,840 | ) | $ | (0.60 | ) | |||||||||
46
| Successor | Predecessor | |||||||||||||||||||||||||
| Year Ended | Period from June 17, 2008 Through January 31, 2009 | Period from February 3, 2008 Through June 16, 2008 | ||||||||||||||||||||||||
| February 2, 2013 | January 28, 2012 | January 29, 2011 | January 30, 2010 | |||||||||||||||||||||||
| (dollars in thousands, excluding share, per share and per square foot data) | ||||||||||||||||||||||||||
Other Financial and Operating Data: | ||||||||||||||||||||||||||
Growth in net revenues: | ||||||||||||||||||||||||||
Stores ( 3 ) | 20 | % | 22 | % | 15 | % | (6 | )% | - | - | ||||||||||||||||
Direct | 30 | % | 27 | % | 37 | % | (15 | )% | - | - | ||||||||||||||||
Total | 25 | % | 24 | % | 24 | % | (10 | )% | - | - | ||||||||||||||||
Retail ( 4 ) : | ||||||||||||||||||||||||||
Comparable store sales change ( 5 ) | 28 | % | 25 | % | 19 | % | (7 | )% | (8 | )% | (12 | )% | ||||||||||||||
Retail stores open at end of period | 71 | 74 | 91 | 95 | 99 | 100 | ||||||||||||||||||||
Total leased square footage at end of period (in thousands) | 768 | 808 | 970 | 1,015 | 1,057 | 1,061 | ||||||||||||||||||||
Total leased selling square footage at end of period (in thousands) ( 6 ) | 501 | 516 | 613 | 642 | 670 | 671 | ||||||||||||||||||||
Retail sales per leased selling square foot ( 7 ) | $ | 1,143 | $ | 846 | $ | 635 | $ | 525 | $ | 406 | $ | 147 | ||||||||||||||
Direct: | ||||||||||||||||||||||||||
Catalogs circulated (in thousands) ( 8 ) | 32,712 | 26,052 | 46,507 | 31,336 | 26,831 | 13,771 | ||||||||||||||||||||
Catalog pages circulated (in millions) ( 8 ) | 16,029 | 8,848 | 6,260 | 4,418 | 3,507 | 2,168 | ||||||||||||||||||||
Direct as a percentage of net revenues ( 9 ) | 46 | % | 44 | % | 43 | % | 39 | % | 41 | % | 43 | % | ||||||||||||||
Capital expenditures | $ | 49,058 | $ | 25,593 | $ | 39,907 | $ | 2,024 | $ | 13,428 | $ | 3,821 | ||||||||||||||
Adjusted EBITDA ( 10 ) | $ | 96,571 | $ | 80,154 | $ | 41,097 | $ | 17,596 | $ | 4,386 | $ | (8,219 | ) | |||||||||||||
| Successor | ||||||||||||||||||||
| February 2, 2013 | January 28, 2012 | January 29, 2011 | January 30, 2010 | January 31, 2009 | ||||||||||||||||
| (in thousands) | ||||||||||||||||||||
Balance Sheet Data: | ||||||||||||||||||||
Cash and cash equivalents | $ | 8,354 | $ | 8,512 | $ | 13,364 | $ | 13,186 | $ | 8,603 | ||||||||||
Working capital (excluding cash and cash equivalents) (1 1 ) | 267,905 | 156,506 | 103,894 | 57,058 | 102,850 | |||||||||||||||
Total assets | 789,613 | 586,810 | 501,991 | 431,528 | 494,773 | |||||||||||||||
Line of credit | 82,501 | 107,502 | 111,837 | 57,442 | 110,696 | |||||||||||||||
Term loan | - | 14,798 | - | - | - | |||||||||||||||
Total debt (including current portion) (1 2 ) | 87,029 | 131,040 | 116,995 | 61,652 | 117,515 | |||||||||||||||
Total stockholders' equity | 451,611 | 250,463 | 215,804 | 221,079 | 238,670 | |||||||||||||||
| (1) | In the third quarter of fiscal 2012, we changed our policy for recognizing stock-based compensation expense from the graded method of accounting to the straight-line method of accounting for our pre-Reorganization time-based units (or service-only awards). This change in accounting had the same impact on our selling, |
47
| general and administrative expenses and net income (loss) for all periods presented. The table below presents the impact to our net income (loss) as a result of this change in accounting policy. The impact to fiscal 2009 was immaterial and there was no impact for years prior to 2009. See Note 3- Change in Accounting Principle-Stock-Based Compensation to our audited consolidated financial statements. |
| Year Ended | ||||||||
| January 28, 2012 | January 29, 2011 | |||||||
| (in thousands) | ||||||||
Net income (loss)-as reported | $ | 20,341 | $ | (8,074 | ) | |||
Change in accounting policy adjustment | 247 | 1,023 | ||||||
|
|
|
| |||||
Net income (loss)-as revised | $ | 20,588 | $ | (7,051 | ) | |||
|
|
|
| |||||
| (2) | As of the end of fiscal 2012, our U.S. operations achieved a position of cumulative profits (adjusted for permanent differences) for the most recent three-year period. We concluded that this record of cumulative profitability in recent years, coupled with our business plan for profitability in future periods, provided assurance that our future tax benefits more likely than not would be realized. Accordingly, in the three and twelve months ended February 2, 2013, we released all of our U.S. valuation allowance of $57.2 million against net deferred tax assets. |
| (3) | Stores data represents retail stores plus outlet stores. |
| (4) | Retail data has been calculated based upon our retail stores, and excludes our outlet stores. |
| (5) | Comparable store sales have been calculated based upon retail stores that were open at least fourteen full months as of the end of the reporting period and did not change square footage by more than 20% between periods. If a store is closed for seven days during a month, that month will be excluded from comparable store sales. Comparable store net revenues exclude revenues from outlet stores. Because fiscal 2012 was a 53-week year, comparable store sales percentage for fiscal 2012 excludes the extra week of sales. |
| (6) | Leased selling square footage is retail space at our stores used to sell our products. Leased selling square footage excludes backrooms at retail stores used for storage office space or similar matters. Leased selling square footage excludes exterior sales space located outside a store, such as courtyards, gardens and rooftops. Leased selling square footage for fiscal 2012, fiscal 2011 and fiscal 2010 includes approximately 4,500 square feet related to one owned store location. |
| (7) | Retail sales per leased selling square foot is calculated by dividing total net revenues for all retail stores, comparable and non-comparable, by the average leased selling square footage for the period. |
Average leased selling square footage for the 2008 Predecessor period is calculated by adding the average leased selling square footage for the first quarter of the year ended January 31, 2009, and for the period May 4, 2008, through June 16, 2008, and dividing by two. Average leased selling square footage for the period May 4, 2008, through June 16, 2008, is calculated by taking the total leased selling square footage at the beginning of the period plus the total leased selling square footage at the end of the period and dividing by two.
Average leased selling square footage for the 2008 Successor period is calculated by adding the average leased selling square footage for three periods, being the period June 17, 2008, through August 2, 2008, the third quarter of the year ending January 31, 2009, and the fourth quarter of the year ended January 31, 2009, and dividing by three. Average leased selling square footage for the period June 17, 2008, through August 2, 2008, is calculated by taking the total leased selling square footage at the beginning of the period plus the total leased selling square footage at the end of the period and dividing by two.
| (8) | The catalogs and catalog pages circulated from period to period do not take into account different page sizes per catalog distributed. Page sizes and page counts vary for different catalog mailings and we sometimes mail different versions of a catalog at the same time. Accordingly, period to period comparisons of catalogs circulated and catalog pages circulated do not take these variations into account. |
| (9) | Direct revenues include sales through our catalogs and websites. |
| (10) | EBITDA and adjusted EBITDA are supplemental measures of financial performance that are not required by, or presented in accordance with, GAAP. We define EBITDA as consolidated net income (loss) before |
48
| depreciation and amortization, interest expense and provision for income taxes. We define adjusted EBITDA as consolidated net income (loss) before depreciation and amortization, interest expense and provision for income taxes, adjusted for the impact of certain non-recurring and other items that we do not consider representative of our ongoing operating performance. |
We believe that EBITDA and adjusted EBITDA are useful measures of operating performance, as they eliminate expenses that are not reflective of the underlying business performance, facilitate a comparison of our operating performance on a consistent basis from period-to-period and provide for a more complete understanding of factors and trends affecting our business. We also use adjusted EBITDA as one of the primary methods for planning and forecasting overall expected performance and for evaluating on a quarterly and annual basis actual results against such expectations, and as the basis of our Management Incentive Plan ("MIP"), which is our cash based-incentive compensation program designed to motivate and reward annual performance for eligible employees. Additionally, EBITDA is frequently used by analysts, investors and other interested parties to evaluate companies in our industry. We use EBITDA and adjusted EBITDA, alongside other GAAP measures such as gross profit, operating income (loss) and net income (loss), to measure profitability, as a key profitability target in our annual and other budgets, and to compare our performance against that of peer companies.
EBITDA and adjusted EBITDA are not GAAP measures of our financial performance or liquidity and should not be considered as alternatives to net income (loss) or net income (loss) per share as a measure of financial performance, cash flows from operating activities as a measure of liquidity, or any other performance measure derived in accordance with GAAP and they should not be construed as an inference that our future results will be unaffected by unusual or non-recurring items. Additionally, EBITDA and adjusted EBITDA are not intended to be measures of free cash flow for management's discretionary use, as they do not consider certain cash requirements such as tax payments and debt service requirements and certain other cash costs that may recur in the future. EBITDA and adjusted EBITDA contain certain other limitations, including the failure to reflect our cash expenditures, cash requirements for working capital needs and cash costs to replace assets being depreciated and amortized. In addition, these non-GAAP measures exclude certain non-recurring and other charges.
In evaluating these non-GAAP measures, you should be aware that in the future we may incur expenses that are the same as or similar to some of the adjustments in these non-GAAP measures. Our presentation of these non-GAAP measures should not be construed to imply that our future results will be unaffected by any such adjustments. Management compensates for these limitations by relying primarily on our GAAP results and by using these non-GAAP only supplementally. These non-GAAP measures are not necessarily comparable to other similarly titled captions of other companies due to different methods of calculation.
49
A reconciliation of net income (loss) to EBITDA and adjusted EBITDA is set forth below:
| Successor | Predecessor (a) | |||||||||||||||||||||||||
| Year Ended | Period from June 17, 2008 Through January 31, 2009 | Period from February 3, 2008 Through June 16, 2008 | ||||||||||||||||||||||||
| February 2, 2013 | January 28, 2012 | January 29, 2011 | January 30, 2010 | |||||||||||||||||||||||
| (in thousands) | ||||||||||||||||||||||||||
Net income (loss) | $ | (12,789 | ) | $ | 20,588 | $ | (7,051 | ) | $ | (28,651 | ) | $ | (27,584 | ) | $ | (23,286 | ) | |||||||||
Depreciation and amortization | 26,748 | 29,186 | 31,263 | 43,065 | 50,222 | 7,934 | ||||||||||||||||||||
Interest expense | 5,776 | 5,134 | 3,150 | 3,241 | 4,907 | 2,731 | ||||||||||||||||||||
Income tax expense (benefit) | (62,023 | ) | 1,121 | 685 | (423 | ) | (201 | ) | 508 | |||||||||||||||||
|
|
|
|
|
|
|
|
|
|
|
| |||||||||||||||
EBITDA | (42,288 | ) | 56,029 | 28,047 | 17,232 | 27,344 | (12,113 | ) | ||||||||||||||||||
Management and board fees (b) | 4,258 | 10,715 | 4,793 | 4,620 | 1,985 | 91 | ||||||||||||||||||||
Non-cash and other one-time compensation (c) | 116,157 | 7,907 | 1,119 | 592 | - | 2,319 | ||||||||||||||||||||
Terminated operations (d) | - | 1,580 | 352 | 2,604 | 3,821 | 884 | ||||||||||||||||||||
Severance and other transaction costs (e) | - | 621 | 1,797 | 1,521 | 368 | 600 | ||||||||||||||||||||
Impairment of long-lived assets (f) | - | - | 2,115 | 2,304 | 3,868 | - | ||||||||||||||||||||
Lease termination costs (g) | (386 | ) | 3,110 | - | - | - | - | |||||||||||||||||||
Amortization of inventory fair value adjustment (h) | - | - | - | (12,780 | ) | (35,075 | ) | - | ||||||||||||||||||
Non-capitalized IPO costs ( i ) | - | - | 2,351 | - | - | - | ||||||||||||||||||||
Special committee investigation and remediation (j) | 4,778 | - | - | - | - | - | ||||||||||||||||||||
Initial public offering costs (k) | 10,755 | - | - | - | - | - | ||||||||||||||||||||
Anti-dumping exposure ( l ) | 3,250 | - | - | - | - | - | ||||||||||||||||||||
Other adjustments allowable under our agreements with our stockholders ( m ) | 47 | 192 | 523 | 1,503 | 2,075 | - | ||||||||||||||||||||
|
|
|
|
|
|
|
|
|
|
|
| |||||||||||||||
Adjusted EBITDA | $ | 96,571 | $ | 80,154 | $ | 41,097 | $ | 17,596 | $ | 4,386 | $ | (8,219 | ) | |||||||||||||
|
|
|
|
|
|
|
|
|
|
|
| |||||||||||||||
| (a) | We have presented adjusted EBITDA for the Predecessor periods consistently with the Successor periods to present information on a comparable basis for those periods. |
| (b) | Includes fees and expenses paid in accordance with our management services agreement with Home Holdings in the Successor periods, as well as fees and expense reimbursements paid to our board of directors prior to the initial public offering in both the Predecessor and Successor periods. |
| (c) | Fiscal 2012 includes a $92.0 million non-cash compensation charge related to equity grants at the time of the Reorganization, as well as a non-cash compensation charge of $23.1 million related to the performance-based vesting of certain shares granted to Mr. Alberini and Mr. Friedman. Fiscal 2011 includes a $6.4 million compensation charge related to the repayment of loans owed to Home Holdings by Gary Friedman, through the reclassification by Home Holdings of Mr. Friedman's Class A and Class A-1 ownership units into an equal number of Class A Prime and Class A-1 Prime ownership units. Mr. Friedman served as our Chairman and Co-Chief Executive Officer at the time of such loan repayment. In addition, amounts include stock-based compensation expense incurred prior to the initial public offering. |
| (d) | Includes the impact of divesting our Brocade Home brand, closing four temporary clearance centers operated from October 2008 to March 2010, costs related to closing of The Michaels Furniture Company and costs related to the restructuring of our Shanghai office location. |
| (e) | Amounts in the 2008 Predecessor period and the 2008 Successor period include severance costs, and transaction costs associated with our Acquisition by Home Holdings. Amounts in fiscal 2009, fiscal 2010, and fiscal 2011 generally include executive severance and other related costs. |
| (f) | Includes costs related to impairment of long-lived assets related to our retail store operations. |
50
| (g) | Includes lease termination costs for retail stores that were closed prior to their respective lease termination dates. The amount in fiscal 2012 relates to changes in estimates regarding liabilities for future lease payments for closed stores. |
| (h) | Represents non-cash impact of amortizing the net fair value adjustment to inventory recorded in connection with the purchase price allocation for the Acquisition over the period of the inventory turn. |
| (i) | Represents costs related to our efforts to pursue an initial public offering. |
| (j) | Represents legal and other professional fees, incurred in connection with the investigation conducted by the special committee of the board of directors relating to our former Chairman and Co-Chief Executive Officer, Gary Friedman, and our subsequent remedial actions. |
| (k) | Represents costs incurred in connection with our initial public offering, including a fee of $7.0 million to Catterton, Tower Three and Glenhill in accordance with our management services agreement, payments of $2.2 million to certain former executives and bonus payments to employees of $1.3 million. |
| (l) | Represents expense incurred as a result of increased tariff obligations of one of our foreign suppliers following the U.S. Department of Commerce's review of the anti-dumping duty order on wooden bedroom furniture from China for the period from January 1, 2011 through December 31, 2011. |
| (m) | Represents items which management believes are not indicative of our ongoing operating performance. The 2008 Successor period includes consulting fees related to organizational matters following the Acquisition. Fiscal 2009 adjustments include one-time start-up costs associated with Baby & Child and occupancy costs for corporate office space exited by us as part of the Acquisition. Fiscal 2010 and fiscal 2011 adjustments include consulting fees related to organizational matters and state franchise tax amounts. All periods include foreign exchange gains and losses. |
| (11) | Working capital is defined as current assets, excluding cash and cash equivalents, less current liabilities, excluding the current portion of long-term debt. |
| (12) | Total debt (including current portion) includes the revolving line of credit, term loan, and capital lease obligations. |
| Item 7. | Management's Discussion and Analysis of Financial Condition and Results of Operations |
Overview
We are a leading luxury retailer in the home furnishings marketplace. Our collections of timeless, updated classics and reproductions are presented consistently across our sales channels in sophisticated and unique lifestyle settings that we believe are on par with world-class interior designers. We offer dominant merchandise assortments across a growing number of categories, including furniture, lighting, textiles, bathware, décor, outdoor and garden, tableware and children's furnishings. Our business is fully integrated across our multiple channels of distribution, consisting of our stores, catalogs and websites. We position our stores as showrooms for our brand, while our catalogs and websites act as virtual extensions of our stores. As of February 2, 2013, we operated 65 Galleries, 3 Full Line Design Galleries and 3 Baby & Child Galleries, as well as 13 outlet stores throughout the United States and Canada.
In order to drive growth across our business, we are focused on the following key strategies:
| • | Transform Our Real Estate Platform. We believe we have an opportunity to significantly increase our sales by transforming our real estate platform from our existing retail footprint to a portfolio focused on Full Line Design Galleries. Our Full Line Design Galleries are sized based on the market potential and the size of our assortment. As of February 2, 2013, we had three Full Line Design Galleries that averaged approximately 21,800 selling square feet, more than three times the size of our average Gallery. We have found that we experience higher sales across all of our channels when we showcase more of our assortment. We have identified approximately 50 key metropolitan markets where we can open new Full Line Design Galleries in iconic or high-profile locations that are representative of our luxury brand positioning. |
We opened our first three Full Line Design Galleries in Los Angeles in June 2011, Houston in November 2011 and Scottsdale in November 2012. In the Los Angeles and Houston markets, store demand increased
51
by approximately 90% and 60%, respectively, and direct demand increased by approximately 30% and 45%, respectively in the first full year of operations of those Full Line Design Galleries. In the Scottsdale market, we experienced an approximate 80% increase in store demand and an approximate 75% increase in direct demand during the months from the store's opening in November 2012 through the end of fiscal 2012. In April 2013 we opened our fourth Full Line Design Gallery in Boston.
| • | Expand Our Offering and Increase Our Market Share. We believe we have a significant opportunity to increase our market share by: |
| • | Growing our merchandise assortment and introducing new products and categories, including current initiatives in furniture, rugs, lighting, tableware, children's furnishings and decorative accessories; |
| • | Expanding our service offerings, including interior design, product customization and gift registry services; and |
| • | Exploring and testing new business opportunities complementary to our core business that leverage our defining strengths of taste, style and innovation, such as the planned launch of our Contemporary Art business. |
| • | Increase Brand Awareness. We will continue to increase our brand awareness and customer loyalty through our real estate transformation, our circulation strategy, our digital marketing initiatives, and our increased advertising and public relations efforts. |
| • | Pursue International Expansion. We plan to strategically expand our business into select countries outside of the United States and Canada over the next several years. We believe that our luxury brand positioning and unique aesthetic will have strong international appeal. |
| • | Increase Operating Margins. We have the opportunity to continue to improve our operating margins by leveraging our fixed occupancy costs and scalable infrastructure. |
Our fiscal 2012 results reflect the ongoing strength of our business. We have continued to take market share, and at the same time invested in our infrastructure and supply chain to support future growth. Key financial achievements of fiscal 2012 include:
| • | Net revenues increased 25% to $1.2 billion, on top of a 24% increase in fiscal 2011 and a 24% increase in fiscal 2010. |
| • | Comparable store sales increased 28% on top of a 25% increase in fiscal 2011 and a 19% increase in fiscal 2010. |
| • | Direct net revenues increased 30% on top of a 27% increase in fiscal 2011 and a 37% increase in fiscal 2010. |
| • | The fourth quarter of fiscal 2012 marked our 12th consecutive quarter of double digit revenue growth. |
| • | Our GAAP net loss was $12.8 million. Our adjusted net income increased 43% to $37.7 million. |
See "Basis of Presentation and Results of Operations" for a discussion of adjusted net income and a reconciliation of the differences between adjusted net income and net income (loss).
Factors Affecting Our Operating Results
Various factors affected our results for the periods presented in this "Management's Discussion and Analysis of Financial Condition and Results of Operations" including the following:
Overall Economic Trends . The industry in which we operate is cyclical, and consequently our revenues are affected by general economic conditions. For example, reduced consumer confidence and lower availability and higher cost of consumer credit reduces demand for our products and limits our ability to increase prices or sustain price increases. We expect that some of the economic factors that have been in place for the last several years,
52
including the continuing economic uncertainty (particularly in the housing market in the United States) may continue in future periods. Based on our research, we believe that the domestic housewares and home furnishings market is anticipated to grow at a compound annual growth rate of 3 – 4% between 2011 and 2015. However, there can be no assurance that the market will grow at this rate. The growth rate of the market could be affected by macroeconomic conditions in the United States. Although we believe our annual net revenues currently represent less than 1% of the domestic housewares and home furnishings market and therefore we have opportunities to grow market share in future periods, slower rates of growth could negatively impact our results. For more information, see "Risk Factors-Changes in consumer spending or the housing market may significantly harm our revenue and results of operations."
Our Strategic Initiatives . We are in the process of implementing a number of significant business initiatives that have had and will continue to have an impact on our results of operations, including the development of new larger Full Line Design Galleries in a number of new locations, the optimization of our store sizes to better fit anticipated demand in a given market, the expansion of our product categories and services and changes in the ways in which we market with our catalogs. Although these initiatives are designed to create growth in our business and continuing improvement in our operating results, the timing of expenditures related to these initiatives, as well as the achievement of returns on our investments, may affect our results of operation in future periods, and we may not achieve the desired benefits. Opening Full Line Design Galleries will require significant capital expenditures, and retail store closures may lead to charges including lease termination and other exit costs. These changes could affect our results of operation in future periods. In addition, the investments required to continue our strategic initiatives may have a negative impact on cash flows in future periods and could create pressure on our liquidity if we do not achieve the desired results from these initiatives in a timely manner. We expect that we will continue to incur significant capital expenditures as part of our initiative to open more Full Line Design Galleries over the next several years, and that these expenditures will have an impact on our cash flows during this time. For fiscal 2012, we incurred total capital expenditures of $49.1 million and we anticipate our capital expenditure requirements to be approximately $95 million to $100 million for fiscal 2013.
Consumer Preferences and Demand . Our ability to maintain our appeal to existing customers and attract new customers depends on our ability to originate, develop and offer a compelling product assortment responsive to customer preferences and design trends. We have successfully introduced a large number of new products during recent periods, which we believe has been a contributing factor in our sales and operating results. Periods in which our products have achieved strong customer acceptance generally have had more favorable results. If we misjudge the market for our products, we may be faced with excess inventories for some products and may be required to become more promotional in our selling activities, which would impact our net revenues and gross profit.
Our Ability to Source and Distribute Products Effectively . Our net revenue and gross profits are affected by our ability to purchase our merchandise in sufficient quantities at competitive prices. While we believe our vendors have adequate capacity to meet our current and anticipated demand, our level of net revenues have been adversely affected in prior periods by constraints in our supply chain, including the inability of our vendors to produce sufficient quantities of some merchandise in a manner that was able to match market demand from our customers, leading to higher levels of customer back orders and lost sales.
Seasonality . Our business is seasonal. As a result, our net revenues fluctuate from quarter to quarter, which often affects the comparability of our results between periods. Net revenues are historically higher in the second and fourth fiscal quarters due primarily to the impact of the outdoor selling season and the holiday selling season, respectively. Cash requirements are typically higher in the first and third quarters due to inventory-related working capital requirements for the outdoor and holiday selling periods. See "Risk Factors-Our operating results are subject to quarterly and seasonal fluctuations, and results for any quarter may not necessarily be indicative of the results that may be achieved for the full fiscal year."
How We Assess the Performance of Our Business
In assessing the performance of our business, we consider a variety of financial and operating measures that affect our operating results, including net revenues, gross profit, selling, general and administrative expenses, adjusted EBITDA and adjusted net income.
53
Net Revenues. Net revenues reflect our sale of merchandise plus shipping and handling revenue collected from our customers, less returns and discounts. Revenues are recognized upon receipt of product by our customers.
Gross Profit. Gross profit is equal to our net revenues less cost of goods sold. Gross profit as a percentage of our net revenues is referred to as gross margin. Cost of goods sold include the direct cost of purchased merchandise; inventory shrinkage; inventory adjustments due to obsolescence, including excess and slow-moving inventory and lower of cost or market reserves; inbound freight; all freight costs to get merchandise to our stores; design, buying and allocation costs; occupancy costs related to store operations, such as rent and common area maintenance; depreciation and amortization of leasehold improvements, equipment and other assets in our stores and distribution centers; and all logistics costs associated with shipping product to our customers, which are only partially offset by shipping income collected from customers. We expect gross profit to increase to the extent that we successfully grow our net revenues and leverage the fixed portion of cost of goods sold.
Our gross profit can be favorably impacted by sales volume increases, as occupancy and certain other costs that are largely fixed do not necessarily increase proportionally with volume increases. Changes in the mix of our products may also impact our gross profit. We review our inventory levels on an ongoing basis in order to identify slow-moving merchandise and use product markdowns and our outlet stores to efficiently sell these products. The timing and level of markdowns are driven primarily by customer acceptance of our merchandise. The primary drivers of the costs of individual goods are raw materials costs, which fluctuate based on a number of factors beyond our control, including commodity prices, changes in supply and demand, general economic conditions, competition, import duties, tariffs and government regulation, logistics costs (which may increase in the event of, for example, expansions of or interruptions in the operation of our distribution centers, furniture home delivery hubs and customer service center or damage or interruption to our information systems) and labor costs in the countries where we source our merchandise. We place orders with merchandise vendors primarily in United States dollars and, as a result, are not exposed to significant foreign currency exchange risk.
Our gross profit may not be comparable to other specialty retailers, as some companies may not include all or a portion of the costs related to their distribution network and store occupancy in calculating gross profit as we and many other retailers do, but instead may include them in selling, general and administrative expenses.
Selling, General and Administrative Expenses. Selling, general and administrative expenses include all operating costs not included in cost of goods sold. These expenses include all payroll and payroll-related expenses, store expenses other than occupancy and expenses related to many of our operations at our headquarters, including utilities, depreciation and amortization, credit card fees and marketing expense, which primarily includes catalog production, mailing and print advertising costs. All store pre-opening costs are included in selling, general and administrative expenses and are expensed as incurred. Selling, general and administrative expenses as a percentage of net revenues is usually higher in lower-volume quarters and lower in higher-volume quarters because a significant portion of the costs are relatively fixed.
Our recent revenue growth has been accompanied by increased selling, general and administrative expenses. The most significant components of these increases are marketing and payroll costs. We expect these expenses to continue to increase as we continue to open new stores, develop new product categories and otherwise grow our business.
Adjusted EBITDA and Adjusted Net Income. We believe that adjusted EBITDA and adjusted net income are useful measures of operating performance, as the adjustments eliminate non-recurring and other items that are not reflective of underlying business performance, facilitate a comparison of our operating performance on a consistent basis from period-to-period and provide for a more complete understanding of factors and trends affecting our business. We also use adjusted EBITDA as one of the primary methods for planning and forecasting overall expected performance and for evaluating on a quarterly and annual basis actual results against such expectations, and as the basis of our MIP.
54
We define adjusted EBITDA as consolidated net income (loss) before depreciation and amortization, interest expense and provision for income taxes, adjusted for the impact of certain non-recurring and other items that we do not consider representative of our ongoing operating performance. Because adjusted EBITDA omits non-cash items, we feel that it is less susceptible to variances in actual performance resulting from depreciation, amortization and other non-cash charges and is more reflective of other factors that affect our operating performance.
We define adjusted net income as consolidated net income (loss), adjusted for the impact of certain non-recurring and other items that we do not consider representative of our ongoing operating performance.
Purchase Accounting
All of the outstanding capital stock of Restoration Hardware, Inc. was acquired on June 16, 2008, by Home Holdings, which we refer to as the "Acquisition," through a transaction that was accounted for under Statement of Financial Accounting Standards 141, "Business Combinations." The purchase price was allocated to state our assets and liabilities at fair value, which took into account work performed by an independent third-party valuation firm. The allocation of the purchase price had the net effect of reducing the carrying amount of inventory by $47.9 million, increasing property and equipment by $17.6 million and increasing amortizable intangible assets by $55.7 million. The $47.9 million decrease in inventory value was due to the prevailing adverse economic situation at the date of the Acquisition and the application of a market participant approach to the valuation of inventory on hand. Such decrease was amortized to cost of goods sold over approximately nine months and resulted in increased gross profit during fiscal 2009. We are depreciating the $17.6 million increase in property and equipment over the useful life of each asset, which has had the effect of reducing gross profit and increasing selling, general and administrative expenses subsequent to the Acquisition. The $55.7 million increase in amortizable intangible assets is being amortized over the remaining life of each asset and has had the effect of reducing gross profit and increasing selling, general and administrative expenses subsequent to the Acquisition. We also recorded intangible assets with an indefinite life, which consisted of goodwill and trademarks, at their fair values of $122.3 million and $47.1 million, respectively.
The following table summarizes the financial impact of purchase accounting adjustments on gross profit and selling, general and administrative expenses in dollars, and as a percentage of net revenues, in fiscal 2012, fiscal 2011 and fiscal 2010:
| Year Ended | ||||||||||||||||||||||||
| February 2, 2013 | January 28, 2012 | January 29, 2011 | ||||||||||||||||||||||
| (dollars in thousands) | ||||||||||||||||||||||||
Net revenues | $ | 1,193,046 | 100 | % | $ | 958,084 | 100 | % | $ | 772,752 | 100 | % | ||||||||||||
|
|
|
|
|
|
|
|
|
|
|
| |||||||||||||
Gross profit increase (decrease) | ||||||||||||||||||||||||
Depreciation related to step up of property and equipment | $ | (1,253 | ) | (0.1 | )% | $ | (1,783 | ) | (0.2 | )% | $ | (3,076 | ) | (0.4 | )% | |||||||||
Amortization of intangible related to net fair value of leases | (879 | ) | (0.1 | )% | (1,507 | ) | (0.1 | )% | (1,975 | ) | (0.3 | )% | ||||||||||||
|
|
|
|
|
|
|
|
|
|
|
| |||||||||||||
| $ | (2,132 | ) | (0.2 | )% | $ | (3,290 | ) | (0.3 | )% | $ | (5,051 | ) | (0.7 | )% | ||||||||||
|
|
|
|
|
|
|
|
|
|
|
| |||||||||||||
Selling general and administrative increase (decrease) | ||||||||||||||||||||||||
Amortization of intangible related to core technologies | $ | 1,316 | 0.1 | % | $ | 1,316 | 0.1 | % | $ | 1,316 | 0.2 | % | ||||||||||||
Depreciation related to step up of property and equipment | - | - | % | - | - | % | 150 | - | % | |||||||||||||||
Amortization of intangible related to net fair value of leases | (9 | ) | - | % | (21 | ) | - | % | 140 | - | % | |||||||||||||
|
|
|
|
|
|
|
|
|
|
|
| |||||||||||||
| $ | 1,307 | 0.1 | % | $ | 1,295 | 0.1 | % | $ | 1,606 | 0.2 | % | |||||||||||||
|
|
|
|
|
|
|
|
|
|
|
| |||||||||||||
55
Basis of Presentation and Results of Operations
On November 7, 2012, Restoration Hardware Holdings, Inc. completed an initial public offering and acquired all of the outstanding shares of capital stock of Restoration Hardware, Inc. In connection with the initial public offering, common stock of Restoration Hardware Holdings, Inc. was issued in replacement of prior unit awards under the Team Resto Ownership Plan. These transactions are referred to as the "Reorganization." Prior to the Reorganization, Restoration Hardware Holdings, Inc. had not engaged in any business or other activities except in connection with its formation and the Reorganization. Accordingly, all financial and other information herein relating to periods prior to the completion of the Reorganization is that of Restoration Hardware, Inc.
The following table sets forth our statement of operations and other financial and operating data.
| Year Ended | ||||||||||||
| February 2, 2013 | January 28, 2012 | January 29, 2011 | ||||||||||
| (dollars in thousands, excluding per square foot store data) | ||||||||||||
Statement of Operations Data: | ||||||||||||
Net revenues | $ | 1,193,046 | $ | 958,084 | $ | 772,752 | ||||||
Cost of goods sold | 756,597 | 601,735 | 501,132 | |||||||||
|
|
|
|
|
| |||||||
Gross profit | 436,449 | 356,349 | 271,620 | |||||||||
Selling, general and administrative expenses | 505,485 | 329,506 | 274,836 | |||||||||
|
|
|
|
|
| |||||||
Income (loss) from operations | (69,036 | ) | 26,843 | (3,216 | ) | |||||||
Interest expense | (5,776 | ) | (5,134 | ) | (3,150 | ) | ||||||
|
|
|
|
|
| |||||||
Income (loss) before income taxes | (74,812 | ) | 21,709 | (6,366 | ) | |||||||
Income tax expense (benefit) | (62,023 | ) | 1,121 | 685 | ||||||||
|
|
|
|
|
| |||||||
Net income (loss) | $ | (12,789 | ) | $ | 20,588 | $ | (7,051 | ) | ||||
|
|
|
|
|
| |||||||
Other Financial and Operating Data: | ||||||||||||
Growth in net revenues: | ||||||||||||
Stores (1) | 20 | % | 22 | % | 15 | % | ||||||
Direct | 30 | % | 27 | % | 37 | % | ||||||
Total | 25 | % | 24 | % | 24 | % | ||||||
Retail (2) : | ||||||||||||
Comparable store sales change (3) | 28 | % | 25 | % | 19 | % | ||||||
Retail stores open at beginning of period | 74 | 91 | 95 | |||||||||
Stores opened | 5 | 5 | 4 | |||||||||
Stores closed | 8 | 22 | 8 | |||||||||
Retail stores open at end of period | 71 | 74 | 91 | |||||||||
Total leased square footage at end of period (in thousands) | 768 | 808 | 970 | |||||||||
Total leased selling square footage at end of period (in thousands) (4) | 501 | 516 | 613 | |||||||||
Retail sales per leased selling square foot ( 5 ) | $ | 1,143 | $ | 846 | $ | 635 | ||||||
Direct: | ||||||||||||
Catalogs circulated (in thousands) ( 6 ) | 32,712 | 26,052 | 46,507 | |||||||||
Catalog pages circulated (in millions) ( 6 ) | 16,029 | 8,848 | 6,260 | |||||||||
Direct as a percentage of net revenues ( 7 ) | 46 | % | 44 | % | 43 | % | ||||||
Capital expenditures | $ | 49,058 | $ | 25,593 | $ | 39,907 | ||||||
Adjusted net income (8) | $ | 37,739 | $ | 26,451 | $ | 3,025 | ||||||
| (1) | Stores data represents retail stores plus outlet stores. Net revenues for outlet stores for fiscal 2012, fiscal 2011 and fiscal 2010 were $54.3 million, $43.9 million and $31.2 million, respectively. |
| (2) | Retail data has been calculated based upon retail stores, which includes our Baby & Child stores, and exclude outlet stores. |
56
| (3) | Comparable store sales have been calculated based upon retail stores that were open at least fourteen full months as of the end of the reporting period and did not change square footage by more than 20% between periods. If a store is closed for seven days during a month, that month will be excluded from comparable store sales. Comparable store net revenues exclude revenues from outlet stores. Because fiscal 2012 was a 53-week year, comparable store sales percentage for fiscal 2012 excludes that extra week of sales. |
| (4) | Leased selling square footage is retail space at our stores used to sell our products. Leased selling square footage excludes backrooms at retail stores used for storage office space or similar matters. Leased selling square footage excludes exterior sales space located outside a store, such as courtyards, gardens and rooftops. Leased selling square footage includes approximately 4,500 square feet related to one owned store location. |
| (5) | Retail sales per leased selling square foot is calculated by dividing total net revenues for all retail stores, comparable and non-comparable, by the average leased selling square footage for the period. |
| (6) | The catalogs and catalog pages circulated from period to period do not take into account different page sizes per catalog distributed. Page sizes and page counts vary for different catalog mailings and we sometimes mail different versions of a catalog at the same time. Accordingly, period to period comparisons of catalogs circulated and catalog pages circulated do not take these variations into account. |
| (7) | Direct revenues include sales through our catalogs and websites. |
| (8) | Adjusted net income is a supplemental measure of financial performance that is not required by, or presented in accordance with, GAAP. We define adjusted net income as consolidated net income (loss), adjusted for the impact of certain non-recurring and other items that we do not consider representative of our ongoing operating performance. Adjusted net income is included in this Form 10-K because management believes that adjusted net income provides meaningful supplemental information for investors regarding the performance of our business and facilitates a meaningful evaluation of actual results on a comparable basis with historical results. Our management uses this non-GAAP financial measure in order to have comparable financial results to analyze changes in our underlying business from quarter to quarter. The following table presents a reconciliation of net income (loss), the most directly comparable GAAP financial measure, to adjusted net income for the periods indicated below. |
| Year Ended | ||||||||||||
| February 2, 2013 | January 28, 2012 | January 29, 2011 | ||||||||||
| (in thousands) | ||||||||||||
| Net income (loss) | $ | (12,789) | $ | 20,588 | $ | (7,051) | ||||||
| Adjustments pre-tax: | ||||||||||||
Management and board fees (a) | 4,258 | 10,715 | 4,793 | |||||||||
Non-cash and other one-time compensation (b) | 115,055 | 6,350 | - | |||||||||
Terminated operations (c) | - | 1,580 | 352 | |||||||||
Severance and other transaction costs (d) | - | 621 | 1,797 | |||||||||
Impairment of long-lived assets (e) | - | - | 2,115 | |||||||||
Lease termination costs (f) | (386 | ) | 3,110 | - | ||||||||
Non-capitalized IPO costs (g) | - | - | 2,351 | |||||||||
Special committee investigation and remediation (h) | 4,778 | - | - | |||||||||
Initial public offering costs ( i ) | 10,755 | - | - | |||||||||
Anti-dumping exposure (j) | 3,250 | - | - | |||||||||
|
|
|
|
|
| |||||||
| Subtotal adjusted items | 137,710 | 22,376 | 11,408 | |||||||||
Impact of income tax items (k) | (87,182 | ) | (16,513 | ) | (1,332 | ) | ||||||
|
|
|
|
|
| |||||||
| Adjusted net income | $ | 37,739 | $ | 26,451 | $ | 3,025 | ||||||
|
|
|
|
|
| |||||||
| (a) | Includes fees and expenses paid in accordance with our management services agreement with Home Holdings, as well as fees and expense reimbursements paid to our board of directors prior to the initial public offering. |
| (b) | The fourth quarter of fiscal 2012 includes a $92.0 million non-cash compensation charge related to equity grants at the time of the Reorganization, as well as a non-cash compensation charge of $23.1 million related |
57
| to the performance-based vesting of certain shares granted to Mr. Alberini and Mr. Friedman. The third quarter of fiscal 2011 includes a $6.4 million compensation charge related to the repayment of loans owed to Home Holdings by Gary Friedman, through the reclassification by Home Holdings of Mr. Friedman's Class A and Class A-1 ownership units into an equal number of Class A Prime and Class A-1 Prime ownership units. Mr. Friedman served as our Chairman and Co-Chief Executive Officer at the time of such loan repayment. |
| (c) | Includes costs related to the restructuring of our Shanghai office location. |
| (d) | Generally includes executive severance and other related costs. |
| (e) | Includes costs related to impairment of long-lived assets related to our retail store operations. |
| (f) | Includes lease termination costs for retail stores that were closed prior to their respective lease termination dates. The lease termination amount in fiscal 2012 includes changes in estimates regarding liabilities for future lease payments for closed stores. |
| (g) | Represents costs related to our efforts to pursue an initial public offering. |
| (h) | Represents legal and other professional fees incurred in connection with the investigation conducted by the special committee of the board of directors relating to our former Chairman and Co-Chief Executive Officer, Gary Friedman, and our subsequent remedial actions. |
| (i) | Represents costs incurred in connection with our initial public offering, including a fee of $7.0 million to Catterton, Tower Three and Glenhill in accordance with our management services agreement, payments of $2.2 million to certain former executives and bonus payments to employees of $1.3 million. |
| (j) | Represents expense incurred as a result of increased tariff obligations of one of our foreign suppliers following the U.S. Department of Commerce's review of the anti-dumping duty order on wooden bedroom furniture from China for the period from January 1, 2011 through December 31, 2011. |
| (k) | As of the end of fiscal 2012, our U.S. operations achieved a position of cumulative profits for the most recent three-year period. We concluded that this record of cumulative profitability in recent years, coupled with our business plan for profitability in future periods provided assurance that our future tax benefits more likely than not would be realized. Accordingly, in fiscal 2012, we released all of our U.S. valuation allowance against net deferred tax assets. In addition, income tax items exclude the tax benefit related to the resolution of our Canada Revenue Agency examination in fiscal 2012, exclude the tax benefit from the utilization of federal and state net operating losses, and assume a normalized tax rate of 40% for all periods. |
The following table sets forth our consolidated statement of operations data as a percentage of total revenues.
| Year Ended | ||||||||||||
| February 2, 2013 | January 28, 2012 | January 29, 2011 | ||||||||||
Statement of Operations Data: | ||||||||||||
Net revenues | 100.0 | % | 100.0 | % | 100.0 | % | ||||||
Cost of goods sold | 63.4 | 62.8 | 64.9 | |||||||||
|
|
|
|
|
| |||||||
Gross profit | 36.6 | 37.2 | 35.1 | |||||||||
Selling, general and administrative expenses | 42.4 | 34.4 | 35.5 | |||||||||
|
|
|
|
|
| |||||||
Income (loss) from operations | (5.8 | ) | 2.8 | (0.4 | ) | |||||||
Interest expense | (0.5 | ) | (0.5 | ) | (0.4 | ) | ||||||
|
|
|
|
|
| |||||||
Income (loss) before income taxes | (6.3 | ) | 2.3 | (0.8 | ) | |||||||
Income tax expense (benefit) | (5.2 | ) | 0.1 | 0.1 | ||||||||
|
|
|
|
|
| |||||||
Net income (loss) | (1.1 | )% | 2.2 | % | (0.9 | )% | ||||||
|
|
|
|
|
| |||||||
58
We operate a fully integrated distribution model through our stores, catalogs and websites. The following table shows a summary of our Stores revenues, which include all sales for orders placed in retail stores as well as sales through outlet stores, and our Direct revenues which include sales through our catalogs and websites.
| Year Ended | ||||||||||||
| February 2, 2013 | January 28, 2012 | January 29, 2011 | ||||||||||
| (in thousands) | ||||||||||||
Stores | $ | 643,306 | $ | 534,411 | $ | 438,463 | ||||||
Direct | 549,740 | 423,673 | 334,289 | |||||||||
|
|
|
|
|
| |||||||
Net revenues | $ | 1,193,046 | $ | 958,084 | $ | 772,752 | ||||||
|
|
|
|
|
| |||||||
Fiscal 2012 Compared to Fiscal 2011
Net revenues
Net revenues increased $234.9 million, or 24.5%, to $1,193.0 million in fiscal 2012 compared to $958.1 million in fiscal 2011. We had 71 and 74 retail stores open at February 2, 2013 and January 28, 2012, respectively. Stores sales increased $108.9 million, or 20.4%, to $643.3 million in fiscal 2012 compared to $534.4 million in fiscal 2011 due in large part to our comparable store sales increase of 28% in fiscal 2012 compared to fiscal 2011, partially offset by having fewer stores open during fiscal 2012 compared to fiscal 2011. Direct sales increased $126.0 million, or 29.8%, to $549.7 million in fiscal 2012 compared to $423.7 million in fiscal 2011. We believe that the increase in both comparable store and direct sales was due primarily to our customers' favorable reaction to our merchandise assortment, including the expansion of existing product categories, new product categories, and an increase in catalog pages circulated.
Gross profit
Gross profit increased $80.1 million, or 22.5%, to $436.4 million in fiscal 2012 from $356.3 million in fiscal 2011. As a percentage of net revenues, gross margin decreased 0.6% to 36.6% of net revenues in fiscal 2012 from 37.2% of net revenues in fiscal 2011.
In fiscal 2012, we incurred a $3.3 million charge related to increased tariff obligations of one of our foreign suppliers following the U.S. Department of Commerce's review of the anti-dumping duty order on wooden bedroom furniture from China for the period from January 1, 2011 through December 31, 2011. Excluding the impact associated with this obligation, gross margin decreased 0.3% to 36.9% of net revenues in fiscal 2012 from 37.2% in fiscal 2011. This decrease was primarily driven by changes in product mix, strategic pricing on new product introductions and increased promotional activity. In addition, gross margin decreased due to increased freight costs resulting from a higher percentage of furniture sales during the period, as furniture deliveries require greater shipping costs than our other products. These decreases in gross margins as a percentage of net revenues were partially offset by improvement in occupancy costs from improved leverage on the fixed portion of our store and distribution center occupancy costs.
Selling, general and administrative expenses
Selling, general and administrative expenses increased $176.0 million, or 53.4%, to $505.5 million in fiscal 2012 compared to $329.5 million in fiscal 2011. Selling, general and administrative expenses for fiscal 2012 included (i) a $92.0 million non-cash compensation charge related to equity grants at the time of the Reorganization and initial public offering, (ii) a $23.1 million non-cash compensation charge related to the performance-based vesting of certain shares granted to Mr. Alberini and Mr. Friedman in connection with the Reorganization and initial public offering, (iii) $10.8 million of costs incurred in connection with our initial public offering, including a fee of $7.0 million to Catterton, Tower Three and Glenhill in accordance with our management services agreement, payments of $2.2 million to certain former executives and bonus payments to
59
employees of $1.3 million, and (iv) $4.8 million of legal and other professional fees incurred in connection with the investigation conducted by the special committee of the board of directors relating to Mr. Friedman and our subsequent remedial actions. Selling, general and administrative expenses for fiscal 2011 included a $6.4 million non-cash compensation charge related to the repayment of loans to Mr. Friedman from Home Holdings through the reclassification by Home Holdings of certain pre-Reorganization ownership units in Home Holdings held by Mr. Friedman at that time.
The increase in selling, general and administrative expenses, excluding the one-time and non-cash compensation items mentioned above, was primarily related to advertising and marketing costs associated with increased catalog circulation, an increase in employment costs, an increase in credit card fees increased due to growth in revenues and an increase in occupancy costs.
Excluding the one-time and non-cash compensations items mentioned above, selling, general and administrative expenses were 31.8% of net revenues in fiscal 2012 compared to 33.7% of net revenues in fiscal 2011. The improvement in selling, general and administrative expenses as a percentage of net revenues was primarily driven by reductions in employment costs, professional fees and occupancy costs, in each case as a percentage of net revenues, due to leverage on the fixed portion of these expenses. These reductions were partially offset by an increase in advertising and marketing costs associated with increased catalog circulation.
Interest expense
Interest expense was $5.8 million in fiscal 2012 compared to $5.1 million in fiscal 2011. This increase was primarily due to the higher interest rate under the modified revolving line of credit agreement entered into in August 2011, higher borrowings under the revolving line of credit, as well as interest related to the term loan entered into in January 2012.
Income tax expense (benefit)
Income tax benefit increased $63.1 million to a $62.0 million benefit in fiscal 2012 compared to an expense of $1.1 million in fiscal 2011. Our effective tax rate was 82.9% in fiscal 2012 compared to 5.2% in fiscal 2011. The increase in the tax benefit was primarily attributable to the reversal of the U.S. valuation allowance against our net deferred tax assets, resulting in a $57.2 million benefit in our provision for income taxes. By the end of fiscal 2012, our U.S. operations achieved a position of cumulative profits (adjusted for permanent differences) for the most recent three-year period. We concluded that this record of cumulative profitability in recent years, coupled with our business plan for profitability in future periods, provided assurance that our future tax benefits are more likely than not to be realized. Accordingly, in the fourth quarter of fiscal 2012, we released all of our U.S. valuation allowance against net deferred tax assets.
60
Fiscal 2011 Compared to Fiscal 2010
The following table summarizes the financial impact of purchase accounting adjustments on gross profit and selling, general and administrative expenses in dollars, and as a percentage of net revenues, for fiscal 2011 and fiscal 2010:
| Fiscal Year Ended | Increase (Decrease) | |||||||||||||||||||||||
| January 28, 2012 | January 29, 2011 | |||||||||||||||||||||||
| (dollars in thousands) | ||||||||||||||||||||||||
Net revenues | $ | 958,084 | 100.0 | % | $ | 772,752 | 100.0 | % | $ | 185,332 | ||||||||||||||
|
|
|
|
|
|
|
|
|
| |||||||||||||||
Gross profit excluding purchase accounting adjustments | $ | 359,639 | 37.5 | % | $ | 276,671 | 35.8 | % | $ | 82,968 | 1.7 | % | ||||||||||||
Decrease in gross profit from purchase accounting adjustments | (3,290 | ) | (0.3 | )% | (5,051 | ) | (0.7 | )% | 1,761 | 0.4 | % | |||||||||||||
|
|
|
|
|
|
|
|
|
|
|
| |||||||||||||
Gross profit | $ | 356,349 | 37.2 | % | $ | 271,620 | 35.1 | % | $ | 84,729 | 2.1 | % | ||||||||||||
|
|
|
|
|
|
|
|
|
|
|
| |||||||||||||
Selling, general and administrative expenses excluding purchase accounting adjustments | $ | 328,211 | 34.3 | % | $ | 273,230 | 35.3 | % | $ | 54,981 | (1.0 | )% | ||||||||||||
Increase in selling, general and administrative expenses from purchase accounting adjustments | 1,295 | 0.1 | % | 1,606 | 0.2 | % | (311 | ) | (0.1 | )% | ||||||||||||||
|
|
|
|
|
|
|
|
|
|
|
| |||||||||||||
Selling, general and administrative expenses | $ | 329,506 | 34.4 | % | $ | 274,836 | 35.5 | % | $ | 54,670 | (1.1 | )% | ||||||||||||
|
|
|
|
|
|
|
|
|
|
|
| |||||||||||||
Net revenues
Net revenues increased $185.3 million, or 24.0%, to $958.1 million in fiscal 2011 compared to $772.8 million in fiscal 2010. We had 74 and 91 retail stores open at January 28, 2012, and January 29, 2011, respectively. This decrease in the number of retail stores was part of our strategy to consolidate stores in markets where we open new Full Line Design Galleries and to close stores that do not meet our profitability objectives. In fiscal 2011, we opened five stores and closed 22 stores. Of the 22 closed stores, 16 were closed at the expiration of the lease, while six were closed prior to the expiration of the lease. We incurred charges of $3.1 million related to the early closures. Stores sales increased $95.9 million, or 21.9%, to $534.4 million in fiscal 2011 compared to $438.5 million in fiscal 2010 due in large part to our comparable store sales increase of 25% in fiscal 2011 compared to fiscal 2010. Direct sales increased $89.4 million, or 26.7%, to $423.7 million in fiscal 2011 compared to $334.3 million in fiscal 2010. We believe that the increase in both comparable store and direct sales was due primarily to our customers' favorable reaction to our merchandise assortment, including expansions of existing product categories and new product categories, an increase in circulated catalog pages and positive customer reaction to our new Design Gallery format.
Gross profit
Gross profit increased $84.7 million, or 31.2%, to $356.3 million in fiscal 2011 from $271.6 million in fiscal 2010. As a percentage of net revenues, gross margin increased 2.1%, to 37.2% of net revenues in fiscal 2011 from 35.1% of net revenues in fiscal 2010. Gross profit in fiscal 2011 included $3.3 million of unfavorable gross profit impact due to purchase accounting compared to $5.1 million of unfavorable gross profit impact due to purchase accounting in fiscal 2010.
Excluding the impact of purchase accounting, gross margin increased 1.7%. This increase was primarily driven by an improvement in occupancy costs achieved due to improved leverage on the fixed portion of our store and distribution center occupancy costs, partially offset by one-time costs associated with the opening of a new distribution center during fiscal 2011. The overall increase in gross margin was also partially offset by higher freight costs due to a change in shipping rates charged to customers as we moved to flat rate shipping fees and experienced a higher percentage of furniture sales, which incurs greater shipping costs than our other products, and due to increased promotional activity.
61
Selling, general and administrative expenses
Selling, general and administrative expenses increased $54.7 million, or 19.9%, to $329.5 million in fiscal 2011 compared to $274.8 million in fiscal 2010. Selling, general and administrative expenses in fiscal 2011 included $1.3 million of unfavorable impact due to purchase accounting compared to $1.6 million of unfavorable impact due to purchase accounting in fiscal 2010. Excluding the effect of purchase accounting adjustments, the increase in selling, general and administrative expenses was primarily related to an increase in employment costs associated with the growth of our operations, a $6.4 million compensation charge related to the repayment of loans between Mr. Friedman and Home Holdings via the reclassification by Home Holdings of Mr. Friedman's pre-Reorganization ownership units, an increase in advertising and marketing costs associated with increased circulated catalog pages, an increase in management fees to Catterton, Tower Three and Glenhill and an increase in credit cards fees due to the growth in sales revenues. During fiscal 2011, we closed four retail store locations in advance of the related lease termination dates resulting in a charge of $3.2 million. In addition, in fiscal 2011 we recorded a $1.6 million restructuring charge associated with our Shanghai office, increased travel-related expenses and an increase in retail store pre-opening expenses.
Selling, general and administrative expenses were 34.4% of net revenues in fiscal 2011 compared to 35.5% of net revenues in fiscal 2010. Selling, general and administrative expenses as a percentage of net revenues included 0.1% of unfavorable impact of purchase accounting in fiscal 2011 compared to 0.2% of unfavorable impact of purchase accounting in fiscal 2010. The improvement in selling, general and administrative expenses excluding the effect of purchase accounting adjustments was driven largely by increased net revenues during fiscal 2011 compared to fiscal 2010, which resulted in a reduction of employment costs, a reduction in advertising and marketing costs, as well as a reduction in professional fees, in each case as a percentage of net revenues. These reductions were partially offset by an increase in costs as a percentage of net revenues related to corporate office costs, due in part to the restructuring charge associated with our Shanghai office and pre-opening expenses related to new retail store locations we opened in fiscal 2011, as well as an increase in occupancy expense as a percentage of net revenues primarily related to the closure of four retail store locations prior to the related lease termination dates.
Interest expense
Interest expense increased $1.9 million to $5.1 million in fiscal 2011 compared to $3.2 million in fiscal 2010. This increase was primarily due to the higher interest rate under the modified revolving line of credit agreement entered into in August 2011, as well as an increase in the amount of borrowings under the revolving line of credit in fiscal 2011 as compared to fiscal 2010 primarily due to increased inventory levels.
Income tax expense
Income tax expense increased $0.4 million to $1.1 million in fiscal 2011 compared to $0.7 million in fiscal 2010. Our effective tax rate was 5.2% for fiscal 2011 compared to (10.8)% for fiscal 2010. The increase in our tax expense was primarily due to an increase in taxable income for state and foreign jurisdictions. The state taxable income was primarily generated as a result of certain states disallowing the utilization of net operating loss carryovers.
Quarterly Results and Seasonality
The following table sets forth our historical quarterly consolidated statements of income for each of the last eight fiscal quarters ended through February 2, 2013. This quarterly information has been prepared on the same basis as our annual audited financial statements and includes all adjustments that we consider necessary to present fairly the financial information for the fiscal quarters presented. The quarterly data should be read in conjunction with our consolidated financial statements and the related notes included in Item 8 - Financial Statements and Supplementary Data .
62
In the third quarter of fiscal 2012, we changed our accounting policy for recognizing stock-based compensation expense which has been applied retrospectively to the periods presented below. See footnote 1 to the table below for further detail.
Our business is seasonal and we have historically realized a higher portion of our net revenues and net income in the second and fourth fiscal quarters due primarily to the outdoor selling season in the second fiscal quarter and the holiday selling season in the fourth fiscal quarter. Working capital requirements are typically higher in the first and third fiscal quarters due to inventory-related working capital requirements in advance of the outdoor selling season and the holiday selling season. During these peak periods of working capital requirements, we have historically increased our borrowings under the Restoration Hardware, Inc. revolving line of credit. As such, results of a period shorter than a full year may not be indicative of results expected for the entire year. Furthermore, the seasonal nature of our business may affect comparisons between periods.
| Fiscal 2011 | Fiscal 2012 | |||||||||||||||||||||||||||||||
| First Quarter | Second Quarter | Third Quarter (1) | Fourth Quarter | First Quarter | Second Quarter ( 2 ) | Third Quarter ( 2 ) | Fourth Quarter ( 3 ) | |||||||||||||||||||||||||
| (dollars in thousands) | ||||||||||||||||||||||||||||||||
Net revenues | $ | 184,760 | $ | 235,623 | $ | 232,459 | $ | 305,242 | $ | 217,914 | $ | 292,906 | $ | 284,171 | $ | 398,055 | ||||||||||||||||
Cost of goods sold | 121,576 | 144,377 | 148,066 | 187,716 | 142,646 | 178,779 | 182,291 | 252,881 | ||||||||||||||||||||||||
|
|
|
|
|
|
|
|
|
|
|
|
|
|
|
| |||||||||||||||||
Gross profit | 63,184 | 91,246 | 84,393 | 117,526 | 75,268 | 114,127 | 101,880 | 145,174 | ||||||||||||||||||||||||
Selling, general, and administrative expenses ( 4 ) | 68,707 | 81,688 | 88,496 | 90,615 | 77,365 | 94,465 | 99,886 | 233,769 | ||||||||||||||||||||||||
|
|
|
|
|
|
|
|
|
|
|
|
|
|
|
| |||||||||||||||||
Income (loss) from operations | (5,523 | ) | 9,558 | (4,103 | ) | 26,911 | (2,097 | ) | 19,662 | 1,994 | (88,595 | ) | ||||||||||||||||||||
Interest expense | (899 | ) | (989 | ) | (1,598 | ) | (1,648 | ) | (1,575 | ) | (1,479 | ) | (1,544 | ) | (1,178 | ) | ||||||||||||||||
|
|
|
|
|
|
|
|
|
|
|
|
|
|
|
| |||||||||||||||||
Income (loss) before income taxes | (6,422 | ) | 8,569 | (5,701 | ) | 25,263 | (3,672 | ) | 18,183 | 450 | (89,773 | ) | ||||||||||||||||||||
Income tax expense (benefit) | (204 | ) | 987 | (871 | ) | 1,209 | 56 | 567 | (1,235 | ) | (61,411 | ) | ||||||||||||||||||||
|
|
|
|
|
|
|
|
|
|
|
|
|
|
|
| |||||||||||||||||
Net income (loss) | $ | (6,218 | ) | $ | 7,582 | $ | (4,830 | ) | $ | 24,054 | $ | (3,728 | ) | $ | 17,616 | $ | 1,685 | $ | (28,362 | ) | ||||||||||||
|
|
|
|
|
|
|
|
|
|
|
|
|
|
|
| |||||||||||||||||
Adjusted EBITDA ( 5 ) | $ | 5,333 | $ | 22,414 | $ | 11,102 | $ | 41,305 | $ | 6,159 | $ | 28,738 | $ | 12,973 | $ | 48,701 | ||||||||||||||||
Adjusted net income (loss) (6) | $ | (2,118 | ) | $ | 8,003 | $ | 1,076 | $ | 19,490 | $ | (1,324 | ) | $ | 12,245 | $ | 2,662 | $ | 24,156 | ||||||||||||||
Comparable store sales ( 7 ) | 25 | % | 17 | % | 36 | % | 22 | % | 26 | % | 31 | % | 29 | % | 26 | % | ||||||||||||||||
| (1) | The third quarter of fiscal 2011 includes a $6.4 million compensation charge related to the repayment of loans owed to Home Holdings by Gary Friedman, through the reclassification by Home Holdings of Mr. Friedman's Class A and Class A-1 ownership units into an equal number of Class A Prime and Class A-1 Prime ownership units. Mr. Friedman served as our Chairman and Co-Chief Executive Officer at the time of such loan repayment. |
| (2) | The second and third quarters of fiscal 2012 include $2.0 million and $2.8 million, respectively, of legal and other professional fees incurred in connection with the investigation conducted by the special committee of the board of directors relating to our former Chairman and Co-Chief Executive Officer, Gary Friedman, and our subsequent remedial actions. |
| (3) | The fourth quarter of fiscal 2012 includes (i) a $92.0 million non-cash compensation charge related to equity grants at the time of the Reorganization, (ii) a non-cash compensation charge of $23.1 million related to the performance-based vesting of certain shares granted to Mr. Alberini and Mr. Friedman, (iii) costs incurred in connection with our initial public offering, including a fee of $7.0 million to Catterton, Tower Three and Glenhill in accordance with our management services agreement, payments of $2.2 million to certain former executives and bonus payments to employees of $1.3 million and (iv) $3.3 million incurred as a result of increased tariff obligations of one of our foreign suppliers following the U.S. Department of |
63
| Commerce's review of the anti-dumping duty order on wooden bedroom furniture from China for the period from January 1, 2011 through December 31, 2011. In addition, as of the end of fiscal 2012, our U.S. operations achieved a position of cumulative profits (adjusted for permanent differences) for the most recent three-year period. We concluded that this record of cumulative profitability in recent years, coupled with our business plan for profitability in future periods, provided assurance that our future tax benefits more likely than not would be realized. Accordingly, in the fourth fiscal quarter of 2012, we released all of our U.S. valuation allowance of $57.2 million against net deferred tax assets. |
| (4) | In the third quarter of fiscal 2012, we changed our policy for recognizing stock-based compensation expense from the graded method of accounting to the straight-line method of accounting for our pre-Reorganization time-based units (or service-only awards). This change in accounting had the same impact on our selling, general and administrative expenses and net income (loss) for all periods presented. The table below presents the impact to our net income (loss) as a result of this change in accounting policy. See Note 3- Change in Accounting Principle - Stock-Based Compensation to our audited consolidated financial statements. |
| Fiscal 2011 | Fiscal 2012 | |||||||||||||||||||||||
| First Quarter | Second Quarter | Third Quarter | Fourth Quarter | First Quarter | Second Quarter | |||||||||||||||||||
| (in thousands) | ||||||||||||||||||||||||
Net income (loss)-as reported | $ | (6,327 | ) | $ | 7,467 | $ | (4,857 | ) | $ | 24,058 | $ | (3,764 | ) | $ | 17,753 | |||||||||
Change in accounting policy adjustment | 109 | 115 | 27 | (4 | ) | 36 | (137 | ) | ||||||||||||||||
|
|
|
|
|
|
|
|
|
|
|
| |||||||||||||
Net income (loss)-as revised | $ | (6,218 | ) | $ | 7,582 | $ | (4,830 | ) | $ | 24,054 | $ | (3,728 | ) | $ | 17,616 | |||||||||
|
|
|
|
|
|
|
|
|
|
|
| |||||||||||||
| (5) | The following table presents a reconciliation of net income (loss), the most directly comparable GAAP financial measure, to EBITDA and adjusted EBITDA for the periods indicated below. For further discussion of the use of EBITDA and adjusted EBITDA, see footnote 10 to the table included in "Selected Historical Consolidated Financial and Operating Data." |
| Fiscal 2011 | Fiscal 2012 | |||||||||||||||||||||||||||||||
| First Quarter | Second Quarter | Third Quarter | Fourth Quarter | First Quarter | Second Quarter | Third Quarter | Fourth Quarter | |||||||||||||||||||||||||
| (in thousands) | ||||||||||||||||||||||||||||||||
Net income (loss) | $ | (6,218 | ) | $ | 7,582 | $ | (4,830 | ) | $ | 24,054 | $ | (3,728 | ) | $ | 17,616 | $ | 1,685 | $ | (28,362 | ) | ||||||||||||
Depreciation and amortization | 7,386 | 7,597 | 7,373 | 6,830 | 6,424 | 6,468 | 6,593 | 7,263 | ||||||||||||||||||||||||
Interest expense | 899 | 989 | 1,598 | 1,648 | 1,575 | 1,479 | 1,544 | 1,178 | ||||||||||||||||||||||||
Income tax expense (benefit) | (204 | ) | 987 | (871 | ) | 1,209 | 56 | 567 | (1,235 | ) | (61,411 | ) | ||||||||||||||||||||
|
|
|
|
|
|
|
|
|
|
|
|
|
|
|
| |||||||||||||||||
EBITDA | 1,863 | 17,155 | 3,270 | 33,741 | 4,327 | 26,130 | 8,587 | (81,332 | ) | |||||||||||||||||||||||
Management and board | 1,198 | 1,198 | 1,149 | 7,170 | 889 | 1,198 | 1,198 | 973 | ||||||||||||||||||||||||
Non-cash and other one-time compensation (b) | 389 | 487 | 6,687 | 344 | 387 | 351 | 364 | 115,055 | ||||||||||||||||||||||||
Terminated operations (c) | 1,666 | - | 14 | (100 | ) | - | - | - | - | |||||||||||||||||||||||
Severance and other related costs (d) | 28 | - | 443 | 150 | - | - | - | - | ||||||||||||||||||||||||
Lease termination costs (e) | - | 3,571 | (461 | ) | - | 575 | (961 | ) | - | - | ||||||||||||||||||||||
Special committee investigation (f) | - | - | - | - | - | 1,989 | 2,789 | - | ||||||||||||||||||||||||
Initial public offering costs (g) | - | - | - | - | - | - | - | 10,755 | ||||||||||||||||||||||||
Anti-dumping exposure (h) | - | - | - | - | - | - | - | 3,250 | ||||||||||||||||||||||||
Other adjustments allowable under our agreements with our stockholders ( i ) | 189 | 3 | - | - | (19 | ) | 31 | 35 | - | |||||||||||||||||||||||
|
|
|
|
|
|
|
|
|
|
|
|
|
|
|
| |||||||||||||||||
Adjusted EBITDA | $ | 5,333 | $ | 22,414 | $ | 11,102 | $ | 41,305 | $ | 6,159 | $ | 28,738 | $ | 12,973 | $ | 48,701 | ||||||||||||||||
|
|
|
|
|
|
|
|
|
|
|
|
|
|
|
| |||||||||||||||||
64
| (a) | Includes fees and expenses paid in accordance with our management services agreement with Home Holdings, as well as fees and expense reimbursements paid to our board of directors prior to the initial public offering. |
| (b) | The fourth quarter of fiscal 2012 includes a $92.0 million non-cash compensation charge related to equity grants at the time of the Reorganization, as well as a non-cash compensation charge of $23.1 million related to the performance-based vesting of certain shares granted to Mr. Alberini and Mr. Friedman. The third quarter of fiscal 2011 includes a $6.4 million compensation charge related to the repayment of loans owed to Home Holdings by Gary Friedman, through the reclassification by Home Holdings of Mr. Friedman's Class A and Class A-1 ownership units into an equal number of Class A Prime and Class A-1 Prime ownership units. Mr. Friedman served as our Chairman and Co-Chief Executive Officer at the time of such loan repayment. In addition, amounts include stock-based compensation expense incurred prior to the initial public offering. |
| (c) | Includes costs related to the restructuring of our Shanghai office location. |
| (d) | Generally includes executive severance and other related costs. |
| (e) | Includes lease termination costs for retail stores that were closed prior to their respective lease termination dates. The lease termination amounts in the third quarter of fiscal 2011 and the first and second quarters of fiscal 2012 include changes in estimates regarding liabilities for future lease payments for closed stores. |
| (f) | Represents legal and other professional fees incurred in connection with the investigation conducted by the special committee of the board of directors relating to our former Chairman and Co-Chief Executive Officer, Gary Friedman, and our subsequent remedial actions. |
| (g) | Represents costs incurred in connection with our initial public offering, including a fee of $7.0 million to Catterton, Tower Three and Glenhill in accordance with our management services agreement, payments of $2.2 million to certain former executives and bonus payments to employees of $1.3 million. |
| (h) | Represents expense incurred as a result of increased tariff obligations of one of our foreign suppliers following the U.S. Department of Commerce's review of the anti-dumping duty order on wooden bedroom furniture from China for the period from January 1, 2011 through December 31, 2011. |
| (i) | Represents items which management believes are not indicative of our ongoing operating performance. The second quarter of fiscal 2011 adjustments include consulting fees related to organizational matters. The fourth quarter of fiscal 2010 and the first quarter of fiscal 2011 include state franchise tax amounts. All periods include foreign exchange gains and losses. |
65
| (6) | Adjusted net income (loss) is a supplemental measure of financial performance that is not required by, or presented in accordance with, GAAP. We define adjusted net income as consolidated net income (loss), adjusted for the impact of certain non-recurring and other items that we do not consider representative of our ongoing operating performance. Adjusted net income (loss) is included in this Form 10-K because management believes that adjusted net income (loss) provides meaningful supplemental information for investors regarding the performance of our business and facilitates a meaningful evaluation of actual results on a comparable basis with historical results. Our management uses this non-GAAP financial measure in order to have comparable financial results to analyze changes in our underlying business from quarter to quarter. The following table presents a reconciliation of net income (loss), the most directly comparable GAAP financial measure, to adjusted net income (loss) for the periods indicated below. |
| Fiscal 2011 | Fiscal 2012 | |||||||||||||||||||||||||||||||
| First Quarter | Second Quarter | Third Quarter | Fourth Quarter | First Quarter | Second Quarter | Third Quarter | Fourth Quarter | |||||||||||||||||||||||||
| (in thousands) | ||||||||||||||||||||||||||||||||
Net income (loss) | $ | (6,218 | ) | $ | 7,582 | $ | (4,830 | ) | $ | 24,054 | $ | (3,728 | ) | $ | 17,616 | $ | 1,685 | $ | (28,362 | ) | ||||||||||||
Adjustments pre-tax: | ||||||||||||||||||||||||||||||||
Management and board fees (j) | 1,198 | 1,198 | 1,149 | 7,170 | 889 | 1,198 | 1,198 | 973 | ||||||||||||||||||||||||
Non-cash and other one-time compensation (k) | - | - | 6,350 | - | - | - | - | 115,055 | ||||||||||||||||||||||||
Terminated | 1,666 | - | 14 | (100 | ) | - | - | - | - | |||||||||||||||||||||||
Severance and other related costs (m) | 28 | - | 443 | 150 | - | - | - | - | ||||||||||||||||||||||||
Lease termination costs (n) | - | 3,571 | (461 | ) | - | 575 | (961 | ) | - | - | ||||||||||||||||||||||
Special committee investigation (o) | - | - | - | - | - | 1,989 | 2,789 | - | ||||||||||||||||||||||||
Initial public offering costs (p) | - | - | - | - | - | - | - | 10,755 | ||||||||||||||||||||||||
Anti-dumping exposure (q) | - | - | - | - | - | - | - | 3,250 | ||||||||||||||||||||||||
|
|
|
|
|
|
|
|
|
|
|
|
|
|
|
| |||||||||||||||||
Subtotal adjusted items | 2,892 | 4,769 | 7,495 | 7,220 | 1,464 | 2,226 | 3,987 | 130,033 | ||||||||||||||||||||||||
Impact of income tax items (r) | 1,208 | (4,348 | ) | (1,589 | ) | (11,784 | ) | 940 | (7,597 | ) | (3,010 | ) | (77,515 | ) | ||||||||||||||||||
|
|
|
|
|
|
|
|
|
|
|
|
|
|
|
| |||||||||||||||||
Adjusted net income (loss) | $ | (2,118 | ) | $ | 8,003 | $ | 1,076 | $ | 19,490 | $ | (1,324 | ) | $ | 12,245 | $ | 2,662 | $ | 24,156 | ||||||||||||||
|
|
|
|
|
|
|
|
|
|
|
|
|
|
|
| |||||||||||||||||
| (j) | Includes fees and expenses paid in accordance with our management services agreement with Home Holdings, as well as fees and expense reimbursements paid to our board of directors prior to the initial public offering. |
| (k) | The fourth quarter of fiscal 2012 includes a $92.0 million non-cash compensation charge related to equity grants at the time of the Reorganization, as well as a non-cash compensation charge of $23.1 million related to the performance-based vesting of certain shares granted to Mr. Alberini and Mr. Friedman. The third quarter of fiscal 2011 includes a $6.4 million compensation charge related to the repayment of loans owed to Home Holdings by Gary Friedman, through the reclassification by Home Holdings of Mr. Friedman's Class A and Class A-1 ownership units into an equal number of Class A Prime and Class A-1 Prime ownership units. Mr. Friedman served as our Chairman and Co-Chief Executive Officer at the time of such loan repayment. |
| (l) | Includes costs related to the restructuring of our Shanghai office location. |
| (m) | Generally includes executive severance and other related costs. |
66
| (n) | Includes lease termination costs for retail stores that were closed prior to their respective lease termination dates. The lease termination amounts in the third quarter of fiscal 2011 and the first and second quarters of fiscal 2012 include changes in estimates regarding liabilities for future lease payments for closed stores. |
| (o) | Represents legal and other professional fees incurred in connection with the investigation conducted by the special committee of the board of directors relating to our former Chairman and Co-Chief Executive Officer, Gary Friedman, and our subsequent remedial actions. |
| (p) | Represents costs incurred in connection with our initial public offering, including a fee of $7.0 million to Catterton, Tower Three and Glenhill in accordance with our management services agreement, payments of $2.2 million to certain former executives and bonus payments to employees of $1.3 million. |
| (q) | Represents expense incurred as a result of increased tariff obligations of one of our foreign suppliers following the U.S. Department of Commerce's review of the anti-dumping duty order on wooden bedroom furniture from China for the period from January 1, 2011 through December 31, 2011. |
| (r) | As of the end of fiscal 2012, our U.S. operations achieved a position of cumulative profits for the most recent three-year period. We concluded that this record of cumulative profitability in recent years, coupled with our business plan for profitability in future periods provided assurance that our future tax benefits more likely than not would be realized. Accordingly, in the fourth quarter of fiscal 2012, we released all of our U.S. valuation allowance against net deferred tax assets. In addition, income tax items exclude the tax benefit related to the resolution of our Canada Revenue Agency examination in the third quarter of fiscal 2012, exclude the tax benefit from the utilization of federal and state net operating losses, and assume a normalized tax rate of 40% for all periods. |
| (7) | Comparable store sales have been calculated based upon retail stores that were open at least fourteen full months as of the end of the reporting period and did not change square footage by more than 20% between periods. If a store is closed for seven days during a month, that month will be excluded from comparable store sales. Comparable store net revenues exclude revenues from outlet stores. Because the fourth quarter of fiscal 2012 was a 14-week quarter, comparable store sales percentage for fourth quarter of fiscal 2012 excludes the extra week of sales. |
Liquidity and Capital Resources
General
Our business relies on cash flows from operations and the revolving line of credit as our primary sources of liquidity. Our primary cash needs are for merchandise inventories, Source Books and other catalogs, payroll, store rent, capital expenditures associated with opening new stores and updating existing stores, as well as infrastructure and information technology. The most significant components of our working capital are cash and cash equivalents, merchandise inventories, accounts receivable, accounts payable and other current liabilities. Our working capital is seasonal as a result of building inventory and paying for catalog costs for the key selling seasons, and as a result, our borrowings are generally higher during these periods when compared to the rest of our fiscal year. Our borrowings generally increase in our first fiscal quarter as we prepare for the outdoor selling season, which is in our second fiscal quarter, and they generally increase in the third fiscal quarter as we prepare for the holiday selling season, which is in our fourth fiscal quarter. We believe that cash expected to be generated from operations, and borrowing availability under the revolving line of credit or other financing arrangements, will be sufficient to meet working capital requirements, anticipated capital expenditures and payments due under our revolving line of credit for at least the next 12 – 24 months. Our investments in capital expenditures for fiscal 2012 totaled $49 million, of which $28 million was for construction of new stores and $21 million was for our infrastructure, including supply chain, information technology and renovations to our corporate headquarters. We expect to have capital expenditures of approximately $95 million to $100 million in fiscal 2013, primarily related to our efforts to continue our growth and expansion, including construction of Full Line Design Galleries and infrastructure investments.
67
Cash Flow Analysis
A summary of operating, investing, and financing activities is shown in the following table:
| Year Ended | ||||||||||||
| February 2, 2013 | January 28, 2012 | January 29, 2011 | ||||||||||
| (in thousands) | ||||||||||||
Provided by (used in) operating activities | $ | (3,864 | ) | $ | 17,121 | $ | (11,810 | ) | ||||
Used in investing activities | (49,368 | ) | (25,593 | ) | (39,907 | ) | ||||||
Provided by financing activities | 53,052 | 3,371 | 51,601 | |||||||||
Increase (decrease) in cash and cash equivalents | (158 | ) | (4,852 | ) | 178 | |||||||
Cash and cash equivalents at end of period | 8,354 | 8,512 | 13,364 | |||||||||
Net Cash Used In Operating Activities
Cash from operating activities consists primarily of net income (loss) adjusted for non-cash items including depreciation and amortization, stock-based compensation and the effect of changes in working capital and other activities.
For fiscal 2012, net cash used in operating activities was $3.9 million and consisted of an increase in working capital and other activities of $73.0 million and a net loss of $12.8 million, offset by non-cash items of $81.9 million. Non-cash items of $81.9 million include a $92.0 million compensation charge related to equity activity at the time of the Reorganization, a compensation charge of $23.1 million related to the performance-based vesting of certain shares granted to Mr. Alberini and Mr. Friedman subsequent to the Reorganization and depreciation and amortization of $26.7 million, offset by the release of our U.S. valuation allowance in fiscal 2012 of $57.2 million and a decrease in our non-cash income tax adjustments of $4.7 million. The increase in working capital and other activities consisted primarily of increases in inventory of $107.5 million as part of our strategy to improve our inventory position to meet demand levels, prepaid expenses of $24.5 million primarily due to an increase in catalog costs associated with the Source Book strategy and accounts receivable of $5.3 million due to timing of payments received related to our credit card receivables. These uses of cash from working capital components were partially offset by increases in accrued liabilities and accounts payable of $36.2 million primarily due to timing of payments, increases in deferred revenue and customer deposits of $16.2 million due to the timing of shipments made at fiscal year end, as well as increases in deferred rent and lease incentives of $10.9 million primarily due to entering into new lease agreements for Full Line Design Gallery locations.
For fiscal 2011, net cash provided by operating activities was $17.1 million and consisted of net income of $20.6 million and non-cash items of $48.6 million, offset by an increase in working capital and other activities of $52.1 million. Non-cash items of $48.6 million include expenses of $6.4 million related to the repayment of the executive loan by Mr. Friedman and $6.0 million for the management fee to the Principal Equity Holders, both incurred by Home Holdings on our behalf and reflected as capital contributions. The increase in working capital and other activities consisted primarily of increases in inventory of $39.5 million in anticipation of future demand and as a result of the increased capacity due to opening a new distribution center in fiscal 2011, prepaid expenses of $36.4 million primarily due to an increase in catalog costs associated with the Source Book strategy and accounts receivable of $7.3 million due to timing of payments received related to our credit card receivables. These uses of cash from working capital components were offset by sources of cash from increases in accrued liabilities and accounts payable of $14.4 million primarily due to timing of payments, increases in deferred revenue and customer deposits of $11.4 million due to the timing of shipments made at fiscal year end, as well as increases in other current liabilities of $3.9 million primarily due to an increase in gift certificate-related liabilities.
For fiscal 2010, net cash used in operating activities was $11.8 million and consisted of an increase in working capital and other activities of $39.0 million, and a net loss of $7.1 million partially offset by non-cash expenses included in the net loss of $34.3 million. Working capital and other activities consisted primarily of increases in inventory of $57.1 million, partially offset by increases in deferred rent and lease incentives of $8.6 million, accrued liabilities and accounts payable of $5.5 million primarily due to timing of payments, other
68
current liabilities of $3.4 million primarily due to an increase in gift certificate related liabilities and deferred revenue and customer deposits of $2.5 million primarily due to an increase in special orders as well as timing of shipments made at period end.
Net Cash Used In Investing Activities
Investing activities consist primarily of investments in capital expenditures related to new store openings and improvements and in supply chain and systems infrastructure.
For fiscal 2012, net cash used in investing activities was $49.4 million primarily as a result of investments in new stores of $27.8 million and investment in supply chain and systems infrastructure of $21.3 million and the purchase of a new domain name for $0.3 million.
For fiscal 2011, capital expenditures were $25.6 million as a result of investments in new stores of $15.7 million and investment in supply chain and systems infrastructure of $9.9 million.
For fiscal 2010, capital expenditures were $39.9 million as a result of investments in approximately 80 Gallery store conversions of $21.2 million, new stores of $11.0 million and investment in supply chain and systems infrastructure of $7.7 million.
Net Cash Provided By Financing Activities
Financing activities consist primarily of borrowings and repayments related to the revolving line of credit, term loan and capital contributions.
For fiscal 2012, net cash provided by financing activities was $53.1 million primarily due to the issuance of common stock which generated proceeds of $106.8 million, partially offset by issuance costs of $9.1 million. This overall increase in cash provided by the initial public offering was partially offset by net repayments under the revolving line of credit of $25.0 million, the repayment in full of the term loan of $15.0 million and payments on capital lease obligations of $4.2 million.
For fiscal 2011, net cash provided by financing activities was $3.4 million primarily due to entering into an amendment to Restoration Hardware, Inc.'s credit agreement, for the purpose of incorporating a term loan facility for $15.0 million in January 2012. This increase is offset by net repayments under the revolving line of credit of $4.6 million, debt issuance costs related to the amended credit agreement and term loan of $2.8 million, as well as payments on capital lease obligations of $4.2 million.
For fiscal 2010, net cash provided by financing activities was $51.6 million primarily due to an increase in net borrowing under the revolving line of credit of $54.2 million resulting from an increase in inventory purchases made during the period. This overall increase in cash provided by financing activities was partially offset by payments on capital lease obligations of $2.6 million.
Revolving Line of Credit and Term Loan
In August 2011, Restoration Hardware, Inc., along with its Canadian subsidiary, Restoration Hardware Canada, Inc., entered into a credit agreement with Bank of America, N.A., as administrative agent, and certain other lenders. This credit agreement modified a previous facility under which Restoration Hardware, Inc. had a revolving line of credit for up to $190.0 million, as of July 30, 2011. As a result of the modification, the unamortized deferred financing fees of $0.2 million related to the previous line of credit on the date of the modification will be amortized over the life of the new revolving line of credit, which has a maturity date of August 3, 2016. Under the credit agreement, Restoration Hardware, Inc. has a revolving line of credit available of up to $417.5 million (following Restoration Hardware, Inc.'s exercise of the commitment increase option on November 1, 2012, as described below), of which $10.0 million is available to Restoration Hardware Canada, Inc. The credit agreement was further amended in January 2012 to add a $15.0 million term loan facility with a maturity date of July 6, 2015, which was repaid in full on November 7, 2012, as described below.
69
Under the credit agreement's commitment increase provision, Restoration Hardware, Inc. had the option to increase the amount of the revolving line of credit by up to an additional $100.0 million, provided that, among other things, the existing lenders or additional lenders agreed to participate in the increased loan commitments under the revolving line of credit, no default under the credit agreement then existed or would result from such increase and sufficient borrowing base collateral was available to support increased loan amounts. On November 1, 2012, Restoration Hardware, Inc. increased the amount of the revolving line of credit by $100.0 million pursuant to this commitment increase provision.
On November 7, 2012, Restoration Hardware, Inc. made payments of $75.7 million on its revolving line of credit and repaid its outstanding term loan of $15.0 million in full. Such payments were funded from the proceeds received as a result of our initial public offering. Upon the repayment of the term loan in full, we expensed the remaining debt issuance costs of $0.2 million related to the term loan.
The availability of credit at any given time under the revolving line of credit is limited by reference to a borrowing base formula based upon numerous factors, including the value of eligible inventory, eligible accounts receivable, eligible real estate, and, in the case of the term loan, registered trade names and reserves established by the administrative agent. As a result of the borrowing base formula, the actual borrowing availability under the revolving line of credit could be less than the stated amount of the revolving line of credit (as reduced by the actual borrowings and outstanding letters of credit under the revolving line of credit). All obligations under the credit agreement are secured by substantially all of Restoration Hardware, Inc.'s assets, including accounts receivable, inventory, intangible assets, property, equipment, goods and fixtures.
Borrowings under the revolving line of credit are subject to interest, at the borrowers' option, at either the bank's reference rate or LIBOR (or the BA Rate or the Canadian Prime Rate, as such terms are defined in the credit agreement, for Canadian borrowings denominated in Canadian dollars or the United States Index Rate or LIBOR for Canadian borrowings denominated in United States dollars) plus an applicable margin rate, in each case. The weighted-average interest rate for the revolving line of credit was 2.5% as of February 2, 2013.
As of February 2, 2013, $82.5 million was outstanding under the revolving line of credit. As of February 2, 2013, Restoration Hardware, Inc.'s undrawn borrowing availability under the revolving line of credit was $188.5 million and there were $19.5 million in outstanding letters of credit.
The credit agreement contains various restrictive covenants, including, among others, limitations on the ability to incur liens, make loans or other investments, incur additional debt, issue additional equity, merge or consolidate with or into another person, sell assets, pay dividends or make other distributions or enter into transactions with affiliates, along with other restrictions and limitations typical to credit agreements of this type and size. The credit agreement does not contain any significant financial or coverage ratio covenants unless the availability under the revolving line of credit is less than the greater of (i) $17.5 million and (ii) 10% of the lesser of (A) the aggregate maximum commitments under the revolving line of credit and (B) the domestic borrowing base. If the availability under the revolving line of credit is less than the foregoing amount, then Restoration Hardware, Inc. is required to maintain a consolidated fixed charge coverage ratio of at least one to one. Such ratio is approximately the ratio on the last day of each month on a trailing twelve-month basis of (a) (i) consolidated EBITDA (as defined in the agreement) minus (ii) capital expenditures, minus (iii) the income taxes paid in cash to (b) the sum of (i) debt service charges plus (ii) certain dividends and distributions paid. As of February 2, 2013, Restoration Hardware, Inc. was in compliance with all covenants, and if the availability under the revolving line of credit were less than the amount described above, Restoration Hardware, Inc. would have been in compliance with the consolidated fixed charge coverage ratio described in the previous sentence. The credit agreement requires a daily sweep of cash to prepay the loans under the credit agreement while (i) an event of default exists or (ii) the availability under the revolving line of credit for extensions of credit to Restoration Hardware, Inc. is less than the greater of (A) $20.0 million and (B) 15% of the lesser of the aggregate maximum commitments and the domestic borrowing base.
70
Contractual Obligations
We enter into long term contractual obligations and commitments, primarily debt obligations and non-cancelable operating leases, in the normal course of business. As of February 2, 2013, our contractual cash obligations over the next several periods were as follows:
| Payments Due by Period | ||||||||||||||||||||
| Total | 2013 | 2014–2015 | 2016–2017 | Thereafter | ||||||||||||||||
| (in thousands) | ||||||||||||||||||||
Revolving line of credit (1) | $ | 82,501 | $ | - | $ | - | $ | 82,501 | $ | - | ||||||||||
Other long-term obligations (2) | 4,710 | 3,070 | 1,598 | 42 | - | |||||||||||||||
Operating leases (3) | 472,836 | 62,343 | 103,056 | 83,042 | 224,395 | |||||||||||||||
Letters of credit | 19,466 | 19,466 | - | - | - | |||||||||||||||
|
|
|
|
|
|
|
|
|
| |||||||||||
Total | $ | 579,513 | $ | 84,879 | $ | 104,654 | $ | 165,585 | $ | 224,395 | ||||||||||
|
|
|
|
|
|
|
|
|
| |||||||||||
| (1) | Excludes estimated interest under the revolving line of credit. Interest costs for the revolving line of credit have been estimated based on interest rates in effect for our indebtedness as of February 2, 2013, as well as estimated borrowing levels in the future based upon planned inventory purchases. Actual borrowing levels and interest costs may differ. The revolving line of credit has a maturity date of August 3, 2016. |
| (2) | Other long-term obligations consist of capital lease obligations. |
| (3) | We enter into operating leases in the normal course of business. Most lease arrangements provide us with the option to renew the leases at defined terms. The future operating lease obligations would change if we were to exercise these options, or if we were to enter into additional new operating leases. Amounts above do not include estimated contingent rent due under operating leases of $1.5 million at February 2, 2013. |
The liability of $1.8 million as of February 2, 2013, for unrecognized tax benefits associated with uncertain tax positions (see Note 10- Income Taxes to our audited consolidated financial statements) has not been included in the contractual obligations table above because we are not able to reasonably estimate when cash payments for these liabilities will occur or the amount by which these liabilities will increase or decrease over time.
Off Balance Sheet Arrangements
We have no material off balance sheet arrangements as of February 2, 2013.
Critical Accounting Policies and Estimates
The preparation of financial statements in accordance with accounting principles generally accepted in the United States requires management to make estimates and assumptions that affect amounts reported in our consolidated financial statements and related notes, as well as the related disclosure of contingent assets and liabilities at the date of the financial statements and the reported amounts of revenues and expenses during the reporting period. Management evaluates its accounting policies, estimates, and judgments on an on-going basis. Management bases its estimates and judgments on historical experience and various other factors that are believed to be reasonable under the circumstances. Actual results may differ from these estimates under different assumptions and conditions and such differences could be material to the consolidated financial statements.
Management evaluated the development and selection of its critical accounting policies and estimates and believes that the following involve a higher degree of judgment or complexity and are most significant to reporting our results of operations and financial position, and are therefore discussed as critical. The following critical accounting policies reflect the significant estimates and judgments used in the preparation of our consolidated financial statements. With respect to critical accounting policies, even a relatively minor variance between actual and expected experience can potentially have a materially favorable or unfavorable impact on subsequent results of operations. However, our historical results for the periods presented in the consolidated
71
financial statements have not been materially impacted by such variances. More information on all of our significant accounting policies can be found in Note 4- Significant Accounting Policies to our audited consolidated financial statements.
Revenue Recognition
We recognize revenues and the related cost of goods sold when merchandise is received by our customers. Revenues from "cash-and-carry" store sales are recognized at the point of sale in the store. Revenues from direct-to-customer and home-delivered sales are recognized when the merchandise is delivered to the customer. Discounts provided to customers are accounted for as a reduction of sales.
We recognize shipping and handling fees as revenue when the merchandise is received by our customers. Costs of shipping and handling are included in cost of goods sold.
Sales tax collected is not recognized as revenue as it is ultimately remitted to governmental authorities.
We reserve for projected merchandise returns based on actual, historical experience and various other assumptions that we believe to be reasonable. Actual merchandise returns are monitored regularly and have not been materially different from the estimates recorded. Merchandise returns are granted for various reasons, including delays in product delivery, product quality issues, customer preference and other similar matters. Product returned often represents merchandise that can be resold. Amounts refunded to customers are generally made by issuing the same payment tender as used in the original purchase. Merchandise exchanges of the same product and price are not considered merchandise returns and, therefore, are excluded when calculating the sales returns reserve.
Gift Certificates and Merchandise Credits
We sell gift certificates and issue merchandise credits to our customers in our stores and through our websites and product catalogs. Such gift certificates and merchandise credits do not have expiration dates. Revenue associated with gift certificates and merchandise credits is deferred until either (i) redemption of the gift certificate and merchandise credits or (ii) when the likelihood of redemption is remote and there exists no legal obligation to remit the value of unredeemed gift certificates or merchandise credits to the relevant jurisdictions (breakage). The breakage rate is based on monitoring of certificates issued, actual certificate redemptions and our analysis of when we believe it is remote that redemptions will occur.
Redeemed gift certificates and merchandise credits are recorded in net revenues. The liability for unredeemed gift certificates and merchandise credits is reversed to selling, general and administrative expenses when it is determined that certificates will not be redeemed.
Merchandise Inventories
Our merchandise inventories are composed of finished goods and are carried at the lower of cost or market, with cost determined on a weighted-average cost method and market determined based on the estimated net realizable value. To determine if the value of inventory should be marked down below original cost, we consider current and anticipated demand, customer preference and the merchandise age. The inventory value is adjusted periodically to reflect current market conditions, which requires management judgments that may significantly affect the ending inventory valuation, as well as gross margin. The significant estimates used in inventory valuation are obsolescence (including excess and slow-moving inventory and lower of cost or market reserves) and estimates of inventory shrinkage. We adjust our inventory for obsolescence based on historical trends, aging reports, specific identification and our estimates of future retail sales prices.
Reserves for shrinkage are estimated and recorded throughout the period as a percentage of net sales based on historical shrinkage results and current inventory levels. Actual shrinkage is recorded throughout the year
72
based upon periodic cycle counts and the results of our annual physical inventory count. Actual inventory shrinkage and obsolescence can vary from estimates due to factors including the mix of our inventory (which ranges from large furniture to decorative accessories) and execution against loss prevention initiatives in our stores, distribution centers, off-site storage locations and with third-party transportation providers.
Due to these factors, our obsolescence and shrinkage reserves contain uncertainties. Both estimates have calculations that require management to make assumptions and to apply judgment regarding a number of factors, including market conditions, the selling environment, historical results and current inventory trends. If actual observed obsolescence or periodic updates of our shrinkage estimates differ from our original estimates, we adjust our inventory reserves accordingly throughout the period. Management does not believe that changes in the assumptions used in these estimates would have a significant effect on our net income or inventory balances. We have not made any material changes to our assumptions included in the calculations of the obsolescence and shrinkage reserves during the periods presented or recorded significant adjustments related to the physical inventory process.
Impairment of Goodwill and Long-Lived Assets
Goodwill
We evaluate goodwill annually to determine whether it is impaired. Goodwill is also tested between annual impairment tests if an event occurs or circumstances change that would indicate that the fair value of a reporting unit is less than its carrying amount. Conditions that may indicate impairment include, but are not limited to, a significant adverse change in customer demand or business climate that could affect the value of an asset; general economic conditions, such as increasing Treasury rates or unexpected changes in gross domestic product growth; a change in our market share; budget-to-actual performance and consistency of operating margins and capital expenditures; a product recall or an adverse action or assessment by a regulator; or changes in management or key personnel. If an impairment indicator exists, we test the intangible asset for recoverability. We have identified only one single reporting unit. We selected the fourth fiscal quarter to perform our annual goodwill impairment testing.
We qualitatively assess goodwill impairment to determine whether it is more likely than not that the fair value of a reporting unit is less than its carrying amount. During fiscal 2012, we performed a qualitative analysis examining key events and circumstances affecting fair value and determined it is more likely than not that the reporting unit's fair value is greater than its carrying amount. As such, no further analysis was required for purposes of testing of our goodwill for impairment.
For goodwill not qualitatively assessed, a two-step quantitative approach is used. In the first step, we compare the fair value of the reporting unit, generally defined as the same level as or one level below an operating segment, to its carrying value. If the fair value of the reporting unit exceeds the carrying value of the net assets assigned to that unit, goodwill is considered not impaired and we are not required to perform further testing. If the carrying value of the net assets assigned to the reporting unit exceeds the fair value of the reporting unit, then we must perform the second step of the impairment test in order to determine the implied fair value of the reporting unit's goodwill. If the carrying value of a reporting unit's goodwill exceeds its implied fair value, then we would record an impairment loss equal to the difference. The assumptions used in such valuations are subject to volatility and may differ from actual results.
Our tests for impairment of goodwill resulted in a determination that the fair value of the Company substantially exceeded the carrying value of our net assets as of February 2, 2013. We do not anticipate any material impairment charges in the near term.
Long-Lived Assets
Long-lived assets, such as property and equipment and intangible assets subject to amortization, are reviewed for impairment whenever events or changes in circumstances indicate that the carrying amount of an asset may not
73
be recoverable. Conditions that may indicate impairment include, but are not limited to, a significant adverse change in customer demand or business climate that could affect the value of an asset, a product recall or an adverse action or assessment by a regulator. If the sum of the estimated undiscounted future cash flows related to the asset are less than the carrying value, we recognize a loss equal to the difference between the carrying value and the fair value, usually determined by the estimated discounted cash flow analysis of the asset.
We evaluate long-lived tangible assets at an individual store level, which is the lowest level at which independent cash flows can be identified. We evaluate corporate assets or other long-lived assets that are not store-specific at the consolidated level.
Since there is typically no active market for our long-lived tangible assets, we estimate fair values based on the expected future cash flows. We estimate future cash flows based on store-level historical results, current trends, and operating and cash flow projections. Our estimates are subject to uncertainty and may be affected by a number of factors outside our control, including general economic conditions and the competitive environment. While we believe our estimates and judgments about future cash flows are reasonable, future impairment charges may be required if the expected cash flow estimates, as projected, do not occur or if events change requiring us to revise our estimates.
Stock-Based Compensation
In the third quarter of fiscal 2012, we changed our policy for recognizing stock-based compensation expense from the graded method of accounting to the straight-line method of accounting for our time-based units (or service-only) awards. Based on research and analysis, we believe the straight-line method of accounting for stock-based compensation expense for service-only awards is the predominant method used in our industry. In order for our results of operations to be comparable to our peers, we have concluded that the straight-line method of accounting for stock-based compensation is a preferable accounting method in accordance with ASC 250-10-45.
We account for stock-based compensation in accordance with applicable guidance which requires the fair value of stock-based payments to be recognized in the consolidated financial statements as compensation expense over the requisite service period. For service-only awards compensation expense is recognized on a straight-line basis, net of forfeitures, over the requisite service period for the fair value of awards that actually vest. Fair value for restricted stock units is valued using the closing price of our stock on the date of grant. The fair value of each option award granted under our award plans subsequent to our initial public offering is estimated on the date of grant using a Black-Scholes Merton option pricing model with the following assumptions:
| • | Expected volatility-Based on the lack of historical data for our own shares, we base our expected volatility on a representative peer group that takes into account industry, market capitalization, stage of life cycle and capital structure. |
| • | Expected term-Represents the period of time that options granted are expected to be outstanding. We elected to calculate the expected term of the option awards using the "simplified method". This election was made as we do not have sufficient historical exercise data to provide a reasonable basis upon which to estimate expected term. Under the "simplified" calculation method, the expected term is calculated as an average of the vesting period and the contractual life of the options. |
| • | Risk-free interest rate-Based on the U.S. Treasury zero-coupon bond rate with a remaining term approximate of the expected term of the option. |
| • | Dividend yield-As we have not paid dividends, nor do we currently plan to pay dividends in the future, the assumed dividend yield is zero. |
Prior to the Reorganization, Home Holdings had granted performance-based units that vested and became deliverable upon achievement or satisfaction of performance conditions specified in the performance agreement or upon the return on investment attained by certain of the equity investors in Home Holdings at defined liquidity
74
events, including an initial public offering or certain sale or merger transactions. We estimated the fair value of performance-based units awarded to employees at the grant date based on the fair value of the Company on such date. We also considered the probability of achieving the established performance targets in determining our stock-based compensation with respect to these awards. We recognize compensation cost over the performance period. When the performance is related to a specific event occurring in the future, we recognize the full expense at the time of the event. In connection with the initial public offering, shares of our common stock with substantially similar restrictions, terms and conditions were issued in replacement of these performance-based units.
In connection with Gary Friedman's resignation as Chairman and Co-Chief Executive Officer and new role as Chairman Emeritus, Creator and Curator, shares of unvested stock he received in replacement of certain performance-based units will be marked to market every period until the required vesting criteria are met in accordance with Financial Accounting Standards Board Accounting Standards Codification Topic 718. As of April 16, 2013, 480,959 of these shares remained unvested.
Income Taxes
We account for income taxes under an asset and liability approach that requires the recognition of deferred tax assets and liabilities for the expected future tax consequences of events that have been recognized in our consolidated financial statements or tax returns. In estimating future tax consequences, we generally take into account all expected future events then known to us, other than changes in the tax law or rates which have not yet been enacted and which are not permitted to be considered. Accordingly, we may record a valuation allowance to reduce our net deferred tax assets to the amount that is more-likely-than-not to be realized. The determination as to whether a deferred tax asset will be realized is made on a jurisdictional basis and is based upon management's best estimate of the recoverability of our net deferred tax assets. Future taxable income and ongoing prudent and feasible tax planning are considered in determining the amount of the valuation allowance, and the amount of the allowance is subject to adjustment in the future. Specifically, in the event we are to determine that we are not more-likely-than-not able to realize our net deferred tax assets in the future, an adjustment to the valuation allowance would decrease income in the period such determination is made. This allowance does not alter our ability to utilize the underlying tax net operating loss and credit carryforwards in the future, the utilization of which is limited to achieving future taxable income.
In assessing the need for a valuation allowance, we consider both positive and negative evidence related to the likelihood of realization of the deferred tax assets. If, based on the weight of available evidence, it is more-likely-than-not the deferred tax assets will not be realized, we record a valuation allowance. The weight given to the positive and negative evidence is commensurate with the extent to which the evidence may be objectively verified. As such, it is generally difficult for positive evidence regarding projected future taxable income exclusive of reversing taxable temporary differences to outweigh objective negative evidence of recent financial reporting losses. United States GAAP states that cumulative losses in recent years are a significant piece of negative evidence that is difficult to overcome in determining that a valuation allowance is not needed against deferred tax assets.
Due to the historical losses incurred, we had recorded a full valuation allowance against the U.S. net deferred tax assets, excluding deferred tax liabilities related to indefinite lived intangibles, as well as against the net deferred tax assets in Shanghai.
A sustained period of profitability in our operations was required before we would change our judgment regarding the need for a full valuation allowance against our net deferred tax assets. Although we were profitable for the full fiscal 2011, the seasonality of our business continued to result in losses during certain quarters. We recorded a net loss of $3.7 million in the first quarter of fiscal 2012, compared to a net loss of $6.2 million in the same quarter of fiscal 2011, and net income of $17.6 million in the second quarter of fiscal 2012, compared to net income of $7.6 million in the same quarter of fiscal 2011. Due to the seasonality of our business, our full year results historically have substantially depended on the results from operations in the fourth quarter.
75
By the end of fiscal 2012, our U.S. operations achieved a position of cumulative profits (adjusted for permanent items) for the most recent three-year period. We concluded that this record of cumulative profitability in recent years, coupled with our business plan for profitability in future periods, provided assurance that our future tax benefits are more likely than not to be realized. Accordingly, in the fourth quarter of fiscal 2012, we released all of our U.S. valuation allowance against net deferred tax assets, resulting in a $57.2 million benefit in our provision for income taxes. At February 2, 2013, we have retained a valuation allowance totaling $0.3 million against deferred tax assets for our Shanghai operations.
The accounting standard for uncertainty in income taxes prescribes a recognition threshold that a tax position is required to meet before being recognized in the financial statements and provides guidance on derecognition, measurement, classification, interest and penalties, accounting in interim periods, disclosure and transition issues. Differences between tax positions taken in a tax return and amounts recognized in the financial statements generally result in an increase in a liability for income taxes payable or a reduction of an income tax refund receivable, or a reduction in a deferred tax asset or an increase in a deferred tax liability, or both. We recognize interest and penalties related to unrecognized tax benefits in tax expense.
Recently Issued Accounting Pronouncements
Indefinite-Lived Intangible Assets
In July 2012, the Financial Accounting Standards Board issued guidance that revises the requirements around how entities test indefinite-lived intangible assets other than goodwill for impairment. Similar to the guidance issued in September 2011 related to the testing of goodwill for impairment, this guidance allows companies to perform a qualitative assessment before calculating the fair value of the indefinite-lived intangible asset. If entities determine, on the basis of qualitative factors, that the fair value of the indefinite-lived intangible asset is more likely than not greater than the carrying amount, a quantitative calculation would not be needed. We adopted this guidance for our fiscal 2012 annual indefinite-lived intangible assets impairment test. The adoption of this guidance resulted in a change in how we performed our indefinite-lived intangible assets impairment assessment; however, the adoption did not have a material impact on our consolidated financial statements.
| Item 7A. | Quantitative and Qualitative Disclosure of Market Risks |
Interest Rate Risk
We are subject to interest rate risk in connection with borrowings under our revolving line of credit and, prior to its repayment on November 7, 2012, our term loan, which bear interest at variable rates. At February 2, 2013, $82.5 million was outstanding under the revolving line of credit. As of February 2, 2013, the undrawn borrowing availability under the revolving line of credit was $188.5 million, and there were $19.5 million in outstanding letters of credit. We currently do not engage in any interest rate hedging activity and we have no intention to do so in the foreseeable future. Based on the average interest rate on the revolving line of credit during the year ended February 2, 2013, and to the extent that borrowings were outstanding, we do not believe that a 10% change in the interest rate would have a material effect on our consolidated results of operations or financial condition.
Impact of Inflation
Our results of operations and financial condition are presented based on historical cost. While it is difficult to accurately measure the impact of inflation due to the imprecise nature of the estimates required, we believe the effects of inflation, if any, on our results of operations and financial condition have been immaterial.
76
| Item 8. | Financial Statements and Supplementary Data |
RESTORATION HARDWARE HOLDINGS, INC.
CONSOLIDATED BALANCE SHEETS
(In thousands, except share amounts)
| February 2, 2013 | January 28, 2012 | |||||||
ASSETS | ||||||||
Current assets: | ||||||||
Cash and cash equivalents | $ | 8,354 | $ | 8,512 | ||||
Accounts receivable-net | 17,040 | 11,759 | ||||||
Merchandise inventories | 353,329 | 245,876 | ||||||
Current deferred tax assets | 37,006 | 4,161 | ||||||
Prepaid expense and other current assets | 77,029 | 52,570 | ||||||
|
|
|
| |||||
Total current assets | 492,758 | 322,878 | ||||||
Property and equipment-net | 111,406 | 83,558 | ||||||
Goodwill | 122,601 | 122,595 | ||||||
Trademarks | 47,410 | 47,100 | ||||||
Other intangible assets-net | 2,713 | 5,426 | ||||||
Non-current deferred tax assets | 6,873 | - | ||||||
Other assets | 5,852 | 5,253 | ||||||
|
|
|
| |||||
Total assets | $ | 789,613 | $ | 586,810 | ||||
|
|
|
| |||||
LIABILITIES AND STOCKHOLDERS' EQUITY | ||||||||
Current liabilities: | ||||||||
Accounts payable and accrued expenses | $ | 145,353 | $ | 105,694 | ||||
Deferred revenue and customer deposits | 41,643 | 25,419 | ||||||
Other current liabilities | 32,428 | 30,861 | ||||||
|
|
|
| |||||
Total current liabilities | 219,424 | 161,974 | ||||||
Revolving line of credit | 82,501 | 107,502 | ||||||
Term loan | - | 14,798 | ||||||
Deferred rent and lease incentives | 30,784 | 19,851 | ||||||
Deferred tax liabilities | - | 22,153 | ||||||
Other long-term obligations | 5,293 | 10,069 | ||||||
|
|
|
| |||||
Total liabilities | 338,002 | 336,347 | ||||||
|
|
|
| |||||
Commitments and contingencies (See Note 15 to the consolidated financial statements) | - | - | ||||||
Stockholders' equity: | ||||||||
Common stock, $0.0001 par value per share, 180,000,000 shares authorized, 38,856,251 shares issued and 37,967,635 shares outstanding as of February 2, 2013; zero par value, 1,000 shares authorized, 1,000 shares issued and outstanding as of January 28, 2012 | 4 | - | ||||||
Additional paid-in capital | 505,883 | 292,011 | ||||||
Accumulated other comprehensive income | 1,211 | 1,150 | ||||||
Accumulated deficit | (55,487 | ) | (42,698 | ) | ||||
|
|
|
| |||||
Total stockholders' equity | 451,611 | 250,463 | ||||||
|
|
|
| |||||
Total liabilities and stockholders' equity | $ | 789,613 | $ | 586,810 | ||||
|
|
|
| |||||
The accompanying notes are an integral part of these Consolidated Financial Statements.
77
RESTORATION HARDWARE HOLDINGS, INC.
CONSOLIDATED STATEMENTS OF OPERATIONS
(In thousands, except share and per share amounts)
| Year Ended | ||||||||||||
| February 2, 2013 | January 28, 2012 | January 29, 2011 | ||||||||||
Net revenues | $ | 1,193,046 | $ | 958,084 | $ | 772,752 | ||||||
Cost of goods sold | 756,597 | 601,735 | 501,132 | |||||||||
|
|
|
|
|
| |||||||
Gross profit | 436,449 | 356,349 | 271,620 | |||||||||
Selling, general and administrative expenses | 505,485 | 329,506 | 274,836 | |||||||||
|
|
|
|
|
| |||||||
Income (loss) from operations | (69,036 | ) | 26,843 | (3,216 | ) | |||||||
Interest expense | (5,776 | ) | (5,134 | ) | (3,150 | ) | ||||||
|
|
|
|
|
| |||||||
Income (loss) before income taxes | (74,812 | ) | 21,709 | (6,366 | ) | |||||||
Income tax expense (benefit) | (62,023 | ) | 1,121 | 685 | ||||||||
|
|
|
|
|
| |||||||
Net income (loss) | $ | (12,789 | ) | $ | 20,588 | $ | (7,051 | ) | ||||
|
|
|
|
|
| |||||||
Weighted-average shares used in computing basic and diluted net income (loss) per share | 9,428,828 | 468 | 100 | |||||||||
Basic and diluted net income (loss) per share | $ | (1.36 | ) | $ | 43,991 | $ | (70,510 | ) | ||||
The accompanying notes are an integral part of these Consolidated Financial Statements.
78
RESTORATION HARDWARE HOLDINGS, INC.
CONSOLIDATED STATEMENTS OF COMPREHENSIVE INCOME (LOSS)
(In thousands)
| Year Ended | ||||||||||||
| February 2, 2013 | January 28, 2012 | January 29, 2011 | ||||||||||
Net income (loss) | $ | (12,789 | ) | $ | 20,588 | $ | (7,051 | ) | ||||
Foreign currency translation adjustment-net of tax | 61 | 163 | 657 | |||||||||
|
|
|
|
|
| |||||||
Total comprehensive income (loss) | $ | (12,728 | ) | $ | 20,751 | $ | (6,394 | ) | ||||
|
|
|
|
|
| |||||||
The accompanying notes are an integral part of these Consolidated Financial Statements.
79
RESTORATION HARDWARE HOLDINGS, INC.
CONSOLIDATED STATEMENTS OF STOCKHOLDERS' EQUITY
(In thousands, except share amounts)
| Common Stock | Additional Paid-In Capital | Accumulated Other Comprehensive Income (Loss) | Accumulated Deficit | Total Stockholders' Equity | ||||||||||||||||||||
| Shares | Amount | |||||||||||||||||||||||
Balances-January 30, 2010 | 100 | $ | - | $ | 276,984 | $ | 330 | $ | (56,235 | ) | $ | 221,079 | ||||||||||||
Stock-based compensation | - | - | 1,119 | - | - | 1,119 | ||||||||||||||||||
Net loss | - | - | - | - | (7,051 | ) | (7,051 | ) | ||||||||||||||||
Foreign currency translation adjustment-net of tax | - | - | - | 657 | - | 657 | ||||||||||||||||||
|
|
|
|
|
|
|
|
|
|
|
| |||||||||||||
Balances-January 29, 2011 | 100 | - | 278,103 | 987 | (63,286 | ) | 215,804 | |||||||||||||||||
Stock-based compensation | - | - | 1,557 | - | - | 1,557 | ||||||||||||||||||
Capital contribution-executive compensation | - | - | 6,350 | - | - | 6,350 | ||||||||||||||||||
Capital contribution-management fee | - | - | 6,000 | - | - | 6,000 | ||||||||||||||||||
Net income | - | - | - | - | 20,588 | 20,588 | ||||||||||||||||||
Foreign currency translation adjustment-net of tax | - | - | - | 163 | - | 163 | ||||||||||||||||||
Capitalization of Restoration Hardware Holdings, Inc. | 900 | - | 1 | - | - | 1 | ||||||||||||||||||
|
|
|
|
|
|
|
|
|
|
|
| |||||||||||||
Balances-January 28, 2012 | 1,000 | - | 292,011 | 1,150 | (42,698 | ) | 250,463 | |||||||||||||||||
Stock-based compensation | - | - | 116,183 | - | - | 116,183 | ||||||||||||||||||
Conversion of Restoration Hardware Holdings, Inc. common stock upon Reorganization | (1,000 | ) | - | - | - | - | - | |||||||||||||||||
Issuance of common stock upon Reorganization | 32,188,891 | 3 | (3 | ) | - | - | - | |||||||||||||||||
Issuance of common stock-net of issuance costs | 4,782,609 | 1 | 97,692 | - | - | 97,693 | ||||||||||||||||||
Vesting of stock awards | 996,135 | - | - | - | - | - | ||||||||||||||||||
Net loss | - | - | - | - | (12,789 | ) | (12,789 | ) | ||||||||||||||||
Foreign currency translation adjustment-net of tax | - | - | - | 61 | - | 61 | ||||||||||||||||||
|
|
|
|
|
|
|
|
|
|
|
| |||||||||||||
Balances-February 2, 2013 | 37,967,635 | $ | 4 | $ | 505,883 | $ | 1,211 | $ | (55,487 | ) | $ | 451,611 | ||||||||||||
|
|
|
|
|
|
|
|
|
|
|
| |||||||||||||
The accompanying notes are an integral part of these Consolidated Financial Statements.
80
RESTORATION HARDWARE HOLDINGS, INC.
CONSOLIDATED STATEMENTS OF CASH FLOWS
(In thousands)
| Year Ended | ||||||||||||
| February 2, 2013 | January 28, 2012 | January 29, 2011 | ||||||||||
CASH FLOWS FROM OPERATING ACTIVITIES | ||||||||||||
Net income (loss) | $ | (12,789 | ) | $ | 20,588 | $ | (7,051 | ) | ||||
Adjustments to reconcile net income (loss) to net cash provided by (used in) operating activities: | ||||||||||||
Depreciation and amortization | 26,748 | 29,186 | 31,263 | |||||||||
Impairment of property and equipment | - | - | 2,115 | |||||||||
Loss on disposal of property and equipment | - | 674 | - | |||||||||
Stock-based compensation expense | 116,183 | 1,557 | 1,119 | |||||||||
Capital contribution-executive compensation | - | 6,350 | - | |||||||||
Capital contribution-management fee paid by Home Holdings on behalf of the Company | - | 6,000 | - | |||||||||
Release of valuation allowance | (57,185 | ) | - | - | ||||||||
Deferred income taxes | (4,686 | ) | 4,299 | (427 | ) | |||||||
Amortization of financing fees | 863 | 573 | 193 | |||||||||
Change in assets and liabilities: | ||||||||||||
Accounts receivable | (5,282 | ) | (7,280 | ) | 68 | |||||||
Merchandise inventories | (107,454 | ) | (39,475 | ) | (57,103 | ) | ||||||
Prepaid expense and other current assets | (24,454 | ) | (36,371 | ) | (1,477 | ) | ||||||
Other assets | (371 | ) | (573 | ) | (797 | ) | ||||||
Accounts payable and accrued expenses | 36,154 | 14,374 | 5,475 | |||||||||
Deferred revenue and customer deposits | 16,224 | 11,418 | 2,503 | |||||||||
Other current liabilities | 2,689 | 3,915 | 3,395 | |||||||||
Deferred rent and lease incentives | 10,923 | 1,732 | 8,638 | |||||||||
Other long-term obligations | (1,427 | ) | 154 | 276 | ||||||||
|
|
|
|
|
| |||||||
Net cash provided by (used in) operating activities | (3,864 | ) | 17,121 | (11,810 | ) | |||||||
|
|
|
|
|
| |||||||
CASH FLOWS FROM INVESTING ACTIVITIES | ||||||||||||
Capital expenditures | (49,058 | ) | (25,593 | ) | (39,907 | ) | ||||||
Purchase of trademarks and other intangible assets | (310 | ) | - | - | ||||||||
|
|
|
|
|
| |||||||
Net cash used in investing activities | (49,368 | ) | (25,593 | ) | (39,907 | ) | ||||||
|
|
|
|
|
| |||||||
CASH FLOWS FROM FINANCING ACTIVITIES | ||||||||||||
Gross borrowings under revolving line of credit | 1,344,468 | 1,007,330 | 875,936 | |||||||||
Gross repayments under revolving line of credit | (1,369,469 | ) | (1,011,937 | ) | (821,734 | ) | ||||||
Proceeds from issuance of term loan | - | 15,000 | - | |||||||||
Repayment of term loan | (15,000 | ) | - | - | ||||||||
Debt issuance costs | (426 | ) | (2,835 | ) | - | |||||||
Payments on capital leases and other long-term obligations | (4,214 | ) | (4,188 | ) | (2,601 | ) | ||||||
Capitalization of Restoration Hardware Holdings, Inc. | - | 1 | - | |||||||||
Proceeds from issuance of common stock-net of issuance costs | 97,693 | - | - | |||||||||
|
|
|
|
|
| |||||||
Net cash provided by financing activities | 53,052 | 3,371 | 51,601 | |||||||||
|
|
|
|
|
| |||||||
Effects of foreign currency exchange rate translation | 22 | 249 | 294 | |||||||||
|
|
|
|
|
| |||||||
Net increase (decrease) in cash and cash equivalents | (158 | ) | (4,852 | ) | 178 | |||||||
Cash and cash equivalents | ||||||||||||
Beginning of period | 8,512 | 13,364 | 13,186 | |||||||||
|
|
|
|
|
| |||||||
End of period | $ | 8,354 | $ | 8,512 | $ | 13,364 | ||||||
|
|
|
|
|
| |||||||
Cash paid for interest | $ | 5,382 | $ | 3,737 | $ | 2,068 | ||||||
Cash paid for taxes | 1,861 | 1,697 | 744 | |||||||||
Non-cash transactions: | ||||||||||||
Property and equipment acquired under capital lease | - | 7,770 | 3,550 | |||||||||
Property and equipment additions in accounts payable | 3,505 | 645 | 454 | |||||||||
Capital contribution-executive compensation | - | 6,350 | - | |||||||||
Capital contribution-management fee paid by Home Holdings on behalf of the Company | - | 6,000 | - | |||||||||
The accompanying notes are an integral part of these Consolidated Financial Statements.
81
RESTORATION HARDWARE HOLDINGS, INC.
NOTES TO CONSOLIDATED FINANCIAL STATEMENTS
NOTE 1-NATURE OF BUSINESS
Restoration Hardware Holdings, Inc., a Delaware corporation, together with its subsidiaries (collectively, the "Company"), is a luxury home furnishings retailer that offers a growing number of categories including furniture, lighting, textiles, bathware, decorative accessories, outdoor and children's furnishings. These products are sold through the Company's stores, catalogs and websites. As of February 2, 2013, the Company operated a total of 71 retail stores and 13 outlet stores in 28 states, the District of Columbia and Canada, and had sourcing operations in Shanghai and Hong Kong.
NOTE 2-ORGANIZATION
The Company was formed on August 18, 2011 and capitalized on September 2, 2011 as a holding company for the purposes of facilitating an initial public offering of common equity and is a direct subsidiary of Home Holdings, LLC, a Delaware limited liability company ("Home Holdings").
On November 1, 2012, the Company acquired all of the outstanding shares of capital stock of Restoration Hardware, Inc., a Delaware corporation, and Restoration Hardware, Inc. became a direct, wholly owned subsidiary of the Company. Outstanding units issued by Home Holdings under its equity compensation plan, referred to as the Team Resto Ownership Plan, were replaced with common stock of the Company at the time of its initial public offering. Restoration Hardware, Inc. was a direct, wholly owned subsidiary of Home Holdings prior to the Company's initial public offering. These transactions are referred to as the "Reorganization." As a result of these transactions, as of November 1, 2012, 32,188,891 shares of the Company's common stock were outstanding.
On November 7, 2012, the Company completed its initial public offering. In connection with its initial public offering, the Company issued and sold 4,782,609 shares of its common stock at a price of $24.00 per share. In addition, certain of the Company's stockholders sold an aggregate of 381,723 shares of common stock held by them in the initial public offering. Further, certain stockholders sold an additional aggregate of 774,650 shares of common stock held by them pursuant to the exercise by the offering's underwriters of their option to purchase additional shares. The Company did not receive any proceeds from the sale of stock by its stockholders.
As a result of the initial public offering, the Company raised a total of $114.8 million in gross proceeds, or approximately $106.7 million in net proceeds after deducting underwriting discounts and commissions of $8.1 million. The Company capitalized $9.1 million of offering costs associated with its initial public offering, which are included in additional paid-in capital and offset against the initial public offering proceeds.
Prior to the Reorganization, Restoration Hardware Holdings, Inc. had not engaged in any business or other activities except in connection with its formation and the Reorganization. Accordingly, all financial and other information herein relating to periods prior to the completion of the Reorganization is that of Restoration Hardware, Inc.
NOTE 3-CHANGE IN ACCOUNTING PRINCIPLE-STOCK-BASED COMPENSATION
In the third quarter of 2012, the Company changed its policy for recognizing stock-based compensation expense from the graded method of accounting to the straight-line method of accounting for its time-based units (or service-only awards). The Company previously disclosed this change in accounting policy and retrospectively restated its consolidated financial statements for such change in its audited consolidated financial statements for the fiscal year ended January 28, 2012 and unaudited condensed consolidated financial statements for the six months ended July 28, 2012, which are included in the Company's final prospectus filed with the Securities and Exchange Commission on November 5, 2012.
82
Based on research and analysis, the Company believes the straight-line method of accounting for stock-based compensation expense for service-only awards is the predominant method used in its industry. In order for the Company's results of operations to be comparable to its peers, it has concluded that the straight-line method of accounting for stock-based compensation is a preferable accounting method in accordance with ASC 250-10-45.
The following table presents the comparative effect of the change in accounting method and its impact on key components of the Company's consolidated statements of operations ( dollar amounts in thousands ):
| Year Ended | ||||||||||||||||
| January 28, 2012 | January 29, 2011 | |||||||||||||||
| As Reported | As Revised | As Reported | As Revised | |||||||||||||
Net revenues | $ | 958,084 | $ | 958,084 | $ | 772,752 | $ | 772,752 | ||||||||
Cost of goods sold | 601,735 | 601,735 | 501,132 | 501,132 | ||||||||||||
|
|
|
|
|
|
|
| |||||||||
Gross profit | 356,349 | 356,349 | 271,620 | 271,620 | ||||||||||||
Selling, general and administrative expense | 329,753 | 329,506 | 275,859 | 274,836 | ||||||||||||
|
|
|
|
|
|
|
| |||||||||
Income (loss) from operations | 26,596 | 26,843 | (4,239 | ) | (3,216 | ) | ||||||||||
Interest expense | (5,134 | ) | (5,134 | ) | (3,150 | ) | (3,150 | ) | ||||||||
|
|
|
|
|
|
|
| |||||||||
Income (loss) before income taxes | 21,462 | 21,709 | (7,389 | ) | (6,366 | ) | ||||||||||
Income tax expense | 1,121 | 1,121 | 685 | 685 | ||||||||||||
|
|
|
|
|
|
|
| |||||||||
Net income (loss) | $ | 20,341 | $ | 20,588 | $ | (8,074 | ) | $ | (7,051 | ) | ||||||
|
|
|
|
|
|
|
| |||||||||
Shares used in computing basic and diluted net income (loss) per share | 468 | 468 | 100 | 100 | ||||||||||||
Basic and diluted net income (loss) per share | $ | 43,464 | $ | 43,991 | $ | (80,740 | ) | $ | (70,510 | ) | ||||||
The following table presents the comparative effect of the change in accounting method and its impact on key components of the Company's consolidated balance sheets ( in thousands ):
| January 28, 2012 | ||||||||
| As Reported | As Revised | |||||||
Stockholders' equity: | ||||||||
Common stock, zero par value, 1,000 shares authorized, 1,000 shares issued and outstanding | $ | - | $ | - | ||||
Additional paid-in capital | 293,281 | 292,011 | ||||||
Accumulated other comprehensive income | 1,150 | 1,150 | ||||||
Accumulated deficit | (43,968 | ) | (42,698 | ) | ||||
|
|
|
| |||||
Total stockholders' equity | $ | 250,463 | $ | 250,463 | ||||
|
|
|
| |||||
The change did not impact cash flows from total operating, investing or financing activities.
NOTE 4-SIGNIFICANT ACCOUNTING POLICIES
Basis of Presentation
These consolidated financial statements are prepared in conformity with accounting principles generally accepted in the United States ("GAAP"). The consolidated financial statements include the accounts of the Company and its wholly owned subsidiaries. Accordingly, all intercompany balances and transactions have been eliminated through the consolidation process.
83
Fiscal Years
The Company's fiscal year ends on the Saturday closest to January 31. As a result, the Company's fiscal year may include 53 weeks. The fiscal year ended February 2, 2013 ("fiscal 2012") consisted of 53 weeks and the fiscal years ended January 28, 2012 ("fiscal 2011") and January 29, 2011 ("fiscal 2010") each consisted of 52 weeks.
Use of Accounting Estimates
The preparation of the Company's consolidated financial statements in conformity with GAAP requires management to make estimates and assumptions that affect the reported amounts of assets and liabilities and disclosures of contingent assets and liabilities at the date of the consolidated financial statements and the reported amounts of revenues and expenses during the reporting period. Actual results could differ from those estimates and such differences could be material to the consolidated financial statements.
Cash and Cash Equivalents
The Company considers highly liquid investments with original maturities of three months or less to be cash equivalents.
Concentration of Credit Risk
The Company maintains its cash and cash equivalent accounts in financial institutions in both U.S. dollar and Canadian dollar denominations. Accounts at the U.S. institutions are insured by the Federal Deposit Insurance Corporation ("FDIC") up to $250,000 and accounts at the Canadian institutions are insured by the Canada Deposit Insurance Corporation ("CDIC") up to $100,000 Canadian dollars. As of February 2, 2013, the Company had two U.S. bank account balances that were in excess of the FDIC insurance limit and one Canadian bank account balance that was in excess of the CIDC insurance limit. The Company performs ongoing evaluations of these institutions to limit its concentration of credit risk.
Accounts Receivable
Accounts receivable consist primarily of receivables from the Company's credit card processors for sales transactions and tenant improvement allowances from the Company's landlords in connection with new leases. Accounts receivable is presented net of allowance for doubtful accounts, which is recorded on a specific identification basis. The allowance for doubtful accounts was not significant as of February 2, 2013 and January 28, 2012.
Merchandise Inventories
The Company's merchandise inventories are comprised of finished goods and are carried at the lower of cost or market, with cost determined on a weighted-average cost method and market determined based on the estimated net realizable value. To determine if the value of inventory should be marked down below original cost, the Company considers current and anticipated demand, customer preference and the merchandise age. The inventory value is adjusted periodically to reflect current market conditions, which requires management judgments that may significantly affect the ending inventory valuation, as well as gross margin. The significant estimates used in inventory valuation are obsolescence (including excess and slow-moving inventory and lower of cost or market reserves) and estimates of inventory shrinkage. The Company adjusts its inventory for obsolescence based on historical trends, aging reports, specific identification and its estimates of future retail sales prices.
84
Reserves for shrinkage are estimated and recorded throughout the period as a percentage of net sales based on historical shrinkage results and current inventory levels. Actual shrinkage is recorded throughout the year based upon periodic cycle counts and the results of the Company's annual physical inventory count. Actual inventory shrinkage and obsolescence can vary from estimates due to factors including the mix of the Company's inventory (which ranges from large furniture to decorative accessories) and execution against loss prevention initiatives in the Company's stores, distribution centers, off-site storage locations and with its third-party transportation providers.
Due to these factors, the Company's obsolescence and shrinkage reserves contain uncertainties. Both estimates have calculations that require management to make assumptions and to apply judgment regarding a number of factors, including market conditions, the selling environment, historical results and current inventory trends. If actual obsolescence or shrinkage estimates change from the Company's original estimates, the Company will adjust its inventory reserves accordingly throughout the period. Management does not believe that changes in the assumptions used in these estimates would have a significant effect on the Company's net income (loss) or inventory balances. The Company's inventory reserve balances were $5.9 million and $5.6 million as of February 2, 2013 and January 28, 2012, respectively.
Prepaid Catalog and Advertising Expenses
Advertising expenses primarily represent the costs associated with the Company's catalog mailings, as well as print and website marketing. All advertising costs are expensed as incurred, with the exception of prepaid catalog expenses. Prepaid catalog expenses consist primarily of third-party incremental direct costs to prepare, print and distribute catalogs. Such costs are capitalized as prepaid catalog expenses and are amortized over their expected period of future benefit. Such amortization is based upon the ratio of actual revenues to the total of actual and estimated future revenues on an individual catalog basis. Estimated future revenues are based upon various factors such as the total number of catalogs and pages circulated, the probability and magnitude of consumer response and the assortment of merchandise offered. Each catalog is generally fully amortized within an eight- to nine-month period, with the majority of the amortization occurring within the first five to six months. Prepaid catalog expenses are evaluated for realizability on a regular basis by comparing the carrying amount associated with each catalog to the estimated probable remaining future sales associated with that catalog. The Company had $43.8 million and $28.6 million of prepaid catalog costs that are included in prepaid expense and other current assets on the consolidated balance sheets as of February 2, 2013, and January 28, 2012, respectively.
Advertising costs, recorded in selling, general and administrative expenses, were $98.8 million, $66.9 million, and $56.1 million in fiscal 2012, fiscal 2011, and fiscal 2010, respectively.
Property and Equipment
Property and equipment is recorded at cost, net of accumulated depreciation and amortization. Depreciation is calculated using the straight-line method, generally using the following useful lives:
Category of Property and Equipment | Useful Life | |||
Building | 40 years | |||
Furniture, fixtures and equipment | 3 to 7 years | |||
Machinery and equipment | 3 to 5 years | |||
Computer software | 3 years | |||
The cost of leasehold improvements and lease acquisitions is amortized over the lesser of the useful life of the asset or the applicable lease term.
85
Interest is capitalized on construction in progress and software projects during the period in which expenditures have been made, activities are in progress to prepare the asset for its intended use and actual interest costs are being incurred.
Assets acquired under non-cancelable leases, which meet the criteria of capital leases, are capitalized in property and equipment and amortized over the lesser of the useful life of the asset or the applicable lease term.
The land purchased by the Company is recorded at cost and is a non-depreciable asset.
Property and equipment is reviewed for impairment whenever events or changes in circumstances indicate that the carrying amount of assets may not be recoverable.
Intangible Assets
Intangible assets reflect the value assigned to trademarks, customer relationships, core technologies and the fair market value of the Company's leases. Customer relationships, core technologies and the fair market value of the leases are amortized over their useful life. The Company does not amortize trademarks as the Company defines the life of the asset as indefinite.
Impairment
Goodwill
The Company evaluates goodwill annually to determine whether it is impaired. Goodwill is also tested between annual impairment tests if an event occurs or circumstances change that would indicate that the fair value of a reporting unit is less than its carrying amount. Conditions that may indicate impairment include, but are not limited to, a significant adverse change in customer demand or business climate that could affect the value of an asset; general economic conditions, such as increasing Treasury rates or unexpected changes in GDP growth; a change in the Company's market share; budget-to-actual performance and consistency of operating margins and capital expenditures; a product recall or an adverse action or assessment by a regulator; or changes in management, key personnel, etc. If an impairment indicator exists, the Company tests the intangible asset for recoverability. The Company has identified only one single reporting unit. The Company selected the fourth fiscal quarter to perform its annual goodwill impairment testing.
The Company qualitatively assesses goodwill impairment to determine whether it is more likely than not that the fair value of a reporting unit is less than its carrying amount. During fiscal 2012, the Company performed a qualitative analysis examining key events and circumstances affecting fair value and determined it is more likely than not that the reporting unit's fair value is greater than its carrying amount. As such, no further analysis was required for purposes of testing of the Company's goodwill for impairment.
If goodwill is not qualitatively assessed, a two-step quantitative approach is used. In the first step, the Company compares the fair value of the reporting unit, generally defined as the same level as or one level below an operating segment, to its carrying value. If the fair value of the reporting unit exceeds the carrying value of the net assets assigned to that unit, goodwill is considered not impaired and the Company is not required to perform further testing. If the carrying value of the net assets assigned to the reporting unit exceeds the fair value of the reporting unit, then the Company must perform the second step of the impairment test in order to determine the implied fair value of the reporting unit's goodwill. If the carrying value of a reporting unit's goodwill exceeds its implied fair value, then the Company would record an impairment loss equal to the difference.
The Company's tests for impairment of goodwill resulted in a determination that the fair value of the Company substantially exceeded the carrying value of the Company's net assets in fiscal 2012 and fiscal 2011. No impairment to goodwill has been recorded in any period.
86
Trademarks
The Company annually evaluates whether trademarks continue to have an indefinite life. Trademarks are reviewed for impairment annually in the fourth quarter and may be reviewed more frequently if indicators of impairment are present. Conditions that may indicate impairment include, but are not limited to, a significant adverse change in customer demand or business climate that could affect the value of an asset, a product recall or an adverse action or assessment by a regulator.
In 2012, the Company adopted the option to qualitatively assess indefinite-lived intangible asset impairment to determine whether it is more likely than not that the fair value of the asset is less than its carrying amount. Accordingly, the Company performed a qualitative analysis examining key events and circumstances affecting fair value and determined it is more likely than not that the asset's fair value is greater than its carrying amount. As such, no further analysis was required for purposes of testing of the Company's trademarks for impairment.
If trademarks are not qualitatively assessed, an impairment review is performed by comparing the carrying value to the estimated fair value, determined using a discounted cash flow methodology. Factors used in the valuation of intangible assets with indefinite lives include, but are not limited to, management's plans for future operations, brand initiatives, recent operating results and projected future cash flows.
The Company tested the trademarks for impairment and concluded that there has been no impairment in any period.
Long-Lived Assets
Long-lived assets, such as property and equipment and intangible assets subject to amortization, are reviewed for impairment whenever events or changes in circumstances indicate that the carrying amount of an asset may not be recoverable. Conditions that may indicate impairment include, but are not limited to, a significant adverse change in customer demand or business climate that could affect the value of an asset, a product recall or an adverse action or assessment by a regulator. If the sum of the estimated undiscounted future cash flows related to the asset are less than the carrying value, the Company recognizes a loss equal to the difference between the carrying value and the fair value, usually determined by the estimated discounted cash flow analysis of the asset.
The Company evaluates long-lived tangible assets at an individual store level, which is the lowest level at which independent cash flows can be identified. The Company evaluates corporate assets or other long-lived assets that are not store-specific at the consolidated level.
Since there is typically no active market for the Company's long-lived tangible assets, the Company estimates fair values based on the expected future cash flows. The Company estimates future cash flows based on store-level historical results, current trends, and operating and cash flow projections. The Company's estimates are subject to uncertainty and may be affected by a number of factors outside its control, including general economic conditions and the competitive environment. While the Company believes its estimates and judgments about future cash flows are reasonable, future impairment charges may be required if the expected cash flow estimates, as projected, do not occur or if events change requiring the Company to revise its estimates.
The Company did not record an impairment charge on long-lived assets in fiscal 2012 or fiscal 2011.The Company recorded a $2.1 million impairment charge on long-lived assets of certain underperforming stores in fiscal 2010, which is included in cost of goods sold on the consolidated statements of operations.
87
Capital and Operating Leases
The Company classifies leases at the inception of the lease as either a capital lease or an operating lease. A lease is classified as a capital lease if any of the following conditions are met: (i) the ownership of the leased property is transferred to the lessee by the end of the lease term, (ii) there is a bargain purchase option, (iii) the lease term is at least 75% of the property's estimated remaining economic life or (iv) the present value of the minimum lease payments at the beginning of the lease term is 90% or more of the fair value of the leased property. A capital lease is accounted for as if there were an acquisition of an asset and an incurrence of an obligation at the inception of the lease. All leases not identified as capital leases are accounted for as operating leases.
The Company leases stores, distribution facilities, office space and certain machinery and equipment under various operating leases. Most real estate lease agreements contain, among other terms and conditions, tenant improvement allowances, rent holidays, lease premiums, rent escalation clauses and contingent rent provisions. For purposes of recognizing lease incentives, premiums and minimum rental expenses on a straight-line basis over the terms of the leases, the Company uses the date of initial possession to begin amortization, which is generally when the Company enters the space and begins to make improvements in preparation of intended use. For tenant improvement allowances and rent holidays, the Company records a deferred rent liability, reported as a long-term liability on the consolidated balance sheets, and amortizes the deferred rent over the term of the lease as an adjustment to rent expense.
For scheduled rent changes during the lease terms or for rental payments commencing at a date other than the date of initial occupancy (rent holidays), the Company records minimum rental expenses on a straight-line basis over the term of the lease.
Certain leases provide for contingent rents, which are determined as a percentage of gross sales in excess of specified levels. The Company records a contingent rent liability in accounts payable and accrued expenses on the consolidated balance sheets and the corresponding rent expense when specified levels have been achieved or when management estimates that achieving the specified levels during the lease term is probable.
Debt Issuance Costs
The Company capitalizes debt issuance costs related to its revolving line of credit and term loan. Capitalized costs related to the revolving line of credit are included in other assets on the consolidated balance sheets as deferred financing fees. Capitalized costs paid to lenders relating to the term loan are netted against the term loan on the consolidated balance sheets. Deferred financing fees are amortized utilizing the straight-line method and are included in interest expense on the consolidated statements of operations.
Revenue Recognition
The Company recognizes revenues and the related cost of goods sold when merchandise is received by its customers. Revenues from "cash-and-carry" store sales are recognized at the point of sale in the store. Revenues from direct-to-customer and home-delivered sales are recognized when the merchandise is delivered to the customer. Discounts provided to customers are accounted for as a reduction of sales.
The Company recognizes shipping and handling fees as revenue when the merchandise is received by its customers. Costs of shipping and handling are included in cost of goods sold.
Sales tax collected is not recognized as revenue but is included in accounts payable and accrued expenses on the consolidated balance sheets as it is ultimately remitted to governmental authorities.
The Company reserves for projected merchandise returns. Merchandise returns are often resaleable merchandise and are refunded by issuing the same payment tender of the original purchase. Merchandise
88
exchanges of the same product and price are not considered merchandise returns and, therefore, are excluded when calculating the sales returns reserve.
The Company's customers may return purchased items for a refund. The Company provides an allowance for sales returns, net of cost of goods sold, based on historical return rates. A summary of the allowance for sales returns, presented net of cost of goods sold, is as follows ( in thousands ):
| Year Ended | ||||||||||||
| February 2, 2013 | January 28, 2012 | January 29, 2011 | ||||||||||
Balance at beginning of fiscal year | $ | 3,181 | $ | 3,403 | $ | 3,145 | ||||||
Provision for sales returns | 134,909 | 102,875 | 83,393 | |||||||||
Actual sales returns | (132,884 | ) | (103,097 | ) | (83,135 | ) | ||||||
|
|
|
|
|
| |||||||
Balance at end of fiscal year | $ | 5,206 | $ | 3,181 | $ | 3,403 | ||||||
|
|
|
|
|
| |||||||
Deferred Revenue and Customer Deposits
Deferred revenue represents the revenue associated with orders that have been shipped by the Company to its customers but have not yet been received by the customer. As the Company recognizes revenue when the merchandise is received by its customers, it is included as deferred revenue on the consolidated balance sheets while in-transit.
Customer deposits represent payments made by customers on custom orders. At the time of purchase the Company collects deposits for all custom orders equivalent to 50% of the customer purchase price. Custom order deposits are recognized as revenue when the merchandise is received by the customer or at the time of cancellation of the order by the customer.
Gift Certificates and Merchandise Credits
The Company sells gift certificates and issues merchandise credits to its customers in its stores and through its websites and product catalogs. Such gift certificates and merchandise credits do not have expiration dates. Revenue associated with gift certificates and merchandise credits is deferred until either (i) redemption of the gift certificate and merchandise credits or (ii) when the likelihood of redemption is remote and there exists no legal obligation to remit the value of unredeemed gift certificates or merchandise credits to the relevant jurisdictions (breakage). The breakage rate is based on monitoring of certificates issued, actual certificate redemptions and the Company's analysis of when it believes it is remote that redemptions will occur.
Redeemed gift certificates and merchandise credits are recorded in net revenues. Breakage resulted in a reduction of selling, general and administrative expenses on the consolidated statements of operations of $1.8 million, $3.2 million, and $3.0 million in fiscal 2012, fiscal 2011, and fiscal 2010, respectively.
Self Insurance
The Company maintains insurance coverage for significant exposures, as well as those risks that, by law, must be insured. In the case of the Company's health care coverage for employees, the Company has a managed self insurance program related to claims filed. Expenses related to this self insured program are computed on an actuarial basis, based on claims experience, regulatory requirements, an estimate of claims incurred but not yet reported ("IBNR") and other relevant factors. The projections involved in this process are subject to uncertainty related to the timing and amount of claims filed, levels of IBNR, fluctuations in health care costs and changes to regulatory requirements.
The Company is self-insured for all workers' compensation claims related to incidents incurred after November 1, 2012 and prior to November 1, 2007.
89
Stock-Based Compensation
The Company accounts for stock-based compensation in accordance with applicable guidance which requires the fair value of stock-based payments to be recognized in the consolidated financial statements as compensation expense over the requisite service period. For service-only awards compensation expense is recognized on a straight-line basis, net of forfeitures, over the requisite service period for the fair value of awards that actually vest. Fair value for restricted stock units is valued using the closing price of the Company's stock on the date of grant. The fair value of each option award granted under the Company's award plans subsequent to its initial public offering is estimated on the date of grant using a Black-Scholes Merton option pricing model with the following assumptions:
| • | Expected volatility-Based on the lack of historical data for its own shares, the Company bases its expected volatility on a representative peer group that takes into account industry, market capitalization, stage of life cycle and capital structure. |
| • | Expected term-Represents the period of time that options granted are expected to be outstanding. The Company elected to calculate the expected term of the option awards using the "simplified method". This election was made as the Company does not have sufficient historical exercise data to provide a reasonable basis upon which to estimate expected term. Under the "simplified" calculation method, the expected term is calculated as an average of the vesting period and the contractual life of the options. |
| • | Risk-free interest rate-Based on the U.S. Treasury zero-coupon bond rate with a remaining term approximate of the expected term of the option. |
| • | Dividend yield-As the Company has not paid dividends, nor does it currently plan to pay dividends in the future, the assumed dividend yield is zero. |
Prior to the Reorganization, Home Holdings had granted performance-based units that vested and became deliverable upon achievement or satisfaction of performance conditions specified in the performance agreement or upon the return on investment attained by certain of the equity investors in Home Holdings at defined liquidity events, including an initial public offering or certain sale or merger transactions. The Company estimated the fair value of performance-based units awarded to employees at the grant date based on the fair value of the Company on such date. The Company also considered the probability of achieving the established performance targets in determining its stock-based compensation with respect to these awards. The Company recognizes compensation cost over the performance period. When the performance is related to a specific event occurring in the future, the Company recognizes the full expense at the time of the event. At the time of the Reorganization, these performance-based units were replaced with shares of the Company's common stock with substantially similar restrictions, terms and conditions. Refer to Note 12- Stock-Based Compensation .
In connection with Mr. Friedman's resignation as Chairman and Co-Chief Executive Officer and new role as Creator and Curator, 1,185,511 shares of unvested stock he received in replacement of certain performance-based units will be marked to market every period until the required vesting criteria are met, resulting in additional stock based compensation in accordance with Financial Accounting Standards Board Accounting Standards Codification Topic 718.
Cost of Goods Sold
Cost of goods sold includes, but is not limited to, the direct cost of purchased merchandise, inventory shrinkage, inventory reserves and write-downs, inbound freight, all freight costs to get merchandise to the Company's stores, design and buying costs, occupancy costs related to store operations, such as rent, property tax and common area maintenance, depreciation and amortization, and all logistics costs associated with shipping product to customers.
90
Selling, General and Administrative Expenses
Selling, general and administrative expenses include all operating costs not included in cost of goods sold. These expenses include payroll and payroll related expenses, store expenses other than occupancy and expenses related to many of the Company's operations at its headquarters, including utilities, depreciation and amortization, credit card fees and marketing expense, which primarily includes catalog production, mailing and print advertising costs. All store pre-opening costs are included in selling, general and administrative expenses and are expensed as incurred.
Selling, general and administrative expenses for fiscal 2012 include a $92.0 million non-cash compensation charge related to equity grants at the time of the Reorganization, as well as a non-cash compensation charge of $23.1 million related to the performance-based vesting of certain shares granted to the Company's Chief Executive Officer, Carlos Alberini, and Gary Friedman, who serves as the Company's Creator and Curator. Costs incurred in connection with the initial public offering, including a fee of $7.0 million to Catterton Management Company, LLC ("Catterton"), Tower Three Partners LLC ("Tower Three") and GJK Capital Advisors, LLC ("Glenhill") in accordance with the Company's management services agreement, payments of $2.2 million to certain former executives and bonus payments to employees of $1.3 million, were included in selling, general and administrative expenses in fiscal 2012. In addition, legal and other professional fees of $4.8 million, incurred in connection with the investigation conducted by the special committee of the board of directors relating to Mr. Friedman and the Company's subsequent remedial actions, are included in fiscal 2012 selling, general and administrative expenses.
Earnings (Loss) Per Share
Basic earnings (loss) per share is computed as net income (loss) divided by the weighted-average number of common shares outstanding for the period. Diluted earnings (loss) per share is computed as net income (loss) divided by the weighted-average number of common shares outstanding for the period plus common stock equivalents consisting of shares subject to stock-based awards with exercise prices less than or equal to the average market price of the Company's common stock for the period, to the extent their inclusion would be dilutive. Potential dilutive securities are excluded from the computation of diluted earnings (loss) per share if their effect is anti-dilutive.
Income Taxes
The Company accounts for income taxes under an asset and liability approach that requires the recognition of deferred tax assets and liabilities for the expected future tax consequences of events that have been recognized in the Company's consolidated financial statements or tax returns. In estimating future tax consequences, the Company generally takes into account all expected future events then known to it, other than changes in the tax law or rates which have not yet been enacted and which are not permitted to be considered. Accordingly, the Company may record a valuation allowance to reduce its net deferred tax assets to the amount that is more-likely-than-not to be realized. The determination as to whether a deferred tax asset will be realized is made on a jurisdictional basis and is based upon management's best estimate of the recoverability of the Company's net deferred tax assets. Future taxable income and ongoing prudent and feasible tax planning are considered in determining the amount of the valuation allowance, and the amount of the allowance is subject to adjustment in the future. Specifically, in the event the Company were to determine that it is not more-likely-than-not able to realize its net deferred tax assets in the future, an adjustment to the valuation allowance would decrease income in the period such determination is made. This allowance does not alter the Company's ability to utilize the underlying tax net operating loss and credit carryforwards in the future, the utilization of which is limited to achieving future taxable income.
The accounting standard for uncertainty in income taxes prescribes a recognition threshold that a tax position is required to meet before being recognized in the financial statements and provides guidance on
91
derecognition, measurement, classification, interest and penalties, accounting in interim periods, disclosure and transition issues. Differences between tax positions taken in a tax return and amounts recognized in the financial statements generally result in an increase in a liability for income taxes payable or a reduction of an income tax refund receivable, or a reduction in a deferred tax asset or an increase in a deferred tax liability, or both. The Company recognizes interest and penalties related to unrecognized tax benefits in tax expense.
Fair Value of Financial Instruments
The carrying values of cash and cash equivalents, accounts receivable, accounts payable and borrowings under the revolving line of credit approximate their estimated fair values.
The degree of judgment used in measuring the fair value of financial instruments generally correlates to the level of pricing observability. Pricing observability is impacted by a number of factors, including the type of financial instrument, whether the financial instrument is new to the market and not yet established and the characteristics specific to the transaction. Financial instruments with readily available active quoted prices for which fair value can be measured generally will have a higher degree of pricing observability and a lesser degree of judgment used in measuring fair value. Conversely, financial instruments rarely traded or not quoted will generally have less, or no, pricing observability and a higher degree of judgment used in measuring fair value.
The Company's financial assets and liabilities measured and reported at fair value are classified and disclosed in one of the following categories:
| • | Level 1-Quoted prices are available in active markets for identical investments as of the reporting date. |
| • | Level 2-Pricing inputs are other than quoted prices in active markets, which are either directly or indirectly observable as of the reporting date, and fair value is determined through the use of models or other valuation methodologies. |
| • | Level 3-Pricing inputs are unobservable for the investment and include situations where there is little, if any, market activity for the investment. The inputs used in the determination of fair value require significant management judgment or estimation. |
The Company's financial assets and liabilities were classified as Level 1 as of February 2, 2013, and January 28, 2012.
Comprehensive Income (Loss)
Comprehensive income (loss) consists of net income (loss) and other comprehensive income (loss). The Company's other comprehensive income (loss) consists of foreign currency translation adjustments.
Foreign Currency Translation
Local currencies are generally considered the functional currencies outside the United States of America. Assets and liabilities denominated in non-U.S. currencies are translated at the rate of exchange prevailing on the date of the consolidated balance sheets and revenues and expenses are translated at average rates of exchange for the period. The related translation gains (losses) are reflected in the accumulated other comprehensive income (loss) section of the consolidated statements of stockholders' equity. Foreign currency gains (losses) resulting from foreign currency transactions are included in selling, general and administrative expenses on the consolidated statements of operations and have not been material in all periods presented.
92
Recently Issued Accounting Standards
In July 2012, the Financial Accounting Standards Board ("FASB") issued guidance that revises the requirements around how entities test indefinite-lived intangible assets other than goodwill for impairment. Similar to the guidance issued in September 2011 related to the testing of goodwill for impairment, this guidance allows companies to perform a qualitative assessment before calculating the fair value of the indefinite-lived intangible asset. If entities determine, on the basis of qualitative factors, that the fair value of the indefinite-lived intangible asset is more likely than not greater than the carrying amount, a quantitative calculation would not be needed. The Company adopted this guidance for its fiscal 2012 annual indefinite-lived intangible assets impairment test. The adoption of this guidance resulted in a change in how the Company performed its indefinite-lived intangible assets impairment assessment; however, the adoption did not have a material impact on the Company's consolidated financial statements.
NOTE 5-PREPAID EXPENSES AND OTHER CURRENT ASSETS
Prepaid expenses and other current assets consist of the following ( in thousands ):
| February 2, 2013 | January 28, 2012 | |||||||
Prepaid catalog | $ | 43,828 | $ | 28,608 | ||||
Vendor deposits | 20,383 | 9,399 | ||||||
Prepaid expenses | 11,479 | 8,923 | ||||||
Other current assets | 1,339 | 5,640 | ||||||
|
|
|
| |||||
Total prepaid expenses and other current assets | $ | 77,029 | $ | 52,570 | ||||
|
|
|
| |||||
NOTE 6-PROPERTY AND EQUIPMENT
Property and equipment consists of the following ( in thousands ):
| February 2, 2013 | January 28, 2012 | |||||||
Leasehold improvements (1) | $ | 155,338 | $ | 118,898 | ||||
Computer software | 33,459 | 27,194 | ||||||
Furniture, fixtures and equipment | 27,076 | 16,166 | ||||||
Machinery and equipment | 8,866 | 4,823 | ||||||
Land | 2,388 | 2,388 | ||||||
Building | 2,205 | 2,205 | ||||||
Equipment under capital leases (2) | 8,879 | 13,918 | ||||||
|
|
|
| |||||
Total property and equipment | 238,211 | 185,592 | ||||||
Less-accumulated depreciation and amortization | (126,805 | ) | (102,034 | ) | ||||
|
|
|
| |||||
Total property and equipment-net | $ | 111,406 | $ | 83,558 | ||||
|
|
|
| |||||
| (1) | Leasehold improvements include construction in progress of $25.9 million and $9.1 million as of February 2, 2013, and January 28, 2012, respectively. |
| (2) | Accumulated depreciation and amortization include accumulated amortization related to equipment under capital leases of $6.8 million and $8.5 million as of February 2, 2013, and January 28, 2012, respectively. |
The Company recorded depreciation expense of $24.3 million, $26.2 million, and $27.8 million in fiscal 2012, fiscal 2011, and fiscal 2010, respectively.
93
NOTE 7-GOODWILL AND INTANGIBLE ASSETS
The following sets forth the goodwill and intangible assets as of February 2, 2013 ( dollar amounts in thousands ):
| Gross Carrying Amount | Accumulated Amortization | Foreign Currency Translation | Net
Book Value February 2, 2013 | Useful Life | ||||||||||||||||
Intangible assets subject to amortization: | ||||||||||||||||||||
Core technologies | $ | 6,580 | $ | (6,141 | ) | $ | - | $ | 439 | 5 years | ||||||||||
Fair value of leases | ||||||||||||||||||||
Fair market write-up | 10,737 | (8,511 | ) | 48 | 2,274 | (2 | ) | |||||||||||||
Fair market write-down | (2,591 | ) | 1,789 | - | (802 | ) (1) | (2 | ) | ||||||||||||
|
|
|
|
|
|
|
| |||||||||||||
Total intangible assets subject to amortization | 14,726 | (12,863 | ) | 48 | 1,911 | |||||||||||||||
Intangible assets not subject to amortization: | ||||||||||||||||||||
Goodwill | 122,285 | - | 316 | 122,601 | ||||||||||||||||
Trademarks and domain name | 47,410 | - | - | 47,410 | ||||||||||||||||
|
|
|
|
|
|
|
| |||||||||||||
Total intangible assets | $ | 184,421 | $ | (12,863 | ) | $ | 364 | $ | 171,922 | |||||||||||
|
|
|
|
|
|
|
| |||||||||||||
| (1) | The fair market write-down of leases is included in other long-term obligations on the consolidated balance sheets. |
| (2) | The fair value of each lease is amortized over the life of the respective lease. The longest lease for which a fair value adjustment was recorded has a termination date in January 2019. |
The following sets forth the goodwill and intangible assets as of January 28, 2012 ( dollar amounts in thousands ):
| Gross Carrying Amount | Accumulated Amortization | Foreign Currency Translation | Net Book Value January 28, 2012 | Useful Life | ||||||||||||||||
Intangible assets subject to amortization: | ||||||||||||||||||||
Core technologies | $ | 6,580 | $ | (4,825 | ) | $ | - | $ | 1,755 | 5 years | ||||||||||
Fair value of leases | ||||||||||||||||||||
Fair market write-up | 11,988 | (8,365 | ) | 48 | 3,671 | (2 | ) | |||||||||||||
Fair market write-down | (2,591 | ) | 1,448 | - | (1,143 | ) (1) | (2 | ) | ||||||||||||
|
|
|
|
|
|
|
| |||||||||||||
Total intangible assets subject to amortization | 15,977 | (11,742 | ) | 48 | 4,283 | |||||||||||||||
Intangible assets not subject to amortization: | ||||||||||||||||||||
Goodwill | 122,285 | - | 310 | 122,595 | ||||||||||||||||
Trademarks | 47,100 | - | - | 47,100 | ||||||||||||||||
|
|
|
|
|
|
|
| |||||||||||||
Total intangible assets | $ | 185,362 | $ | (11,742 | ) | $ | 358 | $ | 173,978 | |||||||||||
|
|
|
|
|
|
|
| |||||||||||||
| (1) | The fair market write-down of leases is included in other long-term obligations on the consolidated balance sheets. |
| (2) | The fair value of each lease is amortized over the life of the respective lease. The longest lease for which a fair value adjustment was recorded has a termination date in January 2019. |
The Company recorded amortization expense related to intangible assets of $2.4 million, $2.8 million, and $3.4 million in fiscal 2012, fiscal 2011, and fiscal 2010, respectively.
94
The following table sets forth the remaining amortization of the intangible assets based on a straight-line method of amortization over the respective useful lives as of February 2, 2013 ( in thousands ):
2013 | $ | 1,128 | ||
2014 | 613 | |||
2015 | 95 | |||
2016 | 56 | |||
2017 | 19 | |||
|
| |||
Total amortization | $ | 1,911 | ||
|
|
NOTE 8-ACCOUNTS PAYABLE, ACCRUED EXPENSES AND OTHER CURRENT LIABILITIES
Accounts payable and accrued expenses consist of the following ( in thousands ):
| February 2, 2013 | January 28, 2012 | |||||||
Accounts payable | $ | 81,608 | $ | 47,440 | ||||
Accrued freight and duty | 17,639 | 8,896 | ||||||
Accrued compensation | 16,621 | 21,168 | ||||||
Accrued sales taxes | 12,783 | 8,472 | ||||||
Accrued catalog costs | 6,906 | 7,176 | ||||||
Accrued occupancy | 5,842 | 6,203 | ||||||
Accrued professional fees | 2,114 | 2,494 | ||||||
Other accrued expenses | 1,840 | 3,845 | ||||||
|
|
|
| |||||
Total accounts payable and accrued expenses | $ | 145,353 | $ | 105,694 | ||||
|
|
|
| |||||
Accounts payable included negative cash balances due to outstanding checks of $28.1 million and $12.4 million as of February 2, 2013, and January 28, 2012, respectively.
Other current liabilities consist of the following ( in thousands ):
| February 2, 2013 | January 28, 2012 | |||||||
Unredeemed gift certificate and merchandise credit liability | $ | 18,435 | $ | 20,742 | ||||
Allowance for sales returns | 5,206 | 3,181 | ||||||
Capital lease obligation-current | 2,925 | 4,114 | ||||||
Other liabilities | 5,862 | 2,824 | ||||||
|
|
|
| |||||
Total other current liabilities | $ | 32,428 | $ | 30,861 | ||||
|
|
|
| |||||
NOTE 9-LINE OF CREDIT AND TERM LOAN
In August 2011, Restoration Hardware, Inc., along with its Canadian subsidiary, Restoration Hardware Canada, Inc., entered into a credit agreement with Bank of America, N.A., as administrative agent, and certain other lenders. This credit agreement modified a previous facility under which Restoration Hardware, Inc. had a revolving line of credit for up to $190.0 million, as of July 30, 2011. As a result of the modification, the unamortized deferred financing fees of $0.2 million related to the previous line of credit on the date of the modification will be amortized over the life of the new revolving line of credit, which has a maturity date of August 3, 2016. Under the credit agreement, Restoration Hardware, Inc. has a revolving line of credit available of up to $417.5 million (following Restoration Hardware, Inc.'s exercise of the commitment increase option on
95
November 1, 2012, as described below), of which $10.0 million is available to Restoration Hardware Canada, Inc. The credit agreement was further amended in January 2012 to add a $15.0 million term loan facility with a maturity date of July 6, 2015, which was repaid in full on November 7, 2012, as described below.
Under the credit agreement's commitment increase provision, Restoration Hardware, Inc. had the option to increase the amount of the revolving line of credit by up to an additional $100.0 million, provided that, among other things, the existing lenders or additional lenders agreed to participate in the increased loan commitments under the revolving line of credit, no default under the credit agreement then existed or would result from such increase and sufficient borrowing base collateral was available to support increased loan amounts. On November 1, 2012, Restoration Hardware, Inc. increased the amount of the revolving line of credit by $100.0 million pursuant to this commitment increase provision.
On November 7, 2012, Restoration Hardware, Inc. made payments of $75.7 million on its revolving line of credit and repaid its outstanding term loan of $15.0 million in full. Such payments were funded from the proceeds received as a result of the Company's initial public offering. Upon the repayment of the term loan in full, the Company expensed the remaining debt issuance costs of $0.2 million related to the term loan.
The availability of credit at any given time under the revolving line of credit is limited by reference to a borrowing base formula based upon numerous factors, including the value of eligible inventory, eligible accounts receivable, eligible real estate, and, in the case of the term loan, registered trade names and reserves established by the administrative agent. As a result of the borrowing base formula, the actual borrowing availability under the revolving line of credit could be less than the stated amount of the revolving line of credit (as reduced by the actual borrowings and outstanding letters of credit under the revolving line of credit). All obligations under the credit agreement are secured by substantially all of Restoration Hardware, Inc.'s assets, including accounts receivable, inventory, intangible assets, property, equipment, goods and fixtures.
Borrowings under the revolving line of credit are subject to interest, at the borrowers' option, at either the bank's reference rate or LIBOR (or the BA Rate or the Canadian Prime Rate, as such terms are defined in the credit agreement, for Canadian borrowings denominated in Canadian dollars or the United States Index Rate or LIBOR for Canadian borrowings denominated in United States dollars) plus an applicable margin rate, in each case. The weighted-average interest rate for the revolving line of credit was 2.5% as of February 2, 2013.
As of February 2, 2013, $82.5 million was outstanding under the revolving line of credit and the undrawn borrowing availability under the revolving line of credit was $188.5 million. There were $19.5 million and $6.9 million in outstanding letters of credit as of February 2, 2013, and January 28, 2012, respectively.
The credit agreement contains various restrictive covenants, including, among others, limitations on the ability to incur liens, make loans or other investments, incur additional debt, issue additional equity, merge or consolidate with or into another person, sell assets, pay dividends or make other distributions or enter into transactions with affiliates, along with other restrictions and limitations typical to credit agreements of this type and size. The credit agreement does not contain any significant financial or coverage ratio covenants unless the availability under the revolving line of credit is less than the greater of (i) $17.5 million and (ii) 10% of the lesser of (A) the aggregate maximum commitments under the revolving line of credit and (B) the domestic borrowing base. If the availability under the revolving line of credit is less than the foregoing amount, then Restoration Hardware, Inc. is required to maintain a consolidated fixed charge coverage ratio of at least one to one. Such ratio is approximately the ratio on the last day of each month on a trailing twelve-month basis of (a) (i) consolidated EBITDA (as defined in the agreement) minus (ii) capital expenditures, minus (iii) the income taxes paid in cash to (b) the sum of (i) debt service charges plus (ii) certain dividends and distributions paid. As of February 2, 2013, Restoration Hardware, Inc. was in compliance with all covenants, and if the availability under the revolving line of credit were less than the amount described above, Restoration Hardware, Inc. would have been in compliance with the consolidated fixed charge coverage ratio described in the previous sentence. The credit agreement requires a daily sweep of cash to prepay the loans under the credit agreement while (i) an
96
event of default exists or (ii) the availability under the revolving line of credit for extensions of credit to Restoration Hardware, Inc. is less than the greater of (A) $20.0 million and (B) 15% of the lesser of the aggregate maximum commitments and the domestic borrowing base.
NOTE 10-INCOME TAXES
The following is a summary of the income tax expense (benefit) ( in thousands ):
| Year Ended | ||||||||||||
| February 2, 2013 | January 28, 2012 | January 29, 2011 | ||||||||||
Current | ||||||||||||
Federal | $ | - | $ | - | $ | 53 | ||||||
State | 236 | 331 | 837 | |||||||||
Foreign | (387 | ) | 595 | 280 | ||||||||
|
|
|
|
|
| |||||||
Total current tax expense (benefit) | (151 | ) | 926 | 1,170 | ||||||||
|
|
|
|
|
| |||||||
Deferred | ||||||||||||
Federal | (48,745 | ) | (76 | ) | 135 | |||||||
State | (12,903 | ) | 223 | (397 | ) | |||||||
Foreign | (224 | ) | 48 | (223 | ) | |||||||
|
|
|
|
|
| |||||||
Total deferred tax benefit | (61,872 | ) | 195 | (485 | ) | |||||||
|
|
|
|
|
| |||||||
Total income tax expense (benefit) | $ | (62,023 | ) | $ | 1,121 | $ | 685 | |||||
|
|
|
|
|
| |||||||
A reconciliation of the federal statutory tax rate to the Company's effective tax rate is as follows:
| Year Ended | ||||||||||||
| February 2, 2013 | January 28, 2012 | January 29, 2011 | ||||||||||
Provision at federal statutory tax rate | 35.0 | % | 34.0 | % | 34.0 | % | ||||||
State income taxes-net of federal tax impact | 0.7 | 5.6 | 2.1 | |||||||||
Foreign income | 0.6 | (2.0 | ) | (3.3 | ) | |||||||
Net adjustments to tax accruals and other | 0.1 | 4.6 | (4.4 | ) | ||||||||
Valuation allowance | 76.5 | (49.4 | ) | (32.5 | ) | |||||||
Stock-based compensation | (30.0 | ) | 12.4 | (6.7 | ) | |||||||
|
|
|
|
|
| |||||||
Effective tax rate | 82.9 | % | 5.2 | % | (10.8 | )% | ||||||
|
|
|
|
|
| |||||||
97
Significant components of the Company's deferred tax assets and liabilities are as follows ( in thousands ):
| February 2, 2013 | January 28, 2012 | |||||||
Current deferred tax assets (liabilities) | ||||||||
Accrued expense | $ | 11,026 | $ | 9,970 | ||||
State tax benefit | (931 | ) | (1,370 | ) | ||||
Inventory | 14,215 | 11,121 | ||||||
Deferred revenue | 20,144 | 12,213 | ||||||
Net operating loss carryforwards | 12,337 | 27,166 | ||||||
Construction allowance | (1,698 | ) | (1,037 | ) | ||||
Prepaid expense and other | (18,056 | ) | (12,729 | ) | ||||
|
|
|
| |||||
Current deferred tax assets | 37,037 | 45,334 | ||||||
Valuation allowance | (31 | ) | (41,173 | ) | ||||
|
|
|
| |||||
Net current deferred tax assets | 37,006 | 4,161 | ||||||
|
|
|
| |||||
Non-current deferred tax assets (liabilities) | ||||||||
State tax benefit | (2,040 | ) | (892 | ) | ||||
Stock-based compensation | 21,231 | - | ||||||
Deferred lease credits | 9,687 | 4,251 | ||||||
Property and equipment | (5,975 | ) | (2,061 | ) | ||||
Net operating loss carryforwards | 262 | 7,525 | ||||||
U.S. impact of Canadian transfer pricing | 2,091 | 3,760 | ||||||
Trademarks | (19,361 | ) | (19,275 | ) | ||||
Other | 1,240 | 850 | ||||||
|
|
|
| |||||
Non-current deferred tax assets (liabilities) | 7,135 | (5,842 | ) | |||||
Valuation allowance | (262 | ) | (16,311 | ) | ||||
|
|
|
| |||||
Net non-current deferred tax assets (liabilities) | 6,873 | (22,153 | ) | |||||
|
|
|
| |||||
Net deferred tax assets (liabilities) | $ | 43,879 | $ | (17,992 | ) | |||
|
|
|
| |||||
A reconciliation of the valuation allowance is as follows ( in thousands ):
| Year Ended | ||||||||||||
| February 2, 2013 | January 28, 2012 | January 29, 2011 | ||||||||||
Balance at beginning of fiscal year | $ | 57,484 | $ | 68,318 | $ | 65,087 | ||||||
Charged to expense | (57,185 | ) | 299 | (236 | ) | |||||||
Net changes in deferred tax assets and liabilities | (6 | ) | (11,133 | ) | 3,467 | |||||||
|
|
|
|
|
| |||||||
Balance at end of fiscal year | $ | 293 | $ | 57,484 | $ | 68,318 | ||||||
|
|
|
|
|
| |||||||
The Company has recorded deferred tax assets and liabilities based upon estimates of their realizable value, such estimates are based upon likely future tax consequences. In assessing the need for a valuation allowance, the Company considers both positive and negative evidence related to the likelihood of realization of the deferred tax assets. If, based on the weight of available evidence, it is more likely than not that the deferred tax assets will not be realized, the Company records a valuation allowance.
As of the end of fiscal year 2012, the Company's U.S. operations achieved a position of cumulative profits (adjusted for permanent differences) for the most recent three-year period. The Company concluded that this record of cumulative profitability in recent years, coupled with its business plan for profitability in future periods,
98
provided assurance that its future tax benefits more likely than not would be realized. Accordingly, in fiscal 2012, the Company released all of its U.S. valuation allowance of $57.2 million against net deferred tax assets.
As of February 2, 2013, the Company has retained a valuation allowance totaling $0.3 million against deferred tax assets for its Shanghai operations.
As of February 2, 2013, the Company had federal and state net operating loss carryovers of $28.3 million and $31.6 million, respectively. The federal and state net operating loss carryovers will expire between 2014 and 2031. Internal Revenue Code Section 382 and similar state rules place a limitation on the amount of taxable income which can be offset by net operating loss carryforwards after a change in ownership (generally greater than 50% change in ownership). The Company cannot give any assurances that it will not undergo an ownership change in the future resulting in further limitations on utilization of net operating losses.
A reconciliation of the exposures related to unrecognized tax benefits is as follows ( in thousands ):
| Year Ended | ||||||||||||
| February 2, 2013 | January 28, 2012 | January 29, 2011 | ||||||||||
Balance at beginning of fiscal year | $ | 2,505 | $ | 9,015 | $ | 8,261 | ||||||
Gross (decreases) increases-prior period tax positions | (57 | ) | - | - | ||||||||
Gross increases (decreases)-current period tax positions | - | (14 | ) | 1,048 | ||||||||
Consent for accounting method change | - | (6,496 | ) | - | ||||||||
Lapses in statute of limitations | (607 | ) | - | (294 | ) | |||||||
|
|
|
|
|
| |||||||
Balance at end of fiscal year | $ | 1,841 | $ | 2,505 | $ | 9,015 | ||||||
|
|
|
|
|
| |||||||
As of February 2, 2013 and January 28, 2012, $1.8 million and $2.5 million, respectively, of the exposures related to unrecognized tax benefits would affect the effective tax rate if realized and are included in other long-term obligations on the consolidated balance sheets. These amounts are primarily associated with foreign tax exposures that would, if realized, reduce the amount of net operating losses that would ultimately be utilized. As of February 2, 2013, $0.3 million of the exposures related to unrecognized tax benefits are expected to decrease in the next 12 months due to the lapse of the statute of limitations.
Adjustments required upon adoption of accounting for uncertainty in income taxes related to deferred tax asset accounts were offset by the related valuation allowance. Future changes to the Company's assessment of the realizability of those deferred tax assets will impact the effective tax rate. The Company accounts for interest and penalties related to exposures as a component of income tax expense. The Company has accrued $0.5 million and $1.3 million of interest associated with exposures as of February 2, 2013, and January 28, 2012, respectively.
A significant portion of the Company's unrecognized tax benefits as of January 29, 2011 was related to an uncertain tax position for advanced payments for the sale of gift cards. The Company filed a request to change its accounting method for advanced payments for the sale of gift cards with the IRS in fiscal 2011 and, during the fourth quarter of fiscal 2011, the IRS approved the Company's request. This approval allowed the Company to increase its tax liability for the impact of the change over a four-year period beginning with its January 28, 2012 tax return. The Company reduced its balance of unrecognized tax benefits by $6.5 million for the impact of the approval on this uncertain tax position.
This Company is subject to tax in the United States, Canada, Shanghai and Hong Kong. The Company could be subject to United States federal and state tax examinations for years 2001 and forward by virtue of net
99
operating loss carryforwards available from those years. There are no United States tax examinations currently in progress. The Company may also be subject to audits in Canada for years 2004 and forward. During fiscal 2012, the Canada Revenue Agency concluded, with no adjustments, its audit of Restoration Hardware Canada, Inc. for the years ended 2006 and 2007 and for the period ended June 16, 2008.
NOTE 11-EARNINGS PER SHARE
On November 1, 2012, the Company acquired all of the outstanding shares of capital stock of Restoration Hardware, Inc. and Restoration Hardware, Inc. became a direct, wholly owned subsidiary of the Company. Outstanding units issued by Home Holdings under its equity compensation plan, referred to as the Team Resto Ownership Plan, were replaced with common stock of the Company at the time of its initial public offering. Restoration Hardware, Inc. was a direct, wholly owned subsidiary of Home Holdings prior to the Company's initial public offering. As a result of these transactions, as of November 1, 2012, 32,188,891 shares of the Company's common stock were outstanding.
On November 7, 2012, the Company completed its initial public offering. In connection with its initial public offering, the Company issued and sold 4,782,609 shares of its common stock.
The weighted-average number of shares for fiscal 2011 is calculated by giving effect to the capitalization of Restoration Hardware Holdings, Inc. on September 2, 2011, which resulted in the number of shares outstanding increasing from 100 shares to 1,000 shares.
The weighted-average number of shares for fiscal 2012 excludes 6,020,152 million shares related to stock options and other stock awards because their inclusion would have an anti-dilutive effect on earnings per share. The Company did not have any anti-dilutive securities in fiscal 2011 or fiscal 2010 because all securities granted in those periods were granted by Home Holdings.
NOTE 12-STOCK-BASED COMPENSATION
The Company accounts for stock-based compensation in accordance with applicable guidance, which requires the Company to estimate the value of securities issued based upon an option-pricing model and recognize this estimated value as compensation expense over the vesting periods.
Team Resto Ownership Plan
Home Holdings established the Team Resto Ownership Plan in fiscal 2009. Awards under the Team Resto Ownership Plan were granted by the Home Holdings and were made up of the following:
| • | Time-based units-time-based units vested in annual installments, generally over a five-year graded vesting period. |
| • | Performance-based units-performance-based units vested based on a return on equity investment to the Company's investors between either two times and three times such investment or three times and five times such investment. |
All stock-based compensation expense associated with the grants of units by Home Holdings to the Company's directors, executive officers and employees was recorded by the Company.
On November 7, 2012, the Company completed its initial public offering and at the time of the initial public offering, outstanding units under the Team Resto Ownership Plan, were replaced with common stock of the Company.
100
Team Resto Ownership Plan – Time-Based Units
The following table presents the time-based unit activity in fiscal 2011 and fiscal 2012:
| Number Of Units | Weighted- Average Grant Date Fair Value | Weighted- Average Remaining Contractual Life (In Years) | ||||||||||
Outstanding-January 29, 2011 | 9,801,071 | 0.61 | 8.35 | |||||||||
Granted | 1,626,000 | 1.28 | 10.00 | |||||||||
Cancelled | (570,426 | ) | 0.58 | 9.53 | ||||||||
Forfeited | (567,925 | ) | 1.18 | 9.78 | ||||||||
|
| |||||||||||
Outstanding-January 28, 2012 | 10,288,720 | 0.69 | 7.43 | |||||||||
Granted | - | - | - | |||||||||
Cancelled | (33,000 | ) | 0.62 | 9.36 | ||||||||
Forfeited | (253,750 | ) | 1.24 | 9.68 | ||||||||
Replaced with common stock | (10,001,970 | ) | 0.67 | 6.65 | ||||||||
|
| |||||||||||
Outstanding-February 2, 2013 | - | - | - | |||||||||
|
| |||||||||||
The fair value of each time-based unit granted in fiscal 2011 was estimated on the date of grant using a Monte Carlo method with the following weighted-average assumptions:
Expected volatility | 56 | % | ||
Expected life (years) | 0.8 | |||
Risk-free interest rate | 0.19 | % | ||
Dividend yield | - |
As of February 2, 2013, all compensation expense related to time-based units was recorded by the Company. No stock-based compensation cost had been capitalized in the accompanying consolidated financial statements.
The Company recorded stock-based compensation expense for time-based units of $1.1 million, $1.6 million, and $1.1 million in fiscal 2012, fiscal 2011, and fiscal 2010, respectively, which is included in selling, general and administrative expenses on the consolidated statements of operations.
Team Resto Ownership Plan – Performance-Based Units
The following table presents the performance-based unit activity in fiscal 2011 and fiscal 2012:
| Number Of Units | Weighted- Average Grant Date Fair Value | |||||||
Outstanding-January 29, 2011 | 9,422,384 | 0.25 | ||||||
Granted | 1,069,000 | 0.48 | ||||||
Cancelled | (762,609 | ) | 0.35 | |||||
Forfeited | (607,000 | ) | 0.11 | |||||
|
| |||||||
Outstanding-January 28, 2012 | 9,121,775 | 0.28 | ||||||
Granted | - | - | ||||||
Forfeited | (45,000 | ) | 0.64 | |||||
Replaced with common stock | (9,076,775 | ) | 0.28 | |||||
|
| |||||||
Outstanding-February 2, 2013 | - | - | ||||||
|
| |||||||
101
The fair value of each performance-based unit granted in fiscal 2011 was estimated on the date of grant using a Monte Carlo method with the following weighted-average assumptions:
Expected volatility | 56 | % | ||
Expected life (years) | 0.8 | |||
Risk-free interest rate | 0.21 | % | ||
Dividend yield | - |
The Company recognizes expense associated with the units when it becomes probable that the performance condition will be met. Once it becomes probable that a participant will vest, the Company recognizes compensation expense equal to the number of shares which have vested multiplied by the fair value of the related shares measured at the grant date. In connection with its initial public offering, the Company recorded $0.8 million related to the vested performance-based units, which is included in selling, general and administrative expenses on the consolidated statements of operations.
2012 Equity Replacement Plan
In connection with the Reorganization, the Board of Directors adopted the Restoration Hardware 2012 Equity Replacement Plan (the "Replacement Plan"), and outstanding units under the Team Resto Ownership Plan were replaced with vested and unvested shares of common stock under the Replacement Plan, in some cases subject to selling restrictions.
A portion of the shares issued under the Replacement Plan, which are fully vested, are subject to resale restrictions whereby the holder may not sell the shares until the earlier of 20 years after the initial public offering, or: (i) with respect to 818,209 of these shares, such resale restrictions will lapse over time in accordance with the dates set forth in the applicable award agreement, and (ii) with respect to 1,523,041 of these shares, such resale restrictions will lapse on the date after the initial public offering on which the price of the Company's common stock reaches a 10-day average closing price per share of $46.50 for at least 10 consecutive trading days.
The Company recorded a non-cash compensation charge at the Reorganization of $39.1 million related to the awards granted under the Replacement Plan which is included in selling, general and administrative expenses on the consolidated statements of operations.
A portion of the shares issued under the Replacement Plan are unvested restricted shares issued to Carlos Alberini, the Company's Chief Executive Officer, and Gary Friedman, who serves as the Company's Creator and Curator, in replacement of certain of their performance-based units granted under the Team Resto Ownership Plan. With respect to the 1,331,548 shares received by Mr. Alberini and Mr. Friedman in replacement of certain of their performance-based units, such shares begin to vest during the 36-month period following the initial public offering when the price of the Company's common stock reaches a 10-day average closing price per share of $31.00 for at least 10 consecutive trading days, and such shares shall fully vest when the price of the Company's common stock reaches a 10-day average closing price per share of $46.50 for at least 10 consecutive trading days (with proportional vesting in between). In addition, with respect to the 512,580 shares received by Mr. Alberini and Mr. Friedman in replacement of certain of their performance-based units, such shares shall begin to vest during the 36-month period following the initial public offering when the 10-day average closing price of the Company's common stock exceeds the initial public offering price of $24.00 per share for at least 10 consecutive trading days, and such shares shall fully vest when the 10-day average closing price of the Company's common stock reaches a price per share of $31.00 for at least 10 consecutive trading days (with proportional vesting in between) during the period.
In connection with Mr. Friedman's resignation and new role as the Creator and Curator, 1,185,511 shares of unvested stock he received in replacement of certain performance-based units will be marked to market every period until the required vesting criteria are met in accordance with Financial Accounting Standards Board Accounting Standards Codification Topic 718.
102
During the fourth quarter of fiscal 2012, all 512,580 shares received by Mr. Alberini and Mr. Friedman in replacement of certain of their performance-based units met the performance objective of $31.00 per share for at least 10 consecutive trading days. The Company recorded a non-cash compensation charge of approximately $12.5 million related to these awards in fiscal 2012 which is included in selling, general and administrative expenses on the consolidated statements of operations. During the fourth quarter of fiscal 2012, 442,932 shares of the 1,331,548 shares received by Mr. Alberini and Mr. Friedman in replacement of certain of their performance-based units had vested in accordance with the performance objective as described above. The Company recorded a non-cash compensation charge of approximately $10.6 million related to these awards in fiscal 2012 which is included in selling, general and administrative expenses on the consolidated statements of operations. Unrecognized compensation for units that have not yet met the performance objectives as of February 2, 2013 was $16.4 million.
Subsequent to February 2, 2013, and through April 16, 2013, 140,457 shares of the 1,331,548 shares received by Mr. Alberini and Mr. Friedman in replacement of certain of their performance-based units had vested in accordance with the performance objective as described above. The Company will record a non-cash compensation charge of approximately $3.4 million related to these awards in the first quarter of fiscal 2013 through April 16, 2013. Additionally, the unvested portion will continue to vest based upon stock price performance in future periods as described above.
Aside from the awards described above, no other awards will be granted under the Replacement Plan.
2012 Stock Option Plan and 2012 Stock Incentive Plan
In connection with the Reorganization, the Board of Directors adopted the Restoration Hardware 2012 Stock Option Plan (the "Option Plan"), pursuant to which 6,829,041 fully vested options were granted in connection with the Reorganization to certain of the Company's employees and advisors, including Mr. Alberini and Mr. Friedman. The options granted under this plan were fully vested upon the completion of the initial public offering and are subject to resale restrictions whereby the holder may not sell the shares for a period of 20 years after the initial public offering, except as follows: (i) with respect to 875,389 of these shares with an exercise price of $29.00 per share, such resale restrictions will lapse over time in accordance with the dates set forth in the applicable award agreement, and (ii) with respect to 5,953,652 shares with an exercise price of $46.50 per share, such resale restrictions will lapse on dates after the initial public offering on which the 10-day average closing price per share of the Company's common stock reaches specified levels ranging from $50.75 to $111.25 for at least 10 consecutive trading days. Aside from these options granted in connection with the Reorganization, no other awards will be granted under the Option Plan.
In connection with the Reorganization, the Board of Directors adopted the Restoration Hardware 2012 Stock Incentive Plan (the "Stock Incentive Plan"). The Stock Incentive Plan provides for the grant of incentive stock options to the Company's employees, non-qualified stock options, stock appreciation rights, restricted stock, restricted stock units, dividend equivalent rights, cash-based awards and any combination thereof to the Company's employees, directors and consultants and the Company's parent and subsidiary corporations' employees, directors and consultants. In connection with the Reorganization, the Board of Directors granted options to purchase 1,264,036 shares of the Company's common stock to employees of the Company under the Stock Incentive Plan, which options were fully vested upon the completion of the initial public offering, with a weighted-average exercise price equal to $26.50 per share.
In addition, in connection with the Reorganization, the Board of Directors granted an aggregate of 40,623 restricted stock units to certain of the Company's directors under the Stock Incentive Plan. Such restricted stock units vested in full on January 31, 2013.
In connection with the grants under the Option Plan and the Stock Incentive Plan, the Company recorded a non-cash compensation charge at the Reorganization of $52.0 million related to these awards which is included in selling, general and administrative expenses on the consolidated statements of operations.
103
As of February 2, 2013, the total number of shares issuable under the Option Plan and Stock Incentive Plan was 11,900,671. Awards under the plans reduce the number of shares available for future issuance. Cancellations and forfeitures of shares previously granted increase the number of shares available for future issuance. The number of shares available for future issuance under the Stock Incentive Plan as of February 2, 2013 was 3,700,471. There are no more shares available for issuance under the Option Plan.
A summary of stock option activity under the Option Plan and the Stock Incentive Plan for fiscal 2012 is as follows:
| Options | Weighted-Average Exercise Price | |||||||
Outstanding-January 28, 2012 | - | $ | - | |||||
Granted | 8,159,577 | 41.41 | ||||||
Exercised | - | - | ||||||
Forfeited | - | - | ||||||
|
| |||||||
Outstanding-February 2, 2013 | 8,159,577 | $ | 41.41 | |||||
|
| |||||||
A summary of additional information about stock options in fiscal 2012 is as follows:
Weighted-average fair value per share of stock options granted | $ | 6.34 | ||
Aggregate intrinsic value of stock options exercised (in thousands) | $ | - | ||
Fair value of stock options vested (in thousands) | $ | 51,063 |
Information about stock options outstanding, vested or expected to vest, and exercisable as of February 2, 2013 is as follows:
| Options Outstanding | Options Exercisable | |||||||||||||||||||
Range of Exercise Prices | Number of Options | Weighted- Average Remaining Contractual Life (in years) | Weighted- Average Exercise Price | Number of Options | Weighted- Average Exercise Price | |||||||||||||||
$24.00 - $29.00 | 2,139,425 | 9.74 | $ | 27.52 | 2,139,425 | $ | 27.52 | |||||||||||||
$30.00 - $33.00 | 66,500 | 9.89 | 32.38 | - | - | |||||||||||||||
$46.50 | 5,953,652 | 9.74 | 46.50 | 5,953,652 | 46.50 | |||||||||||||||
|
|
|
| |||||||||||||||||
Total | 8,159,577 | 9.74 | $ | 41.41 | 8,093,077 | $ | 41.48 | |||||||||||||
|
|
|
| |||||||||||||||||
Vested or expected to vest as of February 2, 2013 | 8,159,577 | 9.74 | $ | 41.41 | ||||||||||||||||
|
| |||||||||||||||||||
The aggregate intrinsic value of options outstanding, options vested or expected to vest, and options exercisable as of February 2, 2013 was $18.9 million, $18.9 million, and $18.6 million, respectively. Stock options exercisable as of February 2, 2013 had a weighted-average remaining contractual life of 9.74 years.
As of February 2, 2013, the total unrecognized compensation expense related to unvested options was $0.5 million, which is expected to be recognized on a straight-line basis over a weighted-average period of 3.80 years. No stock-based compensation cost has been capitalized in the accompanying consolidated financial statements.
NOTE 13-EMPLOYEE BENEFIT PLANS
The Company has a 401(k) plan for its employees who meet certain service and age requirements. Participants may contribute up to 50% of their salaries limited to the maximum allowed by the Internal Revenue Service regulations. The Company, at its discretion, may contribute funds to the 401(k) plan. The Company made no contributions to the 401(k) plan during fiscal 2012, fiscal 2011, or fiscal 2010.
104
NOTE 14-RELATED PARTY TRANSACTIONS
Resignation of Co-Chief Executive Officer and Formation of Hierarchy
The Company's former Chairman and Co-Chief Executive Officer, Gary Friedman, resigned from these positions and as a director of the Company effective as of October 20, 2012. In connection with such resignation, Mr. Friedman and the Company entered into an advisory services agreement that provides for Mr. Friedman to advise the Company in his role as the Creator and Curator with respect to product development, merchandising and other creative matters. The agreement has a five-year term and is renewable for an additional five-year period. In addition, in connection with the Company's initial public offering, Home Holdings has agreed to invest $5 million, consisting of $2.5 million in an initial tranche and up to $2.5 million in one or more additional tranches, directly or indirectly, in Hierarchy, LLC ("Hierarchy"), a newly formed entity in which Mr. Friedman has a controlling interest. If requested by Home Holdings and agreed to by the Company, the Company may make these subsequent investments. The Company will have the right to acquire all or a portion of Home Holdings' interest in Hierarchy between the second and third anniversaries of the Company's initial public offering, at the greater of the then fair market value and the price paid by Home Holdings. As of February 2, 2013, the initial investment tranche of $2.5 million had not been funded by Home Holdings.
In addition, Home Holdings has assigned to the Company its right of first offer and co-sale right over the sale by Mr. Friedman of his interests in Hierarchy, its right of first offer over the sale of Hierarchy or any of its lines of business and its preemptive rights on issuances of additional interests in Hierarchy. The agreements among Hierarchy, Home Holdings, Mr. Friedman and the Company contemplate that the Company will enter into an agreement to provide Hierarchy with back office, logistics, supply chain and administrative support, with pricing determined based on the fair market value of such services. Unless otherwise agreed by Home Holdings, for two years from the date of the Hierarchy operating agreement, Hierarchy's line of business will be limited to apparel and apparel related businesses. In addition, Hierarchy will be permanently prohibited from entering into lines of business in which the Company is engaged and certain lines of business in which the Company may become engaged (other than luggage, which Hierarchy may enter into after such two year period). Mr. Friedman is also a significant stockholder in the Company and will continue to advise the Board of Directors in an observer capacity, with the honorary title of Chairman Emeritus.
Management Agreement
Pursuant to the Amended and Restated Management Services Agreement with certain affiliates of Catterton, Tower Three and Glenhill, such affiliated entities were to provide services to the Company for general management, consulting services and other strategic planning functions. The amount of the annual management fee payable to Catterton, Tower Three and Glenhill under the Amended and Restated Management Services Agreement was equal to 1.5% of Catterton's and Tower Three's invested capital in Home Holdings and 1% of Glenhill's invested capital in Home Holdings.
The Amended and Restated Management Services Agreement provided that the term of the agreement ends upon the consummation of an initial public offering, and that additional fees would be payable upon termination in connection with an initial public offering. The Company paid additional fees upon such termination in connection with its initial public offering to Catterton, Tower Three and Glenhill in the amount of $3.3 million, $3.1 million and $0.6 million, respectively.
In addition to the initial public offering termination fees, the Company recorded management fees of $3.9 million in selling, general and administrative expenses in fiscal 2012 and such management fees were paid by the Company as of February 2, 2013.
The Company recorded management fees of $9.9 million in selling, general and administrative expenses in fiscal 2011, of which $6.0 million was paid directly by Home Holdings and reflected as a capital contribution from Home Holdings through additional paid-in capital. The remaining $3.9 million was paid by the Company as of January 28, 2012.
105
The Company recorded management fees of $3.9 million in selling, general and administrative expenses in fiscal 2010 and such management fees were paid by the Company as of January 29, 2011.
Executive Loans with Home Holdings
In December 2008, Mr. Friedman entered into a $1.0 million loan with Home Holdings in connection with the purchase of a 0.3% ownership interest in Home Holdings. The full recourse loan initially bore interest at a rate of 8.0% per annum. If the interest was not paid in cash on December 31 of each year, such interest was deemed paid by capitalization and added to the principal amount of the loan. Principal and accrued interest was due the earlier of December 31, 2018, upon the sale of the Company or upon Mr. Friedman's termination of employment. In May 2010, the loan was amended and restated to, among other things, reduce the interest rate to 5.0% per annum, as of the date of the original $1.0 million loan received in December 2008, modify the maturity date to December 31, 2015, and provide for an additional $5.0 million loan from Home Holdings in connection with the purchase of an additional 1.7% ownership interest in Home Holdings.
In September 2011, Mr. Friedman repaid the loans owed to Home Holdings, together with accrued interest thereon, through the reclassification by Home Holdings of Mr. Friedman's pre-Reorganization Class A units and Class A-1 units in Home Holdings into an equal number of pre-Reorganization Class A Prime units and Class A-1 Prime units in Home Holdings, respectively. The Class A Prime units and Class A-1 Prime units, which are not subject to any future vesting, do not entitle Mr. Friedman to distributions from Home Holdings until after certain amounts have been distributed to the holders of Class A units, commensurate with the amount of all previously outstanding principal and interest on the loans. On the date of such repayment, the total principal amount of the loans, including all accrued interest thereon, was $6,559,877. No prior payments of principal or interest were made by Mr. Friedman under the loan agreements. The Company completed a valuation analysis regarding the reclassification of units which resulted in a $6.4 million compensation charge included in selling, general and administrative expenses on the consolidated statements of operations for fiscal 2011 and reflected as a capital contribution from Home Holdings through additional paid-in capital. Such compensation charge was calculated as the total principal amount of the loans, including all accrued interest thereon, as of the repayment date, less the difference in fair value of the Class A units and Class A-1 units in Home Holdings as compared to the Class A Prime units and Class A-1 Prime units in Home Holdings.
In May 2010, Mr. Alberini, the Company's Chief Executive Officer, entered into a $4.0 million loan with Home Holdings in connection with the purchase of a 1.4% ownership interest in Home Holdings bearing interest at the rate of 5.0% per annum with a maturity date of ninety days from the original date of such note. The loan to Mr. Alberini was repaid in full on August 25, 2010.
In April 2011, Ken Dunaj, the Company's Chief Operating Officer, entered into a $600,000 loan with Home Holdings. The full recourse loan bears interest at 5.0% per annum and is secured by Mr. Dunaj's Team Restoration Ownership Plan units. The loan, together will all interest accrued but unpaid, is due and payable on the first to occur of (i) December 31, 2015, (ii) ninety days following termination of employment, (iii) the date of any sale of the Company, (iv) the date of an initial public offering, (v) the date of any acceleration that might occur as a result of a defined default under the note, or (vi) demand for repayment by Home Holdings.
In September 2011, Mr. Dunaj repaid the loan owed to Home Holdings, together with accrued interest thereon, through the reclassification by Home Holdings of Mr. Dunaj's pre-Reorganization Class B units issued under the Team Resto Ownership Plan into an equal number of pre-Reorganization Class B Prime units under the Team Resto Ownership Plan. The Class B Prime units are entitled to a lower distribution amount than Class B units, commensurate with the amount of all previously outstanding principal and interest on the loan. On the date of such repayment, the total principal amount of the loan, including all accrued interest thereon, was $620,712. No prior payments of principal or interest were made by Mr. Dunaj under the loan agreement. On the date of such repayment, Mr. Dunaj surrendered 300,000 of his unvested Class B performance units under the Team Resto Ownership Plan. The Company undertook a valuation analysis regarding the reclassification of units which resulted in no compensation charge recorded in connection with the reclassification in the Company's consolidated financial statements for fiscal 2011 as it relates to vested awards and over the remaining vesting periods for currently unvested awards.
106
NOTE 15-COMMITMENTS AND CONTINGENCIES
Leases
The Company leases certain property consisting of retail and outlet stores, corporate offices, distribution centers and equipment. Leases expire at various dates through 2027. The stores, distribution centers and corporate office leases generally provide that the Company assumes the maintenance and all or a portion of the property tax obligations on the leased property. Most store leases also provide for minimum annual rentals, with provisions for additional rent based on a percentage of sales and for payment of certain expenses.
The aggregate future minimum rental payments under leases in effect as of February 2, 2013, are as follows ( in thousands ):
| Capital Leases | Operating Leases | Total | ||||||||||
2013 | $ | 3,070 | $ | 62,343 | $ | 65,413 | ||||||
2014 | 1,414 | 55,137 | 56,551 | |||||||||
2015 | 184 | 47,919 | 48,103 | |||||||||
2016 | 42 | 43,497 | 43,539 | |||||||||
2017 | - | 39,545 | 39,545 | |||||||||
Thereafter | - | 224,395 | 224,395 | |||||||||
|
|
|
|
|
| |||||||
Minimum lease commitments | 4,710 | $ | 472,836 | $ | 477,546 | |||||||
|
|
|
| |||||||||
Less-amount representing interest | (183 | ) | ||||||||||
|
| |||||||||||
Present value of capital lease obligations | 4,527 | |||||||||||
Less-current capital lease obligations | (2,925 | ) | ||||||||||
|
| |||||||||||
Long-term capital lease obligations | $ | 1,602 | ||||||||||
|
| |||||||||||
The current and long-term capital lease obligations are included in other current liabilities and other long-term obligations, respectively, on the consolidated balance sheets.
Lease payments that depend on factors that are not measurable at the inception of the lease, such as future sales volume, are contingent rentals and are excluded from minimum lease payments and included in the determination of total rental expense when it is probable that the expense has been incurred and the amount is reasonably estimable. Future payments for insurance, real estate taxes and repair and maintenance to which the Company is obligated are excluded from minimum lease payments. Minimum and contingent rental expense under operating leases is as follows ( in thousands ):
| Year Ended | ||||||||||||
| February 2, 2013 | January 28, 2012 | January 29, 2011 | ||||||||||
Operating leases | ||||||||||||
Minimum rental expense | $ | 52,750 | $ | 51,665 | $ | 48,801 | ||||||
Contingent rental expense | 3,318 | 1,456 | 900 | |||||||||
|
|
|
|
|
| |||||||
Total operating leases | $ | 56,068 | $ | 53,121 | $ | 49,701 | ||||||
|
|
|
|
|
| |||||||
Commitments
The Company had no off balance sheet commitments as of February 2, 2013.
107
Contingencies
The Company is involved from time to time in various legal claims, actions and complaints arising in connection with its business. The outcome of matters the Company is involved in cannot be determined at this time and the results cannot be predicted with certainty and could result in unexpected expenses and liability and could also materially adversely affect the Company's operations.
The Company reviews the need for any loss contingency reserves and establishes reserves when, in the opinion of management, it is probable that a matter would result in liability, and the amount of loss, if any, can be reasonably estimated. Generally, in view of the inherent difficulty of predicting the outcome of those matters, particularly in cases in which claimants seek substantial or indeterminate damages, it is not possible to determine whether a liability has been incurred or to reasonably estimate the ultimate or minimum amount of that liability until the case is close to resolution, in which case no reserve is established until that time.
NOTE 16-SEGMENT REPORTING
The Company defines an operating segment on the same basis that it uses to evaluate performance internally by the Chief Operating Decision Maker ("CODM"). The Company has determined that the Chief Executive Officer (or Co-Chief Executive Officers prior to Mr. Friedman's resignation from such position) was its CODM and there was one operating segment. Therefore, the Company reports as a single segment. This includes all sales channels accessed by the Company's customers, including sales through catalogs, sales through the Company's website and sales through the Company's stores.
The Company classifies its sales into furniture and non-furniture product lines. Furniture includes both indoor and outdoor furniture from the Company's business lines. Non-furniture includes lighting, textiles, accessories and home décor. Net revenues in each category were as follows ( in thousands ):
| Year Ended | ||||||||||||
| February 2, 2013 | January 28, 2012 | January 29, 2011 | ||||||||||
Furniture | $ | 628,092 | $ | 477,730 | $ | 339,173 | ||||||
Non-furniture | 564,954 | 480,354 | 433,579 | |||||||||
|
|
|
|
|
| |||||||
Total net revenues | $ | 1,193,046 | $ | 958,084 | $ | 772,752 | ||||||
|
|
|
|
|
| |||||||
The Company is domiciled in the United States and operates stores in the United States and Canada. Revenues from Canadian operations, and the long-lived assets in Canada, are not material to the Company. Geographic revenues are determined based upon where service is rendered.
No single customer accounted for more than 10% of the Company's revenues in fiscal 2012, fiscal 2011, or fiscal 2010.
NOTE 17-RETAIL STORE CLOSURES AND OFFICE RESTRUCTURING
Shanghai Office Restructuring
In April 2011, the Company restructured its Shanghai office location and terminated employees at that office, as well as terminated employees within the corporate headquarters in Corte Madera, CA. As a result, during fiscal 2011, the Company incurred $1.6 million in restructuring related costs, including one-time employee termination benefits, contract termination fees, loss on disposal of capitalized property and equipment, and other associated costs, which are included in selling, general and administrative expenses on the consolidated statements of operations. During fiscal 2012, the Company did not incur any restructuring related costs. At February 2, 2013, the Company did not have any remaining future liabilities related to this office restructuring. The Company does not expect to incur additional costs associated with this office restructuring in future periods.
108
Retail Store Closures
In June and July 2011, the Company closed four retail store locations prior to their respective lease termination dates. As a result, during fiscal 2011, the Company incurred $3.2 million in exit related costs, including contract termination fees, one-time employee termination benefits and other associated costs. During fiscal 2012, the Company recorded income of $0.4 million related to a change in estimate of liabilities related to closed stores. At February 2, 2013, the Company had remaining future liabilities existing under the lease agreements of $0.3 million which consist of contract termination fees. The Company does not expect to incur additional costs associated with these retail store closures in future periods.
NOTE 18-SELECTED QUARTERLY FINANCIAL DATA (UNAUDITED)
Quarterly financial data for fiscal 2012 and fiscal 2011 are set forth below ( in thousands, except share and per share amounts ):
| Three Months Ended | ||||||||||||||||
Fiscal 2012 | April 28, 2012 | July 28, 2012 | October 27, 2012 | February 2, 2013 | ||||||||||||
Net revenues | $ | 217,914 | $ | 292,906 | $ | 284,171 | $ | 398,055 | ||||||||
Gross profit | 75,268 | 114,127 | 101,880 | 145,174 | ||||||||||||
Net income (loss) | (3,728 | ) | 17,616 | 1,685 | (28,362 | ) | ||||||||||
Weighted-average shares used in computing basic and diluted net income (loss) per share | 1,000 | 1,000 | 1,000 | 35,692,064 | ||||||||||||
Basic and diluted net income (loss) per share | $ | (3,728 | ) | $ | 17,616 | $ | 1,685 | $ | (0.79 | ) | ||||||
| Three Months Ended | ||||||||||||||||
Fiscal 2011 | April 30, 2011 | July 30, 2011 | October 29, 2011 | January 28, 2012 | ||||||||||||
Net revenues | $ | 184,760 | $ | 235,623 | $ | 232,459 | $ | 305,242 | ||||||||
Gross profit | 63,184 | 91,246 | 84,393 | 117,526 | ||||||||||||
Net income (loss) | (6,218 | ) | 7,582 | (4,830 | ) | 24,054 | ||||||||||
Weighted-average shares used in computing basic and diluted net income (loss) per share | 100 | 100 | 674 | 1,000 | ||||||||||||
Basic and diluted net income (loss) per share | $ | (62,180 | ) | $ | 75,820 | $ | (7,166 | ) | $ | 24,054 | ||||||
The three months ended February 2, 2013 includes (i) a $92.0 million non-cash compensation charge related to equity grants at the time of the Reorganization, (ii) a non-cash compensation charge of $23.1 million related to the performance-based vesting of certain shares granted to Mr. Alberini and Mr. Friedman, (iii) costs incurred in connection with the initial public offering, including a fee of $7.0 million to Catterton, Tower Three and Glenhill in accordance with the Company's management services agreement, payments of $2.2 million to certain former executives and bonus payments to employees of $1.3 million and (iv) $3.3 million incurred as a result of increased tariff obligations of one of the Company's foreign suppliers following the U.S. Department of Commerce's review of the anti-dumping duty order on wooden bedroom furniture from China for the period from January 1, 2011 through December 31, 2011. In addition, as of the end of fiscal 2012, the Company's U.S. operations had returned to a position of cumulative profits (adjusted for permanent differences) for the most recent three-year period. The Company concluded that this record of cumulative profitability in recent years, coupled with its business plan for profitability in future periods, provided assurance that the Company's future tax benefits more likely than not would be realized. Accordingly, in the three months ended February 2, 2013, the Company released all of its U.S. valuation allowance of $57.2 million against net deferred tax assets.
109
The three months ended July 28, 2012 and October 27, 2012 include $2.0 million and $2.8 million, respectively, of legal and other professional fees incurred in connection with the investigation conducted by the special committee of the board of directors relating to Mr. Friedman and its subsequent remedial actions.
The three months ended October 29, 2011 includes a $6.4 million compensation charge related to the repayment of loans owed to Home Holdings by Mr. Friedman, through the reclassification by Home Holdings of Mr. Friedman's Class A and Class A-1 ownership units into an equal number of Class A Prime and Class A-1 Prime ownership units.
110
REPORT OF INDEPENDENT REGISTERED PUBLIC ACCOUNTING FIRM
To the Board of Directors and Stockholders
Restoration Hardware Holdings, Inc.
In our opinion, the accompanying consolidated balance sheets and the related consolidated statements of operations, comprehensive income (loss), stockholders' equity and cash flows present fairly, in all material respects, the financial position of Restoration Hardware Holdings, Inc. and its subsidiaries at February 2, 2013 and January 28, 2012 and the results of their operations and their cash flows for each of the three years in the period ended February 2, 2013 in conformity with accounting principles generally accepted in the United States of America. These financial statements are the responsibility of the Company's management. Our responsibility is to express an opinion on these financial statements based on our audits. We conducted our audits of these statements in accordance with the standards of the Public Company Accounting Oversight Board (United States). Those standards require that we plan and perform the audit to obtain reasonable assurance about whether the financial statements are free of material misstatement. An audit includes examining, on a test basis, evidence supporting the amounts and disclosures in the financial statements, assessing the accounting principles used and significant estimates made by management, and evaluating the overall financial statement presentation. We believe that our audits provide a reasonable basis for our opinion.
/s/ PricewaterhouseCoopers LLP
San Francisco, CA
April 25, 2013
111
| Item 9. | Changes in and Disagreements with Accountants on Accounting and Financial Disclosure |
None.
| Item | 9A. Controls and Procedures |
Evaluation of Disclosure Controls and Procedures
We maintain disclosure controls and procedures that are designed to ensure that information required to be disclosed in the reports we file or submit under the Securities Exchange Act of 1934, as amended, is recorded, processed, summarized and reported within the time periods specified in the SEC's rules and forms, and that such information is accumulated and communicated to our management, including our Principal Executive Officer and our Principal Financial Officer, as appropriate, to allow timely decisions regarding required disclosure.
Our management, with the participation of our Chief Executive Officer and Chief Financial Officer, evaluated the effectiveness of our disclosure controls and procedures (as defined in Rules 13a-15(e) and 15d-15(e) under the Securities Exchange Act of 1934, as amended) as of the end of the period covered by this annual report. Based on that evaluation, our Chief Executive Officer and Chief Financial Officer have concluded that as of the end of the period covered by this annual report our disclosure controls and procedures were effective to provide reasonable assurance that information required to be disclosed by us in reports that we file or submit under the Securities Exchange Act of 1934, as amended, is recorded, processed, summarized and reported within the time periods specified in the SEC's rules and forms, and include controls and procedures designed to ensure that the information required to be disclosed by us in such reports is accumulated and communicated to our management, including our Chief Executive Officer and Chief Financial Officer, as appropriate, to allow timely decisions regarding required disclosures.
Exemption from Management's Report on Internal Control Over Financial Reporting for the Fiscal Year Ended February 2, 2013
This annual report does not include a report of management's assessment regarding internal control over financial reporting or an attestation report of the company's registered public accounting firm due to a transition period established by rules of the Securities and Exchange Commission for newly public companies.
Changes in Internal Control Over Financial Reporting
There was no change in our internal control over financial reporting that occurred during our most recent fiscal quarter that has materially affected, or is reasonably likely to materially affect, our internal control over financial reporting.
| Item 9B. | Other Information. |
None.
112
PART III
| Item 10. | Directors, Executive Officers and Corporate Governance |
The information required by this item will be contained in our definitive Proxy Statement for the Annual Meeting of Shareholders (the "Proxy Statement") and is incorporated herein by reference.
| Item 11. | Executive Compensation |
The information required by this item will be contained in our Proxy Statement and is incorporated herein by reference.
| Item 12. | Security Ownership of Certain Beneficial Owners and Management and Related Stockholder Matters |
The information required by this item will be contained in our Proxy Statement and is incorporated herein by reference.
| Item 13. | Certain Relationships and Related Transactions and Director Independence |
The information required by this item will be contained in our Proxy Statement and is incorporated herein by reference.
| Item 14. | Principal Accountant Fees and Services |
The information required by this item will be contained in our Proxy Statement and is incorporated herein by reference.
113
PART IV
| Item | 15. Exhibits and Financial Statement Schedules |
| (a) | The following documents are filed as part of this Annual Report on Form 10-K: |
| 1. | Consolidated Financial Statements |
The following financial statements are included in Part II, Item 8 of this Annual Report on Form 10-K:
| • | Consolidated Balance Sheets as of February 2, 2013 and January 28, 2012 |
| • | Consolidated Statements of Operations for the fiscal years ended February 2, 2013, January 28, 2012 and January 29, 2011 |
| • | Consolidated Statements of Comprehensive Income (Loss) for the fiscal years ended February 2, 2013, January 28, 2012 and January 29, 2011 |
| • | Consolidated Statements of Cash Flows for the fiscal years ended February 2, 2013, January 28, 2012 and January 29, 2011 |
| • | Notes to the Consolidated Financial Statements |
| • | Report of Independent Registered Public Accounting Firm on Consolidated Financial Statements |
| 2. | Financial Statement Schedules |
Separate financial statement schedules have been omitted either because they are not applicable or because the required information is included in the consolidated financial statements or notes described in Item 15(a)(1) above.
| 3. | Exhibits |
The Exhibits listed in the Index to Exhibits, which appears immediately following the signature page and is incorporated herein by reference, are filed or incorporated by reference as part of this Annual Report on Form 10-K.
114
SIGNATURES
Pursuant to the requirements of Section 13 or 15(d) of the Securities Exchange Act of 1934, the registrant has duly caused this report to be signed on its behalf by the undersigned, thereunto duly authorized.
| RESTORATION HARDWARE HOLDINGS, INC. | ||
By: | /s/ Carlos Alberini | |
Carlos Alberini Chief Executive Officer | ||
Date: April 26, 2013
Know all persons by these presents, that each person whose signature appears below constitutes and appoints Carlos Aberini and Karen Boone, and each of them, as such person's true and lawful attorneys-in-fact and agents, with full power of substitution and resubstitution, for such person and in such person's name, place and stead, in any and all capacities, to sign any and all amendments to this annual report on Form 10-K, and to file the same, with all exhibits thereto, and all other documents in connection therewith, with the Securities and Exchange Commission, granting unto each said attorneys-in-fact and agents, and each of them, full power and authority to do and perform each and every act and thing requisite and necessary to be done in connection therewith, as fully to all intents and purposes as such person might or could do in person, hereby ratifying and confirming all that said attorneys-in-fact and agents, or any of them or their or such person's substitute or substitutes, may lawfully do or cause to be done by virtue thereof.
Pursuant to the requirements of the Securities Exchange Act of 1934, this report has been signed below by the following persons on behalf of the Registrant and in the capacities and on the dates indicated.
Signature | Title | Date | ||
/s/ Carlos Alberini Carlos Alberini | Chief Executive Officer; Director (Principal Executive Officer) | April 26, 2013 | ||
/s/ Karen Boone Karen Boone | Chief Financial Officer (Principal Financial Officer; Principal Accounting Officer) | April 26, 2013 | ||
/s/ Eri Chaya Eri Chaya | Director | April 26, 2013 | ||
/s/ J. Michael Chu J. Michael Chu | Director | April 26, 2013 | ||
/s/ Mark Demilio Mark Demilio | Director | April 26, 2013 | ||
/s/ William Forrest William Forrest | Director | April 26, 2013 | ||
/s/ Thomas Mottola Thomas Mottola | Director | April 26, 2013 | ||
/s/ Barry Sternlicht Barry Sternlicht | Director | April 26, 2013 | ||
115
EXHIBIT INDEX
Incorporated by Reference | ||||||||||||
Exhibit Number | Exhibit Description | Form | File Number | Date of First Filing | Exhibit | Filed Herewith | ||||||
3.1 | Certificate of Incorporation of Restoration Hardware Holdings, Inc. | - | - | - | - | X | ||||||
3.2 | Bylaws of Restoration Hardware Holdings, Inc. | - | - | - | - | X | ||||||
4.1 | Form of Restoration Hardware Holdings, Inc.'s Common Stock Certificate. | S-1/A | 333-176767 | October 23, 2012 | 4.1 | |||||||
10.1 | Form of Indemnification Agreement entered into by and between Restoration Hardware Holdings, Inc. and each of its directors. | S-1/A | 333-176767 | October 23, 2012 | 10.4 | |||||||
10.2 | First Amendment to Ninth Amended and Restated Credit Agreement dated as of January 6, 2012, by and among Restoration Hardware, Inc., as lead borrower, Restoration Hardware Canada, Inc., as Canadian borrower, the other borrowers party thereto, the guarantors party thereto, the lenders party thereto and Bank of America, N.A., as administrative agent and collateral agent. | S-1 | 333-176767 | June 26, 2012 | 10.5 | |||||||
116
Incorporated by Reference | ||||||||||||
Exhibit Number | Exhibit Description | Form | File Number | Date of First Filing | Exhibit | Filed Herewith | ||||||
10.3 | Ninth Amended and Restated Credit Agreement dated as of August 3, 2011, by and among Restoration Hardware, Inc., as lead borrower, Restoration Hardware Canada, Inc., as Canadian borrower, the other borrowers party thereto, the guarantors party thereto, the lenders from time to time party thereto and Bank of America, N.A., as administrative agent and collateral agent. | S-1 | 333-176767 | June 26, 2012 | 10.6 | |||||||
10.4 | Stockholders Agreement dated as of November 7, 2012, by and between Restoration Hardware Holdings, Inc., and Home Holdings, LLC. | - | - | - | - | X | ||||||
10.5 | Registration Rights Agreement dated as of November 7, 2012, by and among Restoration Hardware Holdings, Inc., Home Holdings, LLC, CP Home Holdings, LLC, Tower Three Home, LLC, and the other parties thereto. | - | - | - | - | X | ||||||
10.7 | Advisory Services Agreement dated as of October 20, 2012, between Restoration Hardware, Inc. and Gary Friedman. | S-1 | 333-176767 | October 31, 2012 | 10.18 | |||||||
117
Incorporated by Reference | ||||||||||||
Exhibit Number | Exhibit Description | Form | File Number | Date of First Filing | Exhibit | Filed Herewith | ||||||
10.8 | Employment Agreement dated as of November 1, 2012 by and between Restoration Hardware, Inc. and Carlos Alberini. | - | - | - | - | X | ||||||
10.9 | Employment Agreement dated as of November 1, 2012, by and between Restoration Hardware, Inc. and Karen Boone. | - | - | - | - | X | ||||||
10.10 | Amended and Restated Offer Letter, between Restoration Hardware, Inc. and Ken Dunaj. | S-1 | 333-176767 | October 23, 2012 | 10.3 | |||||||
10.11 | 2012 Equity Replacement Plan and related documents. | S-8 | 333-184716 | November 2, 2012 | 4.2 | |||||||
10.12 | 2012 Stock Incentive Plan and related documents. | S-8 | 333-184716 | November 2, 2012 | 4.3 | |||||||
10.13 | 2012 Stock Option Plan and related documents. | S-8 | 333-184716 | November 2, 2012 | 4.4 | |||||||
21.1 | Subsidiary List | S-1 | 333-176767 | June 26, 2012 | 21.1 | |||||||
23.1 | Consent of PricewaterhouseCoopers LLP | - | - | - | - | X | ||||||
24.1 | Power of Attorney (included on signature page) | - | - | - | - | X | ||||||
118
Incorporated by Reference | ||||||||||||
Exhibit Number | Exhibit Description | Form | File Number | Date of First Filing | Exhibit | Filed Herewith | ||||||
31.1 | Certification of Chief Executive Officer pursuant to Rule 13a-14(a) of the Securities Exchange Act of 1934, as amended. | - | - | - | - | X | ||||||
31.2 | Certification of Chief Financial Officer pursuant to Rule 13a-14(a) of the Securities Exchange Act of 1934, as amended. | - | - | - | - | X | ||||||
32.1 | Certification of Chief Executive Officer pursuant to 18 U.S.C. Section 1350, as adopted pursuant to Section 906 of the Sarbanes-Oxley Act of 2002. | - | - | - | - | X | ||||||
32.2 | Certification of Chief Financial Officer pursuant to 18 U.S.C. Section 1350, as adopted pursuant to Section 906 of the Sarbanes-Oxley Act of 2002. | - | - | - | - | X | ||||||
101.INS | XBRL Instance Document | - | - | - | - | X | ||||||
101.SCH | XBRL Taxonomy Extension Schema Document | - | - | - | - | X | ||||||
101.CAL | XBRL Taxonomy Extension Calculation Linkbase Document | - | - | - | - | X | ||||||
101.DEF | XBRL Extension Definition | - | - | - | - | X | ||||||
101.LAB | XBRL Taxonomy Extension Label Linkbase Document | - | - | - | - | X | ||||||
101.PRE | XBRL Taxonomy Extension Presentation Linkbase Document | - | - | - | - | X | ||||||
119