|
UNITED STATES
SECURITIES AND EXCHANGE COMMISSION
Washington, D.C. 20549
FORM 10-K
(Mark One) |
|
|
ý |
| ANNUAL REPORT PURSUANT TO SECTION 13 OR 15(d) OF THE SECURITIES EXCHANGE ACT OF 1934 |
For the fiscal year ended June 30, 2018 | ||
OR | ||
o |
| TRANSITION REPORT PURSUANT TO SECTION 13 OR 15(d) OF THE SECURITIES EXCHANGE ACT OF 1934 |
For the transition period from to | ||
Commission file number 1-12725
Regis Corporation
Minnesota State or other jurisdiction of incorporation or organization |
| 41-0749934 (I.R.S. Employer Identification No.) |
7201 Metro Boulevard, Edina, Minnesota (Address of principal executive offices) |
| 55439 (Zip Code) |
(952) 947-7777
(Registrant's telephone number, including area code)
Title of each class |
| Name of each exchange on which registered |
Common Stock, par value $0.05 per share |
| New York Stock Exchange |
Securities registered pursuant to Section 12(g) of the Act: None
Indicate by check mark if the registrant is a well-known seasoned issuer, as defined in Rule 405 of the Securities Act. Yes o No ý
Indicate by check mark if the registrant is not required to file reports pursuant to Section 13 or Section 15(d) of the Act. Yes o No ý
Indicate by check mark whether the registrant (1) has filed all reports required to be filed by Section 13 or 15(d) of the Securities Exchange Act of 1934 during the preceding 12 months (or for such shorter period that the registrant was required to file such reports), and (2) has been subject to such filing requirements for the past 90 days. Yes ý No o
Indicate by check mark whether the registrant has submitted electronically and posted on its corporate Web site, if any, every Interactive Data File required to be submitted and posted pursuant to Rule 405 of Regulation S-T (§ 232.405 of this chapter) during the preceding 12 months (or for such shorter period that the registrant was required to submit and post such files). Yes ý No o
Indicate by check mark if disclosure of delinquent filers pursuant to Item 405 of Regulation S-K (§ 229.405 of this chapter) is not contained herein, and will not be contained, to the best of registrant's knowledge, in definitive proxy or information statements incorporated by reference in Part III of this Form 10-K or any amendment to this Form 10-K. o
Large accelerated filer ý |
| Accelerated filer o |
| Non-accelerated filer o (Do not check if a smaller reporting company) |
| Smaller reporting company o |
| Emerging growth company o |
If an emerging growth company, indicate by check mark if the registrant has elected not to use the extended transition period for complying with any new or revised financial accounting standards provided pursuant to Section 13(a) of the Exchange Act. o
Indicate by check mark whether the registrant is a shell company (as defined by Rule 12b-2 of the Act). Yes o No ý
The aggregate market value of the voting common equity held by non-affiliates computed by reference to the price at which common equity was last sold as of the last business day of the registrant's most recently completed second fiscal quarter, December 31, 2017 , was approximately $550,996,588 . The registrant has no non-voting common equity.
As of August 15, 2018 , the registrant had 44,265,743 shares of Common Stock, par value $0.05 per share, issued and outstanding.
DOCUMENTS INCORPORATED BY REFERENCE
Portions of the registrant's definitive Proxy Statement for the annual fiscal 2018 meeting of shareholders (the " 2018 Proxy Statement") (to be filed pursuant to Regulation 14A within 120 days after the registrant's fiscal year-end of June 30, 2018 ) are incorporated by reference into Part III.
|
Table of Contents
CAUTIONARY NOTE REGARDING FORWARD-LOOKING STATEMENTS
This annual report, as well as information included in, or incorporated by reference from, future filings by the Company with the Securities and Exchange Commission and information contained in written material, press releases and oral statements issued by or on behalf of the Company contains or may contain "forward-looking statements" within the meaning of the federal securities laws, including statements concerning anticipated future events and expectations that are not historical facts. These forward-looking statements are made pursuant to the safe harbor provisions of the Private Securities Litigation Reform Act of 1995. The forward-looking statements in this document reflect management's best judgment at the time they are made, but all such statements are subject to numerous risks and uncertainties, which could cause actual results to differ materially from those expressed in or implied by the statements herein. Such forward-looking statements are often identified herein by use of words including, but not limited to, "may," "believe," "project," "forecast," "expect," "estimate," "anticipate," and "plan." In addition, the following factors could affect the Company's actual results and cause such results to differ materially from those expressed in forward-looking statements. These factors include the continued ability of the Company to implement its strategy, priorities and initiatives; our ability to attract, train and retain talented stylists; financial performance of our franchisees; acceleration of sale of certain salons to franchisees; The Beautiful Group's ability to transition and operate its salons successfully, as well as maintain adequate working capital; the ability of the Company to maintain a satisfactory relationship with Walmart; marketing efforts to drive traffic; changes in regulatory and statutory laws including increases in minimum wages; our ability to maintain and enhance the value of our brands; premature termination of agreements with our franchisees; our ability to manage cyber threats and protect the security of sensitive information about our guests, employees, vendors or Company information; reliance on information technology systems; reliance on external vendors; consumer shopping trends and changes in manufacturer distribution channels; competition within the personal hair care industry; changes in tax exposure; changes in healthcare; changes in interest rates and foreign currency exchange rates; failure to standardize operating processes across brands; financial performance of Empire Education Group; the continued ability of the Company to implement cost reduction initiatives; compliance with debt covenants; changes in economic conditions; changes in consumer tastes and fashion trends; exposure to uninsured or unidentified risks; reliance on our management team and other key personnel or other factors not listed above. Additional information concerning potential factors that could affect future financial results is set forth under Item 1A of this Form 10-K. We undertake no obligation to publicly update or revise any forward-looking statements, whether as a result of new information, future events or otherwise. However, your attention is directed to any further disclosures made in our subsequent annual and periodic reports filed or furnished with the SEC on Forms 10-Q and 8-K and Proxy Statements on Schedule 14A.
2
Table of Contents
REGIS CORPORATION
FORM 10-K
FOR THE FISCAL YEAR ENDED JUNE 30, 2018
INDEX
|
|
| Page(s) |
Part I. |
|
|
|
| Item 1. | Business | 4 |
|
| Executive Officers of the Registrant | 13 |
| Item 1A. | Risk Factors | 15 |
| Item 1B. | Unresolved Staff Comments | 22 |
| Item 2. | Properties | 22 |
| Item 3. | Legal Proceedings | 22 |
| Item 4. | Mine Safety Disclosures | 23 |
Part II. |
|
|
|
| Item 5. | Market for Registrant's Common Equity, Related Stockholder Matters, and Issuer Repurchase or Purchases of Equity Securities | 23 |
| Item 6. | Selected Financial Data | 25 |
| Item 7. | Management's Discussion and Analysis of Financial Condition and Results of Operations | 26 |
| Item 7A. | Quantitative and Qualitative Disclosures about Market Risk | 43 |
| Item 8. | Financial Statements and Supplementary Data | 44 |
|
| Report of Independent Registered Public Accounting Firm | 45 |
| Item 9. | Changes in and Disagreements with Accountants on Accounting and Financial Disclosure | 83 |
| Item 9A. | Controls and Procedures | 83 |
| Item 9B. | Other Information | 84 |
Part III. |
|
|
|
| Item 10. | Directors, Executive Officers and Corporate Governance | 84 |
| Item 11. | Executive Compensation | 84 |
| Item 12. | Security Ownership of Certain Beneficial Owners and Management and Related Stockholder Matters | 84 |
| Item 13. | Certain Relationships and Related Transactions, and Director Independence | 84 |
| Item 14. | Principal Accounting Fees and Services | 84 |
Part IV. |
|
|
|
| Item 15. | Exhibits and Financial Statement Schedules | 85 |
| Item 16. | Form 10-K Summary | 88 |
| Signatures | 89 | |
3
Table of Contents
PART I
Item 1. Business
General:
Regis Corporation owns, franchises and operates beauty salons. The Company is listed on the NYSE under the ticker symbol "RGS." Unless the context otherwise provides, when we refer to the "Company," "we," "our," or "us," we are referring to Regis Corporation, the Registrant, together with its subsidiaries.
As of June 30, 2018 , the Company-owned, franchised or held ownership interests in 8,168 locations worldwide. The Company's locations consist of 3,966 company-owned salons, 4,114 franchised salons and 88 locations in which we maintain a non-controlling ownership interest of less than 100%. Each of the Company's salon concepts generally offer similar salon products and services.
The major services supplied by the Company's salons are haircutting and styling (including shampooing and conditioning), hair coloring and other services. Service revenues comprise approximately 81% of total company-owned revenues. The percentage of company-owned service revenues in fiscal year 2018 attributable to haircutting and styling, hair coloring and other services were 77% , 16% and 7% , respectively.
In fiscal year 2017, we announced plans to expand the franchise side of our business, through organic growth and by selling certain company-owned salons to franchisees over time, as well as our review of strategic alternatives for company-owned mall-based locations. In January 2017, we began franchising the SmartStyle brand throughout the U.S. for the first time. In fiscal year 2018, the Company began to consider additional options to further expand its franchise business within its Supercuts company-owned salon portfolio.
In October 2017, the Company sold substantially all of its mall-based salon business in North America, representing 858 salons, and substantially all of its previous International segment, representing 250 salons in the UK, to The Beautiful Group ("TBG"), an affiliate of Regent, a private equity firm based in Los Angeles, California, who operates these locations as franchise locations. See Note 2 to the Consolidated Financial Statements in Part II, Item 8, of this Form 10-K for further discussion on the sale of our mall-based salon business and the previous International segment, which are now reported as a discontinued operation. As a result of this transaction, the Company redefined its operating segments to reflect how the chief operating decision maker now evaluates the business. The Company now reports its operations in two operating segments: Company-owned salons and Franchise salons. Prior to this change, the Company had four operating segments: North American Value, North American Premium, North American Franchise and International. See Note 14 to the Consolidated Financial Statements in Part II, Item 8, of this Form 10-K.
In January 2018, the Company closed 597 non-performing company-owned SmartStyle salons. The 597 non-performing salons generated negative cash flow of approximately $15 million during the twelve months ended September 30, 2017. The Company anticipates this action will allow the Company to reallocate capital and human resources to strategically grow its remaining SmartStyle salons with creative new offerings.
The Company's Company-owned salon operations are comprised of 3,966 company-owned salons operating in the United States (U.S.), Canada, and Puerto Rico. The Company's Franchise salon operations are comprised of 4,114 franchised salons operating in the United States, Canada, the United Kingdom and Puerto Rico. The Company's salons operate primarily under the trade names of SmartStyle, Supercuts, MasterCuts, Regis Salons, and Cost Cutters, and they generally serve two categories within the industry, value and premium. SmartStyle, Supercuts, MasterCuts, Cost Cutters, and other regional trade names are generally within the value category, offering high quality, convenience, and affordably priced hair care and beauty services and retail products. Regis Salons, among other trade names, are in the premium category, offering upscale hair care and beauty services and retail products. The Company's Company-owned business is primarily located mainly in strip center locations and Walmart Supercenters. The Company's Franchise business is primarily located in strip center locations, Walmart Supercenters and mall-based locations. During fiscal years 2018 and 2017 , the number of guest visits at the Company's company-owned salons approximated 50 and 57 million , respectively.
Financial information about our segments and geographic areas for fiscal years 2018 , 2017 , and 2016 are included in Note 14 to the Consolidated Financial Statements in Part II, Item 8, of this Form 10-K.
As we continue to evaluate our business and our mix of company-owned and franchise locations, future sales of company-owned salons to franchisees could impact our operations by decreasing total revenues and operating expenses.
4
Table of Contents
Industry Overview:
The hair salon market is highly fragmented, with the vast majority of locations independently owned and operated. However, the influence of salon chains, both franchised and company-owned, continues to grow within this market. Management believes salon chains will continue to have significant influence on this market and will continue to increase their presence.
In every area in which the Company has a salon, there are competitors offering similar hair care services and products at similar prices. The Company faces competition from chains, such as Great Clips, Fantastic Sams, Sport Clips and Ulta Beauty, independently owned salons, department store salons located within malls, in-home hair services, booth rentals and blow dry bars.
At the individual salon level, barriers to entry are low; however, barriers exist for chains to expand nationally due to the need to establish systems and infrastructure, to recruit franchisees, experienced field and salon management and stylists, and to lease quality sites. The principal factors of competition in the hair care category are quality and consistency of the guest experience, convenience, location and price. The Company continually strives to improve its performance in each of these areas and to create additional points of brand differentiation versus the competition.
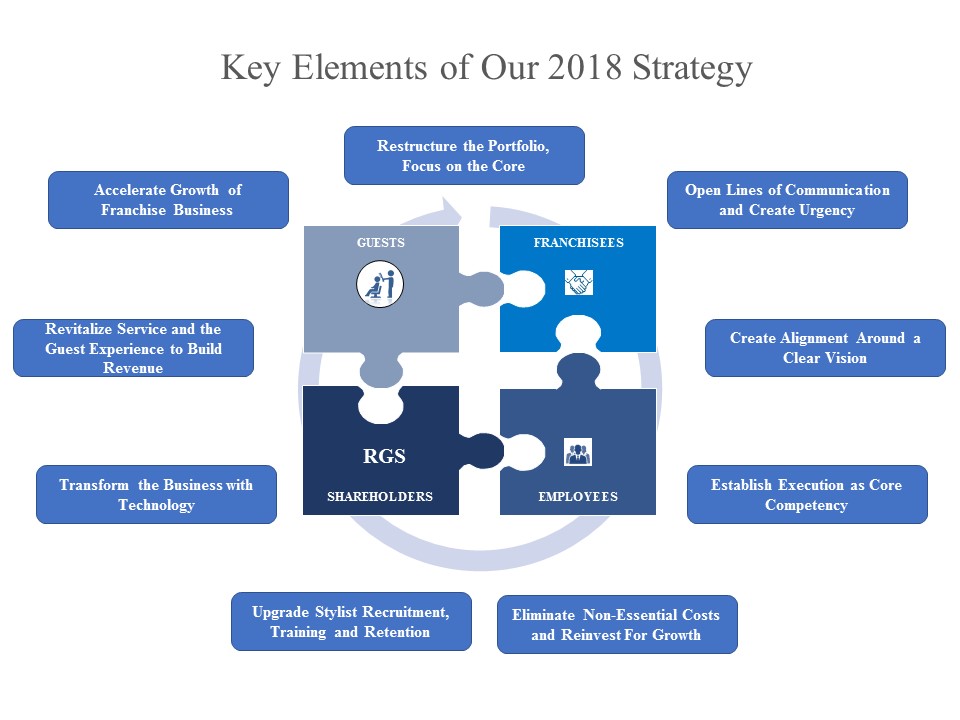
2018 Strategy:
The Company is focused on maximizing shareholder value. In order to successfully maximize shareholder value we place a balanced approach to our guests, employees and stylists, franchisees and shareholders. Our multi-year renewal strategy and key priorities are focused on loving our guests and stylists and initiatives to enhance shareholder value. Achieving our strategy requires a disciplined and thoughtful approach to investing and disinvesting in programming. We are focused on accelerating the growth of our franchise business, where we believe it enhances shareholder value, while materially improving the performance of our company-owned salons.
5
Table of Contents
In fiscal year 2018, the Company has executed on various management initiatives to help stabilize performance and establish a platform for longer term revenue and earnings growth in company-owned salons and expanding its franchise business in order to maximize shareholder value. The core components of the various management initiatives are focused on improving upon our performance by better aligning company resources to demand while continuing to provide an exceptional guest experience, simplification of our business to grow revenues and disinvestment of certain programs that do not create value. As part of the various management initiatives, the Company has appointed several new key executives and personnel, including President of Franchise (in fiscal year 2017), Chief Financial Officer, Chief Marketing Officer, Chief Human Resources Officer, General Counsel, Chief Technology Officer, Senior Vice President, Merchandising and Vice President Creative.
In order to continue providing an exceptional guest experience, we have invested in salon technology by launching SmartStyle online same-day check-in, which allows our guests in Walmart locations to find a location near them, view wait times, check-in via our website or mobile application and upgrading our point-of-sale (POS) hardware to facilitate an efficient guest experience within the salons and deploying tablets in corporate-owned salons to open a channel of direct communication with our stylists, including technical education.
To maximize shareholder value, we are focused on simplification, variable labor management, quality revenue growth, and the allocation of our capital to value-maximizing initiatives. Our business historically has been structured geographically. To simplify and better focus our business on our guests, effective August 1, 2017, we re-aligned the existing field leadership team into three distinct field organizations based on our core brands: SmartStyle, Supercuts and Signature Style. This enables our field leaders to focus on specific brands. We continue to focus on managing variable stylist staffing in our corporate salons to improve financial results and in certain markets may execute price increases in our company-owned salons.
We continue to evaluate our investments and disinvest in non-value generating programs while investing in other value generating initiatives. In January 2018, we closed 597 non-performing company-owned SmartStyle salons. The 597 non-performing salons generated negative cash flow of approximately $15 million during the twelve months ended September 30, 2017. This action will allow us to reallocate capital and human resources to strategically grow our remaining SmartStyle salons with creative new offerings. In addition, we repurposed certain corporate programs and have invested in our creative digital capabilities to re-position Regis as the leading operator of value brands and technical education. Furthermore, we have launched a national SmartStyle digital advertising campaign to drive traffic to our SmartStyle locations in Walmart Supercenters and leverage our relationship with Walmart. We will continue this evaluation as we make decisions in the business.
At the same time, we are making thoughtful decisions to accelerate the growth of our franchise business, if we believe it enhances shareholder value, including the promotion of Eric Bakken to President of our Franchise business. This strategic initiative is intended to facilitate an ongoing multi-year transformation of our operating platform that balances our commitment to high-performing company-owned salons while enabling strategic optionality and the ongoing growth of our franchise business, where we believe it enhances shareholder value. In October 2017, we sold substantially all of our mall-based salon business in North America, representing 858 salons, and substantially all of our previous International segment, representing 250 salons in the UK, to TBG, who operates these locations as franchise locations.
Guests
Among other factors, consistent delivery of an exceptional guest experience, haircut quality, convenience, competitive pricing, salon location, inviting salon appearance and atmosphere, differentiating benefits and guest experience elements and comprehensive retail assortments, all drive guest traffic and improve guest retention.
Guest Experience. Our portfolio of salon concepts enable our guests to select different service scheduling options based upon their preference. We believe that in the value category, the ability to serve walk-in appointments and minimize guest wait times is an essential element in delivering an efficient guest experience. Our mobile applications and online check-in capabilities allow us to capitalize on our guests' desire for convenience. We continue to focus on stylist staffing and retention, optimizing schedules and leveraging our POS systems to help us balance variable labor hours with guest traffic and manage guest wait times. In the Premium category, our salons generally schedule appointments in advance of service. Our salons are located in high-traffic strip centers, Walmart Supercenters and shopping malls, with guest parking and easy access, and are generally open seven days per week, offering guests a variety of convenient ways to fulfill their beauty needs.
Affordability. The Company strives to offer an exceptional value for its services. In the value category, our guests expect outstanding service at competitive prices. These expectations are met with average service transactions ranging from $19 to $21. During fiscal year 2018, we greatly reduced the complexity of the service offerings within our SmartStyle portfolio with the introduction of "Everyday Simple Pricing" while also introducing a new "Express Haircut" service targeted towards the
6
Table of Contents
male guests who shop at Walmart and simplified the service offerings within our Signature Style portfolio. Pricing decisions are considered on a salon level basis and established based on local conditions.
Salon Appearance and Atmosphere. The Company's salons range from 500 to 5,000 square feet, with the typical salon approximating 1,200 square feet. Our salon repairs and maintenance program is designed to ensure we invest in salon cleanliness and safety, as well as in maintaining the normal operation of our salons. Our annual capital expenditures include funds to refresh the appeal and comfort of our salons.
Retail Assortments. The Company's salons sell nationally recognized hair care and beauty products, as well as a complete assortment of owned brand products. The Company's stylists are compensated and regularly trained to sell hair care and beauty products to their guests. Additionally, guests are encouraged to purchase products after stylists demonstrate their efficacy by using them in the styling of our guests' hair. The top selling brands within the Company's retail assortment include Regis DESIGNLINE, Paul Mitchell, Biolage, Redken, Sexy Hair Concepts, Nioxin, Kenra, It's a 10, Total Results, and Tigi. We also continued to expand our e-commerce initiative to distribute our Regis DESIGNLINE brand through new distribution channels to supplement our existing in-salon sales and raise brand awareness.
Technology. Our point of sale (POS) systems have the ability to collect guest and transactional data and enable the Company to invest in guest relationship management, gaining insights into guest behavior, communicating with guests and incenting return visits. Leveraging this technology allows us to monitor guest retention and to survey our guests for feedback on improving the guest experience. Our mobile applications allow guests to view wait times and interact in other ways with salons. We are currently making further investments to improve the speed of our POS technology, improving the overall guest experience.
Marketing. We are investing in advertising to drive traffic. This includes leveraging advertising and media, guest relationship management programs, digital programs, one-on-one communications and local tactical efforts (e.g., couponing), among other programs. Traffic driving efforts are targeted vs. a one-size-fits-all approach. Annual advertising and promotional plans are based on seasonality, consumer mindset, competitive positioning and return on investment. In fiscal year 2018, we entered into an industry-exclusive, multi-year sponsorship between Supercuts and Major League Baseball and select local club partnerships. We continually reallocate marketing investments into opportunities we believe represent the highest return to our shareholders.
Stylists
Our organization depends on its stylists to help deliver great guest experiences.
Field Leadership. As of August 1, 2017, we reorganized our field leadership by brand. This change will simplify and better focus our business by re-aligning the existing field leaders into three distinct field organizations: SmartStyle, Supercuts and Signature Style. Previously, these field leaders were responsible for a variety of brands, with different business models, services, pay plans and guest expectations. Post-reorganization, each field leader is dedicated to a specific brand. We believe the new structure will further enable our field leadership to focus on quality guest experiences, enable improved salon execution, drive same-store sales traffic growth and simplify our operations.
Development of our field leaders is a high priority because stylists depend on their salons and field leaders for coaching, mentoring and motivation. Our training curriculum serves as the foundation for ongoing leadership development. Role clarity and talent assessments help us identify ways to develop and upgrade field leadership. Execution disciplines are used to drive accountability, execution and business performance. Incentives are designed to align field interests with those of the Company's shareholders by rewarding behaviors focused on revenue and EBITDA growth. This organization structure also provides a clear career path for our people who desire to ascend within the Company.
Technical Education. We place a tremendous amount of importance in ongoing development of our stylists' craft. We intend to be the industry leader in technical training, including the utilization of digital training. Our stylists deliver a superior experience for our guests when they are well trained technically and experientially. We employ technical trainers who provide new hire training for stylists joining the Company from beauty schools and training for all stylists in current beauty care and styling trends. We supplement internal training with targeted vendor training and external trainers who bring specialized expertise to our stylists. We utilize training materials to help all levels of field employees navigate the running of a salon and essential elements of guest service training within the context of brand positions.
Recruiting. Ensuring that we attract, train and retain our stylists is critical to our success. We compete with all service industries for our stylists; to that end, we continue to enhance our recruiting efforts across all levels within our organization and are focused on showing our stylists a path forward. We cultivate a pipeline of field leaders through succession planning and recruitment venues from within and outside the salon industry. We also leverage beauty school relationships and participate in job fairs and industry events.
7
Table of Contents
Technology. Our POS systems and salon workstations throughout North America enable communication with salons and stylists, delivery of online and digital training to stylists, salon level analytics on guest retention, wait times, stylist productivity, and salon performance. We are currently making further investments in our POS hardware and salon technology to improve the speed of our systems allowing for stylists to be more productive and improve overall guest and stylist satisfaction. We are also deploying tablets to salons to enhance the channel of communication with our stylists and enable digital training.
Salon Support
Our corporate headquarters is referred to as Salon Support. This acknowledges that loving our guests and stylists mandates a service-oriented, guest and stylist-focused mentality in supporting our field organization.
Organization. Salon Support and our associated priorities are aligned to our field organization to enhance the effectiveness and efficiency of the service we provide and optimize the guest experience.
Simplification. Our ongoing simplification efforts focus on improving the way we plan and execute across our portfolio of brands. Every program, communication, and report that complicates our operations and takes time away from our guests is being assessed for simplification or elimination. Simplifying processes and procedures around scheduling, inventory management, day-to-day salon execution, communication and reporting improve salon service. Our organization also remains focused on eliminating non-essential costs and on profit enhancing initiatives that do not harm the guest experience.
Salon Concepts:
The Company's salon concepts focus on providing high quality hair care services and professional hair care products. A description of the Company's salon concepts are listed below:
SmartStyle. SmartStyle salons offer a full range of custom styling, cutting, and hair coloring, as well as professional hair care products and are currently located exclusively in Walmart Supercenters. SmartStyle has primarily a walk-in guest base with value pricing. Service revenues represent approximately 69% of total company-owned SmartStyle revenues. Additionally, the Company has 561 franchised SmartStyle and Cost Cutters salons located in Walmart Supercenters.
Supercuts. Supercuts salons provide consistent, high quality hair care services and professional hair care products to its guests at convenient times and locations at value prices. This concept appeals to men, women, and children. Service revenues represent approximately 91% of total company-owned Supercuts revenues. Additionally, the Company has 1,739 franchised Supercuts locations throughout North America.
Signature Style. Signature Style salons are made up of acquired regional company-owned salon groups operating under the primary concepts of Hair Masters, Cool Cuts for Kids, Style America, First Choice Haircutters, Famous Hair, Cost Cutters, BoRics, Magicuts, Holiday Hair, Head Start, Fiesta Salons, Roosters and TGF, as well as other concept names. Most concepts offer a full range of custom hairstyling, cutting and coloring services, as well as professional hair care products. Service revenues represent approximately 89% of total company-owned Signature Style salons revenues. Additionally, the Company has 745 franchised locations of Signature Style salons.
MasterCuts. MasterCuts salons are a full service, mall-based salon group which focuses on the walk-in consumer who demands moderately priced hair care services. MasterCuts salons emphasize quality hair care services, affordable prices, and time saving services for the entire family. These salons offer a full range of custom styling, cutting and hair coloring services, as well as professional hair care products. The Company has 302 franchised MasterCuts locations throughout North America.
Regis Salons. Regis Salons are primarily mall-based, full service salons providing complete hair care and beauty services aimed at moderate to upscale, fashion conscious consumers. At Regis Salons both appointments and walk-in guests are common. These salons offer a full range of custom styling, cutting and hair coloring services, as well as professional hair care products. Regis Salons compete in their existing markets primarily by providing high quality services. Included within the Regis Salon concept are various other trade names, including Carlton Hair, Sassoon salons and academies, Hair by Stewarts, Hair Excitement, and Renee Beauty. The Company has 505 franchised Regis Salons locations throughout North America.
International Salons. International salons are now franchised locations operating in the United Kingdom and Germany primarily under the Supercuts, Regis, and Sassoon concepts. These salons offer similar levels of service as our North American salons. Sassoon is one of the world's most recognized names in hair fashion and appeals to women and men looking for a prestigious full service hair salon. Salons are usually located in prominent high-traffic locations and offer a full range of custom hairstyling, cutting and coloring services, as well as professional hair care products.
The tables on the following pages set forth the number of system-wide locations (company-owned and franchised) and activity within the various salon concepts.
8
Table of Contents
System-wide location counts
|
| June 30, | |||||||
|
| 2018 |
| 2017 |
| 2016 | |||
Company-owned salons: |
|
|
|
|
|
| |||
SmartStyle/Cost Cutters in Walmart stores |
| 1,660 | |
| 2,652 | |
| 2,683 | |
Supercuts |
| 928 | |
| 980 | |
| 1,053 | |
Signature Style |
| 1,378 | |
| 1,468 | |
| 1,604 | |
Mall locations (Regis and MasterCuts)(1) |
| - | |
| 898 | |
| 1,124 | |
Total North American salons |
| 3,966 | | | 5,998 | | | 6,464 | |
Total International salons(1)(2) |
| - | |
| 275 | |
| 328 | |
Total, Company-owned salons |
| 3,966 | | | 6,273 | | | 6,792 | |
as a percent of total Company-owned and Franchise salons |
| 49.1 | % |
| 70.3 | % |
| 73.1 | % |
Franchised salons: |
|
|
|
|
|
| |||
SmartStyle/Cost Cutters in Walmart stores(3) |
| 561 | |
| 176 | |
| 125 | |
Supercuts |
| 1,739 | |
| 1,687 | |
| 1,579 | |
Signature Style |
| 745 | |
| 770 | |
| 792 | |
Total non-mall franchise locations |
| 3,045 | |
| 2,633 | |
| 2,496 | |
Mall locations (Regis and MasterCuts)(1) |
| 807 | |
| - | |
| - | |
Total North American salons |
| 3,852 | | | 2,633 | | | 2,496 | |
Total International salons(1)(2) |
| 262 | |
| 13 | |
| - | |
Total, Franchised salons |
| 4,114 | | | 2,646 | | | 2,496 | |
as a percent of total Company-owned and Franchise salons |
| 50.9 | % |
| 29.7 | % |
| 26.9 | % |
Ownership interest locations: |
|
|
|
|
|
| |||
Equity ownership interest locations |
| 88 | |
| 89 | |
| 195 | |
Grand Total, System-wide |
| 8,168 | | | 9,008 | | | 9,483 | |
Constructed Locations (net relocations)
|
| Fiscal Years | |||||||
|
| 2018 |
| 2017 |
| 2016 | |||
Company-owned salons: |
|
|
|
|
|
| |||
SmartStyle/Cost Cutters in Walmart stores |
| 1 | |
| 37 | |
| 51 | |
Supercuts |
| - | |
| 2 | |
| 5 | |
Signature Style |
| 1 | |
| - | |
| 1 | |
Mall locations (Regis and MasterCuts)(1) |
| - | |
| - | |
| - | |
Total North American salons |
| 2 | | | 39 | | | 57 | |
Total International salons(1)(2) |
| 1 | |
| 2 | |
| 9 | |
Total, Company-owned salons |
| 3 | | | 41 | | | 66 | |
Franchised salons: |
|
|
|
|
|
| |||
SmartStyle/Cost Cutters in Walmart stores(3) |
| 1 | |
| - | |
| - | |
Supercuts |
| 68 | |
| 111 | |
| 146 | |
Signature Style |
| 8 | |
| 27 | |
| 24 | |
Mall locations (Regis and MasterCuts)(1) |
| - | |
| - | |
| - | |
Total North American salons |
| 77 | | | 138 | | | 170 | |
Total International salons(1)(2) |
| 2 | |
| 8 | |
| - | |
Total, Franchised salons |
| 79 | | | 146 | | | 170 | |
9
Table of Contents
Closed Locations
|
| Fiscal Years | |||||||
|
| 2018 |
| 2017 |
| 2016 | |||
Company-owned salons: |
|
| |
|
| |
|
| |
SmartStyle/Cost Cutters in Walmart stores(4) |
| (605 | ) |
| (11 | ) |
| (7 | ) |
Supercuts |
| (20 | ) |
| (51 | ) |
| (17 | ) |
Signature Style |
| (76 | ) |
| (123 | ) |
| (77 | ) |
Mall locations (Regis and MasterCuts)(1) |
| (14 | ) |
| (226 | ) |
| (103 | ) |
Total North American salons |
| (715 | ) | | (411 | ) | | (204 | ) |
Total International salons(1)(2) |
| (14 | ) |
| (50 | ) |
| (37 | ) |
Total, Company-owned salons |
| (729 | ) | | (461 | ) | | (241 | ) |
Franchised salons: |
|
|
|
|
|
| |||
SmartStyle/Cost Cutters in Walmart stores(3) |
| (4 | ) |
| (6 | ) |
| (2 | ) |
Supercuts |
| (72 | ) |
| (44 | ) |
| (22 | ) |
Signature Style |
| (40 | ) |
| (43 | ) |
| (32 | ) |
Mall locations (Regis and MasterCuts)(1) |
| (63 | ) |
| - | |
| - | |
Total North American salons |
| (179 | ) | | (93 | ) | | (56 | ) |
Total International salons(1)(2) |
| (15 | ) |
| - | |
| - | |
Total, Franchised salons |
| (194 | ) | | (93 | ) | | (56 | ) |
Conversions (including net franchisee transactions)(5)
|
| Fiscal Years | |||||||
|
| 2018 |
| 2017 |
| 2016 | |||
Company-owned salons: |
|
|
|
|
|
| |||
SmartStyle/Cost Cutters in Walmart stores |
| (388 | ) |
| (57 | ) |
| - | |
Supercuts |
| (32 | ) |
| (24 | ) |
| (27 | ) |
Signature Style |
| (15 | ) |
| (13 | ) |
| (31 | ) |
Mall locations (Regis and MasterCuts)(1) |
| (884 | ) |
| - | |
| - | |
Total North American salons |
| (1,319 | ) | | (94 | ) | | (58 | ) |
Total International salons(1)(2) |
| (262 | ) |
| (5 | ) |
| - | |
Total, Company-owned salons(6) |
| (1,581 | ) | | (99 | ) | | (58 | ) |
Franchised salons: |
|
|
|
|
|
| |||
SmartStyle/Cost Cutters in Walmart stores(3) |
| 388 | |
| 57 | |
| - | |
Supercuts |
| 56 | |
| 41 | |
| 62 | |
Signature Style |
| 7 | |
| (6 | ) |
| (4 | ) |
Mall locations (Regis and MasterCuts)(1) |
| 870 | |
| - | |
| - | |
Total North American salons |
| 1,321 | | | 92 | | | 58 | |
Total International salons(1)(2) |
| 262 | |
| 5 | |
| - | |
Total, Franchised salons(6) |
| 1,583 | | | 97 | | | 58 | |
_______________________________________________________________________________
(1) | In October 2017, the Company sold substantially all of its mall-based salon business in North America, representing 858 salons, and substantially all of its previous International segment, representing approximately 250 salons in the UK, to TBG, who operates these locations as franchise locations. The mall-based business and the previous International segment have been reported as a discontinued operation. See Note 2 to the Consolidated Financial Statements in Part II, Item 8, of this Form 10-K for further discussion. |
10
Table of Contents
(2) | Canadian and Puerto Rican salons are included in the North American salon totals. |
(3) | Franchised SmartStyle salons in Walmart stores includes salons originally opened as Magicuts locations in Canadian Walmart stores that were rebranded to SmartStyle. |
(4) | In January 2018 , the Company closed 597 non-performing company-owned SmartStyle locations. |
(5) | During fiscal years 2018 , 2017 , and 2016 , the Company acquired zero , one , and one salon locations, respectively, from franchisees. During fiscal years 2018 , 2017 , and 2016 , the Company sold 1,581 , 100 , and 59 salon locations, respectively, to franchisees. |
(6) | During fiscal year 2018 , two conversions were completed that were incomplete as of June 30, 2017. |
Salon Franchising Program:
General. We have various franchising programs supporting our 4,114 franchised salons as of June 30, 2018 , consisting mainly of Supercuts, SmartStyle, Cost Cutters, Regis salons, MasterCuts, First Choice Haircutters, Roosters, Magicuts salons. These salons have been included in the discussions regarding salon counts and concepts.
We provide our franchisees with a comprehensive system of business training, stylist education, site approval and lease negotiation, construction management services, professional marketing, promotion, and advertising programs, and other forms of on-going support designed to help franchisees build successful businesses.
Standards of Operations. The Company does not control the day-to-day operations of its franchisees, including employment, benefits and wage determination, establishing prices to charge for products and services, business hours, personnel management, and capital expenditure decisions. However, the franchise agreements afford certain rights to the Company, such as the right to approve locations, suppliers and the sale of a franchise. Additionally, franchisees are required to conform to the Company's established operational policies and procedures relating to quality of service, training, salon design and decor, and trademark usage. The Company's field personnel make periodic visits to franchised salons to ensure they are operating in conformity with the standards for each franchising program. All of the rights afforded to the Company with regard to franchised operations allow the Company to protect its brands, but do not allow the Company to control the franchise operations or make decisions that have a significant impact on the success of the franchised salons. The Company's franchise agreements do not give the Company any right, ability or potential to determine or otherwise influence any terms and/or conditions of employment of franchisees' employees (except for those, if any, that are specifically related to quality of service, training, salon design, decor, and trademark usage), including, but not limited to, franchisees' employees' wages and benefits, hours of work, scheduling, leave programs, seniority rights, promotional or transfer opportunities, layoff/recall arrangements, grievance and dispute resolution procedures, dress code, and/or discipline and discharge.
Franchise Terms. Pursuant to a franchise agreement with the Company, each franchisee pays an initial fee for each store and ongoing royalties to the Company. In addition, for most franchise concepts, the Company collects advertising funds from franchisees and administers the funds on behalf of the concepts. Franchisees are responsible for the costs of leasehold improvements, furniture, fixtures, equipment, supplies, inventory, payroll costs and certain other items, including initial working capital. The majority of franchise agreements provide the Company a right of first refusal if the store is to be sold and the franchisee must obtain the Company's approval in all instances where there is a sale of a franchise location.
Additional information regarding each of the major franchised brands is listed below:
Supercuts
Supercuts franchise agreements have a perpetual term, subject to termination of the underlying lease agreement or termination of the franchise agreement by either the Company or the franchisee. All new franchisees enter into development agreements, which give them the right to enter into a defined number of franchise agreements. These franchise agreements are site specific. The development agreement provides limited territorial protection for the stores developed under those franchise agreements. Older franchisees have grandfathered expansion rights which allow them to develop stores outside of development agreements and provide them with greater territorial protections in their markets. The Company has a comprehensive impact policy that resolves potential conflicts among Supercuts franchisees and/or the Company's Supercuts locations regarding proposed store sites.
SmartStyle and Cost Cutters in Walmart Supercenters
The majority of existing SmartStyle and Cost Cutters franchise agreements for salons located in Walmart Supercenters have a five year term with a five year option to renew. The franchise agreements are site specific. As announced in January 2017, this business grew primarily through conversions from corporate to franchise-owned salons.
11
Table of Contents
Cost Cutters (not located in Walmart Supercenters), First Choice Haircutters and Magicuts
The majority of existing Cost Cutters franchise agreements have a 15 year term with a 15 year option to renew (at the option of the franchisee), while the majority of First Choice Haircutters franchise agreements have a ten year term with a five year option to renew. The majority of Magicuts franchise agreements have a term equal to the greater of five years or the current initial term of the lease agreement with an option to renew for two additional five year periods. The current franchise agreement is site specific. Franchisees may enter into development agreements with the Company which provide limited territorial protection.
Roosters Men's Grooming Center
Roosters franchise agreements have a ten-year term with a ten-year option to renew (at the option of the franchisee). New franchisees enter into a franchise agreement concurrent with the opening of their first store, along with a development agreement under which they have the right to open two additional locations.
Regis and MasterCuts
The Regis and MasterCuts franchise agreements have a ten-year term with a ten-year option to renew (at the option of the franchisee). The franchise agreements are site specific.
Franchisee Training. The Company provides new franchisees with training, focusing on the various aspects of salon management, including operations, personnel management training, marketing fundamentals, and financial controls. Existing franchisees receive training, counseling and information from the Company on a regular basis. The Company provides salon managers and stylists with technical training for franchisees.
Salon Markets and Marketing:
Company-Owned Salons
The Company utilizes various marketing vehicles for its salons, including traditional advertising, guest relationship management, digital marketing programs and promotional/pricing based programs. Most marketing vehicles including radio, print, online, digital and television advertising are developed and supervised at the Company's Salon Support headquarters. The Company reviews its brand strategy with the intent to create more clear communication platforms, identities and differentiation points for our brands to drive consumer preference.
Franchised Salons
Most franchise concepts maintain separate advertising funds that provide comprehensive marketing and sales support for each system. The Supercuts advertising fund is the Company's largest advertising fund and is administered by a council consisting of primarily franchisee representatives. The council has overall control of the advertising fund's expenditures and operates in accordance with terms of the franchise operating and other agreements. All stores, company-owned and franchised, contribute to the advertising funds. Depending on the brand, the funds are allocated to the brand contributing market for media placement and local marketing activities or to the creation of national advertising and system-wide activities.
Affiliated Ownership Interest:
The Company maintains a noncontrolling 54.6% ownership interest in Empire Education Group, Inc. ("EEG"), which is accounted for as an equity method investment. See Note 1 to the Consolidated Financial Statements in Part II, Item 8, of this Form 10-K. EEG operates accredited cosmetology schools. Contributing the Company's beauty schools in fiscal 2008 to EEG leveraged EEG's management expertise, while enabling the Company to maintain a vested interest in the beauty school industry. Additionally, we utilize our EEG relationship to recruit stylists straight from beauty school.
Corporate Trademarks:
The Company holds numerous trademarks, both in the United States and in many foreign countries. The most recognized trademarks are "SmartStyle®," "Supercuts®," "MasterCuts®," "Regis Salons®," "Cost Cutters®," "Hair Masters®," "First Choice Haircutters®," and "Magicuts®."
"Sassoon" is a registered trademark of Procter & Gamble. The Company has a license agreement to use the Sassoon name for existing salons and academies and new salon development.
Corporate Employees:
As of June 30, 2018 , the Company had approximately 27,000 full and part-time employees worldwide, of which approximately 24,000 employees were located in the United States. The Company believes its employee relations are amicable.
12
Table of Contents
Executive Officers:
Information relating to the Executive Officers of the Company follows:
Name |
| Age |
| Position | |
Hugh Sawyer |
| 64 | |
| President and Chief Executive Officer |
Andrew Lacko |
| 48 | |
| Executive Vice President and Chief Financial Officer |
Eric Bakken |
| 51 | |
| Executive Vice President and President of Franchise |
Chad Kapadia |
| 49 | |
| Executive Vice President and Chief Technology Officer |
Jim Lain |
| 54 | |
| Executive Vice President and Chief Operating Officer |
Laura Alexander |
| 35 | |
| Senior Vice President, Merchandise |
Rachel Endrizzi |
| 42 | |
| Senior Vice President and Chief Marketing Officer |
Shawn Moren |
| 51 | |
| Senior Vice President and Chief Human Resources Officer |
Amanda Rusin |
| 36 | |
| Senior Vice President and General Counsel and Secretary |
Hugh Sawyer has served as President and Chief Executive Officer, as well as a member of the Board of Directors, since April 2017. Before joining Regis Corporation, he served as a Managing Director of Huron Consulting Group Inc. ("Huron") from January 2010 to April 2017. While at Huron, he served as Interim President and CEO of JHT Holdings, Inc. from January 2010 to March 2012, as the Chief Administrative Officer of Fisker Automotive Inc. from January 2013 to March 2013 and as Chief Restructuring Officer of Fisker Automotive from March 2013 to October 2013, and as Interim President of Euramax International, Inc. from February 2014 to August 2015. Mr. Sawyer has served as President or CEO of nine companies (including Regis) and on numerous Boards of Directors. In February 2018, Mr. Sawyer was appointed to the Board of Directors of Huron.
Andrew Lacko was appointed to Executive Vice President and Chief Financial Officer in July 2017. Before joining Regis Corporation, he served as Senior Vice President, Global Financial Planning, Analysis and Corporate Development, of Hertz Global Holdings, Inc. since 2015 and as Vice President - Financial Planning and Analysis of Hertz Global Holdings, Inc. beginning in January 2014. Before joining Hertz, Mr. Lacko served as Vice President, Financial Planning and Analysis at First Data Corp. from 2013 to January 2014. Prior to that, Mr. Lacko served in senior financial planning and analysis and investor relations roles at Best Buy Co., Inc. from 2008 to 2013.
Eric Bakken has served as President of Franchise and Executive Vice President since April 2017. He also served as Executive Vice President, Chief Administrative Officer, Corporate Secretary and General Counsel from April 2013 to January 2018. He also served as Interim Chief Financial Officer from September 2016 to January 2017. He served as Executive Vice President, General Counsel and Business Development and Interim Corporate Chief Operating Officer from 2012 to April 2013, and performed the function of interim principal executive officer between July 2012 and August 2012. Mr. Bakken joined the Company in 1994 as a lawyer and became General Counsel in 2004.
Chad Kapadia was appointed to Executive Vice President and Chief Technology Officer in June 2018. Before joining Regis Corporation, he served as Head of Engineering at Target Corporation's New Ventures and Accelerators. Prior to Target Corporation, Mr. Kapadia served in technology positions of increasing responsibility including Chief Technology Officer and Product Head at Swissclear Global, Inc. and as an Engineering Leader and founding member of Netflix, Inc.'s Content Platform Engineering and Media Pipeline.
Jim Lain has served as Executive Vice President and Chief Operating Officer since November 2013. Before joining Regis Corporation, he served as Vice President at Gap, Inc. from August 2006 to November 2013.
Laura Alexander was appointed as Senior Vice President, Merchandise in June 2018. Ms. Alexander served as Vice President, Walmart Relations and SmartStyle Franchise Administration from July 2017 to June 2018. Ms. Alexander joined the Company in 2012 and served in various roles within the legal, franchise and Walmart Relations departments.
Rachel Endrizzi has served as Senior Vice President and Chief Marketing Officer since May 2017. She joined Regis Corporation in 2004 and most recently served as Vice President, Branding and Marketing Communications.
Shawn Moren was appointed to Senior Vice President and Chief Human Resources Officer in August 2017. Before joining Regis Corporation, she served as Senior Vice President, Human Resources, for Bluestem Group, Inc. from July 2013 to August 2017. Prior to that, she served as Vice President, Human Resources, Retail, Supply Chain & Corporate for SUPERVALU during 2013 and as Group Vice President, Human Resources for SUPERVALU from March 2012 to March 2013.
13
Table of Contents
Amanda Rusin was appointed as Senior Vice President and General Counsel and Secretary in January 2018. Before joining Regis Corporation, she served as Assistant General Counsel at Polaris Industries, Inc. from September 2015 to December 2017 and Senior Attorney at Polaris Industries, Inc. from June 2014 to September 2015. Before joining Polaris Industries, Inc. Ms. Rusin served as Commercial Director at Cargill, Incorporated from August 2013 to May 2014 and Attorney at Cargill, Incorporated from June 2008 to August 2013.
Governmental Regulations:
The Company is subject to various federal, state, local and provincial laws affecting its business as well as a variety of regulatory provisions relating to the conduct of its beauty related business, including health and safety.
In the United States, the Company's franchise operations are subject to the Federal Trade Commission's Trade Regulation Rule on Franchising (the FTC Rule) and by state laws and administrative regulations that regulate various aspects of franchise operations and sales. The Company's franchises are offered to franchisees by means of an offering circular/disclosure document containing specified disclosures in accordance with the FTC Rule and the laws and regulations of certain states. The Company has registered its offering of franchises with the regulatory authorities of those states in which it offers franchises and in which such registration is required. State laws that regulate the franchisor-franchisee relationship presently exist in a substantial number of states and, in certain cases, apply substantive standards to this relationship. Such laws may, for example, require that the franchisor deal with the franchisee in good faith, may prohibit interference with the right of free association among franchisees and may limit termination of franchisees without payment of reasonable compensation. The Company believes that the current trend is for government regulation of franchising to increase over time. However, such laws have not had, and the Company does not expect such laws to have, a significant effect on the Company's operations.
In Canada, the Company's franchise operations are subject to franchise laws and regulations in the provinces of Ontario, Alberta, Manitoba, New Brunswick and Prince Edward Island. The offering of franchises in Canada occurs by way of a disclosure document, which contains certain disclosures required by the applicable provincial laws. The provincial franchise laws and regulations primarily focus on disclosure requirements, although each requires certain relationship requirements such as a duty of fair dealing and the right of franchisees to associate and organize with other franchisees.
The Company believes it is operating in substantial compliance with applicable laws and regulations governing all of its operations.
The Company maintains an ownership interest in EEG. Beauty schools derive a significant portion of their revenue from student financial assistance originating from the U.S. Department of Education's Title IV Higher Education Act of 1965. For the students to receive financial assistance at the school, the beauty schools must maintain eligibility requirements established by the U.S. Department of Education.
Financial Information about Foreign and North American Operations
Financial information about foreign and North American markets is incorporated herein by reference to Management's Discussion and Analysis of Financial Condition and Results of Operations in Part II, Item 7 and segment information in Note 14 to the Consolidated Financial Statements in Part II, Item 8 of this Form 10-K.
Available Information
The Company is subject to the informational requirements of the Securities and Exchange Act of 1934, as amended (Exchange Act). The Company therefore files periodic reports, proxy statements and other information with the Securities and Exchange Commission (SEC). Such reports may be obtained by visiting the Public Reference Room of the SEC at 100 F Street NE, Washington, DC 20549, or by calling the SEC at 1-800-SEC-0330. In addition, the SEC maintains an internet site ( www.sec.gov ) that contains reports, proxy and information statements and other information.
Financial and other information can be accessed in the Investor Information section of the Company's website at www.regiscorp.com . The Company makes available, free of charge, copies of its annual report on Form 10-K, quarterly reports on Form 10-Q, current reports on Form 8-K and amendments to those reports filed or furnished pursuant to Section 13(a) or 15(d) of the Exchange Act as soon as reasonably practicable after filing such material electronically or otherwise furnishing it to the SEC.
14
Table of Contents
Item 1A. Risk Factors
We are in the process of implementing a new strategy, priorities and initiatives and any inability to execute and evolve our strategy over time could adversely impact our financial condition and results of operations.
Hugh E. Sawyer became our President and Chief Executive Officer and a member of our Board of Directors in April 2017. The transition has resulted in, and could further result in, changes in business strategy and operations as Mr. Sawyer seeks to continue to improve the performance of company-owned salons while at the same time accelerate the growth of our franchise model. As part of our strategic transformation, we reorganized our field structure by brand/concept; sold substantially all of our mall-based salon business in North America and substantially all of our previous International segment in the United Kingdom to the Beautiful Group ("TBG"), which operates these locations as franchised locations; closed 597 non-performing company-owned SmartStyle salons (including 8 TGF salons) as part of the operational restructuring of the SmartStyle portfolio; and implemented various initiatives intended to stabilize performance and establish a platform for long-term growth, including investments in digital marketing and mobile applications designed to improve the guest experience and a multi-year sponsorship with Major League Baseball for our Supercuts® brand designed to support the growth of both company-owned and franchised Supercuts salons.
Our success depends, in part, on our ability to grow our franchise model, including attracting and retaining qualified franchisees. We announced plans in fiscal year 2017 to expand the franchise side of our business, including by selling certain company-owned salons to franchisees over time. In January 2017, we began franchising the SmartStyle brand throughout the U.S. for the first time. In October 2017, we sold substantially all of our mall-based salons, consisting of 858 Regis Salons and MasterCuts locations, and substantially all of our International business to a new single franchisee, TBG. Growth and development of our franchise model is ongoing. During fiscal year 2018, excluding the TBG transactions, new and existing franchisees opened 525 salons, of which 77 were organic and 448 were the sale of a company-owned salon to a franchisee. The potential growth of our franchise model will take time to execute and may create additional costs, expose us to additional legal and compliance risks, cause disruption to our current business and impact our short-term operating results. Further, in order to enhance services to its franchisees, the Company may need to invest in certain new capabilities and/or services.
Our success also depends, in part, on our ability to improve sales, as well as both cost of service and product and operating margins at our company-owned salons. Same-store sales are affected by average ticket and same-store guest visits. A variety of factors affect same-store guest visits, including the guest experience, staffing and retention of stylists and salon leaders, price competition, fashion trends, competition, current economic conditions, product assortment, customer traffic at Walmart where our SmartStyle locations reside, marketing programs and weather conditions. These factors may cause our same-store sales to differ materially from prior periods and from our expectations.
In addition to a new President and Chief Executive Officer, since April 2017 we have appointed a new President of Franchise, Chief Financial Officer, Chief Marketing Officer, Chief Human Resources Officer, General Counsel, Chief Technology Officer, Senior Vice President of Merchandise and Vice President Creative. The process of integrating new talent and implementing any new strategies, priorities and initiatives involves inherent risks, including timing risks, and the changes we implement could harm our culture, relationships with customers, franchisees, suppliers, employees or other third parties and may be disruptive to our business. While we believe the pursuit of these changes will have a positive effect on our business in the long term, we cannot provide assurance that these changes will lead to the desired results. If we do not effectively and successfully execute on these changes, it could have a material adverse effect on our business.
It is important for us and our franchisees to attract, train and retain talented stylists and salon leaders.
Guest loyalty is dependent upon the stylists who serve our guests and the customer experience in our company-owned and franchised salons. Qualified, trained stylists are a key to a memorable guest experience that creates loyal customers. In order to profitably grow our business, it is important for our company-owned salons and franchisees to attract, train and retain talented stylists and salon leaders and to adequately staff our salons. Because the salon industry is highly fragmented and comprised of many independent operators, the market for stylists is highly competitive. In addition, increases in minimum wage requirements may impact the number of stylists considering careers outside the beauty industry. There is also a low unemployment rate and high competition for employees in the service industry, particularly licensed employees, which drives increased competition for stylists and could result in retention and hiring difficulties. In some markets, we and our franchisees have experienced a shortage of qualified stylists. Offering competitive wages, benefits, education and training programs are important elements to attracting and retaining qualified stylists. In addition, due to challenges facing the for-profit education industry, cosmetology schools, including our joint venture EEG, have experienced declines in enrollment, revenues and profitability in recent years. If the cosmetology school industry sustains further declines in enrollment or some schools close entirely, or if stylists leave the beauty industry, we expect that we and our franchisees would have increased difficulty staffing our salons in some markets. If our company-owned salons or franchisees are not successful in attracting, training and retaining
15
Table of Contents
stylists or in staffing our salons, our same-store sales or the performance of our franchise business could experience periods of variability or sales could decline and our results of operations could be adversely affected.
Our continued success depends in part on the success of our franchisees, who operate independently.
As of June 30, 2018, approximately 50% of our salons were franchised locations and we intend to expand our number of franchised locations, where we believe it will enhance shareholder value. We derive revenues associated with our franchised locations from royalties, service fees and product sales to franchised locations. Our financial results are therefore dependent in part upon the operational and financial success of our franchisees. As we increase our focus on our franchise business, our dependence on our franchisees grows.
We have limited control over how our franchisees' businesses are run. Though we have established operational standards and guidelines, they own, operate and oversee the daily operations of their salon locations. If franchisees do not successfully operate their salons in compliance with our standards, our brand reputation and image could be harmed and our financial results could be affected. We could experience greater risks as the scale of our franchise owners increases. Further, some franchise owners may not successfully execute the turnaround of under-performing salons which we have transferred to them.
In addition, our franchisees are subject to the same general economic risks as our Company, and their results are influenced by competition for both guests and stylists, market trends, price competition and disruptions in their markets due to severe weather and other external events. Like us, they rely on external vendors for some critical functions and to protect their company data. They may also be limited in their ability to open new locations by an inability to secure adequate financing, especially since many of them are small businesses with much more limited access to financing than our Company, or by the limited supply of favorable real estate for new salon locations. They may experience financial distress as a result of over-leveraging, which could negatively affect our operating results as a result of delayed payments to us. The bankruptcy of a franchisee could also expose us to liability under leases, which are generally sub-leased by us to our franchisees.
A deterioration in the financial results of our franchisees, or a failure of our franchisees to renew their franchise agreements, could adversely affect our operating results through decreased royalty payments, fees and product revenues.
Acceleration of the sale of certain company-owned salons to franchisees may not improve our operating results and could cause operational difficulties.
During fiscal year 2018, we accelerated the sale of company-owned salons to new and existing franchisees. During fiscal year 2018 we entered into agreements to sell 448 of our company-owned salons across our brands to new and existing franchisees (of which 388 were SmartStyle salons).
Success will depend on a number of factors, including franchisees' ability to improve the results of the salons they purchase and their ability and interest in continuing to grow their business. We also must continue to attract qualified franchisees and work with them to make their business successful. Moving a salon from company-owned to franchise-owned is expected to reduce our consolidated revenues, increase our royalty revenue and decrease our operating costs; however, the actual benefit from a sale is uncertain and may not be sufficient to offset the loss of revenues.
In addition, challenges in supporting our expanding franchise system could cause our operating results to suffer. If we are unable to effectively select and train new franchisees and support and manage our growing franchisee base, it could affect our brand standards, cause disputes between us and our franchisees, and potentially lead to material liabilities.
TBG's inability to transition and operate its salons successfully could adversely affect our business, financial condition and results of operations or cash flows, and could prevent the transaction from delivering the anticipated benefits and enhancing shareholder value.
In October 2017, we sold substantially all of our mall-based salon business in North America and substantially all of our International segment to TBG, an affiliate of Regent, which is operating them as a franchisee. The success of TBG depends upon a number of factors that are beyond our control, including, among other factors, market conditions, retail trends in mall locations, industry trends, stylist recruiting and retention, customer traffic, the capabilities of TBG, TBG's ability to maintain adequate working capital, technology and landlord issues. In particular, we remain liable under the leases for certain of these salons until the end of their various terms, and we could be required to make payments if TBG fails to do so, which could adversely impact our results of operations or cash flows.
Under the agreements with TBG, we receive fees for certain services, fees for certain transition services, and product sales revenue; however, the amount of these fees is tied to the success of the business as operated by TBG. As of June 30, 2018, it is taking longer than we originally anticipated for TBG to implement the changes intended to improve the business of the mall-based salons and the International business, and there is no assurance that TBG will be successful in doing so in the future. In addition, several of the services we provided to TBG under the transition services agreement ended in the fourth quarter of
16
Table of Contents
fiscal year 2018, thereby reducing this current income stream. We anticipate we will attempt to reduce related general and administrative costs and other associated expenses in connection with providing these transition services; however it will take time for us to reduce all of these costs even though the related income stream has ended.
In connection with the purchase agreements, subleases, transition services and other related agreements with the Company, from time to time, TBG has been delinquent on its payments to the Company and to third parties. It is foreseeable that TBG may in the future continue to have cash flow and working capital issues, which could have significant adverse impacts on our business, including a need to record reserves on receivables from TBG. In August 2018, we restructured certain payments due to us from TBG in the form of promissory notes representing approximately $11.7 million in working capital receivables and $8.0 million in accounts receivables, a majority of which was for inventory payables. All notes have a maturity date of August 2, 2020. Under the working capital notes, if no default has occurred under such notes and certain other conditions are met, such notes will be forgiven as of the maturity date and will be exchanged for a three-year contingent payment right that is payable to us upon the occurrence of certain TBG monetization events. Based on the likelihood of future forgiveness of the working capital notes, the Company recorded a full reserve against such notes. Should the Company need to record reserves against its current and future receivables from TBG or their ability to meet the requirements of the promissory notes, these reserves would be recorded within general and administrative expenses. TBG may in the future need to restructure (operationally, legally, or otherwise) these businesses, operations and obligations. The Company has certain rights and remedies under the various agreements with TBG, including, but not limited to, utilization of collateral, litigation, reversion of the leases in respect of certain divested salons back to the Company and enforcement of a guarantee. If the divested salons were to revert, we may have difficulty supporting the businesses because of the challenges involved in quickly and sufficiently staffing the salons and corporate functions to support an influx in company-owned stores, addressing the stores' performance issues, implementing required data privacy requirements in the United Kingdom and resuming support for the salons' IT and marketing requirements. Overall, TBG's inability to transition and operate the salons successfully, or its ability to make payments when due under the promissory notes or otherwise under the franchise agreements and transition service agreements, could adversely affect our business, including increased litigation risks, financial condition and results of operations or cash flows, and could prevent the transaction from delivering the anticipated benefits and shareholder value.
The continued unit growth and operation of the SmartStyle business is dependent on our relationship with Walmart.
At June 30, 2018, we had 2,221 SmartStyle or Cost Cutters salons within Walmart locations, including 2 salons opened during fiscal year 2018 (net of relocations). Walmart is by far our largest landlord, and we are Walmart's largest tenant. Our business within each of those 2,221 salons relies primarily on the traffic of visitors to the Walmart in which it is located, so our success is tied to Walmart's success in bringing shoppers into their stores. We have limited control over the locations and markets in which we open new SmartStyles, as we only have potential opportunities in locations offered to us by Walmart. Furthermore, Walmart has the right to close up to 100 of our salons per year for any reason, upon payment of certain penalties; to terminate lease agreements for breach, such as if we failed to conform with required operating hours, subject to a notice and cure period; and to terminate the lease if the Walmart store in which it sits is closed. During fiscal year 2017, we began franchising select SmartStyle branded locations. Future franchising activity will require the approval of Walmart. Operating both company-owned and franchised SmartStyles adds complexity in overseeing franchise compliance and coordination with Walmart.
Our future growth and profitability may depend, in part, on our ability to build awareness and drive traffic with advertising and marketing efforts, and on delivering a quality guest experience to drive repeat visits to our salons.
Our future growth and profitability may depend on the effectiveness, efficiency and spending levels of our marketing and advertising efforts to drive awareness and traffic to our salons. In addition, delivering a quality guest experience is crucial in order to drive repeat visits to our salons. We are developing our marketing and advertising strategies, including national and local campaigns, to build awareness, drive interest, consideration and traffic to our salons. We are also focusing on improving guest experiences to provide brand differentiation and preference, and to ensure we meet our guests' needs. If our marketing, advertising and improved guest experience efforts do not generate sufficient customer traffic and repeat visits to our salons, our business, financial condition and results of operations may be adversely affected.
Changes in regulatory and statutory laws, such as increases in the minimum wage and changes that make collective bargaining easier, and the costs of compliance and non-compliance with such laws, may result in increased costs to our business.
With 8,168 locations and approximately 27,000 employees worldwide, our financial results can be adversely impacted by regulatory or statutory changes in laws. Due to the number of people we employ, laws that increase minimum wage rates, employment taxes, overtime requirements or costs to provide employee benefits or administration may result in additional costs to our Company.
17
Table of Contents
A number of U.S. states, Canadian provinces and municipalities in which we do business have recently increased or are considering increasing the minimum wage, with increases generally phased over several years depending upon the size of the employer. Increases in minimum wages and overtime pay increase our costs, and our ability to offset these increases through price increases may be limited. In fact, increases in minimum wages increased our costs over the last five years. In addition, a growing number of states, provinces, and municipalities have passed or are considering requirements for paid sick leave, family leave, predictive scheduling (which imposes penalties for changing an employee's shift as it nears), and other requirements that increase the administrative complexity of managing our workforce. Finally, changes in labor laws, such as recent legislation in Ontario and Alberta designed to facilitate union organizing, could increase the likelihood of some of our employees being subjected to greater organized labor influence. If a significant portion of our employees were to become unionized, it would have an adverse effect on our business and financial results.
Increases in minimum wages, administrative requirements and unionization could also have an adverse effect on the performance of our franchisees, especially if our franchisees are treated as a "joint employer" with us by the National Labor Relations Board (NLRB) or as a large employer under minimum wage statutes because of their affiliation with us. In addition, we must comply with state employment laws, including the California Labor Code, which has stringent requirements and penalties for non-compliance.
Various state and federal laws govern our relationship with our franchisees and our potential sale of a franchise. If we fail to comply with these laws, we could be liable for damages to franchisees and fines or other penalties. A franchisee or government agency may bring legal action against us based on the franchisee/franchisor relationship. Also, under the franchise business model, we may face claims and liabilities based on vicarious liability, joint-employer liability, or other theories or liabilities. All such legal actions not only could result in changes to laws and interpretations, making it more difficult to appropriately support our franchisees and, consequently, impacting our performance, but, also, such legal actions could result in expensive litigation with our franchisees or government agencies that could adversely affect both our profits and our important relations with our franchisees. In addition, other regulatory or legal developments may result in changes to laws or the franchisor/franchisee relationship that could negatively impact the franchise business model and, accordingly, our profits.
In addition to employment and franchise laws, we are also subject to a wide range of federal, state, provincial and local laws and regulations, including those affecting public companies, product manufacture and sale, and governing the franchisor-franchisee relationship, in the jurisdictions in which we operate. Compliance with new, complex and changing laws may cause our expenses to increase. In addition, any non-compliance with laws or regulations could result in penalties, fines, product recalls and enforcement actions or otherwise restrict our ability to market certain products or attract or retain employees, which could adversely affect our business, financial condition and results of operations.
Our success depends substantially on the value of our brands.
Our success is dependent, in large part, upon our ability to maintain and enhance the value of our brands, our customers' connection to our brands, and a positive relationship with our franchisees. Brand value can be severely damaged even by isolated incidents, particularly if the incidents receive considerable negative publicity, including via social media, or result in litigation. Some of these incidents may relate to the way we manage our relationship with our franchisees, our growth strategies, our development efforts, or the ordinary course of our, or our franchisees', business. Other incidents may arise from events that are or may be beyond our ability to control and may damage our brands, such as actions taken (or not taken) by one or more franchisees or their employees relating to health, safety, welfare, or otherwise; litigation and claims; security breaches or other fraudulent activities associated with our payment systems; and illegal activity targeted at us or others. Consumer demand for our products and services and our brands' value could diminish significantly if any such incidents or other matters erode consumer confidence in us or our products or services, which would likely result in lower sales and, ultimately, lower royalty income, which in turn could materially and adversely affect our business and operating results.
Premature termination of franchise agreements can cause losses.
Our franchise agreements may be subject to premature termination in certain circumstances, such as failure of a franchisee to cure a monetary default. If terminations occur for this or other reasons, we may need to enforce our right to damages for breach of contract and related claims, which may cause us to incur significant legal fees and expenses. Any damages we ultimately collect could be less than the projected future value of the fees and other amounts we would have otherwise collected under the franchise agreement. In addition, with many of our brands, we remain liable under the lease and, therefore, will be obligated to pay rent or enter into a settlement with the landlord, and we may not be made whole by the franchisee. A significant loss of franchisee agreements due to premature terminations could hurt our financial performance or our ability to grow our business.
18
Table of Contents
Cybersecurity incidents could result in the compromise of sensitive information about our guests, employees, vendors or company and expose us to business disruption, negative publicity, costly government enforcement actions or private litigation and our reputation could suffer.
The normal operations of our business involve processing, transmission and storage of personal information about our guests as well as employees, vendors and our Company. Cyber-attacks designed to gain access to sensitive information by breaching mission critical systems of large organizations and their third party vendors are constantly evolving, and high profile electronic security breaches leading to unauthorized release of sensitive guest information have occurred at a number of large U.S. companies in recent years. Despite the security measures and processes we have in place, our efforts, and those of our third party vendors, to protect sensitive guest and employee information may not be successful in preventing a breach in our systems, or detecting and responding to a breach on a timely basis. As a result of a security incident or breach in our systems, our systems could be interrupted or damaged, or sensitive information could be accessed by third parties. If that happened, our guests could lose confidence in our ability to protect their personal information, which could cause them to stop visiting our salons altogether. Such events could lead to lost future sales and adversely affect our results of operations. In addition, as the regulatory environment relating to retailers and other companies' obligations to protect sensitive data becomes stricter, a material failure on our part to comply with applicable regulations could subject us to fines or other regulatory sanctions and potentially to lawsuits. These laws are changing rapidly and vary among jurisdictions. Furthermore, while our franchisees are independently responsible for data security at franchised locations, a breach of guest or vendor data at a franchised location could also negatively affect public perception of our brands. More broadly, our incident response preparedness and disaster recovery planning efforts may be inadequate or ill-suited for a security incident and we could suffer disruption of operations or adverse effects to our operating results.
We rely heavily on our information technology systems for our key business processes. If we experience an interruption in their operation, our results of operations may be affected.
The efficient operation of our business is dependent on our management information systems. We rely heavily on our management information systems to collect daily sales information and guest demographics, generate payroll information, monitor salon performance, manage salon staffing and payroll costs, manage our two distribution centers and other inventory and other functions. Such systems are subject to damage or interruption from power outages, computer and telecommunications failures, computer viruses, hackers, security breaches, and natural disasters. In addition, certain of our management information systems are developed and maintained by external vendors, including our POS system, and some are outdated or of limited functionality, not owned by the Company or not exclusively provided by the Company. The failure of our management information systems to perform as we anticipate, meet the continuously evolving needs of our business, or provide an affordable long-term solution, could disrupt our business operations and result in other negative consequences, including remediation costs, loss of revenue, and reputational damage.
We rely on external vendors for products and services critical to our operations.
We rely on external vendors for the manufacture of our owned brand products, other retail products we sell, and products we use during salon services such as color and chemical treatments. We also rely on external vendors for various services critical to our operations and the security of certain Company data. Our dependence on vendors exposes us to operational, reputational, financial, and compliance risk.
If our product offerings do not meet our guests' expectations regarding safety and quality, we could experience lost sales, increased costs, and exposure to legal and reputational risk. All of our vendors must comply with applicable product safety laws, and we are dependent on them to ensure that the products and packages we buy, for either use on a guest during a service or resale to the public, comply with all safety and quality standards. Events that give rise to actual, potential, or perceived product safety concerns or mislabeling could expose us to government enforcement action and/or private litigation and result in costly product recalls and other liabilities. In addition, we do not own the formulas for certain of our owned brand products, and could be unable to sell those products if the vendor decided to discontinue working with us.
Our vendors are also responsible for the security of certain Company data, as discussed above. In the event that one of our key vendors becomes unable to continue to provide products and services, or their systems fail, are compromised or the quality of their systems deteriorate, we may suffer operational difficulties and financial loss.
Consumer shopping trends and changes in manufacturer choice of distribution channels may negatively affect both service and product revenues.
Both our owned and franchised salons are partly dependent on the volume of traffic around their locations in order to generate both service and product revenues. Supercuts salons and most of our other brands are located mainly in strip center locations, and SmartStyle salons are located within Walmart Supercenters, so they are especially sensitive to Walmart traffic. Customer traffic may be adversely affected by changing consumer shopping trends that favor alternative shopping locations, such as the
19
Table of Contents
internet. In recent years we have experienced substantial declines in traffic in some shopping malls in particular. While we no longer own mall-based salons, as they are now operated by TBG, traffic patterns at those salons will affect our potential franchise royalties and product sales revenues.
In addition, we are experiencing a proliferation of alternative channels of distribution, like blow dry bars, booth rental facilities, discount brick-and-mortar and online professional products retailers, and manufacturers selling direct to consumers online, which may negatively affect our product and service revenue. Also, product manufacturers may decide to utilize these other distribution channels to a larger extent than in the past and they generally have the right to terminate relationships with us without much advance notice. These trends could reduce the volume of traffic around our salons, and in turn, our revenues may be adversely affected.
If we are not able to successfully compete in our business markets, our financial results may be affected.
Competition on a market by market basis remains challenging as many smaller chain competitors are franchise systems with local operating strength in certain markets and the hair salon industry as a whole is fragmented and highly competitive for customers, stylists and prime locations. Therefore, our ability to attract guests, raise prices and secure suitable locations in certain markets can be adversely impacted by this competition. Our strategies for competing are complicated by the fact that we have multiple brands in multiple segments, which compete on different factors.
We also face significant competition for prime real estate, particularly in strip malls. We compete for lease locations not only with other hair salons, but with a wide variety of businesses looking for similar square footage and high-quality locations.
Furthermore, our reputation is critical to our ability to compete and succeed. Our reputation may be damaged by negative publicity on social media or other channels regarding the quality of services we provide. There has been a substantial increase in the use of social media platforms, which allow individuals to be heard by a broad audience of consumers and other interested persons. Negative or false commentary regarding us or the products or services we offer may be posted on social media platforms at any time. Customers value readily available information and may act on information without further investigation or regard to its accuracy. The harm to our reputation may be immediate, without affording us an opportunity for redress or correction. Our reputation may also be damaged by factors that are mostly or entirely out of our control, including actions by a franchisee or a franchisee's employee. If we are not able to successfully compete, our ability to grow same-store sales and increase our revenue and earnings may be impaired.
We could be subject to changes in tax rates, the adoption of new U.S. or international tax legislation or exposure to additional tax liabilities.
We are subject to income taxes in the U.S. and other foreign jurisdictions. Significant judgment is required in determining our tax provision for income taxes. In the ordinary course of our business, there are many transactions and calculations where the ultimate tax determination is uncertain. We are subject to the examination of our income tax returns, payroll taxes and other tax matters by the Internal Revenue Service and other tax authorities and governmental bodies. The Company regularly assesses the likelihood of an adverse outcome resulting from these examinations to determine the adequacy of its provision for income taxes and payroll tax accruals. There can be no assurances as to the outcome of these examinations. Although we believe our tax estimates are reasonable, the final determination of tax audits and any related litigation could be materially different from our historical tax provisions and employment taxes. The results of an audit or litigation could have a material effect on our consolidated financial statements in the period or periods for which that determination is made.
Our effective income tax rate in the future could be adversely affected by a number of factors, including changes in the mix of earnings in countries with different statutory tax rates, changes in tax laws, the outcome of income tax audits, and any repatriation of non-U.S. earnings on which we have not previously provided U.S. taxes.
Changes to healthcare laws in the U.S. may increase the number of employees who participate in our healthcare plans, which may significantly increase our healthcare costs and negatively impact our operating results.
We offer comprehensive healthcare coverage to eligible employees in the United States. Historically, a majority of our eligible employees do not participate in our healthcare plans. Due to changes to healthcare laws in the United States, it is possible that enrollment in the Company's healthcare plans may increase as individual penalties for failing to have insurance increase pursuant to the Affordable Care Act (ACA), and as employees continue to assess their changing healthcare alternatives, including if Medicaid coverage decreases or health insurance exchanges become less favorable. Furthermore, under the ACA, potential fees and or penalties may be assessed against us as a result of individuals either not being offered healthcare coverage within a limited timeframe or if coverage offered does not meet minimum care and affordability standards. An increase in the number of employees who elect to participate in our healthcare plans, changing healthcare-related requirements or if the Company fails to comply with one or more provisions of ACA may significantly increase our healthcare-related costs and negatively impact our operating results.
20
Table of Contents
Changes to interest rates and foreign currency exchange rates may impact our results from operations.
Changes in interest rates and foreign currency exchange rates will have an impact on our expected results from operations. Historically, we have managed the risk related to fluctuations in these rates through the use of fixed rate debt instruments and other financial instruments.
Failure to simplify and standardize our operating processes across our brands could have a negative impact on our financial results.
Standardization of operating processes across our brands, marketing and products will enable us to simplify our operating model and decrease our costs. Failure to do so could adversely impact our ability to grow revenue and realize further efficiencies within our results of operations.
If our joint venture with Empire Education Group is unsuccessful, our financial results may be affected.
We have a joint venture arrangement with Empire Education Group (EEG), an operator of accredited cosmetology schools. Due to significantly lower financial projections resulting from continued declines in EEG's enrollment, revenue and profitability, we recorded a $13.0 million non-cash impairment charge in fiscal year 2016, resulting in a full-impairment of our investment. If EEG is unsuccessful in executing its business plan, or if economic, regulatory and other factors, including declines in enrollment, revenue and profitability continue for the for-profit secondary education market, our financial results may be affected by certain potential liabilities related to this joint venture.
Failure to control costs may adversely affect our operating results.
We must continue to control our expense structure. Failure to manage our cost of product, labor and benefit rates, advertising and marketing expenses, operating lease costs, other store expenses or indirect spending could delay or prevent us from achieving increased profitability or otherwise adversely affect our operating results.
If we fail to comply with any of the covenants in our financing arrangement, we may not be able to access our existing revolving credit facility, and we may face an accelerated obligation to repay our indebtedness.
We have a financing arrangement that contains financial and other covenants. If we fail to comply with any of the covenants, it may cause a default under our financing arrangement, which could limit our ability to obtain additional financing under our existing credit facility, require us to pay higher levels of interest or accelerate our obligation to repay our indebtedness.
Changes in the general economic environment may impact our business and results of operations.
Changes to the U.S., Canadian and United Kingdom economies have an impact on our business. General economic factors that are beyond our control, such as recession, inflation, deflation, tax rates and policy, energy costs, unemployment trends, extreme weather patterns, other casualty events and other matters that influence consumer confidence and spending, may impact our business. In particular, visitation patterns to our salons can be adversely impacted by increases in unemployment rates and decreases in discretionary income levels.
Changes in consumer tastes, hair product innovation, fashion trends and consumer spending patterns may impact our revenue.
Our success depends in part on our ability to anticipate, gauge and react in a timely manner to changes in consumer tastes, hair product innovation, fashion trends and consumer spending patterns. If we do not timely identify and properly respond to evolving trends and changing consumer demands for hair care, our sales may decline significantly. Furthermore, we may accumulate additional inventory and be required to mark down unsold inventory to prices that are significantly lower than normal prices, which could adversely impact our margins and could further adversely impact our business, financial condition and results of operations.
Operational failure at one of our distribution centers would impact our ability to distribute product.
We operate two distribution centers, one near Chattanooga, Tennessee, and one near Salt Lake City, Utah. These supply our North America company-owned salons and many of our franchisees with retail products to sell and products used during salon services. A technology failure or natural disaster that caused one of the distribution centers to be inoperable would cause disruption in our business and could negatively impact our revenues.
Our enterprise risk management program may leave us exposed to unidentified or unanticipated risks.
We maintain an enterprise risk management program that is designed to identify, assess, mitigate, and monitor the risks that we face. There can be no assurance that our frameworks or models for assessing and managing known risks, compliance with
21
Table of Contents
applicable law, and related controls will effectively mitigate risk and limit losses in all market environments or against all types of risk in our business. If conditions or circumstances arise that expose flaws or gaps in our risk management or compliance programs, the performance and value of our business could be adversely affected.
Insurance and other traditional risk-shifting tools may be held by or available to Regis in order to manage certain types of risks, but they are subject to terms such as deductibles, retentions, limits and policy exclusions, as well as risk of denial of coverage, default or insolvency. If we suffer unexpected or uncovered losses, or if any of our insurance policies or programs are terminated for any reason or are not effective in mitigating our risks, we may incur losses that are not covered or that exceed our coverage limits and could adversely impact our results of operations, cash flows and financial position.
The franchise arrangements require each franchisee to maintain certain insurance coverages and levels. Certain extraordinary hazards, however, may not be covered, and insurance may not be available (or may be available only at prohibitively expensive rates) with respect to many other risks. Moreover, any loss incurred could exceed policy limits and policy payments made to franchisees may not be made on a timely basis. Any such loss or delay in payment could have a material and adverse effect on a franchisee's ability to satisfy its obligations under its franchise arrangement, including its ability to make royalty payments.
We rely on our management team and other key personnel.
We depend on the skills, working relationships, and continued services of key personnel, including our management team and others throughout our organization. We are also dependent on our ability to attract and retain qualified personnel, for whom we compete with other companies both inside and outside our industry. Our business, financial condition or results of operations may be adversely impacted by the unexpected loss of any of our management team or other key personnel, or more generally if we fail to identify, recruit, train and/or retain talented personnel. Additionally, the Chief Executive Officer's current employment agreement may expire, by its terms, before the Company's multi-year strategic transformation is complete, and no succession plan has yet been determined.
Item 1B. Unresolved Staff Comments
None.
Item 2. Properties
The Company's corporate offices are headquartered in a 139,000 square foot, two building complex in Edina, Minnesota that is owned by the Company.
The Company also operates offices in Edina, Minnesota; and Toronto, Canada. These offices are occupied under long-term leases.
The Company owns distribution centers located in Chattanooga, Tennessee and Salt Lake City, Utah. The Chattanooga facility currently utilizes 230,000 square feet while the Salt Lake City facility utilizes 210,000 square feet. The Salt Lake City facility can be expanded to 290,000 square feet to accommodate future growth.
The Company operates all of its salon locations under leases or license agreements. Salons operating within strip centers and Walmart Supercenters have leases with original terms of at least five years, generally with the ability to renew, at the Company's option, for one or more additional five year periods. Salons operating within department stores in Canada operate under license agreements, while freestanding or shopping center locations have real property leases comparable to the Company's company-owned locations.
The Company also leases the premises in which approximately 94% of our franchisees operate and has entered into corresponding sublease arrangements with the franchisees. These leases have a five year initial term and one or more five year renewal options. All lease costs are passed through to the franchisees. Remaining franchisees who do not enter into sublease arrangements with the Company negotiate and enter into leases on their own behalf.
None of the Company's salon leases are individually material to the operations of the Company and the Company expects that it will be able to renew its leases on satisfactory terms as they expire or identify and secure other suitable locations. See Note 8 to the Consolidated Financial Statements.
Item 3. Legal Proceedings
The Company is a defendant in various lawsuits and claims arising out of the normal course of business. Like certain other large retail employers, the Company has been faced with allegations of purported class-wide consumer and wage and hour violations. Litigation is inherently unpredictable and the outcome of these matters cannot presently be determined. Although the actions are being vigorously defended, the Company could in the future incur judgments or enter into settlements of claims that could have a material adverse effect on its results of operations in any particular period.
22
Table of Contents
Item 4. Mine Safety Disclosures
Not applicable.
PART II
Item 5. | Market for Registrant's Common Equity, Related Stockholder Matters and Issuer Repurchase of Equity Securities |
Regis common stock is listed and traded on the New York Stock Exchange under the symbol "RGS."
The accompanying table sets forth the high and low closing bid quotations for each quarter during fiscal years 2018 and 2017 as reported by the New York Stock Exchange (under the symbol "RGS"). The quotations reflect inter-dealer prices, without retail mark-up, mark-down or commission, and may not necessarily represent actual transactions.
As of August 10, 2018 , Regis shares were owned by approximately 11,000 shareholders based on the number of record holders and an estimate of individual participants in security position listings. The closing stock price was $17.47 per share on August 10, 2018 .
|
| Fiscal Years | ||||||||||||||
|
| 2018 |
| 2017 | ||||||||||||
Fiscal Quarter |
| High |
| Low |
| High |
| Low | ||||||||
1 st Quarter |
| $ | 14.59 | |
| $ | 9.40 | |
| $ | 14.49 | |
| $ | 12.18 | |
2 nd Quarter |
| 16.68 | |
| 13.79 | |
| 15.56 | |
| 11.56 | | ||||
3 rd Quarter |
| 17.13 | |
| 14.66 | |
| 15.61 | |
| 11.37 | | ||||
4 th Quarter |
| 18.63 | |
| 14.31 | |
| 11.71 | |
| 9.02 | | ||||
In accordance with its capital allocation policy, the Company no longer pays dividends.
The following graph compares the cumulative total shareholder return on the Company's stock for the last five years with the cumulative total return of the Standard and Poor's 500 Stock Index and the cumulative total return of a peer group index (the Peer Group) constructed by the Company. In addition, the Company has included the Standard and Poor's 400 Midcap Index and the Dow Jones Consumer Services Index in this analysis because the Company believes these two indices provide a comparative correlation to the cumulative total return of an investment in shares of Regis Corporation.
The Peer Group consists of the following companies: Boyd Gaming Corp., Brinker International, Inc., Buffalo Wild Wings, Inc., Cracker Barrel Old Country Store, DineEquity, Inc., Fossil Group, Inc., Fred's, Inc., Jack in the Box, Inc., Panera Bread Co., Penn National Gaming, Inc., Revlon, Inc., Ruby Tuesday, Inc., Sally Beauty Holdings, Inc., Service Corporation International, The Cheesecake Factory, Inc. and Ulta Salon, Cosmetics & Fragrance Inc. The comparison has omitted Panera Bread Co., Buffalo Wild Wings, Inc., and Ruby Tuesday, Inc. as they are no longer trading public market. The Peer Group is a self-constructed peer group of companies that have comparable annual revenues and market capitalization and are in the beauty industry or other industries where guest service, multi-unit expansion or franchise play a part. The Company reviewed and adjusted its Peer Group used for executive compensation purposes in early fiscal 2017, resulting in this Peer Group. Information regarding executive compensation will be set forth in the 2018 Proxy Statement.
The comparison assumes the initial investment of $100 in the Company's common stock, the S&P 500 Index, the Peer Group, the S&P 400 Midcap Index and the Dow Jones Consumer Services Index on June 30, 2013 and that dividends, if any, were reinvested.
23
Table of Contents
Comparison of 5 Year Cumulative Total Return
Assumes Initial Investment of $100
June 2018
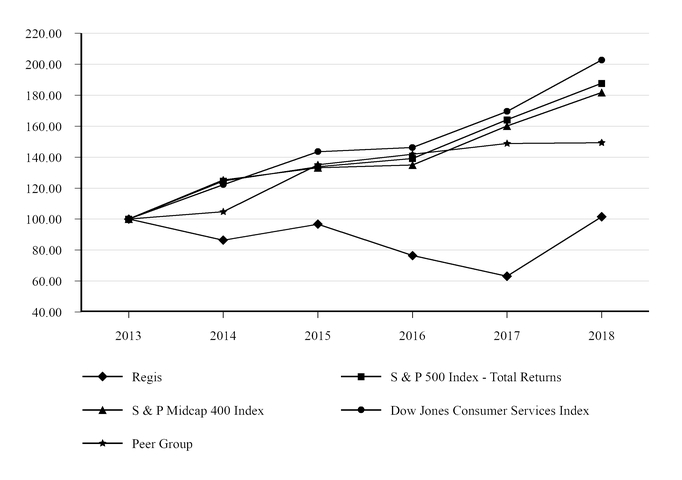
|
| June 30, | ||||||||||||||||||||||
|
| 2013 |
| 2014 |
| 2015 |
| 2016 |
| 2017 |
| 2018 | ||||||||||||
Regis |
| $ | 100.00 | |
| $ | 86.42 | |
| $ | 96.74 | |
| $ | 76.42 | |
| $ | 63.04 | |
| $ | 101.52 | |
S & P 500 |
| 100.00 | |
| 124.61 | |
| 133.86 | |
| 139.20 | |
| 164.11 | |
| 187.70 | | ||||||
S & P 400 Midcap |
| 100.00 | |
| 125.24 | |
| 133.25 | |
| 135.02 | |
| 160.09 | |
| 181.71 | | ||||||
Dow Jones Consumer Services Index |
| 100.00 | |
| 122.24 | |
| 143.56 | |
| 146.19 | |
| 169.55 | |
| 202.72 | | ||||||
Peer Group |
| 100.00 | |
| 104.72 | |
| 135.08 | |
| 141.91 | |
| 148.78 | |
| 149.33 | | ||||||
In May 2000, the Company's Board of Directors (Board) approved a stock repurchase program with no stated expiration date. Since that time and through June 30, 2018 , the Board has authorized $450.0 million to be expended for the repurchase of the Company's stock under this program. All repurchased shares become authorized but unissued shares of the Company. The timing and amounts of any repurchases depends on many factors, including the market price of the common stock and overall market conditions. As of June 30, 2018 , 19.9 million shares have been cumulatively repurchased for $414.7 million , and $35.3 million remained outstanding under the approved stock repurchase program.
In August 2018, the Company's Board of Directors authorized an additional $200.0 million for share repurchases.
24
Table of Contents
The Company repurchased the following common stock through its share repurchase program:
|
| Fiscal Years | ||||||||||
|
| 2018 |
| 2017 |
| 2016 | ||||||
Repurchased Shares |
| 1,469,057 | |
| - | |
| 7,647,819 | | |||
Average Price (per share) |
| | $16.86 | |
| | $- | |
| | $13.19 | |
Price range (per share) |
| $15.55 - $17.90 | |
| | $- | |
| $10.94 - $15.95 | | ||
Total |
| $24.8 million | |
| | $- | |
| $101.0 million | | ||
The following table shows the stock repurchase activity by the Company or any "affiliated purchaser" of the Company, as defined in Rule 10b-18(a)(3) under the Exchange Act, by month for the three months ended June 30, 2018 :
Period |
| Total Number of Shares Purchased |
| Average Price Paid per Share |
| Total Number of Shares Purchased As Part of Publicly Announced Plans or Programs |
| Approximate Dollar Value of Shares that May Yet Be Purchased under the Plans or Programs (in thousands) | ||||||
|
|
| |
|
|
|
| |
|
| ||||
4/1/18 - 4/30/18 |
| - | |
| - | |
| 18,982,137 | |
| 50,430 | | ||
5/1/18 - 5/31/18 |
| 451,731 | |
| 16.88 | |
| 19,433,868 | |
| 42,832 | | ||
6/1/18 - 6/30/18 |
| 431,359 | |
| 17.53 | |
| 19,865,227 | |
| 35,272 | | ||
Total |
| 883,090 | |
| $ | 17.16 | |
| 19,865,227 | |
| $ | 35,272 | |
Item 6. Selected Financial Data
Beginning with the period ended September 30, 2017, the operations of the mall-based business and International segment were accounted for as a discontinued operation. All periods presented reflect the mall-based business and International segment as a discontinued operation.
The following table sets forth selected financial data derived from the Company's Consolidated Financial Statements in Part II, Item 8. The table should be read in conjunction with Item 7, "Management's Discussion and Analysis of Financial Condition and Results of Operations", and Item 8, "Financial Statements and Supplementary Data", of this Report on Form 10-K.
|
| Fiscal Years | ||||||||||||||||||
|
| 2018 |
| 2017 |
| 2016 |
| 2015 |
| 2014 | ||||||||||
|
| (Dollars in thousands, except per share data) | ||||||||||||||||||
Revenues |
| $ | 1,214,074 | |
| $ | 1,268,460 | |
| $ | 1,291,933 | |
| $ | 1,290,339 | |
| $ | 1,306,361 | |
Operating income (loss)(a) |
| 274 | |
| 14,081 | |
| 23,764 | |
| 5,665 | |
| 1,599 | | |||||
Income (loss) from continuing operations(a) |
| 61,886 | |
| (896 | ) |
| (5,587 | ) |
| (30,834 | ) |
| (102,506 | ) | |||||
Income (loss) from continuing operations per diluted share |
| 1.32 | |
| (0.02 | ) |
| (0.12 | ) |
| (0.56 | ) |
| (1.81 | ) | |||||
Dividends declared, per share |
| - | |
| - | |
| - | |
| - | |
| 0.12 | | |||||
|
| June 30, | ||||||||||||||||||
|
| 2018 |
| 2017 |
| 2016 |
| 2015 |
| 2014 | ||||||||||
|
| (Dollars in thousands) | ||||||||||||||||||
Total assets, including discontinued operations |
| $ | 856,735 | |
| $ | 1,011,488 | |
| $ | 1,035,932 | |
| $ | 1,160,843 | |
| $ | 1,414,291 | |
Long-term debt and capital lease obligations, including current portion |
| 90,000 | |
| 120,599 | |
| 119,606 | |
| 118,830 | |
| 291,845 | | |||||
_______________________________________________________________________________
(a) | The following significant items affected each of the years presented: |
25
Table of Contents
• | During fiscal year 2018, the Company recorded a $68.1 million income tax benefit resulting from the federal rate reduction and a partial release of the U.S. valuation allowance as a result of the Tax Cuts and Jobs Act (the "Tax Act"), $41.2 million ($32.5 million, net of taxes) of expenses associated with the January 2018 SmartStyle portfolio restructure and other related costs, $11.1 million of non-cash fixed asset impairment charges, $8.0 million of gain on company-owned life insurance policies, and $2.7 million ($2.2 million, net of taxes) of severance expense related to terminations. |
• | During fiscal year 2017, the Company recorded $7.9 million of non-cash fixed asset impairment charges, $8.4 million of severance expense related to the termination of former executive officers including the Company's Chief Executive Officer, $7.7 million of non-cash tax expense related to tax benefits on certain indefinite-lived assets that the Company cannot recognize for reporting purposes and $5.3 million of expense for a one-time non-cash inventory expense related to salon tools. |
• | During fiscal year 2016, the Company recorded a $13.0 million other than temporary non-cash impairment charge to fully impair its investment in EEG, $10.5 million of non-cash fixed asset impairment charges and $7.9 million of non-cash tax expense related to tax benefits on certain indefinite-lived assets that the Company cannot recognize for reporting purposes. |
• | During fiscal year 2015, the Company recorded its share of a non-cash deferred tax asset valuation allowance recorded by EEG of $6.9 million, non-cash other than temporary impairment charges of its investment in EEG of $4.7 million, $7.9 million of non-cash fixed asset impairment charges, $8.9 million of non-cash tax expense related to tax benefits on certain indefinite-lived assets that the Company cannot recognize for reporting purposes and established a non-cash $2.1 million valuation allowance against its Canadian deferred tax assets. |
• | During fiscal year 2014, the Company recorded non-cash fixed asset impairment charges of $10.0 million, non-cash charges of $15.9 million, net of tax for the Company's share of goodwill and fixed asset impairment charges recorded by EEG and established a non-cash $86.6 million valuation allowance against the U.S. and U.K. deferred tax assets. |
Item 7. Management's Discussion and Analysis of Financial Condition and Results of Operations
Management's Discussion and Analysis of Financial Condition and Results of Operations (MD&A) is designed to provide a reader of our financial statements with a narrative from the perspective of our management on our financial condition, results of operations, liquidity and certain other factors that may affect our future results.
BUSINESS DESCRIPTION
Regis Corporation (RGS) owns, franchises and operates beauty salons. As of June 30, 2018 , the Company-owned, franchised or held ownership interests in 8,168 worldwide locations. Our locations consisted of 8,080 system-wide North American and International salons, and in 88 locations we maintain a non-controlling ownership interest less than 100 percent. Each of the Company's salon concepts generally offer similar salon products and services. As of June 30, 2018 , we had approximately 27,000 corporate employees worldwide. See discussion within Part I, Item 1.
In October 2017, the Company sold substantially all of its mall-based salon business in North America, representing 858 company-owned salons, and substantially all of its International segment, representing approximately 250 company-owned salons, to TBG, who operates these locations as franchise locations. See Note 2 to the Consolidated Financial Statements in Part II, Item 8, of this Form 10-K as the results of operations for the mall-based business and International segment are accounted for as a discontinued operation for all periods presented. Discontinued operations are discussed at the end of this section.
26
Table of Contents
In January 2018, the Company closed 597 non-performing company-owned SmartStyle salons. The 597 non-performing salons generated negative cash flow of approximately $15 million during the twelve months ended September 30, 2017. The action delivers on the Company's commitment to restructure its salon portfolio to improve shareholder value and position the Company for long-term growth. The Company anticipates this action will allow the Company to reallocate capital and human resources to strategically grow its remaining SmartStyle salons with creative new offerings. A summary of costs associated with the SmartStyle salon restructuring for fiscal year 2018 is as follows:
| Financial Line Item |
| Fiscal Year 2018 | ||
|
|
| (Dollars in thousands) | ||
Inventory reserves | Cost of Service |
| $ | 656 | |
Inventory reserves | Cost of Product |
| 586 | | |
Severance | General and administrative |
| 897 | | |
Long-lived fixed asset impairment | Depreciation and amortization |
| 5,460 | | |
Asset retirement obligation | Depreciation and amortization |
| 7,680 | | |
Lease termination and other related closure costs | Rent |
| 27,290 | | |
Deferred rent | Rent |
| (3,291 | ) | |
Total |
|
| $ | 39,278 | |
In addition, the Company recorded approximately $1.9 million of other related costs to the SmartStyle restructuring, primarily warehouse related costs. Substantially all related costs associated with the SmartStyle salon restructuring requiring cash outflow were complete as of June 30, 2018 .
RESULTS OF OPERATIONS
Beginning in the first quarter of fiscal year 2018, the Company redefined its operating segments to reflect how the chief operating decision maker evaluates the business as a result of the sale of the mall-based business (primarily comprised of MasterCuts and Regis branded salons) and International segment. The Company now reports its operations in two operating segments: Company-owned salons and Franchise salons. The Company's operating segments are its reportable operating segments. Prior to this change, the Company had four operating segments: North American Value, North American Premium, North American Franchise, and International.
Beginning with the period ended September 30, 2017, the mall-based business and International segment were accounted for as a discontinued operation for all periods presented. Discontinued operations are discussed at the end of this section. See Note 2 to the Consolidated Financial Statements in Part II, Item 8, of this Form 10-K for further discussion on this transaction.
Beginning in the first quarter of fiscal year 2018, costs associated with field leaders that were previously recorded within Cost of Service and Site Operating expense are now categorized within General and Administrative expense as a result of the field reorganization that took place in the first quarter of fiscal year 2018. The estimated impact of the field reorganization (decreased) increased Cost of Service, Site Operating expense and General and Administrative expense by $(26.5), $(5.8) and $32.3 million, respectively, for fiscal year 2018. This expense classification does not have a financial impact on the Company's reported operating (loss) income, reported net income (loss) or cash flows from operations.
In the past field leaders were responsible for a geographical area that included a variety of brands, with different business models, services, pay plans and guest expectations. They also served as salon managers with a home salon that they spent a large portion of their time serving guests rather than field leadership. Post-reorganization, each field leader is dedicated to a specific brand/concept, as well as geography, and are focused solely on field leadership.
27
Table of Contents
Consolidated Results of Operations
The following table sets forth, for the periods indicated, certain information derived from our Consolidated Statement of Operations. The percentages are computed as a percent of total revenues, except as otherwise indicated.
|
| Fiscal Years | ||||||||||||||||||||||||||||
|
| 2018 |
| 2017 |
| 2016 |
| 2018 |
| 2017 |
| 2016 |
| 2018 |
| 2017 |
| 2016 | ||||||||||||
|
| (Dollars in millions) |
| % of Total Revenues (1) |
| Basis Point | ||||||||||||||||||||||||
Service revenues |
| $ | 899.1 | |
| $ | 960.3 | |
| $ | 978.6 | |
| 74.1 | % |
| 75.7 | % |
| 75.7 | % |
| (160 | ) |
| - | |
| (90 | ) |
Product revenues |
| 258.7 | |
| 259.8 | |
| 265.8 | |
| 21.3 | |
| 20.5 | |
| 20.6 | |
| 80 | |
| (10 | ) |
| 70 | | |||
Franchise royalties and fees |
| 56.4 | |
| 48.3 | |
| 47.5 | |
| 4.6 | |
| 3.8 | |
| 3.7 | |
| 80 | |
| 10 | |
| 20 | | |||
|
|
|
|
|
|
|
|
|
|
|
|
|
|
|
|
|
|
| ||||||||||||
Cost of service (2) |
| 530.6 | |
| 610.4 | |
| 609.0 | |
| 59.0 | |
| 63.6 | |
| 62.2 | |
| (460 | ) |
| 140 | |
| 130 | | |||
Cost of product (2) |
| 140.6 | |
| 126.3 | |
| 130.0 | |
| 54.4 | |
| 48.6 | |
| 48.9 | |
| 580 | |
| (30 | ) |
| (90 | ) | |||
Site operating expenses |
| 127.2 | |
| 127.8 | |
| 135.1 | |
| 10.5 | |
| 10.1 | |
| 10.5 | |
| 40 | |
| (40 | ) |
| (50 | ) | |||
General and administrative |
| 174.0 | |
| 157.3 | |
| 157.0 | |
| 14.3 | |
| 12.4 | |
| 12.2 | |
| 190 | |
| 20 | |
| (50 | ) | |||
Rent |
| 183.1 | |
| 180.5 | |
| 184.2 | |
| 15.1 | |
| 14.2 | |
| 14.3 | |
| 90 | |
| (10 | ) |
| (30 | ) | |||
Depreciation and amortization |
| 58.2 | |
| 52.1 | |
| 52.9 | |
| 4.8 | |
| 4.1 | |
| 4.1 | |
| 70 | |
| - | |
| (70 | ) | |||
|
|
|
|
|
|
|
|
|
|
|
|
|
|
|
|
|
|
| ||||||||||||
Operating income |
| 0.3 | |
| 14.1 | |
| 23.8 | |
| - | |
| 1.1 | |
| 1.8 | |
| (110 | ) |
| (70 | ) |
| 140 | | |||
|
|
|
|
|
|
|
|
|
|
|
|
|
|
|
|
|
|
| ||||||||||||
Interest expense |
| 10.5 | |
| 8.6 | |
| 9.2 | |
| 0.9 | |
| 0.7 | |
| 0.7 | |
| 20 | |
| - | |
| (10 | ) | |||
Interest income and other, net |
| 6.7 | |
| 2.8 | |
| 3.7 | |
| 0.5 | |
| 0.2 | |
| 0.3 | |
| 30 | |
| (10 | ) |
| 20 | | |||
|
|
|
|
|
|
|
|
|
|
|
|
|
|
|
|
|
|
| ||||||||||||
Income tax benefit (expense) (3) |
| 65.4 | |
| (9.2 | ) |
| (9.0 | ) |
| 1,844.3 | |
| 110.8 | |
| 49.6 | |
| N/A | |
| N/A | |
| N/A | | |||
Equity in loss of affiliated companies, net of income taxes |
| - | |
| - | |
| 14.8 | |
| - | |
| - | |
| 1.1 | |
| - | |
| (110 | ) |
| - | | |||
____________________________________________________________________________
(1) | Cost of service is computed as a percent of service revenues. Cost of product is computed as a percent of product revenues. |
(2) | Excludes depreciation and amortization expense. |
(3) | Computed as a percent of income (loss) from continuing operations before income taxes and equity in loss of affiliated companies . The income taxes basis point change is noted as not applicable (N/A) as the discussion below is related to the effective income tax rate. |
Fluctuations in major revenue categories, operating expenses and other income and expense were as follows:
28
Table of Contents
Consolidated Revenues
Consolidated revenues primarily include revenues of company-owned salons, product and equipment sales to franchisees and franchise royalties and fees. The following tables summarize revenues and same-store sales by concept, as well as the reasons for the percentage change:
|
| Fiscal Years | ||||||||||
|
| 2018 |
| 2017 |
| 2016 | ||||||
|
| (Dollars in thousands) | ||||||||||
Company-owned salons |
|
|
|
|
|
| ||||||
SmartStyle |
| $ | 463,502 | |
| $ | 523,903 | |
| $ | 522,700 | |
Supercuts |
| 283,843 | |
| 290,016 | |
| 295,401 | | |||
Signature Style |
| 356,669 | |
| 375,627 | |
| 394,903 | | |||
Total Company-owned salons |
| 1,104,014 | |
| 1,189,546 | |
| 1,213,004 | | |||
Franchise salons |
|
|
|
|
|
| ||||||
Product |
| 53,703 | |
| 30,623 | |
| 31,406 | | |||
Royalties and fees |
| 56,357 | |
| 48,291 | |
| 47,523 | | |||
Total franchise salons revenue |
| 110,060 | |
| 78,914 | |
| 78,929 | | |||
Consolidated revenues |
| $ | 1,214,074 | |
| $ | 1,268,460 | |
| $ | 1,291,933 | |
Percent change from prior year |
| (4.3 | )% |
| (1.8 | )% |
| 0.1 | % | |||
Salon same-store sales increase (decrease) (1) |
| 0.5 | % |
| (0.5 | )% |
| 1.8 | % | |||
_______________________________________________________________________________
(1) | Same-store sales are calculated on a daily basis as the total change in sales for company-owned locations which were open on a specific day of the week during the current period and the corresponding prior period. Quarterly and fiscal year same-store sales are the sum of the same-store sales computed on a daily basis. Locations relocated within a one mile radius are included in same-store sales as they are considered to have been open in the prior period. Same-store sales are calculated in local currencies to remove foreign currency fluctuations from the calculation. |
Decreases in consolidated revenues were driven by the following:
| | Fiscal Years | |||||||
Factor | | 2018 | | 2017 | | 2016 | |||
Same-store sales | | 0.5 | % | | (0.5 | )% | | 1.8 | % |
Closed salons | | (7.4 | ) | | (2.0 | ) | | (2.2 | ) |
New company-owned stores |
| 0.2 | |
| 0.5 | |
| 0.7 | |
Franchise | | 2.4 | | | - | | | 0.5 | |
Foreign currency |
| 0.3 | |
| (0.1 | ) |
| (0.9 | ) |
Other | | (0.3 | ) | | 0.3 | | | 0.2 | |
Total | | (4.3 | )% | | (1.8 | )% | | 0.1 | % |
Same-store sales by concept by fiscal year are detailed in the table below:
|
| Fiscal Years | |||||||
|
| 2018 |
| 2017 |
| 2016 | |||
SmartStyle |
| 0.3 | % |
| (0.4 | )% |
| 3.4 | % |
Supercuts |
| 1.7 | % |
| 0.4 | % |
| 2.0 | % |
Signature Style |
| (0.2 | )% |
| (1.4 | )% |
| (0.2 | )% |
Consolidated same-store sales |
| 0.5 | % |
| (0.5 | )% |
| 1.8 | % |
29
Table of Contents
Fiscal Year Ended June 30, 2018 Compared with Fiscal Year Ended June 30, 2017
Consolidated Revenues
The same-store sales increase of 0.5% during fiscal year 2018 was due to a 3.4% increase in average ticket price, partly offset by a 2.9% decrease in same-store guest visits. We closed 701 company-owned salons, constructed (net of relocations) 3 company-owned salons and sold (net of buybacks) 448 company-owned salons during fiscal year 2018 (2018 Net Salon Count Changes). Our franchisees closed 194 salons and constructed (net of relocations) 79 salons during the same period. Consolidated revenues are primarily comprised of service and product revenues, as well as franchise royalties and fees.
Service Revenues
The $61.3 million decrease in service revenues during fiscal year 2018 was primarily due to the 2018 Net Salon Count Changes. The same-store service sales increase of 0.5% was primarily a result of a 3.8% increase in average ticket price, partly offset by a 3.3% decrease in same-store guest visits. Service revenues were also favorably impacted by a cumulative adjustment related to discontinuing a piloted loyalty program and foreign currency.
Product Revenues
The $1.2 million decrease in product revenues during fiscal year 2018 was primarily due to 2018 Net Salon Count Changes and an unfavorable impact of hurricanes in the southern United States, partly offset by product sold to TBG and same-store product sales increases of 0.2% . The increase in same-store product sales was primarily a result of a 3.7% increase in average ticket price, partly offset by a 3.5% decrease in same-store transactions.
Royalties and Fees
The increase of $8.1 million in royalties and fees during fiscal year 2018 was primarily due to higher franchise fees due to an increase in the number of new salons opened in fiscal year 2018 compared to the prior year and higher royalties due to the increase of 1,468 in franchised locations and same-store sales increases at franchised locations.
Cost of Service
The 460 basis point decrease in cost of service as a percent of service revenues during fiscal year 2018 was primarily due to the change in expense categorization as a result of the field reorganization that took place during the first quarter of fiscal year 2018 . After considering the change in expense categorization, cost of service as a percent of service revenues decreased 180 basis points as a result of improved stylist productivity, one-time benefit from a settlement and cost savings associated with salon tools, partly offset by state minimum wage increases, higher commissions expense as a result of same-store sales increases and higher health insurances costs. Cost of service was also negatively impacted by hurricanes in the southern United States.
Cost of Product
The 580 basis point increase in cost of product as a percent of product revenues during fiscal year 2018 was primarily due to franchise product sold to TBG, shift into lower margin product sales to franchisees and inventory reserves related to the January 2018 SmartStyle portfolio restructure, less favorable shrink as compared to the prior year and a promotional sale implemented in the fourth quarter, partly offset by a one-time benefit from a settlement.
Site Operating Expenses
Site operating expenses decreased $0.5 million during fiscal year 2018 . After considering the change in expense categorization as a result of the field reorganization that took place during the first quarter of fiscal year 2018 , site operating expenses increased $5.2 million primarily due to higher marketing costs associated with the SmartStyle marketing campaign and fees associated with an industry exclusive sponsorship with Major League Baseball, unfavorable actuarial adjustments related to workers' compensation accruals and higher contract maintenance, repairs and services costs, partly offset by the 2018 Net Salon Count Changes.
General and Administrative
General and administrative expense (G&A) increased $16.7 million during fiscal year 2018 . After considering the change in expense categorization as a result of the field reorganization that took place during the first quarter of fiscal year 2018 , G&A decreased $15.6 million, primarily due to an $8.0 million gain associated with life insurance proceeds in connection with the passing of a former executive officer, lower severance expense due to the prior year including severance related to the
30
Table of Contents
termination of former executive officers including the Company's Chief Executive Officer and professional fees, partly offset by increases in incentive compensation accruals.
Rent
Rent expense increased by $2.6 million during fiscal year 2018 primarily due to lease termination fees and other related closure costs associated with the January 2018 SmartStyle portfolio restructure, rent inflation, partly offset by the 2018 Net Salon Count Changes and a deferred rent adjustment related to the January 2018 SmartStyle portfolio restructure.
Depreciation and Amortization
Depreciation and amortization expense (D&A) increased $6.1 million during fiscal year 2018 , primarily due to costs associated with returning certain SmartStyle locations to their pre-occupancy condition in connection with the January 2018 SmartStyle restructuring and higher fixed asset impairment charges, partly offset by lower depreciation due to a reduced salon base.
Interest Expense
Interest expense increased by $1.9 million during fiscal year 2018 primarily due to the premium and unamortized debt discount expense associated with paying off the 5.5% senior term note originally due December 2019, partly offset by savings resulting from a reduced interest rate and lower debt levels.
Interest Income and Other, net
The $3.8 million increase in interest income and other, net during fiscal year 2018 was primarily due to income from transition services related to TBG, higher gains on refranchised salons, incremental interest income, increased gift card breakage, partly offset by a non-recurring insurance recovery benefit in the prior year.
Income Taxes
During fiscal year 2018 , the Company recognized an income tax benefit of $65.4 million on $3.5 million of loss from continuing operations before income taxes and equity in loss of affiliated companies as compared to recognizing income tax expense of $9.2 million on $8.3 million of income from continuing operations before income taxes and equity in loss of affiliated companies during fiscal year 2017.
On December 22, 2017, the U.S. government enacted comprehensive tax legislation commonly referred to as the Tax Cuts and Jobs Act (the "Tax Act"). In connection with the Tax Act, the Company recorded a provisional net tax benefit of $68.1 million in continuing operations for the twelve months ended June 30, 2018. The net tax benefit is primarily attributable to the impact of the corporate rate reduction on our deferred tax assets and liabilities along with a partial release of the U.S. valuation allowance. The benefit recognized on current losses and the partial valuation allowance release is solely attributable to tax reform and the law change that allows for the indefinite carryforward of net operating losses ("NOLs") arising in tax years ending after December 31, 2017. Prior law limited the carryforward period to 20 years. As a result of the new tax rules, companies can now consider its indefinite lived deferred tax liabilities as a source of income to support the realization of its existing deferred tax assets that upon reversal are expected to generate indefinite lived NOLs. Consequently, the Company was able to remove the valuation allowance associated with these deferred tax assets. The Company continues to maintain a valuation allowance on the historical balance of its finite lived federal NOLs, tax credits and various state tax attributes. We are still analyzing certain aspects of the Tax Act and refining our calculations, which could potentially affect the measurement of our deferred tax balances and ultimately cause us to revise our provisional estimate in future periods in accordance with SAB 118. In addition, changes in interpretations, assumptions, and guidance regarding the new tax legislation, as well as the potential for technical corrections to the Tax Act, could have a material impact to the Company's effective tax rate in future periods.
The recorded tax provision and effective tax rate for the twelve months ended June 30, 2018 were different than what would normally be expected primarily due to the impact of the Tax Act and state conformity of the new federal provisions, closure of the IRS examination and the deferred tax valuation allowance.
Additionally, the Company is currently paying taxes in Canada and certain states in which it has profitable entities.
See Note 9 to the Consolidated Financial Statements in Part II, Item 8, of this Form 10-K.
31
Table of Contents
Equity in Loss of Affiliated Companies, Net of Income Taxes
The Company has not recorded any equity income or losses related to its investment in EEG subsequent to the impairment in fiscal year 2016. The Company will record equity income related to the Company's investment in EEG once EEG's cumulative income exceeds its cumulative losses, measured from the date of impairment.
Loss from Discontinued Operations, Net of Income Taxes
During fiscal year 2018, the Company recognized $53.2 million of loss, net of taxes from discontinued operations, primarily due to asset impairment charges based on the sale prices and the carrying values of the mall-based salon business and the International segment, the recognition of net loss of amounts previously classified within accumulated other comprehensive income, professional fees associated with the transactions and losses from operations. See Note 2 to the Consolidated Financial Statements in Part II, Item 8, of this Form 10-K.
Fiscal Year Ended June 30, 2017 Compared with Fiscal Year Ended June 30, 2016
Consolidated Revenues
The same-store sales decrease of 0.5% during fiscal year 2017 was due to a decrease of 4.6% in same-store guest visits, partly offset by an increase of 4.1% in average ticket price. The Company closed 185 company-owned salons, constructed (net of relocations) 39 company-owned salons and sold (net of buybacks) 99 company-owned salons to franchisees during the same period (2017 Net Salon Count Changes). Our franchisees closed 93 salons and constructed (net of relocations) 146 salons during fiscal year 2017. Consolidated revenues are primarily comprised of service and product revenues, as well as franchise royalties and fees.
Service Revenues
Decrease of $18.3 million in service revenues during fiscal year 2017 was primarily due to the 2017 Net Salon Count Changes and same-store service sales decrease of 0.3% . The decrease in same-store service sales was primarily the result of a 4.4% decrease in same-store guest visits, partly offset by a 4.1% increase in average ticket price.
Product Revenues
Decrease of $6.0 million in product revenues during fiscal year 2017 was primarily due to the 2017 Net Salon Count Changes and same-store product sales decrease of 1.5% . The decrease in same-store product sales was primarily the result of a 3.2% decrease in same-store transactions, partly offset by a 1.7% increase in average ticket price.
Royalties and Fees
The increase of $0.8 million in royalties and fees during fiscal year 2017 was primarily due to the increase of 150 franchised locations and same-store sales increases at franchised locations.
Cost of Service
The 140 basis point increase in cost of service as a percent of service revenues during fiscal year 2017 was primarily the result of lower stylist productivity, state minimum wage increases, a one-time inventory expense related to salon tools and a non-recurring rebate in the prior year, partly offset by mix improvement from closing underperforming salons, lower incentive expenses and favorable usage versus the prior year.
Cost of Product
The 30 basis point decrease in cost of product as a percent of product revenues during fiscal year 2017 was primarily due to the closure of salons with higher product costs as a percent of product revenues and favorable shrink versus the prior year.
Site Operating Expenses
Site operating expenses decreased $7.3 million during fiscal year 2017 primarily due to the 2017 Net Salon Count Changes, lower self-insurance costs and cost savings associated with salon telecom costs.
General and Administrative
G&A increased $0.3 million during fiscal year 2017 primarily due to severance related to the termination of former executive officers including the Company's Chief Executive Officer and higher professional fees, partly offset by lower incentive compensation and cost savings.
32
Table of Contents
Rent
Rent expense decreased by $3.7 million during fiscal year 2017 primarily due to the 2017 Net Salon Count Changes, partly offset by rent inflation and lease termination fees.
Depreciation and Amortization
D&A decreased $0.8 million during fiscal year 2017, primarily due to lower depreciation on a reduced salon base, partly offset by increased fixed asset impairment charges.
Interest Expense
Interest expense decreased by $0.6 million during fiscal year 2017 primarily due to the senior term note modification and the amendment to the revolving credit facility in fiscal year 2016.
Interest Income and Other, net
The $0.9 million decrease in interest income and other, net during fiscal year 2017 was primarily due to gains on refranchised salons sold in the prior year and a prior year insurance recovery.
Income Taxes
During fiscal year 2017, the Company recognized income tax expense of $9.2 million on $8.3 million of income from continuing operations before income taxes and equity in loss of affiliated companies as compared to recognizing income tax expense of $9.0 million on $18.2 million of income from continuing operations before income taxes and equity in loss of affiliated companies during fiscal year 2016.
The recorded tax expense for fiscal year 2017 was different than would normally be expected primarily due to the impact of the valuation allowance against the majority of our deferred tax assets. Approximately $7.7 million of the tax expense relates to non-cash tax expense for tax benefits on certain indefinite-lived assets that the Company could not recognize for reporting purposes. See Note 9 to the Consolidated Financial Statements in Part II, Item 8, of this Form 10-K.
Equity in Loss of Affiliate Companies, Net of Income Taxes
The Company has not recorded any equity income or losses related to its investment in EEG subsequent to the impairment in fiscal year 2016. The Company will record equity income related to the Company's investment in EEG once EEG's cumulative income exceeds its cumulative losses, measured from the date of impairment.
Loss from Discontinued Operations, Net of Income Taxes
During fiscal year 2017, the Company recognized $15.2 million of loss, net of taxes from discontinued operations related to operating losses of the mall-based salon business and International segment. See Note 2 to the Consolidated Financial Statements in Part II, Item 8, of this Form 10-K.
33
Table of Contents
Results of Operations by Segment
Based on our internal management structure, we now report two segments: Company-owned salons and Franchise salons. See Note 14 to the Consolidated Financial Statements in in Part II, Item 8, of this Form 10-K. Significant results of operations are discussed below with respect to each of these segments.
Company-owned Salons
| Fiscal Years | ||||||||||||||||||||||
| 2018 |
| 2017 |
| 2016 |
| 2018 |
| 2017 |
| 2016 | ||||||||||||
| (Dollars in millions) |
| (Decrease) Increase | ||||||||||||||||||||
Total revenue | $ | 1,104.0 | |
| $ | 1,189.5 | |
| $ | 1,213.0 | |
| $ | (85.5 | ) |
| $ | (23.5 | ) |
| $ | (2.9 | ) |
Same-store sales | 0.5 | % |
| (0.5 | )% |
| 1.8 | % |
| 100 bps | |
| (230 bps) | |
| 150 bps | | ||||||
|
|
|
|
|
|
|
|
|
|
|
| ||||||||||||
Operating income | $ | 50.1 | |
| $ | 78.3 | |
| $ | 87.8 | |
| $ | (28.2 | ) |
| $ | (9.4 | ) |
| $ | 7.2 | |
Company-owned Salon Revenues
Decreases in Company-owned salon revenues were driven by the following:
|
| Fiscal Years | |||||||
Factor |
| 2018 |
| 2017 |
| 2016 | |||
Same-store sales |
| 0.5 | % |
| (0.5 | )% |
| 1.8 | % |
Closed salons |
| (7.9 | ) |
| (2.1 | ) |
| (2.3 | ) |
New stores |
| 0.2 | |
| 0.5 | |
| 0.7 | |
Foreign currency |
| 0.3 | |
| (0.1 | ) |
| (0.8 | ) |
Other |
| (0.3 | ) |
| 0.3 | |
| 0.4 | |
|
| (7.2 | )% |
| (1.9 | )% |
| (0.2 | )% |
Fiscal Year Ended June 30, 2018 Compared with Fiscal Year Ended June 30, 2017
Company-owned Salons Revenues
Company-owned salon revenues decreased $85.5 million in fiscal year 2018 primarily due to the 2018 Net Salon Count Changes, partly offset by same-store sales increase of 0.5% . The same-store sales increase was due to a 3.4% increase in average ticket price, partly offset by a 2.9% decrease in same-store guest visits.
Company-owned Salon Operating Income
Company-owned salon operating income decreased $28.2 million during fiscal year 2018 primarily due to the January 2018 SmartStyle portfolio restructure consisting of lease termination and other related closure costs and costs associated with returning the salons to pre-occupancy condition. Also contributing to the decrease were state minimum wage increases, costs associated with the SmartStyle marketing campaign, the hurricanes in the southern United States and higher health insurance costs, partly offset by improved stylist productivity, the 2018 Net Salon Count Changes and prior year inventory expense related to salon tools.
Fiscal Year Ended June 30, 2017 Compared with Fiscal Year Ended June 30, 2016
Company-owned Salons Revenues
Company-owned salon revenues decreased $23.5 million in fiscal year 2017 primarily due to the 2017 Net Salon Count Changes and same-store sales decrease of 0.5% . The same-store sales decrease was due to a 4.6% decrease in same-store guest visits, partly offset by a 4.1% increase in average ticket price.
34
Table of Contents
Company-owned Salon Operating Income
Company-owned salon operating income decreased $9.4 million during fiscal year 2017 primarily due to minimum wage increases, unfavorable stylist productivity, same-store sales declines and a one-time inventory write-off related to salon tools, partly offset by the closure of underperforming salons.
Franchise Salons
| Fiscal Years | ||||||||||||||||||||||
| 2018 |
| 2017 |
| 2016 |
| 2018 |
| 2017 |
| 2016 | ||||||||||||
| (Dollars in millions) |
| Increase (Decrease) | ||||||||||||||||||||
Revenue |
|
|
|
|
|
|
|
|
|
|
| ||||||||||||
Product | $ | 34.6 | |
| $ | 30.6 | |
| $ | 31.4 | |
| $ | 4.0 | |
| $ | (0.8 | ) |
| $ | 1.7 | |
Product sold to TBG | 19.1 | |
| - | |
| - | |
| 19.1 | |
| - | |
| - | | ||||||
Total Product | $ | 53.7 | |
| $ | 30.6 | |
| $ | 31.4 | |
| $ | 23.1 | |
| $ | (0.8 | ) |
| $ | 1.7 | |
Royalties and fees (1) | 56.4 | |
| 48.3 | |
| 47.5 | |
| 8.1 | |
| 0.8 | |
| 2.9 | | ||||||
Total franchise salons revenue (2) | $ | 110.1 | |
| $ | 78.9 | |
| $ | 78.9 | |
| $ | 31.1 | |
| $ | - | |
| $ | 4.5 | |
|
|
|
|
|
|
|
|
|
|
|
| ||||||||||||
Operating income | $ | 39.8 | |
| $ | 34.5 | |
| $ | 33.8 | |
| $ | 5.4 | |
| $ | 0.7 | |
| $ | 3.5 | |
Operating income from TBG | 1.6 | |
| - | |
| - | |
| 1.6 | |
| - | |
| - | | ||||||
Total operating income (2) | $ | 41.4 | |
| $ | 34.5 | |
| $ | 33.8 | |
| $ | 6.9 | |
| $ | 0.7 | |
| $ | 3.5 | |
_______________________________________________________________________________
(1) | Total includes $1.2 million of royalties related to TBG during the fiscal year 2018, respectively. |
(2) | Total is a recalculation; line items calculated individually may not sum to total due to rounding. |
Fiscal Year Ended June 30, 2018 Compared with Fiscal Year Ended June 30, 2017
Franchise Salon Revenues
Franchise salon revenues increased $31.1 million during fiscal year 2018 due to a $23.1 million increase in franchise product sales primarily due to product sold to TBG and a $8.1 million increase in royalties and fees. The increase in royalties and fees was primarily due to increased franchised locations and an increase in the number of new salons open during fiscal year 2018. Our franchisees closed 194 salons, constructed (net of relocations) 79 salons and purchased (net of Company buybacks) 1,581 salons from the Company, including 1,132 salons previously included in the Company's mall-based business and International segment during fiscal year 2018 .
Franchise Salon Operating Income
Franchise salon operating income increased $6.9 million during fiscal year 2018 primarily due to the increased number of new franchised locations and increased franchise product sales.
Cash Generated from Refranchised Salons
During fiscal year 2018, the Company generated $11.6 million of cash from refranchising salons (the sale of company-owned salons to franchisees).
Fiscal Year Ended June 30, 2017 Compared with Fiscal Year Ended June 30, 2016
Franchise Salon Revenues
Franchise salon revenues remained flat during fiscal year 2017 due to a $0.8 million increase in royalties and fees, offset by a $0.8 million decrease in franchise product sales. The increase in royalties and fees was primarily due higher royalties from the increased franchised locations, partly offset by lower fees as a result more franchise openings shifting to existing franchisees, who pay lower fees for opening additional salons, and franchise termination revenues in the prior year. Our franchisees closed 93 salons, constructed (net of relocations) 146 salons and purchased (net of Company buybacks) 99 salons from the Company during fiscal year 2017.
35
Table of Contents
Franchise Salon Operating Income
Franchise salon operating income increased $0.7 million during fiscal year 2017 primarily due to lower bad debt expense and higher margins on product sales due to mix, partly offset by higher incentive costs.
Cash Generated from Refranchised Salons
During fiscal year 2017, the Company generated $2.3 million of cash from refranchising salons (the sale of company-owned salons to franchisees).
Corporate
Fiscal Year Ended June 30, 2018 Compared with Fiscal Year Ended June 30, 2017
Corporate Operating Loss (1)
Corporate operating loss of $91.3 million decreased $7.5 million during fiscal year 2018 primarily driven by the prior year including severance related to the termination of former executive officers including the Company's Chief Executive Officer, a current year gain of $8.0 million associated with life insurance proceeds in connection with the passing of a former executive officer and savings realized from Company initiatives, partly offset by higher incentive compensation and severance associated with terminations of former executives and professional fees in the current year.
Fiscal Year Ended June 30, 2017 Compared with Fiscal Year Ended June 30, 2016
Corporate Operating Loss (1)
Corporate operating loss of $98.7 million increased $0.9 million during fiscal year 2017 primarily due to severance related to the termination of former executive officers including the Company's Chief Executive Officer, expense associated with legal settlements, higher professional fees and the planned investments in technical education, offset by lower incentive compensation and cost savings.
_______________________________________________________________________________
(1) | The Corporate operating loss consists primarily of unallocated general and administrative expenses, including expenses associated with salon support, depreciation and amortization related to our corporate headquarters and unallocated insurance, benefit and compensation programs, including stock-based compensation. |
Recent Accounting Pronouncements
Recent accounting pronouncements are discussed in Note 1 to the Consolidated Financial Statements.
LIQUIDITY AND CAPITAL RESOURCES
Sources of Liquidity
Funds generated by operating activities, available cash and cash equivalents, and our borrowing agreements are our most significant sources of liquidity.
As of June 30, 2018 , cash and cash equivalents were $110.4 million , with $92.1 , $17.9 and $0.4 million within the United States, Canada and Europe, respectively.
The Company has a credit agreement which provides for a $295.0 million five-year unsecured revolving credit facility that expires in March 2023, of which $203.5 million was available as of June 30, 2018. See additional discussion under Financing Arrangements.
Uses of Cash
The Company closely manages its liquidity and capital resources. The Company's liquidity requirements depend on key variables, including the level of investment needed to support its business strategies, the performance of the business, capital expenditures, credit facilities and borrowing arrangements and working capital management. Capital expenditures are a component of the Company's cash flow and capital management strategy which can be adjusted in response to economic and other changes to the Company's business environment. The Company has a disciplined approach to capital allocation, which focuses on investing in key priorities to support the Company's multi-year strategic plan as discussed within Part I, Item 1.
36
Table of Contents
Cash Flows
Cash Flows from Operating Activities
During fiscal year 2018 , cash provided by operating activities of $2.3 million , a decrease of $57.7 million compared to the previous fiscal year, was primarily due to the payment of lease termination and other related closure costs associated with the Company's January 2018 SmartStyle portfolio restructure and lower cash volumes generated from salon operations.
During fiscal year 2017 , cash provided by operating activities of $60.1 million , an increase of $4.3 million compared to the previous fiscal year, was primarily due to lower inventory levels in fiscal year 2017, partly offset by lower earnings.
During fiscal year 2016 , cash provided by operating activities of $55.8 million , a decrease of $39.0 million compared to the previous fiscal year, was primarily due to higher inventory levels in fiscal year 2016, enhanced incentive payouts in fiscal year 2016 and lower income tax refunds.
Cash Flows from Investing Activities
During fiscal year 2018 , cash used in investing activities of $1.6 million , was primarily from capital expenditures of $30.7 million and a $0.5 million use of restricted cash, partly offset by proceeds from company-owned life insurance policies of $18.1 million and cash proceeds from sale of salon assets of $11.6 million .
During fiscal year 2017 , cash used in investing activities of $29.1 million , was primarily from capital expenditures of $33.8 million , partly offset by cash proceeds from the sale of salon assets of $2.3 million , a reduction in restricted cash of $1.1 million , cash proceeds from company-owned life insurance policies of $0.9 million and cash proceeds from the sale of the Company's ownership interest in MyStyle of $0.5 million .
During fiscal year 2016 , cash used in investing activities of $17.4 million , was primarily from $31.1 million for capital expenditures, partly offset by a reduction in restricted cash of $9.0 million , cash proceeds from company-owned life insurance policies of $2.9 million and cash proceeds from sale of salon assets of $1.7 million .
Cash Flows from Financing Activities
During fiscal year 2018 , cash used in financing activities of $62.2 million was primarily for repayments of long-term debt relating to the 5.5% senior term notes of $124.2 million , repurchase of common stock of $24.8 million , employee taxes paid for shares withheld of $2.4 million and settlement of equity awards of $0.8 million , partly offset by borrowings on the revolving credit facility of $90.0 million .
During fiscal year 2017 , cash used in financing activities of $6.8 million was primarily for employee taxes paid for shares withheld of $3.7 million and settlement of equity awards of $3.2 million .
During fiscal year 2016 , cash used in financing activities of $102.6 million was primarily for repurchases of common stock of $101.0 million , the purchase of an additional 24% ownership interest in Roosters, MGC International, LLC for $0.8 million and employee taxes paid for shares withheld of $0.8 million .
Financing Arrangements
Financing activities are discussed in Note 7 to the Consolidated Financial Statements. Derivative activities are discussed in Part II, Item 7A, "Quantitative and Qualitative Disclosures about Market Risk."
The Company's financing arrangements consists of the following:
|
|
|
| Interest rate % |
|
|
|
| ||||||
|
|
|
| Fiscal Years |
| June 30, | ||||||||
|
| Maturity Dates |
| 2018 |
| 2017 |
| 2018 |
| 2017 | ||||
|
| (fiscal year) |
|
|
|
|
| (Dollars in thousands) | ||||||
Revolving credit facility, new |
| 2023 |
| 3.3% |
| -% |
| $ | 90,000 | |
| $ | - | |
Revolving credit facility, old |
| N/A |
| -% |
| -% |
| - | |
| - | | ||
Senior term notes |
| N/A |
| 5.5% |
| 5.5% |
| - | |
| 120,599 | | ||
|
|
|
|
|
|
|
| $ | 90,000 | |
| $ | 120,599 | |
37
Table of Contents
In March 2018, the Company entered into a Credit Agreement (Credit Agreement), which provided for a $260.0 million unsecured five-year revolving credit facility (Revolving Credit Facility) that expires in March 2023 and includes, among other things, a maximum consolidated net leverage ratio covenant, a minimum fixed charge coverage ratio covenant, and certain restrictions on liens, investments and other indebtedness. In April 2018, the Company amended and restated the Credit Agreement which increases the Revolving Credit Facility under the Credit Agreement by $35.0 million. After giving effect to the amendment, the revolving commitment under the Credit Facility is $295.0 million. The Revolving Credit Facility includes a $30.0 million subfacility for the issuance of letters of credit and a $30.0 million sublimit for swingline loans. The Company may request an increase in revolving credit commitments under the facility of up to $150.0 million under certain circumstances. The revolving credit facility has variable interest rates tied to LIBOR plus 1.25% to 1.85% and includes a facility fee of 0.25% to 0.40%. Both the LIBOR credit spread and the facility fee are based on the Company's consolidated net leverage ratio.
In connection with entering into the Credit Agreement, the Company terminated its previous $200.0 million revolving credit facility.
In March 2018, the Company redeemed all of its 5.5% senior term notes that were due December 2019 (Senior Term Notes) for $124.2 million, which included a $1.2 million premium. The Company utilized $90.0 million under the Revolving Credit Facility and cash on hand of $34.2 million to repay the Senior Term Notes.
Our debt to capitalization ratio, calculated as the principal amount of debt as a percentage of the principal amount of debt and shareholders' equity at fiscal year-end, was as follows:
As of June 30, |
| Debt to Capitalization |
| Basis Point (Decrease) Increase(1) | ||
2018 |
| 15.2 | % |
| (430 | ) |
2017 |
| 19.5 | |
| 40 | |
2016 |
| 19.1 | |
| 300 | |
_______________________________________________________________________________
(1) | Represents the basis point change in debt to capitalization as compared to prior fiscal year-end (June 30). |
The basis point decrease in the debt to capitalization ratio as of June 30, 2018 compared to June 30, 2017 was primarily due to the net decrease in the principal amount of debt from the redemption of the 5.5% senior term notes, partly offset by utilizing $90.0 million of the revolving credit facility and the repurchase of 1.5 million shares of common stock for $24.8 million .
The basis point increase in the debt to capitalization ratio as of June 30, 2017 compared to June 30, 2016 was primarily due to net reductions to shareholders' equity resulting from net losses and foreign currency translation adjustments.
The basis point increase in the debt to capitalization ratio as of June 30, 2016 compared to June 30, 2015 was primarily due to the repurchase of 7.6 million shares of common stock for $101.0 million .
38
Table of Contents
Contractual Obligations and Commercial Commitments
The following table reflects a summary of obligations and commitments outstanding by payment date as of June 30, 2018 :
|
|
|
| Payments due by period | ||||||||||||||||
Contractual Obligations |
| Total |
| Within 1 year |
| 1 - 3 years |
| 3 - 5 years |
| More than 5 years | ||||||||||
|
|
|
| (Dollars in thousands) | ||||||||||||||||
On-balance sheet: |
|
|
|
|
|
|
|
|
|
| ||||||||||
Debt obligations |
| $ | 90,000 | |
| $ | - | |
| $ | - | |
| $ | 90,000 | |
| $ | - | |
Other long-term liabilities |
| 9,570 | |
| 1,630 | |
| 2,009 | |
| 1,519 | |
| 4,412 | | |||||
Total on-balance sheet |
| 99,570 | |
| 1,630 | |
| 2,009 | |
| 91,519 | |
| 4,412 | | |||||
Off-balance sheet(a): |
|
|
|
|
|
|
|
|
|
| ||||||||||
Operating lease obligations |
| 688,477 | |
| 232,210 | |
| 309,579 | |
| 116,336 | |
| 30,352 | | |||||
Interest on long-term debt |
| - | |
| - | |
| - | |
| - | |
| - | | |||||
Total off-balance sheet |
| 688,477 | |
| 232,210 | |
| 309,579 | |
| 116,336 | |
| 30,352 | | |||||
Total |
| $ | 788,047 | |
| $ | 233,840 | |
| $ | 311,588 | |
| $ | 207,855 | |
| $ | 34,764 | |
_______________________________________________________________________________
(a) | In accordance with accounting principles generally accepted in the United States of America, these obligations are not reflected in the Consolidated Balance Sheet. |
On-Balance Sheet Obligations
Our long-term obligations are composed primarily of our revolving credit facility at June 30, 2018 . In March 2018, the Company redeemed all of its 5.5% senior term notes that were due December 2019.
Other long-term liabilities of $9.6 million include $6.7 million related to a Nonqualified Deferred Salary Plan and a salary deferral program of $2.9 million related to established contractual payment obligations under retirement and severance agreements for a small number of employees.
This table excludes short-term liabilities disclosed on our balance sheet as the amounts recorded for these items will be paid in the next year. We have no unconditional purchase obligations. Also excluded from the contractual obligations table are payment estimates associated with employee health and workers' compensation claims for which we are self-insured. The majority of our recorded liability for self-insured employee health and workers' compensation losses represents estimated reserves for incurred claims that have yet to be filed or settled.
The Company has unfunded deferred compensation contracts covering certain management and executive personnel. Because we cannot predict the timing or amount of future payments related to these contracts, such amounts were not included in the table above. See Note 10 to the Consolidated Financial Statements.
As of June 30, 2018 , we have liabilities for uncertain tax positions. We are not able to reasonably estimate the amount by which the liabilities will increase or decrease over time; however, at this time, we do not expect a significant payment related to these obligations within the next fiscal year. See Note 9 to the Consolidated Financial Statements.
Off-Balance Sheet Arrangements
Operating leases primarily represent long-term obligations for the rental of salons, including leases for company-owned locations, as well as salon franchisee lease obligations of approximately $316.4 million , which are reimbursed to the Company by franchisees. Regarding franchisee subleases, we generally retain the right to the related salon assets, net of any outstanding obligations, in the event of a default by a franchise owner. Management has not experienced and does not expect any material loss to result from these arrangements.
Interest payments on long-term debt are calculated based on the revolving credit facility's rates tied to a LIBOR credit spread and a quarterly facility fee on the average daily amount of the facility (whether used or unused). Both the LIBOR credit spread and the facility fee are based on the Company's debt to EBITDA ratio at the end of each fiscal quarter.
We are a party to a variety of contractual agreements under which we may be obligated to indemnify the other party for certain matters, which indemnities may be secured by operation of law or otherwise, in the ordinary course of business. These contracts primarily relate to our commercial contracts, operating leases and other real estate contracts, financial agreements,
39
Table of Contents
agreements to provide services and agreements to indemnify officers, directors and employees in the performance of their work. While our aggregate indemnification obligation could result in a material liability, we are not aware of any current matter that we expect to result in a material liability.
We do not have other unconditional purchase obligations or significant other commercial commitments such as standby repurchase obligations or other commercial commitments.
We do not have any relationships with unconsolidated entities or financial partnerships, such as entities often referred to as structured finance or special purpose entities, which would have been established for the purpose of facilitating off-balance sheet financial arrangements or other contractually narrow or limited purposes at June 30, 2018 . As such, we are not materially exposed to any financing, liquidity, market or credit risk that could arise if we had engaged in such relationships.
Dividends
In December 2013, the Board of Directors elected to discontinue declaring regular quarterly dividends.
Share Repurchase Program
In May 2000, the Company's Board of Directors (Board) approved a stock repurchase program with no stated expiration date. Since that time and through June 30, 2018, the Board has authorized $450.0 million to be expended for the repurchase of the Company's stock under this program. All repurchased shares become authorized but unissued shares of the Company. The timing and amounts of any repurchases depends on many factors, including the market price of the common stock and overall market conditions. As of June 30, 2018 , 19.9 million shares have been cumulatively repurchased for $414.7 million , and $35.3 million remained outstanding under the approved stock repurchase program.
In August 2018, the Company's Board of Directors authorized an additional $200.0 million for share repurchases.
CRITICAL ACCOUNTING POLICIES
The Consolidated Financial Statements are prepared in conformity with accounting principles generally accepted in the United States of America. In preparing the Consolidated Financial Statements, we are required to make various judgments, estimates and assumptions that could have a significant impact on the results reported in the Consolidated Financial Statements. We base these estimates on historical experience and other assumptions believed to be reasonable under the circumstances. Estimates are considered to be critical if they meet both of the following criteria: (1) the estimate requires assumptions about material matters that are uncertain at the time the accounting estimates are made, and (2) other materially different estimates could have been reasonably made or material changes in the estimates are reasonably likely to occur from period to period. Changes in these estimates could have a material effect on our Consolidated Financial Statements.
Our significant accounting policies can be found in Note 1 to the Consolidated Financial Statements. We believe the following accounting policies are most critical to aid in fully understanding and evaluating our reported financial condition and results of operations.
Goodwill
As of June 30, 2018 and 2017 , the Company-owned reporting unit had $184.8 and $188.9 million of goodwill, respectively, and the Franchise reporting unit had $227.9 and $228.1 million of goodwill, respectively. See Note 4 to the Consolidated Financial Statements. The Company assesses goodwill impairment on an annual basis, during the Company's fourth fiscal quarter, and between annual assessments if an event occurs, or circumstances change, that would more likely than not reduce the fair value of a reporting unit below its carrying amount.
Goodwill impairment assessments are performed at the reporting unit level, which is the same as the Company's operating segments. As part of the new simplification guidance issued by the Financial Accounting Standards Board (FASB), the goodwill assessment involves a one-step comparison of the reporting unit's fair value to its carrying value, including goodwill ("Step 1"). The prior guidance required a hypothetical purchase price allocation as the second step of the goodwill impairment assessment, but this step has been eliminated. If the reporting unit's fair value exceeds its carrying value, no further procedures are required. However, if the reporting unit's fair value is less than the carrying value, an impairment charge is recorded for the difference between the fair value and carrying value of the reporting unit. The Company early adopted this guidance when completing the annual fiscal year 2017 impairment assessment and therefore only completed Step 1 of the goodwill impairment assessment.
In applying the goodwill impairment assessment, the Company may assess qualitative factors to determine whether it is more likely than not that the fair value of the reporting units is less than its carrying value ("Step 0"). Qualitative factors may include, but are not limited to, economic, market and industry conditions, cost factors, and overall financial performance of the
40
Table of Contents
reporting unit. If after assessing these qualitative factors, the Company determines it is "more-likely-than-not" that the carrying value is less than the fair value, then performing Step 1 of the goodwill impairment assessment is unnecessary.
The carrying value of each reporting unit is based on the assets and liabilities associated with the operations of the reporting unit, including allocation of shared or corporate balances among reporting units. Allocations are generally based on the number of salons in each reporting unit as a percent of total company-owned salons or expenses of the reporting unit as a percentage of total company expenses.
The Company calculates estimated fair values of the reporting units based on discounted future cash flows utilizing estimates in annual revenue, service and product margins, fixed expense rates, allocated corporate overhead, corporate-owned and franchise salon counts and long-term growth rates for determining terminal value. Where available and as appropriate, comparative market multiples are used in conjunction with the results of the discounted cash flows. The Company periodically engages third-party valuation consultants to assist in evaluating the Company's estimated fair value calculations.
Following is a description of the goodwill impairment assessments for each of the fiscal years:
Fiscal Year 2018
During the first quarter of fiscal year 2018, the Company experienced a triggering event due to the redefining of its operating segments as the Company's mall-based business and International segment met the criteria to be classified as held for sale and as a discontinued operation as of September 30, 2017. The Company's reporting now consist of two reporting units: Company-owned and Franchise. Prior to this change the Company had four reporting units: North American Value, North American Premium, North American Franchise and International.
Pursuant to the change in operating segments, the Company performed a goodwill impairment assessment on its North American Value reporting unit. The Company assessed qualitative factors to determine whether it is more likely than not that the fair value of the reporting unit was less than its carrying value ("Step 0"). The Company determined it is "more-likely-than-not" that the carrying value of the reporting unit was less than the fair value. Accordingly, the Company did not perform a quantitative analysis. Based on the changes to the operating segment structure, there was no goodwill reallocated from the North American Value reporting unit related to the mall-based business that was subsequently sold as the mall-based business previously included in the North American Value reporting unit was projected to incur future losses. The Company did not perform a goodwill impairment assessment for the North American Franchise reporting unit during the first quarter of fiscal year 2018 as this reporting unit was not impacted by the triggering event. The North American Premium and International reporting units did not have any goodwill.
The Company performs its annual impairment assessment as of April 30. For the fiscal year 2018 annual impairment assessment, due to the transformational efforts completed during the year, the Company elected to forgo the optional Step 0 assessment and performed the quantitative impairment analysis on the Company-owned and Franchise reporting units. The Company compared the carrying value of the reporting units, including goodwill, to their estimated fair value. The results of these assessments indicated that the estimated fair value of our reporting units exceeded their carrying value. The Franchise reporting unit had substantial headroom and the Company-owned reporting unit had headroom of approximately 24%. The fair value of the Company-owned reporting unit was determined based on a discounted cash flow analysis and comparable market multiples. The assumptions used in determining fair value were the number and pace of salons sold to franchisees, proceeds for salon sales, weighted average cost of capital, general and administrative expenses and utilization of net operating loss benefits. We selected the assumptions by considering our historical financial performance and trends, historical salon sale proceeds and estimated salon sale activities. The preparation of our fair value estimate includes uncertain factors and requires significant judgments and estimates which are subject to change. A 100 basis point increase in our weighted average cost of capital within the Company-owned reporting unit would result in a reduction in headroom to approximately 17%.
Other uncertain factors or events exist which may result in a future triggering event and require us to perform an interim impairment analysis with respect to the carrying value of goodwill for the Company-owned reporting unit prior to our annual assessment. These internal and external factors include but are not limited to the following:
• | Changes in the company-owned and franchise expansion strategy, |
• | Future market earnings multiples deterioration, |
• | Our financial performance falls short of our projections due to internal operating factors, |
• | Economic recession, |
• | Reduced salon traffic, |
• | Deterioration of industry trends, |
• | Increased competition, |
• | Inability to reduce general and administrative expenses as company-owned salon count potentially decreases, |
• | Other factors causing our cash flow to deteriorate. |
41
Table of Contents
If the triggering event analysis indicates the fair value of the Company-owned reporting unit has potentially fallen below more than the 24% headroom, we may be required to perform an updated impairment assessment which may result in a non-cash impairment charge to reduce the carrying value of goodwill.
As of June 30, 2018 , the Company's estimated fair value, as determined by the sum of our reporting units' fair value, reconciled within a reasonable range of our market capitalization, which included an assumed control premium of 20.0% .
Assessing goodwill for impairment requires management to make assumptions and to apply judgment, including forecasting future sales and expenses, and selecting appropriate discount rates, which can be affected by economic conditions and other factors that can be difficult to predict. The Company does not believe there is a reasonable likelihood that there will be a material change in the estimates or assumptions it uses to calculate impairment losses of goodwill. However, if actual results are not consistent with the estimates and assumptions used in the calculations, or if there are significant changes to our planned strategy for company-owned salons. the Company may be exposed to future impairment losses that could be material.
Fiscal Year 2017
During the fourth quarter of fiscal year 2017, the Company experienced a triggering event due to the redefining of its operating segments. In connection with the change in operating segment structure, the Company changed its North American reporting units from two reporting units: North American Value and North American Premium, to three reporting units: North American Value, North American Franchise and North American Premium.
Pursuant to the change in operating segments, the Company performed a goodwill impairment assessment on its North American Value reporting unit. The North American Premium and International units did not have any goodwill. The Company compared the carrying value of the North American Value reporting unit, including goodwill, to its estimated fair value. The fair value of the reporting unit exceeded its carrying value by a substantial margin, resulting in no goodwill impairment.
Based on the changes to the Company's operating segment structure, goodwill had been reallocated based on relative fair value to the previous North American Value and North American Franchise reporting units at June 30, 2017 and 2016.
Fiscal Years 2016
During the Company's annual impairment assessment, the Company assessed qualitative factors to determine whether it is more likely than not that the fair value of the reporting units were less than their carrying values ("Step 0"). The Company determined it is "more-likely-than-not" that the carrying values of the reporting units were less than the fair values. Accordingly, the Company did not perform a quantitative analysis.
Long-Lived Assets, Excluding Goodwill
The Company assesses impairment of long-lived assets at the individual salon level, as this is the lowest level for which identifiable cash flows are largely independent of other groups of assets and liabilities, when events or changes in circumstances indicate the carrying value of the assets or the asset grouping may not be recoverable. Factors considered in deciding when to perform an impairment review include significant under-performance of an individual salon in relation to expectations, significant economic or geographic trends, and significant changes or planned changes in our use of the assets. Impairment is evaluated based on the sum of undiscounted estimated future cash flows expected to result from use of the long-lived assets. If the undiscounted estimated cash flows are less than the carrying value of the assets, the Company calculates an impairment charge based on the estimated fair value of the assets. The fair value of the long-lived assets is estimated using a discounted cash flow model based on the best information available, including salon level revenues and expenses. Long-lived asset impairment charges of $11.1 million for fiscal year 2018, have been recorded within depreciation and amortization in the Consolidated Statement of Operations.
Judgments made by management related to the expected useful lives of long-lived assets and the ability to realize undiscounted cash flows in excess of the carrying amounts of such assets are affected by factors such as the ongoing maintenance and improvement of the assets, changes in economic conditions and changes in operating performance. As the ongoing expected cash flows and carrying amounts of long-lived assets are assessed, these factors could cause the Company to realize material impairment charges.
Income Taxes
Deferred income tax assets and liabilities are recognized for the expected future tax consequences of events that have been included in the Consolidated Financial Statements or income tax returns. Deferred income tax assets and liabilities are determined based on the differences between the financial statement and tax basis of assets and liabilities using currently enacted tax rates in effect for the years in which the differences are expected to reverse. A valuation allowance is established for any portion of deferred tax assets that are not considered more likely than not to be realized. The Company evaluates all
42
Table of Contents
evidence, including recent financial performance, the existence of cumulative year losses and our forecast of future taxable income, to assess the need for a valuation allowance against our deferred tax assets. While the determination of whether or not to record a valuation allowance is not fully governed by a specific objective test, accounting guidance places significant weight on recent financial performance.
The Company has a partial valuation allowance on its deferred tax assets amounting to $67.9 and $119.1 million at June 30, 2018 and 2017 , respectively. The Company assesses the realizability of its deferred tax assets on a quarterly basis and will reverse the valuation allowance and record a tax benefit when the Company generates sufficient sustainable pretax earnings to make the realizability of the deferred tax assets more likely than not. In connection with the Tax Cuts and Jobs Act enacted in December 2017, the Company remeasured the deferred tax accounts for the federal rate reduction and recorded a partial valuation allowance release for a total benefit of $68.1 million during the twelve months ended June 30, 2018. See Note 9 to the Consolidated Financial Statements in Part II, Item 8, of this Form 10-K.
The Company reserves for unrecognized tax benefits, interest and penalties related to anticipated tax audit positions in the U.S. and other tax jurisdictions based on an estimate of whether additional taxes will be due. If payment of these amounts ultimately proves to be unnecessary, the reversal of these liabilities would result in tax benefits being recognized in the period in which it is determined that the liabilities are no longer necessary. If the estimate of unrecognized tax benefits, interest and penalties proves to be less than the ultimate assessment, additional expenses would result.
Inherent in the measurement of deferred balances are certain judgments and interpretations of tax laws and published guidance with respect to the Company's operations. Income tax expense is primarily the current tax payable for the period and the change during the period in certain deferred tax assets and liabilities.
Item 7A. Quantitative and Qualitative Disclosures About Market Risk
The primary market risk exposure of the Company relates to changes in interest rates in connection with its debt, specifically the revolving credit facility which bears interest at variable rates based on LIBOR plus an applicable borrowing margin. Additionally, the Company is exposed to foreign currency translation risk related changes in the Canadian dollar and to a lesser extent the British pound. The Company has established policies and procedures that govern the management of these exposures through the use of derivative financial instrument contracts. By policy, the Company does not enter into such contracts for the purpose of speculation. The following details the Company's policies and use of financial instruments.
Interest Rate Risk:
The Company has established an interest rate management policy that attempts to minimize its overall cost of debt, while taking into consideration earnings implications associated with volatility in short-term interest rates. On occasion, the Company uses interest rate swaps to further mitigate the risk associated with changing interest rates and to maintain its desired balances of fixed and floating rate debt. In addition, access to variable rate debt is available through the Company's revolving credit facility. The Company reviews its policy and interest rate risk management quarterly and makes adjustments in accordance with market conditions and the Company's short and long-term borrowing needs. As of June 30, 2018 , the Company had an outstanding variable rate debt of $90.0 million . The Company had an outstanding fixed rate debt balance of $123.0 million at June 30, 2017 . As of June 30, 2018 and 2017, the Company did not have any outstanding interest rate swaps.
Foreign Currency Exchange Risk:
Over 90% of the operations related to Company-owned locations are transacted in United States dollars. However, because a portion of the Company's operations consists of activities outside of the United States, the Company has transactions in other currencies, primarily the Canadian dollar and British pound. In preparing the Consolidated Financial Statements, the Company is required to translate the financial statements of its foreign subsidiaries from the currency in which they keep their accounting records, generally the local currency, into United States dollars. Different exchange rates from period to period impact the amounts of reported income and the amount of foreign currency translation recorded in accumulated other comprehensive income (AOCI). As part of its risk management strategy, the Company frequently evaluates its foreign currency exchange risk by monitoring market data and external factors that may influence exchange rate fluctuations. As a result, the Company may engage in transactions involving various derivative instruments to hedge assets, liabilities and purchases denominated in foreign currencies. As of June 30, 2018 and 2017, the Company did not have any derivative instruments to manage its foreign currency risk.
During fiscal years 2018 , 2017 and 2016 , the foreign currency gain (loss) included in income (loss) from continuing operations was $(0.1) , $0.1 and $0.1 million , respectively. During fiscal year 2018, the Company recognized within discontinued operations a $6.2 million foreign currency translation loss in connection with the Company's liquidation of substantially all foreign entities with British pound denominated currencies.
43
Table of Contents
Item 8. Financial Statements and Supplementary Data
|
|
|
Index to Consolidated Financial Statements: |
|
|
Report of Independent Registered Public Accounting Firm |
| 45 |
Consolidated Balance Sheet as of June 30, 2018 and 2017 |
| 47 |
Consolidated Statement of Operations for each of the three years in the period ended June 30, 2018 |
| 48 |
Consolidated Statement of Comprehensive Loss for each of the three years in the period ended June 30, 2018 |
| 49 |
Consolidated Statement of Shareholders' Equity for each of the three years in the period ended June 30, 2018 |
| 50 |
Consolidated Statement of Cash Flows for each of the three years in the period ended June 30, 2018 |
| 51 |
Notes to Consolidated Financial Statements |
| 52 |
44
Table of Contents
Report of Independent Registered Public Accounting Firm
To the Board of Directors and Shareholders of Regis Corporation
Opinions on the Financial Statements and Internal Control over Financial Reporting
We have audited the accompanying consolidated balance sheets of Regis Corporation and its subsidiaries as of June 30, 2018 and 2017 , and the related consolidated statements of operations, comprehensive income (loss), shareholders' equity and cash flows for each of the three years in the period ended June 30, 2018 , including the related notes (collectively referred to as the "consolidated financial statements"). We also have audited the Company's internal control over financial reporting as of June 30, 2018 , based on criteria established in Internal Control - Integrated Framework (2013) issued by the Committee of Sponsoring Organizations of the Treadway Commission (COSO).
In our opinion, the consolidated financial statements referred to above present fairly, in all material respects, the financial position of the Company as of June 30, 2018 and 2017 , and the results of their operations and their cash flows for each of the three years in the period ended June 30, 2018 in conformity with accounting principles generally accepted in the United States of America. Also in our opinion, the Company maintained, in all material respects, effective internal control over financial reporting as of June 30, 2018 , based on criteria established in Internal Control - Integrated Framework (2013) issued by the COSO.
Basis for Opinions
The Company's management is responsible for these consolidated financial statements, for maintaining effective internal control over financial reporting, and for its assessment of the effectiveness of internal control over financial reporting, included in Management's Report on Internal Control over Financial Reporting appearing under Item 9A. Our responsibility is to express opinions on the Company's consolidated financial statements and on the Company's internal control over financial reporting based on our audits. We are a public accounting firm registered with the Public Company Accounting Oversight Board (United States) ("PCAOB") and are required to be independent with respect to the Company in accordance with the U.S. federal securities laws and the applicable rules and regulations of the Securities and Exchange Commission and the PCAOB.
We conducted our audits in accordance with the standards of the PCAOB. Those standards require that we plan and perform the audits to obtain reasonable assurance about whether the consolidated financial statements are free of material misstatement, whether due to error or fraud, and whether effective internal control over financial reporting was maintained in all material respects.
Our audits of the consolidated financial statements included performing procedures to assess the risks of material misstatement of the consolidated financial statements, whether due to error or fraud, and performing procedures that respond to those risks. Such procedures included examining, on a test basis, evidence regarding the amounts and disclosures in the consolidated financial statements. Our audits also included evaluating the accounting principles used and significant estimates made by management, as well as evaluating the overall presentation of the consolidated financial statements. Our audit of internal control over financial reporting included obtaining an understanding of internal control over financial reporting, assessing the risk that a material weakness exists, and testing and evaluating the design and operating effectiveness of internal control based on the assessed risk. Our audits also included performing such other procedures as we considered necessary in the circumstances. We believe that our audits provide a reasonable basis for our opinions.
45
Table of Contents
Definition and Limitations of Internal Controls over Financial Reporting
A company's internal control over financial reporting is a process designed to provide reasonable assurance regarding the reliability of financial reporting and the preparation of financial statements for external purposes in accordance with generally accepted accounting principles. A company's internal control over financial reporting includes those policies and procedures that (i) pertain to the maintenance of records that, in reasonable detail, accurately and fairly reflect the transactions and dispositions of the assets of the company; (ii) provide reasonable assurance that transactions are recorded as necessary to permit preparation of financial statements in accordance with generally accepted accounting principles, and that receipts and expenditures of the company are being made only in accordance with authorizations of management and directors of the company; and (iii) provide reasonable assurance regarding prevention or timely detection of unauthorized acquisition, use, or disposition of the company's assets that could have a material effect on the financial statements.
Because of its inherent limitations, internal control over financial reporting may not prevent or detect misstatements. Also, projections of any evaluation of effectiveness to future periods are subject to the risk that controls may become inadequate because of changes in conditions, or that the degree of compliance with the policies or procedures may deteriorate.
/s/ PricewaterhouseCoopers LLP
Minneapolis, Minnesota
August 23, 2018
We have served as the Company's auditor since at least 1990. We have not determined the specific year we began serving as auditor of the Company.
46
Table of Contents
REGIS CORPORATION
CONSOLIDATED BALANCE SHEET
(Dollars in thousands, except per share data)
|
| June 30, | ||||||
|
| 2018 |
| 2017 | ||||
ASSETS |
|
|
|
| ||||
Current assets: |
|
|
|
| ||||
Cash and cash equivalents |
| $ | 110,399 | |
| $ | 171,044 | |
Receivables, net |
| 52,430 | |
| 19,683 | | ||
Inventories |
| 79,363 | |
| 98,392 | | ||
Other current assets |
| 47,867 | |
| 48,114 | | ||
Current assets held for sale (Note 2) |
| - | |
| 32,914 | | ||
Total current assets |
| 290,059 | |
| 370,147 | | ||
|
|
|
|
| ||||
Property and equipment, net |
| 105,860 | |
| 123,281 | | ||
Goodwill |
| 412,643 | |
| 416,987 | | ||
Other intangibles, net |
| 10,557 | |
| 11,965 | | ||
Other assets |
| 37,616 | |
| 61,756 | | ||
Long-term assets held for sale (Note 2) |
| - | |
| 27,352 | | ||
Total assets |
| $ | 856,735 | |
| $ | 1,011,488 | |
|
|
|
|
| ||||
LIABILITIES AND SHAREHOLDERS' EQUITY |
|
|
|
| ||||
Current liabilities: |
|
|
|
| ||||
Accounts payable |
| $ | 57,738 | |
| $ | 54,501 | |
Accrued expenses |
| 97,630 | |
| 110,435 | | ||
Current liabilities related to assets held for sale (Note 2) |
| - | |
| 13,126 | | ||
Total current liabilities |
| 155,368 | |
| 178,062 | | ||
|
|
|
|
| ||||
Long-term debt, net |
| 90,000 | |
| 120,599 | | ||
Other noncurrent liabilities |
| 107,875 | |
| 197,374 | | ||
Noncurrent liabilities related to assets held for sale (Note 2) |
| - | |
| 7,232 | | ||
Total liabilities |
| 353,243 | |
| 503,267 | | ||
|
|
|
|
| ||||
Commitments and contingencies (Note 8) |
| |
| | ||||
Shareholders' equity: |
|
|
|
| ||||
Common stock, $0.05 par value; issued and outstanding, 45,258,571 and 46,400,367 common shares at June 30, 2018 and 2017, respectively |
| 2,263 | |
| 2,320 | | ||
Additional paid-in capital |
| 194,436 | |
| 214,109 | | ||
Accumulated other comprehensive income |
| 9,568 | |
| 3,336 | | ||
Retained earnings |
| 297,225 | |
| 288,456 | | ||
|
|
|
|
| ||||
Total shareholders' equity |
| 503,492 | |
| 508,221 | | ||
|
|
|
|
| ||||
Total liabilities and shareholders' equity |
| $ | 856,735 | |
| $ | 1,011,488 | |
The accompanying notes are an integral part of the Consolidated Financial Statements.
47
Table of Contents
REGIS CORPORATION
CONSOLIDATED STATEMENT OF OPERATIONS
(Dollars in thousands, except per share data)
|
| Fiscal Years | ||||||||||
|
| 2018 |
| 2017 |
| 2016 | ||||||
Revenues: |
|
|
|
|
|
| ||||||
Service |
| $ | 899,051 | |
| $ | 960,347 | |
| $ | 978,614 | |
Product |
| 258,666 | |
| 259,822 | |
| 265,796 | | |||
Royalties and fees |
| 56,357 | |
| 48,291 | |
| 47,523 | | |||
|
| 1,214,074 | |
| 1,268,460 | |
| 1,291,933 | | |||
Operating expenses: |
|
|
|
|
|
| ||||||
Cost of service |
| 530,582 | |
| 610,384 | |
| 608,965 | | |||
Cost of product |
| 140,623 | |
| 126,297 | |
| 130,015 | | |||
Site operating expenses |
| 127,249 | |
| 127,797 | |
| 135,139 | | |||
General and administrative |
| 174,045 | |
| 157,335 | |
| 157,012 | | |||
Rent |
| 183,096 | |
| 180,478 | |
| 184,150 | | |||
Depreciation and amortization |
| 58,205 | |
| 52,088 | |
| 52,888 | | |||
Total operating expenses |
| 1,213,800 | |
| 1,254,379 | |
| 1,268,169 | | |||
|
|
|
|
|
|
| ||||||
Operating income |
| 274 | |
| 14,081 | |
| 23,764 | | |||
|
|
|
|
|
|
| ||||||
Other (expense) income: |
|
|
|
|
|
| ||||||
Interest expense |
| (10,492 | ) |
| (8,584 | ) |
| (9,229 | ) | |||
Interest income and other, net |
| 6,670 | |
| 2,831 | |
| 3,713 | | |||
|
|
|
|
|
|
| ||||||
(Loss) income from continuing operations before income taxes and equity in loss of affiliated companies |
| (3,548 | ) |
| 8,328 | |
| 18,248 | | |||
|
|
|
|
|
|
| ||||||
Income tax benefit (expense) |
| 65,434 | |
| (9,224 | ) |
| (9,049 | ) | |||
|
|
|
|
|
|
| ||||||
Equity in loss of affiliated companies, net of income taxes |
| - | |
| - | |
| (14,786 | ) | |||
Income (loss) from continuing operations |
| 61,886 | |
| (896 | ) |
| (5,587 | ) | |||
Loss from discontinued operations, net of income taxes (Note 2) |
| (53,185 | ) |
| (15,244 | ) |
| (5,729 | ) | |||
Net income (loss) |
| $ | 8,701 | |
| $ | (16,140 | ) |
| $ | (11,316 | ) |
|
|
|
|
|
|
| ||||||
Net income (loss) per share: |
|
|
|
|
|
| ||||||
Basic: |
|
|
|
|
|
| ||||||
Income (loss) from continuing operations |
| $ | 1.33 | |
| $ | (0.02 | ) |
| $ | (0.12 | ) |
Loss from discontinued operations |
| (1.14 | ) |
| (0.33 | ) |
| (0.12 | ) | |||
Net income (loss) per share, basic (1) |
| $ | 0.19 | |
| $ | (0.35 | ) |
| $ | (0.23 | ) |
Diluted: |
|
|
|
|
|
| ||||||
Income (loss) from continuing operations |
| $ | 1.32 | |
| $ | (0.02 | ) |
| $ | (0.12 | ) |
Loss from discontinued operations |
| (1.13 | ) |
| (0.33 | ) |
| (0.12 | ) | |||
Net income (loss) per share, diluted (1) |
| $ | 0.18 | |
| $ | (0.35 | ) |
| $ | (0.23 | ) |
Weighted average common and common equivalent shares outstanding: |
|
|
|
|
|
| ||||||
Basic |
| 46,517 | |
| 46,359 | |
| 48,542 | | |||
Diluted |
| 47,035 | |
| 46,359 | |
| 48,542 | | |||
_______________________________________________________________________________
(1) | Total is a recalculation; line items calculated individually may not sum to total due to rounding. |
The accompanying notes are an integral part of the Consolidated Financial Statements.
48
Table of Contents
REGIS CORPORATION
CONSOLIDATED STATEMENT OF COMPREHENSIVE INCOME (LOSS)
(Dollars in thousands)
|
| Fiscal Years | ||||||||||
|
| 2018 |
| 2017 |
| 2016 | ||||||
Net income (loss) |
| $ | 8,701 | |
| $ | (16,140 | ) |
| $ | (11,316 | ) |
Other comprehensive income (loss), net of tax: |
|
|
|
|
|
| ||||||
Foreign currency translation adjustments during the period: |
|
|
|
|
|
| ||||||
Foreign currency translation adjustments |
| (256 | ) |
| (1,889 | ) |
| (4,276 | ) | |||
Reclassification adjustments for losses included in net income (loss) (Note 2) |
| 6,152 | |
| - | |
| - | | |||
Net current period foreign currency translation adjustments |
| 5,896 | |
| (1,889 | ) |
| (4,276 | ) | |||
Recognition of deferred compensation |
| 336 | |
| 157 | |
| (162 | ) | |||
Other comprehensive income (loss) |
| 6,232 | |
| (1,732 | ) |
| (4,438 | ) | |||
Comprehensive income (loss) |
| $ | 14,933 | |
| $ | (17,872 | ) |
| $ | (15,754 | ) |
The accompanying notes are an integral part of the Consolidated Financial Statements.
49
Table of Contents
REGIS CORPORATION
CONSOLIDATED STATEMENT OF SHAREHOLDERS' EQUITY
(Dollars in thousands, except share data)
|
| Common Stock |
| Additional |
| Accumulated Other Comprehensive Income |
| Retained Earnings |
| Total | |||||||||||||
|
| Shares |
| Amount |
|
|
|
| |||||||||||||||
Balance, June 30, 2015 |
| 53,664,366 | |
| $ | 2,683 | |
| $ | 298,396 | |
| $ | 9,506 | |
| $ | 316,859 | |
| $ | 627,444 | |
Net loss |
|
| |
|
| |
|
| |
|
| |
| (11,316 | ) |
| (11,316 | ) | |||||
Foreign currency translation adjustments |
|
| |
|
| |
|
| |
| (4,276 | ) |
|
| |
| (4,276 | ) | |||||
Stock repurchase program |
| (7,647,819 | ) |
| (382 | ) |
| (100,653 | ) |
|
|
|
|
| (101,035 | ) | |||||||
Exercise of SARs & stock options |
| 107 | |
| - | |
| - | |
|
| |
|
| |
| - | | |||||
Stock-based compensation |
|
| |
|
| |
| 9,797 | |
|
| |
|
| |
| 9,797 | | |||||
Shares issued through franchise stock incentive program |
| 22,084 | |
| 1 | |
| 330 | |
|
| |
|
| |
| 331 | | |||||
Recognition of deferred compensation (Note 10) |
|
| |
|
| |
|
| |
| (162 | ) |
|
| |
| (162 | ) | |||||
Net restricted stock activity |
| 115,672 | |
| 6 | |
| (734 | ) |
|
| |
|
| |
| (728 | ) | |||||
Minority interest (Note 1) |
|
|
|
|
| 339 | |
|
|
| (993 | ) |
| (654 | ) | ||||||||
Balance, June 30, 2016 |
| 46,154,410 | |
| 2,308 | |
| 207,475 | |
| 5,068 | |
| 304,550 | |
| 519,401 | | |||||
Net loss |
|
| |
|
| |
|
| |
|
| |
| (16,140 | ) |
| (16,140 | ) | |||||
Foreign currency translation adjustments |
|
| |
|
| |
|
| |
| (1,889 | ) |
|
| |
| (1,889 | ) | |||||
Exercise of SARs & stock options |
| 4,370 | |
| - | |
| (42 | ) |
|
| |
|
| |
| (42 | ) | |||||
Stock-based compensation |
|
| |
|
| |
| 9,991 | |
|
| |
|
| |
| 9,991 | | |||||
Shares issued through franchise stock incentive program |
| 27,819 | |
| 1 | |
| 352 | |
|
| |
|
| |
| 353 | | |||||
Recognition of deferred compensation (Note 10) |
|
| |
|
| |
|
| |
| 157 | |
|
| |
| 157 | | |||||
Net restricted stock activity |
| 213,768 | |
| 11 | |
| (3,667 | ) |
|
| |
|
| |
| (3,656 | ) | |||||
Minority interest (Note 1) |
|
| |
|
| |
| | |
|
| |
| 46 | |
| 46 | | |||||
Balance, June 30, 2017 |
| 46,400,367 | |
| 2,320 | |
| 214,109 | |
| 3,336 | |
| 288,456 | |
| 508,221 | | |||||
Net income |
|
| |
|
| |
|
| |
|
| |
| 8,701 | |
| 8,701 | | |||||
Foreign currency translation adjustments (Note 1) |
|
| |
|
| |
|
| |
| 5,896 | |
|
| |
| 5,896 | | |||||
Stock repurchase program |
| (1,469,057 | ) |
| (74 | ) |
| (24,724 | ) |
|
|
|
|
| (24,798 | ) | |||||||
Exercise of SARs & stock options |
| 33,342 | |
| 2 | |
| (332 | ) |
|
|
|
|
| (330 | ) | |||||||
Stock-based compensation |
|
|
|
|
| 7,475 | |
|
|
|
|
| 7,475 | | |||||||||
Shares issued through franchise stock incentive program |
| 522 | |
| - | |
| 7 | |
|
|
|
|
| 7 | | |||||||
Recognition of deferred compensation (Note 10) |
|
|
|
|
|
|
| 336 | |
|
|
| 336 | | |||||||||
Net restricted stock activity |
| 293,397 | |
| 15 | |
| (2,099 | ) |
|
| |
|
| |
| (2,084 | ) | |||||
Minority interest (Note 1) |
|
| |
|
| |
|
|
|
| |
| 68 | |
| 68 | | ||||||
Balance, June 30, 2018 |
| 45,258,571 | |
| $ | 2,263 | |
| $ | 194,436 | |
| $ | 9,568 | |
| $ | 297,225 | |
| $ | 503,492 | |
The accompanying notes are an integral part of the Consolidated Financial Statements.
50
Table of Contents
REGIS CORPORATION
CONSOLIDATED STATEMENT OF CASH FLOWS
|
| Fiscal Years | ||||||||||
|
| 2018 |
| 2017 |
| 2016 | ||||||
Cash flows from operating activities: |
|
|
|
|
|
| ||||||
Net income (loss) |
| $ | 8,701 | |
| $ | (16,140 | ) |
| $ | (11,316 | ) |
Adjustments to reconcile net income (loss) to net cash provided by operating activities: |
|
|
|
|
|
| ||||||
Non-cash impairment related to discontinued operations |
| 38,826 | |
| - | |
| - | | |||
Depreciation and amortization |
| 39,433 | |
| 40,722 | |
| 42,411 | | |||
Depreciation related to discontinued operations |
| 3,738 | |
| 14,239 | |
| 14,581 | | |||
Equity in loss of affiliated companies |
| - | |
| 81 | |
| 14,783 | | |||
Deferred income taxes |
| (75,863 | ) |
| 7,962 | |
| 7,023 | | |||
Gain on life insurance proceeds |
| (7,986 | ) |
| - | |
| - | | |||
Gain from sale of salon assets to franchisees, net(2) |
| (241 | ) |
| (492 | ) |
| (1,000 | ) | |||
Loss on write down of inventories |
| - | |
| 5,905 | |
| - | | |||
Salon asset impairments |
| 11,092 | |
| 11,366 | |
| 10,478 | | |||
Accumulated other comprehensive income reclassification adjustments (Note 2) |
| 6,152 | |
| - | |
| - | | |||
Stock-based compensation |
| 8,269 | |
| 13,142 | |
| 9,797 | | |||
Amortization of debt discount and financing costs |
| 4,080 | |
| 1,403 | |
| 1,514 | | |||
Other non-cash items affecting earnings |
| (294 | ) |
| 935 | |
| 310 | | |||
Changes in operating assets and liabilities(1): |
|
|
|
|
|
| ||||||
Receivables |
| (12,081 | ) |
| 724 | |
| (577 | ) | |||
Inventories |
| 13,940 | |
| 4,010 | |
| (7,109 | ) | |||
Income tax receivable |
| 527 | |
| (535 | ) |
| 501 | | |||
Other current assets |
| (23 | ) |
| 820 | |
| (460 | ) | |||
Other assets |
| (11,229 | ) |
| (2,586 | ) |
| (1,133 | ) | |||
Accounts payable |
| (1,103 | ) |
| (684 | ) |
| (4,624 | ) | |||
Accrued expenses |
| (12,526 | ) |
| (13,667 | ) |
| (14,280 | ) | |||
Other noncurrent liabilities |
| (11,084 | ) |
| (7,150 | ) |
| (5,113 | ) | |||
Net cash provided by operating activities |
| 2,328 | |
| 60,055 | |
| 55,786 | | |||
Cash flows from investing activities: |
|
|
|
|
|
| ||||||
Capital expenditures |
| (29,571 | ) |
| (26,572 | ) |
| (23,151 | ) | |||
Capital expenditures related to discontinued operations |
| (1,171 | ) |
| (7,271 | ) |
| (7,966 | ) | |||
Proceeds from sale of salon assets to franchisees(2) |
| 11,582 | |
| 2,253 | |
| 1,740 | | |||
Change in restricted cash |
| (524 | ) |
| 1,123 | |
| 9,042 | | |||
Proceeds from company-owned life insurance policies |
| 18,108 | |
| 876 | |
| 2,948 | | |||
Proceeds from sale of investment |
| - | |
| 500 | |
| - | | |||
Net cash used in investing activities |
| (1,576 | ) |
| (29,091 | ) |
| (17,387 | ) | |||
Cash flows from financing activities: |
|
|
|
|
|
| ||||||
Borrowings on revolving credit facilities |
| 90,000 | |
| - | |
| - | | |||
Repayments of long-term debt and capital lease obligations |
| (124,230 | ) |
| - | |
| (2 | ) | |||
Repurchase of common stock |
| (24,798 | ) |
| - | |
| (101,035 | ) | |||
Purchase of noncontrolling interest |
| - | |
| - | |
| (760 | ) | |||
Employee taxes paid for shares withheld |
| (2,413 | ) |
| (3,698 | ) |
| (754 | ) | |||
Settlement of equity awards |
| (794 | ) |
| (3,151 | ) |
| - | | |||
Net cash used in financing activities |
| (62,235 | ) |
| (6,849 | ) |
| (102,551 | ) | |||
Effect of exchange rate changes on cash and cash equivalents |
| (514 | ) |
| 935 | |
| (781 | ) | |||
(Decrease) increase in cash and cash equivalents |
| (61,997 | ) |
| 25,050 | |
| (64,933 | ) | |||
Cash and cash equivalents: |
|
|
|
|
|
| ||||||
Beginning of year |
| 171,044 | |
| 147,346 | |
| 212,279 | | |||
Cash and cash equivalents included in current assets held for sale |
| 1,352 | |
| - | |
| - | | |||
Beginning of year, total cash and cash equivalents |
| 172,396 | |
| 147,346 | |
| 212,279 | | |||
End of year |
| $ | 110,399 | |
| $ | 172,396 | |
| $ | 147,346 | |
(1) | Changes in operating assets and liabilities exclude assets and liabilities sold or acquired. |
(2) Excludes transaction with The Beautiful Group.
The accompanying notes are an integral part of the Consolidated Financial Statements.
51
Table of Contents
NOTES TO CONSOLIDATED FINANCIAL STATEMENTS
1. BUSINESS DESCRIPTION AND SUMMARY OF SIGNIFICANT ACCOUNTING POLICIES
Business Description:
Regis Corporation (the "Company") owns, operates and franchises hairstyling and hair care salons throughout the United States (U.S.), the United Kingdom (U.K.), Canada and Puerto Rico. Substantially all of the hairstyling and hair care salons owned and operated by the Company in the U.S., Canada and Puerto Rico are located in leased space in enclosed mall shopping centers, strip shopping centers or Walmart Supercenters. Franchised salons throughout the U.S. are primarily located in strip shopping centers, Walmart Supercenters and mall-based locations. All salons in the U.K. are Franchised locations and operate in malls, leading department stores, mass merchants and high-street locations.
During the first quarter of fiscal year 2018 , the Company redefined its operating segments to reflect how the chief operating decision maker evaluates the business as a result selling substantially all of its mall-based salon business in North America, representing 858 salons, and substantially all of its previous International segment, representing 250 salons in the UK, to The Beautiful Group ("TBG"), an affiliate of Regent, a private equity firm based in Los Angeles, California, who operates these locations as franchise locations. See additional discussion on these discontinued operations in Note 2 to the Consolidated Financial Statements. Based on the way the chief operating decision maker evaluates the business, the Company has two reportable segments: Company-owned salons and Franchise salons. Prior to this change, the Company had four operating segments: North American Value, North American Premium, North American Franchise and International. See Note 14 to the Consolidated Financial Statements.
Smartstyle Restructuring:
In January 2018, the Company closed 597 non-performing Company owned SmartStyle salons. The action delivers on the Company's commitment to restructure its salon portfolio to improve shareholder value and position the Company for long-term growth. The Company anticipates this action will allow the Company to reallocate capital and human resources to strategically grow its remaining SmartStyle salons with creative new offerings. A summary of costs associated with the SmartStyle salon restructuring for fiscal year 2018 is as follows:
| Financial Line Item |
| Fiscal Year 2018 | ||
|
|
| (Dollars in thousands) | ||
Inventory reserves | Cost of Service |
| $ | 656 | |
Inventory reserves | Cost of Product |
| 586 | | |
Severance | General and administrative |
| 897 | | |
Long-lived fixed asset impairment | Depreciation and amortization |
| 5,460 | | |
Asset retirement obligation | Depreciation and amortization |
| 7,680 | | |
Lease termination and other related closure costs | Rent |
| 27,290 | | |
Deferred rent | Rent |
| (3,291 | ) | |
Total |
|
| $ | 39,278 | |
In addition, the Company recorded approximately $1.9 million of other related costs to the SmartStyle restructuring, primarily warehouse related costs. Substantially all related costs associated with the SmartStyle salon restructuring requiring cash outflow were complete as of June 30, 2018 .
Consolidation:
The Consolidated Financial Statements include the accounts of the Company and its subsidiaries after the elimination of intercompany accounts and transactions. All material subsidiaries are wholly owned. The Company consolidates variable interest entities where it has determined it is the primary beneficiary of those entities' operations.
Variable Interest Entities :
The Company has interests in certain privately held entities through arrangements that do not involve voting interests. Such entities, known as a variable interest entity (VIE), are required to be consolidated by its primary beneficiary. The Company evaluates whether or not it is the primary beneficiary for each VIE using a qualitative assessment that considers the VIE's purpose and design, the involvement of each of the interest holders and the risk and benefits of the VIE.
52
Table of Contents
NOTES TO CONSOLIDATED FINANCIAL STATEMENTS (Continued)
As of June 30, 2018 , the Company has one VIE, Roosters MGC International LLC (Roosters), where the Company is the primary beneficiary. The Company owns an 84.0% ownership interest in Roosters. As of June 30, 2018 , total assets, total liabilities and total shareholders' equity of Roosters were $8.3 , $0.6 and $7.7 million , respectively. Net income attributable to the non-controlling interest in Roosters was immaterial for fiscal years 2018 , 2017 and 2016 . Shareholders' equity attributable to the non-controlling interest in Roosters was $1.0 and $0.9 million as of June 30, 2018 and 2017 , respectively and recorded within retained earnings on the Consolidated Balance Sheet.
The Company accounts for its investment in Empire Eduction Group, Inc. ("EEG") as an equity investment under the voting interest model, as the Company has granted the other shareholder of EEG an irrevocable proxy to vote a certain number of the Company's shares such that the other shareholder of EEG has voting control of 51.0% of EEG's common stock, as well as the right to appoint four of the five members of EEG's Board of Directors. See Note 5 to the Consolidated Financial Statements.
The Company utilized the consolidation of variable interest entities guidance to determine whether or not TBG was a variable interest entity (VIE), and if so, whether the Company was the primary beneficiary of TBG. As of June 30, 2018 , the Company concluded that TBG is a VIE based on the fact that the equity investment at risk in TBG is not sufficient. The Company determined that it is not the primary beneficiary of TBG based on its exposure to the expected losses of TBG and as it is not the variable interest holder that is most closely associated within the relationship and the significance of the activities of TBG. The exposure to loss related to the Company's involvement with TBG is the carrying value of the amounts due from TBG and the guarantee of the operating leases.
Use of Estimates:
The preparation of Consolidated Financial Statements in conformity with accounting principles generally accepted in the United States of America (GAAP) requires management to make certain estimates and assumptions that affect the reported amounts of assets and liabilities and disclosure of contingent assets and liabilities at the date of the financial statements and the reported amounts of revenues and expenses during the reporting period. Actual results could differ from those estimates.
Cash and Cash Equivalents:
Cash equivalents consist of investments in short-term, highly liquid securities having original maturities of three months or less, which are made as a part of the Company's cash management activity. The carrying values of these assets approximate their fair market values. The Company primarily utilizes a cash management system with a series of separate accounts consisting of lockbox accounts for receiving cash, concentration accounts that funds are moved to, and several "zero balance" disbursement accounts for funding of payroll and accounts payable. As a result of the Company's cash management system, checks issued, but not presented to the banks for payment, may create negative book cash balances. There were no checks outstanding in excess of related book cash balances at June 30, 2018 and 2017 .
The Company has restricted cash primarily related to contractual obligations to collateralize its self-insurance programs. The restricted cash arrangement can be canceled by the Company at any time if substituted with letters of credit. The restricted cash balance is classified within other current assets on the Consolidated Balance Sheet.
Receivables and Allowance for Doubtful Accounts:
The receivable balance on the Company's Consolidated Balance Sheet primarily includes credit card receivables and accounts and notes receivable from franchisees. At June 30, 2018 , the receivable balance also included $24.6 million related to the cash surrender value of company-owned life insurance policies surrendered prior to June 30, 2018 . The Company received these proceeds in July 2018. The balance is presented net of an allowance for expected losses (i.e., doubtful accounts), primarily related to receivables from the Company's franchisees. The Company monitors the financial condition of its franchisees and records provisions for estimated losses on receivables when it believes franchisees are unable to make their required payments based on factors such as delinquencies and aging trends.
The allowance for doubtful accounts is the Company's best estimate of the amount of probable credit losses related to existing accounts and notes receivables. As of June 30, 2018 , 2017 and 2016, the allowance for doubtful accounts was $1.2 , $0.8 and $1.3 million , respectively. Activity in the allowance for doubtful accounts during fiscal years 2018, 2017 and 2016 was no t significant.
Inventories:
Inventories of finished goods consist principally of hair care products for retail product sales. A portion of inventories are also used for salon services consisting of hair color, hair care products including shampoo and conditioner and hair care treatments including permanents, neutralizers and relaxers. Inventories are stated at the lower of cost or market, with cost determined on a weighted average cost basis.
53
Table of Contents
NOTES TO CONSOLIDATED FINANCIAL STATEMENTS (Continued)
Physical inventory counts are performed annually in the fourth quarter of the fiscal year for salons. Product and service inventories are adjusted based on the physical inventory counts. During the fiscal year, cost of retail product sold to salon guests is determined based on the weighted average cost of product sold, adjusted for an estimated shrinkage factor. The cost of product used in salon services is determined by applying an estimated percentage of total cost of service to service revenues. These estimates are updated quarterly based on cycle count results for the distribution centers and salons, service sales mix, discounting, special promotions and other factors.
The Company has inventory valuation reserves for excess and obsolete inventories, or other factors that may render inventories unmarketable at their historical costs. Estimates of the future demand for the Company's inventory and anticipated changes in formulas and packaging are some of the other factors used by management in assessing the net realizable value of inventories.
Property and Equipment:
Property and equipment are carried at cost, less accumulated depreciation and amortization. Depreciation of property and equipment is computed using the straight-line method over their estimated useful asset lives ( 30 to 39 years for buildings, 10 years for improvements and three to ten years for equipment, furniture and software). Depreciation expense was $38.1 , $42.7 and $44.4 million in fiscal years 2018 , 2017 and 2016 , respectively.
The Company capitalizes both internal and external costs of developing or obtaining computer software for internal use. Costs incurred to develop internal-use software during the application development stage are capitalized, while data conversion, training and maintenance costs associated with internal-use software are expensed as incurred. Estimated useful lives range from five to seven years .
Expenditures for maintenance and repairs and minor renewals and betterments, which do not improve or extend the life of the respective assets, are expensed. All other expenditures for renewals and betterments are capitalized. The assets and related depreciation and amortization accounts are adjusted for property retirements and disposals with the resulting gain or loss included in operating income. Fully depreciated or amortized assets remain in the accounts until retired from service.
Long-Lived Asset Impairment Assessments, Excluding Goodwill:
The Company assesses impairment of long-lived assets at the individual salon level, as this is the lowest level for which identifiable cash flows are largely independent of other groups of assets and liabilities, when events or changes in circumstances indicate the carrying value of the assets or the asset grouping may not be recoverable. Factors considered in deciding when to perform an impairment review include significant under-performance of an individual salon in relation to expectations, significant economic or geographic trends, and significant changes or planned changes in our use of the assets. Impairment is evaluated based on the sum of undiscounted estimated future cash flows expected to result from use of the long-lived assets. If the undiscounted estimated cash flows are less than the carrying value of the assets, the Company calculates an impairment charge based on the estimated fair value of the assets. The fair value of the long-lived assets is estimated using a discounted cash flow model based on the best information available, including salon level revenues and expenses. Long-lived asset impairment charges are recorded within depreciation and amortization in the Consolidated Statement of Operations.
Judgments made by management related to the expected useful lives of long-lived assets and the ability to realize undiscounted cash flows in excess of the carrying amounts of such assets are affected by factors such as the ongoing maintenance and improvement of the assets, changes in economic conditions and changes in operating performance. As the ongoing expected cash flows and carrying amounts of long-lived assets are assessed, these factors could cause the Company to realize material impairment charges.
Long-lived asset impairment charges of $11.1 , $7.9 and $7.1 million were recorded during fiscal years 2018, 2017 and 2016, respectively, related to continuing operations.
Goodwill:
As of June 30, 2018 and 2017 , the Company-owned reporting unit had $184.8 and $188.9 million of goodwill, respectively, and the Franchise salons reporting unit had $227.9 and $228.1 million of goodwill, respectively. See Note 4 to the Consolidated Financial Statements. The Company assesses goodwill impairment on an annual basis, during the Company's fourth fiscal quarter, and between annual assessments if an event occurs, or circumstances change, that would more likely than not reduce the fair value of a reporting unit below its carrying amount.
54
Table of Contents
NOTES TO CONSOLIDATED FINANCIAL STATEMENTS (Continued)
Goodwill impairment assessments are performed at the reporting unit level, which is the same as the Company's operating segments. As part of the new simplification guidance issued by the Financial Accounting Standards Board (FASB), the goodwill assessment involves a one-step comparison of the reporting unit's fair value to its carrying value, including goodwill ("Step 1"). The prior guidance required a hypothetical purchase price allocation as the second step of the goodwill impairment assessment, but this step has been eliminated. If the reporting unit's fair value exceeds its carrying value, no further procedures are required. However, if the reporting unit's fair value is less than the carrying value, an impairment charge is recorded for the difference between the fair value and carrying value of the reporting unit. The Company early adopted this guidance when completing the annual fiscal year 2017 impairment assessment and therefore only completed Step 1 of the goodwill impairment assessment.
In applying the goodwill impairment assessment, the Company may assess qualitative factors to determine whether it is more likely than not that the fair value of the reporting units is less than its carrying value ("Step 0"). Qualitative factors may include, but are not limited to, economic, market and industry conditions, cost factors, and overall financial performance of the reporting unit. If after assessing these qualitative factors, the Company determines it is "more-likely-than-not" that the carrying value is less than the fair value, then performing Step 1 of the goodwill impairment assessment is unnecessary.
The carrying value of each reporting unit is based on the assets and liabilities associated with the operations of the reporting unit, including allocation of shared or corporate balances among reporting units. Allocations are generally based on the number of salons in each reporting unit as a percent of total company-owned salons or expenses of the reporting unit as a percent of total company expenses.
The Company calculates estimated fair values of the reporting units based on discounted future cash flows utilizing estimates in annual revenue, service and product margins, fixed expense rates, allocated corporate overhead, corporate-owned and franchise salon counts and long-term growth rates for determining terminal value. Where available and as appropriate, comparative market multiples are used in conjunction with the results of the discounted cash flows. The Company periodically engages third-party valuation consultants to assist in evaluating the Company's estimated fair value calculations.
Following is a description of the goodwill impairment assessments for each of the fiscal years:
Fiscal Year 2018
During the first quarter of fiscal year 2018, the Company experienced a triggering event due to the redefining of its operating segments as the Company's mall-based business and International segment met the criteria to be classified as held for sale and as a discontinued operation as of September 30, 2017. The Company's reporting now consist of two reporting units: Company-owned and Franchise. Prior to this change the Company had four reporting units: North American Value, North American Premium, North American Franchise and International.
Pursuant to the change in operating segments, the Company performed a goodwill impairment assessment on its North American Value reporting unit. The Company assessed qualitative factors to determine whether it is more likely than not that the fair value of the reporting unit was less than their carrying values ("Step 0"). The Company determined it is "more-likely-than-not" that the carrying value of the reporting unit was less than the fair value. Accordingly, the Company did not perform a quantitative analysis. Based on the changes to the operating segment structure, there was no goodwill reallocated from the North American Value reporting unit related to the mall-based business that was subsequently sold as the mall-based business previously included in the North American Value reporting unit was projected to incur future losses. The Company did not perform a goodwill impairment assessment for the North American Franchise reporting unit during the first quarter of fiscal year 2018 as this reporting unit was not impacted by the triggering event. The North American Premium and International units did no t have any goodwill.
The Company performs its annual impairment assessment as of April 30. For the fiscal year 2018 annual impairment assessment, due to the transformational efforts completed during the year, the Company elected to forgo the optional Step 0 assessment and performed the quantitative impairment analysis on the Company-owned and Franchise reporting units. The Company compared the carrying value of the reporting units, including goodwill, to their estimated fair value. The results of these assessments indicated that the estimated fair value of our reporting units exceeded their carrying value. The Franchise reporting unit had substantial headroom and the Company-owned reporting unit had headroom of approximately 24% . The fair value of the Company-owned reporting unit was determined based on a discounted cash flow analysis and comparable market multiples. The assumptions used in determining fair value were the number and pace of salons sold to franchisees, proceeds for salon sales, weighted average cost of capital, general and administrative expenses and utilization of net operating loss benefits. We selected the assumptions by considering our historical financial performance and trends, historical salon sale proceeds and estimated salon sale activities. The preparation of our fair value estimate includes uncertain factors and requires significant judgments and estimates which are subject to change. A 100 basis point increase in our weighted average cost of capital within the Company-owned reporting unit would result in a reduction in headroom to approximately 17% .
55
Table of Contents
NOTES TO CONSOLIDATED FINANCIAL STATEMENTS (Continued)
Other uncertain factors or events exist which may result in a future triggering event and require us to perform an interim impairment analysis with respect to the carrying value of goodwill for the Company-owned reporting unit prior to our annual assessment. These internal and external factors include but are not limited to the following:
• | Changes in the company-owned and franchise expansion strategy, |
• | Future market earnings multiples deterioration, |
• | Our financial performance falls short of our projections due to internal operating factors, |
• | Economic recession, |
• | Reduced salon traffic, |
• | Deterioration of industry trends, |
• | Increased competition, |
• | Inability to reduce general and administrative expenses as company-owned salon count potentially decreases, |
• | Other factors causing our cash flow to deteriorate. |
If the triggering event analysis indicates the fair value of the Company-owned reporting unit has potentially fallen below more than the 24% headroom, we may be required to perform an updated impairment assessment which may result in a non-cash impairment charge to reduce the carrying value of goodwill.
As of June 30, 2018 , the Company's estimated fair value, as determined by the sum of our reporting units' fair value, reconciled within a reasonable range of our market capitalization, which included an assumed control premium of 20.0% .
Assessing goodwill for impairment requires management to make assumptions and to apply judgment, including forecasting future sales and expenses, and selecting appropriate discount rates, which can be affected by economic conditions and other factors that can be difficult to predict. The Company does not believe there is a reasonable likelihood that there will be a material change in the estimates or assumptions it uses to calculate impairment losses of goodwill. However, if actual results are not consistent with the estimates and assumptions used in the calculations, or if there are significant changes to the Company's planned strategy for company-owned salons, the Company may be exposed to future impairment losses that could be material.
Fiscal Year 2017
During the fourth quarter of fiscal year 2017, the Company experienced a triggering event due to the redefining of its operating segments, which also coincided with the annual assessment date. See Note 14 to the Consolidated Financial Statements. In connection with the change in operating segment structure, the Company changed its North American reporting units from two reporting units: North American Value and North American Premium, to three reporting units: North American Value, North American Franchise and North American Premium.
Pursuant to the change in operating segments, the Company performed a goodwill impairment assessment on its North American Value reporting unit. The North American Premium and International units do not have any goodwill. The Company compared the carrying value of the North American Value reporting unit, including goodwill, to its estimated fair value. The fair value of the reporting unit exceeded its carrying value by a substantial margin, resulting in no goodwill impairment.
Assessing goodwill for impairment requires management to make assumptions and to apply judgment, including forecasting future sales and expenses, and selecting appropriate discount rates, which can be affected by economic conditions and other factors that can be difficult to predict. The Company does not believe there is a reasonable likelihood that there will be a material change in the estimates or assumptions it uses to calculate impairment losses of goodwill. However, if actual results are not consistent with the estimates and assumptions used in the calculations, the Company may be exposed to future impairment losses that could be material.
Based on the changes to the Company's operating segment structure, goodwill has been reallocated based on relative fair value to the North American Value and North American Franchise reporting units at June 30, 2017 and 2016.
Fiscal Years 2016
During the Company's annual goodwill impairment assessment, the Company assessed qualitative factors to determine whether it is more likely than not that the fair value of the reporting units were less than their carrying value ("Step 0"). The Company determined it is "more-likely-than-not" that the carrying values of the reporting units were less than the fair values. Accordingly, the Company did not perform a two-step quantitative analysis.
56
Table of Contents
NOTES TO CONSOLIDATED FINANCIAL STATEMENTS (Continued)
Investments In Affiliates:
The Company has equity investments in securities of certain privately held entities. The Company accounts for these investments under the equity or cost method of accounting. Investments accounted for under the equity method are recorded at the amount of the Company's investment and adjusted each period for the Company's share of the investee's income or loss. Investments are reviewed for changes in circumstance or the occurrence of events that suggest the Company's investment may not be recoverable. See Note 5 to the Consolidated Financial Statements
During fiscal year 2016, the Company recorded its portion of equity losses from investments in affiliate of $1.8 million and an other than temporary impairment charge of $13.0 million . The other than temporary impairment charge resulted from one investment's significantly lower financial projections in fiscal years 2016 due to continued declines in enrollment, revenue and profitability. The full impairment of this investment followed previous non-cash impairment charges, the investment's impairment of goodwill and its establishment of a deferred tax valuation allowance in prior quarters. The Company did not record any equity income or losses related to its investments during fiscal years 2017 and 2018. The Company will record equity income related to the Company's investment once its cumulative income exceeds its cumulative losses, measured from the date of impairment.
Self-Insurance Accruals:
The Company uses a combination of third party insurance and self-insurance for a number of risks including workers' compensation, health insurance, employment practice liability and general liability claims. The liability represents the Company's estimate of the undiscounted ultimate cost of uninsured claims incurred as of the balance sheet date.
The Company estimates self-insurance liabilities using a number of factors, primarily based on independent third-party actuarially-determined amounts, historical claims experience, estimates of incurred but not reported claims, demographic factors and severity factors.
Although the Company does not expect the amounts ultimately paid to differ significantly from the estimates, self-insurance accruals could be affected if future claims experience differs significantly from historical trends and actuarial assumptions. For fiscal years 2018 , 2017 and 2016 , the Company recorded decreases in expense for changes in estimates related to prior year open policy periods of $1.2 , $1.6 and $1.0 million , respectively. The Company updates loss projections quarterly and adjusts its liability to reflect updated projections. The updated loss projections consider new claims and developments associated with existing claims for each open policy period. As certain claims can take years to settle, the Company has multiple policy periods open at any point in time.
As of June 30, 2018 , the Company had $10.3 and $25.8 million recorded in current liabilities and noncurrent liabilities, respectively, related to the Company's self-insurance accruals. As of June 30, 2017 , the Company had $12.4 and $26.1 million recorded in current liabilities and noncurrent liabilities, respectively, related to the Company's self-insurance accruals.
Deferred Rent and Rent Expense:
The Company leases most salon locations under operating leases. Rent expense is recognized on a straight-line basis over the lease term. Tenant improvement allowances funded by landlord incentives, rent holidays and rent escalation clauses which provide for scheduled rent increases during the lease term or for rental payments commencing at a date other than the date of initial occupancy are recorded in the Consolidated Statements of Operations on a straight-line basis over the lease term (including one renewal period if renewal is reasonably assured based on the imposition of an economic penalty for failure to exercise the renewal option). The difference between the rent due under the stated periods of the lease and the straight-line basis is recorded as deferred rent within accrued expenses and other noncurrent liabilities in the Consolidated Balance Sheet.
For purposes of recognizing incentives and minimum rental expenses on a straight-line basis, the Company uses the date it obtains the legal right to use and control the leased space to begin amortization, which is generally when the Company enters the space and begins to make improvements in preparation of its intended use.
Certain leases provide for contingent rents, which are determined as a percentage of revenues in excess of specified levels. The Company records a contingent rent liability in accrued expenses on the Consolidated Balance Sheet, along with the corresponding rent expense in the Consolidated Statement of Operations, when specified levels have been achieved or when management determines that achieving the specified levels during the fiscal year is probable.
57
Table of Contents
NOTES TO CONSOLIDATED FINANCIAL STATEMENTS (Continued)
Revenue Recognition and Deferred Revenue:
Company-owned salon revenues are recognized at the time when the services are provided. Product revenues are recognized when the guest receives and pays for the merchandise. Revenues from purchases made with gift cards are also recorded when the guest takes possession of the merchandise or services are provided. Gift cards issued by the Company are recorded as a liability (deferred revenue) until they are redeemed.
Product sales by the Company to its franchisees are included within product revenues on the Consolidated Statement of Operations and recorded at the time product is shipped to franchise locations.
Franchise revenues primarily include royalties, initial franchise fees and net rental income. Royalties are recognized as revenue in the month in which franchisee services are rendered. The Company recognizes revenue from initial franchise fees at the time franchise locations are opened, as this is generally when the Company has performed all initial services required under the franchise agreement.
Classification of Expenses:
The following discussion provides the primary costs classified in each major expense category:
Beginning in the first quarter of fiscal year 2018, costs associated with field leaders that were previously recorded within Cost of Service and Site Operating expenses are now categorized within General and Administrative expense as a result of the field reorganization that took place in the first quarter of fiscal year 2018. Previously, field leaders spent most of their time on the salon floor leading and mentoring stylists and serving guests. As reorganized, field leaders now do not work on the salon floor daily. As a result, field leader labor costs are now reported within General and Administrative expenses rather than Cost of Service and their travel costs are reported within General and Administrative expenses rather than Site Operating expenses. This expense classification does not have a financial impact on the Company's reported operating income (loss), reported net (loss) income or cash flows from operations.
Cost of service- labor costs related to salon employees, costs associated with our field supervision (fiscal years 2017 and 2016) and the cost of product used in providing service.
Cost of product- cost of product sold to guests, labor costs related to selling retail product and the cost of product sold to franchisees.
Site operating- direct costs incurred by the Company's salons, such as advertising, workers' compensation, insurance, utilities, travel costs associated with our field supervision (fiscal years 2017 and 2016) and janitorial costs.
General and administrative- costs associated with field supervision (fiscal year 2018), costs associated with salon training, distribution centers and corporate offices (such as salaries and professional fees), including cost incurred to support franchise operations.
Consideration Received from Vendors:
The Company receives consideration for a variety of vendor-sponsored programs. These programs primarily include volume rebates and promotion and advertising reimbursements.
With respect to volume rebates, the Company estimates the amount of rebate it will receive and accrues it as a reduction to the cost of inventory over the period in which the rebate is earned based upon historical purchasing patterns and the terms of the volume rebate program. A quarterly analysis is performed in order to ensure the estimated rebate accrued is reasonable and any necessary adjustments are recorded.
Shipping and Handling Costs:
Shipping and handling costs are incurred to store, move and ship product from the Company's distribution centers to company-owned and franchise locations and include an allocation of internal overhead. Such shipping and handling costs related to product shipped to company-owned locations are included in site operating expenses in the Consolidated Statement of Operations. Shipping and handling costs related to shipping product to franchise locations totaled $6.1 , $3.7 and $3.6 million during fiscal years 2018 , 2017 and 2016 , respectively and are included within general and administrative expenses on the Consolidated Statement of Operations. Any amounts billed to franchisees for shipping and handling are included in product revenues within the Consolidated Statement of Operations.
58
Table of Contents
NOTES TO CONSOLIDATED FINANCIAL STATEMENTS (Continued)
Advertising:
Advertising costs, including salon collateral material, are expensed as incurred. Advertising costs expensed and included in site operating expenses in fiscal years 2018 , 2017 and 2016 was $36.6 , $30.3 and $30.0 million , respectively.
Advertising Funds:
The Company has various franchising programs supporting certain of its franchise salon concepts. Most maintain advertising funds that provide comprehensive advertising and sales promotion support. The Company is required to participate in the advertising funds for company-owned locations under the same salon concept. The Company assists in the administration of the advertising funds. However, a group of individuals consisting of franchisee representatives has control over all of the expenditures and operates the funds in accordance with franchise operating and other agreements.
The Company records advertising expense in the period the company-owned salons make contributions to the respective advertising fund. During fiscal years 2018 , 2017 and 2016 , total Company contributions to the franchise advertising funds totaled $16.9 , $17.2 and $17.5 million , respectively.
The Company records all advertising funds as assets and liabilities within the Company's Consolidated Balance Sheet. As of June 30, 2018 and 2017 , approximately $23.8 and $21.7 million , respectively, representing the advertising funds' assets and liabilities were recorded within total assets and total liabilities in the Company's Consolidated Balance Sheet.
Stock-Based Employee Compensation Plans:
The Company recognizes stock-based compensation expense based on the fair value of the awards at the grant date. Compensation expense is recognized on a straight-line basis over the requisite service period of the award (or to the date a participant becomes eligible for retirement, if earlier). The Company uses option pricing methods that require the input of subjective assumptions, including the expected term, expected volatility, dividend yield and risk-free interest rate.
The Company estimates the likelihood and the rate of achievement for performance sensitive stock-based awards at the end of each reporting period. Changes in the estimated rate of achievement can have a significant effect on the recorded stock-based compensation expense as the effect of a change in the estimated achievement level is recognized in the period the change occurs.
Preopening Expenses:
Non-capital expenditures such as payroll, training costs and promotion incurred prior to the opening of a new location are expensed as incurred.
Sales Taxes:
Sales taxes are recorded on a net basis (rather than as both revenue and an expense) within the Company's Consolidated Statement of Operations.
Income Taxes:
Deferred income tax assets and liabilities are recognized for the expected future tax consequences of events that have been included in the Consolidated Financial Statements or income tax returns. Deferred income tax assets and liabilities are determined based on the differences between the financial statement and tax basis of assets and liabilities using currently enacted tax rates in effect for the years in which the differences are expected to reverse. A valuation allowance is established for any portion of deferred tax assets that are not considered more likely than not to be realized. The Company evaluates all evidence, including recent financial performance, the existence of cumulative year losses and our forecast of future taxable income, to assess the need for a valuation allowance against our deferred tax assets. While the determination of whether or not to record a valuation allowance is not fully governed by a specific objective test, accounting guidance places significant weight on recent financial performance.
The Company has a partial valuation allowance on its deferred tax assets amounting to $67.9 and $119.1 million at June 30, 2018 and 2017 , respectively. The Company assesses the realizability of its deferred tax assets on a quarterly basis and will reverse the valuation allowance and record a tax benefit when the Company generates sufficient sustainable pretax earnings to make the realizability of the deferred tax assets more likely than not. In connection with the Tax Cuts and Jobs Act enacted on December 22, 2017, the Company remeasured the deferred tax accounts for the federal rate reduction and recorded a partial valuation allowance release for a total benefit of $68.1 million during the twelve months ended June 30, 2018. See Note 9 to the Consolidated Financial Statements.
59
Table of Contents
NOTES TO CONSOLIDATED FINANCIAL STATEMENTS (Continued)
The Company reserves for unrecognized tax benefits, interest and penalties related to anticipated tax audit positions in the U.S. and other tax jurisdictions based on an estimate of whether additional taxes will be due. If payment of these amounts ultimately proves to be unnecessary, the reversal of these liabilities would result in tax benefits being recognized in the period in which it is determined that the liabilities are no longer necessary. If the estimate of unrecognized tax benefits, interest and penalties proves to be less than the ultimate assessment, additional expenses would result.
Inherent in the measurement of deferred balances are certain judgments and interpretations of tax laws and published guidance with respect to the Company's operations. Income tax expense is primarily the current tax payable for the period and the change during the period in certain deferred tax assets and liabilities.
Net Income (Loss) Per Share:
The Company's basic earnings per share is calculated as net income (loss) divided by weighted average common shares outstanding, excluding unvested outstanding restricted stock awards and restricted stock units. The Company's dilutive earnings per share is calculated as net income (loss) divided by weighted average common shares and common share equivalents outstanding, which includes shares issuable under the Company's stock option plan and long-term incentive plan and dilutive securities. Stock-based awards with exercise prices greater than the average market value of the Company's common stock are excluded from the computation of diluted earnings per share.
Comprehensive Income (Loss):
Components of comprehensive income (loss) include net income (loss), foreign currency translation adjustments and recognition of deferred compensation, net of tax within shareholders' equity.
Foreign Currency Translation:
The balance sheet, statement of operations and statement of cash flows of the Company's international operations are measured using local currency as the functional currency. Assets and liabilities of these subsidiaries are translated at the exchange rates in effect at each balance sheet date. Translation adjustments arising from the use of differing exchange rates from period to period are included in accumulated other comprehensive income within shareholders' equity. Statement of Operations accounts are translated at the average rates of exchange prevailing during the year. During fiscal years 2018 , 2017 and 2016 , the foreign currency gain (loss) included in income (loss) from continuing operations was $(0.1) , $0.1 and $0.1 million , respectively. During fiscal year 2018, the Company recognized within discontinued operations a $6.2 million foreign currency translation loss in connection with the Company's liquidation of substantially all foreign entities with British pound denominated currencies.
Accounting Standards Recently Issued But Not Yet Adopted by the Company:
Leases
In February 2016, the FASB issued updated guidance requiring organizations that lease assets to recognize the rights and obligations created by those leases on the consolidated balance sheet. The new standard is effective for the Company in the first quarter of fiscal year 2020, with early adoption permitted. The Company is currently evaluating the effect the new standard will have on the Company's consolidated financial statements but expects this adoption will result in a material increase in the assets and liabilities on the Company's consolidated balance sheet.
Revenue from Contracts with Customers
In May 2014, the FASB issued amended guidance for revenue recognition. The new guidance outlines a single comprehensive model for entities to use in accounting for revenue arising from contracts with customers. The core principle of the guidance is that an entity should recognize revenue to depict the transfer of promised goods or services to customers in an amount that reflects the consideration to which the entity expects to be entitled in exchange for those goods and services. Additionally, the guidance requires improved disclosure to help users of financial statements better understand the nature, amount, timing, and uncertainty of revenue that is recognized. The new guidance supersedes most current revenue recognition guidance, including industry-specific guidance, and is effective commencing fiscal year 2019. The guidance allows for either a full retrospective or modified retrospective transition method. The Company currently expects to apply the full retrospective method upon adoption. This guidance will not impact recognition of revenue from salon service or product sales or recognition of continuing royalty revenues from franchisees, which are based on a percentage of franchise sales. Although the Company is in the process of finalizing the impact of adoption, including disclosures and the impact of the prior year restatements, it has determined that the timing of franchise fees and gift card breakage recognition will change. Under the new guidance, initial fees from franchisees will be recognized over the life of the related franchise agreements, approximately 10 years . In fiscal years 2018, 2017 and
60
Table of Contents
NOTES TO CONSOLIDATED FINANCIAL STATEMENTS (Continued)
2016, the Company recognized $8.5 , $4.3 and $4.5 million , respectively, of revenue related to initial fees from franchises, however under the new guidance these fees would have been deferred and recognized over approximately 10 years . Under the new standard, the Company will recognize gift card breakage proportional to redemptions in service and product revenue as opposed to the current classification as other income. The impact to net income related to gift card breakage is not expected to be material. Additionally, under current guidance, advertising fund contributions from franchisees and the related advertising expenditures are reported on a net basis in the Company's Consolidated Statement of Operations. Under the new guidance, the operations of the advertising funds will be included in the Company's Consolidated Statement of Operations. The impact will increase royalty and fee revenue and site operating expense, but is expected to have no impact on operating (loss) income.
Intra-Entity Transfers Other Than Inventory
In October 2016, the FASB issued guidance on the accounting for income tax effects of intercompany transfers of assets other than inventory. The guidance requires entities to recognize the income tax impact of an intra-entity transfer of an asset other than inventory when the transfer occurs, rather than when the assets have been sold to an outside party. The guidance is effective for the Company in the first quarter of fiscal year 2019, with early adoption permitted. The Company does not expect the adoption of this standard to have a material impact on the Company's consolidated financial statements.
Restricted Cash
In November 2016, the FASB issued updated cash flow guidance requiring restricted cash and restricted cash equivalents to be included in the cash and cash equivalent balances in the statement of cash flows. Transfers between cash and cash equivalents and restricted cash will no longer be presented in the statement of cash flows and a reconciliation between the balance sheet and statement of cash flows must be disclosed. The guidance is effective for the Company beginning in the first quarter of fiscal year 2019, with early adoption permitted. The Company is currently evaluating the impact this guidance will have on the Company's consolidated statement of cash flows.
Statement of Cash Flows
In August 2016, the FASB issued updated cash flow guidance clarifying cash flow classification and presentation for certain items. The guidance is effective for the Company beginning in the first quarter of fiscal year 2019, with early adoption permitted. The Company does not expect the adoption of this standard to have a material impact on the Company's consolidated statement of cash flows.
2. DISCONTINUED OPERATIONS
In October 2017, the Company sold substantially all of its mall-based salon business in North America, representing 858 salons, and substantially all of its International segment, representing approximately 250 salons in the UK, to The Bea utiful Group ("TBG"), an affiliate of Regent, a private equity firm based in Los Angeles, California, who will operate these locations as franchise locations. As part of the sale of the mall-based business, TBG agreed to pay for the value of certain inventory and assumed specific liabilities, including lease liabilities. For the International segment, the Company entered into a share purchase agreement with TBG for minimal consideration.
As of September 30, 2017, the Company classified the results of its mall-based business and its International segment as a discontinued operation for all periods presented in the Condensed Consolidated Statement of Operations. The operations of the mall-based business and International segment, which were previously recorded in the North American Value, North American Premium and International reporting segments, have been eliminated from ongoing operations of the Company.
In connection with the sale of the mall-based business and the International segment as part of our held for sale assessment at September 30, 2017, the Company performed an impairment assessment of the asset groups. The Company recognized net impairment charges within discontinued operations based on the difference between the expected sale prices and the carrying value of the asset groups.
61
Table of Contents
NOTES TO CONSOLIDATED FINANCIAL STATEMENTS (Continued)
In March 2018, the Company entered into discussions with TBG regarding a waiver of working capital and prepaid rent payments associated with the original transaction and the financing of certain receivables to assist TBG with its cash flow and operational needs.
Based on the status of these discussions at March 31, 2018 , the Company fully reserved the working capital and prepaid rent amount of $11.7 million , which was recorded within discontinued operations, net of taxes on the Condensed Consolidated Statement of Operations.
In addition, the Company reclassified $8.0 million of accounts receivables due from TBG to other assets as these receivables are expected to be collected more than twelve months in the future. Should the Company need to record reserves against its current and future receivables from TBG, these reserves would be recorded within general and administrative expenses.
The following summarizes the results of our discontinued operations for the periods presented:
|
| Fiscal Years | ||||||||||
|
| 2018 |
| 2017 |
| 2016 | ||||||
|
| (Dollars in thousands) | ||||||||||
Revenues |
| $ | 101,140 | |
| $ | 423,427 | |
| $ | 498,935 | |
|
|
|
|
|
|
| ||||||
Loss from discontinued operations, before income taxes |
| (59,545 | ) |
| (15,163 | ) |
| (5,732 | ) | |||
Income tax benefit on discontinued operations |
| 6,360 | |
| - | |
| - | | |||
Equity in loss of affiliated companies, net of tax |
| - | |
| (81 | ) |
| 3 | | |||
Loss from discontinued operations, net of income taxes |
| $ | (53,185 | ) |
| $ | (15,244 | ) |
| $ | (5,729 | ) |
Included within the $53.2 million loss from discontinued operations for fiscal year 2018 are $43.0 million of asset impairment charges, $6.2 million of cumulative foreign currency translation adjustment associated with the Company's liquidation of substantially all foreign entities with British pound denominated currencies, $3.6 million of loss from operations and $6.8 million of professional fees associated with the transaction, partly offset by a $6.4 million income tax benefit.
Income taxes have been allocated to continuing and discontinued operations based on the methodology required by accounting for income taxes guidance.
The Company utilized the consolidation of variable interest entities guidance to determine whether or not TBG was a variable interest entity (VIE), and if so, whether the Company was the primary beneficiary of TBG. The Company concluded that TBG is a VIE based on the fact that the equity investment at risk in TBG is not sufficient. The Company determined that it is not the primary beneficiary of TBG based on its exposure to the expected losses of TBG and as it is not the variable interest holder that is most closely associated within the relationship and the significance of the activities of TBG. The exposure to loss related to the Company's involvement with TBG is the carrying value of the amounts due from TBG and the guarantee of the operating leases.
Within salon asset impairments presented in the Consolidated Statement of Cash Flows for the fiscal years ended 2017 and 2016, $3.4 million of salon asset impairments were related to discontinued operations in each year. Other than the salon asset impairments and the other items presented in the Consolidated Statement of Cash Flows, there were no other significant non-cash operating activities or any significant non-cash investing activities related to discontinued operations for the fiscal years ended 2018, 2017 and 2016.
62
Table of Contents
NOTES TO CONSOLIDATED FINANCIAL STATEMENTS (Continued)
3. OTHER FINANCIAL STATEMENT DATA
The following provides additional information concerning selected balance sheet accounts:
|
| June 30, | ||||||
|
| 2018 |
| 2017 | ||||
|
| (Dollars in thousands) | ||||||
Other current assets: |
|
|
|
| ||||
Prepaids |
| $ | 27,438 | |
| $ | 27,802 | |
Restricted cash |
| 19,556 | |
| 19,032 | | ||
Other |
| 873 | |
| 1,280 | | ||
|
| $ | 47,867 | |
| $ | 48,114 | |
Property and equipment: |
|
|
|
| ||||
Land |
| $ | 3,864 | |
| $ | 3,864 | |
Buildings and improvements |
| 48,265 | |
| 47,471 | | ||
Equipment, furniture and leasehold improvements |
| 380,196 | |
| 420,656 | | ||
Internal use software |
| 66,046 | |
| 71,054 | | ||
Equipment, furniture and leasehold improvements under capital leases |
| 32,343 | |
| 57,561 | | ||
|
| 530,714 | |
| 600,606 | | ||
Less accumulated depreciation and amortization |
| (393,958 | ) |
| (422,652 | ) | ||
Less amortization of equipment, furniture and leasehold improvements under capital leases |
| (30,896 | ) |
| (54,673 | ) | ||
|
| $ | 105,860 | |
| $ | 123,281 | |
Accrued expenses: |
|
|
|
| ||||
Payroll and payroll related costs |
| $ | 53,949 | |
| $ | 59,192 | |
Insurance |
| 12,891 | |
| 14,876 | | ||
Other |
| 30,790 | |
| 36,367 | | ||
|
| $ | 97,630 | |
| $ | 110,435 | |
Other noncurrent liabilities: |
|
|
|
| ||||
Deferred income taxes |
| $ | 32,229 | |
| $ | 108,187 | |
Deferred rent |
| 20,613 | |
| 29,038 | | ||
Insurance |
| 25,804 | |
| 26,112 | | ||
Deferred benefits |
| 13,377 | |
| 17,302 | | ||
Other |
| 15,852 | |
| 16,735 | | ||
|
| $ | 107,875 | |
| $ | 197,374 | |
63
Table of Contents
NOTES TO CONSOLIDATED FINANCIAL STATEMENTS (Continued)
The following provides additional information concerning other intangibles, net:
|
| June 30, | ||||||||||||||||||||||||||
|
| 2018 |
| 2017 | ||||||||||||||||||||||||
|
| Weighted Average Amortization Periods (1) |
| Cost (2) |
| Accumulated Amortization (2) |
| Net |
| Weighted Average Amortization Periods (1) |
| Cost (2) |
| Accumulated |
| Net | ||||||||||||
|
| (In years) |
| (Dollars in thousands) |
| (In years) |
| (Dollars in thousands) | ||||||||||||||||||||
Brand assets and trade names |
| 31 |
| $ | 8,128 | |
| $ | (4,260 | ) |
| $ | 3,868 | |
| 31 |
| $ | 8,187 | |
| $ | (4,013 | ) |
| $ | 4,174 | |
Franchise agreements |
| 19 |
| 9,763 | |
| (7,712 | ) |
| 2,051 | |
| 19 |
| 9,832 | |
| (7,433 | ) |
| 2,399 | | ||||||
Lease intangibles |
| 20 |
| 13,997 | |
| (9,770 | ) |
| 4,227 | |
| 20 |
| 14,007 | |
| (9,077 | ) |
| 4,930 | | ||||||
Other |
| 21 |
| 1,983 | |
| (1,572 | ) |
| 411 | |
| 21 |
| 1,994 | |
| (1,532 | ) |
| 462 | | ||||||
Total |
| 22 |
| $ | 33,871 | |
| $ | (23,314 | ) |
| $ | 10,557 | |
| 22 |
| $ | 34,020 | |
| $ | (22,055 | ) |
| $ | 11,965 | |
_______________________________________________________________________________
(1) | All intangible assets have been assigned an estimated finite useful life and are amortized on a straight-line basis over the number of years that approximate their expected period of benefit (ranging from three to 40 years ). |
(2) | The change in the gross carrying value and accumulated amortization of other intangible assets is impacted by foreign currency. |
Total amortization expense related to intangible assets during fiscal years 2018 , 2017 and 2016 was approximately $1.4 million in each year. As of June 30, 2018 , future estimated amortization expense related to intangible assets is estimated to be:
Fiscal Year | (Dollars in thousands) | ||
2019 | $ | 1,342 | |
2020 | 1,342 | | |
2021 | 1,216 | | |
2022 | 1,169 | | |
2023 | 1,001 | | |
Thereafter | 4,487 | | |
Total | $ | 10,557 | |
The following provides supplemental disclosures of cash flow activity:
|
| Fiscal Years | ||||||||||
|
| 2018 |
| 2017 |
| 2016 | ||||||
|
| (Dollars in thousands) | ||||||||||
Cash paid (received) for: |
|
|
|
|
|
| ||||||
Interest |
| $ | 7,022 | |
| $ | 7,293 | |
| $ | 7,660 | |
Income taxes, net |
| 2,397 | |
| 2,314 | |
| 2,237 | | |||
Noncash investing activities: |
|
|
|
|
|
| ||||||
Unpaid capital expenditures |
| 9,209 | |
| 2,774 | |
| 6,627 | | |||
64
Table of Contents
NOTES TO CONSOLIDATED FINANCIAL STATEMENTS (Continued)
4. GOODWILL
The table below contains details related to the Company's goodwill:
|
| June 30, | ||||||||||||||||||||||
|
| 2018 |
| 2017 | ||||||||||||||||||||
|
| Gross Carrying Value (2) |
| Accumulated Impairment (1) |
| Net |
| Gross |
| Accumulated Impairment (1) |
| Net | ||||||||||||
|
| (Dollars in thousands) | ||||||||||||||||||||||
Goodwill |
| $ | 486,743 | |
| $ | (74,100 | ) |
| $ | 412,643 | |
| $ | 491,087 | |
| $ | (74,100 | ) |
| $ | 416,987 | |
_______________________________________________________________________________
(1) | In fiscal year 2011 the Company realized a $74.1 million goodwill impairment loss associated with the Company-owned reporting unit (the previous North American Value reporting unit). |
(2) | The change in the gross carrying value of goodwill relates to foreign currency translation adjustments. |
The table below contains details related to the Company's goodwill:
|
| Company-owned |
| Franchise |
| Consolidated | ||||||
|
| (Dollars in thousands) | ||||||||||
Goodwill, net at June 30, 2016 |
| $ | 189,218 | |
| $ | 228,175 | |
| $ | 417,393 | |
Translation rate adjustments |
| (63 | ) |
| (76 | ) |
| (139 | ) | |||
Derecognition related to sale of salon assets to franchisees (1) |
| (267 | ) |
| - | |
| (267 | ) | |||
Goodwill, net at June 30, 2017 |
| 188,888 | |
| 228,099 | |
| 416,987 | | |||
Translation rate adjustments |
| (201 | ) |
| (244 | ) |
| (445 | ) | |||
Derecognition related to sale of salon assets to franchisees (1) |
| (3,899 | ) |
| - | |
| (3,899 | ) | |||
Goodwill, net at June 30, 2018 |
| $ | 184,788 | |
| $ | 227,855 | |
| $ | 412,643 | |
_______________________________________________________________________________
(1) | Goodwill is derecognized for salons sold to franchisees with positive cash flows. The amount of goodwill derecognized is determined by a fraction (the numerator of which is the trailing-twelve months EBITDA of the salon being sold and the denominator of which is the estimated annualized EBITDA of the Company-owned reporting unit) that is applied to the total goodwill balance of the Company-owned reporting unit. |
5. INVESTMENTS IN AFFILIATES
The table below presents summarized financial information of equity method investees:
|
| Greater than 50 Percent Owned | ||||||||||
|
| Fiscal Year | ||||||||||
|
| 2018 |
| 2017 |
| 2016 | ||||||
|
| (Dollars in thousands) | ||||||||||
Summarized Balance Sheet information: |
|
|
|
|
|
| ||||||
Current assets |
| $ | 40,990 | |
| $ | 32,649 | |
| $ | 46,733 | |
Noncurrent assets |
| 37,875 | |
| 39,211 | |
| 42,380 | | |||
Current liabilities |
| 21,897 | |
| 18,385 | |
| 18,160 | | |||
Noncurrent liabilities |
| 23,243 | |
| 12,181 | |
| 28,756 | | |||
Summarized Statement of Operations information: |
|
|
|
|
|
| ||||||
Gross revenue |
| $ | 130,082 | |
| $ | 125,486 | |
| $ | 130,302 | |
Gross profit |
| 40,194 | |
| 41,097 | |
| 34,585 | | |||
Operating (loss) income |
| (2,239 | ) |
| (651 | ) |
| (5,857 | ) | |||
Net (loss) income |
| (2,551 | ) |
| (899 | ) |
| (5,551 | ) | |||
65
Table of Contents
NOTES TO CONSOLIDATED FINANCIAL STATEMENTS (Continued)
Investment in Empire Education Group, Inc.
The Company accounts for its 54.6% ownership interest in EEG as an equity method investment under the voting interest model.
During fiscal year 2016, the Company recorded an other than temporary impairment charge of $13.0 million , which resulted from EEG's significantly lower financial projections due to continued declines in enrollment, revenue and profitability. The full impairment of the investment followed previous non-cash impairment charges, EEG's impairment of goodwill and its establishment of a deferred tax valuation allowance in prior quarters. Prior to the other than temporary impairment charge, the Company recorded a $1.8 million loss for its portion of EEG's losses. The Company has not recorded any equity income or losses related to its investment in EEG subsequent to the impairment. The Company will record equity income related to the Company's investment in EEG once EEG's cumulative income exceeds its cumulative losses, measured from the date of impairment.
While the Company could be responsible for certain liabilities associated with this venture, the Company does not currently expect them to have a material impact on the Company's financial position.
Investment in MY Style
During fiscal year 2017, the Company sold its 27.1% ownership interest in MY Style to MY Style's parent company, Yamano Holdings Corporation for $0.5 million . This ownership interest was previously accounted for as a cost method investment. Associated with the sale, foreign currency translation loss of $0.4 million previously classified within accumulated other comprehensive income was recognized in earnings. The Company also reported a $0.2 million gain associated with the sale within interest income and other, net on the Consolidated Statement of Operations.
6. FAIR VALUE MEASUREMENTS
Fair value measurements are categorized into one of three levels based on the lowest level of significant input used: Level 1 (unadjusted quoted prices in active markets); Level 2 (observable market inputs available at the measurement date, other than quoted prices included in Level 1); and Level 3 (unobservable inputs that cannot be corroborated by observable market data).
Assets and Liabilities Measured at Fair Value on a Recurring Basis
As of June 30, 2018 and June 30, 2017 , the estimated fair value of the Company's cash, cash equivalents, restricted cash, receivables and accounts payable approximated their carrying values. As of June 30, 2018 , the estimated fair value of the Company's debt was $90.0 million and the carrying value was $90.0 million . As of June 30, 2017 , the estimated fair value of the Company's debt was $125.9 million and the carrying value was $123.0 million , excluding the $1.8 million unamortized debt discount and $0.6 million unamortized debt issuance costs. The estimated fair value of the Company's debt is based on Level 2 inputs.
Assets and Liabilities Measured at Fair Value on a Nonrecurring Basis
We measure certain assets, including the Company's equity method investments, tangible fixed and other assets and goodwill, at fair value on a nonrecurring basis when they are deemed to be other than temporarily impaired. The fair values of these assets are determined, when applicable, based on valuation techniques using the best information available, and may include quoted market prices, market comparables, and discounted cash flow projections.
The following impairment charges were based on fair values using Level 3 inputs:
|
| Fiscal Year | ||||||||||
|
| 2018 |
| 2017 |
| 2016 | ||||||
|
| (Dollars in thousands) | ||||||||||
Long-lived assets (1) |
| $ | (11,092 | ) |
| $ | (7,943 | ) |
| $ | (7,057 | ) |
Investment in EEG (2) |
| - | |
| - | |
| (12,954 | ) | |||
_____________________________
(1) | See Note 1 to the Consolidated Financial Statements. |
(2) | See Note 5 to the Consolidated Financial Statements. |
66
Table of Contents
NOTES TO CONSOLIDATED FINANCIAL STATEMENTS (Continued)
7. FINANCING ARRANGEMENTS
The Company's long-term debt consists of the following:
|
|
|
| Interest rate % |
|
|
|
| ||||||
|
|
|
| Fiscal Years |
| June 30, | ||||||||
|
| Maturity Dates |
| 2018 |
| 2017 |
| 2018 |
| 2017 | ||||
|
| (fiscal year) |
|
|
|
|
| (Dollars in thousands) | ||||||
Revolving credit facility, new |
| 2023 |
| 3.34% |
| -% |
| $ | 90,000 | |
| $ | - | |
Revolving credit facility, old |
| N/A |
| -% |
| -% |
| - | |
| - | | ||
Senior term notes |
| N/A |
| 5.5% |
| 5.5% |
| - | |
| 120,599 | | ||
|
|
|
|
|
|
|
| $ | 90,000 | |
| $ | 120,599 | |
The debt agreements contain covenants, including limitations on incurrence of debt, granting of liens, investments, merger or consolidation, certain restricted payments and transactions with affiliates. In addition, the Company must adhere to specified fixed charge coverage and leverage ratios. The Company was in compliance with all covenants and other requirements of our financing arrangements as of June 30, 2018 .
Revolving Credit Facility
In March 2018, the Company entered into a Credit Agreement (Credit Agreement), which provides for a $260.0 million unsecured five -year revolving credit facility (Revolving Credit Facility) that expires in March 2023 and includes, among other things, a maximum consolidated net leverage ratio covenant, a minimum fixed charge coverage ratio covenant, and certain restrictions on liens, investments and other indebtedness. The Revolving Credit Facility includes a $30.0 million subfacility for the issuance of letters of credit and a $30.0 million sublimit for swingline loans. The Company may request an increase in revolving credit commitments under the facility of up to $150.0 million under certain circumstances. The revolving credit facility has variable interest rates tied to LIBOR plus 1.25% to 1.85% and includes a facility fee of 0.25% to 0.40% . Both the LIBOR credit spread and the facility fee are based on the Company's consolidated net leverage ratio.
In April 2018, the Company amended and restated the Credit Agreement which increased the Revolving Credit Facility under the Credit Agreement by $35.0 million . After giving effect to the amendment, the revolving commitment under the Credit Facility is $295.0 million .
As of June 30, 2018 , the Company had $90.0 million of outstanding borrowings under the Revolving Credit Facility. At June 30, 2018 , the Company has outstanding standby letters of credit under the Revolving Credit Facility of $1.5 million primarily related to the Company's self-insurance program, therefore, unused available credit under the facility was $203.5 million .
In connection with entering into the Credit Agreement, the Company terminated its previous $200.0 million revolving credit facility. As a result of terminating the $200.0 million revolving credit facility, the Company recognized $0.1 million of additional interest expense related to unamortized commitment fees during the fiscal year 2018. The Company previously had no outstanding borrowings under this revolving credit facility and outstanding letters of credit under the facility of $1.5 million , primarily related to the Company's self-insurance program, therefore the unused available credit under the facility at June 30, 2017 was $198.5 million .
67
Table of Contents
NOTES TO CONSOLIDATED FINANCIAL STATEMENTS (Continued)
Senior Term Notes
In March 2018, the Company redeemed all of its 5.5% senior term notes that were due December 2019 (Senior Term Notes) for $124.2 million , which included a $1.2 million premium. The Company utilized $90.0 million under the Revolving Credit Facility and cash on hand of $34.2 million to repay the Senior Term Notes. As a result of redeeming the Senior Term Notes, the Company recorded $1.7 million of additional interest expense related to the unamortized debt discount and debt issuance costs during the fiscal year 2018.
The following table contains details related to the Company's Senior Term Notes:
|
| June 30, | ||||||
|
| 2018 |
| 2017 | ||||
|
| (Dollars in thousands) | ||||||
Principal amount on the Senior Term Notes |
| $ | - | |
| $ | 123,000 | |
Unamortized debt discount |
| - | |
| (1,815 | ) | ||
Unamortized debt issuance costs |
| - | |
| (586 | ) | ||
Senior Term Notes, net |
| $ | - | |
| $ | 120,599 | |
8. COMMITMENTS AND CONTINGENCIES
Operating Leases:
The Company leases most of its company-owned salons and some of its corporate facilities and distribution centers under operating leases. The original terms of the salon leases range from one to 20 years , with many leases renewable for additional five to ten year terms at the option of the Company. For most leases, the Company is required to pay real estate taxes and other occupancy expenses. Rent expense for the Company's international department store salons is based primarily on a percentage of sales.
The Company also leases the premises in which the majority of its franchisees operate and has entered into corresponding sublease arrangements with franchisees. These leases, generally with terms of approximately five years , are expected to be renewed on expiration. All additional lease costs are passed through to the franchisees.
Sublease income was $34.0 , $31.5 and $31.4 million in fiscal years 2018 , 2017 and 2016 , respectively. Rent expense on premises subleased was $33.6 , $31.1 and $30.9 million in fiscal years 2018 , 2017 and 2016 , respectively. Rent expense and related rental income on sublease arrangements with franchisees is netted within the rent expense line item on the Consolidated Statement of Operations. In most cases, the amount of rental income related to sublease arrangements with franchisees approximates the amount of rent expense from the primary lease, thereby having no net impact on rent expense or net (loss) income. However, in limited cases, the Company charges a 10.0% mark-up in its sublease arrangements. The net rental income resulting from such arrangements totaled $0.4 , $0.4 , and $0.5 million for fiscal years 2018 , 2017 and 2016 , respectively, and was classified in the royalties and fees caption of the Consolidated Statement of Operations.
The Company has a sublease arrangement for a leased building the Company previously occupied. The aggregate amount of lease payments to be made over the remaining lease term are approximately $3.5 million . The amount of rental income approximates the amount of rent expense, thereby having no material impact on rent expense or net income (loss).
68
Table of Contents
NOTES TO CONSOLIDATED FINANCIAL STATEMENTS (Continued)
Total rent expense, excluding rent expense on premises subleased to franchisees, includes the following:
|
| Fiscal Years | ||||||||||
|
| 2018 |
| 2017 |
| 2016 | ||||||
|
| (Dollars in thousands) | ||||||||||
Minimum rent (1) |
| $ | 157,828 | |
| $ | 154,417 | |
| $ | 156,601 | |
Percentage rent based on sales |
| 4,324 | |
| 4,058 | |
| 4,337 | | |||
Real estate taxes and other expenses |
| 20,944 | |
| 22,003 | |
| 23,212 | | |||
|
| $ | 183,096 | |
| $ | 180,478 | |
| $ | 184,150 | |
_______________________________________________________________________________
(1) | Fiscal year 2018 includes lease termination and other related closure costs of $27.3 million and a deferred rent benefit of $3.3 million related to the restructuring of the company-owned SmartStyle portfolio that occurred in January 2018. |
As of June 30, 2018 , future minimum lease payments (excluding percentage rents based on sales) due under existing noncancelable operating leases are as follows:
Fiscal Year |
| Corporate leases |
| Franchisee leases | ||||
|
| (Dollars in thousands) | ||||||
2019 |
| $ | 129,804 | |
| $ | 102,406 | |
2020 |
| 103,652 | |
| 77,748 | | ||
2021 |
| 71,993 | |
| 56,186 | | ||
2022 |
| 41,196 | |
| 37,202 | | ||
2023 |
| 17,723 | |
| 20,215 | | ||
Thereafter |
| 7,735 | |
| 22,617 | | ||
Total minimum lease payments |
| $ | 372,103 | |
| $ | 316,374 | |
Contingencies:
The Company is self-insured for most workers' compensation, employment practice liability and general liability. Workers' compensation and general liability losses are subject to per occurrence and aggregate annual liability limitations. The Company is insured for losses in excess of these limitations. The Company is also self-insured for health care claims for eligible participating employees subject to certain deductibles and limitations. The Company determines its liability for claims incurred but not reported on an actuarial basis.
Litigation and Settlements:
The Company is a defendant in various lawsuits and claims arising out of the normal course of business. Like certain other large retail employers, the Company has been faced with allegations of purported class-wide consumer and wage and hour violations. Litigation is inherently unpredictable and the outcome of these matters cannot presently be determined. Although the actions are being vigorously defended, the Company could in the future incur judgments or enter into settlements of claims that could have a material adverse effect on its results of operations in any particular period.
69
Table of Contents
NOTES TO CONSOLIDATED FINANCIAL STATEMENTS (Continued)
9. INCOME TAXES
The components of continuing operations (loss) income before income taxes are as follows:
|
| Fiscal Years | ||||||||||
|
| 2018 |
| 2017 |
| 2016 | ||||||
|
| (Dollars in thousands) | ||||||||||
(Loss) income before income taxes: |
|
|
|
|
|
| ||||||
U.S. |
| $ | (10,251 | ) |
| $ | 4,652 | |
| $ | 16,305 | |
International |
| 6,703 | |
| 3,676 | |
| 1,943 | | |||
|
| $ | (3,548 | ) |
| $ | 8,328 | |
| $ | 18,248 | |
The (benefit) provision for income taxes consists of:
|
| Fiscal Years | ||||||||||
|
| 2018 |
| 2017 |
| 2016 | ||||||
|
| (Dollars in thousands) | ||||||||||
Current: |
|
|
|
|
|
| ||||||
U.S. |
| $ | 2,151 | |
| $ | 994 | |
| $ | 819 | |
International |
| 1,894 | |
| 268 | |
| 1,207 | | |||
Deferred: |
|
|
|
|
|
| ||||||
U.S. |
| (69,350 | ) |
| 7,901 | |
| 6,997 | | |||
International |
| (129 | ) |
| 61 | |
| 26 | | |||
|
| $ | (65,434 | ) | | $ | 9,224 | | | $ | 9,049 | |
The provision for income taxes differs from the amount of income tax determined by applying the applicable U.S. statutory rate to earnings (loss) before income taxes, as a result of the following:
|
| Fiscal Years | |||||||
|
| 2018 |
| 2017 |
| 2016 | |||
U.S. statutory rate |
| 28.0 | % |
| 35.0 | % |
| 35.0 | % |
State income taxes, net of federal income tax benefit |
| 37.6 | |
| 6.9 | |
| 3.9 | |
Valuation allowance (1) |
| 1,532.3 | |
| 73.4 | |
| 35.6 | |
Foreign income taxes at other than U.S. rates |
| (1.3 | ) |
| (3.9 | ) |
| (0.3 | ) |
Officer life insurance |
| (3.2 | ) |
| (5.6 | ) |
| (5.2 | ) |
Work Opportunity and Welfare-to-Work Tax Credits |
| 43.7 | |
| (19.1 | ) |
| (16.9 | ) |
Deferred tax rate remeasurement |
| 296.4 | |
| - | |
| - | |
FIN48 - Uncertain tax positions |
| (45.8 | ) |
| - | |
| - | |
Stock-based compensation |
| (45.4 | ) |
| 17.9 | |
| - | |
Other, net (2) |
| 2.0 | |
| 6.2 | |
| (2.5 | ) |
|
| 1,844.3 | % |
| 110.8 | % |
| 49.6 | % |
_______________________________________________________________________________
(1) See Note 1 to the Consolidated Financial Statements.
(2) The 2.0% of Other, net in fiscal year 2018 does not include the rate impact of any items in excess of 5% of computed tax.
The 6.2% of Other, net in fiscal year 2017 includes the rate impact of meals and entertainment expense disallowance, adjustments resulting from charitable contributions and miscellaneous items of 4.5% , 7.1% , and (5.4)% , respectively. Miscellaneous items do not include any items in excess of 5% of computed tax.
The (2.5)% of Other, net in fiscal year 2016 does not include the rate impact of any items in excess of 5% of computed tax.
70
Table of Contents
NOTES TO CONSOLIDATED FINANCIAL STATEMENTS (Continued)
The components of the net deferred tax assets and liabilities are as follows:
|
| June 30, | ||||||
|
| 2018 |
| 2017 | ||||
|
| (Dollars in thousands) | ||||||
Deferred tax assets: |
|
|
|
| ||||
Deferred rent |
| $ | 5,251 | |
| $ | 13,581 | |
Payroll and payroll related costs |
| 14,083 | |
| 24,519 | | ||
Net operating loss carryforwards |
| 41,570 | |
| 28,378 | | ||
Tax credit carryforwards |
| 35,102 | |
| 32,852 | | ||
Inventories |
| 1,103 | |
| 1,930 | | ||
Fixed assets |
| 1,036 | |
| 6,419 | | ||
Accrued advertising |
| 2,211 | |
| 2,723 | | ||
Insurance |
| 1,893 | |
| 4,153 | | ||
Other |
| 13,185 | |
| 7,499 | | ||
Subtotal |
| $ | 115,434 | | | $ | 122,054 | |
Valuation allowance |
| (67,912 | ) |
| (119,082 | ) | ||
Total deferred tax assets |
| $ | 47,522 | | | $ | 2,972 | |
Deferred tax liabilities: |
|
|
|
| ||||
Goodwill and intangibles |
| $ | (72,670 | ) |
| $ | (103,761 | ) |
Other |
| (7,081 | ) |
| (7,398 | ) | ||
Total deferred tax liabilities |
| $ | (79,751 | ) |
| $ | (111,159 | ) |
Net deferred tax liability |
| $ | (32,229 | ) |
| $ | (108,187 | ) |
In December 2017, the U.S. government enacted comprehensive tax legislation commonly referred to as the Tax Cuts and Jobs Act (the "Tax Act"). The Tax Act makes broad and complex changes to the U.S. tax code including, but not limited to, (1) reducing the U.S. federal corporate tax rate from 35 percent to 21 percent; (2) changing rules related to net operating losses ("NOL") carryforwards and carrybacks; (3) eliminating the corporate alternative minimum tax ("AMT") and changing how existing AMT credits can be realized; (4) requiring companies to pay a one-time transition tax on certain unrepatriated earnings of foreign subsidiaries; (5) generally eliminating U.S. federal income taxes on dividends from foreign subsidiaries; (6) allowing full expensing of qualified property; (7) creating a new base erosion anti-abuse minimum tax ("BEAT") and provisions designed to tax global intangible low-taxed income ("GILTI"); (8) adding rules that limit the deductibility of interest expense; and (9) adding new provisions that further restrict the deductibility of certain executive compensation.
Due to the Company's fiscal year end, different provisions of the Tax Act will become applicable at varying dates. Nonetheless, the Company is required to recognize the effects of the rate change and enacted legislation on its deferred tax assets and liabilities in the period of enactment.
The SEC staff issued Staff Accounting Bulletin ("SAB") 118, which provides guidance on accounting for the tax effects of the Tax Act. SAB 118 provides a measurement period that should not extend beyond one year from the Tax Act enactment date for companies to complete the accounting under Accounting Standards Codification (ASC) 740. In accordance with SAB 118, a company must reflect the income tax effects of those aspects of the Tax Act for which the accounting under ASC 740 is complete. To the extent that a company's accounting for certain income tax effects of the Tax Act is incomplete but it is able to determine a reasonable estimate, it must record a provisional estimate in the financial statements. If a company cannot determine a provisional estimate to be included in the financial statements, it should continue to apply ASC 740 on the basis of the provisions of the tax laws that were in effect immediately before the enactment of the Tax Act.
In connection with the Tax Act, the Company recorded a provisional net tax benefit of $68.1 million in continuing operations for the twelve months ended June 30, 2018. The $68.1 million net tax benefit is comprised of $30.5 million for the partial release of the U.S. valuation allowance and $37.6 million associated with remeasurement of the deferred tax accounts. The benefit recognized on current losses and the partial valuation allowance release is solely attributable to tax reform and the law change that allows for the indefinite carryforward of NOLs arising in tax years ending after December 31, 2017. Prior law
71
Table of Contents
NOTES TO CONSOLIDATED FINANCIAL STATEMENTS (Continued)
limited the carryforward period to 20 years. As a result of the new tax rules, the Company can now consider its indefinite lived deferred tax liabilities as a source of income to support the realization of its existing deferred tax assets that upon reversal are expected to generate indefinite lived NOLs. Consequently, the Company is able to remove the valuation allowance associated with these deferred tax assets. The Company continues to maintain a valuation allowance on the historical balance of its finite lived federal NOLs, tax credits and various state tax attributes. We are still analyzing certain aspects of the Tax Act and refining our calculations, which could potentially affect the measurement of our deferred tax balances and ultimately cause us to revise our provisional estimate in future periods in accordance with SAB 118. In addition, changes in interpretations, assumptions, and guidance regarding the new tax legislation, as well as the potential for technical corrections to the Tax Act, could have a material impact to the Company's effective tax rate in future periods.
At June 30, 2018, the Company has tax effected federal, state, Canada and U.K. net operating loss carryforwards of approximately $28.2 , $12.7 , $0.5 and $0.2 million , respectively. The federal loss carryforward will expire from fiscal years 2034 to 2037. The state loss carryforwards will expire from fiscal years 2019 to 2038. The Canada loss carryforward will expire from fiscal years 2036 to 2038. The U.K. loss carryforward has no expiration.
The Company's tax credit carryforward of $35.1 million consists of $33.1 million that will expire from fiscal years 2030 to 2038, $0.5 million that will expire from fiscal years 2020 to 2028 and $1.5 million of carryforward that has no expiration date.
As of June 30, 2018, the Company has not provided deferred taxes on approximately $14.5 million of undistributed earnings of attributable to its international subsidiaries that have been considered to be reinvested indefinitely. The Company has multiple avenues to repatriate these earnings tax efficiently and therefore it does not expect to incur significant U.S. or foreign income taxes upon repatriation.
The Company files tax returns and pays tax primarily in the U.S., Canada, the U.K. and Luxembourg as well as states, cities, and provinces within these jurisdictions. The IRS examination associated with the Company's U.S. federal income tax returns for fiscal years 2010 through 2013 was finalized during fiscal year 2018. Closure of the examination resulted in adjustments to existing tax attributes and did not result in any cash outflow. The Company is no longer subject to IRS examinations for years before 2013. With limited exceptions, the Company is no longer subject to state and international income tax examination by tax authorities for years before 2012.
A rollforward of the unrecognized tax benefits is as follows:
|
| Fiscal Years | ||||||||||
|
| 2018 |
| 2017 |
| 2016 | ||||||
|
| (Dollars in thousands) | ||||||||||
Balance at beginning of period |
| $ | 1,388 | |
| $ | 1,357 | |
| $ | 1,496 | |
Additions based on tax positions related to the current year |
| 553 | |
| 259 | |
| 138 | | |||
Additions based on tax positions of prior years |
| 1,608 | |
| 80 | |
| 170 | | |||
Reductions on tax positions related to the expiration of the statute of limitations |
| (177 | ) |
| (179 | ) |
| (207 | ) | |||
Settlements |
| (345 | ) |
| (129 | ) |
| (240 | ) | |||
Balance at end of period |
| $ | 3,027 | |
| $ | 1,388 | |
| $ | 1,357 | |
If the Company were to prevail on all unrecognized tax benefits recorded, a benefit of approximately $2.4 million would be recorded in the effective tax rate. Interest and penalties associated with unrecognized tax benefits are recorded within income tax expense. During the fiscal years 2018, 2017 and 2016, we recorded interest and penalties of approximately $0.1 million as additions to the accrual net of the respective reversal of previously accrued interest and penalties. As of June 30, 2018, the Company had accrued interest and penalties related to unrecognized tax benefits of $1.2 million . This amount is not included in the gross unrecognized tax benefits noted above.
It is reasonably possible the amount of the unrecognized tax benefit with respect to certain of our unrecognized tax positions will increase or decrease during the next fiscal year. However, an estimate of the amount or range of the change cannot be made at this time.
72
Table of Contents
NOTES TO CONSOLIDATED FINANCIAL STATEMENTS (Continued)
10. BENEFIT PLANS
Regis Retirement Savings Plan:
The Company maintains a defined contribution 401(k) plan, the Regis Retirement Savings Plan (RRSP). The RRSP is a defined contribution profit sharing plan with a 401(k) feature that is intended to qualify under Section 401(a) of the Internal Revenue Code (Code) and is subject to the Employee Retirement Income Security Act of 1974 (ERISA).
The 401(k) portion of the RRSP is a cash or deferred arrangement intended to qualify under section 401(k) of the Code and under which eligible employees may elect to contribute a percentage of their eligible compensation. Employees who are 18 years of age or older and who were not highly compensated employees as defined by the Code during the preceding RRSP year are eligible to participate in the RRSP commencing with the first day of the month following their completion of one month of service.
The discretionary employer contribution profit sharing portion of the RRSP is a noncontributory defined contribution component covering full-time and part-time employees of the Company who have at least one year of eligible service, defined as 1,000 hours of service during the RRSP year, are employed by the Company on the last day of the RRSP year and are employed at Salon Support, distribution centers, as field leaders, artistic directors or consultants, and that are not highly compensated employees as defined by the Code. Participants' interest in the noncontributory defined contribution component become 20.0% vested after completing two years of service with vesting increasing 20.0% for each additional year of service, and with participants becoming fully vested after six full years of service.
Nonqualified Deferred Salary Plan:
The Company maintains a Nonqualified Deferred Salary Plan (Executive Plan), which covers Company officers and all other employees who are highly compensated as defined by the Code. The discretionary employer contribution portion of the Executive Plan is a profit sharing component in which a participant's interest becomes 20.0% vested after completing two years of service with vesting increasing 20.0% for each additional year of service, and with participants becoming fully vested after six full years of service. Certain participants within the Executive Plan also receive a matching contribution from the Company.
Regis Individual Secured Retirement Plan (RiSRP):
The Company maintains a Regis Individual Secured Retirement Plan (RiSRP), pursuant to which eligible employees may use post-tax dollars to purchase life insurance benefits. Salon Support employees at the director level and above, as well as regional vice presidents, are eligible to participate. The Company may make discretionary contributions on behalf of participants within the RiSRP, which may be calculated as a matching contribution. The participant is the owner of the life insurance policy under the RiSRP.
Stock Purchase Plan:
The Company has an employee stock purchase plan (ESPP) available to qualifying employees. Under the terms of the ESPP, eligible employees may purchase the Company's common stock through payroll deductions. The Company contributes an amount equal to 15.0% of the purchase price of the stock to be purchased on the open market and pays all expenses of the ESPP and its administration, not to exceed an aggregate contribution of $11.8 million . As of June 30, 2018 , the Company's cumulative contributions to the ESPP totaled $10.8 million .
Deferred Compensation Contracts:
The Company has unfunded deferred compensation contracts covering certain current and former key executives. Effective June 30, 2012, these contracts were amended and the benefits were frozen.
Expense associated with the deferred compensation contracts included in general and administrative expenses on the Consolidated Statement of Operations totaled $0.2 million for fiscal years 2018 , 2017 and 2016 .
73
Table of Contents
NOTES TO CONSOLIDATED FINANCIAL STATEMENTS (Continued)
|
| June 30, | ||||||
|
| 2018 |
| 2017 | ||||
|
| (Dollars in thousands) | ||||||
Current portion (included in accrued liabilities) |
| $ | 1,960 | |
| $ | 1,658 | |
Long-term portion (included in other noncurrent liabilities) |
| 4,342 | |
| 5,163 | | ||
|
| $ | 6,302 | |
| $ | 6,821 | |
The accumulated other comprehensive income (loss) for the deferred compensation contracts, consisting of primarily unrecognized actuarial income, was $1.0 and $0.7 million at June 30, 2018 and 2017 , respectively.
The Company had previously agreed to pay the former Vice Chairman an annual amount for the remainder of his life. Additionally, the Company has a survivor benefit plan for the former Vice Chairman's spouse. In October 2013, the former Vice Chairman passed away and the Company began paying survivor benefits to his spouse. Estimated associated costs included in general and administrative expenses on the Consolidated Statement of Operations totaled $0.3 , $0.3 and $0.2 million for fiscal years 2018 , 2017 and 2016 , respectively. Related obligations totaled $2.6 and $2.8 million at June 30, 2018 and 2017 , respectively, with $0.5 million within accrued expenses at June 30, 2018 and 2017 , respectively and the remainder included in other noncurrent liabilities in the Consolidated Balance Sheet.
In connection with the passing of former employees in fiscal year 2018, 2017 and 2016, the Company received $18.1 , $0.9 and $2.9 million , respectively, in life insurance proceeds. The Company recorded gains of $8.0 , $0.1 and $1.2 million in fiscal year 2018, 2017, and 2016, respectively, in general and administrative in the Consolidated Statement of Operations associated with the proceeds.
Compensation expense included in income (loss) from continuing operations before income taxes and equity in loss of affiliated companies related to the aforementioned plans, excluding amounts paid for expenses and administration of the plans included the following:
|
| Fiscal Years | ||||||||||
|
| 2018 |
| 2017 |
| 2016 | ||||||
|
| (Dollars in thousands) | ||||||||||
Executive plans |
| $ | 135 | |
| $ | 249 | |
| $ | 289 | |
ESPP |
| 204 | |
| 280 | |
| 301 | | |||
Deferred compensation contracts |
| 578 | |
| 514 | |
| 402 | | |||
11. EARNINGS PER SHARE
The Company's basic earnings per share is calculated as net income (loss) divided by weighted average common shares outstanding, excluding unvested outstanding restricted stock awards, RSUs and PSUs. The Company's diluted earnings per share is calculated as net income (loss) divided by weighted average common shares and common share equivalents outstanding, which includes shares issued under the Company's stock-based compensation plans. Stock-based awards with exercise prices greater than the average market price of the Company's common stock are excluded from the computation of diluted earnings per share.
For fiscal year 2018 , 518,236 common stock equivalents of dilutive common stock were included in the diluted earnings per share calculation due to the net income from continuing operations. For fiscal years 2017 and 2016 , 728,223 and 446,992 , respectively, of common stock equivalents of dilutive common stock were not included in the diluted earnings per share calculation due to the net loss from continuing operations.
The computation of weighted average shares outstanding, assuming dilution, excluded the following stock-based awards as they were not dilutive under the treasury stock method:
|
| Fiscal Year | |||||||
|
| 2018 |
| 2017 |
| 2016 | |||
Equity-based compensation awards |
| 634,292 | |
| 2,407,158 | |
| 2,133,675 | |
74
Table of Contents
NOTES TO CONSOLIDATED FINANCIAL STATEMENTS (Continued)
12. STOCK-BASED COMPENSATION
The Company grants long-term equity-based awards under the 2016 Long Term Incentive Plan (the 2016 Plan). The 2016 Plan, which was approved by the Company's shareholders at its 2016 Annual Meeting, provides for the granting of nonqualified stock options, equity-based stock appreciation rights (SARs), restricted stock awards (RSAs), restricted stock units (RSUs) and stock-settled performance units (PSUs), as well as cash-based performance grants, to employees and non-employee directors of the Company. Under the 2016 Plan, a maximum of 3,500,000 shares were approved for issuance. The 2016 Plan incorporates a fungible share design, under which full value awards (such as RSUs and PSUs) count against the shares reserved for issuance at a rate 2.4 times higher than appreciation awards (such as SARs and stock options). As of June 30, 2018, a maximum of 4,500,278 shares were available for grant under the 2016 Plan. All unvested awards are subject to forfeiture in event of termination of employment, unless accelerated. SAR and RSU awards granted under the 2016 Plan generally include various acceleration terms, including upon retirement for participants aged sixty-two years or older or who are aged fifty-five or older and have fifteen years of continuous service.
The Company also has outstanding awards under the Amended and Restated 2004 Long Term Incentive Plan (the "2004 Plan"), although the 2004 Plan terminated in October 2016 and no additional awards have since been or will be made under the 2004 Plan. The 2004 Plan provided for the granting of nonqualified stock options, equity-based stock appreciation rights (SARs), restricted stock awards (RSAs), restricted stock units (RSUs) and stock-settled performance share units (PSUs), as well as cash-based performance grants, to employees and non-employee directors of the Company.
Under the 2016 Plan and the 2004 Plan, stock-based awards are granted at an exercise price or initial value equal to the fair market value on the date of grant.
Using the fair value of each grant on the date of grant, the weighted average fair values per stock-based compensation award granted during fiscal years 2018 , 2017 and 2016 were as follows:
|
| 2018 |
| 2017 |
| 2016 | ||||||
SARs |
| $ | - | |
| $ | 3.68 | |
| $ | 3.51 | |
RSAs & RSUs |
| 13.43 | |
| 11.73 | |
| 11.18 | | |||
PSUs |
| 15.74 | |
| 12.28 | |
| 12.11 | | |||
The fair value of SARs granted are estimated on the date of grant using the Black-Scholes-Merton (BSM) option valuation model. The significant assumptions used in determining the estimated fair value of SARs granted during fiscal years 2018 , 2017 and 2016 were as follows:
|
| 2018 |
| 2017 |
| 2016 |
Risk-free interest rate |
| N/A |
| 1.99% |
| 1.71% |
Expected term (in years) |
| N/A |
| 6.50 |
| 6.00 |
Expected volatility |
| N/A |
| 31.50% |
| 30.00% |
Expected dividend yield |
| N/A |
| 0% |
| 0% |
The fair value of market-based RSUs and PSUs granted are estimated on the date of grant using a Monte Carlo valuation model. The significant assumptions used in determining the estimated fair value of the market-based awards granted during fiscal years 2018 , 2017 and 2016 were as follows:
|
| 2018 |
| 2017 |
| 2016 |
Risk-free interest rate |
| 1.66 - 2.59% |
| 1.21% |
| N/A |
Expected volatility |
| 33.4 - 37.1% |
| 36.5% |
| N/A |
Expected dividend yield |
| 0% |
| 0% |
| N/A |
The risk free interest rate is determined based on the U.S. Treasury rates approximating the expected life of the SARs and market-based RSUs and PSUs granted. Expected volatility is established based on historical volatility of the Company's stock price. Estimated expected life was based on an analysis of historical stock awards granted data which included analyzing grant activity including grants exercised, expired and canceled. The expected dividend yield is determined based on the Company's annual dividend amount as a percentage of the strike price at the time of the grant. The Company uses historical data to estimate pre-vesting forfeiture rates.
75
Table of Contents
NOTES TO CONSOLIDATED FINANCIAL STATEMENTS (Continued)
|
| 2018 |
| 2017 |
| 2016 | ||||||
SARs |
| $ | 2,252 | |
| $ | 3,533 | |
| $ | 2,774 | |
RSAs, RSUs, & PSUs |
| 6,017 | |
| 9,609 | |
| 7,023 | | |||
Total stock-based compensation expense (recorded in G&A) |
| 8,269 | |
| 13,142 | |
| 9,797 | | |||
Less: Income tax benefit |
| (1,736 | ) |
| - | |
| - | | |||
Total stock-based compensation expense, net of tax |
| $ | 6,533 | |
| $ | 13,142 | |
| $ | 9,797 | |
Total compensation cost for stock-based payment arrangements for fiscal years 2018 and 2017 includes $1.3 and $5.4 million related to the termination of former executive officers.
Stock Appreciation Rights & Stock Options:
SARs and stock options granted under the 2016 Plan and the 2004 Plan generally vest ratably over a three to five year period on each of the annual grant date anniversaries and expire ten years from the grant date. SARs granted subsequent to fiscal year 2012 vest ratably over a three year period with the exception of the April 2017 grant to the Chief Executive Officer, which vests in full after two years .
|
| Shares (in thousands) |
| Weighted Average Exercise Price |
| Weighted- Average Remaining Contractual Life |
| Aggregate Intrinsic Value (in thousands) | ||||||||
|
| SARs |
| Stock Options |
|
|
| |||||||||
Outstanding balance at June 30, 2017 |
| 2,884 | |
| 54 | |
| $ | 14.47 | |
|
|
|
| ||
Granted |
| - | |
| - | |
| - | |
|
|
|
| | ||
Forfeited/Expired |
| (1,086 | ) |
| (39 | ) |
| 17.62 | |
|
|
|
| | ||
Exercised |
| (280 | ) |
| - | |
| 12.96 | |
|
|
|
| | ||
Outstanding balance at June 30, 2018 |
| 1,518 | |
| 15 | |
| $ | 12.44 | |
| 7.54 |
| $ | 6,617 | |
Exercisable at June 30, 2018 |
| 451 | |
| 15 | |
| $ | 15.42 | |
| 4.91 |
| $ | 848 | |
Unvested awards, net of estimated forfeitures |
| 1,066 | |
| - | |
| $ | 13.05 | |
| 7.60 |
| $ | 5,766 | |
As of June 30, 2018 , there was $1.5 million of unrecognized expense related to SARs and stock options that is to be recognized over a weighted-average period of 0.8 years.
Restricted Stock Units:
RSUs granted to employees under the 2016 Plan and 2004 Plan generally vest ratably over a three to five year period on each of the annual grant date anniversaries or vest entirely after a three or five year period. In addition, the Chief Executive Officer has an outstanding RSU grant that vests upon the achievement of a specified value for the Company's stock over a specified period of time. RSUs granted to non-employee directors under the 2016 Plan and 2004 Plan generally vest in equal monthly amounts over a one year period from the Company's previous annual shareholder meeting date and distributions are deferred until the director's board service ends.
|
| Shares/Units (in thousands) |
| Weighted Average Grant Date Fair Value |
| Aggregate Intrinsic Value (in thousands) | |||||
|
| RSUs |
|
| |||||||
Outstanding balance at June 30, 2017 |
| 809 | |
| $ | 12.77 | |
|
| ||
Granted |
| 322 | |
| 13.43 | |
|
| |||
Forfeited |
| (88 | ) |
| 13.40 | |
|
| |||
Vested |
| (338 | ) |
| 13.13 | |
|
| |||
Outstanding balance at June 30, 2018 |
| 705 | |
| $ | 12.82 | |
| $ | 11,657 | |
Vested at June 30, 2018 |
| 189 | |
| $ | 14.42 | |
| $ | 3,123 | |
Unvested awards, net of estimated forfeitures |
| 486 | |
| $ | 12.16 | |
| $ | 8,035 | |
76
Table of Contents
NOTES TO CONSOLIDATED FINANCIAL STATEMENTS (Continued)
As of June 30, 2018 , there was $3.2 million of unrecognized expense related to RSUs that is expected to be recognized over a weighted-average period of 1.7 years.
Performance Share Units:
PSUs are grants of restricted stock units which are earned based on the achievement of performance goals established by the Compensation Committee over a performance period.
|
| Shares/Units (in thousands) |
| Weighted Average Grant Date Fair Value |
| Aggregate Intrinsic Value (in thousands)(1) | |||||
|
| PSUs |
|
| |||||||
Outstanding balance at June 30, 2017 |
| 441 | |
| $ | 12.74 | |
|
| ||
Granted |
| 176 | |
| 15.74 | |
|
| | ||
Forfeited |
| (166 | ) |
| 12.23 | |
|
| | ||
Vested |
| (113 | ) |
| 15.23 | |
|
| | ||
Outstanding balance at June 30, 2018 |
| 338 | |
| $ | 13.72 | |
| $ | 5,589 | |
Vested at June 30, 2018 |
| - | |
| $ | - | |
| $ | - | |
Unvested awards, net of estimated forfeitures |
| 285 | |
| $ | 13.38 | |
| $ | 4,711 | |
(1) | Includes actual or expected payout rates as set forth in the performance criteria. |
In connection with the termination of former executive officers, the Company settled certain PSUs for cash of $0.8 million and $3.2 million during fiscal year 2018 and 2017, respectively.
PSUs granted in fiscal year 2018 have a performance period of three years, after which they will vest to the extent earned. Future compensation expense for these unvested awards could reach a maximum of $4.7 million to be recognized over 2.2 years, if the maximum performance metrics are achieved.
PSUs granted in fiscal year 2017 have a performance period of three years, after which they will vest to the extent earned. Future compensation expense for these unvested awards could reach a maximum of $1.4 million to be recognized over 1.1 years, if the maximum performance metrics are achieved.
PSUs granted in fiscal year 2016 had a performance period of one year. They have been earned and will vest three years from the initial grant date. As of June 30, 2018 , there was less than $0.1 million of expense related to the fiscal 2016 PSUs that is expected to be recognized over a weighted-average period of 0.2 years.
13. SHAREHOLDERS' EQUITY
Authorized Shares and Designation of Preferred Class:
The Company has 100 million shares of capital stock authorized, par value $0.05 , of which all outstanding shares, and shares available under the Stock Option Plans, have been designated as common.
Shareholders' Rights Plan:
The Company previously had a shareholders' rights plan, which expired by its terms in December 2016.
Share Repurchase Program:
In May 2000, the Company's Board approved a stock repurchase program with no stated expiration date. Originally, the program authorized up to $50.0 million to be expended for the repurchase of the Company's stock. The Board elected to increase this maximum to $100.0 million in August 2003, to $200.0 million in May 2005, to $300.0 million in April 2007, to $350.0 million in April 2015, to $400.0 million in September 2015, and to $450.0 million in January 2016. All repurchased shares become authorized but unissued shares of the Company. The timing and amounts of any repurchases depends on many factors, including the market price of the common stock and overall market conditions. As of June 30, 2018 , 19.9 million shares have been cumulatively repurchased for $414.7 million , and $35.3 million remained outstanding under the approved stock repurchase program.
77
Table of Contents
NOTES TO CONSOLIDATED FINANCIAL STATEMENTS (Continued)
Accumulated Other Comprehensive Income:
The components of accumulated other comprehensive income are as follows:
|
| June 30, | ||||||||||
|
| 2018 |
| 2017 |
| 2016 | ||||||
|
| (Dollars in thousands) | ||||||||||
Foreign currency translation |
| $ | 8,580 | |
| $ | 2,684 | |
| $ | 4,573 | |
Unrealized gain on deferred compensation contracts |
| 988 | |
| 652 | |
| 495 | | |||
Accumulated other comprehensive income |
| $ | 9,568 | |
| $ | 3,336 | |
| $ | 5,068 | |
14. SEGMENT INFORMATION
Segment information is prepared on the same basis the chief operating decision maker reviews financial information for operational decision-making purposes. During the first quarter of fiscal year 2018, the Company redefined its operating segments to reflect how the chief operating decision maker now evaluates the business as a result of the Company's Board of Directors' approval of the mall-based business and International segment sale. See Note 1 to the Consolidated Financial Statements. The Company now reports its operations in two operating segments: Company-owned salons and Franchise salons. The Company's operating segments are its reportable operating segments. Prior to this change, the Company had four operating segments: North American Value, North American Premium, North American Franchise, and International. The Company did not operate under the realigned operating segment structure prior to the first quarter of fiscal year 2018.
The Company-owned salons reportable operating segment is comprised of 3,966 company-owned salons located mainly in strip center locations and Walmart Supercenters. Company-owned salons offer high quality, convenient and value priced hair care and beauty services and retail products. SmartStyle, Supercuts, Cost Cutters and other regional trade names operating in the United States, Canada and Puerto Rico are generally within the Company-owned salons segment.
The Franchise salons reportable operating segment is comprised of 4,114 franchised salons located mainly in strip center locations, Walmart Supercenters and mall-based locations. Franchise salons offer high quality, convenient and value priced hair care and beauty services and retail products. This segment operates in the United States and Canada and primarily includes the Supercuts, SmartStyle, Cost Cutters, Regis, Mastercuts, First Choice Haircutters, Roosters and Magicuts concepts.
78
Table of Contents
NOTES TO CONSOLIDATED FINANCIAL STATEMENTS (Continued)
Concurrent with the change in reportable segments, the Company recast its prior period financial information to reflect comparable financial information for the new segment structure. Historical financial information shown in the following table and elsewhere in this filing reflects this change. Financial information concerning the Company's reportable operating segments is shown in the following table:
|
| For the Year Ended June 30, 2018 | ||||||||||||||
|
| Company-owned |
| Franchise |
| Corporate (1) |
| Consolidated | ||||||||
|
| (Dollars in thousands) | ||||||||||||||
Revenues: |
|
|
|
|
|
|
|
| ||||||||
Service |
| $ | 899,051 | |
| $ | - | |
| $ | - | |
| $ | 899,051 | |
Product |
| 204,963 | |
| 53,703 | |
| - | |
| 258,666 | | ||||
Royalties and fees |
| - | |
| 56,357 | |
| - | |
| 56,357 | | ||||
|
| 1,104,014 | |
| 110,060 | |
| - | |
| 1,214,074 | | ||||
Operating expenses: |
|
|
|
|
|
|
|
| ||||||||
Cost of service |
| 530,582 | |
| - | |
| - | |
| 530,582 | | ||||
Cost of product |
| 98,495 | |
| 42,128 | |
| - | |
| 140,623 | | ||||
Site operating expenses |
| 127,249 | |
| - | |
| - | |
| 127,249 | | ||||
General and administrative |
| 67,163 | |
| 25,880 | |
| 81,002 | |
| 174,045 | | ||||
Rent |
| 181,869 | |
| 269 | |
| 958 | |
| 183,096 | | ||||
Depreciation and amortization |
| 48,508 | |
| 365 | |
| 9,332 | |
| 58,205 | | ||||
Total operating expenses |
| 1,053,866 | |
| 68,642 | |
| 91,292 | |
| 1,213,800 | | ||||
Operating income (loss) |
| 50,148 | |
| 41,418 | |
| (91,292 | ) |
| 274 | | ||||
Other (expense) income: |
|
|
|
|
|
|
|
| ||||||||
Interest expense |
| - | |
| - | |
| (10,492 | ) |
| (10,492 | ) | ||||
Interest income and other, net |
| - | |
| - | |
| 6,670 | |
| 6,670 | | ||||
Income (loss) from continuing operations before income taxes and equity in loss of affiliated companies |
| $ | 50,148 | |
| $ | 41,418 | |
| $ | (95,114 | ) |
| $ | (3,548 | ) |
79
Table of Contents
NOTES TO CONSOLIDATED FINANCIAL STATEMENTS (Continued)
|
| For the Year Ended June 30, 2017 | ||||||||||||||
|
| Company-owned |
| Franchise |
| Corporate (1) |
| Consolidated | ||||||||
|
| (Dollars in thousands) | ||||||||||||||
Revenues: |
|
|
|
|
|
|
|
| ||||||||
Service |
| $ | 960,347 | |
| $ | - | |
| $ | - | |
| $ | 960,347 | |
Product |
| 229,199 | |
| 30,623 | |
| - | |
| 259,822 | | ||||
Royalties and fees |
| - | |
| 48,291 | |
| - | |
| 48,291 | | ||||
|
| 1,189,546 | |
| 78,914 | |
| - | |
| 1,268,460 | | ||||
Operating expenses: |
|
|
|
|
|
|
|
| ||||||||
Cost of service |
| 610,384 | |
| - | |
| - | |
| 610,384 | | ||||
Cost of product |
| 103,611 | |
| 22,686 | |
| - | |
| 126,297 | | ||||
Site operating expenses |
| 127,797 | |
| - | |
| - | |
| 127,797 | | ||||
General and administrative |
| 47,673 | |
| 21,222 | |
| 88,440 | |
| 157,335 | | ||||
Rent |
| 179,463 | |
| 171 | |
| 844 | |
| 180,478 | | ||||
Depreciation and amortization |
| 42,273 | |
| 357 | |
| 9,458 | |
| 52,088 | | ||||
Total operating expenses |
| 1,111,201 | |
| 44,436 | |
| 98,742 | |
| 1,254,379 | | ||||
Operating income (loss) |
| 78,345 | |
| 34,478 | |
| (98,742 | ) |
| 14,081 | | ||||
Other (expense) income: |
|
|
|
|
|
|
|
| ||||||||
Interest expense |
| - | |
| - | |
| (8,584 | ) |
| (8,584 | ) | ||||
Interest income and other, net |
| - | |
| - | |
| 2,831 | |
| 2,831 | | ||||
Income (loss) from continuing operations before income taxes and equity in loss of affiliated companies |
| $ | 78,345 | |
| $ | 34,478 | |
| $ | (104,495 | ) |
| $ | 8,328 | |
80
Table of Contents
NOTES TO CONSOLIDATED FINANCIAL STATEMENTS (Continued)
|
| For the Year Ended June 30, 2016 | ||||||||||||||
|
| Company-owned |
| Franchise |
| Corporate (1) |
| Consolidated | ||||||||
|
| (Dollars in thousands) | ||||||||||||||
Revenues: |
|
|
|
|
|
|
|
| ||||||||
Service |
| $ | 978,614 | |
| $ | - | |
| $ | - | |
| $ | 978,614 | |
Product |
| 234,390 | |
| 31,406 | |
| - | |
| 265,796 | | ||||
Royalties and fees |
| - | |
| 47,523 | |
| - | |
| 47,523 | | ||||
|
| 1,213,004 | |
| 78,929 | |
| - | |
| 1,291,933 | | ||||
Operating expenses: |
|
|
|
|
|
|
|
| ||||||||
Cost of service |
| 608,965 | |
| - | |
| - | |
| 608,965 | | ||||
Cost of product |
| 106,929 | |
| 23,086 | |
| - | |
| 130,015 | | ||||
Site operating expenses |
| 135,130 | |
| 9 | |
| - | |
| 135,139 | | ||||
General and administrative |
| 48,811 | |
| 21,490 | |
| 86,711 | |
| 157,012 | | ||||
Rent |
| 182,932 | |
| 162 | |
| 1,056 | |
| 184,150 | | ||||
Depreciation and amortization |
| 42,466 | |
| 363 | |
| 10,059 | |
| 52,888 | | ||||
Total operating expenses |
| 1,125,233 | |
| 45,110 | |
| 97,826 | |
| 1,268,169 | | ||||
Operating income (loss) |
| 87,771 | |
| 33,819 | |
| (97,826 | ) |
| 23,764 | | ||||
Other (expense) income: |
|
|
|
|
|
|
|
| ||||||||
Interest expense |
| - | |
| - | |
| (9,229 | ) |
| (9,229 | ) | ||||
Interest income and other, net |
| - | |
| - | |
| 3,713 | |
| 3,713 | | ||||
Income (loss) from continuing operations before income taxes and equity in loss of affiliated companies |
| $ | 87,771 | |
| $ | 33,819 | |
| $ | (103,342 | ) |
| $ | 18,248 | |
_______________________________________________________________________________
(1) Corporate consists primarily of unallocated general and administrative expenses, including expenses associated with salon support, depreciation and amortization related to our corporate headquarters and unallocated insurance, benefit and compensation programs, including stock-based compensation.
The Company's chief operating decision maker does not evaluate reportable segments using assets and capital expenditure information.
Total revenues and property and equipment, net associated with business operations in the U.S. and all other countries in aggregate were as follows:
|
| June 30, | ||||||||||||||||||||||
|
| 2018 |
| 2017 |
| 2016 | ||||||||||||||||||
|
| Total Revenues |
| Property and Equipment, Net |
| Total Revenues |
| Property and Equipment, Net |
| Total Revenues |
| Property and Equipment, Net | ||||||||||||
|
| (Dollars in thousands) | ||||||||||||||||||||||
U.S. |
| $ | 1,112,155 | |
| $ | 102,528 | |
| $ | 1,174,408 | |
| $ | 119,649 | |
| $ | 1,198,227 | |
| $ | 146,722 | |
Other countries |
| 101,919 | |
| 3,332 | |
| 94,052 | |
| 3,632 | |
| 93,706 | |
| 5,438 | | ||||||
Total |
| $ | 1,214,074 | |
| $ | 105,860 | |
| $ | 1,268,460 | |
| $ | 123,281 | |
| $ | 1,291,933 | |
| $ | 152,160 | |
81
Table of Contents
NOTES TO CONSOLIDATED FINANCIAL STATEMENTS (Continued)
15. SUBSEQUENT EVENT
In August 2018, the Company's Board of Directors authorized an additional $200.0 million for share repurchases.
16. QUARTERLY FINANCIAL DATA (UNAUDITED)
Refer to Management's Discussion and Analysis of Financial Condition and Results of Operations in Part II, Item 7 in this Form 10-K for explanations of items which impacted fiscal years 2018 and 2017 revenues, operating and net income (loss).
Summarized quarterly data for fiscal years 2018 and 2017 follows:
|
| Quarter Ended |
|
| ||||||||||||||||
|
| September 30(a) |
| December 31(b) |
| March 31 |
| June 30 (c) |
| Year Ended | ||||||||||
|
| (Dollars in thousands, except per share amounts) | ||||||||||||||||||
2018 |
|
|
|
|
|
|
|
|
|
| ||||||||||
Revenues |
| $ | 309,873 | |
| $ | 308,515 | |
| $ | 300,801 | |
| $ | 294,885 | |
| $ | 1,214,074 | |
Cost of service and product revenues, excluding depreciation and amortization |
| 169,998 | |
| 174,714 | |
| 169,220 | |
| 157,273 | |
| 671,205 | | |||||
Operating income (loss) |
| 16,736 | |
| (37,334 | ) |
| 5,884 | |
| 14,988 | |
| 274 | | |||||
Income from continuing operations |
| 10,793 | |
| 39,321 | |
| 4,799 | |
| 6,973 | |
| 61,886 | | |||||
Loss from discontinued operations(d) |
| (33,768 | ) |
| (6,601 | ) |
| (10,605 | ) |
| (2,211 | ) |
| (53,185 | ) | |||||
Net (loss) income |
| (22,975 | ) |
| 32,720 | |
| (5,806 | ) |
| 4,762 | |
| 8,701 | | |||||
Income from continuing operations per share, basic(g) |
| 0.23 | |
| 0.84 | |
| 0.10 | |
| 0.15 | |
| 1.33 | | |||||
Loss from discontinued operations per share, basic |
| (0.72 | ) |
| (0.14 | ) |
| (0.23 | ) |
| (0.05 | ) |
| (1.14 | ) | |||||
Net (loss) income per share, basic(g) |
| (0.49 | ) |
| 0.70 | |
| (0.12 | ) |
| 0.10 | |
| 0.19 | | |||||
Income from continuing operations per share, diluted(g) |
| 0.23 | |
| 0.83 | |
| 0.10 | |
| 0.15 | |
| 1.32 | | |||||
Loss from discontinued operations per share, diluted |
| (0.72 | ) |
| (0.14 | ) |
| (0.22 | ) |
| (0.05 | ) |
| (1.13 | ) | |||||
Net (loss) income per share, diluted(g) |
| (0.49 | ) |
| 0.69 | |
| (0.12 | ) |
| 0.10 | |
| 0.18 | | |||||
|
| Quarter Ended |
|
| ||||||||||||||||
|
| September 30 |
| December 31 |
| March 31(e) |
| June 30(f) |
| Year Ended | ||||||||||
|
| (Dollars in thousands, except per share amounts) | ||||||||||||||||||
2017 |
|
|
|
|
|
|
|
|
|
| ||||||||||
Revenues |
| $ | 318,831 | |
| $ | 315,249 | |
| $ | 313,478 | |
| $ | 320,902 | |
| $ | 1,268,460 | |
Cost of service and product revenues, excluding depreciation and amortization |
| 181,612 | |
| 185,777 | |
| 183,997 | |
| 185,295 | |
| 736,681 | | |||||
Operating income (loss) |
| 10,316 | |
| 2,402 | |
| (6,214 | ) |
| 7,577 | |
| 14,081 | | |||||
Income (loss) from continuing operations |
| 5,740 | |
| 982 | |
| (11,840 | ) |
| 4,222 | |
| (896 | ) | |||||
Loss from discontinued operations(d) |
| (2,459 | ) |
| (3,201 | ) |
| (6,615 | ) |
| (2,969 | ) |
| (15,244 | ) | |||||
Net income (loss) |
| 3,281 | |
| (2,219 | ) |
| (18,455 | ) |
| 1,253 | |
| (16,140 | ) | |||||
Loss from continuing operations per share, basic and diluted(g) |
| 0.12 | |
| 0.02 | |
| (0.26 | ) |
| 0.09 | |
| (0.02 | ) | |||||
Loss from discontinued operations per share, basic and diluted(g) |
| (0.05 | ) |
| (0.07 | ) |
| (0.14 | ) |
| (0.06 | ) |
| (0.33 | ) | |||||
Net income (loss) per share, basic and diluted |
| 0.07 | |
| (0.05 | ) |
| (0.40 | ) |
| 0.03 | |
| (0.35 | ) | |||||
_______________________________________________________________________________
(a) | During the first quarter of fiscal year 2018, the Company recorded $33.8 million of one-time asset impairments and other non-recurring costs associated with the October 2017 sale of substantially all of its North American mall-based |
82
Table of Contents
NOTES TO CONSOLIDATED FINANCIAL STATEMENTS (Continued)
salons and its UK business. These impairments and costs and the result of operations for the salons sold, were classified in discontinued operations. Results of operations for the North American mall-based business and the UK have been classified as a discontinued operation for all periods presented.
(b) | During the second quarter of fiscal year 2018, the Company recorded $68.9 million of non-cash, one-time, tax benefits related to the enactment of the Tax Cuts and Jobs Act ("Tax Reform"), partially offset by $37.6 million of one-time lease termination and other non-recurring costs associated with the recently announced restructuring of the Company's SmartStyle® salon portfolio, and $3.5 million of other one-time costs. |
(c) | During the fourth quarter of fiscal year 2018, the Company identified and recorded $2.0 million in non-cash fixed asset impairment charges within discontinued operations. These fixed asset impairment charges should have been recorded in the first quarter of fiscal year 2018. Because this error was not material to the period in which it originated or the fourth quarter, the Company corrected it in the fourth quarter of fiscal year 2018. |
(d) | In October 2017, the Company sold substantially all of its mall-based salon business in North America and International segment to The Bea utiful Group ("TBG"). T he Company classified the results of its mall-based business and its International segment as a discontinued operation for all periods presented in the Condensed Consolidated Statement of Operations. |
(e) | During the third quarter of fiscal year 2017, the Company recorded $7.9 million of severance expense related to the termination of former executive officers including the Company's Chief Executive Officer. |
(f) | During the fourth quarter of fiscal year 2017, the Company recorded $5.3 million for a one-time inventory expense related to salon tools. |
(g) | Total is an annual recalculation; line items calculated quarterly may not sum to total. |
Item 9. Changes in and Disagreements with Accountants on Accounting and Financial Disclosure
None.
Item 9A. Controls and Procedures
Evaluation of Disclosure Controls and Procedures
The Company maintains disclosure controls and procedures that are designed to ensure that information required to be disclosed by the Company in the reports filed or submitted under the Securities Exchange Act of 1934, as amended (the "Exchange Act"), is recorded, processed, summarized and reported within the time periods specified in the Securities and Exchange Commission's rules and forms, and that such information is accumulated and communicated to management, including the Chief Executive Officer (CEO) and Chief Financial Officer (CFO), as appropriate to allow timely decisions regarding required disclosure.
Management, with the participation of the CEO and CFO, evaluated the effectiveness of the design and operation of the Company's disclosure controls and procedures (as defined in Rules 13a-15(e) and 15d-15(e) promulgated under the Exchange Act), at the end of the period. Based on their evaluation, our CEO and CFO, concluded that our disclosure controls and procedures were effective as of June 30, 2018 .
Management's Report on Internal Control over Financial Reporting
Our management is responsible for establishing and maintaining adequate internal control over financial reporting, as such term is defined in Rule 13a-15(f) of the Exchange Act. Under the supervision and with the participation of our management, including the CEO and the CFO, we carried out an evaluation of the effectiveness of our internal control over financial reporting as of June 30, 2018 using the criteria established in "Internal Control-Integrated Framework " (2013), issued by the Committee of Sponsoring Organizations of the Treadway Commission (COSO). Based upon this evaluation, management concluded the Company's internal controls over financial reporting were effective as of June 30, 2018 based on those criteria.
The effectiveness of the Company's internal control over financial reporting as of June 30, 2018 has been audited by PricewaterhouseCoopers LLP, an independent registered public accounting firm, as stated in its report, which appears in Item 8.
83
Table of Contents
Changes in Internal Controls over Financial Reporting
There were no changes in our internal control over financial reporting during the most recent fiscal quarter that have materially affected, or are reasonably likely to materially affect, our internal control over financial reporting.
Item 9B. Other Information
None.
PART III
Item 10. Directors, Executive Officers and Corporate Governance
Information regarding the Directors of the Company and Exchange Act Section 16(a) filings will be set forth in the sections titled "Item 1-Election of Directors" and "Section 16(a) Beneficial Ownership Reporting Compliance" of the Company's 2018 Proxy Statement, and is incorporated herein by reference. The information required by Item 401 of Regulation S-K regarding the Company's executive officers is included under "Executive Officers" in Item 1 of this Annual Report on Form 10-K. Additionally, information regarding the Company's audit committee and audit committee financial expert, as well nominating committee functions, will be set forth in the section titled "Our Board's Committees" and shareholder communications with directors will be set forth in the section titled "Communications with the Board" of the Company's 2018 Proxy Statement, and are incorporated herein by reference.
The Company has adopted a code of ethics, known as the Code of Business Conduct & Ethics that applies to all employees, including the Company's chief executive officer, chief financial officer, directors and executive officers. The Code of Business Conduct & Ethics is available on the Company's website at www.regiscorp.com , under the heading "Corporate Governance - Policies and Disclosures" (within the "Investor Information" section). The Company intends to disclose any substantive amendments to, or waivers from, its Code of Business Conduct & Ethics on its website or in a report on Form 8-K. In addition, the charters of the Company's Audit Committee, Compensation Committee and Nominating and Corporate Governance Committee and the Company's Corporate Governance Guidelines may be found in the same section of the Company's website. Copies of any of these documents are available upon request to any shareholder of the Company by writing to the Company's Corporate Secretary at Regis Corporation, 7201 Metro Boulevard, Edina, Minnesota 55439.
Item 11. Executive Compensation
Information about executive and director compensation will be set forth in the sections titled "Executive Compensation," "How Our Directors Are Paid," "Fiscal 2018 Director Compensation Table," and "CEO Pay Ratio" of the Company's 2018 Proxy Statement, and is incorporated herein by reference.
Item 12. Security Ownership of Certain Beneficial Owners and Management and Related Stockholder Matters
Information regarding the Company's equity compensation plans will be set forth in the section titled "Equity Compensation Plan Information" and information regarding the beneficial ownership of the Company will be set forth in the section titled "Security Ownership of Certain Beneficial Holders and Management" of the Company's 2018 Proxy Statement, and are incorporated herein by reference.
Item 13. Certain Relationships and Related Transactions, and Director Independence
Information regarding certain relationships and related transactions will be set forth in the section titled "Certain Relationships and Related Transactions" of the Company's 2018 Proxy Statement, and is incorporated herein by reference. Information regarding director independence will be set forth in the section titled "Our Board Governance" of the Company's 2018 Proxy Statement, and is incorporated herein by reference.
Item 14. Principal Accounting Fees and Services
A description of the fees paid to the independent registered public accounting firm will be set forth in the section titled "Item 4-Ratification of Appointment of Independent Registered Public Accounting Firm" of the Company's 2018 Proxy Statement and is incorporated herein by reference.
84
Table of Contents
PART IV
Item 15. Exhibits and Financial Statement Schedules
(b) | (1). All financial statements: |
Consolidated Financial Statements filed as part of this report are listed under Part II, Item 8 of this Form 10-K.
(c) | Exhibits: |
The exhibits listed in the accompanying index are filed as part of this report. Except where otherwise indicated below, the SEC file number for each report and registration statement from which the exhibits are incorporated by reference is 1-12725. There are no financial statement schedules included with this filing for the reason they are not applicable, not required or the information is included in the financial statements or notes thereto.
2(a) |
| Asset Purchase Agreement, dated October 1, 2017, between Regis Corporation, Regis Inc. and The Beautiful Group. (Incorporated by reference to Exhibit 2.1 to the Company's Current Report on 8-K filed on October 5, 2017. |
2(b) |
| Share Purchase Agreement, dated October 1, 2017, between Haircare Limited, Regis UK Limited and International Beauty Limited. (Incorporated by reference to Exhibit 2.2 to the Company's Current Report on 8-K filed on October 5, 2017. |
3(a) |
| Election of the Company to become governed by Minnesota Statutes Chapter 302A and Restated Articles of Incorporation of the Company, dated March 11, 1983; Articles of Amendment to Restated Articles of Incorporation, dated October 29, 1984; Articles of Amendment to Restated Articles of Incorporation, dated August 14, 1987; Articles of Amendment to Restated Articles of Incorporation, dated October 21, 1987; Articles of Amendment to Restated Articles of Incorporation, dated November 20, 1996; Articles of Amendment to Restated Articles of Incorporation, dated July 25, 2000; Articles of Amendment to Restated Articles of Incorporation, dated October 22, 2013; Articles of Amendment of Restated Articles of Incorporation, dated April 24, 2018. (Incorporated by reference to Exhibit 3.1 of the Company's Quarterly Report on Form 10-Q filed on May 1, 2018.) |
|
|
|
3(b) |
| Bylaws of the Company. (Incorporated by reference to Exhibit 3.1 of the Company's Current Report on Form 8-K filed on April 27, 2018.) |
|
|
|
4(a) |
| Form of Stock Certificate. (Incorporated by reference to Exhibit 4.1 of the Company's Registration Statement on Form S-1 (Reg. No. 40142).) (P) |
|
|
|
4(b) |
| Indenture, dated December 1, 2015, by and between the Company and Wells Fargo Bank, National Association, as Trustee, in respect of the 5.50% Senior Notes due 2019 (Incorporated by reference to Exhibit 10.2 of the Company's Current Report on Form 8-K filed on December 4, 2015.) |
|
|
|
10(a)* |
| Regis Corporation Short Term Incentive Compensation Plan, effective August 19, 2014. (Incorporated by reference to Appendix A of the Company's Proxy Statement on Definitive Form 14A filed on September 10, 2014.) |
|
|
|
10(b)* |
| Regis Corporation Executive Retirement Savings Plan Adoption Agreement and Trust Agreement, dated November 15, 2008, between the Company and Fidelity Management Trust Company (The CORPORATE Plan for Retirement EXECUTIVE PLAN basic plan document is incorporated by reference to Exhibit 10(c) to the Company's Annual Report on Form 10-K filed on August 29, 2007). (Incorporated by reference to Exhibit 10(a) of the Company's Quarterly Report on Form 10-Q filed February 9, 2009.) |
|
|
|
10(c)* |
| Employment Agreement, dated August 31, 2012, between the Company and Daniel J. Hanrahan. (Incorporated by reference to Exhibit 10(a) of the Company's Current Report on Form 10-Q filed November 9, 2012.) |
|
|
|
10(d)* |
| Amendment to Employment Agreement, dated January 13, 2015, between the Company and Daniel J. Hanrahan. (Incorporated by reference to Exhibit 10(b) of the Company's Quarterly Report on Form 10-Q filed January 29, 2015.) |
|
|
|
10(e)* |
| Employment Agreement, dated November 28, 2012, between the Company and Steven M. Spiegel. (Incorporated by reference to Exhibit 10(a) of the Company's Quarterly Report on Form 10-Q filed February 4, 2013.) |
|
|
|
10(f)* |
| Amendment No. 1 to Employment Agreement, dated June 30, 2016, between the Company and Steven M. Spiegel. (Incorporated by reference to Exhibit 10(f) of the Company's Annual Report on Form 10-K filed on August 23, 2016.) |
85
Table of Contents
10(g)* |
| Form of Amended and Restated Senior Officer Employment and Deferred Compensation Agreement, dated August 31, 2012, between the Company and certain senior executive officers. (Incorporated by reference to Exhibit 10(b) of the Company's Quarterly Report on Form 10-Q filed November 9, 2012.) |
|
|
|
10(h)* |
| Employment Agreement, dated November 11, 2013, between the Company and Jim B. Lain. (Incorporated by reference to Exhibit 10(c) of the Company's Quarterly Report on Form 10-Q filed February 3, 2014.) |
|
|
|
10(i)* |
| Employment Agreement, dated October 21, 2013, between the Company and Carmen Thiede. (Incorporated by reference to Exhibit 10(b) of the Company's Quarterly Report on Form 10-Q filed February 3, 2014.) |
|
|
|
10(j)* |
| Employment Agreement, dated December 15, 2014, between the Company and Annette Miller. (Incorporated by reference to Exhibit 10(a) of the Company's Quarterly Report on Form 10-Q filed January 29, 2015.) |
|
|
|
10(k)* |
| Amended and Restated Employment Agreement, dated May 1, 2015, between the Company and Andrew Dulka. (Incorporated by reference to Exhibit 10(k) of the Company's Annual Report on Form 10-K filed August 28, 2015.) |
|
|
|
10(l)* |
| Letter Agreement with Huron Consulting Services LLC for CFO Services, dated January 25, 2017. (Incorporated by reference to Exhibit 10.1 of the Company's Quarterly Report on Form 10-Q filed on May 4, 2017.) |
|
|
|
10(m)* |
| Employment Agreement, dated April 17, 2017, between the Company and Hugh E. Sawyer. (Incorporated by reference to Exhibit 10(m) of the Company's Annual Report on Form 10-K filed on August 23, 2017.) |
|
|
|
10(n)* |
| Restricted Stock Unit Agreement, dated April 17, 2017, between the Company and Hugh E. Sawyer. (Incorporated by reference to Exhibit 10(n) of the Company's Annual Report on Form 10-K filed on August 23, 2017.) |
|
|
|
10(o)* |
| Stock Appreciation Right Agreement, dated April 17, 2017, between the Company and Hugh E. Sawyer. (Incorporated by reference to Exhibit 10(o) of the Company's Annual Report on Form 10-K filed on August 23, 2017.) |
|
|
|
10(p)* |
| Separation Agreement, dated April 16, 2017, between the Company and Daniel Hanrahan. (Incorporated by reference to Exhibit 10(p) of the Company's Annual Report on Form 10-K filed on August 23, 2017.) |
|
|
|
10(q)* |
| Separation Agreement, dated February 28, 2017, between the Company and Heather Passe. (Incorporated by reference to Exhibit 10(q) of the Company's Annual Report on Form 10-K filed on August 23, 2017.) |
|
|
|
10(r)* |
| Employment Offer Letter, dated June 16, 2017, between the Company and Andrew H. Lacko. (Incorporated by reference to Exhibit 10(r) of the Company's Annual Report on Form 10-K filed on August 23, 2017.) |
|
|
|
10(s)* |
| Employment Agreement, dated August 31, 2012, between the Company and Rachel Endrizzi. |
|
|
|
10(t)* |
| Amended and Restated 2004 Long Term Incentive Plan, as amended and restated effective October 22, 2013. (Incorporated by reference to Exhibit 10.1 of the Company's Current Report on Form 8-K filed on October 11, 2013.) |
|
|
|
10(u)* |
| Amendment to the Amended and Restated 2004 Long Term Incentive Plan, effective August 29, 2014. (Incorporated by reference to Exhibit 10(b) of the Company's Quarterly Report on Form 10-Q filed on November 4, 2014.) |
|
|
|
10(v)* |
| Form of Restricted Stock Unit Award (Annual Fiscal 2018 Executive Grants). |
|
|
|
10(w)* |
| Form of Stock Appreciation Right Award (Annual Executive Grants). |
|
|
|
10(x)* |
| Form of Performance Stock Unit Award (Fiscal 2018 Executive Grants). |
|
|
|
10(y)* |
| Form of Restricted Stock Unit Award (Annual Fiscal 2017 and 2016 Executive Grants). (Incorporated by reference to Exhibit 10(u) of the Company's Annual Report on Form 10-K filed on August 23, 2017.) |
|
|
|
10(z)* |
| Form of Performance Stock Unit Award (Fiscal 2017 Executive Grants). (Incorporated by reference to Exhibit 10(w) of the Company's Annual Report on Form 10-K filed on August 23, 2017.) |
|
|
|
10(aa)* |
| Regis Corporation 2016 Long Term Incentive Plan, effective October 18, 2016. (Incorporated by reference to Appendix A of the Company's Proxy Statement on Definitive Form 14A filed on September 7, 2016.) |
|
|
|
10(bb)* |
| Regis Corporation Amended and Restated 1991 Contributory Stock Purchase Plan, as amended and restated effective October 18, 2016. (Incorporated by reference to Appendix B of the Company's Proxy Statement on Definitive Form 14A filed on September 7, 2016.) |
|
|
|
10(cc)* |
| Supplemental Performance-Based Cash Retention Bonus Plan, dated January 2017. (Incorporated by reference to Exhibit 10.2 of the Company's Quarterly Report on Form 10-Q filed on May 4, 2017.) |
|
|
|
86
Table of Contents
10(dd)* |
| Changes to Severance Program, dated January 23, 2017. (Incorporated by reference to Exhibit 10.3 of the Company's Quarterly Report on Form 10-Q filed on May 4, 2017.) |
|
|
|
10(ee) |
| Sixth Amended and Restated Credit Agreement, dated June 11, 2013, among the Company, the various financial institutions party thereto, JPMorgan Chase Bank, N.A., as Administrative Agent, Swing Line Lender and an Issuer, Bank of America, N.A., as Syndication Agent, and The Bank of Tokyo-Mitsubishi UFJ, Ltd., U.S. Bank, National Association and Wells Fargo Bank, N.A., as Documentation Agents. (Incorporated by reference to Exhibit 10.1 of the Company's Current Report on Form 8-K filed on June 14, 2013.) |
|
|
|
10(ff) |
| First Amendment, dated as of January 27, 2016, to the Sixth Amended and Restated Credit Agreement, dated June 11, 2013, among the Company, the various financial institutions party thereto and JPMorgan Chase Bank, N.A., as Administrative Agent. (Incorporated by reference to Exhibit 10(c) of the Company's Quarterly Report on Form 10-Q filed on January 28, 2016). |
|
|
|
10(gg) |
| Credit Agreement dated as of March 26, 2018 among Regis Corporation, the various financial institutions party thereto, Bank of America, N.A., as Administrative Agent, Swing Line Lender and L/C Issuer, and Merrill Lynch, Pierce, Fenner & Smith Incorporated and Keybank Capital Markets Inc., as Joint Lead Arrangers and Joint Bookrunners. (Incorporated by reference to Exhibit 10.1 of the Company's Current Report on Form 8-K filed on March 30, 2018.) |
|
|
|
10(hh) |
| Amendment No. 1 to Credit Agreement dated as of April 25, 2018 by and among Regis Corporation, various financial institutions and Bank of America, N.A. as Administrative Agent. (Incorporated by reference to Exhibit 10.1 of the Company's Current Report on Form 8-K filed on April 27, 2018.) |
|
|
|
10(ii) |
| Secured Promissory Note (US Working Capital) of The Beautiful Group Management, LLC in favor of Regis Corp., dated as of August 2, 2018 |
|
|
|
10(jj) |
| Secured Promissory Note (UK Working Capital) of International Beauty Limited in favor of Regis Corp., dated as of August 2, 2018 |
|
|
|
10(kk) |
| Secured Promissory Note (Canada Working Capital) of The Beautiful Group Salons (Canada), Ltd. in favor of Regis Corp., dated as of August 2, 2018 |
|
|
|
10(ll) |
| Secured Promissory Note (US Receivables) of The Beautiful Group Management, LLC in favor of Regis Corp., dated as of August 2, 2018 |
|
|
|
10(mm) |
| Secured Promissory Note (Canada Receivables) of The Beautiful Group Salons (Canada), Ltd. in favor of Regis Corp., dated as of August 2, 2018 |
|
|
|
21 |
| List of Subsidiaries of the Company. |
|
|
|
23 |
| Consent of PricewaterhouseCoopers LLP. |
|
|
|
31.1 |
| Chief Executive Officer of the Company: Certification pursuant to Section 302 of the Sarbanes-Oxley Act of 2002. |
|
|
|
31.2 |
| Executive Vice President and Chief Financial Officer of the Company: Certification pursuant to Section 302 of the Sarbanes-Oxley Act of 2002. |
|
|
|
32 |
| Chief Executive Officer and Chief Financial Officer of the Company: Certification pursuant to Section 906 of the Sarbanes-Oxley Act of 2002. |
|
|
|
101.INS |
| XBRL Instance Document |
|
|
|
101.SCH |
| XBRL Taxonomy Extension Schema |
|
|
|
101.CAL |
| XBRL Taxonomy Extension Calculation Linkbase |
|
|
|
101.LAB |
| XBRL Taxonomy Extension Label Linkbase |
|
|
|
101.PRE |
| XBRL Taxonomy Extension Presentation Linkbase |
|
|
|
101.DEF |
| XBRL Taxonomy Extension Definition Linkbase |
(*) Management contract, compensatory plan or arrangement required to be filed as an exhibit to the Company's Report on Form 10-K.
(P) | This Exhibit was originally filed in paper format. Accordingly, a hyperlink has not been provided. |
87
Table of Contents
Item 16. Form 10-K Summary
Not applicable.
88
Table of Contents
SIGNATURES
Pursuant to the requirements of Section 13 or 15(d) of the Securities Exchange Act of 1934, the Registrant has duly caused this report to be signed on its behalf by the undersigned, thereunto duly authorized.
| REGIS CORPORATION | |
| By | /s/ HUGH. E SAWYER |
|
| Hugh E. Sawyer, President and Chief Executive Officer (Principal Executive Officer) |
|
|
|
| By | /s/ ANDREW H. LACKO |
|
| Andrew H. Lacko, Executive Vice President and Chief Financial Officer (Principal Financial Officer) |
|
|
|
| By | /s/ KERSTEN D. ZUPFER |
|
| Kersten D. Zupfer, Senior Vice President, Controller and Chief Accounting Officer (Principal Accounting Officer) |
| DATE: August 23, 2018 | |
Pursuant to the requirements of the Securities Exchange Act of 1934, this report has been signed below by the following persons on behalf of the Registrant and in the capacities and on the dates indicated.
/s/ DAVID P. WILLIAMS |
|
|
David P. Williams, Chairman of the Board of Directors |
| Date: August 23, 2018 |
|
|
|
/s/ HUGH E. SAWYER |
|
|
Hugh E. Sawyer, Director |
| Date: August 23, 2018 |
|
|
|
/s/ DANIEL G. BELTZMAN |
|
|
Daniel G. Beltzman, Director |
| Date: August 23, 2018 |
|
|
|
/s/ M. ANN RHOADES |
|
|
M. Ann Rhoades, Director |
| Date: August 23, 2018 |
|
|
|
/s/ MICHAEL J. MERRIMAN |
|
|
Michael J. Merriman, Director |
| Date: August 23, 2018 |
|
|
|
/s/ VIRGINIA GAMBALE |
|
|
Virginia Gambale, Director |
| Date: August 23, 2018 |
|
|
|
/s/ DAVID J. GRISSEN |
|
|
David J. Grissen, Director |
| Date: August 23, 2018 |
|
|
|
/s/ MARK LIGHT |
|
|
Mark Light, Director |
| Date: August 23, 2018 |
89