UNITED STATES
SECURITIES AND EXCHANGE COMMISSION
WASHINGTON, D.C. 20549
FORM 10-K
ANNUAL REPORT PURSUANT TO SECTION 13 OR 15(d) OF
THE SECURITIES EXCHANGE ACT OF 1934
| FOR THE FISCAL YEAR ENDED JANUARY 31, 2016 | COMMISSION FILE NO. 001-09097 |
REX AMERICAN RESOURCES CORPORATION
(Exact name of registrant as specified in its charter)
| Delaware (State or other jurisdiction of incorporation or organization) | 31-1095548 (I.R.S. Employer Identification No.) | |
| 7720 Paragon Road, Dayton, Ohio (Address of principal executive offices) | 45459 (Zip Code) |
Registrant's telephone number, including area code (937) 276-3931
Securities registered pursuant to Section 12(b) of the Act:
Title of each class | Name of each exchange on which registered | |
| Common Stock, $.01 par value | New York Stock Exchange |
Indicate by check mark if the registrant is a well-known seasoned issuer, as defined in Rule 405 of the Securities Act . Yes o No ☑
Indicate by check mark if the registrant is not required to file reports pursuant to Section 13 or Section 15(d) of the Act. Yes o No ☑
Indicate by check mark whether the registrant (1) has filed all reports required to be filed by Section 13 or 15(d) of the Securities Exchange Act of 1934 during the preceding 12 months (or for such shorter period that the registrant was required to file such reports), and (2) has been subject to such filing requirements for the past 90 days. Yes ☑ No o
Indicate by check mark whether the registrant has submitted electronically and posted on its corporate Web site, if any, every Interactive Data File required to be submitted and posted pursuant to Rule 405 of Regulation S-T during the preceding 12 months (or for such shorter period that the registrant was required to submit and post such files). Yes ☑ No o
Indicate by check mark if disclosure of delinquent filers pursuant to Item 405 of Regulation S-K is not contained herein, and will not be contained, to the best of registrant's knowledge, in definitive proxy or information statements incorporated by reference in Part III of this Form 10-K or any amendment to this Form 10-K. ☑
Indicate by check mark whether the registrant is a large accelerated filer, an accelerated filer, a non-accelerated filer, or a smaller reporting company. See the definitions of "large accelerated filer", "accelerated filer" and "smaller reporting company" in Rule 12b-2 of the Exchange Act. (check one):
| Large accelerated filer o | Accelerated filer ☑ | Non-accelerated filer o | Smaller reporting company o |
(Do not check if a smaller reporting company)
Indicate by check mark whether the registrant is a shell company (as defined in Rule 12b-2 of the Exchange Act) Yes o No ☑
At the close of business on July 31, 2015 the aggregate market value of the registrant's outstanding Common Stock held by non-affiliates of the registrant (for purposes of this calculation, 963,902 shares beneficially owned by directors and executive officers of the registrant were treated as being held by affiliates of the registrant), was $318,852,936.
There were 6,560,527 shares of the registrant's Common Stock outstanding as of March 24, 2016.
Documents Incorporated by Reference
Portions of REX American Resources Corporation's definitive Proxy Statement for its Annual Meeting of Shareholders on June 7, 2016 are incorporated by reference into Part III of this Form 10-K.
Forward-Looking Statements
This Form 10-K contains or may contain forward-looking statements as defined in the Private Securities Litigation Reform Act of 1995. Such statements can be identified by use of forward-looking terminology such as "may," "expect," "believe," "estimate," "anticipate" or "continue" or the negative thereof or other variations thereon or comparable terminology. Readers are cautioned that there are risks and uncertainties that could cause actual events or results to differ materially from those referred to in such forward-looking statements. These risks and uncertainties include the risk factors set forth from time to time in the Company's filings with the Securities and Exchange Commission and include among other things: the impact of legislative changes, the price volatility and availability of corn, distillers grains, ethanol, non-food grade corn oil, gasoline, natural gas, ethanol plants operating efficiently and according to forecasts and projections, changes in the international, national or regional economies, weather and the effects of terrorism or acts of war. The Company does not intend to update publicly any forward-looking statements except as required by law. Other factors that could cause actual results to differ materially from those in the forward-looking statements are set forth in Item 1A.
Available Information
REX makes available free of charge on its Internet website its annual report on Form 10-K, quarterly reports on Form 10-Q, current reports on Form 8-K, and amendments to those reports as soon as reasonably practicable after such material is electronically filed with or furnished to the SEC. REX's Internet website address is www.rexamerican.com. The contents of the Company's website are not a part of this report.
PART I
| Item 1. | Business |
References to "we", "us", "our", "REX" or "the Company" refer to REX American Resources Corporation and its majority owned subsidiaries.
Overview
REX was incorporated in Delaware in 1984 as a holding company. Our principal offices are located at 7720 Paragon Road, Dayton, Ohio 45459. Our telephone number is (937) 276-3931. We have been an investor in various alternative energy entities beginning with synthetic fuel partnerships in 1998 and later ethanol production facilities beginning in 2006. Historically, we were a specialty retailer in the consumer electronics and appliance industry serving small to medium-sized towns and communities. Recognizing the change in our business, we changed our corporate name from REX Stores Corporation to REX American Resources Corporation in 2010 as we completed the transition out of the retail business into the ethanol business.
We are currently invested in three ethanol production entities, two of which we have a majority ownership interest in. We may make additional investments in the energy industry in the future.
Our ethanol operations are highly dependent on commodity prices, especially prices for corn, ethanol, distillers grains, non-food grade corn oil and natural gas. As a result of price volatility for these commodities, our operating results can fluctuate substantially. The price and availability of corn is subject to significant fluctuations depending upon a number of factors that affect commodity prices in general, including crop conditions, weather, federal policy and foreign trade. Because the market price of ethanol is not always directly related to corn prices (for example, crude and other energy prices can impact ethanol prices), at times ethanol prices may lag movements in corn prices and, in an environment of higher corn
| 2 |
prices or lower ethanol prices, reduce the overall margin structure at the plants. As a result, at times, we may operate our plants at negative or marginally positive operating margins.
We expect our ethanol plants to produce approximately 2.8 gallons of denatured ethanol for each bushel of grain processed in the production cycle. We refer to the difference between the price per gallon of ethanol and the price per bushel of grain (divided by 2.8) as the "crush spread." Should the crush spread decline, it is possible that our ethanol plants will generate operating results that do not provide adequate cash flows for sustained periods of time. In such cases, production at the ethanol plants may be reduced or stopped altogether in order to minimize variable costs at individual plants.
We attempt to manage the risk related to the volatility of grain and ethanol prices by utilizing forward grain purchase and forward ethanol, distillers grains and non-food grade corn oil sale contracts. We attempt to match quantities of these sales contracts with an appropriate quantity of grain purchase contracts over a given period of time when we can obtain an adequate gross margin resulting from the crush spread inherent in the contracts we have executed. However, the market for future ethanol sales contracts is not a mature market. Consequently, we generally execute fixed price contracts for no more than two months into the future at any given time and we may lock in our corn or ethanol price without having a corresponding locked in ethanol or corn price for short durations of time. As a result of the relatively short period of time our fixed price contracts cover, we generally cannot predict the future movements in the crush spread for more than two months; thus, we are unable to predict the likelihood or amounts of future income or loss from the operations of our ethanol facilities. We utilize derivative financial instruments, primarily exchange traded commodity future contracts, in conjunction with certain of our grain procurement activities.
The crush spread realized in fiscal year 2015 was subject to significant volatility. For fiscal year 2015, the average Chicago Board of Trade ("CBOT") near-month corn price ranged from a low of approximately $3.48 per bushel in June 2015 to a high of approximately $4.41 per bushel in July 2015. Corn prices benefitted throughout the year from the three strongest corn harvests in U. S. history in 2013, 2014 and 2015 (in order of strength of harvest production). Ethanol prices had significant fluctuations ranging from approximately $1.31 per gallon in January 2016 to a high of approximately $1.69 per gallon in May 2015. Ethanol prices were influenced by many factors throughout the year including low energy prices, particularly late in fiscal year 2015 and over-production of ethanol. The CBOT crush spread during fiscal year 2015 ranged from approximately $0.02 in February 2015 to approximately $0.37 in May 2015.
Income from continuing operations, net of tax was approximately $31.4 million in fiscal year 2015 compared to approximately $86.8 million in fiscal year 2014. The decrease in profitability primarily resulted from lower crush spreads (compared to the prior year) experienced in the ethanol industry for a majority of fiscal year 2015 as lower energy prices and over supply of ethanol reduced ethanol pricing during fiscal year 2015. We expect that future operating results, from our consolidated plants, will be based upon combined annual production of between 215 and 240 million gallons of ethanol, which assumes that our consolidated ethanol plants will operate at or above nameplate capacity. However, due to the inherent volatility of the crush spread, we cannot predict the likelihood of future operating results being similar to the fiscal year 2015 results.
We plan to seek and evaluate various investment opportunities including energy related, agricultural or other ventures we believe fit our investment criteria. We can make no assurances that we will be successful in our efforts to find such opportunities.
Through a wholly owned subsidiary REX I.P., LLC, we have entered into a joint venture with Hytken HPGP LLC ("Hytken") to file and defend patents for eSteam technology relating to heavy oil and oil sands production methods, and to attempt to commercially exploit the technology to generate license fees, royalty income and development opportunities. The patented technology is an enhanced method of heavy oil
| 3 |
recovery involving zero emissions downhole steam generation. To date, we have paid approximately $1.6 million for our ownership interest, patent and other expenses, but have not successfully demonstrated that the technology is commercially feasible. We own 60% and Hytken owns 40% of the entity named Future Energy, LLC ("Future Energy"), an Ohio limited liability company. Future Energy is managed by a board of three managers, two appointed by us and one by Hytken.
Fiscal Year
All references in this report to a particular fiscal year are to REX's fiscal year ended January 31. For example, "fiscal year 2015" means the period February 1, 2015 to January 31, 2016. We refer to our fiscal year by reference to the year immediately preceding the January 31 fiscal year end date.
Alternative Energy Overview
We began investing in the ethanol industry during fiscal year 2006. We seek to identify quality ethanol plant opportunities located near adequate feedstock supply with good transportation capabilities or other economically beneficial attributes, and that utilize leading ethanol production technology.
The form and structure of our investments is tailored to the specific needs and goals of each project and the local farmer group or investor with whom we are partnering. We generally participate in the management of our projects through our membership on the board of managers of the limited liability companies that own the plants.
Ethanol Investments
We have equity investments in three entities as of January 31, 2016. The following table is a summary of our ethanol investments at January 31, 2016 (gallons in millions):
| Entity | Trailing 12 Months Ethanol Gallons Shipped | REX's Current Ownership Interest | Current Effective Ownership of Trailing 12 Months Ethanol Gallons Shipped | |||||||||
| One Earth Energy, LLC | 113.5 | 74.7 | % | 84.8 | ||||||||
| NuGen Energy, LLC | 118.5 | 99.5 | % | 117.9 | ||||||||
| Big River Resources W Burlington, LLC | 106.2 | 9.7 | % | 10.3 | ||||||||
| Big River Resources Galva, LLC | 118.1 | 9.7 | % | 11.5 | ||||||||
| Big River United Energy, LLC | 123.5 | 5.4 | % | 6.7 | ||||||||
| Big River Resources Boyceville, LLC | 57.7 | 9.7 | % | 5.6 | ||||||||
| Total | 637.5 | 236.8 | ||||||||||
One Earth Energy, LLC
We own 74.7% of the outstanding membership units of One Earth Energy, LLC, or One Earth. We consolidate One Earth with our financial results. One Earth commenced operations in the second quarter of fiscal year 2009 of its ethanol production facility in Gibson City, Illinois.
| 4 |
NuGen Energy, LLC
We own 99.5% of the outstanding membership units of NuGen Energy, LLC, or NuGen. We consolidate NuGen, which operates an ethanol producing facility in Marion, South Dakota, with our financial results.
Big River Resources, LLC
We own 9.7% of the outstanding membership units of Big River Resources, LLC, or Big River. Big River is a holding company for several entities including Big River Resources West Burlington, LLC which operates an ethanol plant in West Burlington, Iowa. Big River completed construction in the second quarter of fiscal year 2009 of its second plant which is located in Galva, Illinois. In August 2009, Big River acquired a 50.5% interest in Big River United Energy, LLC, which operates an ethanol production facility located in Dyersville, Iowa. Reflecting REX's 9.7% ownership interest in Big River, we have an effective 5.4% ownership interest in this entity. In December 2011, Big River acquired a 100% interest in an ethanol production facility which is located in Boyceville, Wisconsin. Big River also operates six agricultural elevators with a storage capacity of 15 million bushels. During fiscal year 2015, Big River completed construction of a zein protein plant, which is expected to begin production in the first quarter of fiscal year 2016.
Ethanol Industry
Ethanol is a renewable fuel source produced by processing corn and other biomass through a fermentation process that creates combustible alcohol that can be used as an additive or replacement to fossil fuel based gasoline. The majority of ethanol produced in the United States is made from corn because of its wide availability and ease of convertibility from large amounts of carbohydrates into glucose, the key ingredient in producing alcohol that is used in the fermentation process. Ethanol production can also use feedstocks such as grain sorghum, switchgrass, wheat, barley, potatoes and sugarcane as carbohydrate sources. Most ethanol plants have been located near large corn production areas, such as Illinois, Indiana, Iowa, Minnesota, Nebraska, Ohio and South Dakota. Railway access and interstate access are vital for ethanol facilities due to the large amount of raw materials and finished goods required to be shipped to and from the ethanol plant facilities.
According to the Renewable Fuels Association, or RFA, the United States ethanol industry produced an estimated 14.8 billion gallons of ethanol in 2015. Approximately 13.7 billion gallons were blended domestically and approximately 0.8 billion gallons were exported in 2015. According to the RFA, as of January 2016, the United States ethanol industry has grown to 214 plants (199 operating) in 29 states with an annual nameplate capacity of approximately 15.6 billion gallons (approximately 15.1 billion gallons at operating plants) of ethanol production.
On December 19, 2007, the Energy Independence and Security Act of 2007 (the "Energy Act of 2007") was enacted. The Energy Act of 2007 established new levels of renewable fuel mandates, including two different categories of renewable fuels: conventional biofuels and advanced biofuels. Corn-based ethanol is considered conventional biofuels which was subject to a renewable fuel standard ("RFS") of at least 14.4 billion gallons in 2014 and 15.0 billion gallons thereafter through 2022. The Environmental Protection Agency ("EPA") has the authority to waive the mandates in whole or in part if one of two conditions is met: 1) there is inadequate domestic renewable fuel supply, or 2) implementation of the mandate requirement severely harms the economy or environment of a state, region or the United States.
In November 2013, the EPA released its Notice of Proposed Rulemaking for the 2014 RFS, seeking comment on a range of total renewable fuel volumes and proposing a level of 15.2 billion gallons, including approximately 13.0 billion gallons of conventional corn-derived renewable fuel. The proposal included a
| 5 |
variety of approaches for setting the 2014 standard and a number of production and consumption ranges of biofuels covered by Renewable Fuel Standard II ("RFS II") to address two constraints of RFS II: (1) the volume limitations of ethanol given the practical constraints of vehicles that can use higher ethanol blends, and (2) the industry's ability to produce sufficient volumes of qualifying renewable fuel. In November 2014, the EPA rescinded its 2013 proposal. Furthermore, the EPA did not finalize the 2014 standard under the RFS program before the end of that year.
On June 10, 2015, the EPA proposed volume targets for conventional ethanol of 13.25 billion gallons, 13.40 billion gallons and 14.00 billion gallons for 2014, 2015 and 2016, respectively. On November 30, 2015, the EPA announced final volume requirements for conventional ethanol that were higher than levels proposed in June 2015 of 13.61 billion gallons, 14.05 billion gallons and 14.50 billion gallons for 2014, 2015 and 2016, respectively. The EPA has not yet announced its proposed volume requirements for subsequent years.
Ethanol Production
The plants we have invested in are designed to use the dry milling method of producing ethanol. In the dry milling process, the entire corn kernel is first ground into flour, which is referred to as "meal," and processed without separating out the various component parts of the grain. The meal is processed with enzymes, chemicals and water, and then placed in a high-temperature cooker. It is then transferred to fermenters where yeast is added and the conversion of sugar to ethanol begins. After fermentation, the resulting liquid is transferred to distillation columns where the ethanol is separated from the remaining "stillage" for fuel uses. The anhydrous ethanol is then blended with denaturant, such as natural gasoline, to render it undrinkable and thus not subject to beverage alcohol tax. With the starch elements of the corn consumed in the above described process, the principal co-product produced by the dry milling process is dry distillers grains with solubles, or DDGS. DDGS is sold as a protein used in animal feed and recovers a portion of the corn cost not absorbed in ethanol production. During fiscal year 2012, we began generating revenues from the sale of non-food grade corn oil at our One Earth and NuGen facilities. Non-food grade corn oil is sold to the animal feed market, as well as biodiesel and other chemical markets.
The Primary Uses of Ethanol
Blend component. Today, much of the ethanol blending in the U.S. is done to meet the RFS. Currently, ethanol is blended into approximately 97% of the gasoline sold in the United States, the majority as E-10 (a blend of 10% ethanol and 90% gasoline), according to the RFA. Going forward, the industry is attempting to expand the E-85 market, as well as to raise the federal cap on ethanol blend above the current 10% for most vehicles in use. The U.S. Environmental Protection Agency approved the use of 15% ethanol in gasoline for cars, SUV's and light duty trucks made in 2001 and later. Despite this, it will take time for this measure to be implemented and is still being met with great resistance.
Clean air additive. Ethanol is employed by the refining industry as a fuel oxygenate, which when blended with gasoline, allows engines to combust fuel more completely and reduce emissions from motor vehicles. Ethanol contains 35% oxygen, which results in more complete combustion of the fuel in the engine cylinder. Oxygenated gasoline is used to help meet certain federal and air emission standards.
Octane enhancer. Ethanol increases the octane rating of gasoline with which it is blended. As such, ethanol is used by gasoline suppliers as an octane enhancer both for producing regular grade gasoline from lower octane blending stocks and for upgrading regular gasoline to premium grades.
| 6 |
Legislation
The United States ethanol industry is highly dependent upon federal and state legislation. See Item 1A. Risk Factors for a discussion of legislation affecting the U.S. ethanol industry.
Facilities
At January 31, 2016, our consolidated ethanol entities own a combined 477 acres of land and two facilities that shipped a combined quantity of approximately 232 million gallons of ethanol in fiscal year 2015. In addition, we own three former retail store properties that are leased to outside, unrelated parties, and one vacant former retail store property that we are attempting to either lease or sell. We also own the office building (approximately 7,500 square feet) our corporate headquarters is located in.
Employees
At January 31, 2016, we had 116 employees at our two consolidated ethanol plants and at our corporate headquarters. None of our employees are represented by a labor union. We expect this employment level to remain relatively stable. We consider our relationship with our employees to be good.
Service Marks
We have registered the service marks "REX", and "Farmers Energy", with the United States Patent and Trademark Office. We are not aware of any adverse claims concerning our service marks.
| Item 1A. | Risk Factors |
We encourage you to carefully consider the risks described below and other information contained in this report when considering an investment decision in REX common stock. Any of the events discussed in the risk factors below may occur. If one or more of these events do occur, our results of operations, financial condition or cash flows could be materially adversely affected. In this instance, the trading price of REX stock could decline, and investors might lose all or part of their investment.
We have concentrations of cash deposits at financial institutions that exceed federal insurance limits.
We generally have cash deposits that exceed federal insurance limits. Should the financial institutions we deposit our cash at experience insolvency or other financial difficulty, our access to cash deposits could be limited. In extreme cases, we could lose our cash deposits entirely. This would negatively impact our liquidity and results of operations.
The current interest rate environment has resulted in lower yields on our excess cash.
We have experienced lower yields on our excess cash compared to historical yields. Should the present economic conditions result in a sustained period of historically low interest rates, our interest income would be negatively impacted.
Risks Related to our Alternative Energy Business
The ethanol industry is changing rapidly which could result in unexpected developments that could negatively impact our operations.
| 7 |
According to the RFA, the ethanol industry has grown from approximately 1.5 billion gallons of domestic annual ethanol production in 1999 to approximately 14.8 billion gallons in 2015. Thus, there have been significant changes in the supply and demand of ethanol over a relatively short period of time which could lead to difficulty in maintaining profitable operations at our ethanol plants.
We operate in a capital intensive industry. Limitations to external financing could adversely affect our financial performance.
We may need to incur additional financing to fund growth of our business or in times of increasing liquidity requirements (such as increases in raw material costs). Bankruptcy filings by several ethanol companies over the past several years and capital market volatility has reduced available capital for the ethanol industry. Any delays in obtaining additional financing, or our inability to do so, could have a material adverse impact on our financial results.
The financial returns on our ethanol investments are highly dependent on commodity prices, which are subject to significant volatility and uncertainty, and the availability of supplies, so our results could fluctuate substantially.
The financial returns on our ethanol investments are highly dependent on commodity prices, especially prices for corn, natural gas, ethanol, dried distillers grains, non-food grade corn oil and unleaded gasoline. As a result of the volatility of the prices for these items, the returns may fluctuate substantially and our investments could experience periods of declining prices for their products and increasing costs for their raw materials, which could result in operating losses at our ethanol plants.
Our returns on ethanol investments are highly sensitive to grain prices. Corn is the principal raw material our ethanol plants use to produce ethanol and co-products. As a result, changes in the price of corn can significantly affect our businesses. Rising corn prices result in higher costs of ethanol and co-products. Because ethanol competes with non-corn-based fuels, our ethanol plants may not be able to pass along increased grain costs to our customers. At certain levels, grain prices may make ethanol uneconomical to produce.
The price of corn is influenced by weather conditions and other factors affecting crop yields, transportation costs, farmer planting decisions, exports, the value of the U.S. dollar and general economic, market and regulatory factors. These factors include government policies and subsidies with respect to agriculture and international trade and global and local demand and supply. The significance and relative effect of these factors on the price of corn is difficult to predict. Any event that tends to negatively affect the supply of corn, such as adverse weather or crop disease, could increase corn prices and potentially harm the business of our ethanol plants. Increasing domestic ethanol capacity could boost the demand for corn and result in increased corn prices. Much of the Midwestern United States experienced drought conditions during 2012 which led to a smaller harvest of corn and increased corn prices. Our ethanol plants may also have difficulty, from time to time, in physically sourcing corn on economical terms due to supply shortages. Such a shortage could require our ethanol plants to suspend operations which would have a material adverse effect on our consolidated results of operations.
The spread between ethanol and corn prices can vary significantly. The gross margin at our ethanol plants depends principally on the spread between ethanol and corn prices. Fluctuations in the spread are likely to continue to occur. A sustained narrow or negative spread, whether as a result of sustained high or increased corn prices or sustained low or decreased ethanol prices, would adversely affect the results of operations at our ethanol plants.
| 8 |
Our risk management strategies may be ineffective and may expose us to decreased profitability and liquidity. In an attempt to partially offset the impact of volatility of commodity prices, we enter into forward contracts to sell a portion of our ethanol and distillers grains production and to purchase a portion of our corn and natural gas requirements. The financial impact of these risk management activities is dependent upon, among other items, the prices involved and our ability to receive or deliver the commodities involved. Risk management activities can result in financial loss when positions are purchased in a declining market or when positions are sold in an increasing market. In addition, we may not be able to match the appropriate quantity of corn contracts with quantities of ethanol, distillers grains and non-food grade corn oil contracts. We vary the amount of risk management techniques we utilize, and we may choose not to engage in any risk management activities. Should we fail to properly manage the inherent volatility of commodities prices, our results of operations and financial condition may be adversely affected.
The market for natural gas is subject to market conditions that create uncertainty in the price and availability of the natural gas that our ethanol plants use in their manufacturing process. Our ethanol plants rely upon third parties for their supply of natural gas, which is consumed as fuel in the production of ethanol. The prices for and availability of natural gas are subject to volatile market conditions. These market conditions often are affected by factors beyond the ethanol plants' control, such as weather conditions, overall economic conditions and foreign and domestic governmental regulation and relations. Significant disruptions in the supply of natural gas could impair or completely prevent the ethanol plants' ability to economically manufacture ethanol for their customers. Furthermore, increases in natural gas prices or changes in our natural gas costs relative to natural gas costs paid by competitors may adversely affect results of operations and financial position at our ethanol plants.
Fluctuations in the selling price of commodities may reduce profit margins at our ethanol plants. Ethanol is marketed as a fuel additive to reduce vehicle emissions from gasoline, as an octane enhancer to improve the octane rating of gasoline with which it is blended and, to a lesser extent, as a gasoline substitute. As a result, ethanol prices are influenced by the supply and demand for gasoline and our ethanol plants' results of operations and financial position may be materially adversely affected if gasoline demand or prices decrease.
Distillers grains compete with other protein based animal feed products. The price of distillers grains may decrease when the prices of competing feed products decrease. The prices of competing animal feed products are based in part on the prices of the commodities from which their products are made. Historically, sales prices for distillers grains have tracked along with the price of corn. However, there have been instances when the price increase for distillers grains has lagged price increases in corn prices.
The production of distillers grains has increased as a result of increases in dry mill ethanol production in the United States. This could lead to price declines in what we can sell our distillers grains for in the future. Such declines could have an adverse material effect on our results of operations.
Increased ethanol production or decreases in demand for ethanol may result in excess production capacity in the ethanol industry, which may cause the price of ethanol, distillers grains and non-food grade corn oil to decrease.
According to the RFA, domestic ethanol production nameplate capacity is approximately 15.6 billion gallons per year at January 2016. The RFA estimates that, as of January 2016, approximately 162 million gallons per year of additional production capacity is under construction or expansion. In addition, certain operating plants have qualified as efficient ethanol producers through the EPA pathway assessment, and are expanding, or planning to expand their capacity. The EPA set the RFS requirement to be satisfied by corn derived ethanol at 14.5 billion gallons for 2016. Excess capacity in the ethanol industry could have an adverse effect on the results of our operations. In a manufacturing industry with excess capacity, producers
| 9 |
have an incentive to manufacture additional products for so long as the price exceeds the marginal cost of production (i.e., the cost of producing only the next unit, without regard for interest, overhead or fixed costs). This incentive could result in the reduction of the market price of ethanol to a level that is inadequate to generate sufficient cash flow to cover costs.
Excess capacity may also result from decreases in the demand for ethanol, which could result from a number of factors, including, but not limited to, regulatory developments and reduced U.S. gasoline consumption. Reduced gasoline consumption could occur as a result of increased prices for gasoline or crude oil, which could cause businesses and consumers to reduce driving or acquire vehicles with more favorable gasoline mileage or acquire hybrid vehicles.
In addition, because ethanol production produces distillers grains and non-food grade corn oil as co-products, increased ethanol production will also lead to increased supplies of distillers grains and non-food grade corn oil. An increase in the supply of distillers grains and non-food grade corn oil, without corresponding increases in demand, could lead to lower prices or an inability to sell our ethanol plants' distillers grains and non-food grade corn oil production. A decline in the price of distillers grains or non-food grade corn oil could have a material adverse effect on the results of our ethanol operations.
Trade restrictions on ethanol exports and unfavorable foreign currency exchange rates could reduce the demand for ethanol.
The United States exported approximately 844 million gallons of ethanol in 2015. If producers and exporters of ethanol are subject to trade restrictions, or additional duties are imposed on exports, it may make it uneconomical to export ethanol. Furthermore, unfavorable changes in foreign currency exchange rates could reduce the demand for United States ethanol exports. This could result in an oversupply of ethanol in the United States which could have a material adverse effect on the results of our ethanol operations.
We depend on our partners to operate certain of our ethanol investments .
Our investments currently represent both majority and minority equity positions. Day-to-day operating control of minority owned plants generally remains with the local farmers' cooperative or investor group that has promoted the plant. We do not have the ability to directly modify the operations of these plants in response to changes in the business environment or in response to any deficiencies in local operations of the plants. In addition, local plant operators, who also represent the primary suppliers of corn and other crops to the plants, may have interests, such as the price and sourcing of corn and other crops, that may differ from our interest, which is based solely on the operating profit of the plant. The limitations on our ability to control day-to-day plant operations could adversely affect plant results of operations.
We may not successfully acquire or develop additional ethanol investments.
The growth of our ethanol business depends on our ability to identify and develop new ethanol investments. Our ethanol development strategy depends on referrals, and introductions, to new investment opportunities from industry participants, such as ethanol plant builders, financial institutions, marketing agents and others. We must continue to maintain favorable relationships with these industry participants, and a material disruption in these sources of referrals would adversely affect our ability to expand our ethanol investments.
Any expansion strategy will depend on prevailing market conditions for the price of ethanol and the costs of corn and natural gas and the expectations of future market conditions. There is increasing competition for suitable sites for ethanol plants. Even if suitable sites or opportunities are identified, we may not be able to secure the services and products from contractors, engineering firms, construction firms and equipment
| 10 |
suppliers necessary to build or expand ethanol plants on a timely basis or on acceptable economic terms. Construction costs associated with expansion may increase to levels that would make a new plant too expensive to complete or unprofitable to operate. Additional financing may also be necessary to implement any expansion strategy, which may not be accessible or available on acceptable terms. New and more stringent environmental regulations could increase the operating costs and risks of new plants, which, in turn could discourage us from further expansion.
Our ethanol plants may be adversely affected by technological advances and efforts to anticipate and employ such technological advances may prove unsuccessful.
The development and implementation of new technologies may result in a significant reduction in the costs of ethanol production. For instance, any technological advances in the efficiency or cost to produce ethanol from inexpensive, cellulosic sources such as corn stalk, wheat, oat or barley straw could have an adverse effect on our ethanol plants, because those facilities are designed to produce ethanol from corn, which is, by comparison, a raw material with other high value uses. We cannot predict when new technologies may become available, the rate of acceptance of new technologies by competitors or the costs associated with new technologies. In addition, advances in the development of alternatives to ethanol could significantly reduce demand for or eliminate the need for ethanol.
Any advances in technology which require significant unanticipated capital expenditures to remain competitive or which reduce demand or prices for ethanol would have a material adverse effect on the results of our ethanol operations.
In addition, alternative fuels, additives and oxygenates are continually under development. Alternative fuel additives that can replace ethanol may be developed, which may decrease the demand for ethanol. It is also possible that technological advances in engine and exhaust system design and performance could reduce the use of oxygenates, which would lower the demand for ethanol, and the results of our ethanol operations may be materially adversely affected.
The U.S. ethanol industry is highly dependent upon a myriad of federal and state legislation and regulation and any changes in legislation or regulation could materially and adversely affect our results of operations and financial position.
The Energy Independence and Security Act of 2007 (EISA) established RFS II, which modified the renewable fuel standard from prior legislation. EISA increased the amount of renewable fuel required to be blended into gasoline and required a minimum usage of corn derived renewable fuels of 12.0 billion gallons in 2010, increasing annually by 600 million gallons to 15.0 billion gallons in 2015. The EPA has the authority to assign the mandated amounts of renewable fuels to be blended into transportation fuel to individual fuel blenders. RFS II has been a primary factor in the growth of ethanol usage. On April 10, 2013, the Renewable Fuel Standard Elimination Act was introduced as H.R. 1461 to target the repeal of RFS II. Also introduced on April 10, 2013 was the RFS Reform Bill, H.R. 1462, which would prohibit more than ten percent ethanol in gasoline and reduce the RFS II required volume of renewable fuel. On May 14, 2013, the Domestic Alternatives Fuels Act of 2013 was introduced in the United States House of Representatives as H.R. 1959 to permit ethanol produced from natural gas to be used to meet the RFS II mandate. These bills failed to make it out of congressional committees and were not finalized into law. H.R. 21 was introduced on January 6, 2015 to provide for a comprehensive assessment of the scientific and technical research on the implication of the use of mid-level ethanol blends. This bill seeks to eliminate the waiver granted by the EPA to allow E15 fuel in 2001 and newer model cars and trucks. H.R. 434 was introduced on January 21, 2015 which seeks to modify the Clean Air Act by limiting or removing the authority of the EPA to grant waivers for higher blends of ethanol in domestic gasoline supply. This bill also repeals existing waivers
| 11 |
already granted by the EPA regarding E15 fuel. H.R. 704 was introduced February 4, 2015 and it is similar to H.R. 21 as it proposes limiting ethanol blends higher than 10% in domestic fuel supply and seeks to repeal the RFS.
Under EISA, the EPA has the authority to waive or modify the mandated RFS II requirements in whole or in part. In order to grant a waiver, the EPA administrator must determine in consultation with the Secretaries of Agriculture and Energy, that one of the following two conditions has been met: i) there is inadequate domestic renewable fuel supply or ii) implementation of the requirement would severely harm the economy or environment of a state, region or the country. During fiscal year 2012, several waiver requests were submitted to the EPA based on drought conditions, which were subsequently denied by the EPA.
The RFS II mandate increased to 14.4 billion gallons of corn derived renewable fuel for 2014 and 15.0 billion gallons in 2015 and was to remain at that level until 2022, subsequent to which time, no specific amount was established. In November of 2013, the EPA released a proposal that included several approaches for establishing the 2014 standards. The proposal was for approximately 15.2 billion gallons, including approximately 13.0 billion gallons of corn derived renewable fuel. The proposal addresses two constraints of RFS II: i) limitations in the volume of ethanol that can be consumed in gasoline given the practical constraints on the supply of higher ethanol blends to the vehicles that can use them and ii) limitations in the ability of the industry to produce sufficient volumes of qualifying renewable fuel. In November 2014, the EPA rescinded its 2013 proposal. Furthermore, the EPA did not finalize the 2014 standard under the RFS program before the end of that year.
On June 10, 2015, the EPA proposed volume targets for conventional ethanol of 13.25 billion gallons, 13.40 billion gallons and 14.00 billion gallons for 2014, 2015 and 2016, respectively. On November 30, 2015, the EPA announced final volume requirements for conventional ethanol that were higher than levels proposed in June of 13.61 billion gallons, 14.05 billion gallons and 14.50 billion gallons for 2014, 2015 and 2016, respectively. The EPA has not announced its proposed volume requirements for subsequent years.
To document compliance with RFS II, renewable identification numbers ("RINs"), are generated and attached to renewable fuels, and detached when the renewable fuel is blended into the transportation fuel supply. Detached RINs may be retired by obligated parties to demonstrate compliance with RFS II or may be separately traded in the market. The market price of detached RINs may affect the price of ethanol in certain U.S. markets as obligated parties may factor these costs into their purchasing decisions. Moreover, at certain price levels for various types of RINs, it becomes more economical to import foreign sugar cane ethanol. If changes to RFS II result in significant changes in the price of various types of RINs, it could negatively affect the price of ethanol and our ethanol business.
Changes in corporate average fuel economy standards could adversely impact ethanol prices. Flexible fuel vehicles receive preferential treatment in meeting federally mandated corporate average fuel economy ("CAFE") standards for automobiles manufactured by car makers. High blend ethanol fuels such as E-85 result in lower fuel efficiencies. Absent the CAFE preferences, car makers would not likely build flexible-fuel vehicles. Any change in CAFE preferences could reduce the growth of E-85 markets and result in lower ethanol prices.
Various studies have criticized the efficiency of ethanol, in general, and corn-based ethanol in particular, which could lead to the reduction or repeal of incentives and tariffs that promote the use and domestic production of ethanol or otherwise negatively impact public perception and acceptance of ethanol as an alternative fuel.
| 12 |
Although many trade groups, academics and governmental agencies have supported ethanol as a fuel additive that promotes a cleaner environment, others have criticized ethanol production as consuming considerably more energy and emitting more greenhouse gases than other biofuels and as potentially depleting water resources. Other studies have suggested that corn-based ethanol is less efficient than ethanol produced from switchgrass or wheat grain and that it negatively impacts consumers by causing prices for dairy, meat and other foodstuffs from livestock that consume corn to increase. If these views gain acceptance, support for existing measures promoting use and domestic production of corn-based ethanol could decline, leading to reduction or repeal of these measures. These views could also negatively impact public perception of the ethanol industry and acceptance of ethanol as an alternative fuel.
Federal support of cellulosic ethanol may result in reduced incentives to corn-derived ethanol producers.
The American Recovery and Reinvestment Act of 2009 and EISA provide funding opportunities in support of cellulosic ethanol obtained from biomass sources such as switchgrass and poplar trees. The amended RFS mandates an increasing level of production of non-corn derived biofuels. These federal policies may suggest a long-term political preference for cellulosic processes using alternative feedstocks such as switchgrass, silage or wood chips. Cellulosic ethanol has a smaller carbon footprint and is unlikely to divert foodstuff from the market. Several cellulosic ethanol plants are under development and there is a risk that cellulosic ethanol could displace corn ethanol. Our plants are designed as single-feedstock facilities, located in corn production areas with limited alternative feedstock nearby, and would require significant additional investment to convert to the production of cellulosic ethanol. The adoption of cellulosic ethanol as the preferred form of ethanol could have a significant adverse effect on our ethanol business.
Our ethanol business is affected by environmental and other regulations which could impede or prohibit our ability to successfully operate our plants.
Our ethanol production facilities are subject to extensive air, water and other environmental regulations. We have had to obtain numerous permits to construct and operate our plants. Regulatory agencies could impose conditions or other restrictions in the permits that are detrimental or which increase our costs. More stringent federal or state environmental regulations could be adopted which could significantly increase our operating costs or require us to expend considerable resources.
Our ethanol plants emit various airborne pollutants as by-products of the ethanol production process, including carbon dioxide. In 2007, the U.S. Supreme Court classified carbon dioxide as an air pollutant under the Clean Air Act in a case seeking to require the EPA to regulate carbon dioxide in vehicle emissions. In February 2010, the EPA released its final regulations on the Renewable Fuel Standard program. We believe our plants are grandfathered at their current operating capacity, but plant expansion will need to meet a 20% threshold reduction in greenhouse gas (GHG) emissions from a 2005 baseline measurement to produce ethanol eligible for the RFS II mandate. To expand our plant capacity, we may be required to obtain additional permits, install advanced technology equipment, or reduce drying of certain amounts of distillers grains. We may also be required to install carbon dioxide mitigation equipment or take other steps in order to comply with future laws or regulations. Compliance with future laws or regulations of carbon dioxide, or if we choose to expand capacity at certain of our plants, compliance with then-current regulations of carbon dioxide, could be costly and may prevent us from operating our plants as profitably, which may have a negative impact on our financial performance. We also face the risk of ethanol production above our grandfathered capacity not qualifying for RINS if the plants do not meet certain emission requirements.
The California Air Resources Board ("CARB") has adopted a Low Carbon Fuel Standard ("LCFS") requiring a 10% reduction in GHG emissions from transportation fuels by 2020. An Indirect Land Use
| 13 |
Charge is included in this lifecycle GHG emission calculation. After a series of rulings that temporarily prevented CARB from enforcing these regulations, the State of California Office of Administrative Law approved the LCFS on November 26, 2012 and revised LCFS regulations took effect in January 2013. This standard could have an adverse impact on the market for corn-based ethanol in California if corn-based ethanol fails to achieve lifecycle GHG emission reductions. This could have a negative impact on our financial performance.
Our ethanol business may become subject to various environmental and health and safety and property damage claims and liabilities.
Operations of our ethanol business will expose the business to the risk of environmental and health and safety claims and property damage claims, such as failure to comply with environmental regulations. These types of claims could also be made against our ethanol business based upon the acts or omissions of other persons. Serious claims could have a material negative impact on our results of operations, financial position and future cash flows.
Our business is not significantly diversified.
Our financial results depend heavily on our ability to operate our ethanol plants profitably. We do not have other lines of business or other sources of revenue to depend upon if we are unable to operate our ethanol plants profitably. Such lack of significant diversification could have a material negative impact on our results of operations, financial position and future cash flows should our ethanol plants operate unprofitably.
Our revenue from the sale of distillers grains depends upon its continued market acceptance as an animal feed.
Distillers grains is a co-product from the fermentation of corn to produce ethanol. Antibiotics may be used during the fermentation process to control bacterial contamination; therefore antibiotics may be present in small quantities in distillers grains marketed as animal feed. The U. S. Food and Drug Administration's, or FDA's, Center for Veterinary Medicine has expressed concern about potential animal and human health hazards from the use of distillers grains as an animal feed due to the possibility of antibiotic residues. If the public became concerned about the impact of distillers grains in the food supply or as an acceptable animal feed, the market for distillers grains could be negatively impacted, which would have a negative impact on our results of operations. We may not be able to obtain a suitable replacement for antibiotics, should this be required, which would also negatively impact the market for distillers grains.
Exports of distillers grains produced in the United States have been increasing in recent years. The price of distillers grains has benefitted from the increased exports of the product, with China being the largest importer. In 2013, China rejected certain shipments of distillers grains due to the presence of unapproved genetically modified organisms. If shipments to China or other countries are rejected or delayed, the market price for distillers grains would be negatively impacted, which would have a negative impact on our ethanol results of operations.
At certain of our plants, we extract and sell non-food grade corn oil immediately prior to the production of distillers grains. Several studies are trying to determine how non-food grade corn oil extraction may impact the nutritional value of the resulting distillers grains. If it is determined that non-food grade corn oil extraction adversely impacts the nutritional energy content of distillers grains, the value of the distillers grains we sell may be negatively impacted, which would have a negative impact on our results of operations.
| 14 |
The price of distillers grains may decline as a result of restrictions or duties on distillers grains exports from the United States or from unfavorable changes in foreign currency exchange rates.
Exports of distillers grains produced in the United States have been increasing in recent years. However, the export market may be jeopardized if foreign governments impose trade barriers or other measures to protect the foreign local markets. In January 2016, the China' Ministry of Commerce announced it has initiated anti-dumping and countervailing duty investigations of U.S. dried distillers grains exports to China. If producers and exporters of distillers grains are subjected to trade barriers when selling distillers grains to foreign customers, there may be a reduction in the price of distillers grains in the United States. In addition, foreign currency exchange rate fluctuations could reduce the demand for United States exports of distillers grains. Declines in the price we receive for our distillers grains could lead to decreased revenues and may result in our inability to operate our ethanol plants profitably.
We face significant competition in the ethanol industry.
We face significant competition for new ethanol investment opportunities. There are varied enterprises seeking to participate in the ethanol industry. Some enterprises provide financial and management support similar to our business model. Other enterprises seek to acquire or develop plants which they will directly own and operate. Many of our competitors are larger and have greater financial resources and name recognition than we do. We must compete for investment opportunities based on our strategy of supporting and enhancing local development of ethanol plant opportunities. We may not be successful in competing for investment opportunities based on our strategy.
The ethanol industry is primarily comprised of entities that engage exclusively in ethanol production and large integrated grain companies that produce ethanol along with their base grain business. Several large oil companies have entered the ethanol production market. If these companies increase their ethanol plant ownership or other oil companies seek to engage in direct ethanol production, there would be less of a need to purchase ethanol from independent producers like our ethanol plants.
Plants sold as part of a bankruptcy proceeding may have significantly lower fixed costs than our ethanol plants. Absent significant growth and diversification, our ethanol plants may not be able to operate profitably in a more competitive environment. No assurance can be given that our ethanol plants will be able to compete successfully or that competition from larger companies with greater financial resources will not have a materially adverse impact on the results of our ethanol operations.
We may face competition from foreign companies.
There is a risk of foreign competition in the ethanol industry. Brazil is presently the second largest producer of ethanol in the world. Brazil's ethanol production is sugarcane based, and, depending on feedstock prices, may be cheaper to produce. Under the RFS, certain parties were obligated to meet an advanced biofuel standard. In recent years, sugarcane based ethanol imported from Brazil has been one of the most economical means for obligated parties to comply with this standard.
If significant additional foreign ethanol production capacity is created, such facilities could create excess supplies of ethanol, which may result in lower prices of ethanol. In addition, foreign ethanol producers may be able to produce ethanol at costs lower than ours. These risks could have significant adverse effects on our financial performance.
In addition, the tariff that protected the U.S. ethanol industry expired at the end of 2011. The expiration of the tariff could lead to increases in the import of ethanol produced outside of the U.S.
| 15 |
We are exposed to credit risk from our sales of ethanol and distillers grains to customers.
The inability of a customer to make payments to us for our accounts receivable may cause us to experience losses and may adversely impact our liquidity and our ability to make our payments when due.
We may not be able to hire and retain qualified personnel to operate our ethanol plants.
Our ability to attract and retain competent personnel has a significant impact on operating efficiencies and plant profitability. Competition for key plant employees in the ethanol industry can be intense, and we may not be able to attract and retain qualified employees. Failure to do so could have a negative impact on our financial results at individual plants.
Our plants depend on an uninterrupted supply of energy and water to operate. Unforeseen plant shutdowns could harm our business.
Our plants require a significant and uninterrupted supply of natural gas, electricity and water to operate. We generally rely on third parties to provide these resources. If there is an interruption in the supply of energy or water for any reason, such as supply, delivery or mechanical problems and we are unable to secure an adequate alternative supply to sustain plant operations, we may be required to stop production. A production halt for an extended period of time could result in material losses.
Potential business disruption from factors outside our control, including natural disasters, severe weather conditions, accidents, strikes, unexpected equipment failures and unforeseen plant shutdowns, could adversely affect our cash flow and operating results.
The debt agreements for certain of the ethanol plants limit, or otherwise restrict the amount of dividends and other payments the ethanol subsidiaries can transfer to their members.
We are dependent on dividends from our ethanol subsidiaries to generate cash flow. Presently our unconsolidated ethanol subsidiary has debt agreements that limit payments to members. Therefore, this company cannot distribute all of the cash it generates to their members. Furthermore, we may not be able to use the excess cash flow from one subsidiary to fund corporate needs or needs of another operating ethanol subsidiary.
We rely on information technology in our operations and financial reporting and any material failure, inadequacy, interruption or security breach of that technology could harm our ability to efficiently operate our business and report our financial results accurately and timely.
We rely heavily on information technology systems across our operations, including for management of inventory, purchase orders, production, invoices, shipping, accounting and various other processes and transactions. Our ability to effectively manage our business, coordinate the production, distribution and sale of our products and ensure the timely and accurate recording and disclosure of financial information depends significantly on the reliability and capacity of these systems. The failure of these systems to operate effectively, problems with transitioning to upgraded or replacement systems, or a breach in security of these systems through a cyber-attack or otherwise could cause delays in product sales, reduced efficiency of our operations and delays in reporting our financial results. Significant capital investments could be required to remediate any such problem. Security breaches of employee information or other confidential or proprietary data could also adversely impact our reputation, and could result in litigation against us or the imposition of penalties.
| 16 |
We are exposed to potential business disruption from factors outside our control, including natural disasters, severe weather conditions, accidents, and unforeseen operational failures any of which could negatively affect our transportation operations and could adversely affect our cash flows and operating results.
Potential business disruption in available transportation due to natural disasters, significant track damage resulting from a train derailment, strikes or other interruptions by our transportation providers could result in delays in procuring and supplying raw materials to our ethanol facilities, or transporting ethanol and distillers grains to our customers. Such business disruptions may result in our inability to meet customer demand or contract delivery requirements, as well as the potential loss of customers.
Rail cars used to transport ethanol may need to be modified or replaced to meet proposed rail safety regulations.
The leased rail cars we use to transport ethanol to market will need to be retrofitted or replaced as the Enhanced Tank Car Standards and Operation Controls for High-Hazard Flammable Trains adopted by the U.S. Department of Transportation ("DOT") calls for an enhanced tank car standard known as the DOT specification 117 and establishes a schedule to retrofit or replace older tank cars that carry crude oil and ethanol. The rule also establishes braking standards intended to reduce the severity of accidents and new operational protocols. This could lead to increased rail car lease costs and delays in transportation of ethanol if rail cars are out of service for extended periods of time.
Risks Related to our eSteam investments and operations.
eSteam may not be commercially viable technology.
During fiscal year 2013, we invested in eSteam, a new technology utilizing steam to extract deep heavy oil. Cumulatively, we have spent approximately $1.6 million on this patented but unproven technology. Low energy and crude oil prices may make eSteam technology less attractive to potential users. If we cannot demonstrate that the technology is commercially feasible, we may incur additional losses.
Our eSteam technology may be subject to patent challenges.
We could be required to spend considerable time and resources defending our technology from patent challenges.
Operations utilizing our eSteam technology may be subject to stringent environmental regulations.
These operations will require significant amounts of water and energy. If we are unable to obtain the proper permits and sources of water and energy, then we may not be able to operate the new technologies, and thus, generate any revenue.
Operations utilizing our eSteam technology may cause environmental damage.
When operating the eSteam technology, we may cause environmental damage, as we would be injecting water into the ground in order to extract oil. We could be subject to significant penalties and fines if we were to cause environmental damage.
| Item 1B. | Unresolved Staff Comments |
None.
| 17 |
| Item 2. | Properties |
The information required by this Item 2 is set forth in Item 1 of this report under "Ethanol Investments" and "Facilities" and is incorporated herein by reference.
| Item 3. | Legal Proceedings |
We are involved in various legal proceedings incidental to the conduct of our business from time to time. We believe that the current proceedings will not have a material adverse effect on our financial condition or results of operations.
Executive Officers of the Company
Set forth below is certain information about each of our executive officers.
| Name | Age | Position | ||
| Stuart Rose | 61 | Executive Chairman of the Board* | ||
| Zafar Rizvi | 66 | Chief Executive Officer and President* | ||
| Douglas Bruggeman | 55 | Vice President-Finance, Chief Financial Officer and Treasurer | ||
| Edward Kress | 66 | Secretary* |
*Also serves as a director.
Stuart Rose was elected our Executive Chairman of the Board in 2015. Mr. Rose had served as our Chairman of the Board and Chief Executive Officer since our incorporation in 1984 as a holding company. Prior to 1984, Mr. Rose was Chairman of the Board and Chief Executive Officer of Rex Radio and Television, Inc., which he founded in 1980 to acquire the stock of a corporation which operated four retail stores.
Zafar Rizvi was elected Chief Executive Officer in 2015. Mr. Rizvi has been our President and Chief Operating Officer since 2010, was Vice President from 2006 to 2010 and has been President of Farmers Energy Incorporated, our alternative energy investment subsidiary, since 2006. From 1991 to 2006, Mr. Rizvi was our Vice President – Loss Prevention.
Douglas Bruggeman has been our Vice President–Finance and Treasurer since 1989 and was elected Chief Financial Officer in 2003. From 1987 to 1989, Mr. Bruggeman was our Manager of Corporate Accounting. Mr. Bruggeman was employed with the accounting firm of Ernst & Young prior to joining us in 1986.
Edward Kress has been our Secretary since 1984. Mr. Kress has been a partner of the law firm of Dinsmore & Shohl LLP (formerly Chernesky, Heyman & Kress P.L.L.), our legal counsel, since 1988. Mr. Kress has practiced law in Dayton, Ohio since 1974.
| Item 4. | Mine Safety Disclosures |
Not Applicable
| 18 |
PART II
| Item 5. | Market for Registrant's Common Equity, Related Stockholder Matters and Issuer Purchases of Equity Securities |
SHAREHOLDER INFORMATION
Common Share Information and Quarterly Share Prices
Our common stock is traded on the New York Stock Exchange under the symbol REX.
| Fiscal Quarter Ended | High | Low | |||||||
| April 30, 2014 | $ | 68.41 | $ | 37.33 | |||||
| July 31, 2014 | 90.69 | 56.59 | |||||||
| October 31, 2014 | 110.65 | 55.46 | |||||||
| January 31, 2015 | 76.29 | 51.63 | |||||||
| April 30, 2015 | $ | 65.99 | $ | 53.65 | |||||
| July 31, 2015 | 67.99 | 51.59 | |||||||
| October 31, 2015 | 58.99 | 43.50 | |||||||
| January 31, 2016 | 64.40 | 44.48 | |||||||
As of March 23, 2016, there were 88 holders of record of our common stock, including shares held in nominee or street name by brokers.
Dividend Policy
We did not pay dividends in the current or prior years. We (including our consolidated subsidiaries) currently have no restrictions on the payment of dividends. Our minority owned ethanol subsidiary has restrictions on its ability to pay dividends to members (including REX). One Earth paid dividends to REX of approximately $11.4 million, $13.2 million and $4.4 million during fiscal years 2015, 2014 and 2013, respectively. NuGen paid no dividends to REX during fiscal year 2015, and paid dividends to REX of approximately $34.8 million and $5.0 million during fiscal years 2014 and 2013, respectively.
Issuer Purchases of Equity Securities
| Period | Total Number of Shares Purchased | Average Price Paid per Share | Total Number of Shares Purchased as Part of Publicly Announced Plans or Programs (1) | Maximum Number of Shares that May Yet Be Purchased Under the Plans or Programs (1) | |||||||||||||
| November 1-30, 2015 | - | $ | - | - | 452,809 | ||||||||||||
| December 1-31, 2015 | 27,426 | $ | 49.46 | 27,426 | 425,383 | ||||||||||||
| January 1-31, 2016 | 182,145 | $ | 47.96 | 182,145 | 243,238 | ||||||||||||
| Total | 209,571 | $ | 48.16 | 209,571 | 243,238 | ||||||||||||
| 19 |
| (1) | On August 26, 2015, our Board of Directors increased our share repurchase authorization by an additional 500,000 shares. At January 31, 2016, a total of 243,238 shares remained available to purchase under this authorization. |
Equity Compensation Plans
Refer to Item 12 – Security Ownership of Certain Beneficial Owners and Management and Related Stockholder Matters for information regarding shares authorized for issuance under equity compensation plans.
Performance Graph
The following graph compares the yearly percentage change in the cumulative total shareholder return on our Common Stock against the cumulative total return of the S&P 500 Stock Index and a peer group comprised of selected publicly traded ethanol producers (*) for the period commencing January 31, 2011 and ended January 31, 2016. The graph assumes an investment of $100 in our Common Stock and each index on January 31, 2011 and reinvestment of all dividends.
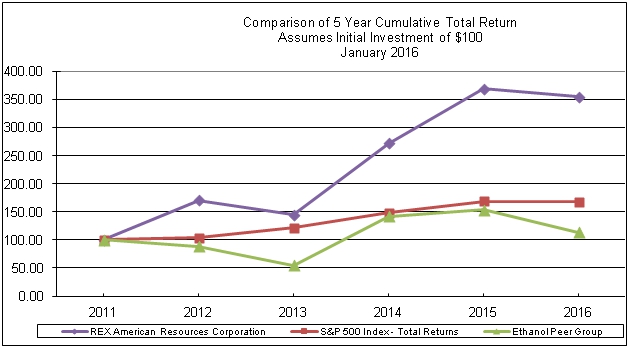
* The peer group is comprised of Pacific Ethanol, Inc. and Green Plains, Inc.
| Item 6. | Selected Financial Data |
The following statements of operations and balance sheet data have been derived from our consolidated financial statements and should be read in conjunction with Management's Discussion and Analysis of Financial Condition and Results of Operations and the Consolidated Financial Statements and related Notes. See Item 7. Management's Discussion and Analysis of Financial Condition and Results of Operations for a discussion of net sales and revenue and gross profit, income from ethanol investments, derivative financial
| 20 |
instruments, and long-term debt. These items have fluctuated significantly in recent years and may affect comparability of years.
| 21 |
Five Year Financial Summary
(In Thousands, Except Per Share Amounts)
| Years Ended January 31, | 2016 | 2015 | 2014 | 2013 | 2012 | |||||||||||||||
| Statement of Operations Data: | ||||||||||||||||||||
| Net sales and revenue | $ | 436,488 | $ | 572,230 | $ | 666,045 | $ | 656,589 | $ | 408,856 | ||||||||||
| Cost of sales | 385,654 | 430,291 | 601,757 | 642,787 | 373,912 | |||||||||||||||
| Gross profit | 50,834 | 141,939 | 64,288 | 13,802 | 34,944 | |||||||||||||||
| Selling, general and administrative expenses | (19,813 | ) | (19,422 | ) | (17,846 | ) | (12,546 | ) | (10,376 | ) | ||||||||||
| Equity in income of unconsolidated ethanol affiliates | 8,984 | 32,229 | 17,175 | 627 | 21,532 | |||||||||||||||
| Interest expense | - | (2,074 | ) | (3,898 | ) | (4,828 | ) | (3,374 | ) | |||||||||||
| Net income (loss) attributable to REX common shareholders | 31,436 | 87,337 | 35,073 | (2,295 | ) | 28,270 | ||||||||||||||
| Diluted net income (loss) per share attributable to REX common shareholders | $ | 4.30 | $ | 10.76 | $ | 4.29 | $ | (0.28 | ) | $ | 3.08 | |||||||||
| January 31, | 2016 | 2015 | 2014 | 2013 | 2012 | |||||||||||||||
| Balance Sheet Data: | ||||||||||||||||||||
| Cash and cash equivalents | $ | 135,765 | $ | 137,697 | $ | 105,149 | $ | 69,073 | $ | 75,013 | ||||||||||
| Current assets | 179,360 | 175,745 | 148,810 | 114,927 | 127,039 | |||||||||||||||
| Property and equipment – net | 189,976 | 194,447 | 202,258 | 223,180 | 240,084 | |||||||||||||||
| Equity method investments | 38,707 | 80,389 | 71,189 | 59,959 | 61,679 | |||||||||||||||
| Long term debt | - | - | 63,500 | 91,306 | 108,527 | |||||||||||||||
| Total REX shareholders' equity | 311,263 | 349,971 | 279,281 | 246,352 | 252,511 | |||||||||||||||
| Item 7. | Management's Discussion and Analysis of Financial Condition and Results of Operations |
Overview
We have been an investor in various alternative energy entities beginning with synthetic fuel partnerships in 1998 and later ethanol production facilities beginning in 2006. We currently have equity investments in three ethanol production entities, two of which we have a majority ownership interest. We may make additional alternative energy investments in the future.
Our ethanol operations are highly dependent on commodity prices, especially prices for corn, ethanol, distillers grains, non-food grade corn oil and natural gas. As a result of price volatility for these commodities, our operating results can fluctuate substantially. The price and availability of corn is subject to significant fluctuations depending upon a number of factors that affect commodity prices in general, including crop conditions, weather, federal policy and foreign trade. Because the market price of ethanol is not always directly related to corn prices, at times ethanol prices may not follow movements in corn prices and, in an environment of higher corn prices or lower ethanol prices, reduce the overall margin structure at the plants. As a result, at times, we may operate our plants at negative or marginally positive operating margins.
We expect our ethanol plants to produce approximately 2.8 gallons of denatured ethanol for each bushel of grain processed in the production cycle. We refer to the difference between the price per gallon of ethanol
| 22 |
and the price per bushel of grain (divided by 2.8) as the "crush spread." Should the crush spread decline, our ethanol plants are likely to generate operating results that do not provide adequate cash flows for sustained periods of time. In such cases, production at the ethanol plants may be reduced or stopped altogether in order to minimize variable costs at individual plants.
We attempt to manage the risk related to the volatility of grain and ethanol prices by utilizing forward grain purchase and forward ethanol, distillers grains and non-food grade corn oil sale contracts. We attempt to match quantities of these sale contracts with an appropriate quantity of grain purchase contracts over a given period of time when we can obtain an adequate gross margin resulting from the crush spread inherent in the contracts we have executed. However, the market for future ethanol sales contracts is not a mature market. Consequently, we generally execute fixed price contracts for no more than two months into the future at any given time and we may lock in our corn or ethanol price without having a corresponding locked in ethanol or corn price for short durations of time. As a result of the relatively short period of time our fixed price contracts cover, we generally cannot predict the future movements in the crush spread for more than two months; thus, we are unable to predict the likelihood or amounts of future income or loss from the operations of our ethanol facilities.
The crush spread realized in fiscal year 2015 was subject to significant volatility. For fiscal year 2015, the average Chicago Board of Trade ("CBOT") near-month corn price ranged from a low of approximately $3.48 per bushel in June 2015 to a high of approximately $4.41 per bushel in July 2015. Corn prices were favorably impacted throughout the year from the three strongest corn harvests in U. S. history in 2013, 2014 and 2015 (in order of strength of harvest production). Ethanol prices had significant fluctuations ranging from approximately $1.31 per gallon in January 2016 to a high of approximately $1.69 per gallon in May 2015. Ethanol prices were influenced by many factors throughout the year including low energy prices, particularly late in fiscal year 2015 and over-production of ethanol. The CBOT crush spread during fiscal year 2015 ranged from approximately $0.02 in February 2015 to approximately $0.37 in May 2015.
Income from continuing operations, net of tax was approximately $31.4 million in fiscal year 2015 compared to approximately $86.8 million in fiscal year 2014. We sold our interest in Patriot Holdings, LLC ("Patriot") effective June 1, 2015 for an after tax gain of approximately $6.6 million. The gain and resulting loss of income from Patriot using the equity method of accounting affects comparability between years. The decrease in profitability primarily resulted from lower crush spreads (compared to the prior year) experienced in the ethanol industry for a majority of fiscal year 2015 as lower energy prices and over supply of ethanol reduced ethanol pricing during fiscal year 2015. We expect that future operating results, from our consolidated plants, will be based upon combined annual production of between 215 and 240 million gallons of ethanol, which assumes that our consolidated ethanol plants will operate at or above nameplate capacity. However, due to the inherent volatility of the crush spread, we cannot predict the likelihood of future operating results being similar to the fiscal year 2015 results. We utilize derivative financial instruments, primarily exchange traded commodity future contracts, in conjunction with certain of our grain procurement activities.
The crush spread in the first quarter of fiscal year 2016 has continued to be negatively impacted by lower energy pricing and over supply of ethanol. Likewise, distillers grains pricing has also trailed the prior year which we believe is largely being impacted by lower corn prices and over supply. Distillers grains pricing may also be negatively impacted by the Chinese government initiating an anti-dumping and countervailing duty investigation in January 2016.
The EPA has reduced the RFS required volume from conventional biofuels for 2014, 2015 and 2016 from its originally mandated levels of 14.4 billion, 15.0 billion and 15.0 billion gallons to 13.6 billion, 14.1 billion and 14.5 billion gallons, respectively. The uncertainty regarding the required RFS volumes for future years could negatively impact ethanol pricing. The U.S. ethanol industry produced approximately 14.8 billion
| 23 |
gallons of conventional biofuel in 2015. The U.S. exported approximately 844 million gallons in 2015. If the export market is not maintained or increased, ethanol pricing may be negatively impacted.
We plan to seek and evaluate various investment opportunities including energy related, agricultural or other ventures we believe fit our investment criteria. We can make no assurances that we will be successful in our efforts to find such opportunities.
Through a wholly owned subsidiary REX I.P., LLC, we have entered into a joint venture with Hytken to file and defend patents for technology relating to heavy oil and oil sands production methods, and to attempt to commercially exploit the technology to generate license fees, royalty income and development opportunities. The patented technology is an enhanced method of heavy oil recovery involving zero emissions downhole steam generation. We own 60% and Hytken owns 40% of the entity named Future Energy, LLC, an Ohio limited liability company. Future Energy is managed by a board of three managers, two appointed by us and one by Hytken.
During fiscal year 2013, we agreed to fund direct patent expenses relating to patent applications and defense, annual annuity fees and maintenance on a country by country basis, with the right to terminate funding and transfer related patent rights to Hytken. We may also fund, through loans, all costs relating to new intellectual property, consultants, and future research and development, pilot field tests and equipment purchases for commercialization stage of the patents. To date, we have paid approximately $1.6 million for our ownership interest, patent and other expenses. Results of the formation and year to date operations of Future Energy, LLC were immaterial to the Consolidated Financial Statements.
In addition, at January 31, 2016, we had lease agreements for all or parts of three former retail properties and had one vacant former retail property. We are marketing the vacant property to lease or sell.
Ethanol Investments
In fiscal year 2006, we entered the alternative energy industry by investing in several entities organized to construct and, subsequently operate, ethanol producing plants. We are invested in three entities as of January 31, 2016, utilizing equity investments.
The following table is a summary of our ethanol investments at January 31, 2016 (gallons in millions):
| Entity | Trailing 12 Months Ethanol Gallons Shipped | REX's Current Ownership Interest | Current Effective Ownership of Trailing 12 Months Ethanol Gallons Shipped | |||||||||
| One Earth Energy, LLC | 113.5 | 74.7 | % | 84.8 | ||||||||
| NuGen Energy, LLC | 118.5 | 99.5 | % | 117.9 | ||||||||
| Big River Resources W Burlington, LLC | 106.2 | 9.7 | % | 10.3 | ||||||||
| Big River Resources Galva, LLC | 118.1 | 9.7 | % | 11.5 | ||||||||
| Big River United Energy, LLC | 123.5 | 5.4 | % | 6.7 | ||||||||
| Big River Resources Boyceville, LLC | 57.7 | 9.7 | % | 5.6 | ||||||||
| Total | 637.5 | 236.8 | ||||||||||
| 24 |
Results of Operations
Comparison of Fiscal Years Ended January 31, 2016 and 2015
The following table summarizes selected data from our consolidated operations:
| Years Ended January 31, | ||||||||
| 2016 | 2015 | |||||||
| Average selling price per gallon of ethanol | $ | 1.44 | $ | 2.00 | ||||
| Gallons of ethanol sold (in millions) | 232.1 | 226.4 | ||||||
| Average selling price per ton of dried distillers grains | $ | 145.50 | $ | 166.00 | ||||
| Tons of dried distillers grains sold | 557,511 | 580,304 | ||||||
| Average selling price per pound of non-food grade corn oil | $ | 0.26 | $ | 0.32 | ||||
| Pounds of non-food grade corn oil sold (in millions) | 59,249 | 53,930 | ||||||
| Average selling price per ton of modified distillers grains | $ | 66.17 | $ | 63.47 | ||||
| Tons of modified distillers grains sold | 90,659 | 75,842 | ||||||
| Average cost per bushel of grain | $ | 3.62 | $ | 3.99 | ||||
| Average cost of natural gas (per mmbtu) | $ | 3.71 | $ | 6.10 | ||||
Net Sales and Revenue – Net sales and revenue in fiscal year 2015 were approximately $436.5 million, a 23.7% decrease from approximately $572.2 million in fiscal year 2014. The following table summarizes sales of our consolidated operations for each product and service group for the periods presented (amounts in thousands):
| Fiscal Year | ||||||||||||
| Product or Service Category | 2015 | 2014 | 2013 | |||||||||
| Ethanol | $ | 333,200 | $ | 452,831 | $ | 500,203 | ||||||
| Dried distillers grains | 81,116 | 96,328 | 125,575 | |||||||||
| Non-food grade corn oil | 15,510 | 16,985 | 18,788 | |||||||||
| Modified distillers grains | 5,999 | 4,814 | 18,998 | |||||||||
| Other | 663 | 1,272 | 2,481 | |||||||||
| Total | $ | 436,488 | $ | 572,230 | $ | 666,045 | ||||||
Ethanol sales decreased from approximately $452.8 million in the prior year to approximately $333.2 million in the current year, primarily a result of a $0.56 decline in the price per gallon sold. Management believes the decline in the selling price results primarily from the historically low crude oil prices experienced in fiscal year 2015 and an oversupply of ethanol. Dried distillers grains sales decreased from approximately $96.3 million in the prior year to approximately $81.1 million in the current year, primarily a result of a $20.50 decline in the price per ton sold. Management believes the decline in the selling price results primarily from the lower grain prices experienced during fiscal year 2015. Non-food grade corn oil sales decreased from approximately $17.0 million in the prior year to approximately $15.5 million in the current year, primarily a result of a $0.06 decline in the price per pound sold. Modified distillers grains sales
| 25 |
increased from approximately $4.8 million in the prior year to approximately $6.0 million in the current year, primarily a result of a 19.5% increase in tons sold.
We expect that sales of One Earth and NuGen in future periods will be based upon the following:
| Product | Annual Sales Quantity | |
| Ethanol | 215 million to 240 million gallons | |
| Dried distillers grains | 550,000 to 625,000 tons | |
| Non-food grade corn oil | 50 million to 70 million pounds | |
| Modified distillers grains | 60,000 to 100,000 tons |
This expectation assumes that One Earth and NuGen will continue to operate at or above capacity, which is dependent upon the crush spread realized. We may vary the amounts of dried and modified distillers grains production, and resulting sales, based upon market conditions.
Gross Profit – Gross profit was approximately $50.8 million in fiscal year 2015, or 11.6% of net sales and revenue, versus approximately $141.9 million in fiscal year 2014 or 24.8% of net sales and revenue. This represents a decrease of approximately $91.1 million. The crush spread for fiscal year 2015 was approximately $0.17 per gallon of ethanol sold compared to approximately $0.59 per gallon of ethanol sold in fiscal year 2014. Grain accounted for approximately 76% ($293.0 million) of our cost of sales during fiscal year 2015 compared to approximately 74% ($320.0 million) during fiscal year 2014. Natural gas accounted for approximately 6% ($22.7 million) of our cost of sales during fiscal year 2015 compared to approximately 9% ($37.9 million) during fiscal year 2014. The decrease in natural gas costs are primarily related to relatively mild winter weather conditions and generally large production volumes of natural gas. Given the inherent volatility in ethanol, distillers grains, non-food grade corn oil, grain and natural gas prices, we cannot predict the likelihood that the spread between ethanol, distillers grains, non-food grade corn oil and grain prices in future periods will be consistent compared to historical periods.
We attempt to match quantities of ethanol, distillers grains and non-food grade corn oil sale contracts with an appropriate quantity of grain purchase contracts over a given period of time when we can obtain an adequate margin resulting from the crush spread inherent in the contracts we have executed. However, the market for future ethanol sales contracts is not a mature market. Consequently, we generally execute fixed price contracts for no more than two months into the future at any given time and we may lock in our corn or ethanol price without having a corresponding locked in ethanol or corn price for short durations of time. As a result of the relatively short period of time our fixed price contracts cover, we generally cannot predict the future movements in the crush spread for more than two months. None of our forecasted ethanol, approximately 9% of our forecasted distillers grains and approximately 17% of our forecasted non-food grade corn oil production during the next 12 months have been sold under fixed-price contracts. The effect of a 10% adverse change in the price of ethanol, distillers grains and non-food grade corn oil from the current pricing would result in a decrease in annual revenues in fiscal year 2016 of approximately $38.5 million. Similarly, approximately 2% of our estimated corn usage for the next 12 months was subject to fixed-price contracts. The effect of a 10% adverse change in the price of corn from current pricing would result in an increase in annual cost of goods sold in fiscal year 2016 of approximately $30.7 million.
Selling, General and Administrative Expenses – Selling, general and administrative expenses for fiscal year 2015 were approximately $19.8 million (4.5% of net sales and revenue), an increase of approximately $0.4 million or 2.0% from approximately $19.4 million (3.4% of net sales and revenue) for fiscal year 2014. A majority of the dollar fluctuation results from increases in professional fees.
| 26 |
Gain on Sale of Investment – On June 1, 2015, Patriot and a subsidiary of CHS Inc. ("CHS") completed a merger that resulted in CHS acquiring 100% of the ownership interest in Patriot. We received a cash payment of approximately $45.5 million at the closing, representing our proportionate share of the merger proceeds. The total merger consideration was approximately $196 million in cash subject to certain adjustments and certain escrow holdbacks. In connection with this transaction, we recognized a gain of approximately $10.4 million. At January 31, 2016, we have approximately $4.4 million in accounts receivable on the accompanying Consolidated Balance Sheet related to estimated escrow proceeds that were recognized as income. We expect that a determination of the final payment of escrowed proceeds to be received will occur by December of 2016.
Equity in Income of Unconsolidated Ethanol Affiliates – During fiscal years 2015 and 2014, we recognized income of approximately $9.0 million and $32.2 million, respectively, from our equity investments in Big River and Patriot. Big River has an effective ownership of ethanol gallons shipped in the trailing twelve months ended January 31, 2016 of approximately 344 million gallons. Effective June 1, 2015, a merger between Patriot and CHS occurred in which our ownership interest in Patriot was sold; thus we ceased recording income from Patriot using the equity method of accounting.
Income from Big River was approximately $6.0 million and $18.2 million in fiscal years 2015 and 2014, respectively. Income from Patriot was approximately $2.9 million and $14.0 million in fiscal years 2015 and 2014, respectively. As with our consolidated plants, Big River's and Patriot's results in fiscal year 2015 were negatively impacted from the decreased crush spread experienced in the ethanol industry.
Overall, we expect the trends in crush spread margins described in the "Overview" section to be generally consistent with the operating experience of Big River as its results are dependent on the same key drivers (ethanol, corn and natural gas pricing). Due to the inherent volatility of the crush spread, we cannot predict the likelihood of future operating results from Big River being similar to the fiscal year 2015 results.
Interest and Other Income – Interest and other income of approximately $0.6 million for fiscal year 2015 was consistent with the fiscal year 2014 amount.
Interest Expense – There was no interest expense for fiscal year 2015 compared to approximately $2.1 million for fiscal year 2014. This decrease was attributable to scheduled and accelerated principal repayments that paid off our debt balances in full during fiscal year 2014.
Gain (Loss) on Disposal of Real Estate and Property and Equipment, net – We recognized gains of approximately $0.5 million in fiscal year 2015 compared to losses of approximately $0.2 million in fiscal year 2014. We sold three real estate properties in fiscal year 2015 classified in continuing operations while such sales were classified as discontinued operations in fiscal year 2014. The change in classification is a result of us adopting Accounting Standards Update ("ASU") 2014-08, " Reporting Discontinued Operations and Disclosures of Disposals of Components of an Entity " ("ASU 2014-08").
Provision for Income Taxes – Our effective tax rate was 27.4% and 32.5% for fiscal years 2015 and 2014, respectively. Our effective rate is impacted by the noncontrolling interests of the companies we consolidate, as we recognize 100% of their income or loss in continuing operations before income taxes and noncontrolling interests. However, we only provide an income tax provision or benefit for our portion of the subsidiaries' income or loss with a noncontrolling interest. In addition, our effective rate was favorably impacted as state and local taxes decreased from 3.6% to a benefit of 1.5% primarily as a result of lower tax rates and apportionment in certain jurisdictions.
Income from Continuing Operations – As a result of the foregoing, income from continuing operations was approximately $37.4 million for fiscal year 2015 versus approximately $103.2 million for fiscal year 2014.
| 27 |
Discontinued Operations – During fiscal year 2009, we closed our remaining retail store and warehouse operations and reclassified all retail related results at that time as discontinued operations. Income or loss from discontinued operations, net of taxes was insignificant for both fiscal years 2015 and 2014. We expect such income or loss to be insignificant for future periods. There was no gain on sale, net of taxes, during fiscal year 2015 compared to approximately $0.3 million, which was recognized for four properties classified as discontinued operations during fiscal year 2014. The change in classification is a result of us adopting ASU 2014-08. We expect gain on sale of discontinued operations to be insignificant in future periods.
Noncontrolling Interests – Income attributable to noncontrolling interests was approximately $6.0 million and $16.4 million during fiscal years 2015 and 2014, respectively, and represents the owners' (other than us) share of the income or loss of One Earth, NuGen and Future Energy. Noncontrolling interests of One Earth and NuGen were approximately $6.0 million and $0.1 million, respectively, during fiscal year 2015. Noncontrolling interests of One Earth and NuGen were approximately $16.2 million and $0.4 million, respectively, during fiscal year 2014. The loss related to noncontrolling interests of Future Energy was approximately $0.1 million and $0.2 million during fiscal years 2015 and 2014, respectively.
Net Income Attributable to REX Common Shareholders – As a result of the foregoing, net income attributable to REX common shareholders was approximately $31.4 million for fiscal year 2015 compared to $87.3 million for fiscal year 2014.
Comparison of Fiscal Years Ended January 31, 2015 and 2014
The following table summarizes selected operating data from One Earth and NuGen during periods of consolidation:
| Years Ended January 31, | ||||||||
| 2015 | 2014 | |||||||
| Average selling price per gallon of ethanol | $ | 2.00 | $ | 2.20 | ||||
| Gallons of ethanol sold (in millions) | 226.4 | 227.2 | ||||||
| Average selling price per ton of dried distillers grains | $ | 166.00 | $ | 233.27 | ||||
| Tons of dried distillers grains sold | 580,304 | 538,337 | ||||||
| Average selling price per pound of non-food grade corn oil | $ | 0.32 | $ | 0.38 | ||||
| Pounds of non-food grade corn oil sold (in millions) | 53.9 | 49.9 | ||||||
| Average selling price per ton of modified distillers grains | $ | 63.47 | $ | 114.91 | ||||
| Tons of modified distillers grains sold | 75,842 | 165,329 | ||||||
| Average cost per bushel of grain | $ | 3.99 | $ | 6.27 | ||||
| Average cost of natural gas (per mmbtu) | $ | 6.10 | $ | 4.54 | ||||
Net Sales and Revenue – Net sales and revenue in fiscal year 2014 were approximately $572.2 million, a 14.1% decrease from approximately $666.0 million in fiscal year 2013. Net sales and revenue do not include sales from operations classified as discontinued operations. Ethanol sales decreased from approximately $500.2 million in fiscal year 2013 to approximately $452.8 million in fiscal year 2014, primarily a result of a $0.20 decline in the price per gallon sold. Dried distillers grains sales decreased from approximately $125.6 million in fiscal year 2013 to approximately $96.3 million in fiscal year 2014, primarily a result of a $67.27 decrease in the price per ton sold. Our non-food grade corn oil sales decreased from approximately $18.8 million in fiscal year 2013 to approximately $17.0 million in fiscal year 2014, primarily a result of a $0.06 decline in the price per pound sold. Our modified distillers grains sales decreased from approximately $19.0
| 28 |
million in fiscal year 2013 to approximately $4.8 million in fiscal year 2014, primarily a result of a $51.44 decline in the price per ton sold and a decline of 89,500 tons sold.
Gross Profit – Gross profit was approximately $141.9 million in fiscal year 2014, or 24.8% of net sales and revenue, versus approximately $64.3 million in fiscal year 2013 or 9.7% of net sales and revenue. This represents an increase of approximately $77.6 million. The crush spread for fiscal year 2014 was approximately $0.59 per gallon of ethanol sold compared to approximately $(0.02) per gallon of ethanol sold during fiscal year 2013. Grain accounted for approximately 74% ($320.0 million) of our cost of sales during fiscal year 2014 compared to approximately 84% ($504.1 million) during fiscal year 2013. Natural gas accounted for approximately 9% ($37.9 million) of our cost of sales during fiscal year 2014 compared to approximately 5% ($28.1 million) during fiscal year 2013 million primarily due to higher rates in fiscal year 2014.
Selling, General and Administrative Expenses – Selling, general and administrative expenses for fiscal year 2014 were approximately $19.4 million (3.4% of net sales and revenue), an increase of approximately $1.6 million or 9.0% from approximately $17.8 million (2.7% of net sales and revenue) for fiscal year 2013. The increase is primarily a result of increases in incentive compensation associated with the higher levels of profitability in fiscal year 2014 compared to fiscal year 2013.
Equity in Income of Unconsolidated Ethanol Affiliates – During fiscal years 2014 and 2013, we recognized income of approximately $32.2 million and $17.2 million, respectively, from our equity investments in Big River and Patriot. Income from Big River was approximately $18.2 million and $8.8 million in fiscal years 2014 and 2013, respectively. Income from Patriot was approximately $14.0 million and $8.4 million in fiscal years 2014 and 2013, respectively. Big River's and Patriot's results in fiscal year 2014 were favorably impacted from the increased crush spread experienced in the ethanol industry.
Interest and Other Income – Interest and other income of approximately $0.4 million for fiscal year 2014 was consistent with the fiscal year 2013 amount.
Interest Expense – Interest expense decreased to approximately $2.1 million for fiscal year 2014 from approximately $3.9 million for fiscal year 2013. This decrease was primarily a result of scheduled and accelerated principal repayments that have reduced our debt levels.
Loss on Disposal of Real Estate and Property and Equipment, net – We recognized losses of approximately $0.2 million in fiscal year 2014, which was primarily the result of certain equipment being disposed of at one of our ethanol plants.
Income Taxes – Our effective tax rate was 32.5% and 34.6% for fiscal years 2014 and 2013, respectively. Our effective rate is impacted by the noncontrolling interests of the companies we consolidate, as we recognize 100% of their income or loss in continuing operations before income taxes and noncontrolling interests. However, we only provide an income tax provision or benefit for our portion of the subsidiaries' income or loss with a noncontrolling interest. In addition, our effective rate was favorably impacted as state and local taxes decreased from 4.5% to 3.6% primarily as a result of higher deductions for state taxes paid.
Income or Loss from Continuing Operations – As a result of the foregoing, income from continuing operations was approximately $103.2 million for fiscal year 2014 versus approximately $39.2 million for fiscal year 2013.
Discontinued Operations – We had income from discontinued operations, net of taxes, of approximately $0.2 million in fiscal year 2014 compared to approximately $0.3 million in fiscal year 2013. Four properties classified as discontinued operations were sold during fiscal year 2014, resulting in a gain, net of taxes, of
| 29 |
approximately $0.3 million. We sold or disposed of eight properties classified as discontinued operations in fiscal year 2013; as a result, we had a gain from disposal of discontinued operations, net of taxes, of approximately $0.7 million in fiscal year 2013.
Noncontrolling Interests – (Income) or loss related to noncontrolling interests was approximately $(16.4) million and $(5.2) million during fiscal years 2014 and 2013, respectively, and represents the owners' (other than us) share of the income or loss of One Earth, NuGen and Future Energy. Noncontrolling interests of One Earth and NuGen were approximately $(16.2) million and $(0.4) million, respectively, during fiscal year 2014. Noncontrolling interests of One Earth and NuGen were approximately $(5.4) million and $(0.2) million, respectively, during fiscal year 2013. The loss related to noncontrolling interests of Future Energy was approximately $0.2 million and $0.4 million during fiscal years 2014 and 2013, respectively.
Net Income or Loss Attributable to REX Common Shareholders – As a result of the foregoing, net income attributable to REX common shareholders was approximately $87.3 million for fiscal year 2014 compared to $35.1 million for fiscal year 2013.
Liquidity and Capital Resources
Our primary sources of cash have been income from operations, a sale of one of our ethanol investments, and dividends from ethanol investments. Our primary uses of cash have been capital expenditures at our ethanol plants, long term debt repayments and stock repurchases.
Outlook – Our cash balance of approximately $135.8 million includes approximately $78.6 million held by One Earth and NuGen. During fiscal year 2014, One Earth and NuGen paid off and terminated their debt agreements, and are no longer limited with respect to paying dividends. We expect that One Earth and NuGen will use a majority of their cash for working capital needs, general corporate purposes and dividend payments. We expect our equity method investee to limit the payment of dividends based upon working capital needs.
We are investigating various uses of our excess cash. We have a stock buyback program, and given our current authorization level, can repurchase a total of 243,238 shares as of January 31, 2016. We typically repurchase our common stock when our stock price is trading at prices we deem to be a discount to the underlying value of our net assets. We do not currently plan to build a new ethanol plant. Another possible use of our cash is to expand the capacity of our existing consolidated plants by approximately 10-15% as these plants have qualified as efficient ethanol producers through the EPA pathway assessment. We also plan to seek and evaluate other various investment opportunities including energy related, agricultural or other ventures we believe fit our investment criteria.
We do not have significant commitments for capital expenditures at January 31, 2016. We expect capital expenditures to be in the range of approximately $6 million to $10 million in fiscal year 2016 and expect to fund such capital expenditures with available cash at our ethanol plant subsidiaries.
Operating Activities – Net cash provided by operating activities was approximately $40.2 million for fiscal year 2015 compared to approximately $137.2 million in fiscal year 2014. During fiscal year 2015, operating cash flow was provided by net income of approximately $37.4 million and adjustments of approximately $(5.4) million, which consist of depreciation and amortization, income from equity method investments, gain on sale of investment and disposal of real estate and property and equipment and the deferred income tax provision. Big River and Patriot paid dividends to REX of approximately $11.2 million during fiscal year 2015. Accounts receivable increased approximately $0.5 million, primarily a result of the timing of products shipped and the receipt of customer payments at One Earth and NuGen. Inventory decreased approximately $0.8 million, primarily a result of the lower quantities of corn on hand
| 30 |
and the decline in corn costs during fiscal year 2015. Accounts payable increased approximately $0.4 million, primarily a result of the timing of vendor payments. Prepaid expenses and other assets increased approximately $1.1 million, primarily a result of increased payment for refundable real estate taxes. Refundable income taxes increased approximately $2.2 million resulting from our estimated payments of the current year liabilities.
Net cash provided by operating activities was approximately $137.2 million for fiscal year 2014. During fiscal year 2014, operating cash flow was provided by net income of approximately $103.7 million including adjustments to net income of approximately $5.6 million, which consist of depreciation and amortization, income from equity method investments, derivative financial instruments, gain on disposal of real estate and property and equipment and the deferred income tax provision. Big River and Patriot paid dividends to REX of approximately $22.9 million during fiscal year 2014 as a result of their financial performance during the current year. Accounts receivable decreased approximately $7.7 million, primarily a result of the timing of products shipped and the receipt of customer payments at One Earth and NuGen and the impact of lower commodity prices during fiscal year 2014. Inventory decreased approximately $1.3 million, primarily a result of the decline in corn costs during fiscal year 2014. Accounts payable increased approximately $2.0 million, primarily a result of the timing of vendor payments. Prepaid expenses and other assets increased approximately $1.9 million, primarily a result of increased payment for refundable real estate taxes. Refundable income taxes increased approximately $2.0 million resulting from tax overpayments in prior years being used to pay the current year liability and estimated payments made during fiscal year 2014. Accrued expenses and other liabilities decreased approximately $1.7 million, primarily a result of lower accruals for interest and taxes at January 31, 2015.
Investing Activities – Net cash provided by investing activities was approximately $32.2 million during fiscal year 2015 compared to cash used of approximately $7.3 million during fiscal year 2014. Capital expenditures in fiscal year 2015 totaled approximately $15.5 million, the majority of which was plant expansion capacity projects at One Earth's and NuGen's ethanol plant. The sale of our equity investment in Patriot provided cash of approximately $45.5 million during fiscal year 2015. Cash of approximately $2.0 million was provided by proceeds from the sale of three real estate properties.
Net cash used in investing activities was approximately $7.3 million during fiscal year 2014. Capital expenditures in fiscal year 2014 totaled approximately $9.9 million, the majority of which was for grain and ethanol storage expansion at NuGen's ethanol plant. Cash of approximately $1.8 million was provided by proceeds from the sale of real estate and property and equipment. We received payments of approximately $0.8 million as refunds or reductions of restricted investments and deposits from governmental agencies.
Financing Activities – Net cash used in financing activities was approximately $74.3 million during fiscal year 2015 compared to approximately $97.3 million for fiscal year 2014. We used cash of approximately $4.5 million to purchase shares from and pay dividends to noncontrolling members of One Earth and NuGen. We do not expect such payments to noncontrolling members of One Earth and NuGen to increase significantly in fiscal year 2016. During fiscal year 2015, we purchased approximately 1,247,000 shares of our common stock for approximately $69.9 million in open market transactions.
Net cash used in financing activities was approximately $97.3 million during fiscal year 2014. During fiscal year 2014, repayments of debt were approximately $75.7 million. The increase in repayments of debt resulted from accelerated payments on NuGen's and One Earth's loans. Stock option exercises in fiscal year 2014 generated cash of approximately $0.9 million. We used cash of approximately $4.9 million to purchase shares from and pay dividends to noncontrolling members of One Earth and NuGen. During fiscal year 2014, we purchased approximately 282,000 shares of our common stock for approximately $18.1 million in open market transactions.
| 31 |
At January 31, 2015, we had no debt outstanding as we paid off our debt during fiscal year 2014 and terminated the related agreements.
Based on our forecasts, which are primarily based on estimates of plant production, prices of ethanol, corn, distillers grains, non-food grade corn oil and natural gas as well as other assumptions management believes to be reasonable, management believes that cash flow from operating activities together with working capital will be sufficient to meet One Earth's and NuGen's respective liquidity needs. However, if a material adverse change in the financial position of One Earth or NuGen should occur, or if actual sales or expenses are substantially different than what has been forecasted, One Earth's and NuGen's liquidity, and ability to fund future operating and capital requirements could be negatively impacted.
Including equity method investees, approximately 9.5% of our net assets are restricted pursuant to the terms of various loan agreements as of January 31, 2016. Excluding equity method investees, none of our net assets are restricted as of January 31, 2016.
Off Balance Sheet Arrangements
None.
Tabular Disclosure of Contractual Obligations
In the ordinary course of business, we enter into agreements under which we are obligated to make legally enforceable future cash payments. These agreements include obligations related to purchasing inventory and leasing rail cars. The following table summarizes by category expected future cash outflows associated with contractual obligations in effect, at January 31, 2016 (amounts in thousands):
| Payment due by period | ||||||||||||||||||||
| Contractual Obligations | Total | Less than 1 Year | 1-3 Years | 3-5 Years | More than 5 Years | |||||||||||||||
| Other (a) | $ | 35,993 | $ | 12,285 | $ | 12,420 | $ | 7,119 | $ | 4,169 | ||||||||||
| (a) | Amounts represent primarily payments due for rail car usage and grain contracts at One Earth and NuGen. We are not able to determine the likely settlement period for uncertain tax positions, accordingly, approximately $1.0 million of uncertain tax positions and related interest and penalties have been excluded from the table above. We are not able to determine the likely settlement for forward basis corn purchase contracts which do not contain a determinable fixed price; accordingly, payments for such contracts have been excluded from the table above. |
Seasonality and Quarterly Fluctuations
The impact of seasonal and quarterly fluctuations has not been material to our results of operations for the past three fiscal years.
Impact of Inflation
The impact of inflation has not been material to our results of operations for the past three fiscal years.
| 32 |
Critical Accounting Policies
We believe the application of the following accounting policies, which are important to our financial position and results of operations, require significant assumptions, judgments and estimates on the part of management. We base our assumptions, judgments, and estimates on historical experience, current trends and other factors that management believes to be relevant at the time our consolidated financial statements are prepared. On a regular basis, management reviews the accounting policies, assumptions, estimates and judgments to ensure that our financial statements are presented in accordance with generally accepted accounting principles (GAAP). However, because future events and their effects cannot be determined with certainty, actual results could differ from our assumptions and estimates, and such differences could be material. Further, if different assumptions, judgments and estimates had been used, the results could have been different and such differences could be material. For a summary of all of our accounting policies, including the accounting policies discussed below, see Note 1 of the Notes to the Consolidated Financial Statements. Management believes that the following accounting policies are the most critical to aid in fully understanding and evaluating our reported financial results, and they require management's most difficult, subjective or complex judgments, resulting from the need to make estimates about the effect of matters that are inherently uncertain.
Revenue Recognition – We recognize sales from ethanol, distillers grains and non-food grade corn oil when title transfers to customers, generally upon shipment from our plant or upon loading of the rail car used to transport the products.
Investments– The method of accounting applied to long-term investments, whether consolidated, equity or cost, involves an evaluation of the significant terms of each investment that explicitly grant or suggest evidence of control or influence over the operations of the investee and also includes the identification of any variable interests in which we are the primary beneficiary. The evaluation of consolidation under Accounting Standards Codification ("ASC 810") " Consolidation " is complex and requires judgments to be made. We consolidate the results of two majority owned subsidiaries, One Earth and NuGen. The results of One Earth are included on a delayed basis of one month. The Company accounts for investments in limited liability companies in which it may have a less than 20% ownership interest, using the equity method of accounting when the factors discussed in ASC 323 " Investments-Equity Method and Joint Ventures " are met. The excess of the carrying value over the underlying equity in the net assets of equity method investees is allocated to specific assets and liabilities. Any unallocated excess is treated as goodwill and is recorded as a component of the carrying value of the equity method investee. Investments in businesses that the Company does not control but for which it has the ability to exercise significant influence over operating and financial matters are accounted for using the equity method. Investments in which the Company does not have the ability to exercise significant influence over operating and financial matters are accounted for using the cost method. The Company accounts for its investments in Big River and Patriot (through May 31, 2015 – see Note 2 of the Notes to the Consolidated Financial Statements for a discussion of the sale of the Company's equity interest in Patriot) using the equity method of accounting and includes the results of these entities on a delayed basis of one month.
We periodically evaluate our investments for impairment due to declines in market value considered to be other than temporary. Such impairment evaluations include, in addition to persistent, declining market prices, general economic and company-specific evaluations. If we determine that a decline in market value is other than temporary, then a charge to earnings is recorded in the accompanying Consolidated Statements of Operations for all or a portion of the unrealized loss and a new cost basis in the investment is established.
Inventory – Inventory is recorded at the lower of cost or market. The market value of inventory is often dependent upon fluctuating commodity prices. If these estimates are inaccurate, we may be exposed to market conditions that require an additional reduction in the value of certain inventories affected. We
| 33 |
provide for a permanent write down of inventory, for inventory items that have a cost greater than net realizable value. There was no significant write down of inventory at January 31, 2016 or 2015. Fluctuations in the write down of inventory generally relate to the levels and composition of such inventory at a given point in time as well as commodity price levels. The assumptions we currently use include our estimates of the selling prices of ethanol, distillers grains and non-food grade corn oil.
Financial Instruments – A majority of the forward grain purchase and ethanol, distillers grains and non-food grade corn oil sales contracts are accounted for under the "normal purchases and normal sales" scope exemption of ASC 815, " Derivatives and Hedging " ("ASC 815") because these arrangements are for purchases of grain that will be delivered in quantities expected to be used by us and sales of ethanol, distillers grains and non-food grade corn oil that will be produced in quantities expected to be sold by us over a reasonable period of time in the normal course of business. During fiscal year 2015, we began to carry a portion of our forward grain purchase contracts at fair value. During the year ended January 31, 2016, there were no material settlements of forward contracts that are recorded at fair value; at January 31, 2016, we recorded a liability of approximately $0.3 million associated with these contracts.
We use derivative financial instruments (exchange-traded futures contracts) to manage a portion of the risk associated with changes in commodity prices, primarily related to corn. We monitor and manage this exposure as part of our overall risk management policy. As such, we seek to reduce the potentially adverse effects that the volatility of these markets may have on our operating results. We may take hedging positions in these commodities as one way to mitigate risk. While we attempt to link our hedging activities to purchase and sales activities, there are situations in which these hedging activities can themselves result in losses. We do not hold or issue derivative financial instruments for trading or speculative purposes.
Income Taxes – Income taxes are recorded based on the current year amounts payable or refundable, as well as the consequences of events that give rise to deferred tax assets and liabilities based on differences in how those events are treated for tax purposes, net of valuation allowances. We base our estimate of deferred tax assets and liabilities on current tax laws and rates and other expectations about future outcomes. Changes in existing regulatory tax laws and rates and future business results may affect the amount of deferred tax liabilities or the valuation of deferred tax assets over time. We have established valuation allowances for certain state net operating loss carryforwards. We determined that it is more likely than not that we will be able to generate sufficient taxable income in future years to allow for the full utilization of the other deferred tax assets other than those reserved. In determining the need for a valuation allowance, we have assumed that our ethanol plants will generate future taxable income. We are projecting that the future operations of One Earth, NuGen and Big River will be profitable.
A valuation allowance of approximately $1.2 million and approximately $1.8 million was recorded at January 31, 2016 and January 31, 2015, respectively which is primarily for state net operating loss carryforwards and other deferred tax assets. Should estimates of future income differ significantly from our prior estimates, we could be required to make a material change to our deferred tax valuation allowance. The primary assumption used to estimate the valuation allowance has been estimates of future state taxable income. Such estimates can have material variations from year to year based upon expected levels of income from our ethanol plants, leasing income and gains on real estate sales. Factors that could negatively affect future taxable income include adverse changes in the ethanol industry and the ethanol crush spread. Our accounting for deferred tax consequences represents management's best estimate of future events that can be appropriately reflected in the accounting estimates.
Recoverability of Long-Lived Assets – Given the nature of our business, events and changes in circumstances include, but are not limited to, a significant decline in our estimated future cash flows, a sustained decline in market prices for similar assets, or a significant adverse change in legal or regulatory factors or the business climate.
| 34 |
Upon the identification of a triggering event, we test for recoverability of an asset group by comparing its carrying amount to its estimated undiscounted future cash flows. If the carrying amount of an asset group exceeds its estimated undiscounted future cash flows, we recognize an impairment charge for the amount by which the asset group's carrying amount exceeds its fair value, if any. We generally determine the fair value of the asset group using a discounted cash flow model based on market participant assumptions (for income producing asset groups) or by obtaining appraisals based on the market approach and comparable market transactions (for non-income producing asset groups).
New Accounting Pronouncements
For information related to recent accounting pronouncements, see Note 1 of the Notes to the Consolidated Financial Statements.
| Item 7A. | Quantitative and Qualitative Disclosures About Market Risk |
We are exposed to the impact of market fluctuations associated with commodity prices as discussed below.
Commodity Price Risk
We manage a portion of our risk with respect to the volatility of commodity prices inherent in the ethanol industry by using forward purchase and sale contracts. At January 31, 2016, One Earth and NuGen combined have purchase commitments for approximately 14.0 million bushels of corn, the principal raw material for their ethanol plants. One Earth and NuGen expect to take delivery of the corn by May 2016. One Earth and NuGen have combined sales commitments for approximately 51.7 million gallons of ethanol, 63,000 tons of distillers grains and 10.5 million pounds of non-food grade corn oil. One Earth and NuGen expect to deliver the ethanol, distillers grains and non-food grade corn oil through June 2016. None of our forecasted ethanol sales during the next 12 months have been sold under fixed-price contracts. As a result, the effect of a 10% adverse move in the price of ethanol from the current pricing would result in a decrease in annual revenues of approximately $30.3 million for the remaining forecasted ethanol sales. Approximately 9% of our forecasted distillers grains sales during the next 12 months have been sold under fixed-price contracts. As a result, the effect of a 10% adverse move in the price of distillers grains from the current pricing would result in a decrease in annual revenues of approximately $7.0 million for the remaining forecasted distillers grains sales. Approximately 17% of our forecasted non-food grade corn oil sales during the next 12 months have been sold under fixed-price contracts. As a result, the effect of a 10% adverse move in the price of non-food grade corn oil from the current pricing would result in a decrease in annual revenues of approximately $1.2 million for the remaining forecasted non-food grade corn oil sales. Similarly, approximately 2% of our estimated corn usage for the next 12 months was subject to fixed-price contracts. As a result, the effect of a 10% adverse move in the price of corn from current pricing would result in an increase in annual cost of goods sold of approximately $30.7 million for the remaining forecasted corn usage. Approximately 16% of our estimated natural gas usage for the next 12 months was subject to fixed-price contracts. As a result, the effect of a 10% adverse move in the price of natural gas from current pricing would result in an increase in annual cost of goods sold of approximately $1.8 million for the remaining forecasted natural gas usage.
| 35 |
Item 8. Financial Statements and Supplementary Data
REX AMERICAN RESOURCES CORPORATION AND SUBSIDIARIES
CONSOLIDATED BALANCE SHEETS
(Amounts in Thousands)
| January 31, | ||||||||
| 2016 | 2015 | |||||||
| ASSETS | ||||||||
| CURRENT ASSETS: | ||||||||
| Cash and cash equivalents | $ | 135,765 | $ | 137,697 | ||||
| Restricted cash | 54 | - | ||||||
| Accounts receivable | 13,666 | 8,794 | ||||||
| Inventory | 17,178 | 18,062 | ||||||
| Refundable income taxes | 5,254 | 3,019 | ||||||
| Prepaid expenses and other | 6,407 | 5,810 | ||||||
| Deferred taxes - net | 1,036 | 2,363 | ||||||
| Total current assets | 179,360 | 175,745 | ||||||
| Property and equipment - net | 189,976 | 194,447 | ||||||
| Other assets | 6,642 | 6,366 | ||||||
| Equity method investments | 38,707 | 80,389 | ||||||
| TOTAL ASSETS | $ | 414,685 | $ | 456,947 | ||||
| LIABILITIES AND EQUITY | ||||||||
| CURRENT LIABILITIES: | ||||||||
| Accounts payable – trade | $ | 10,212 | $ | 9,210 | ||||
| Accrued expenses and other current liabilities | 9,423 | 10,347 | ||||||
| Total current liabilities | 19,635 | 19,557 | ||||||
| LONG TERM LIABILITIES: | ||||||||
| Deferred taxes | 38,304 | 42,768 | ||||||
| Other long term liabilities | 987 | 1,658 | ||||||
| Total long term liabilities | 39,291 | 44,426 | ||||||
| COMMITMENTS AND CONTINGENCIES | ||||||||
| EQUITY: | ||||||||
| REX shareholders' equity: | ||||||||
| Common stock, 45,000 shares authorized, 29,853 shares issued at par | 299 | 299 | ||||||
| Paid in capital | 144,844 | 144,791 | ||||||
| Retained earnings | 475,874 | 444,438 | ||||||
| Treasury stock, 23,205 and 21,954 shares, respectively | (309,754 | ) | (239,557 | ) | ||||
| Total REX shareholders' equity | 311,263 | 349,971 | ||||||
| Noncontrolling interests | 44,496 | 42,993 | ||||||
| Total equity | 355,759 | 392,964 | ||||||
| TOTAL LIABILITIES AND EQUITY | $ | 414,685 | $ | 456,947 | ||||
See notes to consolidated financial statements.
| 36 |
REX AMERICAN RESOURCES CORPORATION AND SUBSIDIARIES
CONSOLIDATED STATEMENTS OF OPERATIONS
(Amounts in Thousands, Except Per Share Amounts)
| Years Ended January 31, | ||||||||||||
| 2016 | 2015 | 2014 | ||||||||||
| Net sales and revenue | $ | 436,488 | $ | 572,230 | $ | 666,045 | ||||||
| Cost of sales | 385,654 | 430,291 | 601,757 | |||||||||
| Gross profit | 50,834 | 141,939 | 64,288 | |||||||||
| Selling, general and administrative expenses | (19,813 | ) | (19,422 | ) | (17,846 | ) | ||||||
| Gain on sale of investment | 10,385 | - | - | |||||||||
| Equity in income of unconsolidated ethanol affiliates | 8,984 | 32,229 | 17,175 | |||||||||
| Interest and other income | 625 | 368 | 195 | |||||||||
| Interest expense | - | (2,074 | ) | (3,898 | ) | |||||||
| Gain (loss) on disposal of real estate and property and equipment, net | 503 | (238 | ) | - | ||||||||
| Income from continuing operations before income taxes | 51,518 | 152,802 | 59,914 | |||||||||
| Provision for income taxes | (14,108 | ) | (49,649 | ) | (20,751 | ) | ||||||
| Income from continuing operations | 37,410 | 103,153 | 39,163 | |||||||||
| Income from discontinued operations, net of tax | - | 234 | 325 | |||||||||
| Gain on disposal of discontinued operations, net of tax | - | 327 | 741 | |||||||||
| Net income | 37,410 | 103,714 | 40,229 | |||||||||
| Net income attributable to noncontrolling interests | (5,974 | ) | (16,377 | ) | (5,156 | ) | ||||||
| Net income attributable to REX common shareholders | $ | 31,436 | $ | 87,337 | $ | 35,073 | ||||||
| Weighted average shares outstanding – basic | 7,297 | 8,109 | 8,137 | |||||||||
| Basic income per share from continuing operations attributable to REX common shareholders | $ | 4.31 | $ | 10.70 | $ | 4.18 | ||||||
| Basic income per share from discontinued operations attributable to REX common shareholders | - | 0.03 | 0.04 | |||||||||
| Basic income per share on disposal of discontinued operations attributable to REX common shareholders | - | 0.04 | 0.09 | |||||||||
| Basic net income per share attributable to REX common shareholders | $ | 4.31 | $ | 10.77 | $ | 4.31 | ||||||
| Weighted average shares outstanding – diluted | 7,307 | 8,118 | 8,180 | |||||||||
| Diluted income per share from continuing operations attributable to REX common shareholders | $ | 4.30 | $ | 10.69 | $ | 4.16 | ||||||
| Diluted income per share from discontinued operations attributable to REX common shareholders | - | 0.03 | 0.04 | |||||||||
| Diluted income per share on disposal of discontinued operations attributable to REX common shareholders | - | 0.04 | 0.09 | |||||||||
| Diluted net income per share attributable to REX common shareholders | $ | 4.30 | $ | 10.76 | $ | 4.29 | ||||||
| Amounts attributable to REX common shareholders: | ||||||||||||
| Income from continuing operations, net of tax | $ | 31,436 | $ | 86,776 | $ | 34,007 | ||||||
| Income from discontinued operations, net of tax | - | 561 | 1,066 | |||||||||
| Net income | $ | 31,436 | $ | 87,337 | $ | 35,073 | ||||||
See notes to consolidated financial statements.
| 37 |
REX AMERICAN RESOURCES CORPORATION AND SUBSIDIARIES
CONSOLIDATED STATEMENTS OF SHAREHOLDERS' EQUITY
FOR THE YEARS ENDED JANUARY 31, 2016, 2015 AND 2014
(Amounts in Thousands)
| REX Shareholders | ||||||||||||||||||||||||||||||||
| Common Shares | ||||||||||||||||||||||||||||||||
| Issued | Treasury | Paid-in | Retained | Noncontrolling | Total | |||||||||||||||||||||||||||
| Shares | Amount | Shares | Amount | Capital | Earnings | Interest | Equity | |||||||||||||||||||||||||
| Balance at January 31, 2013 | 29,853 | $ | 299 | 21,701 | $ | (219,550 | ) | $ | 143,575 | $ | 322,028 | $ | 27,931 | $ | 274,283 | |||||||||||||||||
| Net income | 35,073 | 5,156 | 40,229 | |||||||||||||||||||||||||||||
| Treasury stock acquired | 137 | (3,486 | ) | (3,486 | ) | |||||||||||||||||||||||||||
| Noncontrolling interests distribution and other | (1,615 | ) | (1,615 | ) | ||||||||||||||||||||||||||||
| Stock based compensation expense and related tax effects | - | - | (85 | ) | 866 | 476 | - | - | 1,342 | |||||||||||||||||||||||
| Balance at January 31, 2014 | 29,853 | 299 | 21,753 | (222,170 | ) | 144,051 | 357,101 | 31,472 | 310,753 | |||||||||||||||||||||||
| Net income | 87,337 | 16,377 | 103,714 | |||||||||||||||||||||||||||||
| Treasury stock acquired | 284 | (18,238 | ) | (18,238 | ) | |||||||||||||||||||||||||||
| Noncontrolling interests distribution and other | (4,856 | ) | (4,856 | ) | ||||||||||||||||||||||||||||
| Stock based compensation expense and related tax effects | - | - | (83 | ) | 851 | 740 | - | - | 1,591 | |||||||||||||||||||||||
| Balance at January 31, 2015 | 29,853 | 299 | 21,954 | (239,557 | ) | 144,791 | 444,438 | 42,993 | 392,964 | |||||||||||||||||||||||
| Net income | 31,436 | 5,974 | 37,410 | |||||||||||||||||||||||||||||
| Treasury stock acquired | 1,254 | (70,208 | ) | (70,208 | ) | |||||||||||||||||||||||||||
| Noncontrolling interests distribution and other | (4,471 | ) | (4,471 | ) | ||||||||||||||||||||||||||||
| Stock based compensation and related tax effects | - | - | (4 | ) | 11 | 53 | - | - | 64 | |||||||||||||||||||||||
| Balance at January 31, 2016 | 29,853 | $ | 299 | 23,204 | $ | (309,754 | ) | $ | 144,844 | $ | 475,874 | $ | 44,496 | $ | 355,759 | |||||||||||||||||
| 38 |
REX AMERICAN RESOURCES CORPORATION AND SUBSIDIARIES
CONSOLIDATED STATEMENTS OF CASH FLOWS
(Amounts in Thousands)
| Years Ended January 31, | ||||||||||||
| 2016 | 2015 | 2014 | ||||||||||
| CASH FLOWS FROM OPERATING ACTIVITIES: | ||||||||||||
| Net income | $ | 37,410 | $ | 103,714 | $ | 40,229 | ||||||
| Adjustments to reconcile net income to net cash provided by operating activities: | ||||||||||||
| Depreciation and amortization | 18,639 | 16,787 | 17,284 | |||||||||
| Impairment charges on real estate | 125 | 68 | 55 | |||||||||
| Stock based compensation expense | 64 | - | - | |||||||||
| Income from equity method investments | (8,984 | ) | (32,229 | ) | (17,175 | ) | ||||||
| Dividends received from equity method investments | 11,151 | 22,889 | 5,804 | |||||||||
| Gain on sale of investment | (10,385 | ) | - | - | ||||||||
| Derivative financial instruments | - | (1,141 | ) | (1,648 | ) | |||||||
| Gain on disposal of real estate and property and equipment | (503 | ) | (275 | ) | (1,015 | ) | ||||||
| Deferred income tax | (4,196 | ) | 22,473 | 15,987 | ||||||||
| Excess tax benefit from stock option exercises | - | (441 | ) | (64 | ) | |||||||
| Changes in assets and liabilities: | ||||||||||||
| Accounts receivable | (496 | ) | 7,692 | (4,919 | ) | |||||||
| Inventory | 884 | 1,308 | 5,549 | |||||||||
| Prepaid expenses and other assets | (1,135 | ) | (1,929 | ) | (1,490 | ) | ||||||
| Income taxes refundable | (2,235 | ) | (1,985 | ) | 1,480 | |||||||
| Accounts payable-trade | 387 | 2,030 | 1,721 | |||||||||
| Accrued expenses and other liabilities | (536 | ) | (1,745 | ) | 2,637 | |||||||
| Net cash provided by operating activities | 40,190 | 137,216 | 64,435 | |||||||||
| CASH FLOWS FROM INVESTING ACTIVITIES: | ||||||||||||
| Capital expenditures | (15,495 | ) | (9,927 | ) | (3,518 | ) | ||||||
| Repayment of note receivable | 23 | 6 | 681 | |||||||||
| Proceeds from sale of investment | 45,476 | - | - | |||||||||
| Proceeds from sale of real estate and property and equipment | 2,001 | 1,778 | 8,876 | |||||||||
| Restricted cash | (54 | ) | 500 | (500 | ) | |||||||
| Restricted investments and deposits | 250 | 323 | 1,293 | |||||||||
| Net cash provided by (used in) investing activities | 32,201 | (7,320 | ) | 6,832 | ||||||||
| CASH FLOWS FROM FINANCING ACTIVITIES: | ||||||||||||
| Payments of long term debt | - | (75,726 | ) | (31,203 | ) | |||||||
| Stock options exercised | - | 931 | 1,072 | |||||||||
| Payments to noncontrolling interests holders | (4,471 | ) | (4,856 | ) | (1,638 | ) | ||||||
| Excess tax benefit from stock option exercises | - | 441 | 64 | |||||||||
| Treasury stock acquired | (69,852 | ) | (18,138 | ) | (3,486 | ) | ||||||
| Net cash used in financing activities | (74,323 | ) | (97,348 | ) | (35,191 | ) | ||||||
| NET (DECREASE) INCREASE IN CASH AND CASH EQUIVALENTS | (1,932 | ) | 32,548 | 36,076 | ||||||||
| CASH AND CASH EQUIVALENTS-Beginning of year | 137,697 | 105,149 | 69,073 | |||||||||
| CASH AND CASH EQUIVALENTS-End of year | $ | 135,765 | $ | 137,697 | $ | 105,149 | ||||||
| Non cash financing activities-Cashless exercises of stock options | $ | - | $ | 100 | $ | - | ||||||
| Non cash financing activities-Accrued common stock repurchase | $ | 356 | $ | - | $ | - | ||||||
| Non cash investing activities-Accrued capital expenditures | $ | 1,063 | $ | 804 | $ | 250 | ||||||
| Non cash investing activities- Loan receivable granted in connection with sale of real estate | $ | - | $ | 475 | $ | - | ||||||
| 39 |
REX AMERICAN RESOURCES CORPORATION AND SUBSIDIARIES
NOTES TO CONSOLIDATED FINANCIAL STATEMENTS
| 1. | SUMMARY OF SIGNIFICANT ACCOUNTING POLICIES |
Principles of Consolidation – The accompanying financial statements consolidate the operating results and financial position of REX American Resources Corporation and its wholly-owned and majority owned subsidiaries (the "Company" or "REX"). All intercompany balances and transactions have been eliminated. As of January 31, 2016, the Company owns interests in three ethanol entities – two are consolidated and one is accounted for using the equity method of accounting. The Company operates in one reportable segment, alternative energy. The Company completed the exit of its retail business during fiscal year 2009 and recognized, in discontinued operations, revenue and expense associated with administering extended service policies, all of which were expired as of January 31, 2016.
Fiscal Year – All references in these consolidated financial statements to a particular fiscal year are to the Company's fiscal year ended January 31. For example, "fiscal year 2015" means the period February 1, 2015 to January 31, 2016. The Company refers to its fiscal year by reference to the year immediately preceding the January 31 fiscal year end date.
Segments – The Company has one reportable segment, alternative energy. In applying the criteria set forth in ASC 280 " Segment Reporting ", the Company determined that based on the nature of the products and production process and the expected financial results, the Company's operations at its ethanol plants are aggregated into one reporting segment.
Use of Estimates – The preparation of consolidated financial statements in conformity with accounting principles generally accepted in the United States of America requires management to make estimates and assumptions that affect the reported amounts of assets and liabilities and disclosure of contingent assets and liabilities at the date of the consolidated financial statements and the reported amounts of revenues and expenses during the reporting period. Actual results could differ from those estimates.
Cash Equivalents – Cash equivalents are principally short-term investments with original maturities of less than three months. The carrying amount of cash equivalents approximates fair value.
Concentrations of Risk – The Company maintains cash and cash equivalents in accounts with financial institutions which exceed federally insured limits. The Company has not experienced any losses in such accounts. The Company does not believe there is significant credit risk related to its cash and cash equivalents. Four customers accounted for approximately 75%, 74% and 82% of the Company's net sales and revenue during fiscal years 2015, 2014 and 2013, respectively. At January 31, 2016 and 2015, these customers represented approximately 47% and 76%, respectively, of the Company's accounts receivable balance. These customers were Archer Daniels Midland Company, Biourja Trading, LLC, CHS, Inc. and United Bio Energy, LLC.
Inventory – Inventories are carried at the lower of cost or market on a first-in, first-out basis. Inventory includes direct production costs and certain overhead costs such as depreciation, property taxes and utilities related to producing ethanol and related co-products. Inventory is permanently written down for instances when cost exceeds estimated net realizable value; such write-downs are based primarily upon commodity prices as the market value of inventory is often dependent upon changes in commodity prices. There was no significant write-down of inventory during fiscal years 2015, 2014 or 2013. Fluctuations in the write-down of inventory generally relate to the levels and composition of
| 40 |
such inventory at a given point in time and commodity prices . The components of inventory at January 31, 2016, and January 31, 2015 are as follows (amounts in thousands):
| 2016 | 2015 | |||||||
| Ethanol and other finished goods | $ | 3,105 | $ | 3,039 | ||||
| Work in process | 2,652 | 2,609 | ||||||
| Grain and other raw materials | 11,421 | 12,414 | ||||||
| Total | $ | 17,178 | $ | 18,062 | ||||
Property and Equipment – Property and equipment is recorded at cost. Depreciation is computed using the straight-line method. Estimated useful lives are 15 to 40 years for buildings and improvements, and 2 to 20 years for fixtures and equipment. The components of property and equipment at January 31, 2016 and 2015 are as follows (amounts in thousands):
| 2016 | 2015 | |||||||
| Land and improvements | $ | 21,598 | $ | 20,844 | ||||
| Buildings and improvements | 24,543 | 27,069 | ||||||
| Machinery, equipment and fixtures | 237,735 | 231,422 | ||||||
| Construction in progress | 6,094 | 1,290 | ||||||
| 289,970 | 280,625 | |||||||
| Less: accumulated depreciation | (99,994 | ) | (86,178 | ) | ||||
| Total | $ | 189,976 | $ | 194,447 | ||||
In accordance with ASC 360-05 " Impairment or Disposal of Long-Lived Assets ", the carrying value of long-lived assets is assessed for recoverability by management when changes in circumstances indicate that the carrying amount may not be recoverable, based on an analysis of undiscounted future expected cash flows from the use and ultimate disposition of the asset. The Company recorded impairment charges of $125,000 in fiscal year 2015, all of which is included in cost of sales in the Consolidated Statements of Operations. The Company recorded impairment charges of $68,000 and $55,000 in fiscal years 2014 and 2013, respectively, all of which is included in discontinued operations in the Consolidated Statements of Operations. These impairment charges are primarily related to unfavorable changes in real estate conditions in local markets. Impairment charges result from the Company's management performing cash flow analysis and represent management's estimate of the excess of net book value over fair value.
The Company tests for recoverability of an asset group by comparing its carrying amount to its estimated undiscounted future cash flows. If the carrying amount of an asset group exceeds its estimated undiscounted future cash flows, the Company recognizes an impairment charge for the amount by which the asset group's carrying amount exceeds its fair value, if any. The Company generally determines the fair value of the asset group using a discounted cash flow model based on market participant assumptions (for income producing asset groups) or by obtaining appraisals based on the market approach and comparable market transactions (for non-income producing asset groups).
Depreciation expense was approximately $18,638,000, $16,387,000 and $16,915,000 in fiscal years 2015, 2014 and 2013, respectively.
| 41 |
Investments and Deposits – The method of accounting applied to long-term investments, whether consolidated, equity or cost, involves an evaluation of the significant terms of each investment that explicitly grant or suggest evidence of control or influence over the operations of the investee and also includes the identification of any variable interests in which the Company is the primary beneficiary. The Company consolidates the results of two majority owned subsidiaries, One Earth and NuGen. The results of One Earth are included on a delayed basis of one month lag as One Earth has a fiscal year end of December 31. NuGen has the same fiscal year as the parent, and therefore, there is no lag in reporting the results of NuGen. The Company accounts for investments in limited liability companies in which it may have a less than 20% ownership interest, using the equity method of accounting when the factors discussed in ASC 323 "Investments-Equity Method and Joint Ventures" are met. The excess of the carrying value over the underlying equity in the net assets of equity method investees is allocated to specific assets and liabilities. Any unallocated excess is treated as goodwill and is recorded as a component of the carrying value of the equity method investee. Investments in businesses that the Company does not control but for which it has the ability to exercise significant influence over operating and financial matters are accounted for using the equity method. The Company accounts for its investments in Big River and Patriot (through May 31, 2015 – see Note 2 for a discussion of the sale of the Company's equity interest in Patriot) using the equity method of accounting and includes the results of these entities on a delayed basis of one month as they have a fiscal year end of December 31.
The Company periodically evaluates its investments for impairment due to declines in market value considered to be other than temporary. Such impairment evaluations include, in addition to persistent, declining market prices, general economic and company-specific evaluations. If the Company determines that a decline in market value is other than temporary, then a charge to earnings is recorded in the Consolidated Statements of Operations and a new cost basis in the investment is established.
Revenue Recognition – The Company recognizes sales from the production of ethanol, distillers grains and non-food grade corn oil when title transfers to customers, generally upon shipment from the ethanol plant or upon loading of the rail car used to transport the products.
Costs of Sales – Cost of sales includes depreciation, costs of raw materials, inbound freight charges, purchasing and receiving costs, inspection costs, shipping costs, other distribution expenses, warehousing costs, plant management, certain compensation costs, and general facility overhead charges.
Selling, General and Administrative Expenses – The Company includes non-production related costs such as professional fees and certain payroll in selling, general and administrative expenses.
Interest Expense – There was no cash paid for interest in fiscal year 2015. Cash paid for interest in fiscal years 2014 and 2013 was approximately $2,136,000 and $3,492,000, respectively.
Financial Instruments – A majority of the forward grain purchase and ethanol, distillers grains and non-food grade corn oil sale contracts are accounted for under the "normal purchases and normal sales" scope exemption of ASC 815, because these arrangements are for purchases of grain that will be delivered in quantities expected to be used and sales of ethanol, distillers grains and non-food grade corn oil that will be produced in quantities expected to be sold by us over a reasonable period of time in the normal course of business. During the year ended January 31, 2016, there were no material settlements of forward contracts that are recorded at fair value; at January 31, 2016, the Company recorded a liability of approximately $0.3 million associated with these contracts.
The Company uses derivative financial instruments (exchange-traded futures contracts) to manage a portion of the risk associated with changes in commodity prices, primarily related to corn. The
| 42 |
Company monitors and manages this exposure as part of its overall risk management policy. As such, the Company seeks to reduce the potentially adverse effects that the volatility of these markets may have on its operating results. The Company may take hedging positions in these commodities as one way to mitigate risk. While the Company attempts to link its hedging activities to purchase and sale activities, there are situations in which these hedging activities can themselves result in losses. The Company does not hold or issue derivative financial instruments for trading or speculative purposes.
The Company used derivative financial instruments to manage its balance of fixed and variable rate debt. Interest rate swap agreements involve the exchange of fixed and variable rate interest payments and do not represent an actual exchange of the notional amounts between the parties. The swap agreement was not designated for hedge accounting pursuant to ASC 815. The interest rate swap was recorded at its fair value and the changes in fair values were recorded as gain or loss on derivative financial instruments in the Consolidated Statements of Operations. The Company paid settlements of interest rate swaps of approximately $1,142,000 and $1,687,000 in fiscal years 2014 and 2013, respectively.
Stock Compensation – The Company has a stock-based compensation plan, approved by its shareholders, which reserves a total of 550,000 shares of common stock for issuance pursuant to its terms. The plan provides for the granting of shares of stock, including options to purchase shares of common stock, stock appreciation rights tied to the value of common stock, restricted stock, and restricted stock unit awards to eligible employees, non-employee directors and consultants. The Company measures share-based compensation grants at fair value on the grant date, adjusted for estimated forfeitures. The Company records noncash compensation expense related to equity awards in its consolidated financial statements over the requisite service period on a straight-line basis. All of the Company's existing share-based compensation awards have been determined to be equity awards. See Note 11 for a further discussion of restricted stock.
The Company had stock-based compensation plans under which stock options had been granted to directors, officers and key employees. These plans were terminated in fiscal year 2015. The total intrinsic value of options (granted pursuant to these terminated plans) exercised in the years ended January 31, 2015 and 2014 was approximately $4.0 million and $1.1 million, respectively, resulting in tax deductions to realize benefits of approximately $0.8 million and $0.4 million, respectively. At January 31, 2015: (i) there were no outstanding stock options; and (ii) there was no unrecognized compensation cost related to nonvested stock options. See Note 11 for a further discussion of stock options.
Income Taxes – The Company provides for deferred tax liabilities and assets for the future tax consequences attributable to differences between the financial statement carrying amounts of existing assets and liabilities and their respective tax bases and operating loss and tax credit carryforwards. The Company provides for a valuation allowance if, based on the weight of available evidence, it is more likely than not that some or all of the deferred tax assets will not be realized.
Discontinued Operations – Prior to the prospective adoption of ASU 2014-08, the Company classified sold real estate assets in discontinued operations when the operations and cash flows of the real estate assets had been eliminated from ongoing operations and when the Company did not have any significant continuing involvement in the operation of the real estate after disposal. Beginning February 1, 2015, only disposals of a component that represent a strategic shift that has (or will have) a major effect on operations and financial results are to be classified as discontinued operations.
Comprehensive Income – The Company has no components of other comprehensive income, and therefore, comprehensive income equals net income.
| 43 |
New Accounting Pronouncements – The Company will be required to adopt the amended guidance in ASC Topic 606, " Revenue from Contracts with Customers ", which requires revenue recognition to reflect the transfer of promised goods or services to customers and replaces existing revenue recognition guidance. The updated standard permits the use of either the retrospective or cumulative effect transition method. The Financial Accounting Standards Board has deferred the required adoption of the amended guidance by one year, from February 1, 2017 to February 1, 2018. Early application beginning February 1, 2017 is permitted. The Company does not expect the adoption of this guidance to have a material impact on its consolidated financial statements and related disclosures.
Effective February 1, 2015, the Company was required to adopt ASU 2014-08. Under this new guidance, only disposals of a component that represent a strategic shift that has (or will have) a major effect on an entity's operations and financial results are to be classified as a discontinued operation. The adoption of ASU 2014-08 resulted in the Company classifying sales of individual real estate properties as continuing operations instead of discontinued operations as the sale of individual properties does not represent a strategic shift for the Company (for sales occurring subsequent to January 31, 2015).
Effective February 1, 2017, the Company will be required to adopt the amended guidance in ASC Topic 330, " Inventory: Simplifying the Measurement of Inventory" . This amended guidance requires inventory to be measured at the lower of cost or net realizable value. Net realizable value is defined as the estimated selling prices in the ordinary course of business, less reasonably predictable costs of completion, disposal and transportation. The amended guidance will be applied prospectively. The Company has not yet determined the effect of this amended guidance on its consolidated financial statements and related disclosures.
Effective January 1, 2018, the Company will be required to adopt ASU 2015-17, " Balance Sheet Classification of Deferred Taxes ". This amended guidance requires that deferred income tax liabilities and assets be classified as noncurrent in a classified statement of financial position. The Company has not yet determined the effect of this amended guidance on its consolidated financial statements and related disclosures.
Effective February 1, 2019, the Company will be required to adopt ASU 2016 - 02, "Leases (Topic 842) ", which will require that a lessee recognize assets and liabilities on the balance sheet for all leases with a lease term of more than twelve months, with the result being the recognition of a right of use asset and a lease liability. The Company has not yet determined the effect of this guidance on its consolidated financial statements and related disclosures.
| 44 |
| 2. | INVESTMENTS |
The Company's equity method investments are accounted for under ASC 323 " Investments-Equity Method and Joint Ventures ". The following table summarizes these investments at January 31, 2016 and 2015 (amounts in thousands):
| Entity | Ownership Percentage | Carrying Amount January 31, 2016 | Carrying Amount January 31, 2015 | |||||||
| Big River Resources, LLC | 9.7% | $ | 38,707 | $ | 40,188 | |||||
| Patriot Holdings, LLC (sold June 1, 2015) | N/A | - | 40,201 | |||||||
| Total Equity Method Investments | $ | 38,707 | $ | 80,389 | ||||||
The Company invested $20.0 million in Big River, a holding company for several entities, for a 9.7% ownership interest. Big River Resources West Burlington, LLC, a wholly owned subsidiary of Big River, operates an ethanol manufacturing plant in West Burlington, Iowa. During fiscal year 2015, the plant shipped 106 million gallons of ethanol. The plant has been in operation since 2004. Big River Resources Galva, LLC, a wholly owned subsidiary of Big River, operates an ethanol manufacturing plant in Galva, Illinois. During fiscal year 2015, the plant shipped 118 million gallons of ethanol. The plant has been in operation since 2009. Big River Resources United Energy, LLC, a 55.3% owned subsidiary of Big River, operates an ethanol manufacturing plant in Dyersville, Iowa. During fiscal year 2015, the plant shipped 123 million gallons of ethanol. Big River acquired a 50.5% ownership interest in this plant in 2009 and increased its ownership to 55.3% during fiscal year 2015. Big River Resources Boyceville, LLC, a wholly owned subsidiary of Big River, operates an ethanol manufacturing plant in Boyceville, Wisconsin. During fiscal year 2015, the plant shipped 58 million gallons of ethanol. Big River acquired its interest in this plant in 2011. The Company recorded income of approximately $6.0 million, $18.2 million and $8.8 million as its share of earnings from Big River during fiscal years 2015, 2014 and 2013, respectively. The Company received dividends of approximately $7.5 million, $18.0 million and $1.2 million from Big River during fiscal years 2015, 2014 and 2013, respectively. At January 31, 2016, the carrying value of the investment in Big River is approximately $38.7 million; the amount of underlying equity in the net assets of Big River is approximately $36.7 million.
The Company invested $17.9 million in Patriot for a 27% ownership interest. Patriot operated an ethanol manufacturing plant in Annawan, Illinois. On June 1, 2015, Patriot and a subsidiary of CHS Inc. ("CHS") completed a merger that resulted in CHS acquiring 100% of the ownership interest in Patriot. The Company received a cash payment of approximately $45.5 million at the closing, representing its proportionate share of the merger consideration for its 27% ownership interest. The total merger consideration was approximately $196 million in cash subject to certain adjustments and certain escrow holdbacks. In connection with this transaction, the Company recognized a gain of approximately $10.4 million based on the Company's carrying value of approximately $39.0 million at the time of sale. At January 31, 2016, the Company has approximately $4.4 million in accounts receivable on the accompanying Consolidated Balance Sheets related to estimated escrow proceeds that were recognized as income. The Company recorded approximately $45.5 million as a source of cash investing activity in the Consolidated Statements of Cash Flows. The estimated escrow proceeds of approximately $4.4 million is a non-cash investing activity. The Company expects that a determination of the final payment of escrowed proceeds to be received will occur by December of 2016. The
| 45 |
Company recorded income of approximately $2.9 million, $14.0 million and $8.4 million as its share of earnings from Patriot during fiscal years 2015, 2014 and 2013, respectively. The Company received dividends of approximately $3.6 million, $4.9 million and $4.6 million from Patriot during fiscal years 2015, 2014 and 2013, respectively.
Undistributed earnings of equity method investees totaled approximately $18.7 million and $41.9 million at January 31, 2016 and 2015, respectively.
Summarized financial information for the Company's equity method investees, as of their fiscal year end is presented in the following table (amounts in thousands):
| As of December 31, 2015 | ||||||||
| Big River | ||||||||
| Current assets | $ | 137,758 | ||||||
| Non current assets | 341,907 | |||||||
| Total assets | $ | 479,665 | ||||||
| Current liabilities | $ | 49,224 | ||||||
| Long-term liabilities | - | |||||||
| Total liabilities | $ | 49,224 | ||||||
| Noncontrolling interests | $ | 48,156 | ||||||
| As of December 31, 2014 | ||||||||
| Patriot | Big River | |||||||
| Current assets | $ | 56,272 | $ | 180,186 | ||||
| Non current assets | 158,828 | 343,182 | ||||||
| Total assets | $ | 215,100 | $ | 523,368 | ||||
| Current liabilities | $ | 19,205 | $ | 57,130 | ||||
| Long-term liabilities | 49,542 | - | ||||||
| Total liabilities | $ | 68,747 | $ | 57,130 | ||||
| Noncontrolling interests | $ | - | $ | 46,913 | ||||
Summarized financial information for each of the Company's equity method investees is presented in
| 46 |
the following table for the years ended December 31, 2015, 2014 and 2013 (amounts in thousands):
Year Ended December 31, 2015
| Patriot (1) | Big River | |||||||
| Net sales and revenue | $ | 115,614 | $ | 863,554 | ||||
| Gross profit | $ | 14,424 | $ | 85,451 | ||||
| Income from continuing operations | $ | 11,100 | $ | 62,193 | ||||
| Net income | $ | 11,100 | $ | 62,193 | ||||
| (1) | For Patriot, results are for the five month period ended May 31, 2015 as the Company's equity interest in Patriot was sold June 1, 2015. |
Year Ended December 31, 2014
| Patriot | Big River | |||||||
| Net sales and revenue | $ | 331,260 | $ | 1,184,505 | ||||
| Gross profit | $ | 59,980 | $ | 241,963 | ||||
| Income from continuing operations | $ | 52,875 | $ | 187,388 | ||||
| Net income | $ | 52,875 | $ | 187,388 | ||||
Year Ended December 31, 2013
| Patriot | Big River | |||||||
| Net sales and revenue | $ | 377,532 | $ | 1,292,120 | ||||
| Gross profit | $ | 37,411 | $ | 124,327 | ||||
| Income from continuing operations | $ | 31,518 | $ | 90,729 | ||||
| Net income | $ | 31,518 | $ | 90,729 | ||||
Big River has debt agreements that limit and restrict amounts the entity can pay in the form of dividends or advances to owners. The restricted net assets of Big River at January 31, 2016 are approximately $306.3 million. At January 31, 2016, the Company's proportionate share of restricted net assets of Big River is approximately $29.7 million.
| 3. | FAIR VALUE |
The Company applies ASC 820, which defines fair value as the exchange price that would be received for an asset or paid to transfer a liability (an exit price) in the principal or most advantageous market for the asset or liability in an orderly transaction between market participants on the measurement date.
| 47 |
The Company determines the fair market values of its financial instruments based on the fair value hierarchy established by ASC 820, which requires an entity to maximize the use of observable inputs and minimize the use of unobservable inputs when measuring fair value. The standard describes three levels of inputs that may be used to measure fair values which are provided below. The Company carries certain cash equivalents, investments and derivative liabilities at fair value.
The fair values of derivative assets and liabilities traded in the over-the-counter market are determined using quantitative models that require the use of multiple market inputs including interest rates, prices and indices to generate pricing and volatility factors, which are used to value the position. The predominance of market inputs are actively quoted and can be validated through external sources, including brokers, market transactions and third-party pricing services. Estimation risk is greater for derivative asset and liability positions that are either option-based or have longer maturity dates where observable market inputs are less readily available or are unobservable, in which case interest rate, price or index scenarios are extrapolated in order to determine the fair value. The fair values of derivative assets and liabilities include adjustments for market liquidity, counterparty credit quality, the Company's own credit standing and other specific factors, where appropriate. The fair values of property and equipment are determined by using various models that discount future expected cash flows.
To ensure the prudent application of estimates and management judgment in determining the fair value of derivative assets and liabilities and property and equipment, various processes and controls have been adopted, which include: (i) model validation that requires a review and approval for pricing, financial statement fair value determination and risk quantification; and (ii) periodic review and substantiation of profit and loss reporting for all derivative instruments. Financial assets and liabilities
| 48 |
measured at fair value at January 31, 2016 on a recurring basis are summarized below (amounts in thousands):
| Level 1 | Level 2 | Level 3 | Total Fair Value | |||||||||||||
| Investment in cooperative (1) | $ | - | $ | - | $ | 333 | $ | 333 | ||||||||
| Forward purchase contracts liability (2) | $ | - | $ | 312 | $ | - | $ | 312 | ||||||||
| Commodity futures (3) | - | - | - | - | ||||||||||||
| Total liabilities | $ | - | $ | 312 | $ | - | $ | 312 | ||||||||
Financial assets and liabilities measured at fair value at January 31, 2015 on a recurring basis are summarized below (amounts in thousands):
| Level 1 | Level 2 | Level 3 | Total Fair Value | |||||||||||||
| Investment in cooperative (1) | $ | - | $ | - | $ | 333 | $ | 333 | ||||||||
| (1) | The investment in cooperative is included in "Other assets" on the accompanying Consolidated Balance Sheets. |
| (2) | The forward purchase contract liability is included in "Accrued expenses and other current liabilities" on the accompanying Consolidated Balance Sheets. |
| (3) | The commodity futures are included in "Accrued expenses and other current liabilities" on the accompanying Consolidated Balance Sheets. |
The following table provides a reconciliation of the activity related to assets measured at fair value on a recurring basis using Level 3 inputs (amounts in thousands):
| Investment in Cooperative | ||||
| Balance, January 31, 2014 | $ | 289 | ||
| Fair value adjustment | 44 | |||
| Balance, January 31, 2015 | 333 | |||
| Fair value adjustment | - | |||
| Balance, January 31, 2016 | $ | 333 | ||
The Company determined the fair value of the investment in cooperative by using a discounted cash flow analysis on the expected cash flows. Inputs used in the analysis include the face value of the allocated equity amount, the projected term for repayment based upon a historical trend, and a risk adjusted discount rate based on the expected compensation participants would demand because of the uncertainty of the future cash flows. The inherent risk and uncertainty associated with unobservable inputs could have a significant effect on the actual fair value of the investment.
| 49 |
No other financial instruments were elected to be measured at fair value in accordance with ASC 470-20-25-21.
The Company reviews its long-lived assets for impairment on at least an annual basis based on the carrying value of these assets. As a result of vacancies at owned real estate locations, the Company tested certain long-lived assets for impairment using a fair value measurement approach. The fair value measurement approach utilizes a number of significant unobservable inputs or Level 3 assumptions. These assumptions include, among others, the implied fair value of these assets using an income approach by preparing a discounted cash flow analysis and the implied fair value of these assets using recent sales data of comparable properties, and other subjective assumptions. Upon completion of its impairment analysis, which was performed at various times throughout fiscal year 2014, the Company determined that the carrying value of certain long-lived assets exceeded the fair value of these assets. Accordingly, in fiscal year 2014, the Company recorded long-lived asset impairment charges of approximately $68,000. There were no assets measured at fair value at January 31, 2016 and 2015 on a non-recurring basis.
| 4. | OTHER ASSETS |
The components of other noncurrent assets at January 31, 2016 and 2015 are as follows (amounts in thousands):
| January 31, | ||||||||
| 2016 | 2015 | |||||||
| Real estate taxes refundable | $ | 5,091 | $ | 4,395 | ||||
| Deposits | 664 | 914 | ||||||
| Other | 887 | 1,057 | ||||||
| Total | $ | 6,642 | $ | 6,366 | ||||
Real estate taxes refundable represent amounts due One Earth associated with refunds of previously paid taxes in connection with a tax increment financing arrangement with local taxing authorities. Deposits are with vendors and governmental authorities.
| 50 |
| 5. | ACCRUED EXPENSES AND OTHER CURRENT LIABILITIES |
The components of accrued expenses and other current liabilities at January 31, 2016 and 2015 are as follows (amounts in thousands):
| January 31, | ||||||||
| 2016 | 2015 | |||||||
| Accrued utility charges | $ | 2,094 | $ | 3,085 | ||||
| Accrued payroll and related items | 3,760 | 3,798 | ||||||
| Accrued real estate taxes | 2,564 | 2,507 | ||||||
| Other | 1,005 | 957 | ||||||
| Total | $ | 9,423 | $ | 10,347 | ||||
| 6. | NET INCOME PER SHARE FROM CONTINUING OPERATIONS |
The Company reports net income per share in accordance with ASC 260, " Earnings per Share ". Basic net income per share is computed by dividing net income available to common shareholders by the weighted average number of common shares outstanding during the year. Diluted net income per share is computed by dividing net income available to common shareholders by the weighted average number of shares outstanding and dilutive common share equivalents during the year. Common share equivalents for each year include the number of shares issuable upon the exercise of outstanding options or restricted stock awards, less the shares that could be purchased under the treasury stock method. For fiscal years 2015, 2014 and 2013, all shares subject to outstanding options were dilutive.
The following table reconciles the basic and diluted net income per share amounts from continuing operations computations for each year presented for fiscal years 2015, 2014 and 2013 (amounts in thousands, except per-share amounts):
| 2015 | ||||||||||||
| Income | Shares | Per Share | ||||||||||
| Basic net income per share from continuing operations attributable to REX common shareholders | $ | 31,436 | 7,297 | $ | 4.31 | |||||||
| Effect of restricted stock | 10 | |||||||||||
| Diluted net income per share from continuing operations attributable to REX common shareholders | $ | 31,436 | 7,307 | $ | 4.30 | |||||||
| 51 |
| 2014 | ||||||||||||
| Income | Shares | Per Share | ||||||||||
| Basic net income per share from continuing operations attributable to REX common shareholders | $ | 86,776 | 8,109 | $ | 10.70 | |||||||
| Effect of stock options | 9 | |||||||||||
| Diluted net income per share from continuing operations attributable to REX common shareholders | $ | 86,776 | 8,118 | $ | 10.69 | |||||||
| 2013 | ||||||||||||
| Income | Shares | Per Share | ||||||||||
| Basic net income per share from continuing operations attributable to REX common shareholders | $ | 34,007 | 8,137 | $ | 4.18 | |||||||
| Effect of stock options | 43 | |||||||||||
| Diluted net income per share from continuing operations attributable to REX common shareholders | $ | 34,007 | 8,180 | $ | 4.16 | |||||||
| 7. | LEASES |
At January 31, 2016, the Company has lease agreements, as lessee, for rail cars and a natural gas pipeline. All of the leases are accounted for as operating leases. As of January 31, 2016, future minimum annual rentals on such leases are as follows (amounts in thousands):
| Years Ended | Minimum | |||
| January 31, | Rentals | |||
| 2017 | $ | 7,340 | ||
| 2018 | 6,575 | |||
| 2019 | 5,845 | |||
| 2020 | 4,341 | |||
| 2021 | 2,778 | |||
| Thereafter | 4,169 | |||
| $ | 31,048 | |||
| 8. | COMMON STOCK |
During fiscal years 2015, 2014 and 2013, the Company purchased 1,254,344 shares, 283,979 shares and 137,015 shares, respectively, of its common stock for approximately $70,208,000, $18,238,000 and $3,486,000, respectively. Included in these amounts are shares the Company received totaling 1,555 for the year ended January 31, 2015 as tenders of the exercise price of stock options exercised by certain officers and directors of the Company. The cost of these shares, determined as the fair market value on the date they were tendered, was approximately $100,000 for the year ended January 31, 2015. At January 31, 2016, the Company had prior authorization by its Board of Directors to purchase, in
| 52 |
open market transactions, an additional 243,238 shares of its common stock. Information regarding the Company's common stock is as follows (amounts in thousands):
| January 31, 2016 | January 31, 2015 | |||||||
| Authorized shares | 45,000 | 45,000 | ||||||
| Issued shares | 29,853 | 29,853 | ||||||
| Outstanding shares | 6,648 | 7,900 | ||||||
| 9. | REVOLVING LINES OF CREDIT |
Effective April 1, 2015, One Earth and NuGen each entered into $10.0 million revolving loan facilities that mature April 1, 2016. Any borrowings will be secured by the inventory and accounts receivable of One Earth or NuGen, specific to which entity borrows money under these facilities. These revolving loan facilities are recourse only to One Earth and NuGen and not to REX American Resources Corporation or any of its other subsidiaries. Borrowings under these facilities bear interest at the one month LIBOR rate plus 250 basis points. Neither One Earth nor NuGen had outstanding borrowings on the revolving loans during the year ended January 31, 2016. One Earth and NuGen are also subject to certain financial covenants under the revolving loan facilities, including working capital requirements, should they borrow on the loans.
| 10. | DERIVATIVE FINANCIAL INSTRUMENTS |
The Company is exposed to various market risks, including changes in commodity prices (raw materials and finished goods). To manage risks associated with the volatility of these natural business exposures, the Company enters into commodity agreements and forward purchase (corn) and sale (ethanol, distillers grains and non-food grade corn oil) contracts. The Company does not purchase or sell derivative financial instruments for trading or speculative purposes. The Company does not purchase or sell derivative financial instruments for which a lack of marketplace quotations would require the use of fair value estimation techniques. The changes in fair value of these derivative financial instruments are recognized in current period earnings as the Company does not use hedge accounting.
The following table provides information about the fair values of the Company's derivative financial instruments and the line items on the Consolidated Balance Sheets in which the fair values are reflected (in thousands):
| Asset Derivatives | Liability Derivatives | |||||||||||||||
| Fair Value at January 31, | Fair Value at January 31, | |||||||||||||||
| 2016 | 2015 | 2016 | 2015 | |||||||||||||
| Commodity futures | $ | - | $ | - | $ | - | $ | - | ||||||||
| Forward purchase contracts (1) | $ | - | $ | - | $ | 312 | $ | - | ||||||||
| Total | ||||||||||||||||
(1) Forward purchase contracts are included in accrued expenses and other current liabilities. These contracts are for purchases of approximately 0.7 million bushels of corn.
As of January 31, 2016, all of the derivative financial instruments held by the Company were subject to enforceable master netting arrangements. The Company's accounting policy is to offset positions
| 53 |
amounts owed or owing with the same counterparty. As of January 31, 2016, the gross positions of the enforceable master netting agreements are not significantly different from the net positions presented in the table above. Depending on the amount of an unrealized loss on a derivative contract held by the Company, the counterparty may require collateral to secure the Company's derivative contract position. As of January 31, 2016, the Company was required to maintain collateral with the counterparty in the amount of approximately $54,000 to secure the Company's derivative liability position.
See Note 3 which contains fair value information related to derivative financial instruments.
The following table provides information about gains or losses recognized in income on the Company's derivative financial instruments and the line items on the Consolidated Statements of Operations in which the fair values are reflected for fiscal years 2015, 2014 and 2013 (in thousands):
| 2015 | 2014 | 2013 | ||||||||||
| Cost of sales | $ | (382 | ) | $ | - | $ | - | |||||
| 11. | EMPLOYEE BENEFITS |
The Company maintains the REX 2015 Incentive Plan, approved by its shareholders, which a reserves a total of 550,000 shares of common stock for issuance pursuant to its terms. The plan provides for the granting of shares of stock, including options to purchase shares of common stock, stock appreciation rights tied to the value of common stock, restricted stock, and restricted stock unit awards to eligible employees, non-employee directors and consultants. The Company measures share-based compensation grants at fair value on the grant date, adjusted for estimated forfeitures. The Company records noncash compensation expense related to equity awards in its consolidated financial statements over the requisite service period on a straight-line basis. All of the Company's existing share-based compensation awards have been determined to be equity awards. At January 31, 2016, 546,832 shares remain available for issuance under the Plan. As a component of their compensation, restricted stock has been granted to directors at the market price of REX common stock on the date of the grant. In addition one third of executives' incentive compensation is payable by an award of restricted stock based on the then market price of REX common stock. The following table summarizes non-vested restricted stock award activity for fiscal year ended 2015:
| 2015 | ||||||||||||
| Weighted | Weighted | |||||||||||
| Average Grant | Average Vesting | |||||||||||
| Non-Vested | Date Fair Value | Term | ||||||||||
| Shares | (000's) | (in years) | ||||||||||
| Non-Vested at January 31, 2015 | - | $ | - | |||||||||
| Granted | 3,168 | 200 | ||||||||||
| Forfeited | - | - | ||||||||||
| Vested | - | - | ||||||||||
| Non-Vested at January 31, 2016 | 3,168 | $ | 200 | 2 | ||||||||
At January 31, 2016, unrecognized compensation cost related to nonvested restricted stock was approximately $136,000.
| 54 |
The following summarizes stock option activity for fiscal years 2014 and 2013:
| 2014 | 2013 | |||||||||||||||
| Weighted | Weighted | |||||||||||||||
| Average | Average | |||||||||||||||
| Shares | Exercise | Shares | Exercise | |||||||||||||
| (000's) | Price | (000's) | Price | |||||||||||||
| Outstanding-Beginning of year | 84 | $ | 12.37 | 169 | $ | 12.46 | ||||||||||
| Exercised | (84 | ) | 12.37 | (85 | ) | 12.55 | ||||||||||
| Canceled or expired | - | - | - | - | ||||||||||||
| Outstanding-End of year | - | 84 | $ | 12.37 | ||||||||||||
| Exercisable-End of year | - | 84 | $ | 12.37 | ||||||||||||
| 12. | COMMITMENTS |
One Earth and NuGen have combined forward purchase contracts for approximately 14.0 million bushels of corn, the principal raw material for their ethanol plants. They expect to take delivery of the corn through May 2016.
One Earth and NuGen have combined sales commitments for approximately 51.7 million gallons of ethanol, 63,000 tons of distillers grains and 10.5 million pounds of non-food grade corn oil. They expect to deliver the ethanol, distillers grains and corn oil through June 2016.
One Earth has entered into an agreement with an unrelated party for the use of a portion of the party's natural gas pipeline. The term of the agreement is 10 years, and the amount is $4,380,000, which is paid over 120 equal monthly installments of $36,500. Payments began in February 2009. One Earth paid approximately $438,000 pursuant to the lease in each of fiscal years 2015, 2014 and 2013.
One Earth and NuGen have entered into agreements with unrelated parties for the lease of railcars that will be used to ship ethanol and distillers grains. These leases expire on various dates through September 30, 2022. One Earth and NuGen pay a monthly lease amount per railcar. One Earth and NuGen combined paid approximately $7,221,000, $7,024,000 and $6,405,000 pursuant to the leases in fiscal years 2015, 2014 and 2013, respectively.
One Earth and NuGen each have a contract with an unrelated party ("Distillers Grains Marketer") for distillers grains marketing services. Under the terms of the contracts, the Distillers Grains Marketers will purchase all of One Earth's and NuGen's distillers grains production during the term of the contracts. The contracts call for One Earth and NuGen to pay a fee per ton of distillers grains for the Distillers Grains Marketers' services. The terms of the agreements are for one year and shall renew automatically for additional one year terms, unless either party sends notice to the other party of its intent to terminate the agreement at least 90 days prior to the expiration of the then current term of the agreement. One Earth and NuGen incurred fees of approximately $1,169,000, $1,190,000 and $1,478,000 in fiscal years 2015, 2014 and 2013, respectively, for these marketing services.
One Earth has a grain origination agreement with Alliance Grain, a minority equity owner, under which it purchased 100% of its grain during fiscal years 2015, 2014 and 2013. One Earth pays to Alliance Grain a certain amount per bushel for procurement fees. The term of the agreement expires October 31,
| 55 |
2016, and shall renew automatically for additional one year terms, unless either party sends notice to the other party of its intent to terminate the agreement at least 180 days prior to the expiration of the then current term of the agreement.
| 13. | INCOME TAXES |
The provision for income taxes from continuing operations for fiscal years 2015, 2014 and 2013 consists of the following (amounts in thousands):
| 2015 | 2014 | 2013 | ||||||||||
| Federal: | ||||||||||||
| Current | $ | 15,804 | $ | 23,452 | $ | 2,974 | ||||||
| Deferred | (2,867 | ) | 20,717 | 15,402 | ||||||||
| 12,937 | 44,169 | 18,376 | ||||||||||
| State and Local: | ||||||||||||
| Current | 2,651 | 3,536 | 2,154 | |||||||||
| Deferred | (1,480 | ) | 1,944 | 221 | ||||||||
| 1,171 | 5,480 | 2,375 | ||||||||||
| Provision for income taxes | $ | 14,108 | $ | 49,649 | $ | 20,751 | ||||||
The tax effects of significant temporary differences representing deferred tax assets and liabilities are as follows as of January 31, 2016 and 2015 (amounts in thousands):
| January 31, | ||||||||
| 2016 | 2015 | |||||||
| Assets: | ||||||||
| Accrued liabilities | $ | 915 | $ | 664 | ||||
| AMT credit carryforward | - | 4,015 | ||||||
| State net operating loss carryforward | 1,147 | 1,343 | ||||||
| Other items | 198 | 624 | ||||||
| Valuation allowance | (1,151 | ) | (1,752 | ) | ||||
| Total | 1,109 | 4,894 | ||||||
| Liabilities: | ||||||||
| Basis in pass through entities, including depreciation | (37,834 | ) | (44,783 | ) | ||||
| Other | (543 | ) | (516 | ) | ||||
| Total | (38,377 | ) | (45,299 | ) | ||||
| Net deferred tax liability | $ | (37,268 | ) | $ | (40,405 | ) | ||
| 56 |
The Company has state net operating loss carryforwards of approximately $14,860,000, net of the federal benefit, which will begin to expire in fiscal year 2019.
The Company has a valuation allowance of approximately $1,151,000 at January 31, 2016. The Company decreased the valuation allowance by $601,000 and $265,000 in fiscal years 2015 and 2014, respectively and increased the valuation allowance by $126,000 in fiscal year 2013. These adjustments to the valuation allowance are a result of estimates of realizing certain future state tax benefits and federal capital loss carryforwards.
The Company paid income taxes of approximately $20,253,000, $30,142,000 and $3,450,000 in fiscal years 2015, 2014 and 2013, respectively. The Company received refunds of income taxes of approximately $132,000, $53,000 and $38,000 in fiscal years 2015, 2014 and 2013, respectively.
The effective income tax rate on consolidated pre-tax income or loss differs from the federal income tax statutory rate for fiscal years 2015, 2014 and 2013 as follows:
| 2015 | 2014 | 2013 | ||||||||||
| Federal income tax at statutory rate | 35.0 | % | 35.0 | % | 35.0 | % | ||||||
| State and local taxes, net of federal tax benefit | (1.3 | ) | 3.6 | 4.5 | ||||||||
| Net change in valuation allowance | (1.2 | ) | (0.2 | ) | 0.2 | |||||||
| Domestic production activities deduction | (1.7 | ) | (1.1 | ) | (1.5 | ) | ||||||
| Uncertain tax positions | 1.0 | - | (0.1 | ) | ||||||||
| Noncontrolling interest | (4.4 | ) | (4.0 | ) | (3.4 | ) | ||||||
| Other | - | (0.8 | ) | (0.1 | ) | |||||||
| Total | 27.4 | % | 32.5 | % | 34.6 | % | ||||||
The Company files a U.S. federal income tax return and income tax returns in various states. In general, the Company is no longer subject to U.S. federal, state or local income tax examinations by tax authorities for fiscal years ended January 31, 2010 and prior.
The Company applies the provisions of ASC 740-10-25-5 for uncertain tax positions. As of January 31, 2016, total unrecognized tax benefits were approximately $987,000. There were no accrued penalties and interest at January 31, 2016. If the Company were to prevail on all unrecognized tax benefits recorded, the provision for income taxes would be reduced by approximately $987,000. Interest and penalties associated with unrecognized tax benefits are recorded within income tax expense.
On a quarterly and annual basis, the Company accrues for the effects of open uncertain tax positions and the related potential penalties and interest. It is reasonably possible that the amount of the unrecognized tax benefit with respect to certain unrecognized tax positions will increase or decrease during the next 12 months; however, the Company does not expect the change to have a material effect
| 57 |
| on results of operations or financial position. A reconciliation of the beginning and ending amount of unrecognized tax benefits, including interest and penalties, is as follows (dollars in thousands): |
| Years Ended | ||||||||
| January 31, | ||||||||
| 2016 | 2015 | |||||||
| Unrecognized tax benefits, beginning of year | $ | 1,658 | $ | 1,862 | ||||
| Changes for tax positions for prior years | (1,658 | ) | (204 | ) | ||||
| Changes for tax positions for current year | 987 | - | ||||||
| Unrecognized tax benefits, end of year | $ | 987 | $ | 1,658 | ||||
| 14. | DISCONTINUED OPERATIONS |
| During fiscal year 2009, the Company completed the exit of its retail business. Accordingly, certain operations of the Company's former retail operations and certain sold properties had been classified as discontinued operations prior to the prospective adoption of ASU 2014-08 effective February 1, 2015. No items were reclassified as discontinued operations for fiscal year 2015. Below is a table reflecting certain items of the Consolidated Statements of Operations that were reclassified as discontinued operations for fiscal years 2014 and 2013 (amounts in thousands): |
| 2014 | 2013 | |||||||
| Net sales and revenue | $ | 47 | $ | 1,512 | ||||
| Cost of sales | $ | (321 | ) | $ | 732 | |||
| Income before income taxes | $ | 368 | $ | 538 | ||||
| Provision for income taxes | (134 | ) | (213 | ) | ||||
| Income from discontinued operations, net of tax | $ | 234 | $ | 325 | ||||
| Gain on disposal before provision for income taxes | $ | 513 | $ | 1,226 | ||||
| Provision for income taxes | (186 | ) | (485 | ) | ||||
| Gain on disposal of discontinued operations, net of tax | $ | 327 | $ | 741 | ||||
| 15. | CONTINGENCIES |
| The Company is involved in various legal actions arising in the normal course of business. After taking into consideration legal counsels' evaluation of such actions, management is of the opinion that their outcome will not have a material effect on the Company's consolidated financial statements. There were no liabilities recorded at January 31, 2016 or 2015 as the Company did not believe that there was a probable and reasonably estimable loss associated with any legal contingencies. |
| 58 |
| 16. | NET SALES AND REVENUE |
| The following table summarizes sales for each product and service group for the periods presented (amounts in thousands): |
| Fiscal Year | ||||||||||||
| Product or Service Category | 2015 | 2014 | 2013 | |||||||||
| Ethanol | $ | 333,200 | $ | 452,831 | $ | 500,203 | ||||||
| Dried distillers grains | 81,116 | 96,328 | 125,575 | |||||||||
| Non-food grade corn oil | 15,510 | 16,985 | 18,788 | |||||||||
| Modified distillers grains | 5,999 | 4,814 | 18,998 | |||||||||
| Other | 663 | 1,272 | 2,481 | |||||||||
| Total | $ | 436,488 | $ | 572,230 | $ | 666,045 | ||||||
| All of the Company's ethanol and distillers grains are sold in the domestic market. The Company's distillers grains marketers make all decisions with regard to where products they purchase from the Company are distributed. | |
| 17. | QUARTERLY UNAUDITED INFORMATION |
| The following tables set forth the Company's net sales and revenue, gross profit, net income and net income per share (basic and diluted) for each quarter during the last two fiscal years. In the opinion of |
| 59 |
| management, all adjustments (consisting of normal recurring accruals) considered necessary for a fair presentation have been included. |
| Quarters Ended | ||||||||||||||||
| (In Thousands, Except Per Share Amounts) | ||||||||||||||||
| April 30, | July 31, | October 31, | January 31, | |||||||||||||
| 2015 | 2015 | 2015 | 2016 | |||||||||||||
| Net sales and revenue | $ | 105,197 | $ | 113,480 | $ | 110,584 | $ | 107,227 | ||||||||
| Gross profit | 9,127 | 18,276 | 14,273 | 9,158 | ||||||||||||
| Net income | 4,439 | 18,711 | 9,433 | 4,827 | ||||||||||||
| Net income attributable to REX common shareholders | 3,927 | 16,367 | 7,456 | 3,686 | ||||||||||||
| Basic net income per share attributable to REX common shareholders (a) | $ | 0.50 | $ | 2.16 | $ | 1.08 | $ | 0.54 | ||||||||
| Diluted net income per share attributable to REX common shareholders (a) | $ | 0.50 | $ | 2.16 | $ | 1.08 | $ | 0.54 | ||||||||
| Quarters Ended | ||||||||||||||||
| (In Thousands, Except Per Share Amounts) | ||||||||||||||||
| April 30, | July 31, | October 31, | January 31, | |||||||||||||
| 2014 | 2014 | 2014 | 2015 | |||||||||||||
| Net sales and revenue | $ | 155,924 | $ | 150,231 | $ | 138,424 | $ | 127,651 | ||||||||
| Gross profit | 36,636 | 38,838 | 36,491 | 29,974 | ||||||||||||
| Net income | 24,200 | 26,718 | 28,589 | 24,207 | ||||||||||||
| Net income attributable to REX common shareholders | 21,742 | 21,907 | 23,340 | 20,348 | ||||||||||||
| Basic net income per share attributable to REX common shareholders | $ | 2.68 | $ | 2.68 | $ | 2.86 | $ | 2.55 | ||||||||
| Diluted net income per share attributable to REX common shareholders | $ | 2.67 | $ | 2.68 | $ | 2.86 | $ | 2.55 | ||||||||
| a) | The total of the quarterly net income per share amounts do not equal the annual net income per share amounts due to the impact of varying amounts of shares outstanding during the year. |
| 18. | RELATED PARTIES |
| During fiscal years 2015 and 2014, One Earth and NuGen purchased approximately $148.2 million and $164.7 million, respectively, of corn from minority equity investors. |
* * * * * *
| 60 |
REPORT OF INDEPENDENT REGISTERED PUBLIC ACCOUNTING FIRM
REX American Resources Corporation
Dayton, Ohio
We have audited the accompanying consolidated balance sheets of REX American Resources Corporation and subsidiaries (the "Company") as of January 31, 2016 and 2015, and the related consolidated statements of operations, shareholders' equity, and cash flows for each of the three years in the period ended January 31, 2016. Our audits also included the financial statement schedule listed in the Index at Item 15. These financial statements and the financial statement schedule are the responsibility of the Company's management. Our responsibility is to express an opinion on the financial statements and the financial statement schedule based on our audits. We did not audit the financial statements as of January 31, 2015 or for each of the two years in the period ended January 31, 2015 of Patriot Holdings, LLC, the Company's investment which is accounted for by use of the equity method. The accompanying consolidated financial statements of the Company include its equity investment in Patriot Holdings, LLC of $40,201,000 as of January 31, 2015 and its equity earnings of Patriot Holdings, LLC of $14,038,000 and $8,368,000 for each of the two years in the period ended January 31, 2015. Those statements were audited by other auditors whose report has been furnished to us, and our opinion, insofar as it relates to the amounts included for Patriot Holdings, LLC is based solely on the report of the other auditors.
We conducted our audits in accordance with the standards of the Public Company Accounting Oversight Board (United States). Those standards require that we plan and perform the audit to obtain reasonable assurance about whether the financial statements are free of material misstatement. An audit includes examining, on a test basis, evidence supporting the amounts and disclosures in the financial statements. An audit also includes assessing the accounting principles used and significant estimates made by management, as well as evaluating the overall financial statement presentation. We believe that our audits and the report of the other auditors provide a reasonable basis for our opinion.
In our opinion, based on our audits and the report of the other auditors, such consolidated financial statements present fairly, in all material respects, the financial position of REX American Resources Corporation and subsidiaries as of January 31, 2016 and 2015, and the results of their operations and their cash flows for each of the three years in the period ended January 31, 2016, in conformity with accounting principles generally accepted in the United States of America. Also, in our opinion, such financial statement schedule, based on our audits, when considered in relation to the basic consolidated financial statements taken as a whole, presents fairly, in all material respects, the information set forth therein.
We have also audited, in accordance with the standards of the Public Company Accounting Oversight Board (United States), the Company's internal control over financial reporting as of January 31, 2016, based on the criteria established in Internal Control-Integrated Framework (2013) issued by the Committee of Sponsoring Organizations of the Treadway Commission and our report dated March 25, 2016 expressed an unqualified opinion on the Company's internal control over financial reporting, based on our audit.
/s/ Deloitte and Touche LLP
Cincinnati, Ohio
March 25, 2016
| 61 |

REPORT OF INDEPENDENT REGISTERED PUBLIC ACCOUNTING FIRM
To the
Board of Directors of
Patriot Holdings, LLC and Subsidiaries
Annawan, Illinois
We have audited the consolidated balance sheets of Patriot Holdings, LLC and Subsidiaries as of December 31, 2014 and 2013, and the related consolidated statements of operations, changes in members' equity and cash flows for each of the three years in the period ended December 31, 2014, not separately presented here. Patriot Holdings, LLC's management is responsible for these consolidated financial statements. Our responsibility is to express an opinion on these consolidated financial statements based on our audits.
We conducted our audits in accordance with the standards of the Public Company Accounting Oversight Board (United States). Those standards require that we plan and perform the audit to obtain reasonable assurance about whether the consolidated financial statements are free of material misstatement. The company is not required to have, nor were we engaged to perform, an audit of its internal control over financial reporting. Our audit included consideration of internal control over financial reporting as a basis for designing audit procedures that are appropriate in the circumstances, but not for the purpose of expressing an opinion on the effectiveness of the company's internal control over financial reporting. Accordingly, we express no such opinion. An audit also includes examining, on a test basis, evidence supporting the amounts and disclosures in the consolidated financial statements, assessing the accounting principles used and significant estimates made by management, as well as evaluating the overall financial statement presentation. We believe that our audits provide a reasonable basis for our opinion.
In our opinion, the consolidated financial statements referred to above present fairly, in all material respects, the financial position of Patriot Holdings, LLC as of December 31, 2014 and 2013, and the results of its operations and its cash flows for each of the three years in the period ended December 31, 2014 in conformity with accounting principles generally accepted in the United States of America.
On June 1, 2015, Patriot Holdings, LLC and Subsidiaries was acquired by and became a wholly owned subsidiary of GTL Resources USA, Inc., a Delaware corporation and an affiliate of CHS, Inc.
/s/ Boulay PLLP
Certified Public Accountants
Minneapolis, Minnesota
February 17, 2015, except for the last paragraph
above, as to which the date is July 15, 2015
| 62 |
REX AMERICAN RESOURCES CORPORATION AND SUBSIDIARIES
Schedule II - VALUATION AND QUALIFYING ACCOUNTS
FOR THE YEARS ENDED JANUARY 31, 2016, 2015 AND 2014
(Amounts in thousands)
| Additions | Deductions | |||||||||||||||
| Balance | Charged to | Charges for | Balance | |||||||||||||
| Beginning | Cost and | Which Reserves | End | |||||||||||||
| of Year | Expenses | Were Created | of Year | |||||||||||||
| 2016: | ||||||||||||||||
| Deferred tax valuation allowance | $ | 1,752 | $ | - | $ | 601 | $ | 1,151 | ||||||||
| 2015: | ||||||||||||||||
| Deferred tax valuation allowance | $ | 2,017 | $ | - | $ | 265 | $ | 1,752 | ||||||||
| 2014: | ||||||||||||||||
| Deferred tax valuation allowance | $ | 1,891 | $ | 126 | $ | - | $ | 2,017 | ||||||||
| Item 9. | Changes in and Disagreements with Accountants on Accounting and Financial Disclosure |
None
| Item 9A. | Controls and Procedures |
| Evaluation of Disclosure Controls and Procedures | |
| Our management evaluated, with the participation of our Chief Executive Officer and Chief Financial Officer, the effectiveness of our disclosure controls and procedures (as defined in Rules 13a–15(e) and 15d–15(e) under the Securities Exchange Act of 1934) as of the end of the period covered by this report. Based on that evaluation, our Chief Executive Officer and Chief Financial Officer concluded that our disclosure controls and procedures are effective at the reasonable assurance level to ensure that information required to be disclosed by us in the reports that we file or submit under the Securities Exchange Act of 1934 is recorded, processed, summarized and reported within the time periods specified in the Securities and Exchange Commission's rules and forms. Our officers concluded that our disclosure controls and procedures are also effective at the reasonable assurance level to ensure that information required to be disclosed in the reports that we file or submit under the Exchange Act is accumulated and communicated to our management, including our Chief Executive Officer and Chief Financial Officer, to allow timely decisions regarding required disclosure. | |
| Material Changes to Internal Control Over Financial Reporting | |
| There were no changes in our internal control over financial reporting that occurred during our last fiscal quarter that have materially affected, or are reasonably likely to materially affect, our internal control over financial reporting. | |
| 63 |
| Management's Annual Report on Internal Control Over Financial Reporting | |
| Our management is responsible for establishing and maintaining adequate internal control over financial reporting, as defined in Exchange Act Rule 13a-15(f). Our internal control over financial reporting is designed to provide reasonable assurance regarding the reliability of financial reporting and the preparation of financial statements in accordance with accounting principles generally accepted in the United States of America. | |
| All internal control systems, no matter how well designed, have inherent limitations. Therefore, even those systems deemed to be effective can provide only reasonable assurance with respect to financial statement preparation and presentation. | |
| Under the supervision and with the participation of our senior management, including our Chief Executive Officer and Chief Financial Officer, we assessed the effectiveness of our internal control over financial reporting as of January 31, 2016 based on the Internal Control-Integrated Framework (2013) issued by the Committee of Sponsoring Organizations of the Treadway Commission ("COSO"). Based upon this assessment, our management concluded that our internal control over financial reporting was effective as of January 31, 2016 based on those criteria. | |
| The effectiveness of our internal control over financial reporting as of January 31, 2016 has been audited by Deloitte & Touche LLP, an independent registered public accounting firm, as stated in their report which is included herein. |
| ZAFAR RIZVI | Chief Executive Officer and President | |
| Zafar Rizvi | (principal executive officer) | March 25, 2016 |
| DOUGLAS L. BRUGGEMAN | Vice President-Finance, Chief Financial Officer and Treasurer | |
| Douglas L. Bruggeman | (principal financial and accounting officer) | March 25, 2016 |
| 64 |
REPORT OF INDEPENDENT REGISTERED PUBLIC ACCOUNTING FIRM
To the Board of Directors and Shareholders of
REX American Resources Corporation
We have audited the internal control over financial reporting of REX American Resources Corporation and subsidiaries (the "Company") as of January 31, 2016, based on criteria established in Internal Control - Integrated Framework (2013) issued by the Committee of Sponsoring Organizations of the Treadway Commission. The Company's management is responsible for maintaining effective internal control over financial reporting and for its assessment of the effectiveness of internal control over financial reporting, included in the accompanying Management's Annual Report on Internal Control Over Financial Reporting . Our responsibility is to express an opinion on the Company's internal control over financial reporting based on our audit.
We conducted our audit in accordance with the standards of the Public Company Accounting Oversight Board (United States). Those standards require that we plan and perform the audit to obtain reasonable assurance about whether effective internal control over financial reporting was maintained in all material respects. Our audit included obtaining an understanding of internal control over financial reporting, assessing the risk that a material weakness exists, testing and evaluating the design and operating effectiveness of internal control based on the assessed risk, and performing such other procedures as we considered necessary in the circumstances. We believe that our audit provides a reasonable basis for our opinion.
A company's internal control over financial reporting is a process designed by, or under the supervision of, the company's principal executive and principal financial officers, or persons performing similar functions, and effected by the company's board of directors, management, and other personnel to provide reasonable assurance regarding the reliability of financial reporting and the preparation of financial statements for external purposes in accordance with generally accepted accounting principles. A company's internal control over financial reporting includes those policies and procedures that (1) pertain to the maintenance of records that, in reasonable detail, accurately and fairly reflect the transactions and dispositions of the assets of the company; (2) provide reasonable assurance that transactions are recorded as necessary to permit preparation of financial statements in accordance with generally accepted accounting principles, and that receipts and expenditures of the company are being made only in accordance with authorizations of management and directors of the company; and (3) provide reasonable assurance regarding prevention or timely detection of unauthorized acquisition, use, or disposition of the company's assets that could have a material effect on the financial statements.
Because of the inherent limitations of internal control over financial reporting, including the possibility of collusion or improper management override of controls, material misstatements due to error or fraud may not be prevented or detected on a timely basis. Also, projections of any evaluation of the effectiveness of the internal control over financial reporting to future periods are subject to the risk that the controls may become inadequate because of changes in conditions, or that the degree of compliance with the policies or procedures may deteriorate.
In our opinion, the Company maintained, in all material respects, effective internal control over financial reporting as of January 31, 2016, based on the criteria established in Internal Control - Integrated Framework (2013) issued by the Committee of Sponsoring Organizations of the Treadway Commission.
| 65 |
We have also audited, in accordance with the standards of the Public Company Accounting Oversight Board (United States), the consolidated financial statements and financial statement schedule as of and for the year ended January 31, 2016 of the Company and our report dated March 25, 2016 expressed an unqualified opinion on those financial statements and financial statement schedule and referred to the report of other auditors.
/s/ Deloitte & Touche LLP
Cincinnati, Ohio
March 25, 2016
| 66 |
| Item 9B. | Other Information |
None
PART III
| Item 10. | Directors, Executive Officers and Corporate Governance |
The information required by this Item 10 is incorporated herein by reference to the Proxy Statement for our Annual Meeting of Shareholders on June 7, 2016, except for certain information concerning our executive officers which is set forth in Part I of this report.
| Item 11. | Executive Compensation |
The information required by this Item 11 is set forth in the Proxy Statement for our Annual Meeting of Shareholders on June 7, 2016 and is incorporated herein by reference.
| Item 12. | Security Ownership of Certain Beneficial Owners and Management and Related Stockholder Matters |
The information required by this Item 12 is set forth in the Proxy Statement for our Annual Meeting of Shareholders on June 7, 2016 and is incorporated herein by reference.
| Item 13. | Certain Relationships and Related Transactions and Director Independence |
The information required by this Item 13 is set forth in the Proxy Statement for our Annual Meeting of Shareholders on June 7, 2016 and is incorporated herein by reference.
| Item 14. | Principal Accountant Fees and Services |
The information required by this Item 14 is set forth in the Proxy Statement for our Annual Meeting of Shareholders on June 7, 2016 and is incorporated herein by reference.
PART IV
| Item 15. | Exhibits and Financial Statement Schedules |
(a)(1) Financial Statements
The following consolidated financial statements of REX American Resources Corporation and subsidiaries are filed as a part of this report at Item 8 hereof.
Consolidated Balance Sheets as of January 31, 2016 and 2015
Consolidated Statements of Operations for the years ended January 31, 2016, 2015 and 2014
Consolidated Statements of Cash Flows for the years ended January 31, 2016, 2015 and 2014
Consolidated Statements of Shareholders' Equity for the years ended January 31, 2016, 2015 and 2014
Notes to Consolidated Financial Statements
Report of Independent Registered Public Accounting Firm
| 67 |
(a)(2)(i) Financial Statement Schedules
The following financial statement schedules are filed as a part of this report at Item 8 hereof.
Schedule II -Valuation and Qualifying Accounts
All other schedules are omitted because they are not applicable or not required, or because the required information is included in the consolidated financial statements or notes thereto.
(a)(3) Exhibits
See Exhibit Index at page 66 of this report.
Management contracts and compensatory plans and arrangements filed as exhibits to this report are identified by an asterisk in the exhibit index.
| 68 |
SIGNATURES
Pursuant to the requirements of Section 13 or 15(d) of the Securities Exchange Act of 1934, the registrant has duly caused this report to be signed on its behalf by the undersigned, thereunto duly authorized.
| REX AMERICAN RESOURCES CORPORATION | |
| By: ZAFAR RIZVI | |
| Zafar Rizvi | |
| Chief Executive Officer and President | |
| Date: March 25, 2016 |
Pursuant to the requirements of the Securities Exchange Act of 1934, this report has been signed below by the following persons on behalf of the registrant and in the capacities and on the dates indicated.
| Signature | Capacity | Date | ||
| STUART A. ROSE Stuart A. Rose | Executive Chairman of the Board | March 25, 2016 | ||
| ZAFAR RIZVI Zafar Rizvi | Chief Executive Officer, President and Director (principal executive officer) | March 25, 2016 | ||
| DOUGLAS L. BRUGGEMAN Douglas L. Bruggeman | Vice President-Finance, Chief Financial Officer and Treasurer (principal financial and accounting officer) | March 25, 2016 | ||
| LAWRENCE TOMCHIN Lawrence Tomchin | Director | March 25, 2016 | ||
| EDWARD M. KRESS Edward M. Kress | Director | March 25, 2016 | ||
| CHARLES A. ELCAN Charles A. Elcan | Director | March 25, 2016 | ||
| DAVID S. HARRIS David S. Harris | Director | March 25, 2016 | ||
| MERVYN L. ALPHONSO Mervyn L. Alphonso | Director | March 25, 2016 | ||
| LEE FISHER Lee Fisher | Director | March 25, 2016 |
| 69 |
EXHIBIT INDEX
| (3) | Articles of incorporation and by-laws: | |
| 3(a) | Certificate of Incorporation, as amended (incorporated by reference to Exhibit 3(a) to Form 10-Q for quarter ended July 31, 2010, File No. 001-09097) | |
| 3(b) | By-Laws, as amended (incorporated by reference to Exhibit 3(a) to Form 8-K filed June 8, 2015, File No. 001-09097) | |
| (10) | Material contracts: | |
| 10(a)* | Employment Agreement dated June 2, 2015 between Rex Radio and Television, Inc. and Stuart A. Rose (incorporated by reference to Exhibit 10(a) to Form 8-K filed June 8, 2015, File No. 001-09097) | |
| 10(b)* | Employment Agreement dated June 2, 2015 between Rex Radio and Television, Inc. and Zafar Rizvi (incorporated by reference to Exhibit 10(b) to Form 8-K filed June 8, 2015, File No. 001-09097) | |
| 10(c)* | Employment Agreement dated June 2, 2015 between Rex Radio and Television, Inc. and Douglas L. Bruggeman (incorporated by reference to Exhibit 10(c) to Form 8-K filed June 8, 2015, File No. 001-09097) | |
| 10(d)* | Subscription Agreement dated December 1, 1989 from Stuart Rose to purchase 300,000 shares of registrant's Common Stock (incorporated by reference to Exhibit 6.5 to Form 10-Q for quarter ended October 31, 1989, File No. 0-13283) | |
| 10(e)* | Subscription Agreement dated December 1, 1989 from Lawrence Tomchin to purchase 140,308 shares of registrant's Common Stock (incorporated by reference to Exhibit 6.6 to Form 10-Q for quarter ended October 31, 1989, File No. 0-13283) | |
| 10(f)* | 2015 Incentive Plan (incorporated by reference to Exhibit 10(d) to Form 8-K filed June 8, 2015, File No. 001-09097) | |
| 10(g)* | Form of Restricted Stock Award Agreement under 2015 Incentive Plan (incorporated by reference to Exhibit 10(e) to Form 8-K filed June 8, 2015, File No. 001-09097) | |
| (14) | Code of Ethics: | |
| 14(a) | Code of Business Conduct and Ethics (incorporated by reference to Exhibit 14 | |
| (a) to Form 10-K for fiscal year ended January 31, 2004, File No. 001-09097) | ||
| 70 |
| (21) | Subsidiaries of the registrant: | |||
| 21 | Subsidiaries of registrant | |||
| (23) | Consents of experts and counsel: | |||
| 23(a) | Consent of Deloitte & Touche LLP to use its reports dated March 25, 2016 included in this annual report on Form 10-K into registrant's Registration Statement on Form S-8 (Registration No. 333-205419) | |||
| 23(b) | Consent of Boulay PLLP to use its report dated February 17, 2015 and July 15, 2015 included in this annual report on Form 10-K into registrant's Registration Statement on Form S-8 (Registration No. 333-205419) | |||
| (31) | Rule 13a-14(a)/15d-14(a) Certifications: |
| 31 | Certifications | |||
| (32) | Section 1350 Certifications: |
| 32 | Certifications |
| (101) | Interactive Data File | |
| 101 | The following information from REX American Resources Corporation Annual Report on Form 10-K for the fiscal year ended January 31, 2016, formatted in XBRL: (i) Consolidated Balance Sheets, (ii) Consolidated Statements of Operations, (iii) Consolidated Statements of Shareholders' Equity, (iv) Consolidated Statements of Cash Flows and (v) Notes to Consolidated Financial Statements. | |
| Copies of the Exhibits not contained herein may be obtained by writing to Edward M. Kress, Secretary, REX American Resources Corporation, 7720 Paragon Road, Dayton, Ohio 45459. | ||
Those exhibits marked with an asterisk (*) above are management contracts or compensatory plans or arrangements for directors or executive officers of the registrant.
| 71 |