Table of Contents
UNITED STATES
SECURITIES AND EXCHANGE COMMISSION
WASHINGTON, DC 20549
|
FORM 10-K
|
ý | FOR ANNUAL REPORTS PURSUANT TO SECTION 13 OR 15(d) OF THE SECURITIES EXCHANGE ACT OF 1934 |
For the fiscal year ended May 31, 2014
OR
¨ | TRANSITION REPORT PURSUANT TO SECTION 13 OR 15(d) OF THE SECURITIES EXCHANGE ACT OF 1934 |
For the transition period from to
Commission File Number: 0-12906
|

|
(Exact name of registrant as specified in its charter)
Delaware |
| 36-2096643 |
(State or other jurisdiction of incorporation or organization) |
| (I.R.S. Employer Identification No.) |
40W267 Keslinger Road, P.O. Box 393, LaFox, Illinois 60147-0393
(Address of principal executive offices)
Registrant's telephone number, including area code: (630) 208-2200
Securities registered pursuant to Section 12(b) of the Act:
Title of each class |
| Common stock, $0.05 Par Value |
Name of each exchange of which registered |
| NASDAQ Global Select Market |
Securities registered pursuant to Section 12(g) of the Act: None
|
Indicate by check mark whether the registrant is a well-known seasoned issuer, as defined in Rule 405 of the Securities Act. ¨ Yes ý No
Indicate by check mark whether the registrant is not required to file reports pursuant to Section 13 or Section 15(d) of the Act ¨ Yes ý No
Indicate by check mark whether the registrant (1) has filed all reports required to be filed by Section 13 or 15(d) of the Securities Exchange Act of 1934 during the preceding 12 months (or for such shorter period that the registrant was required to file such reports), and (2) has been subject to such filing requirements for the past 90 days. ý Yes ¨ No
Indicate by check mark whether the registrant has submitted electronically and posted on its corporate Web site, if any, every Interactive Data File required to be submitted and posted pursuant to Rule 405 of Regulation S-T (§232.405 of this chapter) during the preceding 12 months or for such shorter period that the registrant was required to submit and post such files). ý Yes ¨ No
Indicate by check mark if disclosure of delinquent filers pursuant to Item 405 of Regulation S-K is not contained herein, and will not be contained, to the best of registrant's knowledge, in definitive proxy or information statements incorporated by reference in Part III of this Form 10-K or any amendment to this Form 10-K. ý
Table of Contents
Indicate by check mark whether the registrant is a large accelerated filer, an accelerated filer, a non-accelerated filer, or a smaller reporting company. See definition of "large accelerated filer," "accelerated filer," and "smaller reporting company" in Rule 12b-2 of the Exchange Act. (Check one):
Large Accelerated Filer |
| ¨ |
| Accelerated Filer |
| ý |
Non-Accelerated Filer |
| ¬ (Do not check if a smaller reporting company) |
| Smaller reporting company |
| ¨ |
Indicate by check mark whether the registrant is a shell company (as defined in Rule 12b-2 of the Exchange Act). ¨ Yes ý No
The aggregate market value of the registrant's common stock held by non-affiliates of the registrant as of November 30, 2013, was approximately $128.7 million.
As of July 18, 2014, there were outstanding 11,802,733 shares of Common Stock, $0.05 par value and 2,190,644 shares of Class B Common Stock, $0.05 par value, which are convertible into Common Stock of the registrant on a one-for-one basis.
DOCUMENTS INCORPORATED BY REFERENCE
Portions of the registrant's Proxy Statement for the Annual Meeting of Stockholders scheduled to be held October 7, 2014, which will be filed pursuant to Regulation 14A, are incorporated by reference in Part III of this report. Except as specifically incorporated herein by reference, the abovementioned Proxy Statement is not deemed filed as part of this report.
Table of Contents
TABLE OF CONTENTS
|
| Page |
Part I |
|
|
Item 1. | Business | 4 |
Item 1A. | Risk Factors | 8 |
Item 1B. | Unresolved Staff Comments | 11 |
Item 2. | Properties | 12 |
Item 3. | Legal Proceedings | 13 |
|
|
|
Part II |
|
|
Item 5. | Market for Registrant's Common Equity, Related Stockholder Matters and Issuer Purchases of Equity Securities | 14 |
Item 6. | Selected Financial Data | 16 |
Item 7. | Management's Discussion and Analysis of Financial Condition and Results of Operations | 17 |
Item 7A. | Quantitative and Qualitative Disclosures About Market Risk | 28 |
Item 8. | Financial Statements and Supplementary Data | 29 |
Item 9A. | Controls and Procedures | 53 |
Item 9B. | Other Information | 54 |
|
|
|
Part III |
|
|
Item 10. | Directors, Executive Officers and Corporate Governance | 55 |
Item 11. | Executive Compensation | 55 |
Item 12. | Security Ownership of Certain Beneficial Owners and Management and Related Stockholder Matters | 55 |
Item 13. | Certain Relationships and Related Transactions, and Director Independence | 55 |
Item 14. | Principal Accountant Fees and Services | 55 |
|
|
|
Part IV |
|
|
Item 15. | Exhibits and Financial Statement Schedules | 56 |
|
| |
Signatures | 57 | |
Exhibit Index | 58 | |
3
Table of Contents
Forward Looking Statements
Certain statements in this report may constitute "forward-looking" statements within the meaning of the Private Securities Litigation Reform Act of 1995. The terms "may", "should", "could", "anticipate", "believe", "continues", "estimate", "expect", "intend", "objective", "plan", "potential", "project", and similar expressions are intended to identify forward-looking statements. These statements are not guarantees of future performance and involve risks, uncertainties, and assumptions that are difficult to predict. These statements are based on management's current expectations, intentions, or beliefs and are subject to a number of factors, assumptions, and uncertainties that could cause actual results to differ materially from those described in the forward-looking statements. Factors that could cause or contribute to such differences or that might otherwise impact the business include the risk factors set forth in Item 1A of this Form 10-K. We undertake no obligation to update any such factor or to publicly announce the results of any revisions to any forward-looking statements contained herein whether as a result of new information, future events, or otherwise.
In addition, while we do, from time to time, communicate with securities analysts, it is against our policy to disclose to them any material non-public information, or other confidential commercial information. Accordingly, stockholders should not assume that we agree with any statement or report issued by any analyst irrespective of the content of the statement or report. Thus, to the extent that reports issued by securities analysts contain any projections, forecasts, or opinions, such reports are not our responsibility.
PART I
ITEM 1. Business
General
Richardson Electronics, Ltd. ("we", "us", "the Company", and "our") is incorporated in the state of Delaware. We are a leading global provider of engineered solutions, power grid and microwave tubes and related components, and customized display solutions, serving customers in the alternative energy, aviation, broadcast, communications, industrial, marine, medical, military, scientific, and semiconductor markets. Our strategy is to provide specialized technical expertise and "engineered solutions" based on our core engineering and manufacturing capabilities. We provide solutions and add value through design-in support, systems integration, prototype design and manufacturing, testing, logistics, and aftermarket technical service and repair.
Our products include electron tubes and related components, microwave generators, subsystems used in semiconductor manufacturing, and visual technology solutions. These products are used to control, switch or amplify electrical power signals, or are used as display devices in a variety of industrial, commercial, medical, and communication applications.
On July 5, 2013, we acquired the assets of WVS-Technology ("WVS") for approximately $1.0 million. WVS, located in Meerbusch, Germany, develops and sells radio frequency ("RF") and microwave products, power grid tubes, vacuum capacitors, as well as industrial microwave equipment. This acquisition provides us with engineering and sales expertise to help expand our presence in the vacuum capacitor market.
On September 4, 2012, we acquired the assets of D and C Import-Export, Inc. ("D and C") for approximately $2.6 million. D and C, a Florida-based distributor of power grid tubes and associated RF components, services the broadcast, commercial, industrial, medical, military, and scientific markets. This acquisition provides us with access to additional product lines, vendors, and customers.
On September 5, 2011, we acquired the assets of Powerlink Specialist Electronics Support Limited ("Powerlink") for approximately $2.3 million. Powerlink, a UK-based technical service company with locations in London and Dubai, services traveling wave tube ("TWT") amplifiers and related equipment for the satellite communications market throughout Europe and the Middle East.
Our fiscal year 2014 began on June 2, 2013, and ended on May 31, 2014 . Unless otherwise noted, all references in this document to a particular year shall mean our fiscal year.
4
Table of Contents
Geography
We currently have operations in the following major geographic regions:
• | North America; |
• | Asia/Pacific; |
• | Europe; and |
• | Latin America. |
Selected financial data attributable to each segment and geographic region for fiscal 2014 , 2013 , and 2012 is set forth in Note 10 "Segment and Geographic Information" of the notes to our consolidated financial statements in Part II, Item 8 of this Annual Report on Form 10-K.
We have two operating segments, which we define as follows:
Electron Device Group
Electron Device Group ("EDG") provides engineered solutions and distributes electronic components to customers in alternative energy, aviation, broadcast, communications, industrial, marine, medical, military, scientific, and semiconductor markets. EDG focuses on various applications including broadcast transmission, CO 2 laser cutting, diagnostic imaging, dielectric and induction heating, high energy transfer, high voltage switching, plasma, power conversion, radar, and radiation oncology. EDG also offers its customers technical services for both microwave and industrial equipment.
EDG represents leading manufacturers of electron tubes and components used in semiconductor manufacturing equipment and industrial power applications. Among the suppliers they support are Amperex, CPI, Draloric, Eimac, General Electric, Hitachi, Jennings, L3, National, NJRC, Thales, Toshiba, and Vishay.
EDG's inventory levels reflect our commitment to maintain an inventory of a broad range of products for customers who are buying products for replacement of components used in critical equipment. As of May 31, 2014 , on average, we hold 120 days of inventory in the normal course of operations. This level of inventory reflects the fact that EDG also sells a number of products representing trailing edge technology. While the market for these trailing edge technology products is declining, EDG is increasing its market share. EDG often buys products it knows it can sell ahead of any supplier price increases. As manufacturers for these products exit the business, EDG has the option to purchase a substantial portion of their remaining inventory.
EDG has distribution agreements with many of its suppliers; most of these agreements provide exclusive distribution rights which often include global responsibility. The agreements are typically long term, and usually contain provisions permitting termination by either party if there are significant breaches which are not cured within a reasonable period of time. Although some of these agreements allow EDG to return inventory periodically, others do not, in which case EDG may have obsolete inventory that they cannot return to the supplier.
EDG's suppliers provide warranty coverage for the products and allow return of defective products, including those returned to EDG by its customers. For information regarding the warranty reserves, see Note 3 "Significant Accounting Policies" of the notes to our consolidated financial statements in Part II, Item 8 of this Annual Report on Form 10-K.
In addition to third party products, we sell proprietary products principally under certain trade names we own including: Amperex ®, Cetron ® , and National® . Our proprietary products include thyratrons and rectifiers, power tubes, ignitrons, magnetrons, phototubes, microwave generators, and liquid crystal display monitors. The materials used in the manufacturing process consist of glass bulbs and tubing, nickel, stainless steel and other metals, plastic and metal bases, ceramics, and a wide variety of fabricated metal components. These materials are generally readily available, but some components may require long lead times for production, and some materials are subject to shortages or price fluctuations based on supply and demand.
5
Table of Contents
Canvys
Canvys provides customized display solutions serving the corporate enterprise, financial, healthcare, industrial, and original equipment manufacturer ("OEM") markets. Our engineers design, manufacture, source, and support a full spectrum of solutions to match the needs of our customers. We offer custom display solutions that include touch screens, protective panels, custom enclosures, specialized cabinet finishes, and application specific software packages. Our volume commitments are much lower than those of the large display manufacturers, making us the ideal choice for companies with very specific design requirements. We partner with both private label manufacturing companies and leading branded hardware vendors to offer the highest quality liquid crystal displays, mounting devices, and customized computing platforms.
As a longtime provider of healthcare solutions to hospitals and medical clinics, we specialize in creating comprehensive solutions for diagnostic and clinical review, 3-D and post processing, surgical suites and modality-specific applications. Our solutions meet certifications and calibration standards for patient monitoring, bio-medical displays, ultrasound, cardiac imaging, picture archiving, and communications systems. We offer our picture archiving communication system ("PACS") and patient monitoring displays under our own brand, Image Systems ® .
We have long-standing relationships with key component and finished goods manufacturers including 3M, HP, IBM, Intel, LG, NEC Displays, Sharp Electronics, Samsung, and WIDE Corporation. We believe our distributor relationships, combined with our engineering design and manufacturing capabilities and private label partnerships, allow us to maintain a well-balanced and technologically advanced offering of customer specific display solutions.
Sales and Product Management
As of the end of fiscal 2014 , we employed 139 sales and product management personnel worldwide. In addition, we have authorized representatives, who are not our employees, selling our products primarily in regions where we do not have a direct sales presence.
We offer various credit terms to qualifying customers as well as cash in advance and credit card terms. We establish credit limits for each sale prior to selling product to our customers and routinely review delinquent and aging accounts.
Distribution
We maintain approximately 110,700 part numbers in our product inventory database and we estimate that more than 90% of orders received by 6:00 p.m. local time are shipped complete the same day if product is in stock. Customers can access our products on our web sites, www.rell.com , www.canvys.com, and www.rellaser.com, through electronic data interchange, or by telephone. Customer orders are processed by our regional sales offices and supported primarily by one of our distribution facilities in LaFox, Illinois; Amsterdam, Netherlands; Marlborough, Massachusetts; Plymouth, Minnesota; Donaueschingen, Germany; or Singapore, Singapore. We also have satellite warehouses in Sao Paulo, Brazil; Shanghai, China; Bangkok, Thailand; and Hook, United Kingdom. Our data processing network provides on-line, real-time interconnection of all sales offices and central distribution operations, 24 hours per day, seven days per week. Information on stock availability, cross-reference information, customers, and market analyses are obtainable throughout the entire distribution network.
International Sales
During fiscal 2014 , approximately 58% of our sales were made outside the U.S. We continue to pursue new international sales to further expand our geographic reach.
Employees
As of May 31, 2014 , we employed 308 individuals, of which 293 were full-time and 15 were part-time. Of these, 191 were located in the United States and 117 were located internationally. The worldwide employee base included 139 in sales and product management, 20 in distribution support, 82 in administrative positions, and 67 in value-add and product manufacturing. All of our employees are non-union, and we consider our relationships with our employees to be good.
6
Table of Contents
Website Access to SEC Reports
We maintain an Internet website at www.rell.com . Our Annual Report on Form 10-K, quarterly reports on Form 10-Q, current reports on Form 8-K, and amendments to those reports filed or furnished pursuant to Section 13(a) or 15(d) of the Securities and Exchange Act of 1934 are accessible through our website, free of charge, as soon as reasonably practicable after these reports are filed electronically with the Securities and Exchange Commission. Interactive Data Files pursuant to Rule 405 of Regulation S-T, of these filing dates, formatted in Extensible Business Reporting Language ("XBRL") are accessible as well. To access these reports, go to our website at www.rell.com . The foregoing information regarding our website is provided for convenience and the content of our website is not deemed to be incorporated by reference in this report filed with the Securities and Exchange Commission.
7
Table of Contents
ITEM 1A. Risk Factors
Investors should consider carefully the following risk factors in addition to the other information included and incorporated by reference in this Annual Report on Form 10-K that we believe are applicable to our businesses and the industries in which we operate. While we believe we have identified the key risk factors affecting our businesses, there may be additional risks and uncertainties that are not presently known or that are not currently believed to be significant that may adversely affect our results of operations.
We may not achieve our growth, margin expansion or cost-reduction goals.
We have established goals to improve our profitability by growing our sales with new and existing customers, reducing our expenses, and increasing our margins. If we do not achieve our growth objectives, the complexity of our global infrastructure makes it difficult to reduce our fixed cost structure to align with the size of our operations. Factors that could have a significant effect on our ability to achieve these goals include the following:
• | Failure to achieve our sales and margin growth objectives in our product lines and business units; |
• | Failure to identify, consummate and integrate future acquisitions; |
• | Declining gross margin reflecting competitive pricing pressures or product mix; and, |
• | Limitations on our ability to leverage our support-function cost structure while maintaining an adequate structure to achieve our long-term growth objectives. |
We have historically incurred significant charges for inventory obsolescence, and may incur similar charges in the future.
We maintain significant inventories in an effort to ensure that customers have a reliable source of supply. Our products generally support industrial machinery that is powered by tube technology. As technology evolves and this capital equipment is replaced, the market for our products potentially declines. In addition, the market for many of our other products is characterized by rapid change resulting from the development of new technologies, evolving industry standards, frequent new product introductions by some of our suppliers and changing end-user demand, which can contribute to the decline in value or obsolescence of our inventory. We do not have many long-term supply contracts with our customers. If we fail to anticipate the changing needs of our customers or we fail to accurately forecast customer demand, our customers may not place orders with us, and we may accumulate significant inventories of products which we will be unable to sell or return to our vendors. This may result in a significant decline in the value of our inventory.
We face competitive pressures in the markets we serve.
Our overall competitive position depends on a number of factors including price, engineering capability, vendor representation, product diversity, lead times and the level of customer service. There are very few vacuum tube competitors in the markets EDG serves. There are also a limited number of Chinese manufacturers whose ability to produce vacuum tubes has progressed over the past several years. The most significant competitive risk comes from technical obsolescence. Canvys faces many competitors in the markets we serve. Increased competition may result in price reductions, reduced margins, or a loss of market share, any of which could materially and adversely affect our business, operating results, and financial condition.
A single stockholder has voting control over us.
As of July 22, 2014, Edward J. Richardson, our Chairman, Chief Executive Officer and President, beneficially owned approximately 99% of the outstanding shares of our Class B common stock, representing approximately 65% of the voting power of the outstanding common stock. This share ownership permits Mr. Richardson to exert control over the outcome of stockholder votes, including votes concerning the election of directors, by-law amendments, possible mergers, corporate control contests, and other significant corporate transactions.
We depend on key management and employees, the loss of whom may prevent us from implementing our business plans, limit our profitability and decrease the value of our common stock.
We are dependent on the talent and resources of our key executives and employees. In particular, the success of our business depends to a great extent on Edward J. Richardson, our President, Chief Executive Officer and the Chairman of our Board of Directors. Mr. Richardson has extensive experience in the electron device industry, and his services are critical to our success. We have not obtained key man insurance with respect to Mr. Richardson or any of our executive officers. The loss of Mr. Richardson may prevent us from implementing our business plan, which may limit our profitability and decrease the value of our common stock.
8
Table of Contents
EDG is dependent on a limited number of vendors to supply it with essential products.
EDG's principal products are capacitors, vacuum tubes and related products, microwave generators, and high voltage power supplies. The products supplied by EDG are currently produced by a relatively small number of manufacturers. One of EDG's suppliers represents 17% of our total sales volume. Our success depends, in large part, on maintaining current vendor relationships and developing new relationships. We believe that some vendors supplying products to EDG product lines are consolidating their distribution relationships as a result of the declining market. To the extent that our significant suppliers reduce the volume of product they sell through distribution and are unwilling or unable to continue to do business with us, or extend lead times, or limit supplies due to capacity constraints, or other factors, there could be a material adverse effect on our business.
International operations represent a significant percentage of our business and present a variety of unique risks which could impact our results of operations.
Because we source and sell our products worldwide, our business is subject to risks associated with doing business internationally. These risks include the costs and difficulties of managing foreign entities, limitations on the repatriation and investment of funds, currency fluctuations, cultural differences that affect customer preferences and business practices, unstable political or economic conditions, trade protection measures and import or export licensing requirements, changes in tax laws, and difficulty in staffing global operations.
We also face exposure to fluctuations in foreign currency exchange rates because we conduct business outside of the U.S. Price increases caused by currency exchange rate fluctuations may make our products less competitive or may have an adverse effect on our margins. Our international revenues and expenses generally are derived from sales and operations in currencies other than the U.S. dollar. Accordingly, when the U.S. dollar strengthens in relation to the base currencies of the countries in which we sell our products, our U.S. dollar reported net revenue and income will decrease. We currently do not engage in any currency hedging transactions. We cannot predict whether foreign currency exchange risks inherent in doing business in foreign countries will have a material adverse effect on our operations and financial results in the future.
We rely heavily on information technology systems, which, if not properly functioning, could materially adversely affect our business.
Pursuant to a Transition Services Agreement with Arrow Electronics, Arrow provides IT services to us. We rely on these information systems to process, analyze, and manage data to facilitate the purchase and distribution of our products, as well as to receive, process, bill, and ship orders on a timely basis. If the IT services provided by Arrow Electronics are not provided to us in an adequate manner, our ability to serve our customers and to perform other vital company functions may be affected. On July 8, 2014, we received notice from Arrow that it will cease to provide these IT services as of January 8, 2015. We are in the process of migrating to a new ERP platform with the intent of completing the migration prior to January 8, 2015. A significant disruption or failure in the design, implementation or support of the new information technology systems could significantly disrupt our business, result in increased costs or decreased revenues, harm our reputation, or expose us to liability. To the extent we cannot timely complete this project, our business may suffer and we may incur significant additional costs.
Our products may be found to be defective or our services performed may result in equipment or product damage and, as a result, warranty and/or product liability claims may be asserted against us.
Many of our components are sold at prices that are significantly lower than the cost of the equipment or other goods in which they are incorporated. Since a defect or failure in a product could give rise to failures in the equipment that incorporates them, we may face claims for damages that are disproportionate to the revenues and profits we receive from the components involved in the claims. While we typically have provisions in our agreements with our suppliers that hold the supplier accountable for defective products, and we and our suppliers generally exclude consequential damages in our standard terms and conditions, our ability to avoid such liabilities may be limited as a result of various factors, including the inability to exclude such damages due to the laws of some of the countries where we do business. Our business could be adversely affected as a result of a significant quality or performance issues in the components sold by us if we are required to pay for the damages. Although we have product liability insurance, such insurance is limited in coverage and amount.
Substantial defaults by our customers on our accounts receivable or the loss of significant customers could have a significant negative impact on our business.
We extend credit to our customers. The failure of a significant customer or a significant group of customers to timely pay all amounts due could have a material adverse effect on our financial condition and results of operations. The extension of credit involves considerable judgment and is based on management's evaluation of factors which include such things as a customer's financial condition, payment history, and the availability of collateral to secure customers' receivables.
9
Table of Contents
We may not be successful in identifying, consummating and integrating future acquisitions.
As part of our growth strategy, our intent is to acquire additional businesses or assets. We may not be able to identify attractive acquisition candidates or complete the acquisition of identified candidates at favorable prices and upon advantageous terms. Also, acquisitions are accompanied by risks, such as potential exposure to unknown liabilities and the possible loss of key employees and customers of the acquired business. In addition, we may not obtain the expected benefits or cost savings from acquisitions. Acquisitions are subject to risks associated with financing the acquisition, and integrating the operations, personnel and systems of the acquired businesses. If any of these risks materialize, they may result in disruptions to our business and the diversion of management time and attention, which could increase the costs of operating our existing or acquired businesses or negate the expected benefits of the acquisitions.
Economic weakness and uncertainty could adversely affect our revenues and gross margins.
Our revenues and gross profit margins depend significantly on global economic conditions, the demand for our products and services and the financial condition of our customers. Economic weakness and uncertainty have in the past resulted, and may result in the future, in decreased revenues and gross profit margins. Economic weakness and uncertainty also make it more difficult for us to forecast overall supply and demand with a great deal of confidence.
Our operating results during fiscal 2014 reflect a decline in sales volume, and there can be no assurance that we will experience a recovery in the near future; nor can there be any assurance that such worldwide economic volatility experienced recently will not continue.
Major disruptions to our logistics capability could have a material adverse impact on our operations.
Our global logistics services are operated through specialized and centralized distribution centers. We depend on third party transportation service providers for the delivery of products to our customers. A major interruption or disruption in service at any of our distribution centers for any reason (such as natural disasters, pandemics, or significant disruptions of services from our third party providers) could cause cancellations or delays in a significant number of shipments to customers and, as a result, could have a severe impact on our business, operations and financial performance.
We may be subject to intellectual property rights claims, which are costly to defend, could require payment of damages or licensing fees, and/or could limit our ability to use certain technologies in the future.
Substantial litigation and threats of litigation regarding intellectual property rights exist in the display systems and electronics industries. From time to time, third parties (including certain companies in the business of acquiring patents not for the purpose of developing technology but with the intention of aggressively seeking licensing revenue from purported infringers) may assert patent and/or other intellectual property rights to technologies that are important to our business. In any dispute involving products that we have sold, our customers could also become the target of litigation. We are obligated in many instances to indemnify and defend our customers if the products we sell are alleged to infringe any third party's intellectual property rights. In some cases, depending on the nature of the claim, we may be able to seek indemnification from our suppliers for our self and our customers against such claims, but there is no assurance that we will be successful in obtaining such indemnification or that we are fully protected against such claims. Any infringement claim brought against us, regardless of the duration, outcome or size of damage award, could result in substantial cost, divert our management's attention, be time consuming to defend, result in significant damage awards, cause product shipment delays, or require us to enter into royalty or other licensing agreements.
Additionally, if an infringement claim is successful we may be required to pay damages or seek royalty or license arrangements which may not be available on commercially reasonable terms. The payment of any such damages or royalties may significantly increase our operating expenses and harm our operating results and financial condition. Also, royalty or license arrangements may not be available at all. We may have to stop selling certain products or certain technologies, which could affect our ability to compete effectively.
Potential lawsuits, with or without merit, may divert management's attention, and we may incur significant expenses in our defense. In addition, we may be required to pay damage awards or settlements, become subject to injunctions or other equitable remedies, or determine to abandon certain lines of business, that may cause a material adverse effect on our results of operations, financial position, and cash flows.
10
Table of Contents
If we fail to maintain an effective system of internal controls or discover material weaknesses in our internal controls over financial reporting, we may not be able to detect fraud or report our financial results accurately or timely.
An effective internal control environment is necessary for us to produce reliable financial reports and is an important part of our effort to prevent financial fraud. We are required to periodically evaluate the effectiveness of the design and operation of our internal controls over financial reporting. Based on these evaluations, we may conclude that enhancements, modifications, or changes to internal controls are necessary or desirable. While management evaluates the effectiveness of our internal controls on a regular basis, these controls may not always be effective. There are inherent limitations on the effectiveness of internal controls, including fraud, collusion, management override, and failure in human judgment. In addition, control procedures are designed to reduce rather than eliminate business risks.
If we fail to maintain an effective system of internal controls, or if management or our independent registered public accounting firm discovers material weaknesses in our internal controls, we may be unable to produce reliable financial reports or prevent fraud. In addition, we may be subject to sanctions or investigation by regulatory authorities, such as the Securities and Exchange Commission or NASDAQ. Any such actions could result in an adverse reaction in the financial markets due to a loss of confidence in the reliability of our financial statements.
If we are deemed to be an investment company, we will be required to meet burdensome compliance requirements and restrictions on our activities.
We currently have significant cash and investments. If we are deemed to be an "investment company" as defined under the Investment Company Act of 1940 (the "Investment Company Act"), the nature of our investments may be subject to various restrictions. We do not believe that our principal activities subject us to the Investment Company Act. If we are deemed to be subject to the Investment Company Act, compliance with required additional regulatory burdens would increase our operating expenses.
The company's identifiable intangible assets could become impaired, which could reduce the value of our assets and reduce our net income in the year in which the write-off occurs.
Our intangible assets could become impaired, which could reduce the value of our assets and reduce our net income in the year in which the write-off occurs. We ascribe value to certain intangible assets, which consist of customer lists and trade names resulting from acquisitions. We may incur an impairment charge on intangible assets if we determine that the fair value of the intangible assets are less than their current carrying values. We evaluate whether events have occurred that indicate all, or a portion, of the carrying amount of intangible assets may no longer be recoverable. If this is the case, an impairment charge to earnings would be necessary.
ITEM 1B. Unresolved Staff Comments
None.
11
Table of Contents
ITEM 2. Properties
The Company owns three facilities and leases 29 facilities. We own our corporate facility and largest distribution center, which is located on approximately 100 acres in LaFox, Illinois and consists of approximately 242,000 square feet of manufacturing, warehouse, and office space. We maintain geographically diverse facilities because we believe this provides value to our customers and suppliers, and limits market risk and exchange rate exposure. We consider our properties to be well maintained, in sound condition and repair, and adequate for our present needs. The extent of utilization varies from property to property and from time to time during the year.
Our facility locations, their primary use, and segments served are as follows:
Location |
| Leased/Owned |
| Use |
| Segment |
Woodland Hills, California |
| Leased |
| Sales |
| EDG |
Farmington, Connecticut |
| Leased |
| Sales |
| EDG |
Brooksville, Florida |
| Leased |
| Sales/Distribution |
| EDG |
Fort Lauderdale, Florida |
| Leased |
| Sales |
| EDG |
LaFox, Illinois * |
| Owned |
| Corporate/Sales/Distribution/Manufacturing |
| EDG/Canvys |
Rockland, Massachusetts |
| Leased |
| Sales |
| EDG |
Marlborough, Massachusetts |
| Leased |
| Sales/Distribution/Manufacturing |
| Canvys |
Plymouth, Minnesota |
| Leased |
| Sales/Distribution/Manufacturing |
| Canvys |
Charlotte, North Carolina |
| Leased |
| Sales |
| EDG |
Sao Paulo, Brazil |
| Leased |
| Sales/Distribution |
| EDG |
Beijing, China |
| Leased |
| Sales |
| EDG |
Shanghai, China |
| Leased |
| Sales/Distribution |
| EDG |
Shenzhen, China |
| Leased |
| Sales |
| EDG |
Colombes, France |
| Leased |
| Sales |
| EDG |
Donaueschingen, Germany |
| Leased |
| Sales/Distribution/Manufacturing |
| Canvys |
Meerbusch, Germany |
| Leased |
| Sales/Distribution/Testing |
| EDG |
Puchheim, Germany |
| Leased |
| Sales |
| EDG |
Mumbai, India |
| Leased |
| Sales |
| EDG |
Florence, Italy |
| Owned |
| Sales |
| EDG |
Milan, Italy |
| Leased |
| Sales |
| EDG |
Tokyo, Japan |
| Leased |
| Sales |
| EDG |
Mexico City, Mexico |
| Leased |
| Sales |
| EDG |
Amsterdam, Netherlands |
| Leased |
| Sales/Distribution |
| EDG |
Singapore, Singapore |
| Leased |
| Sales/Distribution |
| EDG |
Seoul, South Korea |
| Leased |
| Sales |
| EDG |
Madrid, Spain |
| Owned |
| Sales |
| EDG |
Taipei, Taiwan |
| Leased |
| Sales |
| EDG/Canvys |
Bangkok, Thailand |
| Leased |
| Sales/Distribution |
| EDG |
Dubai, United Arab Emirates |
| Leased |
| Sales/Distribution/Testing/Repair |
| EDG |
Hook, United Kingdom |
| Leased |
| Sales/Distribution/Testing/Repair |
| EDG |
Lincoln, United Kingdom |
| Leased |
| Sales |
| EDG/Canvys |
Ho Chi Minh City, Vietnam |
| Leased |
| Sales |
| EDG |
* | LaFox, Illinois is also the location of our corporate headquarters. |
12
Table of Contents
ITEM 3. Legal Proceedings
From time to time, we or our subsidiaries are involved in pending judicial proceedings concerning matters arising in the ordinary course of our business. While the outcome of litigation is subject to uncertainties, based on information at the time the financial statements were issued, we do not believe that the outcome of any current claims will have a material adverse effect on our consolidated financial position, results of operations, or cash flows.
13
Table of Contents
PART II
ITEM 5. Market for the Registrant's Common Equity, Related Stockholder Matters and Issuer Purchases of Equity Securities
Unregistered Sales of Equity Securities
None.
Share Repurchases
Period | Total Number of Shares Purchased |
| Average Price Paid per Share |
| Total Number of Shares Purchased as Part of Publicly Announced Plans or Programs |
| Dollar Amount of Shares Purchased Under the Plans or Programs |
| Amounts Remaining Under the Share Repurchase Authorization | ||||||||
June 1, 2013 |
|
|
|
|
|
|
|
| $ | 27,308,893 | | ||||||
June 2, 2013 - June 29, 2013 | 95,441 | |
| $ | 11.81 | |
| 95,441 | |
| $ | 1,127,610 | |
| $ | 26,181,283 | |
June 30, 2013 - July 27, 2013 | 56,429 | |
| $ | 11.86 | |
| 56,429 | |
| $ | 669,439 | |
| $ | 25,511,844 | |
July 28, 2013 - August 31, 2013 | 426,195 | |
| $ | 11.50 | |
| 426,195 | |
| $ | 4,902,732 | |
| $ | 20,609,112 | |
September 1, 2013 - September 28, 2013 | 91,499 | |
| $ | 11.36 | |
| 91,499 | |
| $ | 1,039,257 | |
| $ | 19,569,855 | |
September 29, 2013 - October 26, 2013 | 81,494 | |
| $ | 11.45 | |
| 81,494 | |
| $ | 933,276 | |
| $ | 18,636,579 | |
October 27, 2013 - November 30, 2013 | 4,518 | |
| $ | 11.58 | |
| 4,518 | |
| $ | 52,317 | |
| $ | 18,584,262 | |
December 1, 2013 - December 28, 2013 | - | |
| $ | - | |
| - | |
| $ | - | |
| $ | 18,584,262 | |
December 29, 2013 - January 25, 2014 | - | |
| $ | - | |
| - | |
| $ | - | |
| $ | 18,584,262 | |
January 26, 2014 - March 1, 2014 | - | |
| $ | - | |
| - | |
| $ | - | |
| $ | 18,584,262 | |
March 2, 2014 - March 29, 2014 | - | |
| $ | - | |
| - | |
| $ | - | |
| $ | 18,584,262 | |
March 30, 2014 - April 26, 2014 | - | |
| $ | - | |
| - | |
| $ | - | |
| $ | 18,584,262 | |
April 27, 2014 - May 31, 2014 | 1,371 | |
| $ | 10.01 | |
| 1,371 | |
| $ | 13,725 | |
| $ | 18,570,537 | |
Dividends
Our quarterly dividend was $0.06 per common share and $0.054 per Class B common share. Annual dividend payments for fiscal 2014 and fiscal 2013 were approximately $3.3 million and $3.6 million, respectively. All future payments of dividends are at the discretion of the Board of Directors. Dividend payments will depend on earnings, capital requirements, operating conditions, and such other factors that the Board may deem relevant.
Common Stock Information
Our common stock is traded on the NASDAQ Global Select Market ("NASDAQ") under the trading symbol ("RELL"). There is no established public trading market for our Class B common stock. As of July 21, 2014, there were approximately 721 stockholders of record for the common stock and approximately 16 stockholders of record for the Class B common stock. The following table sets forth the high and low closing sales price per share of RELL common stock as reported on the NASDAQ for the periods indicated.
High and Low Closing Prices of Common Stock |
|
|
| ||||||||||||
| 2014 |
| 2013 | ||||||||||||
Fiscal Quarter | High |
| Low |
| High |
| Low | ||||||||
First | $ | 12.11 | |
| $ | 11.00 | |
| $ | 12.71 | |
| $ | 11.52 | |
Second | $ | 11.66 | |
| $ | 11.08 | |
| $ | 12.39 | |
| $ | 10.75 | |
Third | $ | 12.12 | |
| $ | 10.85 | |
| $ | 12.44 | |
| $ | 11.07 | |
Fourth | $ | 11.22 | |
| $ | 10.01 | |
| $ | 12.24 | |
| $ | 11.14 | |
14
Table of Contents
Performance Graph
The following graph compares the performance of our common stock for the periods indicated with the performance of the NASDAQ Composite Index and NASDAQ Electronic Components Index. The graph assumes $100 invested on the last day of our fiscal year 2009, in our common stock, the NASDAQ Composite Index, and NASDAQ Electronic Components Index. Total return indices reflect reinvestment of dividends at the closing stock prices at the date of the dividend declaration.
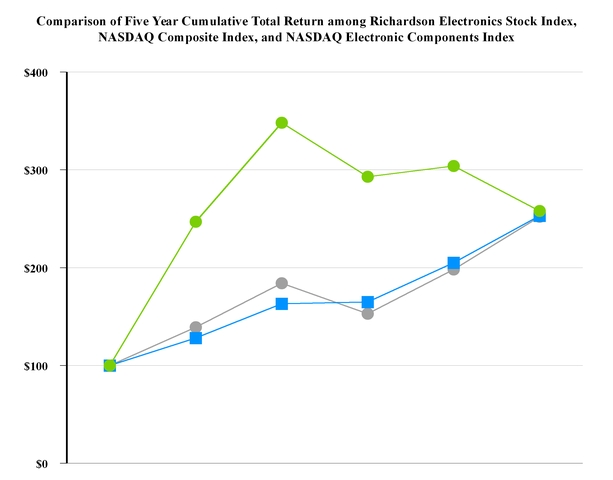
| 2009 | 2010 | 2011 | 2012 | 2013 | 2014 |
 | $100 | $247 | $348 | $293 | $304 | $258 |
 | $100 | $128 | $163 | $165 | $205 | $253 |
 | $100 | $139 | $184 | $153 | $198 | $252 |
15
Table of Contents
ITEM 6. Selected Financial Data
Five-Year Financial Review
| Fiscal Year Ended (1) | ||||||||||||||||||
| (in thousands , except per share amounts ) | ||||||||||||||||||
| May 31, 2014 |
| June 1, 2013 |
| June 2, 2012 (2) |
| May 28, 2011 (2) |
| May 29, 2010 (2) | ||||||||||
Statements of Income (Loss) |
|
|
|
|
|
|
|
|
| ||||||||||
Net sales | $ | 137,960 | |
| $ | 141,066 | |
| $ | 157,836 | |
| $ | 158,867 | |
| $ | 135,372 | |
Continuing Operations |
|
|
|
|
|
|
|
|
| ||||||||||
Income (loss) from continuing operations before tax | (652 | ) |
| 642 | |
| 7,656 | |
| $ | 2,450 | |
| $ | (4,250 | ) | |||
Income tax provision (benefit) | (307 | ) |
| 160 | |
| (334 | ) |
| 468 | |
| (68 | ) | |||||
Income (loss) from continuing operations | $ | (345 | ) |
| $ | 482 | |
| $ | 7,990 | |
| $ | 1,982 | |
| $ | (4,182 | ) |
Discontinued Operations |
|
|
|
|
|
|
|
|
| ||||||||||
Income (loss) from discontinued operations | (170 | ) |
| 766 | |
| 536 | |
| $ | 85,966 | |
| $ | 20,277 | | |||
Net income (loss) | $ | (515 | ) |
| $ | 1,248 | |
| $ | 8,526 | |
| $ | 87,948 | |
| $ | 16,095 | |
Per Share Data |
|
|
|
|
|
|
|
|
| ||||||||||
Net income (loss) per Common share - Basic: |
|
|
|
|
|
|
|
|
| ||||||||||
Income (loss) from continuing operations | $ | (0.03 | ) |
| $ | 0.03 | |
| $ | 0.48 | |
| $ | 0.11 | |
| $ | (0.24 | ) |
Income (loss) from discontinued operations | (0.01 | ) |
| 0.05 | |
| 0.03 | |
| 4.87 | |
| 1.16 | | |||||
Total net income (loss) per Common share - Basic: | $ | (0.04 | ) |
| $ | 0.08 | |
| $ | 0.51 | |
| $ | 4.98 | |
| $ | 0.92 | |
Net income (loss) per Class B common share - Basic: |
|
|
|
|
|
|
|
|
| ||||||||||
Income (loss) from continuing operations | $ | (0.02 | ) |
| $ | 0.03 | |
| $ | 0.43 | |
| $ | 0.10 | |
| $ | (0.21 | ) |
Income (loss) from discontinued operations | (0.01 | ) |
| 0.05 | |
| 0.03 | |
| 4.38 | |
| 1.04 | | |||||
Total net income (loss) per Class B common share - Basic: | $ | (0.03 | ) |
| $ | 0.08 | |
| $ | 0.46 | |
| $ | 4.48 | |
| $ | 0.83 | |
Net income (loss) per Common share - Diluted: |
|
|
|
|
|
|
|
|
| ||||||||||
Income (loss) from continuing operations | $ | (0.03 | ) |
| $ | 0.03 | |
| $ | 0.47 | |
| $ | 0.11 | |
| $ | (0.24 | ) |
Income (loss) from discontinued operations | (0.01 | ) |
| 0.05 | |
| 0.03 | |
| 4.72 | |
| 1.16 | | |||||
Total net income (loss) per Common share - Diluted: | $ | (0.04 | ) |
| $ | 0.08 | |
| $ | 0.50 | |
| $ | 4.83 | |
| $ | 0.92 | |
Net income (loss) per Class B common share - Diluted: |
|
|
|
|
|
|
|
|
| ||||||||||
Income (loss) from continuing operations | $ | (0.02 | ) |
| $ | 0.03 | |
| $ | 0.43 | |
| $ | 0.10 | |
| $ | (0.21 | ) |
Income (loss) from discontinued operations | (0.01 | ) |
| 0.05 | |
| 0.03 | |
| 4.32 | |
| 1.04 | | |||||
Total net income (loss) per Class B common share - Diluted: | $ | (0.03 | ) |
| $ | 0.08 | |
| $ | 0.46 | |
| $ | 4.42 | |
| $ | 0.83 | |
Cash Dividend Data |
|
|
|
|
|
|
|
|
| ||||||||||
Dividends per common share | $ | 0.240 | |
| $ | 0.240 | |
| $ | 0.200 | |
| $ | 0.110 | |
| $ | 0.080 | |
Dividends per Class B common share (3) | $ | 0.220 | |
| $ | 0.220 | |
| $ | 0.180 | |
| $ | 0.099 | |
| $ | 0.072 | |
Balance Sheet Data |
|
|
|
|
|
|
|
|
| ||||||||||
Total assets | $ | 203,545 | |
| $ | 217,318 | |
| $ | 231,423 | |
| $ | 314,054 | |
| $ | 234,815 | |
Short-term debt | - | |
| - | |
| - | |
| - | |
| 19,517 | | |||||
Stockholders' equity | $ | 174,845 | |
| $ | 185,239 | |
| $ | 200,213 | |
| $ | 222,047 | |
| $ | 129,863 | |
(1) | Our fiscal year ends on the Saturday nearest the end of May. Each of the fiscal years presented contain 52/53 weeks. |
(2) | Restated to reflect the sale of RFPD. See Note 4 "Discontinued Operations" of the notes to our consolidated financial statements in Part II, Item 8 of this Annual Report on Form 10-K. |
(3) | The dividend per Class B common share is 90% of the dividend per Class A common share. |
16
Table of Contents
ITEM 7. Management's Discussion and Analysis of Financial Condition and Results of Operations
The following discussion should be read in conjunction with the consolidated financial statements and related notes.
Management's Discussion and Analysis of Financial Condition and Results of Operations ("MD&A") is intended to assist the reader in better understanding our business, results of operations, financial condition, changes in financial condition, critical accounting policies and estimates, and significant developments. MD&A is provided as a supplement to, and should be read in conjunction with, our consolidated financial statements and the accompanying notes appearing elsewhere in this filing. This section is organized as follows:
• | Business Overview |
• | Results of Continuing Operations - an analysis and comparison of our consolidated results of operations for the fiscal years ended May 31, 2014 , June 1, 2013 , and June 2, 2012 , as reflected in our consolidated statements of comprehensive income (loss). |
• | Liquidity, Financial Position, and Capital Resources - a discussion of our primary sources and uses of cash for the fiscal years ended May 31, 2014 , June 1, 2013 , and June 2, 2012 , and a discussion of changes in our financial position. |
Business Overview
Richardson Electronics, Ltd. ("we", "us", "the Company", and "our") is incorporated in the state of Delaware. We are a leading global provider of engineered solutions, power grid and microwave tubes and related components, and customized display solutions, serving customers in the alternative energy, aviation, broadcast, communications, industrial, marine, medical, military, scientific, and semiconductor markets. Our strategy is to provide specialized technical expertise and "engineered solutions" based on our core engineering and manufacturing capabilities. We provide solutions and add value through design-in support, systems integration, prototype design and manufacturing, testing, logistics, and aftermarket technical service and repair.
Our products include electron tubes and related components, microwave generators, subsystems used in semiconductor manufacturing, and visual technology solutions. These products are used to control, switch or amplify electrical power signals, or are used as display devices in a variety of industrial, commercial, medical, and communication applications.
On July 5, 2013, we acquired the assets of WVS-Technology ("WVS") for approximately $1.0 million. WVS, located in Meerbusch, Germany, develops and sells RF and microwave products, power grid tubes, vacuum capacitors, as well as industrial microwave equipment. This acquisition provides us with engineering and sales expertise to help expand our presence in the vacuum capacitor market.
On September 4, 2012, we acquired the assets of D and C Import-Export, Inc. ("D and C") for approximately $2.6 million. D and C, a Florida-based distributor of power grid tubes and associated RF components, services the broadcast, commercial, industrial, medical, military, and scientific markets. This acquisition provides us with access to additional product lines, vendors, and customers.
On September 5, 2011, we acquired the assets of Powerlink Specialist Electronics Support Limited ("Powerlink") for approximately $2.3 million. Powerlink, a UK-based technical service company with locations in London and Dubai, services TWT amplifiers and related equipment for the Satellite Communications market throughout Europe and the Middle East.
We have two operating segments which we define as follows:
Electron Device Group ("EDG") provides engineered solutions and distributes electronic components to customers in alternative energy, aviation, broadcast, communications, industrial, marine, medical, military, scientific, and semiconductor markets. EDG focuses on various applications including broadcast transmission, CO 2 laser cutting, diagnostic imaging, dielectric and induction heating, high energy transfer, high voltage switching, plasma, power conversion, radar, and radiation oncology. EDG also offers its customers technical services for both microwave and industrial equipment.
Canvys provides customized display solutions serving the corporate enterprise, financial, healthcare, industrial, and medical original equipment manufacturers ("OEM") markets.
17
Table of Contents
We currently have operations in the following major geographic regions:
• | North America; |
• | Asia/Pacific; |
• | Europe; and |
• | Latin America. |
Results of Continuing Operations
Overview - Fiscal Year Ended May 31, 2014
• | Net sales for fiscal 2014 were $138.0 million, down 2.2%, compared to net sales of $141.1 million during fiscal 2013 . |
• | Gross margin increased to 29.7% during fiscal 2014 , compared to 29.5% during fiscal 2013 . |
• | Selling, general, and administrative expenses increased to $43.5 million, or 31.5% of net sales, for fiscal 2014 compared to $41.5 million, or 29.4% of net sales, for fiscal 2013 . |
• | Operating loss during fiscal 2014 was $4.2 million, compared to breakeven during fiscal 2013 . |
• | Loss from continuing operations during fiscal 2014 was $0.3 million compared to income of $0.5 million, or $0.03 per diluted common share, during fiscal 2013 . |
• | Loss from discontinued operations, net of tax, was $0.2 million, during fiscal 2014 , compared to income of $0.8 million, or $0.05 per diluted common share, during fiscal 2013 . |
• | Net loss during fiscal 2014 was $0.5 million compared to net income of $1.2 million, or $0.08 per diluted common share, during fiscal 2013 . |
Net Sales and Gross Profit Analysis
Net sales by segment and percent change for fiscal 2014 , 2013 , and 2012 were as follows ( in thousands ):
Net Sales | FY 2014 |
| FY 2013 |
| FY 2012 |
| FY14 vs. FY13 % Change |
| FY13 vs. FY12 % Change | ||||||||
EDG | $ | 103,274 | |
| $ | 102,593 | |
| $ | 112,586 | |
| 0.7 | % |
| (8.9 | %) |
Canvys | 34,686 | |
| 38,473 | |
| 45,250 | |
| (9.8 | %) |
| (15.0 | %) | |||
Total | $ | 137,960 | |
| $ | 141,066 | |
| $ | 157,836 | |
| (2.2 | %) |
| (10.6 | %) |
During fiscal 2014 consolidated net sales decreased 2.2% compared to fiscal 2013 . Sales for Canvys declined by 9.8%, slightly offset by a 0.7% increase in sales for EDG. During fiscal 2013 consolidated net sales decreased 10.6% compared to fiscal 2012 . Sales for Canvys declined by 15.0%, and sales for EDG declined 8.9%.
Gross profit by segment and percent of segment net sales for fiscal 2014 , 2013 , and 2012 were as follows ( in thousands ):
Gross Profit | FY 2014 |
| FY 2013 |
| FY 2012 | ||||||||||||||
EDG | $ | 31,610 | |
| 30.6% |
| $ | 31,431 | |
| 30.6 | % |
| $ | 34,626 | |
| 30.8 | % |
Canvys | 9,404 | |
| 27.1% |
| 10,114 | |
| 26.3 | % |
| 12,155 | |
| 26.9 | % | |||
Total | $ | 41,014 | |
| 29.7% |
| $ | 41,545 | |
| 29.5 | % |
| $ | 46,781 | |
| 29.6 | % |
Gross profit reflects the distribution and manufacturing product margin less manufacturing variances, inventory obsolescence charges, customer returns, scrap and cycle count adjustments, engineering costs, unabsorbed manufacturing labor and overhead, and other provisions.
Consolidated gross profit was $41.0 million during fiscal 2014 , compared to $41.5 million during fiscal 2013 . Consolidated gross margin as a percentage of net sales increased slightly to 29.7% during fiscal 2014 , from 29.5% during fiscal 2013 . Gross margin during fiscal 2014 included expense related to inventory provisions for EDG and Canvys of $0.6 million and $0.2 million, respectively. Gross margin during fiscal 2013 included expense related to inventory provisions for EDG and Canvys of $0.2 million and $0.2 million, respectively. In addition, gross margin for EDG included $0.5 million and
18
Table of Contents
$0.8 million related to unabsorbed manufacturing labor and overhead for continuing operations during fiscal 2014 and 2013, respectively.
Consolidated gross profit was $41.5 million during fiscal 2013 , compared to $46.8 million during fiscal 2012 . Consolidated gross margin as a percentage of net sales declined slightly to 29.5% during fiscal 2013 , from 29.6% during fiscal 2012 . Gross margin during fiscal 2013 and fiscal 2012 included expense related to inventory provisions for EDG and Canvys of $0.2 million and $0.2 million, respectively. In addition, gross margin for EDG included $0.8 million and $0.2 million related to unabsorbed manufacturing labor and overhead for continuing operations during fiscal 2013 and 2012, respectively.
Electron Device Group
Net sales for EDG increased 0.7% to $103.3 million during fiscal 2014 , from $102.6 million during fiscal 2013 . Net sales of tubes grew in the industrial heating, marine, and laser markets but were offset by declines primarily in the broadcast and aviation markets. Gross margin as a percentage of net sales remained flat at 30.6% during fiscal 2014 compared to fiscal 2013.
Net sales for EDG decreased 8.9% to $102.6 million during fiscal 2013 , from $112.6 million during fiscal 2012 . Net sales of tubes decreased to $80.8 million during fiscal 2013 , as compared to $90.1 million during fiscal 2012 , due primarily to economic factors and weaker demand, particularly in Europe and China, as well as overall declines in the plastic, wood, and semiconductor fabrication markets. Net sales of continuous wave magnetrons and related assemblies sold primarily into the semi-conductor fabrication market decreased to $9.7 million during fiscal 2013, as compared to $10.1 million during fiscal 2012. Gross margin as a percentage of net sales decreased slightly to 30.6% during fiscal 2013, as compared to 30.8% during fiscal 2012.
Canvys
Net sales for Canvys decreased 9.8% to $34.7 million during fiscal 2014 , from $38.5 million during fiscal 2013 . Sales were flat in the North America Healthcare segment, up slightly in Europe OEM and down in the North America OEM market as suppliers sold directly to end users. Gross margin as a percentage of net sales increased to 27.1% during fiscal 2014 as compared to 26.3% during fiscal 2013 , due to continued margin improvement in Europe and lower inbound freight costs associated with inventory management.
Canvys net sales decreased 15.0% to $38.5 million during fiscal 2013 , from $45.3 million during fiscal 2012 . Sales were negatively impacted in North America by healthcare reform. Sales in Europe were down due to continuing economic pressures. Gross margin as a percentage of net sales decreased to 26.3% during fiscal 2013 as compared to 26.9% during fiscal 2012, due to lower margin in Europe associated with customer mix and currency exchange.
Sales by Geographic Area
On a geographic basis, our sales are categorized by destination: North America; Europe; Asia/Pacific; Latin America; and Other.
Net sales by geographic area and percent change for fiscal 2014 , 2013 , and 2012 were as follows ( in thousands ):
Net Sales | FY 2014 |
| FY 2013 |
| FY 2012 |
| FY14 vs. FY13 % Change |
| FY13 vs. FY12 % Change | ||||||||
North America | $ | 57,137 | |
| $ | 62,269 | |
| $ | 68,980 | |
| (8.2 | %) |
| (9.7 | %) |
Asia/Pacific | 24,069 | |
| 22,732 | |
| 25,588 | |
| 5.9 | % |
| (11.2 | %) | |||
Europe | 47,610 | |
| 45,663 | |
| 48,998 | |
| 4.3 | % |
| (6.8 | %) | |||
Latin America | 8,936 | |
| 9,447 | |
| 9,870 | |
| (5.4 | %) |
| (4.3 | %) | |||
Other | 208 | |
| 955 | |
| 4,400 | |
| (78.2 | %) |
| (78.3 | %) | |||
Total | $ | 137,960 | |
| $ | 141,066 | |
| $ | 157,836 | |
| (2.2 | %) |
| (10.6 | %) |
19
Table of Contents
Gross profit by geographic area and percent of geographic net sales for fiscal 2013, 2012, and 2011 were as follows ( in thousands ):
Gross Profit (Loss) | FY 2014 |
| FY 2013 |
| FY 2012 | |||||||||||||||
North America | $ | 18,905 | |
| 33.1 | % |
| $ | 20,963 | |
| 33.7 | % |
| $ | 22,380 | |
| 32.4 | % |
Asia/Pacific | 7,849 | |
| 32.6 | % |
| 7,805 | |
| 34.3 | % |
| 9,068 | |
| 35.4 | % | |||
Europe | 15,506 | |
| 32.6 | % |
| 14,248 | |
| 31.2 | % |
| 15,107 | |
| 30.8 | % | |||
Latin America | 3,231 | |
| 36.2 | % |
| 3,296 | |
| 34.9 | % |
| 3,712 | |
| 37.6 | % | |||
Other | (4,477 | ) |
|
|
| (4,767 | ) |
|
|
| (3,486 | ) |
|
| ||||||
Total | $ | 41,014 | |
| 29.7 | % |
| $ | 41,545 | |
| 29.5 | % |
| $ | 46,781 | |
| 29.6 | % |
We sell our products to customers in diversified industries and perform periodic credit evaluations of our customers' financial condition. Terms are generally on open account, payable net 30 days in North America, and vary throughout Asia/Pacific, Europe, and Latin America. Estimates of credit losses are recorded in the financial statements based on monthly reviews of outstanding accounts. Other primarily includes net sales not allocated to a specific geographical region, unabsorbed value-add costs, and unallocated freight expenses.
Selling, General, and Administrative Expenses
Selling, general, and administrative expenses ("SG&A") increased during fiscal 2014 to $43.5 million from $41.5 million during fiscal 2013 . SG&A as a percentage of sales from continuing operations, increased to 31.5% during fiscal 2014 from 29.4% during fiscal 2013 . The increase in SG&A costs of $2.0 million during fiscal 2014, compared to fiscal 2013, includes severance costs of $1.2 million, new system implementation expenses of $0.8 million, expenses related to evaluating potential acquisitions of $1.1 million, and new product development costs of $0.4 million, partially offset by a $1.5 million decrease within EDG, Canvys, and support functions.
SG&A increased during fiscal 2013 to $41.5 million from $40.6 million during fiscal 2012 . SG&A as a percentage of sales, from continuing operations, increased to 29.4% during fiscal 2013 from 25.8% during fiscal 2012 . SG&A in fiscal 2013 includes a $1.4 million increase for EDG partially offset by a $0.1 million reduction of support function costs and a decrease of SG&A costs for Canvys of $0.9 million. SG&A in fiscal 2013 includes employee-related termination costs of $0.5 million, $0.3 million, and $0.4 million relating to EDG, Canvys, and support functions, respectively, compared to no employee-related terminations costs for fiscal 2012.
Impairment of Goodwill
The results of our goodwill impairment tests as of March 1, 2014, indicated that the balance of goodwill reported, entirely attributed to our EDG reporting unit, was fully impaired. The goodwill impairment test revealed that there was no implied goodwill value as of the measurement date. As a result, we recorded a pre-tax goodwill impairment charge of $1.7 million. Additionally, a $0.6 million tax benefit was recorded related to the goodwill impairment.
The results of our goodwill impairment test as of March 2, 2013, and March 1, 2012, indicated no goodwill impairment as estimated fair value of the EDG reporting unit exceeded the carrying value.
Other Income/Expense
Other income/expense was income of $3.5 million during fiscal 2014 , compared to income of $0.6 million during fiscal 2013 . Fiscal 2014 included an antitrust class action lawsuit settlement of $2.6 million. The $0.6 million in fiscal 2013 included a foreign exchange loss of $0.8 million. Our foreign exchange gains and losses are primarily due to the translation of U.S. dollars held in non-U.S. entities. We currently do not utilize derivative instruments to manage our exposure to foreign currency. Fiscal 2014 and fiscal 2013 also included $1.0 million and $1.3 million, respectively, of investment income.
Other income was $0.6 million during fiscal 2013, compared to $1.4 million during fiscal 2012. Other income included a foreign exchange loss of $0.8 million, as compared to a foreign exchange gain of less than $0.1 million during fiscal 2012. Our foreign exchange gains and losses are primarily due to the translation of U.S. dollars held in non-U.S. entities. We currently do not utilize derivative instruments to manage our exposure to foreign currency. Fiscal 2013 and fiscal 2012 also included $1.3 million and $1.4 million, respectively, of investment income.
20
Table of Contents
Income Tax Provision (Benefit)
Our income tax benefit during fiscal year 2014 was $0.3 million. Our income tax provision for fiscal year 2013 was $0.2 million. During fiscal 2012 , we had an income tax benefit of $0.3 million. The effective income tax rates for continuing operations during fiscal 2014 , 2013 , and 2012 , were 47.0%, 24.9%, and (4.4%), respectively. The difference between the effective tax rates as compared to the U.S. federal statutory rate of 34% during 2014, 2013, and 2012 resulted from our geographical distribution of taxable income or losses, return to provision adjustments, the release of income tax reserves for uncertain tax positions, changes in the amount of foreign earnings considered to be permanently reinvested, and changes in valuation allowance. There were no changes in judgment during the fiscal year end regarding the beginning-of-year valuation allowance which would require a benefit to be excluded from the annual effective tax rate and allocated to the interim period.
As of May 31, 2014 , we had no domestic federal net operating loss ("NOL") carryforwards. Domestic state NOL carryforwards amounted to approximately $2.3 million. Foreign NOL carryforwards totaled approximately $1.1 million with various or indefinite expiration dates. We also had no alternative minimum tax credit carryforward or foreign tax credit carryforwards as of May 31, 2014 .
Management assesses the available positive and negative evidence to estimate if sufficient future taxable income will be generated to use the existing deferred tax assets. A significant component of objective evidence evaluated was the cumulative income or loss incurred in each jurisdiction over the three-year period ended May 31, 2014 . On the basis of this evaluation, as of May 31, 2014 , a valuation allowance of $4.1 million has been established to record only the portion of the deferred tax asset that more likely than not will be realized. The valuation allowance relates to deferred tax assets in jurisdictions where historical taxable losses have been incurred, and domestic state NOL carryforwards related to jurisdictions where the utilization of NOLs have been suspended. The amount of the deferred tax asset considered realizable, however, could be adjusted if estimates of future taxable income during the carryforward period are reduced or increased, or if objective negative evidence in the form of cumulative losses is no longer present and additional weight may be given to subjective evidence such as our projections for growth.
Our future U.S. federal, state, and foreign effective tax rates are expected to be closer to 34.0%, 3.8%, and 27.3%, respectively.
Income taxes paid, including foreign estimated tax payments, were $2.1 million, $1.7 million, and $40.1 million during fiscal 2014 , 2013 , and 2012 , respectively.
We have historically determined that certain undistributed earnings of our foreign subsidiaries, to the extent of cash available, will be repatriated to the U.S. Accordingly, we have provided a deferred tax liability totaling $7.0 million and $6.8 million as of May 31, 2014 and June 1, 2013 , respectively, on foreign earnings of $41.3 million. In addition, as of May 31, 2014, $45.4 million of cumulative positive earnings of some of our foreign subsidiaries are still considered permanently reinvested pursuant to ASC 740-30, Income Taxes - Other Considerations or Special Areas ("ASC 740-30"). Due to various tax attributes that are continuously changing, it is not practical to determine what, if any, tax liability might exist if such earnings were to be repatriated.
In the normal course of business, we are subject to examination by taxing authorities throughout the world. Generally, years prior to fiscal 2005 are closed for examination under the statute of limitation for U.S. federal, state or local, or non-U.S. tax jurisdictions. We are also currently under examination in Germany (fiscal 2009, 2010, and 2011), Italy (fiscal 2011), and Thailand (fiscal 2008 through 2011). Our primary foreign tax jurisdictions are Germany and the Netherlands. We have tax years open in Germany beginning in fiscal 2007 and the Netherlands beginning in fiscal 2008.
Discontinued Operations
During fiscal year 2011, we completed the sale of the assets primarily used or held for use in, and certain liabilities of our RF, Wireless, and Power Division ("RFPD"), as well as certain other Company assets, including our information technology assets, to Arrow Electronics, Inc. ("Arrow") in exchange for $238.8 million ("the Transaction"). In accordance with Accounting Standards Codification ("ASC") 205-20, Presentation of Financial Statements - Discontinued Operations ("ASC 205-20"), we reported the financial results of RFPD as a discontinued operation. Refer to Note 4 "Discontinued Operations" of the notes to our consolidated financial statements in Part II, Item 8 of this Annual Report on form 10-K.
21
Table of Contents
Financial Summary - Discontinued Operations
Summary financial results for fiscal 2014 , 2013 , and 2012 are presented in the following table ( in thousands ):
| Fiscal 2014 |
| Fiscal 2013 |
| Fiscal 2012 | ||||||
Net sales | $ | 402 | |
| $ | 636 | |
| $ | 2,984 | |
Gross loss (1) | (330 | ) |
| (553 | ) |
| (227 | ) | |||
Selling, general, and administrative expenses (2) | 215 | |
| 714 | |
| 552 | | |||
Additional (gain)/loss on sale | - | |
| 18 | |
| (266 | ) | |||
Income tax benefit (3) | (375 | ) |
| (2,051 | ) |
| (1,049 | ) | |||
Income (loss) from discontinued operations, net of tax | (170 | ) |
| 766 | |
| 536 | | |||
Notes:
(1) | Gross loss for fiscal year 2014 , 2013, and 2012 includes unabsorbed manufacturing labor and overhead expenses related to the Manufacturing Agreement with RFPD which ended March 1, 2014. |
(2) | Selling, General and Administrative expenses in fiscals 2014, 2013, and 2012 related primarily to professional fees for tax audits resulting from the Transaction. |
(3) | The income tax benefits in fiscal years 2014, 2013, and 2012 relates to the reversal of tax reserves. |
In accordance with ASC 230, Statement of Cash Flows, entities are permitted but not required to separately disclose, either in the statement of cash flows or footnotes to the financial statements, cash flows pertaining to discontinued operations. Entities that do not present separate operating cash flows information related to discontinued operations must do so consistently for all periods presented, which may include periods long after the sale or liquidation of the operation. We did not have cash balances that were specific to RFPD and elected not to present separate cash flows from discontinued operations on our statement of cash flows.
Assets and liabilities classified as discontinued operations on our consolidated balance sheets as of May 31, 2014 , and June 1, 2013 , include the following ( in thousands ):
| May 31, 2014 |
| June 1, 2013 | ||||
Inventories | $ | 18 | |
| $ | 303 | |
Discontinued operations - Assets | $ | 18 | |
| $ | 303 | |
Accrued liabilities - current | $ | 7 | |
| $ | 245 | |
Accrued liabilities - non-current (1) | 130 | |
| - | | ||
Discontinued operations - Liabilities | $ | 137 | |
| $ | 245 | |
(1) | Included in accrued liabilities - non-current as of May 31, 2014, is a reserve for an income tax liability due to an ongoing audit. |
Liquidity, Financial Position, and Capital Resources
Our growth and cash needs have been primarily financed through income from operations and the proceeds from the sale of RFPD during fiscal 2011.
Cash and cash equivalents were $102.8 million at May 31, 2014 . In addition, CD's and time deposits, classified as short-term investments were $31.7 million and long-term investments were $1.5 million including equity securities of $0.5 million. Cash and investments at May 31, 2014 , consisted of $71.8 million in North America, $20.5 million in Europe, $0.9 million in Latin America, and $42.8 million in Asia/Pacific.
Cash and cash equivalents were $102.0 million at June 1, 2013 . In addition, CD's and time deposits classified as short-term investments were $38.9 million and long-term investments were $5.5 million, including equity securities of $0.4 million. Cash and investments at June 1, 2013 , consisted of $82.1 million in North America, $22.1 million in Europe, $1.2 million in Latin America, and $41.0 million in Asia/Pacific.
22
Table of Contents
Cash Flows from Discontinued Operations
In accordance with ASC 230, Statement of Cash Flows, entities are permitted but not required to separately disclose, either in the statement of cash flows or footnotes to the financial statements, cash flows pertaining to discontinued operations. Entities that do not present separate operating cash flow information related to discontinued operations must do so consistently for all periods presented, which may include periods long after the sale or liquidation of the operation.
We believe we will continue to have sufficient liquidity to fund our future growth strategies for our business in the foreseeable future.
Cash Flows from Operating Activities
Cash flow from operating activities primarily resulted from our net income, adjusted for non-cash items, and changes in our operating assets and liabilities.
Operating activities, which include our discontinued operations, provided $4.6 million of cash during fiscal 2014. We had net loss of $0.5 million during fiscal 2014, which included non-cash stock-based compensation expense of $0.8 million associated with the issuance of stock option awards primarily to our directors and officers and depreciation and amortization expense of $1.1 million associated with our property and equipment as well as amortization of our intangible assets. Changes in our operating assets and liabilities, net of effects of acquired businesses, provided $2.6 million of cash during fiscal 2014, due primarily to the decrease in our income tax receivable of $3.5 million, decrease in inventory of $1.5 million, partially offset by a decrease to our accounts payable of $2.1 million. The decrease in our inventory was the result of reduced inventory purchases during fiscal 2014 due to the decline in net sales.
Operating activities, which include our discontinued operations, provided $8.6 million of cash during fiscal 2013. We had net income of $1.2 million during fiscal 2013, which included non-cash stock-based compensation expense of $0.6 million associated with the issuance of stock option awards primarily to our directors and officers and depreciation and amortization expense of $1.1 million associated with our property and equipment as well as amortization of our intangible assets. Changes in our operating assets and liabilities, net of effects of acquired businesses, provided $7.4 million of cash during fiscal 2013, due primarily to the decrease in inventory of $2.5 million, decrease in our accounts receivable of $1.8 million, partially offset by an increase to our prepaid expenses of $0.3 million. The decrease in our inventory was the result of reduced inventory purchases during fiscal 2013 due to the decline in net sales. The decrease in our receivables of $1.8 million was due primarily to the improvement in our day sales outstanding and lower sales volume. The increase in prepaid expenses of $0.3 million was due primarily to the renewal of our liability insurance coverage.
Cash Flows from Investing Activities
The cash flow from investing activities has consisted primarily of purchases and maturities of investments and capital expenditures.
Cash provided by investing activities during fiscal 2014, included proceeds from the maturities of investments of $342.3 million, offset by the purchase of investments of $331.0 million, $1.0 million for the acquisition of WVS, and $2.8 million in capital expenditures, primarily related to a new ERP system implementation.
Cash provided by investing activities during fiscal 2013, included proceeds from the maturities of investments of $154.2 million, offset by the purchase of investments of $82.9 million, $2.6 million for the acquisition of D and C, and $1.6 million in capital expenditures.
Our purchases and proceeds from investments consist of time deposits and CDs. Purchasing of future investments may vary from period to period due to interest and foreign currency exchange rates.
Cash Flows from Financing Activities
The cash flow from financing activities primarily consists of repurchases of common stock and cash dividends paid.
Cash used in financing activities of $11.9 million during fiscal 2014 , resulted from $8.7 million of cash used to repurchase common stock and $3.3 million in dividends paid, offset by $0.2 million of proceeds from the issuance of common stock. The repurchase of common stock relates to our share repurchase authorizations. Cash dividends paid of $3.3 million were approved by the Board of Directors on July 23, 2013, October 8, 2013, January 7, 2014, and April 8, 2014.
23
Table of Contents
Cash used in financing activities of $18.4 million during fiscal 2013 , was due primarily to $15.0 million related to the repurchases of common stock and $3.6 million in cash dividends paid, offset by $0.2 million in proceeds from the issuance of common stock. The repurchase of common stock relates to our share repurchase authorizations. Cash dividends paid of $3.6 million were approved by the Board of Directors on July 23, 2012, October 8, 2012, January 8, 2013, and April 9, 2013.
Dividend payments during fiscal 2014 were approximately $3.3 million. All future payments of dividends are at the discretion of the Board of Directors. Dividend payments will depend on earnings, capital requirements, operating conditions, and such other factors that the Board may deem relevant.
Contractual Obligations
| Less than 1 year |
| 1 - 3 years |
| 3 - 5 years |
| More than 5 years |
| Total | ||||||||||
Lease obligations (1) | $ | 352 | |
| $ | 1,770 | |
| $ | 171 | |
| $ | 331 | |
| $ | 2,624 | |
IT services (2) | 1,075 | |
| - | |
| - | |
| - | |
| 1,075 | | |||||
Total | $ | 1,427 | |
| $ | 1,770 | |
| $ | 171 | |
| $ | 331 | |
| $ | 3,699 | |
|
(1) | Lease obligations are related to certain warehouse and office facilities under non-cancelable operating leases. |
(2) | IT services are related to the Transaction. |
We believe that the existing sources of liquidity, including current cash, will provide sufficient resources to meet known capital requirements and working capital needs for the fiscal year ending May 30, 2015.
Critical Accounting Policies and Estimates
The preparation of financial statements in conformity with U.S. generally accepted accounting principles ("GAAP") requires management to make significant estimates and assumptions that affect the reported amounts of assets and liabilities and disclosure of contingent assets and liabilities at the date of the financial statements and the reported amounts of revenues and expenses during the reporting period. Management continuously evaluates its critical accounting policies and estimates, including the allowance for doubtful accounts, revenue recognition, inventory obsolescence, goodwill and other intangible assets, loss contingencies, and income taxes. Management bases the estimates on historical experience and on various other assumptions believed to be reasonable under the circumstances, however, actual results could differ from those estimates.
The policies discussed below are considered by management to be critical to understanding our financial position and the results of operations. Their application involves significant judgments and estimates in preparation of our consolidated financial statements. For all of these policies, management cautions that future events rarely develop exactly as forecasted, and the best estimates routinely require adjustment.
Allowance for Doubtful Accounts
Our allowance for doubtful accounts includes estimated losses that result from uncollectible receivables. The estimates are influenced by the following: continuing credit evaluation of customers' financial conditions; aging of receivables, individually and in the aggregate; a large number of customers which are widely dispersed across geographic areas; collectability and delinquency history by geographic area; and the fact that no single customer accounts for more than 10% of net sales. Significant changes in one or more of these considerations may require adjustments affecting net income and net carrying value of accounts receivable. The allowance for doubtful accounts was approximately $0.6 million as of May 31, 2014 , and $1.1 million as of June 1, 2013 .
Revenue Recognition
Our product sales are recognized as revenue upon shipment, when title passes to the customer, when delivery has occurred or services have been rendered, and when collectability is reasonably assured. We also record estimated discounts and returns based on our historical experience. Our products are often manufactured to meet the specific design needs of our customers' applications. Our engineers work closely with customers to ensure that our products will meet their needs. Our customers are under no obligation to compensate us for designing the products we sell.
Inventories
Our worldwide inventories are stated at the lower of cost or market, generally using a weighted-average cost method. Our inventories included approximately $30.9 million of finished goods and $3.0 million of raw materials and work-in-progress as of May 31, 2014 , as compared to approximately $31.6 million of finished goods and $2.4 million of raw materials and work-in-progress as of June 1, 2013 .
24
Table of Contents
Provisions for obsolete or slow moving inventories are recorded based upon regular analysis of stock rotation privileges, obsolescence, the exiting of certain market segments, and assumptions about future demand and market conditions. If future demand, changes in the industry, or market conditions differ from management's estimates, additional provisions may be necessary.
We recorded provisions to our inventory reserves of $0.8 million, $0.4 million, and $0.4 million during fiscal 2014 , 2013 , and 2012 , respectively, which were included in cost of sales. The provisions were primarily for obsolete and slow moving parts. The parts were written down to estimated realizable value.
Goodwill and Other Intangible Assets
Goodwill is initially recorded based on the premium paid for acquisitions and is subsequently tested for impairment. We test goodwill for impairment annually and whenever events or circumstances indicate an impairment may have occurred, such as a significant adverse change in the business climate, loss of key personnel or a decision to sell or dispose of a reporting unit.
During the fourth quarter of each fiscal year, our goodwill balances are reviewed for impairment through the application of a fair-value based test, using the third quarter as the measurement date. In performing our annual review of goodwill balances for impairment, we estimate the fair value of each of our reporting units based on projected future operating results, market approach, and discounted cash flows. Projected future operating results and cash flows used for valuation purposes may reflect considerable improvements relative to historical periods with respect to, among other things, revenue growth and operating margins. Although we believe our projected future operating results and cash flows and related estimates regarding fair values are based on reasonable assumptions, historically, projected operating results and cash flows have not always been achieved. In accordance with ASC 350 "Intangibles - Goodwill and Other" , if indicators of impairment are deemed to be present, we would perform an interim impairment test and any resulting impairment loss would be charged to expense in the period identified.
Our goodwill impairment testing follows the two-step process as defined in ASC 350. The first step in the process compares the fair value of the reporting unit to its carrying value. If the carrying value of the reporting unit exceeds its fair value, the second step of the impairment test is performed to measure the amount of impairment loss to be recognized. In the second step, the fair value of the reporting unit resulting from the first step of the evaluation is allocated to the fair value of all of the assets and liabilities of the reporting unit in order to determine an implied goodwill value. This allocation is similar to the purchase price allocation performed in purchase accounting. If the carrying amount of the goodwill reported exceeds the implied goodwill value, an impairment loss should be recognized in an amount equal to that excess.
Intangible assets are initially recorded at their fair market values determined on quoted market prices in active markets, if available, or recognized valuation models. Intangible assets that have finite useful lives are amortized on a straight-line basis over their useful lives. Our intangible assets represent the fair value for trade name, customer relationships, and non-compete agreements acquired in connection with the acquisitions of Powerlink during our second quarter of fiscal 2012 and D and C acquired during our second quarter of fiscal 2013. Intangible assets fully relate to our EDG segment.
Long-Lived Assets
We review property and equipment, definite-lived intangible assets, and other long-lived assets for impairment whenever adverse events or changes in circumstances indicate that the carrying amounts of such assets may not be recoverable.
Loss Contingencies
We accrue a liability for loss contingencies when it is probable that a liability has been incurred and the amount can be reasonably estimated. When only a range of possible losses can be established, the most probable amount in the range is accrued. If no amount within this range is a better estimate than any other amount within the range, the minimum amount in the range is accrued. If we determine that there is at least a reasonable possibility that a loss may have been incurred, we will include a disclosure describing the contingency.
25
Table of Contents
Income Taxes
We recognize deferred tax assets and liabilities based on the differences between financial statement carrying amounts and the tax bases of assets and liabilities. We regularly review our deferred tax assets for recoverability and determine the need for a valuation allowance based on a number of factors, including both positive and negative evidence. These factors include historical taxable income or loss, projected future taxable income or loss, the expected timing of the reversals of existing temporary differences, and the implementation of tax planning strategies. In circumstances where we, or any of our affiliates, have incurred three years of cumulative losses which constitute significant negative evidence, positive evidence of equal or greater significance is needed to overcome the negative evidence before a tax benefit is recognized for deductible temporary differences and loss carryforwards. See Note 8 "Income Taxes" of the notes to our consolidated financial statements in Part II, Item 8 of this Annual Report on Form 10-K for further information.
New Accounting Pronouncements
In June 2014, the Financial Accounting Standards Board ("FASB") issued Accounting Standards Update ("ASU") No. 2014-12, Compensation - Stock Compensation (Topic718): Accounting for Share-Based Payments When the Terms of an Award Provide That a Performance Target Could Be Achieved after the Requisite Service Period. This ASU standardizes the reporting for these awards by requiring that entities treat these performance targets as a performance condition. As such, the performance target should not be reflected in estimating the grant-date fair value of the award. Compensation cost should be recognized in the period in which it becomes probable that the performance target will be achieved and should represent the compensation cost attributable to the period(s) for which the requisite service has already been rendered. For all entities, ASU 2014-12 is effective for annual periods and interim periods within those annual periods beginning after December 15, 2015; early adoption is permitted. We are currently evaluating the impact that the adoption of ASU 2014-11 will have on our financial condition, results of operations and disclosures.
In May 2014, the FASB issued ASU No. 2014-09, Revenue from Contracts with Customers (Topic 606). ASU 2014-09 is principles based guidance that can be applied to all contracts with customers, enhancing comparability of revenue recognition practices across entities, industries, jurisdictions and capital markets. The core principle of the guidance is that entities should recognize revenue to depict the transfer of promised goods or services to customers in an amount that reflects the consideration to which the entity expects to be entitled in exchange for those goods and services. The guidance details the steps entities should apply to achieve the core principle. For public entities, ASU 2014-09 is effective for annual reporting periods beginning after December 15, 2016, including interim periods within that reporting period; early adoption is not permitted. We are currently evaluating the impact that the adoption of ASU 2014-09 will have on our financial condition, results of operations and disclosures.
In April 2014, the FASB issued ASU No. 2014-08, Presentation of Financial Statements (Topic 205) and Property, Plant, and Equipment (Topic 360): Reporting Discontinued Operations and Disclosures of Disposals of Components of an Entity. This ASU limits discontinued operations reporting to disposals of components of an entity that represent strategic shifts that have (or will have) a major effect on an entity's operations and financial results. In addition, the amendments in this ASU require expanded disclosures for discontinued operations as well as for disposals that do not qualify as discontinued operations. For public entities, ASU 2014-08 is effective for fiscal years, and interim periods within those years, beginning on or after December 15, 2014. Early adoption is permitted for disposals that have not been reported in financial statements previously issued. We are currently evaluating the impact that the adoption of ASU 2014-08 will have on our financial condition, results of operations and disclosures.
We have evaluated and adopted the guidance of the following ASUs issued by the FASB in 2013; adopting these ASUs did not materially impact the presentation of our financial condition, results of operations and disclosures:
• | ASU No. 2013-11, Income Taxes (Topic 740): Presentation of an Unrecognized Tax Benefit When a Net Operating Loss Carryforward, a Similar Tax Loss, or a Tax Credit Carryforward Exists issued in July 2013. ASU 2013-11 standardizes the financial statement presentation of an unrecognized tax benefit when a net operating loss carryforward, a similar tax loss, or a tax credit carryforward exists; it does not require new recurring disclosures. ASU 2013-11 requires that an unrecognized tax benefit, or a portion of an unrecognized tax benefit, should be presented in the financial statements as a reduction to a deferred tax asset for a net operating loss carryforward, a similar tax loss, or a tax credit carryforward unless specific criteria exist, in which case the unrecognized tax benefit should be presented as a liability and should not be combined with deferred tax assets . |
26
Table of Contents
• | ASU No. 2013-05, Foreign Currency Matters (Topic 830): Parent's Accounting for the Cumulative Translation Adjustment upon Derecognition of Certain Subsidiaries or Groups of Assets within a Foreign Entity or of an Investment in a Foreign Entity issued in March 2013 . ASU 2013-05 provides guidance on releasing cumulative translation adjustments ("CTA") when an entity ceases to have a controlling financial interest in a subsidiary or group of assets that is a nonprofit activity or a business within a foreign entity, and also provides guidance on releasing CTA in partial sales of equity method investments and in step acquisitions. |
• | ASU No. 2013-04, Liabilities (Topic 405): Obligations Resulting from Joint and Several Liability Arrangements for Which the Total Amount of the Obligation is Fixed at the Reporting Date issued in February 2013 . The guidance in ASU 2013-04 requires entities to measure obligations resulting from joint and several liability arrangements, for which the total obligation amount is fixed at the reporting date, as the sum of the amount the reporting entity agreed to pay on the basis of its arrangement among its co-obligors and any additional amount it expects to pay on behalf of its co-obligors. ASU 2013-04 also specifies disclosure requirements. |
27
Table of Contents
ITEM 7A. Quantitative and Qualitative Disclosures about Market Risk
Risk Management and Market Sensitive Financial Instruments
We are exposed to many different market risks with the various industries we serve. The primary financial risk we are exposed to is foreign currency exchange, as certain operations, assets, and liabilities of ours are denominated in foreign currencies. We manage these risks through normal operating and financing activities.
The interpretation and analysis of these disclosures should not be considered in isolation since such variances in exchange rates would likely influence other economic factors. Such factors, which are not readily quantifiable, would likely also affect our operations. Additional disclosure regarding various market risks are set forth in Part I, Item 1A, "Risk Factors" of our Annual Report on this Form 10-K.
Foreign Currency Exposure
Even though we take into account current foreign currency exchange rates at the time an order is taken, our financial statements, denominated in a non-U.S. functional currency, are subject to foreign exchange rate fluctuations.
Our foreign denominated assets and liabilities are cash, accounts receivable, inventory, accounts payable and intercompany receivables and payables, as we conduct business in countries of the European Union, Asia/Pacific and, to a lesser extent, Canada and Latin America. We could manage foreign exchange exposures by using currency clauses in sales contracts, local debt to offset asset exposures, and forward contracts to hedge significant transactions. We have not entered into any forward contracts in fiscal 2014 , fiscal 2013 , or fiscal 2012 .
Had the U.S. dollar changed unfavorably 10% against various foreign currencies, foreign denominated net sales would have been lower by an estimated $13.8 million during fiscal 2014 , an estimated $14.1 million during fiscal 2013 , and an estimated $15.8 million during fiscal 2012 . Total assets would have declined by an estimated $26.8 million as of the fiscal year ended May 31, 2014 , and an estimated $26.1 million as of the fiscal year ended June 1, 2013 , while the total liabilities would have decreased by an estimated $0.7 million as of the fiscal year ended May 31, 2014 , and an estimated $0.9 million as of the fiscal year ended June 1, 2013 .
The interpretation and analysis of these disclosures should not be considered in isolation since such variances in exchanges rates would likely influence other economic factors. Such factors, which are not readily quantifiable, would likely also affect our operations.
28
Table of Contents
ITEM 8. Financial Statements and Supplementary Data
Richardson Electronics, Ltd.
Audited Consolidated Balance Sheets
(in thousands, except per share amounts)
| May 31, 2014 |
| June 1, 2013 | ||||
Assets |
|
|
| ||||
Current assets: |
|
|
| ||||
Cash and cash equivalents | $ | 102,752 | |
| $ | 102,002 | |
Accounts receivable, less allowance of $581 and $1,092 | 18,354 | |
| 18,268 | | ||
Inventories | 33,869 | |
| 33,975 | | ||
Prepaid expenses and other assets | 1,089 | |
| 1,155 | | ||
Deferred income taxes | 1,537 | |
| 1,856 | | ||
Income tax receivable | 2,888 | |
| 6,429 | | ||
Investments - current | 31,732 | |
| 38,971 | | ||
Discontinued operations - assets | 18 | |
| 303 | | ||
Total current assets | 192,239 | |
| 202,959 | | ||
Non-current assets: |
|
|
| ||||
Property, plant and equipment, net | 7,223 | |
| 5,073 | | ||
Goodwill | - | |
| 1,519 | | ||
Other Intangibles | 843 | |
| 908 | | ||
Non-current deferred income taxes | 1,724 | |
| 1,398 | | ||
Investments - non-current | 1,516 | |
| 5,461 | | ||
Total non-current assets | 11,306 | |
| 14,359 | | ||
Total assets | $ | 203,545 | |
| $ | 217,318 | |
Liabilities and Stockholders' Equity |
|
|
| ||||
Current liabilities: |
|
|
| ||||
Accounts payable | $ | 12,337 | |
| $ | 14,255 | |
Accrued liabilities | 9,220 | |
| 9,566 | | ||
Discontinued operations - liabilities | 7 | |
| 245 | | ||
Total current liabilities | 21,564 | |
| 24,066 | | ||
Non-current liabilities: |
|
|
| ||||
Non-current deferred income tax liability | 5,691 | |
| 6,726 | | ||
Other non-current liabilities | 1,315 | |
| 1,287 | | ||
Discontinued operations - non-current liabilities | 130 | |
| - | | ||
Total non-current liabilities | 7,136 | |
| 8,013 | | ||
Total liabilities | 28,700 | |
| 32,079 | | ||
Commitments and contingencies | - | |
| - | | ||
Stockholders' equity |
|
|
| ||||
Common stock, $0.05 par value; issued 11,835 shares at May 31, 2014, and 12,263 shares at June 1, 2013 | 592 | |
| 613 | | ||
Class B common stock, convertible, $0.05 par value; issued 2,191 shares at May 31, 2014, and 2,491 shares at June 1, 2013 | 110 | |
| 125 | | ||
Preferred stock, $1.00 par value, no shares issued | - | |
| - | | ||
Additional paid-in-capital | 66,141 | |
| 73,979 | | ||
Common stock in treasury, at cost, 1 share at May 31, 2014, and 9 shares at June 1, 2013 | (14 | ) |
| (105 | ) | ||
Retained earnings | 97,959 | |
| 101,816 | | ||
Accumulated other comprehensive income | 10,057 | |
| 8,811 | | ||
Total stockholders' equity | 174,845 | |
| 185,239 | | ||
Total liabilities and stockholders' equity | $ | 203,545 | |
| $ | 217,318 | |
29
Table of Contents
Richardson Electronics, Ltd.
Audited Consolidated Statements of Comprehensive Income (Loss)
(in thousands, except per share amounts)
| Fiscal Year Ended | ||||||||||
| May 31, 2014 |
| June 1, 2013 |
| June 2, 2012 | ||||||
Statements of Comprehensive Income (Loss) |
|
|
|
|
| ||||||
Net sales | $ | 137,960 | |
| $ | 141,066 | |
| $ | 157,836 | |
Cost of sales | 96,946 | |
| 99,521 | |
| 111,055 | | |||
Gross profit | 41,014 | |
| 41,545 | |
| 46,781 | | |||
Selling, general, and administrative expenses | 43,496 | |
| 41,536 | |
| 40,603 | | |||
Impairment of goodwill | 1,671 | |
| - | |
| - | | |||
Loss on disposal of assets | - | |
| (2 | ) |
| (77 | ) | |||
Operating income (loss) | (4,153 | ) |
| 11 | |
| 6,255 | | |||
Other (income) expense: |
|
|
|
|
| ||||||
Investment/interest income | (1,018 | ) |
| (1,306 | ) |
| (1,386 | ) | |||
Foreign exchange (gain) loss | 84 | |
| 760 | |
| (5 | ) | |||
Proceeds from legal settlement | (2,547 | ) |
| - | |
| - | | |||
Other, net | (20 | ) |
| (85 | ) |
| (10 | ) | |||
Total other income | (3,501 | ) |
| (631 | ) |
| (1,401 | ) | |||
Income (loss) from continuing operations before income taxes | (652 | ) |
| 642 | |
| 7,656 | | |||
Income tax provision (benefit) | (307 | ) |
| 160 | |
| (334 | ) | |||
Income (loss) from continuing operations | (345 | ) |
| 482 | |
| 7,990 | | |||
Income (loss) from discontinued operations, net of tax | (170 | ) |
| 766 | |
| 536 | | |||
Net income (loss) | (515 | ) |
| 1,248 | |
| 8,526 | | |||
Foreign currency translation gain (loss), net of tax | 1,216 | |
| (1,508 | ) |
| (4,227 | ) | |||
Fair value adjustments on investments gain (loss) | 30 | |
| (30 | ) |
| (40 | ) | |||
Comprehensive income (loss) | $ | 731 | |
| $ | (290 | ) |
| $ | 4,259 | |
Net income (loss) per Common share - Basic: |
|
|
|
|
| ||||||
Income (loss) from continuing operations | $ | (0.03 | ) |
| $ | 0.03 | |
| $ | 0.48 | |
Income (loss) from discontinued operations | (0.01 | ) |
| 0.05 | |
| 0.03 | | |||
Total net income (loss) per Common share - Basic: | $ | (0.04 | ) |
| $ | 0.08 | |
| $ | 0.51 | |
Net income (loss) per Class B common share - Basic: |
|
|
|
|
| ||||||
Income (loss) from continuing operations | $ | (0.02 | ) |
| $ | 0.03 | |
| $ | 0.43 | |
Income (loss) from discontinued operations | (0.01 | ) |
| 0.05 | |
| 0.03 | | |||
Total net income (loss) per Class B common share - Basic: | $ | (0.03 | ) |
| $ | 0.08 | |
| $ | 0.46 | |
Net income (loss) per Common share - Diluted: |
|
|
|
|
| ||||||
Income (loss) from continuing operations | $ | (0.03 | ) |
| $ | 0.03 | |
| $ | 0.47 | |
Income (loss) from discontinued operations | (0.01 | ) |
| 0.05 | |
| 0.03 | | |||
Total net income (loss) per Common share - Diluted: | $ | (0.04 | ) |
| $ | 0.08 | |
| $ | 0.50 | |
Net income (loss) per Class B common share - Diluted: |
|
|
|
|
| ||||||
Income (loss) from continuing operations | $ | (0.02 | ) |
| $ | 0.03 | |
| $ | 0.43 | |
Income (loss) from discontinued operations | (0.01 | ) |
| 0.05 | |
| 0.03 | | |||
Total net income (loss) per Class B common share - Diluted: | $ | (0.03 | ) |
| $ | 0.08 | |
| $ | 0.46 | |
Weighted average number of shares: |
|
|
|
|
| ||||||
Common shares - Basic | 11,915 | |
| 12,448 | |
| 14,025 | | |||
Class B common shares - Basic | 2,250 | |
| 2,790 | |
| 2,941 | | |||
Common shares - Diluted | 11,915 | |
| 15,372 | |
| 17,118 | | |||
Class B common shares - Diluted | 2,250 | |
| 2,790 | |
| 2,941 | | |||
Dividends per common share | $ | 0.240 | |
| $ | 0.240 | |
| $ | 0.200 | |
Dividends per Class B common share | $ | 0.220 | |
| $ | 0.220 | |
| $ | 0.180 | |
30
Table of Contents
Richardson Electronics, Ltd.
Audited Consolidated Statements of Cash Flows
(in thousands)
| Fiscal Year Ended | ||||||||||
| May 31, 2014 |
| June 1, 2013 |
| June 2, 2012 | ||||||
Operating activities: |
|
|
|
|
| ||||||
Net income (loss) | $ | (515 | ) |
| $ | 1,248 | |
| $ | 8,526 | |
Adjustments to reconcile net income to cash provided by (used in) operating activities: |
|
|
|
|
| ||||||
Depreciation and amortization | 1,094 | |
| 1,057 | |
| 1,112 | | |||
Gain on sale of investments | (27 | ) |
| (28 | ) |
| - | | |||
(Gain) loss on disposal of assets | - | |
| 16 | |
| (77 | ) | |||
Share-based compensation expense | 759 | |
| 619 | |
| 481 | | |||
Deferred income taxes | (1,005 | ) |
| 145 | |
| 2,855 | | |||
Impairment of goodwill | 1,671 | |
| - | |
| - | | |||
Change in assets and liabilities, net of effect of acquired businesses: |
|
|
|
|
| ||||||
Accounts receivable | 195 | |
| 1,814 | |
| 4,112 | | |||
Income tax receivable | 3,541 | |
| 143 | |
| (6,572 | ) | |||
Inventories | 1,517 | |
| 3,097 | |
| (4,429 | ) | |||
Prepaid expenses and other assets | 96 | |
| (329 | ) |
| 5,058 | | |||
Accounts payable | (2,072 | ) |
| 1,482 | |
| (4,712 | ) | |||
Accrued liabilities | (723 | ) |
| 960 | |
| (50,115 | ) | |||
Long-term income tax liabilities | 133 | |
| (1,918 | ) |
| (5,205 | ) | |||
Other | (51 | ) |
| 319 | |
| 243 | | |||
Net cash provided by (used in) operating activities | 4,613 | |
| 8,625 | |
| (48,723 | ) | |||
Investing activities: |
|
|
|
|
| ||||||
Cash consideration paid for acquired businesses | (973 | ) |
| (2,557 | ) |
| (2,291 | ) | |||
Capital expenditures | (2,781 | ) |
| (1,640 | ) |
| (218 | ) | |||
Proceeds from sale of assets | - | |
| 4 | |
| 25 | | |||
Proceeds from maturity of investments | 342,279 | |
| 154,228 | |
| 376,633 | | |||
Purchases of investments | (331,023 | ) |
| (82,898 | ) |
| (423,585 | ) | |||
Proceeds from sales of available-for-sale securities | 176 | |
| 188 | |
| 208 | | |||
Purchases of available-for-sale securities | (176 | ) |
| (188 | ) |
| (208 | ) | |||
Other | 98 | |
| 68 | |
| 39 | | |||
Net cash provided by (used in) investing activities | 7,600 | |
| 67,205 | |
| (49,397 | ) | |||
Financing activities: |
|
|
|
|
| ||||||
Repurchase of common stock | (8,739 | ) |
| (15,024 | ) |
| (23,991 | ) | |||
Proceeds from issuance of common stock | 190 | |
| 198 | |
| 807 | | |||
Cash dividends paid | (3,341 | ) |
| (3,571 | ) |
| (3,315 | ) | |||
Other | 37 | |
| - | |
| (75 | ) | |||
Net cash used in financing activities | (11,853 | ) |
| (18,397 | ) |
| (26,574 | ) | |||
Effect of exchange rate changes on cash and cash equivalents | 390 | |
| 676 | |
| (2,388 | ) | |||
Increase/ (decrease) in cash and cash equivalents | 750 | |
| 58,109 | |
| (127,082 | ) | |||
Cash and cash equivalents at beginning of period | 102,002 | |
| 43,893 | |
| 170,975 | | |||
Cash and cash equivalents at end of period | $ | 102,752 | |
| $ | 102,002 | |
| $ | 43,893 | |
Supplemental Disclosure of Cash Flow Information: |
|
|
|
|
| ||||||
Cash paid during the fiscal year for: |
|
|
|
|
| ||||||
Interest | $ | - | |
| $ | - | |
| $ | 1 | |
Income taxes | $ | 2,094 | |
| $ | 1,680 | |
| $ | 40,143 | |
31
Table of Contents
Richardson Electronics, Ltd.
Audited Consolidated Statement of Stockholders' Equity
(in thousands)
| Common | Class B Common |
| Par Value |
| Additional Paid In Capital |
| Common Stock in Treasury |
| Retained Earnings |
| Accumulated Other Comprehensive Income |
| Total | ||||||||||||||
Balance May 28, 2011: | 14,921 | | 2,952 | |
| $ | 893 | |
| $ | 112,179 | |
| $ | (1,493 | ) |
| $ | 98,927 | |
| $ | 11,541 | |
| $ | 222,047 | |
Comprehensive income |
|
|
|
|
|
|
|
|
|
|
|
|
|
| ||||||||||||||
Net income | - | | - | |
| - | |
| - | |
| - | |
| 8,526 | |
| - | |
| 8,526 | | ||||||
Foreign currency translation | - | | - | |
| - | |
| - | |
| - | |
| - | |
| (4,227 | ) |
| (4,227 | ) | ||||||
Fair value adjustments on investments | - | | - | |
| - | |
| - | |
| - | |
| - | |
| (40 | ) |
| (40 | ) | ||||||
Share-based compensation: |
|
|
|
|
|
|
|
|
|
|
|
|
|
| ||||||||||||||
Stock options | - | | - | |
| - | |
| 481 | |
| - | |
| - | |
| - | |
| 481 | | ||||||
Common stock: |
|
|
|
|
|
|
|
|
|
|
|
|
|
| ||||||||||||||
Options Exercised | 121 | | - | |
| 5 | |
| 799 | |
| (79 | ) |
| - | |
| - | |
| 725 | | ||||||
Converted Class B to Common | - | | (32 | ) |
| - | |
| - | |
| - | |
| - | |
| - | |
| - | | ||||||
Repurchase of common stock | - | | - | |
| - | |
| - | |
| (23,991 | ) |
| - | |
| - | |
| (23,991 | ) | ||||||
Treasury stock | (2,000 | ) | - | |
| (100 | ) |
| (25,242 | ) |
| 25,347 | |
| - | |
| - | |
| 5 | | ||||||
Other | 32 | | - | |
| 2 | |
| - | |
| - | |
| 1 | |
| (1 | ) |
| 2 | | ||||||
Dividends paid to: |
|
|
|
|
|
|
|
|
|
|
|
|
|
| ||||||||||||||
Common ($0.20 per share) | - | | - | |
| - | |
| - | |
| - | |
| (2,787 | ) |
| - | |
| (2,787 | ) | ||||||
Class B ($0.18 per share) | - | | - | |
| - | |
| - | |
| - | |
| (528 | ) |
| - | |
| (528 | ) | ||||||
Balance June 2, 2012: | 13,074 | | 2,920 | |
| $ | 800 | |
| $ | 88,217 | |
| $ | (216 | ) |
| $ | 104,139 | |
| $ | 7,273 | |
| $ | 200,213 | |
Comprehensive income |
|
|
|
|
|
|
|
|
|
|
|
|
|
| ||||||||||||||
Net income | - | | - | |
| - | |
| - | |
| - | |
| 1,248 | |
| - | |
| 1,248 | | ||||||
Foreign currency translation | - | | - | |
| - | |
| - | |
| - | |
| - | |
| 1,508 | |
| 1,508 | | ||||||
Fair value adjustments on investments | - | | - | |
| - | |
| - | |
| - | |
| - | |
| 30 | |
| 30 | | ||||||
Share-based compensation: |
|
|
|
|
|
|
|
|
|
|
|
|
|
| ||||||||||||||
Non-vested restricted stock | - | | - | |
| - | |
| 18 | |
| - | |
| - | |
| - | |
| 18 | | ||||||
Stock options | - | | - | |
| - | |
| 601 | |
| - | |
| - | |
| - | |
| 601 | | ||||||
Common stock: |
|
|
|
|
|
|
|
|
|
|
|
|
|
| ||||||||||||||
Employee stock option grant | - | | - | |
| - | |
| - | |
| - | |
| - | |
|
|
| - | | |||||||
Options Exercised | 31 | | - | |
| 2 | |
| 215 | |
| - | |
| - | |
| - | |
| 217 | | ||||||
Canceled Shares | - | | (354 | ) |
| - | |
| - | |
| - | |
| - | |
| - | |
| - | | ||||||
Converted Class B to Common | 200 | | - | |
| - | |
| - | |
| - | |
| - | |
| - | |
| - | | ||||||
Repurchase of common stock | - | | - | |
| - | |
| - | |
| (15,024 | ) |
| - | |
| - | |
| (15,024 | ) | ||||||
Treasury stock | (1,196 | ) | (75 | ) |
| (64 | ) |
| (15,072 | ) |
| 15,136 | |
| - | |
| - | |
| - | | ||||||
Other | 154 | | - | |
| - | |
| - | |
| (1 | ) |
| - | |
| - | |
| (1 | ) | ||||||
Dividends paid to: |
|
|
|
|
|
|
|
|
|
|
|
|
|
| ||||||||||||||
Common ($0.24 per share) | - | | - | |
| - | |
| - | |
| - | |
| (2,971 | ) |
| - | |
| (2,971 | ) | ||||||
Class B ($0.22 per share) | - | | - | |
| - | |
| - | |
| - | |
| (600 | ) |
| - | |
| (600 | ) | ||||||
Balance June 1, 2013: | 12,263 | | 2,491 | |
| $ | 738 | |
| $ | 73,979 | |
| $ | (105 | ) |
| $ | 101,816 | |
| $ | 8,811 | |
| $ | 185,239 | |
Comprehensive income |
|
|
|
|
|
|
|
|
|
|
|
|
|
| ||||||||||||||
Net loss | - | | - | |
| - | |
| - | |
| - | |
| (515 | ) |
| - | |
| (515 | ) | ||||||
Foreign currency translation | - | | - | |
| - | |
| - | |
| - | |
| - | |
| 1,216 | |
| 1,216 | | ||||||
Fair value adjustments on investments | - | | - | |
| - | |
| - | |
| - | |
| - | |
| 30 | |
| 30 | | ||||||
Share-based compensation: |
|
|
|
|
|
|
|
|
|
|
|
|
|
| ||||||||||||||
Non-vested restricted stock | - | | - | |
| - | |
| 18 | |
| - | |
| - | |
| - | |
| 18 | | ||||||
Stock options | - | | - | |
| - | |
| 741 | |
| - | |
| - | |
| - | |
| 741 | | ||||||
Common stock: |
|
|
|
|
|
|
|
|
|
|
|
|
|
| ||||||||||||||
Employee stock option grant | - | | - | |
| - | |
| - | |
| - | |
| - | |
| - | |
| - | | ||||||
Options Exercised | 32 | | - | |
| 2 | |
| 195 | |
| - | |
| - | |
| - | |
| 197 | | ||||||
Canceled Shares | - | | (300 | ) |
| - | |
| - | |
| - | |
| - | |
| - | |
| - | | ||||||
Converted Class B to Common | 300 | | - | |
| - | |
| - | |
| - | |
| - | |
| - | |
| - | | ||||||
Repurchase of common stock | - | | - | |
| - | |
| - | |
| (8,739 | ) |
| - | |
| - | |
| (8,739 | ) | ||||||
Treasury stock | (764 | ) | - | |
| (38 | ) |
| (8,791 | ) |
| 8,829 | |
| - | |
| - | |
| - | | ||||||
Other | 4 | | - | |
| - | |
| (1 | ) |
| 1 | |
| (1 | ) |
| - | |
| (1 | ) | ||||||
Dividends paid to: |
|
|
|
|
|
|
|
|
|
|
|
|
|
| ||||||||||||||
Common ($0.24 per share) | - | | - | |
| - | |
| - | |
| - | |
| (2,853 | ) |
| - | |
| (2,853 | ) | ||||||
Class B ($0.22 per share) | - | | - | |
| - | |
| - | |
| - | |
| (488 | ) |
| - | |
| (488 | ) | ||||||
Balance May 31, 2014: | 11,835 | | 2,191 | |
| $ | 702 | |
| $ | 66,141 | |
| $ | (14 | ) |
| $ | 97,959 | |
| $ | 10,057 | |
| $ | 174,845 | |
32
Table of Contents
Notes to Consolidated Financial Statements
(in thousands, except per share amounts)
1. | DESCRIPTION OF THE COMPANY |
Richardson Electronics, Ltd. ("we", "us", "the Company", and "our") is incorporated in the state of Delaware. We are a leading global provider of engineered solutions, power grid and microwave tubes and related components, and customized display solutions, serving customers in the alternative energy, aviation, broadcast, communications, industrial, marine, medical, military, scientific, and semiconductor markets. Our strategy is to provide specialized technical expertise and "engineered solutions" based on our core engineering and manufacturing capabilities. We provide solutions and add value through design-in support, systems integration, prototype design and manufacturing, testing, logistics, and aftermarket technical service and repair.
Our products include electron tubes and related components, microwave generators, subsystems used in semiconductor manufacturing, and visual technology solutions. These products are used to control, switch or amplify electrical power signals, or are used as display devices in a variety of industrial, commercial, medical, and communication applications.
2. | BASIS OF PRESENTATION |
The accompanying consolidated financial statements have been prepared in accordance with U.S. GAAP for all fiscal years presented.
The consolidated financial statements include our wholly owned subsidiaries. All intercompany transactions and account balances have been eliminated in consolidation.
Our fiscal year 2014 began on June 2, 2013, and ended on May 31, 2014 . Unless otherwise noted, all references to a particular year in this document shall mean our fiscal year.
3. | SIGNIFICANT ACCOUNTING POLICIES AND DISCLOSURES |
Use of Estimates: The preparation of financial statements in conformity with GAAP requires management to make significant estimates and assumptions that affect the reported amounts of assets and liabilities and disclosure of contingent assets and liabilities at the date of the financial statements and the reported amounts of revenues and expenses during the reporting period. Management continuously evaluates its critical accounting policies and estimates, including the allowance for doubtful accounts, revenue recognition, inventory obsolescence, goodwill and other intangible assets, loss contingencies, and income taxes. Management bases the estimates on historical experience and on various other assumptions believed to be reasonable under the circumstances, however, actual results could differ from those estimates.
Fair Values of Financial Instruments: The fair values of financial instruments are determined based on quoted market prices and market interest rates as of the end of the reporting period. Our financial instruments include investments, accounts receivable, accounts payable, and accrued liabilities. The fair values of these financial instruments were not materially different from their carrying values at May 31, 2014 , and June 1, 2013 .
Cash and Cash Equivalents: We consider short-term, highly liquid investments that are readily convertible to known amounts of cash, and so near their maturity that they present insignificant risk of changes in value because of changes in interest rates, and that have a maturity of three months or less, when purchased, to be cash equivalents. The carrying amounts reported in the balance sheet for cash and cash equivalents approximate the fair market value of these assets.
Allowance for Doubtful Accounts: Our allowance for doubtful accounts includes estimated losses that result from uncollectible receivables. The estimates are influenced by the following: continuing credit evaluation of customers' financial conditions; aging of receivables, individually and in the aggregate; a large number of customers which are widely dispersed across geographic areas; collectability and delinquency history by geographic area; and the fact that no single customer accounts for more than 10% of net sales. Significant changes in one or more of these considerations may require adjustments affecting net income and net carrying value of accounts receivable. The allowance for doubtful accounts was approximately $0.6 million as of May 31, 2014 , and $1.1 million as of June 1, 2013 .
33
Table of Contents
Loss Contingencies: We accrue a liability for loss contingencies when it is probable that a liability has been incurred and the amount can be reasonably estimated. When only a range of possible loss can be established, the most probable amount in the range is accrued. If no amount within this range is a better estimate than any other amount within the range, the minimum amount in the range is accrued. If we determine that there is at least a reasonable possibility that a loss may have been incurred, we will include a disclosure describing the contingency.
Revenue Recognition: Our product sales are recognized as revenue upon shipment, when title passes to the customer, when delivery has occurred or services have been rendered, and when collectability is reasonably assured. We also record estimated discounts and returns based on our historical experience. Our products are often manufactured to meet the specific design needs of our customers' applications. Our engineers work closely with customers to ensure that our products will meet their needs. Our customers are under no obligation to compensate us for designing the products we sell.
Foreign Currency Translation: Balance sheet items for our foreign entities, included in our consolidated balance sheet are translated into U.S. dollars at end-of-period spot rates. Gains and losses resulting from translation of foreign subsidiary financial statements are credited or charged directly to accumulated other comprehensive income/(loss), a component of stockholders' equity. Revenues and expenses are translated at the current rate on the date of the transaction. Gains and losses resulting from foreign currency transactions are included in income. Foreign currency translation reflected in our consolidated statements of comprehensive income (loss) was a loss of $0.1 million during fiscal 2014, a loss of $0.8 million during fiscal 2013, and a gain of less than $0.1 million during fiscal 2012.
Shipping and Handling Fees and Costs: Shipping and handling costs billed to customers are reported as revenue and the related costs are reported as a component of cost of sales.
Inventories: Our worldwide inventories are stated at the lower of cost or market, generally using a weighted-average cost method. Our inventories include approximately $30.9 million of finished goods and $3.0 million of raw materials and work-in-progress as of May 31, 2014 , as compared to approximately $31.6 million of finished goods and $2.4 million of raw materials and work-in-progress as of June 1, 2013 .
Provisions for obsolete or slow moving inventories are recorded based upon regular analysis of stock rotation privileges, obsolescence, the exiting of certain markets, and assumptions about future demand and market conditions. If future demand, changes in the industry, or market conditions differ from management's estimates, additional provisions may be necessary.
We recorded provisions to our inventory reserves of $0.8 million , $0.4 million , and $0.4 million during fiscal 2014 , 2013 , and 2012 , respectively, which were included in cost of sales from continuing operations. The provisions were principally for obsolete and slow moving parts. The parts were written down to estimated realizable value.
Income Taxes: We recognize deferred tax assets and liabilities based on the differences between financial statement carrying amounts and the tax bases of assets and liabilities. We regularly review our deferred tax assets for recoverability and determine the need for a valuation allowance based on a number of factors, including both positive and negative evidence. These factors include historical taxable income or loss, projected future taxable income or loss, the expected timing of the reversals of existing temporary differences, and the implementation of tax planning strategies. In circumstances where we, or any of our affiliates, have incurred three years of cumulative losses which constitute significant negative evidence, positive evidence of equal or greater significance is needed to overcome the negative evidence before a tax benefit is recognized for deductible temporary differences and loss carryforwards.
Investments: During fiscal 2014 , we invested in time deposits and certificates of deposit ("CD") in the amount of $32.7 million . Of this, $31.7 million mature in less than twelve months and $1.0 million mature in greater than twelve months. As of June 1, 2013 , we had approximately $44.0 million invested in time deposits and CD's. Of this, $39.0 million matured in less than twelve months and $5.0 million matured in greater than twelve months. The fair value of these investments is the face value of each time deposit and CD.
We also have investments in equity securities, all of which are classified as available-for-sale and are carried at their fair value based on quoted market prices. Our investments, which are included in non-current assets, had a carrying amount of $0.5 million at May 31, 2014 , and $0.4 million at June 1, 2013 . Proceeds from the sale of securities were $0.2 million during fiscal 2014 and $0.2 million during fiscal 2013 and fiscal 2012 . We reinvested proceeds from the sale of securities, and the cost of the equity securities sold was based on a specific identification method. Gross realized gains and losses on those sales were less than $0.1 million during fiscal 2014 and less than $0.1 million during fiscal 2013 and fiscal 2012 . Net unrealized holding losses during fiscal 2014 were less than $0.1 million , and during fiscal 2013 and fiscal 2012 , were $0.1 million or less, and have been included in accumulated comprehensive income (loss) during its respective fiscal year.
34
Table of Contents
Discontinued Operations: During fiscal year 2011, we completed the sale of the assets primarily used or held for use in, and certain liabilities of, our RF, Wireless and Power Division ("RFPD"), as well as certain other Company assets, including our information technology assets, to Arrow Electronics, Inc. ("Arrow") in exchange for $238.8 million, ("the Transaction"). In accordance with Accounting Standards Codification ("ASC") 205-20, Presentation of Financial Statements - Discontinued Operations ("ASC 205-20"), we reported the financial results of RFPD as a discontinued operation. Refer to Note 4 "Discontinued Operations" for additional discussion on the sale of RFPD.
Goodwill and Other Intangible Assets: Goodwill is initially recorded based on the premium paid for acquisitions and is subsequently tested for impairment. We test goodwill for impairment annually and whenever events or circumstances indicates an impairment may have occurred, such as a significant adverse change in the business climate, loss of key personnel or a decision to sell or dispose of a reporting unit.
During the fourth quarter of each fiscal year, our goodwill balances are reviewed for impairment through the application of a fair-value based test, using the third quarter as the measurement date. In performing our annual review of goodwill balances for impairment, we estimate the fair value of each of our reporting units based on projected future operating results, market approach, and discounted cash flows. Projected future operating results and cash flows used for valuation purposes may reflect considerable improvements relative to historical periods with respect to, among other things, revenue growth and operating margins. Although we believe our projected future operating results and cash flows and related estimates regarding fair values are based on reasonable assumptions, historically, projected operating results and cash flows have not always been achieved. In accordance with ASC 350 "Intangibles - Goodwill and Other" , if indicators of impairment are deemed to be present, we would perform an interim impairment test and any resulting impairment loss would be charged to expense in the period identified.
Intangible assets are initially recorded at their fair market values determined on quoted market prices in active markets, if available, or recognized valuation models. Intangible assets that have finite useful lives are amortized on a straight-line basis over their useful lives.
Property, Plant and Equipment: Property, plant and equipment are stated at cost, net of accumulated depreciation. Improvements and replacements are capitalized while expenditures for maintenance and repairs are charged to expense as incurred. Provisions for depreciation are computed using the straight-line method over the estimated useful life of the asset. Depreciation expense was approximately $1.0 million , $1.0 million , and $1.1 million during fiscal 2014 , 2013 , and 2012 , respectively. Property, plant and equipment consist of the following ( in thousands ):
| May 31, 2014 |
| June 1, 2013 | ||||
Land and improvements | $ | 1,598 | |
| $ | 1,503 | |
Buildings and improvements | 18,456 | |
| 18,384 | | ||
Computer and communications equipment (1) | 3,792 | |
| 1,676 | | ||
Construction in progress (1) | 1,377 | |
| 1,305 | | ||
Machinery and other equipment | 5,795 | |
| 4,963 | | ||
| $ | 31,018 | |
| $ | 27,831 | |
Accumulated depreciation | (23,795 | ) |
| (22,758 | ) | ||
Property, plant, and equipment, net | $ | 7,223 | |
| $ | 5,073 | |
(1) | Relates primarily to IT Infrastructure for our ERP Implementation. |
Supplemental disclosure information of the estimated useful life of the asset:
Land improvements | 10 years |
Buildings and improvements | 10 - 30 years |
Computer and communications equipment | 3 - 10 years |
Machinery and other equipment | 3 - 10 years |
We review property, plant and equipment for impairment whenever adverse events or changes in circumstances indicate that the carrying amounts of such assets may not be recoverable. We have concluded that property, plant and equipment reported as of May 31, 2014, were not impaired.
35
Table of Contents
Accrued Liabilities: Accrued liabilities consist of the following ( in thousands ):
| May 31, 2014 |
| June 1, 2013 | ||||
Compensation and payroll taxes | $ | 4,692 | |
| $ | 4,138 | |
Income taxes | 68 | |
| 1,191 | | ||
Professional fees | 560 | |
| 811 | | ||
Other accrued expenses | 3,900 | |
| 3,426 | | ||
Accrued Liabilities | $ | 9,220 | |
| $ | 9,566 | |
Warranties: We offer warranties for the limited number of specific products we manufacture. We also provide extended warranties for some products we sell that lengthen the period of coverage specified in the manufacturer's original warranty. Our warranty terms generally range from one to three years.
We estimate the cost to perform under the warranty obligation and recognize this estimated cost at the time of the related product sale. We record expense related to our warranty obligations as cost of sales in our consolidated statements of comprehensive income. Each quarter, we assess actual warranty costs incurred on a product-by-product basis and compare the warranty costs to our estimated warranty obligation. With respect to new products, estimates are based generally on knowledge of the products, the extended warranty period, and warranty experience.
Warranty reserves are established for costs that are expected to be incurred after the sale and delivery of products under warranty. Warranty reserves are included in accrued liabilities on our consolidated balance sheets. The warranty reserves are determined based on known product failures, historical experience, and other available evidence.
Changes in the warranty reserve during fiscal 2014 and 2013 were as follows ( in thousands ):
| Warranty Reserve | ||
Balance at June 2, 2012 | $ | 148 | |
Accruals for products sold | 259 | | |
Utilization | (219 | ) | |
Balance at June 1, 2013 | $ | 188 | |
Accruals for products sold | 202 | | |
Utilization | (215 | ) | |
Balance at May 31, 2014 | $ | 175 | |
Other Non-Current Liabilities: Other non-current liabilities of $1.3 million at May 31, 2014 , and $1.3 million at June 1, 2013 , primarily represent employee-benefits obligations in various non-US locations.
Share-Based Compensation: We measure and recognize compensation cost at fair value for all share-based payments, including stock options. We estimate fair value using the Black-Scholes option-pricing model, which requires assumptions such as expected volatility, risk-free interest rate, expected life, and dividends. Compensation cost is recognized using a graded-vesting schedule over the applicable vesting period, or date on which retirement eligibility is achieved, if shorter (non-substantive vesting period approach). Share-based compensation expense totaled approximately $0.8 million during fiscal 2014 , $0.6 million during fiscal 2013 , and $0.5 million during fiscal 2012 .
36
Table of Contents
Stock options granted generally vest over a period of five years and have contractual terms to exercise of 10 years . A summary of stock option activity is as follows ( in thousands, except option prices and years):
| Number of |
| Weighted |
| Weighted |
| Aggregate | |||||
Options Outstanding at May 28, 2011 | 883 | |
| $ | 8.51 | |
|
|
|
| ||
Granted | 140 | |
| 12.87 | |
|
|
|
| |||
Exercised | (121 | ) |
| 6.68 | |
|
|
|
| |||
Forfeited | (62 | ) |
| 8.91 | |
|
|
|
| |||
Cancelled | (74 | ) |
| 7.92 | |
|
|
|
| |||
Options Outstanding at June 2, 2012 | 766 | |
| $ | 9.52 | |
|
|
|
| ||
Granted | 225 | |
| 11.70 | |
|
|
|
| |||
Exercised | (31 | ) |
| 6.37 | |
|
|
|
| |||
Forfeited | (14 | ) |
| 10.40 | |
|
|
|
| |||
Cancelled | (2 | ) |
| 12.43 | |
|
|
|
| |||
Options Outstanding at June 1, 2013 | 944 | |
| $ | 10.13 | |
|
|
|
| ||
Granted | 224 | |
| 11.15 | |
|
|
|
| |||
Exercised | (32 | ) |
| 5.84 | |
|
|
|
| |||
Forfeited | (54 | ) |
| 11.73 | |
|
|
|
| |||
Cancelled | (17 | ) |
| 11.52 | |
|
|
|
| |||
Options Outstanding at May 31, 2014 | 1,065 | |
| $ | 10.37 | |
| 6.4 |
| $ | 1,189 | |
Options Vested at May 31, 2014 | 576 | |
| $ | 9.50 | |
| 4.8 |
| $ | 1,040 | |
There were 32,000 stock options exercised during fiscal 2014 , with cash received of $0.2 million . The total intrinsic value of options exercised totaled $0.2 million during fiscal 2014 , $0.1 million during fiscal 2013 , and $0.6 million during fiscal 2012 . The weighted average fair value of stock option grants was $4.53 during fiscal 2014 , $4.75 during fiscal 2013 , and $5.38 during fiscal 2012 . As of May 31, 2014 , total unrecognized compensation costs related to unvested stock options was approximately $2.1 million which is expected to be recognized over the remaining weighted average period of five years. The total grant date fair value of stock options vested during fiscal 2014 was $0.8 million .
The fair value of stock options is estimated using the Black-Scholes option-pricing model with the following weighted average assumptions:
| Fiscal Year Ended | ||||||||||
| May 31, 2014 |
| June 1, 2013 |
| June 2, 2012 | ||||||
Expected volatility | 49.31 | % |
| 50.79 | % |
| 53.91 | % | |||
Risk-free interest rate | 2.03 | % |
| 1.12 | % |
| 1.52 | % | |||
Expected lives (years) | 6.47 | |
| 6.37 | |
| 6.29 | | |||
Annual cash dividend | $ | 0.24 | |
| $ | 0.24 | |
| $ | 0.20 | |
The expected volatility assumptions are based on historical experience. The risk-free interest rate is based on the yield of a treasury note with a remaining term equal to the expected life of the stock option.
The expected stock option life assumption is based on the Securities and Exchange Commission's ("SEC") guidance in Staff Accounting Bulletin ("SAB") No. 107 ("SAB No. 107"). On December 21, 2007, the SEC issued SAB No. 110 stating that they will continue to accept SAB No. 107, past the original expiration date of December 31, 2007. For stock options granted during fiscal years 2014 , 2013 , and 2012 , we believe that our historical stock option experience does not provide a reasonable basis upon which to estimate expected term. We utilized the Safe Harbor option, or Simplified Method, to determine the expected term of these options in accordance with SAB No. 107 for options granted. We intend to continue to utilize the Simplified Method for future grants in accordance with SAB No. 110 until such time that we believe that our historical stock option experience will provide a reasonable basis to estimate an expected term.
37
Table of Contents
The following table summarizes information about stock options outstanding at May 31, 2014 ( in thousands, except option prices and years ):
| Outstanding |
| Vested | ||||||||||||||||||||||
Exercise Price Range | Shares |
| Price |
| Life |
| Aggregate Intrinsic |
| Shares |
| Price |
| Life |
| Aggregate Intrinsic | ||||||||||
$4.18 to $7.24 | 224 | |
| $ | 5.74 | |
| 4.8 |
| $ | 994 | |
| 191 | |
| $ | 5.75 | |
| 4.7 |
| $ | 845 | |
$7.32 to $11.00 | 135 | |
| $ | 8.96 | |
| 2.3 |
| $ | 195 | |
| 135 | |
| $ | 8.96 | |
| 2.3 |
| $ | 195 | |
$11.12 to $13.76 | 706 | |
| $ | 12.10 | |
| 7.7 |
| $ | - | |
| 250 | |
| $ | 12.66 | |
| 6.2 |
| $ | - | |
Total | 1,065 | |
| $ | 10.37 | |
| 6.4 |
| $ | 1,189 | |
| 576 | |
| $ | 9.50 | |
| 4.8 |
| $ | 1,040 | |
As of May 31, 2014, we had zero unvested restricted shares compared to 10,000 unvested restricted shares as of
June 1, 2013.
Compensation effects arising from issuing stock awards have been charged against income and recorded as additional paid-in-capital in the consolidated statements of stockholder's equity and were immaterial during fiscal 2014 , 2013 , and 2012 .
The Employees' 2011 Long-Term Incentive Compensation Plan authorizes the issuance of up to 750,000 shares as incentive stock options, non-qualified stock options, or stock awards. Under this plan, 359,000 shares are reserved for future issuance. The Plan authorizes the granting of stock options at the fair market value at the date of grant. Generally, these options become exercisable over five years and expire up to 10 years from the date of grant.
On June 16, 2005, our Board of Directors adopted the 2006 Stock Option Plan for Non-Employee Directors which authorizes the issuance of up to 400,000 shares as non-qualified stock options. Under this plan, 70,000 shares of common stock have been reserved for future issuance relating to stock options exercisable based on the passage of time. Each option is exercisable over a period of time from its date of grant at the market value on the grant date and expires after 10 years and one month.
Earnings per Share: We have authorized 30,000,000 shares of common stock, 10,000,000 shares of Class B common stock, and 5,000,000 shares of preferred stock. The Class B common stock has 10 votes per share and has transferability restrictions; however, Class B common stock may be converted into common stock on a share-for-share basis at any time. With respect to dividends and distributions, shares of common stock and Class B common stock rank equally and have the same rights, except that Class B common stock cash dividends are limited to 90% of the amount of Class A common stock cash dividends.
In accordance with ASC 260-10, Earnings Per Share ("ASC 260"), our Class B common stock is considered a participating security requiring the use of the two-class method for the computation of basic and diluted earnings per share. The two-class computation method for each period reflects the cash dividends paid per share for each class of stock, plus the amount of allocated undistributed earnings per share computed using the participation percentage which reflects the dividend rights of each class of stock. Basic and diluted earnings per share were computed using the two-class method as prescribed in ASC 260. The shares of Class B common stock are considered to be participating convertible securities since the shares of Class B common stock are convertible on a share-for-share basis into shares of common stock and may participate in dividends with common stock according to a predetermined formula which is 90% of the amount of Class A common stock cash dividends.
38
Table of Contents
The per share amounts presented in the consolidated statements of comprehensive income (loss) are based on the following ( amounts in thousands, except per share amounts ):
| For the Fiscal Year Ended | ||||||||||||||||||||||
| May 31, 2014 |
| June 1, 2013 |
| June 2, 2012 | ||||||||||||||||||
| Basic |
| Diluted |
| Basic |
| Diluted |
| Basic |
| Diluted | ||||||||||||
Numerator for Basic and Diluted EPS: |
|
|
|
|
|
|
|
|
|
|
| ||||||||||||
Income (loss) from continuing operations | $ | (345 | ) |
| $ | (345 | ) |
| $ | 482 | |
| $ | 482 | |
| $ | 7,990 | |
| $ | 7,990 | |
Less dividends: |
|
|
|
|
|
|
|
|
|
|
| ||||||||||||
Common stock | 2,853 | |
| 2,853 | |
| 2,971 | |
| 2,971 | |
| 2,787 | |
| 2,787 | | ||||||
Class B common stock | 488 | |
| 488 | |
| 600 | |
| 600 | |
| 528 | |
| 528 | | ||||||
Undistributed earnings (losses) | $ | (3,686 | ) |
| $ | (3,686 | ) |
| $ | (3,089 | ) |
| $ | (3,089 | ) |
| $ | 4,675 | |
| $ | 4,675 | |
Common stock undistributed earnings (losses) | $ | (3,151 | ) |
| $ | (3,151 | ) |
| $ | (2,570 | ) |
| $ | (2,575 | ) |
| $ | 3,933 | |
| $ | 3,939 | |
Class B common stock undistributed earnings (losses) | (535 | ) |
| (535 | ) |
| (519 | ) |
| (514 | ) |
| 742 | |
| 736 | | ||||||
Total undistributed earnings (losses) | $ | (3,686 | ) |
| $ | (3,686 | ) |
| $ | (3,089 | ) |
| $ | (3,089 | ) |
| $ | 4,675 | |
| $ | 4,675 | |
Income (loss) from discontinued operations | $ | (170 | ) |
| $ | (170 | ) |
| $ | 766 | |
| $ | 766 | |
| $ | 536 | |
| $ | 536 | |
Less dividends: |
|
|
|
|
|
|
|
|
|
|
| ||||||||||||
Common stock | 2,853 | |
| 2,853 | |
| 2,971 | |
| 2,971 | |
| 2,787 | |
| 2,787 | | ||||||
Class B common stock | 488 | |
| 488 | |
| 600 | |
| 600 | |
| 528 | |
| 528 | | ||||||
Undistributed earnings (losses) | $ | (3,511 | ) |
| $ | (3,511 | ) |
| $ | (2,805 | ) |
| $ | (2,805 | ) |
| $ | (2,779 | ) |
| $ | (2,779 | ) |
Common stock undistributed earnings (losses) | $ | (3,001 | ) |
| $ | (3,001 | ) |
| $ | (2,334 | ) |
| $ | (2,338 | ) |
| $ | (2,338 | ) |
| $ | (2,342 | ) |
Class B common stock undistributed earnings (losses) | (510 | ) |
| (510 | ) |
| (471 | ) |
| (467 | ) |
| (441 | ) |
| (437 | ) | ||||||
Total undistributed earnings (losses) | $ | (3,511 | ) |
| $ | (3,511 | ) |
| $ | (2,805 | ) |
| $ | (2,805 | ) |
| $ | (2,779 | ) |
| $ | (2,779 | ) |
Net income (loss) | $ | (515 | ) |
| $ | (515 | ) |
| $ | 1,248 | |
| $ | 1,248 | |
| $ | 8,526 | |
| $ | 8,526 | |
Less dividends: |
|
|
|
|
|
|
|
|
|
|
| ||||||||||||
Common stock | 2,853 | |
| 2,853 | |
| 2,971 | |
| 2,971 | |
| 2,787 | |
| 2,787 | | ||||||
Class B common stock | 488 | |
| 488 | |
| 600 | |
| 600 | |
| 528 | |
| 528 | | ||||||
Undistributed earnings (losses) | $ | (3,856 | ) |
| $ | (3,856 | ) |
| $ | (2,323 | ) |
| $ | (2,323 | ) |
| $ | 5,211 | |
| $ | 5,211 | |
Common stock undistributed earnings (losses) | $ | (3,296 | ) |
| $ | (3,296 | ) |
| $ | (1,933 | ) |
| $ | (1,937 | ) |
| $ | 4,384 | |
| $ | 4,391 | |
Class B common stock undistributed earnings (losses) | (560 | ) |
| (560 | ) |
| (390 | ) |
| (386 | ) |
| 827 | |
| 820 | | ||||||
Total undistributed earnings (losses) | $ | (3,856 | ) |
| $ | (3,856 | ) |
| $ | (2,323 | ) |
| $ | (2,323 | ) |
| $ | 5,211 | |
| $ | 5,211 | |
Denominator for basic and diluted EPS: |
|
|
|
|
|
|
|
|
|
|
| ||||||||||||
Common stock weighted average shares | 11,915 | |
| 11,915 | |
| 12,448 | |
| 12,448 | |
| 14,025 | |
| 14,025 | | ||||||
Class B common stock weighted average shares, and shares under if-converted method for diluted EPS | 2,250 | |
| 2,250 | |
| 2,790 | |
| 2,790 | |
| 2,941 | |
| 2,941 | | ||||||
Effect of dilutive securities |
|
|
|
|
|
|
|
|
|
|
| ||||||||||||
Dilutive stock options |
|
| - | |
|
|
| 134 | |
|
|
| 152 | | |||||||||
Denominator for diluted EPS adjusted for weighted average shares and assumed conversions |
|
| 14,165 | |
|
|
| 15,372 | |
|
|
| 17,118 | | |||||||||
Income (loss) from continuing operations per share: |
|
|
|
|
|
|
|
|
|
|
| ||||||||||||
Common stock | $ | (0.03 | ) |
| $ | (0.03 | ) |
| $ | 0.03 | |
| $ | 0.03 | |
| $ | 0.48 | |
| $ | 0.47 | |
Class B common stock | $ | (0.02 | ) |
| $ | (0.02 | ) |
| $ | 0.03 | |
| $ | 0.03 | |
| $ | 0.43 | |
| $ | 0.43 | |
Income (loss) from discontinued operations per share: |
|
|
|
|
|
|
|
|
|
|
| ||||||||||||
Common stock | $ | (0.01 | ) |
| $ | (0.01 | ) |
| $ | 0.05 | |
| $ | 0.05 | |
| $ | 0.03 | |
| $ | 0.03 | |
Class B common stock | $ | (0.01 | ) |
| $ | (0.01 | ) |
| $ | 0.05 | |
| $ | 0.05 | |
| $ | 0.03 | |
| $ | 0.03 | |
Net income (loss) per share: |
|
|
|
|
|
|
|
|
|
|
| ||||||||||||
Common stock | $ | (0.04 | ) |
| $ | (0.04 | ) |
| $ | 0.08 | |
| $ | 0.08 | |
| $ | 0.51 | |
| $ | 0.50 | |
Class B common stock | $ | (0.03 | ) |
| $ | (0.03 | ) |
| $ | 0.08 | |
| $ | 0.08 | |
| $ | 0.46 | |
| $ | 0.46 | |
|
Note: Common stock options that were anti-dilutive and not included in diluted earnings per common share for fiscal 2014 , fiscal 2013 , and fiscal 2012 were 489,064 ; 280,764 ; and 272,864 , respectively.
39
Table of Contents
New Accounting Pronouncements: In June 2014, the Financial Accounting Standards Board ("FASB") issued Accounting Standards Update ("ASU") No. 2014-12, Compensation - Stock Compensation (Topic718): Accounting for Share-Based Payments When the Terms of an Award Provide That a Performance Target Could Be Achieved after the Requisite Service Period. This ASU standardizes the reporting for these awards by requiring that entities treat these performance targets as a performance condition. As such, the performance target should not be reflected in estimating the grant-date fair value of the award. Compensation cost should be recognized in the period in which it becomes probable that the performance target will be achieved and should represent the compensation cost attributable to the period(s) for which the requisite service has already been rendered. For all entities, ASU 2014-12 is effective for annual periods and interim periods within those annual periods beginning after December 15, 2015; early adoption is permitted. We are currently evaluating the impact that the adoption of ASU 2014-11 will have on our financial condition, results of operations and disclosures.
In May 2014, the FASB issued ASU No. 2014-09, Revenue from Contracts with Customers (Topic 606). ASU 2014-09 is principles based guidance that can be applied to all contracts with customers, enhancing comparability of revenue recognition practices across entities, industries, jurisdictions and capital markets. The core principle of the guidance is that entities should recognize revenue to depict the transfer of promised goods or services to customers in an amount that reflects the consideration to which the entity expects to be entitled in exchange for those goods and services. The guidance details the steps entities should apply to achieve the core principle. For public entities, ASU 2014-09 is effective for annual reporting periods beginning after December 15, 2016, including interim periods within that reporting period; early adoption is not permitted. We are currently evaluating the impact that the adoption of ASU 2014-09 will have on our financial condition, results of operations and disclosures.
In April 2014, the FASB issued ASU No. 2014-08, Presentation of Financial Statements (Topic 205) and Property, Plant, and Equipment (Topic 360): Reporting Discontinued Operations and Disclosures of Disposals of Components of an Entity. This ASU limits discontinued operations reporting to disposals of components of an entity that represent strategic shifts that have (or will have) a major effect on an entity's operations and financial results. In addition, the amendments in this ASU require expanded disclosures for discontinued operations as well as for disposals that do not qualify as discontinued operations. For public entities, ASU 2014-08 is effective for fiscal years, and interim periods within those years, beginning on or after December 15, 2014. Early adoption is permitted for disposals that have not been reported in financial statements previously issued. We are currently evaluating the impact that the adoption of ASU 2014-08 will have on our financial condition, results of operations and disclosures.
We have evaluated and adopted the guidance of the following ASUs issued by the FASB in 2013; adopting these ASUs did not materially impact the presentation of our financial condition, results of operations and disclosures:
• | ASU No. 2013-11, Income Taxes (Topic 740): Presentation of an Unrecognized Tax Benefit When a Net Operating Loss Carryforward, a Similar Tax Loss, or a Tax Credit Carryforward Exists issued in July 2013. ASU 2013-11 standardizes the financial statement presentation of an unrecognized tax benefit when a net operating loss carryforward, a similar tax loss, or a tax credit carryforward exists; it does not require new recurring disclosures. ASU 2013-11 requires that an unrecognized tax benefit, or a portion of an unrecognized tax benefit, should be presented in the financial statements as a reduction to a deferred tax asset for a net operating loss carryforward, a similar tax loss, or a tax credit carryforward unless specific criteria exist, in which case the unrecognized tax benefit should be presented as a liability and should not be combined with deferred tax assets . |
• | ASU No. 2013-05, Foreign Currency Matters (Topic 830): Parent's Accounting for the Cumulative Translation Adjustment upon Derecognition of Certain Subsidiaries or Groups of Assets within a Foreign Entity or of an Investment in a Foreign Entity issued in March 2013 . ASU 2013-05 provides guidance on releasing cumulative translation adjustments ("CTA") when an entity ceases to have a controlling financial interest in a subsidiary or group of assets that is a nonprofit activity or a business within a foreign entity, and also provides guidance on releasing CTA in partial sales of equity method investments and in step acquisitions. |
• | ASU No. 2013-04, Liabilities (Topic 405): Obligations Resulting from Joint and Several Liability Arrangements for Which the Total Amount of the Obligation is Fixed at the Reporting Date issued in February 2013 . The guidance in ASU 2013-04 requires entities to measure obligations resulting from joint and several liability arrangements, for which the total obligation amount is fixed at the reporting date, as the sum of the amount the reporting entity agreed to pay on the basis of its arrangement among its co-obligors and any additional amount it expects to pay on behalf of its co-obligors. ASU 2013-04 also specifies disclosure requirements. |
40
Table of Contents
4. | DISCONTINUED OPERATIONS |
Financial Summary - Discontinued Operations
Summary financial results for fiscal 2014 , 2013 , and 2012 are presented in the following table ( in thousands ):
| Fiscal 2014 |
| Fiscal 2013 |
| Fiscal 2012 | ||||||
Net sales | $ | 402 | |
| $ | 636 | |
| $ | 2,984 | |
Gross loss (1) | (330 | ) |
| (553 | ) |
| (227 | ) | |||
Selling, general, and administrative expenses (2) | 215 | |
| 714 | |
| 552 | | |||
Additional (gain)/loss on sale | - | |
| 18 | |
| (266 | ) | |||
Income tax provision (benefit) (3) | (375 | ) |
| (2,051 | ) |
| (1,049 | ) | |||
Income (loss) from discontinued operations, net of tax | (170 | ) |
| 766 | |
| 536 | | |||
Notes:
(1) | Gross loss for fiscal year 2014 , 2013, and 2012 includes unabsorbed manufacturing labor and overhead expenses related to the Manufacturing Agreement with RFPD which ended March 1, 2014. |
(2) | Selling, General and Administrative expenses in fiscals 2014, 2013, and 2012 related primarily to professional fees for tax audits resulting from the Transaction. |
(3) | The income tax benefits in fiscal years 2014, 2013, and 2012 relates to the reversal of tax reserves. |
In accordance with ASC 230, Statement of Cash Flows, entities are permitted but not required to separately disclose, either in the statement of cash flows or footnotes to the financial statements, cash flows pertaining to discontinued operations. Entities that do not present separate operating cash flows information related to discontinued operations must do so consistently for all periods presented, which may include periods long after the sale or liquidation of the operation. We did not have cash balances that were specific to RFPD and elected not to present separate cash flows from discontinued operations on our statement of cash flows.
Assets and liabilities classified as discontinued operations on our consolidated balance sheets as of May 31, 2014 , and June 1, 2013 , include the following ( in thousands ):
| May 31, 2014 |
| June 1, 2013 | ||||
Inventories | $ | 18 | |
| $ | 303 | |
Discontinued operations - Assets | $ | 18 | |
| $ | 303 | |
Accrued liabilities - current | $ | 7 | |
| $ | 245 | |
Accrued liabilities - non-current (1) | 130 | |
| - | | ||
Discontinued operations - Liabilities | $ | 137 | |
| $ | 245 | |
(1) | Included in accrued liabilities - non-current as of May 31, 2014, relate to a reserve for an income tax liability due to an ongoing audit. |
5. | ACQUISITIONS |
On July 5, 2013, we acquired the assets of WVS for approximately $1.0 million . WVS, located in Meerbusch, Germany, develops and sells RF and microwave products, power grid tubes, vacuum capacitors, as well as industrial microwave equipment. This acquisition provides us with engineering and sales expertise to help expand our presence in the vacuum capacitor market.
The allocation of the final purchase price recorded during the first quarter of fiscal 2014, included $0.7 million of inventory and $0.3 million of fixed assets. Pro forma financial information is not presented due to immateriality.
On September 4, 2012, we acquired the assets of D and C for approximately $2.6 million . D and C, a Florida-based distributor of power grid tubes and associated RF components, services the broadcast, commercial, industrial, medical, military, and scientific markets. This acquisition provides us with access to additional product lines, vendors, and customers.
41
Table of Contents
The allocation of the final purchase price was recorded during the fourth quarter of fiscal 2013 and included $0.2 million of trade receivables, $1.5 million of inventory, $0.7 million of intangibles, and $0.2 million of goodwill. Pro forma financial information is not presented due to immateriality.
6. | GOODWILL AND OTHER INTANGIBLE ASSETS |
Changes in the carrying value of goodwill are as follows (in thousands) :
|
| TOTAL | ||
Balance at June 2, 2012 |
| $ | 1,261 | |
Premium Paid for D and C Acquisition |
| 230 | | |
Foreign currency translation |
| 28 | | |
Balance at June 1, 2013 |
| $ | 1,519 | |
Premium Paid for WVS Acquisition |
| 25 | | |
Foreign currency translation |
| 127 | | |
Impairment on goodwill |
| (1,671 | ) | |
Balance at May 31, 2014 |
| $ | - | |
Goodwill is initially recorded based on the premium paid for acquisitions and is subsequently tested for impairment, using the first day of our fourth quarter as the measurement date. We test goodwill for impairment annually and whenever events or circumstances indicates an impairment may have occurred, such as a significant adverse change in the business climate, loss of key personnel or a decision to sell or dispose of a reporting unit.
In calculating the fair value for our reporting units, we performed extensive valuation analysis, utilizing both income and market approaches. The following describes the valuation methodologies used to derive the fair value of our EDG reporting unit:
• | Income Approach : To determine the estimated fair value of each reporting unit, we discount the expected cash flows which are developed by management. We estimate our future cash flows after considering current economic conditions and trends, estimated future operating results, our views of growth rates and anticipated future economic and regulatory conditions. To estimate cash flows beyond the final year of our models, we use a terminal value approach and incorporate the present value of the resulting terminal value into our estimate of fair value. |
• | Market-Based Approach : To corroborate the results of the income approach described above, we estimate the fair value of our reporting unit using several market-based approaches, including the guideline company method, which focuses on comparing our risk profile and growth prospects to select reasonably similar publicly traded companies. |
Projected future operating results and cash flows used for valuation purposes may reflect considerable improvements relative to historical periods with respect to, among other things, revenue growth and operating margins. Although we believe our projected future operating results and cash flows and related estimates regarding fair values are based on reasonable assumptions, historically, projected operating results and cash flows have not always been achieved.
In accordance with ASC 350 "Intangibles - Goodwill and Other" , if indicators of impairment are deemed to be present, we would perform an interim impairment test and any resulting impairment loss would be charged to expense in the period identified.
The results of our goodwill impairment tests as of March 1, 2014, indicated that the value of goodwill attributed to our EDG segment was fully impaired. Certain indicators existed to suggest our EDG reporting unit was at risk of its carrying value exceeding its fair value. This included a reduction in the EDG core business as well as a reduction in our forecasted financial results due to the uncertainty with our growth initiatives. As a result, we recorded a pre-tax goodwill impairment charge of $1.7 million . Additionally, a $0.4 million tax benefit was recorded related to the goodwill impairment.
Intangible assets are initially recorded at their fair market values determined on quoted market prices in active markets, if available, or recognized valuation models. Intangible assets that have finite useful lives are amortized on a straight-line basis over their useful lives.
42
Table of Contents
Our intangible assets represent the fair value for trade name, customer relationships, and non-compete agreements acquired in connection with the acquisition of Powerlink during the second quarter of fiscal 2012 and the acquisition of D and C during the second quarter of fiscal 2013.
Intangible assets subject to amortization as well as amortization expense are as follows (in thousands) :
| Intangible Assets Subject to Amortization as of | ||||||
| May 31, 2014 |
| June 1, 2013 | ||||
Gross Amounts: |
|
|
| ||||
Trade Name | $ | 29 | |
| $ | 29 | |
Customer Relationship | 977 | |
| 947 | | ||
Non-compete Agreements | 47 | |
| 47 | | ||
Total Gross Amounts | $ | 1,053 | |
| $ | 1,023 | |
Accumulated Amortization: |
|
|
| ||||
Trade Name | $ | 18 | |
| $ | 8 | |
Customer Relationship | 178 | |
| 101 | | ||
Non-compete Agreements | 14 | |
| 6 | | ||
Total Accumulated Amortization | $ | 210 | |
| $ | 115 | |
We determined that other intangibles were not impaired on the basis of the future undiscounted cash flows expected.
The amortization expense associated with the intangible assets subject to amortization for the next five years is presented in the following table (in thousands) :
| Amortization | ||
Fiscal Year |
| ||
2015 | $ | 83 | |
2016 | 68 | | |
2017 | 58 | | |
2018 | 57 | | |
2019 | 47 | | |
Thereafter | 530 | | |
The weighted average number of years of amortization expense remaining is 16.9 years.
7. | LEASE OBLIGATIONS, OTHER COMMITMENTS, AND CONTINGENCIES |
We lease certain warehouse and office facilities and office equipment under non-cancelable operating leases. Rent expense from continuing operations for fiscal 2014 , 2013 , and 2012 was $1.5 million , $1.6 million , and $1.6 million , respectively. Under the terms of the Transaction, Arrow assumed many of our facility leases and we are sub-leasing space from Arrow. Our future lease commitments for minimum rentals, including common area maintenance charges and property taxes during the next five years have been adjusted to reflect the Transaction as follows (in thousands) :
Fiscal Year | Payments | ||
2015 | $ | 1,518 | |
2016 | 776 | | |
2017 | 133 | | |
2018 | 86 | | |
2019 | 55 | | |
Thereafter | 55 | | |
43
Table of Contents
8. | INCOME TAXES |
Income (loss) before income taxes includes the following components ( in thousands ):
| Fiscal Year Ended | ||||||||||
| May 31, 2014 |
| June 1, 2013 |
| June 2, 2012 | ||||||
United States | $ | (1,399 | ) |
| $ | (2,716 | ) |
| $ | 982 | |
Foreign | 747 | |
| 3,358 | |
| 6,674 | | |||
Income before income taxes | $ | (652 | ) |
| $ | 642 | |
| $ | 7,656 | |
The provision (benefit) for income taxes for fiscal 2014, 2013, and 2012 consists of the following ( in thousands ):
| Fiscal Year Ended | ||||||||||
| May 31, 2014 |
| June 1, 2013 |
| June 2, 2012 | ||||||
Current: |
|
|
|
|
| ||||||
Federal | $ | 214 | |
| $ | (974 | ) |
| $ | 950 | |
State | 1 | |
| 56 | |
| 2 | | |||
Foreign | 601 | |
| 970 | |
| 1,156 | | |||
Total current | $ | 816 | |
| $ | 52 | |
| $ | 2,108 | |
Deferred: |
|
|
|
|
| ||||||
Federal | $ | (585 | ) |
| $ | (213 | ) |
| $ | (2,392 | ) |
State | (169 | ) |
| 151 | |
| - | | |||
Foreign | (369 | ) |
| 170 | |
| (50 | ) | |||
Total deferred | $ | (1,123 | ) |
| $ | 108 | |
| $ | (2,442 | ) |
Income tax provision (benefit) | $ | (307 | ) |
| $ | 160 | |
| $ | (334 | ) |
The differences between income taxes at the U.S. federal statutory income tax rate of 34% and the reported income tax provision (benefit) for fiscal 2014 , 2013 , and 2012 are summarized as follows:
| Fiscal Year Ended | |||||||
| May 31, 2014 |
| June 1, 2013 |
| June 2, 2012 | |||
Federal statutory rate | 34.0 | % |
| 34.0 | % |
| 34.0 | % |
Effect of: |
|
|
|
|
| |||
State income taxes, net of federal tax benefit | 14.1 | |
| (14.5 | ) |
| 0.1 | |
Foreign income inclusion | (10.2 | ) |
| 24.7 | |
| 5.1 | |
Foreign taxes at other rates | (4.4 | ) |
| (44.6 | ) |
| (17.5 | ) |
Permanent tax differences | (3.9 | ) |
| 3.2 | |
| 1.2 | |
Intercompany items | (11.0 | ) |
| - | |
| - | |
Compensation items | (12.7 | ) |
| - | |
| - | |
Tax reserves | (7.2 | ) |
| (23.5 | ) |
| (1.6 | ) |
Additional U.S. tax on undistributed foreign earnings | 37.6 | |
| 33.8 | |
| (25.4 | ) |
Net increase in valuation allowance for deferred tax assets | (3.4 | ) |
| 18.1 | |
| - | |
Additional benefit for carryback of current year federal loss | - | |
| (6.1 | ) |
| - | |
Return to provision adjustments | 15.3 | |
| - | |
| - | |
Other | (1.2 | ) |
| (0.2 | ) |
| (0.3 | ) |
Effective tax rate | 47.0 | % |
| 24.9 | % |
| (4.4 | %) |
44
Table of Contents
Deferred income taxes reflect the net tax effect of temporary differences between the carrying amounts of assets and liabilities for financial reporting purposes and the amounts used for income tax purposes. Our deferred tax assets and liabilities reflect continuing operations as of May 31, 2014 and June 1, 2013 . Significant components are as follows ( in thousands ):
| Fiscal Year Ended | ||||||
| May 31, 2014 | | June 1, 2013 | ||||
Deferred tax assets: |
|
|
| ||||
NOL carryforwards - foreign and domestic | $ | 3,405 | |
| $ | 3,086 | |
Inventory valuations | 1,130 | |
| 935 | | ||
Goodwill | 989 | |
| 1,050 | | ||
Severance reserve | 367 | |
| 200 | | ||
Foreign capital loss | 1,093 | |
| 1,093 | | ||
Other | 2,753 | |
| 2,638 | | ||
Subtotal | $ | 9,737 | |
| $ | 9,002 | |
Valuation allowance - foreign and domestic | (4,070 | ) |
| (4,201 | ) | ||
Net deferred tax assets after valuation allowance | $ | 5,667 | |
| $ | 4,801 | |
Deferred tax liabilities: |
|
|
| ||||
Accelerated depreciation | $ | (317 | ) |
| $ | (309 | ) |
Tax on undistributed earnings | (7,031 | ) |
| (6,820 | ) | ||
Other | (659 | ) |
| (1,065 | ) | ||
Subtotal | $ | (8,007 | ) |
| $ | (8,194 | ) |
Net Deferred tax assets (liabilities) | $ | (2,340 | ) |
| $ | (3,393 | ) |
Supplemental disclosure of deferred tax assets (liabilities) information: |
|
|
| ||||
Domestic | $ | (1,797 | ) |
| $ | (2,108 | ) |
Foreign | $ | 3,527 | |
| $ | 2,916 | |
As of May 31, 2014 , we had no domestic federal net operating loss ("NOL") carryforwards. Domestic state NOL carryforwards amounted to approximately $2.3 million . Foreign NOL carryforwards totaled approximately $1.1 million with various or indefinite expiration dates. We also had no alternative minimum tax credit carryforward or foreign tax credit carryforwards as of May 31, 2014 .
We have historically determined that certain undistributed earnings of our foreign subsidiaries, to the extent of cash available, will be repatriated to the U.S. Accordingly, we have provided a deferred tax liability totaling $7.0 million and $6.8 million as of May 31, 2014 and June 1, 2013 , respectively, on foreign earnings of $41.3 million . In addition, as of May 31, 2014, $45.4 million of cumulative positive earnings of some of our foreign subsidiaries are still considered permanently reinvested pursuant to ASC 740-30, Income Taxes - Other Considerations or Special Areas ("ASC 740-30"). Due to various tax attributes that are continuously changing, it is not practical to determine what, if any, tax liability might exist if such earnings were to be repatriated.
Management assesses the available positive and negative evidence to estimate if sufficient future taxable income will be generated to use the existing deferred tax assets. A significant component of objective evidence evaluated was the cumulative income or loss incurred in each jurisdiction over the three-year period ended May 31, 2014 . On the basis of this evaluation, as of May 31, 2014 , a valuation allowance of $4.1 million has been established to record only the portion of the deferred tax asset that will more likely than not be realized. The valuation allowance relates to deferred tax assets in jurisdictions where historical taxable losses have been incurred, and domestic state NOL carryforwards related to jurisdictions where the utilization of NOLs have been suspended. The amount of the deferred tax asset considered realizable, however, could be adjusted if estimates of future taxable income during the carryforward period are reduced or increased, or if objective negative evidence in the form of cumulative losses is no longer present and additional weight may be given to subjective evidence such as our projections for growth.
Our future U.S. federal, state, and foreign effective tax rates are expected to be closer to 34.0% , 3.8% , and 27.3% , respectively.
Income taxes paid, including foreign estimated tax payments, were $2.1 million , $1.7 million , and $40.1 million during fiscal 2014 , 2013 , and 2012 , respectively.
45
Table of Contents
In the normal course of business, we are subject to examination by taxing authorities throughout the world. Generally, years prior to fiscal 2005 are closed for examination under the statute of limitation for U.S. federal, state or local, or non-U.S. tax jurisdictions. We are also currently under examination in Germany (fiscal 2009, 2010, and 2011), Italy (fiscal 2011), and Thailand (fiscal 2008 through 2011). Our primary foreign tax jurisdictions are Germany and the Netherlands. We have tax years open in Germany beginning in fiscal 2007 and the Netherlands beginning in fiscal 2008.
The uncertain tax positions as of May 31, 2014 and June 1, 2013 , totaled $0.2 million and less than $0.1 million , respectively. Unrecognized tax benefits of $0.2 million would affect our effective tax rate if recognized. The following table summarizes the activity related to the unrecognized tax benefits ( in thousands ):
| Fiscal Year Ended | ||||||
| May 31, 2014 | | June 1, 2013 | ||||
Unrecognized tax benefits, beginning of period | $ | 32 | |
| $ | 1,750 | |
Increase (decrease) due to currency translation | 7 | |
| 2 | | ||
Increase in positions taken in prior period | 163 | |
| - | | ||
Increase in positions taken in current period | - | |
| 99 | | ||
Decrease in positions due to settlements | - | |
| (1,779 | ) | ||
Decrease related to the expiration of statute of limitations | (41 | ) |
| (40 | ) | ||
Unrecognized tax benefits, end of period | $ | 161 | |
| $ | 32 | |
Unrecognized tax benefits for continuing and discontinued operations are as follows (in thousands):
| Fiscal Year Ended | ||||||
| May 31, 2014 | | June 1, 2013 | ||||
Continuing operations | $ | 66 | |
| $ | 17 | |
Discontinuing operations | 95 | |
| 15 | | ||
| $ | 161 | |
| $ | 32 | |
We record penalties and interest relating to uncertain tax positions in the income tax expense line item within the Consolidated Statements of Comprehensive Income (Loss). Accrued interest and penalties are included within the related tax liability line in the Consolidated Balance Sheets. As of May 31, 2014 and June 1, 2013 , we recorded a liability for interest and penalties of $0.1 million and less than $0.1 million , respectively.
It is not expected that there will be a change in the unrecognized tax benefits due to the expiration of various statutes of limitations within the next 12 months.
9. | EMPLOYEE BENEFIT PLANS |
Employee Profit Sharing Plan: The employee profit sharing plan is a defined contribution profit sharing plan for employees. The profit sharing plan has a 401(k) provision whereby we match 50% of employee contributions up to 4.0% of pay. Charges to expense for matching contributions to this plan were $0.3 million during fiscal 2014 and $0.2 million during fiscal 2013 and fiscal 2012 , respectively.
10. | SEGMENT AND GEOGRAPHIC INFORMATION |
In accordance with ASC 280-10, Segment Reporting , we have identified two reportable segments: EDG and Canvys.
EDG provides engineered solutions and distributes electronic components to customers in alternative energy, aviation, broadcast, communications, industrial, marine, medical, military, scientific, and semiconductor markets. EDG focuses on various applications including broadcast transmission, CO 2 laser cutting, diagnostic imaging, dielectric and induction heating, high energy transfer, high voltage switching, plasma, power conversion, radar, and radiation oncology. EDG also offers its customers technical services for both microwave and industrial equipment.
Canvys provides global customized display solutions serving the corporate enterprise, financial, healthcare, industrial, and OEM markets.
46
Table of Contents
The CEO evaluates performance and allocates resources primarily based on the gross profit of each segment.
Operating results by segment are summarized in the following table ( in thousands ):
| Fiscal Year Ended | ||||||||||
| May 31, 2014 |
| June 1, 2013 |
| June 2, 2012 | ||||||
EDG |
|
|
|
|
| ||||||
Net Sales | $ | 103,274 | |
| $ | 102,593 | |
| $ | 112,586 | |
Gross Profit | 31,610 | |
| 31,431 | |
| 34,626 | | |||
Canvys |
|
|
|
|
| ||||||
Net Sales | $ | 34,686 | |
| $ | 38,473 | |
| $ | 45,250 | |
Gross Profit | 9,404 | |
| 10,114 | |
| 12,155 | | |||
A reconciliation of assets to the relevant consolidated amount is as follows ( in thousands ):
| May 31, 2014 |
| June 1, 2013 | ||||
Segment assets | $ | 52,790 | |
| $ | 53,253 | |
Cash | 102,752 | |
| 102,002 | | ||
Investments - current | 31,732 | |
| 38,971 | | ||
Other current assets (1) | 5,790 | |
| 10,857 | | ||
Net property | 7,223 | |
| 5,073 | | ||
Investments - non-current | 1,516 | |
| 5,461 | | ||
Other assets - non-current deferred income taxes | 1,724 | |
| 1,398 | | ||
Assets of discontinued operations (2) | 18 | |
| 303 | | ||
Total assets | $ | 203,545 | |
| $ | 217,318 | |
(1) | Other current assets include miscellaneous receivables, prepaid expenses, and current deferred income taxes. |
(2) | See Note 4 "Discontinued Operations". |
Geographic net sales information is primarily grouped by customer destination into five areas: North America; Asia/Pacific; Europe; Latin America; and Other.
Net sales and gross profit by geographic region are summarized in the following table ( in thousands ):
| Fiscal Year Ended | ||||||||||
| May 31, 2014 |
| June 1, 2013 |
| June 2, 2012 | ||||||
Net Sales |
|
|
|
|
| ||||||
North America | $ | 57,137 | |
| $ | 62,269 | |
| $ | 68,980 | |
Asia/Pacific | 24,069 | |
| 22,732 | |
| 25,588 | | |||
Europe | 47,610 | |
| 45,663 | |
| 48,998 | | |||
Latin America | 8,936 | |
| 9,447 | |
| 9,870 | | |||
Other | 208 | |
| 955 | |
| 4,400 | | |||
Total | $ | 137,960 | |
| $ | 141,066 | |
| $ | 157,836 | |
Gross Profit |
|
|
|
|
| ||||||
North America | $ | 18,905 | |
| $ | 20,963 | |
| $ | 22,380 | |
Asia/Pacific | 7,849 | |
| 7,805 | |
| 9,068 | | |||
Europe | 15,506 | |
| 14,248 | |
| 15,107 | | |||
Latin America | 3,231 | |
| 3,296 | |
| 3,712 | | |||
Other | (4,477 | ) |
| (4,767 | ) |
| (3,486 | ) | |||
Total | $ | 41,014 | |
| $ | 41,545 | |
| $ | 46,781 | |
47
Table of Contents
We sell our products to customers in diversified industries and perform periodic credit evaluations of our customers' financial condition. Terms are generally on open account, payable net 30 days in North America, and vary throughout Asia/Pacific, Europe, and Latin America. Estimates of credit losses are recorded in the financial statements based on monthly reviews of outstanding accounts. Other primarily includes net sales not allocated to a specific geographical region, unabsorbed value-add costs, and other unallocated expenses.
| Fiscal Year Ended | ||||||||||
| May 31, |
| June 1, |
| June 2, | ||||||
Net Assets |
|
|
|
|
| ||||||
North America | $ | 89,549 | |
| $ | 107,976 | |
| $ | 121,475 | |
Asia/Pacific | 45,334 | |
| 43,604 | |
| 47,123 | | |||
Europe | 38,407 | |
| 36,373 | |
| 33,843 | | |||
Latin America | 2,202 | |
| 2,256 | |
| 1,571 | | |||
Total | $ | 175,492 | |
| $ | 190,209 | |
| $ | 204,012 | |
11. | LITIGATION |
We are involved in several pending judicial proceedings concerning matters arising in the ordinary course of business. While the outcome of litigation is subject to uncertainties, based on information available at the time the financial statements were issued, we determined disclosure of contingencies relating to any of our pending judicial proceedings was not necessary because there was less than a reasonable possibility that a material loss had been incurred.
During fiscal 2014, we received settlements in the amount of $2.5 million related to an antitrust class action lawsuit settlement. The settlement was recorded as proceeds from legal settlement within the Other Income section of our Consolidated Statements of Comprehensive Income (Loss).
12. | FAIR VALUE MEASUREMENTS |
ASC 820, Fair Value Measurements and Disclosures ("ASC 820"), defines fair value, establishes a framework for measuring fair value in accordance with accounting principles generally accepted in the United States, and expands disclosures about fair value measurements.
ASC 820 establishes a three-tier fair value hierarchy, which prioritizes the inputs used in measuring fair value. These tiers include: Level 1, defined as observable inputs such as quoted prices in active markets; Level 2, defined as inputs other than quoted prices in active markets that are either directly or indirectly observable; and Level 3, defined as unobservable inputs in which little or no market data exists; therefore requiring an entity to develop its own assumptions.
As of May 31, 2014 , we held investments that are required to be measured at fair value on a recurring basis. Our investments consist of time deposits and CDs, where face value is equal to fair value, and equity securities of publicly traded companies for which market prices are readily available.
Investments measured at fair value on a recurring basis subject to the disclosure requirements of ASC 820 as of May 31, 2014 and June 1, 2013 , were as follows ( in thousands ):
| Level 1 |
| Level 2 |
| Level 3 | ||||||
May 31, 2014 |
|
|
|
|
| ||||||
Time deposits/CDs | $ | 32,732 | |
| $ | - | |
| $ | - | |
Equity securities | 516 | |
| - | |
| - | | |||
Total | $ | 33,248 | |
| $ | - | |
| $ | - | |
June 1, 2013 |
|
|
|
|
| ||||||
Time deposits/CDs | $ | 43,989 | |
| $ | - | |
| $ | - | |
Equity securities | 443 | |
| - | |
| - | | |||
Total | $ | 44,432 | |
| $ | - | |
| $ | - | |
48
Table of Contents
13. | VALUATION AND QUALIFYING ACCOUNTS |
The following table presents the valuation and qualifying account activity for fiscal year ended May 31, 2014 , June 1, 2013 , and June 2, 2012 , ( in thousands ):
Description | Balance at |
| Charged to |
|
| Deductions |
|
| Balance at | ||||||||
Year ended May 31, 2014 |
|
|
|
|
|
|
|
|
| ||||||||
Allowance for doubtful accounts | $ | 1,092 | |
| $ | 114 | | (1) |
| $ | 625 | | (2) |
| $ | 581 | |
Inventory provisions | 2,715 | |
| 751 | | (3) |
| 325 | | (4) |
| 3,141 | | ||||
Year ended June 1, 2013 |
|
|
|
|
|
|
|
|
| ||||||||
Allowance for doubtful accounts | $ | 1,058 | |
| $ | 135 | | (1) |
| $ | 101 | | (2) |
| $ | 1,092 | |
Inventory provisions | 2,976 | |
| 412 | | (3) |
| 673 | | (4) |
| 2,715 | | ||||
Year ended June 2, 2012 |
|
|
|
|
|
|
|
|
| ||||||||
Allowance for doubtful accounts | $ | 438 | |
| $ | 638 | | (1) |
| $ | 18 | | (2) |
| $ | 1,058 | |
Inventory provisions | 4,519 | |
| 445 | | (3) |
| 1,988 | | (4) |
| 2,976 | | ||||
|
Notes:
(1) | Charges to bad debt expense |
(2) | Uncollectible amounts written off, net of recoveries and foreign currency translation. |
(3) | Charges to cost of sales. Included in fiscal 2014 are inventory write-downs of $0.6 million for EDG and $0.2 million for Canvys. Included in fiscal 2013 are inventory write-downs of $0.2 million for EDG and $0.2 million for Canvys. Included in fiscal 2012 are inventory write-downs of $0.2 million for EDG and $0.2 million for Canvys. |
(4) | Inventory disposed of or sold, net of foreign currency translation. |
49
Table of Contents
14. | SELECTED QUARTERLY FINANCIAL DATA |
Description | First |
| Second |
| Third |
| Fourth | ||||||||
Fiscal 2014 |
|
|
|
|
|
|
| ||||||||
Net sales | $ | 34,257 | |
| $ | 35,436 | |
| $ | 32,884 | |
| $ | 35,383 | |
Gross profit | 10,192 | |
| 11,007 | |
| 9,651 | |
| 10,164 | | ||||
Income (loss) from continuing operations | 1,979 | |
| 631 | |
| (112 | ) |
| (2,843 | ) | ||||
Income (loss) from discontinued operations | (11 | ) |
| (107 | ) |
| (420 | ) |
| 368 | | ||||
Net income (loss) | 1,968 | |
| 524 | |
| (532 | ) |
| (2,475 | ) | ||||
Income (loss) from continuing operations |
|
|
|
|
|
|
| ||||||||
Common stock - basic | $ | 0.14 | |
| $ | 0.05 | |
| $ | (0.01 | ) |
| $ | (0.21 | ) |
Class B common stock - basic | $ | 0.13 | |
| $ | 0.04 | |
| $ | (0.01 | ) |
| $ | (0.19 | ) |
Common stock - diluted | $ | 0.14 | |
| $ | 0.04 | |
| $ | (0.01 | ) |
| $ | (0.21 | ) |
Class B common stock - diluted | $ | 0.13 | |
| $ | 0.04 | |
| $ | (0.01 | ) |
| $ | (0.19 | ) |
Income (loss) from discontinued operations |
|
|
|
|
|
|
| ||||||||
Common stock - basic | $ | - | |
| $ | (0.01 | ) |
| $ | (0.03 | ) |
| $ | 0.03 | |
Class B common stock - basic | $ | - | |
| $ | (0.01 | ) |
| $ | (0.03 | ) |
| $ | 0.02 | |
Common stock - diluted | $ | - | |
| $ | (0.01 | ) |
| $ | (0.03 | ) |
| $ | 0.03 | |
Class B common stock - diluted | $ | - | |
| $ | (0.01 | ) |
| $ | (0.03 | ) |
| $ | 0.02 | |
Net income (loss) |
|
|
|
|
|
|
| ||||||||
Common stock - basic | $ | 0.14 | |
| $ | 0.04 | |
| $ | (0.04 | ) |
| $ | (0.18 | ) |
Class B common stock - basic | $ | 0.13 | |
| $ | 0.03 | |
| $ | (0.04 | ) |
| $ | (0.17 | ) |
Common stock - diluted | $ | 0.14 | |
| $ | 0.03 | |
| $ | (0.04 | ) |
| $ | (0.18 | ) |
Class B common stock - diluted | $ | 0.13 | |
| $ | 0.03 | |
| $ | (0.04 | ) |
| $ | (0.17 | ) |
Fiscal 2013 |
|
|
|
|
|
|
| ||||||||
Net sales | $ | 35,650 | |
| $ | 36,603 | |
| $ | 33,630 | |
| $ | 35,183 | |
Gross profit | 10,646 | |
| 10,742 | |
| 9,910 | |
| 10,247 | | ||||
Income (loss) from continuing operations | 734 | |
| 581 | |
| 586 | |
| (1,419 | ) | ||||
Income (loss) from discontinued operations | (87 | ) |
| (203 | ) |
| (182 | ) |
| 1,238 | | ||||
Net income (loss) | 647 | |
| 378 | |
| 404 | |
| (181 | ) | ||||
Income (loss) from continuing operations |
|
|
|
|
|
|
| ||||||||
Common stock - basic | $ | 0.05 | |
| $ | 0.04 | |
| $ | 0.04 | |
| $ | (0.10 | ) |
Class B common stock - basic | $ | 0.04 | |
| $ | 0.03 | |
| $ | 0.04 | |
| $ | (0.09 | ) |
Common stock - diluted | $ | 0.05 | |
| $ | 0.04 | |
| $ | 0.04 | |
| $ | (0.09 | ) |
Class B common stock - diluted | $ | 0.04 | |
| $ | 0.03 | |
| $ | 0.04 | |
| $ | (0.08 | ) |
Income (loss) from discontinued operations |
|
|
|
|
|
|
| ||||||||
Common stock - basic | $ | (0.01 | ) |
| $ | (0.01 | ) |
| $ | (0.01 | ) |
| $ | 0.08 | |
Class B common stock - basic | $ | - | |
| $ | (0.01 | ) |
| $ | (0.01 | ) |
| $ | 0.08 | |
Common stock - diluted | $ | (0.01 | ) |
| $ | (0.01 | ) |
| $ | (0.01 | ) |
| $ | 0.08 | |
Class B common stock - diluted | $ | - | |
| $ | (0.01 | ) |
| $ | (0.01 | ) |
| $ | 0.08 | |
Net income (loss) |
|
|
|
|
|
|
| ||||||||
Common stock - basic | $ | 0.04 | |
| $ | 0.03 | |
| $ | 0.03 | |
| $ | (0.02 | ) |
Class B common stock - basic | $ | 0.04 | |
| $ | 0.02 | |
| $ | 0.03 | |
| $ | (0.01 | ) |
Common stock - diluted | $ | 0.04 | |
| $ | 0.03 | |
| $ | 0.03 | |
| $ | (0.01 | ) |
Class B common stock - diluted | $ | 0.04 | |
| $ | 0.02 | |
| $ | 0.03 | |
| $ | - | |
50
Table of Contents
Report of Independent Registered Public Accounting Firm
The Board of Directors and Stockholders of Richardson Electronics, Ltd.:
We have audited the accompanying consolidated balance sheets of Richardson Electronics, Ltd. as of May 31, 2014 , and June 1, 2013 , and the related consolidated statements of comprehensive income (loss), stockholders' equity, and cash flows for each of the three years in the period ended May 31, 2014 . These financial statements are the responsibility of the Company's management. Our responsibility is to express an opinion on these financial statements based on our audits.
We conducted our audits in accordance with the standards of the Public Company Accounting Oversight Board (United States). Those standards require that we plan and perform the audit to obtain reasonable assurance about whether the financial statements are free of material misstatement. An audit includes examining, on a test basis, evidence supporting the amounts and disclosures in the financial statements. An audit also includes assessing the accounting principles used and significant estimates made by management, as well as evaluating the overall financial statement presentation. We believe that our audits provide a reasonable basis for our opinion.
In our opinion, the financial statements referred to above present fairly, in all material respects, the consolidated financial position of Richardson Electronics, Ltd. at May 31, 2014 , and June 1, 2013 , and the consolidated results of its operations and its cash flows for each of the three years in the period ended May 31, 2014 , in conformity with U.S. generally accepted accounting principles.
We also have audited, in accordance with the standards of the Public Company Accounting Oversight Board (United States), Richardson Electronics Ltd's internal control over financial reporting as of May 31, 2014 , based on criteria established in Internal Control-Integrated Framework issued by the Committee of Sponsoring Organizations of the Treadway Commission (1992 framework) and our report dated July 25, 2014, expressed an unqualified opinion thereon.
/s/ Ernst & Young LLP
Chicago, Illinois
July 25, 2014
51
Table of Contents
Report of Independent Registered Public Accounting Firm
The Board of Directors and Stockholders of Richardson Electronics, Ltd.:
We have audited Richardson Electronics Ltd.'s, internal control over financial reporting as of May 31, 2014 , based on criteria established in Internal Control - Integrated Framework issued by the Committee of Sponsoring Organizations of the Treadway Commission (1992 framework) (the COSO criteria). Richardson Electronics Ltd.'s management is responsible for maintaining effective internal control over financial reporting, and for its assessment of the effectiveness of internal control over financial reporting included in the accompanying Management's Report on Internal Control Over Financial Reporting. Our responsibility is to express an opinion on the company's internal control over financial reporting based on our audit.
We conducted our audit in accordance with the standards of the Public Company Accounting Oversight Board (United States). Those standards require that we plan and perform the audit to obtain reasonable assurance about whether effective internal control over financial reporting was maintained in all material respects. Our audit included obtaining an understanding of internal control over financial reporting, assessing the risk that a material weakness exists, testing and evaluating the design and operating effectiveness of internal control based on the assessed risk, and performing such other procedures as we considered necessary in the circumstances. We believe that our audit provides a reasonable basis for our opinion.
A company's internal control over financial reporting is a process designed to provide reasonable assurance regarding the reliability of financial reporting and the preparation of financial statements for external purposes in accordance with generally accepted accounting principles. A company's internal control over financial reporting includes those policies and procedures that (1) pertain to the maintenance of records that, in reasonable detail, accurately and fairly reflect the transactions and dispositions of the assets of the company; (2) provide reasonable assurance that transactions are recorded as necessary to permit preparation of financial statements in accordance with generally accepted accounting principles, and that receipts and expenditures of the company are being made only in accordance with authorizations of management and directors of the company; and (3) provide reasonable assurance regarding prevention or timely detection of unauthorized acquisition, use or disposition of the company's assets that could have a material effect on the financial statements.
Because of its inherent limitations, internal control over financial reporting may not prevent or detect misstatements. Also, projections of any evaluation of effectiveness to future periods are subject to the risk that controls may become inadequate because of changes in conditions, or that the degree of compliance with the policies or procedures may deteriorate.
In our opinion, Richardson Electronics, Ltd. maintained, in all material respects, effective internal control over financial reporting as of May 31, 2014 , based on the COSO criteria .
We also have audited, in accordance with the standards of the Public Company Accounting Oversight Board (United States), the consolidated balance sheets of Richardson Electronics, Ltd. as of May 31, 2014 , and June 1, 2013 , and the related consolidated statements of comprehensive income (loss), stockholders' equity, and cash flows for each of the three years in the period ended May 31, 2014 , of Richardson Electronics, Ltd., and our report dated July 25, 2014, expressed an unqualified opinion thereon.
/s/ Ernst & Young LLP
Chicago, IL
July 25, 2014
52
Table of Contents
ITEM 9A. | CONTROLS AND PROCEDURES |
(a) | Evaluation of Disclosure Controls and Procedures |
Management of the Company, with the participation of the Chief Executive Officer and the Chief Financial Officer, evaluated the effectiveness of the design and operation of the Company's disclosure controls and procedures (as defined in Rules 13a-15(e) and 15d-15(e) of the Securities Exchange Act of 1934, as amended (the "Exchange Act") as of May 31, 2014 . Disclosure controls and procedures are intended to provide reasonable assurance that information required to be disclosed in the Company's Exchange Act reports is recorded, processed, summarized, and reported within the time periods specified by the Securities and Exchange Commission's rules and forms, and that such information is accumulated and communicated to management, including the Company's Chief Executive Officer and Chief Financial Officer, as appropriate to allow timely decisions regarding required disclosure. Based on this evaluation, the Company's Chief Executive Officer and Chief Financial Officer have concluded that the Company's disclosure controls and procedures were effective as of May 31, 2014 .
(a) | Management's Report on Internal Control over Financial Reporting |
The Company's management is responsible for establishing and maintaining adequate internal control over financial reporting, as defined in Exchange Act Rules 13a-15(f) and 15d-15(f). Because of its inherent limitations, internal control over financial reporting may not prevent or detect misstatements. Also, projections of any evaluation of effectiveness of future periods are subject to the risk that controls may become inadequate because of changes in conditions, or that the degree of compliance with the policies or procedures may deteriorate.
A material weakness is a deficiency in internal control over financial reporting that results in more than a remote likelihood that a material misstatement of the annual or interim financial statements will not be prevented or detected.
Under the supervision of the Chief Executive Officer and Chief Financial Officer, management conducted an assessment of the effectiveness of our internal control over financial reporting as of May 31, 2014 , based on the framework in the Internal Control-Integrated Framework published by the Committee of Sponsoring Organizations of the Treadway Commission ("COSO"). Based on that assessment, management has concluded that the Company's internal control over financial reporting was effective as of May 31, 2014 .
Management's assessment of the effectiveness of our internal control over financial reporting as of May 31, 2014 , has been audited by Ernst & Young LLP, an independent registered public accounting firm, as stated in their report which is included herein.
(a) | Changes in Internal Control over Financial Reporting |
There have been no changes in the Company's internal control over financial reporting during the most recent fiscal year that have materially affected, or are reasonably likely to materially affect, the Company's internal control over financial reporting.
53
Table of Contents
ITEM 9B. | OTHER INFORMATION |
None
Results of Operation and Financial Condition and Declaration of Dividend
On July 23, 2014, we issued a press release reporting results for our fourth quarter and fiscal year ended May 31, 2014 , and the declaration of a quarterly cash dividend. A copy of the press release is furnished as Exhibit 99.1 to this Form 10-K and incorporated by reference herein.
54
Table of Contents
PART III
ITEM 10. Directors, Executive Officers and Corporate Governance
Information concerning directors and executive officers of the registrant will be contained in our Proxy Statement to be issued in connection with our Annual Meeting of Stockholders scheduled to be held on October 7, 2014, and is incorporated herein by reference.
ITEM 11. Executive Compensation
Information concerning executive compensation will be contained in our Proxy Statement to be issued in connection with our Annual Meeting of Stockholders scheduled to be held on October 7, 2014, and is incorporated herein by reference.
ITEM 12. Security Ownership of Certain Beneficial Owners and Management and Related Stockholder Matters
Information concerning security ownership of certain beneficial owners and management will be contained in our Proxy Statement to be issued in connection with our Annual Meeting of Stockholders scheduled to be held on October 7, 2014, and is incorporated herein by reference.
Equity Compensation Plan Information
The following table sets forth information as of May 31, 2014 , with respect to compensation plans under which equity securities are authorized for issuance:
Plan Category | Number of Securities to be Issued Upon Exercise of Outstanding Options, Warrants and Rights |
| Weighted Average Per Share Exercise Price of Outstanding Options, Warrants and Rights |
| Number of Securities Remaining Available for Future Issuance Under Equity Compensation Plans (Excluding Securities Reflected in the First Column) | ||||
Equity Compensation Plans Approved by Security Holders | 1,041,714 | |
| $ | 10.31 | |
| 428,959 | |
Equity Compensation Plans Not Approved by Security Holders | 23,564 | | (1) | $ | 12.95 | | (1) | - | |
Total | 1,065,278 | |
| $ | 10.37 | |
| 428,959 | |
(1) | Options issued in 1987 pursuant to an employment contract with a former officer and director of Richardson Electronics, Ltd. |
ITEM 13. Certain Relationships and Related Transactions, and Director Independence
Information concerning certain relationships and related transactions will be contained in our Proxy Statement to be issued in connection with our Annual Meeting of Stockholders scheduled to be held on October 7, 2014, and is incorporated herein by reference.
ITEM 14. Principal Accountant Fees and Services
Information concerning accountant fees and services will be contained in our Proxy Statement to be issued in connection with our Annual Meeting of Stockholders scheduled to be held on October 7, 2014, and is incorporated herein by reference.
55
Table of Contents
PART IV
ITEM 15. Exhibits and Financial Statement Schedules
(a) Exhibit
See Exhibit Index.
(b) Financial Statements and Financial Statement Schedules.
Our consolidated financial statements being filed as part of this Form 10-K are filed on Item 8 of this Form 10-K. All other schedules for which provision is made in the applicable accounting regulations of the Securities and Exchange Commission are not required under the related instructions or are inapplicable, and therefore have been omitted.
56
Table of Contents
SIGNATURES
Pursuant to the requirements of Section 13 or 15(d) of the Securities Exchange Act of 1934, the registrant has duly caused this report to be signed on its behalf by the undersigned, thereunto duly authorized.
Richardson Electronics, Ltd.
|
| Signature |
| Title |
| Date |
|
|
|
|
|
|
|
By: |
| /s/ Edward J. Richardson |
| Chairman of the Board, Chief Executive Officer (Principal Executive Officer), President, and Director |
| July 25, 2014 |
|
| Edward J. Richardson |
|
|
| |
Pursuant to the requirements of the Securities Exchange Act of 1934, this report has been signed below by the following persons on behalf of the registrant and in the capacities and on the dates indicated.
Signature |
| Title |
| Date |
|
|
| ||
/s/ Edward J. Richardson |
| Chairman of the Board, Chief Executive Officer (Principal Executive Officer), President, and Director |
| July 25, 2014 |
Edward J. Richardson |
|
|
| |
|
|
| ||
/s/ Kathleen S. Dvorak |
| Chief Financial Officer (Principal Financial Officer) |
| July 25, 2014 |
Kathleen S. Dvorak |
|
|
|
|
|
|
| ||
/s/ James M. Dudek Jr. |
| Corporate Controller and Chief Accounting Officer (Principal Accounting Officer) |
| July 25, 2014 |
James M. Dudek Jr. |
|
|
| |
|
|
| ||
/s/ Paul J. Plante |
| Director |
| July 25, 2014 |
Paul J. Plante |
|
|
|
|
|
|
| ||
/s/ Jacques Belin |
| Director |
| July 25, 2014 |
Jacques Belin |
|
|
|
|
|
|
| ||
/s/ James Benham |
| Director |
| July 25, 2014 |
James Benham |
|
|
|
|
|
|
| ||
/s/ Kenneth Halverson |
| Director |
| July 25, 2014 |
Kenneth Halverson |
|
|
|
|
|
|
| ||
/s/ Scott Hodes |
| Director |
| July 25, 2014 |
Scott Hodes |
|
|
|
|
57
Table of Contents
PART IV
ITEM 15. Exhibits and Financial Statement Schedules
(a) | List of Documents Filed as a Part of This Report: | |
| (1) | Index to Consolidated Financial Statements: |
|
| Consolidated Balance Sheets as of May 31, 2014, and June 1, 2013. |
|
| Consolidated Statements of Comprehensive Income (Loss) for each of the three years ended May 31, 2014, June 1, 2013, and June 2, 2012. |
|
| Consolidated Statements of Cash Flows for each of the three years ended May 31, 2014, June 1, 2013, and June 2, 2012. |
|
| Consolidated Statements of Stockholders' Equity for each of the three years ended May 31, 2014, June 1, 2013, and June 2, 2012. |
|
| Notes to Consolidated Financial Statements. |
|
| Report of Ernst & Young LLP, Independent Registered Public Accounting Firm. |
| (2) | Index to Financial Statement Schedules: |
| All schedules have been omitted because the required information is included in the consolidated financial statements or the notes thereto, or is not applicable or required. | |
| (3) | Index to Exhibits |
Exhibit Number | Description |
3(a) | Restated Certificate of Incorporation of the Company, (incorporated by reference to the Company's Registration Statement on Form S-4, Registration No. 33-8696, dated November 13, 1986). |
3(b) | Amended and Restated By-Laws of the Company (incorporated by reference to Exhibit 3.2 to the Company's Quarterly Report on Form 10-Q for the quarterly period ended December 3, 2011). |
3(c) | Amended and Restated By-Laws of the Company (incorporated by reference to Exhibit 3.2 to the Company's current Form 8-K filed with the SEC on October 15, 2012). |
10(a) † | Richardson Electronics, Ltd. 2011 Long-Term Incentive Plan (incorporated by reference to Annex A to the Company's Proxy Statement on Schedule 14A, filed with the Securities and Exchange Commission on August 23, 2011). |
10(e) † | Edward J. Richardson Incentive Compensation Plan (incorporated by reference to Appendix F to the Company's Proxy Statement on Schedule 14A, filed with the Securities and Exchange Commission on September 14, 2007). |
10(e)(i) † | Amended and Restated Edward J. Richardson Incentive Plan (incorporated by reference to Appendix A to the Company's Proxy Statement on Schedule 14A, filed with the SEC on August 30, 2012). |
10(f) † | Richardson Electronics, Ltd. 2006 Stock Option Plan for Non-Employee Directors (incorporated by reference to Exhibit A to the Company's Proxy Statement on Schedule 14A, filed with the Securities and Exchange Commission on September 12, 2005). |
10(g) † | Employment, Nondisclosure and Non-Compete Agreement, dated June 1, 2004, by and between the Company and Wendy Diddell (incorporated by reference to Exhibit 10.47 to the Company's Amendment No. 4 to the Registration Statement on Form S-1, Registration No. 333-113568, filed June 14, 2004). |
10(g)(i) † | First Amendment to Employment, Nondisclosure and Non-Compete Agreement, dated May 31, 2007, by and between the Company and Wendy Diddell (incorporated by reference to Exhibit 10.2 to the Company's Current Report on Form 8-K, filed with the Securities and Exchange Commission on June 6, 2007). |
10(h) † | Employment, Nondisclosure and Non-Compete Agreement, dated October 24, 2007, by and between the Company and Kathleen Dvorak (incorporated by reference to Exhibit 10.1 to the Company's Current Report on Form 8-K, filed with the Securities and Exchange Commission on October 25, 2007). |
10(j) † | Employment, Nondisclosure and Non-Compete Agreement dated June 26, 2014, by and between the Company and Gregory J. Peloquin (incorporated by reference to Exhibit 10.1 to the Company's Form 8-K filed with the SEC on June 27, 2014). |
10(k) † | Form of Non-Qualified Stock Option Agreement issued under the Richardson Electronics, Ltd. Employees' 2001 Incentive Compensation Plan (incorporated by reference to Exhibit 10(o) to the Company's Annual Report on Form 10-K for the fiscal year ended May 31, 2008). |
10(n) | Acquisition Agreement, dated October 1, 2010, among Richardson Electronics, Ltd., certain subsidiaries of Richardson Electronics, Ltd. and Arrow Electronics, Inc. (incorporated by reference to Exhibit 2.1 to the Company's Current Report on Form 8-K, filed with the Securities and Exchange Commission on October 1, 2010). |
58
Table of Contents
Exhibit Number | Description |
10(o)(i) | Amendment No. 1 to Acquisition Agreement, dated February 28, 2011, between Richardson Electronics, Ltd., and Arrow Electronics, Inc. (incorporated by reference to Exhibit 10(q)(i) to the Company's Annual Report on Form 10-K for the fiscal year ended May 28, 2011). |
14 | Corporate Code of Conduct (incorporated by reference to and Form 8-K filed on June 4, 2012). |
21 | Subsidiaries of the Company. |
23.1 | Consent of Independent Registered Public Accounting Firm - Ernst & Young LLP. |
31.1 | Certification of Edward J. Richardson pursuant to Section 302 of the Sarbanes-Oxley Act of 2002 (filed pursuant to Part I). |
31.2 | Certification of Kathleen S. Dvorak pursuant to Section 302 of the Sarbanes-Oxley Act of 2002 (filed pursuant to Part I). |
32 | Certifications pursuant to Section 906 of the Sarbanes-Oxley Act of 2002 (filed pursuant to Part I). |
99.1 | Press release, dated July 23, 2014. |
101 | The following financial information from our Annual Report on Form 10-K for the fourth quarter and fiscal year ended May 31, 2014, filed with the SEC on July 25, 2014, formatted in Extensible Business Reporting Language (XBRL): (i) the Audited Consolidated Balance Sheet as of May 31, 2014, (ii) the Audited Consolidated Statements of Income and Comprehensive Income (Loss) for the three months and 12 months ended May 31, 2014, (iii) the Audited Consolidated Statements of Cash Flows for the three and 12 months ended May 31, 2014, (iv) the Audited Consolidated Statement of Stockholder's Equity as of May 31, 2014, and (v) Notes to Audited Consolidated Financial Statements. |
|
† | Executive Compensation Plan or Agreement |
59