UNITED STATES
SECURITIES AND EXCHANGE COMMISSION
Washington, D.C. 20549
FORM 10-K
| X | ANNUAL REPORT PURSUANT TO SECTION 13 OR 15(d) OF THE SECURITIES EXCHANGE ACT OF 1934 |
For the fiscal year ended March 2, 2013 .
OR
TRANSITION REPORT PURSUANT TO SECTION 13 OR 15(d) OF THE SECURITIES EXCHANGE ACT OF 1934
For the transition period from to
Commission File No. 001-07832
PIER 1 IMPORTS, INC.
(Exact name of registrant as specified in its charter)
DELAWARE | 75-1729843 | |
(State or other jurisdiction of incorporation or organization) | (I.R.S. Employer Identification No.) | |
100 Pier 1 Place Fort Worth, Texas | 76102 | |
(Address of principal executive offices) | (Zip Code) | |
Company's telephone number, including area code: (817) 252-8000
Securities registered pursuant to Section 12(b) of the Act:
Title of each class | Name of each exchange on which registered | |
Common Stock, $0.001 par value | New York Stock Exchange |
Securities registered pursuant to Section 12(g) of the Act: None
Indicate by check mark if the registrant is a well-known seasoned issuer, as defined in Rule 405 of the Securities Act. Yes X No
Indicate by check mark if the registrant is not required to file reports pursuant to Section 13 or Section 15(d) of the Act. Yes No X
Indicate by check mark whether the registrant (1) has filed all reports required to be filed by Section 13 or 15(d) of the Securities Exchange Act of 1934 during the preceding 12 months (or for such shorter period that the registrant was required to file such reports), and (2) has been subject to such filing requirements for the past 90 days. Yes X No
Indicate by check mark whether the registrant has submitted electronically and posted on its corporate Web site, if any, every Interactive Data File required to be submitted and posted pursuant to Rule 405 Regulation S-T during the preceding 12 months (or for such shorter period that the registrant was required to submit and post such files). Yes X No
Indicate by check mark if disclosure of delinquent filers pursuant to Item 405 of Regulation S-K is not contained herein, and will not be contained, to the best of the registrant's knowledge, in definitive proxy or information statements incorporated by reference in Part III of this Form 10-K or any amendment to this Form 10-K. [X]
Indicate by check mark whether the registrant is a large accelerated filer, an accelerated filer, a non-accelerated filer, or a smaller reporting company. See the definitions of "large accelerated filer," "accelerated filer" and "smaller reporting company" in Rule 12b-2 of the Exchange Act.
Large accelerated filer X | Accelerated filer | |||||
Non-accelerated filer | (Do not check if a smaller reporting company) | Smaller reporting company |
Indicate by check mark whether the registrant is a shell company (as defined in Rule 12b-2 of the Act). Yes No X
The aggregate market value of the voting stock held by non-affiliates of the registrant, computed by reference to the closing price as of the last business day of the registrant's most recently completed second fiscal quarter, August 25, 2012, was approximately $1,894,825,000. The registrant has no non-voting common stock.
As of April 23, 2013, there were outstanding 106,998,203 shares of the registrant's common stock, all of one class.
DOCUMENTS INCORPORATED BY REFERENCE
Portions of the following documents have been incorporated herein by reference:
| 1) | Registrant's Proxy Statement for the 2013 Annual Meeting in Part III hereof. |
PIER 1 IMPORTS, INC.
FORM 10-K ANNUAL REPORT
Fiscal Year Ended March 2, 2013
TABLE OF CONTENTS
| PART I | PAGE | |||||||
Item | 1. | Business. | 1 | |||||
Item | 1A. | Risk Factors. | 5 | |||||
Item | 1B. | Unresolved Staff Comments. | 12 | |||||
Item | 2. | Properties. | 12 | |||||
Item | 3. | Legal Proceedings. | 13 | |||||
Item | 4. | Mine Safety Disclosures. | 13 | |||||
| PART II | ||||||||
Item | 5. | Market for the Registrant's Common Equity, Related Stockholder Matters and Issuer Purchases of Equity Securities. | 14 | |||||
Item | 6. | Selected Financial Data. | 17 | |||||
Item | 7. | Management's Discussion and Analysis of Financial Condition and Results of Operations. | 18 | |||||
Item | 7A. | Quantitative and Qualitative Disclosures About Market Risk. | 31 | |||||
Item | 8. | Financial Statements and Supplementary Data. | 32 | |||||
Item | 9. | Changes in and Disagreements with Accountants on Accounting and Financial Disclosure. | 56 | |||||
Item | 9A. | Controls and Procedures. | 56 | |||||
Item | 9B. | Other Information. | 59 | |||||
| PART III | ||||||||
Item | 10. | Directors, Executive Officers and Corporate Governance. | 59 | |||||
Item | 11. | Executive Compensation. | 59 | |||||
Item | 12. | Security Ownership of Certain Beneficial Owners and Management and Related Stockholder Matters. | 59 | |||||
Item | 13. | Certain Relationships and Related Transactions, and Director Independence. | 59 | |||||
Item | 14. | Principal Accounting Fees and Services. | 59 | |||||
| PART IV | ||||||||
Item | 15. | Exhibits, Financial Statement Schedules. | 60 | |||||
PART I
| Item 1. | Business . |
| (a) | General Development of Business. |
Pier 1 Imports, Inc. was incorporated as a Delaware corporation in 1986. Throughout this report, references to the "Company" include Pier 1 Imports, Inc. and its consolidated subsidiaries. References to "Pier 1 Imports" relate to the Company's retail locations and e-Commerce operations conducting business under the name Pier 1 Imports ® .
As of March 2, 2013, the Company had 1,062 stores in the United States and Canada. In fiscal 2013, the Company opened 22 new Pier 1 Imports stores and closed 12 stores. Subject to changes in the retail environment, availability of suitable store sites, and lease renewal negotiations, the Company plans to open approximately 30 new Pier 1 Imports stores and close 14 stores during fiscal 2014. During fiscal 2013, the Company also refurbished approximately 100 stores with a new merchandise fixture package and lighting upgrades, completed major remodels at four locations, and added some new fixtures throughout all stores. The Company operates regional distribution center facilities in or near Baltimore, Maryland; Columbus, Ohio; Fort Worth, Texas; Ontario, California; Savannah, Georgia; and Tacoma, Washington. At the end of July 2012, the Company successfully executed the launch of its new e-Commerce enabled website, Pier1.com.
The Company has an arrangement to supply Grupo Sanborns, S.A. de C.V. ("Grupo Sanborns") with Pier 1 Imports merchandise to be sold primarily in a "store within a store" format in certain stores operated by Grupo Sanborns' subsidiaries, Sears Operadora de Mexico, S.A. de C.V. ("Sears Mexico") and Corporacion de Tiendas Internationales, S.A. de C.V. ("Sears El Salvador"). The agreements with Grupo Sanborns will expire January 1, 2017. The agreements are structured in a manner which substantially insulates the Company from currency fluctuations in the value of the Mexican peso. As of March 2, 2013, Pier 1 Imports merchandise was offered in 49 Sears Mexico stores and one Sears El Salvador store. Since Sears Mexico and Sears El Salvador operate these locations, the Company has no employees or real estate obligations in Mexico or El Salvador.
| (b) | Financial Information about Industry Segments . |
In fiscal 2013, the Company conducted business as one operating segment consisting of the retail sales of decorative home furnishings, gifts and related items.
Financial information with respect to the Company's business is found in the Company's Consolidated Financial Statements, which are set forth in Item 8 herein.
| (c) | Narrative Description of Business . |
The specialty retail operations of the Company consist of retail stores and e-Commerce operations conducting business under the name "Pier 1 Imports," which sell a wide variety of furniture, decorative home furnishings, dining and kitchen goods, candles, gifts and other specialty items for the home.
As of March 2, 2013, the Company operated 982 Pier 1 Imports stores in the United States and 80 Pier 1 Imports stores in Canada. During fiscal 2013, the Company supplied merchandise and licensed the Pier 1 Imports name to Grupo Sanborns, which sold Pier 1 Imports merchandise primarily in a "store within a store" format in 49 Sears Mexico stores and one store in El Salvador. Pier 1 Imports stores in the United States and Canada average approximately 9,900 gross square feet, which includes an average of approximately 7,900 square feet of retail selling space. The stores consist of freestanding units located near shopping centers or malls and in-line
1
positions in major shopping centers. Pier 1 Imports operates in all major U.S. metropolitan areas and many of the primary smaller markets. Pier 1 Imports stores generally have their highest sales volumes during November and December as a result of the holiday selling season. In fiscal 2013, net sales of the Company totaled $1.7 billion.
Pier 1 Imports offers a unique selection of merchandise consisting of items imported from many countries around the world. While the broad categories of Pier 1 Imports' merchandise remain fairly constant, individual items within these merchandise categories change frequently in order to meet the changing demands and preferences of customers. The principal categories of merchandise include the following:
DECORATIVE ACCESSORIES – This merchandise group constitutes the broadest category of merchandise in Pier 1 Imports' sales mix and has remained constant at 61% of Pier 1 Imports' total U.S. and Canadian retail sales in fiscal years 2013, 2012, and 2011. These items are imported primarily from Asian and European countries, as well as some domestic sources. This merchandise group includes decorative accents, lamps, vases, dried and artificial flowers, baskets, ceramics, dinnerware, bath and fragrance products, candles, seasonal and gift items.
FURNITURE – This merchandise group consists of furniture and furniture cushions to be used in living, dining, office, kitchen and bedroom areas, sunrooms and on patios. Also included in this group are wall decorations and mirrors. This group has remained constant at 39% of Pier 1 Imports' total U.S. and Canadian retail sales in fiscal years 2013, 2012, and 2011. These goods are imported from a variety of countries such as Vietnam, Malaysia, Brazil, Thailand, China, the Philippines, India and Indonesia, and are also obtained from domestic sources. This merchandise group is generally made of metal or handcrafted natural materials, including rattan, pine, beech, rubberwood and selected hardwoods with either natural, stained, painted or upholstered finishes.
Pier 1 Imports merchandise largely consists of items that feature a significant degree of handcraftsmanship and are mostly imported directly from foreign suppliers. For the most part, the imported merchandise is handcrafted in cottage industries and small factories. Pier 1 Imports has enjoyed long-standing relationships with many vendors and agents and is not dependent on any particular supplier. The Company believes alternative sources of merchandise could be procured over a reasonable period of time, if necessary. In selecting the source of merchandise, Pier 1 Imports considers quality, dependability of delivery, and cost. During fiscal 2013, Pier 1 Imports sold merchandise imported from many different countries with approximately 58.6% of its sales derived from merchandise produced in China, approximately 12.8% derived from merchandise produced in India, and approximately 19.3% collectively derived from merchandise produced in Vietnam, Indonesia, and the United States. The remainder of its merchandise is sourced from other countries around the world.
Imported and domestic merchandise is delivered to the Company's distribution centers, where merchandise is received, allocated and shipped to the various stores in each distribution center's region, and/or shipped directly to customers.
The Company owns a number of federally registered trademarks and service marks under which Pier 1 Imports stores conduct business. Additionally, the Company has registered and has applications pending for the registration of certain other Pier 1 Imports trademarks and service marks in the United States, Canada and other foreign countries. The Company believes that its marks have significant value and are important in its marketing efforts. The Company maintains a policy of pursuing registration of its marks and opposing any infringement of its marks.
The Company operates in the highly competitive specialty home retail business, both in its stores and e-Commerce business, and competes primarily with specialty sections of large department stores, furniture and decorative home furnishings retailers, small specialty stores and mass merchandising discounters.
2
The Company allows customers to return merchandise within a reasonable time after the date of purchase without limitation as to reason. Most returns occur within 30 days of the date of purchase. The Company monitors the level of returns and maintains a reserve for future returns based on historical experience and other known factors.
On March 2, 2013, the Company employed approximately 21,400 associates in the United States and Canada, of which approximately 3,700 were full-time employees and 17,700 were part-time employees.
| (d) | Financial Information about Geographic Areas. |
Information required by this Item is found in Note 1 of the Notes to the Consolidated Financial Statements .
| (e) | Available Information . |
The Company makes available free of charge through its Internet website address ( www.pier1.com ) its annual reports on Form 10-K, quarterly reports on Form 10-Q, current reports on Form 8-K, and amendments to those reports filed with the Securities and Exchange Commission (the "SEC") pursuant to Section 13(a) of the Securities Exchange Act of 1934 as soon as reasonably practicable after it electronically files such material with, or furnishes such material to, the SEC.
Certain statements contained in Item 1, Item 1A, Item 7, Item 7A, Item 8 and elsewhere in this report may constitute "forward-looking statements" within the meaning of Section 27A of the Securities Act of 1933 and Section 21E of the Securities Exchange Act of 1934. The Company may also make forward-looking statements in other reports filed with the SEC and in material delivered to the Company's shareholders. Forward-looking statements provide current expectations of future events based on management's assumptions and assessments in light of past experience and trends, current economic and industry conditions, expected future developments, and other relevant factors. These statements encompass information that does not directly relate to any historical or current fact and often may be identified with words such as "anticipates," "believes," "expects," "estimates," "intends," "plans," "projects" and other similar expressions. Management's expectations and assumptions regarding planned store openings and closings, financing of Company obligations from operations, success of its marketing, merchandising and store operations strategies, its e-Commerce business, and other future results are subject to risks, uncertainties and other factors that could cause actual results to differ materially from the anticipated results or other expectations expressed in the forward-looking statements. Risks and uncertainties that may affect Company operations and performance include, among others, the effects of terrorist attacks or other acts of war, conflicts or war involving the United States or its allies or trading partners, labor strikes, weather conditions or natural disasters, volatility of fuel and utility costs, the actions taken by the United States and other countries to stimulate the economy, the general strength of the economy and levels of consumer spending, consumer confidence, suitable store sites and distribution center locations, the availability of a qualified labor force and management, the availability and proper functioning of technology and communications systems supporting the Company's key business processes, the ability of the Company to import merchandise from foreign countries without significantly restrictive tariffs, duties or quotas, and the ability of the Company to source, ship and deliver items of acceptable quality to its U.S. distribution centers at reasonable prices and rates and in a timely fashion. The foregoing risks and uncertainties are in addition to others discussed elsewhere in this report which may also affect Company operations and performance. The Company assumes no obligation to update or otherwise revise its forward-looking statements even if experience or future changes make it clear that any projected results expressed or implied will not be realized.
3
Executive Officers of the Company
ALEXANDER W. SMITH, age 60, joined the Company as President and Chief Executive Officer in February 2007. Prior to joining the Company, Mr. Smith served as group president of the TJX Companies, Inc., where he oversaw the operations and development of Home Goods, Marshalls, TJ Maxx, and a number of corporate functions. He was instrumental in the development of the TK Maxx stores in Great Britain and also ran their international operations.
CHARLES H. TURNER, age 56, was named Senior Executive Vice President of the Company in April 2012 and has served as Chief Financial Officer of the Company since August 1999. Mr. Turner has served the Company for twenty-one years in key executive capacities within the organization including Executive Vice President, Senior Vice President of Stores and Controller. Mr. Turner first became an officer of the Company in 1992 when he was named Principal Accounting Officer. Prior to joining the Company, he was Group Controller for JC Penney and a Senior Manager for KPMG Peat Marwick.
CATHERINE DAVID, age 49, joined the organization in August 2009 as Executive Vice President of Merchandising. Prior to her current role, Ms. David served as President and Chief Operating Officer of Kirkland's Inc. and Vice President and General Manager with Sears Essential, Sears Grand and The Great Indoors. Ms. David also previously served the Target Corporation for thirteen years in various positions including Vice President and General Manager of target.direct and various positions in the buying, planning and stores divisions.
GREGORY S. HUMENESKY, age 61, was named Executive Vice President of Human Resources of the Company in February 2005. Prior to his current position, he served in various human resource positions for other retailers, including ten years as Senior Vice President of Human Resources at Zale Corporation and twenty-one years in various positions of increasing importance at Macy's.
SHARON M. LEITE, age 50, joined the organization in August 2007 as Executive Vice President of Stores. Prior to joining the Company, she spent eight years at Bath & Body Works, six years as Vice President of Store Operations and two years in other leadership roles. Before joining Bath & Body Works, Ms. Leite held various operations positions with several prominent retailers, including Gap, Inc., The Walt Disney Company, and Limited, Inc.
MICHAEL R. BENKEL, age 44, was named Executive Vice President of Planning and Allocations in April 2012. He joined the organization in September 2008 as Senior Vice President of Planning and Allocations. Prior to joining the Company, he spent eleven years at Williams-Sonoma Inc. in continuously advancing positions in the Pottery Barn Retail Stores division, including Vice President of Inventory Management, Director – Inventory Management, and as a home furnishings and furniture buyer.
MICHAEL A. CARTER, age 54, was named Senior Vice President, General Counsel and Secretary of the Company in December 2005. Mr. Carter has served within the organization for twenty-three years in various leadership capacities, including Vice President – Legal Affairs, and Corporate Counsel. Mr. Carter first became an officer of the Company in 1991 when he was named Assistant Secretary. Mr. Carter is a licensed attorney in the State of Texas. Prior to joining the Company, Mr. Carter practiced law with the Fort Worth, Texas law firm of Brackett and Ellis, LLP.
LAURA A. COFFEY, age 46, was named Senior Vice President of Business Development and Strategic Planning in January 2011. Ms. Coffey has served within the organization for sixteen years in various capacities, including most recently as Senior Vice President of Finance. Ms. Coffey first became an officer of the Company in 2005 and was named Principal Accounting Officer in 2008. Prior to joining the Company, she held various positions with Alcon Laboratories and KPMG, LLP.
4
DONALD L. KINNISON, age 55, was named Senior Vice President of Marketing and Visual Merchandising in March 2008. Mr. Kinnison has served within the organization for twenty-three years in various capacities, including Vice President of Visual Merchandising and Merchandise Support and Director, Visual Merchandising. Prior to joining the Company, Mr. Kinnison held various positions with May Company and Federated Department Stores.
The executive officers of the Company are elected by the Board of Directors and hold office until their successors are elected or appointed and qualified or until their earlier resignation or removal. None of the above executive officers has any family relationship with any other of such officers or with any director of the Company. None of such officers was selected pursuant to any arrangement or understanding between her or him and any other person, except for Mr. Smith, who pursuant to his employment agreement with the Company, serves as President and Chief Executive Officer.
| Item 1A. | Risk Factors . |
Strategic Risks and Strategy Execution Risks
The Company must be able to anticipate, identify and respond to changing trends and customer preferences for home furnishings.
The success of the Company's specialty retail business depends largely upon its ability to predict trends in home furnishings consistently and to provide merchandise that satisfies consumer demand in a timely manner. Consumer preferences often change and may not be reasonably predicted. A majority of the Company's merchandise is manufactured, purchased and imported from countries around the world and may be ordered well in advance of the applicable selling season. Extended lead times may make it difficult to respond rapidly to changes in consumer demand, and as a result, the Company may be unable to react quickly and source needed merchandise. In addition, the Company's vendors may not have the ability to handle its increased demand for product. The seasonal nature of the business leads the Company to purchase, and requires it to carry, a significant amount of inventory prior to its peak selling season. As a result, the Company may be vulnerable to evolving home furnishing trends, changes in customer preferences, and pricing shifts, and may misjudge the timing and selection of merchandise purchases. The Company's failure to anticipate, predict and respond in a timely manner to changing home furnishing trends could lead to lower sales and additional discounts and markdowns in an effort to clear merchandise, which could have a negative impact on merchandise margins and, in turn, the results of operations.
Failure by the Company to identify and successfully implement strategic initiatives could have a negative impact on the Company.
The Company's long-term growth, strategic plans and capital allocation strategies are dependent on the Company's ability to identify and successfully implement those initiatives. If they are not properly developed and successfully executed, the implementation of such initiatives may negatively impact the Company's business operations and financial results. While the Company believes these disruptions would be short-term, it is unknown whether the impact would be material.
The success of the business is dependent on factors affecting consumer spending that are not controllable by the Company.
Consumer spending, including spending for the home and home-related furnishings, are dependent upon factors other than general economic conditions (both domestic and international), and include, among others, levels of employment, disposable consumer income, prevailing interest rates, consumer debt, costs of fuel, inflation, recession and fears of recession or actual recession periods, war and fears of war, pandemics, inclement
5
weather, tax rates and rate increases, consumer confidence in future economic conditions and political conditions (including the possibility of a governmental shut down), and consumer perceptions of personal well-being and security. Unfavorable changes in factors affecting discretionary spending could reduce demand for the Company's products and therefore lower sales and negatively impact the business and its financial results.
The Company outsources certain business processes to third-party vendors and has certain business relationships that subject the Company to risks, including disruptions in business and increased costs.
The Company outsources some business processes to third parties including gift card tracking and authorization, credit card authorization and processing, store scheduling and time and attendance, store maintenance services, maintenance and support of the Company's website and e-Commerce platform, certain marketing services, insurance claims processing, customs filings and reporting, ocean freight processing, shipment and delivery of e-Commerce orders, certain payroll processing and various tax filings, record keeping for retirement plans, and third party vendor auditing. In addition, the Company also has business relationships with third parties to provide essential services such as the extension of credit to its customers and maintenance of the Company's private-label credit card and rewards program. The Company makes a diligent effort to ensure that all providers of these services are observing proper internal control practices, such as redundant processing facilities; however, there are no guarantees that failures will not occur. Failure of third parties to provide adequate services or the Company's inability to arrange for alternative providers on favorable terms in a timely manner could have a negative effect on the Company's financial results.
An overall decline in the health of the United States economy and its impact on consumer confidence and spending could negatively impact the Company's results of operations.
The recession experienced by the United States in recent years resulted in a significant decline in the market value of domestic and foreign companies, adversely affecting the savings and investments of United States consumers. The resulting deterioration in consumer confidence and spending during that recessionary period resulted in consumers sacrificing purchases of discretionary items, including the Company's merchandise, which negatively impacted the Company's financial results during those years. Such a recession could occur again and could have a similar, if not worse, impact on the Company's financial results.
Failure to control merchandise returns could negatively impact the business.
The Company has established a provision for estimated merchandise returns based upon historical experience and other known factors. If actual returns are greater than those projected by management, additional reductions of revenue could be recorded in the future. Also, to the extent that returned merchandise is damaged, the Company may not receive full retail value from the resale of the returned merchandise. Introductions of new merchandise, changes in merchandise mix, associate selling behavior, merchandise quality issues, changes to the Company's return policy, e-Commerce return behavior, changes in consumer confidence, or other competitive and general economic conditions may cause actual returns to exceed the provision for estimated merchandise returns. An increase in merchandise returns that exceeds the Company's current provisions could negatively impact the business and financial results.
A disruption in the operation of the domestic portion of the Company's supply chain, including the e-Commerce business, could impact its ability to deliver merchandise to its stores and customers, which could impact its sales and results of operations.
The Company maintains regional distribution centers in Maryland, Ohio, Texas, California, Georgia and Washington. At these distribution centers, merchandise is received, allocated, and shipped to the Company's stores, and/or e-Commerce orders are fulfilled. Major catastrophic events such as natural disasters, fire or flooding, malfunction or disruption of the information systems, a disruption in telephone/internet service or
6
power outages, or shipping problems could result in distribution delays of merchandise to the Company's stores and customers. Such disruptions could have a negative impact on the Company's sales and results of operations.
Factors that may or may not be controllable by the Company may negatively affect the Company's financial results.
Increases in the Company's costs that are beyond the Company's control, including items such as increases in fuel and transportation costs, higher interest rates, increases in losses from damaged merchandise, inflation, fluctuations in foreign currency rates, higher costs of labor, labor disputes around the world, increases in the costs of insurance and healthcare, increases in postage and media costs, higher tax rates and complying with changes in laws and regulations, including accounting standards, may negatively impact the Company's financial results.
Failure to successfully manage and execute the Company's marketing initiatives could have a negative impact on the business.
The success and growth of the Company is partially dependent on generating customer traffic in order to gain sales momentum in its stores and drive traffic to the Company's website. Successful marketing efforts require the ability to reach customers through their desired mode of communication utilizing various media outlets. Media placement decisions are generally made months in advance of the scheduled release date. The Company's inability to accurately predict its consumers' preferences, to utilize the desired mode of communication, or to ensure availability of advertised products may negatively impact the business and operating results.
Changes to estimates related to the Company's property and equipment, or financial results that are lower than its current estimates at certain store locations, may cause the Company to incur impairment charges on certain long-lived assets.
The Company makes certain estimates and projections with regards to individual store operations as well as overall Company performance in connection with its impairment analyses for long-lived assets in accordance with applicable accounting guidance. An impairment charge is required when the carrying value of the asset exceeds the estimated fair value or undiscounted future cash flows of the asset. The projection of future cash flows used in this analysis requires the use of judgment and a number of estimates and projections of future operating results. If actual results differ from the Company's estimates, additional charges for asset impairments may be required in the future. If impairment charges are significant, the Company's financial results could be negatively affected.
Risks Related to Profitability
The Company's success depends, in part, on its ability to operate in desirable locations at reasonable rental rates and to close underperforming stores at or before the conclusion of their lease terms.
The profitability of the business is dependent on operating the current store base at a reasonable profit, opening and operating new stores at a reasonable profit, and identifying and closing underperforming stores. For a majority of the Company's current store base, a large portion of a store's operating expense is the cost associated with leasing the location. Management actively monitors individual store performance and attempts to negotiate rent reductions to ensure stores can remain profitable or have the ability to rebound to a profitable state. Current locations may not continue to be desirable as demographics change, and the Company may choose to close an underperforming store before its lease expires and incur lease termination costs associated with that closing. The Company cannot give assurance that opening new stores or an increase in closing underperforming stores will result in greater profits.
7
Failure to attract and retain an effective management team or changes in the costs or availability of a suitable workforce to manage and support the Company's stores, distribution facilities and e-Commerce business could negatively affect the business.
The Company's success is dependent, in a large part, on being able to successfully attract, motivate and retain a qualified management team and employees. Sourcing qualified candidates to fill important positions within the Company, especially management, in the highly competitive retail environment may prove to be a challenge. The inability to recruit and retain such individuals could result in turnover in the home office, stores and the distribution facilities, which could have a negative effect on the business. Management will continue to assess the Company's compensation and benefit program in an effort to attract future qualified candidates and retain current experienced management team members. The Company does not believe that its compensation policies, principles, objectives and practices are structured to promote inappropriate risk taking by its executives nor inappropriate risk-taking by its employees whose behavior would be most affected by performance-based incentives. The Company believes that the focus of its overall compensation program encourages its employees to take a balanced approach that focuses on increasing and sustaining Pier 1 Imports' profitability.
Occasionally the Company experiences union organizing activities in non-unionized distribution facilities. Similar activities could also occur in the stores. These types of activities may result in work slowdowns or stoppages and higher labor costs. Any increase in costs associated with labor organization at distribution facilities could result in higher costs to distribute inventory and could negatively impact merchandise margins.
Failure to successfully manage the Company's e-Commerce operations could negatively affect the business.
The Company successfully executed the launch of its e-Commerce operations in the United States during fiscal 2013. Successful operation of the e-Commerce initiatives are dependent on the Company's ability to maintain uninterrupted availability of the Company's website and supporting applications, adequate inventory levels, timely fulfillment of customer orders, and accurate shipping of undamaged product. In addition, the Company's call center must maintain a high standard of customer care. Failure to successfully manage this process may negatively impact sales, result in the loss of customers, and damage the Company's reputation.
The Company operates in a highly competitive retail environment with companies offering similar merchandise, and if customers are lost to the Company's competitors, sales could decline.
The Company operates in the highly competitive specialty retail business, both in its stores and e-Commerce business, competing with specialty sections of large department stores, home furnishing retailers, small specialty stores and mass merchandising discounters. Management believes that as it is competing for sales, it does so on the basis of pricing and quality of products, constantly changing merchandise assortment, visual presentation of its merchandise and customer service. The Company could also experience added short-term competition when other retailers are liquidating merchandise for various reasons. If the Company is unable to maintain a competitive position, it could experience negative pressure on retail prices and loss of customers, which in turn could result in reduced merchandise margins and operating results.
The Company's business is subject to seasonal variations, with a significant portion of its sales and earnings occurring during two months of the year.
Approximately 25% of the Company's sales generally occur during the November-December holiday selling season. Failure to predict consumer demand correctly during these months could result in lost sales or gross margin erosion if merchandise must be marked down significantly to clear inventory.
The Company's business may be harmed by adverse weather conditions and natural disasters.
Extreme or undesirable weather can negatively affect customer traffic in retail stores as well as customer shopping behavior. Natural disasters such as earthquakes, weather phenomena, and events causing infrastructure
8
failures could negatively affect any of the Company's retail locations, distribution centers, administrative facilities, ports, or locations of its suppliers domestically and in foreign countries.
Risks Associated with Dependence on Technology
The Company is heavily dependent on various kinds of technology in the operation of its business.
Failure of any critical software applications, technology infrastructure, telecommunications, data communications, data storage equipment, or networks could have a negative effect, including additional expense, on the Company's ability to manage the merchandise supply chain, sell merchandise, accomplish payment functions, report financial data or manage labor and staffing. Although the Company maintains off-site data backups, a concentration of technology-related risk exists in the Company's headquarters located in Fort Worth, Texas.
Failure to protect the integrity and security of individually identifiable data of the Company's customers and employees could expose the Company to litigation and damage the Company's reputation.
The Company receives and maintains certain personal information about its customers, vendors and employees. The collection and use of this information by the Company is regulated at the international, federal and state levels, and is subject to certain contractual restrictions in third party contracts. Although the Company has implemented processes to collect and protect the integrity and security of personal information, there can be no assurance that this information will not be obtained by unauthorized persons, or collected or used inappropriately. If the security and information systems of the Company or of its internal or external business associates are compromised or its internal or external business associates fail to comply with these laws and regulations and this information is obtained by unauthorized persons, or collected or used inappropriately, it could negatively affect the Company's reputation, as well as operations and financial results, and could result in litigation against the Company or the imposition of penalties. As privacy and information security laws and regulations change, the Company may incur additional costs to remain in compliance.
Failure to successfully implement new information technology systems and enhance existing systems could negatively impact the business and its financial results.
As part of the Company's growth plan, the Company is investing in new information technology systems and implementing modifications and upgrades to existing systems. These investments include replacing legacy systems, making changes to existing systems, building redundancies, and acquiring new systems and hardware with updated functionality. The Company is taking appropriate actions to ensure the successful implementation of these initiatives, including the testing of new systems and the transfer of existing data, with minimal disruptions to the business. However, there can be no assurance the Company has anticipated all potential risks and failure to successfully implement these initiatives could negatively impact the business and its financial results.
The expansion of the Company's e-Commerce business has inherent cybersecurity risks that may disrupt its business.
The Company's full e-Commerce functionality in the United States has increased the Company's exposure to cybersecurity risks. A compromise of its security systems could result in a service disruption, or customers' personal information or the Company's proprietary information being obtained by unauthorized users. Although the Company has implemented processes to mitigate the risks of security breaches and cyber incidents, there can be no assurance that such an attack will not occur. Any breach of the Company's security could result in violation of privacy laws, potential litigation, and a loss of confidence in its security measures, all of which could have a negative impact on the Company's financial results and its reputation.
9
Failure to maintain positive brand perception and recognition could have a negative impact on the business.
Maintaining a good reputation is critical to the business. The considerable expansion in the use of social media over recent years has increased the risk that the Company's reputation could be negatively impacted in a short amount of time. If the Company is unable to quickly and effectively respond to such incidents, it may suffer declines in customer loyalty and traffic, vendor relationship issues, and other factors, all of which could negatively impact the Company's financial results and its reputation.
Regulatory Risks
The Company is subject to laws and regulatory requirements in many jurisdictions. Changes in these laws and requirements, or interpretations of them, may result in additional costs to the Company, including the costs of compliance as well as potential penalties for non-compliance.
Legislation on a local, regional, state or national level has the potential to have a negative effect on the Company's profitability or ability to operate its business. Compliance with certain legislation carries with it significant costs. The Company is subject to oversight by many governmental agencies in the course of operating its business because of its numerous locations, large number of employees, contact with consumers and importation and exportation of product. In addition, the Company is subject to regulations regarding consumer product quality and safety standards. Complying with regulations may cause the Company to incur significant expenses, including the costs associated with periodic audits. Failure to comply may also result in additional costs in the form of penalties.
The Company operates in many taxing jurisdictions, including foreign countries. In most of these jurisdictions, the Company is required to collect state and local sales taxes at the point of sale and remit them to the appropriate taxing authority. The Company is also subject to income taxes, excise taxes, franchise taxes, payroll taxes and other special taxes. The Company is also required to maintain various kinds of business and commercial licenses to operate its stores and other facilities. Rates of taxation are beyond the Company's control, and increases in such rates or taxation methods and rules could have a negative impact on the Company's financial results. Failure to comply with laws concerning the collection and remittance of taxes and with licensing requirements could also subject the Company to financial penalties or business interruptions.
Risks Associated with International Trade
As a retailer of imported merchandise, the Company is subject to certain risks that typically do not affect retailers of domestically produced merchandise.
The Company may order merchandise well in advance of delivery and generally takes title to the merchandise at the time it is loaded for transport to designated U.S. destinations. Global political unrest, war, threats of war, terrorist acts or threats, especially threats to foreign and U.S. ports and piracy, disruption in the operation of the international portion of the Company's supply chain, or natural disasters could affect the Company's ability to import merchandise from certain countries. Fluctuations in foreign currency exchange rates and the relative value of the U.S. dollar, restrictions on the convertibility of the dollar and other currencies, duties, taxes and other charges on imports, rising labor costs and cost of living in foreign countries, dock strikes, worker strikes, import quota systems and other restrictions sometimes placed on foreign trade can affect the price, delivery and availability of imported merchandise as well as exports to the Company's stores in other countries. The inability to import merchandise from China and other countries, unavailability of adequate shipping capacity at reasonable rates, or the imposition of significant tariffs could have a negative effect on the financial results of the Company. Freight costs contribute a substantial amount to the cost of imported merchandise. Monitoring of foreign vendors' compliance with applicable laws and Company standards, including quality and safety standards and social compliance issues, is more difficult than monitoring of domestic vendors.
10
Governmental agencies have the authority to enforce trade agreements, resolve trade disputes, and control market access to goods and services. Governments may also impose trade sanctions on foreign countries that are deemed to violate trade agreements or maintain laws or practices that are unjustifiable and restrict commerce. In these situations, governments may increase duties on imports from one or more foreign countries. In this event, the Company could be negatively affected by the imposition of trade sanctions.
In addition, the governments of the countries in which the Company does business maintain a variety of additional international trade laws under which the Company's ability to import may be affected from time to time, including antidumping laws, countervailing duty laws, safeguards laws, and laws designed to protect intellectual property rights. Although the Company may not be directly involved in a particular trade dispute under any of these laws, its ability to import, or the terms and conditions under which it can continue to import, may be affected by the outcome of such disputes.
In particular, because the Company imports merchandise from countries around the world, the Company may be affected from time to time by antidumping petitions filed with the United States and international agencies by U.S. producers of competing products alleging that foreign manufacturers are selling their own products at prices in the United States that are less than the prices that they charge in their home country market or in third country markets or at less than their cost of production. Such petitions, if successful, could significantly increase the United States import duties on those products. In that event, the Company might decide to pay the increased duties, thereby possibly increasing the Company's price to consumers. Alternatively, the Company might decide to source the product or a similar product from a different country not subject to increased duties or else discontinue the importation and sale of the product.
In recent years, dispute resolution processes have been utilized to resolve disputes regarding market access between the European Union, China, the United States and other countries. In some instances, these trade disputes can lead to threats by countries of sanctions against each other, which can include import prohibitions and increased duty rates on imported items. The Company considers any agreement that reduces tariff and non-tariff barriers in international trade to be beneficial to its business. Any type of sanction on imports is likely to increase the Company's import costs or limit the availability of merchandise purchased from sanctioned countries. In that case, the Company may be required to seek similar merchandise from other countries.
Risks Relating to Liquidity
A disruption in the global credit and equity markets could negatively impact the Company's ability to obtain financing on acceptable terms.
In the future, the Company could become dependent on the availability of adequate capital to fund its operations. Disruption in the global credit and equity markets and future disruptions in the financial markets could negatively affect the Company's ability to enter into new financing agreements or obtain funding through the sale of Company securities. A decline in economic conditions could also result in difficulties for financial institutions and other parties that the Company does business with, which could potentially affect the Company's ability to access financing under existing arrangements or to otherwise recover amounts as they become due under the Company's contractual agreements. The inability of the Company to obtain financing as needed on acceptable terms to fund its operations may have a negative impact on the Company's business and financial results.
Insufficient cash flows from operations could result in the substantial utilization of the Company's secured credit facility, which may limit the Company's ability to conduct certain activities.
The Company maintains a secured credit facility to enable it to issue merchandise and special purpose standby letters of credit as well as to fund working capital requirements. Borrowings under the credit facility are
11
subject to a borrowing base calculation consisting of a percentage of certain eligible assets of the Company and is subject to advance rates and commercially reasonable reserves. Substantial utilization of the availability under the borrowing base will result in various restrictions on the Company, including restrictions on the ability of the Company to repurchase its common stock or pay dividends and dominion over the Company's cash accounts. See Note 4 to the Notes to Consolidated Financial Statements for additional discussion regarding the Company's secured credit facility. Significant decreases in cash flow from operations and investing could result in the Company borrowing increased amounts under the credit facility to fund operational needs and increased utilization of letters of credit. These could result in the Company being subject to the above restrictions.
| Item 1B. | Unresolved Staff Comments . |
None.
| Item 2. | Properties . |
The Company leases its corporate headquarters and the majority of its retail stores and warehouses. The Company has an operating lease for its corporate headquarters located in Fort Worth, Texas, which included approximately 280,000 square feet of office space as of March 2, 2013. On January 28, 2013, the Company entered into an amendment to the current lease that expanded its leased square footage. During fiscal 2014 the Company's leased office space will expand to a total of approximately 308,000 square feet. As of March 2, 2013, the present value of the Company's minimum future operating lease commitments discounted at 10% totaled approximately $798.7 million. The following table sets forth the distribution of Pier 1 Imports' U.S. and Canadian stores by state and province as of March 2, 2013:
United States | ||||||||||||||||
Alabama | 13 | Louisiana | 15 | Ohio | 29 | |||||||||||
Alaska | 2 | Maine | 1 | Oklahoma | 8 | |||||||||||
Arizona | 24 | Maryland | 22 | Oregon | 14 | |||||||||||
Arkansas | 8 | Massachusetts | 23 | Pennsylvania | 38 | |||||||||||
California | 111 | Michigan | 32 | Rhode Island | 3 | |||||||||||
Colorado | 15 | Minnesota | 18 | South Carolina | 16 | |||||||||||
Connecticut | 20 | Mississippi | 6 | South Dakota | 2 | |||||||||||
Delaware | 4 | Missouri | 18 | Tennessee | 18 | |||||||||||
Florida | 74 | Montana | 6 | Texas | 79 | |||||||||||
Georgia | 27 | Nebraska | 4 | Utah | 9 | |||||||||||
Hawaii | 5 | Nevada | 9 | Virginia | 34 | |||||||||||
Idaho | 6 | New Hampshire | 6 | Washington | 28 | |||||||||||
Illinois | 39 | New Jersey | 35 | West Virginia | 5 | |||||||||||
Indiana | 17 | New Mexico | 5 | Wisconsin | 19 | |||||||||||
Iowa | 9 | New York | 48 | Wyoming | 1 | |||||||||||
Kansas | 9 | North Carolina | 34 | |||||||||||||
| Kentucky | 11 | North Dakota | 3 | |||||||||||||
Canada | ||||||||||||||||
Alberta | 11 | New Brunswick | 2 | Ontario | 33 | |||||||||||
British Columbia | 14 | Newfoundland | 1 | Quebec | 13 | |||||||||||
Manitoba | 2 | Nova Scotia | 2 | Saskatchewan | 2 | |||||||||||
12
The Company currently owns or leases distribution center space of approximately 3.6 million square feet. The Company also acquires temporary distribution center space from time to time through short-term leases. As of March 2, 2013, the Company owned or leased under operating leases the following warehouse properties in or near the following cities:
Location | Approx. Sq. Ft. | Owned/Leased Facility | ||
Baltimore, Maryland (1) | 634,000 sq. ft. | Leased | ||
Columbus, Ohio | 527,000 sq. ft. | Leased | ||
Fort Worth, Texas | 460,000 sq. ft. | Owned | ||
Ontario, California | 747,000 sq. ft. | Leased | ||
Savannah, Georgia | 784,000 sq. ft. | Leased | ||
Tacoma, Washington | 451,000 sq. ft. | Leased | ||
| (1) | Subsequent to year end, the Company leased an additional 350,000 square feet in Baltimore, Maryland. |
| Item 3. | Legal Proceedings . |
The Company is a party to various legal proceedings and claims in the ordinary course of its business. The Company believes that the outcome of these matters will not have a material adverse effect on its consolidated financial position, results of operations or liquidity.
| Item 4. | Mine Safety Disclosures . |
Not applicable.
13
PART II
| Item 5. | Market for the Registrant's Common Equity, Related Stockholder Matters and Issuer Purchases of Equity Securities . |
Market Prices of Common Stock
The following table shows the high and low closing sale prices of the Company's common stock on the New York Stock Exchange (the "NYSE"), as reported in the consolidated transaction reporting system for each quarter of fiscal 2013 and 2012.
| Market Price | ||||||||||||
Fiscal 2013 | High | Low | ||||||||||
First quarter | $ | 18.80 | $ | 15.21 | ||||||||
Second quarter | 18.25 | 15.24 | ||||||||||
Third quarter | 21.10 | 18.04 | ||||||||||
Fourth quarter | 22.79 | 19.08 | ||||||||||
Fiscal 2012 | High | Low | ||||||||||
First quarter | $ | 12.42 | $ | 9.04 | ||||||||
Second quarter | 12.25 | 8.90 | ||||||||||
Third quarter | 13.75 | 9.17 | ||||||||||
Fourth quarter | 17.00 | 12.65 | ||||||||||
Number of Holders of Record
The Company's common stock is traded on the NYSE under the symbol "PIR". As of April 23, 2013, there were approximately 8,000 shareholders of record of the Company's common stock.
Dividends
The Company declared cash dividends of $0.04 per share in each of the first three quarters of fiscal 2013, and declared a cash dividend of $0.05 in the fourth quarter of fiscal 2013, which totaled $17,989,000 in cash dividends paid during fiscal 2013. The Company did not pay any cash dividends in fiscal years 2012 or 2011. On April 4, 2013, subsequent to year end, the Company's Board of Directors declared a $0.05 per share quarterly cash dividend on the Company's outstanding shares of common stock. The $0.05 quarterly cash dividend will be paid on May 8, 2013 to shareholders of record on April 24, 2013. The Company's dividend policy depends upon the earnings, financial condition and capital needs of the Company and other factors deemed relevant by the Company's Board of Directors.
As of March 2, 2013, the Company was not precluded under its secured credit facility from paying cash dividends or repurchasing the Company's common stock. The Company's secured credit facility may limit certain investments and, in some instances, limit payment of cash dividends and repurchases of the Company's common stock. The Company will not be restricted from paying certain dividends unless credit extensions on the line result in availability over a specified period of time that is projected to be less than 20% of the lesser of either $300,000,000 or the calculated borrowing base, subject to the Company meeting a fixed charge coverage requirement when availability over the same specified period of time is projected to be less than 50% of the lesser of either $300,000,000 or the calculated borrowing base. See Note 4 to the Notes to Consolidated Financial Statements for further discussion of the Company's secured credit facility.
14
Purchases of Equity Securities by the Issuer and Affiliated Purchasers
On April 7, 2011, the Board of Directors announced an initial $100.0 million for repurchases of the Company's common stock. On September 6, 2011, the Company had completed this $100.0 million initial share repurchase program and had purchased a total of 9,498,650 shares of its common stock at a weighted average cost of $10.53 per share. On October 14, 2011, the Board of Directors announced a second $100.0 million share repurchase program. On December 14, 2012, the Company completed this second program, with total repurchases of 5,822,142 shares at a weighted average cost of $17.18 per share. On December 13, 2012, the Company announced a third $100.0 million share repurchase program and $100.0 million remained available for repurchase at the end of fiscal 2013.
The following table provides information with respect to purchases of common stock of the Company made during the three months ended March 2, 2013, by Pier 1 Imports, Inc. or any "affiliated purchaser" of Pier 1 Imports, Inc., as defined in Rule 10b-18(a)(3) under the Securities Exchange Act of 1934.
Period | Total Number of Shares Purchased | Average Price Paid per Share (including fees) | Total Number of Shares Purchased as Part of Publicly Announced Plans or Programs (1) | Approximate Dollar Value of Shares that May Yet Be Purchased Under the Plans or Programs (1) | ||||||||||||
Nov 25, 2012 – Dec 29, 2012 | 523,192 | $ | 19.60 | 523,192 | $ | 100,000,000 | ||||||||||
Dec 30, 2012 – Jan 26, 2013 | - | - | - | $ | 100,000,000 | |||||||||||
Jan 27, 2013 – Mar 2, 2013 | - | - | - | $ | 100,000,000 | |||||||||||
|
|
|
|
|
|
|
| |||||||||
| 523,192 | $ | 19.60 | 523,192 | $ | 100,000,000 | |||||||||||
|
|
|
|
|
|
|
| |||||||||
| (1) | On December 14, 2012, the Company completed a $100.0 million share repurchase program, which was announced in October 2011. On December 13, 2012, the Company announced a new $100.0 million share repurchase program. |
Subsequent to year end, the Company utilized a total of $5.0 million to repurchase 226,700 shares of the Company's common stock at a weighted average price per share, including fees, of $22.24 and as of April 23, 2013, $95.0 million remained available for repurchase under the December 2012 program. There is no expiration date on the current authorization and no determination has been made by the Company to suspend or cancel purchases under the program.
During fiscal 2013, 263,464 shares of the Company's common stock were acquired from employees to satisfy tax withholding obligations that arose upon vesting of restricted stock granted pursuant to approved plans.
15
Performance Graph
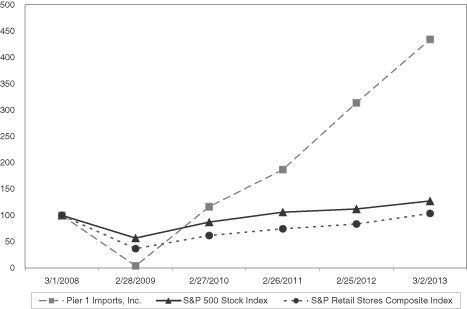
The following graph compares the five-year cumulative total shareholder return for the Company's common stock against the Standard & Poor's 500 Stock Index and the Standard & Poor's Retail Stores Composite Index. The annual changes for the five-year period shown on the graph are based on the assumption, as required by the SEC's rules, that $100 had been invested in the Company's stock and in each index on March 1, 2008, and that dividends were reinvested. The total cumulative dollar returns shown on the graph represent the value that such investments would have had on March 2, 2013. The information used in the graph below was obtained from Bloomberg L.P.
PIER 1 IMPORTS, INC. STOCK PERFORMANCE GRAPH
16
| Item 6. | Selected Financial Data . |
FINANCIAL SUMMARY
| Year Ended | ||||||||||||||||||||||||||||
| 2013 (1) | 2012 | 2011 | 2010 | 2009 | ||||||||||||||||||||||||
| ($ in millions except per share amounts) | ||||||||||||||||||||||||||||
SUMMARY OF OPERATIONS: | ||||||||||||||||||||||||||||
Net sales | $ | 1,704.9 | 1,533.6 | 1,396.5 | 1,290.9 | 1,320.7 | ||||||||||||||||||||||
Gross profit | $ | 743.1 | 651.2 | 555.4 | 440.4 | 363.5 | ||||||||||||||||||||||
Selling, general and administrative expenses | $ | 513.1 | 475.2 | 431.9 | 421.2 | 453.5 | ||||||||||||||||||||||
Depreciation and amortization | $ | 31.0 | 21.2 | 19.7 | 22.5 | 30.6 | ||||||||||||||||||||||
Operating income (loss) | $ | 199.0 | 154.8 | 103.7 | (3.3 | ) | (120.6 | ) | ||||||||||||||||||||
Operating income (loss) as a % of sales | 11.7% | 10.1% | 7.4% | (0.3% | ) | (9.1% | ) | |||||||||||||||||||||
Nonoperating (income) and expenses, net (2) | $ | (2.0 | ) | (9.3 | ) | 0.2 | (35.3 | ) | 8.1 | |||||||||||||||||||
Income (loss) before income taxes | $ | 201.0 | 164.1 | 103.5 | 32.1 | (128.6 | ) | |||||||||||||||||||||
Net income (loss) (3) | $ | 129.4 | 168.9 | 100.1 | 86.8 | (129.3 | ) | |||||||||||||||||||||
PER SHARE AMOUNTS: | ||||||||||||||||||||||||||||
Basic earnings (loss) | $ | 1.22 | 1.50 | .86 | .86 | (1.45 | ) | |||||||||||||||||||||
Diluted earnings (loss) | $ | 1.20 | 1.48 | .85 | .86 | (1.45 | ) | |||||||||||||||||||||
Cash dividends declared | $ | .17 | - | - | - | - | ||||||||||||||||||||||
Shareholders' equity - diluted | $ | 4.96 | 4.31 | 3.51 | 3.01 | 1.62 | ||||||||||||||||||||||
OTHER FINANCIAL DATA: | ||||||||||||||||||||||||||||
Working capital | $ | 410.8 | 404.9 | 415.6 | 316.7 | 299.9 | ||||||||||||||||||||||
Current ratio | 2.7 | 2.7 | 2.8 | 2.3 | 2.3 | |||||||||||||||||||||||
Total assets | $ | 857.2 | 823.4 | 743.6 | 643.0 | 655.5 | ||||||||||||||||||||||
Long-term debt (4) | $ | 9.5 | 9.5 | 9.5 | 19.0 | 184.0 | ||||||||||||||||||||||
Shareholders' equity | $ | 537.1 | 493.6 | 412.9 | 303.1 | 144.3 | ||||||||||||||||||||||
Weighted average diluted shares outstanding (millions) (5) | 108.3 | 114.4 | 117.5 | 100.7 | 88.9 | |||||||||||||||||||||||
Effective tax rate (%) (3) | 35.6 | (2.9 | ) | 3.3 | (171.0 | ) | (0.5 | ) | ||||||||||||||||||||
| (1) | Fiscal 2013 consisted of a 53-week year. All other fiscal years presented reflect 52-week years. |
| (2) | Nonoperating income for fiscal 2010 included a gain of $49.6 million related to the debt transactions during the year. This gain was partially offset by $18.3 million in related expenses. Nonoperating income in fiscal 2010 also included a $10.0 million payment received as a result of a foreign litigation settlement. |
| (3) | During the fourth quarter of fiscal 2012, the Company was able to conclude that given its improved performance, the realization of its deferred tax assets was more likely than not and accordingly reversed substantially all of its valuation allowance. In fiscal 2010, the Company recorded and received a $55.9 million tax benefit as a result of a tax law change allowing additional carryback of the Company's net operating losses. In fiscal years 2011, 2010, and 2009, the Company recorded minimal state and foreign tax provisions and provided a valuation allowance on the deferred tax asset arising during those periods. |
| (4) | The Company's consolidated long-term debt was reduced significantly during fiscal 2011 and 2010 as a result of multiple debt transactions. |
| (5) | The increase in shares outstanding in fiscal 2011 and 2010 was primarily the result of the Company issuing approximately 24.5 million shares of common stock related to the conversion of its convertible debt during fiscal 2010. The decrease in shares outstanding during fiscal 2012 and 2013 was primarily the result of the Company's Board approved share repurchase program. Under this program, the Company repurchased 9,498,650 and 5,822,142 shares in fiscal 2012 and 2013, respectively. |
17
| Item 7. | Management's Discussion and Analysis of Financial Condition and Results of Operations . |
MANAGEMENT OVERVIEW
Introduction
Pier 1 Imports, Inc is one of North America's largest specialty retailers of imported decorative home furnishings and gifts. The Company directly imports merchandise from many countries, and sells a wide variety of decorative accessories, furniture, candles, housewares, gifts and seasonal products in its stores and through the Company's website, Pier1.com. The Company conducts business as one operating segment and operates stores in the United States and Canada under the name Pier 1 Imports. As of March 2, 2013, the Company operated 1,062 stores in the United States and Canada. Fiscal 2013 consisted of a 53-week year and fiscal 2012 and 2011 were 52-week years.
In April 2012, the Company announced a new three-year growth plan designed to drive profitable top and bottom-line growth, expand market share, and increase shareholder value as the Company continues evolving into a multi-channel retailer. The plan includes building a best-in-class e-Commerce platform; strengthening the Company's infrastructure through investments in technology, processes and systems; improving the Company's store portfolio through refurbishments, remodels, new store openings and strategic relocations; investing $200 million in capital over a three-year period; and returning value to shareholders through share repurchases and quarterly cash dividends. In conjunction with the three-year growth plan, the Company established financial targets which include achieving sales per retail square foot of $225 and operating margins of at least 12% of sales by the end of fiscal 2015. The Company also expects an online sales contribution of at least 10% of total revenues by the end of fiscal 2016. During fiscal 2013, the Company delivered on a number of long-term strategic projects, which are the foundations and building blocks for long term success. One of the most significant achievements was the successful launch of its new e-Commerce enabled website, Pier1.com, at the end of July 2012. The website has a brand new, fully redesigned look, feel and functionality. Traffic to the website has increased significantly compared to last year with more than one million unique visits per week.
Fiscal 2013 total sales (on a 53-week basis) increased 11.2% and comparable store sales (on a 52-week basis) increased 7.5% compared to the prior year. The increases were primarily attributable to increases in store traffic and average ticket versus last year. Sales per retail square foot were $198 at the end of fiscal 2013, compared to $184 at the end of fiscal 2012. Management believes that the Company's sales will continue to improve as a result of its unique and special merchandise assortments and superior in-store experience.
Merchandise margins at the store level for the fiscal 2013 were 60.0% compared to 59.8% in the same period last year. Merchandise margins, including the direct-to-consumer business, were 59.8% of sales, which was flat compared to fiscal 2012. Store occupancy costs during fiscal 2013 were $276.5 million, or 16.2% of sales, compared to $265.9 million, or 17.3% of sales, during fiscal 2012. Gross profit for fiscal 2013 was 43.6% as a percentage of sales, compared to 42.5% in fiscal 2012, an improvement of 110 basis points.
Operating income for fiscal 2013 was 11.7% of sales, compared to 10.1% of sales in fiscal 2012. The year-over-year improvement was primarily due to increases in sales and merchandise margins.
The Company also continues working diligently towards completing the implementation of its new point-of-sale system. The Company commenced an all store rollout of the new point-of-sale system in March 2013 and expects to have it rolled out to all stores by summer of 2013. After the roll out is complete, the Company will begin to fully integrate its e-Commerce site with the new point-of-sale system, further strengthening the foundation on which to build its multi-channel capabilities. The Company's vision for the future, "1 Pier 1", is a multi-channel, multi-brand, fully integrated and seamless organization and shopping experience. The Company's retail store locations and e-Commerce channel will operate as mutually supportive, integrated and interdependent businesses.
18
Capital expenditures for the year totaled $80.4 million. Of that amount, approximately $52 million was deployed toward the opening of 22 new Pier 1 Imports stores, the refurbishment of approximately 100 locations, major remodels at four locations, the rollout of new merchandise fixtures to all stores and the implementation of other leasehold improvements and equipment. The Company's three-year growth plan includes $100 million in investments to enhance the quality of its real estate through new store openings, relocations, remodels and refurbishments. To date, the Company has refurbished 253 stores to varying degrees, of which 200 are top volume stores, and all stores have received some new fixtures. The remaining $28 million of capital spend was utilized for technology and infrastructure initiatives, including e-Commerce and the new point-of-sale system. Capital expenditures in fiscal 2014 are expected to be approximately $75 million, with approximately half allocated to stores and other leasehold improvements and the balance being deployed toward technology and infrastructure.
The Company's share repurchase program announced in October 2011 was completed in December 2012, resulting in the repurchase of approximately 5.3% of the Company's common stock outstanding. A total of 5,822,142 shares of its common stock were repurchased at a weighted average cost of $17.18 per share for a total cost of $100.0 million. As a result of the Company's continued strong financial performance during fiscal 2013, the Company's Board of Directors announced a new $100 million share repurchase program on December 13, 2012. As of March 2, 2013, no shares had been repurchased under the Company's current share repurchase program and $100 million remained available for repurchase. Subsequent to year end, the Company utilized a total of $5.0 million to repurchase 226,700 shares of the Company's common stock at a weighted average price per share, including fees, of $22.24 and as of April 23, 2013, $95.0 million remained available for repurchase under the December 2012 program. In addition, on April 4, 2013, subsequent to year end, the Company's Board of Directors declared a $0.05 per share quarterly cash dividend on the Company's outstanding shares of common stock as of April 24, 2013, which is payable on May 8, 2013.
The following discussion and analysis of financial condition, results of operations, and liquidity and capital resources should be read in conjunction with the accompanying audited Consolidated Financial Statements and notes thereto which can be found in Item 8 of this report.
Overview of Business
The Company's key financial and operational indicators used by management to evaluate the performance of the business include the following (trends for these indicators are explained in the comparative discussions of this section):
| Key Performance Indicators | 2013 | 2012 | 2011 | |||||||||
Total sales growth | 11.2% | 9.8% | 8.2% | |||||||||
Comparable stores sales growth (1) | 7.5% | 9.5% | 10.9% | |||||||||
Sales per average retail square foot (1) | $ | 198 | $ | 184 | $ | 168 | ||||||
Merchandise margins as a % of sales | 59.8% | 59.8% | 58.6% | |||||||||
Gross profit as a % of sales | 43.6% | 42.5% | 39.8% | |||||||||
Selling, general and administrative expenses as a % of sales | 30.1% | 31.0% | 30.9% | |||||||||
Operating income as a % of sales | 11.7% | 10.1% | 7.4% | |||||||||
Net income as a % of sales | 7.6% | 11.0% | 7.2% | |||||||||
Total retail square footage (in thousands) | 8,358 | 8,271 | 8,232 | |||||||||
Total retail square footage increase (decline) | 1.1% | 0.5% | (0.7%) | |||||||||
| (1) | Includes orders placed online for store pick-up. All fiscal years were calculated on a 52-week basis. |
Stores included in the comparable store sales calculation are those stores that have been open since the beginning of the preceding fiscal year. In addition, orders placed online for store pick-up were included in the
19
calculation. Remodeled or relocated stores are included if they meet specific criteria. Those criteria include the following: the new store is within a specified distance serving the same market, no significant change in store size, and no significant overlap or gap between the closing and reopening. Such stores are included in the comparable store sales calculation in the first full month after the re-opening. If a relocated or remodeled store does not meet the above criteria, it is excluded from the calculation until it meets the Company's established definition of a comparable store.
FISCAL YEARS ENDED MARCH 2, 2013 AND FEBRUARY 25, 2012
Net Sales
Net sales consisted almost entirely of sales to retail customers, net of discounts and returns, but also included delivery revenues and wholesale sales and royalties. Sales by retail concept during fiscal years 2013 and 2012 were as follows (in thousands):
| 2013 | 2012 | |||||||||
Stores | $ | 1,676,293 | $ | 1,518,200 | ||||||
Other (1) | 28,592 | 15,411 | ||||||||
|
|
|
| |||||||
Net sales | $ | 1,704,885 | $ | 1,533,611 | ||||||
|
|
|
| |||||||
| (1) | Other sales consisted primarily of wholesale sales and royalties received from subsidiaries of Grupo Sanborns, S.A. de C.V., gift card breakage, and direct-to-consumer sales. |
Net sales during fiscal 2013 were $1.705 billion for the 53-week period, an increase of 11.2%, from $1.534 billion for the prior fiscal year. The increase in sales for the fiscal year was comprised of the following components (in thousands):
| Net Sales | ||||
Net sales for fiscal 2012 | $ | 1,533,611 | ||
Incremental sales growth (decline) from: | ||||
New stores opened during fiscal 2013 (1) | 31,093 | |||
Stores opened during fiscal 2012 | 13,511 | |||
Comparable stores (2) | 112,077 | |||
Other, including closed stores (3) | 14,593 | |||
|
| |||
Net sales for fiscal 2013 | $ | 1,704,885 | ||
|
| |||
| (1) | Includes direct-to-consumer sales. |
| (2) | Includes orders placed online for store pick-up. |
| (3) | Includes comparable store sales for the 53rd week of fiscal 2013. |
The total sales growth for fiscal 2013 was primarily the result of an increase in store traffic and average ticket compared to the prior year. Comparable store sales increased 7.5% for the year. As of March 2, 2013, the Company operated 1,062 stores in the United States and Canada, compared to 1,052 stores at the end of fiscal 2012. The Company's net sales from Canadian stores were subject to fluctuation in currency conversion rates. These fluctuations contributed to a ten basis point decrease in the comparable store calculation in fiscal 2013 compared to fiscal 2012. Sales on the Pier 1 credit card comprised 25.7% of U.S. store sales compared to 21.2% last year.
20
A summary reconciliation of the Company's stores open at the beginning of fiscal 2013, 2012 and 2011 to the number open at the end of each period is as follows (openings and closings include relocated stores):
| United States | Canada | Total | ||||||||||||||
Open at February 27, 2010 | 973 | 81 | 1,054 | |||||||||||||
Openings | 3 | - | 3 | |||||||||||||
Closings | (9 | ) | (2 | ) | (11 | ) | ||||||||||
|
|
|
|
|
| |||||||||||
Open at February 26, 2011 | 967 | 79 | 1,046 | |||||||||||||
Openings | 13 | 2 | 15 | |||||||||||||
Closings | (9 | ) | - | (9 | ) | |||||||||||
|
|
|
|
|
| |||||||||||
Open at February 25, 2012 | 971 | 81 | 1,052 | |||||||||||||
Openings | 22 | - | 22 | |||||||||||||
Closings | (11 | ) | (1 | ) | (12 | ) | ||||||||||
|
|
|
|
|
| |||||||||||
Open at March 2, 2013 (1) | 982 | 80 | 1,062 | |||||||||||||
|
|
|
|
|
| |||||||||||
| (1) | The Company supplies merchandise and licenses the Pier 1 Imports name to Grupo Sanborns, S.A. de C.V. which sells Pier 1 Imports merchandise primarily in a "store within a store" format. At the end of fiscal 2013, there were 49 of these locations in Mexico and one in El Salvador. These locations are excluded from the table above. |
Cost of Sales and Gross Profit
Cost of sales were 56.4% expressed as a percentage of sales in fiscal 2013, compared to 57.5% of sales in fiscal 2012. Gross profit, which is calculated by deducting store occupancy costs from merchandise margin dollars, was 43.6% expressed as a percentage of sales in fiscal 2013, compared to 42.5% a year ago. Merchandise margins at the store level for the fiscal 2013 were 60.0% compared to 59.8% in the same period last year. Merchandise margins, including the direct-to-consumer business, were 59.8% of sales this year. During fiscal 2013, the Company maintained strong input margins, which resulted from the Company's continued focus on maximizing margins through negotiating advantageous vendor costs and ensuring an efficient supply chain. In addition, the Company also continued to execute its disciplined and analytical buying strategies in an effort to maintain the right balance of regular, promotional, and clearance pricing.
Store occupancy costs during fiscal 2013 were $276.5 million or 16.2% of sales, compared to $265.9 million, or 17.3% of sales during fiscal 2012. For the fiscal year, all occupancy expenses decreased as a percentage of sales compared to last year, with the exception of property insurance which remained relatively constant. Overall, rent expense increased in dollars primarily due to the increase in new store openings, but decreased as a percentage of sales during fiscal 2013.
Operating Expenses and Depreciation
Selling, general and administrative expenses were $513.1 million, or 30.1% of sales in fiscal 2013, compared to $475.2 million, or 31.0% of sales in fiscal 2012. The 90 basis point improvement was due to the leveraging of store payroll and fixed expenses, and was slightly offset by increases in marketing expense.
Depreciation and amortization for fiscal 2013 was $31.0 million, representing an increase of $9.8 million from last year's depreciation and amortization expense of $21.2 million. This increase was primarily the result of capital expenditures in fiscal 2013, partially offset by certain assets becoming fully depreciated and store closures.
In fiscal 2013, the Company recorded operating income of $199.0 million, or 11.7% of sales, compared to $154.8 million, or 10.1% of sales, for fiscal 2012.
21
Nonoperating Income and Expense
Nonoperating income for fiscal 2013 was $2.0 million, compared to $9.3 million in fiscal 2012. The decrease was primarily the result of the completion of deferred gain recognition related to transactions with the Company's former proprietary credit card provider. During the second quarter of fiscal 2013, the Company reversed a portion of its reserve for uncertain income tax positions for which the statute of limitations had expired. This adjustment resulted in the reversal of $2.8 million of accrued interest expense, which partially offset the decrease in deferred gain recognition compared to the prior year.
Income Taxes
The Company recorded an effective tax rate of 35.6% and an income tax provision of $71.6 million in fiscal 2013, which included the impact of the Company reversing a portion of its reserve for uncertain income tax positions during the second quarter. During fiscal 2012, the Company recorded a benefit of $4.8 million. The increase over prior year was due to the Company reporting increased income in fiscal 2013. In addition, the Company reversed its valuation allowance during the fourth quarter of fiscal 2012 and recorded a tax benefit during the period.
Net Income
Net income in fiscal 2013 was $129.4 million, or $1.20 per share. Net income for fiscal 2012 was $168.9 million, or $1.48 per share, which included the tax benefit resulting from the change in the Company's tax valuation allowance during the fourth quarter of fiscal 2012. Before non-recurring tax benefits of $61.5 million, primarily resulting from the change in the Company's tax valuation allowance, earnings per share were $0.94 for fiscal 2012.
FISCAL YEARS ENDED FEBRUARY 25, 2012 AND FEBRUARY 26, 2011
Net Sales
Net sales consisted primarily of sales to retail customers, net of discounts and returns, but also included delivery revenues and wholesale sales and royalties. Sales by retail concept during fiscal years 2012 and 2011 were as follows (in thousands):
| 2012 | 2011 | |||||||||
Stores | $ | 1,518,200 | $ | 1,381,944 | ||||||
Other (1) | 15,411 | 14,526 | ||||||||
|
|
|
| |||||||
Net sales | $ | 1,533,611 | $ | 1,396,470 | ||||||
|
|
|
| |||||||
| (1) | Other sales consisted primarily of wholesale sales and royalties received from subsidiaries of Grupo Sanborns, S.A. de C.V. and gift card breakage. |
22
Net sales during fiscal 2012 were $1.534 billion, an increase of $137.1 million or 9.8%, from $1.396 billion for the prior fiscal year. The increase in sales for the fiscal year was comprised of the following components (in thousands):
| Net Sales | ||||
Net sales for fiscal 2011 | $ | 1,396,470 | ||
Incremental sales growth (decline) from: | ||||
New stores | 9,329 | |||
Comparable stores | 131,008 | |||
Closed stores and other | (3,196 | ) | ||
|
| |||
Net sales for fiscal 2012 | $ | 1,533,611 | ||
|
| |||
The total sales growth for fiscal 2012 was primarily the result of an increase in traffic and average ticket compared to the prior year. As of February 25, 2012, the Company operated 1,052 stores in the United States and Canada, compared to 1,046 stores at the end of fiscal 2011. The Company's net sales from Canadian stores were subject to fluctuation in currency conversion rates. These fluctuations contributed to a 30 basis point increase in both the net sales and comparable store calculations in fiscal 2012 compared to fiscal 2011. Net sales during fiscal 2012 and the fourth quarter of fiscal 2011 included amortization of the deferred gain related to the renegotiation of the Company's propriety credit card agreement with Chase Bank USA, N.A. ("Chase") during the fourth quarter of fiscal 2011. The gain amortization in fiscal 2012 was consistent with the treatment of amounts received from Chase during the same period of fiscal 2011 for transaction level incentives. During both periods, the amounts were mostly offset by costs associated with the credit card program. As a result of its new agreement with a subsidiary of Alliance Data Systems Corporation ("ADS") during the third quarter of fiscal 2012, the Company revised the amortization period for any remaining deferred gains related to prior transactions with Chase as appropriate.
A summary reconciliation of the Company's stores open at the beginning of fiscal 2012, 2011 and 2010 to the number open at the end of each period is as follows (openings and closings include relocated stores):
| United States | Canada | Total | ||||||||||||||
Open at February 28, 2009 | 1,011 | 81 | 1,092 | |||||||||||||
Openings | - | - | - | |||||||||||||
Closings | (38 | ) | - | (38 | ) | |||||||||||
|
|
|
|
|
| |||||||||||
Open at February 27, 2010 (1) | 973 | 81 | 1,054 | |||||||||||||
Openings | 3 | - | 3 | |||||||||||||
Closings | (9 | ) | (2 | ) | (11 | ) | ||||||||||
|
|
|
|
|
| |||||||||||
Open at February 26, 2011 | 967 | 79 | 1,046 | |||||||||||||
Openings | 13 | 2 | 15 | |||||||||||||
Closings | (9 | ) | - | (9 | ) | |||||||||||
|
|
|
|
|
| |||||||||||
Open at February 25, 2012 (2) | 971 | 81 | 1,052 | |||||||||||||
|
|
|
|
|
| |||||||||||
| (1) | During the third quarter of fiscal 2010, the Company ended its relationship with Sears Roebuck de Puerto Rico, Inc. and closed all seven "store within a store" locations in Puerto Rico. These locations are excluded from the table above. |
| (2) | The Company supplies merchandise and licenses the Pier 1 Imports name to Grupo Sanborns, S.A. de C.V. which sells Pier 1 Imports merchandise primarily in a "store within a store" format. At the end of fiscal 2012, there were 47 of these locations in Mexico and one in El Salvador. These locations are excluded from the table above. |
23
Gross Profit
Gross profit, which is calculated by deducting store occupancy costs from merchandise margin dollars, was 42.5% expressed as a percentage of sales in fiscal 2012, compared to 39.8% a year ago. Merchandise margins were 59.8% as a percentage of sales, an increase of 120 basis points over 58.6% in fiscal 2011. This improvement was the result of strong input margins, the right balance of regular and promotional pricing, and well-managed inventory levels.
Store occupancy costs during fiscal 2012 were $265.9 million or 17.3% of sales, compared to $262.4 million, or 18.8% of sales during fiscal 2011. Rent, property taxes, utilities and repair and maintenance expenses were all lower as a percentage of sales.
Operating Expenses and Depreciation
Selling, general and administrative expenses were $475.2 million, or 31.0% of sales in fiscal 2012, compared to $431.9 million, or 30.9% of sales in fiscal 2011. The increase was primarily due to increases in payroll resulting from the planned hiring of incremental headcount in support of e-Commerce and other growth initiatives, additional associate hours at the stores to support the higher sales volume, and additional expense for performance related pay and other items.
Depreciation and amortization for fiscal 2012 was $21.2 million, representing an increase of approximately $1.5 million from fiscal 2011. This increase was primarily the result of capital expenditures in fiscal 2012, partially offset by certain assets becoming fully depreciated and store closures.
In fiscal 2012, the Company recorded operating income of $154.8 million, or 10.1% of sales, compared to $103.7 million, or 7.4% of sales, for fiscal 2011.
Nonoperating Income and Expense
Nonoperating income for fiscal 2012 was $9.3 million, compared to expense of $0.2 million in fiscal 2011. The increase in net interest income was primarily the result of an increase in deferred gain recognition related to the renegotiation of the Company's proprietary credit card agreement with Chase during the fourth quarter of fiscal 2011. As a result of its agreement with ADS during the third quarter of fiscal 2012, the Company also revised the amortization period for any remaining deferred gains related to prior transactions with Chase as appropriate. In addition, interest expense decreased primarily as a result of a lower debt balance in fiscal 2012.
Income Taxes
The Company recorded an income tax benefit of $4.8 million in fiscal 2012 compared to a provision of $3.4 million in fiscal 2011. During the fourth quarter of fiscal 2012, the Company was able to conclude that given its improved performance, the realization of its deferred tax assets was more likely than not and accordingly reversed its valuation allowance and recorded a tax benefit during the period. This benefit was partially offset by tax expense. During fiscal 2012, the Company recognized federal income tax expense compared to only minimal amounts of state and foreign tax during fiscal 2011 due to the full valuation allowance.
24
Net Income
Net income in fiscal 2012 was $168.9 million, or $1.48 per share, which included the tax benefit resulting from the change in the Company's tax valuation allowance during the fourth quarter of fiscal 2012. Before non-recurring tax benefits of $61.5 million, primarily resulting from the change in the Company's tax valuation allowance, earnings per share were $0.94 for fiscal 2012. Net income for fiscal 2011 was $100.1 million, or $0.85 per share.
Net income for the fourth quarter of fiscal 2012 was $115.2 million, or $1.04 per share. Before non-recurring tax benefits of $61.5 million, primarily resulting from the change in the Company's tax valuation allowance, earnings per share were $0.48 for the fourth quarter of fiscal 2012. Net income for the fourth quarter of fiscal 2011 was $57.1 million, or $0.48 per share.
LIQUIDITY AND CAPITAL RESOURCES
The Company's cash and cash equivalents totaled $231.6 million at the end of fiscal 2013, a decrease of $56.3 million from the fiscal 2012 year-end balance of $287.9 million. The decrease was primarily the result of the utilization of cash to support the Company's three-year growth plan, including capital expenditures of $80.4 million, $100.0 million to repurchase shares of the Company's common stock, and cash dividends of $18.0 million. These expenditures were mostly offset by cash provided by operating activities of $124.0 million.
The Company's cash and cash equivalents totaled $287.9 million at the end of fiscal 2012, a decrease of $13.6 million from the fiscal 2011 year-end balance of $301.5 million. The decrease was primarily the result of the utilization of cash to support the Company's three-year growth plan, including capital expenditures of $62.3 million and $100.0 million to repurchase shares of the Company's common stock. These expenditures were mostly offset by cash provided by operating activities of $142.2 million.
Cash Flows from Operating Activities
Operating activities provided $124.0 million of cash in fiscal 2013, primarily as a result of $129.4 million of net income, and a $5.7 million increase in income taxes payable, partially offset by a $31.6 million increase in prepaid expenses and other assets, primarily due to timing of rent payments, and a $33.6 million increase in inventory. Inventory increased 10.4% from the end of fiscal 2012 due to additional inventory to support the new e-Commerce business and slightly larger purchases of select merchandise to support higher sales in the first quarter of fiscal 2014. The Company continues to focus on strategically managing inventory levels and closely monitoring merchandise purchases to keep inventory in line with consumer demand.
During fiscal 2012, operating activities provided $142.2 million of cash, primarily as a result of $168.9 million of net income, partially offset by increases in inventory. Inventory levels at the end of fiscal 2012 were $322.5 million, an increase of $10.7 million, or 3.4%, from the end of fiscal 2011, due to increased inventory purchases to support higher sales.
Cash Flows from Investing Activities
During fiscal 2013, the Company's investing activities used $82.4 million, compared to $62.1 million during fiscal 2012. Total capital expenditures were $80.4 million, which included approximately $48.5 million for the opening of 22 new stores, four major remodels, new merchandise fixtures and lighting, and other leasehold improvements and equipment. The Company also invested in the build-out of the e-Commerce fulfillment space located in one of the Company's distribution centers. The remaining capital expenditures were for technology and infrastructure initiatives, including e-Commerce and the new point-of-sale system.
25
During fiscal 2012, the Company's investing activities used $62.1 million, compared to $13.7 million during fiscal 2011, primarily as a result of increased capital expenditures during fiscal 2012. Capital expenditures were $62.3 million in fiscal 2012, and consisted primarily of $33.8 million for new and existing stores. The majority of the remaining capital expenditures were for information systems enhancements.
Cash Flows from Financing Activities
Financing activities for fiscal 2013 used $97.9 million, primarily related to the Company using $100.0 million to repurchase the Company's common stock and paying quarterly cash dividends of $0.04 per share per quarter for the first three quarters and $0.05 per share for the fourth quarter of fiscal 2013, totaling $18.0 million. The cash outflows were partially offset by the receipt of $20.1 million in proceeds related primarily to employee stock option exercises and the Company's employee stock purchase plan.
For fiscal 2012, financing activities used $93.8 million, compared to $21.1 million in fiscal 2011. The increased utilization of cash for financing activities during fiscal 2012 primarily related to the Company using $100.0 million to repurchase shares of the Company's common stock and $3.1 million in debt issuance costs for an amendment to the Company's secured credit facility. The cash outflows were offset by the receipt of $9.3 million in proceeds related primarily to employee stock option exercises and the Company's employee stock purchase plan.
Secured Credit Facility
The Company has a $300 million credit facility with a $100 million accordion feature. This facility matures in April 2016 and is secured by the Company's eligible merchandise and third-party credit card receivables. As of March 2, 2013, the Company had no outstanding borrowings under this facility and had approximately $41.5 million in letters of credit and bankers acceptances outstanding. The calculated borrowing base was $300 million, of which approximately $258.5 million remained available for additional borrowings. At the end of fiscal 2013, the Company was in compliance with all required covenants stated in the agreement.
The Company's secured credit facility may limit certain investments and, in some instances, limit payment of cash dividends and repurchases of the Company's common stock. The Company will not be restricted from paying certain dividends unless credit extensions on the line result in availability over a specified period of time that is projected to be less than 20% of the lesser of either $300 million or the calculated borrowing base, subject to the Company meeting a fixed charge coverage requirement when availability over the same specified period of time is projected to be less than 50% of the lesser of either $300 million or the calculated borrowing base. See Note 4 to the Notes to Consolidated Financial Statements for further discussion of the Company's secured credit facility.
Share Repurchase Program
During fiscal 2013, the Company repurchased approximately 5.3% of the Company's common stock outstanding under the share repurchase program approved by the Board in October 2011. A total of 5,822,142 shares of its common stock were repurchased at a weighted average cost of $17.18 per share for a total cost of $100.0 million. On December 13, 2012, the Company's Board of Directors announced a new $100 million share repurchase program. As of March 2, 2013, no shares had been repurchased under the new program and $100 million remained available for share repurchase. The timing of the repurchases will depend on several factors including, among others, prevailing market conditions and prices.
During fiscal 2012, the Company repurchased approximately 8% of the Company's common stock outstanding under a Board approved share repurchase program. A total of 9,498,650 shares of its common stock were repurchased at a weighted average cost of $10.53 per share for a total cost of $100.0 million.
26
Dividends Payable
On April 4, 2013, subsequent to year end, the Company's Board of Directors declared a $0.05 per share quarterly cash dividend on the Company's outstanding shares of common stock. The $0.05 quarterly cash dividend will be paid on May 8, 2013 to shareholders of record on April 24, 2013.
Contractual Obligations
A summary of the Company's contractual obligations and other commercial commitments as of March 2, 2013 is listed below (in thousands):
| Amount of Commitment per Period | ||||||||||||||||||||||||||||
| Less Than | 1 to 3 | 3 to 5 | More Than | |||||||||||||||||||||||||
| Total | 1 Year | Years | Years | 5 Years | ||||||||||||||||||||||||
Operating leases | $ | 1,098,514 | $ | 224,430 | $ | 352,321 | $ | 233,406 | $ | 288,357 | ||||||||||||||||||
Assets retirement obligation | 3,165 | 432 | 1,059 | 990 | 684 | |||||||||||||||||||||||
Purchase obligations (1) | 218,131 | 218,131 | - | - | - | |||||||||||||||||||||||
Standby letters of credit (2) | 28,957 | 28,957 | - | - | - | |||||||||||||||||||||||
Industrial revenue bonds (2) | 9,500 | - | - | - | 9,500 | |||||||||||||||||||||||
Interest on industrial revenue bonds (3) | 196 | 14 | 29 | 29 | 124 | |||||||||||||||||||||||
Interest and related fees on secured credit facility (4) | 5,172 | 1,671 | 3,341 | 160 | - | |||||||||||||||||||||||
Other obligations (5) (6) | 49,025 | 3,465 | 18,474 | 4,042 | 23,044 | |||||||||||||||||||||||
|
|
|
|
|
|
|
|
|
| |||||||||||||||||||
Total | $ | 1,412,660 | $ | 477,100 | $ | 375,224 | $ | 238,627 | $ | 321,709 | ||||||||||||||||||
|
|
|
|
|
|
|
|
|
| |||||||||||||||||||
| (1) | As of March 2, 2013, the Company had approximately $218.1 million of outstanding purchase orders, which were primarily related to merchandise inventory, and included $2.8 million in merchandise letters of credit and bankers' acceptances. Such orders are generally cancelable at the discretion of the Company until the order has been shipped. The table above excludes certain executory contracts for goods and services that tend to be recurring in nature and similar in amount year over year. |
| (2) | The Company also has an outstanding standby letter of credit totaling $9.7 million related to the Company's industrial revenue bonds. This amount is excluded from the table above as it is not incremental to the Company's total outstanding commitments. |
| (3) | The interest rates on the Company's industrial revenue bonds are variable and reset weekly. The estimated interest payments included in the table were calculated based upon the rate in effect at fiscal 2013 year end and exclude fees for the related standby letter of credit which are included elsewhere in this table. |
| (4) | Represents estimated commitment fees for trade and standby letters of credit, and unused fees on the Company's $300 million secured credit facility. Fees are calculated based upon balances at fiscal 2013 year end and the applicable rates in effect under the terms of the Company's $300 million secured credit facility. |
| (5) | Other obligations include the Company's liability under various unfunded retirement plans. See Note 5 of the Notes to Consolidated Financial Statements for further discussion of the Company's employee benefit plans. |
| (6) | Excluded from this table, but recorded on the Company's balance sheet, is the portion of reserves for uncertain tax positions of $1.4 million for which the Company is not reasonably able to estimate when or if cash settlement with the respective taxing authority will occur. |
The present value of the Company's minimum future operating lease commitments discounted at 10% was $798.7 million at fiscal 2013 year end, compared to $638.6 million at fiscal 2012 year end. As part of the sale of the Company's home office building and accompanying land during fiscal 2009, the Company entered into a lease agreement to rent office space in the building. The lease was amended on January 28, 2013 to increase the Company's leaseable square footage and to extend the term of the lease to expire on June 30, 2022. The lease includes one option to extend the lease by five years. The Company plans to fund its lease commitments from cash generated from the operations of the Company and, if needed, from borrowings on its secured credit facility.
27
The Company has an umbrella trust, currently consisting of five sub-trusts, which was established for the purpose of setting aside funds to be used to settle certain benefit plan obligations. Two of the sub-trusts are restricted to satisfy obligations to certain participants in the Company's supplemental retirement plans. These trusts consisted of interest bearing investments of less than $0.1 million at both March 2, 2013 and February 25, 2012, and were included in other noncurrent assets. The remaining three sub-trusts are restricted to meet the funding requirements of the Company's non-qualified deferred compensation plans. These trusts' assets consisted of investments totaling $3.7 million and $1.2 million at March 2, 2013 and February 25, 2012, respectively, and were included in other noncurrent assets. The investments were held in money market funds and mutual funds and are stated at fair value. Some of these trusts also own and are the beneficiaries of life insurance policies with cash surrender values of approximately $6.6 million at March 2, 2013 and death benefits of approximately $13.1 million. In addition, the Company owns and is the beneficiary of a number of insurance policies on the lives of current and former key executives that are unrestricted as to use. The cash surrender value of these unrestricted policies was approximately $17.6 million at March 2, 2013, and was included in other noncurrent assets. These policies had a death benefit of approximately $26.0 million at March 2, 2013. At the discretion of the Board of Directors, contributions of cash or unrestricted life insurance policies could be made to the trusts.
Sources of Working Capital
The Company's sources of working capital for fiscal 2013 were primarily from operations. The Company has a variety of sources for liquidity, which include available cash balances and available lines of credit. The Company's current plans for fiscal 2014 include a capital expenditure budget of approximately $75 million, cash dividends and share repurchases as discussed above. The Company does not presently anticipate any other significant cash outflows in fiscal 2014 other than those discussed herein or those occurring in the normal course of business.
The Company's key drivers of cash flows are sales, management of inventory levels, vendor payment terms, management of expenses, and capital expenditures. The Company's focus remains on making conservative inventory purchases, managing those inventories, and continuing to evolve the Company's merchandise offering while at the same time maximizing its revenues, seeking out ways to make its cost base more efficient and effective and preserving liquidity. While there can be no assurance that the Company will sustain positive cash flows or profitability over the long-term, given the Company's cash position and the various liquidity options available, the Company believes it has sufficient liquidity to fund its obligations, capital expenditure requirements, cash dividends and share repurchases through fiscal 2014.
OFF-BALANCE SHEET ARRANGEMENTS
Other than the operating leases, letters of credit and purchase obligations discussed above, the Company has no off-balance sheet arrangements.
CRITICAL ACCOUNTING POLICIES AND ESTIMATES
The preparation of the Company's consolidated financial statements in accordance with accounting principles generally accepted in the United States requires the use of estimates that affect the reported value of assets, liabilities, revenues and expenses. These estimates are based on historical experience and various other factors that are believed to be reasonable under the circumstances, the results of which form the basis for the Company's conclusions. The Company continually evaluates the information used to make these estimates as the business and the economic environment changes. Historically, actual results have not varied materially from the Company's estimates, with the exception of the early retirement of participants in its defined benefit plans, and income taxes as discussed below. The Company does not currently anticipate a significant change in its assumptions related to these estimates. Actual results may differ from these estimates under different
28
assumptions or conditions. The Company's significant accounting policies can be found in Note 1 of the Notes to Consolidated Financial Statements . The policies and estimates discussed below include the financial statement elements that are either judgmental or involve the selection or application of alternative accounting policies and are material to the Company's financial statements. Unless specifically addressed below, the Company does not believe that its critical accounting policies are subject to market risk exposure that would be considered material, and, as a result, has not provided a sensitivity analysis. The use of estimates is pervasive throughout the consolidated financial statements, but the accounting policies and estimates considered most critical are as follows:
Revenue recognition – The Company recognizes revenue from retail sales, net of sales tax and third-party credit card fees, upon customer receipt or delivery of merchandise. The Company records an allowance for estimated merchandise returns based upon historical experience and other known factors. Should actual returns differ from the Company's estimates and current provision for merchandise returns, revisions to the estimated merchandise returns may be required.
Gift cards – Revenue associated with gift cards is recognized when merchandise is sold and a gift card is redeemed as payment. Gift card breakage is estimated and recorded as income based upon an analysis of the Company's historical data and expected trends in redemption patterns and represents the remaining unused portion of the gift card liability for which the likelihood of redemption is remote. If actual redemption patterns vary from the Company's estimates or if regulations change, actual gift card breakage may differ from the amounts recorded. For all periods presented, estimated gift card breakage was recognized 30 months after the original issuance and was $4.3 million, $3.8 million, and $4.2 million in fiscal 2013, 2012, and 2011, respectively.
Inventories – The Company's inventory is comprised of finished merchandise and is stated at the lower of weighted average cost or market value. Cost is calculated based upon the actual landed cost of an item at the time it is received in the Company's warehouse using vendor invoices, the cost of warehousing and transporting product to the stores and other direct costs associated with purchasing products. Carrying values of inventory are analyzed and to the extent that the cost of inventory exceeds the expected selling prices less reasonable costs to sell, provisions are made to reduce the carrying amount of the inventory. The Company reviews its inventory levels in order to identify slow-moving merchandise and uses merchandise markdowns to sell such merchandise. Markdowns are recorded to reduce the retail price of such slow-moving merchandise as needed. Since the determination of carrying values of inventory involves both estimation and judgment with regard to market values and reasonable costs to sell, differences in these estimates could result in ultimate valuations that differ from the recorded asset. The majority of inventory purchases and commitments are made in U.S. dollars in order to limit the Company's exposure to foreign currency fluctuations.
The Company recognizes known inventory losses, shortages and damages when incurred and makes a provision for estimated shrinkage. The amount of the provision is estimated based on historical experience from the results of its physical inventories. Inventory is physically counted at substantially all locations at least once in each 12-month period, at which time actual results are reflected in the financial statements. Physical counts were taken at substantially all stores and distribution centers during each period presented in the financial statements. Although inventory shrinkage rates have not fluctuated significantly in recent years, should actual rates differ from the Company's estimates, revisions to the inventory shrinkage expense may be required.
Insurance provision – The Company maintains insurance for workers' compensation and general liability claims with deductibles of $1,000,000 per occurrence. The liability recorded for such claims is determined by estimating the total future claims cost for events that occurred prior to the balance sheet date. The estimates consider historical claims loss development factors as well as information obtained from and projections made by the Company's broker, actuary, insurance carriers and third party claims administrators. The recorded liabilities for workers' compensation and general liability claims include claims occurring in prior years
29
but not yet settled and reserves for fees. The recorded liability for workers' compensation claims and fees was $21.4 million and $17.4 million at March 2, 2013 and February 25, 2012, respectively. The recorded liability for general liability claims and fees was $5.9 million and $6.0 million at March 2, 2013 and February 25, 2012, respectively.
The assumptions made in determining the above estimates are reviewed monthly and the liability adjusted accordingly as new facts are developed. Changes in circumstances and conditions affecting the assumptions used in determining the liabilities could cause actual results to differ from the Company's recorded amounts.
Defined benefit plans – The Company maintains supplemental retirement plans (the "Plans") for certain of its current and former executive officers. The Plans provide that upon death, disability, reaching retirement age or certain termination events, a participant will receive benefits based on highest compensation, years of service and years of plan participation. These benefit costs are dependent upon numerous factors, assumptions and estimates. Benefit costs may be significantly affected by changes in key actuarial assumptions such as the discount rate, compensation rates, or retirement dates used to determine the projected benefit obligation. Additionally, changes made to the provisions of the Plans may impact current and future benefit costs.
Stock-based compensation – For restricted stock awards, compensation expense is measured and recorded using the closing price of the Company's stock on the date of grant. If the date of grant occurs on a day when the Company's stock is not traded, then the closing price on the last trading day before the date of grant is used. Restricted stock grants include time-based and performance-based shares. The time-based awards typically vest ratably over a three-year period beginning on the first anniversary of the grant date provided that the participant is employed on the vesting date. The total fair market value of the grant of the restricted stock shares is expensed over the requisite service period. A portion of the performance-based shares vests upon the Company satisfying certain performance targets. Performance based shares are considered granted for accounting purposes on the date the performance targets are set, and the fair market value at that date is expensed over the requisite service period. The remaining performance-based shares are based on a market condition and will vest if certain annual equivalent returns of total shareholder return targets are achieved in comparison to a peer group. The fair value for these performance-based shares was determined using a lattice valuation model in accordance with accounting guidelines, and will be expensed on a straight-line basis over the performance period.
Income taxes – The Company accounts for income taxes using the asset and liability method. Under this method, deferred tax assets and liabilities are determined based on differences between financial reporting and income tax bases of assets and liabilities and are measured using the enacted tax rates and laws that will be in effect when the differences are expected to reverse. Deferred tax assets and liabilities are recorded in the Company's consolidated balance sheets and are classified as current or noncurrent based on the classification of the related assets or liabilities for financial reporting purposes. A valuation allowance is recorded to reduce the carrying amounts of deferred tax assets unless it is more likely than not that such assets will be realized. In assessing the need for a valuation allowance, all available evidence is considered including past operating results, estimates of future income, and tax planning strategies. The Company is subject to income tax in many jurisdictions, including the United States, various states and localities, and foreign countries. At any point in time, multiple tax years are subject to audit by various jurisdictions and the Company records reserves for uncertain tax benefits for foreign and domestic tax audits. The timing of these audits and negotiations with taxing authorities may affect the ultimate settlement of these issues. If different assumptions had been used, the Company's tax expense or benefit, assets and liabilities could have varied from recorded amounts. If actual results differ from estimated results or if the Company adjusts these assumptions in the future, the Company may need to adjust its deferred tax assets or liabilities, which could impact its effective tax rate.
30
IMPACT OF INFLATION AND CHANGING PRICES
Inflation has not had a significant impact on the operations of the Company during the preceding three years. However, the Company's management cannot be certain of the effect inflation may have on the Company's operations in the future.
| Item 7A. | Quantitative and Qualitative Disclosures about Market Risk . |
Market risks relating to the Company's operations result primarily from changes in foreign exchange rates and interest rates. The Company has only limited involvement with derivative financial instruments, does not use them for trading purposes and is not a party to any leveraged derivatives. Collectively, the Company's exposure to market risk factors is not significant and has not materially changed from February 25, 2012.
Foreign Currency Risk
Though the majority of the Company's inventory purchases are made in U.S. dollars in order to limit its exposure to foreign currency fluctuations, the Company, from time to time, enters into forward foreign currency exchange contracts. The Company uses such contracts to hedge exposures to changes in foreign currency exchange rates associated with purchases denominated in foreign currencies, primarily euros. The Company operates stores in Canada and is subject to fluctuations in currency conversion rates related to those operations. On occasion, the Company may consider utilizing contracts to hedge its exposure associated with repatriation of funds from its Canadian operations. Changes in the fair value of the derivatives are included in the Company's consolidated statements of operations as such contracts are not designated as hedges under the applicable accounting guidance. Forward contracts that hedge merchandise purchases generally have maturities not exceeding six months. Changes in the fair value and settlement of these forwards are included in cost of sales and the impact was immaterial. At March 2, 2013, there were no material outstanding contracts to hedge exposure associated with the Company's merchandise purchases denominated in foreign currencies or the repatriation of Canadian funds.
Interest Rate Risk
The Company manages its exposure to changes in interest rates by optimizing the use of variable and fixed rate debt. The interest rate exposure on the Company's secured credit facility and industrial revenue bonds is based upon variable interest rates and therefore is affected by changes in market interest rates. As of March 2, 2013, the Company had $9.5 million in long-term debt outstanding related to its industrial revenue bonds and no cash borrowings outstanding on its secured credit facility. A hypothetical 10% adverse change in the interest rates applicable to either or both of these variable rate instruments would have a negligible impact on the Company's earnings and cash flows.
31
| Item 8. | Financial Statements and Supplementary Data . |
REPORT OF INDEPENDENT REGISTERED PUBLIC ACCOUNTING FIRM
To the Board of Directors of Pier 1 Imports, Inc.
We have audited the accompanying consolidated balance sheets of Pier 1 Imports, Inc. as of March 2, 2013 and February 25, 2012, and the related consolidated statements of operations, comprehensive income, shareholders' equity, and cash flows for each of the three years in the period ended March 2, 2013. These financial statements are the responsibility of the Company's management. Our responsibility is to express an opinion on these financial statements based on our audits.
We conducted our audits in accordance with the standards of the Public Company Accounting Oversight Board (United States). Those standards require that we plan and perform the audit to obtain reasonable assurance about whether the financial statements are free of material misstatement. An audit includes examining, on a test basis, evidence supporting the amounts and disclosures in the financial statements. An audit also includes assessing the accounting principles used and significant estimates made by management, as well as evaluating the overall financial statement presentation. We believe that our audits provide a reasonable basis for our opinion.
In our opinion, the financial statements referred to above present fairly, in all material respects, the consolidated financial position of Pier 1 Imports, Inc. at March 2, 2013 and February 25, 2012, and the consolidated results of its operations and its cash flows for each of the three years in the period ended March 2, 2013, in conformity with U.S. generally accepted accounting principles.
We also have audited, in accordance with the standards of the Public Company Accounting Oversight Board (United States), Pier 1 Imports, Inc.'s internal control over financial reporting as of March 2, 2013, based on criteria established in Internal Control-Integrated Framework issued by the Committee of Sponsoring Organizations of the Treadway Commission and our report dated April 30, 2013 expressed an unqualified opinion thereon.
/s/ Ernst & Young LLP
Fort Worth, Texas
April 30, 2013
32
Pier 1 Imports, Inc.
CONSOLIDATED STATEMENTS OF OPERATIONS
(in thousands except per share amounts)
| Year Ended | ||||||||||||||||
| 2013 | 2012 | 2011 | ||||||||||||||
Net sales | $ | 1,704,885 | $ | 1,533,611 | $ | 1,396,470 | ||||||||||
Cost of sales | 961,826 | 882,449 | 841,083 | |||||||||||||
|
|
|
|
|
| |||||||||||
Gross profit | 743,059 | 651,162 | 555,387 | |||||||||||||
Selling, general and administrative expenses | 513,085 | 475,162 | 431,900 | |||||||||||||
Depreciation and amortization | 30,988 | 21,240 | 19,739 | |||||||||||||
|
|
|
|
|
| |||||||||||
Operating income | 198,986 | 154,760 | 103,748 | |||||||||||||
Nonoperating (income) and expenses: | ||||||||||||||||
Interest, investment income and other | (2,757 | ) | (12,434 | ) | (5,164 | ) | ||||||||||
Interest expense | 743 | 3,087 | 5,368 | |||||||||||||
|
|
|
|
|
| |||||||||||
| (2,014 | ) | (9,347 | ) | 204 | ||||||||||||
|
|
|
|
|
| |||||||||||
Income before income taxes | 201,000 | 164,107 | 103,544 | |||||||||||||
Income tax provision (benefit) | 71,556 | (4,831 | ) | 3,419 | ||||||||||||
|
|
|
|
|
| |||||||||||
Net income | $ | 129,444 | $ | 168,938 | $ | 100,125 | ||||||||||
|
|
|
|
|
| |||||||||||
Earnings per share: | ||||||||||||||||
Basic | $ | 1.22 | $ | 1.50 | $ | 0.86 | ||||||||||
|
|
|
|
|
| |||||||||||
Diluted | $ | 1.20 | $ | 1.48 | $ | 0.85 | ||||||||||
|
|
|
|
|
| |||||||||||
Average shares outstanding during period: | ||||||||||||||||
Basic | 106,222 | 112,534 | 116,466 | |||||||||||||
|
|
|
|
|
| |||||||||||
Diluted | 108,259 | 114,390 | 117,484 | |||||||||||||
|
|
|
|
|
| |||||||||||
The accompanying notes are an integral part of these financial statements.
33
Pier 1 Imports, Inc.
CONSOLIDATED STATEMENTS OF COMPREHENSIVE INCOME
(in thousands)
| Twelve Months Ended | ||||||||||||||||
| March 2, 2013 | February 25, 2012 | February 26, 2011 | ||||||||||||||
Net income | $ | 129,444 | $ | 168,938 | $ | 100,125 | ||||||||||
Other comprehensive income (loss) | ||||||||||||||||
Foreign currency translation adjustments | (918 | ) | (2,050 | ) | 1,841 | |||||||||||
Pension adjustments | 563 | (1,639 | ) | (1,926 | ) | |||||||||||
|
|
|
|
|
| |||||||||||
Other comprehensive loss, net of tax | (355 | ) | (3,689 | ) | (85 | ) | ||||||||||
|
|
|
|
|
| |||||||||||
Comprehensive income | $ | 129,089 | $ | 165,249 | $ | 100,040 | ||||||||||
|
|
|
|
|
| |||||||||||
The accompanying notes are an integral part of these financial statements.
34
Pier 1 Imports, Inc.
CONSOLIDATED BALANCE SHEETS
(in thousands except share amounts)
| March 2, 2013 | February 25, 2012 | |||||||||
ASSETS |
| |||||||||
Current assets: | ||||||||||
Cash and cash equivalents, including temporary investments | $ | 231,556 | $ | 287,868 | ||||||
Accounts receivable, net of allowance for | 22,309 | 16,282 | ||||||||
Inventories | 356,053 | 322,482 | ||||||||
Prepaid expenses and other current assets | 49,016 | 23,682 | ||||||||
|
|
|
| |||||||
Total current assets | 658,934 | 650,314 | ||||||||
Properties, net | 150,615 | 103,640 | ||||||||
Other noncurrent assets | 47,666 | 69,409 | ||||||||
|
|
|
| |||||||
| $ | 857,215 | $ | 823,363 | |||||||
|
|
|
| |||||||
LIABILITES AND SHAREHOLDERS' EQUITY |
| |||||||||
Current liabilities: | ||||||||||
Accounts payable | $ | 58,701 | $ | 63,827 | ||||||
Gift cards and other deferred revenue | 51,740 | 53,123 | ||||||||
Accrued income taxes payable | 25,249 | 16,759 | ||||||||
Other accrued liabilities | 112,437 | 111,679 | ||||||||
|
|
|
| |||||||
Total current liabilities | 248,127 | 245,388 | ||||||||
Long-term debt | 9,500 | 9,500 | ||||||||
Other noncurrent liabilities | 62,457 | 74,832 | ||||||||
Shareholders' equity: | ||||||||||
Common stock, $0.001 par, 500,000,000 shares authorized | 125 | 125 | ||||||||
Paid-in capital | 233,518 | 231,919 | ||||||||
Retained earnings | 574,206 | 462,751 | ||||||||
Cumulative other comprehensive loss | (4,828 | ) | (4,473 | ) | ||||||
Less - 18,906,000 and 15,512,000 common shares in | (265,890 | ) | (196,679 | ) | ||||||
|
|
|
| |||||||
| 537,131 | 493,643 | |||||||||
Commitments and contingencies | - | - | ||||||||
|
|
|
| |||||||
| $ | 857,215 | $ | 823,363 | |||||||
|
|
|
| |||||||
The accompanying notes are an integral part of these financial statements.
35
Pier 1 Imports, Inc.
CONSOLIDATED STATEMENTS OF CASH FLOWS
(in thousands)
| Year Ended | ||||||||||||||||
| 2013 | 2012 | 2011 | ||||||||||||||
Cash flow from operating activities: | ||||||||||||||||
Net income | $ | 129,444 | $ | 168,938 | $ | 100,125 | ||||||||||
Adjustments to reconcile to net cash provided by (used in) operating activities: | ||||||||||||||||
Depreciation and amortization | 38,431 | 30,949 | 33,806 | |||||||||||||
Stock-based compensation expense | 12,337 | 6,199 | 4,706 | |||||||||||||
Deferred compensation | 6,192 | 5,612 | 4,237 | |||||||||||||
Deferred income taxes | 19,928 | (41,915 | ) | - | ||||||||||||
Amortization of credit card deferred revenue | (2,986 | ) | (22,706 | ) | (2,855 | ) | ||||||||||
Amortization of deferred gains | (3,931 | ) | (13,938 | ) | (8,498 | ) | ||||||||||
Change in reserve for uncertain tax positions | (6,252 | ) | 629 | 905 | ||||||||||||
Other | (2,087 | ) | 3,888 | 4,935 | ||||||||||||
Change in cash from: | ||||||||||||||||
Inventories | (33,571 | ) | (10,712 | ) | 1,726 | |||||||||||
Proprietary credit card receivables | (2,019 | ) | 171 | 100 | ||||||||||||
Prepaid expenses and other assets | (31,620 | ) | (8,245 | ) | (8,050 | ) | ||||||||||
Proceeds from an adjustment to the proprietary credit card agreement | - | - | 28,326 | |||||||||||||
Accounts payable and accrued expenses | (5,516 | ) | 6,824 | (8,112 | ) | |||||||||||
Accrued income taxes payable, net of payments | 5,699 | 16,527 | (2,966 | ) | ||||||||||||
|
|
|
|
|
| |||||||||||
Net cash provided by operating activities | 124,049 | 142,221 | 148,385 | |||||||||||||
|
|
|
|
|
| |||||||||||
Cash flow from investing activities: | ||||||||||||||||
Capital expenditures | (80,363 | ) | (62,316 | ) | (31,049 | ) | ||||||||||
Proceeds from disposition of properties | 217 | 1,350 | 11,146 | |||||||||||||
Proceeds from sale of restricted investments | 1,290 | 471 | 3,876 | |||||||||||||
Purchase of restricted investments | (3,567 | ) | (1,575 | ) | (3,944 | ) | ||||||||||
Collection of note receivable | - | - | 6,250 | |||||||||||||
|
|
|
|
|
| |||||||||||
Net cash used in investing activities | (82,423 | ) | (62,070 | ) | (13,721 | ) | ||||||||||
|
|
|
|
|
| |||||||||||
Cash flow from financing activities: | ||||||||||||||||
Cash dividends | (17,989 | ) | - | - | ||||||||||||
Purchases of treasury stock | (100,000 | ) | (100,000 | ) | - | |||||||||||
Proceeds from stock options exercised, stock purchase plan and other, net | 20,051 | 9,343 | 4,972 | |||||||||||||
Repayment of long-term debt | - | - | (26,077 | ) | ||||||||||||
Debt issuance costs | - | (3,097 | ) | - | ||||||||||||
|
|
|
|
|
| |||||||||||
Net cash used in financing activities | (97,938 | ) | (93,754 | ) | (21,105 | ) | ||||||||||
|
|
|
|
|
| |||||||||||
Change in cash and cash equivalents | (56,312 | ) | (13,603 | ) | 113,559 | |||||||||||
Cash and cash equivalents at beginning of period | 287,868 | 301,471 | 187,912 | |||||||||||||
|
|
|
|
|
| |||||||||||
Cash and cash equivalents at end of period | $ | 231,556 | $ | 287,868 | $ | 301,471 | ||||||||||
|
|
|
|
|
| |||||||||||
Supplemental cash flow information: | ||||||||||||||||
Interest paid | $ | 3,563 | $ | 4,812 | $ | 6,015 | ||||||||||
|
|
|
|
|
| |||||||||||
Income taxes paid | $ | 43,740 | $ | 18,751 | $ | 7,342 | ||||||||||
|
|
|
|
|
| |||||||||||
The accompanying notes are an integral part of these financial statements.
36
Pier 1 Imports, Inc.
CONSOLIDATED STATEMENTS OF SHAREHOLDERS' EQUITY
(in thousands)
| Cumulative | ||||||||||||||||||||||||||||||||||||||||
| Common Stock | Other | Total | ||||||||||||||||||||||||||||||||||||||
| Outstanding | Paid-in | Retained | Comprehensive | Treasury | Shareholders' | |||||||||||||||||||||||||||||||||||
| Shares | Amount | Capital | Earnings | Income (Loss) | Stock | Equity | ||||||||||||||||||||||||||||||||||
Balance February 27, 2010 | 115,587 | $ | 125 | $ | 264,477 | $ | 193,688 | $ | (699) | $ | (154,457) | $ | 303,134 | |||||||||||||||||||||||||||
Net income | - | - | 100,125 | - | - | 100,125 | ||||||||||||||||||||||||||||||||||
Other comprehensive income | - | - | - | - | (85 | ) | (85 | ) | ||||||||||||||||||||||||||||||||
Stock-based compensation expense | 979 | - | (10,970 | ) | - | - | 15,676 | 4,706 | ||||||||||||||||||||||||||||||||
Exercise of stock options, directors deferred, stock purchase plan and other | 918 | - | (10,456 | ) | - | - | 15,428 | 4,972 | ||||||||||||||||||||||||||||||||
|
|
|
|
|
|
|
|
|
|
|
|
|
| |||||||||||||||||||||||||||
Balance February 26, 2011 | 117,484 | $ | 125 | $ | 243,051 | $ | 293,813 | $ | (784 | ) | $ | (123,353 | ) | $ | 412,852 | |||||||||||||||||||||||||
|
|
|
|
|
|
|
|
|
|
|
|
|
| |||||||||||||||||||||||||||
Net income | - | - | 168,938 | - | - | 168,938 | ||||||||||||||||||||||||||||||||||
Other comprehensive income | - | - | - | - | (3,689 | ) | - | (3,689 | ) | |||||||||||||||||||||||||||||||
Purchases of treasury stock | (9,499 | ) | - | - | - | - | (100,000 | ) | (100,000 | ) | ||||||||||||||||||||||||||||||
Stock-based compensation expense | 820 | - | (6,859 | ) | - | - | 13,058 | 6,199 | ||||||||||||||||||||||||||||||||
Exercise of stock options, | ||||||||||||||||||||||||||||||||||||||||
stock purchase plan, and other | 915 | - | (4,273 | ) | - | - | 13,616 | 9,343 | ||||||||||||||||||||||||||||||||
|
|
|
|
|
|
|
|
|
|
|
|
|
| |||||||||||||||||||||||||||
Balance February 25, 2012 | 109,720 | $ | 125 | $ | 231,919 | $ | 462,751 | $ | (4,473 | ) | $ | (196,679 | ) | $ | 493,643 | |||||||||||||||||||||||||
|
|
|
|
|
|
|
|
|
|
|
|
|
| |||||||||||||||||||||||||||
Net income | - | - | 129,444 | - | - | 129,444 | ||||||||||||||||||||||||||||||||||
Other comprehensive income | - | - | - | - | (355 | ) | - | (355 | ) | |||||||||||||||||||||||||||||||
Purchases of treasury stock | (5,822 | ) | - | - | - | - | (100,000 | ) | (100,000 | ) | ||||||||||||||||||||||||||||||
Stock-based compensation expense | 809 | - | 2,128 | - | - | 10,209 | 12,337 | |||||||||||||||||||||||||||||||||
Exercise of stock options, | ||||||||||||||||||||||||||||||||||||||||
stock purchase plan, and other | 1,619 | - | (529 | ) | - | - | 20,580 | 20,051 | ||||||||||||||||||||||||||||||||
Cash dividends ($.17 per share) | - | - | - | (17,989 | ) | - | - | (17,989 | ) | |||||||||||||||||||||||||||||||
|
|
|
|
|
|
|
|
|
|
|
|
|
| |||||||||||||||||||||||||||
Balance March 2, 2013 | 106,326 | $ | 125 | $ | 233,518 | $ | 574,206 | $ | (4,828 | ) | $ | (265,890 | ) | $ | 537,131 | |||||||||||||||||||||||||
|
|
|
|
|
|
|
|
|
|
|
|
|
| |||||||||||||||||||||||||||
The accompanying notes are an integral part of these financial statements.
37
NOTES TO CONSOLIDATED FINANCIAL STATEMENTS
NOTE 1 – DESCRIPTION OF BUSINESS AND SUMMARY OF SIGNIFICANT ACCOUNTING POLICIES
Organization – Pier 1 Imports, Inc. (together with its consolidated subsidiaries, the "Company") is a global importer and is one of North America's largest specialty retailers of imported decorative home furnishings and gifts, with retail stores located in the United States and Canada. Additionally, the Company has merchandise primarily in "store within a store" locations in Mexico and El Salvador that are operated by Sears Operadora de Mexico, S.A. de C.V. and Corporacion de Tiendas Internationales, S.A. de C.V., respectively. During fiscal 2013, the Company executed the launch of its new e-Commerce enabled website, Pier1.com.
Basis of consolidation – The consolidated financial statements of the Company include the accounts of all subsidiary companies, and all intercompany transactions and balances have been eliminated.
Segment information – The Company is a specialty retailer that offers a broad range of products in its stores and on its website and conducts business as one operating segment. The Company's domestic operations provided 91.4%, 91.1% and 90.5% of its net sales, with 7.9%, 8.2% and 8.8% provided by stores in Canada, and the remainder from royalties primarily received from Sears Operadora de Mexico S.A. de C.V. during fiscal 2013, 2012 and 2011, respectively. As of March 2, 2013, February 25, 2012 and February 26, 2011, $5,344,000, $5,061,000 and $1,709,000, respectively, of the Company's long-lived assets were located in Canada. There were no long-lived assets in Mexico or El Salvador during any period.
Use of estimates – Preparation of the financial statements in conformity with U.S. generally accepted accounting principles requires management to make estimates and assumptions that affect the amounts reported in the financial statements and accompanying notes. Actual results could differ from those estimates.
Reclassifications – Certain reclassifications have been made in the prior years' consolidated statements of cash flows to conform to the fiscal 2013 presentation. These reclassifications had no effect on the major categories within the cash flow statement.
Fiscal periods – The Company utilizes 5-4-4 (week) quarterly accounting periods with the fiscal year ending on the Saturday closest to February 28th. Fiscal 2013 ended March 2, 2013, fiscal 2012 ended February 25, 2012 and fiscal 2011 ended February 26, 2011. Fiscal 2013 consisted of a 53-week year and fiscal 2012 and 2011 were 52-week years.
Cash and cash equivalents, including temporary investments – The Company considers all highly liquid investments with an original maturity date of three months or less to be cash equivalents, except for those investments that are restricted and have been set aside in a trust to satisfy retirement obligations and are classified as non-current assets. As of March 2, 2013 and February 25, 2012, the Company's short-term investments classified as cash equivalents included investments in money market mutual funds totaling $191,568,000 and $248,624,000, respectively. The effect of foreign currency exchange rate fluctuations on cash was not material.
Translation of foreign currencies – Assets and liabilities of foreign operations are translated into U.S. dollars at fiscal year-end exchange rates. Income and expense items are translated at average exchange rates prevailing during the year. Translation adjustments arising from differences in exchange rates from period to period are included as a separate component of shareholders' equity and are included in other comprehensive income (loss). As of March 2, 2013, February 25, 2012 and February 26, 2011, the Company had cumulative other comprehensive income (loss) balances of ($1,304,000), ($386,000) and $1,664,000, respectively, related to cumulative translation adjustments. The adjustments for currency translation during fiscal 2013, 2012 and 2011
38
NOTES TO CONSOLIDATED FINANCIAL STATEMENTS (continued)
resulted in other comprehensive income (loss), net of tax, as applicable, of ($918,000), ($2,050,000) and $1,841,000, respectively. Taxes on the portion of its cumulative currency translation adjustment considered not to be permanently reinvested abroad were insignificant in fiscal 2013, 2012 and 2011.
Concentrations of risk – The Company has risk of concentration with respect to sourcing the Company's inventory purchases. However, the Company believes alternative merchandise sources could be procured over a reasonable period of time. Pier 1 Imports sells merchandise imported from many countries, with approximately 58.6% of its sales derived from merchandise produced in China, approximately 12.8% derived from merchandise produced in India, and approximately 19.3% collectively derived from merchandise produced in Vietnam, Indonesia, and the United States. The remaining sales were from merchandise produced in various other countries around the world.
Financial instruments – The fair value of financial instruments is determined by reference to various market data and other valuation techniques as appropriate. There were no assets or liabilities with a fair value significantly different from the recorded value as of March 2, 2013 or February 25, 2012.
Risk management instruments : The Company may utilize various financial instruments to manage interest rate and market risk associated with its on- and off-balance sheet commitments.
From time to time, the Company hedges certain commitments denominated in foreign currencies through the purchase of forward contracts. The forward contracts are purchased to cover a portion of commitments to buy merchandise for resale. The Company also, on occasion, uses contracts to hedge its exposure associated with the repatriation of funds from its Canadian operations. At March 2, 2013 and February 25, 2012, there were no material outstanding contracts to hedge exposure associated with the Company's merchandise purchases denominated in foreign currencies or the repatriation of Canadian funds. For financial accounting purposes, the Company does not designate such contracts as hedges. Thus, changes in the fair value of both types of forward contracts would be included in the Company's consolidated statements of operations. The changes in fair value and settlement of these contracts were not material and were included in cost of sales for forwards related to merchandise purchases, and in selling, general and administrative expense for the contracts associated with the repatriation of Canadian funds.
When the Company enters into forward foreign currency exchange contracts, it enters into them with major financial institutions and monitors its positions with, and the credit quality of, these counterparties to such financial instruments.
Accounts Receivable – The Company's accounts receivable are stated at carrying value less an allowance for doubtful accounts. These receivables consist largely of third-party credit card receivables for which collection is reasonably assured. The remaining receivables are periodically evaluated for collectability, and an allowance for doubtful accounts is recorded as appropriate.
Inventories – The Company's inventory is comprised of finished merchandise and is stated at the lower of weighted average cost or market value. Cost is calculated based upon the actual landed cost of an item at the time it is received in the Company's warehouse using vendor invoices, the cost of warehousing and transporting merchandise to the stores and other direct costs associated with purchasing merchandise.
The Company recognizes known inventory losses, shortages and damages when incurred and maintains a reserve for estimated shrinkage since the last physical count, when actual shrinkage was recorded. The reserves for estimated shrinkage at the end of fiscal 2013 and 2012 were $7,156,000 and $7,016,000, respectively.
39
NOTES TO CONSOLIDATED FINANCIAL STATEMENTS (continued)
Properties, maintenance and repairs – Buildings, equipment, furniture and fixtures, and leasehold improvements are carried at cost less accumulated depreciation. Depreciation is computed using the straight-line method over estimated remaining useful lives of the assets, generally thirty years for buildings and three to ten years for equipment, furniture and fixtures. Depreciation of improvements to leased properties is based upon the shorter of the remaining primary lease term or the estimated useful lives of such assets. Depreciation related to the Company's distribution centers is included in cost of sales. All other depreciation costs are included in depreciation and amortization and were $30,988,000, $21,240,000 and $19,739,000 in fiscal 2013, 2012 and 2011, respectively.
Expenditures for maintenance, repairs and renewals that do not materially prolong the original useful lives of the assets are charged to expense as incurred. In the case of disposals, assets and the related depreciation are removed from the accounts and the net amount, less proceeds from disposal, is credited or charged to income.
Long-lived assets are reviewed for impairment at least annually and whenever an event or change in circumstances indicates that their carrying values may not be recoverable. If the carrying value exceeds the sum of the expected undiscounted cash flows, the assets are considered impaired. Impairment, if any, is recorded in the period in which the impairment occurred. The Company recorded no impairment charges in fiscal 2013 and 2012, and $0.5 million in impairment charges in fiscal 2011. Impairment charges were included in selling, general and administrative expenses.
Insurance provision – The Company maintains insurance for workers' compensation and general liability claims with deductibles of $1,000,000 per occurrence. The liability recorded for such claims is determined by estimating the total future claims cost for events that occurred prior to the balance sheet date. The estimates consider historical claims loss development factors as well as information obtained from and projections made by the Company's broker, actuary, insurance carriers and third party claims administrators. The recorded liabilities for workers' compensation and general liability claims include claims occurring in prior years but not yet settled and reserves for fees. The recorded liability for workers' compensation claims and fees was $21,356,000 and $17,363,000 at March 2, 2013 and February 25, 2012, respectively. The recorded liability for general liability claims and fees was $5,916,000 and $5,977,000 at March 2, 2013 and February 25, 2012, respectively.
Revenue recognition – Revenue is recognized upon customer receipt or delivery for retail sales. A reserve has been established for estimated merchandise returns based upon historical experience and other known factors. The reserves for estimated merchandise returns at the end of fiscal 2013 and 2012 were $2,927,000 and $2,570,000, respectively. The Company's revenues are reported net of discounts and returns, net of sales tax and third-party credit card fees, and include wholesale sales and royalties received from Sears Operadora de Mexico S.A. de C.V. and Corporacion de Tiendas Internationales, S.A. de C.V. Amounts billed to customers for shipping and handling are included in net sales.
Cost of sales – Cost of sales includes the cost of the merchandise, buying expenses, costs related to the Company's distribution network (including depreciation), and store occupancy expenses. The costs incurred by the Company for shipping and handling are recorded in cost of sales.
Gift cards – Revenue associated with gift cards is recognized when merchandise is sold and a gift card is redeemed as payment. Gift card breakage is estimated and recorded as income based upon an analysis of the Company's historical data and expected trends in redemption patterns and represents the remaining unused portion of the gift card liability for which the likelihood of redemption is remote. If actual redemption patterns vary from the Company's estimates or if regulations change, actual gift card breakage may differ from the amounts recorded. For all periods presented, estimated gift card breakage was recognized 30 months after the original issuance and was $4,348,000, $3,785,000 and $4,169,000 in fiscal 2013, 2012 and 2011, respectively.
40
NOTES TO CONSOLIDATED FINANCIAL STATEMENTS (continued)
Leases – The Company leases certain property consisting principally of retail stores, warehouses, its home office and material handling and office equipment under operating leases expiring through fiscal 2029. Most retail store locations were leased for primary terms of ten years with varying renewal options and rent escalation clauses. Escalations occurring during the primary terms of the leases are included in the calculation of the minimum lease payments, and the rent expense related to these leases is recognized on a straight-line basis over this lease term, including free rent periods prior to the opening of its stores. The portion of rent expense applicable to a store before opening is included in selling, general and administrative expenses. Once opened for business, rent expense is included in cost of sales. Certain leases provide for additional rental payments based on a percentage of sales in excess of a specified base. This additional rent is accrued when it appears that the sales will exceed the specified base. Construction allowances received from landlords are initially recorded as lease liabilities and amortized as a reduction of rental expense over the primary lease term.
Advertising costs – Advertising production costs are expensed the first time the advertising takes place. Advertising costs were $71,214,000, $62,405,000 and $55,723,000 in fiscal 2013, 2012 and 2011, respectively. Prepaid advertising at the end of fiscal years 2013 and 2012 was $2,426,000 and $2,008,000, respectively.
Defined benefit plans – The Company maintains supplemental retirement plans (the "Plans") for certain of its current and former executive officers. The Plans provide that upon death, disability, reaching retirement age or certain termination events, a participant will receive benefits based on highest compensation, years of service and years of plan participation. These benefit costs are dependent upon numerous factors, assumptions and estimates. Benefit costs may be significantly affected by changes in key actuarial assumptions such as the discount rate, compensation increase rates, or retirement dates used to determine the projected benefit obligation. Additionally, changes made to the provisions of the Plans may impact current and future benefit costs. In accordance with accounting rules, changes in benefit obligations associated with these factors may not be immediately recognized as costs in the statement of operations, but recognized in future years over the remaining average service period of plan participants. See Note 5 of the Notes to Consolidated Financial Statements for further discussion.
Income taxes – The Company accounts for income taxes using the asset and liability method. Under this method, deferred tax assets and liabilities are determined based on differences between financial reporting and income tax bases of assets and liabilities and are measured using the enacted tax rates and laws that will be in effect when the differences are expected to reverse. Deferred tax assets and liabilities are recorded in the Company's consolidated balance sheet and are classified as current or noncurrent based on the classification of the related assets or liabilities for financial reporting purposes. A valuation allowance is recorded to reduce the carrying amounts of deferred tax assets unless it is more likely than not that such assets will be realized. In assessing the need for a valuation allowance, all available evidence is considered including past operating results, estimates of future income, and tax planning strategies. The Company is subject to income tax in many jurisdictions, including the United States, various states and localities, and foreign countries. At any point in time, multiple tax years are subject to audit by various jurisdictions and the Company records estimated reserves for uncertain tax benefits for foreign and domestic tax audits. However, negotiations with taxing authorities may yield results different from those currently estimated. See Note 8 of the Notes to Consolidated Financial Statements for further discussion.
Earnings per share – Basic earnings per share amounts were determined by dividing net income by the weighted average number of common shares outstanding for the period. Diluted earnings per share amounts were similarly computed, and have included the effect, if dilutive, of the Company's weighted average number of stock options outstanding and shares of unvested restricted stock.
41
NOTES TO CONSOLIDATED FINANCIAL STATEMENTS (continued)
Earnings per share amounts were calculated as follows (in thousands except per share amounts):
| 2013 | 2012 | 2011 | ||||||||||||||
Net Income | $ | 129,444 | $ | 168,938 | $ | 100,125 | ||||||||||
|
|
|
|
|
| |||||||||||
Weighted average shares outstanding: | ||||||||||||||||
Basic | 106,222 | 112,534 | 116,466 | |||||||||||||
Effect of dilutive stock options | 1,337 | 1,214 | 454 | |||||||||||||
Effect of dilutive restricted stock | 700 | 642 | 564 | |||||||||||||
|
|
|
|
|
| |||||||||||
Diluted | 108,259 | 114,390 | 117,484 | |||||||||||||
|
|
|
|
|
| |||||||||||
Earnings per share: | ||||||||||||||||
Basic | $ | 1.22 | $ | 1.50 | $ | 0.86 | ||||||||||
|
|
|
|
|
| |||||||||||
Diluted | $ | 1.20 | $ | 1.48 | $ | 0.85 | ||||||||||
|
|
|
|
|
| |||||||||||
A total of 961,575, 2,968,250 and 3,903,875 outstanding stock options and shares of unvested restricted stock were excluded from the computation of the fiscal 2013, 2012 and 2011 earnings per share, respectively, as the effect would be antidilutive.
Stock-based compensation – The Company's stock-based compensation relates to stock options, restricted stock awards and director deferred stock units. Accounting guidance requires all companies to measure and recognize compensation expense at an amount equal to the fair value of share-based payments granted. Compensation expense is recognized for any unvested stock option awards and restricted stock awards on a straight-line basis or ratably over the requisite service period. Stock option exercise prices equal the fair market value of the shares on the date of the grant. The fair value of stock options is calculated using a Black-Scholes option pricing model. For time-based and certain performance-based restricted stock awards, compensation expense is measured and recorded using the closing price of the Company's stock on the date of grant. If the date of grant for stock options or restricted stock awards occurs on a day when the Company's stock is not traded, the closing price on the last trading day before the date of grant is used. A portion of the performance-based shares vests upon the Company satisfying certain performance targets. The Company records compensation expense for these awards with a performance condition when it is probable that the condition will be achieved. The compensation expense ultimately recognized, if any, related to these awards will equal the grant date fair value for the number of shares for which the performance condition has been satisfied. The remaining performance-based shares are based on a market condition and will vest if certain annual equivalent returns of total shareholder return targets are achieved in comparison to a peer group. The fair value for these performance-based shares was determined using a lattice valuation model in accordance with accounting guidelines.
The Company estimates forfeitures based on its historical forfeiture experience, and adjusts forfeiture estimates based on actual forfeiture experience for all awards with service conditions. The effect of any forfeiture adjustments was insignificant.
Adoption of new accounting standards – In June 2011, the Financial Accounting Standards Board issued Accounting Standards Update ("ASU") 2011-05, " Comprehensive Income (Topic 220): Presentation of Comprehensive Income," which amends current comprehensive income guidance. This accounting update eliminates the option to present the components of other comprehensive income as part of the statement of shareholders' equity. Instead, the Company must report comprehensive income in either a single continuous statement of comprehensive income which contains two sections, net income and other comprehensive income, or in two separate but consecutive statements . The Company adopted ASU 2011-05 in the first quarter of fiscal 2013 and included two separate but consecutive statements.
42
NOTES TO CONSOLIDATED FINANCIAL STATEMENTS (continued)
NOTE 2 – PROPERTIES
Properties are summarized as follows at March 2, 2013 and February 25, 2012 (in thousands):
| 2013 | 2012 | |||||||||
Land | $ | 4,256 | $ | 4,256 | ||||||
Buildings | 12,394 | 12,396 | ||||||||
Equipment, furniture, fixtures and other | 306,094 | 277,247 | ||||||||
Leasehold improvements | 192,562 | 176,069 | ||||||||
Computer software | 112,755 | 87,821 | ||||||||
Projects in progress | 5,621 | 7,241 | ||||||||
|
|
|
| |||||||
| 633,682 | 565,030 | |||||||||
Less accumulated depreciation and amortization | 483,067 | 461,390 | ||||||||
|
|
|
| |||||||
Properties, net | $ | 150,615 | $ | 103,640 | ||||||
|
|
|
| |||||||
NOTE 3 – OTHER ACCRUED LIABILITIES AND NONCURRENT LIABILITIES
The following is a summary of other accrued liabilities and noncurrent liabilities at March 2, 2013 and February 25, 2012 (in thousands):
| 2013 | 2012 | |||||||||
Accrued payroll and other employee-related liabilities | $ | 60,867 | $ | 65,758 | ||||||
Accrued taxes, other than income | 22,608 | 19,965 | ||||||||
Rent-related liabilities | 9,973 | 10,064 | ||||||||
Other | 18,989 | 15,892 | ||||||||
|
|
|
| |||||||
Other accrued liabilities | $ | 112,437 | $ | 111,679 | ||||||
|
|
|
| |||||||
Rent-related liabilities | $ | 18,057 | $ | 19,090 | ||||||
Deferred gains | 4,788 | 7,574 | ||||||||
Retirement benefits | 37,502 | 31,754 | ||||||||
Other | 2,110 | 16,414 | ||||||||
|
|
|
| |||||||
Other noncurrent liabilities | $ | 62,457 | $ | 74,832 | ||||||
|
|
|
| |||||||
NOTE 4 – LONG-TERM DEBT AND AVAILABLE CREDIT
Long-term debt consisted entirely of industrial revenue bonds at March 2, 2013 and February 25, 2012. The Company's industrial revenue bond loan agreements have been outstanding since fiscal 1987. Proceeds were used to construct warehouse/distribution facilities. The loan agreements and related tax-exempt bonds mature in the year 2026. During fiscal 2011, the Company repaid $9,500,000 of industrial revenue bonds related to the distribution center near Chicago, Illinois with proceeds received from the sale of that facility earlier in the year. The Company's interest rates on the loans are based on the bond interest rates, which are market driven, reset weekly and are similar to other tax-exempt municipal debt issues. The Company's weighted average effective interest rate, including standby letter of credit fees, was 2.4%, 2.7% and 3.8% for fiscal 2013, 2012 and 2011, respectively.
43
NOTES TO CONSOLIDATED FINANCIAL STATEMENTS (continued)
In February 2006, the Company issued $165,000,000 of convertible debt. As of the end of fiscal 2011, all remaining convertible debt and any accrued interest were paid in full. As of March 2, 2013 and February 25, 2012, the Company had no outstanding convertible debt.
The Company has a $300,000,000 secured credit facility with a $100,000,000 accordion feature. Provided that there is no default and no default would occur as a result thereof, the Company may request that the facility be increased to an amount not to exceed $400,000,000. This facility matures in April 2016 and is secured by the Company's eligible merchandise inventory and third-party credit card receivables. At the Company's option, borrowings will bear interest, payable quarterly or, if earlier, at the end of each interest period, at either (a) the LIBOR rate plus a spread varying from 175 to 225 basis points per year, depending on the amount then borrowed under the facility, or (b) the prime rate plus a spread varying from 75 to 125 basis points per year, depending on the amount then borrowed under the facility The Company pays a fee ranging from 175 to 225 basis points per year for standby letters of credit depending on the average daily availability as defined by the agreement, 87.5 to 112.5 basis points per year for trade letters of credit, and a commitment fee of 37.5 basis points per year for any unused amounts. As of March 2, 2013, the fee for standby letters of credit was 175 basis points per year and 87.5 basis points per year for trade letters of credit. In addition, the Company will pay, when applicable, letter of credit fronting fees on the amount of letters of credit outstanding.
The facility includes a requirement that the Company maintain minimum availability equal to the greater of 10% of the line cap, as defined by the facility, or $20,000,000. The Company's secured credit facility may limit certain investments and, in some instances, limit payment of cash dividends and repurchases of the Company's common stock. The Company will not be restricted from paying certain dividends unless credit extensions on the line result in availability over a specified period of time that is projected to be less than 20% of the lesser of either $300,000,000 or the calculated borrowing base, subject to the Company meeting a fixed charge coverage requirement when availability over the same specified period of time is projected to be less than 50% of the lesser of either $300,000,000 or the calculated borrowing base.
During fiscal 2013, 2012 and 2011, the Company had no cash borrowings under this facility. As of March 2, 2013, the Company's borrowing base, as defined by the agreement, was $300,000,000. This borrowing base calculation was subject to advance rates and commercially reasonable availability reserves. As of March 2, 2013, the Company utilized approximately $41,471,000 in letters of credit and bankers' acceptances against the secured credit facility. Of the outstanding balance, approximately $2,800,000 related to trade letters of credit and bankers acceptances for merchandise purchases, $19,975,000 related to a standby letter of credit for the Company's workers' compensation and general liability insurance policies, $9,715,000 related to a standby letter of credit related to the Company's industrial revenue bonds, and $8,981,000 related to other miscellaneous standby letters of credit. After excluding the $41,471,000 in utilized letters of credit and bankers' acceptances from the borrowing base, $258,529,000 remained available for cash borrowings.
NOTE 5 – EMPLOYEE BENEFIT PLANS
The Company offers a qualified defined contribution employee retirement plan to all its full- and part-time personnel who are at least 18 years old and have been employed for a minimum of six months. During fiscal 2013, 2012 and 2011, employees contributing 1% to 5% of their compensation received a matching Company contribution of up to 3%. Company contributions to the plan were $2,119,000, $1,869,000 and $2,286,000 in fiscal 2013, 2012 and 2011, respectively.
In addition, the Company offers non-qualified deferred compensation plans for the purpose of providing deferred compensation for certain employees whose benefits under the qualified plan may be limited under Section 401(k) of the Internal Revenue Code. The Company's expense for these non-qualified plans was
44
NOTES TO CONSOLIDATED FINANCIAL STATEMENTS (continued)
$1,051,000, $744,000 and $576,000 for fiscal 2013, 2012 and 2011, respectively. The Company has trusts established for the purpose of setting aside funds to be used to settle certain obligations of these non-qualified deferred compensation plans, and contributed $2,773,000 and used $497,000 to satisfy a portion of retirement obligations during fiscal 2013. The Company also contributed $1,526,000 and used $423,000 to satisfy a portion of retirement obligations during fiscal 2012. As of March 2, 2013 and February 25, 2012, the trusts' assets included investments with an aggregate value of $3,732,000 and $1,215,000, respectively. The investments were held in money market funds and mutual funds. All investments held in the trusts are valued at fair value using Level 1 Inputs, which are unadjusted quoted prices in active markets for identical assets or liabilities. The Company has accounted for these restricted investments as trading securities. The trust assets also consisted of life insurance policies, which were classified as non-current assets, with cash surrender values of $6,556,000 as of March 2, 2013 and $6,333,000 as of February 25, 2012, and death benefits of $13,090,000 for both periods. The trust assets are restricted and may only be used to satisfy obligations to plan participants. The Company owns and is the beneficiary of a number of insurance policies on the lives of current and former key executives that are unrestricted as to use. At the discretion of the Board of Directors such policies could be contributed to these trusts or to the trusts established for the purpose of setting aside funds to be used to satisfy obligations arising from supplemental retirement plans described below. The cash surrender value of these unrestricted policies was $17,634,000 at March 2, 2013, and the death benefit was $25,980,000. These cash surrender values are carried in the Company's consolidated financial statements in other non-current assets.
The Company maintains supplemental retirement plans (the "Plans") for certain of its executive officers. The Plans provide that upon death, disability, reaching retirement age or certain termination events, a participant will receive benefits based on highest compensation, years of service and years of plan participation. The Company recorded expenses related to the Plans of $3,423,000, $2,759,000 and $2,458,000 in fiscal 2013, 2012 and 2011, respectively.
The Plans are not funded and thus have no plan assets. However, a trust has been established for the purpose of setting aside funds to be used to settle the defined benefit plan obligations upon retirement or death of certain participants. The trust assets are consolidated in the Company's financial statements and consist of interest bearing investments in the amount of $17,000 that are included in other noncurrent assets at both March 2, 2013 and February 25, 2012. These investments are restricted and may only be used to satisfy retirement obligations to certain participants. The Company has accounted for these restricted investments as available-for-sale securities. Cash contributions of $794,000 and $0 were made to the trust in fiscal 2013 and 2012, respectively. Any future contributions will be made at the discretion of the Board of Directors. Restricted investments from the trust were sold to fund retirement benefits of $794,000 and $0 in fiscal 2013 and 2012, respectively. Funds from the trust will be used to fund or partially fund benefit payments. The Company expects to pay $129,000 during fiscal 2014, $129,000 during fiscal 2015, $17,719,000 during fiscal 2016, $3,475,000 during fiscal 2017, $128,000 during fiscal 2018 and $7,332,000 during fiscal years 2019 through 2023.
45
NOTES TO CONSOLIDATED FINANCIAL STATEMENTS (continued)
Measurement of obligations for the Plans is calculated as of each fiscal year end. The following provides a reconciliation of benefit obligations and funded status of the Plans as of March 2, 2013 and February 25, 2012 (in thousands):
| 2013 | 2012 | |||||||||
Change in projected benefit obligation: | ||||||||||
Projected benefit obligation, beginning of year | $ | 23,519 | $ | 18,377 | ||||||
Service cost | 1,353 | 1,118 | ||||||||
Interest cost | 740 | 779 | ||||||||
Actuarial loss | 854 | 3,363 | ||||||||
Benefits paid (including settlements) | (893 | ) | (118 | ) | ||||||
|
|
|
| |||||||
Projected benefit obligation, end of year | $ | 25,573 | $ | 23,519 | ||||||
|
|
|
| |||||||
Reconciliation of funded status: | ||||||||||
Projected benefit obligation | $ | 25,573 | $ | 23,519 | ||||||
Plan assets | - | - | ||||||||
|
|
|
| |||||||
Funded status | $ | (25,573 | ) | $ | (23,519 | ) | ||||
|
|
|
| |||||||
Accumulated benefit obligation | $ | 25,573 | $ | (23,519 | ) | |||||
|
|
|
| |||||||
Amounts recognized in the balance sheets: | ||||||||||
Current liability | $ | (129 | ) | $ | (897 | ) | ||||
Noncurrent liability | (25,444 | ) | (22,622 | ) | ||||||
Accumulated other comprehensive loss, pre-tax | 6,714 | 7,189 | ||||||||
|
|
|
| |||||||
Net amount recognized | $ | (18,859 | ) | $ | (16,330 | ) | ||||
|
|
|
| |||||||
Cumulative other comprehensive loss, net of taxes of $4,033 and $4,266 in fiscal 2013 and 2012, respectively | $ | 2,681 | $ | 2,923 | ||||||
|
|
|
| |||||||
Weighted average assumptions used to determine: | ||||||||||
Benefit obligation, end of year: | ||||||||||
Discount rate | 3.00% | 3.25% | ||||||||
Lump-sum conversion discount rate | 5.00% | 5.00% | ||||||||
Rate of compensation increase (1) | 3.00% | 0.00% | ||||||||
Net periodic benefit cost for years ended: | ||||||||||
Discount rate | 3.25% | 4.25% | ||||||||
Lump-sum conversion discount rate | 5.00% | 5.00% | ||||||||
Rate of compensation increase (1) | 0.00% | 0.00% | ||||||||
| (1) | The rate of compensation increase shown above reflects an increase of 3.0% for fiscal years 2014 and thereafter for all participants except for the Company's CEO. The CEO's rate of compensation is set forth in his employment agreement. |
Net periodic benefit cost included the following actuarially determined components during fiscal 2013, 2012 and 2011 (in thousands):
| 2013 | 2012 | 2011 | ||||||||||||||
Service cost | $ | 1,353 | $ | 1,118 | $ | 1,121 | ||||||||||
Interest cost | 740 | 779 | 674 | |||||||||||||
Amortization of unrecognized prior service cost | 410 | 410 | 410 | |||||||||||||
Amortization of net actuarial loss | 1,408 | 452 | 108 | |||||||||||||
Settlement | (488 | ) | - | 145 | ||||||||||||
|
|
|
|
|
| |||||||||||
Net periodic benefit cost | $ | 3,423 | $ | 2,759 | $ | 2,458 | ||||||||||
|
|
|
|
|
| |||||||||||
46
NOTES TO CONSOLIDATED FINANCIAL STATEMENTS (continued)
As of March 2, 2013 and February 25, 2012, accumulated other comprehensive loss included amounts that had not been recognized as components of net periodic benefit cost related to prior service cost of $1,146,000 and $1,555,000, and net actuarial loss of $5,568,000 and $5,634,000, respectively. During fiscal 2013, $854,000 was recognized in other comprehensive income related to net actuarial loss for the period. The estimated prior service cost and net actuarial loss that will be amortized from accumulated other comprehensive loss into net periodic cost in fiscal 2014 are $410,000 and $1,392,000, respectively.
NOTE 6 – MATTERS CONCERNING SHAREHOLDERS' EQUITY
On March 23, 2006, the Board of Directors approved the adoption of the Pier 1 Imports, Inc. 2006 Stock Incentive Plan (the "2006 Plan"). The 2006 Plan was approved by the shareholders on June 22, 2006. The aggregate number of shares available for issuance under the 2006 Plan included a new authorization of 1,500,000 shares, plus shares (not to exceed 560,794 shares) that remained available for grant under the Pier 1 Imports, Inc. 1999 Stock Plan (the "1999 Stock Plan") and the Pier 1 Imports, Inc. Management Restricted Stock Plan, increased by the number of shares (not to exceed 11,186,150 shares) subject to outstanding awards on March 23, 2006, under these prior plans that cease to be subject to such awards. As of March 2, 2013, there were a total of 4,399,094 shares available for issuance under the 2006 Plan.
Restricted stock awards – On December 15, 2009, upon the recommendation of the Compensation Committee, the Board of Directors approved the first renewal and extension of the Company's President and Chief Executive Officer's (the "CEO") initial employment agreement dated February 19, 2007. The first renewal and extension provided that a total of 1,500,000 shares of restricted stock would be awarded over a period of more than three years, provided the CEO is employed by the Company at designated times during the period covered by the employment agreement. 937,500 of the shares were time-based and the remaining 562,500 share were performance-based. On December 18, 2009 the CEO received 375,000 time-based awards that vest equally over a three-year period on the anniversary date of the grant, and on the first day of the 2011, 2012 and 2013 fiscal years the CEO received 187,500 time-based awards that vest equally over a three-year period on the last day of each respective fiscal year. In accordance with the accounting guidance on equity compensation, all 937,500 shares of the time-based restricted stock included in the first renewed and extended employment agreement had a grant date as of the date of the employment agreement, which was December 15, 2009. On the date the employment agreement was signed, December 15, 2009, both the Company and the CEO had a mutual understanding of all key terms and conditions related to the time-based restricted stock awards and the Company became obligated to issue the restricted stock awards to the CEO, subject only to his continued employment. In addition, all necessary approvals from both the Company's Compensation Committee and Board of Directors were obtained on December 15, 2009 for the restricted stock awards. Therefore, the Company began expensing the time-based shares on December 15, 2009.
On the first day of the 2011, 2012 and 2013 fiscal years the Company's CEO received 187,500 performance-based shares of restricted stock that vest equally over a period of three fiscal years if the Company achieves certain fiscal year targeted levels of a performance measure for each year as defined by the renewed and extended agreement. Shares that do not vest because the performance target is not met during one fiscal year may vest in future fiscal years if certain aggregate levels of the performance measure are achieved. The vesting of performance-based shares will occur on the date the Company's Form 10-K is filed with the Securities and Exchange Commission for each respective fiscal year. In accordance with accounting guidelines, one-third of the fiscal 2013 performance-based shares had a grant date in fiscal 2013 and the Company began expensing these shares during fiscal 2013. The remaining two-thirds of the fiscal 2013 performance shares did not have a grant date in fiscal 2013 because the performance targets for future fiscal years, which are a key term of the award, have not been established and, therefore, both parties did not have a mutual understanding of all key terms of the award. The CEO must be employed by the Company on the last day of each respective fiscal year in order for the performance-based shares to vest. These shares could also vest under certain termination events. During fiscal
47
NOTES TO CONSOLIDATED FINANCIAL STATEMENTS (continued)
2013, the Company also began expensing performance-based restricted shares awarded in previous fiscal years that were based on the fiscal 2013 performance target. The performance-based shares expensed during fiscal 2013 had a grant date fair value of $18.29 per share.
On June 13, 2012, upon the recommendation of the Compensation Committee, the Board of Directors approved a second renewal and extension of the CEO's employment agreement. The second renewal and extension provides that a total of 1,125,000 shares of restricted stock will be awarded during fiscal years 2014, 2015, and 2016 provided the CEO is employed by the Company at designated times during the period covered by the employment agreement. 540,000 of the shares are time-based and the remaining 585,000 share are performance-based. In accordance with the accounting guidance on equity compensation, all 540,000 shares of the time-based restricted stock included in the second renewed and extended employment agreement had a grant date as of the date of the employment agreement, which was June 13, 2012. On the date the employment agreement was signed, June 13, 2012, both the Company and the CEO had a mutual understanding of all key terms and conditions related to the time-based restricted stock awards and the Company became obligated to issue the restricted stock awards to the CEO, subject only to his continued employment. In addition, all necessary approvals from both the Company's Compensation Committee and Board of Directors were obtained on June 13, 2012 for the restricted stock awards. Therefore, on June 13, 2012 the Company began expensing these time-based shares, which had a grant date fair value of $15.58 per share. The Company did not begin expensing any of the performance-based awards during fiscal 2013 because the performance-based metrics, which are a key term of the awards, had not been established and, therefore, both parties did not have a mutual understanding of all key terms of the award. The Company will begin expensing the performance-based awards in fiscal years 2014, 2015, and 2016 when the respective performance metrics are established and communicated to the CEO.
During fiscal 2013, the Company also awarded long-term incentive awards under the 2006 Plan to certain employees. The fiscal 2013 long-term incentive awards were comprised of restricted stock grants that were divided between time-based and two different types of performance-based awards. The time-based shares vest 33%, 33% and 34% each year over a three-year period beginning on the first anniversary of the award date provided that the participant is employed on the vesting date, and in accordance with accounting guidelines, the Company began expensing the time-based shares during fiscal 2013. The first portion of the performance-based shares vest 33% upon the Company satisfying a certain targeted level of a performance measure in fiscal 2013, and will vest 33% and 34% for each of the following two fiscal years, respectively, upon the Company satisfying a certain targeted level of a performance measure for the respective fiscal year, provided that vesting for each fiscal year is conditioned upon the participant being employed on the date of filing of the Company's annual report on Form 10-K with the SEC for the applicable fiscal year. In accordance with accounting guidelines, one-third of the fiscal 2013 performance-based shares had a grant date in fiscal 2013 because the targeted performance measure for future fiscal years, which are a key term of the award, had not been established and, therefore, both parties did not have a mutual understanding of all key terms of the award. Over each three-year performance (vesting) period, if a targeted performance measure is not satisfied in any fiscal year, those shares that do not vest may still vest if the sum of consecutive years' actual performance measure results equals or exceeds the sum of the individual consecutive fiscal year performance targets. The second portion of the performance-based shares awarded in fiscal 2013 are based on a market condition and will vest following the end of fiscal 2015 if certain annual equivalent returns of total shareholder return targets are achieved in comparison to a peer group. The fair value for these performance-based shares was determined using a lattice valuation model in accordance with accounting guidelines, and the Company began expensing these shares during fiscal 2013.
As of March 2, 2013 and February 25, 2012, the Company had 2,056,357 and 1,681,278 unvested shares of restricted stock awards outstanding, respectively. During fiscal 2013, 1,183,303 shares of restricted stock were awarded, 786,932 shares of restricted stock vested, and 21,292 shares of restricted stock were forfeited. During
48
NOTES TO CONSOLIDATED FINANCIAL STATEMENTS (continued)
fiscal 2012, 671,600 shares of restricted stock were awarded, 609,581 shares of restricted stock vested, and 38,725 shares of restricted stock were forfeited. The weighted average fair market value at the date of grant of the restricted stock shares awarded during fiscal 2013 was $16.44 and is being expensed over the requisite service period. This amount excludes the value of shares awarded to the Company's CEO which is disclosed above. This amount also does not include performance-based restricted shares that the Company will begin expensing in future fiscal years when the targeted performance measures are set, but does include performance-based restricted shares awarded in the previous fiscal year that were based on a fiscal 2013 targeted performance measure which the Company began expensing in fiscal 2013.
Compensation expense for restricted stock was $12,167,000, $5,737,000 and $3,802,000 in fiscal 2013, 2012 and 2011, respectively. As of March 2, 2013, there was $13,645,000 of total unrecognized compensation expense related to restricted stock that will be recognized over a weighted average period of 1.98 years. The total fair value of restricted stock awards vested was $15,339,000, $8,016,000 and $2,454,000 in fiscal 2013, 2012 and 2011, respectively.
The Company recognized a tax benefit related to stock-based compensation of $4,814,000 and $1,679,000 during fiscal years 2013 and 2012, respectively, and no net tax benefit during fiscal 2011 as a result of the Company's valuation allowance on all deferred tax assets. See Note 8 of the Notes to Consolidated Financial Statements for additional discussion of income taxes.
Stock option grants – On January 27, 2007, the Board of Directors approved an employment agreement effective February 19, 2007 for the CEO. Under the employment agreement, the CEO received stock option grants. These options have a term of ten years from the grant date. As of March 2, 2013, outstanding options covering 1,500,000 shares were exercisable. The options were granted as an employment inducement award, and not under any stock option or other equity incentive plan adopted by the Company.
During fiscal 2013, the Board of Directors approved stock options grants under the 2006 Plan of 11,900 shares. As of March 2, 2013 and February 25, 2012, outstanding options covering 607,775 and 932,275 shares were exercisable under the 2006 Plan, respectively. Options were granted at exercise prices equal to the fair market value of the Company's common stock at the date of grant. Employee options issued under the 2006 Plan vest over a period of four years and have a term of ten years from the grant date. The employee options are fully vested upon death, disability or retirement of the employee. The 2006 Plan's administrative committee also has the discretion to take certain actions with respect to stock options, such as accelerating the vesting, upon certain corporate changes (as defined in the 2006 Plan).
The 1999 Stock Plan provided for the granting of options to directors and employees with an exercise price not less than the fair market value of the common stock on the date of the grant. The 1999 Stock Plan provided that a maximum of 14,500,000 shares of common stock could be issued under the 1999 Stock Plan, of which not more than 250,000 shares could be issued under the Director Deferred Stock Program. The options issued to employees vest equally over a period of four years, while non-employee directors' options were fully vested on the date of grant. The options all have a term of ten years from the grant date. The employee options are fully vested upon death, disability, or retirement of an employee, or under certain conditions, such as a change in control of the Company, unless the Board of Directors determines otherwise prior to a change of control event. As of March 2, 2013, there were no shares available for grant under the 1999 Stock Plan. All future stock option grants will be made from shares available under the 2006 Plan. Additionally, outstanding options covering 1,147,500 and 2,430,250 shares were exercisable under the 1999 Stock Plan at fiscal years ended 2013 and 2012, respectively.
Under the Pier 1 Imports, Inc. 1989 Employee Stock Option Plan, options vest over a period of four to five years and have a term of ten years from the grant date. As of March 2, 2013 and February 25, 2012,
49
NOTES TO CONSOLIDATED FINANCIAL STATEMENTS (continued)
outstanding options covering 213,000 and 258,000 shares were exercisable, respectively. As a result of the expiration of the plan during fiscal 2005, no shares are available for future grant.
A summary of stock option transactions related to the Company's stock option grants during the three fiscal years ended March 2, 2013 is as follows:
| Shares | Weighted Average Exercise Price | Weighted Average Fair Value at Date of Grant | Exercisable Shares | |||||||||||||||||||||||||
| Number of Shares | Weighted Average Exercise Price | |||||||||||||||||||||||||||
Outstanding at February 27, 2010 | 9,186,225 | 12.36 | 7,440,275 | 13.62 | ||||||||||||||||||||||||
Options granted | 6,000 | 8.64 | 7.16 | |||||||||||||||||||||||||
Options exercised | (588,000 | ) | 7.77 | |||||||||||||||||||||||||
Options cancelled or expired | (1,394,075 | ) | 15.43 | |||||||||||||||||||||||||
|
| |||||||||||||||||||||||||||
Outstanding at February 26, 2011 | 7,210,150 | 12.14 | 6,897,450 | 12.36 | ||||||||||||||||||||||||
Options granted | 6,600 | 11.47 | 9.43 | |||||||||||||||||||||||||
Options exercised | (893,275 | ) | 7.97 | |||||||||||||||||||||||||
Options cancelled or expired | (588,000 | ) | 18.23 | |||||||||||||||||||||||||
|
| |||||||||||||||||||||||||||
Outstanding at February 25, 2012 | 5,735,475 | 12.16 | 5,620,525 | 12.26 | ||||||||||||||||||||||||
Options granted | 11,900 | 18.80 | 14.75 | |||||||||||||||||||||||||
Options exercised | (1,545,500 | ) | 11.08 | |||||||||||||||||||||||||
Options cancelled or expired | (713,750 | ) | 20.09 | |||||||||||||||||||||||||
|
| |||||||||||||||||||||||||||
Outstanding at March 2, 2013 | 3,488,125 | 11.05 | 3,468,275 | 11.02 | ||||||||||||||||||||||||
|
| |||||||||||||||||||||||||||
| For options outstanding at March 2, 2013 | ||||||||||||||||||||||||||||||||
Ranges of Exercise Prices | Total Shares | Weighted Average Exercise Price | Weighted Average Remaining Contractual Life (in years) | Shares Currently Exercisable | Weighted Average Exercise Price- Exercisable Shares | |||||||||||||||||||||||||||
$4.24 - $6.69 | 1,520,000 | $ | 6.66 | 3.99 | 1,520,000 | $ | 6.66 | |||||||||||||||||||||||||
$7.42 - $11.27 | 594,125 | 7.61 | 4.20 | 591,125 | 7.61 | |||||||||||||||||||||||||||
$11.47 - $17.25 | 842,100 | 16.12 | 1.73 | 837,150 | 16.15 | |||||||||||||||||||||||||||
$18.49 - $20.35 | 531,900 | 19.39 | 0.74 | 520,000 | 19.40 | |||||||||||||||||||||||||||
As of March 2, 2013, the weighted average remaining contractual term for outstanding and exercisable options was 2.99 years and 2.96 years, respectively. The aggregate intrinsic value for outstanding and exercisable options was $40,127,000 and $39,986,000, respectively, at fiscal 2013 year end. The total intrinsic value of options exercised for the fiscal years 2013, 2012 and 2011 was approximately $13,420,000, $3,557,000 and $1,185,000, respectively. The intrinsic value of a stock option is the amount by which the market value of the underlying stock exceeds the exercise price of the option.
At March 2, 2013, there was approximately $195,000 of total unrecognized compensation expense related to unvested stock option awards, which is expected to be recognized over a weighted average period of 2.8 years. The fair value of the stock options is amortized on a straight-line basis as compensation expense over the vesting periods of the options. The Company recorded stock-based compensation expense related to stock options of approximately $170,000, $462,000 and $904,000 in fiscal 2013, 2012 and 2011, respectively.
Director deferred stock units –The 2006 Plan and the 1999 Stock Plan also authorize director deferred stock unit awards to non-employee directors. During fiscal 2013, directors could elect to defer all or a portion of their director's cash fees into a deferred stock unit account. The annual retainer fees deferred (other than committee chairman and chairman of the board annual retainers) received a 25% matching contribution from the
50
NOTES TO CONSOLIDATED FINANCIAL STATEMENTS (continued)
Company in the form of director deferred stock units. There were 647,027 shares and 800,670 shares deferred, but not delivered, as of March 2, 2013 and February 25, 2012, respectively, under the 2006 Plan and the 1999 Stock Plan. All future deferred stock unit awards will be from shares available for grant under the 2006 Plan. During fiscal 2013, approximately 39,584 director deferred stock units were granted, 193,227 units were delivered and no units were cancelled. Compensation expense for the director deferred stock awards was $700,000, $642,000 and $579,000 in fiscal 2013, 2012 and 2011, respectively.
Stock purchase plan – Substantially all Company employees and all non-employee directors are eligible to participate in the Pier 1 Imports, Inc. Stock Purchase Plan under which the Company's common stock is purchased on behalf of participants at an average of market prices through regular payroll deductions. Each employee may contribute up to 20% of the eligible portions of compensation, and non-employee directors may contribute up to 100% of their director compensation. The Company contributes an amount equal to 25% of the participant's contributions. Company contributions to the plan were $431,000, $342,000 and $179,000 in fiscal years 2013, 2012, and 2011, respectively. The Company's stock purchase plan was suspended during a portion of fiscal 2011.
Preferred Stock – As of March 2, 2013, 20,000,000 shares of preferred stock were available for future issuance.
Dividends – The Company paid cash dividends of $17,989,000 in fiscal year 2013. The Company did not pay any cash dividends in fiscal years 2012 or 2011. On April 4, 2013, subsequent to year end, the Company's Board of Directors declared a $0.05 per share quarterly cash dividend on the Company's outstanding shares of common stock. The $0.05 quarterly cash dividend will be paid on May 8, 2013 to shareholders of record on April 24, 2013.
Shares reserved for future issuances – As of March 2, 2013, the Company had approximately 8,534,246 shares of common stock reserved for future issuances under the stock plans. This amount includes stock options outstanding, director deferred stock units and shares available for future grant.
Share repurchase plan – On April 7, 2011, the Company announced an initial $100,000,000 for repurchases of the Company's common stock. On September 6, 2011, the Company completed this $100,000,000 initial share repurchase program and had purchased a total of 9,498,650 shares of its common stock at a weighted average cost of $10.53 per share. On October 14, 2011, the Board of Directors announced a new $100,000,000 share repurchase program and $100,000,000 remained available for repurchase at the end of fiscal 2012. On December 14, 2012, the Company completed this program, with total repurchases of 5,822,142 shares at a weighted average cost of $17.18 per share. On December 13, 2012, the Company announced a third $100,000,000 share repurchase program and $100,000,000 remained available for repurchase at the end of fiscal 2013. Subsequent to year end, the Company utilized a total of $5,043,000 to repurchase 226,700 shares of the Company's common stock at a weighted average price per share, including fees, of $22.24 and as of April 23, 2013, $94,957,000 remained available for repurchase under the December 2012 program.
NOTE 7 – PRIVATE-LABEL CARD INFORMATION
During the third quarter of fiscal 2012, the Company entered into a private-label credit card plan agreement ("Agreement") with a subsidiary of Alliance Data Systems Corporation ("ADS"). The transfer of ownership to ADS of the private-label credit accounts issued under the Company's previous private-label credit card program agreement was completed in the first quarter of fiscal 2013. The Agreement had an initial term of seven years that could be automatically extended to a term of ten years if certain performance targets were achieved. Subsequent to fiscal 2013 year end, the performance target was achieved and the contract was extended to a term of ten years. Under the terms of the Agreement, the Company receives payments based on revolving credit card sales and certain other credit and account related matters. These amounts are recognized as a component of net sales.
51
NOTES TO CONSOLIDATED FINANCIAL STATEMENTS (continued)
During fiscal 2007, the Company sold its proprietary credit card operations to Chase Bank USA, N.A. ("Chase"). The sale was comprised of the Company's proprietary credit card receivables, certain charged-off accounts, and the common stock of Pier 1 National Bank. The Company received cash proceeds for the majority of the sales price and was entitled to receive additional proceeds of $10,750,000, plus any accrued interest, over the life of a long-term program agreement. The Company received no payments related to this agreement in fiscal 2013 or 2012 and received $6,250,000 in fiscal 2011. The net deferred gain associated with the original program agreement with Chase was recognized in nonoperating income. The Company recognized $1,126,000, $10,880,000 and $3,535,000 related to this deferred gain in fiscal 2013, 2012 and 2011, respectively. In addition, the Company and Chase entered into a private-label credit card program agreement with an original term of ten years. Under this agreement, the Company continued to support the card through marketing programs and receive additional payments over the life of the agreement for transaction level incentives, marketing support and other program terms.
On December 30, 2010, the Company entered into a new program agreement with Chase, effective January 1, 2011, with an original term of 18 months (the term was subsequently reduced to 15 months when conversion to a new provider was completed). In conjunction with this agreement, the Company and Chase terminated the original program agreement between the Company and Chase in consideration of payment to the Company from Chase of $28,326,000 plus all remaining sums due to the Company by Chase. The Company was entitled to future payments over the term of the new program agreement based on revolving credit card sales, and certain other credit and account related matters. The Company received total payments of $160,000, $1,574,000 and $4,489,000 related to these program agreements during fiscal 2013, 2012 and 2011, respectively and recognized them as a component of net sales. The $28,326,000 in consideration received from Chase was also deferred and was previously recognized over the new term of the agreement as a component of revenue consistent with the treatment of transaction-based amounts previously received under the original program agreement. The Company recognized approximately $2,715,000, $22,706,000 and $2,905,000 of this amount in fiscal 2013, 2012 and 2011, respectively.
NOTE 8 – INCOME TAXES
The provision (benefit) for income taxes for each of the last three fiscal years consists of (in thousands):
| 2013 | 2012 | 2011 | ||||||||||||||
Federal: | ||||||||||||||||
Current | $ | 45,797 | $ | 32,734 | $ | (446) | ||||||||||
Deferred | 15,635 | (34,107 | ) | - | ||||||||||||
State: | ||||||||||||||||
Current | 4,738 | 1,659 | 1,898 | |||||||||||||
Deferred | 4,293 | (7,808 | ) | - | ||||||||||||
Foreign: | ||||||||||||||||
Current | 1,093 | 2,691 | 1,967 | |||||||||||||
Deferred | - | - | - | |||||||||||||
|
|
|
|
|
| |||||||||||
Total provision (benefit) for income taxes | $ | 71,556 | $ | (4,831 | ) | $ | 3,419 | |||||||||
|
|
|
|
|
| |||||||||||
The Internal Revenue Service ("IRS") has completed its examination of all fiscal years through fiscal 2009. There were no adjustments from this examination which resulted in significant permanent differences. Late in the fourth quarter of fiscal 2012, the IRS initiated an examination of 2010.
At the end of fiscal 2011, the Company had utilized all federal net operating loss carryforwards.
52
NOTES TO CONSOLIDATED FINANCIAL STATEMENTS (continued)
Deferred tax assets and liabilities at March 2, 2013 and February 25, 2012 were comprised of the following (in thousands):
| 2013 | 2012 | |||||||||
Deferred tax assets: | ||||||||||
Deferred compensation | $ | 22,845 | $ | 24,404 | ||||||
Net operating loss carryforward | 3,544 | 7,254 | ||||||||
Accrued average rent | 9,088 | 9,691 | ||||||||
Properties, net | 4,398 | 14,215 | ||||||||
Self insurance reserves | 10,623 | 9,310 | ||||||||
Deferred gain on credit card transactions | 665 | 2,281 | ||||||||
Cumulative foreign currency translation | 2,115 | 1,860 | ||||||||
Deferred revenue and revenue reserves | 6,506 | 5,984 | ||||||||
Foreign and other tax credits | 3,104 | 8,159 | ||||||||
Other | 904 | 1,811 | ||||||||
|
|
|
| |||||||
Total deferred tax assets | 63,792 | 84,969 | ||||||||
|
|
|
| |||||||
Deferred tax liabilities: | ||||||||||
Inventory | (20,982 | ) | (20,561 | ) | ||||||
Deferred gain on debt repurchase | (19,273 | ) | (19,636 | ) | ||||||
Other | (235 | ) | (315 | ) | ||||||
|
|
|
| |||||||
Total deferred tax liabilities | (40,490 | ) | (40,512 | ) | ||||||
|
|
|
| |||||||
Valuation allowance | (1,944 | ) | (2,978 | ) | ||||||
|
|
|
| |||||||
Net deferred tax assets (1) | $ | 21,358 | $ | 41,479 | ||||||
|
|
|
| |||||||
| (1) | The current portion of $6,880 and $2,690 for fiscal 2013 and 2012, respectively, was included in the balance sheet with prepaid expenses and other current assets. The remainder was included in other noncurrent assets. |
During fiscal 2007, the Company recorded a valuation allowance against all deferred tax assets. Taxes arising from the earnings in fiscal 2011 were offset by utilization of the Company's federal net operating loss carryforwards. During the fourth quarter of fiscal 2012, the Company was able to conclude that given its improved performance, the realization of its deferred tax assets was more likely than not and accordingly reversed substantially all of its valuation allowance. The remaining valuation allowance related to certain states net operating loss carryforwards. State net operating losses at March 2, 2013 and February 25, 2012 were $3,544,000 and $7,254,000, respectively. State losses vary as to carryforward position and will expire from fiscal 2014 through fiscal 2029.
53
NOTES TO CONSOLIDATED FINANCIAL STATEMENTS (continued)
The difference between income taxes at the statutory federal income tax rate of 35% in fiscal 2013, 2012 and 2011, and income tax reported in the consolidated statements of operations is as follows (in thousands):
| 2013 | 2012 | 2011 | ||||||||||||||
Tax provision at statutory federal | ||||||||||||||||
income tax rate | $ | 70,350 | $ | 57,437 | $ | 36,240 | ||||||||||
State income taxes, net of | ||||||||||||||||
federal provision | 6,838 | 6,408 | 3,893 | |||||||||||||
Decrease in valuation allowance | (1,034 | ) | (60,751 | ) | (38,687 | ) | ||||||||||
Foreign income taxes | 1,093 | 2,691 | 1,967 | |||||||||||||
Foreign and other tax credits | (1,785 | ) | (3,429 | ) | - | |||||||||||
Other, net | (3,906 | ) | (7,187 | ) | 6 | |||||||||||
|
|
|
|
|
| |||||||||||
Provision (benefit) for income taxes | $ | 71,556 | $ | (4,831 | ) | $ | 3,419 | |||||||||
|
|
|
|
|
| |||||||||||
The accounting guidance on uncertainty in income taxes prescribes the minimum recognition threshold a tax position is required to meet before being recognized in the financial statements. It also provides guidance on derecognition, measurement, classification, interest and penalties, accounting in interim periods, disclosure and transition. On a quarterly and annual basis, the Company accrues for the effects of open uncertain tax positions. A summary of amounts recorded for unrecognized tax benefits at the beginning and end of fiscal 2013 and 2012 are presented below, in thousands:
Unrecognized Tax Benefits - February 26, 2011 | $ | 8,811 | ||||||||||
Gross increases - tax positions in prior period | - | |||||||||||
Gross decreases - tax positions in prior period | (80 | ) | ||||||||||
Settlements | - | |||||||||||
Expiration of statute of limitations | - | |||||||||||
|
| |||||||||||
Unrecognized Tax Benefits - February 25, 2012 | $ | 8,731 | ||||||||||
|
| |||||||||||
Gross increases - tax positions in prior period | 1,171 | |||||||||||
Gross decreases - tax positions in prior period | (1,054 | ) | ||||||||||
Settlements | (1,965 | ) | ||||||||||
Expiration of statute of limitations | (4,689 | ) | ||||||||||
|
| |||||||||||
Unrecognized Tax Benefits - March 2, 2013 | $ | 2,194 | ||||||||||
|
| |||||||||||
If the Company were to prevail on all unrecognized tax benefits recorded, the majority of this reserve for uncertain tax positions would have a favorable impact on the effective tax rate. It is reasonably possible that slightly less than half of the Company's gross unrecognized tax benefits could decrease within the next twelve months primarily due to audit settlements.
Interest associated with unrecognized tax benefits is recorded in nonoperating (income) and expenses. Penalties associated with unrecognized tax benefits are recorded in selling, general and administrative expenses. During the second quarter of fiscal 2013, the Company reversed a portion of its reserve for uncertain tax positions, resulting in the reversal of $2,758,000 of accrued interest expense. Excluding this reversal of accrued interest, the Company recorded expenses of $1,119,000 related to penalties and interest in fiscal 2013, compared to $711,000 and $424,000 in fiscal 2012 and 2011, respectively. The Company had accrued penalties and interest of $2,035,000 and $5,685,000 at March 2, 2013 and February 25, 2012, respectively.
54
NOTES TO CONSOLIDATED FINANCIAL STATEMENTS (continued)
NOTE 9 – COMMITMENTS AND CONTINGENCIES
Leases – At March 2, 2013, the Company had the following minimum lease commitments and future subtenant receipts in the years indicated (in thousands):
Fiscal Year | Operating Leases | Subtenant Income | ||||||||||
2014 | $ | 225,088 | $ | 658 | ||||||||
2015 | 192,990 | 458 | ||||||||||
2016 | 160,013 | 224 | ||||||||||
2017 | 133,551 | 224 | ||||||||||
2018 | 100,215 | 136 | ||||||||||
Thereafter | 288,404 | 47 | ||||||||||
|
|
|
| |||||||||
Total lease commitments | $ | 1,100,261 | $ | 1,747 | ||||||||
|
|
|
| |||||||||
Rental expense incurred was $231,481,000, $223,188,000 and $217,988,000, including contingent rentals of $674,000, $356,000 and $205,000, based upon a percentage of sales, and net of sublease incomes totaling $278,000, $269,000 and $272,000 in fiscal 2013, 2012 and 2011, respectively.
During fiscal 2009, the Company sold its corporate headquarters building and accompanying land to Chesapeake Plaza, L.L.C., an affiliate of Chesapeake Energy Corporation. The Company also entered into a lease agreement to rent office space in the building. The lease had a primary term of seven years, which began on June 9, 2008. This lease was amended on January 28, 2013, extending the term of the lease to expire on June 30, 2022. The related gain on the sale of the property was approximately $23,300,000. As of March 2, 2013, the Company's remaining deferred gain was $5,838,000, approximately half of which is included in other noncurrent liabilities, and will be recognized over the remaining original lease term.
Legal matters – There were no significant legal matters in fiscal years 2013, 2012 or 2011.
There are various claims, lawsuits, investigations and pending actions against the Company and its subsidiaries incident to the operations of its business. The Company considers them to be ordinary and routine in nature. The Company maintains liability insurance against most of these claims. It is the opinion of management, after consultation with counsel, that the ultimate resolution of such litigation will not have a material adverse effect, either individually or in aggregate, on the Company's financial position, results of operations or liquidity.
55
NOTES TO CONSOLIDATED FINANCIAL STATEMENTS (continued)
NOTE 10 – SELECTED QUARTERLY FINANCIAL DATA (UNAUDITED)
Summarized quarterly financial data for the years ended March 2, 2013 and February 25, 2012 are set forth below (in thousands except per share amounts):
| Three Months Ended | ||||||||||||||||||||||||
Fiscal 2013 | 5/26/2012 | 8/25/2012 | 11/24/2012 | 3/2/2013 (2) | ||||||||||||||||||||
Net sales | $ | 361,119 | $ | 367,615 | $ | 424,527 | $ | 551,625 | ||||||||||||||||
Gross profit | 150,275 | 151,549 | 186,259 | 254,977 | ||||||||||||||||||||
Operating income | 27,413 | 32,314 | 38,823 | 100,435 | ||||||||||||||||||||
Net income | 17,825 | 26,231 | 23,685 | 61,704 | ||||||||||||||||||||
Average shares outstanding - basic | 108,597 | 105,786 | 105,419 | 105,168 | ||||||||||||||||||||
Average shares outstanding - diluted | 110,564 | 107,447 | 107,308 | 107,066 | ||||||||||||||||||||
Basic earnings per share | 0.16 | 0.25 | 0.22 | 0.59 | ||||||||||||||||||||
Diluted earnings per share | 0.16 | 0.24 | 0.22 | 0.58 | ||||||||||||||||||||
| Three Months Ended | ||||||||||||||||||||||||
Fiscal 2012 | 5/28/2011 | 8/27/2011 | 11/26/2011 | 2/25/2012 | ||||||||||||||||||||
Net sales | $ | 334,603 | $ | 339,552 | $ | 382,699 | $ | 476,757 | ||||||||||||||||
Gross profit | 134,067 | 134,521 | 165,490 | 217,083 | ||||||||||||||||||||
Operating income | 19,885 | 23,734 | 32,872 | 78,267 | ||||||||||||||||||||
Net income (1) | 14,098 | 16,638 | 22,988 | 115,213 | ||||||||||||||||||||
Average shares outstanding - basic | 117,300 | 115,288 | 108,713 | 108,835 | ||||||||||||||||||||
Average shares outstanding - diluted | 119,235 | 117,085 | 110,306 | 110,709 | ||||||||||||||||||||
Basic earnings per share (1) | 0.12 | 0.14 | 0.21 | 1.06 | ||||||||||||||||||||
Diluted earnings per share (1) | 0.12 | 0.14 | 0.21 | 1.04 | ||||||||||||||||||||
| (1) | During the fourth quarter of fiscal 2012, the Company was able to conclude that given its improved performance, the realization of its deferred tax assets was more likely than not and accordingly reversed substantially all of its valuation allowance. See Note 8 of the Notes to Consolidated Financial Statements for further discussion. |
| (2) | The quarter ended March 2, 2013 consisted of 14 weeks, compared to 13 weeks for the quarter ended February 25, 2012. |
| Item 9. | Changes in and Disagreements with Accountants on Accounting and Financial Disclosure . |
None.
| Item 9A. | Controls and Procedures . |
EVALUATION OF DISCLOSURE CONTROLS AND PROCEDURES
The Company maintains disclosure controls and procedures, as defined in Rule 13a-15(e) under the Securities Exchange Act of 1934, as amended, (the "Exchange Act"), that are designed to ensure that information required to be disclosed by the Company in its reports filed or furnished under the Exchange Act is (a) recorded, processed, summarized, and reported within the time periods specified in the Securities and Exchange Commission's rules and forms, and that such information is (b) accumulated and communicated to the Company's management, including the Chief Executive Officer and Chief Financial Officer, as appropriate to allow timely decisions regarding the required disclosure.
56
As required by Rules 13a-15 and 15d-15 under the Exchange Act, an evaluation was conducted under the supervision and with the participation of the Company's management, including the Chief Executive Officer and Chief Financial Officer, of the effectiveness of the design and operation of the Company's disclosure controls and procedures as of March 2, 2013. Based on this evaluation, the Chief Executive Officer and Chief Financial Officer have concluded, with reasonable assurance, that the Company's disclosure controls and procedures were effective as of such date.
REPORT OF MANAGEMENT ON INTERNAL CONTROL OVER FINANCIAL REPORTING
Management is responsible for establishing and maintaining a system of internal control over financial reporting designed to provide reasonable assurance that transactions are executed in accordance with management authorization and that such transactions are properly recorded and reported in the financial statements, and that records are maintained so as to permit preparation of the financial statements in accordance with U.S. generally accepted accounting principles. Because of its inherent limitations, internal control over financial reporting may not prevent or detect misstatements. Management has assessed the effectiveness of the Company's internal control over financial reporting utilizing the criteria set forth by the Committee of Sponsoring Organizations of the Treadway Commission in Internal Control–Integrated Framework. Management concluded that based on its assessment, Pier 1 Imports, Inc.'s internal control over financial reporting was effective as of March 2, 2013. Ernst & Young LLP, an independent registered public accounting firm, has audited the Company's internal control over financial reporting as of March 2, 2013, as stated in their report which is included in this Annual Report on Form 10-K.
/s/ Alexander W. Smith
Alexander W. Smith
President and
Chief Executive Officer
/s/ Charles H. Turner
Charles H. Turner
Senior Executive Vice President and
Chief Financial Officer
CHANGES IN INTERNAL CONTROL OVER FINANCIAL REPORTING
There were no changes in the Company's internal control over financial reporting during the fourth quarter of fiscal 2013 that would have materially affected, or would have been reasonably likely to materially affect, the Company's internal control over financial reporting.
57
REPORT OF INDEPENDENT REGISTERED PUBLIC ACCOUNTING FIRM
The Board of Directors of Pier 1 Imports, Inc.
We have audited Pier 1 Imports, Inc.'s internal control over financial reporting as of March 2, 2013, based on criteria established in Internal Control – Integrated Framework issued by the Committee of Sponsoring Organizations of the Treadway Commission (the COSO criteria). Pier 1 Imports, Inc.'s management is responsible for maintaining effective internal control over financial reporting, and for its assessment of the effectiveness of internal control over financial reporting included in the accompanying Report of Management on Internal Control over Financial Reporting. Our responsibility is to express an opinion on the company's internal control over financial reporting based on our audit.
We conducted our audit in accordance with the standards of the Public Company Accounting Oversight Board (United States). Those standards require that we plan and perform the audit to obtain reasonable assurance about whether effective internal control over financial reporting was maintained in all material respects. Our audit included obtaining an understanding of internal control over financial reporting, assessing the risk that a material weakness exists, testing and evaluating the design and operating effectiveness of internal control based on the assessed risk, and performing such other procedures as we considered necessary in the circumstances. We believe that our audit provides a reasonable basis for our opinion.
A company's internal control over financial reporting is a process designed to provide reasonable assurance regarding the reliability of financial reporting and the preparation of financial statements for external purposes in accordance with generally accepted accounting principles. A company's internal control over financial reporting includes those policies and procedures that (1) pertain to the maintenance of records that, in reasonable detail, accurately and fairly reflect the transactions and dispositions of the assets of the company; (2) provide reasonable assurance that transactions are recorded as necessary to permit preparation of financial statements in accordance with generally accepted accounting principles, and that receipts and expenditures of the company are being made only in accordance with authorizations of management and directors of the company; and (3) provide reasonable assurance regarding prevention or timely detection of unauthorized acquisition, use or disposition of the company's assets that could have a material effect on the financial statements.
Because of its inherent limitations, internal control over financial reporting may not prevent or detect misstatements. Also, projections of any evaluation of effectiveness to future periods are subject to the risk that controls may become inadequate because of changes in conditions, or that the degree of compliance with the policies or procedures may deteriorate.
In our opinion, Pier 1 Imports, Inc. maintained, in all material respects, effective internal control over financial reporting as of March 2, 2013, based on the COSO criteria.
We also have audited, in accordance with the standards of the Public Company Accounting Oversight Board (United States), the consolidated balance sheets of Pier 1 Imports, Inc. as of March 2, 2013 and February 25, 2012 and the related consolidated statements of operations, comprehensive income, shareholders' equity and cash flows for each of the three years in the period ended March 2, 2013 of Pier 1 Imports, Inc. and our report dated April 30, 2013 expressed an unqualified opinion thereon.
| /s/ Ernst & Young LLP |
Fort Worth, Texas
April 30, 2013
58
| Item 9B. | Other Information . |
None.
PART III
| Item 10. | Directors, Executive Officers and Corporate Governance . |
Information regarding executive officers of the Company required by this item is contained in Part I of this report under the caption "Executive Officers of the Company." Information regarding directors of the Company required by this Item is incorporated by reference to the section entitled "Proposal No. 1 – Election of Directors" set forth in the Company's Proxy Statement for its 2013 Annual Meeting of Shareholders (the "2013 Proxy Statement").
The information regarding compliance with Section 16(a) of the Securities Exchange Act of 1934 required by this Item is incorporated by reference to the section entitled "Section 16(a) Beneficial Ownership Reporting Compliance" set forth in the 2013 Proxy Statement.
Information regarding the Company's audit committee financial experts and code of ethics and business conduct required by this Item is incorporated by reference to the section entitled "Matters Relating to Corporate Governance, Board Structure, Director Compensation and Stock Ownership" set forth in the 2013 Proxy Statement.
No director or nominee for director of the Company has any family relationship with any other director or nominee or with any executive officer of the Company.
| Item 11. | Executive Compensation . |
The information required by this Item is incorporated by reference to the section entitled "Executive Compensation," the section entitled "Matters Relating to Corporate Governance, Board Structure, Director Compensation and Stock Ownership – Non-Employee Director Compensation for the Fiscal Year Ended March 2, 2013," the section entitled "Compensation Committee Interlocks and Insider Participation; Certain Related Person Transactions," and the section entitled "Executive Compensation – Compensation Committee Report," set forth in the 2013 Proxy Statement.
| Item 12. | Security Ownership of Certain Beneficial Owners and Management and Related Stockholder Matters . |
The information required by this Item is incorporated by reference to the section entitled "Matters Relating to Corporate Governance, Board Structure, Director Compensation and Stock Ownership – Security Ownership of Directors and Named Executive Officers," "Matters Relating to Corporate Governance, Board Structure, Director Compensation and Stock Ownership – Security Ownership of Certain Beneficial Owners," the table entitled "Executive Compensation – Outstanding Equity Awards Table for the Fiscal Year Ended March 2, 2013," and the table entitled "Equity Compensation Plan Information" set forth in the 2013 Proxy Statement.
| Item 13. | Certain Relationships and Related Transactions, and Director Independence . |
The information required by this Item is incorporated by reference to the section entitled "Compensation Committee Interlocks and Insider Participation; Certain Related Person Transactions" and "Matters Relating to Corporate Governance, Board Structure, Director Compensation and Stock Ownership-Director Independence" set forth in the 2013 Proxy Statement.
| Item 14. | Principal Accounting Fees and Services. |
Information required by this Item is incorporated by reference to the sections entitled "Independent Registered Public Accounting Firm Fees" and "Pre-approval of Nonaudit Fees" set forth in Proposal No. 3 of the 2013 Proxy Statement.
59
PART IV
| Item 15. | Exhibits, Financial Statement Schedules . |
| (a) | List of consolidated financial statements, schedules and exhibits filed as part of this report. | |||||
| 1. | Financial Statements | |||||
| Report of Independent Registered Public Accounting Firm | ||||||
Consolidated Statements of Operations for the Years Ended March 2, 2013, February 25, 2012 and February 26, 2011 | ||||||
Consolidated Statements of Comprehensive Income for the Years Ended March 2, 2013, February 25, 2012 and February 26, 2011 | ||||||
Consolidated Balance Sheets at March 2, 2013 and February 25, 2012 | ||||||
Consolidated Statements of Cash Flows for the Years Ended March 2, 2013, February 25, 2012 and February 26, 2011 | ||||||
Consolidated Statements of Shareholders' Equity for the Years Ended March 2, 2013, February 25, 2012 and February 26, 2011 | ||||||
| Notes to Consolidated Financial Statements | ||||||
| 2. | Financial Statement Schedules | |||
| Schedules have been omitted because they are not required or are not applicable or because the information required to be set forth therein either is not material or is included in the financial statements or notes thereto. | ||||
| 3. | Exhibits | |||
| See Exhibit Index. | ||||
60
SIGNATURES
Pursuant to the requirements of Section 13 or 15(d) of the Securities Exchange Act of 1934, the Company has duly caused this report to be signed on its behalf by the undersigned, thereunto duly authorized.
| PIER 1 IMPORTS, INC. | ||||
Date: April 30, 2013 | By: | /s/ Alexander W. Smith | ||
| Alexander W. Smith, President | ||||
| and Chief Executive Officer | ||||
Pursuant to the requirements of the Securities Exchange Act of 1934, this report has been signed below by the following persons on behalf of the Company and in the capacities and on the dates indicated.
Signature | Title | Date | ||
/s/ Terry E. London Terry E. London | Director, Chairman of the Board | April 30, 2013 | ||
/s/ Alexander W. Smith Alexander W. Smith | Director, President and Chief Executive Officer | April 30, 2013 | ||
/s/ Charles H. Turner Charles H. Turner | Senior Executive Vice President and Chief Financial Officer | April 30, 2013 | ||
/s/ Darla D. Ramirez Darla D. Ramirez | Principal Accounting Officer | April 30, 2013 | ||
/s/ Claire H. Babrowski Claire H. Babrowski | Director | April 30, 2013 | ||
/s/ Cheryl A. Bachelder Cheryl A. Bachelder | Director | April 30, 2013 | ||
/s/ John H. Burgoyne John H. Burgoyne | Director | April 30, 2013 | ||
/s/ Hamish A. Dodds Hamish A. Dodds | Director | April 30, 2013 | ||
/s/ Brendan L. Hoffman Brendan L. Hoffman | Director | April 30, 2013 | ||
/s/ Cece Smith Cece Smith | Director | April 30, 2013 | ||
61
EXHIBIT INDEX
Exhibit No. | Description | |
| 3(i) | Restated Certificate of Incorporation of Pier 1 Imports, Inc. as filed with the Delaware Secretary of State on October 12, 2009, incorporated herein by reference to Exhibit 3(i) to the Company's Form 10-Q for the quarter ended November 28, 2009 (File No. 001-07832). | |
| 3(ii) | Amended and Restated Bylaws of Pier 1 Imports, Inc. (as amended through October 9, 2009), incorporated herein by reference to Exhibit 3(ii) to the Company's Form 8-K filed on October 16, 2009 (File No. 001-07832). | |
| 10.1* | Form of Indemnity Agreement between the Company and the directors and executive officers of the Company dated January 18, 2011, incorporated herein by reference to Exhibit 10.1 to the Company's Form 10-K for the year ended February 26, 2011 (File No. 001-07832). | |
| 10.2* | Pier 1 Imports, Inc. Supplemental Executive Retirement Plan, Restated as of January 1, 2009, incorporated herein by reference to Exhibit 10.5 to the Company's Form 10-Q for the quarter ended November 29, 2008 (File No. 001-07832). | |
| 10.3* | Pier 1 Imports, Inc. Supplemental Retirement Plan, Restated as of January 1, 2009, incorporated herein by reference to Exhibit 10.4 to the Company's Form 10-Q for the quarter ended November 29, 2009 (File No. 001-07832). | |
| 10.3.1* | Participation Agreement dated November 9, 2007, by and between Alexander W. Smith and Pier 1 Imports, Inc., incorporated herein by reference to Exhibit 10.1 to the Company's Form 8-K filed November 15, 2007 (File No. 001-07832). | |
| 10.3.2* | Participation Agreement Amendment dated April 20, 2008 by and between Charles H. Turner and Pier 1 Imports, Inc., incorporated herein by reference to Exhibit 10.6 to the Company's Form 8-K filed April 24, 2008 (File No. 001-07832). | |
| 10.3.3* | Participation Agreement Amendment dated April 20, 2008 by and between Gregory S. Humenesky and Pier 1 Imports, Inc., incorporated herein by reference to Exhibit 10.3.6 to the Company's Form 10-K for the year ended March 1, 2008 (File No. 001-07832). | |
| 10.4* | Pier 1 Imports, Inc. 1989 Employee Stock Option Plan, amended and restated as of June 27, 1996, incorporated herein by reference to Exhibit 10.6.1 to the Company's Form 10-K for the year ended February 26, 2005 (File No. 001-07832). | |
| 10.4.1* | Amendment No. 1 to Pier 1 Imports, Inc. 1989 Employee Stock Option Plan, incorporated herein by reference to Exhibit 10.6.2 to the Company's Form 10-K for the year ended February 26, 2005 (File No. 001-07832). | |
| 10.5* | Pier 1 Imports, Inc. 1999 Stock Plan, as amended and restated December 31, 2004, incorporated herein by reference to Exhibit 10.3 to the Company's 8-K filed October 12, 2006 (File No. 001-07832). | |
| 10.5.1* | First Amendment to the Pier 1 Imports, Inc. 1999 Stock Plan, as amended and restated December 31, 2004, incorporated herein by reference to Exhibit 10.2 to the Company's Form 10-Q for the quarter ended September 1, 2007 (File No. 001-07832). | |
| 10.6* | Forms of Director and Employee Stock Option Agreements, incorporated herein by reference to Exhibit 10.2 to the Company's Form 10-Q for the quarter ended August 28, 1999 (File No. 001-07832). | |
| 10.7* | Pier 1 Imports, Inc. Stock Purchase Plan, restated as amended June 20, 2008, incorporated herein by reference to Exhibit 10.2 to the Company's Form 10-Q for the quarter ended May 31, 2008 (File No. 001-07832). | |
| 10.7.1* | Amendment to the Pier 1 Imports, Inc. Stock Purchase Plan, incorporated herein by reference to Exhibit 10.8.1 to the Company's Form 10-K for the year ended February 28, 2009 (File No. 001-07832). | |
| 10.7.2* | Second Amendment dated July 14, 2009 to Pier 1 Imports, Inc. Stock Purchase Plan, incorporated herein by reference to Exhibit 10.8.2 to the Company's Form 10-Q for the quarter ended August 29, 2009 (File No. 001-07832). | |
| 10.7.3* | Third Amendment dated June 29, 2010 to Pier 1 Imports, Inc. Stock Purchase Plan, incorporated herein by reference to Exhibit 10.1 to the Company's Form 10-Q for the quarter ended May 29, 2010 (File No. 001-07832). | |
| 10.8 | Amended and Restated Credit Agreement, dated April 4, 2011, among Pier 1 Imports (U.S.), Inc., Bank of America, N.A., as administrative and collateral agent, Merrill Lynch, Pierce, Fenner & Smith Incorporated and Wells Fargo Capital Finance, LLC as joint lead arrangers and joint lead bookrunners, various other agents and the lenders party thereto, and the facility guarantors party thereto, incorporated herein by reference to Exhibit 10.8.4 to the Company's Form 10-K for the year ended February 26, 2011 (File No. 001-07832). | |
| 10.9* | Pier 1 Umbrella Trust, dated December 21, 2005, incorporated herein by reference to Exhibit 10.1 to the Company's Form 8-K filed December 21, 2005 (File No. 001-07832). | |
| 10.9.1* | Pier 1 Umbrella Trust Amendment No. 1, effective January 1, 2009, incorporated herein by reference to Exhibit 10.2 to the Company's Form 10-Q for the quarter ended November 29, 2008 (File No. 001-07832). | |
| 10.9.2* | Pier 1 Umbrella Trust Amendment No. 2, effective January 1, 2011, incorporated herein by reference to Exhibit 10.1 to the Company's Form 10-Q for the quarter ended November 27, 2010 (File No. 001-07832). | |
| 10.10* | Pier 1 Imports, Inc. 2006 Stock Incentive Plan (Omnibus Plan), Restated as Amended through March 25, 2011, incorporated herein by reference to Exhibit 10.10 to the Company's Form 10-K for the year ended February 26, 2011 (File No. 001-07832). | |
| 10.10.1* | Form of Non-Qualified Stock Option Agreement – Non-Employee Director, incorporated herein by reference to Exhibit 10.2 to the Company's Form 8-K filed June 23, 2006 (File No. 001-07832). | |
| 10.10.2* | Form of Non-Qualified Stock Option Agreement – Employee Participant, incorporated herein by reference to Exhibit 10.3 to the Company's Form 8-K filed June 23, 2006 (File No. 001-07832). | |
| 10.10.3* | Form of Restricted Stock Award Agreement – April 9, 2010 Performance-Based Award, incorporated herein by reference to Exhibit 10.2 to the Company's Form 8-K filed on April 14, 2010 (File No. 001-07832). | |
| 10.10.4* | Form of Restricted Stock Award Agreement – April 9, 2010 Time-Based Award, incorporated herein by reference to Exhibit 10.3 to the Company's Form 8-K filed on April 14, 2010 (File No. 001-07832). | |
| 10.10.5* | Form of Restricted Stock Award Agreement – April 8, 2011 Performance-Based Award, incorporated herein by reference to Exhibit 10.2 to the Company's Form 8-K filed on April 14, 2011 (File No. 001-07832). | |
| 10.10.6* | Form of Restricted Stock Award Agreement – April 8, 2011 Time-Based Award, incorporated herein by reference to Exhibit 10.3 to the Company's Form 8-K filed on April 14, 2011 (File No. 001-07832). | |
| 10.10.7* | Form of Restricted Stock Award Agreement – April 6, 2012 Performance-Based Award, incorporated herein by reference to Exhibit 10.2 to the Company's Form 8-K filed on April 12, 2012 (File No. 001-07832). | |
| 10.10.8* | Form of Restricted Stock Award Agreement – April 6, 2012 Time-Based Award, incorporated herein by reference to Exhibit 10.3 to the Company's Form 8-K filed on April 12, 2012 (File No. 001-07832). | |
| 10.10.9* | Form of Restricted Stock Award Agreement – April 6, 2012 Performance-Based Award ("TSR"), incorporated herein by reference to Exhibit 10.4 to the Company's Form 8-K filed on April 12, 2012 (File No. 001-07832). | |
| 10.10.10* | Form of Restricted Stock Award Agreement – April 12, 2013 Performance-Based Award, incorporated herein by reference to Exhibit 10.2 to the Company's Form 8-K filed on April 18, 2013 (File No. 001-07832). | |
| 10.10.11* | Form of Restricted Stock Award Agreement – April 12, 2013 Time-Based Award, incorporated herein by reference to Exhibit 10.3 to the Company's Form 8-K filed on April 18, 2013 (File No. 001-07832). | |
| 10.10.12* | Form of Restricted Stock Award Agreement – April 12, 2013 Performance-Based Award ("TSR"), incorporated herein by reference to Exhibit 10.4 to the Company's Form 8-K filed on April 18, 2013 (File No. 001-07832). | |
| 10.11* | Pier 1 Imports Non-Employee Director Compensation Plan, incorporated herein by reference to Exhibit 10.2 to the Company's Form 10-Q for the quarter ended August 26, 2006 (File No. 001-07832). | |
| 10.11.1* | Pier 1 Imports Non-Employee Director Compensation Plan, as amended March 4, 2007, incorporated herein by reference to Exhibit 10.22.1 to the Company's Form 10-K for the year ended March 3, 2007 (File No. 001-07832). | |
| 10.11.2* | Pier 1 Imports Non-Employee Director Compensation Plan, as amended March 25, 2008, incorporated herein by reference to Exhibit 10.16.2 to the Company's Form 10-K for the year ended March 1, 2008 (File No. 001-07832). | |
| 10.11.3* | Pier 1 Imports Non-Employee Director Compensation Plan, as amended December 15, 2008, incorporated by reference to Exhibit 10.7 to the Company's Form 10-Q for the quarter ended November 29, 2008 (File No. 001-07832). | |
| 10.11.4* | Pier 1 Imports Non-Employee Director Compensation Plan, as amended through October 9, 2009, incorporated herein by reference to Exhibit 10.2 to the Company's Form 10-Q for the quarter ended November 28, 2009 (File No. 001-07832). | |
| 10.11.5* | Pier 1 Imports Non-Employee Director Compensation Plan, as amended through October 8, 2010, incorporated herein by reference to Exhibit 10.4 to the Company's Form 10-Q for the quarter ended November 27, 2010 (File No. 001-07832). | |
| 10.12* | Pier 1 Benefit Restoration Plan I, as amended and restated effective January 1, 2005, incorporated herein by reference to Exhibit 10.1 to the Company's Form 8-K filed October 12, 2006 (File No. 001-07832). | |
| 10.13* | Pier 1 Benefit Restoration Plan II, as amended and restated effective January 1, 2009, incorporated herein by reference to Exhibit 10.3 to the Company's Form 10-Q for the quarter ended November 29, 2008 (File No. 001-07832). | |
| 10.13.1* | Amendment No. 1, effective January 1, 2011, to Pier 1 Benefit Restoration Plan II, as amended and restated effective January 1, 2009, incorporated herein by reference to Exhibit 10.3 to the Company's Form 10-Q for the quarter ended November 27, 2010 (File No. 001-07832). | |
| 10.14* | Form of Non-Qualified Stock Option Agreement between Alexander W. Smith and Pier 1 Imports, Inc., incorporated herein by reference to Exhibit 10.2 to the Company's Form 8-K filed January 30, 2007 (File No. 001-07832). | |
| 10.15* | Form of Non-Qualified Stock Option Agreement between Alexander W. Smith and Pier 1 Imports, Inc., incorporated herein by reference to Exhibit 10.3 to the Company's Form 8-K filed January 30, 2007 (File No. 001-07832). | |
| 10.15.1* | First Amendment to Non-Qualified Stock Option Agreement between Alexander W. Smith and Pier 1 Imports, Inc. dated October 6, 2008, incorporated herein by reference to Exhibit 10.19.4 to the Company's Form 10-Q for the quarter ended August 30, 2008 (File No. 001-07832). | |
| 10.16* | Employment Agreement dated as of December 15, 2009 by and between Alexander W. Smith and Pier 1 Imports, Inc., incorporated herein by reference to Exhibit 10.1 to the Company's Form 8-K filed on December 17, 2009 (File No. 001-07832). | |
| 10.16.1* | Restricted Stock Award Agreement dated December 18, 2009 by and between Alexander W. Smith and Pier 1 Imports, Inc., incorporated herein by reference to Exhibit 10.1 to the Company's Form 8-K filed on December 22, 2009 (File No. 001-07832). | |
| 10.16.2* | Restricted Stock Award Agreement dated February 28, 2010 by and between Alexander W. Smith and Pier 1 Imports, Inc., incorporated herein by reference to Exhibit 10.1 to the Company's Form 8-K filed March 4, 2010 (File No. 001-07832). | |
| 10.16.3* | Restricted Stock Award Agreement dated February 28, 2010 by and between Alexander W. Smith and Pier 1 Imports, Inc., incorporated herein by reference to Exhibit 10.2 to the Company's Form 8-K filed March 4, 2010 (File No. 001-07832). | |
| 10.16.4* | Restricted Stock Award Agreement dated February 27, 2011 by and between Alexander W. Smith and Pier 1 Imports, Inc., incorporated herein by reference to Exhibit 10.1 to the Company's Form 8-K filed on March 3, 2011 (File No. 001-07832). | |
| 10.16.5* | Amendment to Restricted Stock Award Agreement dated April 8, 2011 by and between Alexander W. Smith and Pier 1 Imports, Inc , incorporated herein by reference to Exhibit 10.14.10 to the Company's Form 10-K for the year ended February 26, 2011 (File No. 001-07832). | |
| 10.16.6* | Restricted Stock Award Agreement dated February 27, 2011 by and between Alexander W. Smith and Pier 1 Imports, Inc., incorporated herein by reference to Exhibit 10.2 to the Company's Form 8-K filed on March 3, 2011 (File No. 001-07832). | |
| 10.16.7* | Amendment to Restricted Stock Award Agreement dated April 8, 2011 by and between Alexander W. Smith and Pier 1 Imports, Inc, incorporated herein by reference to Exhibit 10.14.12 to the Company's Form 10-K for the year ended February 26, 2011 (File No. 001-07832). | |
| 10.16.8* | Restricted Stock Award Agreement dated February 26, 2012 by and between Alexander W. Smith and Pier 1 Imports, Inc., incorporated herein by reference to Exhibit 10.1 to the Company's Form 8-K filed on March 1, 2012 (File No. 001-07832). | |
| 10.16.9* | Restricted Stock Award Agreement dated February 26, 2012 by and between Alexander W. Smith and Pier 1 Imports, Inc., incorporated herein by reference to Exhibit 10.2 to the Company's Form 8-K filed on March 1, 2012 (File No. 001-07832). | |
| 10.16.10* | Employment Agreement dated as of June 13, 2012 by and between Alexander W. Smith and Pier 1 Imports, Inc., incorporated herein by reference to Exhibit 10.1 to the Company's Form 8-K filed on June 14, 2012 (File No. 001-07832). | |
| 10.16.11* | Restricted Stock Award Agreement dated March 3, 2013 by and between Alexander W. Smith and Pier 1 Imports, Inc. (time-based award agreement), incorporated herein by reference to Exhibit 10.1 to the Company's Form 8-K filed on March 7, 2013 (File No. 001-07832). | |
| 10.16.12* | Restricted Stock Award Agreement dated March 3, 2013 by and between Alexander W. Smith and Pier 1 Imports, Inc. (performance-based award agreement), incorporated herein by reference to Exhibit 10.2 to the Company's Form 8-K filed on March 7, 2013 (File No. 001-07832). | |
| 10.16.13* | Restricted Stock Award Agreement dated March 3, 2013 by and between Alexander W. Smith and Pier 1 Imports, Inc. (performance-based award [TSR] agreement), incorporated herein by reference to Exhibit 10.3 to the Company's Form 8-K filed on March 7, 2013 (File No. 001-07832). | |
| 10.17 | Office Lease between Chesapeake Plaza, L.L.C. and Pier 1 Services Company, dated June 9, 2008, incorporated herein by reference to Exhibit 10.1 to the Company's Form 10-Q for the quarter ended May 31, 2008 (File No. 001-07832). | |
| 10.17.1 | First Amendment to Office Lease, dated June 20, 2008, incorporated herein by reference to Exhibit 10.1.1 to the Company's Form 10-Q for the quarter ended May 31, 2008 (File No. 001-07832). | |
| 10.17.2 | Second Amendment to Office Lease between Chesapeake Plaza, L.L.C. and Pier 1 Services Company, dated July 1, 2011, incorporated herein by reference to Exhibit 10.1 to the Company's Form 10-Q for the quarter ended May 28, 2011 (File No. 001-07832). | |
| 10.17.3 | Third Amendment to Office Lease between Chesapeake Plaza, L.L.C. and Pier 1 Services Company, dated January 28, 2013. | |
| 10.18* | Summary Plan Description of Pier 1 Imports Limited Severance Plan, Restated as of January 1, 2009, incorporated herein by reference to Exhibit 10.1 to the Company's Form 10-Q for the quarter ended November 29, 2008 (File No. 001-07832). | |
| 10.19* | Pier 1 Imports, Inc. Deferred Compensation Plan, effective January 1, 2011, incorporated herein by reference to Exhibit 10.2 to the Company's Form 10-Q for the quarter ended November 27, 2010 (File No. 001-07832). | |
| 10.19.1* | Pier 1 Imports, Inc. Deferred Compensation Plan Amendment No. 1, effective January 1, 2013, incorporated herein by reference to Exhibit 10.1 to the Company's Form 10-Q for the quarter ended November 24, 2012 (File No. 001-07832). | |
| 10.20 | Private Label Credit Card Plan Agreement by and between World Financial Network Bank and Pier 1 Imports (U.S.), Inc., dated October 5, 2011, incorporated herein by reference to Exhibit 10.1 to the Company's Form 8-K filed on October 7, 2011 (File No. 001-07832). Some of the schedules and an exhibit to this agreement have been omitted pursuant to an order granting confidential treatment. | |
| 10.21* | ERISA Plan Document and Summary Plan Description for the Pier 1 Imports, Inc. Supplemental Individual Disability Income Benefit Plan, effective September 1, 2012, incorporated herein by reference to Exhibit 10.2 to the Company's Form 10-Q for the quarter ended November 24, 2012 (File No. 001-07832). | |
| 10.22* | Summary Plan Description for Pier 1 Imports, Inc. Employee Life Insurance (Basic Insurance, Class 1), effective June 1, 2012. | |
| 21 | Subsidiaries of the Company. | |
| 23 | Consent of Ernst & Young LLP. | |
| 31.1 | Certification of the Chief Executive Officer Pursuant to Exchange Act Rule 13a-14(a)/15d-14(a). | |
| 31.2 | Certification of the Chief Financial Officer Pursuant to Exchange Act Rule 13a-14(a)/15d-14(a). | |
| 32.1 | Certification of Chief Executive Officer and Chief Financial Officer pursuant to 18 U.S.C. Section 1350, as adopted pursuant to Section 906 of the Sarbanes-Oxley Act of 2002. | |
| 99.1 | Pier 1 Imports, Inc. Stock Purchase Plan Audit Report. | |
| 101.INS**+ | XBRL Instance Document. | |
| 101.SCH**+ | XBRL Taxonomy Extension Schema Document. | |
| 101.CAL**+ | XBRL Taxonomy Extension Calculation Linkbase Document. | |
| 101.DEF**+ | XBRL Taxonomy Extension Definition Linkbase Document. | |
| 101.LAB**+ | XBRL Taxonomy Extension Label Linkbase Document. | |
| 101.PRE**+ | XBRL Taxonomy Extension Presentation Linkbase Document. | |
| *Management | Contracts and Compensatory Plans |