Table of Contents
UNITED STATES
SECURITIES AND EXCHANGE COMMISSION
Washington, D.C. 20549
FORM 10-K
| (Mark One) | ||
ý | | ANNUAL REPORT PURSUANT TO SECTION 13 OR 15(d) OF THE SECURITIES EXCHANGE ACT OF 1934 |
For the fiscal year ended February 28, 2009. | ||
OR | ||
o | | TRANSITION REPORT PURSUANT TO SECTION 13 OR 15(d) OF THE SECURITIES EXCHANGE ACT OF 1934 |
For the transition period from to | ||
Commission File No. 001-07832
PIER 1 IMPORTS, INC.
(Exact name of registrant as specified in its charter)
| DELAWARE (State or other jurisdiction of incorporation or organization) | 75-1729843 (I.R.S. Employer Identification No.) | |
100 Pier 1 Place Fort Worth, Texas (Address of principal executive offices) | | 76102 (Zip Code) |
Company's telephone number, including area code: (817) 252-8000
Securities registered pursuant to Section 12(b) of the Act:
| Title of each class | Name of each exchange on which registered | |
|---|---|---|
| Common Stock, $1.00 par value | New York Stock Exchange |
Securities registered pursuant to Section 12(g) of the Act: None
Indicate by check mark if the registrant is a well-known seasoned issuer, as defined in Rule 405 of the Securities Act. Yes o No ý
Indicate by check mark if the registrant is not required to file reports pursuant to Section 13 or Section 15(d) of the Act. Yes o No ý
Indicate by check mark whether the registrant (1) has filed all reports required to be filed by Section 13 or 15(d) of the Securities Exchange Act of 1934 during the preceding 12 months (or for such shorter period that the registrant was required to file such reports), and (2) has been subject to such filing requirements for the past 90 days. Yes ý No o
Indicate by check mark whether the registrant has submitted electronically and posted on its corporate Web site, if any, every Interactive Data File required to be submitted and posted pursuant to Rule 405 Regulation S-T during the preceding 12 months (or for such shorter period that the registrant was required to submit and post such files). Yes o No o
Indicate by check mark if disclosure of delinquent filers pursuant to Item 405 of Regulation S-K is not contained herein, and will not be contained, to the best of the registrant's knowledge, in definitive proxy or information statements incorporated by reference in Part III of this Form 10-K or any amendment to this Form 10-K. ý
Indicate by check mark whether the registrant is a large accelerated filer, an accelerated filer, a non-accelerated filer, or a smaller reporting company. See the definitions of "large accelerated filer," "accelerated filer" and "smaller reporting company" in Rule 12b-2 of the Exchange Act.
| Large accelerated filer o | Accelerated filer ý | Non-accelerated filer o (Do not check if a smaller reporting company) | Smaller reporting company o |
Indicate by check mark whether the registrant is a shell company (as defined in Rule 12b-2 of the Act). Yes o No ý
As of August 29, 2008, the approximate aggregate market value of the registrant's common stock held by non-affiliates of the registrant was $391,319,000 based on the closing sales price on that day of $4.42 as reported by the New York Stock Exchange.
As of April 29, 2009, 90,546,034 shares of the registrant's common stock, $1.00 par value, were outstanding.
DOCUMENTS INCORPORATED BY REFERENCE
Portions of the following documents have been incorporated herein by reference:
1) Registrant's Proxy Statement for the 2009 Annual Meeting in Part III hereof.
Table of Contents
PIER 1 IMPORTS, INC.
FORM 10-K ANNUAL REPORT
Fiscal Year Ended February 28, 2009
TABLE OF CONTENTS
| | | PAGE | ||
|---|---|---|---|---|
| PART I | |||
Item 1. | Business. | 3 | ||
Item 1A. | Risk Factors. | 7 | ||
Item 1B. | Unresolved Staff Comments. | 14 | ||
Item 2. | Properties. | 15 | ||
Item 3. | Legal Proceedings. | 16 | ||
Item 4. | Submission of Matters to a Vote of Security Holders. | 16 | ||
| PART II | |||
Item 5. | Market for the Registrant's Common Equity, Related Stockholder Matters and Issuer Purchases of Equity Securities. | 16 | ||
Item 6. | Selected Financial Data. | 18 | ||
Item 7. | Management's Discussion and Analysis of Financial Condition and Results of Operations. | 20 | ||
Item 7A. | Quantitative and Qualitative Disclosures About Market Risk. | 36 | ||
Item 8. | Financial Statements and Supplementary Data. | 38 | ||
Item 9. | Changes in and Disagreements with Accountants on Accounting and Financial Disclosure. | 78 | ||
Item 9A. | Controls and Procedures. | 78 | ||
Item 9B. | Other Information. | 79 | ||
| PART III | |||
Item 10. | Directors, Executive Officers and Corporate Governance. | 80 | ||
Item 11. | Executive Compensation. | 80 | ||
Item 12. | Security Ownership of Certain Beneficial Owners and Management and Related Stockholder Matters. | 80 | ||
Item 13. | Certain Relationships and Related Transactions, and Director Independence. | 80 | ||
Item 14. | Principal Accounting Fees and Services. | 80 | ||
| PART IV | |||
Item 15. | Exhibits, Financial Statement Schedules. | 81 |
Table of Contents
PART I
Item 1. Business.
(a) General Development of Business.
Pier 1 Imports, Inc. was incorporated as a Delaware corporation in 1986. Throughout this report, references to the "Company" include Pier 1 Imports, Inc. and its consolidated subsidiaries. References to "Pier 1 Imports" relate to the Company's retail locations operating under the name Pier 1 Imports®. References to "Pier 1 Kids" relate to the Company's retail locations that operated under the name Pier 1 Kids®.
On March 20, 2006, the Company announced the sale of its subsidiary based in the United Kingdom, The Pier Retail Group Limited ("The Pier"). The Pier has been included in discontinued operations in the Company's financial statements for fiscal 2007 and prior years. All discussions in this report relate to continuing operations, unless stated otherwise.
In fiscal 2009, the Company closed 26 stores and opened one new Pier 1 Imports store, a relocation of an existing store in Flushing, New York. During the fourth quarter of fiscal 2009, the Company began negotiating with landlords to achieve rental reductions across its store portfolio. Unsuccessful rental reduction negotiations may lead to the execution of early termination agreements for underperforming store locations. The Company expects these negotiations to be on-going throughout the upcoming fiscal year.
As of the end of fiscal 2009, the Company maintained regional distribution center facilities in or near Baltimore, Maryland; Chicago, Illinois; Columbus, Ohio; Fort Worth, Texas; Ontario, California; Savannah, Georgia; and Tacoma, Washington. The Company plans to cease operations at its Company-owned 514,000 square foot distribution center near Chicago, Illinois, by the end of the first quarter of fiscal 2010.
The Company has an arrangement to supply Grupo Sanborns, S.A. de C.V. ("Grupo Sanborns") with merchandise to be sold primarily in a "store within a store" format in certain stores operated by Grupo Sanborns' subsidiaries, Sears Roebuck de Mexico, S.A. de C.V. ("Sears Mexico") and Dorian's Tijuana, S.A. de C.V. ("Dorian's"). The agreement with Grupo Sanborns will expire January 1, 2012. The agreement is structured in a manner which substantially insulates the Company from currency fluctuations in the value of the Mexican peso. In fiscal 2009, Grupo Sanborns opened three new "store within a store" locations and one free-standing location offering Pier 1 Imports merchandise. As of February 28, 2009, Pier 1 Imports merchandise was offered in 34 Sears Mexico stores and one Dorian's store. Grupo Sanborns has no plans for new "store within a store" or "free-standing" locations in Mexico during fiscal 2010. Since Sears Mexico operates these locations, the Company has no employee or real estate obligations in Mexico.
The Company has a product distribution agreement with Sears Roebuck de Puerto Rico, Inc. ("Sears Puerto Rico"), which allows Sears Puerto Rico to market and sell Pier 1 Imports merchandise in a "store within a store" format in certain Sears Puerto Rico stores. The Company has no employee or real estate obligations in Puerto Rico because Sears Puerto Rico operates these locations. As of February 28, 2009, Pier 1 Imports merchandise was offered in seven Sears Puerto Rico stores. Sears Puerto Rico has no plans for new "store within a store" locations in Puerto Rico during fiscal 2010.
During fiscal 2007, the Company sold its credit card operations, which included its credit card bank located in Omaha, Nebraska, that operated under the name Pier 1 National Bank, N.A. (the "Bank") to Chase Bank USA, N.A. ("Chase"). The sale was comprised of the Company's proprietary credit card receivables, certain charged-off accounts and the common stock of the Bank. The Company and Chase have entered into a long-term program agreement. Under this agreement, the Company
3
Table of Contents
continues to support the card through marketing programs and receives payments over the life of the agreement for transaction level incentives, marketing support and other program terms.
In August 2007, the Company discontinued its e-commerce business. The Company continues to use its web site, www.pier1.com , for marketing and product information, plus investor relations purposes.
(b) Financial Information about Industry Segments.
In fiscal 2009, the Company conducted business as one operating segment consisting of the retail sale of decorative home furnishings, gifts and related items.
Financial information with respect to the Company's business is found in the Company's Consolidated Financial Statements, which are set forth in Item 8 herein.
(c) Narrative Description of Business.
The specialty retail operations of the Company consist of retail stores operating under the name "Pier 1 Imports", selling a wide variety of furniture, decorative home furnishings, dining and kitchen goods, epicurean products, bath and bedding accessories, candles and other specialty items for the home.
On February 28, 2009, the Company operated 1,011 Pier 1 Imports stores in the United States and 81 Pier 1 Imports stores in Canada. During fiscal 2009, the Company supplied merchandise and licensed the Pier 1 Imports name to Grupo Sanborns and Sears Puerto Rico, which sold Pier 1 Imports merchandise primarily in a "store within a store" format in 34 Sears Mexico stores, one Dorian's store and in seven Sears Puerto Rico stores. Pier 1 Imports stores in the United States and Canada average approximately 9,900 gross square feet, which includes an average of approximately 7,900 square feet of retail selling space. The stores consist of freestanding units located near shopping centers or malls and in-line positions in major shopping centers. Pier 1 Imports operates in all major U.S. metropolitan areas and many of the primary smaller markets. Pier 1 Imports stores generally have their highest sales volumes during November and December as a result of the holiday selling season. In fiscal 2009, net sales of the Company totaled $1.3 billion.
Pier 1 Imports offers a unique selection of merchandise consisting of more than 4,000 items imported from over 50 countries around the world. While the broad categories of Pier 1 Imports' merchandise remain fairly constant, individual items within these merchandise categories change frequently in order to meet the changing demands and preferences of customers. The principal categories of merchandise include the following:
DECORATIVE ACCESSORIES -This merchandise group constitutes the broadest category of merchandise in Pier 1 Imports' sales mix and contributed approximately 60% to Pier 1 Imports' total U.S. and Canadian retail sales in fiscal year 2009, 59% in fiscal year 2008 and 57% in fiscal year 2007. These items are imported primarily from Asian and European countries, as well as some domestic sources. This category includes decorative wood accessories, lamps, vases, dried and artificial flowers, baskets, ceramics, dinnerware, bath and fragrance products, candles, bedding, epicurean products, and seasonal and gift items.
FURNITURE -This merchandise group consists of furniture and furniture cushions to be used in living, dining, office, kitchen and bedroom areas, sunrooms, and on patios. Also included in this group are wall decorations and mirrors. This product group constituted approximately 40% of Pier 1 Imports' total U.S. and Canadian retail sales in fiscal year 2009, 41% in fiscal year 2008 and 43% in fiscal year 2007. These goods are imported from a variety of countries such as Vietnam, Malaysia, Brazil, Thailand, China, the Philippines, India and Indonesia, and are also obtained from domestic sources.
4
Table of Contents
This merchandise is made of metal or handcrafted natural materials, including rattan, pine, beech, rubberwood and selected hardwoods with either natural, stained, painted or upholstered finishes.
Pier 1 Imports merchandise largely consists of items that feature a significant degree of handcraftsmanship and are mostly imported directly from foreign suppliers. For the most part, the imported merchandise is handcrafted in cottage industries and small factories. Pier 1 Imports has enjoyed long-standing relationships with many vendors and agents and is not dependent on any particular supplier. The Company believes alternative sources of merchandise could be procured over a relatively short period of time, if necessary. In selecting the source of merchandise, Pier 1 Imports considers quality, dependability of delivery, and cost. During fiscal 2009, Pier 1 Imports sold merchandise imported from over 50 different countries with over 40% of its sales derived from merchandise produced in China. The remainder of its merchandise is sourced from India, Indonesia and other countries around the world.
Imported merchandise and a portion of domestic purchases are delivered to the Company's distribution centers, unpacked and made available for shipment to the various stores in each distribution center's region.
The Company, through one of its wholly owned subsidiaries, owns a number of federally registered trademarks and service marks under which Pier 1 Imports stores do business. Additionally, certain subsidiaries of the Company have registered and have applications pending for the registration of certain other Pier 1 Imports trademarks and service marks in the United States and in numerous foreign countries. The Company believes that its marks have significant value and are important in its marketing efforts. The Company maintains a policy of pursuing registration of its marks and opposing any infringement of its marks.
The Company operates in the highly competitive specialty retail business and competes primarily with specialty sections of large department stores, furniture and decorative home furnishings retailers, small specialty stores, and mass merchandising discounters.
The Company allows customers to return merchandise within a reasonable time after the date of purchase without limitation as to reason. Most returns occur within 30 days of the date of purchase. The Company monitors the level of returns and maintains a reserve for future returns based on historical experience and other known factors.
On February 28, 2009, the Company employed approximately 16,700 associates in the United States and Canada, of which approximately 3,500 were full-time employees and 13,200 were part-time employees.
(d) Financial Information about Geographic Areas.
Information required by this Item is found in Note 1 of the Notes to the Consolidated Financial Statements .
(e) Available Information.
The Company makes available free of charge through its Internet web site address ( www.pier1.com ) its annual reports on Form 10-K, quarterly reports on Form 10-Q, current reports on Form 8-K, and amendments to those reports filed with the Securities and Exchange Commission (the "SEC") pursuant to Section 13(a) of the Securities Exchange Act of 1934 as soon as reasonably practicable after it electronically files such material with, or furnishes such material to, the SEC.
Certain statements contained in Item 1, Item 1A, Item 7, Item 7A, Item 8 and elsewhere in this report may constitute "forward-looking statements" within the meaning of Section 21E of the Securities Exchange Act of 1934. The Company may also make forward-looking statements in other reports filed
5
Table of Contents
with the SEC and in material delivered to the Company's shareholders. Forward-looking statements provide current expectations of future events based on certain assumptions. These statements encompass information that does not directly relate to any historical or current fact and often may be identified with words such as "anticipates," "believes," "expects," "estimates," "intends," "plans," "projects" and other similar expressions. Management's expectations and assumptions regarding planned store openings and closings, financing of Company obligations from operations, success of its marketing, merchandising and store operations strategies, and other future results are subject to risks, uncertainties and other factors that could cause actual results to differ materially from the anticipated results or other expectations expressed in the forward-looking statements. Risks and uncertainties that may affect Company operations and performance include, among others, the effects of terrorist attacks or other acts of war, conflicts or war involving the United States or its allies or trading partners, labor strikes, weather conditions or natural disasters, volatility of fuel and utility costs, the on-going recession and related financial crisis and the actions taken by the United States and other countries to stimulate the economy or to prevent the worsening of the financial crisis, the general strength of the economy and levels of consumer spending, consumer confidence, the availability of suitable sites for locating stores and distribution centers, the availability of a qualified labor force and management, the availability and proper functioning of technology and communications systems supporting the Company's key business processes, the ability of the Company to import merchandise from foreign countries without significantly restrictive tariffs, duties or quotas, and the ability of the Company to source, ship and deliver items of acceptable quality to its U.S. distribution centers at reasonable prices and rates and in a timely fashion. The foregoing risks and uncertainties are in addition to others discussed elsewhere in this report which may also affect Company operations and performance. The Company assumes no obligation to update or otherwise revise its forward-looking statements even if experience or future changes make it clear that any projected results expressed or implied will not be realized.
Executive Officers of the Company
ALEXANDER W. SMITH, age 56, has been a director of Pier 1 Imports, has served as President and Chief Executive Officer and has been a member of Pier 1 Imports' Executive Committee since February 19, 2007. From March 2004 to February 18, 2007, Mr. Smith served as the Senior Executive Vice President, Group President of The TJX Companies, Inc. From 2001 to March 2004, Mr. Smith served as Executive Vice President, Group Executive, International of The TJX Companies, Inc.
CHARLES H. TURNER, age 52, has served as Executive Vice President of the Company since April 2002 and has served as Chief Financial Officer of the Company since August 1999. He served as Senior Vice President of Finance of the Company from August 1999 to April 2002. He served as Senior Vice President of Stores of the Company from August 1994 to August 1999, and served as Controller and Principal Accounting Officer of the Company from January 1992 to August 1994.
GREGORY S. HUMENESKY, age 57, has served as Executive Vice President of Human Resources of the Company since February 2005. Prior to joining the Company, he served as Senior Vice President of Human Resources at Zale Corporation from April 1996 to February 2005.
JAY R. JACOBS, age 54, served as Executive Vice President of Merchandising of the Company from April 2002 to March 2009. He served as Senior Vice President of Merchandising of the Company from May 1995 to April 2002. He served as Vice President of Divisional Merchandising of Pier 1 Imports (U.S.), Inc. from May 1993 to May 1995, and served as Director of Divisional Merchandising of Pier 1 Imports (U.S.), Inc. from July 1991 to May 1993. On March 4, 2009 Mr. Jacobs announced his retirement from the Company. As of that date he will no longer serve as Executive Vice President of Merchandising for the Company. He will, however, continue his employment through March 1, 2010 to ensure continuity throughout the transition of his duties.
6
Table of Contents
SHARON M. LEITE, age 46, has served as Executive Vice President of Stores of the Company since September 2007. Prior to joining the Company, she served as Vice President of Store Operations at Bath & Body Works from April 2001 to August 2007.
MICHAEL A. CARTER, age 50, has served as Senior Vice President and General Counsel, Secretary of the Company since December 2005. He served as Vice President-Legal Affairs of Pier 1 Imports, (U.S.), Inc. from April 1999 to December 2005. He served as Corporate Counsel of Pier 1 Imports (U.S.), Inc. from March 1990 until April 1999. He served as Assistant Secretary of the Company from April 1991 until December 2005.
The officers of the Company are appointed by the Board of Directors, hold office until their successors are elected and qualified and/or until their earlier death, resignation or removal. None of the above executive officers has any family relationship with any other of such officers or with any director of the Company. None of such officers was selected pursuant to any arrangement or understanding between him and any other person.
Item 1A. Risk Factors.
The following information describes certain significant risks and uncertainties inherent in the Company's business that should be carefully considered, along with other information contained elsewhere in this report and in other filings, when making an investment decision with respect to the Company. If one or more of these risks actually occurs, the impact on the Company's operations, financial position, or liquidity could be material and the business could be harmed substantially. Additional risks and uncertainties not presently known to the Company or that it currently believes are immaterial may also adversely affect the Company's business, financial condition, future results of operations and cash flow. In addition to the risks discussed below, the Company is also subject to certain market risks as described in Item 7A to this report.
Strategic Risks and Strategy Execution Risks
The deterioration of the United States economy and its impact on consumer confidence and spending could continue for an unspecified period of time, and could further adversely impact the Company's results of operations.
The United States economy remains in a deep recession and is suffering from a near collapse of the credit and financial markets. The market value of domestic and foreign companies has declined significantly since August 2008, which has adversely affected the savings and investments of United States consumers. Consumer confidence and spending have deteriorated significantly as a result of this current market turmoil. The difficult economic situation faced in the United States and other countries may not end in the near future and consumer confidence and spending could remain depressed and possibly deteriorate even further. During times of economic uncertainty, consumers tend to sacrifice purchases of discretionary items, including the Company's merchandise, which could continue to adversely impact the Company's financial results and turnaround plan.
The success of the business is dependent on factors affecting consumer spending that are not controllable by the Company.
Consumer spending, including spending for the home and home-related furnishings, are further dependent upon factors besides general economic conditions and include, but are not limited to, levels of employment, disposable consumer income, prevailing interest rates, consumer debt, costs of fuel, inflation, recession and fears of recession, war and fears of war, inclement weather, tax rates and rate increases, consumer confidence in future economic conditions and political conditions, and consumer perceptions of personal well-being and security. Unfavorable changes in factors affecting discretionary
7
Table of Contents
spending could reduce demand for the Company's products and therefore lower sales and negatively impact the business and its operating results.
The Company's turnaround strategy may cause a disruption in operations and may not be successful.
The Company began implementing a strategy during fiscal 2008 for returning the Company to profitability. The turnaround strategy may negatively impact the Company's operations, which could include disruptions from the realignment of operational functions within the home office and distribution centers, changes in the store administration reporting structure, and changes in the Company's product assortments or marketing strategies. These changes could adversely affect the Company's business operations and financial results. While the Company believes any disruptions would be short-term, it is unknown whether the impact would be material. In addition, if the Company's turnaround strategy is not successful, takes longer than initially projected, or is not executed effectively, the Company's business operations and financial results could be adversely affected.
The Company must be able to anticipate, identify and respond to changing trends and customer preferences for home furnishings.
The success of the Company's specialty retail business depends largely upon its ability to predict trends in home furnishings consistently and to provide merchandise that satisfies consumer demand in a timely manner. Consumer preferences often change and may not be reasonably predicted. A majority of the Company's merchandise is manufactured, purchased and imported from countries around the world and may be ordered well in advance of the applicable selling season. Extended lead times may make it difficult to respond rapidly to changes in consumer demand and as a result, the Company may be unable to react quickly and source needed merchandise. In addition, the Company's vendors may not have the ability to handle its increased demand for product. The seasonal nature of the business leads the Company to purchase and requires it to carry a significant amount of inventory prior to its peak selling season. As a result, the Company may be vulnerable to evolving home furnishing trends, changes in customer preferences, and pricing shifts, and may misjudge the timing and selection of merchandise purchases. The Company's failure to anticipate, predict and respond in a timely manner to changing home furnishing trends could lead to lower sales and additional discounts and markdowns in an effort to clear merchandise, which could have a negative impact on merchandise margins and in turn the results of operations.
Failure to control merchandise returns could negatively impact the business.
The Company has established a provision for estimated merchandise returns based upon historical experience and other known factors. If actual returns are greater than those projected by management, additional reductions of revenue could be recorded in the future. Also, to the extent that returned merchandise is damaged, the Company may not receive full retail value from the resale of the returned merchandise. Introductions of new merchandise, changes in merchandise mix, merchandise quality issues, changes in consumer confidence, or other competitive and general economic conditions may cause actual returns to exceed the provision for estimated merchandise returns. An increase in merchandise returns that exceeds the Company's current provisions could negatively impact the business and operating results.
A disruption in the operation of the domestic portion of the Company's supply chain could impact its ability to deliver merchandise to its stores and customers, which could impact its sales and results of operations.
The Company maintains regional distribution centers in Maryland, Illinois, Ohio, Texas, California, Georgia and Washington. At these distribution centers, merchandise is received, allocated, and shipped to the Company's stores. Major catastrophic events such as fire or flooding, malfunction or disruption
8
Table of Contents
of the information systems, or shipping problems could result in distribution delays of merchandise to the Company's stores and customers. Such disruptions could have a negative impact on the Company's sales and results of operations.
Factors that may or may not be controllable by the Company may adversely affect the Company's financial performance.
Increases in the Company's expenses that are beyond the Company's control including items such as increases in fuel and transportation costs, higher interest rates, increases in losses from damaged merchandise, inflation, fluctuations in foreign currency rates, higher costs of labor, insurance and healthcare, increases in postage and media costs, higher tax rates and changes in laws and regulations, including accounting standards, may negatively impact the Company's operating results.
Failure to successfully manage and execute the Company's marketing initiatives could have a negative impact on the business.
The success and growth of the Company is partially dependent on generating customer traffic in order to gain sales momentum in its stores. Successful marketing efforts require the ability to reach customers through their desired mode of communication utilizing various media outlets. Media placement decisions are generally made months in advance of the scheduled release date. The Company's inability to accurately predict its consumers' preferences or to utilize the desired mode of communication may negatively impact the business and operating results.
Changes to estimates related to the Company's property and equipment, or operating results that are lower than its current estimates at certain store locations, may cause the Company to incur impairment charges on certain long-lived assets.
The Company makes certain estimates and projections with regards to individual store operations as well as overall Company performance in connection with its impairment analyses for long-lived assets in accordance with Statement of Financial Accounting Standards No. 144, "Accounting for the Impairment or Disposal of Long-Lived Assets." An impairment charge is required when the carrying value of the asset exceeds the estimated fair value or undiscounted future cash flows of the asset. The projection of future cash flows used in this analysis requires the use of judgment and a number of estimates and projections of future operating results. If actual results differ from the Company's estimates, additional charges for asset impairments may be required in the future. If impairment charges are significant, the Company's results of operations could be adversely affected.
Risks Related to Store Profitability
The Company's success depends, in part, on its ability to operate in desirable locations at reasonable rental rates and to close underperforming stores at or before the conclusion of their lease terms.
The profitability of the business is dependent on operating the current store base at a reasonable profit, opening and operating new stores at a reasonable profit, and identifying and closing underperforming stores. For a majority of the Company's current store base, a large portion of a stores' operating expense is the cost associated with leasing the location. Management actively monitors individual store performance and attempts to negotiate rent reductions to ensure stores can remain profitable or have the ability to rebound to a profitable state. Current locations may not continue to be desirable as demographics change, and the Company may choose to close an underperforming store before its lease expires and incur lease termination costs associated with that closing. The Company cannot give assurance that opening new stores or an increase in closings will result in greater profits.
9
Table of Contents
Failure to attract and retain an effective management team or changes in the costs or availability of a suitable workforce to manage and support the Company's stores and distribution facilities could adversely affect the business.
The Company's success is dependent, in a large part, on being able to successfully attract, motivate and retain a qualified management team and employees. Sourcing qualified candidates to fill important positions within the Company, especially management, in the highly competitive retail environment may prove to be a challenge. The inability to recruit and retain such individuals could result in turnover in the home office, stores and the distribution facilities, which could have an adverse effect on the business. Management will continue to assess the Company's compensation and benefit structure in an effort to attract future qualified candidates or retain current experienced management team members.
Occasionally the Company experiences union organizing activities in its non-unionized distribution facilities. These types of activities may result in work slowdowns or stoppages and higher labor costs. Any increase in costs associated with labor organization at the distribution facilities could result in higher costs to distribute inventory and could negatively impact merchandise margins.
The Company operates in a highly competitive retail environment with companies offering similar merchandise, and if customers are lost to the Company's competitors, sales could decline.
The Company's retail locations operate in the highly competitive specialty retail business competing with specialty sections of large department stores, home furnishing stores, small specialty stores and mass merchandising discounters. Management believes that as it is competing for sales, it does so on the basis of pricing and quality of products, constantly changing merchandise assortment, visual presentation of its merchandise and customer service. The Company could also experience added short-term competition when other retailers are liquidating merchandise for various reasons. If the Company is unable to maintain a competitive position, it could experience negative pressure on retail prices and loss of customers, which in turn could result in reduced merchandise margins and operating results.
The Company's business is subject to seasonal variations, with a significant portion of its sales and earnings occurring during two months of the year.
Approximately 25% of the Company's sales generally occur during the November-December holiday selling season. Failure to predict consumer demand correctly during these months could result in lost sales or gross margin erosion if merchandise must be marked down significantly to clear inventory.
The Company's business may be harmed by adverse weather conditions and natural disasters.
Extreme or undesirable weather can affect customer traffic in retail stores as well as customer shopping behavior. Natural disasters such as earthquakes, weather phenomena, and events causing infrastructure failures could adversely affect any of the Company's retail locations, distribution centers, administrative facilities, ports, or locations of its suppliers domestically and in foreign countries.
Risks Associated with Dependence on Technology
The Company is heavily dependent on various kinds of technology in the operation of its business.
Failure of any critical software applications, technology infrastructure, telecommunications, data communications, or networks could have a material adverse effect on the Company's ability to manage the merchandise supply chain, sell merchandise, accomplish payment functions or report financial data. Although the Company maintains off-site data backups, a concentration of technology related risk does exist in certain locations.
10
Table of Contents
The Company outsources certain business processes to third-party vendors that subject the Company to risks, including disruptions in business and increased costs.
Some business processes that are dependent on technology are outsourced to third parties. Such processes include gift card tracking and authorization, credit card authorization and processing, insurance claims processing, U.S. customs filings and reporting, certain payroll processing and tax filings, and record keeping for retirement plans. The Company makes a diligent effort to ensure that all providers of outsourced services are observing proper internal control practices, such as redundant processing facilities; however, there are no guarantees that failures will not occur. Failure of third parties to provide adequate services could have an adverse effect on the Company's results of operations, financial condition, or ability to accomplish its financial and management reporting.
Failure to protect the integrity and security of individually identifiable data of the Company's customers and employees could expose the Company to litigation and damage the Company's reputation.
The Company receives and maintains certain personal information about its customers and employees. The use of this information by the Company is regulated at the international, federal and state levels, as well as by certain third party contracts. If the Company's security and information systems are compromised or our business associates fail to comply with these laws and regulations and this information is obtained by unauthorized persons or used inappropriately, it could adversely affect the Company's reputation, as well as operations, results of operations and financial condition, and could result in litigation against the Company or the imposition of penalties. As privacy and information security laws and regulations change, the Company may incur additional costs to ensure it remains in compliance.
Regulatory Risks
The Company is subject to laws and regulatory requirements in many jurisdictions. Changes in these laws and requirements may result in additional costs to the Company, including the costs of compliance as well as potential penalties for non-compliance.
The Company operates in many local, state, and federal taxing jurisdictions, including foreign countries. In most of these jurisdictions, the Company is required to collect state and local sales taxes at the point of sale and remit them to the appropriate taxing authority. The Company is also subject to income taxes, excise taxes, franchise taxes, payroll taxes and other special taxes. The Company is also required to maintain various kinds of business and commercial licenses to operate its stores and other facilities. Rates of taxation are beyond the Company's control, and increases in such rates or taxation methods and rules could have a material impact on the Company's profitability. Failure to comply with laws concerning the collection and remittance of taxes and with licensing requirements could also subject the Company to financial penalties or business interruptions.
Local, state, and federal legislation also has a potential material effect on the Company's profitability or ability to operate its business. Compliance with certain legislation carries with it significant costs. The Company is subject to oversight by many governmental agencies in the course of operating its business because of its numerous locations, large number of employees, contact with consumers and importation and exportation of product. Complying with regulations may cause the Company to incur significant expenses, including the costs associated with periodic audits. Failure to comply may also cause additional costs in the form of penalties.
11
Table of Contents
Risks Associated with International Trade
As a retailer of imported merchandise, the Company is subject to certain risks that typically do not affect retailers of domestically produced merchandise.
The Company may order merchandise well in advance of delivery and generally takes title to the merchandise at the time it is loaded for transport to designated U.S. destinations. Global political unrest, war, threats of war, terrorist acts or threats, especially threats to foreign and U.S. ports, could affect the Company's ability to import merchandise from certain countries. Fluctuations in foreign currency exchange rates and the relative value of the U.S. dollar, restrictions on the convertibility of the dollar and other currencies, duties, taxes and other charges on imports, dock strikes, import quota systems and other restrictions sometimes placed on foreign trade can affect the price, delivery and availability of imported merchandise as well as exports to the Company's stores in other countries. The inability to import merchandise from China and other countries, unavailability of adequate shipping capacity at reasonable rates, or the imposition of significant tariffs could have a material adverse effect on the results of operations of the Company. Freight costs contribute a substantial amount to the cost of imported merchandise. Monitoring of foreign vendors' compliance with U.S. laws and Company standards, including quality and safety standards, is more difficult than monitoring of domestic vendors.
The United States government has the authority to enforce trade agreements, resolve trade disputes, and open foreign markets to U.S. goods and services. The United States government may also impose trade sanctions on foreign countries that are deemed to violate trade agreements or maintain laws or practices that are unjustifiable and restrict U.S. commerce. In these situations, the United States government may increase duties on imports into the United States from one or more foreign countries. In this event, the Company could be adversely affected by the imposition of trade sanctions.
In addition, the United States maintains in effect a variety of additional international trade laws under which the Company's ability to import may be affected from time to time, including, but not limited to, the antidumping law, the countervailing duty law, the safeguards law, and laws designed to protect intellectual property rights. Although the Company may not be directly involved in a particular trade dispute under any of these laws, its ability to import, or the terms and conditions under which it can continue to import, may be affected by the outcome of such disputes.
In particular, because the Company imports merchandise from countries around the world, the Company may be affected from time to time by antidumping petitions filed with the United States Commerce Department and International Trade Commission by U.S. producers of competing products alleging that foreign manufacturers are selling their own products at prices in the United States that are less than the prices that they charge in their home country market or in third country markets or at less than their cost of production. Such petitions, if successful, could significantly increase the United States import duties on those products. In that event, the Company might possibly decide to pay the increased duties, thereby possibly increasing the Company's price to consumers. Alternatively, the Company might decide to source the product or a similar product from a different country not subject to increased duties or else discontinue the importation and sale of the product.
In recent years, dispute resolution processes have been utilized to resolve disputes regarding market access between the European Union, China, the United States and other countries. In some instances, these trade disputes can lead to threats by countries of sanctions against each other, which can include import prohibitions and increased duty rates on imported items. The Company considers any agreement that reduces tariff and non-tariff barriers in international trade to be beneficial to its business. Any type of sanction on imports is likely to increase the Company's import costs or limit the availability of merchandise purchased from sanctioned countries. In that case, the Company may be required to seek similar merchandise from other countries.
12
Table of Contents
Risks Relating to Liquidity
The disruption in the global credit and equity markets could adversely impact the Company's ability to obtain financing on acceptable terms or could increase the cost of obtaining credit.
From fiscal 2006 through fiscal 2009, the Company has incurred net losses and had negative cash flows from operations. In the future, the Company may become dependent on the availability of adequate capital to fund its operations, carry out its turnaround strategy, or refinance existing indebtedness if necessary. Disruption in the global credit and equity markets and future disruptions in the financial markets could adversely affect the Company's ability to enter into new financing agreements, refinance the Company's current indebtedness if necessary, or obtain funding through the issuance of the Company's securities. A continued decline in economic conditions could also result in continued difficulties for financial institutions and other parties that the Company does business with, which could potentially affect the Company's ability to access financing under existing arrangements or to otherwise recover amounts as they become due under the Company's contractual agreements. The inability of the Company to obtain financing as needed, on acceptable terms in order to finance its operations may have a material adverse impact on the Company's business, financial condition and results of operations.
Insufficient cash flows from operations could result in the substantial utilization of the Company's secured credit facility, which may impose certain financial covenants.
The Company maintains a secured credit facility to enable it to issue merchandise and special purpose standby letters of credit as well as to occasionally fund working capital requirements. Borrowings under the credit facility are subject to a borrowing base calculation consisting of a percentage of certain eligible assets of the Company and is subject to advance rates and commercially reasonable reserves. Substantial utilization of the availability under the borrowing base will result in various restrictions on the Company including: restricted ability of the Company to repurchase its common stock or pay dividends, dominion over the Company's cash accounts, and compliance with a minimum fixed charge coverage ratio. The minimum fixed charge coverage ratio, assuming availability below the required minimum, would not have been met during fiscal 2009. See Note 5 to the Notes to Consolidated Financial Statements for additional discussion regarding the Company's secured credit facility. Significant decreases in cash flow from operations and investing could result in the Company's borrowing increased amounts under the credit facility to fund operational needs. Increases in utilization of letters of credit and/or increased cash borrowings could result in the Company being subject to these limitations.
Risks Relating to Common Stock
The Company must remain in compliance with the New York Stock Exchange's requirements for the continued listing of its common stock on the exchange.
The Company's common stock is traded on the New York Stock Exchange ("NYSE"). Continued listing on the NYSE is contingent upon the Company's ability to meet certain listing criteria including, among others, an average closing share price over a consecutive 30 trading-day period of at least $1.00. On May 4, 2009, the Company received notice from NYSE Regulation, Inc. ("NYSE Regulation") that the Company was in compliance with this requirement. Previously on December 15, 2008, the Company had received notice from NYSE Regulation that the Company was not in compliance with this requirement. The Company notified NYSE Regulation within the required ten business days that it intended to cure the deficiency and that its Board of Directors had met and was considering all strategic measures to cure the non-compliance with the listing standard.
Another criteria for continued listing on the NYSE is an average global market capitalization over a consecutive 30 trading-day period of at least $25 million. The NYSE will promptly initiate suspension
13
Table of Contents
and delisting procedures with respect to a company if it is not in compliance with this standard. As of May 1, 2009, the Company's average global market capitalization over a consecutive 30 trading-day period was greater than $25 million.
On February 26, 2009, the Company received notice from the NYSE that it had suspended its $1.00 minimum price requirement on a temporary basis, initially through June 30, 2009. On January 23, 2009, the NYSE temporarily changed to $15 million from $25 million the consecutive 30 trading-day average global market capitalization required of listed issues. On February 26, 2009, this temporary change was extended by the NYSE until June 30, 2009.
Failure to maintain the NYSE listing could negatively impact the Company by reducing the number of investors willing to hold or acquire the Company's stock, which could limit the ability to raise capital by issuing additional shares in the future. It could also negatively impact the perception of the Company's financial situation which may cause some vendors, creditors and other business partners to impose less favorable terms on the Company or cease to conduct business with the Company. In addition, the perceived value of equity incentive awards granted to employees could deteriorate significantly, thereby negating the goal of retaining key employees with equity incentive awards.
Item 1B. Unresolved Staff Comments.
None.
14
Table of Contents
Item 2. Properties.
The Company is headquartered in Fort Worth, Texas. In August 2004, the Company completed construction of a corporate headquarters facility, which contains approximately 460,000 square feet of office space. On June 9, 2008, the Company sold its headquarters building and accompanying land. As part of the transaction, the Company entered into a lease agreement to rent approximately 250,000 square feet of office space in the building for a primary term of seven years beginning on the closing date, with one three-year renewal option, and a right to terminate the lease at the end of the fifth lease year.
The Company leases the majority of its retail stores, its warehouses and regional space. At February 28, 2009, the present value of the Company's minimum future operating lease commitments discounted at 10% totaled approximately $736.4 million. The following table sets forth the distribution of Pier 1 Imports' U.S. and Canadian stores by state and province as of February 28, 2009:
United States | ||||||||||
Alabama | 15 | Louisiana | 15 | Ohio | 31 | |||||
Alaska | 1 | Maine | 1 | Oklahoma | 9 | |||||
Arizona | 25 | Maryland | 24 | Oregon | 14 | |||||
Arkansas | 8 | Massachusetts | 24 | Pennsylvania | 39 | |||||
California | 114 | Michigan | 33 | Rhode Island | 3 | |||||
Colorado | 19 | Minnesota | 20 | South Carolina | 17 | |||||
Connecticut | 21 | Mississippi | 6 | South Dakota | 2 | |||||
Delaware | 4 | Missouri | 18 | Tennessee | 18 | |||||
Florida | 78 | Montana | 6 | Texas | 83 | |||||
Georgia | 30 | Nebraska | 3 | Utah | 9 | |||||
Hawaii | 4 | Nevada | 8 | Virginia | 35 | |||||
Idaho | 6 | New Hampshire | 6 | Washington | 28 | |||||
Illinois | 42 | New Jersey | 35 | West Virginia | 5 | |||||
Indiana | 18 | New Mexico | 5 | Wisconsin | 19 | |||||
Iowa | 8 | New York | 45 | Wyoming | 1 | |||||
Kansas | 8 | North Carolina | 34 | |||||||
Kentucky | 11 | North Dakota | 3 | |||||||
Canada | ||||||||||
Alberta | 11 | New Brunswick | 2 | Ontario | 34 | |||||
British Columbia | 14 | Newfoundland | 1 | Quebec | 14 | |||||
Manitoba | 2 | Nova Scotia | 1 | Saskatchewan | 2 |
The Company currently owns or leases distribution center space of approximately 4.5 million square feet. The Company also acquires temporary distribution center space from time to time through short-term leases. During fiscal 2009, the Company vacated approximately 350,000 square feet of leased distribution center space near Baltimore. The lease on this space expires in July 2009. In February 2009, the Company announced plans to vacate a Company-owned distribution center near Chicago,
15
Table of Contents
Illinois during the first quarter of fiscal 2010. As of February 28, 2009, the Company owned or leased under operating leases the following warehouse properties in or near the following cities:
Location | Approx. Sq. Ft. | Owned/Leased Facility | ||
|---|---|---|---|---|
Baltimore, Maryland | 981,000 sq. ft. | Leased | ||
Chicago, Illinois | 514,000 sq. ft. | Owned | ||
Columbus, Ohio | 527,000 sq. ft. | Leased | ||
Fort Worth, Texas | 460,000 sq. ft. | Owned | ||
Ontario, California | 747,000 sq. ft. | Leased | ||
Savannah, Georgia | 784,000 sq. ft. | Leased | ||
Tacoma, Washington | 451,000 sq. ft. | Leased |
Item 3. Legal Proceedings.
The Company is a party to various legal proceedings and claims in the ordinary course of its business. The Company believes that the outcome of these matters will not have a material adverse effect on its consolidated financial position, results of operations or liquidity.
Item 4. Submission of Matters to a Vote of Security Holders.
There were no matters submitted to a vote of the Company's security holders during the fourth quarter of the Company's 2009 fiscal year.
PART II
Item 5. Market for the Registrant's Common Equity, Related Stockholder Matters and Issuer Purchases of Equity Securities.
Market Prices of Common Stock
The following table shows the high and low closing sale prices of the Company's common stock on the New York Stock Exchange (the "NYSE"), as reported in the consolidated transaction reporting system for each quarter of fiscal 2009 and 2008.
| | Market Price | ||||||
|---|---|---|---|---|---|---|---|
Fiscal 2009 | High | Low | |||||
First quarter | $ | 8.18 | $ | 4.91 | |||
Second quarter | 7.10 | 3.14 | |||||
Third quarter | 4.75 | 0.38 | |||||
Fourth quarter | 0.69 | 0.21 | |||||
Fiscal 2008 | High | Low | |||||
|---|---|---|---|---|---|---|---|
First quarter | $ | 8.00 | $ | 6.48 | |||
Second quarter | 8.93 | 5.84 | |||||
Third quarter | 6.52 | 3.67 | |||||
Fourth quarter | 6.93 | 3.28 | |||||
Number of Holders of Record
The Company's common stock is traded on the NYSE. As of April 30, 2009, there were approximately 10,000 shareholders of record of the Company's common stock. Please see Item 1A for discussion regarding the risks surrounding the Company's common stock.
16
Table of Contents
Dividends
In fiscal 2007, the Company announced that its Board of Directors discontinued the Company's quarterly cash dividend. The Company believed that discontinuing the cash dividend would provide financial flexibility as it executed its turnaround strategy. The Company did not pay any cash dividends in fiscal years 2009 or 2008 and does not currently anticipate paying cash dividends in fiscal 2010. The Company's dividend policy in the near term will depend upon the earnings, financial condition and capital needs of the Company and other factors deemed relevant by the Company's Board of Directors.
As of February 28, 2009, the Company was restricted under its secured credit facility from paying certain dividends. Dividend payments are not restricted by the Company's secured credit facility unless the availability under the Company's credit facility over a specified period of time is projected to be less than $97.5 million. See Note 5 to the Notes to Consolidated Financial Statements for further discussion of the Company's secured credit facility.
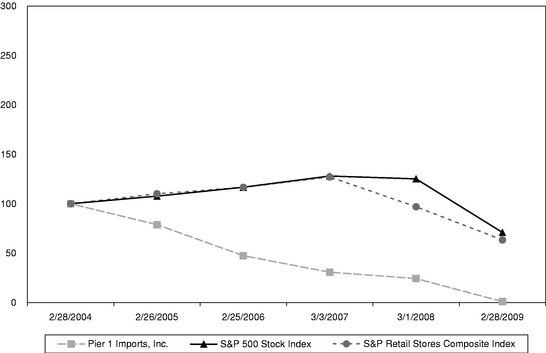
Performance Graph
The following graph compares the five-year cumulative total shareholder return for the Company's common stock against the Standard & Poor's 500 Stock Index and the Standard & Poor's Retail Stores Composite Index. The annual changes for the five-year period shown on the graph are based on the assumption, as required by the SEC's rules, that $100 had been invested in the Company's stock and in each index on February 28, 2004, and that all quarterly dividends were reinvested at the average of the closing stock prices at the beginning and end of the quarter. The total cumulative dollar returns shown on the graph represent the value that such investments would have had on February 28, 2009.
PIER 1 IMPORTS, INC. STOCK PERFORMANCE GRAPH
Purchases of Equity Securities by the Issuer and Affiliated Purchasers
There were no purchases of common stock of the Company made during the three months ended February 28, 2009, by Pier 1 Imports, Inc. or any "affiliated purchaser" of Pier 1 Imports, Inc. as defined in Rule 10b-18(a)(3) under the Securities Exchange Act of 1934.
17
Table of Contents
Item 6. Selected Financial Data.
FINANCIAL SUMMARY
| | Year Ended | |||||||||||||||
|---|---|---|---|---|---|---|---|---|---|---|---|---|---|---|---|---|
| | 2009 | 2008 | 2007 (1) | 2006 | 2005 | |||||||||||
| | ($ in millions except per share amounts) | |||||||||||||||
SUMMARY OF OPERATIONS (2) : | ||||||||||||||||
Net sales | $ | 1,320.7 | 1,511.8 | 1,623.2 | 1,776.7 | 1,825.3 | ||||||||||
Gross profit (3) | $ | 363.5 | 439.6 | 474.0 | 601.7 | 703.6 | ||||||||||
Selling, general and administrative expenses (4) | $ | 453.5 | 487.9 | 649.0 | 588.3 | 549.6 | ||||||||||
Depreciation and amortization | $ | 30.6 | 39.8 | 51.2 | 56.2 | 55.8 | ||||||||||
Operating income (loss) | $ | (120.6 | ) | (88.1 | ) | (226.2 | ) | (42.8 | ) | 98.2 | ||||||
Nonoperating (income) and expenses, net | $ | 8.1 | 5.3 | 1.9 | (0.9 | ) | (0.9 | ) | ||||||||
Income (loss) from continuing operations before income taxes | $ | (128.6 | ) | (93.4 | ) | (228.1 | ) | (41.9 | ) | 99.1 | ||||||
Income (loss) from continuing operations, net of tax | $ | (129.3 | ) | (96.0 | ) | (227.2 | ) | (27.5 | ) | 62.8 | ||||||
Income (loss) from discontinued operations, net of tax | $ | - | - | (0.4 | ) | (12.3 | ) | (2.3 | ) | |||||||
Net income (loss) | $ | (129.3 | ) | (96.0 | ) | (227.6 | ) | (39.8 | ) | 60.5 | ||||||
PER SHARE AMOUNTS: | ||||||||||||||||
Basic earnings (loss) from continuing operations | $ | (1.45 | ) | (1.09 | ) | (2.59 | ) | (.32 | ) | .72 | ||||||
Diluted earnings (loss) from continuing operations | $ | (1.45 | ) | (1.09 | ) | (2.59 | ) | (.32 | ) | .71 | ||||||
Basic earnings (loss) from discontinued operations | $ | - | - | (.01 | ) | (.14 | ) | (.03 | ) | |||||||
Diluted earnings (loss) from discontinued operations | $ | - | - | (.01 | ) | (.14 | ) | (.03 | ) | |||||||
Basic earnings (loss) | $ | (1.45 | ) | (1.09 | ) | (2.60 | ) | (.46 | ) | .69 | ||||||
Diluted earnings (loss) | $ | (1.45 | ) | (1.09 | ) | (2.60 | ) | (.46 | ) | .68 | ||||||
Cash dividends declared | $ | - | - | .20 | .40 | .40 | ||||||||||
Shareholders' equity | $ | 1.62 | 3.04 | 4.13 | 6.81 | 7.63 | ||||||||||
OTHER FINANCIAL DATA: | ||||||||||||||||
Working capital | $ | 299.9 | 307.3 | 349.4 | 486.1 | 387.4 | ||||||||||
Current ratio | 2.3 | 2.1 | 2.2 | 2.7 | 2.3 | |||||||||||
Total assets | $ | 655.5 | 821.9 | 916.5 | 1,169.9 | 1,075.7 | ||||||||||
Long-term debt (5) | $ | 184.0 | 184.0 | 184.0 | 184.0 | 19.0 | ||||||||||
Shareholders' equity | $ | 144.3 | 267.7 | 361.1 | 590.0 | 664.4 | ||||||||||
Weighted average diluted shares outstanding (millions) | 88.9 | 88.1 | 87.4 | 86.6 | 88.8 | |||||||||||
Effective tax rate (%) (6) | (0.5 | ) | (2.8 | ) | 0.4 | 34.5 | 36.7 | |||||||||
(2) Amounts are from continuing operations unless otherwise specified.
(3) Gross profit for fiscal 2007 included a pre-tax charge of $32.5 million for inventory write-down related to a strategic decision made in the fourth quarter to liquidate certain inventory by the end of the first quarter of fiscal 2008.
(4) The decrease in selling, general and adminstrative expense for fiscal years 2009 and 2008 relate primarily to initiatives to reduce costs Company-wide. See detailed description of these expenses in Item 7. Management's Discussion and Analysis of Financial Condition and Results of Operations. Selling, general and administrative expense in fiscal 2007 included a pre-tax charge of $32.3 million related to impairment charges on long-lived store level assets.
18
Table of Contents
(5) Subsequent to year end, the Company's consolidated long-term debt was reduced to $105.1 million as a result of a repurchase of a portion of the Company's outstanding convertible debt. See detailed discussion in Note 13 of the Notes to the Consolidated Financial Statements contained in Item 8 of this report .(6) In fiscal years 2009 and 2008, the Company recorded minimal state and foreign tax provisions and provided a valuation allowance on the deferred tax asset arising from the tax benefit of fiscal 2009 and 2008 losses. The decrease in the Company's effective tax rate for fiscal 2007 was the result of recording a valuation allowance on its deferred tax assets during the second quarter and only recording a tax benefit on the losses for the year that could be carried back.
19
Table of Contents
Item 7. Management's Discussion and Analysis of Financial Condition and Results of Operations.
MANAGEMENT OVERVIEW
Introduction
Pier 1 Imports, Inc. (together with its consolidated subsidiaries, the "Company") is a global importer and is one of North America's largest specialty retailers of imported decorative home furnishings and gifts. The Company directly imports merchandise from over 50 countries, and sells a wide variety of decorative accessories, furniture collections, bed and bath products, candles, housewares and other seasonal assortments in its stores. The Company conducts business as one operating segment. The Company operates stores in the United States and Canada under the name "Pier 1 Imports" and, for a portion of fiscal 2008 and in prior years, "Pier 1 Kids." As of February 28, 2009, the Company operated 1,092 stores in the United States and Canada.
Since April 2007, the Company has been executing a turnaround strategy that is built on key business priorities. Over the first year, fiscal 2008, the Company was able to execute its strategy successfully, revitalizing its merchandise offering, significantly cutting costs, and ultimately reporting its first quarterly profit in two years in the fourth quarter of fiscal 2008. Management anticipated that the Company would continue to see improvements throughout fiscal 2009. As a result of the dramatic changes in the economic environment, fiscal year 2009 did not turn out the way the Company had anticipated.
During the second half of fiscal 2009, the U.S. economy significantly deteriorated as a result of the disruption in the credit and financial markets which created an environment of uncertainty for consumers. During this time of economic turmoil, consumers sacrificed purchases of discretionary items, including the Company's merchandise, which adversely affected the Company's sales and financial performance. Management believes that the current economic recession has delayed the Company's return to profitability and now expects that its turnaround plan will take approximately two years longer than originally anticipated.
For the year, comparable store sales declined 9.2%. The decline in sales was primarily the result of a reduction in traffic and average ticket, offset slightly by increases in conversion rate and units per transaction. Merchandise margins for the year improved slightly to 49.0% of sales. Improvements in the margin over last year were primarily the result of less aggressive liquidation of inventory as compared to fiscal 2008, especially when comparing the first quarter of each year. Despite the slowdown in the economy, the Company anticipates that it will be able to maintain or improve merchandise margins during fiscal 2010 as it began the year with significantly reduced and clean inventory. Changes in the Company's merchandise assortments have allowed the Company to maintain lower inventory levels without significantly jeopardizing sales.
One of the key components of the Company's turnaround plan was improving its merchandise offering. To accomplish this, the Company doubled the size of its buying staff during fiscal 2008. As these buyers became more familiar with the Pier 1 Imports customer and traveled to meet with the vast network of vendors and agents during fiscal 2009, the Company's merchandise offering improved, began to resonate with customers and once again reflected the quirky and unique style that is synonymous with the Company's brand. This was evident throughout the year as the conversion rate levels consistently improved. Management expects that it will continuously evolve and finesse the Company's merchandise offering and continue to test new products to ensure that the "treasure hunt" feel of its stores is maintained.
The Company believes that it can continue to reduce costs in the supply chain as a result of declining fuel costs and lower ocean freight rates. Additionally, costs in the supply chain will be reduced as the Company ceases operations in its Chicago distribution facility in the first quarter of fiscal 2010.
20
Table of Contents
Another opportunity for the Company to reduce expenses is in its real estate costs. The Company closed 26 stores in fiscal 2009 and ended the year with 1,092 Pier 1 Imports stores in North America. An outside firm has been hired to assist the Company in negotiating with landlords to achieve reductions in rental rates across its store portfolio. In certain cases, if appropriate rental reductions cannot be reached, the Company may elect to close those locations. Currently, the Company expects to close no more than 80 locations in connection with these negotiation efforts.
Selling, general and administrative expenses in fiscal 2009 were lower in dollars than the prior year, primarily as a result of the significant cost savings efforts throughout the year. The Company also made significant changes to its marketing strategy during fiscal 2009. The timing of marketing expenditures was shifted in order to utilize more of the budget in the all important holiday selling period. Most notably, the Company resumed national television advertising on national cable networks during the holiday selling period. The Company will continue to seek out ways to efficiently use its marketing budget through multiple media outlets including television, the Internet, direct mail, and print media.
The Company ended the year with total cash of $155.8 million and net availability under its credit line of $84.9 million, for a total liquidity position of $240.7 million. During fiscal 2009, the Company was able to accomplish two feats in particular which strengthened its liquidity position. In June 2008, the Company sold its corporate headquarters to Chesapeake Energy Company for net proceeds of approximately $102.4 million. The sale had a positive impact on both the balance sheet and the income statement as the cost of leasing space was lower than the carrying costs of the building. In addition, the Company was able to preserve working capital through the significant reduction of its inventory. The Company reduced its inventory position from $411.7 million at the beginning of the year to $316.3 million by year end. The Company accomplished this by reacting quickly to the slowdown in sales, reducing purchases and clearing out excess inventory, especially in the distribution centers. The Company also made changes to its procurement process. The changes included buying inventory much closer to the needed in-store date, and buying smaller initial quantities. This reduction in inventory has the added benefit of allowing the reduction of distribution center space requirements.
Further improvements to the Company's balance sheet were accomplished subsequent to fiscal 2009 year end. On March 20, 2009, a foreign subsidiary of the Company entered into private agreements purchasing $78.9 million of the Company's outstanding 6.375% convertible senior notes due 2036. The notes were acquired at a purchase price of $27.4 million, including accrued interest. As a result of this transaction, the Company reduced its outstanding convertible debt to $86.1 million on a consolidated basis. The foreign subsidiary presently intends to hold the convertible notes until maturity. In connection with this transaction, the Company expects to recognize a gain of approximately $49.0 million during the first quarter of fiscal 2010.
While the recession has slowed the Company's turnaround speed and increased its timeline, the Company's overall strategy remains the same. Until management sees signs of an upturn, however, it will buy conservatively, manage inventories, and continue to make the Company's merchandise offering more compelling and improve the in-store experience. In addition, the Company will continue to focus on its ongoing mission to maximize its revenues, while continuing to seek out ways to reduce its cost base and preserve its liquidity.
The following discussion and analysis of financial condition, results of operations, liquidity and capital resources relates to continuing operations, unless otherwise stated, and should be read in conjunction with the accompanying audited Consolidated Financial Statements and notes thereto which can be found in Item 8 of this report. Fiscal 2009 and fiscal 2008 were 52-week years while fiscal 2007 was a 53-week year.
21
Table of Contents
Overview of Business
The Company's key financial and operational indicators used by management to evaluate the performance of the business include the following (trends for these indicators are explained in the comparative discussions of this section):
Key Performance Indicators | 2009 | 2008 | 2007 | |||||||
|---|---|---|---|---|---|---|---|---|---|---|
Continuing operations: | ||||||||||
Total sales decline | (12.6)% | (6.9)% | (8.6)% | |||||||
Comparable stores sales decline | (9.2)% | (1.7)% | (11.3)% | |||||||
Sales per average retail square foot | $ | 149 | $ | 164 | $ | 168 | ||||
Merchandise margins as a % of sales | 49.0% | 48.5% | 47.9% | |||||||
Gross profit as a % of sales | 27.5% | 29.1% | 29.2% | |||||||
Selling, general and administrative expenses as a % of sales | 34.3% | 32.3% | 40.0% | |||||||
Operating loss from continuing operations as a % of sales | (9.1)% | (5.8)% | (13.9)% | |||||||
Loss from continuing operations as a % of sales | (9.8)% | (6.4)% | (14.0)% | |||||||
Inventory per retail square foot | $ | 37 | $ | 47 | $ | 39 | ||||
Total retail square footage (in thousands) | 8,586 | 8,782 | 9,230 | |||||||
Total retail square footage growth (decline) | (2.2)% | (4.9)% | (1.9)% | |||||||
Stores included in the comparable store sales calculation are those stores that were opened prior to the beginning of the preceding fiscal year and are still open. Also included are stores that were relocated during the year within a specified distance serving the same market, where there is not a significant change in store size and where there is not a significant overlap or gap in timing between the opening of the new store and the closing of the existing store. Stores that are expanded or renovated are excluded from the comparable store sales calculation during the period they are closed for such remodeling. When these stores re-open for business, they are included in the comparable store sales calculation in the first full month after the re-opening if there is no significant change in store size. If there is a significant change in store size, the store continues to be excluded from the calculation until it meets the Company's established definition of a comparable store. Comparable store sales in fiscal 2010 are anticipated to include all stores, however, stores closed during the year will be excluded after they are closed.
FISCAL YEARS ENDED FEBRUARY 28, 2009 AND MARCH 1, 2008
Net Sales
Net sales consisted almost entirely of sales to retail customers, net of discounts and returns, but also included delivery revenues and wholesale sales and royalties. Sales by retail concept during fiscal years 2009, 2008 and 2007 were as follows (in thousands):
| | 2009 | 2008 | 2007 | ||||||||
|---|---|---|---|---|---|---|---|---|---|---|---|
Stores | $ | 1,308,331 | $ | 1,486,147 | $ | 1,590,854 | |||||
Direct to consumer | - | 8,366 | 18,943 | ||||||||
Other (1) | 12,346 | 17,319 | 13,419 | ||||||||
Net sales | $ | 1,320,677 | $ | 1,511,832 | $ | 1,623,216 | |||||
22
Table of Contents
Net sales during fiscal 2009 were $1,320.7 million, a decrease of $191.1 million or 12.6%, from $1,511.8 million for the prior fiscal year. The decrease in sales for the fiscal year was comprised of the following components (in thousands):
| | 2009 | |||
|---|---|---|---|---|
Stores opened during fiscal 2008 | $ | 1,231 | ||
Comparable stores | (129,901 | ) | ||
Closed stores and other (1) | (62,485 | ) | ||
Net decrease in sales | $ | (191,155 | ) | |
The total sales decline for fiscal 2009 was attributable to current macro-environmental conditions which have caused a slowdown in consumer spending, a net decrease of 25 stores for the fiscal year and a comparable store sales decline of 9.2%. The Company's net sales from Canadian stores were subject to fluctuation in currency conversion rates. These fluctuations had an unfavorable impact of approximately 50 basis points on both net sales and comparable store calculations in fiscal 2009 compared to fiscal 2008.
During fiscal 2009, the Company opened one new store and closed 26 store locations. As of February 28, 2009, the Company operated 1,092 stores in the United States and Canada. The Company continues to evaluate every lease in its current real estate portfolio and will attempt to negotiate more favorable occupancy costs in an effort to lower overall costs of leased properties. The Company engaged a third-party real estate consulting firm to assist with these rent reduction efforts for existing leases. If rental reductions cannot be negotiated on stores that have negative operating results, the Company will attempt to negotiate a buyout or exercise any early termination rights and close these stores. As a result of its efforts thus far, the Company now estimates that it will close no more than 80 stores in fiscal 2010.
A summary reconciliation of the Company's stores open at the beginning of fiscal 2009, 2008 and 2007 to the number open at the end of each period follows (openings and closings include relocated stores):
| | United States | Canada | Total | ||||||||
|---|---|---|---|---|---|---|---|---|---|---|---|
Open at February 25, 2006 | 1,143 | 83 | 1,226 | ||||||||
Openings | 32 | 2 | 34 | ||||||||
Closings | (63 | ) | (1 | ) | (64 | ) | |||||
Open at March 3, 2007 | 1,112 | 84 | 1,196 | ||||||||
Openings | 4 | - | 4 | ||||||||
Closings | (82 | ) | (1 | ) | (83 | ) | |||||
Open at March 1, 2008 | 1,034 | 83 | 1,117 | ||||||||
Openings | 1 | - | 1 | ||||||||
Closings | (24 | ) | (2 | ) | (26 | ) | |||||
Open at February 28, 2009 (1) | 1,011 | 81 | 1,092 | ||||||||
23
Table of Contents
Gross Profit
Gross profit after related buying and store occupancy costs, expressed as a percentage of sales, was 27.5% in fiscal 2009 compared to 29.1% a year ago. Merchandise margins were 49.0% as a percentage of sales, an increase of 50 basis points over 48.5% in fiscal 2008. Improvements in merchandise margin over last year were primarily the result of less aggressive inventory liquidation activity that occurred during the first quarter of fiscal 2009 as compared to the first quarter of fiscal 2008. Store occupancy costs during fiscal 2009 were $284.1 million or 21.5% of sales, a decrease of $9.1 million and an increase of 210 basis points over store occupancy costs of $293.2 million or 19.4% of sales during fiscal 2008. The decrease of $9.1 million was primarily due to store closures, while the increase as a percentage of sales was the result of the deleveraging of relatively fixed rental costs over a slightly lower sales base in the remaining open stores. As discussed above, the Company is actively evaluating every lease renewal and working to negotiate more favorable occupancy costs in an effort to lower the overall costs of its leased properties.
Operating Expenses, Depreciation and Income Taxes
Selling, general and administrative expenses, including marketing, were $453.5 million or 34.3% of sales in fiscal 2009, a decrease of $34.4 million and an increase 200 basis points from last year's $487.9 million or 32.3% of sales. Selling, general and administrative expenses for fiscal years 2009 and 2008 included charges summarized in the table below (in thousands):
| | February 28, 2009 | March 1, 2008 | | ||||||||||||||
|---|---|---|---|---|---|---|---|---|---|---|---|---|---|---|---|---|---|
| | Increase / (Decrease) | ||||||||||||||||
| | Expense | % Sales | Expense | % Sales | |||||||||||||
Store payroll | $ | 217,774 | 16.5 | % | $ | 229,573 | 15.2 | % | $ | (11,799 | ) | ||||||
Marketing | 58,989 | 4.5 | % | 63,970 | 4.2 | % | (4,981 | ) | |||||||||
Store supplies, services and other | 32,473 | 2.5 | % | 38,341 | 2.5 | % | (5,868 | ) | |||||||||
Variable costs | 309,236 | 23.4 | % | 331,884 | 22.0 | % | (22,648 | ) | |||||||||
Administrative payroll (excluding severance) | 70,118 | 5.3 | % | 82,244 | 5.4 | % | (12,126 | ) | |||||||||
Lease termination costs and impairments | 15,727 | 1.2 | % | 15,470 | 1.0 | % | 257 | ||||||||||
Severance and other | 5,922 | 0.4 | % | 7,646 | 0.5 | % | (1,724 | ) | |||||||||
Acquistion costs | 1,660 | 0.1 | % | - | 0.0 | % | 1,660 | ||||||||||
Loss (gain) on sale of fixed assets | 41 | 0.0 | % | (2,137 | ) | -0.1 | % | 2,178 | |||||||||
Other relatively fixed expenses | 50,767 | 3.8 | % | 52,791 | 3.5 | % | (2,024 | ) | |||||||||
| 144,235 | 10.9 | % | 156,014 | 10.3 | % | (11,779 | ) | |||||||||
| $ | 453,471 | 34.3 | % | $ | 487,898 | 32.3 | % | $ | (34,427 | ) | ||||||
Expenses that tend to fluctuate proportionately with sales and number of stores, such as store payroll, marketing, store supplies, and equipment rental, decreased $22.6 million and increased 140 basis points as a percentage of sales from last year. Store payroll, including bonus, decreased $11.8 million partly as a result of planned staffing reductions at the stores and as a result of store closures. Marketing expense decreased $5.0 million and increased 25 basis points as a percentage of sales as a result of the absence of television advertising for most of fiscal 2009, offset slightly by the introduction of a seasonal national cable advertising campaign introduced late in the third quarter of fiscal 2009 running through the early part of the fourth quarter. The timing of marketing expenditures was shifted in order to utilize more of the budget in the all important holiday selling period. Other variable expenses such as store supplies and equipment rental decreased $5.9 million primarily due to efforts to reduce costs.
Relatively fixed selling, general and administrative expenses decreased $11.8 million compared to last year. Administrative payroll including bonus decreased $12.1 million resulting primarily from a
24
Table of Contents
decrease in home office management bonus, stock option expense and home office payroll expense. Severance, outplacement and other costs decreased $1.7 million primarily as a result of expenses incurred in the prior year related to larger reductions in work force compared to a slightly smaller reduction in the current year. Other selling, general and administrative expenses that do not typically vary with sales decreased $2.0 million primarily as a result of the Company's continued initiative to manage and control expenses. These decreases were partially offset by $1.7 million in expenses related to the Company's withdrawn proposal to acquire all of the outstanding common stock shares of Cost Plus, Inc. and a $2.2 million gain recorded on the sale of fixed assets in fiscal 2008.
Depreciation and amortization for fiscal 2009 was $30.6 million, representing a decrease of approximately $9.2 million from last year's depreciation and amortization expense of $39.8 million. This decrease was primarily the result of the sale of the home office building and related assets during fiscal 2009, lower net book values on certain store-level long-lived assets because of impairment charges taken during and since the end of fiscal 2008, certain assets becoming fully depreciated, store closures, and reduced capital spending in recent years.
In fiscal 2009, the Company recorded an operating loss of $120.6 million compared to $88.1 million for fiscal 2008.
The Company continues to provide a valuation allowance against all deferred tax assets. As a result, the Company did not record a federal tax benefit on its operating loss and only minimal state and foreign tax provisions were recorded on results for fiscal 2009. Net deferred tax assets of $181.0 million were fully reserved at year end through the valuation allowance. The Company has tax loss carryforwards of approximately $276.0 million. These loss carryforwards, with expirations beginning in fiscal year 2027, can be utilized to offset future income for U.S. federal tax purposes.
Net Loss
Net loss in fiscal 2009 was $129.3 million, or $1.45 per share, compared to $96.0 million, or $1.09 per share for fiscal 2008.
FISCAL YEARS ENDED MARCH 1, 2008 AND MARCH 3, 2007
Net Sales
Net sales consisted almost entirely of sales to retail customers, net of discounts and returns, but also included delivery revenues and wholesale sales and royalties. Sales by retail concept during fiscal years 2008, 2007 and 2006 were as follows (in thousands):
| | 2008 | 2007 | 2006 | ||||||||
|---|---|---|---|---|---|---|---|---|---|---|---|
Stores | $ | 1,486,147 | $ | 1,590,854 | $ | 1,753,927 | |||||
Direct to consumer | 8,366 | 18,943 | 15,345 | ||||||||
Other (1) | 17,319 | 13,419 | 7,429 | ||||||||
Net sales | $ | 1,511,832 | $ | 1,623,216 | $ | 1,776,701 | |||||
25
Table of Contents
Net sales during fiscal 2008 were $1,511.8 million, a decrease of $111.4 million or 6.9%, from $1,623.2 million for fiscal 2007. The decrease in sales for fiscal 2008 was comprised of the following components (in thousands):
| | 2008 | |||
|---|---|---|---|---|
New stores opened during fiscal 2008 | $ | 2,641 | ||
Stores opened during fiscal 2007 | 9,778 | |||
Comparable stores | (23,860 | ) | ||
Closed stores and other (1) | (99,943 | ) | ||
Net decrease in sales | $ | (111,384 | ) | |
Comparable store sales for fiscal 2008 declined 1.7%. The Company's net sales from Canadian stores were subject to fluctuation in currency conversion rates. These fluctuations had a favorable impact of approximately 70 basis points on both net sales and comparable store calculations in fiscal 2008 compared to fiscal 2007.
During fiscal 2008, the Company opened four new stores and closed 83 store locations, including all Pier 1 Kids and clearance stores. In addition, the Company closed its direct to consumer business. As of March 1, 2008, the Company operated 1,117 stores in the United States and Canada. A summary reconciliation of the Company's stores open at the beginning of fiscal 2008, 2007 and 2006 to the number open at the end of each period follows (openings and closings include relocated stores):
| | United States | Canada | Total | ||||||||
|---|---|---|---|---|---|---|---|---|---|---|---|
Open at February 26, 2005 | 1,115 | 80 | 1,195 | ||||||||
Openings | 65 | 4 | 69 | ||||||||
Closings | (37 | ) | (1 | ) | (38 | ) | |||||
Open at February 25, 2006 | 1,143 | 83 | 1,226 | ||||||||
Openings | 32 | 2 | 34 | ||||||||
Closings | (63 | ) | (1 | ) | (64 | ) | |||||
Open at March 3, 2007 | 1,112 | 84 | 1,196 | ||||||||
Openings | 4 | - | 4 | ||||||||
Closings | (82 | ) | (1 | ) | (83 | ) | |||||
Open at March 1, 2008 (1) | 1,034 | 83 | 1,117 | ||||||||
Gross Profit
Gross profit after related buying and store occupancy costs, expressed as a percentage of sales, was 29.1% in fiscal 2008 compared to 29.2% in fiscal 2007. Merchandise margins were 48.5% as a percentage of sales, an increase of 60 basis points over 47.9% in fiscal 2007. Although margins improved overall in fiscal 2008, margins were negatively impacted by the clearance activities related to the liquidation of the Company's modern craftsmen merchandise, the closure of its Pier 1 Kids stores, clearance stores and its direct to consumer channel. Merchandise margins in fiscal 2007 were negatively
26
Table of Contents
impacted by 200 basis points as a result of a $32.5 million inventory write-down. Store occupancy costs during fiscal 2008 were $293.2 million or 19.4% of sales, a decrease of $10.2 million and an increase of 70 basis points over store occupancy costs of $303.4 million or 18.7% of sales during fiscal 2007. The decrease of $10.2 million was due to store closures, while the increase as a percentage of sales was the result of the deleveraging of relatively fixed rental costs over a slightly lower sales base in the remaining open stores.
Operating Expenses, Depreciation and Income Taxes
Selling, general and administrative expenses, including marketing, were $487.9 million or 32.3% of sales in fiscal 2008, a decrease of $161.1 million and 770 basis points from fiscal 2007's $649.0 million or 40.0% of sales. Selling, general and administrative expenses for fiscal years ended 2008 and 2007 included charges summarized in the table below (in thousands):
| | March 1, 2008 | March 3, 2007 | | |||||||||||||
|---|---|---|---|---|---|---|---|---|---|---|---|---|---|---|---|---|
| | Increase/ (Decrease) | |||||||||||||||
| | Expense | % Sales | Expense | % Sales | ||||||||||||
Store payroll | $ | 229,573 | 15.2 | % | $ | 261,600 | 16.1 | % | $ | (32,027 | ) | |||||
Marketing | 63,970 | 4.2 | % | 117,364 | 7.2 | % | (53,394 | ) | ||||||||
Store supplies and equipment rental | 38,341 | 2.5 | % | 47,378 | 2.9 | % | (9,037 | ) | ||||||||
| 331,884 | 22.0 | % | 426,342 | 26.3 | % | (94,458 | ) | ||||||||
Administrative payroll | 82,244 | 5.4 | % | 96,712 | 6.0 | % | (14,468 | ) | ||||||||
Lease termination costs and impairments | 15,470 | 1.0 | % | 40,372 | 2.5 | % | (24,902 | ) | ||||||||
(Gain) loss on disposal of fixed assets | (2,137 | ) | -0.1 | % | 187 | 0.0 | % | (2,324 | ) | |||||||
Severance, outplacement and new CEO | 5,972 | 0.4 | % | 2,679 | 0.2 | % | 3,293 | |||||||||
Settlement and curtailment, retirement plan | 1,763 | 0.1 | % | 6,769 | 0.4 | % | (5,006 | ) | ||||||||
Litigation settlements | (89 | ) | 0.0 | % | 4,836 | 0.3 | % | (4,925 | ) | |||||||
Credit card contract termination | - | - | 2,400 | 0.1 | % | (2,400 | ) | |||||||||
Other relatively fixed expenses | 52,791 | 3.5 | % | 68,708 | 4.2 | % | (15,917 | ) | ||||||||
| 156,014 | 10.3 | % | 222,663 | 13.7 | % | (66,649 | ) | ||||||||
| $ | 487,898 | 32.3 | % | $ | 649,005 | 40.0 | % | $ | (161,107 | ) | |||||
Expenses that tend to fluctuate proportionately with sales and number of stores, such as store payroll, marketing, store supplies, and equipment rental, decreased $94.5 million and 430 basis points as a percentage of sales in fiscal 2008 from fiscal 2007 due, in part, to store closures. The decline was primarily the result of a conscious effort by management to reduce costs at all levels of the organization, especially marketing. Store payroll, including bonus, decreased $32.0 million as a result of store closures, and decreased 90 basis points as a percentage of sales primarily as a result of planned reductions in staffing levels in the stores. Marketing expense decreased $53.4 million and 300 basis points as a percentage of sales as a result of the Company's strategic decision to shift from television and catalog advertisements to targeted event mailers, newspaper inserts and emails. Other variable expenses such as store supplies and equipment rental decreased 40 basis points as a percentage of sales, primarily due to efforts to reduce costs.
Relatively fixed selling, general and administrative expenses decreased $66.6 million and 340 basis points as a percentage of sales in fiscal 2008 compared to fiscal 2007. Administrative payroll including bonus decreased $14.5 million and 50 basis points as a percentage of sales, resulting primarily from decreases in salaries and wages related to a reduction in the number of home office and field administrative employees in the first half of fiscal 2008. Decreases in other non-store payroll expenses included a $5.0 million decrease in retirement plan settlement and curtailment expense primarily as a result of the retirement of two officers in fiscal 2007 compared to one in fiscal 2008, partly offset by a
27
Table of Contents
$3.3 million increase in severance and outplacement costs in fiscal 2008 associated primarily with home office and field administration headcount reductions during the first two quarters of the year. Impairment charges decreased $31.4 million as a result of less impairment recorded during fiscal 2008, and lease termination obligations increased $6.4 million related primarily to the closure of all Pier 1 Kids and clearance stores during fiscal 2008. Litigation settlements decreased $4.9 million as a result of a $4.6 million charge in fiscal 2007 related to an accrual for the settlement of a class action lawsuit with no similar expense in fiscal 2008. Other selling, general and administrative expenses that do not typically vary with sales decreased primarily as a result of the Company's continued initiative to manage and control expenses.
Depreciation and amortization for fiscal 2008 was $39.8 million, representing a decrease of approximately $11.4 million from fiscal 2007 depreciation and amortization expense of $51.2 million. This decrease was primarily the result of lower net book values on certain store-level long-lived assets because of impairment charges taken during and since the end of fiscal 2007, certain assets' becoming fully depreciated, store closures, and lower capital expenditures.
In fiscal 2008, the Company recorded an operating loss of $88.1 million compared to $226.2 million for fiscal 2007.
During fiscal 2008, the Company recorded a $1.8 million charge to tax expense to adjust its federal and state income tax refunds estimated at fiscal 2007 year end to the actual tax refunds filed for. The federal tax benefit was entirely offset by provision of a full valuation allowance on the deferred assets arising from the benefit, and only minimal state and foreign tax provisions were recorded on results for fiscal 2008. Net deferred tax assets of $125.7 million were fully reserved at fiscal 2008 year end through a valuation allowance. The Company had tax loss carryforwards of approximately $203.0 million. These loss carryforwards have expirations beginning in fiscal year 2027.
Net Loss
Net loss in fiscal 2008 was $96.0 million or $1.09 per share, an improvement of $131.6 million when compared to fiscal 2007's net loss (including discontinued operations) of $227.6 million, or $2.60 per share. See Note 12 of the Notes to Consolidated Financial Statements for additional information regarding discontinued operations in fiscal 2007.
LIQUIDITY AND CAPITAL RESOURCES
The Company's cash and cash equivalents totaled $155.8 million at the end of fiscal 2009, an increase of $62.4 million from the fiscal 2008 year end balance of $93.4 million. Operating activities used $31.6 million primarily as a result of the Company's net loss, a reduction in accounts payable and accrued expenses, and an increase in accounts receivable, prepaid expenses and other current assets. These operating outflows were partially offset by a reduction in inventory and the collection of a federal income tax refund, including related interest.
Inventory levels at the end of fiscal 2009 were $316.3 million, down $95.4 million, or 23.2% from inventory levels at the end of fiscal 2008. At the end of fiscal 2009, inventory per retail square foot was $37 compared to $47 a year ago. The decrease from fiscal 2008 year end was due in part to a conservative plan for the first six months of fiscal 2010 and a planned decline in inventory levels at the distribution centers as the Company continued to shift inventory to the stores. This allowed the Company to exit approximately 350,000 square feet of outside distribution center space during the second quarter of fiscal 2009. In addition, the Company plans to exit approximately 514,000 square feet of additional distribution center space by closing its Chicago distribution center during the first quarter of fiscal 2010. The Company continues to focus on managing inventory levels and is closely monitoring the timing and appropriate levels of merchandise purchases to keep inventory in line with consumer
28
Table of Contents
demand. The Company expects inventory levels to range from $300 million to $340 million with seasonal fluctuations similar to prior years and to end fiscal 2010 at approximately $300 million.
During fiscal 2009, the Company's investing activities provided $91.8 million. During the second quarter of fiscal 2009, the Company sold its corporate headquarters building and accompanying land to Chesapeake Plaza, L.L.C., an affiliate of Chesapeake Energy Corporation, for net proceeds of approximately $102.4 million. The Company collected $1.5 million of a note receivable related to the fiscal 2007 sale of Pier 1 National Bank. Proceeds from the sale of restricted investments used primarily for the payment of defined benefit obligations provided $3.3 million, partially offset by contributions of $2.0 million to purchase similar restricted investments. Capital expenditures were $13.4 million and consisted primarily of $5.8 million for fixtures, equipment and leasehold improvements for stores, $3.5 million related to home office leasehold improvements, $2.7 million for information systems enhancements and $1.4 million related to the Company's distribution centers.
Financing activities for fiscal 2009 provided a net $2.2 million, primarily related to the Company's stock purchase plan.
The Company's bank facilities include a $325 million credit facility expiring in May 2012, which is secured by the Company's eligible merchandise inventory and third-party credit card receivables. During fiscal 2009, the Company had no cash borrowings against its credit facility; however, in the future, the Company may become dependent upon its secured credit facility to fund operations including seasonal inventory purchases. As of February 28, 2009, the Company had no outstanding borrowings and had utilized approximately $84.3 million in letters of credit and bankers acceptances. Should the availability under such facility be less than $32.5 million, the Company will be required to comply with a fixed charge coverage ratio as stated in the agreement. The Company does not anticipate falling below this minimum availability in the foreseeable future. As of February 28, 2009, the Company's calculated borrowing base was $201.7 million. After excluding the required minimum of $32.5 million and the $84.3 million in utilized letters of credit and bankers' acceptances from the borrowing base, $84.9 million remained available for cash borrowings. This borrowing base calculation is subject to advance rates and commercially reasonable reserves. At the end of fiscal 2009, the Company was in compliance with required debt covenants stated in the agreement.
The Company does not currently anticipate paying cash dividends in fiscal 2010, and its dividend policy in the near term will depend upon the earnings, financial condition and capital needs of the Company and other factors deemed relevant by the Company's Board of Directors. Under the terms of the Company's secured credit facility, the Company will not be restricted from paying certain dividends unless the availability under the credit facility over a specified period of time is projected to be less than $97.5 million.
During fiscal 2009, the Company did not make any repurchases of, and has no immediate plans to repurchase, shares of its outstanding common stock.
29
Table of Contents
A summary of the Company's contractual obligations and other commercial commitments as of February 28, 2009 is listed below (in thousands):
| | | Amount of Commitment per Period | ||||||||||||||
|---|---|---|---|---|---|---|---|---|---|---|---|---|---|---|---|---|
| | Total | Less Than 1 Year | 1 to 3 Years | 3 to 5 Years | More Than 5 Years | |||||||||||
Operating leases | $ | 936,431 | $ | 225,496 | $ | 379,899 | $ | 240,921 | $ | 90,115 | ||||||
Purchase obligations (1) | 75,845 | 75,845 | - | - | - | |||||||||||
Convertible debt (2) | 165,000 | - | 165,000 | - | - | |||||||||||
Standby letters of credit (3) | 48,599 | 48,599 | - | - | - | |||||||||||
Industrial revenue bonds (3) | 19,000 | - | - | - | 19,000 | |||||||||||
Interest on convertible debt (2) | 21,038 | 10,519 | 10,519 | - | - | |||||||||||
Interest on industrial revenue bonds (4) | 6,408 | 361 | 722 | 722 | 4,603 | |||||||||||
Interest and related fees on secured credit facility (5) | 4,431 | 1,363 | 2,727 | 341 | - | |||||||||||
Other obligations (6)(7) | 48,248 | 11,512 | 1,584 | 2,150 | 33,002 | |||||||||||
Total (8) | $ | 1,325,000 | $ | 373,695 | $ | 560,451 | $ | 244,134 | $ | 146,720 | ||||||
Liabilities recorded on the balance sheet | $ | 269,272 | ||||||||||||||
Commitments not recorded on the balance sheet | 1,055,728 | |||||||||||||||
Total | $ | 1,325,000 | ||||||||||||||
(2) The Company's convertible debt is subject to redemption in part or full on February 15, 2011, and the above amounts assume the notes will be repaid or refinanced at that time. As of February 28, 2009, if all notes had remained outstanding until maturity in 2036, the total interest paid would have been $273.7 million. Subsequent to year end, a foreign subsidiary of the Company purchased approximately $78.9 million of the convertible debt for $27.4 million including interest, thereby reducing the consolidated outstanding convertible debt to $86.1 million. If the remaining $86.1 million in notes are held to maturity, the total interest paid would be approximately $143.1 million. See Note 5 of the Notes to Consolidated Financial Statements for further discussion of the Company's convertible senior notes .
(3) The Company also has outstanding standby letters of credit totaling $19.4 million related to the Company's industrial revenue bonds. This amount is excluded from the table above as it is not incremental to the Company's total outstanding commitments.
(4) The interest rates on the Company's industrial revenue bonds are variable and reset weekly. The estimated interest payments included in the table were calculated based upon the rate in effect at fiscal 2009 year end.
(5) Represents estimated commitment fees for trade and standby letters of credit, and unused fees on the Company's $325 million secured credit facility, which expires in May 2012, calculated based upon balances and rates in effect at fiscal 2009 year end.
30
Table of Contents
(6) Other obligations include the Company's liability under various unfunded retirement plans. See Note 7 of the Notes to Consolidated Financial Statements for further discussion of the Company's employee benefit plans .(7) Other obligations also include approximately $8.0 million of reserves for uncertain tax positions, including interest and penalties, under Financial Accounting Standards Board Interpretation No. 48, "Accounting for Uncertainty in Income Taxes-An Interpretation of FASB Statement No. 109", which has been classified as a current liability. Excluded from this table is the noncurrent portion of reserves for uncertain tax positions of $9.0 million for which the Company is not reasonably able to estimate the timing of future cash flows.
(8) The above amounts do not include payments that may be due under employment agreement(s) with certain employee(s).
The present value of the Company's minimum future operating lease commitments discounted at 10% was $736.4 million at fiscal 2009 year end and as a result of the Company's on-going rent negotiations was $713.4 million as of April 15, 2009. The Company plans to fund these commitments from cash generated from the operations of the Company and, if needed, from borrowings against lines of credit.
Total capital expenditures for fiscal 2010 are expected to be approximately $7 million. On February 3, 2009, the Company announced that it hired an outside firm to assist in negotiations with its landlords to achieve rental reductions across its store portfolio. To date, the Company has reached agreements in principal to terminate the leases on 22 stores and has decided to close 3 additional stores for which termination or rental reduction agreements were unable to be reached. The Company estimates total charges of approximately $7 million of cash and non-cash termination charges related to these closures, of which, $4 million will be incurred in the first quarter of fiscal 2010. The cash portion of these charges will be partially offset by the liquidation of inventory in the closing stores. As a result of its efforts to date, the Company has achieved approximately $7 million in rental savings for fiscal 2010 and now estimates it will close no more than 80 locations in fiscal 2010. Actual expenses related to these closures cannot be estimated as they will largely depend upon the results of on-going negotiations.
As part of the sale of the Company's home office building and accompanying land, the Company entered into a lease agreement to rent office space in the building. The lease has a primary term of seven years beginning on June 9, 2008, with one three-year renewal option and provisions for terminating the lease at the end of the fifth lease year.
On May 4, 2009, the Company received notice from NYSE Regulation, Inc. ("NYSE Regulation") that the Company was in compliance with the New York Stock Exchange ("NYSE") continued listing standards. Previously on December 15, 2008, the Company had received notice from NYSE Regulation that the Company was not in compliance with the NYSE continued listing standard under Section 802.01C of the NYSE Listed Company Manual due to the fact that the average closing share price of the Company's common stock over a consecutive 30-day trading period was less than $1.00. The Company notified NYSE Regulation within the required ten business days that it intended to cure the deficiency and that its Board of Directors had met and was considering all strategic measures to cure the non-compliance with the listing standard.
On February 26, 2009, the Company received notice from the NYSE that it had suspended the NYSE's $1.00 minimum price requirement on a temporary basis, initially through June 30, 2009. The notice also extends until June 30, 2009, the NYSE's current easing of the average global market capitalization standard, calculated over a consecutive 30 trading-day period, from $25 million to $15 million. According to section 802.01B of the NYSE Listed Company Manual, the NYSE will promptly initiate suspension and delisting procedures with respect to a company if a company is
31
Table of Contents
determined to be out of compliance with this standard. As of May 1, 2009, the Company's average global market capitalization over a consecutive 30 trading-day period was greater than $25 million.
As discussed in Note 5 to the Consolidated Financial Statements, the definition of a fundamental change under the Company's 6.375% convertible senior notes due 2036 (the "Notes") includes the Company's common stock ceasing to be listed on a national securities exchange or quoted on the Nasdaq National Market or another established automated over-the-counter trading market in the United States. The Company believes that it will continue to be able to satisfy the above requirement for the listing or quotation of its common stock. If the Company is, however, unable to comply with this provision of the Notes, the holders of the Notes could, at their option, require the Company to repurchase all or a portion of their Notes. Such an event could have a material adverse effect on the Company if the Company does not have sufficient cash, is unable to raise sufficient additional capital for such repurchases, or is otherwise unable to refinance the Notes.
On March 20, 2009, a foreign subsidiary of the Company purchased $78.9 million of the Company's outstanding Notes at a purchase price of $27.4 million, including accrued interest. The foreign subsidiary intends to hold the notes until maturity. As a result of this transaction, the Company has reduced its outstanding convertible debt to $86.1 million on a consolidated basis. The Company expects to recognize a gain of approximately $49.0 million in connection with this transaction during the first quarter of fiscal 2010. From time to time the Company may continue to seek to retire or purchase its remaining outstanding Notes through cash purchases and/or exchanges for equity securities, in open market purchases, privately negotiated transactions or otherwise. Such repurchases or exchanges, if any, will depend on prevailing market conditions, the Company's liquidity requirements, contractual restrictions and other factors. The amounts involved will be subject to compliance with all debt agreements and may be material. See Note 13 of the Notes to Consolidated Financial Statements for further discussion. As a result of the put feature of the Company's 6.375% convertible senior notes due 2036, the Company anticipates that the remaining $86.1 million in Notes will have to be repaid or refinanced on or before February 15, 2011. If the Company does not have sufficient cash, is unable to raise sufficient additional capital for such repurchases, or is otherwise unable to refinance the Notes, such repayment could have a material adverse effect on the Company, its business, financial condition and results of operations.
The Company has an umbrella trust, currently consisting of four sub-trusts (the "Trusts"), which was established for the purpose of setting aside funds to be used to settle certain benefit plan obligations. Two of the sub-trusts are restricted to satisfy obligations to certain participants of the Company's supplemental retirement plans. These trusts consisted of interest bearing investments of less than $0.1 million at both February 28, 2009 and March 1, 2008, and were included in other noncurrent assets in fiscal 2009 and 2008. The remaining two sub-trusts are restricted to meet the funding requirements of the Company's non-qualified deferred compensation plans. These trusts' assets consisted of interest bearing investments totaling $0.2 million at February 28, 2009 and $1.5 million at March 1, 2008, and were included in other noncurrent assets. These trusts also own and are the beneficiaries of life insurance policies with cash surrender values of approximately $5.4 million at February 28, 2009, and death benefits of approximately $13.5 million. In addition, the Company owns and is the beneficiary of a number of insurance policies on the lives of current and former key executives that are unrestricted as to use. The cash surrender value of these unrestricted policies was approximately $16.0 million at February 28, 2009, and was included in other noncurrent assets. The death benefit related to the unrestricted policies was approximately $24.9 million. At the discretion of the Board of Directors, contributions of cash or unrestricted life insurance policies could be made to the Trusts.
The Company's sources of working capital for fiscal 2009 were cash flows from internally generated funds, the sale of the Company's home office building and related assets and collections of income tax receivables. The Company has a variety of sources for liquidity, which include available cash
32
Table of Contents
balances, available lines of credit and cash surrender value of life insurance policies not restricted as to use. The Company's current plans for fiscal 2010 include a capital expenditure budget of approximately $7.0 million. As discussed above, the Company estimates total charges of approximately $7 million of cash and non-cash termination charges related to store closures, of which, $4 million will be incurred in the first quarter of fiscal 2010. The cash portion of these charges will be partially offset by the liquidation of inventory in the closing stores. In addition, a foreign subsidiary of the Company utilized $27.4 million to repurchase a portion of the Company's outstanding Notes during the first quarter of fiscal 2010 and may continue to seek to retire or purchase the remaining outstanding Notes as discussed above. The Company does not presently anticipate any other significant cash outflows in fiscal 2010 other than those occurring in the normal course of business or as discussed herein. Considering these plans and the other sources of liquidity referred to above, the Company believes it has sufficient liquidity to fund operational obligations and capital expenditure requirements through fiscal year 2010.
The Company's key drivers of cash flows are sales, management of inventory levels, vendor payment terms, management of expenses, and capital expenditures. The Company's turnaround plan includes making conservative inventory purchases, managing those inventories, continuing to make the Company's merchandise offering more compelling, and improving the in-store experience. In addition, the Company will continue to focus on its ongoing mission to maximize its revenues, while seeking out ways to reduce its cost base, considering refinancing alternatives of its convertible senior notes and preserving its liquidity. From fiscal 2006 through fiscal 2009, the Company has incurred net losses and had negative cash flows from operating activities. The end of the difficult economic situation faced by the United States is not known at this time and consumer confidence and spending could remain depressed and possibly deteriorate even further. The Company may incur negative operating cash flows in future periods and a long-term decline in consumer spending could have a material adverse effect on the Company's financial condition and ability to generate cash flows from operations. As a result, the Company may become dependent on the availability of adequate capital to fund its operations, carry out its turnaround strategy, or refinance existing indebtedness if necessary. Recent disruption in the global credit and equity markets and future disruptions in the financial markets could adversely affect the Company's ability to enter into new financing agreements, refinance the Company's current indebtedness, or obtain funding through the issuance of the Company's securities. Future availability of financing sources cannot be assured given the current economic environment and the Company's recent financial results, and there can be no assurance that the Company will achieve or sustain positive cash flows or profitability over the long-term.
OFF-BALANCE SHEET ARRANGEMENTS
Other than the operating leases, letters of credit and purchase obligations discussed above, the Company has no off-balance sheet arrangements.
33
Table of Contents
CRITICAL ACCOUNTING POLICIES AND ESTIMATES
The preparation of the Company's consolidated financial statements in accordance with accounting principles generally accepted in the United States requires the use of estimates that affect the reported value of assets, liabilities, revenues and expenses. These estimates are based on historical experience and various other factors that are believed to be reasonable under the circumstances, the results of which form the basis for the Company's conclusions. The Company continually evaluates the information used to make these estimates as the business and the economic environment changes. Historically, actual results have not varied materially from the Company's estimates, with the exception of the impairment of long-lived assets, the early retirement of participants in its defined benefit plans, and income taxes as discussed below. The Company does not currently anticipate a significant change in its assumptions related to these estimates. Actual results may differ from these estimates under different assumptions or conditions. The Company's significant accounting policies can be found in Note 1 of the Notes to Consolidated Financial Statements . The policies and estimates discussed below include the financial statement elements that are either judgmental or involve the selection or application of alternative accounting policies and are material to the Company's financial statements. Unless specifically addressed below, the Company does not believe that its critical accounting policies are subject to market risk exposure that would be considered material and as a result, has not provided a sensitivity analysis. The use of estimates is pervasive throughout the consolidated financial statements, but the accounting policies and estimates considered most critical are as follows:
Revenue recognition -The Company recognizes revenue from retail sales, net of sales tax and third-party credit card fees, upon customer receipt or delivery of merchandise, including sales under deferred payment promotions on its proprietary credit card in fiscal 2007 and prior years. The Company records an allowance for estimated merchandise returns based upon historical experience and other known factors. Should actual returns differ from the Company's estimates and current provision for merchandise returns, revisions to the estimated merchandise returns may be required.
Gift cards -Revenue associated with gift cards is recognized when merchandise is sold and a gift card is redeemed as payment. Gift card breakage is estimated and recorded as income based upon an analysis of the Company's historical data and expected trends in redemption patterns and represents the remaining unused portion of the gift card liability for which the likelihood of redemption is remote. If actual redemption patterns vary from the Company's estimates, actual gift card breakage may differ from the amounts recorded. For all periods presented, gift card breakage was recognized at 30 months from the original issuance and was $4.1 million, $1.7 million and $6.2 million in fiscal 2009, 2008 and 2007, respectively.
Inventories -The Company's inventory is comprised of finished merchandise and is stated at the lower of weighted average cost or market value. Cost is calculated based upon the actual landed cost of an item at the time it is received in the Company's warehouse using actual vendor invoices, the cost of warehousing and transporting product to the stores and other direct costs associated with purchasing products. Carrying values of inventory are analyzed and to the extent that the cost of inventory exceeds the expected selling prices less reasonable costs to sell, provisions are made to reduce the carrying amount of the inventory. The Company reviews its inventory levels in order to identify slow-moving merchandise and uses merchandise markdowns to sell such merchandise. Markdowns are recorded to reduce the retail price of such slow-moving merchandise as needed. Since the determination of carrying values of inventory involves both estimation and judgment with regard to market values and reasonable costs to sell, differences in these estimates could result in ultimate valuations that differ from the recorded asset. The majority of inventory purchases and commitments are made in U.S. dollars in order to limit the Company's exposure to foreign currency fluctuations.
The Company recognizes known inventory losses, shortages and damages when incurred and makes a provision for estimated shrinkage. The amount of the provision is estimated based on historical
34
Table of Contents
experience from the results of its physical inventories. Inventory is physically counted at substantially all locations at least once in each 12-month period, at which time actual results are reflected in the financial statements. Physical counts were taken at substantially all stores and distribution centers during each period presented in the financial statements. Although inventory shrinkage rates have not fluctuated significantly in recent years, should actual rates differ from the Company's estimates, revisions to the inventory shrinkage expense may be required.
Impairment of long-lived assets -Long-lived assets such as buildings, equipment, furniture and fixtures, and leasehold improvements are reviewed for impairment at least annually and whenever an event or change in circumstances indicates that their carrying values may not be recoverable. If the carrying value exceeds the sum of the expected undiscounted cash flows, the assets are considered impaired. For store level long-lived assets, expected cash flows are estimated based on management's estimate of changes in sales, merchandise margins, and expenses over the remaining expected terms of the leases. Impairment is measured as the amount by which the carrying value of the asset exceeds the fair value of the asset. Fair value is determined by discounting expected cash flows. Impairment, if any, is recorded in the period in which the impairment occurred. The Company recorded $9.4 million, $4.8 million and $31.9 million in impairment charges in fiscal 2009, 2008 and 2007, respectively. As the projection of future cash flows requires the use of judgment and estimates, if actual results differ from the Company's estimates, additional charges for asset impairments may be recorded in the future. If management had lowered its assumptions of comparable store sales results by 3% for each of the next five years, additional impairment charges of approximately $2.3 million would have been recorded in fiscal 2009.
Insurance provision -The Company maintains insurance for workers' compensation and general liability claims with deductibles of $1,000,000 and $750,000, respectively, per claim. The liability recorded for such claims is determined by estimating the total future claims cost for events that occurred prior to the balance sheet date. The estimates consider historical claims development factors as well as information obtained from and projections made by the Company's insurance carrier and underwriters. The recorded liabilities for workers' compensation and general liability claims, including those occurring in prior years but not yet settled, at February 28, 2009 were $19.7 million and $8.3 million, respectively.
The assumptions made in determining the above estimates are reviewed monthly and the liability adjusted accordingly as new facts are revealed. Changes in circumstances and conditions affecting the assumptions used in determining the liabilities could cause actual results to differ from the Company's recorded amounts.
Defined benefit plans -The Company maintains supplemental retirement plans (the "Plans") for certain of its current and former executive officers. The Plans provide that upon death, disability, reaching retirement age or certain termination events, a participant will receive benefits based on highest compensation, years of service and years of plan participation. These benefit costs are dependent upon numerous factors, assumptions and estimates. Benefit costs may be significantly affected by changes in key actuarial assumptions such as the discount rate, compensation rates, or retirement dates used to determine the projected benefit obligation. Additionally, changes made to the provisions of the Plans may impact current and future benefit costs.
Stock-based compensation -The fair value of stock options is amortized as compensation expense over the vesting periods of the options. The fair values for options granted by the Company are estimated as of the date of grant using the Black-Scholes option-pricing model. Option valuation models require the input of highly subjective assumptions, including the expected stock price volatility and the average life of options. The Company uses expected volatilities and risk-free interest rates that correlate with the expected term of the option when estimating an option's fair value. To determine the expected term of the option, the Company bases its estimates on historical exercise activity of grants
35
Table of Contents
with similar vesting periods. Expected volatility is based on the historical volatility of the common stock of the Company for a period approximating the expected life. The risk free interest rate utilized is the United States Treasury rate that most closely matches the weighted average expected life at the time of the grant. The expected dividend yield is based on the annual dividend rate at the time of grant or estimates of future anticipated dividend rates. If the Company had used different assumptions, the value of stock options may have been different.
Income taxes -The Company accounts for income taxes using the asset and liability method. Under this method, deferred tax assets and liabilities are determined based on differences between financial reporting and income tax bases of assets and liabilities and are measured using the enacted tax rates and laws that will be in effect when the differences are expected to reverse. Deferred tax assets and liabilities are recorded in the Company's consolidated balance sheets and are classified as current or noncurrent based on the classification of the related assets or liabilities for financial reporting purposes. A valuation allowance is recorded to reduce the carrying amounts of deferred tax assets unless it is more likely than not those assets will be realized. In assessing the need for a valuation allowance, all available evidence is considered including past operating results, estimates of future income, and tax planning strategies. The Company is subject to income tax in many jurisdictions, including the United States, various states and localities, and foreign countries. At any point in time, multiple tax years are subject to audit by various jurisdictions and the Company records reserves for estimates of the tax exposure for foreign and domestic tax audits. The timing of these audits and negotiations with taxing authorities may affect the ultimate settlement of these issues. If different assumptions had been used, the Company's tax expense or benefit, assets and liabilities could have varied from recorded amounts. If actual results differ from estimated results or if the Company adjusts these assumptions in the future, the Company may need to adjust its deferred tax assets or liabilities, which could impact its effective tax rate.
IMPACT OF INFLATION AND CHANGING PRICES
Inflation has not had a significant impact on the operations of the Company during the preceding three years.
IMPACT OF NEW ACCOUNTING STANDARDS
In May 2008, the Financial Accounting Standards Board ("FASB") issued FASB Staff Position ("FSP") APB 14-1, "Accounting for Convertible Debt Instruments That May Be Settled in Cash upon Conversion (Including Partial Cash Settlement)", which clarifies that convertible debt instruments that may be settled in cash upon conversion (including partial cash settlement) are not addressed by paragraph 12 of APB Opinion No. 14, "Accounting for Convertible Debt and Debt Issued with Stock Purchase Warrants." Additionally, this FSP specifies that issuers of such instruments should separately account for the liability and equity components in a manner that will reflect the entity's nonconvertible debt borrowing rate when interest cost is recognized in subsequent periods. This FSP will be applied retrospectively to all periods presented. FSP APB 14-1 is effective for the Company at the beginning of fiscal year 2010. The Company is currently evaluating the impact of the adoption on its financial statements.
Item 7A. Quantitative and Qualitative Disclosures about Market Risk.
Market risks relating to the Company's operations result primarily from changes in foreign exchange rates and interest rates. The Company has only limited involvement with derivative financial instruments, does not use them for trading purposes and is not a party to any leveraged derivatives. Collectively, the Company's exposure to market risk factors is not significant and has not materially changed from March 1, 2008.
36
Table of Contents
Foreign Currency Risk
Though the majority of the Company's inventory purchases are made in U.S. dollars in order to limit its exposure to foreign currency fluctuations, the Company, from time to time, enters into forward foreign currency exchange contracts. The Company uses such contracts to hedge exposures to changes in foreign currency exchange rates associated with purchases denominated in foreign currencies, primarily euros. The Company operates stores in Canada and is subject to fluctuations in currency conversion rates related to these operations. The Company, on occasion, uses contracts to hedge its exposure associated with repatriation of funds from its Canadian operations. Changes in the fair value of the derivatives are included in the Company's consolidated statements of operations as such contracts are not designated as hedges under SFAS No. 133, "Accounting for Derivative Instruments and Hedging Activities." Forward contracts that hedge merchandise purchases generally have maturities not exceeding six months. Changes in the fair value and settlement of these forwards are included in cost of sales. Contracts that hedge the repatriation of Canadian funds have maturities not exceeding 18 months and changes in the fair value and settlement of these contracts are included in selling, general and administrative expenses. At February 28, 2009, there were no outstanding contracts to hedge exposure associated with the Company's merchandise purchases denominated in foreign currencies or the repatriation of Canadian funds.
Interest Rate Risk
The Company manages its exposure to changes in interest rates by optimizing the use of variable and fixed rate debt. The interest rate exposure on the Company's secured credit facility and industrial revenue bonds is based upon variable interest rates and therefore is affected by changes in market interest rates. As of February 28, 2009, the Company had $19.0 million in borrowings outstanding on its industrial revenue bonds and no cash borrowings outstanding on its secured credit facility. A hypothetical 10% adverse change in the interest rates applicable to either or both of these variable rate instruments would have a negligible impact on the Company's earnings and cash flows.
Additionally, as of February 28, 2009, the Company had $165.0 million in convertible senior notes outstanding, which mature in February 2036. The notes pay a fixed annual rate of 6.375% for the first five years and a fixed rate of 6.125% thereafter. Changes in market interest rates generally affect the fair value of fixed rate debt instruments, but would not affect the Company's financial position, results of operations or cash flows related to these notes. As of February 28, 2009, the fair value of these notes was $42.9 million based on quoted market values.
On March 20, 2009 a foreign subsidiary of the Company purchased $78.9 million of the Company's outstanding Notes at a purchase price of $27.4 million, including accrued interest. The purchase price of these convertible notes implies a fair value of the total outstanding notes prior to the purchase of approximately $56.0 million. The foreign subsidiary intends to hold the notes until maturity. As a result of this transaction, the Company has reduced its outstanding convertible debt to $86.1 million on a consolidated basis. The Company expects to recognize a gain of approximately $49.0 million in connection with this transaction during the first quarter of fiscal 2010. See Note 13 of the Notes to Consolidated Financial Statements for further discussion.
37
Table of Contents
Item 8. Financial Statements and Supplementary Data.
REPORT OF INDEPENDENT REGISTERED PUBLIC ACCOUNTING FIRM
To the Board of Directors of Pier 1 Imports, Inc.
We have audited the accompanying consolidated balance sheets of Pier 1 Imports, Inc. as of February 28, 2009 and March 1, 2008, and the related consolidated statements of operations, shareholders' equity, and cash flows for each of the three years in the period ended February 28, 2009. These financial statements are the responsibility of the Company's management. Our responsibility is to express an opinion on these financial statements based on our audits.
We conducted our audits in accordance with the standards of the Public Company Accounting Oversight Board (United States). Those standards require that we plan and perform the audit to obtain reasonable assurance about whether the financial statements are free of material misstatement. An audit includes examining, on a test basis, evidence supporting the amounts and disclosures in the financial statements. An audit also includes assessing the accounting principles used and significant estimates made by management, as well as evaluating the overall financial statement presentation. We believe that our audits provide a reasonable basis for our opinion.
In our opinion, the financial statements referred to above present fairly, in all material respects, the consolidated financial position of Pier 1 Imports, Inc. at February 28, 2009 and March 1, 2008, and the consolidated results of its operations and its cash flows for each of the three years in the period ended February 28, 2009, in conformity with U.S. generally accepted accounting principles.
As discussed in notes to the consolidated financial statements, effective March 3, 2007, Pier 1 Imports, Inc. adopted Statement of Financial Accounting Standards No. 158, Employers' Accounting for Defined Benefit Pension and Other Postretirement Plans, an Amendment of FASB Statements No. 87, 88, 106 and 132(R), and effective March 4, 2007, Pier 1 Imports, Inc. adopted FASB Interpretation No. 48, Accounting for Uncertainty in Income Taxes-An Interpretation of FASB Statement No. 109.
We also have audited, in accordance with the standards of the Public Company Accounting Oversight Board (United States), Pier 1 Imports, Inc.'s internal control over financial reporting as of February 28, 2009, based on criteria established in Internal Control-Integrated Framework issued by the Committee of Sponsoring Organizations of the Treadway Commission and our report dated April 28, 2009 expressed an unqualified opinion thereon.
| /s/ Ernst & Young LLP | ||
Fort Worth, Texas April 28, 2009 | | |
38
Table of Contents
Pier 1 Imports, Inc.
CONSOLIDATED STATEMENTS OF OPERATIONS
(in thousands except per share amounts)
| | Year Ended | |||||||||||
|---|---|---|---|---|---|---|---|---|---|---|---|---|
| | 2009 | 2008 | 2007 | |||||||||
Net sales | $ | 1,320,677 | $ | 1,511,832 | $ | 1,623,216 | ||||||
Operating costs and expenses: | ||||||||||||
Cost of sales (including buying and store occupancy costs) | 957,213 | 1,072,280 | 1,149,257 | |||||||||
Selling, general and administrative expenses | 453,471 | 487,898 | 649,005 | |||||||||
Depreciation and amortization | 30,556 | 39,792 | 51,184 | |||||||||
| 1,441,240 | 1,599,970 | 1,849,446 | |||||||||
Operating loss | (120,563 | ) | (88,138 | ) | (226,230 | ) | ||||||
Nonoperating (income) and expenses: | ||||||||||||
Interest and investment income | (4,250 | ) | (8,677 | ) | (12,456 | ) | ||||||
Interest expense | 14,592 | 15,916 | 16,116 | |||||||||
Other income | (2,276 | ) | (1,960 | ) | (1,767 | ) | ||||||
| 8,066 | 5,279 | 1,893 | |||||||||
Loss from continuing operations before income taxes | (128,629 | ) | (93,417 | ) | (228,123 | ) | ||||||
Provision (benefit) for income taxes | 624 | 2,594 | (885 | ) | ||||||||
Net loss from continuing operations | (129,253 | ) | (96,011 | ) | (227,238 | ) | ||||||
Discontinued operations: | ||||||||||||
Loss from discontinued operations | - | - | (638 | ) | ||||||||
Income tax benefit | - | - | (231 | ) | ||||||||
Net loss from discontinued operations | - | - | (407 | ) | ||||||||
Net loss | $ | (129,253 | ) | $ | (96,011 | ) | $ | (227,645 | ) | |||
Loss per share from continuing operations: | ||||||||||||
Basic and diluted | $ | (1.45 | ) | $ | (1.09 | ) | $ | (2.59 | ) | |||
Loss per share from discontinued operations: | ||||||||||||
Basic and diluted | $ | - | $ | - | $ | (0.01 | ) | |||||
Loss per share: | ||||||||||||
Basic and diluted | $ | (1.45 | ) | $ | (1.09 | ) | $ | (2.60 | ) | |||
Dividends declared per share: | $ | - | $ | - | $ | 0.20 | ||||||
Average shares outstanding during period: | ||||||||||||
Basic and diluted | 88,912 | 88,083 | 87,395 | |||||||||
The accompanying notes are an integral part of these financial statements.
39
Table of Contents
Pier 1 Imports, Inc.
CONSOLIDATED BALANCE SHEETS
(in thousands except share amounts)
| | 2009 | 2008 | ||||||||||
|---|---|---|---|---|---|---|---|---|---|---|---|---|
ASSETS | ||||||||||||
Current assets: | ||||||||||||
Cash and cash equivalents, including temporary investments of $142,523 and $87,837, respectively | $ | 155,798 | $ | 93,433 | ||||||||
Other accounts receivable, net of allowance for | ||||||||||||
doubtful accounts of $1,579 and $1,034, respectively | 17,566 | 23,121 | ||||||||||
Inventories | 316,331 | 411,709 | ||||||||||
Income tax receivable | 2,149 | 13,632 | ||||||||||
Prepaid expenses and other current assets | 41,883 | 41,445 | ||||||||||
Total current assets | 533,727 | 583,340 | ||||||||||
Office building and related assets | - | 80,539 | ||||||||||
Other properties, net | 85,135 | 114,952 | ||||||||||
Other noncurrent assets | 36,600 | 43,073 | ||||||||||
| $ | 655,462 | $ | 821,904 | ||||||||
LIABILITES AND SHAREHOLDERS' EQUITY | ||||||||||||
Current liabilities: | ||||||||||||
Accounts payable | $ | 80,695 | $ | 106,084 | ||||||||
Gift cards and other deferred revenue | 47,332 | 63,101 | ||||||||||
Accrued income taxes payable | 4,434 | 5,000 | ||||||||||
Other accrued liabilities | 101,350 | 101,817 | ||||||||||
Total current liabilities | 233,811 | 276,002 | ||||||||||
Long-term debt | 184,000 | 184,000 | ||||||||||
Other noncurrent liabilities | 93,390 | 94,158 | ||||||||||
Shareholders' equity: | ||||||||||||
Common stock, $1.00 par, 500,000,000 shares authorized, 100,779,000 issued | 100,779 | 100,779 | ||||||||||
Paid-in capital | 113,326 | 126,795 | ||||||||||
Retained earnings | 106,841 | 236,094 | ||||||||||
Cumulative other comprehensive income (loss) | (1,195 | ) | 373 | |||||||||
Less-10,905,000 and 12,172,000 common shares in treasury, at cost, respectively | (175,490 | ) | (196,297 | ) | ||||||||
| 144,261 | 267,744 | ||||||||||
Commitments and contingencies | - | - | ||||||||||
| $ | 655,462 | $ | 821,904 | ||||||||
The accompanying notes are an integral part of these financial statements.
40
Table of Contents
Pier 1 Imports, Inc.
CONSOLIDATED STATEMENTS OF CASH FLOWS
(in thousands)
| | Year Ended | ||||||||||||
|---|---|---|---|---|---|---|---|---|---|---|---|---|---|
| | 2009 | 2008 | 2007 | ||||||||||
Cash flow from operating activities: | |||||||||||||
Net loss | $ | (129,253 | ) | $ | (96,011 | ) | $ | (227,645 | ) | ||||
Adjustments to reconcile to net cash used in operating activities: | |||||||||||||
Depreciation and amortization | 45,156 | 55,303 | 63,496 | ||||||||||
Loss (gain) on disposal of fixed assets | 41 | (2,137 | ) | 187 | |||||||||
Loss on impairment of fixed assets and other long-lived assets | 9,653 | 5,030 | 36,369 | ||||||||||
Stock-based compensation expense | 5,177 | 5,837 | 5,464 | ||||||||||
Deferred compensation | 4,215 | 4,157 | 16,915 | ||||||||||
Lease termination expense | 6,074 | 10,440 | 4,003 | ||||||||||
Deferred income taxes | - | - | 24,576 | ||||||||||
Amortization of deferred gains | (6,774 | ) | (2,533 | ) | (981 | ) | |||||||
Other | (2,201 | ) | 1,543 | (2,140 | ) | ||||||||
Change in cash from: | |||||||||||||
Sale of receivables in exchange for beneficial interest in securitized receivables | - | - | (15,914 | ) | |||||||||
Purchase of proprietary credit card receivables and other | - | - | (97,740 | ) | |||||||||
Proceeds from the sale of proprietary credit card operations | - | - | 144,622 | ||||||||||
Inventories | 95,378 | (51,646 | ) | 9,757 | |||||||||
Other accounts receivable, prepaid expenses and other current assets | (5,055 | ) | (8,776 | ) | (14,428 | ) | |||||||
Income tax receivable | 14,486 | 25,616 | (16,955 | ) | |||||||||
Accounts payable and accrued expenses | (65,457 | ) | (22,818 | ) | (5,388 | ) | |||||||
Income taxes payable | (1,620 | ) | 2,765 | (1,595 | ) | ||||||||
Defined benefit plan liabilities | (118 | ) | (6,351 | ) | (25,495 | ) | |||||||
Other noncurrent assets | 1,209 | 762 | 566 | ||||||||||
Other noncurrent liabilities | (2,545 | ) | (4,255 | ) | (2,579 | ) | |||||||
Net cash used in operating activities | (31,634 | ) | (83,074 | ) | (104,905 | ) | |||||||
Cash flow from investing activities: | |||||||||||||
Capital expenditures | (13,378 | ) | (7,153 | ) | (28,600 | ) | |||||||
Proceeds from disposition of properties | 102,478 | 5,674 | 173 | ||||||||||
Proceeds from sale of discontinued operation | - | - | 11,601 | ||||||||||
Proceeds from sale of Pier 1 National Bank | - | - | 10,754 | ||||||||||
Proceeds from sale of restricted investments | 3,258 | 6,986 | 25,707 | ||||||||||
Purchase of restricted investments | (2,020 | ) | (589 | ) | (9,712 | ) | |||||||
Collection of note receivable | 1,500 | 1,500 | - | ||||||||||
Collections of principal on beneficial interest in securitized receivables | - | - | 21,907 | ||||||||||
Net cash provided by investing activities | 91,838 | 6,418 | 31,830 | ||||||||||
Cash flow from financing activities: | |||||||||||||
Cash dividends | - | - | (17,398 | ) | |||||||||
Proceeds from stock options exercised, stock purchase plan and other, net | 2,161 | 3,909 | 4,719 | ||||||||||
Notes payable borrowings | - | - | 69,000 | ||||||||||
Repayment of notes payable | - | - | (69,000 | ) | |||||||||
Debt issuance costs | - | (998 | ) | (283 | ) | ||||||||
Net cash provided by (used in) financing activities | 2,161 | 2,911 | (12,962 | ) | |||||||||
Change in cash and cash equivalents | 62,365 | (73,745 | ) | (86,037 | ) | ||||||||
Cash and cash equivalents at beginning of period | 93,433 | 167,178 | 253,215 | ||||||||||
Cash and cash equivalents at end of period | $ | 155,798 | $ | 93,433 | $ | 167,178 | |||||||
Supplemental cash flow information: | |||||||||||||
Interest paid | $ | 14,018 | $ | 15,743 | $ | 12,821 | |||||||
Income taxes paid | $ | 2,617 | $ | 1,124 | $ | 2,021 | |||||||
The accompanying notes are an integral part of these financial statements.
41
Table of Contents
Pier 1 Imports, Inc.
CONSOLIDATED STATEMENTS OF SHAREHOLDERS' EQUITY
(in thousands except per share amounts)
| | Common Stock | | | | | | | ||||||||||||||||||||
|---|---|---|---|---|---|---|---|---|---|---|---|---|---|---|---|---|---|---|---|---|---|---|---|---|---|---|---|
| | | | Cumulative Other Comprehensive Income (Loss) | | | | |||||||||||||||||||||
| | Outstanding Shares | Amount | Paid-in Capital | Retained Earnings | Treasury Stock | Unearned Compensation | Total Shareholders' Equity | ||||||||||||||||||||
Balance February 25, 2006 | 86,939 | $ | 100,779 | $ | 132,075 | $ | 582,221 | $ | (583 | ) | $ | (222,254 | ) | $ | (2,256 | ) | $ | 589,982 | |||||||||
Comprehensive income (loss): | |||||||||||||||||||||||||||
Net loss | - | - | - | (227,645 | ) | - | - | - | (227,645 | ) | |||||||||||||||||
Other comprehensive income (loss), net of tax as applicable: | |||||||||||||||||||||||||||
Minimum pension liability adjustments | - | - | - | - | 7,172 | - | - | 7,172 | |||||||||||||||||||
Currency translation adjustments | - | - | - | - | (2,550 | ) | - | - | (2,550 | ) | |||||||||||||||||
Comprehensive loss | (223,023 | ) | |||||||||||||||||||||||||
Adjustment to initially apply SFAS No. 158 | - | - | - | - | (1,631 | ) | - | - | (1,631 | ) | |||||||||||||||||
Restricted stock compensation | 185 | - | (4,280 | ) | - | - | 2,994 | 2,256 | 970 | ||||||||||||||||||
Stock option compensation expense | - | - | 4,494 | - | - | - | - | 4,494 | |||||||||||||||||||
Exercise of stock options, stock purchase plan and other | 674 | - | (1,873 | ) | - | - | 9,596 | - | 7,723 | ||||||||||||||||||
Cash dividends ($.20 per share) | - | - | - | (17,398 | ) | - | - | - | (17,398 | ) | |||||||||||||||||
Balance March 3, 2007 | 87,798 | 100,779 | 130,416 | 337,178 | 2,408 | (209,664 | ) | - | 361,117 | ||||||||||||||||||
Implementation of FIN 48 | - | - | - | (5,073 | ) | - | - | - | (5,073 | ) | |||||||||||||||||
Comprehensive loss: | |||||||||||||||||||||||||||
Net loss | - | - | - | (96,011 | ) | - | - | - | (96,011 | ) | |||||||||||||||||
Other comprehensive income (loss), net of tax as applicable: | |||||||||||||||||||||||||||
Pension adjustments | - | - | - | - | (3,017 | ) | - | - | (3,017 | ) | |||||||||||||||||
Currency translation adjustments | - | - | - | - | 982 | - | - | 982 | |||||||||||||||||||
Comprehensive loss | (98,046 | ) | |||||||||||||||||||||||||
Restricted stock compensation | 281 | - | (2,974 | ) | - | - | 4,533 | - | 1,559 | ||||||||||||||||||
Stock option compensation expense | - | - | 4,278 | - | - | - | - | 4,278 | |||||||||||||||||||
Exercise of stock options, stock purchase plan and other | 528 | - | (4,925 | ) | - | - | 8,834 | - | 3,909 | ||||||||||||||||||
Balance March 1, 2008 | 88,607 | 100,779 | 126,795 | 236,094 | 373 | (196,297 | ) | - | 267,744 | ||||||||||||||||||
Comprehensive loss: | |||||||||||||||||||||||||||
Net loss | - | - | - | (129,253 | ) | - | - | - | (129,253 | ) | |||||||||||||||||
Other comprehensive income (loss), net of tax as applicable: | |||||||||||||||||||||||||||
Pension adjustments | - | - | - | - | 2,016 | - | - | 2,016 | |||||||||||||||||||
Currency translation adjustments | - | - | - | - | (3,584 | ) | - | - | (3,584 | ) | |||||||||||||||||
Comprehensive loss | (130,821 | ) | |||||||||||||||||||||||||
Restricted stock compensation | 245 | - | (2,298 | ) | - | - | 3,947 | - | 1,649 | ||||||||||||||||||
Stock option compensation expense | - | - | 3,528 | - | - | - | - | 3,528 | |||||||||||||||||||
Exercise of stock options, stock purchase plan and other | 1,022 | - | (14,699 | ) | - | - | 16,860 | - | 2,161 | ||||||||||||||||||
Balance February 28, 2009 | 89,874 | $ | 100,779 | $ | 113,326 | $ | 106,841 | $ | (1,195 | ) | $ | (175,490 | ) | $ | - | $ | 144,261 | ||||||||||
The accompanying notes are an integral part of these financial statements.
42
Table of Contents
NOTES TO CONSOLIDATED FINANCIAL STATEMENTS
NOTE 1-DESCRIPTION OF BUSINESS AND SUMMARY OF SIGNIFICANT ACCOUNTING POLICIES
Organization -Pier 1 Imports, Inc. (together with its consolidated subsidiaries, the "Company") is one of North America's largest specialty retailers of imported decorative home furnishings and gifts, with retail stores located in the United States and Canada. Additionally, the Company has merchandise in "store within a store" locations in Mexico and Puerto Rico that are primarily operated by Sears Roebuck de Mexico, S.A. de C.V. and Sears Roebuck de Puerto Rico, Inc., respectively. On March 20, 2006, the Company sold its subsidiary based in the United Kingdom, The Pier Retail Group Limited ("The Pier"). The Pier has been included in discontinued operations in the Company's financial statements for fiscal year 2007.
Basis of consolidation -The consolidated financial statements of the Company include the accounts of all subsidiary companies except, in fiscal 2007, Pier 1 Funding, LLC ("Funding"), a non-consolidated, bankruptcy remote, securitization subsidiary. See Note 9 of the Notes to Consolidated Financial Statements for further discussion. All intercompany transactions and balances have been eliminated.
Segment information -The Company is a specialty retailer that offers a broad range of products in its stores and conducts business as one operating segment. The Company's domestic operations provided 90.9%, 90.9% and 92.3% of its net sales, with 8.5%, 8.7% and 7.3% provided by stores in Canada, and the remainder from royalties received from Sears Roebuck de Mexico S.A. de C.V. during fiscal 2009, 2008 and 2007, respectively. As of February 28, 2009, March 1, 2008 and March 3, 2007, $2,308,000, $4,572,000 and $5,510,000, respectively, of the Company's long-lived assets were located in Canada. There were no long-lived assets in Mexico during any period.
Use of estimates -Preparation of the financial statements in conformity with U.S. generally accepted accounting principles requires management to make estimates and assumptions that affect the amounts reported in the financial statements and accompanying notes. Actual results could differ from those estimates.
Reclassifications -Certain reclassifications have been made in the prior years' consolidated financial statements to conform to the fiscal 2009 presentation. These reclassifications had no effect on net income, shareholders' equity, total assets and total liabilities and the major categories of the cash flow. In addition to insignificant reclassifications on the statement of cash flows, the Company's home office building and related assets were reclassified during the first quarter of fiscal 2009 to noncurrent assets from assets held for sale which were included in current assets at March 1, 2008. This reclassification on the balance sheet was made in all prior periods presented to reflect the fact that the Company entered into a lease for a portion of the building when the sale transaction was completed, and therefore the building did not meet the definition of assets held for sale at the balance sheet dates. Depreciation was recorded on the assets through the date of sale and the reclassification had no impact on the results of operations or statement of cash flows in any period presented. As stated in Note 2 of the Notes to Consolidated Financial Statements above, the office building and related assets were sold on June 9, 2008.
Fiscal periods -The Company utilizes 5-4-4 (week) quarterly accounting periods with the fiscal year ending on the Saturday nearest the last day of February. Both fiscal 2009 and 2008 consisted of 52-week years and fiscal 2007 consisted of a 53-week year. Fiscal 2009 ended February 28, 2009, fiscal 2008 ended March 1, 2008 and fiscal 2007 ended March 3, 2007.
43
Table of Contents
NOTES TO CONSOLIDATED FINANCIAL STATEMENTS (Continued)
NOTE 1-DESCRIPTION OF BUSINESS AND SUMMARY OF SIGNIFICANT ACCOUNTING POLICIES (Continued)
Cash and cash equivalents, including temporary investments -The Company considers all highly liquid investments with an original maturity date of three months or less to be cash equivalents, except for those investments that are restricted and have been set aside in a trust to satisfy retirement obligations. As of February 28, 2009 and March 1, 2008, the Company's short-term investments classified as cash equivalents included investments in money market mutual funds totaling $142,523,000 and $87,837,000, respectively. The effect of foreign currency exchange rate fluctuations on cash was not material.
Translation of foreign currencies -Assets and liabilities of foreign operations are translated into U.S. dollars at fiscal year end exchange rates. Income and expense items are translated at average exchange rates prevailing during the year. Translation adjustments arising from differences in exchange rates from period to period are included as a separate component of shareholders' equity and are included in other comprehensive income (loss). As of February 28, 2009, March 1, 2008 and March 3, 2007, the Company had cumulative other comprehensive income (loss) balances of ($162,000), $3,422,000 and $2,440,000, respectively, related to cumulative translation adjustments. The adjustments for currency translation during fiscal 2009, 2008 and 2007 resulted in other comprehensive income (loss), net of tax, as applicable, of ($3,584,000), $982,000 and ($2,550,000), respectively. Taxes on the portion of its cumulative currency translation adjustment considered not to be permanently reinvested abroad were insignificant in fiscal 2009, 2008 and 2007.
Concentrations of risk -The Company has some degree of risk concentration with respect to sourcing the Company's inventory purchases. However, the Company believes alternative merchandise sources could be procured over a relatively short period of time. Pier 1 Imports sells merchandise imported from over 50 different countries, with more than 40% of its sales derived from merchandise produced in China, approximately 10% derived from merchandise produced in each of India, Indonesia, Vietnam, and the United States and approximately 10% collectively derived from merchandise produced in Thailand, Brazil, the Philippines, Italy, Mexico and Spain. The remaining sales were from merchandise produced in various Asian, European, Central American, South American, African countries and Canada.
Financial instruments -The fair value of financial instruments is determined by reference to various market data and other valuation techniques as appropriate. Other than the 6.375% convertible senior notes due 2036, there were no assets or liabilities with a fair value significantly different from the recorded value as of February 28, 2009 and March 1, 2008. The fair value of these notes was $42,900,000 and $133,650,000 based on quoted market values as of February 28, 2009 and March 1, 2008, respectively. On March 20, 2009, a foreign subsidiary of the Company purchased a portion of these convertible notes at a price which would imply a fair value of the total outstanding prior to the purchase of approximately $56,000,000. Changes in the market interest rates and other factors affecting convertible notes affect the fair value of the Company's fixed rate notes, but do not affect the Company's financial position, results of operations or cash flows related to these instruments.
Risk management instruments: The Company may utilize various financial instruments to manage interest rate and market risk associated with its on- and off-balance sheet commitments.
From time to time, the Company hedges certain commitments denominated in foreign currencies through the purchase of forward contracts. The forward contracts are purchased to cover a portion of commitments to buy merchandise for resale. The Company also, on occasion, uses contracts to hedge
44
Table of Contents
NOTES TO CONSOLIDATED FINANCIAL STATEMENTS (Continued)
NOTE 1-DESCRIPTION OF BUSINESS AND SUMMARY OF SIGNIFICANT ACCOUNTING POLICIES (Continued)
its exposure associated with the repatriation of funds from its Canadian operations. At February 28, 2009 and March 1, 2008, there were no outstanding contracts to hedge exposure associated with the Company's merchandise purchases denominated in foreign currencies or the repatriation of Canadian funds. For financial accounting purposes, the Company does not designate such contracts as hedges. Thus, changes in the fair value of both types of forward contracts would be included in the Company's consolidated statements of operations. Both the changes in fair value and settlement of these contracts are included in cost of sales for forwards related to merchandise purchases and in selling, general and administrative expense for the contracts associated with the repatriation of Canadian funds.
When the Company enters into forward foreign currency exchange contracts, it enters into them with major financial institutions and continually monitors its positions with, and the credit quality of, these counterparties to such financial instruments.
Beneficial interest in securitized receivables -As of February 28, 2009 and March 1, 2008, the Company had no beneficial interest since it allowed its securitization agreement to expire in fiscal 2007. Prior to the expiration of this agreement, the Company securitized its entire portfolio of proprietary credit card receivables, except an immaterial amount of those that failed certain eligibility requirements, to a special-purpose wholly owned subsidiary, Funding, which transferred the receivables to the Pier 1 Imports Credit Card Master Trust (the "Master Trust"). Neither Funding nor the Master Trust were consolidated by the Company, as the Master Trust met the requirements of a qualifying special-purpose entity under Statement of Financial Accounting Standards ("SFAS") No. 140, "Accounting for Transfers and Servicing of Financial Assets and Extinguishments of Liabilities." The Master Trust issued beneficial interests that represent undivided interests in the assets of the Master Trust consisting of the transferred receivables and all cash flows from collections of such receivables. The beneficial interests included certain interests retained by Funding, which were represented by Class B Certificates, and the residual interest in the Master Trust (the excess of the principal amount of receivables held in the Master Trust over the portion represented by the certificates sold to third-party investors and the Class B Certificates). Gain or loss on the sale of receivables depended in part on the previous carrying amount of the financial assets involved in the transfer, allocated between the assets sold and the retained interests based on their relative fair value at the date of transfer.
The beneficial interest in the Master Trust was accounted for as an available-for-sale security and was recorded at fair value. The Company estimated fair value of its beneficial interest in the Master Trust, both upon initial securitization and thereafter, based on the present value of future expected cash flows using management's best estimates of key assumptions including credit losses and payment rates. See Note 9 of the Notes to Consolidated Financial Statements for further discussion.
Inventories -The Company's inventory is comprised of finished merchandise and is stated at the lower of weighted average cost or market value. Cost is calculated based upon the actual landed cost of an item at the time it is received in the Company's warehouse using actual vendor invoices, the cost of warehousing and transporting merchandise to the stores and other direct costs associated with purchasing merchandise.
The Company recognizes known inventory losses, shortages and damages when incurred and maintains a reserve for estimated shrinkage since the last physical count, when actual shrinkage was recorded. The reserves for estimated shrinkage at the end of fiscal years 2009 and 2008 were $6,582,000 and $3,756,000, respectively. The Company's reserve for shrinkage as of fiscal 2009 year end increased from 2008 as a result of a shift in the timing of physical inventory counts.
45
Table of Contents
NOTES TO CONSOLIDATED FINANCIAL STATEMENTS (Continued)
NOTE 1-DESCRIPTION OF BUSINESS AND SUMMARY OF SIGNIFICANT ACCOUNTING POLICIES (Continued)
In the fourth quarter of fiscal 2007, the Company made a strategic decision to liquidate certain inventory, and completed its liquidation efforts by the end of the first quarter of fiscal 2008. In connection with this decision, a $32,500,000 inventory write-down was recorded in fiscal 2007 to state the excess inventory at the lower of average cost or market. The write-down of inventory consisted primarily of previous merchandise assortments the Company discontinued offering in its stores. This decision was made by the Company in order to clear room in its stores to allow for new inventory to be displayed as it arrived throughout fiscal 2008.
Properties, maintenance and repairs -Buildings, equipment, furniture and fixtures, and leasehold improvements are carried at cost less accumulated depreciation. Depreciation is computed using the straight-line method over estimated remaining useful lives of the assets, generally thirty years for buildings and three to ten years for equipment, furniture and fixtures. Depreciation of improvements to leased properties is based upon the shorter of the remaining primary lease term or the estimated useful lives of such assets. Depreciation related to the Company's distribution centers is included in cost of sales. All other depreciation costs are included in depreciation and amortization. Depreciation costs were $30,556,000, $39,478,000 and $49,984,000 in fiscal 2009, 2008 and 2007, respectively.
Expenditures for maintenance, repairs and renewals that do not materially prolong the original useful lives of the assets are charged to expense as incurred. In the case of disposals, assets and the related depreciation are removed from the accounts and the net amount, less proceeds from disposal, is credited or charged to income.
Long-lived assets are reviewed for impairment at least annually and whenever an event or change in circumstances indicates that its carrying value may not be recoverable. If the carrying value exceeds the sum of the expected undiscounted cash flows, the assets are considered impaired. For store level long-lived assets, expected cash flows are estimated based on management's estimate of future sales, merchandise margin rates, and expenses over the remaining expected terms of the leases. Impairment is measured as the amount by which the carrying value of the asset exceeds the fair value of the asset. Fair value is determined by discounting expected cash flows. Impairment, if any, is recorded in the period in which the impairment occurred. Impairment charges were $9,420,000, or $0.11 per share, $4,838,000 or $0.05 per share, and $31,947,000, or $0.37 per share, in fiscal 2009, 2008 and 2007, respectively, and were included in selling, general and administrative expenses. As the projection of future cash flows requires the use of judgment and estimates, if actual results differ from the Company's estimates, additional charges for asset impairments may be recorded in the future. If management had lowered its assumptions of comparable store sales results by 3% for each of the next five years, additional impairment charges of approximately $2,300,000 would have been recorded in fiscal 2009.
Goodwill and intangible assets -The Company applies the provisions of SFAS No. 142, "Goodwill and Intangible Assets" ("SFAS No. 142"). Under SFAS No. 142, goodwill and intangible assets with indefinite useful lives are not amortized, but instead are tested for impairment at least annually. In accordance with SFAS No. 142, the Company's reporting units were identified as components, and the goodwill assigned to each represents the excess of the original purchase price over the fair value of the net identifiable assets acquired for that component. The Company completed the annual impairment test as of March 3, 2007. Fair value was determined through analyses of discounted future cash flows for the applicable reporting units. The analysis resulted in a write-down of goodwill in fiscal 2007,
46
Table of Contents
NOTES TO CONSOLIDATED FINANCIAL STATEMENTS (Continued)
NOTE 1-DESCRIPTION OF BUSINESS AND SUMMARY OF SIGNIFICANT ACCOUNTING POLICIES (Continued)
included in selling, general and administrative expenses, of approximately $4,422,000, primarily related to Pier 1 Kids. The Company had no goodwill remaining as of the end of fiscal 2007.
Revenue recognition -Revenue is recognized upon customer receipt or delivery for retail sales, including sales under deferred payment promotions on the Company's proprietary credit card in fiscal 2007 and prior years. A reserve has been established for estimated merchandise returns based upon historical experience and other known factors. The reserves for estimated merchandise returns at the end of fiscal years 2009 and 2008 were $1,374,000 and $1,559,000, respectively. The Company's revenues are reported net of discounts and returns, net of sales tax and third-party credit card fees, and include wholesale sales and royalties received from Sears Roebuck de Mexico S.A. de C.V and from franchise stores in fiscal 2008 and 2007. Amounts billed to customers for shipping and handling are included in net sales and the costs incurred by the Company for these items are recorded in cost of sales.
Gift cards -Revenue associated with gift cards is recognized when merchandise is sold and a gift card is redeemed as payment. Gift card breakage is estimated and recorded as income based upon an analysis of the Company's historical data and expected trends in redemption patterns and represents the remaining unused portion of the gift card liability for which the likelihood of redemption is remote. If actual redemption patterns vary from the Company's estimates, actual gift card breakage may differ from the amounts recorded. For all periods presented, gift card breakage was recognized at 30 months from the original issuance and was $4,107,000, $1,699,000 and $6,222,000 in fiscal 2009, 2008 and 2007, respectively.
Leases -The Company leases certain property consisting principally of retail stores, warehouses, its home office and material handling and office equipment under leases expiring through fiscal 2022. Most retail store locations are leased for primary terms of ten years with varying renewal options and rent escalation clauses. Escalations occurring during the primary terms of the leases are included in the calculation of the minimum lease payments, and the rent expense related to these leases is recognized on a straight-line basis over this lease term, including free rent periods prior to the opening of its stores. The portion of rent expense applicable to a store before opening is included in selling, general and administrative expenses. Once opened for business, rent expense is included in cost of sales. Certain leases provide for additional rental payments based on a percentage of sales in excess of a specified base. This additional rent is accrued when it appears that the sales will exceed the specified base. Construction allowances received from landlords are initially recorded as lease liabilities and amortized as a reduction of rental expense over the primary lease term. The Company's lease obligations are operating leases under SFAS No. 13, "Accounting for Leases."
Advertising costs -Advertising production costs are expensed the first time the advertising takes place. Advertising costs were $49,506,000, $55,122,000 and $109,540,000 in fiscal 2009, 2008 and 2007, respectively. Prepaid advertising at the end of fiscal years 2009 and 2008 was $2,707,000 and $2,096,000, respectively.
Defined benefit plans -The Company maintains supplemental retirement plans (the "Plans") for certain of its current and former executive officers. The Plans provide that upon death, disability, reaching retirement age or certain termination events, a participant will receive benefits based on highest compensation, years of service and years of plan participation. These benefit costs are dependent upon numerous factors, assumptions and estimates. Benefit costs may be significantly
47
Table of Contents
NOTES TO CONSOLIDATED FINANCIAL STATEMENTS (Continued)
NOTE 1-DESCRIPTION OF BUSINESS AND SUMMARY OF SIGNIFICANT ACCOUNTING POLICIES (Continued)
affected by changes in key actuarial assumptions such as the discount rate, compensation increase rates, or retirement dates used to determine the projected benefit obligation. Additionally, changes made to the provisions of the Plans may impact current and future benefit costs. In accordance with accounting rules, changes in benefit obligations associated with these factors may not be immediately recognized as costs in the statement of operations, but recognized in future years over the remaining average service period of plan participants. See Note 7 of the Notes to Consolidated Financial Statements for further discussion.
Income taxes -The Company accounts for income taxes using the asset and liability method. Under this method, deferred tax assets and liabilities are determined based on differences between financial reporting and income tax bases of assets and liabilities and are measured using the enacted tax rates and laws that will be in effect when the differences are expected to reverse. Deferred tax assets and liabilities are recorded in the Company's consolidated balance sheet and are classified as current or noncurrent based on the classification of the related assets or liabilities for financial reporting purposes. A valuation allowance is recorded to reduce the carrying amounts of deferred tax assets unless it is more likely than not those assets will be realized. In assessing the need for a valuation allowance, all available evidence is considered including past operating results, estimates of future income, and tax planning strategies. At any point in time, multiple tax years are subject to audit by various jurisdictions and the Company records reserves for estimates of tax exposures for foreign and domestic tax audits. However, negotiations with taxing authorities may yield results different from those currently estimated. See Note 10 of the Notes to Consolidated Financial Statements for further discussion.
Loss per share -Basic loss per share amounts were determined by dividing loss from continuing operations, loss from discontinued operations and net loss by the weighted average number of common shares outstanding for the period. Diluted loss per share amounts were similarly computed, but would have included the effect, if dilutive, of the Company's weighted average number of stock options outstanding and shares of unvested restricted stock.
48
Table of Contents
NOTES TO CONSOLIDATED FINANCIAL STATEMENTS (Continued)
NOTE 1-DESCRIPTION OF BUSINESS AND SUMMARY OF SIGNIFICANT ACCOUNTING POLICIES (Continued)
Loss per share amounts were calculated as follows (in thousands except per share amounts):
| | 2009 | 2008 | 2007 | |||||||
|---|---|---|---|---|---|---|---|---|---|---|
Loss from continuing operations, basic and diluted | $ | (129,253 | ) | $ | (96,011 | ) | $ | (227,238 | ) | |
Loss from discontinued operations, basic and diluted | - | - | (407 | ) | ||||||
Net loss, basic and diluted | $ | (129,253 | ) | $ | (96,011 | ) | $ | (227,645 | ) | |
Average shares outstanding: | ||||||||||
Basic and diluted | 88,912 | 88,083 | 87,395 | |||||||
Loss per share from continuing operations: | ||||||||||
Basic and diluted | $ | (1.45 | ) | $ | (1.09 | ) | $ | (2.59 | ) | |
Loss per share from discontinued operations: | ||||||||||
Basic and diluted | - | - | $ | (.01 | ) | |||||
Net loss per share: | ||||||||||
Basic and diluted | $ | (1.45 | ) | $ | (1.09 | ) | $ | (2.60 | ) | |
All 12,302,323, 13,102,360 and 13,991,195 outstanding stock options and shares of unvested restricted stock were excluded from the computation of the fiscal 2009, 2008 and 2007, respectively, loss per share as the effect would be antidilutive. In addition, incremental net shares for the conversion feature of the Company's 6.375% senior convertible notes due 2036 have not been included in the Company's diluted earnings per share calculations for those periods as the average common stock price has not exceeded the initial conversion price of $15.19 per share.
Stock-based compensation -The Company grants stock options and restricted stock for a fixed number of shares to employees with stock option exercise prices equal to the fair market value of the shares on the date of the grant. The Company accounts for stock-based compensation under the provisions of SFAS No. 123 (Revised 2004), "Share-Based Payment" ("SFAS 123R"). SFAS 123R requires all companies to measure and recognize compensation expense at an amount equal to the fair value of share-based payments granted under compensation arrangements.
The Company adopted SFAS 123R at the beginning of fiscal 2007 using the modified prospective method. Under the modified prospective method, the Company records stock-based compensation expense for all awards granted on or after the date of adoption and for the portion of previously granted awards that remained unvested at the date of adoption. Currently, the Company's stock-based compensation relates to stock options, restricted stock awards and director deferred stock units. Compensation expense is recognized for any unvested stock option awards outstanding as of the date of adoption on a straight-line basis over the remaining vesting period. The fair values of the options are calculated using a Black-Scholes option pricing model. The Company records compensation expense for stock-based awards with a performance condition when it is probable that the condition will be achieved. The compensation expense ultimately recognized, if any, related to these awards will equal the grant date fair value for the number of shares for which the performance condition has been satisfied.
49
Table of Contents
NOTES TO CONSOLIDATED FINANCIAL STATEMENTS (Continued)
NOTE 1-DESCRIPTION OF BUSINESS AND SUMMARY OF SIGNIFICANT ACCOUNTING POLICIES (Continued)
SFAS 123R requires that forfeitures be estimated at the time of grant. The Company estimates forfeitures based on its historical forfeiture experience. In accordance with SFAS 123R, the Company adjusts forfeiture estimates based on actual forfeiture experience for all awards with service conditions. The effect of forfeiture adjustments for the year was insignificant.
Liquidity -From fiscal 2006 through fiscal 2009, the Company has incurred net losses and had negative cash flows from operating activities. The Company's turnaround plan includes making conservative inventory purchases, managing those inventories, continuing to make the Company's merchandise offering more compelling, and improving the in-store experience. In addition, the Company will continue to focus on its ongoing mission to maximize its revenues, while seeking out ways to reduce its cost base, considering refinancing alternatives of its convertible senior notes, and preserving its liquidity. The end of the difficult economic situation faced by the United States is not known at this time and consumer confidence and spending could remain depressed and possibly deteriorate even further. The Company may incur negative operating cash flows in future periods, and a long-term decline in consumer spending could have a material adverse effect on the Company's financial condition and ability to generate cash flows from operations. There can be no assurance that the Company will achieve or sustain positive cash flows or profitability over the long-term. During fiscal 2010, the Company may become dependent on availability of adequate capital including utilization under its secured credit facility to fund operations and carry out its turnaround strategy. The Company believes that its existing cash balances and borrowings under its secured credit facility will provide sufficient liquidity to fund operational obligations and capital expenditure requirements through fiscal year 2010. However, if fiscal 2010 cash flow needs are in excess of availability under the secured credit facility and the Company is unable to obtain additional financing sources, the impact thereof will have a material adverse effect on the Company's business, financial condition and results of operations.
Adoption of new accounting standards -In May 2008, the Financial Accounting Standards Board ("FASB") issued FASB Staff Position ("FSP") APB 14-1, "Accounting for Convertible Debt Instruments That May Be Settled in Cash upon Conversion (Including Partial Cash Settlement)", which clarifies that convertible debt instruments that may be settled in cash upon conversion (including partial cash settlement) are not addressed by paragraph 12 of APB Opinion No. 14, "Accounting for Convertible Debt and Debt Issued with Stock Purchase Warrants." Additionally, this FSP specifies that issuers of such instruments should separately account for the liability and equity components in a manner that will reflect the entity's nonconvertible debt borrowing rate when interest cost is recognized in subsequent periods. This FSP will be applied retrospectively to all periods presented. FSP APB 14-1 is effective for the Company at the beginning of fiscal year 2010. The Company is currently evaluating the impact of the adoption on its financial statements.
50
Table of Contents
NOTES TO CONSOLIDATED FINANCIAL STATEMENTS (Continued)
NOTE 2-PROPERTIES
Other properties are summarized as follows at February 28, 2009 and March 1, 2008 (in thousands):
| | 2009 | 2008 | ||||||
|---|---|---|---|---|---|---|---|---|
Land | $ | 6,379 | $ | 6,379 | ||||
Buildings | 29,546 | 29,621 | ||||||
Equipment, furniture and fixtures | 243,403 | 246,803 | ||||||
Leasehold improvements | 162,832 | 167,542 | ||||||
Computer software | 74,588 | 73,175 | ||||||
Projects in progress | 798 | 41 | ||||||
| 517,546 | 523,561 | ||||||
Less accumulated depreciation and amortization | 432,411 | 408,609 | ||||||
Other properties, net | $ | 85,135 | $ | 114,952 | ||||
In addition to the above properties, the Company had an office building and related assets with net book value of $80,539,000 as of March 1, 2008 which it utilized as its corporate headquarters. On June 9, 2008, the Company sold its corporate headquarters building and accompanying land to Chesapeake Plaza, L.L.C., an affiliate of Chesapeake Energy Corporation, for net proceeds of approximately $102,400,000. The Company also entered into a lease agreement to rent office space in the building. The lease has a primary term of seven years which began on June 9, 2008, with one three-year renewal option and provisions for terminating the lease at the end of the fifth lease year. The related gain on the sale of the property was approximately $23,300,000, the majority of which is included in other noncurrent liabilities, and will be recognized over the expected lease term. In connection with this transaction, the corporate headquarters building was removed from the assets securing borrowings under the Company's secured credit facility.
NOTE 3-OTHER ACCRUED LIABILITIES AND NONCURRENT LIABILITIES
The following is a summary of other accrued liabilities and noncurrent liabilities at February 28, 2009 and March 1, 2008 (in thousands):
| | 2009 | 2008 | ||||||
|---|---|---|---|---|---|---|---|---|
Accrued payroll and other employee-related liabilities | $ | 38,185 | $ | 46,416 | ||||
Accrued taxes, other than income | 23,617 | 24,030 | ||||||
Rent-related liabilities | 10,423 | 11,017 | ||||||
Retirement benefits | 3,292 | 1,351 | ||||||
Other | 25,833 | 19,003 | ||||||
Other accrued liabilities | $ | 101,350 | $ | 101,817 | ||||
Rent-related liabilities | $ | 30,047 | $ | 34,887 | ||||
Deferred gains | 31,673 | 19,634 | ||||||
Retirement benefits | 21,074 | 24,276 | ||||||
Other | 10,596 | 15,361 | ||||||
Other noncurrent liabilities | $ | 93,390 | $ | 94,158 | ||||
51
Table of Contents
NOTES TO CONSOLIDATED FINANCIAL STATEMENTS (Continued)
NOTE 4-COSTS ASSOCIATED WITH EXIT ACTIVITIES
As part of the ordinary course of business, the Company terminates leases prior to their expiration when certain stores or distribution center facilities are closed or relocated as deemed necessary by the evaluation of its real estate portfolio. These decisions are based on store profitability, lease renewal obligations, relocation space availability, local market conditions and prospects for future profitability. In connection with these lease terminations, the Company has recorded estimated liabilities in accordance with SFAS No. 146, "Accounting for Costs Associated with Exit or Disposal Activities." At the time of closure, neither the write-off of fixed assets nor the write-down of inventory related to such stores was material. Additionally, employee severance costs associated with these closures were not significant. The estimated liabilities were recorded based upon the Company's remaining lease obligations less estimated subtenant rental income. Revisions during the periods presented relate to changes in estimated buyout terms or subtenant receipts expected on closed facilities. Expenses related to lease termination obligations are included in selling, general and administrative expenses in the Company's consolidated statements of operations. The write-off of fixed assets and associated intangible assets related to Pier 1 Imports store closures, excluding clearance and Pier 1 Kids stores, was approximately $56,000, $751,000 and $370,000 in fiscal 2009, 2008 and 2007, respectively. The following table represents a rollforward of the liability balances for the three fiscal years ended February 28, 2009 (in thousands):
| | Lease Termination Obligations | ||||
|---|---|---|---|---|---|
Balance at February 25, 2006 | $ | 2,859 | |||
Original charges | 4,245 | ||||
Revisions | (242 | ) | |||
Cash payments | (4,426 | ) | |||
Balance at March 3, 2007 | 2,436 | ||||
Original charges | 11,573 | ||||
Revisions | (1,133 | ) | |||
Cash payments | (7,248 | ) | |||
Balance at March 1, 2008 | 5,628 | ||||
Original charges | 5,591 | ||||
Revisions | 483 | ||||
Cash payments | (6,704 | ) | |||
Balance at February 28, 2009 | $ | 4,998 | |||
Included in the table above are lease termination costs related to the closure of all of the Company's clearance and Pier 1 Kids stores and the direct to consumer channel. These concepts were closed during fiscal 2008 since their aggregate performance was not in line with the Company's profitability targets. Lease termination costs associated with these closures were $258,000, or less than $0.01 per share, during fiscal 2009 and $7,973,000, or $0.09 per share, during fiscal 2008. Cash outflows related to these lease terminations were $2,889,000 and $5,138,000 during fiscal 2009 and 2008, respectively. The net write-off of fixed assets, write-down of inventory and employee severance costs associated with these closures was not material.
An outside firm has been hired to assist the Company in negotiating with landlords to achieve reductions in rental rates across its store portfolio. In certain cases, if appropriate rental reductions
52
Table of Contents
NOTES TO CONSOLIDATED FINANCIAL STATEMENTS (Continued)
NOTE 4-COSTS ASSOCIATED WITH EXIT ACTIVITIES (Continued)
cannot be reached, the Company may elect to close those locations. Currently, the Company expects to close no more than 80 locations in connection with these negotiation efforts. Actual expenses related to these closures cannot be estimated as they will largely depend upon the results of on going negotiations.
NOTE 5-LONG-TERM DEBT AND AVAILABLE CREDIT
Long-term debt is summarized as follows at February 28, 2009 and March 1, 2008 (in thousands):
| | 2009 | 2008 | ||||||
|---|---|---|---|---|---|---|---|---|
Industrial revenue bonds | $ | 19,000 | $ | 19,000 | ||||
6.375% convertible senior notes due 2036 | 165,000 | 165,000 | ||||||
| 184,000 | 184,000 | ||||||
Less-portion due within one year | - | - | ||||||
Long-term debt | $ | 184,000 | $ | 184,000 | ||||
The Company has $19,000,000 in industrial revenue bond loan agreements, which have been outstanding since 1987. Proceeds were used to construct warehouse/distribution facilities. The loan agreements and related tax-exempt bonds mature in the year 2026. The Company's interest rates on the loans are based on the bond interest rates, which are market driven, reset weekly and are similar to other tax-exempt municipal debt issues. The Company's weighted average effective interest rate, including standby letter of credit fees, was 3.5% for fiscal 2009 and 5.2% for both fiscal 2008 and 2007.
In February 2006, the Company issued $165,000,000 of 6.375% convertible senior notes due 2036 (the "Notes") in a private placement, and subsequently registered the Notes with the Securities and Exchange Commission in June 2006. The Notes are governed by an Indenture dated February 14, 2006 (the "Indenture"). The Notes bear interest at a rate of 6.375% per year until February 15, 2011 and at a rate of 6.125% per year thereafter. Interest is payable semiannually in arrears on February 15 and August 15 of each year, and commenced August 15, 2006. The Notes are convertible into cash and, if applicable, shares of the Company's common stock based on an initial conversion rate, subject to adjustments, of 65.8328 shares per $1,000 principal amount of Notes (which represents an initial conversion price of approximately $15.19 per share representing a 40% conversion premium at issuance). Holders of the Notes may convert their Notes only under the following circumstances: (1) during any fiscal quarter (and only during such fiscal quarter) commencing after May 27, 2006, if the last reported sale price of the Company's common stock for at least 20 trading days during the period of 30 consecutive trading days ending on the last trading day of the preceding fiscal quarter is greater than or equal to 130% of the applicable conversion price on such last trading day; (2) if the Company has called the Notes for redemption; or (3) upon the occurrence of specified corporate transactions. In general, upon conversion of a Note, a holder will receive cash equal to the lesser of the principal amount of the Note or the conversion value of the Note, plus common stock of the Company for any conversion value in excess of the principal amount. As of February 28, 2009, the maximum number of shares that could be required to be issued to net share settle the conversion of the Notes was 10,862,412 shares. The Company may redeem the Notes at its option on or after February 15, 2011 for cash at 100% of the principal amount. The Notes are fully and unconditionally guaranteed, on a joint and several basis, by all of the Company's material domestic consolidated subsidiaries.
53
Table of Contents
NOTES TO CONSOLIDATED FINANCIAL STATEMENTS (Continued)
NOTE 5-LONG-TERM DEBT AND AVAILABLE CREDIT (Continued)
The holders of the Notes can, at their option, require the Company to purchase all or a portion of their Notes at a repurchase price in cash equal to 100% of the principal amount of the repurchased Notes at February 15, 2011, February 15, 2016, February 15, 2021, February 15, 2026 and February 15, 2031, or if a fundamental change occurs. "Fundamental change" is defined in the Indenture and will be deemed to have occurred upon (1) certain changes in beneficial ownership of the Company's common equity as described in the Indenture, (2) certain share exchanges, consolidations, mergers, or assets transactions as described in the Indenture, (3) "Continuing Directors" as defined in the Indenture ceasing to constitute at least a majority of the Company's board of directors, (4) the Company's stockholders approving any plan or proposal for the Company's liquidation or dissolution, or (5) the Company's common stock ceasing to be listed on a national securities exchange or quoted on the Nasdaq National Market or another established automated over-the-counter trading market in the United States. The Company believes that it will continue to be able to satisfy the above requirement for the listing or quotation of its common stock. If the Company is, however, unable to comply with this provision of the Notes, the holders of the Notes could, at their option, require the Company to repurchase all or a portion of their Notes. Such an event could have a material adverse effect on the Company if the Company does not have sufficient cash, is unable to raise sufficient additional capital for such repurchases, or is otherwise unable to refinance the Notes.
In connection with the issuance of the Notes, the Company purchased a call option with respect to its common stock. If the call option, which expires February 15, 2011, is exercised by the Company, it must be net share settled, and, in all cases, the Company would receive shares. This transaction has no effect on the terms of the Notes, but is intended to reduce the potential dilution upon future conversion of the Notes by effectively increasing the initial conversion price to $17.09 per share, representing a 57.5% conversion premium at issuance. The call option is exercisable under the same circumstances which can trigger conversion under the Notes so long as the Company remains listed on the New York Stock Exchange, The American Stock Exchange, or the Nasdaq National Market or their respective successors. The cost of $9,145,000 of the purchased call option is included in shareholders' equity.
EITF Issue No. 00-19, "Accounting for Derivative Financial Instruments Indexed to, and Potentially Settled in, a Company's Own Stock" ("EITF 00-19"), provides guidance for distinguishing between when a financial instrument should be accounted for permanently in equity, temporarily in equity or as an asset or liability. The conversion feature of the Notes and the call option each meet the requirements of EITF 00-19 to be accounted for as equity instruments. Therefore, the conversion feature has not been accounted for as a derivative, which would require a mark-to-market adjustment each period. In the event the debt is exchanged, the transaction will be accounted for with the cash payment of principal reducing the recorded liability and the issuance of common shares recorded in shareholders' equity. In addition, the premium paid for the call option has been recorded as additional paid-in capital in the accompanying consolidated balance sheet and is not accounted for as a derivative. Incremental net shares for the Note conversion feature will be included in the Company's future diluted earnings per share calculations for those periods in which the Company's average common stock price exceeds $15.19 per share.
As discussed in Note 13 of the Notes to Consolidated Financial Statements , on March 20, 2009 a foreign subsidiary of the Company purchased $78,941,000 of the Company's outstanding Notes at a purchase price of $27,399,000, including accrued interest. The foreign subsidiary intends to hold the Notes until maturity. As a result of this transaction, the Company has reduced its outstanding convertible debt to $86,059,000 on a consolidated basis. The Company expects to recognize a gain of
54
Table of Contents
NOTES TO CONSOLIDATED FINANCIAL STATEMENTS (Continued)
NOTE 5-LONG-TERM DEBT AND AVAILABLE CREDIT (Continued)
approximately $49,000,000 in connection with this transaction during the first quarter of fiscal 2010. As a result of the put features of the Notes, the Company anticipates that the remaining $86,059,000 in Notes will have to be repaid or refinanced on or before February 15, 2011. The Notes are included in fiscal 2011 long-term debt maturities in the table below at the entire $165,000,000 that was outstanding at the end of fiscal 2009. Long-term debt matures as follows (in thousands):
Fiscal Year | Long-term Debt | ||||
|---|---|---|---|---|---|
2010 | - | ||||
2011 | 165,000 | ||||
2012 | - | ||||
2013 | - | ||||
2014 | - | ||||
Thereafter | 19,000 | ||||
Total long-term debt | $ | 184,000 | |||
The Company has a $325,000,000 secured credit facility which matures in May 2012 and is secured by the Company's eligible merchandise inventory and third-party credit card receivables. The Company sold its corporate headquarters building during fiscal 2009, and as a result, the building was removed from the assets securing borrowings under the Company's secured credit facility at that time. During fiscal 2009 and 2008, the Company had no cash borrowings under this facility. As of February 28, 2009, the Company's borrowing base, as defined by the agreement, was $201,669,000. This borrowing base calculation is subject to advance rates and commercially reasonable availability reserves. After excluding the required minimum $32,500,000 and the $84,256,000 in utilized letters of credit and bankers' acceptances from the borrowing base, $84,913,000 remained available for cash borrowings. The facility bears interest at LIBOR plus 1.0% for cash borrowings. The Company pays a fee ranging from 1.0% to 1.5% for standby letters of credit depending on the average daily availability as defined by the agreement, 0.5% for trade letters of credit and a commitment fee of 0.25% for any unused amounts. As of February 28, 2009, the fee for standby letters of credit was 1.0%. As of February 28, 2009, the Company utilized approximately $84,256,000 in letters of credit and bankers' acceptances against the secured credit facility. Of the outstanding balance, approximately $16,228,000 related to trade letters of credit and bankers acceptances for merchandise purchases, $43,669,000 related to standby letters of credit for the Company's workers' compensation and general liability insurance policies, $19,429,000 related to standby letters of credit related to the Company's industrial revenue bonds, and $4,930,000 related to other miscellaneous standby letters of credit. Should the availability under the facility be less than $32,500,000, the Company would be required to comply with a fixed charge coverage ratio as stated in the agreement. Assuming availability was below that level, the fixed charge coverage ratio would not have been met during fiscal 2009. The Company does not anticipate falling below this minimum availability in the foreseeable future. The Company was in compliance with all required debt covenants at fiscal 2009 year end. This facility may limit certain investments and, in some instances, limit payment of cash dividends and repurchases of the Company's common stock. Under this credit facility, the Company will not be restricted from paying certain dividends unless the availability under the facility over a specified period of time is projected to be less than $97,500,000.
55
Table of Contents
NOTES TO CONSOLIDATED FINANCIAL STATEMENTS (Continued)
NOTE 6-CONDENSED FINANCIAL STATEMENTS
The Company's 6.375% convertible senior notes due 2036 are fully and unconditionally guaranteed, on a joint and several basis, by all of the Company's material domestic consolidated subsidiaries (the "Guarantor Subsidiaries"). The subsidiaries that do not guarantee such notes are comprised of the Company's foreign subsidiaries and certain other insignificant domestic consolidated subsidiaries (the "Non-Guarantor Subsidiaries"). Each of the Guarantor Subsidiaries is wholly owned. The Company registered these Notes with the Securities and Exchange Commission in June 2006; therefore, in lieu of providing separate audited financial statements for the Guarantor Subsidiaries, condensed consolidating financial information is presented below.
CONSOLIDATING CONDENSED STATEMENT OF OPERATIONS
Year Ended February 28, 2009
(in thousands)
| | Pier 1 Imports, Inc. | Guarantor Subsidiaries | Non- Guarantor Subsidiaries | Eliminations | Total | ||||||||||||
|---|---|---|---|---|---|---|---|---|---|---|---|---|---|---|---|---|---|
Net sales | $ | - | $ | 1,312,426 | $ | 14,674 | $ | (6,423 | ) | $ | 1,320,677 | ||||||
Cost of sales (including buying and store occupancy costs) | - | 950,710 | 13,244 | (6,741 | ) | 957,213 | |||||||||||
Selling, general and administrative (including depreciation and amortization) | 3,788 | 479,724 | 515 | - | 484,027 | ||||||||||||
Operating income (loss) | (3,788 | ) | (118,008 | ) | 915 | 318 | (120,563 | ) | |||||||||
Nonoperating (income) expenses | (2,398 | ) | 10,881 | (417 | ) | - | 8,066 | ||||||||||
Income (loss) from continuing operations before income taxes | (1,390 | ) | (128,889 | ) | 1,332 | 318 | (128,629 | ) | |||||||||
Provision (benefit) for income taxes | - | 637 | (13 | ) | - | 624 | |||||||||||
Net income (loss) from continuing operations | (1,390 | ) | (129,526 | ) | 1,345 | 318 | (129,253 | ) | |||||||||
Net income (loss) from subsidiaries | (128,181 | ) | 1,345 | - | 126,836 | - | |||||||||||
Net income (loss) | $ | (129,571 | ) | $ | (128,181 | ) | $ | 1,345 | $ | 127,154 | $ | (129,253 | ) | ||||
56
Table of Contents
NOTES TO CONSOLIDATED FINANCIAL STATEMENTS (Continued)
NOTE 6-CONDENSED FINANCIAL STATEMENTS (Continued)
CONSOLIDATING CONDENSED STATEMENT OF OPERATIONS
Year Ended March 1, 2008
(in thousands)
| | Pier 1 Imports, Inc. | Guarantor Subsidiaries | Non- Guarantor Subsidiaries | Eliminations | Total | ||||||||||||
|---|---|---|---|---|---|---|---|---|---|---|---|---|---|---|---|---|---|
Net sales | $ | - | $ | 1,505,011 | $ | 38,155 | $ | (31,334 | ) | $ | 1,511,832 | ||||||
Cost of sales (including buying and store occupancy costs) | - | 1,068,371 | 35,466 | (31,557 | ) | 1,072,280 | |||||||||||
Selling, general and administrative (including depreciation and amortization) | 1,829 | 525,279 | 582 | - | 527,690 | ||||||||||||
Operating income (loss) | (1,829 | ) | (88,639 | ) | 2,107 | 223 | (88,138 | ) | |||||||||
Nonoperating (income) expenses | (2,106 | ) | 7,999 | (614 | ) | - | 5,279 | ||||||||||
Income (loss) from continuing operations before income taxes | 277 | (96,638 | ) | 2,721 | 223 | (93,417 | ) | ||||||||||
Provision for income taxes | - | 2,380 | 214 | - | 2,594 | ||||||||||||
Net income (loss) from continuing operations | 277 | (99,018 | ) | 2,507 | 223 | (96,011 | ) | ||||||||||
Net income (loss) from subsidiaries | (96,511 | ) | 2,507 | - | 94,004 | - | |||||||||||
Net income (loss) | $ | (96,234 | ) | $ | (96,511 | ) | $ | 2,507 | $ | 94,227 | $ | (96,011 | ) | ||||
57
Table of Contents
NOTES TO CONSOLIDATED FINANCIAL STATEMENTS (Continued)
NOTE 6-CONDENSED FINANCIAL STATEMENTS (Continued)
CONSOLIDATING CONDENSED STATEMENT OF OPERATIONS
Year Ended March 3, 2007
(in thousands)
| | Pier 1 Imports, Inc. | Guarantor Subsidiaries | Non- Guarantor Subsidiaries | Eliminations | Total | |||||||||||||
|---|---|---|---|---|---|---|---|---|---|---|---|---|---|---|---|---|---|---|
Net sales | $ | - | $ | 1,615,951 | $ | 42,780 | $ | (35,515 | ) | $ | 1,623,216 | |||||||
Cost of sales (including buying and store occupancy costs) | - | 1,145,765 | 39,114 | (35,622 | ) | 1,149,257 | ||||||||||||
Selling, general and administrative (including depreciation and amortization) | 1,585 | 697,075 | 1,529 | - | 700,189 | |||||||||||||
Operating income (loss) | (1,585 | ) | (226,889 | ) | 2,137 | 107 | (226,230 | ) | ||||||||||
Nonoperating (income) expenses | (3,660 | ) | 6,251 | (698 | ) | - | 1,893 | |||||||||||
Income (loss) from continuing operations before income taxes | 2,075 | (233,140 | ) | 2,835 | 107 | (228,123 | ) | |||||||||||
Provision (benefit) for income taxes | - | (1,101 | ) | 216 | - | (885 | ) | |||||||||||
Net income (loss) from continuing operations | 2,075 | (232,039 | ) | 2,619 | 107 | (227,238 | ) | |||||||||||
Net income (loss) from subsidiaries | (229,827 | ) | 2,212 | - | 227,615 | - | ||||||||||||
Discontinued operations: | ||||||||||||||||||
Loss from discontinued operations | - | - | (638 | ) | - | (638 | ) | |||||||||||
Benefit for income taxes | - | - | (231 | ) | - | (231 | ) | |||||||||||
Net loss from discontinued operations | - | - | (407 | ) | - | (407 | ) | |||||||||||
Net income (loss) | $ | (227,752 | ) | $ | (229,827 | ) | $ | 2,212 | $ | 227,722 | $ | (227,645 | ) | |||||
58
Table of Contents
NOTES TO CONSOLIDATED FINANCIAL STATEMENTS (Continued)
NOTE 6-CONDENSED FINANCIAL STATEMENTS (Continued)
CONSOLIDATING CONDENSED BALANCE SHEET
February 28, 2009
(in thousands)
| | Pier 1 Imports, Inc. | Guarantor Subsidiaries | Non- Guarantor Subsidiaries | Eliminations | Total | |||||||||||||
|---|---|---|---|---|---|---|---|---|---|---|---|---|---|---|---|---|---|---|
ASSETS | ||||||||||||||||||
Current assets: | ||||||||||||||||||
Cash and cash equivalents | $ | 61,648 | $ | 62,399 | $ | 31,751 | $ | - | $ | 155,798 | ||||||||
Other accounts receivable, net | 2 | 15,684 | 1,880 | - | 17,566 | |||||||||||||
Inventories | - | 316,245 | 86 | - | 316,331 | |||||||||||||
Income tax receivable | - | 1,667 | 482 | - | 2,149 | |||||||||||||
Prepaid expenses and other current assets | 100 | 41,783 | - | - | 41,883 | |||||||||||||
Total current assets | 61,750 | 437,778 | 34,199 | - | 533,727 | |||||||||||||
Other properties, net | - | 81,398 | 3,737 | - | 85,135 | |||||||||||||
Investment in subsidiaries | 16,125 | 45,262 | - | (61,387 | ) | - | ||||||||||||
Other noncurrent assets | 5,525 | 31,075 | - | - | 36,600 | |||||||||||||
| $ | 83,400 | $ | 595,513 | $ | 37,936 | $ | (61,387 | ) | $ | 655,462 | |||||||
LIABILITIES AND SHAREHOLDERS' EQUITY | ||||||||||||||||||
Current liabilities: | ||||||||||||||||||
Accounts payable | $ | 116 | $ | 80,288 | $ | 291 | $ | - | $ | 80,695 | ||||||||
Intercompany payable (receivable) | (226,635 | ) | 234,163 | (7,528 | ) | - | - | |||||||||||
Gift cards and other deferred revenue | - | 47,332 | - | - | 47,332 | |||||||||||||
Accrued income taxes payable (receivable) | 48 | 4,553 | (167 | ) | - | 4,434 | ||||||||||||
Other accrued liabilities | 610 | 100,662 | 78 | - | 101,350 | |||||||||||||
Total current liabilities | (225,861 | ) | 466,998 | (7,326 | ) | - | 233,811 | |||||||||||
Long-term debt | 165,000 | 19,000 | - | - | 184,000 | |||||||||||||
Other noncurrent liabilities | - | 93,390 | - | - | 93,390 | |||||||||||||
Shareholders' equity | 144,261 | 16,125 | 45,262 | (61,387 | ) | 144,261 | ||||||||||||
| $ | 83,400 | $ | 595,513 | $ | 37,936 | $ | (61,387 | ) | $ | 655,462 | |||||||
59
Table of Contents
NOTES TO CONSOLIDATED FINANCIAL STATEMENTS (Continued)
NOTE 6-CONDENSED FINANCIAL STATEMENTS (Continued)
CONSOLIDATING CONDENSED BALANCE SHEET
March 1, 2008
(in thousands)
| | Pier 1 Imports, Inc. | Guarantor Subsidiaries | Non- Guarantor Subsidiaries | Eliminations | Total | |||||||||||||
|---|---|---|---|---|---|---|---|---|---|---|---|---|---|---|---|---|---|---|
ASSETS | ||||||||||||||||||
Current assets: | ||||||||||||||||||
Cash and cash equivalents | $ | 53,030 | $ | 26,824 | $ | 13,579 | $ | - | $ | 93,433 | ||||||||
Other accounts receivable, net | 5 | 21,607 | 1,509 | - | 23,121 | |||||||||||||
Inventories | - | 411,709 | - | - | 411,709 | |||||||||||||
Income tax receivable | - | 13,251 | 381 | - | 13,632 | |||||||||||||
Prepaid expenses and other current assets | 78 | 41,367 | - | - | 41,445 | |||||||||||||
Total current assets | 53,113 | 514,758 | 15,469 | - | 583,340 | |||||||||||||
Office building and related assets | - | 80,539 | - | - | 80,539 | |||||||||||||
Other properties, net | - | 111,112 | 3,840 | - | 114,952 | |||||||||||||
Investment in subsidiaries | 145,555 | 43,354 | - | (188,909 | ) | - | ||||||||||||
Other noncurrent assets | 6,588 | 36,485 | - | - | 43,073 | |||||||||||||
| $ | 205,256 | $ | 786,248 | $ | 19,309 | $ | (188,909 | ) | $ | 821,904 | |||||||
LIABILITIES AND SHAREHOLDERS' EQUITY | ||||||||||||||||||
Current liabilities: | ||||||||||||||||||
Accounts payable | $ | 126 | $ | 104,900 | $ | 1,058 | $ | - | $ | 106,084 | ||||||||
Intercompany payable (receivable) | (228,310 | ) | 253,339 | (25,029 | ) | - | - | |||||||||||
Gift cards and other deferred revenue | - | 63,101 | - | - | 63,101 | |||||||||||||
Accrued income taxes payable (receivable) | 48 | 5,065 | (113 | ) | - | 5,000 | ||||||||||||
Other accrued liabilities | 648 | 101,130 | 39 | - | 101,817 | |||||||||||||
Total current liabilities | (227,488 | ) | 527,535 | (24,045 | ) | - | 276,002 | |||||||||||
Long-term debt | 165,000 | 19,000 | - | - | 184,000 | |||||||||||||
Other noncurrent liabilities | - | 94,158 | - | - | 94,158 | |||||||||||||
Shareholders' equity | 267,744 | 145,555 | 43,354 | (188,909 | ) | 267,744 | ||||||||||||
| $ | 205,256 | $ | 786,248 | $ | 19,309 | $ | (188,909 | ) | $ | 821,904 | |||||||
60
Table of Contents
NOTES TO CONSOLIDATED FINANCIAL STATEMENTS (Continued)
NOTE 6-CONDENSED FINANCIAL STATEMENTS (Continued)
CONSOLIDATING CONDENSED STATEMENT OF CASH FLOWS
Year Ended February 28, 2009
(in thousands)
| | Pier 1 Imports, Inc. | Guarantor Subsidiaries | Non- Guarantor Subsidiaries | Eliminations | Total | ||||||||||||
|---|---|---|---|---|---|---|---|---|---|---|---|---|---|---|---|---|---|
Cash flow from operating activities: | |||||||||||||||||
Net cash provided by (used in) operating activities | $ | 4,782 | $ | (55,282 | ) | $ | 18,866 | $ | - | $ | (31,634 | ) | |||||
Cash flow from investing activities: | |||||||||||||||||
Capital expenditures | - | (13,378 | ) | - | - | (13,378 | ) | ||||||||||
Proceeds from disposition of properties | - | 102,478 | - | - | 102,478 | ||||||||||||
Proceeds from the sale of restricted investments | - | 3,258 | - | - | 3,258 | ||||||||||||
Purchase of restricted investments | - | (2,020 | ) | - | - | (2,020 | ) | ||||||||||
Collections of a note receivable | - | 1,500 | - | - | 1,500 | ||||||||||||
Capitalization of subsidiary | - | (250 | ) | 250 | - | - | |||||||||||
Net cash provided by investing activities | - | 91,588 | 250 | - | 91,838 | ||||||||||||
Cash flow from financing activities: | |||||||||||||||||
Proceeds from stock options exercised, stock purchase plan and other, net | 2,161 | - | - | - | 2,161 | ||||||||||||
Advances (to) from subsidiaries | 1,675 | (731 | ) | (944 | ) | - | - | ||||||||||
Net cash provided by (used in) financing activities | 3,836 | (731 | ) | (944 | ) | - | 2,161 | ||||||||||
Change in cash and cash equivalents | 8,618 | 35,575 | 18,172 | - | 62,365 | ||||||||||||
Cash and cash equivalents at beginning of period | 53,030 | 26,824 | 13,579 | - | 93,433 | ||||||||||||
Cash and cash equivalents at end of period | $ | 61,648 | $ | 62,399 | $ | 31,751 | $ | - | $ | 155,798 | |||||||
61
Table of Contents
NOTES TO CONSOLIDATED FINANCIAL STATEMENTS (Continued)
NOTE 6-CONDENSED FINANCIAL STATEMENTS (Continued)
CONSOLIDATING CONDENSED STATEMENT OF CASH FLOWS
Year Ended March 1, 2008
(in thousands)
| | Pier 1 Imports, Inc. | Guarantor Subsidiaries | Non- Guarantor Subsidiaries | Eliminations | Total | ||||||||||||
|---|---|---|---|---|---|---|---|---|---|---|---|---|---|---|---|---|---|
Cash flow from operating activities: | |||||||||||||||||
Net cash provided by (used in) operating activities | $ | 7,230 | $ | (94,318 | ) | $ | 4,014 | $ | - | $ | (83,074 | ) | |||||
Cash flow from investing activities: | |||||||||||||||||
Capital expenditures | - | (7,153 | ) | - | - | (7,153 | ) | ||||||||||
Proceeds from disposition of properties | - | 5,674 | - | - | 5,674 | ||||||||||||
Proceeds from the sale of restricted investments | - | 6,986 | - | - | 6,986 | ||||||||||||
Purchase of restricted investments | - | (589 | ) | - | - | (589 | ) | ||||||||||
Collections of principal on beneficial interest in securitized receivables | - | 1,500 | - | - | 1,500 | ||||||||||||
Net cash provided by investing activities | - | 6,418 | - | - | 6,418 | ||||||||||||
Cash flow from financing activities: | |||||||||||||||||
Proceeds from stock options exercised, stock purchase plan and other, net | 3,909 | - | - | - | 3,909 | ||||||||||||
Debt issuance costs | - | (998 | ) | - | - | (998 | ) | ||||||||||
Advances (to) from subsidiaries | (69,272 | ) | 72,023 | (2,751 | ) | - | - | ||||||||||
Net cash provided by (used in) financing activities | (65,363 | ) | 71,025 | (2,751 | ) | - | 2,911 | ||||||||||
Change in cash and cash equivalents | (58,133 | ) | (16,875 | ) | 1,263 | - | (73,745 | ) | |||||||||
Cash and cash equivalents at beginning of period | 111,163 | 43,699 | 12,316 | - | 167,178 | ||||||||||||
Cash and cash equivalents at end of period | $ | 53,030 | $ | 26,824 | $ | 13,579 | $ | - | $ | 93,433 | |||||||
62
Table of Contents
NOTES TO CONSOLIDATED FINANCIAL STATEMENTS (Continued)
NOTE 6-CONDENSED FINANCIAL STATEMENTS (Continued)
CONSOLIDATING CONDENSED STATEMENT OF CASH FLOWS
Year Ended March 3, 2007
(in thousands)
| | Pier 1 Imports, Inc. | Guarantor Subsidiaries | Non- Guarantor Subsidiaries (1) | Eliminations | Total (1) | ||||||||||||
|---|---|---|---|---|---|---|---|---|---|---|---|---|---|---|---|---|---|
Cash flow from operating activities: | |||||||||||||||||
Net cash provided by (used in) operating activities | $ | 9,354 | $ | (117,163 | ) | $ | 2,922 | $ | (18 | ) | $ | (104,905 | ) | ||||
Cash flow from investing activities: | |||||||||||||||||
Capital expenditures | - | (28,600 | ) | - | - | (28,600 | ) | ||||||||||
Proceeds from disposition of properties | - | 173 | - | - | 173 | ||||||||||||
Net proceeds from sale of discontinued operations | - | 14,998 | (3,397 | ) | - | 11,601 | |||||||||||
Net proceeds from sale of Pier 1 National Bank | - | 12,962 | (2,208 | ) | - | 10,754 | |||||||||||
Proceeds from the sale of restricted investments | - | 25,707 | - | - | 25,707 | ||||||||||||
Purchase of restricted investments | - | (9,712 | ) | - | - | (9,712 | ) | ||||||||||
Collections of principal on beneficial interest in securitized receivables | - | 21,907 | - | - | 21,907 | ||||||||||||
Net cash provided by (used in) investing activities | - | 37,435 | (5,605 | ) | - | 31,830 | |||||||||||
Cash flow from financing activities: | |||||||||||||||||
Cash dividends | (17,398 | ) | (18 | ) | - | 18 | (17,398 | ) | |||||||||
Proceeds from stock options exercised, stock purchase plan and other, net | 4,618 | 101 | - | - | 4,719 | ||||||||||||
Notes payable borrowings | - | 69,000 | - | - | 69,000 | ||||||||||||
Repayments of notes payable | - | (69,000 | ) | - | - | (69,000 | ) | ||||||||||
Debt issuance costs | - | (283 | ) | - | - | (283 | ) | ||||||||||
Advances (to) from subsidiaries | (16,190 | ) | 22,858 | (6,668 | ) | - | - | ||||||||||
Net cash provided by (used in) financing activities | (28,970 | ) | 22,658 | (6,668 | ) | 18 | (12,962 | ) | |||||||||
Change in cash and cash equivalents | (19,616 | ) | (57,070 | ) | (9,351 | ) | - | (86,037 | ) | ||||||||
Cash and cash equivalents at beginning of period | 130,779 | 100,769 | 21,667 | - | 253,215 | ||||||||||||
Cash and cash equivalents at end of period | $ | 111,163 | $ | 43,699 | $ | 12,316 | $ | - | $ | 167,178 | |||||||
63
Table of Contents
NOTES TO CONSOLIDATED FINANCIAL STATEMENTS (Continued)
NOTE 7-EMPLOYEE BENEFIT PLANS
The Company offers a qualified, defined contribution employee retirement plan to all its full- and part-time personnel who are at least 18 years old and have been employed for a minimum of six months. During fiscal 2009, 2008 and 2007, employees contributing 1% to 5% of their compensation received a matching Company contribution of up to 3%. Company contributions to the plan were $2,082,000, $2,305,000 and $2,645,000 in fiscal 2009, 2008 and 2007, respectively.
In addition, the Company offers non-qualified deferred compensation plans for the purpose of providing deferred compensation for certain employees whose benefits under the qualified plan may be limited under Section 401(k) of the Internal Revenue Code. The Company's expense for these non-qualified plans was $690,000, $831,000 and $1,628,000 for fiscal 2009, 2008 and 2007, respectively. The Company has trusts established for the purpose of setting aside funds to be used to settle certain obligations of these non-qualified deferred compensation plans and contributed $2,020,000 and used $3,258,000 to satisfy a portion of retirement obligations during fiscal 2009. As of February 28, 2009 and March 1, 2008, the trusts' assets consisted of interest bearing investments of $247,000 and $1,460,000 and life insurance policies with cash surrender values of $5,409,000 and $7,187,000 and death benefits of $13,486,000 and $17,100,000, respectively. The trust assets are restricted and may only be used to satisfy obligations to plan participants. The Company owns and is the beneficiary of a number of insurance policies on the lives of current and former key executives that are unrestricted as to use. At the discretion of the Board of Directors such policies could be contributed to these trusts or to the trusts established for the purpose of setting aside funds to be used to satisfy obligations arising from supplemental retirement plans described below. The cash surrender value of these unrestricted policies was $16,038,000 at February 28, 2009, and the death benefit was $24,920,000. These cash surrender values are carried in the Company's consolidated financial statements in other noncurrent assets.
The Company maintains supplemental retirement plans (the "Plans") for certain of its executive officers. The Plans provide that upon death, disability, reaching retirement age and certain termination events, a participant will receive benefits based on highest compensation, years of service and years of plan participation. The Company recorded expenses related to the Plans of $3,210,000, $3,511,000 and $15,112,000 in fiscal 2009, 2008 and 2007, respectively.
The Plans are not funded and thus have no plan assets. However, a trust has been established for the purpose of setting aside funds to be used to settle the defined benefit plan obligations upon retirement or death of certain participants. The trust assets are consolidated in the Company's financial statements and consist of interest bearing investments in the amounts of $17,000 and $16,000 included in other noncurrent assets at February 28, 2009 and March 1, 2008, respectively. These investments are restricted and may only be used to satisfy retirement obligations to certain participants. The Company has accounted for these restricted investments as available-for-sale securities. Cash contributions of $0 and $23,000 were made to the trust in fiscal 2009 and 2008, respectively. Any future contributions will be made at the discretion of the Board of Directors. Restricted investments from the trust were sold to fund retirement benefits of $0 and $6,986,000 in fiscal 2009 and 2008, respectively. Funds from the trust will be used to fund or partially fund benefit payments through fiscal year 2019 that are expected to total approximately $21,118,000. Of this amount, the Company expects to pay $1,784,000 during fiscal 2010, $118,000 during fiscal 2011, $118,000 during fiscal 2012, $118,000 during fiscal 2013, $1,792,000 during fiscal 2014 and $17,188,000 during fiscal years 2015 through 2019.
64
Table of Contents
NOTES TO CONSOLIDATED FINANCIAL STATEMENTS (Continued)
NOTE 7-EMPLOYEE BENEFIT PLANS (Continued)
Measurement of obligations for the Plans is calculated as of each fiscal year end. The following provides a reconciliation of benefit obligations and funded status of the Plans as of February 28, 2009 and March 1, 2008 (in thousands):
| | 2009 | 2008 | |||||||
|---|---|---|---|---|---|---|---|---|---|
Change in projected benefit obligation: | |||||||||
Projected benefit obligation, beginning of year | $ | 16,609 | $ | 16,460 | |||||
Service cost | 923 | 498 | |||||||
Interest cost | 923 | 764 | |||||||
Actuarial (gain) loss (1) | (715 | ) | 5,238 | ||||||
Benefits paid (including settlements) | (118 | ) | (6,351 | ) | |||||
Projected benefit obligation, end of year | $ | 17,622 | $ | 16,609 | |||||
Reconciliation of funded status: | |||||||||
Projected benefit obligation | $ | 17,622 | $ | 16,609 | |||||
Plan assets | - | - | |||||||
Funded status | $ | (17,622 | ) | $ | (16,609 | ) | |||
Accumulated benefit obligation | $ | (17,622 | ) | $ | (16,609 | ) | |||
Amounts recognized in the balance sheets: | |||||||||
Current liability | $ | (1,784 | ) | $ | (326 | ) | |||
Noncurrent liability | (15,838 | ) | (16,282 | ) | |||||
Accumulated other comprehensive loss, pre-tax | 4,232 | 6,311 | |||||||
Net amount recognized | $ | (13,390 | ) | $ | (10,297 | ) | |||
Cumulative other comprehensive loss, net of taxes of $3,291 in fiscal 2009 and 2008 | $ | 941 | $ | 3,020 | |||||
Weighted average assumptions used to determine: | |||||||||
Benefit obligation, end of year: | |||||||||
Discount rate | 5.00 | % | 5.00 | % | |||||
Lump-sum conversion discount rate | 5.00 | % | 2.75 | % | |||||
Rate of compensation increase (2) | 0.00 | % | 0.00 | % | |||||
Net periodic benefit cost for years ended: | |||||||||
Discount rate | 5.00 | % | 5.50 | % | |||||
Lump-sum conversion discount rate | 2.75 | % | 2.75 | % | |||||
Rate of compensation increase (2) | 0.00 | % | 0.00 | % | |||||
(2) The rate of compensation increase shown above reflects no increase anticipated for fiscal 2010. An increase of 3.0% was assumed for fiscal years 2011 and thereafter.
65
Table of Contents
NOTES TO CONSOLIDATED FINANCIAL STATEMENTS (Continued)
NOTE 7-EMPLOYEE BENEFIT PLANS (Continued)
Net periodic benefit cost included the following actuarially determined components during fiscal 2009, 2008 and 2007 (in thousands):
| | 2009 | 2008 | 2007 | ||||||||
|---|---|---|---|---|---|---|---|---|---|---|---|
Service cost | $ | 923 | $ | 498 | $ | 2,405 | |||||
Interest cost | 923 | 764 | 1,931 | ||||||||
Amortization of unrecognized prior service cost | 551 | 361 | 804 | ||||||||
Amortization of net actuarial loss | 445 | 125 | 3,203 | ||||||||
Settlement charges | - | 1,399 | 5,257 | ||||||||
Curtailment charge | 368 | 364 | 1,512 | ||||||||
Net periodic benefit cost | $ | 3,210 | $ | 3,511 | $ | 15,112 | |||||
As of February 28, 2009 and March 1, 2008, accumulated other comprehensive loss included amounts that had not been recognized as components of net periodic benefit cost related to prior service cost of $3,398,000 and $4,317,000, and net actuarial loss of $834,000 and $1,993,000, respectively. The estimated prior service cost and net actuarial loss that will be amortized from accumulated other comprehensive loss into net periodic cost in fiscal 2010 are $498,000 and $67,000, respectively.
In September 2006, the Financial Accounting Standards Board ("FASB") issued SFAS No. 158, "Employers Accounting for Defined Benefit Pension and Other Postretirement Pension Plans, an amendment of FASB Statements No. 87, 88, 106, and 132(R)" ("SFAS 158"). SFAS 158 requires companies to recognize the funded status of postretirement benefit plans as an asset or liability in the financial statements. The Company adopted the funded status recognition portion of SFAS 158 as of March 3, 2007, and recorded an additional liability with an offset to other comprehensive income of $1,631,000. In addition, SFAS 158 requires an employer to measure its postretirement benefit plan assets and benefit obligations as of the date of the employer's fiscal year end. This portion of the statement was effective for the Company for fiscal 2009 and did not have a material impact on the Company's consolidated financial statements.
NOTE 8-MATTERS CONCERNING SHAREHOLDERS' EQUITY
On March 23, 2006, the Board of Directors approved the adoption of the Pier 1 Imports, Inc. 2006 Stock Incentive Plan (the "2006 Plan"). The 2006 Plan was approved by the shareholders on June 22, 2006. The aggregate number of shares available for issuance under the 2006 Plan included a new authorization of 1,500,000 shares, plus shares (not to exceed 560,794 shares) that remained available for grant under the Pier 1 Imports, Inc. 1999 Stock Plan (the "1999 Stock Plan") and the Pier 1 Imports, Inc. Management Restricted Stock Plan, increased by the number of shares (not to exceed 11,186,150 shares) subject to outstanding awards on March 23, 2006, under these prior plans that cease to be subject to such awards. As of February 28, 2009, there was a total of 1,505,812 shares available for grant under the 2006 Plan.
Stock option grants -On January 27, 2007, the Board of Directors approved an employment agreement for the Company's President and Chief Executive Officer (the "CEO"). The employment agreement set forth that on February 19, 2007, the CEO would be granted two options to purchase an aggregate of 3,000,000 shares of the Company's common stock. The exercise price per share would be the fair market value of the Company's common stock on the following day, which was $6.69. The
66
Table of Contents
NOTES TO CONSOLIDATED FINANCIAL STATEMENTS (Continued)
NOTE 8-MATTERS CONCERNING SHAREHOLDERS' EQUITY (Continued)
options were granted as an employment inducement award, and not under any stock option or other equity incentive plan adopted by the Company. The first option for 1,000,000 shares vested on February 19, 2008. The second option for 2,000,000 shares could have vested up to 1,000,000 shares based on the Company's performance as measured by an adjusted consolidated EBITDA target as defined in the agreement for the Company's 2009 fiscal year. However, the target was not met and the shares did not vest. The remaining 1,000,000 shares from the second option may vest based on the Company's performance as measured by an adjusted consolidated EBITDA target for the Company's 2010 fiscal year. Subject to the terms of the employment agreement, the CEO must be employed at the end of each fiscal year for the respective options to vest. All options have a term of ten years from the date of grant. The Company did not expense 1,000,000 shares of the second option during fiscal 2009 since the adjusted consolidated EBITDA target was not met. The remaining 1,000,000 shares of the second grant did not have a SFAS 123R grant date at the end of fiscal 2009 and will be expensed in fiscal 2010 if the Company determines it is probable the adjusted consolidated EBITDA target that was set will be met.
During fiscal 2009, the Board of Directors approved stock option grants under the 2006 Plan of 617,300 shares. As of February 28, 2009 and March 1, 2008, outstanding options covering 1,259,250 and 802,625 shares were exercisable under the 2006 Plan, respectively. Options were granted at exercise prices equal to the fair market value of the Company's common stock at the date of grant. Employee options issued under the 2006 Plan vest over a period of four years and have a term of ten years from the grant date. The employee options are fully vested upon death, disability or retirement of the employee. The 2006 Plan's administrative committee also has the discretion to take certain actions with respect to stock options, such as accelerating the vesting, upon certain corporate changes (as defined in the 2006 Plan). Non-employee director options are fully vested on the date of grant, and are exercisable for a period of ten years.
The 1999 Stock Plan provided for the granting of options to directors and employees with an exercise price not less than the fair market value of the common stock on the date of the grant. The 1999 Stock Plan provided that a maximum of 14,500,000 shares of common stock could be issued under the 1999 Stock Plan, of which not more than 250,000 shares could be issued under the Director Deferred Stock Program. The options issued to employees vest equally over a period of four years, while non-employee directors' options were fully vested at the date of issuance. Both options have a term of ten years from the grant date. The employee options are fully vested upon death, disability, or retirement of an employee, or under certain conditions, such as a change in control of the Company, unless the Board of Directors determines otherwise prior to a change of control event. As of February 28, 2009, there were no shares available for grant under the 1999 Stock Plan. All future stock option grants will be made from shares available under the 2006 Plan. Additionally, outstanding options covering 7,757,400 and 8,465,775 shares were exercisable under the 1999 Stock Plan at fiscal years ended 2009 and 2008, respectively.
Under the 1989 Employee Stock Option Plan, options vest over a period of four to five years and all have a term of ten years from the grant date. As of February 28, 2009 and March 1, 2008, outstanding options covering 368,975 and 714,825 shares were exercisable, respectively. As a result of the expiration of the plan during fiscal 2005, no shares are available for future grant. The plan was subject to adjustments for stock dividends and certain other changes to the Company's capitalization.
67
Table of Contents
NOTES TO CONSOLIDATED FINANCIAL STATEMENTS (Continued)
NOTE 8-MATTERS CONCERNING SHAREHOLDERS' EQUITY (Continued)
A summary of stock option transactions related to the stock option plans during the three fiscal years ended February 28, 2009 is as follows:
| | | | | Exercisable Shares | |||||||||||||
|---|---|---|---|---|---|---|---|---|---|---|---|---|---|---|---|---|---|
| | | | Weighted Average Fair Value at Date of Grant | ||||||||||||||
| | Shares | Weighted Average Exercise Price | Number of Shares | Weighted Average Exercise Price | |||||||||||||
Outstanding at February 25, 2006 | 12,738,025 | $ | 15.41 | 11,438,025 | $ | 15.54 | |||||||||||
Options granted | 2,745,500 | 7.24 | $ | 3.33 | |||||||||||||
Options exercised | (98,950 | ) | 7.77 | ||||||||||||||
Options cancelled or expired | (1,716,450 | ) | 14.42 | ||||||||||||||
Outstanding at March 3, 2007 | 13,668,125 | 13.95 | 10,797,625 | 15.31 | |||||||||||||
Options granted | 724,000 | 7.71 | 3.31 | ||||||||||||||
Options exercised | (50,775 | ) | 7.43 | ||||||||||||||
Options cancelled or expired | (1,763,875 | ) | 14.54 | ||||||||||||||
Outstanding at March 1, 2008 | 12,577,475 | 13.53 | 10,983,225 | 14.18 | |||||||||||||
Options granted | 617,300 | 7.29 | 3.42 | ||||||||||||||
Options exercised | (2,875 | ) | 6.79 | ||||||||||||||
Options cancelled or expired | (1,481,975 | ) | 14.43 | ||||||||||||||
Outstanding at February 28, 2009 | 11,709,925 | 13.09 | 10,385,625 | 13.72 | |||||||||||||
For shares outstanding at February 28, 2009
Ranges of Exercise Prices | Total Shares | Weighted Average Exercise Price | Weighted Average Remaining Contractual Life (in years) | Shares Currently Exercisable | Weighted Average Exercise Price- Exercisable Shares | |||||||||||
|---|---|---|---|---|---|---|---|---|---|---|---|---|---|---|---|---|
$4.24-$6.69 | 1,524,150 | $ | 6.37 | 5.76 | 1,471,650 | $ | 6.41 | |||||||||
$7.42-$11.27 | 4,200,900 | 8.23 | 5.46 | 3,062,850 | 8.48 | |||||||||||
$11.50-$17.25 | 2,712,500 | 16.20 | 5.65 | 2,580,000 | 16.30 | |||||||||||
$18.49-$21.00 | 3,272,375 | 19.88 | 4.10 | 3,271,125 | 19.88 | |||||||||||
As of February 28, 2009, the weighted average remaining contractual term for outstanding and exercisable options was 5.16 years and 4.78 years, respectively. The aggregate intrinsic value for outstanding and exercisable options was zero at fiscal 2009 year end. The total intrinsic value of options exercised for the fiscal years ended 2009, 2008 and 2007 was approximately $2,000, $58,000 and $372,000, respectively. The intrinsic value of a stock option is the amount by which the market value of the underlying stock exceeds the exercise price of the option.
On February 26, 2006, the Company adopted the provisions of SFAS 123R. SFAS 123R requires all companies to measure and recognize compensation expense at an amount equal to the fair value of share-based payments granted under compensation arrangements. Prior to February 26, 2006, the Company accounted for stock option grants using the intrinsic value method in accordance with Accounting Principles Board Opinion No. 25, "Accounting for Stock Issued to Employees," and recognized no compensation expense for stock option grants since all options granted had an exercise price equal to the market value of the underlying common stock on the date of grant. The fair value of the stock options is amortized on a straight-line basis as compensation expense over the vesting periods of the options. The fair values for options granted during the respective period were estimated as of
68
Table of Contents
NOTES TO CONSOLIDATED FINANCIAL STATEMENTS (Continued)
NOTE 8-MATTERS CONCERNING SHAREHOLDERS' EQUITY (Continued)
the date of grant using the Black-Scholes option-pricing model with the following weighted average assumptions:
| | 2009 | 2008 | 2007 | |||||||
|---|---|---|---|---|---|---|---|---|---|---|
Weighted average fair value of options granted | $ | 3.42 | $ | 3.31 | $ | 3.33 | ||||
Risk-free interest rates | 2.60 | % | 4.68 | % | 4.95 | % | ||||
Expected stock price volatility | 51.29 | % | 42.43 | % | 47.15 | % | ||||
Expected dividend yields | 0.00 | % | 0.25 | % | 0.40 | % | ||||
Weighted average expected lives | 5 years | 5 years | 5 years | |||||||
Option valuation models are used in estimating the fair value of traded options that have no vesting restrictions and are fully transferable. In addition, option valuation models require the input of highly subjective assumptions, including the expected stock price volatility and the average life of options. The Company uses expected volatilities and risk-free interest rates that correlate with the expected term of the option when estimating an option's fair value. To determine the expected term of the option, the Company bases its estimates on historical exercise activity of grants with similar vesting periods. Expected volatility is based on the historical volatility of the common stock of the Company for a period approximating the expected life. The risk free interest rate utilized is the United States Treasury rate that most closely matches the weighted average expected life at the time of the grant. The expected dividend yield is based on the annual dividend rate at the time of grant or estimates of future anticipated dividend rates.
At February 28, 2009, there was approximately $3,313,000 of total unrecognized compensation expense related to unvested stock option awards. This expense is expected to be recognized over a weighted average period of 2.08 years. The Company recorded stock-based compensation expense related to stock options of approximately $3,528,000, or $0.04 per share, $4,278,000, or $ 0.05 per share, and $4,494,000, or $0.05 per share, in fiscal 2009, 2008 and 2007, respectively. The Company recognized no net tax benefit related to stock based compensation during fiscal 2009 or fiscal 2008 as a result of the Company's valuation allowance on all deferred tax assets. See Note 10 of the Notes to Consolidated Financial Statements for additional discussion of income taxes.
A summary of the Company's nonvested options as of February 28, 2009 is as follows:
| | Options | Weighted Average Grant Date Fair Value | |||||
|---|---|---|---|---|---|---|---|
Nonvested at beginning of period | 1,594,250 | $ | 3.68 | ||||
Granted | 617,300 | 3.42 | |||||
Vested | (674,750 | ) | 3.78 | ||||
Cancelled | (212,500 | ) | 3.54 | ||||
Nonvested at end of period | 1,324,300 | $ | 3.53 | ||||
Restricted stock grants -As of February 28, 2009 and March 1, 2008, the Company had 592,398 and 524,885 unvested shares of restricted stock awards outstanding, respectively. During fiscal 2009, 399,400 shares of restricted stock were granted, 177,268 shares of restricted stock vested, and 154,619 shares of restricted stock were cancelled. During fiscal 2008, 435,100 shares of restricted stock were granted, 78,870 shares of restricted stock vested, and 154,415 shares of restricted stock were cancelled. The weighted average fair market value at the date of grant of the restricted stock shares granted
69
Table of Contents
NOTES TO CONSOLIDATED FINANCIAL STATEMENTS (Continued)
NOTE 8-MATTERS CONCERNING SHAREHOLDERS' EQUITY (Continued)
during fiscal 2009 pursuant to the 2006 Plan was $7.45 and is being expensed over the requisite vesting period of three years. As of fiscal 2009 year end, no shares were available for future grant under the Management Restricted Stock Plan since all future grants, if any, will be made from shares available under the 2006 Plan.
Compensation expense for restricted stock was $1,649,000, or $0.02 per share, $1,559,000, or $ 0.02 per share, and $970,000, or $0.01 per share in fiscal 2009, 2008 and 2007, respectively. As of February 28, 2009, there was $3,122,000 of total unrecognized compensation expense related to restricted stock that may be recognized over a weighted average period of 1.62 years if all performance targets are met. The total fair value of restricted stock awards vested was $1,076,000, $664,000, and $456,000 in fiscal 2009, 2008 and 2007, respectively.
Director deferred stock units -The 2006 Plan and the 1999 Stock Plan also authorize director deferred stock unit awards to be granted to non-employee directors. During fiscal 2009, each director could elect to defer up to 100% of their director's cash fees into a deferred stock unit account. The annual retainer fees deferred (other than committee chairman and chairman annual retainers) received a 25% matching contribution from the Company in the form of director deferred stock units. As of February 28, 2009 and March 1, 2008, there were 554,292 shares and 360,939 shares deferred, but not delivered, under the 2006 Plan and the 1999 Stock Plan. All future grants will be awarded from shares available for grant under the 2006 Plan. During fiscal 2009, approximately 193,352 director deferred stock units were granted, no shares were delivered, and no shares were cancelled. Compensation expense for the director deferred stock awards was $1,015,000, $1,084,000 and $557,000 in fiscal 2009, 2008 and 2007, respectively.
Stock purchase plan -Substantially all Company employees are eligible to participate in the Pier 1 Imports, Inc. Stock Purchase Plan under which the Company's common stock is purchased on behalf of employees at market prices through regular payroll deductions. Each participant may contribute up to 20% of the eligible portions of compensation. The Company contributes 25% of the participants' contributions. Prior to June 20, 2008, a participant could contribute up to 10% of eligible compensation, and the Company contributed from 10% to 100% of the participant's contribution, depending on length of participation and date of entry into the plan. Company contributions to the plan were $263,000, $786,000 and $1,143,000 in fiscal years 2009, 2008 and 2007, respectively. As of March 29, 2009, the Company's stock purchase plan was suspended.
Shares reserved for future issuances -As of February 28, 2009, the Company had approximately 15,770,000 shares reserved for future issuances under the stock plans. This amount includes stock options outstanding, director deferred units and shares available for future grant.
NOTE 9-PROPRIETARY CREDIT CARD INFORMATION
On September 6, 2006, the Company allowed its agreement to securitize its proprietary credit card receivables to expire. At the time of expiration, the Company purchased $144,007,000 of proprietary credit card receivables, previously held by the Master Trust, an unconsolidated subsidiary, for $100,000,000 in cash and in exchange for $44,007,000 of beneficial interest. The Master Trust, upon approval from the Class A Certificate holders, paid $100,000,000 to redeem the Class A Certificates that were outstanding.
70
Table of Contents
NOTES TO CONSOLIDATED FINANCIAL STATEMENTS (Continued)
NOTE 9-PROPRIETARY CREDIT CARD INFORMATION (Continued)
On November 21, 2006, the Company completed the sale of its proprietary credit card operations to Chase. The sale was comprised of the Company's proprietary credit card receivables, certain charged-off accounts, and the common stock of Pier 1 National Bank. The Company received cash proceeds of $157,583,000 and was entitled to receive additional proceeds of $10,750,000, plus any accrued interest, over the life of the long-term program agreement. In both fiscal 2009 and fiscal 2008, the Company received payments of $1,500,000. The net deferred gain associated with this sale will be recognized in nonoperating income over the ten-year life of the agreement described below. The Company recognized $2,164,000 and $1,551,000 deferred gain related to this agreement in fiscal 2009 and 2008, respectively.
In addition, the Company and Chase entered into a long-term program agreement. Under this agreement, the Company continues to support the card through marketing programs and receive additional payments over the life of the agreement for transaction level incentives, marketing support and other program terms. The Company received total payments of $7,500,000 and $8,742,000 related to this agreement during fiscal 2009 and 2008, respectively.
Prior to the sale of its proprietary credit card operations in November 2006, the Company's proprietary credit card receivables were generated under open-ended revolving credit accounts issued by its subsidiary, Pier 1 National Bank, to finance purchases of merchandise and services offered by the Company. These accounts had various billing and payment structures, including varying minimum payment levels. The Company had an agreement with a third party to provide certain credit card processing and related credit services, while the Company maintained control over credit policy decisions and customer service standards.
Net proprietary credit card income was included in selling, general and administrative expenses on the Company's statements of operations. The following table presents a summary of the Company's proprietary credit card results, prior to the sale of Pier 1 National Bank, for fiscal 2007 on a managed basis. Fiscal 2007 income and costs include activity through November 21, 2006, when the Company completed the sale of its proprietary credit card operations.
| | 2007 (in thousands) | ||||
|---|---|---|---|---|---|
Income: | |||||
Finance charge income, net of debt service costs | $ | 20,127 | |||
Other income | 118 | ||||
| 20,245 | ||||
Costs: | |||||
Processing fees | 11,565 | ||||
Bad debts | 3,449 | ||||
| 15,014 | ||||
Net proprietary credit card income | $ | 5,231 | |||
The Company began securitizing its entire portfolio of proprietary credit card receivables (the "Receivables") in fiscal 1997. On a daily basis from February 26, to September 6, 2006, the Company sold all of its proprietary credit card receivables, except an immaterial amount of those that failed certain eligibility criteria, to a special-purpose wholly owned subsidiary, Funding. The Receivables were then transferred from Funding to the Master Trust. In exchange for the Receivables, the Company
71
Table of Contents
NOTES TO CONSOLIDATED FINANCIAL STATEMENTS (Continued)
NOTE 9-PROPRIETARY CREDIT CARD INFORMATION (Continued)
received cash and retained a residual interest in the Master Trust. These cash payments were funded from undistributed principal collections on the Receivables that were previously sold to the Master Trust.
Funding was capitalized by the Company as a special-purpose wholly owned subsidiary and was subject to certain covenants and restrictions, including a restriction from engaging in any business or activity unrelated to acquiring and selling interests in receivables. The Master Trust issued beneficial interests that represented undivided interests in the assets of the Master Trust. Neither Funding nor the Master Trust was consolidated in the Company's financial statements. Under U.S. generally accepted accounting principles, if the structure of a securitization meets certain requirements, such transactions are accounted for as sales of receivables. As the Company's securitizations met such requirements, they were accounted for as sales. Gains or losses resulting from the daily sales of Receivables to Funding were not material during fiscal 2007. The Company's exposure to deterioration in the performance of the Receivables was limited to its retained beneficial interest in the Master Trust. As such, the Company had no corporate obligation to reimburse Funding, the Master Trust or purchasers of any certificates issued by the Master Trust for credit losses from the Receivables.
As a result of the securitization, the Master Trust had $100,000,000 of outstanding 2001-1 Class A Certificates issued to a third party through September 6, 2006. The 2001-1 Class A Certificates bore interest at a floating rate equal to the rate on commercial paper issued by the third party plus a credit spread. Since the securitization agreement expired in September 2006, there were no outstanding 2001-1 Class A Certificates or 2001-1 Class B Certificates at the end of fiscal 2009 or 2008, as all amounts were settled.
Cash flows received by the Company from the Master Trust during fiscal 2007 were as follows (in thousands):
| | 2007 | |||
|---|---|---|---|---|
Proceeds from collections reinvested in revolving securitizations | $ | 212,653 | ||
Servicing fees received | $ | 1,190 | ||
Cash flows received on retained interests | $ | 32,592 | ||
72
Table of Contents
NOTES TO CONSOLIDATED FINANCIAL STATEMENTS (Continued)
NOTE 10-INCOME TAXES
The provision (benefit) for income taxes for each of the last three fiscal years consists of (in thousands):
| | 2009 | 2008 | 2007 | ||||||||
|---|---|---|---|---|---|---|---|---|---|---|---|
Federal: | |||||||||||
Current | $ | 296 | $ | 521 | $ | (25,442 | ) | ||||
Deferred | - | - | 22,980 | ||||||||
State: | |||||||||||
Current | 236 | 1,623 | (365 | ) | |||||||
Deferred | - | - | 1,596 | ||||||||
Foreign: | |||||||||||
Current | 92 | 450 | 346 | ||||||||
Deferred | - | - | - | ||||||||
Provision (benefit) for income taxes from continuing operations | 624 | 2,594 | (885 | ) | |||||||
Provision (benefit) for income taxes from discontinued operations | - | - | (231 | ) | |||||||
Total provision (benefit) for income taxes | $ | 624 | $ | 2,594 | $ | (1,116 | ) | ||||
The Company files a U.S. federal income tax return and income tax returns in various states and foreign jurisdictions. The Company has settled and closed all Internal Revenue Service ("IRS") examinations of the Company's tax returns for all years through fiscal 2002. Certain refund claims have been through appeals and during fiscal 2009 the Company received a refund of $12,429,000, including interest. With only a few exceptions, and other than changes to state taxable income required by the IRS adjustments from the fiscal years 2000 through 2002 audit, the Company is no longer subject to state, local and non-U.S. income tax examinations by tax authorities for years before fiscal 2003. The IRS completed its examination of fiscal years 2003 through 2007 during the first quarter of fiscal 2010. As a result of prior refunds received for the years under audit, the final audit results are subject to approval by the Joint Committee on Taxation. Final approval is expected to be received within 15 months. There were no adjustments from this examination which resulted in significant permanent differences that had not already been reserved.
The Company has net operating loss carryforwards of approximately $276,000,000. These loss carryforwards can be utilized to offset future income but will begin to expire in fiscal year 2027 if not utilized before then.
73
Table of Contents
NOTES TO CONSOLIDATED FINANCIAL STATEMENTS (Continued)
NOTE 10-INCOME TAXES (Continued)
Deferred tax assets and liabilities from continuing operations at February 28, 2009 and March 1, 2008 were comprised of the following (in thousands):
| | 2009 | 2008 | ||||||
|---|---|---|---|---|---|---|---|---|
Deferred tax assets: | ||||||||
Deferred compensation | $ | 19,157 | $ | 16,933 | ||||
Net operating loss | 109,779 | 75,924 | ||||||
Accrued average rent | 13,180 | 13,912 | ||||||
Fixed assets, net | 33,741 | 17,584 | ||||||
Self insurance reserves | 10,999 | 9,658 | ||||||
Deferred gain on sale of credit card operations | 6,793 | 7,373 | ||||||
Cumulative foreign currency translation | 1,299 | 1,949 | ||||||
Deferred revenue and revenue reserves | 6,380 | 5,111 | ||||||
Purchased call option | 1,561 | 2,159 | ||||||
Other | 6,892 | 6,630 | ||||||
Total deferred tax assets | 209,781 | 157,233 | ||||||
Deferred tax liabilities: | ||||||||
Inventory | (27,733 | ) | (29,898 | ) | ||||
Other | (1,049 | ) | (1,630 | ) | ||||
Total deferred tax liabilities | (28,782 | ) | (31,528 | ) | ||||
Valuation allowance | (180,999 | ) | (125,705 | ) | ||||
Net deferred tax assets | $ | - | $ | - | ||||
During fiscal 2007, the Company recorded a valuation allowance against all deferred tax assets. In addition, net deferred tax assets arising from losses during fiscal 2009 and 2008 in excess of the amount expected to be carried back to offset taxable income in a prior year were fully reserved through a valuation allowance during the respective years. As these deferred tax assets were established and fully reserved during fiscal 2009 and 2008, there was no net impact to the provision of income taxes.
The difference between income taxes at the statutory federal income tax rate of 35% in fiscal 2009, 2008 and, 2007, and income tax reported in continuing operations in the consolidated statements of operations is as follows (in thousands):
| | 2009 | 2008 | 2007 | |||||||
|---|---|---|---|---|---|---|---|---|---|---|
Tax benefit at statutory federal income tax rate | $ | (45,020 | ) | $ | (32,696 | ) | $ | (79,843 | ) | |
State income taxes, net of federal benefit | (12,350 | ) | (1,240 | ) | (4,091 | ) | ||||
Increase in valuation allowance | 56,637 | 36,498 | 83,047 | |||||||
Net foreign income taxed at lower rates, net of foreign tax credits | 92 | (209 | ) | 718 | ||||||
Other, net | 1,265 | 241 | (716 | ) | ||||||
Provision (benefit) for income taxes from continuing operations | $ | 624 | $ | 2,594 | $ | (885 | ) | |||
In July 2006, the FASB issued FASB Interpretation No. 48, "Accounting for Uncertainty in Income Taxes-An Interpretation of FASB Statement No. 109" ("FIN 48"), which clarifies the accounting for
74
Table of Contents
NOTES TO CONSOLIDATED FINANCIAL STATEMENTS (Continued)
NOTE 10-INCOME TAXES (Continued)
uncertainty in tax positions. FIN 48 prescribes the minimum recognition threshold a tax position is required to meet before being recognized in the financial statements. It also provides guidance on derecognition, measurement, classification, interest and penalties, accounting in interim periods, disclosure and transition. The Company adopted the provisions of FIN 48 effective as of the beginning of fiscal 2008. As a result of the cumulative effect of the adoption, the Company recorded a $5,073,000 decrease in retained earnings in fiscal 2008. Upon adoption on March 4, 2007, total reserves for uncertain tax positions were $13,908,000.
On a quarterly and annual basis, the Company accrues for the effects of open uncertain tax positions. A summary of amounts recorded for unrecognized tax benefits at the beginning and end of fiscal 2009 and 2008 are presented below, in thousands:
Unrecognized Tax Benefits-March 4, 2007 | $ | 13,908 | ||
Gross increases-tax positions in prior period | 1,880 | |||
Gross decreases-tax positions in prior period | (1,400 | ) | ||
Settlements | (449 | ) | ||
Unrecognized Tax Benefits-March 1, 2008 | $ | 13,939 | ||
Gross increases-tax positions in prior period | 3 | |||
Gross decreases-tax positions in prior period | (1,179 | ) | ||
Settlements | (1,418 | ) | ||
Expiration of statute of limitations | (168 | ) | ||
Unrecognized Tax Benefits-February 28, 2009 | $ | 11,177 | ||
If the Company were to prevail on all unrecognized tax benefits recorded, this entire reserve for uncertain tax positions would have a favorable impact on the effective tax rate. It is reasonably possible that the amount of the unrecognized tax benefit with respect to certain of the Company's unrecognized tax positions will increase or decrease during the next 12 months as a result of audit settlements. Accordingly, the Company has classified $4,680,000 of the reserve for uncertain tax positions and the related accrued interest as a current liability in the accompanying consolidated balance sheet. The Company does not expect the resolution of these issues to have a significant effect on the Company's results of operations or financial position.
Interest and penalties associated with unrecognized tax benefits are recorded in nonoperating (income) and expenses and selling, general and administrative expenses, respectively. The Company recorded expenses of $1,059,000 and $2,312,000 related to penalties and interest in fiscal 2009 and fiscal 2008, respectively. The Company had accrued penalties and interest of $5,854,000 and $6,786,000 at February 28, 2009 and March 1, 2008, respectively.
75
Table of Contents
NOTES TO CONSOLIDATED FINANCIAL STATEMENTS (Continued)
NOTE 11-COMMITMENTS AND CONTINGENCIES
Leases- At February 28, 2009, the Company had the following minimum lease commitments and future subtenant receipts from continuing operations in the years indicated (in thousands):
Fiscal Year | Operating Leases | Subtenant Income | ||||||
|---|---|---|---|---|---|---|---|---|
2010 | $ | 225,496 | $ | 787 | ||||
2011 | 202,259 | 839 | ||||||
2012 | 177,640 | 783 | ||||||
2013 | 141,379 | 561 | ||||||
2014 | 99,542 | 333 | ||||||
Thereafter | 90,115 | 112 | ||||||
Total lease commitments | $ | 936,431 | $ | 3,415 | ||||
Rental expense incurred was $244,776,000, $253,962,000 and $257,255,000, including contingent rentals of $43,000, $46,000 and $93,000, based upon a percentage of sales, and net of sublease incomes totaling $281,000, $332,000 and $304,000 in fiscal 2009, 2008 and 2007, respectively.
During fiscal 2009, the Company entered into an agreement to sell its corporate headquarters building and accompanying land. As part of the transaction, the Company entered into an agreement to rent office space in the building. See Note 2 of the Notes to Consolidated Financial Statements for further discussion.
Legal matters -There were no significant legal matters in fiscal 2009. During fiscal 2008, the Company paid $4,376,000, for the settlement of a class action lawsuit regarding compensation matters, which was included in selling, general and administrative expenses in fiscal 2007.
There are various claims, lawsuits, investigations and pending actions against the Company and its subsidiaries incident to the operations of its business. The Company considers them to be ordinary and routine in nature. The Company maintains liability insurance against most of these claims. It is the opinion of management, after consultation with counsel, that the ultimate resolution of such litigation will not have a material adverse effect, either individually or in aggregate, on the Company's financial position, results of operations or liquidity.
NOTE 12-DISCONTINUED OPERATIONS
During the fourth quarter of fiscal 2006, the Company's Board of Directors authorized management to sell its operations of The Pier with stores located in the United Kingdom and Ireland. The Company met the criteria of SFAS 144 that allowed it to classify The Pier as held for sale and present its results of operations as discontinued for all years presented. On March 20, 2006, the Company sold The Pier to Palli Limited for approximately $15,000,000. Palli Limited is a wholly owned subsidiary of Lagerinn ehf ("Lagerinn"), an Iceland corporation owned by Jakup a Dul Jacobsen. Collectively Lagerinn and Mr. Jacobsen beneficially owned approximately 9.9% of the Company's common stock as of the date of the sale. Expenses incurred by the Company in March 2006 related to The Pier were $407,000, net of taxes, which included an insignificant gain on the sale. The Company recorded net sales from these discontinued operations of $3,323,000 for fiscal 2007.
76
Table of Contents
NOTES TO CONSOLIDATED FINANCIAL STATEMENTS (Continued)
NOTE 13-SUBSEQUENT EVENT
On March 20, 2009, a foreign subsidiary of the Company purchased $78,941,000 of the Company's outstanding 6.375% convertible senior notes due 2036 at a purchase price of $27,399,000,including interest accrued to the date of purchase. The foreign subsidiary presently intends to hold the notes until maturity. As a result of this transaction the Company has reduced its outstanding convertible debt to $86,059,000 on a consolidated basis. In connection with this transaction, the Company expects to recognize a gain of approximately $49,000,000 during the first quarter of fiscal 2010.
NOTE 14-SELECTED QUARTERLY FINANCIAL DATA (UNAUDITED)
Summarized quarterly financial data for the years ended February 28, 2009 and March 1, 2008 are set forth below (in thousands except per share amounts):
| | Three Months Ended | ||||||||||||
|---|---|---|---|---|---|---|---|---|---|---|---|---|---|
Fiscal 2009 | 5/31/2008 | 8/30/2008 | 11/29/2008 | 2/28/2009 | |||||||||
Net sales | $ | 310,020 | $ | 320,494 | $ | 300,906 | $ | 389,257 | |||||
Gross profit | 87,606 | 86,135 | 87,891 | 101,832 | |||||||||
Net loss | (32,824 | ) | (30,156 | ) | (36,855 | ) | (29,418 | ) | |||||
Basic and diluted loss per share | (.37 | ) | (.34 | ) | (.41 | ) | (.33 | ) | |||||
| | Three Months Ended | ||||||||||||
|---|---|---|---|---|---|---|---|---|---|---|---|---|---|
Fiscal 2008 | 6/2/2007 | 9/1/2007 | 12/1/2007 | 3/1/2008 | |||||||||
Net sales | $ | 356,375 | $ | 344,566 | $ | 374,181 | $ | 436,710 | |||||
Gross profit | 87,178 | 87,524 | 125,895 | 138,955 | |||||||||
Net income (loss) | (56,378 | ) | (43,409 | ) | (9,962 | ) | 13,738 | ||||||
Basic and diluted income (loss) per share | (.64 | ) | (.49 | ) | (.11 | ) | .16 | ||||||
77
Table of Contents
Item 9. Changes in and Disagreements with Accountants on Accounting and Financial Disclosure.
None.
Item 9A. Controls and Procedures.
EVALUATION OF DISCLOSURE CONTROLS AND PROCEDURES
As required by Rules 13a-15 and 15d-15 under the Securities Exchange Act of 1934, as amended (the "Exchange Act"), an evaluation was conducted under the supervision and with the participation of the Company's management, including the Chief Executive Officer and Chief Financial Officer, of the effectiveness of the design and operation of the Company's disclosure controls and procedures as of February 28, 2009, and based on this evaluation the Chief Executive Officer and Chief Financial Officer have concluded, with reasonable assurance, that the Company's disclosure controls and procedures were effective as of such date to ensure that information required to be disclosed by the Company in its reports filed or furnished under the Exchange Act is (a) accumulated and communicated to management, including the Chief Executive Officer and the Chief Financial Officer, as appropriate to allow timely decisions regarding required disclosure, and (b) recorded, processed, summarized and reported within the time periods specified in the Securities and Exchange Commission's rules and forms.
REPORT OF MANAGEMENT ON INTERNAL CONTROL OVER FINANCIAL REPORTING
Management is responsible for establishing and maintaining a system of internal control over financial reporting designed to provide reasonable assurance that transactions are executed in accordance with management authorization and that such transactions are properly recorded and reported in the financial statements, and that records are maintained so as to permit preparation of the financial statements in accordance with U.S. generally accepted accounting principles. Because of its inherent limitations, internal control over financial reporting may not prevent or detect misstatements. Management has assessed the effectiveness of the Company's internal control over financial reporting utilizing the criteria set forth by the Committee of Sponsoring Organizations of the Treadway Commission in Internal Control-Integrated Framework . Management concluded that based on its assessment, Pier 1 Imports, Inc.'s internal control over financial reporting was effective as of February 28, 2009. Ernst & Young LLP, an independent registered public accounting firm, has audited the Company's internal control over financial reporting as of February 28, 2009, as stated in their report which is included in this Annual Report on Form 10-K.
| /s/ Alexander W. Smith Alexander W. Smith President and Chief Executive Officer | ||
/s/ Charles H. Turner Charles H. Turner Executive Vice President and Chief Financial Officer | | |
CHANGES IN INTERNAL CONTROL OVER FINANCIAL REPORTING
There were no changes in the Company's internal control over financial reporting during the fourth quarter of fiscal 2009 that would have materially affected, or would have been reasonably likely to materially affect, the Company's internal control over financial reporting.
78
Table of Contents
REPORT OF INDEPENDENT REGISTERED PUBLIC ACCOUNTING FIRM
To the Board of Directors of Pier 1 Imports, Inc.
We have audited Pier 1 Imports, Inc.'s internal control over financial reporting as of February 28, 2009, based on criteria established in Internal Control-Integrated Framework issued by the Committee of Sponsoring Organizations of the Treadway Commission (the COSO criteria). Pier 1 Imports, Inc.'s management is responsible for maintaining effective internal control over financial reporting, and for its assessment of the effectiveness of internal control over financial reporting included in the accompanying Report of Management on Internal Control over Financial Reporting. Our responsibility is to express an opinion on the Company's internal control over financial reporting based on our audit.
We conducted our audit in accordance with the standards of the Public Company Accounting Oversight Board (United States). Those standards require that we plan and perform the audit to obtain reasonable assurance about whether effective internal control over financial reporting was maintained in all material respects. Our audit included obtaining an understanding of internal control over financial reporting, assessing the risk that a material weakness exists, testing and evaluating the design and operating effectiveness of internal control based on the assessed risk, and performing such other procedures as we considered necessary in the circumstances. We believe that our audit provides a reasonable basis for our opinion.
A company's internal control over financial reporting is a process designed to provide reasonable assurance regarding the reliability of financial reporting and the preparation of financial statements for external purposes in accordance with generally accepted accounting principles. A company's internal control over financial reporting includes those policies and procedures that (1) pertain to the maintenance of records that, in reasonable detail, accurately and fairly reflect the transactions and dispositions of the assets of the company; (2) provide reasonable assurance that transactions are recorded as necessary to permit preparation of financial statements in accordance with generally accepted accounting principles, and that receipts and expenditures of the company are being made only in accordance with authorizations of management and directors of the company; and (3) provide reasonable assurance regarding prevention or timely detection of unauthorized acquisition, use, or disposition of the company's assets that could have a material effect on the financial statements.
Because of its inherent limitations, internal control over financial reporting may not prevent or detect misstatements. Also, projections of any evaluation of effectiveness to future periods are subject to the risk that controls may become inadequate because of changes in conditions, or that the degree of compliance with the policies or procedures may deteriorate.
In our opinion, Pier 1 Imports, Inc. maintained, in all material respects, effective internal control over financial reporting as of February 28, 2009, based on the COSO criteria.
We also have audited, in accordance with the standards of the Public Company Accounting Oversight Board (United States), the consolidated balance sheets of Pier 1 Imports, Inc. as of February 28, 2009 and March 1, 2008, and the related consolidated statements of operations, shareholders' equity, and cash flows for each of the three years in the period ended February 28, 2009 and our report dated April 28, 2009 expressed an unqualified opinion thereon.
| /s/ Ernst & Young LLP | ||
Fort Worth, Texas April 28, 2009 | | |
Item 9B. Other Information.
None.
79
Table of Contents
PART III
Item 10. Directors, Executive Officers and Corporate Governance.
Directors of the Company
Information regarding directors of the Company required by this Item is incorporated by reference to the section entitled "Item 1-Election of Directors, Nominees for Directors" set forth in the Company's Proxy Statement for its 2009 Annual Meeting of Shareholders.
The information regarding compliance with Section 16(a) of the Securities Exchange Act of 1934 required by this Item is incorporated by reference to the section entitled "Section 16(a) Beneficial Ownership Reporting Compliance" set forth in the Company's Proxy Statement for its 2009 Annual Meeting of Shareholders.
Information regarding the Company's audit committee financial experts and code of ethics and business conduct required by this item is incorporated by reference to the section entitled "Matters Relating to Corporate Governance, Board Structure, Director Compensation and Stock Ownership" set forth in the Company's Proxy Statement for its 2009 Annual Meeting of Shareholders.
No director or nominee for director of the Company has any family relationship with any other director or nominee or with any executive officer of the Company.
Item 11. Executive Compensation.
The information required by this Item is incorporated herein by reference to the section entitled "Executive Compensation" and the section entitled "Matters Relating to Corporate Governance, Board Structure, Director Compensation and Stock Ownership-Non-Employee Director Compensation for the Fiscal Year Ended February 28, 2009" set forth in the Company's Proxy Statement for its 2009 Annual Meeting of Shareholders.
Item 12. Security Ownership of Certain Beneficial Owners and Management and Related Stockholder Matters.
The information required by this Item is incorporated by reference to the section entitled "Matters Relating to Corporate Governance, Board Structure, Director Compensation and Stock Ownership-Security Ownership of Management", "Matters Relating to Corporate Governance, Board Structure, Director Compensation and Stock Ownership-Security Ownership of Certain Beneficial Owners", the table entitled "Executive Compensation-Outstanding Equity Awards Table for the Fiscal Year Ended February 28, 2009", and the table entitled "Equity Compensation Plan Information" set forth in the Company's Proxy Statement for its 2009 Annual Meeting of Shareholders.
Item 13. Certain Relationships and Related Transactions, and Director Independence.
The information required by this Item is incorporated by reference to the section entitled "Compensation Committee Interlocks and Insider Participation; Certain Related Party Transactions" and "Matters Relating to Corporate Governance, Board Structure, Director Compensation and Stock Ownership-Director Independence" set forth in the Company's Proxy Statement for its 2009 Annual Meeting of Shareholders.
Item 14. Principal Accounting Fees and Services.
Information required by this Item is incorporated by reference to the sections entitled "Independent Registered Public Accounting Firm Fees" and "Pre-approval of Nonaudit Fees" set forth in Item 4 of the Company's Proxy Statement for its 2009 Annual Meeting of Shareholders.
80
Table of Contents
PART IV
Item 15. Exhibits, Financial Statement Schedules.
(a) | List of consolidated financial statements, schedules and exhibits filed as part of this report. | |||
| 1. | Financial Statements | ||
| Report of Independent Registered Public Accounting Firm | |||
| Consolidated Statements of Operations for the Years Ended February 28, 2009, March 1, 2008 and March 3, 2007 | |||
| Consolidated Balance Sheets at February 28, 2009 and March 1, 2008 | |||
| Consolidated Statements of Cash Flows for the Years Ended February 28, 2009, March 1, 2008 and March 3, 2007 | |||
| Consolidated Statements of Shareholders' Equity for the Years Ended February 28, 2009, March 1, 2008 and March 3, 2007 | |||
| Notes to Consolidated Financial Statements | |||
| 2. | Financial Statement Schedules | ||
| Schedules have been omitted because they are not required or are not applicable or because the information required to be set forth therein either is not material or is included in the financial statements or notes thereto. | |||
| 3. | Exhibits | ||
| See Exhibit Index. | |||
81
Table of Contents
SIGNATURES
Pursuant to the requirements of Section 13 or 15(d) of the Securities Exchange Act of 1934, the Company has duly caused this report to be signed on its behalf by the undersigned, thereunto duly authorized.
| PIER 1 IMPORTS, INC. | ||||
Date: April 28, 2009 | | By: | | /s/ ALEXANDER W. SMITH Alexander W. Smith, President and Chief Executive Officer |
Pursuant to the requirements of the Securities Exchange Act of 1934, this report has been signed below by the following persons on behalf of the Company and in the capacities and on the dates indicated.
Signature | Title | Date | ||
|---|---|---|---|---|
| | | | | |
| /s/ TOM M. THOMAS Tom M. Thomas | Director, Chairman of the Board | April 28, 2009 | ||
/s/ ALEXANDER W. SMITH Alexander W. Smith | | Director, President and Chief Executive Officer | | April 28, 2009 |
/s/ CHARLES H. TURNER Charles H. Turner | | Executive Vice President and Chief Financial Officer | | April 28, 2009 |
/s/ LAURA A. SCHACK Laura A. Schack | | Principal Accounting Officer | | April 28, 2009 |
/s/ JOHN H. BURGOYNE John H. Burgoyne | | Director | | April 28, 2009 |
/s/ DR. MICHAEL R. FERRARI Dr. Michael R. Ferrari | | Director | | April 28, 2009 |
/s/ ROBERT B. HOLLAND, III Robert B. Holland, III | | Director | | April 28, 2009 |
82
Table of Contents
Signature | Title | Date | ||
|---|---|---|---|---|
| | | | | |
| /s/ KAREN W. KATZ Karen W. Katz | Director | April 28, 2009 | ||
/s/ TERRY E. LONDON Terry E. London | | Director | | April 28, 2009 |
/s/ CECE SMITH Cece Smith | | Director | | April 28, 2009 |
83
Table of Contents
EXHIBIT INDEX
| Exhibit No. | Description | ||
|---|---|---|---|
| 3(i) | Certificate of Incorporation and Amendments thereto, incorporated herein by reference to Exhibit 3(i) to Registrant's Form 10-Q for the quarter ended May 30, 1998. | ||
| | 3(ii) | | Bylaws of the Company as amended to date, incorporated herein by reference to Exhibit 3(ii) to Registrant's Form 10-K for the year ended February 26, 2005. |
| | 4.1 | | Indenture dated February 14, 2006 and Form of 6.375% Convertible Senior Notes due 2036, among Pier 1 Imports, Inc., the Subsidiary Guarantors parties thereto and JPMorgan Chase Bank, National Association, incorporated herein by reference to Exhibit 4.1 to the Company's Form 8-K filed February 16, 2006. |
| | 4.1.2 | | Registration Rights Agreement dated February 14, 2006, among Pier 1 Imports, Inc., the Guarantors parties thereto and the Initial Purchaser named therein, incorporated herein by reference to Exhibit 4.3 to the Company's Form 8-K filed February 16, 2006. |
| | 10.1 | * | Form of Indemnity Agreement between the Company and the directors and executive officers of the Company dated December 4, 2003, incorporated herein by reference to Exhibit 10.1 to the Company's Form 10-K for the year ended February 28, 2004. |
| | 10.2 | * | The Company's Supplemental Executive Retirement Plan, Restated as of January 1, 2009, incorporated herein by reference to Exhibit 10.5 to the Company's Form 10-Q for the quarter ended November 29, 2008. |
| | 10.3 | * | The Company's Supplemental Retirement Plan, Restated as of January 1, 2009, incorporated herein by reference to Exhibit 10.4 to the Company's Form 10-Q for the quarter ended November 29, 2009. |
| | 10.3.1 | * | Participation Agreement dated November 9, 2007, by and between Alexander W. Smith and Pier 1 Imports, Inc., incorporated herein by reference to Exhibit 10.1 to the Company's Form 8-K filed November 15, 2007. |
| | 10.3.2 | * | Participation Agreement Amendment dated April 20, 2008 by and between Jay R. Jacobs and Pier 1 Imports, Inc., incorporated herein by reference to Exhibit 10.5 to the Company's Form 8-K filed April 24, 2008. |
| | 10.3.3 | * | Participation Agreement Amendment dated April 20, 2008 by and between Charles H. Turner and Pier 1 Imports, Inc., incorporated herein by reference to Exhibit 10.6 to the Company's Form 8-K filed April 24, 2008. |
| | 10.3.4 | * | Participation Agreement Amendment dated April 20, 2008 by and between David A. Walker and Pier 1 Imports, Inc., incorporated herein by reference to Exhibit 10.7 to the Company's Form 8-K filed April 24, 2008. |
| | 10.3.5 | * | Participation Agreement Amendment dated April 20, 2008 by and between Gregory S. Humenesky and Pier 1 Imports, Inc., incorporated herein by reference to Exhibit 10.3.6 to the Company's Form 10-K for the year ended March 1, 2008. |
| | 10.4 | * | The Company's 1989 Employee Stock Option Plan, amended and restated as of June 27, 1996, incorporated herein by reference to Exhibit 10.6.1 to the Company's Form 10-K for the year ended February 26, 2005. |
| | 10.4.1 | * | Amendment No. 1 to the Company's 1989 Employee Stock Option Plan, incorporated herein by reference to Exhibit 10.6.2 to the Company's Form 10-K for the year ended February 26, 2005. |
Table of Contents
| Exhibit No. | Description | ||
|---|---|---|---|
| 10.5 | * | Form of Post-Employment Consulting Agreement between the Company and its executive officers, incorporated herein by reference to Exhibit 10(r) to the Company's Form 10-K for the fiscal year ended February 29, 1992. | |
| | 10.5.1 | * | Termination of Post-Employment Consulting Agreement dated April 20, 2008 by and between Jay R. Jacobs and Pier 1 Imports, Inc., incorporated by reference to Exhibit 10.1 to the Company's Form 8-K filed April 24, 2008. |
| | 10.5.2 | * | Termination of Post-Employment Consulting Agreement dated April 20, 2008 by and between Cary H. Turner and Pier 1 Imports, Inc., incorporated by reference to Exhibit 10.2 to the Company's Form 8-K filed April 24, 2008. |
| | 10.5.3 | * | Termination of Post-Employment Consulting Agreement dated April 20, 2008 by and between David A. Walker and Pier 1 Imports, Inc., incorporated by reference to Exhibit 10.3 to the Company's Form 8-K filed April 24, 2008. |
| | 10.6 | * | The Company's 1999 Stock Plan, as amended and restated December 31, 2004, incorporated herein by reference to Exhibit 10.3 to the Company's 8-K filed October 12, 2006. |
| | 10.6.1 | * | First Amendment to the Pier 1 Imports, Inc. 1999 Stock Plan, as amended and restated December 31, 2004, incorporated herein by reference to Exhibit 10.2 to the Company's Form 10-Q for the quarter ended September 1, 2007. |
| | 10.7 | * | Forms of Director and Employee Stock Option Agreements, incorporated herein by reference to Exhibit 10.2 to the Company's Form 10-Q for the quarter ended August 28, 1999. |
| | 10.8 | * | Pier 1 Imports, Inc. Stock Purchase Plan, restated as amended June 20, 2008, incorporated herein by reference Exhibit 10.2 to the Company's Form 10-Q for the quarter ended May 31, 2008. |
| | 10.8.1 | * | Amendment to the Pier 1 Imports, Inc. Stock Purchase Plan. |
| | 10.9 | | Secured Credit Agreement, dated November 22, 2005, among the Company, certain of its subsidiaries, Bank of America, N.A., Wells Fargo Retail Finance, LLC, Wachovia Bank, National Association, HSBC Bank USA, N.A., JPMorgan Chase Bank, N.A., and others, incorporated herein by reference to Exhibit 10.1 to the Company's Form 8-K filed November 23, 2005. |
| | 10.9.1 | | First Amendment to Credit Agreement, dated as of July 28, 2006, by and among Pier 1 Imports (U.S.), Inc., Bank of America, N.A., the facility guarantors party thereto and the lenders party thereto, incorporated herein by reference to Exhibit 10.1 to the Company's Form 8-K filed July 28, 2006. |
| | 10.9.2 | | Second Amendment to Credit Agreement, dated as of May 31, 2007 by and among Pier 1 Imports (U.S.), Inc., Bank of America, N.A., the facility guarantors party thereto and the lenders party thereto, incorporated herein by reference to Exhibit 10.1 to the Company's Form 8-K filed June 5, 2007. |
| | 10.10 | | Pier 1 Umbrella Trust, dated December 21, 2005, incorporated herein by reference to Exhibit 10.1 to the Company's Form 8-K filed December 21, 2005. |
| | 10.10.1 | | Pier 1 Umbrella Trust Amendment No. 1, effective January 1, 2009, incorporated herein by reference to Exhibit 10.2 to the Company's Form 10-Q for the quarter ended November 29, 2008. |
| | 10.11 | * | Pier 1 Imports, Inc. 2006 Stock Incentive Plan (Omnibus Plan), Restated as Amended through March 25, 2008, incorporated herein by reference to Exhibit 10.15 to the Company's Form 10-K for the year ended March 1, 2008. |
Table of Contents
| Exhibit No. | Description | ||
|---|---|---|---|
| 10.11.1 | * | First Amendment dated December 15, 2008 to Pier 1 Imports, Inc. 2006 Stock Incentive Plan (Omnibus Plan) Restated as Amended Through March 25, 2008, incorporated herein by reference to Exhibit 10.6 to the Company's Form 10-Q for the quarter ended November 29, 2008. | |
| | 10.11.2 | * | Form of Non-Qualified Stock Option Agreement-Non-Employee Director, incorporated herein by reference to Exhibit 10.2 to the Company's Form 8-K filed June 23, 2006. |
| | 10.11.3 | * | Form of Non-Qualified Stock Option Agreement-Employee Participant, incorporated herein by reference to Exhibit 10.3 to the Company's Form 8-K filed June 23, 2006. |
| | 10.11.4 | * | Form of Restricted Stock Award Agreement (Time Vesting), incorporated herein by reference to Exhibit 10.4 to the Company's Form 8-K filed June 23, 2006. |
| | 10.11.5 | * | Form of Restricted Stock Award Agreement (Performance Vesting), incorporated herein by reference to Exhibit 10.5 to the Company's Form 8-K filed June 23, 2006. |
| | 10.12 | * | Pier 1 Imports Non-Employee Director Compensation Plan, incorporated herein by reference to Exhibit 10.2 to the Company's Form 10-Q for the quarter ended August 26, 2006. |
| | 10.12.1 | * | Pier 1 Imports Non-Employee Director Compensation Plan, as amended March 4, 2007, incorporated herein by reference to Exhibit 10.22.1 to the Company's Form 10-K for the year ended March 3, 2007. |
| | 10.12.2 | * | Pier 1 Imports Non-Employee Director Compensation Plan, as amended March 25, 2008, incorporated herein by reference to Exhibit 10.16.2 to the Company's Form 10-K for the year ended March 1, 2008. |
| | 10.12.3 | * | Pier 1 Imports Non-Employee Director Compensation Plan, as amended December 15, 2008, incorporated by reference to Exhibit 10.7 to the Company's Form 10-Q for the quarter ended November 29, 2008. |
| | 10.13 | * | Pier 1 Imports Benefit Restoration Plan I, as amended and restated effective January 1, 2005, incorporated herein by reference to Exhibit 10.1 to the Company's Form 8-K filed October 12, 2006. |
| | 10.14 | * | Pier 1 Imports Benefit Restoration Plan II, as amended and restated effective January 1, 2009, incorporated herein by reference to Exhibit 10.3 to the Company's Form 10-Q for the quarter ended November 29, 2008. |
| | 10.15 | * | Employment Agreement by and between Alexander W. Smith and Pier 1 Imports, Inc. dated February 19, 2007, incorporated herein by reference to Exhibit 10.1 to the Company's Form 8-K filed January 30, 2007. |
| | 10.15.1 | * | Form of Non-Qualified Stock Option Agreement between Alexander W. Smith and Pier 1 Imports, Inc., incorporated herein by reference to Exhibit 10.2 to the Company's Form 8-K filed January 30, 2007. |
| | 10.15.2 | * | Form of Non-Qualified Stock Option Agreement between Alexander W. Smith and Pier 1 Imports, Inc., incorporated herein by reference to Exhibit 10.3 to the Company's Form 8-K filed January 30, 2007. |
| | 10.15.3 | * | First Amendment to Employment Agreement by and between Alexander W. Smith and Pier 1 Imports, Inc., dated October 6, 2008, incorporated herein by reference to Exhibit 10.19.3 to the Company's Form 10-Q for the quarter ended August 30, 2008. |
| | 10.15.4 | * | First Amendment to Non-Qualified Stock Option Agreement between Alexander W. Smith and Pier 1 Imports, Inc. dated October 6, 2008, incorporated herein by reference to Exhibit 10.19.4 to the Company's Form 10-Q for the quarter ended August 30, 2008. |
Table of Contents
| Exhibit No. | Description | ||
|---|---|---|---|
| 10.16 | Credit Card Program Agreement by and among Pier 1 Imports (U.S.), Inc. and Chase Bank USA, N.A., incorporated herein by reference to Exhibit 10.3 to the Company's Form 10-Q for the quarter ended June 2, 2007. | ||
| | 10.16.1 | | Amendment No. 1 to the Credit Card Program Agreement by and among Pier 1 Imports (U.S.), Inc. and Chase Bank USA, N.A., incorporated herein by reference to Exhibit 10.3 to the Company's Form 10-Q for the quarter ended September 1, 2007. |
| | 10.16.2 | | Amendment No. 2 to the Credit Card Program Agreement by and among Pier 1 Imports (U.S.), Inc. and Chase Bank USA, N.A., incorporated herein by reference to Exhibit 10.4 to the Company's Form 10-Q for the quarter ended September 1, 2007. |
| | 10.17 | | Real Estate Purchase Agreement by and between Chesapeake Land Company, L.L.C. and Pier 1 Services Company, dated March 25, 2008, incorporated by reference herein to Exhibit 10.21 to the Company's Form 10-K for the year ended March 1, 2008. |
| | 10.18 | | Office Lease between Chesapeake Plaza, L.L.C and Pier 1 Services Company, dated June 9, 2008, incorporated herein by reference to Exhibit 10.1 to the Company's Form 10-Q for the quarter ended May 31, 2008. |
| | 10.18.1 | | First Amendment to Office Lease, dated June 20, 2008, incorporated herein by reference to Exhibit 10.1.1 to the Company's Form 10-Q for the quarter ended May 31, 2008. |
| | 10.19 | | Agreement for Severance Benefits and for Release, Waiver and Nondisclosure, incorporated herein by reference to Exhibit 99.1 to the Company's Form 8-K filed October 1, 2008. |
| | 10.20 | * | Summary Plan Description of Pier 1 Imports Limited Severance Plan, Restated as of January 1, 2009, incorporated herein by reference to Exhibit 10.1 to the Company's Form 10-Q for the quarter ended November 29, 2008. |
| | 10.21 | * | Termination of Pier 1 Executive Health Expense Reimbursement Plan, effective January 5, 2009, incorporated herein by reference to Exhibit 10.8 to the Company's Form 10-Q for the quarter ended November 29, 2008. |
| | 21 | | Subsidiaries of the Company. |
| | 23 | | Consent of Independent Registered Public Accounting Firm. |
| | 31.1 | | Certification of the Chief Executive Officer Pursuant to Exchange Act Rule 13a-14(a)/15d-14(a). |
| | 31.2 | | Certification of the Chief Financial Officer Pursuant to Exchange Act Rule 13a-14(a)/15d-14(a). |
| | 32.1 | | Certification of Chief Executive Officer and Chief Financial Officer pursuant to 18 U.S.C. Section 1350, as adopted pursuant to Section 906 of the Sarbanes-Oxley Act of 2002. |
| | 99.1 | | Pier 1 Imports, Inc. Stock Purchase Plan Audit Report |