Table of Contents
UNITED STATES
SECURITIES AND EXCHANGE COMMISSION
WASHINGTON, DC 20549
|
FORM 10-K
x | ANNUAL REPORT PURSUANT TO SECTION 13 OR 15(d) OF THE SECURITIES EXCHANGE ACT OF 1934 |
For the fiscal year ended December 27, 2014
or
¨ | TRANSITION REPORT PURSUANT TO SECTION 13 OR 15(d) OF THE SECURITIES EXCHANGE ACT OF 1934 |
For the transition period from to
Commission file number 1-1183
PepsiCo, Inc.
(Exact Name of Registrant as Specified in Its Charter)
North Carolina (State or Other Jurisdiction of Incorporation or Organization) |
| 13-1584302 (I.R.S. Employer Identification No.) |
700 Anderson Hill Road, Purchase, New York (Address of Principal Executive Offices) |
| 10577 (Zip Code) |
Registrant's telephone number, including area code: 914-253-2000
Securities registered pursuant to Section 12(b) of the Securities Exchange Act of 1934:
Title of each class |
| Name of each exchange on which registered |
Common Stock, par value 1-2/3 cents per share |
| New York and Chicago Stock Exchanges |
2.500% Senior Notes Due 2022 |
| New York Stock Exchange |
1.750% Senior Notes Due 2021 |
| New York Stock Exchange |
2.625% Senior Notes Due 2026 |
| New York Stock Exchange |
Indicate by check mark if the registrant is a well-known seasoned issuer, as defined in Rule 405 of the Securities Act. Yes x No ¨
Indicate by check mark if the registrant is not required to file reports pursuant to Section 13 or 15(d) of the Act. Yes ¨ No x
Indicate by check mark whether the registrant (1) has filed all reports required to be filed by Section 13 or 15(d) of the Securities Exchange Act of 1934 during the preceding 12 months (or for such shorter period that the registrant was required to file such reports), and (2) has been subject to such filing requirements for the past 90 days. Yes x No ¨
Indicate by check mark whether the registrant has submitted electronically and posted on its corporate Web site, if any, every Interactive Data File required to be submitted and posted pursuant to Rule 405 of Regulation S-T (§ 232.405 of this chapter) during the preceding 12 months (or for such shorter period that the registrant was required to submit and post such files). Yes x No ¨
Indicate by check mark if disclosure of delinquent filers pursuant to Item 405 of Regulation S-K (§ 232.405 of this chapter) is not contained herein, and will not be contained, to the best of registrant's knowledge, in definitive proxy or information statements incorporated by reference in Part III of this Form 10-K or any amendment to this Form 10-K. x
Indicate by check mark whether the registrant is a large accelerated filer, an accelerated filer, a non-accelerated filer, or a smaller reporting company. See the definitions of "large accelerated filer," "accelerated filer" and "smaller reporting company" in Rule 12b-2 of the Exchange Act. (Check one):
Large accelerated filer x | Accelerated filer ¨ |
Non-accelerated filer ¨ | Smaller reporting company ¨ |
Indicate by check mark whether the registrant is a shell company (as defined in Rule 12b-2 of the Exchange Act). Yes ¨ No x
The aggregate market value of PepsiCo, Inc. Common Stock held by nonaffiliates of PepsiCo, Inc. (assuming for these purposes, but without conceding, that all executive officers and directors of PepsiCo, Inc. are affiliates of PepsiCo, Inc.) as of June 13, 2014, the last day of business of our most recently completed second fiscal quarter, was $131.6 billion (based on the closing sale price of PepsiCo, Inc.'s Common Stock on that date as reported on the New York Stock Exchange).
The number of shares of PepsiCo, Inc. Common Stock outstanding as of February 6, 2015 was 1,482,368,514 .
Documents Incorporated by Reference
Portions of the Proxy Statement relating to PepsiCo, Inc.'s 2015 Annual Meeting of Shareholders are incorporated by reference into Part III of this Form 10-K.
Table of Contents
PepsiCo, Inc.
Form 10-K Annual Report
For the Fiscal Year Ended
December 27, 2014
Table of Contents
PART I |
|
|
Item 1. | Business | 2 |
Item 1A. | Risk Factors | 11 |
Item 1B. | Unresolved Staff Comments | 25 |
Item 2. | Properties | 25 |
Item 3. | Legal Proceedings | 27 |
Item 4. | Mine Safety Disclosures | 27 |
|
|
|
PART II |
|
|
Item 5. | Market for Registrant's Common Equity, Related Stockholder Matters and Issuer Purchases of Equity Securities | 31 |
Item 6. | Selected Financial Data | 34 |
Item 7. | Management's Discussion and Analysis of Financial Condition and Results of Operations | 34 |
Item 7A. | Quantitative and Qualitative Disclosures About Market Risk | 122 |
Item 8. | Financial Statements and Supplementary Data | 122 |
Item 9. | Changes in and Disagreements with Accountants on Accounting and Financial Disclosure | 122 |
Item 9A. | Controls and Procedures | 122 |
Item 9B. | Other Information | 123 |
|
|
|
PART III |
|
|
Item 10. | Directors, Executive Officers and Corporate Governance | 123 |
Item 11. | Executive Compensation | 123 |
Item 12. | Security Ownership of Certain Beneficial Owners and Management and Related Stockholder Matters | 123 |
Item 13. | Certain Relationships and Related Transactions, and Director Independence | 124 |
Item 14. | Principal Accounting Fees and Services | 124 |
|
|
|
PART IV |
|
|
Item 15. | Exhibits and Financial Statement Schedules | 125 |
1
Table of Contents
Forward-Looking Statements
This Annual Report on Form 10-K contains statements reflecting our views about our future performance that constitute "forward-looking statements" within the meaning of the Private Securities Litigation Reform Act of 1995 (Reform Act). Statements that constitute forward-looking statements within the meaning of the Reform Act are generally identified through the inclusion of words such as "aim," "anticipate," "believe," "drive," "estimate," "expect," "expressed confidence," "forecast," "future," "goals," "guidance," "intend," "may," "objectives," "outlook," "plan," "position," "potential," "project," "seek," "should," "strategy," "target," "will" or similar statements or variations of such words and other similar expressions. All statements addressing our future operating performance, and statements addressing events and developments that we expect or anticipate will occur in the future, are forward-looking statements within the meaning of the Reform Act. These forward-looking statements are based on currently available information, operating plans and projections about future events and trends. They inherently involve risks and uncertainties that could cause actual results to differ materially from those predicted in any such forward-looking statement. These risks and uncertainties include, but are not limited to, those described in "Risk Factors" in Item 1A. and "Management's Discussion and Analysis of Financial Condition and Results of Operations – Our Business – Our Business Risks" in Item 7. Investors are cautioned not to place undue reliance on any such forward-looking statements, which speak only as of the date they are made. We undertake no obligation to update any forward-looking statement, whether as a result of new information, future events or otherwise. The discussion of risks below and elsewhere in this report is by no means all-inclusive but is designed to highlight what we believe are important factors to consider when evaluating our future performance.
PART I
Item 1. Business.
PepsiCo, Inc. was incorporated in Delaware in 1919 and was reincorporated in North Carolina in 1986. When used in this report, the terms "we," "us," "our," "PepsiCo" and the "Company" mean PepsiCo, Inc. and its consolidated subsidiaries, collectively.
We are a leading global food and beverage company with a complementary portfolio of enjoyable brands, including Frito-Lay, Gatorade, Pepsi-Cola, Quaker and Tropicana. Through our operations, authorized bottlers, contract manufacturers and other third parties, we make, market, distribute and sell a wide variety of convenient and enjoyable beverages, foods and snacks, serving customers and consumers in more than 200 countries and territories.
Performance with Purpose is our goal to deliver sustained value by providing a wide range of beverages, foods and snacks, from treats to healthy eats; finding innovative ways to minimize our impact on the environment and lower our costs through energy and water conservation as well as reduce our use of packaging material; providing a safe and inclusive workplace for our employees globally; and respecting, supporting and investing in the local communities in which we operate. PepsiCo was again recognized for its leadership in this area in 2014 by earning a place on the prestigious Dow Jones World Index for the eighth consecutive year and on the North America Index for the ninth consecutive year.
Certain terms used in this Annual Report on Form 10-K are defined in the Glossary included in Item 7. of this report.
2
Table of Contents
Our Operations
We are organized into six reportable segments (also referred to as divisions), as follows:
1) | Frito-Lay North America (FLNA); |
2) | Quaker Foods North America (QFNA); |
3) | Latin America Foods (LAF), which includes all of our food and snack businesses in Latin America; |
4) | PepsiCo Americas Beverages (PAB), which includes all of our North American and Latin American beverage businesses; |
5) | PepsiCo Europe (Europe), which includes all beverage, food and snack businesses in Europe and South Africa; and |
6) | PepsiCo Asia, Middle East and Africa (AMEA), which includes all beverage, food and snack businesses in AMEA, excluding South Africa. |
See Note 1 to our consolidated financial statements for financial information about our divisions and geographic areas. See also "Risk Factors" in Item 1A. below for a discussion of certain risks associated with our operations outside the United States.
Frito-Lay North America
Either independently or in conjunction with third parties, FLNA makes, markets, distributes and sells branded snack foods. These foods include Lay's potato chips, Doritos tortilla chips, Cheetos cheese-flavored snacks, Tostitos tortilla chips, branded dips, Ruffles potato chips, Fritos corn chips and Santitas tortilla chips. FLNA's branded products are sold to independent distributors and retailers. In addition, FLNA's joint venture with Strauss Group makes, markets, distributes and sells Sabra refrigerated dips and spreads. FLNA's net revenue was $14.5 billion , $ 14.1 billion and $ 13.6 billion in 2014 , 2013 and 2012 , respectively, and approximated 22% of our total net revenue in 2014 and 21% of our total net revenue in both 2013 and 2012 .
Quaker Foods North America
Either independently or in conjunction with third parties, QFNA makes, markets, distributes and sells cereals, rice, pasta, dairy and other branded products. QFNA's products include Quaker oatmeal, Aunt Jemima mixes and syrups, Quaker Chewy granola bars, Quaker grits, Cap'n Crunch cereal, Life cereal, Rice-A-Roni side dishes, Quaker rice cakes, Quaker oat squares and Quaker natural granola. These branded products are sold to independent distributors and retailers. QFNA's net revenue was $ 2.6 billion in each of 2014 , 2013 and 2012 , and approximated 4% of our total net revenue in each of 2014 , 2013 and 2012 .
Latin America Foods
Either independently or in conjunction with third parties, LAF makes, markets, distributes and sells a number of snack food brands including Doritos, Cheetos, Marias Gamesa, Ruffles, Emperador, Saladitas, Lay's, Rosquinhas Mabel, Elma Chips and Sabritas, as well as many Quaker-branded cereals and snacks. These branded products are sold to independent distributors and retailers. LAF's net revenue was $8.4 billion , $ 8.3 billion and $ 7.8 billion in 2014 , 2013 and 2012 , respectively, and approximated 12% of our total net revenue in each of 2014 , 2013 and 2012 .
3
Table of Contents
PepsiCo Americas Beverages
Either independently or in conjunction with third parties, PAB makes, markets, distributes and sells beverage concentrates, fountain syrups and finished goods under various beverage brands including Pepsi, Gatorade, Mountain Dew, Diet Pepsi, Aquafina, 7UP (outside the United States), Diet Mountain Dew, Tropicana Pure Premium, Sierra Mist and Diet 7UP (outside the United States). PAB also, either independently or in conjunction with third parties, makes, markets and sells ready-to-drink tea and coffee products through joint ventures with Unilever (under the Lipton brand name) and Starbucks, respectively. Further, PAB manufactures and distributes certain brands licensed from Dr Pepper Snapple Group, Inc. (DPSG), including Dr Pepper, Crush and Schweppes, and certain juice brands licensed from Dole Food Company, Inc. (Dole) and Ocean Spray Cranberries, Inc. (Ocean Spray). PAB operates its own bottling plants and distribution facilities and sells branded finished goods directly to independent distributors and retailers. PAB also sells concentrate and finished goods for our brands to authorized and independent bottlers, who in turn sell our branded finished goods to independent distributors and retailers in certain markets. PAB's net revenue was $21.2 billion , $ 21.1 billion and $ 21.4 billion in 2014 , 2013 and 2012 , respectively, and approximated 32% of our total net revenue in both 2014 and 2013 , and 33% in 2012 .
PepsiCo Europe
Either independently or in conjunction with third parties, Europe makes, markets, distributes and sells a number of leading snack food brands including Lay's, Walkers, Doritos, Cheetos and Ruffles, as well as many Quaker-branded cereals and snacks, through consolidated businesses as well as through noncontrolled affiliates. Europe also, either independently or in conjunction with third parties, makes, markets, distributes and sells beverage concentrates, fountain syrups and finished goods under various beverage brands including Pepsi, Pepsi Max, 7UP, Diet Pepsi and Tropicana. These branded products are sold to authorized bottlers, independent distributors and retailers. In certain markets, however, Europe operates its own bottling plants and distribution facilities. Europe also, either independently or in conjunction with third parties, makes, markets and sells ready-to-drink tea products through an international joint venture with Unilever (under the Lipton brand name). In addition, Europe makes, markets, sells and distributes a number of leading dairy products including Domik v Derevne, Chudo and Agusha. Europe's net revenue was $13.3 billion , $ 13.8 billion and $ 13.4 billion in 2014 , 2013 and 2012 , respectively, and approximated 20%, 21% and 20% of our total net revenue in 2014 , 2013 and 2012 , respectively.
PepsiCo Asia, Middle East and Africa
Either independently or in conjunction with third parties, AMEA makes, markets, distributes and sells a number of leading snack food brands including Lay's, Kurkure, Chipsy, Doritos, Cheetos and Crunchy through consolidated businesses as well as through noncontrolled affiliates. Further, either independently or in conjunction with third parties, AMEA makes, markets, distributes and sells many Quaker-branded cereals and snacks. AMEA also makes, markets, distributes and sells beverage concentrates, fountain syrups and finished goods under various beverage brands including Pepsi, Mirinda, 7UP, Mountain Dew, Aquafina and Tropicana. These branded products are sold to authorized bottlers, independent distributors and retailers. However, in certain markets, AMEA operates its own bottling plants and distribution facilities. AMEA also, either independently or in conjunction with third parties, makes, markets, distributes and sells ready-to-drink tea products through an international joint venture with Unilever (under the Lipton brand name). Further, we license the Tropicana brand for use in China on co-branded juice products in connection with a strategic alliance with Tingyi (Cayman Islands) Holding Corp. (Tingyi). AMEA's net revenue was $6.7 billion , $6.5 billion and $6.7 billion in 2014 , 2013 and 2012 , respectively, and approximated 10% of our total net revenue in each of 2014 , 2013 and 2012 .
See Note 15 to our consolidated financial statements for additional information about our transaction with Tingyi in 2012.
4
Table of Contents
Our Distribution Network
Our products are brought to market through direct-store-delivery (DSD), customer warehouse and distributor networks. The distribution system used depends on customer needs, product characteristics and local trade practices.
Direct-Store-Delivery
We, our independent bottlers and our distributors operate DSD systems that deliver beverages, foods and snacks directly to retail stores where the products are merchandised by our employees or our independent bottlers. DSD enables us to merchandise with maximum visibility and appeal. DSD is especially well-suited to products that are restocked often and respond to in-store promotion and merchandising.
Customer Warehouse
Some of our products are delivered from our manufacturing plants and warehouses to customer warehouses and retail stores. These less costly systems generally work best for products that are less fragile and perishable, and have lower turnover.
Distributor Networks
We distribute many of our products through third-party distributors. Third-party distributors are particularly effective when greater distribution reach can be achieved by including a wide range of products on the delivery vehicles. For example, our foodservice and vending business distributes beverages, foods and snacks to restaurants, businesses, schools and stadiums through third-party foodservice and vending distributors and operators.
Ingredients and Other Supplies
The principal ingredients we use in our beverage, food and snack products are apple, orange and pineapple juice and other juice concentrates, aspartame, corn, corn sweeteners, flavorings, flour, grapefruit and other fruits, oats, oranges, potatoes, raw milk, rice, seasonings, sucralose, sugar, vegetable and essential oils, and wheat. We also use water in the manufacturing of our products. Our key packaging materials include plastic resins, including polyethylene terephthalate (PET) and polypropylene resins used for plastic beverage bottles and film packaging used for snack foods, aluminum used for cans, glass bottles, closures, cardboard and paperboard cartons. Fuel and natural gas are also important commodities for us due to their use in our facilities and in the trucks delivering our products. We employ specialists to secure adequate supplies of many of these items and have not experienced any significant continuous shortages. Many of these ingredients, raw materials and commodities are purchased in the open market. The prices we pay for such items are subject to fluctuation, and we manage this risk through the use of fixed-price contracts and purchase orders, pricing agreements and derivative instruments, including swaps and futures. In addition, risk to our supply of certain raw materials is mitigated through purchases from multiple geographies and suppliers. When prices increase, we may or may not pass on such increases to our customers. See Note 10 to our consolidated financial statements for additional information on how we manage our exposure to commodity costs. See also "Item 1A. Risk Factors – Our business, financial condition or results of operations may be adversely affected by increased costs, disruption of supply or shortages of raw materials or other supplies."
Our Brands and Intellectual Property Rights
We own numerous valuable trademarks which are essential to our worldwide businesses, including Agusha, Amp Energy, Aquafina, Aquafina Flavorsplash, Aunt Jemima, Cap'n Crunch, Cheetos, Chester's, Chipsy, Chudo, Cracker Jack, Crunchy, Diet Mountain Dew, Diet Mug, Diet Pepsi, Diet 7UP, Diet Sierra Mist, Domik v Derevne, Doritos, Duyvis, Elma Chips, Emperador, Frito-Lay, Fritos, Fruktovy Sad, Frustyle, G Series, G2, Gatorade, Grandma's, Imunele, Izze, Kurkure, Lay's, Life, Lubimy, Manzanita Sol, Marias Gamesa, Matutano, Mirinda, Miss Vickie's, Mother's, Mountain Dew, Mountain Dew Code Red, Mountain Dew
5
Table of Contents
Kickstart, Mug, Munchies, Naked, Near East, O.N.E., Paso de los Toros, Pasta Roni, Pepsi, Pepsi Max, Pepsi Next, Propel, Quaker, Quaker Chewy, Rice-A-Roni, Rold Gold, Rosquinhas Mabel, Ruffles, Sabritas, Sakata, Saladitas, Sandora, Santitas, 7UP (outside the United States) and 7UP Free (outside the United States), Sierra Mist, Simba, Smartfood, Smith's, Snack a Jacks, SoBe, SoBe Lifewater, SoBe V Water, Sonric's, Stacy's, Sting, SunChips, Tonus, Tostitos, Trop 50, Tropicana, Tropicana Farmstand, Tropicana Pure Premium, Tropicana Twister, Vesely Molochnik, Walkers and Ya. We also hold long-term licenses to use valuable trademarks in connection with our products in certain markets, including Dole and Ocean Spray. We also distribute Rockstar Energy drinks, Muscle Milk protein shakes and certain DPSG brands, including Dr Pepper, Crush and Schweppes, in certain markets. Joint ventures in which we have an ownership interest either own or have the right to use certain trademarks, such as Lipton, Müller, Sabra and Starbucks. Trademarks remain valid so long as they are used properly for identification purposes, and we emphasize correct use of our trademarks. We have authorized, through licensing arrangements, the use of many of our trademarks in such contexts as snack food joint ventures and beverage bottling appointments. In addition, we license the use of our trademarks on merchandise that is sold at retail, which enhances brand awareness.
We either own or have licenses to use a number of patents which relate to certain of our products, their packaging, the processes for their production and the design and operation of various equipment used in our businesses. Some of these patents are licensed to others. See also "Item 1A. Risk Factors – Our intellectual property rights could be infringed or challenged and reduce the value of our products and brands and have an adverse impact on our business, financial condition or results of operations."
Seasonality
Our businesses are affected by seasonal variations. For instance, our beverage sales are higher during the warmer months and certain food and dairy sales are higher in the cooler months. Weekly beverage and snack sales are generally highest in the third quarter due to seasonal and holiday-related patterns, and generally lowest in the first quarter. However, taken as a whole, seasonality does not have a material impact on our consolidated financial results.
Our Customers
Our primary customers include wholesale and other distributors, foodservice customers, grocery stores, drug stores, convenience stores, discount/dollar stores, mass merchandisers, membership stores and authorized independent bottlers. We normally grant our independent bottlers exclusive contracts to sell and manufacture certain beverage products bearing our trademarks within a specific geographic area. These arrangements provide us with the right to charge our independent bottlers for concentrate, finished goods and Aquafina royalties and specify the manufacturing process required for product quality. We also grant distribution rights to our independent bottlers for certain beverage products bearing our trademarks for specified geographic areas.
Since we do not sell directly to the consumer, we rely on and provide financial incentives to our customers to assist in the distribution and promotion of our products. For our independent distributors and retailers, these incentives include volume-based rebates, product placement fees, promotions and displays. For our independent bottlers, these incentives are referred to as bottler funding and are negotiated annually with each bottler to support a variety of trade and consumer programs, such as consumer incentives, advertising support, new product support, and vending and cooler equipment placement. Consumer incentives include coupons, pricing discounts and promotions, and other promotional offers. Advertising support is directed at advertising programs and supporting independent bottler media. New product support includes targeted consumer and retailer incentives and direct marketplace support, such as point-of-purchase materials, product placement fees, media and advertising. Vending and cooler equipment placement programs support the acquisition and placement of vending machines and cooler equipment. The nature and type of programs vary annually.
6
Table of Contents
Changes to the retail landscape, including increased consolidation of retail ownership, and the current economic environment continue to increase the importance of major customers. See "Item 1A. Risk Factors – The loss of any key customer or changes to the retail landscape could adversely affect our business, financial condition or results of operations." In 2014 , sales to Wal-Mart Stores, Inc. (Wal-Mart), including Sam's Club (Sam's), represented approximately 12% of our total net revenue. Our top five retail customers represented approximately 31% of our 2014 North American (United States and Canada) net revenue, with Wal-Mart (including Sam's) representing approximately 18% . These percentages include concentrate sales to our independent bottlers, which were used in finished goods sold by them to these retailers.
See Note 8 to our consolidated financial statements for more information on our customers, including our independent bottlers.
Our Competition
Our beverage, food and snack products are in highly competitive industries and markets and compete against products of international beverage, food and snack companies that, like us, operate in multiple geographies, as well as regional, local and private label manufacturers and other value competitors. In many countries in which our products are sold, including the United States, The Coca-Cola Company is our primary beverage competitor. Other beverage, food and snack competitors include, but are not limited to, DPSG, Kellogg Company, Kraft Foods Group, Inc., Mondelēz International, Inc., Monster Beverage Corporation, Nestlé S.A., Red Bull GmbH and Snyder's-Lance, Inc.
Many of our food and snack products hold significant leadership positions in the food and snack industry worldwide. However, The Coca-Cola Company has significant carbonated soft drink (CSD) share advantage in many markets outside the United States.
Our beverage, food and snack products compete primarily on the basis of brand recognition, taste, price, quality, product variety, distribution, advertising, marketing and promotional activity, packaging, convenience, service and the ability to anticipate and respond to consumer trends. Success in this competitive environment is dependent on effective promotion of existing products, introduction of new products and the effectiveness of our advertising campaigns, marketing programs, product packaging, pricing, increased efficiency in production techniques, new vending and dispensing equipment and brand and trademark development and protection. We believe that the strength of our brands, innovation and marketing, coupled with the quality of our products and flexibility of our distribution network, allows us to compete effectively. See also "Item 1A. Risk Factors – Our business, financial condition or results of operations could suffer if we are unable to compete effectively."
7
Table of Contents
U.S. Savory Snacks % Retail Sales in Measured Channels (1) Includes salty snacks (including potato, tortilla, corn, pita, bagel and veggie chips, pretzels, fruit crisps and cheese puffs), snack nuts, seeds, corn nuts, meat snacks, crackers (excluding graham), popcorn, dips, trail mixes, rice cakes and soy chips. | U.S. Liquid Refreshment Beverage Category Share % Retail Sales in Measured Channels (1)(2) |
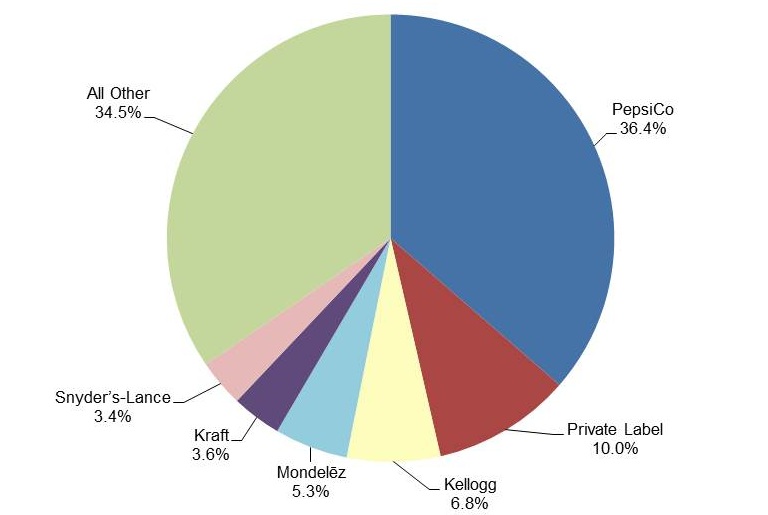 | 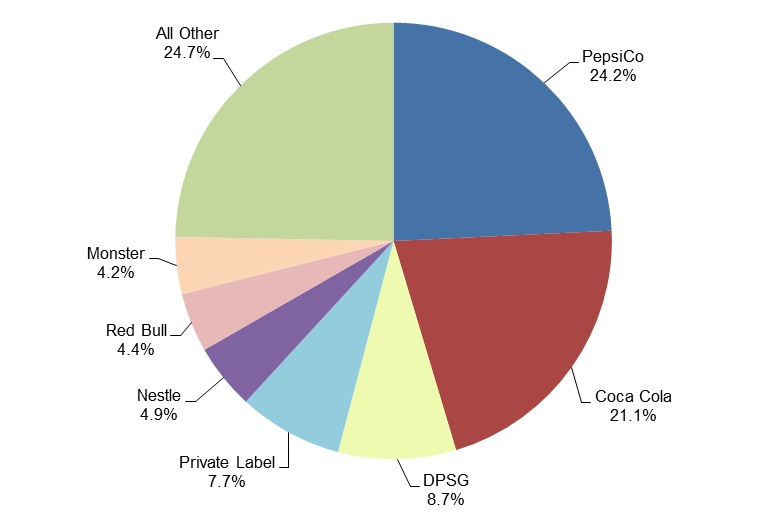 |
(1) | The categories and category share information in the charts above are through December 2014 based on data provided and verified by Information Resources, Inc. (IRI). The above charts include data from most major retail chains (including Wal-Mart) but exclude data from certain retailers that do not report to this service. |
(2) | Does not sum due to rounding. |
Research and Development
We engage in a variety of research and development activities and continue to invest to accelerate growth to drive innovation globally. These activities principally involve production, processing and packaging and include: development of new ingredients and products; reformulation and improvement in the quality of existing products; improvement and modernization of manufacturing processes; improvements in product quality, safety and integrity; development of, and improvements in, packaging technology and dispensing equipment; and efforts focused on identifying opportunities to transform, grow and broaden our product portfolio, including the development of sweetener alternatives and flavor modifiers to reduce added sugar, and recipes that allow us to reduce sodium levels in certain of our products. Our research centers are located around the world, including in Brazil, China, Germany, India, Mexico, Russia, the United Arab Emirates, the United Kingdom and the United States, and leverage nutrition science, food science, engineering and consumer insights to meet our strategy to develop nutritious, convenient beverages, foods and snacks. In 2014, we continued to refine our beverage, food and snack portfolio to meet changing consumer needs by developing a broader portfolio of product choices, including building on our important nutrition platforms and brands – Quaker (grains), Tropicana (fruits and vegetables), Gatorade (sports nutrition for athletes) and Naked Juice (super-premium juice and protein smoothies) – and expanding our portfolio of nutritious products in growing categories, such as dairy, hummus and other fresh dips, and baked grain snacks. We also made investments to minimize our impact on the environment, including innovation in our packaging to make it increasingly sustainable, and developed and implemented new technologies to enhance the quality and value of our current and future products, as well as made investments to incorporate into our operations best practices and technology to support sustainable agriculture and to minimize our impact on the environment. We continue to make investments to conserve energy and raw materials, reduce waste in our facilities, recycle containers, use renewable resources and optimize package design to use fewer materials. Consumer research is excluded from research and development costs and included in other marketing costs. Research and development costs were $718 million , $ 665 million and $552 million in 2014 , 2013 and 2012 , respectively, and are reported within selling, general and administrative expenses. See also "Item 1A. Risk Factors – Demand for our products may be adversely affected by changes in consumer preferences or any inability on
8
Table of Contents
our part to innovate or market our products effectively and any significant reduction in demand could adversely affect our business, financial condition or results of operations."
Regulatory Environment and Environmental Compliance
The conduct of our businesses, including the production, storage, distribution, sale, display, advertising, marketing, labeling, quality and safety of our products, occupational safety and health practices, transportation and use of many of our products, are subject to various laws and regulations administered by federal, state and local governmental agencies in the United States, as well as to laws and regulations administered by government entities and agencies outside the United States in markets in which our products are made, manufactured, distributed or sold. It is our policy to abide by the laws and regulations around the world that apply to our businesses.
We are required to comply with a variety of U.S. laws and regulations, including but not limited to: the Federal Food, Drug and Cosmetic Act and various state laws governing food safety; the Food Safety Modernization Act; the Occupational Safety and Health Act; the Clean Air Act; the Clean Water Act; the Resource Conservation and Recovery Act; the Comprehensive Environmental Response, Compensation and Liability Act; the Federal Motor Carrier Safety Act; the Lanham Act; various federal and state laws and regulations governing competition and trade practices; various federal and state laws and regulations governing our employment practices, including those related to equal employment opportunity, such as the Equal Employment Opportunity Act and the National Labor Relations Act; customs and foreign trade laws and regulations; and laws regulating the sale of certain of our products in schools. In our business dealings, we are also required to comply with the Foreign Corrupt Practices Act, the U.K. Bribery Act and the Trade Sanctions Reform and Export Enhancement Act. We are also subject to various state and local statutes and regulations, including state consumer protection laws such as Proposition 65 in California which requires that, unless a safe harbor level exists and has been met, a specific warning appear on any product that contains a substance listed by the State of California as having been found to cause cancer or birth defects. See also "Item 1A. Risk Factors – Changes in the legal and regulatory environment could limit our business activities, increase our operating costs, reduce demand for our products or result in litigation."
We are also subject to numerous similar and other laws and regulations outside the United States, including but not limited to laws and regulations governing food safety, health and safety, anti-corruption and data privacy. In many jurisdictions, compliance with competition laws is of special importance to us due to our competitive position in those jurisdictions, as is compliance with anti-corruption laws. We rely on legal and operational compliance programs, as well as in-house and outside counsel, to guide our businesses in complying with applicable laws and regulations of the countries in which we do business. See also "Item 1A. Risk Factors – Changes in the legal and regulatory environment could limit our business activities, increase our operating costs, reduce demand for our products or result in litigation." and "Item 1A. Risk Factors – Our business, financial condition or results of operations could be adversely affected if we are unable to grow our business in developing and emerging markets or as a result of unstable political conditions, civil unrest or other developments and risks in the markets where our products are made, manufactured, distributed or sold."
Certain jurisdictions in which our products are sold have either imposed, or are considering imposing, taxes or other limitations on, or regulations pertaining to, the sale of certain of our products, ingredients or substances contained in our products or commodities used in the production of our products, including certain of our products that contain added sugar, exceed specified caloric content or include specified ingredients such as caffeine; this includes regulations imposing additional labeling requirements. For example, in 2014, Mexico imposed a tax on sugar-sweetened beverages and certain packaged foods. In addition, certain jurisdictions require or are considering proposals to require labeling of foods that are, or contain ingredients that are, genetically modified and to restrict the use of benefit programs, such as the Supplemental Nutrition Assistance
9
Table of Contents
Program, to purchase certain beverages and foods. In addition, legislation has been enacted in certain U.S. states and in certain other countries in which our products are sold that requires collection and recycling of containers or that prohibits the sale of our beverages in certain non-refillable containers, unless a deposit or other fee is charged. It is possible that similar or more restrictive legal requirements may be proposed or enacted in the future. In addition, we are subject to taxes in the United States and numerous foreign jurisdictions. Economic and political conditions may result in changes in tax rates which could affect our financial performance. See also "Item 1A. Risk Factors – Changes in the legal and regulatory environment could limit our business activities, increase our operating costs, reduce demand for our products or result in litigation." and "Item 1A. Risk Factors – Imposition of new taxes, disagreements with tax authorities or additional tax liabilities could adversely affect our business, financial condition or results of operations."
The cost of compliance with U.S. and foreign laws does not have a material financial impact on our consolidated results of operations.
We are also subject to national and local environmental laws in the United States and in foreign countries in which we do business, including laws related to water consumption and treatment, wastewater discharge and air emissions. In the United States, our facilities must comply with the Clean Air Act, the Comprehensive Environmental Response, Compensation and Liability Act, the Resource Conservation and Recovery Act and other federal and state laws regarding handling, storage, release and disposal of wastes generated on-site and sent to third-party owned and operated off-site licensed facilities and our facilities outside the United States must comply with similar laws and regulations. Our policy is to meet all applicable environmental compliance requirements, and we have internal programs in place to enhance our global environmental compliance. We have made, and plan to continue making, necessary expenditures for compliance with applicable laws. While these expenditures have not had a material impact on our business, financial condition or results of operations, changes in environmental compliance requirements, and any expenditures necessary to comply with such requirements, could affect our financial performance. In addition, we and our subsidiaries are subject to environmental remediation obligations in the normal course of business, as well as remediation and related indemnification obligations in connection with certain historical activities and contractual obligations, including those of businesses acquired by our subsidiaries. While these environmental and indemnification obligations cannot be predicted with certainty, environmental compliance costs have not had, and are not expected to have, a material impact on our capital expenditures, earnings or competitive position. See also "Item 1A. Risk Factors – Changes in the legal and regulatory environment could limit our business activities, increase our operating costs, reduce demand for our products or result in litigation."
The Iran Threat Reduction and Syria Human Rights Act of 2012 (ITRA) requires disclosure of certain activities relating to Iran by PepsiCo or its affiliates that occurred during our 2014 fiscal year. As previously disclosed, one of our foreign subsidiaries historically maintained a small office in Iran, which provided sales support to independent bottlers in Iran in connection with in-country sales of foreign-owned beverage brands, and which was not in contravention of any applicable U.S. sanctions laws. The office ceased all commercial activity since the enactment of ITRA. In addition, the office of the foreign subsidiary had one local bank account, containing aggregate deposits of approximately $180, with a bank identified on the list of "Specially Designated Nationals" maintained by the U.S. Treasury Department's Office of Foreign Assets Control (OFAC). During our 2014 fiscal year, our foreign subsidiary received a license from OFAC authorizing it to engage in activities related to the winding down of the office in Iran and to close the bank account. Following receipt of this license, our foreign subsidiary restarted the process of winding down its office and closed the bank account. Subsequent to the end of 2014 , this license expired and the foreign subsidiary ceased the process of winding down its office upon expiration of the license. The foreign subsidiary has applied for a license from OFAC to authorize continuation and completion of wind-down activities and intends to continue such activities upon receipt thereof. The foreign subsidiary did not engage in any activities in Iran other than wind-down activities in 2014 , or have any revenues or profits attributable to activities in Iran during 2014 .
10
Table of Contents
Employees
As of December 27, 2014 , we employed approximately 271,000 people worldwide, including approximately 107,000 people within the United States. Our employment levels are subject to seasonal variations. We or our subsidiaries are a party to numerous collective bargaining agreements. We expect that we will be able to renegotiate these collective bargaining agreements on satisfactory terms when they expire. We believe that relations with our employees are generally good.
Available Information
We are required to file annual, quarterly and current reports, proxy statements and other information with the U.S. Securities and Exchange Commission (SEC). The public may read and copy any materials that we file with the SEC at the SEC's Public Reference Room at 100 F Street, N.E., Washington, D.C. 20549. Information on the operation of the Public Reference Room may be obtained by calling the SEC at 1-800-SEC-0330. In addition, the SEC maintains an Internet site that contains reports, proxy and information statements, and other information regarding issuers that file electronically with the SEC at http://www.sec.gov .
Our Annual Reports on Form 10-K, Quarterly Reports on Form 10-Q, Current Reports on Form 8-K, proxy statements and amendments to those documents filed or furnished pursuant to Section 13(a) or 15(d) of the Securities Exchange Act of 1934, as amended (Exchange Act), are also available free of charge on our Internet site at http://www.pepsico.com as soon as reasonably practicable after such reports are electronically filed with or furnished to the SEC. The information on our website is not, and shall not be deemed to be, a part hereof or incorporated into this or any of our other filings with the SEC.
Item 1A. Risk Factors.
In addition to the other information set forth in this Annual Report on Form 10-K, you should carefully consider the following factors that could have a material adverse effect on our business, financial condition, results of operations or the price of our common stock. The following information should be read together and in conjunction with "Forward-Looking Statements," "Item 1. Business," "Item 7. Management's Discussion and Analysis of Financial Condition and Results of Operations," our consolidated financial statements and the accompanying notes thereto. The risks below are not the only risks we face. Additional risks and uncertainties not currently known to us or that we currently deem to be immaterial may also adversely affect our business, financial condition, results of operations or the price of our common stock.
Demand for our products may be adversely affected by changes in consumer preferences or any inability on our part to innovate or market our products effectively and any significant reduction in demand could adversely affect our business, financial condition or results of operations.
We are a global food and beverage company operating in highly competitive categories and we rely on continued demand for our products. To generate revenues and profits, we must sell products that appeal to our customers and to consumers. Any significant changes in consumer preferences or any inability on our part to anticipate or react to such changes could result in reduced demand for our products and erosion of our competitive and financial position and could adversely affect our business, financial condition or results of operations. Our success depends on: our ability to anticipate and effectively respond to shifts in consumer trends, including increased demand for products that meet the needs of consumers who are concerned with health and wellness, convenience and location of origin or source of the products they consume; our product quality; our ability to extend our portfolio of convenient beverages, foods and snacks in growing markets; our ability to develop or acquire new products that are responsive to certain consumer preferences, including reducing sodium, added sugars and saturated fat; our ability to develop a broader portfolio of product choices and increase non-carbonated beverage offerings and alternatives to traditional carbonated beverage offerings;
11
Table of Contents
our ability to develop sweetener innovation; our ability to improve the production and packaging of our products; and our ability to respond to competitive product and pricing pressures. For example, our growth rate may be adversely affected if we are unable to maintain or grow our current share of the liquid refreshment beverage market in North America, or our current share of the snacks market globally, or if demand for our products does not grow in developing and emerging markets.
In general, changes in product category consumption or consumer demographics could result in reduced demand for our products. Consumer preferences may evolve due to a variety of factors, including: the aging of the general population; consumer concerns or perceptions regarding the nutrition profile of certain of our products, including their caloric content, or perceptions (whether or not valid) regarding the health effects of ingredients or substances present in certain of our products, such as 4-MeI, acrylamide, artificial sweeteners, caffeine, high-fructose corn syrup, saturated fat, sodium, sugar, trans fats or other product ingredients, substances or attributes, including genetically modified ingredients; packaging materials; changes in package or portion size; changes in in-home consumption patterns; changes in social trends that impact travel, vacation or leisure activity patterns; changes in weather patterns or seasonal consumption cycles; negative publicity (whether or not valid) resulting from regulatory action, litigation against us or other companies in our industry or negative or inaccurate posts or comments in the media, including social media, about us, our products or advertising campaigns and marketing programs; consumer perception of social media posts or other information disseminated by us or our employees, agents, customers, suppliers, bottlers, distributors, joint venture partners or other third parties; consumer perception of our employees, agents, customers, suppliers, bottlers, distributors, joint venture partners or other third parties or the business practices of such parties; a downturn in economic conditions; or taxes or other restrictions imposed on our products.
"Our business, financial condition or results of operations could suffer if we are unable to compete effectively.", "Unfavorable economic conditions may have an adverse impact on our business, financial condition or results of operations." and "Any damage to our reputation or brand image could adversely affect our business, financial condition or results of operations."
Our continued success is also dependent on our product and marketing innovation, including: maintaining a robust pipeline of new products; improving the quality of existing products; and the effectiveness of our product packaging, advertising campaigns and marketing programs, including our ability to successfully adapt to a rapidly changing media environment, including through use of social media and online advertising campaigns and marketing programs.
Although we devote significant resources to the actions mentioned above, there can be no assurance as to our continued ability to develop, launch and maintain successful new products or variants of existing products, our ability to introduce new products or variants of existing products in a timely manner or our ability to correctly anticipate or effectively react to changes in consumer preference or develop and effectively execute advertising and marketing campaigns that appeal to consumers. Our failure to make the right strategic investments to drive innovation or successfully launch new products or variants of existing products could decrease demand for our existing products by negatively affecting consumer perception of existing brands and may result in inventory write-offs and other costs that could adversely affect our business, financial condition or results of operations. See also "Any damage to our reputation or brand image could adversely affect our business, financial condition or results of operations."
12
Table of Contents
Changes in the legal and regulatory environment could limit our business activities, increase our operating costs, reduce demand for our products or result in litigation.
The conduct of our businesses, including the production, storage, distribution, sale, display, advertising, marketing, labeling, transportation and use of many of our products, as well as our health and safety practices, are subject to various laws and regulations administered by federal, state and local governmental agencies in the United States, as well as to laws and regulations administered by government entities and agencies outside the United States in markets in which our products are made, manufactured, distributed or sold. Many of these laws and regulations may have differing or conflicting legal standards across the various markets where our products are made, manufactured, distributed or sold and, in certain markets, such as developing and emerging markets, may be less developed or certain. In addition, these laws and regulations and interpretations thereof may change, sometimes dramatically, as a result of a variety of factors, including political, economic or social events. Such changes may include changes in: food and drug laws; laws related to product labeling, advertising and marketing practices; laws regarding the import or export of our products or ingredients used in our products; laws and programs restricting the sale and advertising of certain of our products; laws and programs aimed at reducing, restricting or eliminating ingredients or substances in, or attributes of, certain of our products; laws and programs aimed at discouraging the consumption or altering the package or portion size of certain of our products, including laws imposing restrictions on the use of government programs, such as the Supplemental Nutrition Assistance Program, to purchase certain of our products; increased regulatory scrutiny of, and increased litigation involving product claims and concerns regarding the effects on health of ingredients or substances in, or attributes of, certain of our products, including without limitation those found in energy drinks; state consumer protection laws; taxation requirements, including the imposition or proposed imposition of new or increased taxes or other limitations on the sale of our products; competition laws; anti-corruption laws; employment laws; privacy laws; laws regulating the price we may charge for our products; laws regulating access to and use of water or utilities; and environmental laws, including laws relating to the regulation of water rights, treatment and discharge of wastewater and air emissions.
New laws, regulations or governmental policy and their related interpretations, or changes in any of the foregoing, including taxes or other limitations on the sale of our products, ingredients or substances contained in, or attributes of, our products or commodities used in the production of our products, may alter the environment in which we do business and, therefore, may increase our costs or liabilities or reduce demand for our products, which could adversely affect our business, financial condition or results of operations.
Governmental entities or agencies in jurisdictions where our products are made, manufactured, distributed or sold may also impose new labeling, product or production requirements, or other restrictions. If one jurisdiction imposes or proposes to impose new requirements or restrictions, other jurisdictions may follow and the requirements or restrictions, or proposed requirements or restrictions, may result in adverse publicity (whether or not valid). For example, if one jurisdiction imposes a specific labeling requirement or requires a specific warning on any product that contains certain ingredients or substances, other jurisdictions may react and impose restrictions on products containing the same ingredients or substances, which may result in adverse publicity or increased concerns about the health implications of consumption of such ingredients or substances in our products (whether or not valid). In addition, studies are underway by third parties to assess the health implications of consumption of certain ingredients or substances present in certain of our products, such as 4-MeI, acrylamide, caffeine and sugar. If consumer concerns, whether or not valid, about the health implications of consumption of ingredients or substances present in certain of our products increase as a result of these studies, new scientific evidence, new labeling, product or production requirements or other restrictions, or for any other reason, including adverse publicity as a result of any of the foregoing, or if we are required to add warning labels to any of our products or place warnings in locations where our products are sold, demand for our products could decline, or we could be subject to lawsuits or new regulations
13
Table of Contents
that could affect sales of our products, any of which could adversely affect our business, financial condition or results of operations.
In many jurisdictions, compliance with competition laws is of special importance to us due to our competitive position in those jurisdictions, as is compliance with anti-corruption laws. In addition, regulatory authorities under whose laws we operate may have enforcement powers that can subject us to actions such as product recall, seizure of products or other sanctions, which could have an adverse effect on our sales or damage our reputation. Although we have policies and procedures in place that are designed to promote legal and regulatory compliance, our employees, suppliers, or other third parties with whom we do business could take actions, intentional or not, that violate these policies and procedures or applicable laws or regulations. Violations of these laws or regulations could subject us to criminal or civil enforcement actions, including fines, penalties, disgorgement of profits or activity restrictions, any of which could adversely affect our business, financial condition or results of operations.
In addition, we and our subsidiaries are party to a variety of legal and environmental remediation obligations arising in the normal course of business, as well as environmental remediation, product liability, toxic tort and related indemnification proceedings in connection with certain historical activities and contractual obligations, including those of businesses acquired by our subsidiaries. Due to regulatory complexities, uncertainties inherent in litigation and the risk of unidentified contaminants on current and former properties of ours and our subsidiaries, the potential exists for remediation, liability and indemnification costs to differ materially from the costs we have estimated. We cannot guarantee that our costs in relation to these matters will not exceed our established liabilities or otherwise have an adverse effect on our business, financial condition or results of operations.
See also "Item 1. Business – Regulatory Environment and Environmental Compliance.", "Imposition of new taxes, disagreements with tax authorities or additional tax liabilities could adversely affect our business, financial condition or results of operations.", "Our business, financial condition or results of operations could suffer if we are unable to compete effectively.", "Our business, financial condition or results of operations could be adversely affected if we are unable to grow our business in developing and emerging markets or as a result of unstable political conditions, civil unrest or other developments and risks in the markets where our products are made, manufactured, distributed or sold.", "Product contamination or tampering or issues or concerns with respect to product quality, safety and integrity could adversely affect our business, financial condition or results of operations." and "Any damage to our reputation or brand image could adversely affect our business, financial condition or results of operations."
Imposition of new taxes, disagreements with tax authorities or additional tax liabilities could adversely affect our business, financial condition or results of operations.
Our products are made, manufactured, distributed or sold in more than 200 countries and territories. As such, we are subject to tax laws and regulations of various federal, state and local governments in the United States, as well as to tax laws and regulations outside the United States. The imposition or proposed imposition of new or increased taxes or other limitations on the sale of our products, ingredients or substances contained in our products or commodities used in the production of our products, could increase the cost of our products, reduce overall consumption of our products, lead to negative publicity (whether or not valid) or leave consumers with the perception that our products do not meet their health and wellness needs, which could adversely affect our business, financial condition or results of operations. If one jurisdiction imposes new or increased taxes or limitations, other jurisdictions may follow, which may result in adverse publicity or increased concerns about the health implications of consumption of our products (whether or not valid).
In addition, we are subject to regular reviews, examinations and audits by the Internal Revenue Service (IRS) and other taxing authorities with respect to income and non-income based taxes both within and outside the
14
Table of Contents
United States. Economic and political pressures to increase tax revenues in jurisdictions in which we operate, or the adoption of new or reformed tax legislation or regulation, may make resolving tax disputes more difficult and the final resolution of tax audits and any related litigation could differ from our historical provisions and accruals resulting in an adverse impact on our business, financial condition or results of operations.
Our operations outside the United States generate a significant portion of our net revenue and repatriation of foreign earnings to the United States could adversely affect our business, financial condition or results of operations. In addition, key representatives of the U.S. government have made public statements that tax reform is a priority and many countries outside the United States, including countries in which we have significant operations, are actively considering changes to existing tax laws. Changes in how U.S. multinational corporations are taxed on foreign earnings could adversely affect our business, financial condition or results of operations. See also "Item 1. Business – Regulatory Environment and Environmental Compliance." and "Demand for our products may be adversely affected by changes in consumer preferences or any inability on our part to innovate or market our products effectively and any significant reduction in demand could adversely affect our business, financial condition or results of operations.", "Changes in the legal and regulatory environment could limit our business activities, increase our operating costs, reduce demand for our products or result in litigation.", "Our business, financial condition or results of operations could be adversely affected if we are unable to grow our business in developing and emerging markets or as a result of unstable political conditions, civil unrest or other developments and risks in the markets where our products are made, manufactured, distributed or sold." and "Any damage to our reputation or brand image could adversely affect our business, financial condition or results of operations."
Our business, financial condition or results of operations could suffer if we are unable to compete effectively.
Our beverage, food and snack products are in highly competitive industries and markets and compete against products of international beverage, food and snack companies that, like us, operate in multiple geographic areas, as well as regional, local and private label manufacturers and other competitors. We compete with other large companies in each of the beverage, food and snack categories, including The Coca-Cola Company, DPSG, Kellogg Company, Kraft Foods Group, Inc., Mondelēz International, Inc., Monster Beverage Corporation, Nestlé S.A., Red Bull GmbH and Snyder's-Lance, Inc. In many countries in which our products are sold, including the United States, our primary beverage competitor is The Coca-Cola Company.
Our beverage, food and snack products compete primarily on the basis of brand recognition, taste, price, quality, product variety, distribution, advertising, marketing and promotional activity, packaging, convenience, service and the ability to anticipate and effectively respond to consumer trends. If we are unable to effectively promote our existing products or introduce new products, if our advertising or marketing campaigns are not effective or if we are otherwise unable to compete effectively, we may be unable to grow or maintain sales or gross margins in the global market or in various local markets, which may adversely affect our business, financial condition or results of operations. See also "Unfavorable economic conditions may have an adverse impact on our business, financial condition or results of operations." and "Our business, financial condition or results of operations may be adversely affected by increased costs, disruption of supply or shortages of raw materials and other supplies."
15
Table of Contents
Our business, financial condition or results of operations could be adversely affected if we are unable to grow our business in developing and emerging markets or as a result of unstable political conditions, civil unrest or other developments and risks in the markets where our products are made, manufactured, distributed or sold.
Our operations outside of the United States, particularly in Russia, Mexico, Canada, the United Kingdom and Brazil, contribute significantly to our revenue and profitability, and we believe that these countries and developing and emerging markets, particularly China, India and the Latin America, Africa and Middle East regions, present important future growth opportunities for us. However, there can be no assurance that our existing products, variants of our existing products or new products that we make, manufacture, distribute or sell will be accepted or be successful in any particular developing or emerging market, due to local or global competition, product price, cultural differences, consumer preferences or otherwise. The following factors could reduce demand for our products, or otherwise adversely affect our business, financial condition or results of operations: unstable economic, political or social conditions, acts of war, terrorist acts, and civil unrest in areas where our products are sold, including Russia, Ukraine, Venezuela and the Middle East; increased competition; a slowdown in growth and the related impact on other countries who export to these markets; our inability to acquire businesses, form strategic business alliances or to make necessary infrastructure investments; our inability to complete divestitures or refranchisings; imposition of new or increased sanctions against, or other regulations restricting contact with, countries in markets in which our products are made, manufactured, distributed or sold, such as Russia, or imposition of new or increased sanctions against U.S. multinational corporations operating in these markets; foreign ownership restrictions; nationalization of our assets; restrictions on the import or export of our products or ingredients or substances used in our products; regulations on the transfer of funds to and from foreign countries, which, from time to time, result in significant cash balances in foreign countries, such as Venezuela; regulations on the repatriation of funds currently held in foreign jurisdictions to the United States; highly inflationary currency, devaluation or fluctuation, such as the devaluation of the Russian ruble, Venezuelan bolivar, Argentine peso, Ukrainian hryvnia and Turkish lira; the lack of well-established or reliable legal systems; imposition of new or increased labeling, product or production requirements, or other restrictions; and increased costs of doing business due to compliance with complex foreign and United States laws and regulations that apply to our international operations, including the Foreign Corrupt Practices Act, the U.K. Bribery Act and the Trade Sanctions Reform and Export Enhancement Act, and adverse consequences, such as the assessment of fines or penalties, for any failure to comply with these laws and regulations. If we are unable to expand our businesses in developing and emerging markets, or achieve the return on capital we expect from our investments, our business, financial condition or results of operations could be adversely affected. See also "Item 1. Business – Regulatory Environment and Environmental Compliance.", "Demand for our products may be adversely affected by changes in consumer preferences or any inability on our part to innovate or market our products effectively and any significant reduction in demand could adversely affect our business, financial condition or results of operations.", "Changes in the legal and regulatory environment could limit our business activities, increase our operating costs, reduce demand for our products or result in litigation.", "Our business, financial condition or results of operations could suffer if we are unable to compete effectively.", "Business disruptions could have an adverse impact on our business, financial condition or results of operations." and "Failure to successfully complete or integrate acquisitions and joint ventures into our existing operations, or to complete or manage divestitures or refranchisings, could adversely affect our business, financial condition or results of operations."
Unfavorable economic conditions may have an adverse impact on our business, financial condition or results of operations.
Many of the countries in which we operate, including the United States and certain countries in Europe and Latin America, have experienced and continue to experience unfavorable economic conditions. Our business
16
Table of Contents
or financial results may be adversely impacted by these unfavorable economic conditions, including: adverse changes in interest rates, tax laws or tax rates; volatile commodity markets; highly inflationary currency, devaluation or fluctuation; contraction in the availability of credit in the marketplace due to legislation or other economic conditions; the effects of government initiatives to manage economic conditions, including changes to or cessation of any such initiatives; reduced demand for our products resulting from a slow-down in the general global economy or a shift in consumer preferences for economic reasons or otherwise to regional, local or private label products or other economy products, or to less profitable channels; or a decrease in the fair value of pension or post-retirement assets that could increase future employee benefit costs and/or funding requirements of our pension or post-retirement plans. An adverse change in any of the above factors could have a negative impact on the fair value of our intangible assets, which could require us to record a non-cash impairment charge. In addition, we cannot predict how current or worsening economic conditions will affect our customers, consumers, suppliers, bottlers, distributors, joint venture partners or other third parties and any negative impact on any of the foregoing may also have an adverse impact on our business, financial condition or results of operations.
In addition, some of the major financial institutions with which we execute transactions, including U.S. and non-U.S. commercial banks, insurance companies, investment banks and other financial institutions, may be exposed to a ratings downgrade, bankruptcy, liquidity, default or similar risks as a result of unfavorable economic conditions or other factors beyond our control. A ratings downgrade, bankruptcy, receivership, default or similar event involving a major financial institution may limit the availability of credit or willingness of financial institutions to extend credit on terms commercially acceptable to us or at all or, with respect to financial institutions that are parties to our financing arrangements, leave us with reduced borrowing capacity or exposed to certain currencies or price risk associated with forecasted purchases of raw materials, or result in a decline in the market value of our investments in debt securities, which could have an adverse impact on our business, financial condition or results of operations.
See also "Our business, financial condition or results of operations may be adversely affected by increased costs, disruption of supply or shortages of raw materials and other supplies.", "Imposition of new taxes, disagreements with tax authorities or additional tax liabilities could adversely affect our business, financial condition or results of operations." and "Our borrowing costs and access to capital and credit markets may be adversely affected by a downgrade or potential downgrade of our credit ratings."
Our business, financial condition or results of operations may be adversely affected by increased costs, disruption of supply or shortages of raw materials and other supplies.
We and our business partners use various raw materials and other supplies in our business. The principal ingredients we use in our beverage, food and snack products are apple, orange and pineapple juice and other juice concentrates, aspartame, corn, corn sweeteners, flavorings, flour, grapefruit and other fruits, oats, oranges, potatoes, raw milk, rice, seasonings, sucralose, sugar, vegetable and essential oils, and wheat. We also use water in the manufacturing of our products. Our key packaging materials include plastic resins, including PET and polypropylene resin used for plastic beverage bottles and film packaging used for snack foods, aluminum used for cans, glass bottles, closures, cardboard and paperboard cartons. Fuel and natural gas are also important commodities for us due to their use in our facilities and in the trucks delivering our products.
Some of these raw materials and supplies are sourced from countries experiencing civil unrest, political instability or other unfavorable economic conditions, and some are available from a limited number of suppliers or are in short supply when seasonal demand is at its peak. The raw materials and energy, including fuel, that we use for the manufacturing, production and distribution of our products are largely commodities that are subject to price volatility and fluctuations in availability caused by many factors, including changes
17
Table of Contents
in global supply and demand, weather conditions, disease, agricultural uncertainty, governmental incentives and controls, political uncertainties or governmental instability. Shortage of some of these raw materials and other supplies, sustained interruption in their supply or an increase in their costs could adversely affect our business, financial condition or results of operations. Many of our ingredients, raw materials and commodities are purchased in the open market. The prices we pay for such items are subject to fluctuation, and we manage this risk through the use of fixed-price contracts and purchase orders, pricing agreements and derivatives. If commodity price changes result in unexpected or significant increases in raw materials and energy costs, we may not be able to increase our product prices or effectively hedge against commodity price increases to offset these increased costs without suffering reduced volume, revenue, margins and operating results. In addition, certain of the derivatives used to hedge price risk do not qualify for hedge accounting treatment and therefore can result in increased volatility in our net earnings in any given period due to changes in the spot prices of the underlying commodities.
Water is also a limited resource in many parts of the world. The lack of available water of acceptable quality and increasing pressure to conserve water in areas of scarcity and stress may lead to supply chain disruption, adverse effects on our operations or higher production costs that could adversely affect our business, financial condition or results of operations.
See also "Changes in the legal and regulatory environment could limit our business activities, increase our operating costs, reduce demand for our products or result in litigation.", "Unfavorable economic conditions may have an adverse impact on our business, financial condition or results of operations.", "Climate change, or legal, regulatory or market measures to address climate change, may negatively affect our business and operations." and "Market Risks" contained in "Item 7. Management's Discussion and Analysis of Financial Condition and Results of Operations" and Note 10 to our consolidated financial statements.
Failure to realize anticipated benefits from our productivity initiatives or global operating model could have an adverse impact on our business, financial condition or results of operations.
Our future success and earnings growth depend in part on our ability to reduce costs and improve efficiencies. Our productivity initiatives help fund our growth initiatives and contribute to our results of operations. We are implementing strategic plans that we believe will position our business for future success and long-term sustainable growth by allowing us to achieve a lower cost structure and operate more efficiently in the highly competitive beverage, food and snack industries. We are also continuing to implement our global operating model to improve efficiency, decision making, innovation and brand management across the global PepsiCo organization to enable us to compete effectively. In order to capitalize on our cost reduction efforts and our global operating model, it will be necessary to make certain investments in our business, which may be limited due to capital constraints. In addition, it is critical that we have the appropriate personnel in place to continue to lead and execute our plans. If we are unable to successfully implement our productivity initiatives, fail to implement these initiatives as timely as we anticipate, do not achieve expected savings as a result of these initiatives or incur higher than expected or unanticipated costs in implementing these initiatives, or fail to identify and implement additional productivity opportunities in the future, our business, financial condition or results of operations could be adversely impacted.
Business disruptions could have an adverse impact on our business, financial condition or results of operations.
Our ability, and that of our suppliers and other third parties, including our independent bottlers, contract manufacturers, joint venture partners, independent distributors and retailers, to make, manufacture, transport, distribute and sell products is critical to our success. Damage or disruption to our or their operations due to any of the following could impair the ability to make, manufacture, transport, distribute or sell our products: adverse weather conditions or natural disaster, such as a hurricane, earthquake or flooding; government
18
Table of Contents
action; economic or political uncertainties or instability in countries in which our products are made, manufactured, distributed or sold; fire; terrorism; outbreak or escalation of armed hostilities; health epidemics or pandemics; cybersecurity incidents; industrial accidents or other occupational health and safety issues; telecommunications failures; power or water shortages; strikes and other labor disputes; or other reasons beyond our control or the control of our suppliers and other third parties. Failure to take adequate steps to mitigate the likelihood or potential impact of such events, or to effectively manage such events if they occur, could adversely affect our business, financial condition or results of operations, as well as require additional resources to restore our operations.
Product contamination or tampering or issues or concerns with respect to product quality, safety and integrity could adversely affect our business, financial condition or results of operations.
Product contamination or tampering, the failure to maintain high standards for product quality, safety and integrity, including with respect to raw materials and ingredients obtained from suppliers, or allegations of product quality issues, mislabeling, misbranding, spoilage, allergens or contamination, even if untrue, may reduce demand for our products or cause production and delivery disruptions, which could adversely affect our business, financial condition or results of operations. If any of our products are mislabeled or become unfit for consumption or cause injury, illness or death, or if appropriate resources are not devoted to product quality and safety (particularly as we expand our portfolio into new categories) or to comply with changing food safety requirements, our products may be subject to a product recall and/or be subject to liability or government action, which could result in payment of damages or fines, cause certain of our products to be unavailable for a period of time or result in adverse publicity, which could reduce consumer demand and brand equity. We could also be adversely affected if consumers lose confidence in product quality, safety and integrity generally. Any of the foregoing could adversely affect our business, financial condition or results of operations. See also "Any damage to our reputation or brand image could adversely affect our business, financial condition or results of operations."
Any damage to our reputation or brand image could adversely affect our business, financial condition or results of operations.
We are a leading global beverage, food and snack company with brands that are respected household names throughout the world. Maintaining a good reputation globally is critical to selling our branded products. Our reputation or brand image could be adversely impacted by any of the following, or by adverse publicity (whether or not valid) relating thereto: the failure to maintain high ethical, social and environmental practices for all of our operations and activities or failure to require our suppliers or other third parties to do so; the failure to achieve our goal of continuing to refine our beverage, food and snack choices to meet changing consumer demands by reducing sodium, added sugars and saturated fat and developing a broader portfolio of product choices; health concerns (whether or not valid) about our products or particular ingredients or substances in, or attributes of, our products, including whether certain of our products contribute to obesity; the imposition or proposed imposition of new or increased taxes or other limitations on the sale or advertising of our products; any failure to comply, or perception of a failure to comply, with our policies and goals, including those regarding advertising to children and reducing calorie consumption from sugary drinks; our research and development efforts; our environmental impact, including use of agricultural materials, packaging, water, energy use and waste management or any failure to achieve our goals with respect to minimizing our impact on the environment; the practices of our employees, agents, customers, distributors, suppliers, bottlers, joint venture partners or other third parties with respect to any of the foregoing; consumer perception of our advertising campaigns or marketing programs; consumer perception of our use of social media; or our responses to any of the foregoing or negative publicity as a result of any of the foregoing.
19
Table of Contents
In addition, we operate globally, which requires us to comply with numerous local regulations, including, without limitation, anti-corruption laws, competition laws and tax laws and regulations of the jurisdictions in which our products are made, manufactured, distributed or sold. In the event that our employees engage in improper activities, we may be subject to enforcement actions, litigation, loss of sales or other consequences, which may cause us to suffer damage to our reputation in the United States or abroad. Failure to comply with local laws and regulations, to maintain an effective system of internal controls or to provide accurate and timely financial information could also hurt our reputation. In addition, water is a limited resource in many parts of the world and demand for water continues to rise. Our reputation could be damaged if we or others in our industry do not act, or are perceived not to act, responsibly with respect to water use.
Further, the rising popularity of social media and other consumer-oriented technologies has increased the speed and accessibility of information dissemination. As a result, negative or inaccurate posts or comments about us, our products, policies, practices or advertising campaigns and marketing programs, our use of social media or of posts or other information disseminated by us or our employees, agents, customers, suppliers, bottlers, distributors, joint venture partners or other third parties, or consumer perception of any of the foregoing, may also generate adverse publicity that could damage our reputation.
Damage to our reputation or brand image or loss of consumer confidence in our products for any of these or other reasons could result in decreased demand for our products and could adversely affect our business, financial condition or results of operations, as well as require additional resources to rebuild our reputation. See also "Demand for our products may be adversely affected by changes in consumer preferences or any inability on our part to innovate or market our products effectively and any significant reduction in demand could adversely affect our business, financial condition or results of operations.", "Changes in the legal and regulatory environment could limit our business activities, increase our operating costs, reduce demand for our products or result in litigation.", "Imposition of new taxes, disagreements with tax authorities or additional tax liabilities could adversely affect our business, financial condition or results of operations." and "Our business, financial condition or results of operations may be adversely affected by increased costs, disruption of supply or shortages of raw materials and other supplies.
Failure to successfully complete or integrate acquisitions and joint ventures into our existing operations, or to complete or manage divestitures or refranchisings, could adversely affect our business, financial condition or results of operations.
We regularly review our portfolio of businesses and evaluate potential acquisitions, joint ventures, divestitures, refranchisings and other strategic transactions. Potential issues associated with these activities could include, among other things: our ability to realize the full extent of the benefits or cost savings that we expect to realize as a result of the completion of an acquisition, divestiture or refranchising, or the formation of a joint venture, within the anticipated time frame, or at all; receipt of necessary consents, clearances and approvals in connection with an acquisition, joint venture, divestiture or refranchising; and diversion of management's attention from day-to-day operations.
With respect to acquisitions, the following also pose potential risks: our ability to successfully combine our businesses with the business of the acquired company, including integrating the manufacturing, distribution, sales and administrative support activities and information technology systems between us and the acquired company and our ability to successfully operate in new categories or territories; motivating, recruiting and retaining executives and key employees; conforming standards, controls (including internal control over financial reporting, environmental compliance and health and safety compliance), procedures and policies, business cultures and compensation structures between us and the acquired company; consolidating and streamlining corporate and administrative infrastructures; consolidating sales and marketing operations; retaining existing customers and attracting new customers; identifying and eliminating redundant and
20
Table of Contents
underperforming operations and assets; coordinating geographically dispersed organizations; managing tax costs or inefficiencies associated with integrating our operations following completion of the acquisitions; and other unanticipated problems and liabilities.
With respect to joint ventures, we share ownership and management responsibility with one or more parties who may or may not have the same goals, strategies, priorities or resources as we do and joint ventures are intended to be operated for the benefit of all co-owners, rather than for our exclusive benefit. In addition, acquisitions and joint ventures outside of the United States increase our exposure to risks associated with operations outside of the United States, including fluctuations in exchange rates and compliance with the Foreign Corrupt Practices Act and other anti-corruption and anti-bribery laws, and laws and regulations outside the United States.
With respect to divestitures and refranchisings, we may not be able to complete such transactions on terms commercially favorable to us or at all. Further, as divestitures and refranchisings may reduce our direct control over certain aspects of our business, any failure to maintain good relations with divested or refranchised businesses in our supply or sales chain may adversely impact sales or business performance.
If an acquisition or joint venture is not successfully completed or integrated into our existing operations, or if a divestiture or refranchising is not successfully completed or managed or does not result in the benefits we expect, our business, financial condition or results of operations may be adversely affected.
If we are unable to hire or retain key employees or a highly skilled and diverse workforce, it could have a negative impact on our business, financial condition or results of operations.
Our continued growth requires us to hire, retain and develop our leadership bench and a highly skilled and diverse workforce. We compete to hire new employees and then must train them and develop their skills and competencies. Any unplanned turnover or our failure to develop an adequate succession plan to backfill current leadership positions, including the Chief Executive Officer, or to hire and retain a diverse workforce could deplete our institutional knowledge base and erode our competitive advantage or result in increased costs due to increased competition for employees, higher employee turnover or increased employee benefit costs. Any of the foregoing could have a negative impact on our business, financial condition or results of operations.
The loss of any key customer or changes to the retail landscape could adversely affect our business, financial condition or results of operations.
We must maintain mutually beneficial relationships with our key customers, including Wal-Mart, as well as other retailers, to effectively compete. The loss of any of our key customers could adversely affect our business, financial condition or results of operations. In addition, our industry has been affected by changes to the retail landscape, including increased consolidation of retail ownership, particularly in North America and Europe, resulting in large retailers with increased purchasing power, which may impact our ability to compete in these areas. Such retailers may demand lower pricing and increased promotional programs. Further, should larger retailers increase utilization of their own distribution networks, other distribution channels such as e-commerce, or private label brands, the competitive advantages we derive from our go-to market systems and brand equity may be eroded. Failure to appropriately respond to any such actions or to offer effective sales incentives and marketing programs to our customers could reduce our ability to secure adequate shelf space at our retailers and adversely affect our business, financial condition or results of operations. In addition, if we are unable to resolve a dispute with any of our key customers, or if there is a change in the business condition (financial or otherwise) of any of our key customers, even if unrelated to us, our business, financial condition or results of operations may be adversely affected. See also "Our Customers," contained in "Item 1. Business."
21
Table of Contents
Our borrowing costs and access to capital and credit markets may be adversely affected by a downgrade or potential downgrade of our credit ratings.
We expect to maintain Tier 1 commercial paper access which we believe will ensure appropriate financial flexibility and ready access to global credit markets at favorable interest rates. Any downgrade of our credit ratings by a credit rating agency, especially any downgrade to below investment grade, whether as a result of our actions or factors which are beyond our control, could increase our future borrowing costs and impair our ability to access capital and credit markets on terms commercially acceptable to us, or at all. Further, any downgrade of our current short-term credit ratings could impair our ability to access the commercial paper market with the same flexibility that we have experienced historically, and therefore require us to rely more heavily on more expensive types of debt financing. Our borrowing costs and access to the commercial paper market could also be adversely affected if a credit rating agency announces that our ratings are under review for a potential downgrade. See also "Unfavorable economic conditions may have an adverse impact on our business, financial condition or results of operations." and "Our Liquidity and Capital Resources" contained in "Item 7. Management's Discussion and Analysis of Financial Condition and Results of Operations."
Our business and reputation could suffer if we are unable to protect our information systems against, or effectively respond to, cybersecurity incidents or if our information systems are otherwise disrupted.
We depend on information technology, including public websites and cloud-based services, for many activities important to our business, including to interface with our customers and consumers, to engage in digital marketing activities, to enable and improve the effectiveness of our operations, to order and manage materials from suppliers, to maintain financial accuracy and efficiency, to comply with regulatory, financial reporting, legal and tax requirements, to collect and store sensitive data and confidential information, and to communicate electronically among our global operations and with our employees and the employees of our independent bottlers, contract manufacturers, joint ventures, suppliers and other third parties. As with other large and prominent companies, we are regularly subject to cyberattacks and such attempts are occurring more frequently, are constantly evolving in nature and are becoming more sophisticated. If we do not allocate and effectively manage the resources necessary to build and sustain our information technology infrastructure, if we fail to timely identify or appropriately respond to cybersecurity incidents, or if our information systems are damaged, destroyed or shut down (whether as a result of natural disasters, fires, power outages, acts of terrorism or other catastrophic events, network outages, software, equipment or telecommunications failures, user errors, or from deliberate cyberattacks such as malicious or disruptive software, denial of service attacks, malicious social engineering, hackers or otherwise), our business could be disrupted and we could, among other things, be subject to: transaction errors; processing inefficiencies; the loss of, or failure to attract new, customers and consumers; the loss of revenues from unauthorized use, acquisition or disclosure of or access to confidential information; the loss of or damage to intellectual property or trade secrets, including the loss or unauthorized disclosure of sensitive data, confidential information or other assets; damage to our reputation; litigation; regulatory enforcement actions; violation of data privacy, security or other laws and regulations; and remediation costs. Further, our information systems and the information stored therein, could be compromised by, and we could experience similar adverse consequences due to, unauthorized outside parties intent on accessing or extracting sensitive data or confidential information, corrupting information or disrupting business processes or by inadvertent or intentional actions by our employees or agents. Similar risks exist with respect to the third-party vendors we rely upon for aspects of our information technology support services and administrative functions, including payroll processing, health and benefit plan administration and certain finance and accounting functions. See also "Any damage to our reputation or brand image could adversely affect our business, financial condition or results of operations." and "If we are not able to successfully implement shared services or utilize information technology systems and networks effectively, our ability to conduct our business might be negatively impacted."
22
Table of Contents
If we are not able to successfully implement shared services or utilize information technology systems and networks effectively, our ability to conduct our business might be negatively impacted.
We have entered into agreements with third-party service providers to share certain information technology support services and administrative functions, including payroll processing, health and benefit plan administration and certain finance and accounting functions, and may enter into agreements to share services for other functions in the future to achieve cost savings and efficiencies. In addition, we utilize cloud-based services and systems and networks managed by third-party vendors to process, transmit and store information and to conduct certain of our business activities and transactions with employees, customers, consumers and other third parties. If any of these third-party service providers or vendors do not perform effectively, or if we fail to adequately monitor their performance, we may not be able to achieve the expected cost savings and may have to incur additional costs to correct errors made by such service providers and our reputation could be harmed. Depending on the function involved, such errors may also lead to business disruption, processing inefficiencies, the loss of or damage to intellectual property or sensitive data through security breach or otherwise, litigation or remediation costs, or damage to our reputation and could have a negative impact on employee morale. See also "Any damage to our reputation or brand image could adversely affect our business, financial condition or results of operations." and "Our business and reputation could suffer if we are unable to protect our information systems against, or effectively respond to, cybersecurity incidents or if our information systems are otherwise disrupted."
We have also embarked on a multi-year business transformation initiative to migrate certain of our systems, including our financial processing systems, to enterprise-wide systems solutions. If we do not allocate and effectively manage the resources necessary to build and sustain the proper information technology infrastructure, or if we fail to achieve the expected benefits from this initiative, it may impact our ability to process transactions accurately and efficiently and remain in step with the changing needs of the trade, which could result in the loss of customers or consumers. In addition, the failure to either deliver the applications on time, or anticipate the necessary readiness and training needs, could lead to business disruption and loss of customers or consumers and revenue.
Fluctuations in exchange rates may have an adverse impact on our business, financial condition or results of operations.
We hold assets and incur liabilities, earn revenues and pay expenses in a variety of currencies other than the U.S. dollar. Because our consolidated financial statements are presented in U.S. dollars, the financial statements of our subsidiaries outside the United States, where the functional currency is other than the U.S. dollar, are translated into U.S. dollars. Our operations outside of the United States, particularly in Russia, Mexico, Canada, the United Kingdom and Brazil, generate a significant portion of our net revenue. In addition, we purchase many of the ingredients, raw materials and commodities used in our business in numerous markets and in numerous currencies. Fluctuations in exchange rates may therefore adversely impact our business, financial condition or results of operations. See also "Market Risks" contained in "Item 7. Management's Discussion and Analysis of Financial Condition and Results of Operations" and Notes 1 and 10 to our consolidated financial statements.
Climate change, or legal, regulatory or market measures to address climate change, may negatively affect our business and operations.
There is concern that carbon dioxide and other greenhouse gases in the atmosphere may have an adverse impact on global temperatures, weather patterns and the frequency and severity of extreme weather and natural disasters. In the event that such climate change has a negative effect on agricultural productivity, we may be subject to decreased availability or less favorable pricing for certain commodities that are necessary for our products, such as sugar cane, corn, wheat, rice, oats, potatoes and various fruits. As a result of climate
23
Table of Contents
change, we may also be subjected to decreased availability of water, deteriorated quality of water or less favorable pricing for water, which could adversely impact our manufacturing and distribution operations. In addition, natural disasters and extreme weather conditions may disrupt the productivity of our facilities or the operation of our supply chain.
The increasing concern over climate change also may result in new or increased regional, federal and/or global legal and regulatory requirements to reduce or mitigate the effects of greenhouse gases. In the event that such regulation is more aggressive than the measures that we are currently undertaking to monitor our emissions and improve our energy efficiency, we may experience significant increases in our costs of operation and delivery and we may be required to make additional investments in facilities and equipment. In particular, increasing regulation of fuel emissions could substantially increase the cost of energy, including fuel, required to operate our facilities or transport and distribute our products, thereby substantially increasing the distribution and supply chain costs associated with our products. As a result, the effects of climate change could negatively affect our business and operations. See also "Demand for our products may be adversely affected by changes in consumer preferences or any inability on our part to innovate or market our products effectively and any significant reduction in demand could adversely affect our business, financial condition or results of operations.", "Changes in the legal and regulatory environment could limit our business activities, increase our operating costs, reduce demand for our products or result in litigation.", "Our business, financial condition or results of operations may be adversely affected by increased costs, disruption of supply or shortages of raw materials and other supplies." and "Business disruptions could have an adverse impact on our business, financial condition or results of operations."
A portion of our workforce belongs to unions. Failure to successfully negotiate collective bargaining agreements, or strikes or work stoppages could cause our business to suffer.
Many of our employees are covered by collective bargaining agreements and other employees may seek to be covered by collective bargaining agreements. Strikes or work stoppages or other business interruptions could occur if we are unable to renew these agreements on satisfactory terms or enter into new agreements on satisfactory terms, which could impair manufacturing and distribution of our products or result in a loss of sales, which could adversely impact our business, financial condition or results of operations. The terms and conditions of existing, renegotiated or new collective bargaining agreements could also increase our costs or otherwise affect our ability to fully implement future operational changes to enhance our efficiency or to adapt to changing business needs or strategy.
Our intellectual property rights could be infringed or challenged and reduce the value of our products and brands and have an adverse impact on our business, financial condition or results of operations.
We possess intellectual property rights that are important to our business. These intellectual property rights include ingredient formulas, trademarks, copyrights, patents, business processes and other trade secrets that are important to our business and relate to a variety of our products, their packaging, the processes for their production and the design and operation of various equipment used in our businesses. We protect our intellectual property rights globally through a combination of trademark, copyright, patent and trade secret laws, third-party assignment and nondisclosure agreements and monitoring of third-party misuses of our intellectual property. If we fail to obtain or adequately protect our ingredient formulas, trademarks, copyrights, patents, business processes and other trade secrets, or if there is a change in law that limits or removes the current legal protections of our intellectual property, the value of our products and brands could be reduced and there could be an adverse impact on our business, financial condition or results of operations. See also "Changes in the legal and regulatory environment could limit our business activities, increase our operating costs, reduce demand for our products or result in litigation."
24
Table of Contents
Potential liabilities and costs from litigation or legal proceedings could have an adverse impact on our business, financial condition or results of operations.
We and our subsidiaries are party to a variety of legal claims and proceedings in the ordinary course of business, including but not limited to litigation related to our advertising, marketing or commercial practices, product labels, claims and ingredients, and environmental, employment and insurance matters. Since litigation is inherently uncertain, there is no guarantee that we will be successful in defending ourselves against such claims or proceedings, or that management's assessment of the materiality of these matters, including the reserves taken in connection therewith, will be consistent with the ultimate outcome of such claims or proceedings. In the event that management's assessment of materiality of current claims and proceedings proves inaccurate or litigation that is material arises in the future, there may be a material adverse effect on our business, financial condition or results of operations. See also "Any damage to our reputation or brand image could adversely affect our business, financial condition or results of operations."
Many factors may adversely affect the price of our common stock and our business, financial condition or results of operations.
Many factors may adversely affect the price of our common stock and our business, financial condition or results of operations. Such factors, some of which are beyond our control, may include, but are not limited to: unfavorable economic conditions; changes in financial or tax reporting and changes in accounting principles or practices that materially affect our reported financial condition and results; investor perceptions of our performance; actions by shareholders or others seeking to influence our business strategies; speculation by the media or investment community regarding our business; trading activity in our common stock or trading activity in derivative instruments with respect to our common stock; and the impact of our share repurchase programs or dividend rate. In addition, corporate actions, such as those we may or may not take from time to time as part of our continuous review of our corporate structure, including as a result of business, legal and tax considerations, may not have the impact we intend and may adversely affect the price of our common stock and our business, financial condition or results of operations. The above factors, as well as other risks included in this Item 1A. Risk Factors, could adversely affect the price of our common stock and our business, financial condition or results of operations.
Item 1B. Unresolved Staff Comments.
We have received no written comments regarding our periodic or current reports from the staff of the SEC that were issued 180 days or more preceding the end of our 2014 fiscal year and that remain unresolved.
Item 2. Properties.
Our principal executive offices, which we own, are located in Purchase, New York. These offices continue to undergo renovations to improve technology and energy efficiency, and to make necessary infrastructure repairs and improvements. We expect these renovations to be completed in 2015. Our executive offices and our data center in Plano, Texas, which we own, are our most significant corporate properties.
25
Table of Contents
Each of our divisions utilize plants, warehouses, distribution centers, offices and other facilities in connection with making, marketing, selling and distributing our products. The approximate number of such facilities utilized by each division is as follows:
| FLNA (a) |
| QFNA |
| LAF |
| PAB |
| Europe |
| AMEA (b) |
| Shared (c) |
Plants (d) | 40 |
| 5 |
| 55 |
| 75 |
| 110 |
| 50 |
| 6 |
Other Facilities (e) | 1,700 |
| 2 |
| 605 |
| 465 |
| 425 |
| 490 |
| 60 |
(a) Excludes three snack plants and one office that are utilized by FLNA's joint venture with Strauss Group, all of which are owned or leased by the joint venture.
(b) Excludes properties utilized in connection with AMEA's strategic alliance with Tingyi that are owned or leased by Tingyi.
(c) Shared properties are in addition to the other properties reported by our six divisions identified in this table. QFNA shares 12 warehouse and distribution centers with PAB and FLNA. QFNA also shares 15 warehouse and distribution centers and one plant with PAB, as well as one research and development laboratory. FLNA shares one plant with LAF. PAB, Europe and AMEA share two plants and a service center. Europe and AMEA share a research and development facility. PAB and AMEA share two concentrate plants. In addition, approximately 30 offices support shared functions.
(d) Includes manufacturing and processing plants as well as bottling and production plants.
(e) Includes warehouses, distribution centers, offices including division headquarters, research and development facilities and other facilities.
Significant properties by division included in the table above are as follows:
• | FLNA's research facility in Plano, Texas, which is owned. |
• | QFNA's snack plant in Cedar Rapids, Iowa, which is owned. |
• | LAF's four snack plants in Brazil (Guarulhos) and the Mexican cities of Celaya, Monterrey and Mexico City (Vallejo), all of which are owned. |
• | PAB's concentrate plants in Cork, Ireland, its research and development facility in Valhalla, New York, and a Tropicana plant in Bradenton, Florida, all of which are owned. |
• | Europe's snack plant in Leicester, United Kingdom, which is leased, and its snack research and development facility in Leicester, United Kingdom, its beverage plant in Lebedyan, Russia and its dairy plant in Moscow, Russia, all of which are owned. |
• | AMEA's beverage plants in Sixth of October City, Egypt, Rayong, Thailand and Amman, Jordan, and its snack plants in Sixth of October City, Egypt, which are owned, and Riyadh, Saudi Arabia, which is leased. |
• | Shared service centers in Winston-Salem, North Carolina, and Plano, Texas, which are primarily shared by our FLNA, QFNA and PAB divisions, both of which are leased. |
Leases of plants in North America generally are on a long-term basis, expiring at various times, with options to renew for additional periods. Most international plants are owned or leased on a long-term basis. In addition to company-owned or leased properties described above, we also utilize a highly distributed network of plants, warehouses and distribution centers that are owned or leased by our contract manufacturers, co-packers, strategic alliances or joint ventures in which we have an equity interest. We believe that our properties generally are in good operating condition and, taken as a whole, are suitable, adequate and of sufficient capacity for our current operations.
26
Table of Contents
Item 3. Legal Proceedings.
As previously disclosed, on January 6, 2011, Wojewodzka Inspekcja Ochrony Srodowiska, the Polish environmental control authority (the Polish Authority), began an audit of a bottling plant of our subsidiary, Pepsi-Cola General Bottlers Poland SP, z.o.o. (PCGB), in Michrow, Poland. On February 18, 2011, the Polish Authority alleged that in 2009 the plant was not in compliance with applicable regulations requiring the use of approved laboratories for the analysis of the plant's waste and sought monetary sanctions of $700,000. As previously disclosed, PCGB appealed this decision and, on January 15, 2013, the Supreme Administrative Court issued a final, non-appealable decision finding that the sanctions against PCGB were imposed in violation of applicable environmental law and released PCGB from all liability with respect to such sanctions. On July 30, 2013, the Polish Authority alleged that the plant was not in compliance in 2009 with applicable regulations governing the taking of water samples for analysis of the plant's waste and sought monetary sanctions of $650,000. PCGB has appealed this decision and the appeal is pending.
Also as previously disclosed, on May 8, 2011, Kozep-Duna-Volgyi Kornyezetvedelmi, Termeszetvedelmi es Vizugyi Felugyeloseg (Budapest), the regional Hungarian governmental authority (the Hungarian Authority), notified our subsidiary, Fovarosi Asvanyviz-es Uditoipari Zrt. (FAU), that it assessed monetary sanctions of approximately $220,000 for alleged violation of applicable wastewater discharge standards in 2010. Also as previously disclosed, on August 9, 2012, the Hungarian Authority notified FAU that it assessed monetary sanctions of approximately $153,000 for alleged violation of applicable wastewater discharge standards in 2011. Following an appeal of this decision by FAU, the Orszagos Kornyezetvedelmi, Termeszetvedelmi es Vizugyi Felugyeloseg (Budapest) increased the 2011 sanctions to $320,000 and the 2012 sanctions to $196,000, on the grounds that certain pollutant factors had not been taken into account by the Hungarian Authority. FAU has appealed these decisions and the appeals are pending at the Fovarosi Kozigazgatasi es Munkaugyi Birosag (Budapest).
In addition, we and our subsidiaries are party to a variety of legal, administrative, regulatory and government proceedings, claims and inquiries arising in the normal course of business. While the results of these proceedings, claims and inquiries cannot be predicted with certainty, management believes that the final outcome of the foregoing will not have a material adverse effect on our consolidated financial statements, results of operations or cash flows. See also "Item 1. Business – Regulatory Environment and Environmental Compliance." and "Item 1A. Risk Factors – Changes in the legal and regulatory environment could limit our business activities, increase our operating costs, reduce demand for our products or result in litigation.", "Item 1A. Risk Factors – Imposition of new taxes, disagreements with tax authorities or additional tax liabilities could adversely affect our business, financial condition or results of operations.", "Item 1A. Risk Factors – Our business, financial condition or results of operations could be adversely affected if we are unable to grow our business in developing and emerging markets or as a result of unstable political conditions, civil unrest or other developments and risks in the markets where our products are made, manufactured, distributed or sold." and "Item 1A. Risk Factors – Potential liabilities and costs from litigation or legal proceedings could have an adverse impact on our business, financial condition or results of operations."
Item 4. Mine Safety Disclosures.
Not applicable.
__________________________________________________
27
Table of Contents
Executive Officers of the Registrant
The following is a list of names, ages and backgrounds of our current executive officers:
Name | Age | Title |
Albert P. Carey | 63 | Chief Executive Officer, PepsiCo Americas Beverages |
Sanjeev Chadha | 55 | Chief Executive Officer, PepsiCo Asia, Middle East and Africa |
Marie T. Gallagher | 55 | Senior Vice President and Controller, PepsiCo |
Thomas Greco | 56 | Chief Executive Officer, Frito-Lay North America |
Enderson Guimaraes | 55 | Executive Vice President, Global Categories and Operations |
Hugh F. Johnston | 53 | Executive Vice President and Chief Financial Officer, PepsiCo |
Dr. Mehmood Khan | 56 | Vice Chairman, PepsiCo; Executive Vice President, PepsiCo Chief Scientific Officer, Global Research and Development |
Ramon Laguarta | 51 | Chief Executive Officer, PepsiCo Europe |
Laxman Narasimhan | 47 | Chief Executive Officer, PepsiCo Latin America Foods |
Indra K. Nooyi | 59 | Chairman of the Board of Directors and Chief Executive Officer, PepsiCo |
Cynthia M. Trudell | 61 | Executive Vice President, Human Resources and Chief Human Resources Officer, PepsiCo |
Tony West | 49 | Executive Vice President, Government Affairs, General Counsel and Corporate Secretary, PepsiCo |
Albert P. Carey
, 63, was appointed Chief Executive Officer, PepsiCo Americas Beverages in September 2011. He served as President and Chief Executive Officer of Frito-Lay North America from June 2006 to September 2011. Mr. Carey began his career with Frito-Lay in 1981 where he spent 20 years in a variety of roles. He served as President, PepsiCo Sales from February 2003 until June 2006. Prior to that, he served as Chief Operating Officer, PepsiCo Beverages and Foods North America from June 2002 to February 2003 and as PepsiCo's Senior Vice President, Sales and Retailer Strategies from August 1998 to June 2002.Sanjeev Chadha
, 55, was appointed to the role of Chief Executive Officer, PepsiCo Asia, Middle East and Africa in September 2013. Mr. Chadha was President of PepsiCo's Middle East and Africa region from January 2011 to September 2013 and President of PepsiCo's India region from 2009 to December 2010. Mr. Chadha joined PepsiCo in 1989 and has held a variety of senior positions with the Company. He served as Senior Vice President – Commercial, Asia Pacific, including China and India, Senior General Manager, Vietnam and the Philippines, and held other leadership roles in sales, marketing, innovation and franchise.Marie T. Gallagher
, 55, was appointed PepsiCo's Senior Vice President and Controller in May 2011. Ms. Gallagher joined PepsiCo in 2005 as Vice President and Assistant Controller. Prior to joining PepsiCo, Ms. Gallagher was Assistant Controller at Altria Corporate Services from 1992 to 2005 and, prior to that, a senior manager at Coopers & Lybrand.Thomas Greco
, 56, was appointed Chief Executive Officer of Frito-Lay North America in September 2014. Mr. Greco served as Executive Vice President, PepsiCo and President, Frito-Lay North America from September 2011 to September 2014. Prior to that, Mr. Greco served as Executive Vice President and Chief Commercial Officer for Pepsi Beverages Company. Mr. Greco joined PepsiCo in Canada in 1986, and has served in a variety of positions, including Region Vice President, Midwest; President, Frito-Lay Canada; Senior Vice President, Sales, Frito-Lay North America; President, Global Sales, PepsiCo; and Executive Vice President, Sales, North America Beverages.28
Table of Contents
Enderson Guimaraes
, 55, was appointed Executive Vice President, Global Categories and Operations effective January 2015. Mr. Guimaraes served as Chief Executive Officer, PepsiCo Europe from September 2012 to January 2015 and as President of PepsiCo Global Operations from October 2011 to September 2012. Before PepsiCo, Mr. Guimaraes served as Executive Vice President of Electrolux and Chief Executive Officer of its major appliances business in Europe, Africa and the Middle East from 2008 to 2011. He also spent 10 years at Philips Electronics, from 1998 to 2007, first as a regional marketing executive in Brazil and ultimately as Senior Vice President, head of Global Marketing Management and general manager of the WidiWall LED display business. He also served as CEO of Philips' Lifestyle Incubator group, an innovation engine which created new businesses and developed them over several years. Earlier, Mr. Guimaraes worked in various marketing positions at Danone and Johnson & Johnson.Hugh F. Johnston
, 53, was appointed Executive Vice President and Chief Financial Officer, PepsiCo in March 2010. In December 2014, Mr. Johnston also assumed responsibility for the Company's global e-commerce business and Quaker Foods North America division. He previously held the position of Executive Vice President, Global Operations since November 2009 and the position of President of Pepsi-Cola North America since November 2007. He was formerly PepsiCo's Executive Vice President, Operations, a position he held from October 2006 until November 2007. From April 2005 until October 2006, Mr. Johnston was PepsiCo's Senior Vice President, Transformation. Prior to that, he served as Senior Vice President and Chief Financial Officer of PepsiCo Beverages and Foods from November 2002 through March 2005, and as PepsiCo's Senior Vice President of Mergers and Acquisitions from March 2002 until November 2002. Mr. Johnston joined PepsiCo in 1987 as a Business Planner and held various finance positions until 1999 when he left to join Merck & Co., Inc. as Vice President, Retail, a position which he held until he rejoined PepsiCo in 2002. Prior to joining PepsiCo in 1987, Mr. Johnston was with General Electric Company in a variety of finance positions.Dr. Mehmood Khan
, 56, was appointed Executive Vice President, PepsiCo Chief Scientific Officer, Global Research and Development in May 2012 and Vice Chairman, PepsiCo in February 2015. He previously held the position of Chief Executive Officer of PepsiCo's Global Nutrition Group since November 2010 and the position of PepsiCo's Chief Scientific Officer since 2008. Prior to joining PepsiCo, Dr. Khan served for five years at Takeda Pharmaceuticals in various leadership roles including President of Research and Development and Chief Medical Officer. Dr. Khan also served at the Mayo Clinic until 2003 as the director of the Diabetes, Endocrinology and Nutrition Clinical Unit and as Consultant Physician in Endocrinology.Ramon Laguarta
, 51, was appointed Chief Executive Officer, PepsiCo Europe effective January 2015. Mr. Laguarta served as President, Developing & Emerging Markets, PepsiCo Europe from 2012 to January 2015 and as President, PepsiCo Eastern Europe Region from 2008 to 2012. Mr. Laguarta joined PepsiCo in 1996 as a marketing vice president for Spain Snacks and served in a variety of positions, including as Commercial Vice President of PepsiCo Europe from 2006 to 2008, General Manager for Iberia Snacks and Juices from 2002 to 2006 and General Manager for Greece Snacks from 1999 to 2001. Prior to joining PepsiCo in 1996, Mr. Laguarta worked for Chupa Chups, S.A., where he worked in several international assignments in Europe and the United States.Laxman Narasimhan
, 47, was appointed Chief Executive Officer, PepsiCo Latin America Foods in September 2014. From 2012 to September 2014, Mr. Narasimhan served as Senior Vice President and Chief Financial Officer of PepsiCo Americas Foods, a business unit that had previously included the Company's Frito-Lay North America, Quaker Foods North America and Latin America Foods divisions. Prior to joining PepsiCo in 2012, Mr. Narasimhan spent 19 years at McKinsey & Company, where he served in various positions, including as a director and location manager of the New Delhi office and co-leader of the global consumer and shopper insights practice.29
Table of Contents
Indra K. Nooyi
, 59, has been PepsiCo's Chief Executive Officer since 2006 and assumed the role of Chairman of PepsiCo's Board of Directors in 2007. She was elected to PepsiCo's Board of Directors and became President and Chief Financial Officer in 2001, after serving as Senior Vice President and Chief Financial Officer since 2000. Ms. Nooyi also served as PepsiCo's Senior Vice President, Corporate Strategy and Development from 1996 until 2000, and as PepsiCo's Senior Vice President, Strategic Planning from 1994 until 1996. Prior to joining PepsiCo, Ms. Nooyi spent four years as Senior Vice President of Strategy, Planning and Strategic Marketing for Asea Brown Boveri, Inc. She was also Vice President and Director of Corporate Strategy and Planning at Motorola, Inc.Cynthia M. Trudell
, 61, has been Executive Vice President, Human Resources and Chief Human Resources Officer, PepsiCo since April 2011 and was PepsiCo's Senior Vice President, Chief Personnel Officer from February 2007 until April 2011. Ms. Trudell served as a director of PepsiCo from January 2000 until February 2007. She was formerly Vice President of Brunswick Corporation and President of Sea Ray Group from 2001 until 2006. From 1999 until 2001, Ms. Trudell served as Vice President of General Motors (GM), and Chairman and President of Saturn Corporation, a wholly owned subsidiary of GM. Ms. Trudell began her career with the Ford Motor Co. as a chemical process engineer. In 1981, she joined GM and held various engineering and manufacturing supervisory positions. In 1995, she became plant manager at GM's Wilmington Assembly Center in Delaware. In 1996, she became President of IBC Vehicles in Luton, England, a joint venture between General Motors and Isuzu.Tony West
, 49, was appointed PepsiCo's Executive Vice President, Government Affairs, General Counsel and Corporate Secretary effective November 2014. Prior to joining PepsiCo, Mr. West served as Associate Attorney General of the United States from 2012 to 2014, after previously serving as the Assistant Attorney General for the Civil Division in the U.S. Department of Justice from 2009 to 2012. From 2001 to 2009, Mr. West was a partner at Morrison & Foerster LLP. He also served as Special Assistant Attorney General at the California Department of Justice from 1999 to 2001 and, prior to that, as an Assistant United States Attorney in the Northern District of California.Executive officers are elected by our Board of Directors, and their terms of office continue until the next annual meeting of the Board or until their successors are elected and have qualified. There are no family relationships among our executive officers.
30
Table of Contents
PART II
Item 5. Market for Registrant's Common Equity, Related Stockholder Matters and Issuer Purchases of Equity Securities.
Stock Trading Symbol – PEP
Stock Exchange Listings – The New York Stock Exchange is the principal market for our Common Stock, which is also listed on the Chicago Stock Exchange and SIX Swiss Exchange.
Stock Prices – The composite quarterly high and low closing sales prices for PepsiCo Common Stock as reported on the New York Stock Exchange for each fiscal quarter of 2014 and 2013 are contained in our Selected Financial Data included on page 117.
Shareholders – As of February 5, 2015 , there were approximately 137,971 shareholders of record of our Common Stock.
Dividends – We have paid consecutive quarterly cash dividends since 1965. The declaration and payment of future dividends are at the discretion of the Board of Directors. Dividends are usually declared in February, May, July and November and paid at the end of March, June and September and the beginning of January. On February 5, 2015, the Board of PepsiCo declared a quarterly dividend of $0.655 payable March 31, 2015, to shareholders of record on March 6, 2015. For the remainder of 2015 , the dividend record dates for these payments are expected to be June 5, September 4 and December 4, 2015, subject to approval of the Board of Directors. Information with respect to the quarterly dividends declared in 2014 and 2013 is contained in our Selected Financial Data included on page 117.
For information on securities authorized for issuance under our equity compensation plans, see "Item 12. Security Ownership of Certain Beneficial Owners and Management and Related Stockholder Matters."
31
Table of Contents
A summary of our common stock repurchases (in millions, except average price per share) during the fourth quarter of 2014 is set forth in the table below.
Issuer Purchases of Common Stock
Period | Total Number of Shares Repurchased (1) |
| Average Price Paid Per Share |
| Total Number of Shares Purchased as Part of Publicly Announced Plans or Programs |
| Maximum Number (or Approximate Dollar Value) of Shares that May Yet Be Purchased Under the Plans or Programs (2) | ||||||
9/6/14 |
|
| |
|
|
| $ | 5,100 | | ||||
|
|
|
|
|
|
|
| ||||||
9/7/14 - 10/4/14 | 6.7 | |
| $ | 92.54 | |
| 6.7 | |
| (616 | ) | |
|
|
|
|
|
|
| 4,484 | | |||||
10/5/14 - 11/1/14 | 2.5 | |
| $ | 93.99 | |
| 2.5 | |
| (233 | ) | |
|
|
|
|
|
|
| 4,251 | | |||||
11/2/14 - 11/29/14 | 7.1 | |
| $ | 97.74 | |
| 7.1 | |
| (699 | ) | |
|
|
|
|
|
|
| 3,552 | | |||||
11/30/14 - 12/27/14 | 2.0 | |
| $ | 98.79 | |
| 2.0 | |
| (200 | ) | |
Total | 18.3 | |
| $ | 95.46 | |
| 18.3 | |
| $ | 3,352 | |
(1) All shares were repurchased in open market transactions pursuant to the $ 10 billion repurchase program authorized by our Board of Directors and publicly announced on February 14, 2013, which commenced on July 1, 2013 and expires on June 30, 2016.
(2) Does not include shares authorized for repurchase under a new program for repurchases of up to $12 billion of our common stock announced on February 11, 2015, which will commence on July 1, 2015 and expire on June 30, 2018. Such shares may be repurchased in open market transactions, in privately negotiated transactions, in accelerated stock repurchase transactions or otherwise.
32
Table of Contents
In connection with our merger with The Quaker Oats Company (Quaker) in 2001, shares of our convertible preferred stock were authorized and issued to an employee stock ownership plan (ESOP) fund established by Quaker. The preferences, limitations and relative rights of the shares of convertible preferred stock are set forth in Exhibit A to our amended and restated articles of incorporation. Quaker made the final award to the ESOP in June 2001. The Company does not have any authorized, but unissued, "blank check preferred stock." PepsiCo repurchases shares of its convertible preferred stock from the ESOP in connection with share redemptions by ESOP participants.
The following table summarizes our convertible preferred share repurchases during the fourth quarter of 2014 .
Issuer Purchases of Convertible Preferred Stock
Period | Total Number of Shares Repurchased |
| Average Price Paid Per Share |
| Total Number of Shares Purchased as Part of Publicly Announced Plans or Programs |
| Maximum Number (or Approximate Dollar Value) of Shares that May Yet Be Purchased Under the Plans or Programs | |||
9/7/14 - 10/4/14 | 1,200 | |
| $ | 459.87 | |
| N/A |
| N/A |
|
|
|
|
|
|
|
| |||
10/5/14 - 11/1/14 | 1,000 | |
| $ | 472.73 | |
| N/A |
| N/A |
|
|
|
|
|
|
|
| |||
11/2/14 - 11/29/14 | 1,300 | |
| $ | 490.94 | |
| N/A |
| N/A |
|
|
|
|
|
|
|
| |||
11/30/14 - 12/27/14 | 2,800 | |
| $ | 478.72 | |
| N/A |
| N/A |
Total | 6,300 | |
| $ | 476.70 | |
| N/A |
| N/A |
33
Table of Contents
Item 6. Selected Financial Data.
Selected Financial Data is included on page 117.
Item 7. Management's Discussion and Analysis of Financial Condition and Results of Operations.
OUR BUSINESS |
|
Executive Overview | 36 |
Our Operations | 38 |
Our Business Risks | 39 |
OUR CRITICAL ACCOUNTING POLICIES |
|
Revenue Recognition | 43 |
Goodwill and Other Intangible Assets | 44 |
Income Tax Expense and Accruals | 45 |
Pension and Retiree Medical Plans | 46 |
OUR FINANCIAL RESULTS |
|
Items Affecting Comparability | 48 |
Results of Operations – Consolidated Review | 52 |
Results of Operations – Division Review | 55 |
Frito-Lay North America | 57 |
Quaker Foods North America | 58 |
Latin America Foods | 59 |
PepsiCo Americas Beverages | 60 |
PepsiCo Europe | 61 |
PepsiCo Asia, Middle East and Africa | 62 |
Our Liquidity and Capital Resources | 63 |
34
Table of Contents
Consolidated Statement of Income | 67 |
Consolidated Statement of Comprehensive Income | 68 |
Consolidated Statement of Cash Flows | 69 |
Consolidated Balance Sheet | 71 |
Consolidated Statement of Equity | 72 |
Notes to Consolidated Financial Statements |
|
Note 1 – Basis of Presentation and Our Divisions | 73 |
Note 2 – Our Significant Accounting Policies | 77 |
Note 3 – Restructuring, Impairment and Integration Charges | 81 |
Note 4 – Property, Plant and Equipment and Intangible Assets | 84 |
Note 5 – Income Taxes | 87 |
Note 6 – Stock-Based Compensation | 90 |
Note 7 – Pension, Retiree Medical and Savings Plans | 94 |
Note 8 – Related Party Transactions | 101 |
Note 9 – Debt Obligations and Commitments | 102 |
Note 10 – Financial Instruments | 104 |
Note 11 – Net Income Attributable to PepsiCo per Common Share | 108 |
Note 12 – Preferred Stock | 109 |
Note 13 – Accumulated Other Comprehensive Loss Attributable to PepsiCo | 110 |
Note 14 – Supplemental Financial Information | 111 |
Note 15 – Acquisitions and Divestitures | 112 |
MANAGEMENT'S RESPONSIBILITY FOR FINANCIAL REPORTING | 113 |
REPORT OF INDEPENDENT REGISTERED PUBLIC ACCOUNTING FIRM | 115 |
SELECTED FINANCIAL DATA | 117 |
FIVE-YEAR SUMMARY | 118 |
GLOSSARY | 120 |
35
Table of Contents
Our discussion and analysis is intended to help the reader understand our results of operations and financial condition and is provided as an addition to, and should be read in connection with, our consolidated financial statements and the accompanying notes. Definitions of key terms can be found in the glossary beginning on page 120. Tabular dollars are presented in millions, except per share amounts. All per share amounts reflect common stock per share amounts, assume dilution unless otherwise noted, and are based on unrounded amounts. Percentage changes are based on unrounded amounts.
OUR BUSINESS
Executive Overview
We are a leading global food and beverage company with a complementary portfolio of enjoyable brands, including Frito-Lay, Gatorade, Pepsi-Cola, Quaker and Tropicana. Through our operations, authorized bottlers, contract manufacturers and other third parties, we make, market, distribute and sell a wide variety of convenient and enjoyable beverages, foods and snacks, serving customers and consumers in more than 200 countries and territories.
Our management monitors a variety of key indicators to evaluate our business results and financial condition. These indicators include growth in volume, revenue, organic revenue, operating profit, EPS (as reported and excluding certain items and the impact of foreign exchange translation), retail sales, market share, safety, innovation, product and service quality, organizational health, brand equity, media viewership and engagement, employee diversity, net commodity inflation, productivity savings, net capital spending, free cash flow and free cash flow excluding certain items, cash returned to shareholders in the forms of share repurchases and dividends, advertising and marketing expenses, return on invested capital (ROIC), and gross and operating margin change.
During 2014, we continued to take steps to position ourselves for sustainable value creation over the long-term and continued our progress against our key business priorities - brand building, innovation, productivity, execution and talent management. For example, in 2014 we:
• | Drove growth for our retail customers. Among the largest 30 food and beverage manufacturers, PepsiCo was the largest contributor to U.S. retail sales in 2014. |
• | Continued to increase our investment in global research and development. Innovation in 2014 accounted for 9% of our net revenue in 2014, up from approximately 8% since 2012. |
• | Continued our multi-year productivity programs. In 2014, we delivered over $1 billion in productivity savings. |
• | Continued our efforts to harmonize our food and beverage businesses, enhancing the effectiveness of our execution and driving growth for PepsiCo and our customers. In 2014, we launched our largest-ever global campaign for Pepsi and Lay's, cross-promoting these brands in 28 markets. |
• | Continued to expand our globally integrated talent management infrastructure that provides insight into our workforce planning at the global and local levels. In 2014, we continued to enhance PepsiCo University, which helps our associates develop the leadership and functional skills they, and PepsiCo, need to succeed and grow. |
We successfully continued these initiatives during 2014 while returning $8.7 billion to shareholders through dividends and share repurchases.
36
Table of Contents
As we look to 2015 and beyond, we remain focused on positioning our Company for long-term sustainable growth while continuing to deliver strong financial results. Our business strategies are designed to address key challenges facing our Company, including: uncertain macroeconomic conditions, including geopolitical, economic and social instability; evolving consumer tastes and preferences, including continued consumer focus on nutritious products and changes in customer channels, including the growth of e-commerce; and resource scarcity. See also "Item 1A. Risk Factors" for additional information about risks and uncertainties that the Company faces. We believe that many of these challenges create new growth opportunities for our Company. For example, we believe that continued consumer focus on health and wellness and changes in consumer and distribution channels will provide us with new opportunities to expand our product offerings and interact with our customers and consumers. In order to address these challenges and capitalize on these opportunities, we intend to do the following:
Strengthen our presence around the world.
Continued global expansion will be critical to our continued growth. The global middle class is growing rapidly. With three billion people projected to join the middle class in growth markets in the next 20 years, we believe we have the opportunity to continue to expand our business around the world. Although this presents growth opportunities in the long-term, the global economic landscape remains volatile, with many of the markets in which our products are sold continuing to experience unstable economic, political and social conditions. To address these challenges, we plan to continue building a portfolio that is balanced across geographies and categories to help navigate short-term volatility and uncertainty in these markets.
Continue to broaden the range of our product portfolio, including expanding our offerings of more nutritious products.
We anticipate that the consumer demand for convenient, functional nutrition, fruits, vegetables, protein and value-added dairy, local and natural ingredients, and better-for-you snacking and beverage options will continue to grow as consumer tastes and preferences continue to evolve. To meet this growing demand, we plan to continue to grow our portfolio of more nutritious products as well as to reduce added sugar, sodium and saturated fat in certain key brands, while continuing to focus on the great taste consumers expect from our beverages, foods and snacks. At the end of 2014, approximately 20% of our net revenue came from our nutrition businesses. We expect that our increased investments in global research and development will enable us to continue to meet the growing demand for convenient, nutritious products and a broad variety of snack and beverage options.
Continue to adapt to changing customer channels.
Digital technology continues to change the retail landscape and the way in which we interact with retailers, shoppers and consumers. As part of this shift, e-commerce is emerging as a significant factor. To help retailers navigate this changing landscape, and to build relationships with consumers through emerging channels, we plan on increasing our e-commerce presence, developing tailored customer strategies and utilizing the size and scale of our distribution system.
Continue to focus on productivity.
We also intend to focus on productivity and lowering the cost base of the Company over the long term and, by utilizing our global scale, eliminating duplication, deploying new technologies and capitalizing on everyday opportunities to lower our cost base. We achieved our targeted productivity savings of $1 billion for 2014 and have successfully completed the three-year, $3 billion productivity program we launched in 2012. We are focused on our five-year, $5 billion productivity program, which we expect will extend annual savings of $1 billion from 2015 through 2019. This next generation of productivity initiatives will focus on the following areas: increasing automation in our operations to reduce costs and increase capacity; expanding shared services, restructuring our manufacturing operations to optimize our assets and capabilities globally;
37
Table of Contents
restructuring our go-to-market systems to optimize our distribution network; and increasing organizational effectiveness and efficiencies through the ongoing evolution of our operating model.
Continue to embrace sustainable business practices across our supply chain.
We expect the demand for finite natural resources will continue to rise as the global population continues to grow. To address this concern, we plan to continue developing and deploying innovative ways to conserve and replenish water, reduce energy consumption and greenhouse gas emissions, promote sustainable agriculture and decrease waste sent to landfills.
Build and retain top talent.
We expect that the global competition for talent will continue to accelerate. Global companies like PepsiCo need strong general managers in local markets, leaders who can collaborate effectively on multi-disciplinary teams and employees who can solve complex, multi-faceted challenges. To meet the future needs of our business, we remain focused on systematically developing the functional, technical and leadership skills we need for sustainable long-term performance.
Deliver on the promise of Performance with Purpose.
Performance with Purpose is our goal to deliver top-tier financial performance while creating sustainable growth and shareholder value. In practice, Performance with Purpose means providing a wide range of beverages, foods and snacks, from treats to healthy eats; finding innovative ways to minimize our impact on the environment and reduce our operating costs; providing a safe and inclusive workplace for our employees globally; and respecting, supporting and investing in the local communities in which we operate. PepsiCo was again recognized for its leadership in this area in 2014 by earning a place on the prestigious Dow Jones Sustainability World Index for the eighth consecutive year and on the North America Index for the ninth consecutive year.
Our Operations
We are organized into six reportable segments (also referred to as divisions), as follows:
1) | Frito-Lay North America (FLNA); |
2) | Quaker Foods North America (QFNA); |
3) | Latin America Foods (LAF), which includes all of our food and snack businesses in Latin America; |
4) | PepsiCo Americas Beverages (PAB), which includes all of our North American and Latin American beverage businesses; |
5) | PepsiCo Europe (Europe), which includes all beverage, food and snack businesses in Europe and South Africa; and |
6) | PepsiCo Asia, Middle East and Africa (AMEA), which includes all beverage, food and snack businesses in AMEA, excluding South Africa. |
See "Item 1. Business." for more information on our divisions and a description of our distribution network, ingredients and other supplies, brands and intellectual property rights, seasonality, customers and competition. In addition, see Note 1 to our consolidated financial statements for financial information about our divisions and geographic areas.
38
Table of Contents
Our Business Risks
We are subject to risks in the normal course of business. During 2014 and 2013 , certain countries in which our products are sold operated in a challenging environment, experiencing unstable economic and political conditions, civil unrest, debt and credit issues, and currency fluctuations. We continue to monitor the economic, operating and political environment in these markets closely and have identified actions to potentially mitigate the unfavorable impact, if any, on our future results. See also "Risk Factors" in Item 1A., "Executive Overview" above and "Market Risks" below for more information about these risks and the actions we have taken to address key challenges.
Risk Management Framework
The achievement of our strategic and operating objectives involves taking risks. To identify, assess, prioritize, address, manage, monitor and communicate these risks across the Company's operations, we leverage an integrated risk management framework. This framework includes the following:
• | PepsiCo's Board of Directors has oversight responsibility for PepsiCo's integrated risk management framework. One of the Board's primary responsibilities is overseeing and interacting with senior management with respect to key aspects of the Company's business, including risk assessment and risk mitigation of the Company's top risks. The Board receives updates on key risks throughout the year. In addition, the Board has tasked designated Committees of the Board with certain categories of risk management, and the Committees report to the Board regularly on these matters. |
◦ | The Audit Committee of the Board reviews and assesses the guidelines and policies governing PepsiCo's risk management and oversight processes, and assists the Board's oversight of financial, compliance and employee safety risks facing PepsiCo; and |
◦ | The Compensation Committee of the Board periodically reviews PepsiCo's employee compensation policies and practices to assess whether such policies and practices could lead to unnecessary risk-taking behavior. |
• | The PepsiCo Risk Committee (PRC), which is comprised of a cross-functional, geographically diverse, senior management group, meets regularly to identify, assess, prioritize and address our top strategic, financial, operating, business, compliance, safety, reputational and other risks. The PRC is also responsible for reporting progress on our risk mitigation efforts to the Board; |
• | Division Risk Committees (DRC), comprised of cross-functional senior management teams, meet regularly to identify, assess, prioritize and address division-specific business risks; |
• | PepsiCo's Risk Management Office, which manages the overall risk management process, provides ongoing guidance, tools and analytical support to the PRC and the DRCs, identifies and assesses potential risks and facilitates ongoing communication between the parties, as well as with PepsiCo's Board of Directors and the Audit Committee of the Board; |
• | PepsiCo's Corporate Audit Department evaluates the ongoing effectiveness of our key internal controls through periodic audit and review procedures; and |
• | PepsiCo's Compliance & Ethics Department leads and coordinates our compliance policies and practices. |
39
Table of Contents
Market Risks
We are exposed to market risks arising from adverse changes in:
• | commodity prices, affecting the cost of our raw materials and energy; |
• | foreign exchange rates and currency restrictions; and |
• | interest rates. |
In the normal course of business, we manage commodity price, foreign exchange and interest rate risks through a variety of strategies, including productivity initiatives, global purchasing programs and hedging. Ongoing productivity initiatives involve the identification and effective implementation of meaningful cost-saving opportunities or efficiencies, including the use of derivatives. Our global purchasing programs include fixed-price purchase orders and pricing agreements. See "Unfavorable economic conditions may have an adverse impact on our business, financial condition or results of operations." and "Our business, financial condition or results of operations may be adversely affected by increased costs, disruption of supply or shortages of raw materials or other supplies." in "Risk Factors" in Item 1A. See Note 9 to our consolidated financial statements for further information on our non-cancelable purchasing commitments.
The fair value of our derivatives fluctuates based on market rates and prices. The sensitivity of our derivatives to these market fluctuations is discussed below. See Note 10 to our consolidated financial statements for further discussion of these derivatives and our hedging policies. See "Our Critical Accounting Policies" for a discussion of the exposure of our pension and retiree medical plan assets and liabilities to risks related to market fluctuations.
Inflationary, deflationary and recessionary conditions impacting these market risks also impact the demand for and pricing of our products. See "Risk Factors" in Item 1A. for further discussion.
Commodity Prices
Our open commodity derivative contracts had a notional value of $1.2 billion as of December 27, 2014 and $1.4 billion as of December 28, 2013 . At the end of 2014 , the potential change in fair value of commodity derivative instruments, assuming a 10% decrease in the underlying commodity price, would have increased our net unrealized losses in 2014 by $ 103 million .
Foreign Exchange
Our operations outside of the U.S. generate 49% of our net revenue, with Russia, Mexico, Canada, the United Kingdom and Brazil comprising approximately 23% of our net revenue in 2014 . As a result, we are exposed to foreign exchange risks in certain of the international markets in which we operate. In addition, unstable economic, political and social conditions and civil unrest in certain markets in which our products are sold, including in Russia, Ukraine and the Middle East, and currency fluctuations in certain of these international markets, as well as Venezuela (discussed below), Argentina and Turkey continue to result in challenging operating environments. During 2014 , unfavorable foreign exchange reduced net revenue growth by 3 percentage points, primarily due to depreciation of the Russian ruble, Canadian dollar, Venezuelan bolivar, Argentine peso and Mexican peso. Currency declines against the U.S. dollar which are not offset could adversely impact our future results.
The results of our Venezuelan businesses have been reported under highly inflationary accounting since the beginning of our 2010 fiscal year, at which time the functional currency of our Venezuelan entities was changed from the bolivar to the U.S. dollar.
In February 2013, the Venezuelan government devalued the bolivar by resetting the exchange rate of government-operated National Center of Foreign Commerce (CENCOEX) ("fixed exchange rate"), formerly
40
Table of Contents
the Foreign Exchange Administration Board (CADIVI), from 4.3 bolivars per U.S. dollar to 6.3 bolivars per U.S. dollar, resulting in an after-tax net charge of $111 million in the first quarter of 2013 (see "Items Affecting Comparability"). In January 2014, the Venezuelan government announced the expansion of its auction-based foreign exchange system (SICAD 1) to include additional items, including foreign investments. In March 2014, the Venezuelan government introduced an additional auction-based foreign exchange system (SICAD 2) which permitted all companies incorporated or domiciled in Venezuela to bid for U.S. dollars for any purpose. As a result, as of December 27, 2014 , there was a three-tiered exchange rate mechanism in Venezuela, and the SICAD 1 rate was 12 bolivars per U.S. dollar and the SICAD 2 rate was 50 bolivars per U.S. dollar. On February 11, 2015, the Venezuelan government announced that the transactions for the sale or purchase of foreign currency under the SICAD 2 exchange system would no longer be available and created a new open market foreign exchange system (SIMADI).
At December 27, 2014 , we had pending requests with an agency of the Venezuelan government for remittance of dividends of approximately $310 million at the fixed exchange rate. These requests pertain to the years from 2006 to 2012. We are unable to predict the likelihood of Venezuelan government approvals of these requests or any requests that we may file in the future or, if any such requests are approved, the estimated time for remittance.
At the end of each period, we remeasure the net monetary assets of our Venezuela entities at the rate at which we expect them to be settled, including the payment of dividends. During the fourth quarter of 2014, certain of our pending dividend requests at the fixed exchange rate were denied by CENCOEX. We analyzed the exchange rates available to our Venezuela entities, including for payment of future dividend requests. As a result of this analysis, we believe that, except as noted below, the SICAD 1 exchange rate is the most appropriate rate to remeasure our net monetary assets. Therefore, during the fourth quarter of 2014, we incurred an after-tax net charge of $105 million to remeasure certain of the net monetary assets of our Venezuela entities at the SICAD 1 rate (see "Items Affecting Comparability"). We remeasure certain other net monetary assets at the fixed exchange rate, since we believe that dividends submitted to CENCOEX in prior years at the fixed exchange rate and payables for imports of essential goods approved by CENCOEX continue to qualify for settlement at the fixed exchange rate.
In 2014 , our results of operations in Venezuela generated 2 % of our net revenue and 4 % of our operating profit. As of December 27, 2014 , our operations in Venezuela comprised 9 % of our cash and cash equivalents balance. Our bolivar-denominated net monetary assets in Venezuela, which primarily include cash and cash equivalents, approximated $ 480 million at December 27, 2014 . Our non-monetary assets in Venezuela, which primarily include equity investments, intangible assets, property, plant and equipment and inventory, approximated $650 million at December 27, 2014. We continue to evaluate available options to obtain U.S. dollars to meet our operational needs in Venezuela.
We believe that significant uncertainty exists regarding the exchange mechanisms in Venezuela, including the nature of transactions that are eligible to flow through CENCOEX, SICAD 1 or SIMADI, or any other new exchange mechanism that may emerge (whether as a result of the Venezuelan government's announcement on February 11, 2015 or otherwise), as well as how any such mechanisms will operate in the future and the availability of U.S. dollars under each mechanism. We continue to monitor developments closely and may determine in the future that rates other than the SICAD 1 rate or the fixed exchange rate, as applicable, are appropriate for remeasurement of the net monetary assets of our Venezuelan entities. If, at December 27, 2014, we had used the SICAD 1 rate to remeasure the net monetary assets that remain at the fixed exchange rate, we would have incurred an additional net charge of approximately $160 million. If, at December 27, 2014, we had remeasured all net monetary assets of our Venezuela businesses at 50 bolivars per U.S. dollar (which was the SICAD 2 rate at December 27, 2014), we would have incurred an additional net charge of approximately $400 million. Any such remeasurement charge, if recognized, would be reflected
41
Table of Contents
in "Items Affecting Comparability." Any further devaluation of the bolivar, change in the currency exchange mechanisms or fluctuation of the SICAD 1 auction-based rate, which may vary throughout the year, could adversely affect our financial position, including a potential impairment of non-monetary assets, and results of operations, both for any period in which we determine to remeasure using another rate and on a going forward basis following any such remeasurement.
In 2014, the Venezuelan government also issued a new Law on Fair Pricing, establishing a maximum profit margin of 30%. The new law did not and is not expected to have a material impact on our consolidated results or financial position.
During 2014 , Russia announced economic sanctions against the United States and other nations that include a ban on imports of certain ingredients and finished goods from specific countries. We do not anticipate the current sanctions to have a material impact on the results of our operations in Russia or our consolidated results or financial position, and we will continue to monitor the economic, operating and political environment in Russia closely. For both years ending December 27, 2014 and December 28, 2013 , 7% of our total net revenue was generated by our operations in Russia. As of December 27, 2014 , our long-lived assets in Russia were $4.5 billion. Our operations in Ukraine are not significant in relation to our consolidated results or financial position.
Our foreign currency derivatives had a total notional value of $ 2.7 billion as of December 27, 2014 and $2.5 billion as of December 28, 2013 . At the end of 2014 , we estimate that an unfavorable 10% change in the underlying exchange rates would have decreased our net unrealized gains by $ 141 million .
Interest Rates
The notional values of the interest rate derivative instruments outstanding as of December 27, 2014 and December 28, 2013 were $ 9.3 billion and $ 7.9 billion , respectively. Assuming year-end 2014 investment levels and variable rate debt, a 1-percentage-point increase in interest rates would have decreased net interest expense by $ 17 million in 2014 due to higher cash and cash equivalents and short-term investments levels as compared with our variable rate debt.
OUR CRITICAL ACCOUNTING POLICIES
An appreciation of our critical accounting policies is necessary to understand our financial results. These policies may require management to make difficult and subjective judgments regarding uncertainties, and as a result, such estimates may significantly impact our financial results. The precision of these estimates and the likelihood of future changes depend on a number of underlying variables and a range of possible outcomes. Other than our accounting for pension and retiree medical plans, our critical accounting policies do not involve a choice between alternative methods of accounting. We applied our critical accounting policies and estimation methods consistently in all material respects, and for all periods presented, and have discussed these policies with our Audit Committee.
Our critical accounting policies are:
• | revenue recognition; |
• | goodwill and other intangible assets; |
• | income tax expense and accruals; and |
• | pension and retiree medical plans. |
42
Table of Contents
Revenue Recognition
Our products are sold for cash or on credit terms. Our credit terms, which are established in accordance with local and industry practices, typically require payment within 30 days of delivery in the U.S., and generally within 30 to 90 days internationally, and may allow discounts for early payment. We recognize revenue upon shipment or delivery to our customers based on written sales terms that do not allow for a right of return. However, our policy for DSD and certain chilled products is to remove and replace damaged and out-of-date products from store shelves to ensure that consumers receive the product quality and freshness they expect. Similarly, our policy for certain warehouse-distributed products is to replace damaged and out-of-date products. Based on our experience with this practice, we have reserved for anticipated damaged and out-of-date products.
Our policy is to provide customers with product when needed. In fact, our commitment to freshness and product dating serves to regulate the quantity of product shipped or delivered. In addition, DSD products are placed on the shelf by our employees with customer shelf space and storerooms limiting the quantity of product. For product delivered through our other distribution networks, we monitor customer inventory levels.
As discussed in "Our Customers" in "Item 1. Business.", we offer sales incentives and discounts through various programs to customers and consumers. Total marketplace spending includes sales incentives, discounts, advertising and other marketing activities. Sales incentives and discounts are primarily accounted for as a reduction of revenue and totaled $ 35.8 billion in 2014 and $ 34.7 billion in both 2013 and 2012 . Sales incentives and discounts include payments to customers for performing merchandising activities on our behalf, such as payments for in-store displays, payments to gain distribution of new products, payments for shelf space and discounts to promote lower retail prices. Sales incentives and discounts also include support provided to our independent bottlers through funding of advertising and other marketing activities. A number of our sales incentives, such as bottler funding to independent bottlers and customer volume rebates, are based on annual targets, and accruals are established during the year for the expected payout. These accruals are based on contract terms and our historical experience with similar programs and require management judgment with respect to estimating customer participation and performance levels. Differences between estimated expense and actual incentive costs are normally insignificant and are recognized in earnings in the period such differences are determined. In addition, certain advertising and marketing costs are also based on annual targets and recognized during the year as incurred. The terms of most of our incentive arrangements do not exceed a year, and therefore do not require highly uncertain long-term estimates. Certain arrangements, such as fountain pouring rights, may extend beyond one year. Payments made to obtain these rights are recognized over the shorter of the economic or contractual life, primarily as a reduction of revenue, and the remaining balances of $ 355 million as of December 27, 2014 and $ 410 million as of December 28, 2013 are included in prepaid expenses and other current assets and other assets on our balance sheet.
For interim reporting, our policy is to allocate our forecasted full-year sales incentives for most of our programs to each of our interim reporting periods in the same year that benefits from the programs. The allocation methodology is based on our forecasted sales incentives for the full year and the proportion of each interim period's actual gross revenue or volume, as applicable, to our forecasted annual gross revenue or volume, as applicable. Based on our review of the forecasts at each interim period, any changes in estimates and the related allocation of sales incentives are recognized beginning in the interim period that they are identified. In addition, we apply a similar allocation methodology for interim reporting purposes for certain advertising and other marketing activities. See Note 2 to our consolidated financial statements for additional information on our total marketplace spending. Our annual financial statements are not impacted by this interim allocation methodology.
43
Table of Contents
We estimate and reserve for our bad debt exposure based on our experience with past due accounts and collectibility, the aging of accounts receivable and our analysis of customer data. Bad debt expense is classified within selling, general and administrative expenses in our income statement.
Goodwill and Other Intangible Assets
We sell products under a number of brand names, many of which were developed by us. The brand development costs are expensed as incurred. We also purchase brands and other intangible assets in acquisitions. In a business combination, the consideration is first assigned to identifiable assets and liabilities, including brands and other intangible assets, based on estimated fair values, with any excess recorded as goodwill. Determining fair value requires significant estimates and assumptions based on an evaluation of a number of factors, such as marketplace participants, product life cycles, market share, consumer awareness, brand history and future expansion expectations, amount and timing of future cash flows and the discount rate applied to the cash flows.
We believe that a brand has an indefinite life if it has a history of strong revenue and cash flow performance and we have the intent and ability to support the brand with marketplace spending for the foreseeable future. If these perpetual brand criteria are not met, brands are amortized over their expected useful lives, which generally range from five to 40 years. Determining the expected life of a brand requires management judgment and is based on an evaluation of a number of factors, including market share, consumer awareness, brand history, future expansion expectations and regulatory restrictions, as well as the macroeconomic environment of the countries in which the brand is sold.
In connection with previous acquisitions, we reacquired certain franchise rights which provided the exclusive and perpetual rights to manufacture and/or distribute beverages for sale in specified territories. In determining the useful life of these franchise rights, many factors were considered, including the pre-existing perpetual bottling arrangements, the indefinite period expected for these franchise rights to contribute to our future cash flows, as well as the lack of any factors that would limit the useful life of these franchise rights to us, including legal, regulatory, contractual, competitive, economic or other factors. Therefore, certain of these franchise rights are considered as indefinite-lived, with the balance amortized over the remaining contractual period of the contract in which the right was granted.
Indefinite-lived intangible assets and goodwill are not amortized and are assessed for impairment at least annually, using either a qualitative or quantitative approach. We perform this annual assessment during our third quarter. Where we use the qualitative assessment, first we determine if, based on qualitative factors, it is more likely than not that an impairment exists. Factors considered include macroeconomic, industry and competitive conditions, legal and regulatory environment, historical financial performance and significant changes in the brand or reporting unit. If the qualitative assessment indicates that it is more likely than not that an impairment exists, then a quantitative assessment is performed.
The quantitative assessment requires an analysis of several estimates including future cash flows or income consistent with management's strategic business plans, annual sales growth rates and the selection of assumptions underlying a discount rate (weighted average cost of capital) based on market data available at the time. Significant management judgment is necessary to estimate the impact of competitive operating, macroeconomic and other factors to estimate future levels of sales, operating profit or cash flows. All assumptions used in our impairment evaluations for nonamortizable intangible assets, such as forecasted growth rates and weighted average cost of capital, are based on the best available market information and are consistent with our internal forecasts and operating plans. These assumptions could be adversely impacted by certain of the risks described in "Risk Factors" in Item 1A, and "Our Business Risks."
44
Table of Contents
See Note 2 to our consolidated financial statements for additional information on performing the quantitative assessment.
Amortizable intangible assets are only evaluated for impairment upon a significant change in the operating or macroeconomic environment. If an evaluation of the undiscounted future cash flows indicates impairment, the asset is written down to its estimated fair value, which is based on its discounted future cash flows or another income-based approach.
We did not recognize any impairment charges for goodwill in each of the fiscal years ended December 27, 2014 , December 28, 2013 and December 29, 2012 . In 2014, we performed the impairment analysis for goodwill for all our reporting units using the qualitative approach and concluded that it was more likely than not that the estimated fair values of our reporting units were greater than their carrying amounts. After reaching this conclusion, no further testing was performed.
In 2014 and 2012, we recognized pre-tax impairment charges in Europe for nonamortizable intangible assets of $23 million in each year. We recognized no impairment charges for nonamortizable intangible assets in 2013. As of December 27, 2014, the estimated fair values of our indefinite-lived reacquired and acquired franchise rights recorded at PAB exceeded their carrying values. However, there could be an impairment of the carrying value of PAB's reacquired and acquired franchise rights if future revenues and their contribution to the operating results of PAB's CSD business do not achieve our expected estimated future cash flows or if macroeconomic conditions result in a future increase in the weighted-average cost of capital used to estimate fair value. We have also analyzed the impact of the recent economic and political developments in Russia on the estimated fair value of our indefinite-lived intangible assets in Russia and have concluded that there is no impairment as of December 27, 2014. However, a further deterioration in these conditions in Russia could potentially require us to record an impairment charge for these assets in the future.
Income Tax Expense and Accruals
Our annual tax rate is based on our income, statutory tax rates and tax planning opportunities available to us in the various jurisdictions in which we operate. Significant judgment is required in determining our annual tax rate and in evaluating our tax positions. We establish reserves when, despite our belief that our tax return positions are fully supportable, we believe that certain positions are subject to challenge and that we likely will not succeed. We adjust these reserves, as well as the related interest, in light of changing facts and circumstances, such as the progress of a tax audit. See "Imposition of new taxes, disagreements with tax authorities or additional tax liabilities could adversely affect our business, financial condition or results of operations." in "Risk Factors" in Item 1A.
An estimated annual effective tax rate is applied to our quarterly operating results. In the event there is a significant or unusual item recognized in our quarterly operating results, the tax attributable to that item is separately calculated and recorded at the same time as that item. We consider the tax adjustments from the resolution of prior year tax matters to be among such items.
Tax law requires items to be included in our tax returns at different times than the items are reflected in our financial statements. As a result, our annual tax rate reflected in our financial statements is different than that reported in our tax returns (our cash tax rate). Some of these differences are permanent, such as expenses that are not deductible in our tax return, and some differences reverse over time, such as depreciation expense. These temporary differences create deferred tax assets and liabilities. Deferred tax assets generally represent items that can be used as a tax deduction or credit in our tax returns in future years for which we have already recorded the tax benefit in our income statement. We establish valuation allowances for our deferred tax assets if, based on the available evidence, it is more likely than not that some portion or all of the deferred tax assets will not be realized. Deferred tax liabilities generally represent tax expense recognized in our
45
Table of Contents
financial statements for which payment has been deferred, or expense for which we have already taken a deduction in our tax return but have not yet recognized as expense in our financial statements.
In 2014 , our annual tax rate was 25.1% compared to 23.7% in 2013 , as discussed in "Other Consolidated Results." The tax rate increased 1.4 percentage points compared to the prior year, primarily due to lapping the prior year impact of the favorable resolution with the IRS of audits for taxable years 2003 through 2009 partially offset by the favorable resolution of certain tax matters in the current year.
Pension and Retiree Medical Plans
Our pension plans cover certain full-time employees in the U.S. and certain international employees. Benefits are determined based on either years of service or a combination of years of service and earnings. Certain U.S. and Canada retirees are also eligible for medical and life insurance benefits (retiree medical) if they meet age and service requirements. Generally, our share of retiree medical costs is capped at specified dollar amounts, which vary based upon years of service, with retirees contributing the remainder of the cost. In addition, the Company has been phasing out certain Company subsidies of retiree medical benefits.
In the fourth quarters of 2014 and 2012, the Company offered certain former employees who had vested benefits in our U.S. defined benefit pension plans the option of receiving a one-time lump sum payment equal to the present value of the participant's pension benefit (payable in cash or rolled over into a qualified retirement plan or Individual Retirement Account (IRA)). In 2014, we recorded a pension lump sum settlement charge in corporate unallocated expenses of $141 million ( $88 million after-tax or $0.06 per share). In 2012, we recorded a pension lump sum settlement charge in corporate unallocated expenses of $195 million ( $131 million after-tax or $ 0.08 per share). See "Items Affecting Comparability" and Note 7 to our consolidated financial statements.
Our Assumptions
The determination of pension and retiree medical plan obligations and related expenses requires the use of assumptions to estimate the amount of benefits that employees earn while working, as well as the present value of those benefits. Annual pension and retiree medical expense amounts are principally based on four components: (1) the value of benefits earned by employees for working during the year (service cost), (2) the increase in the liability due to the passage of time (interest cost), and (3) other gains and losses as discussed in Note 7 to our consolidated financial statements, reduced by (4) the expected return on assets for our funded plans.
Significant assumptions used to measure our annual pension and retiree medical expenses include:
• | the interest rate used to determine the present value of liabilities (discount rate); |
• | certain employee-related demographic factors, such as turnover, retirement age and mortality; |
• | the expected return on assets in our funded plans; |
• | for pension expense, the rate of salary increases for plans where benefits are based on earnings; and |
• | for retiree medical expense, health care cost trend rates. |
Our assumptions reflect our historical experience and management's best judgment regarding future expectations. Due to the significant management judgment involved, our assumptions could have a material impact on the measurement of our pension and retiree medical benefit expenses and obligations.
At each measurement date, the discount rates are based on interest rates for high-quality, long-term corporate debt securities with maturities comparable to those of our liabilities. Our 2012 U.S. pension and retiree medical expense was based on the discount rate determined using the Mercer Pension Discount Yield Curve (Mercer Curve). The Mercer Curve used a portfolio of high-quality bonds rated Aa or higher by Moody's.
46
Table of Contents
In 2012, due to the downgrade of several global financial institutions by Moody's, Mercer developed a new curve, the Above Mean Curve, which we used to determine the discount rate for our U.S. pension and retiree medical plans as of year-end 2012 and going forward. These curves include bonds that closely match the timing and amount of our expected benefit payments and reflect the portfolio of investments we would consider to settle our liabilities.
We review our employee demographic assumptions annually and update the assumptions as necessary. During 2014, we revised our mortality assumptions to incorporate the new set of mortality tables issued by the Society of Actuaries, adjusted to reflect our experience and future expectations. This resulted in an increase in the projected benefit obligation of our U.S. pension and retiree medical programs. We also reviewed and revised other demographic assumptions to reflect recent experience. The net effect of these changes and certain plan design changes resulted in an increase of approximately $150 million in the projected benefit obligation at December 27, 2014.
See Note 7 to our consolidated financial statements for information about the expected return on plan assets and our plan investment strategy.
The health care trend rate used to determine our retiree medical plan's liability and expense is reviewed annually. Our review is based on our claim experience, information provided by our health plans and actuaries, and our knowledge of the health care industry. Our review of the trend rate considers factors such as demographics, plan design, new medical technologies and changes in medical carriers.
Weighted-average assumptions for pension and retiree medical expense are as follows:
| 2015 | |
| 2014 | |
| 2013 | |
Pension |
|
|
|
|
| |||
Expense discount rate | 4.1 | % |
| 5.0 | % |
| 4.2 | % |
Expected rate of return on plan assets | 7.3 | % |
| 7.3 | % |
| 7.5 | % |
Expected rate of salary increases | 3.5 | % |
| 3.7 | % |
| 3.7 | % |
Retiree medical |
|
|
|
|
| |||
Expense discount rate | 3.8 | % |
| 4.3 | % |
| 3.7 | % |
Expected rate of return on plan assets | 7.5 | % |
| 7.5 | % |
| 7.8 | % |
Current health care cost trend rate | 6.2 | % |
| 6.4 | % |
| 6.6 | % |
Based on our assumptions, we expect our pension and retiree medical expenses to decrease in 2015 primarily driven by favorable experience, updates to demographic assumptions and plan changes, offset by lower discount rates and updates to our mortality assumptions.
Sensitivity of Assumptions
A decrease in the discount rate or in the expected rate of return assumptions would increase pension expense. A 25-basis-point decrease in the discount rate and expected rate of return assumptions would increase the 2015 pension expense as follows:
Assumption |
| Amount |
Discount rate |
| $58 million |
Expected rate of return |
| $35 million |
See Note 7 to our consolidated financial statements for information about the sensitivity of our retiree medical cost assumptions.
47
Table of Contents
Funding
We make contributions to pension trusts that provide plan benefits for certain pension plans. These contributions are made in accordance with applicable tax regulations that provide for current tax deductions for our contributions and taxation to the employee only upon receipt of plan benefits. Generally, we do not fund our pension plans when our contributions would not be currently tax deductible. As our retiree medical plans are not subject to regulatory funding requirements, we generally fund these plans on a pay-as-you-go basis, although we periodically review available options to make additional contributions toward these benefits.
Our pension and retiree medical contributions are subject to change as a result of many factors, such as changes in interest rates, deviations between actual and expected asset returns and changes in tax or other benefit laws. See Note 7 to our consolidated financial statements for our past and expected contributions and estimated future benefit payments.
OUR FINANCIAL RESULTS
Items Affecting Comparability
The year-over-year comparisons of our financial results are affected by the following items:
| 2014 | |
| 2013 | |
| 2012 | | |||
Operating profit |
|
| |
| | | |||||
Mark-to-market net (losses)/gains | $ | (68 | ) |
| $ | (72 | ) |
| $ | 65 | |
Merger and integration charges | $ | - | |
| $ | (10 | ) |
| $ | (11 | ) |
Restructuring and impairment charges | $ | (418 | ) |
| $ | (163 | ) |
| $ | (279 | ) |
Pension lump sum settlement charges | $ | (141 | ) |
| $ | - | |
| $ | (195 | ) |
Venezuela remeasurement charges | $ | (105 | ) |
| $ | (111 | ) |
| $ | - | |
Restructuring and other charges related to the transaction with Tingyi | $ | - | |
| $ | - | |
| $ | (150 | ) |
Interest expense |
|
|
|
|
| ||||||
Merger and integration charges | $ | - | |
| $ | - | |
| $ | (5 | ) |
Net income attributable to PepsiCo |
|
| |
| | ||||||
Mark-to-market net (losses)/gains | $ | (44 | ) |
| $ | (44 | ) |
| $ | 41 | |
Merger and integration charges | $ | - | |
| $ | (8 | ) |
| $ | (12 | ) |
Restructuring and impairment charges | $ | (316 | ) |
| $ | (129 | ) |
| $ | (215 | ) |
Pension lump sum settlement charges | $ | (88 | ) |
| $ | - | |
| $ | (131 | ) |
Venezuela remeasurement charges | $ | (105 | ) |
| $ | (111 | ) |
| $ | - | |
Tax benefits | $ | - | |
| $ | 209 | |
| $ | 217 | |
Restructuring and other charges related to the transaction with Tingyi | $ | - | |
| $ | - | |
| $ | (176 | ) |
Net income attributable to PepsiCo per common share – diluted |
|
| |
| | ||||||
Mark-to-market net (losses)/gains | $ | (0.03 | ) |
| $ | (0.03 | ) |
| $ | 0.03 | |
Merger and integration charges | $ | - | |
| $ | (0.01 | ) |
| $ | (0.01 | ) |
Restructuring and impairment charges | $ | (0.21 | ) |
| $ | (0.08 | ) |
| $ | (0.14 | ) |
Pension lump sum settlement charges | $ | (0.06 | ) |
| $ | - | |
| $ | (0.08 | ) |
Venezuela remeasurement charges | $ | (0.07 | ) |
| $ | (0.07 | ) |
| $ | - | |
Tax benefits | $ | - | |
| $ | 0.13 | |
| $ | 0.14 | |
Restructuring and other charges related to the transaction with Tingyi | $ | - | |
| $ | - | |
| $ | (0.11 | ) |
48
Table of Contents
Mark-to-Market Net Impact
We centrally manage commodity derivatives on behalf of our divisions. These commodity derivatives include agricultural products, energy and metals. Commodity derivatives that do not qualify for hedge accounting treatment are marked to market each period with the resulting gains and losses recorded in corporate unallocated expenses as either cost of sales or selling, general and administrative expenses, depending on the underlying commodity. These gains and losses are subsequently reflected in division results when the divisions recognize the cost of the underlying commodity in operating profit. Therefore, the divisions realize the economic effects of the derivative without experiencing any resulting mark-to-market volatility, which remains in corporate unallocated expenses.
In 2014 , we recognized $68 million ( $44 million after-tax or $0.03 per share) of mark-to-market net losses on commodity hedges in corporate unallocated expenses, with a $33 million net gain recognized in cost of sales and a $101 million net loss recognized in selling, general and administrative expenses.
In 2013 , we recognized $ 72 million ($ 44 million after-tax or $ 0.03 per share) of mark-to-market net losses on commodity hedges in corporate unallocated expenses, with a $82 million net loss recognized in cost of sales and a $10 million net gain recognized in selling, general and administrative expenses.
In 2012 , we recognized $ 65 million ($ 41 million after-tax or $0.03 per share) of mark-to-market net gains on commodity hedges in corporate unallocated expenses, with a $25 million net gain recognized in cost of sales and a $40 million net gain recognized in selling, general and administrative expenses.
Merger and Integration Charges
In 2013, we incurred merger and integration charges of $ 10 million ($ 8 million after-tax or $ 0.01 per share) related to our acquisition of Wimm-Bill-Dann Foods OJSC (WBD), all of which were recorded in the Europe segment.
In 2012, we incurred merger and integration charges of $ 16 million ($ 12 million after-tax or $ 0.01 per share) related to our acquisition of WBD, including $ 11 million recorded in the Europe segment and $ 5 million recorded in interest expense.
Restructuring and Impairment Charges
2014 Multi-Year Productivity Plan
The multi-year productivity plan we publicly announced on February 13, 2014 (2014 Productivity Plan) includes the next generation of productivity initiatives that we believe will strengthen our food, snack and beverage businesses by: accelerating our investment in manufacturing automation; further optimizing our global manufacturing footprint, including closing certain manufacturing facilities; re-engineering our go-to-market systems in developed markets; expanding shared services; and implementing simplified organization structures to drive efficiency. The 2014 Productivity Plan is in addition to the productivity plan we began implementing in 2012 and is expected to continue the benefits of that plan.
In 2014 and 2013 , we incurred restructuring charges of $ 357 million ($ 262 million after-tax or $ 0.17 per share) and $ 53 million ($ 39 million after-tax or $ 0.02 per share), respectively, in conjunction with our 2014 Productivity Plan. See Note 3 to our consolidated financial statements for further information.
49
Table of Contents
We expect to incur pre-tax charges of approximately $990 million , of which approximately $690 million represents cash expenditures related to the 2014 Productivity Plan, summarized by period as follows:
|
| Charges |
| Cash |
| ||||
2013 |
| $ | 53 | |
| $ | - | |
|
2014 |
| 357 | |
| 175 | | (b) | ||
2015 (expected) |
| 242 | |
| 234 | |
| ||
2016 - 2019 (expected) |
| 338 | |
| 281 | |
| ||
|
| $ | 990 | | (a) | $ | 690 | |
|
(a) | This total pre-tax charge will consist of approximately $550 million of severance and other employee-related costs, approximately $180 million for asset impairments (all non-cash) resulting from plant closures and related actions, and approximately $260 million for other costs, including costs related to the termination of leases and other contracts. This charge is expected to impact reportable segments approximately as follows: FLNA 13%, QFNA 2%, LAF 15%, PAB 35%, Europe 25%, AMEA 4% and Corporate 6%. |
(b) | In 2014 , cash expenditures include $10 million reported on the Consolidated Statement of Cash Flows in pension and retiree medical plan contributions. |
2012 Multi-Year Productivity Plan
The multi-year productivity plan we publicly announced on February 9, 2012 (2012 Productivity Plan) includes actions in every aspect of our business that we believe will strengthen our complementary food, snack and beverage businesses by: leveraging new technologies and processes across PepsiCo's operations, go-to-market and information systems; heightening the focus on best practice sharing across the globe; consolidating manufacturing, warehouse and sales facilities; and implementing simplified organization structures, with wider spans of control and fewer layers of management. The 2012 Productivity Plan continues to enhance PepsiCo's cost-competitiveness and provide a source of funding for future brand-building and innovation initiatives.
In 2014 , 2013 and 2012 , we incurred restructuring charges of $ 61 million ($ 54 million after-tax or $ 0.04 per share), $ 110 million ($ 90 million after-tax or $ 0.06 per share) and $ 279 million ($ 215 million after-tax or $ 0.14 per share), respectively, in conjunction with our 2012 Productivity Plan. See Note 3 to our consolidated financial statements for further information.
We expect to incur pre-tax charges of approximately $ 910 million , of which approximately $ 704 million represents cash expenditures related to the 2012 Productivity Plan, summarized by period as follows:
|
| Charges |
| Cash | ||||
2011 |
| $ | 383 | |
| $ | 30 | |
2012 |
| 279 | |
| 343 | | ||
2013 |
| 110 | |
| 133 | | ||
2014 |
| 61 | |
| 101 | | ||
2015 (expected) |
| 77 | |
| 97 | | ||
|
| $ | 910 | | (a) | $ | 704 | |
(a) | This total pre-tax charge will consist of approximately $545 million of severance and other employee-related costs, approximately $90 million for asset impairments (all non-cash) resulting from plant closures and related actions, and approximately $275 million for other costs, including costs related to the termination of leases and other contracts. This charge is expected to impact reportable segments approximately as follows: FLNA 14%, QFNA 3%, LAF 13%, PAB 24%, Europe 23%, AMEA 8% and Corporate 15%. |
50
Table of Contents
Pension Lump Sum Settlement Charges
In 2014, we recorded a pension lump sum settlement charge in corporate unallocated expenses of $141 million ( $88 million after-tax or $0.06 per share) related to payments for pension liabilities to certain former employees who had vested benefits.
In 2012, we recorded a pension lump sum settlement charge in corporate unallocated expenses of $195 million ( $131 million after-tax or $ 0.08 per share) related to payments for pension liabilities to certain former employees who had vested benefits.
See Note 7 to our consolidated financial statements.
Venezuela Remeasurement Charges
In 2014, we recorded a $105 million net charge related to our remeasurement of the bolivar for certain net monetary assets of our Venezuela businesses. $126 million of this charge was recorded in corporate unallocated expenses, with the balance (equity income of $21 million ) recorded in our PAB segment. In total, this net charge had an after-tax impact of $105 million or $0.07 per share.
In 2013, we recorded a $ 111 million net charge related to the devaluation of the bolivar for our Venezuela businesses. $ 124 million of this charge was recorded in corporate unallocated expenses, with the balance (equity income of $ 13 million ) recorded in our PAB segment. In total, this net charge had an after-tax impact of $ 111 million or $ 0.07 per share.
For additional information on Venezuela, see "Our Business Risks."
Tax Benefits
In 2013, we recognized a non-cash tax benefit of $ 209 million ($ 0.13 per share) associated with our agreement with the IRS resolving all open matters related to the audits for taxable years 2003 through 2009, which reduced our reserve for uncertain tax positions for the tax years 2003 through 2012. See Note 5 to our consolidated financial statements.
In 2012, we recognized a non-cash tax benefit of $217 million ( $0.14 per share) associated with a favorable tax court decision related to the classification of financial instruments. See Note 5 to our consolidated financial statements.
Restructuring and Other Charges Related to the Transaction with Tingyi
In 2012, we recorded restructuring and other charges of $ 150 million ($ 176 million after-tax or $ 0.11 per share) in the AMEA segment related to the transaction with Tingyi. See Note 15 to our consolidated financial statements.
Non-GAAP Measures
Certain measures contained in this Form 10-K are financial measures that are adjusted for items affecting comparability (see "Items Affecting Comparability" for a detailed list and description of each of these items), as well as, in certain instances, adjusted for foreign exchange. These measures are not in accordance with U.S. Generally Accepted Accounting Principles (GAAP). Items adjusted for currency assume foreign currency exchange rates used for translation based on the rates in effect for the comparable prior-year period. In order to compute our constant currency results, we multiply or divide, as appropriate, our current year U.S. dollar results by the current year average foreign exchange rates and then multiply or divide, as appropriate, those amounts by the prior year average foreign exchange rates. We believe investors should consider these non-GAAP measures in evaluating our results as they are indicative of our ongoing performance
51
Table of Contents
and reflect how management evaluates our operational results and trends. These measures are not, and should not be viewed as, a substitute for U.S. GAAP reporting measures. See also "Organic Revenue Growth" and "Free Cash Flow."
Results of Operations - Consolidated Review
In the discussions of net revenue and operating profit below, "effective net pricing" reflects the year-over-year impact of discrete pricing actions, sales incentive activities and mix resulting from selling varying products in different package sizes and in different countries and "net pricing" reflects the year-over-year combined impact of list price changes, weight changes per package, discounts and allowances. Additionally, "acquisitions and divestitures," except as otherwise noted, reflect all mergers and acquisitions activity, including the impact of acquisitions, divestitures and changes in ownership or control in consolidated subsidiaries and nonconsolidated equity investees.
Volume
Our beverage volume in the PAB, Europe and AMEA segments reflects sales to authorized bottlers, independent distributors and retailers, as well as the sale of beverages bearing Company-owned or licensed trademarks that have been sold through our authorized independent bottlers. Bottler case sales (BCS) and concentrate shipments and equivalents (CSE) are not necessarily equal during any given period due to seasonality, timing of product launches, product mix, bottler inventory practices and other factors. While our beverage revenues are not entirely based on BCS volume, as there are independent bottlers in the supply chain, we believe that BCS is a valuable measure as it quantifies the sell-through of our beverage products at the consumer level. Sales of products from our unconsolidated joint ventures are reflected in our reported volume. PAB, AMEA and Europe, either independently or in conjunction with third parties, make, market, distribute and sell ready-to-drink tea products through a joint venture with Unilever (under the Lipton brand name), and PAB further, either independently or in conjunction with third parties, makes, markets, distributes and sells ready-to-drink coffee products through a joint venture with Starbucks. In addition, AMEA licenses the Tropicana brand for use in China on co-branded juice products in connection with a strategic alliance with Tingyi.
Our food and snacks volume in the FLNA, QFNA, LAF, Europe and AMEA segments is reported on a system-wide basis, which includes our own sales and the sales by our noncontrolled affiliates of snacks bearing Company-owned or licensed trademarks.
Servings
Since our divisions each use different measures of physical unit volume (i.e., kilos, gallons, pounds and case sales), a common servings metric is necessary to reflect our consolidated physical unit volume. Our divisions' physical volume measures are converted into servings based on U.S. Food and Drug Administration guidelines for single-serving sizes of our products.
In 2014 , total servings increased 1% compared to 2013 . In 2013 , total servings increased 2% compared to 2012 . Servings growth in 2013 reflects an adjustment to the base year for divestitures and business changes.
52
Table of Contents
Total Net Revenue and Operating Profit
|
|
|
|
|
|
| Change | ||||||||||
| 2014 |
| 2013 |
| 2012 |
| 2014 |
| 2013 | ||||||||
Total net revenue | $ | 66,683 | |
| $ | 66,415 | |
| $ | 65,492 | |
| - | % |
| 1 | % |
Operating profit |
|
|
|
|
|
|
|
|
| ||||||||
FLNA | $ | 4,054 | |
| $ | 3,877 | |
| $ | 3,646 | |
| 5 | % |
| 6 | % |
QFNA | 621 | |
| 617 | |
| 695 | |
| 1 | % |
| (11 | )% | |||
LAF | 1,211 | |
| 1,242 | |
| 1,059 | |
| (2.5 | )% |
| 17 | % | |||
PAB | 2,846 | |
| 2,955 | |
| 2,937 | |
| (4 | )% |
| 1 | % | |||
Europe | 1,331 | |
| 1,293 | |
| 1,330 | |
| 3 | % |
| (3 | )% | |||
AMEA | 1,043 | |
| 1,174 | |
| 747 | |
| (11 | )% |
| 57 | % | |||
Corporate Unallocated |
|
|
|
|
|
|
|
|
| ||||||||
Mark-to-market net (losses)/gains | (68 | ) |
| (72 | ) |
| 65 | |
|
|
|
| |||||
Restructuring and impairment charges | (41 | ) |
| (11 | ) |
| (10 | ) |
|
|
|
| |||||
Pension lump sum settlement charges | (141 | ) |
| - | |
| (195 | ) |
|
|
|
| |||||
Venezuela remeasurement charges | (126 | ) |
| (124 | ) |
| - | |
|
|
|
| |||||
Other | (1,149 | ) |
| (1,246 | ) |
| (1,162 | ) |
|
|
|
| |||||
| $ | (1,525 | ) |
| $ | (1,453 | ) |
| $ | (1,302 | ) |
| 5 | % |
| 12 | % |
Total operating profit | $ | 9,581 | |
| $ | 9,705 | |
| $ | 9,112 | |
| (1 | )% |
| 7 | % |
|
|
|
|
|
|
|
|
|
| ||||||||
Total operating profit margin | 14.4 | % |
| 14.6 | % |
| 13.9 | % |
| (0.2 | ) |
| 0.7 | | |||
2014
On a reported basis, total operating profit decreased 1% and operating margin decreased 0.2 percentage points. Operating profit performance was primarily driven by certain operating cost increases including strategic initiatives related to capacity and capability, higher commodity costs and unfavorable foreign exchange. Commodity inflation negatively impacted operating profit performance by 4 percentage points, primarily attributable to inflation in the LAF and Europe segments, partially offset by deflation in the PAB and FLNA segments. These impacts were partially offset by favorable effective net pricing and the benefit of actions associated with our productivity initiatives, which contributed more than $1 billion in cost reductions across a number of expense categories throughout all of our segments. Additionally, the impact of certain charges associated with productivity initiatives outside the scope of the 2014 and 2012 Productivity Plans negatively impacted operating profit performance by nearly 1 percentage point, primarily in the Europe and AMEA segments. Other corporate unallocated expenses decreased 8%, primarily reflecting decreased pension expense, as well as the lapping of incremental investments into our business in the prior year, partially offset by higher foreign exchange transaction losses. Items affecting comparability (see "Items Affecting Comparability") negatively impacted total operating profit performance by 3.8 percentage points and total operating margin by 0.6 percentage points.
2013
On a reported basis, total operating profit increased 7% and operating margin increased 0.7 percentage points. Operating profit growth was primarily driven by effective net pricing and planned cost reductions across a number of expense categories, partially offset by certain operating cost increases including strategic initiatives related to capacity and capability, higher advertising and marketing expenses and higher commodity costs. Commodity inflation reduced operating profit growth by 2 percentage points, primarily attributable to inflation in the Europe, LAF and AMEA segments, partially offset by deflation in the PAB and FLNA segments. Operating profit also benefited from actions associated with our productivity initiatives, which
53
Table of Contents
contributed more than $900 million in cost reductions across a number of expense categories throughout all of our divisions. Other corporate unallocated expenses increased 7%, reflecting incremental investments in our business. Items affecting comparability positively contributed 2.6 percentage points to total operating profit growth and 0.3 percentage points to total operating margin. Additionally, the gain from structural changes in 2013 due to the beverage refranchising in our Vietnam business increased total operating profit growth by 1.5 percentage points (see Note 15 to our consolidated financial statements). This gain was substantially offset in 2013 by incremental investments in our business, primarily in the AMEA and Europe segments and in corporate unallocated expenses.
Other Consolidated Results
|
|
|
|
|
|
|
| Change | ||||||||||||
|
| 2014 |
| 2013 |
| 2012 |
| 2014 |
| 2013 | ||||||||||
Interest expense, net |
| $ | (824 | ) |
| $ | (814 | ) |
| $ | (808 | ) |
| $ | (10 | ) |
| $ | (6 | ) |
Annual tax rate |
| 25.1 | % |
| 23.7 | % |
| 25.2 | % |
|
|
|
| |||||||
Net income attributable to PepsiCo |
| $ | 6,513 | |
| $ | 6,740 | |
| $ | 6,178 | |
| (3 | )% |
| 9 | % | ||
Net income attributable to PepsiCo per common share – diluted |
| $ | 4.27 | |
| $ | 4.32 | |
| $ | 3.92 | |
| (1 | )% |
| 10 | % | ||
Mark-to-market net losses/(gains) |
| 0.03 | |
| 0.03 | |
| (0.03 | ) |
|
|
|
| |||||||
Merger and integration charges |
| - | |
| 0.01 | |
| 0.01 | |
|
|
|
| |||||||
Restructuring and impairment charges |
| 0.21 | |
| 0.08 | |
| 0.14 | |
|
|
|
| |||||||
Pension lump sum settlement charges |
| 0.06 | |
| - | |
| 0.08 | |
|
|
|
| |||||||
Venezuela remeasurement charges |
| 0.07 | |
| 0.07 | |
| - | |
|
|
|
| |||||||
Tax benefits |
| - | |
| (0.13 | ) |
| (0.14 | ) |
|
|
|
| |||||||
Restructuring and other charges related to the transaction with Tingyi |
| - | |
| - | |
| 0.11 | |
|
|
|
| |||||||
Net income attributable to PepsiCo per common share – diluted, excluding above items (a) |
| $ | 4.63 | | (b) | $ | 4.37 | | (b) | $ | 4.10 | | (b) | 6 | % |
| 7 | % | ||
Impact of foreign exchange translation |
|
|
|
|
|
|
| 3 | |
| 2 | | ||||||||
Growth in net income attributable to PepsiCo per common share – diluted, excluding above items, on a constant currency basis (a) |
|
|
|
|
|
|
| 9 | % |
| 9 | % | ||||||||
(a) | See "Non-GAAP Measures." |
(b) | Does not sum due to rounding. |
2014
Net interest expense increased $ 10 million, primarily reflecting lower gains on the market value of investments used to economically hedge a portion of our deferred compensation costs, partially offset by higher interest income due to higher average cash balances.
The reported tax rate increased 1.4 percentage points, primarily due to lapping the prior year impact of the favorable resolution with the IRS of audits for taxable years 2003 through 2009, partially offset by favorable resolution of certain tax matters in the current year.
Net income attributable to PepsiCo decreased 3% and net income attributable to PepsiCo per common share decreased 1% . Items affecting comparability (see "Items Affecting Comparability") negatively impacted both net income attributable to PepsiCo and net income attributable to PepsiCo per common share by 7 percentage points.
54
Table of Contents
2013
Net interest expense increased $6 million, primarily reflecting higher average debt balances and lower interest income due to lower investment interest rates, partially offset by higher gains on the market value of investments used to economically hedge a portion of our deferred compensation costs.
The reported tax rate decreased 1.5 percentage points compared to the prior year, due to resolution with the IRS of audits for taxable years 2003 through 2009, the favorable tax effects of international refranchising, the reversal of international and state tax reserves resulting from the expiration of statutes of limitations, favorable resolution of certain tax matters and the lapping of the tax impact of the transaction with Tingyi in 2012. These decreases were partially offset by the lapping of a 2012 tax benefit related to a favorable tax court decision, the 2012 pre-payment of Medicare subsidy liabilities and the impact of the 2013 Venezuela devaluation.
Net income attributable to PepsiCo increased 9% and net income attributable to PepsiCo per common share increased 10% . Items affecting comparability (see "Items Affecting Comparability") positively contributed 3 percentage points to both net income attributable to PepsiCo and net income attributable to PepsiCo per common share.
Results of Operations - Division Review
The results and discussions below are based on how our Chief Executive Officer monitors the performance of our divisions. Accordingly, 2013 volume growth measures reflect an adjustment to the base year for divestitures and business changes. See "Items Affecting Comparability" for a discussion of items to consider when evaluating our results and related information regarding non-GAAP measures.
| FLNA |
| QFNA |
| LAF |
| PAB |
| Europe |
| AMEA |
| Total | ||||||||||||||
Net Revenue, 2014 | $ | 14,502 | |
| $ | 2,568 | |
| $ | 8,442 | |
| $ | 21,154 | |
| $ | 13,290 | |
| $ | 6,727 | |
| $ | 66,683 | |
Net Revenue, 2013 | $ | 14,126 | |
| $ | 2,612 | |
| $ | 8,350 | |
| $ | 21,068 | |
| $ | 13,752 | |
| $ | 6,507 | |
| $ | 66,415 | |
% Impact of: |
|
|
|
|
|
|
|
|
|
|
|
|
| ||||||||||||||
Volume (a) | 2 | % |
| - | % |
| (2 | )% |
| - | % |
| 1 | % |
| 6 | % |
| 1 | % | |||||||
Effective net pricing (b) | 1 | |
| (1 | ) |
| 12 | |
| 1.5 | |
| 3 | |
| 2 | |
| 3 | | |||||||
Foreign exchange translation | (1 | ) |
| (1 | ) |
| (8 | ) |
| (1 | ) |
| (8 | ) |
| (3 | ) |
| (3 | ) | |||||||
Acquisitions and divestitures | - | |
| - | |
| - | |
| - | |
| - | |
| (1.5 | ) |
| - | | |||||||
Reported growth (c) | 3 | % |
| (2 | )% |
| 1 | % |
| - | % |
| (3 | )% |
| 3 | % |
| - | % | |||||||
| FLNA |
| QFNA |
| LAF |
| PAB |
| Europe |
| AMEA |
| Total | ||||||||||||||
Net Revenue, 2013 | $ | 14,126 | |
| $ | 2,612 | |
| $ | 8,350 | |
| $ | 21,068 | |
| $ | 13,752 | |
| $ | 6,507 | |
| $ | 66,415 | |
Net Revenue, 2012 | $ | 13,574 | |
| $ | 2,636 | |
| $ | 7,780 | |
| $ | 21,408 | |
| $ | 13,441 | |
| $ | 6,653 | |
| $ | 65,492 | |
% Impact of: |
|
|
|
|
|
|
|
|
|
|
|
|
| ||||||||||||||
Volume (a) | 3 | % |
| 1 | % |
| 2 | % |
| (4 | )% |
| 0.5 | % |
| 5 | % |
| - | % | |||||||
Effective net pricing (b) | 2 | |
| (1 | ) |
| 11 | |
| 3 | |
| 3 | |
| 7 | |
| 4 | | |||||||
Foreign exchange translation | - | |
| - | |
| (6 | ) |
| (1 | ) |
| (1 | ) |
| (4 | ) |
| (2 | ) | |||||||
Acquisitions and divestitures | - | |
| - | |
| - | |
| - | |
| - | |
| (10 | ) |
| (1 | ) | |||||||
Reported growth (c) | 4 | % |
| (1 | )% |
| 7 | % |
| (2 | )% |
| 2 | % |
| (2 | )% |
| 1 | % | |||||||
(a) | Excludes the impact of acquisitions and divestitures. In certain instances, volume growth varies from the amounts disclosed in the following divisional discussions due to nonconsolidated joint venture volume, and, for our beverage businesses, temporary timing differences between BCS and CSE, as well as the mix of beverage volume sold by our Company-owned and franchised-owned bottlers. Our net revenue excludes nonconsolidated joint venture volume, and, for our beverage businesses, is based on CSE. |
55
Table of Contents
(b) | Includes the year-over-year impact of discrete pricing actions, sales incentive activities and mix resulting from selling varying products in different package sizes and in different countries. |
(c) | Amounts may not sum due to rounding. |
Organic Revenue Growth
Organic revenue growth is a significant measure we use to monitor net revenue performance. However, it is not a measure provided by U.S. GAAP. Therefore, this measure is not, and should not be viewed as, a substitute for U.S. GAAP net revenue growth. In order to compute our organic revenue growth results, we exclude the impact of acquisitions and divestitures and foreign exchange translation from reported net revenue growth. See also "Non-GAAP Measures."
|
|
|
|
|
|
|
|
|
|
|
|
|
| |||||||
2014 | FLNA | | QFNA | | LAF | | PAB | | Europe | | AMEA | | Total | |||||||
Reported Growth | 3 | % | | (2 | )% | | 1 | % | | - | % | | (3 | )% | | 3 | % | | - | % |
% Impact of: | | | | | | | | | | | | | | | | | | | | |
Foreign exchange translation | 1 | | | 1 | | | 8 | | | 1 | | | 8 | | | 3 | | | 3 | |
Acquisitions and divestitures | - | | | - | | | - | | | - | | | - | |
| 1.5 | | | - | |
Organic Growth (a) | 3 | % | | (1 | )% | | 10 | % | | 1 | % | | 4.5 | % | | 8 | % | | 4 | % |
| |
|
| |
|
| |
|
| |
|
| |
|
| |
|
| | |
2013 | FLNA |
| QFNA |
| LAF |
| PAB |
| Europe |
| AMEA |
| Total | |||||||
Reported Growth | 4 | % |
| (1 | )% |
| 7 | % |
| (2 | )% |
| 2 | % |
| (2 | )% |
| 1 | % |
% Impact of: |
|
|
|
|
|
|
|
|
|
|
|
|
| |||||||
Foreign exchange translation | - | |
| - | |
| 6 | |
| 1 | |
| 1 | |
| 4 | |
| 2 | |
Acquisitions and divestitures | - | |
| - | |
| - | |
| - | |
| - | |
| 10 | |
| 1 | |
Organic Growth (a) | 4 | % |
| (0.5 | )% |
| 13 | % |
| (1 | )% |
| 3.5 | % |
| 11 | % |
| 4 | % |
(a) | Amounts may not sum due to rounding. |
56
Table of Contents
Frito-Lay North America
|
| |
| |
| | % Change | |||||||||
| 2014 | | | 2013 | | | 2012 | | | 2014 |
| 2013 | | |||
Net revenue | $ | 14,502 | | | $ | 14,126 | | | $ | 13,574 | | | 3 | 4 | | |
Impact of foreign exchange translation | | | | | | | 1 | - | | |||||||
Net revenue growth on a constant currency basis (a) | | | | | | | 3 | (b) | 4 | | ||||||
|
|
|
|
|
|
|
|
|
| |||||||
Operating profit | $ | 4,054 | | | $ | 3,877 | | | $ | 3,646 | | | 5 | 6 | | |
Restructuring and impairment charges | 48 | |
| 19 | |
| 38 | |
|
|
|
| ||||
Operating profit excluding above item (a) | $ | 4,102 | | | $ | 3,896 | | | $ | 3,684 | | | 5 | 6 | | |
Impact of foreign exchange translation | | | | | | | 0.5 | - | | |||||||
Operating profit growth excluding above item, on a constant currency basis (a) | | | | | | | 6 | (b) | 6 | | ||||||
(a) See "Non-GAAP Measures."
(b) Does not sum due to rounding.
2014
Net revenue grew 3% and volume grew 2%. Net revenue growth was driven by the volume growth and effective net pricing. The volume growth reflects mid-single-digit growth in trademark Doritos, double-digit growth in variety packs and our Sabra joint venture products and low-single-digit growth in dips. These gains were partially offset by a double-digit decline in trademark SunChips.
Operating profit grew 5%, primarily reflecting the net revenue growth and planned cost reductions across a number of expense categories, as well as lower commodity costs, primarily cooking oil and corn, which increased operating profit growth by 2 percentage points. These impacts were partially offset by certain operating cost increases including strategic initiatives.
2013
Net revenue grew 4% and volume grew 3%. Net revenue growth was driven by the volume growth and effective net pricing. The volume growth reflects high-single-digit growth in trademark Cheetos and in variety packs, low-single-digit growth in trademark Lay's and double-digit growth in our Sabra joint venture. These gains were partially offset by a double-digit decline in trademark SunChips.
Operating profit grew 6%, primarily reflecting the net revenue growth and planned cost reductions across a number of expense categories, as well as lower commodity costs, primarily cooking oil, which increased operating profit growth by 2 percentage points. These impacts were partially offset by certain operating cost increases including strategic initiatives.
57
Table of Contents
Quaker Foods North America
|
| |
| |
| | % Change |
| ||||||||||
| 2014 | | | 2013 | | | 2012 | | | 2014 | |
| 2013 | |
| |||
Net revenue | $ | 2,568 | |
| $ | 2,612 | |
| $ | 2,636 | | | (2 | ) | (1 | ) |
| |
Impact of foreign exchange translation | | | | | | | 1 | | | - | |
| ||||||
Net revenue growth on a constant currency basis (a) | | | | | | | (1 | ) |
| (0.5 | ) | (b) | ||||||
|
|
|
|
|
|
|
|
|
|
| ||||||||
Operating profit | $ | 621 | |
| $ | 617 | |
| $ | 695 | | | 1 | | (11 | ) |
| |
Restructuring and impairment charges | 14 | |
| 4 | |
| 9 | |
|
|
|
|
| |||||
Operating profit excluding above item (a) | $ | 635 | | | $ | 621 | | | $ | 704 | | | 2 | | (12 | ) |
| |
Impact of foreign exchange translation | | | | | | | 1 | | | - | |
| ||||||
Operating profit growth excluding above item, on a constant currency basis (a) | | | | | | | 3 | |
| (11 | ) | (b) | ||||||
(a) See "Non-GAAP Measures."
(b) Does not sum due to rounding.
2014
Net revenue declined 2% and volume was even with the prior year. The net revenue decline primarily reflects unfavorable net pricing and unfavorable foreign exchange, which negatively impacted net revenue performance by 1 percentage point. The volume performance reflects low-single-digit declines in Aunt Jemima syrup and mix and ready-to-eat cereals, a mid-single-digit decline in regional grains, as well as a double-digit decline in cookies, offset by low-single-digit growth in Oatmeal.
Operating profit increased 1%, primarily driven by planned cost reductions across a number of expense categories, improvement in our share of the operating results of our Müller Quaker Dairy (MQD) joint venture, which reflected start-up costs in the prior year, and lower advertising and marketing expenses. Additionally, the net gain on the divestiture of a cereal business contributed 3 percentage points to operating profit growth. These impacts were partially offset by the unfavorable net pricing and mix, as well as certain operating cost increases.
2013
Net revenue declined 1% and volume increased 3%. The net revenue decline primarily reflects unfavorable product mix. The volume growth primarily reflects growth in MQD products (launched in 2012) and low-single-digit growth in Oatmeal and Aunt Jemima syrup and mix.
Operating profit declined 11%, reflecting the unfavorable product mix, as well as our share of the operating results of our MQD joint venture, which negatively impacted operating profit performance by 6 percentage points, and certain operating cost increases reflecting strategic initiatives. These impacts were partially offset by planned cost reductions across a number of expense categories and the volume growth.
58
Table of Contents
Latin America Foods
|
| |
| |
| | % Change | |||||||||
| 2014 | | | 2013 | | | 2012 | | | 2014 | | | 2013 | |||
Net revenue | $ | 8,442 | | | $ | 8,350 | | | $ | 7,780 | | | 1 | | | 7 |
Impact of foreign exchange translation | | | | | | | 8 | | | 6 | ||||||
Net revenue growth, on a constant currency basis (a) | | | | | | | 10 | | (b) | 13 | ||||||
|
|
|
|
|
|
|
|
|
| |||||||
Operating profit | $ | 1,211 | | | $ | 1,242 | | | $ | 1,059 | | | (2.5 | ) | | 17 |
Restructuring and impairment charges | 25 | |
| 12 | |
| 50 | | | | | | ||||
Operating profit excluding above item (a) | $ | 1,236 | | | $ | 1,254 | | | $ | 1,109 | | | (1.5 | ) | | 13 |
Impact of foreign exchange translation | | | | | | | 11 | | | 5 | ||||||
Operating profit growth excluding above item, on a constant currency basis (a) | | | | | | | 9 | | (b) | 18 | ||||||
(a) See "Non-GAAP Measures."
(b) Does not sum due to rounding.
2014
Net revenue increased 1%, primarily reflecting favorable effective net pricing, including 7 percentage points related to inflation-based pricing in Venezuela, partially offset by volume declines. Unfavorable foreign exchange reduced net revenue growth by 8 percentage points.
Volume declined 2%, reflecting a mid-single-digit decline in Mexico due to a tax on certain packaged foods, which became effective during the first quarter of 2014. Additionally, Brazil experienced a low-single-digit decline.
Operating profit declined 2.5%, reflecting certain operating cost increases including strategic initiatives. Additionally, higher commodity costs, led by Venezuela, primarily reflecting packaging and potato inflation, negatively impacted operating profit performance by 27 percentage points. These increases in costs were partially offset by the revenue growth and planned cost reductions across a number of expense categories. Unfavorable foreign exchange negatively impacted operating profit performance by 11 percentage points, including a 6-percentage-point impact from Venezuela. Reported operating profit performance included a contribution of 6 percentage points from the results of our Venezuela business. For additional information on Venezuela, see "Market Risks" in "Our Business Risks."
2013
Net revenue increased 7%, primarily reflecting favorable effective net pricing. Unfavorable foreign exchange reduced net revenue growth by 6 percentage points.
Volume increased 2%, reflecting a mid-single-digit increase in Brazil and low-single-digit growth in Mexico.
Operating profit increased 17%, reflecting the net revenue growth and planned cost reductions across a number of expense categories, partially offset by certain operating cost increases and higher advertising and marketing expenses, as well as higher commodity costs, which reduced operating profit growth by 15 percentage points. Lower restructuring and impairment charges increased operating profit growth by 4 percentage points. Unfavorable foreign exchange reduced operating profit growth by 5 percentage points.
59
Table of Contents
PepsiCo Americas Beverages
|
| |
| |
| | % Change | ||||||||||
| 2014 | | | 2013 | | | 2012 | | | 2014 | |
| 2013 | | |||
Net revenue | $ | 21,154 | | | $ | 21,068 | | | $ | 21,408 | | | - | | (2 | ) | |
Impact of foreign exchange translation | | | | | | | 1 | | | 1 | | ||||||
Net revenue growth on a constant currency basis (a) | | | | | | | 1 | | (1 | ) | |||||||
|
|
|
|
|
|
|
|
|
| ||||||||
Operating profit | $ | 2,846 | | | $ | 2,955 | | | $ | 2,937 | | | (4 | ) | 1 | | |
Restructuring and impairment charges | 182 | |
| 31 | |
| 102 | |
|
|
|
| |||||
Venezuela remeasurement (b) | (21 | ) |
| (13 | ) |
| - | |
|
|
|
| |||||
Operating profit excluding above items (a) | $ | 3,007 | | | $ | 2,973 | | | $ | 3,039 | | | 1 | | | (2 | ) |
Impact of foreign exchange translation | | | | | | | 3 | | | 3 | | ||||||
Operating profit growth excluding above items, on a constant currency basis (a) | | | | | | | 4 | | 1 | | |||||||
(a) See "Non-GAAP Measures."
(b) Benefit resulting from the remeasurement of certain net monetary liabilities of our joint venture in Venezuela.
2014
Net revenue was even with the prior year, primarily reflecting favorable effective net pricing, offset by unfavorable foreign exchange, which reduced net revenue growth by 1 percentage point.
Volume increased 1%, which included a one-half-percentage-point contribution from certain of our bottler's brands relating to our new joint venture in Chile. Latin America volume increased 4%, which included a mid-single-digit increase in Brazil and a low-single-digit increase in Mexico, partially offset by a low-single-digit decrease in Argentina. Latin America volume growth also included 2 percentage points from certain of our bottler's brands in Chile. North America volume declined slightly, driven by a 2% decline in CSD volumes, partially offset by a 2% increase in non-carbonated beverage volume. The non-carbonated beverage volume increase primarily reflected mid-single-digit increases in Gatorade sports drinks, our overall water portfolio and Lipton ready-to-drink teas, partially offset by a high-single-digit decline in our juice and juice drinks portfolio.
Reported operating profit decreased 4%. Excluding the items affecting comparability in the above table (see "Items Affecting Comparability"), operating profit increased 1%. This increase primarily reflects the favorable effective net pricing, planned cost reductions across a number of expense categories, as well as lower commodity costs, which positively impacted reported operating profit performance by 6 percentage points. These impacts were partially offset by certain operating cost increases. Unfavorable foreign exchange negatively impacted reported operating profit performance by 3 percentage points, including a 2-percentage-point impact from Venezuela. Reported operating profit performance included a contribution of 2 percentage points from the results of our Venezuela businesses. For additional information on Venezuela, see "Market Risks" in "Our Business Risks."
2013
Net revenue decreased 2%, reflecting volume declines, partially offset by favorable effective net pricing. Unfavorable foreign exchange negatively impacted net revenue performance by 1 percentage point.
Volume decreased 3%, primarily reflecting North America volume declines of 4%, while Latin America volume was even with 2012. The North America volume performance was driven by a 5% decline in CSD volume and a 2% decline in non-carbonated beverage volume. The North America non-carbonated beverage
60
Table of Contents
volume decline primarily reflected a high-single-digit decline in our overall water portfolio. The Latin America volume performance primarily reflected a double-digit decrease in Brazil and a low-single-digit decrease in Argentina, offset by a double-digit increase in Venezuela and a low-single-digit increase in Mexico.
Reported operating profit increased 1%. Excluding the items affecting comparability in the above table (see "Items Affecting Comparability"), operating profit declined 2%, primarily reflecting the volume declines and certain operating cost increases. These impacts were partially offset by the favorable effective net pricing and planned cost reductions across a number of expense categories, as well as lower commodity costs, which increased reported operating profit by 6 percentage points. Unfavorable foreign exchange reduced operating profit growth by 3 percentage points.
PepsiCo Europe
|
| |
| |
| | % Change |
| ||||||||||
| 2014 | | | 2013 | | | 2012 | | | 2014 | | 2013 | |
| ||||
Net revenue | $ | 13,290 | |
| $ | 13,752 | |
| $ | 13,441 | | | (3 | ) | | 2 | |
|
Impact of foreign exchange translation | | | | | | | 8 | | | 1 | |
| ||||||
Net revenue growth on a constant currency basis (a) | | | | | | | 4.5 | | (b) | 3.5 | | (b) | ||||||
|
|
|
|
|
|
|
|
|
|
| ||||||||
Operating profit | $ | 1,331 | | | $ | 1,293 | | | $ | 1,330 | | | 3 | | | (3 | ) |
|
Merger and integration charges | - | |
| 10 | |
| 11 | |
|
|
|
|
| |||||
Restructuring and impairment charges | 71 | |
| 60 | |
| 42 | |
|
|
|
|
| |||||
Operating profit excluding above items (a) | $ | 1,402 | | | $ | 1,363 | | | $ | 1,383 | | | 3 | | | (1.5 | ) |
|
Impact of foreign exchange translation | | | | | | | 1 | | | 1 | |
| ||||||
Operating profit growth excluding above items, on a constant currency basis (a) | | | | | | | 4 | |
| - | | (b) | ||||||
(a) See "Non-GAAP Measures."
(b) Does not sum due to rounding.
2014
Net revenue decreased 3%, primarily reflecting unfavorable foreign exchange, which negatively impacted net revenue performance by 8 percentage points, partially offset by effective net pricing and volume growth.
Snacks volume grew 2%, primarily reflecting high-single-digit growth in South Africa and mid-single-digit growth in Turkey, partially offset by a slight decline in Russia. Additionally, the Netherlands experienced slight growth and the United Kingdom grew low-single-digits.
Beverage volume grew 1%, primarily reflecting mid-single-digit growth in Germany and low-single-digit growth in the United Kingdom and Turkey, partially offset by a mid-single-digit decline in Russia.
Operating profit increased 3%, primarily reflecting the effective net pricing and planned cost reductions across a number of expense categories. These impacts were partially offset by certain operating cost increases including strategic initiatives, as well as higher commodity costs, primarily reflecting milk prices and foreign exchange transaction losses, which reduced operating profit growth by 21 percentage points. The impacts of a one-time gain associated with the sale of agricultural assets in Russia and the lapping of incremental investments into our business in the prior year each contributed 2 percentage points to operating profit growth. These impacts were partially offset by an impairment charge associated with a brand in Greece and certain charges associated with productivity initiatives outside the scope of the 2014 and 2012 Productivity Plans,
61
Table of Contents
each of which reduced operating profit growth by 2 percentage points. See Note 3 for additional information on "Other Productivity Initiatives."
2013
Net revenue increased 2%, primarily reflecting effective net pricing and volume growth. Unfavorable foreign exchange reduced net revenue growth by 1 percentage point.
Snacks volume grew 3% primarily reflecting high-single-digit growth in Turkey and South Africa, partially offset by low-single-digit declines in the United Kingdom and Spain. Additionally, Russia and the Netherlands experienced low-single-digit growth.
Beverage volume declined 1%, reflecting low-single-digit declines in Turkey, Germany and Russia, partially offset by slight growth in the United Kingdom.
Operating profit declined 3%, primarily driven by certain operating cost increases reflecting strategic initiatives, as well as higher commodity costs, primarily milk, which negatively impacted operating profit performance by 15 percentage points, partially offset by the net revenue growth and planned cost reductions across a number of expense categories. Incremental investments in our business negatively impacted operating profit performance by 2 percentage points, which was substantially offset by the impact of lapping prior year impairment charges, which positively contributed nearly 2 percentage points to operating profit performance. The impact of items affecting comparability in the above table (see "Items Affecting Comparability") negatively impacted operating profit performance by 1.5 percentage points.
PepsiCo Asia, Middle East and Africa
|
| |
| |
| | % Change | ||||||||||
| 2014 | | | 2013 | | | 2012 | | | 2014 | |
| 2013 | | |||
Net revenue | $ | 6,727 | | | $ | 6,507 | | | $ | 6,653 | | | 3 | | (2 | ) | |
Impact of foreign exchange translation | | | | | | | | 3 | | | 4 | | |||||
Net revenue growth, on a constant currency basis (a) | | | | | | | 6 | | 2 | | |||||||
|
|
|
|
|
|
|
|
|
| ||||||||
Operating profit | $ | 1,043 | | | $ | 1,174 | | | $ | 747 | | | (11 | ) | 57 | | |
Restructuring and impairment charges | 37 | | | 26 | | | 28 | | | | | | |||||
Restructuring and other charges related to the transaction with Tingyi | - | | | - | | | 150 | | | | | | | | |||
Operating profit excluding above items (a) | $ | 1,080 | | | $ | 1,200 | | | $ | 925 | | | (10 | ) | 30 | | |
Impact of foreign exchange translation | | | | | | | 2 | | | 2 | | ||||||
Operating profit growth excluding above items, on a constant currency basis (a) | | | | | | | (8 | ) | 32 | | |||||||
(a) See "Non-GAAP Measures."
2014
Net revenue grew 3%, reflecting volume growth and favorable effective net pricing, partially offset by the net impact of the refranchising of our beverage businesses in Vietnam and the Middle East, which reduced net revenue growth by 1.5 percentage points. Unfavorable foreign exchange reduced net revenue growth by 3 percentage points.
Snacks volume grew 8%, reflecting double-digit growth in China and high-single-digit growth in India, partially offset by a mid-single-digit decline in Thailand. Additionally, Australia experienced mid-single-digit growth and the Middle East experienced high-single-digit growth.
62
Table of Contents
Beverage volume grew 2%, driven by mid-single-digit growth in the Middle East and India and double-digit growth in the Philippines, partially offset by a double-digit decline in China and a low-single-digit decline in Pakistan.
Operating profit declined 11%, reflecting operating cost increases including strategic initiatives as well as the impact of lapping the prior year refranchising of our Vietnam beverage business, which negatively impacted operating performance by 12 percentage points and primarily reflected a one-time gain of $137 million. These impacts were partially offset by the net revenue growth and planned cost reductions across a number of expense categories. The lapping of incremental investments into our business in the prior year, which positively contributed 4.5 percentage points to operating profit performance, was partially offset by certain charges associated with productivity initiatives outside the scope of the 2014 and 2012 Productivity Plans, which negatively impacted operating performance by 2.5 percentage points. See Note 3 for additional information on "Other Productivity Initiatives."
2013
Net revenue declined 2%, reflecting the impact of the prior year transaction with Tingyi and the Vietnam beverage refranchising, which negatively impacted net revenue performance by 5.5 percentage points and 4 percentage points, respectively. The prior year deconsolidation of International Dairy and Juice Limited (IDJ) had a slight negative impact on net revenue performance. These impacts were offset by favorable effective net pricing and volume growth. Unfavorable foreign exchange negatively impacted net revenue performance by 4 percentage points.
Snacks volume grew 7%, reflecting double-digit growth in China and high-single-digit growth in Thailand and the Middle East, partially offset by a mid-single-digit decline in Australia. Additionally, India experienced mid-single-digit growth.
Beverage volume grew 12%, driven by double-digit growth in China (including the co-branded juice products distributed through our strategic alliance with Tingyi) and Pakistan, partially offset by a double-digit decline in Thailand. Additionally, the Middle East experienced low-single-digit growth and India experienced slight growth.
Operating profit grew 57%, reflecting the impact of lapping restructuring and other charges related to the prior year transaction with Tingyi included in the above table (see "Items Affecting Comparability") and a one-time gain of $137 million associated with the Vietnam beverage refranchising (which contributed 18 percentage points to reported operating profit growth). Excluding items affecting comparability, operating profit grew 30%, reflecting the one-time gain associated with the Vietnam beverage refranchising (which contributed 15 percentage points to operating profit growth excluding items affecting comparability). Operating profit performance also reflected the effective net pricing, volume growth and planned cost reductions across a number of expense categories, partially offset by certain operating cost increases reflecting strategic initiatives, higher advertising and marketing expenses, as well as higher commodity costs, which reduced operating profit growth by 5 percentage points. The impact of incremental investments in our business reduced operating profit growth by 7 percentage points.
Our Liquidity and Capital Resources
We believe that our cash generating capability and financial condition, together with our revolving credit facilities and other available methods of debt financing, such as commercial paper borrowings and long-term debt financing, will be adequate to meet our operating, investing and financing needs. Our primary sources of cash available to us to fund cash outflows, such as our anticipated share repurchases, dividend payments and scheduled debt maturities, include cash from operations and proceeds obtained from issuances of commercial paper and long-term debt. However, there can be no assurance that volatility in the global capital
63
Table of Contents
and credit markets will not impair our ability to access these markets on terms commercially acceptable to us, or at all. See Note 9 to our consolidated financial statements for a description of our credit facilities. See also "Unfavorable economic conditions may have an adverse impact on our business, financial condition or results of operations." in "Risk Factors" in Item 1A.
As of December 27, 2014 , we had cash, cash equivalents and short-term investments of $7.4 billion outside the U.S. In the fourth quarter of 2014, we remitted $ 6 billion of international cash to the United States through a return of basis, which was used to repay commercial paper borrowings. As a return of basis, there was no impact on our international earnings and the impact on our provision for income taxes was insignificant. To the extent foreign earnings are repatriated, such amounts would be subject to income tax liabilities, both in the U.S. and in various applicable foreign jurisdictions. In addition, currency restrictions enacted by the government in Venezuela have impacted our ability to pay dividends outside of the country from our snack and beverage operations in Venezuela. As of December 27, 2014 and December 28, 2013 , our operations in Venezuela comprised 9 % and 5% , respectively, of our cash and cash equivalents balance. For additional information on the impact of our remeasurement, see "Market Risks – Foreign Exchange" in "Our Business Risks" and "Items Affecting Comparability."
Furthermore, our cash provided from operating activities is somewhat impacted by seasonality. Working capital needs are impacted by weekly sales, which are generally highest in the third quarter due to seasonal and holiday-related sales patterns, and generally lowest in the first quarter. On a continuing basis, we consider various transactions to increase shareholder value and enhance our business results, including acquisitions, divestitures, joint ventures, share repurchases, productivity and other efficiency initiatives, and other structural changes. These transactions may result in future cash proceeds or payments.
The table below summarizes our cash activity:
| 2014 | |
| 2013 | |
| 2012 | | |||
Net cash provided by operating activities | $ | 10,506 | |
| $ | 9,688 | |
| $ | 8,479 | |
Net cash used for investing activities | $ | (4,937 | ) |
| $ | (2,625 | ) |
| $ | (3,005 | ) |
Net cash used for financing activities | $ | (8,264 | ) |
| $ | (3,789 | ) |
| $ | (3,306 | ) |
Operating Activities
During 2014, net cash provided by operating activities was $10.5 billion, compared to $9.7 billion in the prior year. The operating cash flow performance primarily reflects lapping the impact of the prior year U.S. federal net cash tax payments of $758 million, including interest, related to an agreement with the IRS resolving all open matters related to the audits for taxable years 2003 through 2009 and $226 million of cash payments for other federal, state and local tax matters related to open tax years. See Note 5 to our consolidated financial statements. This impact was partially offset by discretionary pension and retiree medical contributions, pertaining to the lump sum payments, in the United States of $388 million ($261 million after-tax) in 2014.
During 2013, net cash provided by operating activities was $9.7 billion, compared to $8.5 billion in the prior year. The operating cash flow performance primarily reflects the overlap of discretionary pension and retiree medical contributions of $1.5 billion ($1.1 billion after-tax) made in 2012, higher restructuring and cash payments related to the transaction with Tingyi in 2012 and favorable working capital comparisons to 2012. These impacts were partially offset by the tax payments described above.
Also see "Free Cash Flow" below for certain other items impacting net cash provided by operating activities.
64
Table of Contents
Investing Activities
During 2014, net cash used for investing activities was $4.9 billion, primarily reflecting net capital spending of $2.7 billion and net purchases of marketable debt securities of $2.4 billion. See Note 10 to our consolidated financial statements for further discussion of our marketable debt securities.
During 2013 , net cash used for investing activities was $ 2.6 billion , primarily reflecting $2.7 billion for net capital spending.
We expect 2015 net capital spending to be approximately $3 billion , within our long-term capital spending target of less than or equal to 5% of net revenue.
Financing Activities
During 2014 , net cash used for financing activities was $8.3 billion, primarily reflecting the return of operating cash flow to our shareholders through dividend payments and share repurchases of $8.7 billion and net payments of short-term borrowings of $2.0 billion, partially offset by net proceeds from long-term debt of $1.7 billion and proceeds from exercises of stock options of $0.8 billion.
During 2013 , net cash used for financing activities was $ 3.8 billion , primarily reflecting the return of operating cash flow to our shareholders through dividend payments and share repurchases of $6.4 billion , partially offset by net proceeds from short-term borrowings of $1.2 billion , proceeds from exercises of stock options of $1.1 billion and net proceeds from long-term debt of $0.3 billion .
We annually review our capital structure with our Board of Directors, including our dividend policy and share repurchase activity. On February 11, 2015, we announced a new share repurchase program providing for the repurchase of up to $12.0 billion of PepsiCo common stock commencing from July 1, 2015 and expiring on June 30, 2018. This repurchase program is in addition to the current $10.0 billion repurchase program authorized by our Board of Directors and publicly announced in the first quarter of 2013, which commenced on July 1, 2013 and expires on June 30, 2016. On February 11, 2015 , we also announced a 7% increase in our annualized dividend to $2.81 per share from $2.62 per share, effective with the dividend that is expected to be paid in June 2015. We expect to return a total of $8.5 billion to $9.0 billion to shareholders in 2015 through share repurchases of approximately $4.5 billion to $5.0 billion and dividends of approximately $4.0 billion.
Free Cash Flow
We focus on free cash flow as an important element in evaluating our performance. Since net capital spending is essential to our product innovation initiatives and maintaining our operational capabilities, we believe that it is a recurring and necessary use of cash. As such, we believe investors should also consider net capital spending when evaluating our cash from operating activities. Additionally, we consider certain items (included in the table below) in evaluating free cash flow. We believe investors should consider these items in evaluating our free cash flow results. Free cash flow excluding certain items is the primary measure we use to monitor cash flow performance. However, free cash flow and free cash flow excluding certain items are not measures provided by U.S. GAAP. Therefore, these measures are not, and should not be viewed as, substitutes for U.S. GAAP cash flow measures.
65
Table of Contents
The table below reconciles net cash provided by operating activities, as reflected in our cash flow statement, to our free cash flow excluding the impact of the items below.
|
|
|
|
|
|
| % Change | ||||||||
| 2014 | |
| 2013 | |
| 2012 | |
| 2014 |
| 2013 | |||
Net cash provided by operating activities | $ | 10,506 | |
| $ | 9,688 | |
| $ | 8,479 | | | 8 |
| 14 |
Capital spending | (2,859 | ) |
| (2,795 | ) |
| (2,714 | ) | |
|
|
| |||
Sales of property, plant and equipment | 115 | |
| 109 | |
| 95 | | |
|
|
| |||
Free cash flow | 7,762 | | | 7,002 | | | 5,860 | | | 11 |
| 19 | |||
Discretionary pension and retiree medical contributions (after-tax) | 274 | | | 20 | | | 1,051 | | |
|
|
| |||
Merger and integration payments (after-tax) | - | |
| 21 | |
| 63 | | |
|
|
| |||
Payments related to restructuring charges (after-tax) | 215 | | | 105 | | | 260 | | |
|
|
| |||
Net payments related to income tax settlements | - | |
| 984 | |
| - | | |
|
|
| |||
Net capital investments related to merger and integration | - | |
| (4 | ) |
| 10 | | |
|
|
| |||
Net capital investments related to restructuring plan | 8 | |
| 8 | |
| 26 | | |
|
|
| |||
Payments for restructuring and other charges related to the transaction with Tingyi (after-tax) | - | | | 26 | | | 117 | | |
|
|
| |||
Free cash flow excluding above items | $ | 8,259 | | | $ | 8,162 | | | $ | 7,387 | | | 1 |
| 10 |
In all years presented, free cash flow was used primarily to pay dividends and repurchase shares. We expect to continue to return free cash flow to our shareholders through dividends and share repurchases while maintaining Tier 1 commercial paper access, which we believe will ensure appropriate financial flexibility and ready access to global capital and credit markets at favorable interest rates. However, see "Our borrowing costs and access to capital and credit markets may be adversely affected by a downgrade or potential downgrade of our credit ratings." in "Risk Factors" in Item 1A. and "Our Business Risks" for certain factors that may impact our credit ratings or our operating cash flows.
Any downgrade of our credit ratings by a credit rating agency, especially any downgrade to below investment grade, whether or not as a result of our actions or factors which are beyond our control, could increase our future borrowing costs and impair our ability to access capital and credit markets on terms commercially acceptable to us, or at all. In addition, any downgrade of our current short-term credit ratings could impair our ability to access the commercial paper market with the same flexibility that we have experienced historically, and therefore require us to rely more heavily on more expensive types of debt financing. See "Our borrowing costs and access to capital and credit markets may be adversely affected by a downgrade or potential downgrade of our credit ratings." in "Risk Factors" in Item 1A, "Our Business Risks" and Note 9 to our consolidated financial statements.
Credit Facilities and Long-Term Contractual Commitments
See Note 9 to our consolidated financial statements for a description of our credit facilities and long-term contractual commitments.
Off-Balance-Sheet Arrangements
It is not our business practice to enter into off-balance-sheet arrangements, other than in the normal course of business. Additionally, we do not enter into off-balance-sheet transactions specifically structured to provide income or tax benefits or to avoid recognizing or disclosing assets or liabilities. See Note 9 to our consolidated financial statements.
66
Table of Contents
Consolidated Statement of Income
PepsiCo, Inc. and Subsidiaries
Fiscal years ended December 27, 2014 , December 28, 2013 and December 29, 2012
(in millions except per share amounts)
| 2014 | |
| 2013 | |
| 2012 | | |||
Net Revenue | $ | 66,683 | |
| $ | 66,415 | |
| $ | 65,492 | |
Cost of sales | 30,884 | |
| 31,243 | |
| 31,291 | | |||
Gross profit | 35,799 | |
| 35,172 | |
| 34,201 | | |||
Selling, general and administrative expenses | 26,126 | |
| 25,357 | |
| 24,970 | | |||
Amortization of intangible assets | 92 | |
| 110 | |
| 119 | | |||
Operating Profit | 9,581 | |
| 9,705 | |
| 9,112 | | |||
Interest expense | (909 | ) |
| (911 | ) |
| (899 | ) | |||
Interest income and other | 85 | |
| 97 | |
| 91 | | |||
Income before income taxes | 8,757 | |
| 8,891 | |
| 8,304 | | |||
Provision for income taxes | 2,199 | |
| 2,104 | |
| 2,090 | | |||
Net income | 6,558 | |
| 6,787 | |
| 6,214 | | |||
Less: Net income attributable to noncontrolling interests | 45 | |
| 47 | |
| 36 | | |||
Net Income Attributable to PepsiCo | $ | 6,513 | |
| $ | 6,740 | |
| $ | 6,178 | |
Net Income Attributable to PepsiCo per Common Share |
|
|
|
|
| ||||||
Basic | $ | 4.31 | |
| $ | 4.37 | |
| $ | 3.96 | |
Diluted | $ | 4.27 | |
| $ | 4.32 | |
| $ | 3.92 | |
Weighted-average common shares outstanding |
|
|
|
|
| ||||||
Basic | 1,509 | |
| 1,541 | |
| 1,557 | | |||
Diluted | 1,527 | |
| 1,560 | |
| 1,575 | | |||
Cash dividends declared per common share | $ | 2.5325 | |
| $ | 2.24 | |
| $ | 2.1275 | |
See accompanying notes to the consolidated financial statements.
67
Table of Contents
Consolidated Statement of Comprehensive Income
PepsiCo, Inc. and Subsidiaries
Fiscal years ended December 27, 2014 , December 28, 2013 and December 29, 2012
(in millions)
| 2014 | ||||||||||
| Pre-tax amounts |
| Tax amounts |
| After-tax amounts | ||||||
Net income | | | | | |
| $ | 6,558 | | ||
Other Comprehensive Loss |
|
|
|
|
| ||||||
Currency translation adjustment | $ | (5,010 | ) |
| $ | - | |
| (5,010 | ) | |
Cash flow hedges: |
|
|
|
|
| ||||||
Reclassification of net losses to net income | 249 | |
| (95 | ) |
| 154 | | |||
Net derivative losses | (88 | ) |
| 44 | |
| (44 | ) | |||
Pension and retiree medical: |
|
|
|
|
| ||||||
Reclassification of net losses to net income | 369 | |
| (122 | ) |
| 247 | | |||
Remeasurement of net liabilities and translation | (1,323 | ) |
| 437 | |
| (886 | ) | |||
Unrealized losses on securities | (11 | ) |
| 5 | |
| (6 | ) | |||
Other | 1 | |
| - | |
| 1 | | |||
Total Other Comprehensive Loss | $ | (5,813 | ) |
| $ | 269 | |
| (5,544 | ) | |
Comprehensive income |
|
|
|
| 1,014 | | |||||
Comprehensive income attributable to noncontrolling interests |
|
|
|
| (43 | ) | |||||
Comprehensive Income Attributable to PepsiCo |
|
|
|
| $ | 971 | | ||||
| 2013 | ||||||||||
| Pre-tax amounts |
| Tax amounts |
| After-tax amounts | ||||||
Net income | | | | | |
| $ | 6,787 | | ||
Other Comprehensive Income |
|
|
|
|
| ||||||
Currency translation adjustment | $ | (1,303 | ) |
| $ | - | |
| (1,303 | ) | |
Cash flow hedges: |
|
|
|
|
| ||||||
Reclassification of net losses to net income | 45 | |
| (17 | ) |
| 28 | | |||
Net derivative losses | (20 | ) |
| 10 | |
| (10 | ) | |||
Pension and retiree medical: |
|
|
|
|
| ||||||
Reclassification of net losses to net income | 353 | |
| (123 | ) |
| 230 | | |||
Remeasurement of net liabilities and translation | 2,164 | |
| (764 | ) |
| 1,400 | | |||
Unrealized gains on securities | 57 | |
| (28 | ) |
| 29 | | |||
Other | - | |
| (16 | ) |
| (16 | ) | |||
Total Other Comprehensive Income | $ | 1,296 | |
| $ | (938 | ) |
| 358 | | |
Comprehensive income |
|
|
|
| 7,145 | | |||||
Comprehensive income attributable to noncontrolling interests |
|
|
|
| (45 | ) | |||||
Comprehensive Income Attributable to PepsiCo |
|
|
|
| $ | 7,100 | | ||||
| 2012 | ||||||||||
| Pre-tax amounts |
| Tax amounts |
| After-tax amounts | ||||||
Net income | | | |
| $ | 6,214 | | ||||
Other Comprehensive Income |
|
|
|
|
| ||||||
Currency translation adjustment | $ | 737 | |
| $ | - | |
| 737 | | |
Cash flow hedges: |
|
|
|
|
| ||||||
Reclassification of net losses to net income | 90 | |
| (32 | ) |
| 58 | | |||
Net derivative losses | (50 | ) |
| 10 | |
| (40 | ) | |||
Pension and retiree medical: |
|
|
|
|
| ||||||
Reclassification of net losses to net income | 508 | |
| (87 | ) |
| 421 | | |||
Remeasurement of net liabilities and translation | (581 | ) |
| 88 | |
| (493 | ) | |||
Unrealized gains on securities | 18 | |
| - | |
| 18 | | |||
Other | - | |
| 36 | |
| 36 | | |||
Total Other Comprehensive Income | $ | 722 | |
| $ | 15 | |
| 737 | | |
Comprehensive income |
|
|
|
| 6,951 | | |||||
Comprehensive income attributable to noncontrolling interests |
|
|
|
| (31 | ) | |||||
Comprehensive Income Attributable to PepsiCo |
|
|
|
| $ | 6,920 | | ||||
See accompanying notes to the consolidated financial statements .
68
Table of Contents
Consolidated Statement of Cash Flows
PepsiCo, Inc. and Subsidiaries
Fiscal years ended December 27, 2014 , December 28, 2013 and December 29, 2012
(in millions)
| 2014 | |
| 2013 | |
| 2012 | | |||
Operating Activities |
|
|
|
|
| ||||||
Net income | $ | 6,558 | |
| $ | 6,787 | |
| $ | 6,214 | |
Depreciation and amortization | 2,625 | |
| 2,663 | |
| 2,689 | | |||
Stock-based compensation expense | 297 | |
| 303 | |
| 278 | | |||
Merger and integration charges | - | |
| 10 | |
| 16 | | |||
Cash payments for merger and integration charges | - | |
| (25 | ) |
| (83 | ) | |||
Restructuring and impairment charges | 418 | |
| 163 | |
| 279 | | |||
Cash payments for restructuring charges | (266 | ) |
| (133 | ) |
| (343 | ) | |||
Restructuring and other charges related to the transaction with Tingyi | - | |
| - | |
| 176 | | |||
Cash payments for restructuring and other charges related to the transaction with Tingyi | - | |
| (26 | ) |
| (109 | ) | |||
Venezuela remeasurement charges | 105 | |
| 111 | |
| - | | |||
Excess tax benefits from share-based payment arrangements | (114 | ) |
| (117 | ) |
| (124 | ) | |||
Pension and retiree medical plan expenses | 667 | |
| 663 | |
| 796 | | |||
Pension and retiree medical plan contributions | (655 | ) |
| (262 | ) |
| (1,865 | ) | |||
Deferred income taxes and other tax charges and credits | (19 | ) |
| (1,058 | ) |
| 321 | | |||
Change in assets and liabilities: |
|
|
|
|
| ||||||
Accounts and notes receivable | (343 | ) |
| (88 | ) |
| (250 | ) | |||
Inventories | (111 | ) |
| 4 | |
| 144 | | |||
Prepaid expenses and other current assets | 80 | |
| (51 | ) |
| 89 | | |||
Accounts payable and other current liabilities | 1,162 | |
| 1,007 | |
| 548 | | |||
Income taxes payable | 371 | |
| 86 | |
| (97 | ) | |||
Other, net | (269 | ) |
| (349 | ) |
| (200 | ) | |||
Net Cash Provided by Operating Activities | 10,506 | |
| 9,688 | |
| 8,479 | | |||
|
|
|
|
|
| ||||||
Investing Activities |
|
|
|
|
| ||||||
Capital spending | (2,859 | ) |
| (2,795 | ) |
| (2,714 | ) | |||
Sales of property, plant and equipment | 115 | |
| 109 | |
| 95 | | |||
Cash payments related to the transaction with Tingyi | - | |
| (3 | ) |
| (306 | ) | |||
Acquisitions and investments in noncontrolled affiliates | (88 | ) |
| (109 | ) |
| (121 | ) | |||
Divestitures | 203 | |
| 133 | |
| (32 | ) | |||
Short-term investments, by original maturity |
|
|
|
|
| ||||||
More than three months - purchases | (6,305 | ) |
| - | |
| - | | |||
More than three months - maturities | 3,891 | |
| - | |
| - | | |||
Three months or less, net | 116 | |
| 61 | |
| 61 | | |||
Other investing, net | (10 | ) |
| (21 | ) |
| 12 | | |||
Net Cash Used for Investing Activities | (4,937 | ) |
| (2,625 | ) |
| (3,005 | ) | |||
(Continued on following page)
69
Table of Contents
Consolidated Statement of Cash Flows (continued)
PepsiCo, Inc. and Subsidiaries
Fiscal years ended December 27, 2014 , December 28, 2013 and December 29, 2012
(in millions)
| 2014 | |
| 2013 | |
| 2012 | | |||
Financing Activities |
|
|
|
|
| ||||||
Proceeds from issuances of long-term debt | $ | 3,855 | |
| $ | 4,195 | |
| $ | 5,999 | |
Payments of long-term debt | (2,189 | ) |
| (3,894 | ) |
| (2,449 | ) | |||
Short-term borrowings, by original maturity |
|
|
|
|
| ||||||
More than three months - proceeds | 50 | |
| 23 | |
| 549 | | |||
More than three months - payments | (10 | ) |
| (492 | ) |
| (248 | ) | |||
Three months or less, net | (2,037 | ) |
| 1,634 | |
| (1,762 | ) | |||
Cash dividends paid | (3,730 | ) |
| (3,434 | ) |
| (3,305 | ) | |||
Share repurchases - common | (5,012 | ) |
| (3,001 | ) |
| (3,219 | ) | |||
Share repurchases - preferred | (10 | ) |
| (7 | ) |
| (7 | ) | |||
Proceeds from exercises of stock options | 755 | |
| 1,123 | |
| 1,122 | | |||
Excess tax benefits from share-based payment arrangements | 114 | |
| 117 | |
| 124 | | |||
Acquisition of noncontrolling interests | - | |
| (20 | ) |
| (68 | ) | |||
Other financing | (50 | ) |
| (33 | ) |
| (42 | ) | |||
Net Cash Used for Financing Activities | (8,264 | ) |
| (3,789 | ) |
| (3,306 | ) | |||
Effect of exchange rate changes on cash and cash equivalents | (546 | ) |
| (196 | ) |
| 62 | | |||
Net (Decrease)/Increase in Cash and Cash Equivalents | (3,241 | ) |
| 3,078 | |
| 2,230 | | |||
Cash and Cash Equivalents, Beginning of Year | 9,375 | |
| 6,297 | |
| 4,067 | | |||
Cash and Cash Equivalents, End of Year | $ | 6,134 | |
| $ | 9,375 | |
| $ | 6,297 | |
See accompanying notes to the consolidated financial statements.
70
Table of Contents
Consolidated Balance Sheet
PepsiCo, Inc. and Subsidiaries
December 27, 2014 and December 28, 2013
(in millions except per share amounts)
| 2014 | |
| 2013 | | ||
ASSETS |
|
|
| ||||
Current Assets |
|
|
| ||||
Cash and cash equivalents | $ | 6,134 | |
| $ | 9,375 | |
Short-term investments | 2,592 | |
| 303 | | ||
Accounts and notes receivable, net | 6,651 | |
| 6,954 | | ||
Inventories | 3,143 | |
| 3,409 | | ||
Prepaid expenses and other current assets | 2,143 | |
| 2,162 | | ||
Total Current Assets | 20,663 | |
| 22,203 | | ||
Property, Plant and Equipment, net | 17,244 | |
| 18,575 | | ||
Amortizable Intangible Assets, net | 1,449 | |
| 1,638 | | ||
Goodwill | 14,965 | |
| 16,613 | | ||
Other nonamortizable intangible assets | 12,639 | |
| 14,401 | | ||
Nonamortizable Intangible Assets | 27,604 | |
| 31,014 | | ||
Investments in Noncontrolled Affiliates | 2,689 | |
| 2,623 | | ||
Other Assets | 860 | |
| 1,425 | | ||
Total Assets | $ | 70,509 | |
| $ | 77,478 | |
|
|
|
| ||||
LIABILITIES AND EQUITY |
|
|
| ||||
Current Liabilities |
|
|
| ||||
Short-term obligations | $ | 5,076 | |
| $ | 5,306 | |
Accounts payable and other current liabilities | 13,016 | |
| 12,533 | | ||
Total Current Liabilities | 18,092 | |
| 17,839 | | ||
Long-Term Debt Obligations | 23,821 | |
| 24,333 | | ||
Other Liabilities | 5,744 | |
| 4,931 | | ||
Deferred Income Taxes | 5,304 | |
| 5,986 | | ||
Total Liabilities | 52,961 | |
| 53,089 | | ||
Commitments and contingencies | | |
| | | ||
Preferred Stock, no par value | 41 | |
| 41 | | ||
Repurchased Preferred Stock | (181 | ) |
| (171 | ) | ||
PepsiCo Common Shareholders' Equity |
|
|
| ||||
Common stock, par value 1 2 / 3 ¢ per share (authorized 3,600 shares, issued, net of repurchased common stock at par value: 1,488 and 1,529 shares, respectively) | 25 | |
| 25 | | ||
Capital in excess of par value | 4,115 | |
| 4,095 | | ||
Retained earnings | 49,092 | |
| 46,420 | | ||
Accumulated other comprehensive loss | (10,669 | ) |
| (5,127 | ) | ||
Repurchased common stock, in excess of par value (378 and 337 shares, respectively) | (24,985 | ) |
| (21,004 | ) | ||
Total PepsiCo Common Shareholders' Equity | 17,578 | |
| 24,409 | | ||
Noncontrolling interests | 110 | |
| 110 | | ||
Total Equity | 17,548 | |
| 24,389 | | ||
Total Liabilities and Equity | $ | 70,509 | |
| $ | 77,478 | |
See accompanying notes to the consolidated financial statements.
71
Table of Contents
Consolidated Statement of Equity
PepsiCo, Inc. and Subsidiaries
Fiscal years ended December 27, 2014 , December 28, 2013 and December 29, 2012
(in millions)
| 2014 |
| 2013 |
| 2012 | |||||||||||||||
| Shares | |
| Amount | |
| Shares | |
| Amount | |
| Shares | |
| Amount | | |||
Preferred Stock | 0.8 | |
| $ | 41 | |
| 0.8 | |
| $ | 41 | |
| 0.8 | |
| $ | 41 | |
Repurchased Preferred Stock |
|
|
|
|
|
|
|
|
|
|
| |||||||||
Balance, beginning of year | (0.6 | ) |
| (171 | ) |
| (0.6 | ) |
| (164 | ) |
| (0.6 | ) |
| (157 | ) | |||
Redemptions | (0.1 | ) |
| (10 | ) |
| - | |
| (7 | ) |
| - | |
| (7 | ) | |||
Balance, end of year | (0.7 | ) |
| (181 | ) |
| (0.6 | ) |
| (171 | ) |
| (0.6 | ) |
| (164 | ) | |||
Common Stock |
|
|
|
|
|
|
|
|
|
|
| |||||||||
Balance, beginning of year | 1,529 | |
| 25 | |
| 1,544 | |
| 26 | |
| 1,565 | |
| 26 | | |||
Repurchased common stock | (41 | ) | | - | | | (15 | ) | | (1 | ) | | (21 | ) | | - | | |||
Balance, end of year | 1,488 | |
| 25 | |
| 1,529 | |
| 25 | |
| 1,544 | |
| 26 | | |||
Capital in Excess of Par Value |
|
|
|
|
|
|
|
|
|
|
| |||||||||
Balance, beginning of year |
|
| 4,095 | |
|
|
| 4,178 | |
|
|
| 4,461 | | ||||||
Stock-based compensation expense |
|
| 297 | |
|
|
| 303 | |
|
|
| 278 | | ||||||
Stock option exercises, RSUs, PSUs and PEPunits converted (a) |
|
| (200 | ) |
|
|
| (287 | ) |
|
|
| (431 | ) | ||||||
Withholding tax on RSUs and PSUs converted |
|
| (91 | ) |
|
|
| (87 | ) |
|
|
| (70 | ) | ||||||
Other |
|
| 14 | |
|
|
| (12 | ) |
|
|
| (60 | ) | ||||||
Balance, end of year |
|
| 4,115 | |
|
|
| 4,095 | |
|
|
| 4,178 | | ||||||
Retained Earnings |
|
|
|
|
|
|
|
|
|
|
| |||||||||
Balance, beginning of year |
|
| 46,420 | |
|
|
| 43,158 | |
|
|
| 40,316 | | ||||||
Net income attributable to PepsiCo |
|
| 6,513 | |
|
|
| 6,740 | |
|
|
| 6,178 | | ||||||
Cash dividends declared – common |
|
| (3,814 | ) |
|
|
| (3,451 | ) |
|
|
| (3,312 | ) | ||||||
Cash dividends declared – preferred |
|
| (1 | ) |
|
|
| (1 | ) |
|
|
| (1 | ) | ||||||
Cash dividends declared – RSUs and PSUs |
|
| (26 | ) |
|
|
| (26 | ) |
|
|
| (23 | ) | ||||||
Balance, end of year |
|
| 49,092 | |
|
|
| 46,420 | |
|
|
| 43,158 | | ||||||
Accumulated Other Comprehensive Loss |
|
|
|
|
|
|
|
|
|
|
| |||||||||
Balance, beginning of year |
|
| (5,127 | ) |
|
|
| (5,487 | ) |
|
|
| (6,229 | ) | ||||||
Currency translation adjustment |
|
| (5,008 | ) |
|
|
| (1,301 | ) |
|
|
| 742 | | ||||||
Cash flow hedges, net of tax: |
|
|
|
|
|
|
|
|
|
|
| |||||||||
Reclassification of net losses to net income |
|
| 154 | |
|
|
| 28 | |
|
|
| 58 | | ||||||
Net derivative losses |
|
| (44 | ) |
|
|
| (10 | ) |
|
|
| (40 | ) | ||||||
Pension and retiree medical, net of tax: |
|
|
|
|
|
|
|
|
|
|
| |||||||||
Reclassification of net losses to net income |
|
| 247 | |
|
|
| 230 | |
|
|
| 421 | | ||||||
Remeasurement of net liabilities and translation |
|
| (886 | ) |
|
|
| 1,400 | |
|
|
| (493 | ) | ||||||
Unrealized (losses)/gains on securities, net of tax |
|
| (6 | ) |
|
|
| 29 | |
|
|
| 18 | | ||||||
Other |
|
| 1 | |
|
|
| (16 | ) |
|
|
| 36 | | ||||||
Balance, end of year |
|
| (10,669 | ) |
|
|
| (5,127 | ) |
|
|
| (5,487 | ) | ||||||
Repurchased Common Stock |
|
|
|
|
|
|
|
|
|
|
| |||||||||
Balance, beginning of year | (337 | ) |
| (21,004 | ) |
| (322 | ) |
| (19,458 | ) |
| (301 | ) |
| (17,870 | ) | |||
Share repurchases | (57 | ) |
| (5,012 | ) |
| (37 | ) |
| (3,000 | ) |
| (47 | ) |
| (3,219 | ) | |||
Stock option exercises | 13 | |
| 866 | |
| 20 | |
| 1,301 | |
| 24 | |
| 1,488 | | |||
Other | 3 | |
| 165 | |
| 2 | |
| 153 | |
| 2 | |
| 143 | | |||
Balance, end of year | (378 | ) |
| (24,985 | ) |
| (337 | ) |
| (21,004 | ) |
| (322 | ) |
| (19,458 | ) | |||
Total PepsiCo Common Shareholders' Equity |
|
| 17,578 | |
|
|
| 24,409 | |
|
|
| 22,417 | | ||||||
Noncontrolling Interests |
|
|
|
|
|
|
|
|
|
|
| |||||||||
Balance, beginning of year |
|
| 110 | |
|
|
| 105 | |
|
|
| 311 | | ||||||
Net income attributable to noncontrolling interests |
|
| 45 | |
|
|
| 47 | |
|
|
| 36 | | ||||||
Distributions to noncontrolling interests |
|
| (41 | ) |
|
|
| (34 | ) |
|
|
| (37 | ) | ||||||
Currency translation adjustment |
|
| (2 | ) |
|
|
| (2 | ) |
|
|
| (5 | ) | ||||||
Acquisitions and divestitures |
|
| - | |
|
|
| (6 | ) |
|
|
| (200 | ) | ||||||
Other, net |
|
| (2 | ) |
|
|
| - | |
|
|
| - | | ||||||
Balance, end of year |
|
| 110 | |
|
|
| 110 | |
|
|
| 105 | | ||||||
Total Equity |
|
| $ | 17,548 | |
|
|
| $ | 24,389 | |
|
|
| $ | 22,399 | | |||
(a) Includes total tax benefits of $74 million in 2014 , $45 million in 2013 and $84 million in 2012 .
See accompanying notes to the consolidated financial statements.
72
Table of Contents
Notes to Consolidated Financial Statements
Note 1 - Basis of Presentation and Our Divisions
Basis of Presentation
The accompanying financial statements have been prepared in accordance with U.S. GAAP and include the consolidated accounts of PepsiCo, Inc. and the affiliates that we control. In addition, we include our share of the results of certain other affiliates using the equity method based on our economic ownership interest, our ability to exercise significant influence over the operating or financial decisions of these affiliates or our ability to direct their economic resources. We do not control these other affiliates, as our ownership in these other affiliates is generally 50% or less. Intercompany balances and transactions are eliminated. Our fiscal year ends on the last Saturday of each December, resulting in an additional week of results every five or six years.
The results of our Venezuelan businesses have been reported under highly inflationary accounting since the beginning of 2010. See further unaudited information in "Our Business Risks," "Items Affecting Comparability" and "Our Liquidity and Capital Resources" in Management's Discussion and Analysis of Financial Condition and Results of Operations.
Raw materials, direct labor and plant overhead, as well as purchasing and receiving costs, costs directly related to production planning, inspection costs and raw material handling facilities, are included in cost of sales. The costs of moving, storing and delivering finished product are included in selling, general and administrative expenses.
The preparation of our consolidated financial statements requires us to make estimates and assumptions that affect reported amounts of assets, liabilities, revenues, expenses and disclosure of contingent assets and liabilities. Estimates are used in determining, among other items, sales incentives accruals, tax reserves, stock-based compensation, pension and retiree medical accruals, amounts and useful lives for intangible assets, and future cash flows associated with impairment testing for perpetual brands, goodwill and other long-lived assets. We evaluate our estimates on an ongoing basis using our historical experience, as well as other factors we believe appropriate under the circumstances, such as current economic conditions, and adjust or revise our estimates as circumstances change. As future events and their effect cannot be determined with precision, actual results could differ significantly from these estimates.
While our United States and Canada (North America) results are reported on a weekly calendar basis, most of our international operations report on a monthly calendar basis. The following chart details our quarterly reporting schedule for all reporting periods presented:
Quarter |
| U.S. and Canada |
| International |
First Quarter |
| 12 weeks |
| January, February |
Second Quarter |
| 12 weeks |
| March, April and May |
Third Quarter |
| 12 weeks |
| June, July and August |
Fourth Quarter |
| 16 weeks |
| September, October, November and December |
See "Our Divisions" below, and for additional unaudited information on items affecting the comparability of our consolidated results, see further unaudited information in "Items Affecting Comparability" in Management's Discussion and Analysis of Financial Condition and Results of Operations.
73
Table of Contents
Tabular dollars are in millions, except per share amounts. All per share amounts reflect common per share amounts, assume dilution unless noted, and are based on unrounded amounts. Certain reclassifications were made to prior years' amounts to conform to the current year presentation.
Our Divisions
Through our operations, authorized bottlers, contract manufacturers and other third parties, we make, market, sell and distribute a wide variety of convenient and enjoyable foods and beverages, serving customers and consumers in more than 200 countries and territories with our largest operations in North America, Russia, Mexico, the United Kingdom and Brazil. Division results are based on how our Chief Executive Officer assesses the performance of and allocates resources to our divisions. For additional unaudited information on our divisions, see "Our Operations" contained in "Item 1. Business." The accounting policies for the divisions are the same as those described in Note 2, except for the following allocation methodologies:
• | stock-based compensation expense; |
• | pension and retiree medical expense; and |
• | derivatives. |
Stock-Based Compensation Expense
Our divisions are held accountable for stock-based compensation expense and, therefore, this expense is allocated to our divisions as an incremental employee compensation cost. The allocation of stock-based compensation expense in 2014 was approximately 15% to FLNA, 2% to QFNA, 6% to LAF, 24% to PAB, 13% to Europe, 10% to AMEA and 30% to corporate unallocated expenses. We had similar allocations of stock-based compensation expense to our divisions in 2013 and 2012 . The expense allocated to our divisions excludes any impact of changes in our assumptions during the year which reflect market conditions over which division management has no control. Therefore, any variances between allocated expense and our actual expense are recognized in corporate unallocated expenses.
Pension and Retiree Medical Expense
Pension and retiree medical service costs measured at a fixed discount rate, as well as amortization of costs related to certain pension plan amendments and gains and losses due to demographics (including mortality assumptions and salary experience) are reflected in division results for North American employees. Division results also include interest costs, measured at a fixed discount rate, for retiree medical plans. Interest costs for the pension plans, pension asset returns and the impact of pension funding, and gains and losses other than those due to demographics, are all reflected in corporate unallocated expenses. In addition, corporate unallocated expenses include the difference between the service costs measured at a fixed discount rate (included in division results as noted above) and the total service costs determined using the plans' discount rates as disclosed in Note 7 to our consolidated financial statements.
Derivatives
We centrally manage commodity derivatives on behalf of our divisions. These commodity derivatives include agricultural products, energy and metals. Commodity derivatives that do not qualify for hedge accounting treatment are marked to market each period with the resulting gains and losses recorded in corporate unallocated expenses, as either cost of sales or selling, general and administrative expenses, depending on the underlying commodity. These gains and losses are subsequently reflected in division results when the divisions recognize the cost of the underlying commodity in operating profit. Therefore, the divisions realize the economic effects of the derivative without experiencing any resulting mark-to-market volatility, which remains in corporate unallocated expenses. These derivatives hedge underlying commodity price risk and were not entered into for trading or speculative purposes.
74
Table of Contents
Net revenue and operating profit of each division are as follows:
| Net Revenue |
| Operating Profit (a) | ||||||||||||||||||||
| 2014 | |
| 2013 | |
| 2012 | |
| 2014 | |
| 2013 | |
| 2012 | | ||||||
FLNA | $ | 14,502 | |
| $ | 14,126 | |
| $ | 13,574 | |
| $ | 4,054 | |
| $ | 3,877 | |
| $ | 3,646 | |
QFNA | 2,568 | |
| 2,612 | |
| 2,636 | |
| 621 | |
| 617 | |
| 695 | | ||||||
LAF | 8,442 | |
| 8,350 | |
| 7,780 | |
| 1,211 | |
| 1,242 | |
| 1,059 | | ||||||
PAB | 21,154 | |
| 21,068 | |
| 21,408 | |
| 2,846 | |
| 2,955 | |
| 2,937 | | ||||||
Europe | 13,290 | |
| 13,752 | |
| 13,441 | |
| 1,331 | |
| 1,293 | |
| 1,330 | | ||||||
AMEA | 6,727 | |
| 6,507 | |
| 6,653 | |
| 1,043 | |
| 1,174 | |
| 747 | | ||||||
Total division | 66,683 | |
| 66,415 | |
| 65,492 | |
| 11,106 | |
| 11,158 | |
| 10,414 | | ||||||
Corporate Unallocated | |
| |
| |
| |
| |
| | ||||||||||||
Mark-to-market net (losses)/gains | | | | | | | (68 | ) | | (72 | ) | | 65 | | |||||||||
Restructuring and impairment charges | | | | | | | (41 | ) | | (11 | ) | | (10 | ) | |||||||||
Pension lump sum settlement charges | | | | | | | (141 | ) | | - | | | (195 | ) | |||||||||
Venezuela remeasurement charges |
|
|
|
|
|
| (126 | ) |
| (124 | ) |
| - | | |||||||||
Other | | | | | | | (1,149 | ) |
| (1,246 | ) |
| (1,162 | ) | |||||||||
| $ | 66,683 | |
| $ | 66,415 | |
| $ | 65,492 | |
| $ | 9,581 | |
| $ | 9,705 | |
| $ | 9,112 | |
(a) | For information on the impact of restructuring and impairment charges on our divisions, see Note 3 to our consolidated financial statements. See also Note 15 to our consolidated financial statements for more information on our transaction with Tingyi and refranchising of our beverage business in Vietnam in our AMEA segment. |
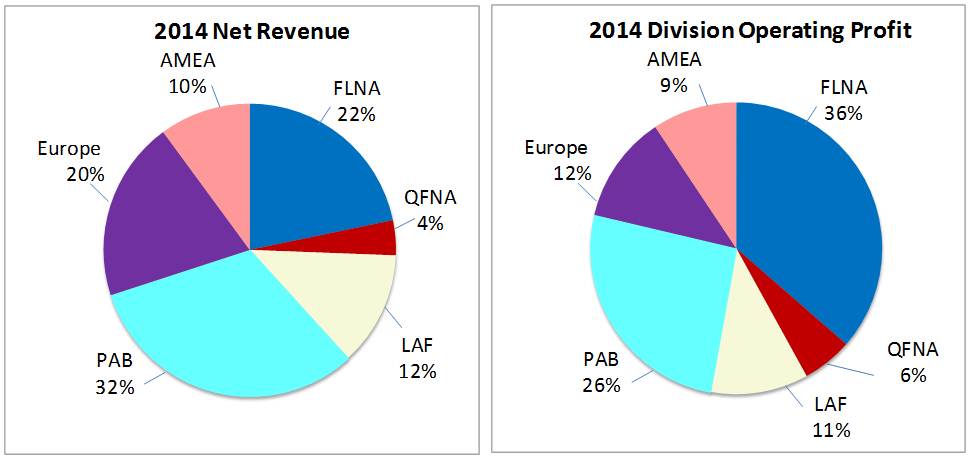
Corporate
Corporate unallocated includes costs of our corporate headquarters, centrally managed initiatives such as research and development projects, unallocated insurance and benefit programs, foreign exchange transaction gains and losses, commodity derivative gains and losses, our ongoing business transformation initiatives and certain other items.
75
Table of Contents
Other Division Information
Total assets and capital spending of each division are as follows:
| Total Assets |
| Capital Spending | ||||||||||||||||
| 2014 | | | 2013 | |
| 2014 | | | 2013 | | | 2012 | | |||||
FLNA | $ | 5,307 | | | $ | 5,308 | |
| $ | 519 | | | $ | 423 | | | $ | 365 | |
QFNA | 982 | | | 983 | |
| 58 | | | 38 | | | 37 | | |||||
LAF | 4,760 | | | 4,829 | |
| 368 | | | 384 | | | 436 | | |||||
PAB | 30,188 | | | 30,350 | |
| 719 | | | 716 | | | 702 | | |||||
Europe (a) | 13,902 | | | 18,702 | |
| 502 | | | 550 | | | 575 | | |||||
AMEA | 5,887 | | | 5,754 | |
| 517 | | | 531 | | | 510 | | |||||
Total division | 61,026 | | | 65,926 | |
| 2,683 | | | 2,642 | | | 2,625 | | |||||
Corporate (b) | 9,483 | | | 11,552 | |
| 176 | | | 153 | | | 89 | | |||||
| $ | 70,509 | | | $ | 77,478 | |
| $ | 2,859 | | | $ | 2,795 | | | $ | 2,714 | |
(a) | The change in total assets in 2014 primarily reflects the depreciation of the Russian ruble. |
(b) | Corporate assets consist principally of cash and cash equivalents, short-term investments, derivative instruments, property, plant and equipment and certain pension and tax assets. In 2014, the change in total Corporate assets was primarily due to the decrease in cash and cash equivalents and certain pension assets, partially offset by an increase in short-term investments. |
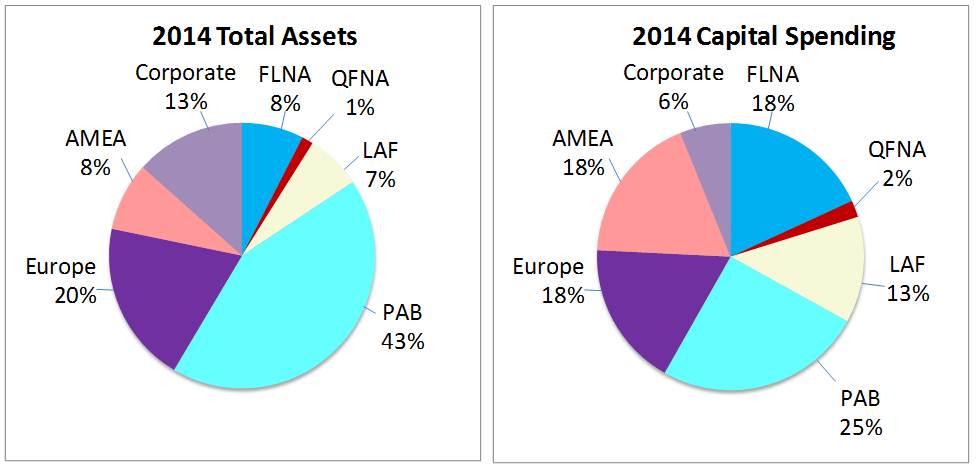
Amortization of intangible assets and depreciation and other amortization of each division are as follows:
| Amortization of Intangible | | Depreciation and | ||||||||||||||||||||
| 2014 | | | 2013 | | | 2012 | | | 2014 | | | 2013 | | | 2012 | | ||||||
FLNA | $ | 7 | | | $ | 7 | | | $ | 7 | | | $ | 424 | | | $ | 430 | | | $ | 445 | |
QFNA | - | | | - | | | - | | | 51 | | | 51 | | | 53 | | ||||||
LAF | 8 | | | 8 | | | 10 | | | 254 | | | 253 | | | 248 | | ||||||
PAB | 45 | | | 58 | | | 59 | | | 856 | | | 863 | | | 855 | | ||||||
Europe | 28 | | | 32 | | | 36 | | | 471 | | | 525 | | | 522 | | ||||||
AMEA | 4 | | | 5 | | | 7 | | | 313 | | | 283 | | | 305 | | ||||||
Total division | 92 | | | 110 | | | 119 | | | 2,369 | | | 2,405 | | | 2,428 | | ||||||
Corporate | - | | | - | | | - | | | 164 | | | 148 | | | 142 | | ||||||
| $ | 92 | | | $ | 110 | | | $ | 119 | | | $ | 2,533 | | | $ | 2,553 | | | $ | 2,570 | |
76
Table of Contents
| Net Revenue | | Long-Lived Assets (a) | ||||||||||||||||
| 2014 | | | 2013 | | | 2012 | | | 2014 | | | 2013 | | |||||
U.S. | $ | 34,219 | | | $ | 33,626 | | | $ | 33,348 | | | $ | 27,964 | | | $ | 28,157 | |
Russia (b) | 4,414 | | | 4,908 | | | 4,861 | | | 4,520 | | | 7,922 | | |||||
Mexico | 4,113 | | | 4,347 | | | 3,955 | | | 1,126 | | | 1,233 | | |||||
Canada | 3,022 | | | 3,195 | | | 3,290 | | | 2,815 | | | 3,067 | | |||||
United Kingdom | 2,174 | | | 2,115 | | | 2,102 | | | 1,155 | | | 1,219 | | |||||
Brazil | 1,790 | |
| 1,835 | |
| 1,866 | |
| 928 | |
| 1,005 | | |||||
All other countries | 16,951 | | | 16,389 | | | 16,070 | | | 10,478 | | | 11,247 | | |||||
| $ | 66,683 | | | $ | 66,415 | | | $ | 65,492 | | | $ | 48,986 | | | $ | 53,850 | |
(a) | Long-lived assets represent property, plant and equipment, nonamortizable intangible assets, amortizable intangible assets and investments in noncontrolled affiliates. These assets are reported in the country where they are primarily used. |
(b) | Change in long-lived assets in 2014 primarily reflects the depreciation of the Russian ruble. |
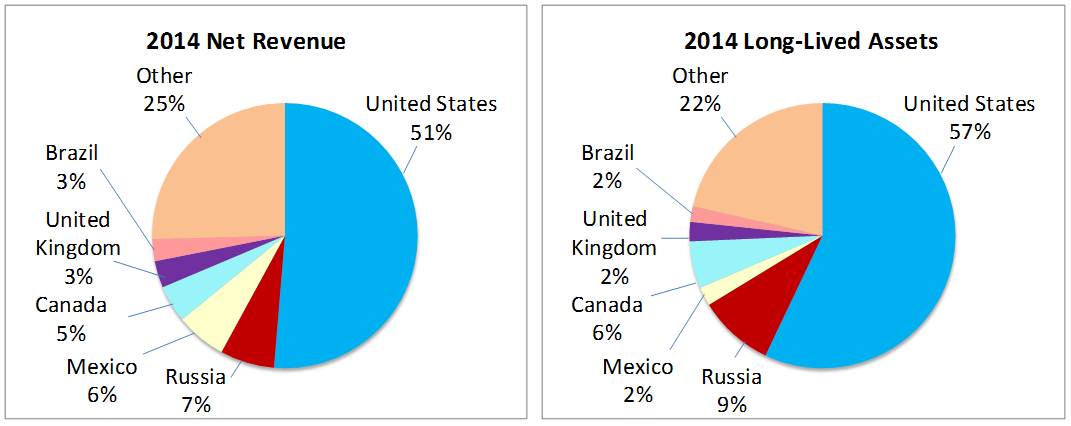
Note 2 - Our Significant Accounting Policies
Revenue Recognition
We recognize revenue upon shipment or delivery to our customers based on written sales terms that do not allow for a right of return. However, our policy for DSD and certain chilled products is to remove and replace damaged and out-of-date products from store shelves to ensure that consumers receive the product quality and freshness they expect. Similarly, our policy for certain warehouse-distributed products is to replace damaged and out-of-date products. Based on our experience with this practice, we have reserved for anticipated damaged and out-of-date products. For additional unaudited information on our revenue recognition and related policies, including our policy on bad debts, see "Our Critical Accounting Policies" in Management's Discussion and Analysis of Financial Condition and Results of Operations. We are exposed to concentration of credit risk from our customers, including Wal-Mart. In 2014 , sales to Wal-Mart (including Sam's) represented approximately 12% of our total net revenue, including concentrate sales to our independent bottlers, which are used in finished goods sold by them to Wal-Mart. We have not experienced credit issues with these customers.
Total Marketplace Spending
We offer sales incentives and discounts through various programs to customers and consumers. Total marketplace spending includes sales incentives, discounts, advertising and other marketing activities. Sales incentives and discounts are primarily accounted for as a reduction of revenue and totaled $35.8 billion in 2014 and $34.7 billion in both 2013 and 2012 . Sales incentives and discounts include payments to customers
77
Table of Contents
for performing merchandising activities on our behalf, such as payments for in-store displays, payments to gain distribution of new products, payments for shelf space and discounts to promote lower retail prices. It also includes support provided to our independent bottlers through funding of advertising and other marketing activities. While most of these incentive arrangements have terms of no more than one year, certain arrangements, such as fountain pouring rights, may extend beyond one year. Costs incurred to obtain these arrangements are recognized over the shorter of the economic or contractual life, primarily as a reduction of revenue, and the remaining balances of $355 million as of December 27, 2014 and $410 million as of December 28, 2013 are included in prepaid expenses and other current assets and other assets on our balance sheet. For additional unaudited information on our sales incentives, see "Our Critical Accounting Policies" in Management's Discussion and Analysis of Financial Condition and Results of Operations.
Advertising and other marketing activities, reported as selling, general and administrative expenses, totaled $3.9 billion in 2014 and 2013 and $3.7 billion in 2012 , including advertising expenses of $2.3 billion in 2014 , $2.4 billion in 2013 and $ 2.2 billion in 2012 . Deferred advertising costs are not expensed until the year first used and consist of:
• | media and personal service prepayments; |
• | promotional materials in inventory; and |
• | production costs of future media advertising. |
Deferred advertising costs of $42 million and $68 million as of December 27, 2014 and December 28, 2013 , respectively, are classified as prepaid expenses on our balance sheet.
Distribution Costs
Distribution costs, including the costs of shipping and handling activities, are reported as selling, general and administrative expenses. Shipping and handling expenses were $9.7 billion in 2014 , $9.4 billion in 2013 and $9.1 billion in 2012 .
Cash Equivalents
Cash equivalents are highly liquid investments with original maturities of three months or less.
Software Costs
We capitalize certain computer software and software development costs incurred in connection with developing or obtaining computer software for internal use when both the preliminary project stage is completed and it is probable that the software will be used as intended. Capitalized software costs include only (i) external direct costs of materials and services utilized in developing or obtaining computer software, (ii) compensation and related benefits for employees who are directly associated with the software project and (iii) interest costs incurred while developing internal-use computer software. Capitalized software costs are included in property, plant and equipment on our balance sheet and amortized on a straight-line basis when placed into service over the estimated useful lives of the software, which approximate 5 to 10 years. Software amortization totaled $208 million in 2014 , $197 million in 2013 and $196 million in 2012 . Net capitalized software and development costs were $0.9 billion and $1.1 billion as of December 27, 2014 and December 28, 2013 , respectively.
Commitments and Contingencies
We are subject to various claims and contingencies related to lawsuits, certain taxes and environmental matters, as well as commitments under contractual and other commercial obligations. We recognize liabilities for contingencies and commitments when a loss is probable and estimable. For additional information on our commitments, see Note 9 to our consolidated financial statements.
78
Table of Contents
Research and Development
We engage in a variety of research and development activities and continue to invest to accelerate growth to drive innovation globally. These activities principally involve production, processing and packaging and include: development of new ingredients and products; reformulation and improvement in the quality of existing products; improvement and modernization of manufacturing processes; improvements in product quality, safety and integrity; development of, and improvements in, packaging technology and dispensing equipment; and efforts focused on identifying opportunities to transform, grow and broaden our product portfolio, including the development of sweetener alternatives and flavor modifiers to reduce added sugar, and recipes that allow us to reduce sodium levels in certain of our products. We also made investments to minimize our impact on the environment, including innovation in our packaging to make it increasingly sustainable, and developed and implemented new technologies to enhance the quality and value of our current and future products, as well as made investments to incorporate into our operations best practices and technology to support sustainable agriculture and to minimize our impact on the environment. We continue to make investments to conserve energy and raw materials, reduce waste in our facilities, recycle containers, use renewable resources and optimize package design to use fewer materials. Consumer research is excluded from research and development costs and included in other marketing costs. Research and development costs were $718 million , $665 million and $552 million in 2014 , 2013 and 2012 , respectively, and are reported within selling, general and administrative expenses.
Goodwill and Other Intangible Assets
Indefinite-lived intangible assets and goodwill are not amortized and are assessed for impairment at least annually, using either a qualitative or quantitative approach. We perform this annual assessment during our third quarter. Where we use the qualitative assessment, first we determine if, based on qualitative factors, it is more likely than not that an impairment exists. Factors considered include macroeconomic, industry and competitive conditions, legal and regulatory environment, historical financial performance and significant changes in the brand or reporting unit. If the qualitative assessment indicates that it is more likely than not that an impairment exists, then a quantitative assessment is performed.
The quantitative assessment requires an analysis of several estimates including future cash flows or income consistent with management's strategic business plans, annual sales growth rates and the selection of assumptions underlying a discount rate (weighted average cost of capital) based on market data available at the time. In the quantitative assessment of indefinite-lived intangible assets, if the carrying amount of the indefinite-lived intangible asset exceeds its estimated fair value, as determined by its discounted cash flows or another income-based approach, an impairment loss is recognized in an amount equal to that excess. Quantitative assessment of goodwill is performed using a two-step impairment test at the reporting unit level. A reporting unit can be a division or business within a division. The first step compares the carrying value of a reporting unit, including goodwill, with its estimated fair value, as determined by its discounted cash flows. If the carrying value of a reporting unit exceeds its estimated fair value, we complete the second step to determine the amount of goodwill impairment loss that we should record, if any. In the second step, we determine an implied fair value of the reporting unit's goodwill by allocating the estimated fair value of the reporting unit to all of the assets and liabilities other than goodwill (including any unrecognized intangible assets). The amount of impairment loss is equal to the excess of the carrying value of the goodwill over the implied fair value of that goodwill. Quantitative assessments described above are primarily based on expected future levels of sales and operating profit which are inputs from our annual long-range planning process that are used to estimate future cash flows. Additionally, they are also impacted by estimates of discount rates, perpetuity growth assumptions and other factors. Significant management judgment is necessary to estimate the impact of competitive operating, macroeconomic and other factors to estimate future levels of sales, operating profit or cash flows. All assumptions used in our impairment evaluations for nonamortizable intangible assets, such as forecasted growth rates and weighted average cost of capital, are based on the best
79
Table of Contents
available market information and are consistent with our internal forecasts and operating plans.
Amortizable intangible assets are only evaluated for impairment upon a significant change in the operating or macroeconomic environment. If an evaluation of the undiscounted future cash flows indicates impairment, the asset is written down to its estimated fair value, which is based on its discounted future cash flows or another income-based approach.
For additional unaudited information on goodwill and other intangible assets see "Our Critical Accounting Policies" in Management's Discussion and Analysis of Financial Condition and Results of Operations.
Other Significant Accounting Policies
Our other significant accounting policies are disclosed as follows:
• | Property, Plant and Equipment and Intangible Assets – Note 4. |
• | Income Taxes – Note 5, and for additional unaudited information see "Our Critical Accounting Policies" in Management's Discussion and Analysis of Financial Condition and Results of Operations. |
• | Stock-Based Compensation – Note 6. |
• | Pension, Retiree Medical and Savings Plans – Note 7, and for additional unaudited information see "Our Critical Accounting Policies" in Management's Discussion and Analysis of Financial Condition and Results of Operations. |
• | Financial Instruments – Note 10, and for additional unaudited information, see "Our Business Risks" in Management's Discussion and Analysis of Financial Condition and Results of Operations. |
• | Inventories – Note 14. Inventories are valued at the lower of cost or market. Cost is determined using the average; first-in, first-out (FIFO) or last-in, first-out (LIFO) methods. |
• | Translation of Financial Statements of Foreign Subsidiaries – Financial statements of foreign subsidiaries are translated into U.S. dollars using period-end exchange rates for assets and liabilities and weighted-average exchange rates for revenues and expenses. Adjustments resulting from translating net assets are reported as a separate component of accumulated other comprehensive loss within common shareholders' equity as currency translation adjustment. |
Recent Accounting Pronouncements
In June 2014, the Financial Accounting Standards Board (FASB) issued accounting guidance for share-based payments when the terms of an award provide that a performance target could be achieved after the requisite service period. The guidance requires that a performance target that could be achieved after the requisite service period is treated as a performance condition that affects the vesting of the award rather than factored into the grant date fair value. The guidance is effective as of the beginning of our 2016 fiscal year and can be applied prospectively to all share-based payments granted or modified on or after the effective date with early adoption permissible. This guidance is not expected to have any impact on our financial statements.
In May 2014, the FASB issued accounting guidance on revenue recognition, which provides for a single five-step model to be applied to all revenue contracts with customers. The standard also requires additional financial statement disclosures that will enable users to understand the nature, amount, timing and uncertainty of revenue and cash flows relating to customer contracts. Companies have an option to use either a retrospective approach or cumulative effect adjustment approach to implement the standard. There is no option for early adoption. The provisions of this guidance will be effective as of the beginning of our 2017 fiscal year. We are currently evaluating the impact of the guidance on our financial statements and have not yet selected a transition approach to implement the standard.
In July 2013, the FASB issued accounting guidance that requires an entity to net its liability for unrecognized tax positions against a net operating loss carryforward, a similar tax loss or a tax credit carryforward when
80
Table of Contents
settlement in this manner is available under the tax law. The provisions of this guidance were effective as of the beginning of our 2014 fiscal year and did not have a material impact on our financial statements.
In February 2013, the FASB issued guidance that requires an entity to disclose information showing the effect of the items reclassified from accumulated other comprehensive income on the line items of net income. The provisions of this guidance were effective prospectively as of the beginning of our 2013 fiscal year. Accordingly, we included enhanced footnote disclosure for the years ended December 27, 2014 and December 28, 2013 in Note 13.
In July 2012, the FASB issued accounting guidance that permits an entity to first assess qualitative factors to determine whether it is more likely than not that an indefinite-lived intangible asset is impaired as a basis for determining whether it is necessary to perform a quantitative impairment test. An entity would continue to calculate the fair value of an indefinite-lived intangible asset if the asset fails the qualitative assessment, while no further analysis would be required if it passes. The provisions of this guidance were effective for 2013 and have had no impact on our annual indefinite-lived intangible asset impairment test results.
In December 2011, the FASB issued disclosure requirements that were intended to enhance current disclosures on offsetting financial assets and liabilities. The disclosures required an entity to disclose both gross and net information about derivative instruments accounted for in accordance with the guidance on derivatives and hedging that are eligible for offset on the balance sheet and instruments and transactions subject to an agreement similar to a master netting arrangement. The provisions of these disclosure requirements were effective as of the beginning of our 2014 fiscal year. Accordingly, we included enhanced footnote disclosure in Note 10.
Note 3 - Restructuring, Impairment and Integration Charges
2014 Multi-Year Productivity Plan
The 2014 Productivity Plan includes the next generation of productivity initiatives that we believe will strengthen our food, snack and beverage businesses by: accelerating our investment in manufacturing automation; further optimizing our global manufacturing footprint, including closing certain manufacturing facilities; re-engineering our go-to-market systems in developed markets; expanding shared services; and implementing simplified organization structures to drive efficiency. The 2014 Productivity Plan is in addition to the 2012 Productivity Plan and is expected to continue the benefits of that plan.
In 2014 and 2013 , we incurred restructuring charges of $357 million ($ 262 million after-tax or $ 0.17 per share) and $53 million ($ 39 million after-tax or $ 0.02 per share), respectively, in conjunction with our 2014 Productivity Plan. All of these charges were recorded in selling, general and administrative expenses and primarily relate to severance and other employee-related costs, asset impairments (all non-cash), and contract termination costs. Substantially all of the restructuring accrual at December 27, 2014 is expected to be paid by the end of 2015 .
81
Table of Contents
A summary of our 2014 Productivity Plan charges is as follows:
| 2014 |
| 2013 | ||||||||||||||||||||||||
| Severance and Other |
| Asset Impairments |
| Other Costs |
| Total |
| Severance and Other |
| Other Costs |
| Total | ||||||||||||||
FLNA | $ | 25 | |
| $ | 10 | |
| $ | 11 | |
| $ | 46 | |
| $ | 11 | |
| $ | - | |
| $ | 11 | |
QFNA | 12 | |
| - | |
| 2 | |
| 14 | |
| 3 | |
| - | |
| 3 | | |||||||
LAF | 12 | |
| 3 | |
| 10 | |
| 25 | |
| 5 | |
| - | |
| 5 | | |||||||
PAB | 63 | |
| 56 | |
| 56 | |
| 175 | |
| 10 | |
| - | |
| 10 | | |||||||
Europe | 24 | |
| 4 | |
| 14 | |
| 42 | |
| 10 | |
| - | |
| 10 | | |||||||
AMEA | 14 | |
| - | |
| 8 | |
| 22 | |
| 1 | |
| - | |
| 1 | | |||||||
Corporate (a) | (2 | ) |
| - | |
| 35 | |
| 33 | |
| 12 | |
| 1 | |
| 13 | | |||||||
| $ | 148 | |
| $ | 73 | |
| $ | 136 | |
| $ | 357 | |
| $ | 52 | |
| $ | 1 | |
| $ | 53 | |
(a) | Income amount represents adjustments of previously recorded amounts. |
A summary of our 2014 Productivity Plan activity is as follows:
| Severance and Other |
| Asset Impairments |
| Other Costs |
| Total | ||||||||
2013 restructuring charges | $ | 52 | |
| $ | - | |
| $ | 1 | |
| $ | 53 | |
Non-cash charges | (22 | ) |
| - | |
| - | |
| (22 | ) | ||||
Liability as of December 28, 2013 | 30 | |
| - | |
| 1 | |
| 31 | | ||||
2014 restructuring charges | 148 | |
| 73 | |
| 136 | |
| 357 | | ||||
Cash payments | (56 | ) |
| - | |
| (109 | ) |
| (165 | ) | ||||
Non-cash charges | (33 | ) |
| (73 | ) |
| (4 | ) |
| (110 | ) | ||||
Liability as of December 27, 2014 | $ | 89 | |
| $ | - | |
| $ | 24 | |
| $ | 113 | |
2012 Multi-Year Productivity Plan
The 2012 Productivity Plan includes actions in every aspect of our business that we believe will strengthen our complementary food, snack and beverage businesses by: leveraging new technologies and processes across PepsiCo's operations, go-to-market and information systems; heightening the focus on best practice sharing across the globe; consolidating manufacturing, warehouse and sales facilities; and implementing simplified organization structures, with wider spans of control and fewer layers of management. The 2012 Productivity Plan continues to enhance PepsiCo's cost-competitiveness and provide a source of funding for future brand-building and innovation initiatives.
In 2014 , 2013 and 2012 , we incurred restructuring charges of $61 million ($ 54 million after-tax or $ 0.04 per share), $110 million ( $90 million after-tax or $ 0.06 per share) and $279 million ($ 215 million after-tax or $ 0.14 per share), respectively, in conjunction with our 2012 Productivity Plan. All of these charges were recorded in selling, general and administrative expenses and primarily relate to severance and other employee-related costs, asset impairments (all non-cash), and contract termination costs. All of the restructuring accrual at December 27, 2014 is expected to be paid by the end of 2015 .
82
Table of Contents
A summary of our 2012 Productivity Plan charges is as follows:
|
| 2014 |
| 2013 |
| 2012 | ||||||||||||||||||||||||||||||||||||||||||
|
| Severance and Other |
| Asset Impairments |
| Other Costs |
| Total |
| Severance and Other |
| Asset Impairments |
| Other Costs |
| Total |
| Severance and Other |
| Asset Impairments |
| Other Costs |
| Total | ||||||||||||||||||||||||
FLNA (a) |
| $ | (1 | ) |
| $ | - | |
| $ | 3 | |
| $ | 2 | |
| $ | 4 | |
| $ | - | |
| $ | 4 | |
| $ | 8 | |
| $ | 14 | |
| $ | 8 | |
| $ | 16 | |
| $ | 38 | |
QFNA |
| - | |
| - | |
| - | |
| - | |
| - | |
| - | |
| 1 | |
| 1 | |
| - | |
| - | |
| 9 | |
| 9 | | ||||||||||||
LAF (a) |
| 19 | |
| - | |
| (19 | ) |
| - | |
| 5 | |
| 2 | |
| - | |
| 7 | |
| 15 | |
| 8 | |
| 27 | |
| 50 | | ||||||||||||
PAB |
| (3 | ) |
| 1 | |
| 9 | |
| 7 | |
| 8 | |
| - | |
| 13 | |
| 21 | |
| 34 | |
| 43 | |
| 25 | |
| 102 | | ||||||||||||
Europe |
| 6 | |
| 5 | |
| 18 | |
| 29 | |
| 36 | |
| 2 | |
| 12 | |
| 50 | |
| 14 | |
| 16 | |
| 12 | |
| 42 | | ||||||||||||
AMEA |
| 12 | |
| - | |
| 3 | |
| 15 | |
| 21 | |
| 2 | |
| 2 | |
| 25 | |
| 18 | |
| - | |
| 10 | |
| 28 | | ||||||||||||
Corporate (a) |
| (2 | ) |
| - | |
| 10 | |
| 8 | |
| - | |
| - | |
| (2 | ) |
| (2 | ) |
| (6 | ) |
| - | |
| 16 | |
| 10 | | ||||||||||||
|
| $ | 31 | |
| $ | 6 | |
| $ | 24 | |
| $ | 61 | |
| $ | 74 | |
| $ | 6 | |
| $ | 30 | |
| $ | 110 | |
| $ | 89 | |
| $ | 75 | |
| $ | 115 | |
| $ | 279 | |
(a) | Income amounts represent adjustments of previously recorded amounts. |
A summary of our 2012 Productivity Plan activity is as follows:
| Severance and Other |
| Asset Impairments |
| Other Costs |
| Total | ||||||||
Liability as of December 31, 2011 | $ | 249 | |
| $ | - | |
| $ | 27 | |
| $ | 276 | |
2012 restructuring charges | 89 | |
| 75 | |
| 115 | |
| 279 | | ||||
Cash payments | (239 | ) |
| - | |
| (104 | ) |
| (343 | ) | ||||
Non-cash charges | (8 | ) |
| (75 | ) |
| (2 | ) |
| (85 | ) | ||||
Liability as of December 29, 2012 | 91 | |
| - | |
| 36 | |
| 127 | | ||||
2013 restructuring charges | 74 | |
| 6 | |
| 30 | |
| 110 | | ||||
Cash payments | (89 | ) |
| - | |
| (44 | ) |
| (133 | ) | ||||
Non-cash charges | (8 | ) |
| (6 | ) |
| (5 | ) |
| (19 | ) | ||||
Liability as of December 28, 2013 | 68 | |
| - | |
| 17 | |
| 85 | | ||||
2014 restructuring charges | 31 | |
| 6 | |
| 24 | |
| 61 | | ||||
Cash payments | (65 | ) |
| - | |
| (36 | ) |
| (101 | ) | ||||
Non-cash charges | (6 | ) |
| (6 | ) |
| - | |
| (12 | ) | ||||
Liability as of December 27, 2014 | $ | 28 | |
| $ | - | |
| $ | 5 | |
| $ | 33 | |
Other Productivity Initiatives
In 2014, the Company incurred pre-tax charges of $67 million ( $54 million after-tax or $0.04 per share) related to productivity and efficiency initiatives outside the scope of the 2014 and 2012 Productivity Plans discussed above, including $11 million in LAF, $26 million in Europe and $30 million in AMEA. These charges were primarily recorded in selling, general and administrative expenses and reflect severance and other employee-related costs. These initiatives were excluded from Items Affecting Comparability. See additional unaudited information in "Results of Operations – Division Review" in Management's Discussion and Analysis of Financial Condition and Results of Operations.
83
Table of Contents
Note 4 - Property, Plant and Equipment and Intangible Assets
A summary of our property, plant and equipment is as follows:
| Average |
| 2014 | |
| 2013 | |
| 2012 | | |||
Property, plant and equipment, net | |
|
|
| |
| | ||||||
Land | |
| $ | 1,288 | |
| $ | 1,340 | |
| | ||
Buildings and improvements | 15 – 44 |
| 8,114 | |
| 8,375 | |
| | ||||
Machinery and equipment, including fleet and software | 5 – 15 |
| 25,146 | |
| 25,415 | |
| | ||||
Construction in progress | |
| 1,752 | |
| 1,831 | |
| | ||||
| |
| 36,300 | |
| 36,961 | |
| | ||||
Accumulated depreciation | |
| (19,056 | ) |
| (18,386 | ) |
| | ||||
| |
| $ | 17,244 | |
| $ | 18,575 | |
| | ||
Depreciation expense | |
| $ | 2,441 | |
| $ | 2,472 | |
| $ | 2,489 | |
Property, plant and equipment is recorded at historical cost. Depreciation and amortization are recognized on a straight-line basis over an asset's estimated useful life. Land is not depreciated and construction in progress is not depreciated until ready for service.
A summary of our amortizable intangible assets is as follows:
|
| | 2014 | | 2013 |
| 2012 | ||||||||||||||||||||||
Amortizable intangible assets, net | Average | | Gross | | Accumulated | | Net | | Gross | | Accumulated |
| Net |
| | ||||||||||||||
Acquired franchise rights | 56 – 60 | | $ | 879 | | | $ | (89 | ) | | $ | 790 | | | $ | 910 | | | $ | (83 | ) |
| $ | 827 | |
| | ||
Reacquired franchise rights | 5 – 14 | | 107 | | | (95 | ) | | 12 | | | 108 | | | (86 | ) |
| 22 | |
| | ||||||||
Brands | 20 – 40 | | 1,361 | | | (1,004 | ) | | 357 | | | 1,400 | | | (996 | ) |
| 404 | |
| | ||||||||
Other identifiable intangibles | 10 – 24 | | 595 | | | (305 | ) | | 290 | | | 686 | | | (301 | ) |
| 385 | |
| | ||||||||
| | | $ | 2,942 | | | $ | (1,493 | ) | | $ | 1,449 | | | $ | 3,104 | | | $ | (1,466 | ) |
| $ | 1,638 | |
| | ||
Amortization expense | | | | | | | $ | 92 | | | | | |
| $ | 110 | |
| $ | 119 | | ||||||||
Amortization of intangible assets for each of the next five years, based on existing intangible assets as of December 27, 2014 and using average 2014 foreign exchange rates, is expected to be as follows:
|
| 2015 | | | 2016 | | | 2017 | | | 2018 | | | 2019 | | |||||
Five-year projected amortization |
| $ | 82 | |
| $ | 74 | |
| $ | 68 | |
| $ | 66 | |
| $ | 63 | |
Depreciable and amortizable assets are only evaluated for impairment upon a significant change in the operating or macroeconomic environment. In these circumstances, if an evaluation of the undiscounted cash flows indicates impairment, the asset is written down to its estimated fair value, which is based on discounted future cash flows. Useful lives are periodically evaluated to determine whether events or circumstances have occurred which indicate the need for revision. For additional unaudited information on our policies for amortizable brands, see "Our Critical Accounting Policies" in Management's Discussion and Analysis of Financial Condition and Results of Operations.
84
Table of Contents
Nonamortizable Intangible Assets
We did not recognize any impairment charges for goodwill in each of the fiscal years ended December 27, 2014, December 28, 2013 and December 29, 2012. In 2014, we performed the impairment analysis for goodwill for all our reporting units using the qualitative approach and concluded that it was more likely than not that the estimated fair values of our reporting units were greater than their carrying amounts. After reaching this conclusion, no further testing was performed.
In 2014 and 2012, we recognized pre-tax impairment charges in Europe for nonamortizable intangible assets of $23 million in each year. We recognized no impairment charges for nonamortizable intangible assets in 2013. Based on our year-end assessment, the estimated fair values of our indefinite-lived reacquired and acquired franchise rights recorded at PAB exceed their carrying values. However, there could be an impairment of the carrying value of PAB's reacquired and acquired franchise rights if future revenues and their contribution to the operating results of PAB's CSD business do not achieve our estimated future cash flows or if macroeconomic conditions result in a future increase in the weighted-average cost of capital used to estimate fair value. We have also analyzed the impact of the recent economic and political developments in Russia on the estimated fair value of our indefinite-lived intangible assets in Russia and have concluded that there is no impairment as of December 27, 2014. However, a further deterioration in these conditions in Russia could potentially require us to record an impairment charge for these assets in the future. For additional information on our policies for nonamortizable intangible assets, see Note 2 to our consolidated financial statements.
85
Table of Contents
The change in the book value of nonamortizable intangible assets is as follows:
| Balance, |
| Acquisitions/(Divestitures) |
| Translation |
| Balance, |
| Translation |
| Balance, | ||||||||||||
FLNA | |
| |
| |
| |
| |
| | ||||||||||||
Goodwill | $ | 316 | |
| $ | - | |
| $ | (11 | ) |
| $ | 305 | |
| $ | (14 | ) |
| $ | 291 | |
Brands | 31 | |
| - | |
| (2 | ) |
| 29 | |
| (2 | ) |
| 27 | | ||||||
| 347 | |
| - | |
| (13 | ) |
| 334 | |
| (16 | ) |
| 318 | | ||||||
QFNA | |
| |
| |
| |
| |
| | ||||||||||||
Goodwill | 175 | |
| - | |
| - | |
| 175 | |
| - | |
| 175 | | ||||||
|
|
|
|
|
|
|
|
|
|
|
| ||||||||||||
LAF | |
| |
| |
| |
| |
| | ||||||||||||
Goodwill | 716 | |
| - | |
| (56 | ) |
| 660 | |
| (59 | ) |
| 601 | | ||||||
Brands | 223 | |
| - | |
| (17 | ) |
| 206 | |
| (17 | ) |
| 189 | | ||||||
| 939 | | | - | |
| (73 | ) |
| 866 | |
| (76 | ) |
| 790 | | ||||||
PAB | |
| |
| |
| |
| |
| | ||||||||||||
Goodwill | 9,988 | |
| 5 | |
| (50 | ) |
| 9,943 | |
| (54 | ) |
| 9,889 | | ||||||
Reacquired franchise rights | 7,337 | |
| 16 | |
| (72 | ) |
| 7,281 | |
| (88 | ) |
| 7,193 | | ||||||
Acquired franchise rights | 1,573 | |
| (8 | ) |
| (14 | ) | | 1,551 | |
| (13 | ) |
| 1,538 | | ||||||
Brands | 153 | |
| - | |
| (7 | ) |
| 146 | |
| (4 | ) |
| 142 | | ||||||
| 19,051 | |
| 13 | |
| (143 | ) |
| 18,921 | |
| (159 | ) |
| 18,762 | | ||||||
Europe (a) | |
| |
| |
| |
| |
| | ||||||||||||
Goodwill | 5,214 | |
| - | |
| (187 | ) |
| 5,027 | |
| (1,488 | ) |
| 3,539 | | ||||||
Reacquired franchise rights | 772 | |
| - | |
| (12 | ) |
| 760 | |
| (189 | ) |
| 571 | | ||||||
Acquired franchise rights | 223 | |
| - | |
| 7 | |
| 230 | |
| (31 | ) |
| 199 | | ||||||
Brands | 4,284 | |
| - | |
| (213 | ) |
| 4,071 | |
| (1,408 | ) |
| 2,663 | | ||||||
| 10,493 | |
| - | |
| (405 | ) |
| 10,088 | |
| (3,116 | ) |
| 6,972 | | ||||||
AMEA | |
| |
| |
| |
| |
|
| ||||||||||||
Goodwill | 562 | |
| (4 | ) |
| (55 | ) |
| 503 | |
| (33 | ) |
| 470 | | ||||||
Brands | 148 | |
| - | |
| (21 | ) |
| 127 | |
| (10 | ) |
| 117 | | ||||||
| 710 | |
| (4 | ) |
| (76 | ) |
| 630 | |
| (43 | ) |
| 587 | | ||||||
|
|
|
|
|
|
|
|
|
|
|
| ||||||||||||
Total goodwill | 16,971 | |
| 1 | |
| (359 | ) |
| 16,613 | |
| (1,648 | ) |
| 14,965 | | ||||||
Total reacquired franchise rights | 8,109 | |
| 16 | |
| (84 | ) |
| 8,041 | |
| (277 | ) |
| 7,764 | | ||||||
Total acquired franchise rights | 1,796 | |
| (8 | ) |
| (7 | ) |
| 1,781 | |
| (44 | ) |
| 1,737 | | ||||||
Total brands | 4,839 | |
| - | |
| (260 | ) |
| 4,579 | |
| (1,441 | ) |
| 3,138 | | ||||||
| $ | 31,715 | |
| $ | 9 | |
| $ | (710 | ) |
| $ | 31,014 | |
| $ | (3,410 | ) |
| $ | 27,604 | |
(a) | The change in 2014 primarily reflects the depreciation of the Russian ruble. |
86
Table of Contents
Note 5 - Income Taxes
The components of income before income taxes are as follows:
|
| 2014 | |
| 2013 | |
| 2012 | | |||
U.S. |
| $ | 2,557 | |
| $ | 3,078 | |
| $ | 3,234 | |
Foreign |
| 6,200 | |
| 5,813 | |
| 5,070 | | |||
|
| $ | 8,757 | |
| $ | 8,891 | |
| $ | 8,304 | |
| ||||||||||||
The provision for income taxes consisted of the following: | ||||||||||||
| ||||||||||||
| 2014 | |
| 2013 | |
| 2012 | | ||||
Current: | U.S. Federal | $ | 1,364 | |
| $ | 1,092 | |
| $ | 911 | |
| Foreign | 851 | |
| 807 | |
| 940 | | |||
| State | 210 | |
| 124 | |
| 153 | | |||
|
| 2,425 | |
| 2,023 | |
| 2,004 | | |||
Deferred: | U.S. Federal | (33 | ) |
| 87 | |
| 154 | | |||
| Foreign | (60 | ) |
| 11 | |
| (95 | ) | |||
| State | (133 | ) |
| (17 | ) |
| 27 | | |||
|
| (226 | ) |
| 81 | |
| 86 | | |||
|
| $ | 2,199 | |
| $ | 2,104 | |
| $ | 2,090 | |
| ||||||||||||
A reconciliation of the U.S. Federal statutory tax rate to our annual tax rate is as follows: | ||||||||||||
| ||||||||||||
| 2014 | |
| 2013 | |
| 2012 | | ||||
U.S. Federal statutory tax rate | 35.0 | % |
| 35.0 | % |
| 35.0 | % | ||||
State income tax, net of U.S. Federal tax benefit | 0.6 | |
| 1.2 | |
| 1.4 | | ||||
Lower taxes on foreign results | (8.6 | ) |
| (8.8 | ) |
| (6.9 | ) | ||||
Tax benefits | - | |
| (2.4 | ) |
| (2.6 | ) | ||||
Other, net | (1.9 | ) |
| (1.3 | ) |
| (1.7 | ) | ||||
Annual tax rate | 25.1 | % |
| 23.7 | % |
| 25.2 | % | ||||
87
Table of Contents
Deferred tax liabilities | 2014 | |
| 2013 | | ||
Pension benefits | $ | - | |
| $ | 84 | |
Debt guarantee of wholly owned subsidiary | 842 | |
| 828 | | ||
Property, plant and equipment | 2,174 | |
| 2,327 | | ||
Intangible assets other than nondeductible goodwill | 4,068 | |
| 4,348 | | ||
Other | 264 | |
| 361 | | ||
Gross deferred tax liabilities | 7,348 | |
| 7,948 | | ||
Deferred tax assets |
|
|
| ||||
Net carryforwards | 1,329 | |
| 1,485 | | ||
Stock-based compensation | 265 | |
| 303 | | ||
Retiree medical benefits | 388 | |
| 384 | | ||
Other employee-related benefits | 646 | |
| 627 | | ||
Pension benefits | 263 | |
| - | | ||
Deductible state tax and interest benefits | 158 | |
| 155 | | ||
Long-term debt obligations acquired | 98 | |
| 125 | | ||
Other | 1,002 | |
| 959 | | ||
Gross deferred tax assets | 4,149 | |
| 4,038 | | ||
Valuation allowances | (1,230 | ) |
| (1,360 | ) | ||
Deferred tax assets, net | 2,919 | |
| 2,678 | | ||
Net deferred tax liabilities | $ | 4,429 | |
| $ | 5,270 | |
Deferred taxes are included within the following balance sheet accounts:
| 2014 | |
| 2013 | | ||
Assets: |
|
|
| ||||
Prepaid expenses and other current assets | $ | 875 | |
| $ | 716 | |
Liabilities: |
|
|
| ||||
Deferred income taxes | $ | 5,304 | |
| $ | 5,986 | |
| 2014 | |
| 2013 | |
| 2012 | | |||
Balance, beginning of year | $ | 1,360 | |
| $ | 1,233 | |
| $ | 1,264 | |
(Benefit)/provision | (25 | ) |
| 111 | |
| 68 | | |||
Other (deductions)/additions | (105 | ) |
| 16 | |
| (99 | ) | |||
Balance, end of year | $ | 1,230 | |
| $ | 1,360 | |
| $ | 1,233 | |
The Patient Protection and Affordable Care Act (PPACA), which was signed into law in the second quarter of 2010, changed the tax treatment related to an existing retiree drug subsidy (RDS) available to sponsors of retiree health benefit plans that provide a benefit that is at least actuarially equivalent to the benefits under Medicare Part D. As a result of the PPACA, RDS payments became taxable in tax years beginning in 2013, by requiring the amount of the subsidy received to be offset against our deduction for health care expenses. In the first quarter of 2012, we began pre-paying funds within our 401(h) accounts intended to fully cover prescription drug benefit liabilities for Medicare eligible retirees. As a result, the receipt of future Medicare subsidy payments for prescription drugs will not be taxable and consequently we recorded a $55 million tax benefit reflecting this change in the first quarter of 2012.
88
Table of Contents
For additional unaudited information on our income tax policies, including our reserves for income taxes, see "Our Critical Accounting Policies" in Management's Discussion and Analysis of Financial Condition and Results of Operations.
Reserves
A number of years may elapse before a particular matter, for which we have established a reserve, is audited and finally resolved. The number of years with open tax audits varies depending on the tax jurisdiction. Our major taxing jurisdictions and the related open tax audits are as follows:
Jurisdiction |
| Years Open to Audit |
| Years Currently Under Audit |
United States |
| 2010-2013 |
| 2010-2011 |
Mexico |
| 2009-2013 |
| None |
United Kingdom |
| 2012-2013 |
| None |
Canada (Domestic) |
| 2010-2013 |
| 2010-2012 |
Canada (International) |
| 2008-2013 |
| 2008-2012 |
Russia |
| 2009-2013 |
| 2009-2013 |
While it is often difficult to predict the final outcome or the timing of resolution of any particular tax matter, we believe that our reserves reflect the probable outcome of known tax contingencies. We adjust these reserves, as well as the related interest, in light of changing facts and circumstances. Settlement of any particular issue would usually require the use of cash. Favorable resolution would be recognized as a reduction to our annual tax rate in the year of resolution. For further unaudited information on the impact of the resolution of open tax issues, see "Other Consolidated Results" in Management's Discussion and Analysis of Financial Condition and Results of Operations.
We believe that it is reasonably possible that our reserves for uncertain tax positions could decrease by approximately $300 million within the next 12 months as a result of the completion of audits in various jurisdictions.
In the fourth quarter of 2013, we reached an agreement with the IRS resolving all open matters related to the audits for taxable years 2003 through 2009. As a result, we made U.S. Federal net cash tax payments of $ 758 million , including interest. The settlement reduced our 2013 net cash provided by operating activities and our reserves for uncertain tax positions for the tax years 2003 through 2012 and resulted in a non-cash tax benefit of $ 209 million in the fourth quarter of 2013. In addition, payments for other U.S. Federal, state and local tax matters related to open tax years totaling $ 226 million were made in 2013. In 2012, we received a favorable tax court decision related to the classification of financial instruments resulting in a non-cash tax benefit of $ 217 million in the fourth quarter of 2012. See additional unaudited information in "Items Affecting Comparability" in Management's Discussion and Analysis of Financial Condition and Results of Operations.
As of December 27, 2014 , the total gross amount of reserves for income taxes, reported in other liabilities, was $1,587 million . We accrue interest related to reserves for income taxes in our provision for income taxes and any associated penalties are recorded in selling, general and administrative expenses. The gross amount of interest accrued, reported in other liabilities, was $141 million as of December 27, 2014 , of which $31 million of expense was recognized in 2014 . The gross amount of interest accrued, reported in other liabilities, was $164 million as of December 28, 2013 , of which $36 million of expense was recognized in 2013 .
89
Table of Contents
A rollforward of our reserves for all federal, state and foreign tax jurisdictions, is as follows:
| 2014 | |
| 2013 | | ||
Balance, beginning of year | $ | 1,268 | |
| $ | 2,425 | |
Additions for tax positions related to the current year | 349 | |
| 238 | | ||
Additions for tax positions from prior years | 215 | |
| 273 | | ||
Reductions for tax positions from prior years | (81 | ) |
| (327 | ) | ||
Settlement payments | (70 | ) |
| (1,306 | ) | ||
Statutes of limitations expiration | (42 | ) |
| (30 | ) | ||
Translation and other | (52 | ) |
| (5 | ) | ||
Balance, end of year | $ | 1,587 | |
| $ | 1,268 | |
Carryforwards and Allowances
Operating loss carryforwards totaling $10.4 billion at year-end 2014 are being carried forward in a number of foreign and state jurisdictions where we are permitted to use tax operating losses from prior periods to reduce future taxable income. These operating losses will expire as follows: $0.1 billion in 2015 , $9.8 billion between 2016 and 2034 and $0.5 billion may be carried forward indefinitely. We establish valuation allowances for our deferred tax assets if, based on the available evidence, it is more likely than not that some portion or all of the deferred tax assets will not be realized.
Undistributed International Earnings
As of December 27, 2014 , we had approximately $37.8 billion of undistributed international earnings. We intend to continue to reinvest earnings outside the U.S. for the foreseeable future and, therefore, have not recognized any U.S. tax expense on these earnings. It is not practicable for us to determine the amount of unrecognized U.S. tax expense on these reinvested international earnings.
Note 6 - Stock-Based Compensation
Our stock-based compensation program is designed to attract and retain employees while also aligning employees' interests with the interests of our shareholders. Stock options, restricted stock units (RSUs), performance stock units (PSUs) and PepsiCo equity performance units (PEPunits) are granted to employees under the shareholder-approved 2007 Long-Term Incentive Plan (LTIP). Each RSU represents our obligation to deliver to the holder one share of PepsiCo common stock when the award vests at the end of the service period. PSUs are awards where the number of shares delivered to the holder upon vesting at the end of the service period depends on PepsiCo's performance against specified targets. During the vesting period, RSUs and PSUs accrue dividend equivalents that pay out in cash (without interest) if and when the applicable RSU or PSU vests and becomes payable. PEPunits provide an opportunity to earn shares of PepsiCo common stock with a value that adjusts based upon changes in PepsiCo's absolute stock price as well as PepsiCo's Total Shareholder Return relative to the S&P 500 over a three -year performance period.
The Company may use authorized and unissued shares to meet share requirements resulting from the exercise of stock options and the vesting of RSUs and PSUs as well as PEPunits.
As of December 27, 2014 , 98 million shares were available for future stock-based compensation grants.
90
Table of Contents
The following table summarizes our total stock-based compensation expense:
| 2014 | |
| 2013 | |
| 2012 | | |||
Stock-based compensation expense | $ | 297 | |
| $ | 303 | |
| $ | 278 | |
Merger and integration charges | - | |
| - | |
| 2 | | |||
Restructuring and impairment benefits | (3 | ) |
| - | |
| (7 | ) | |||
Total | $ | 294 | |
| $ | 303 | |
| $ | 273 | |
Income tax benefits recognized in earnings related to stock-based compensation | $ | 75 | |
| $ | 76 | |
| $ | 73 | |
Method of Accounting and Our Assumptions
We account for our employee stock options under the fair value method of accounting using a Black-Scholes valuation model to measure stock option expense at the date of grant. The fair value of RSUs is measured at the market price of the Company's stock on the date of grant. The fair value of PSUs is measured at the market price of the Company's stock on the date of grant with the exception of market-based awards, for which we use the Monte-Carlo simulation option-pricing model to determine the fair value. The Monte-Carlo simulation option-pricing model uses the same input assumptions as the Black-Scholes model; however, it also further incorporates into the fair-value determination the possibility that the market condition may not be satisfied. Compensation costs related to these awards are recognized regardless of whether the market condition is satisfied, provided that the requisite service has been provided.
All stock option grants have an exercise price equal to the fair market value of our common stock on the date of grant and generally have a 10 -year term. We do not backdate, reprice or grant stock-based compensation awards retroactively. Repricing of awards would require shareholder approval under the LTIP.
The fair value of stock-based award grants is amortized to expense over the vesting period, primarily three years. Awards to employees eligible for retirement prior to the award becoming fully vested are amortized to expense over the period through the date that the employee first becomes eligible to retire and is no longer required to provide service to earn the award. Executives who are awarded long-term incentives based on their performance may generally elect to receive their grant in the form of stock options or RSUs, or a combination thereof. Executives who elect RSUs receive one RSU for every four stock options that would have otherwise been granted. Certain executive officers and other senior executives do not have a choice and are granted a combination of 60% PEPunits measuring both absolute and relative stock price performance and 40% long-term cash based on achievement of specific performance operating metrics. Certain executives are granted performance-based stock units which require the achievement of specified financial and/or operational performance metrics. The number of shares may be increased to the maximum or reduced to the minimum threshold based on the results of these performance metrics in accordance with the terms established at the time of the award.
Our weighted-average Black-Scholes fair value assumptions are as follows:
| 2014 | | | 2013 | | | 2012 | |
Expected life | 6 years | | | 6 years | | | 6 years | |
Risk-free interest rate | 1.9 | % | | 1.1 | % | | 1.3 | % |
Expected volatility | 16 | % | | 17 | % | | 17 | % |
Expected dividend yield | 2.9 | % | | 2.7 | % | | 3.0 | % |
The expected life is the period over which our employee groups are expected to hold their options. It is based on our historical experience with similar grants. The risk-free interest rate is based on the expected U.S. Treasury rate over the expected life. Volatility reflects movements in our stock price over the most recent
91
Table of Contents
historical period equivalent to the expected life. Dividend yield is estimated over the expected life based on our stated dividend policy and forecasts of net income, share repurchases and stock price.
A summary of our stock-based compensation activity for the year ended December 27, 2014 is as follows:
Our Stock Option Activity | Options (a) | | Average Price (b) | | Average Life (years) (c) | | Aggregate Intrinsic Value (d) | |||||
Outstanding at December 28, 2013 | 49,462 | | | $ | 61.58 | | | | | | ||
Granted | 3,416 | | | $ | 81.27 | | | | | | ||
Exercised | (12,898 | ) | | $ | 58.56 | | | | | | ||
Forfeited/expired | (1,123 | ) | | $ | 70.62 | | | | | | ||
Outstanding at December 27, 2014 | 38,857 | | | $ | 64.06 | | | 4.67 | | $ | 1,282,200 | |
Exercisable at December 27, 2014 | 30,237 | | | $ | 60.94 | | | 3.66 | | $ | 1,091,815 | |
Expected to vest as of December 27, 2014 | 8,111 | |
| $ | 74.59 | |
| 8.19 |
| $ | 182,132 | |
(a) | Options are in thousands and include options previously granted under The Pepsi Bottling Group, Inc. (PBG) and PepsiAmericas, Inc. (PAS) plans. No additional options or shares were granted under the PBG and PAS plans after 2009. |
(b) | Weighted-average exercise price. |
(c) | Weighted-average contractual life remaining. |
(d) | In thousands. |
Our RSU and PSU Activity | RSUs/PSUs (a) | | Average Intrinsic Value (b) | | Average Life (years) (c) | | Aggregate Intrinsic Value (d) | |||||
Outstanding at December 28, 2013 | 11,939 | | | $ | 69.04 | | | | | | ||
Granted (e) | 4,379 | | | $ | 80.39 | | | | | | ||
Converted | (3,713 | ) | | $ | 64.77 | | | | | | ||
Forfeited | (1,171 | ) | | $ | 73.71 | | | | | | ||
Actual performance change (f) | (206 | ) |
| $ | 64.19 | |
|
|
|
| ||
Outstanding at December 27, 2014 (g) | 11,228 | | | $ | 74.49 | | | 1.42 | | $ | 1,089,707 | |
Expected to vest as of December 27, 2014 | 10,745 | |
| $ | 73.74 | |
| 1.28 |
| $ | 1,042,781 | |
(a) | RSUs and PSUs are in thousands and include RSUs previously granted under the PBG plan. No additional RSUs or shares were granted under the PBG plan after 2009. |
(b) | Weighted-average intrinsic value at grant date. |
(c) | Weighted-average contractual life remaining. |
(d) | In thousands. |
(e) | Grant activity for all PSUs are disclosed at target. |
(f) | Reflects the net number of PSUs above and below target levels based on actual performance measured at the end of the performance period. |
(g) | The outstanding PSUs for which the performance period has not ended as of December 27, 2014, at the threshold, target and maximum award levels were zero , 0.7 million and 1.1 million , respectively. |
92
Table of Contents
Our PEPunit Activity | PEPunits (a) | | Average Intrinsic Value (b) | | Average Life (years) (c) | | Aggregate Intrinsic Value (d) | |||||
Outstanding at December 28, 2013 | 675 | | | $ | 66.65 | | | | | | ||
Granted (e) | 387 | | | $ | 50.95 | | | | | | ||
Converted | - | | | $ | - | | | | | | ||
Forfeited | (109 | ) | | $ | 59.85 | | | | | | ||
Outstanding at December 27, 2014 (f) | 953 | | | $ | 61.04 | | | 1.24 | | $ | 92,451 | |
Expected to vest as of December 27, 2014 | 843 | |
| $ | 60.97 | |
| 1.21 |
| $ | 81,770 | |
(a) | PEPunits are in thousands. |
(b) | Weighted-average intrinsic value at grant date. |
(c) | Weighted-average contractual life remaining. |
(d) | In thousands. |
(e) | Grant activity for all PEPunits are disclosed at target. |
(f) | The outstanding PEPunits for which the performance period has not ended as of December 27, 2014, at the threshold, target and maximum award levels were zero , 1.0 million and 1.7 million , respectively. |
Other Stock-Based Compensation Data
| 2014 | | | 2013 | | | 2012 | | |||
Stock Options | | | | | | ||||||
Total number of options granted (a) | 3,416 | |
| 2,868 | |
| 3,696 | | |||
Weighted-average fair value of options granted | $ | 8.79 | | | $ | 8.14 | | | $ | 6.86 | |
Total intrinsic value of options exercised (a) | $ | 423,251 | | | $ | 471,475 | | | $ | 512,636 | |
Total fair value of options vested (a) | $ | 42,353 | |
| $ | 88,750 | |
| $ | 148,835 | |
RSUs/PSUs | | | | | | ||||||
Total number of RSUs/PSUs granted (a) | 4,379 | | | 4,231 | | | 4,404 | | |||
Weighted-average intrinsic value of RSUs/PSUs granted | $ | 80.39 | | | $ | 76.30 | | | $ | 66.64 | |
Total intrinsic value of RSUs/PSUs converted (a) | $ | 319,820 | | | $ | 294,065 | | | $ | 236,575 | |
Total fair value of RSUs/PSUs vested (a) | $ | 241,836 | |
| $ | 236,688 | |
| $ | 188,723 | |
PEPunits |
|
|
|
|
| ||||||
Total number of PEPunits granted (a) | 387 | |
| 355 | |
| 410 | | |||
Weighted-average intrinsic value of PEPunits granted | $ | 50.95 | |
| $ | 68.48 | |
| $ | 64.85 | |
Total intrinsic value of PEPunits converted (a) | $ | - | |
| $ | 3,868 | |
| $ | - | |
Total fair value of PEPunits vested (a) | $ | 5,072 | |
| $ | 5,896 | |
| $ | - | |
(a) | In thousands. |
As of December 27, 2014 and December 28, 2013 , there were approximately 324,000 and 290,000 outstanding awards, respectively, consisting primarily of phantom stock units that were granted under the PepsiCo Director Deferral Program and will be settled in shares of PepsiCo common stock pursuant to the LTIP at the end of the applicable deferral period, not included in the tables above.
As of December 27, 2014 , there was $382 million of total unrecognized compensation cost related to nonvested share-based compensation grants. This unrecognized compensation cost is expected to be recognized over a weighted-average period of two years.
93
Table of Contents
Note 7 - Pension, Retiree Medical and Savings Plans
In the fourth quarter of 2014 and 2012, the Company offered certain former employees who had vested benefits in our U.S. defined benefit pension plans the option of receiving a one-time lump sum payment equal to the present value of the participant's pension benefit (payable in cash or rolled over into a qualified retirement plan or IRA). In December 2014 and 2012, we made a discretionary contribution of $388 million and $405 million , respectively, to fund substantially all of these payments. The Company recorded a pre-tax non-cash settlement charge of $141 million ( $88 million after-tax or $0.06 per share) in 2014 and $195 million ( $131 million after-tax or $0.08 per share) in 2012 as a result of these transactions. See additional unaudited information in "Items Affecting Comparability" in Management's Discussion and Analysis of Financial Condition and Results of Operations.
The provisions of both the PPACA and the Health Care and Education Reconciliation Act are reflected in our retiree medical expenses and liabilities and were not material to our financial statements.
During 2014, we revised our mortality assumptions to incorporate the new set of mortality tables issued by the Society of Actuaries, adjusted to reflect our experience and future expectations. This resulted in an increase in the projected benefit obligation of our U.S. pension and retiree medical programs. We also reviewed and revised other demographic assumptions to reflect recent experience. The net effect of these changes and certain plan design changes resulted in an increase of approximately $150 million in the projected benefit obligation at December 27, 2014.
Gains and losses resulting from actual experience differing from our assumptions, including the difference between the actual return on plan assets and the expected return on plan assets, and from changes in our assumptions are determined at each measurement date. If this net accumulated gain or loss exceeds 10% of the greater of the market-related value of plan assets or plan liabilities, a portion of the net gain or loss is included in expense for the following year based upon the average remaining service period of active plan participants, which is approximately 11 years for pension expense and approximately 8 years for retiree medical expense. The cost or benefit of plan changes that increase or decrease benefits for prior employee service (prior service cost/(credit)) is included in earnings on a straight-line basis over the average remaining service period of active plan participants.
94
Table of Contents
Selected financial information for our pension and retiree medical plans is as follows:
| Pension |
| Retiree Medical | ||||||||||||||||||||
| U.S. |
| International |
|
|
|
| ||||||||||||||||
| 2014 | |
| 2013 | |
| 2014 | |
| 2013 | |
| 2014 | |
| 2013 | | ||||||
Change in projected benefit liability |
|
|
|
|
|
|
|
|
|
|
| ||||||||||||
Liability at beginning of year | $ | 11,825 | |
| $ | 12,886 | |
| $ | 2,859 | |
| $ | 2,788 | |
| $ | 1,384 | |
| $ | 1,511 | |
Service cost | 393 | |
| 467 | |
| 98 | |
| 111 | |
| 36 | |
| 45 | | ||||||
Interest cost | 580 | |
| 527 | |
| 131 | |
| 118 | |
| 58 | |
| 54 | | ||||||
Plan amendments | (122 | ) |
| 22 | |
| - | |
| (1 | ) |
| (125 | ) |
| - | | ||||||
Participant contributions | - | |
| - | |
| 3 | |
| 3 | |
| - | |
| - | | ||||||
Experience loss/(gain) | 1,635 | |
| (1,522 | ) |
| 512 | |
| (65 | ) |
| 190 | |
| (128 | ) | ||||||
Benefit payments | (349 | ) |
| (533 | ) |
| (86 | ) |
| (91 | ) |
| (101 | ) |
| (97 | ) | ||||||
Settlement/curtailment | (577 | ) |
| (44 | ) |
| (25 | ) |
| (3 | ) |
| - | |
| - | | ||||||
Special termination benefits | 24 | |
| 22 | |
| - | |
| - | |
| 3 | |
| 2 | | ||||||
Foreign currency adjustment | - | |
| - | |
| (245 | ) |
| (2 | ) |
| (6 | ) |
| (3 | ) | ||||||
Other | - | |
| - | |
| - | |
| 1 | |
| - | |
| - | | ||||||
Liability at end of year | $ | 13,409 | |
| $ | 11,825 | |
| $ | 3,247 | |
| $ | 2,859 | |
| $ | 1,439 | |
| $ | 1,384 | |
|
|
|
|
|
|
|
|
|
|
|
| ||||||||||||
Change in fair value of plan assets |
|
|
|
|
|
|
|
|
|
|
| ||||||||||||
Fair value at beginning of year | $ | 11,462 | |
| $ | 10,817 | |
| $ | 2,777 | |
| $ | 2,463 | |
| $ | 406 | |
| $ | 365 | |
Actual return on plan assets | 1,254 | |
| 1,159 | |
| 401 | |
| 265 | |
| 46 | |
| 76 | | ||||||
Employer contributions/funding | 434 | |
| 63 | |
| 157 | |
| 137 | |
| 64 | |
| 62 | | ||||||
Participant contributions | - | |
| - | |
| 3 | |
| 3 | |
| - | |
| - | | ||||||
Benefit payments | (349 | ) |
| (533 | ) |
| (86 | ) |
| (91 | ) |
| (101 | ) |
| (97 | ) | ||||||
Settlement | (577 | ) |
| (44 | ) |
| (24 | ) |
| (8 | ) |
| - | |
| - | | ||||||
Foreign currency adjustment | - | |
| - | |
| (226 | ) |
| 8 | |
| - | |
| - | | ||||||
Fair value at end of year | $ | 12,224 | |
| $ | 11,462 | |
| $ | 3,002 | |
| $ | 2,777 | |
| $ | 415 | |
| $ | 406 | |
Funded status | $ | (1,185 | ) |
| $ | (363 | ) |
| $ | (245 | ) |
| $ | (82 | ) |
| $ | (1,024 | ) |
| $ | (978 | ) |
95
Table of Contents
| Pension |
| Retiree Medical | ||||||||||||||||||||
| U.S. |
| International |
|
|
|
| ||||||||||||||||
| 2014 | |
| 2013 | |
| 2014 | |
| 2013 | |
| 2014 | |
| 2013 | | ||||||
Amounts recognized |
|
|
|
|
|
|
|
|
|
|
| ||||||||||||
Other assets | $ | 97 | |
| $ | 603 | |
| $ | 37 | |
| $ | 74 | |
| $ | - | |
| $ | - | |
Other current liabilities | (42 | ) |
| (41 | ) |
| (1 | ) |
| (1 | ) |
| (57 | ) |
| (72 | ) | ||||||
Other liabilities | (1,240 | ) |
| (925 | ) |
| (281 | ) |
| (155 | ) |
| (967 | ) |
| (906 | ) | ||||||
Net amount recognized | $ | (1,185 | ) |
| $ | (363 | ) |
| $ | (245 | ) |
| $ | (82 | ) |
| $ | (1,024 | ) |
| $ | (978 | ) |
|
|
|
|
|
|
|
|
|
|
|
| ||||||||||||
Amounts included in accumulated other comprehensive loss (pre-tax) |
|
|
|
|
|
|
|
| |||||||||||||||
Net loss/(gain) | $ | 2,918 | |
| $ | 2,069 | |
| $ | 1,003 | |
| $ | 849 | |
| $ | (49 | ) |
| $ | (222 | ) |
Prior service (credit)/cost | (18 | ) |
| 125 | |
| (7 | ) |
| (6 | ) |
| (166 | ) |
| (69 | ) | ||||||
Total | $ | 2,900 | |
| $ | 2,194 | |
| $ | 996 | |
| $ | 843 | |
| $ | (215 | ) |
| $ | (291 | ) |
|
|
|
|
|
|
|
|
|
|
|
| ||||||||||||
Components of the increase/(decrease) in net loss/(gain) included in accumulated other comprehensive loss |
|
|
|
| |||||||||||||||||||
Change in discount rate | $ | 1,424 | |
| $ | (1,532 | ) |
| $ | 636 | |
| $ | (166 | ) |
| $ | 98 | |
| $ | (117 | ) |
Employee-related assumption changes | 345 | |
| 24 | |
| (112 | ) |
| 91 | |
| 58 | |
| 2 | | ||||||
Liability-related experience different from assumptions | (104 | ) |
| (14 | ) |
| (12 | ) |
| 10 | |
| 34 | |
| (13 | ) | ||||||
Actual asset return different from expected return | (470 | ) |
| (336 | ) |
| (225 | ) |
| (108 | ) |
| (19 | ) |
| (49 | ) | ||||||
Amortization and settlement of losses | (316 | ) |
| (285 | ) |
| (61 | ) |
| (68 | ) |
| 4 | |
| (1 | ) | ||||||
Other, including foreign currency adjustments | (30 | ) |
| - | |
| (72 | ) |
| (6 | ) |
| (2 | ) |
| - | | ||||||
Total | $ | 849 | |
| $ | (2,143 | ) |
| $ | 154 | |
| $ | (247 | ) |
| $ | 173 | |
| $ | (178 | ) |
|
|
|
|
|
|
|
|
|
|
|
| ||||||||||||
Liability at end of year for service to date | $ | 12,206 | |
| $ | 10,803 | |
| $ | 2,721 | |
| $ | 2,369 | |
|
|
|
| ||||
The components of benefit expense are as follows:
| Pension |
| Retiree Medical | ||||||||||||||||||||||||||||||||
| U.S. |
| International |
|
|
|
|
|
| ||||||||||||||||||||||||||
| 2014 | |
| 2013 | |
| 2012 | |
| 2014 | |
| 2013 | |
| 2012 | |
| 2014 | |
| 2013 | |
| 2012 | | |||||||||
Components of benefit expense |
|
|
|
|
|
|
|
|
|
|
|
|
|
|
|
|
| ||||||||||||||||||
Service cost | $ | 393 | |
| $ | 467 | |
| $ | 407 | |
| $ | 98 | |
| $ | 111 | |
| $ | 100 | |
| $ | 36 | |
| $ | 45 | |
| $ | 50 | |
Interest cost | 580 | |
| 527 | |
| 534 | |
| 131 | |
| 118 | |
| 115 | |
| 58 | |
| 54 | |
| 65 | | |||||||||
Expected return on plan assets | (784 | ) |
| (823 | ) |
| (796 | ) |
| (176 | ) |
| (157 | ) |
| (146 | ) |
| (27 | ) |
| (27 | ) |
| (22 | ) | |||||||||
Amortization of prior service cost/(credit) | 21 | |
| 18 | |
| 17 | |
| - | |
| 1 | |
| 1 | |
| (28 | ) |
| (23 | ) |
| (26 | ) | |||||||||
Amortization of net loss/(gain) | 175 | |
| 289 | |
| 259 | |
| 53 | |
| 66 | |
| 53 | |
| (4 | ) |
| 1 | |
| - | | |||||||||
| 385 | |
| 478 | |
| 421 | |
| 106 | |
| 139 | |
| 123 | |
| 35 | |
| 50 | |
| 67 | | |||||||||
Settlement/curtailment loss/(gain) (a) | 141 | |
| (4 | ) |
| 185 | |
| 7 | |
| 7 | |
| 4 | |
| - | |
| - | |
| - | | |||||||||
Special termination benefits | 24 | |
| 22 | |
| 8 | |
| - | |
| - | |
| 1 | |
| 3 | |
| 2 | |
| 5 | | |||||||||
Total | $ | 550 | |
| $ | 496 | |
| $ | 614 | |
| $ | 113 | |
| $ | 146 | |
| $ | 128 | |
| $ | 38 | |
| $ | 52 | |
| $ | 72 | |
(a) | U.S. includes pension lump sum settlement charge of $141 million in 2014 and $195 million in 2012. These charges are reflected in items affecting comparability (see additional unaudited information in "Items Affecting Comparability" in Management's Discussion and Analysis of Financial Condition and Results of Operations). |
96
Table of Contents
The estimated amounts to be amortized from accumulated other comprehensive loss into expense in 2015 for our pension and retiree medical plans are as follows:
| Pension |
| Retiree Medical | ||||||||
| U.S. |
| International |
|
| ||||||
Net loss | $ | 205 | |
| $ | 74 | |
| $ | - | |
Prior service credit | (3 | ) |
| - | |
| (38 | ) | |||
Total | $ | 202 | |
| $ | 74 | |
| $ | (38 | ) |
The following table provides the weighted-average assumptions used to determine projected benefit liability and benefit expense for our pension and retiree medical plans:
| Pension |
| Retiree Medical | |||||||||||||||||||||||
| U.S. |
| International |
|
|
|
|
|
| |||||||||||||||||
| 2014 | |
| 2013 | |
| 2012 | |
| 2014 | |
| 2013 | |
| 2012 | |
| 2014 | |
| 2013 | |
| 2012 | |
Weighted-average assumptions |
|
|
|
|
|
|
|
|
|
|
|
|
|
|
|
|
| |||||||||
Liability discount rate | 4.2 | % |
| 5.0 | % |
| 4.2 | % |
| 3.8 | % |
| 4.7 | % |
| 4.4 | % |
| 3.8 | % |
| 4.6 | % |
| 3.7 | % |
Expense discount rate | 5.0 | % |
| 4.2 | % |
| 4.6 | % |
| 4.7 | % |
| 4.4 | % |
| 4.8 | % |
| 4.3 | % |
| 3.7 | % |
| 4.4 | % |
Expected return on plan assets | 7.5 | % |
| 7.8 | % |
| 7.8 | % |
| 6.6 | % |
| 6.6 | % |
| 6.7 | % |
| 7.5 | % |
| 7.8 | % |
| 7.8 | % |
Liability rate of salary increases | 3.5 | % |
| 3.7 | % |
| 3.7 | % |
| 3.6 | % |
| 3.9 | % |
| 3.9 | % |
|
|
|
|
|
| |||
Expense rate of salary increases | 3.7 | % |
| 3.7 | % |
| 3.7 | % |
| 3.9 | % |
| 3.9 | % |
| 4.1 | % |
|
|
|
|
|
| |||
The following table provides selected information about plans with liability for service to date and total projected benefit liability in excess of plan assets:
| Pension |
| Retiree Medical | ||||||||||||||||||||
| U.S. |
| International |
|
|
|
| ||||||||||||||||
| 2014 | |
| 2013 | |
| 2014 | |
| 2013 | |
| 2014 | |
| 2013 | | ||||||
Selected information for plans with liability for service to date in excess of plan assets |
|
|
|
| |||||||||||||||||||
Liability for service to date | $ | (661 | ) |
| $ | (577 | ) |
| $ | (333 | ) |
| $ | (310 | ) |
|
|
|
| ||||
Fair value of plan assets | $ | 2 | |
| $ | 2 | |
| $ | 288 | |
| $ | 259 | |
|
|
|
| ||||
Selected information for plans with projected benefit liability in excess of plan assets |
|
|
|
|
|
| |||||||||||||||||
Benefit liability | $ | (7,385 | ) |
| $ | (6,555 | ) |
| $ | (2,865 | ) |
| $ | (2,291 | ) |
| $ | (1,439 | ) |
| $ | (1,384 | ) |
Fair value of plan assets | $ | 6,103 | |
| $ | 5,589 | |
| $ | 2,583 | |
| $ | 2,135 | |
| $ | 415 | |
| $ | 406 | |
Of the total projected pension benefit liability at year-end 2014 , $808 million relates to plans that we do not fund because the funding of such plans does not receive favorable tax treatment.
97
Table of Contents
Future Benefit Payments and Funding
Our estimated future benefit payments are as follows:
| 2015 | |
| 2016 | |
| 2017 | |
| 2018 | |
| 2019 | |
| 2020-24 | | ||||||
Pension | $ | 700 | |
| $ | 730 | |
| $ | 775 | |
| $ | 830 | |
| $ | 880 | |
| $ | 5,160 | |
Retiree medical (a) | $ | 120 | |
| $ | 125 | |
| $ | 125 | |
| $ | 125 | |
| $ | 125 | |
| $ | 560 | |
(a) | Expected future benefit payments for our retiree medical plans do not reflect any estimated subsidies expected to be received under the 2003 Medicare Act. Subsidies are expected to be approximately $3 million for each of the years from 2015 through 2019 and approximately $13 million in total for 2020 through 2024. |
These future benefit payments to beneficiaries include payments from both funded and unfunded plans.
In 2015 , we expect to make pension and retiree medical contributions of approximately $225 million , with approximately $55 million for retiree medical benefits.
Plan Assets
Our pension plan investment strategy includes the use of actively managed securities and is reviewed periodically in conjunction with plan liabilities, an evaluation of market conditions, tolerance for risk and cash requirements for benefit payments. This strategy is also applicable to funds held for the retiree medical plans. Our investment objective is to ensure that funds are available to meet the plans' benefit obligations when they become due. Our overall investment strategy is to prudently invest plan assets in a well-diversified portfolio of equity and high-quality debt securities and real estate to achieve our long-term return expectations. Our investment policy also permits the use of derivative instruments which are primarily used to reduce risk.
Our expected long-term rate of return on U.S. plan assets is 7.5% for 2015 and 2014 . Our target investment allocations for U.S. plan assets are as follows:
| 2015 | |
| 2014 | |
Fixed income | 40 | % |
| 40 | % |
U.S. equity | 33 | % |
| 33 | % |
International equity | 22 | % |
| 22 | % |
Real estate | 5 | % |
| 5 | % |
Actual investment allocations may vary from our target investment allocations due to prevailing market conditions. We regularly review our actual investment allocations and periodically rebalance our investments to our target allocations.
The expected return on plan assets is based on our plan investment strategy and our expectations for long-term rates of return by asset class, taking into account volatility and correlation among asset classes and our historical experience. We also review current levels of interest rates and inflation to assess the reasonableness of the long-term rates. We evaluate our expected return assumptions annually to ensure that they are reasonable. To calculate the expected return on plan assets, our market-related value of assets for fixed income is the actual fair value. For all other asset categories, we use a method that recognizes investment gains or losses (the difference between the expected and actual return based on the market-related value of assets) over a five -year period. This has the effect of reducing year-to-year volatility.
98
Table of Contents
Contributions to our pension and retiree medical plans were as follows:
| Pension |
| Retiree Medical | ||||||||||||||||||||
| 2014 | |
| 2013 | |
| 2012 | |
| 2014 | |
| 2013 | |
| 2012 | | ||||||
Discretionary (a) | $ | 407 | |
| $ | 23 | |
| $ | 1,375 | |
| $ | - | |
| $ | - | |
| $ | 140 | |
Non-discretionary | 184 | |
| 177 | |
| 239 | |
| 64 | |
| 62 | |
| 111 | | ||||||
Total | $ | 591 | |
| $ | 200 | |
| $ | 1,614 | |
| $ | 64 | |
| $ | 62 | |
| $ | 251 | |
(a) | Includes $388 million and $405 million in 2014 and 2012, respectively, pertaining to pension lump sum payments. |
99
Table of Contents
Plan assets measured at fair value as of fiscal year-end 2014 and 2013 are categorized consistently by level in both years, and are as follows:
| 2014 |
| 2013 | ||||||||||||||||
| Total |
| Quoted Prices in Active Markets for Identical Assets (Level 1) |
| Significant Other Observable Inputs (Level 2) |
| Significant Unobservable Inputs (Level 3) |
| Total | ||||||||||
U.S. plan assets (a) |
|
|
|
|
|
|
|
|
| ||||||||||
Equity securities: |
|
|
|
|
|
|
|
|
| ||||||||||
U.S. common stock (b) | $ | 966 | |
| $ | 966 | |
| $ | - | |
| $ | - | |
| $ | 732 | |
U.S. commingled funds (c) (d) | 3,437 | |
| - | |
| 3,437 | |
| - | |
| 3,334 | | |||||
International common stock (b) | 1,488 | |
| 1,488 | |
| - | |
| - | |
| 1,669 | | |||||
International commingled fund (e) | 876 | |
| - | |
| 876 | |
| - | |
| 902 | | |||||
Preferred stock (f) | 22 | |
| - | |
| 22 | |
| - | |
| 18 | | |||||
Fixed income securities: |
|
|
|
|
|
|
|
|
| ||||||||||
Government securities (f) | 1,279 | |
| - | |
| 1,279 | |
| - | |
| 1,264 | | |||||
Corporate bonds (f) (g) | 3,338 | |
| - | |
| 3,338 | |
| - | |
| 2,958 | | |||||
Mortgage-backed securities (f) | 274 | |
| - | |
| 274 | |
| - | |
| 220 | | |||||
Other: |
|
|
|
|
|
|
|
|
| ||||||||||
Contracts with insurance companies (h) | 6 | |
| - | |
| - | |
| 6 | |
| 6 | | |||||
Real estate commingled funds (i) | 629 | |
| - | |
| - | |
| 629 | |
| 552 | | |||||
Cash and cash equivalents | 267 | |
| 267 | |
| - | |
| - | |
| 154 | | |||||
Sub-total U.S. plan assets | 12,582 | |
| $ | 2,721 | |
| $ | 9,226 | |
| $ | 635 | |
| 11,809 | | ||
Dividends and interest receivable | 57 | |
|
|
|
|
|
|
| 59 | | ||||||||
Total U.S. plan assets | $ | 12,639 | |
|
|
|
|
|
|
| $ | 11,868 | | ||||||
International plan assets |
|
|
|
|
|
|
|
|
| ||||||||||
Equity securities: |
|
|
|
|
|
|
|
|
| ||||||||||
U.S. common stock (b) | $ | 5 | |
| $ | 5 | |
| $ | - | |
| $ | - | |
| $ | 4 | |
U.S. commingled funds (c) | 373 | |
| - | |
| 373 | |
| - | |
| 334 | | |||||
International common stock (b) | 171 | |
| 171 | |
| - | |
| - | |
| 176 | | |||||
International commingled funds (e) | 918 | |
| - | |
| 918 | |
| - | |
| 914 | | |||||
Preferred stock (f) | 1 | |
| - | |
| 1 | |
| - | |
| 1 | | |||||
Fixed income securities: |
|
|
|
|
|
|
|
|
| ||||||||||
Government securities (f) | 454 | |
| - | |
| 454 | |
| - | |
| 207 | | |||||
Corporate bonds (f) | 320 | |
| - | |
| 320 | |
| - | |
| 261 | | |||||
Fixed income commingled funds (j) | 517 | |
| - | |
| 517 | |
| - | |
| 650 | | |||||
Other: |
|
|
|
|
|
|
|
|
| ||||||||||
Contracts with insurance companies (h) | 36 | |
| - | |
| - | |
| 36 | |
| 34 | | |||||
Currency commingled fund (k) | 87 | |
| - | |
| 87 | |
| - | |
| 91 | | |||||
Real estate commingled fund (i) | 92 | |
| - | |
| - | |
| 92 | |
| 83 | | |||||
Cash and cash equivalents | 21 | |
| 21 | |
| - | |
| - | |
| 15 | | |||||
Sub-total international plan assets | 2,995 | |
| $ | 197 | |
| $ | 2,670 | |
| $ | 128 | |
| 2,770 | | ||
Dividends and interest receivable | 7 | |
|
|
|
|
|
|
| 7 | | ||||||||
Total international plan assets | $ | 3,002 | |
|
|
|
|
|
|
| $ | 2,777 | | ||||||
(a) | 2014 and 2013 amounts include $415 million and $ 406 million , respectively, of retiree medical plan assets that are restricted for purposes of providing health benefits for U.S. retirees and their beneficiaries. |
(b) | Based on quoted market prices in active markets. |
(c) | Based on the fair value of the investments owned by these funds that track various U.S. large, mid-cap and small company indices. |
(d) | Includes one large-cap fund that represents 25% of total U.S. plan assets for both 2014 and 2013 . |
(e) | Based on the fair value of the investments owned by these funds that track various non-U.S. equity indices. |
(f) | Based on quoted bid prices for comparable securities in the marketplace and broker/dealer quotes in active markets. |
(g) | Corporate bonds of U.S.-based companies represent 23% and 21% , respectively, of total U.S. plan assets for 2014 and 2013 . |
(h) | Based on the fair value of the contracts as determined by the insurance companies using inputs that are not observable. |
(i) | Based on the appraised value of the investments owned by these funds as determined by independent third parties using inputs that are not observable. |
(j) | Based on the fair value of the investments owned by these funds that track various government and corporate bond indices. |
(k) | Based on the fair value of the investments owned by this fund that invests primarily in derivatives to hedge currency exposure. |
100
Table of Contents
The changes in Level 3 plan assets are as follows:
| Balance, Beginning 2013 |
| Return on Assets Held at Year-End |
| Purchases and Sales, Net |
| Balance, End of 2013 |
| Return on Assets Held at Year-End |
| Purchases and Sales, Net |
| Balance, End of 2014 | ||||||||||||||
Real estate commingled funds | $ | 391 | |
| $ | 56 | |
| $ | 188 | |
| $ | 635 | |
| $ | 68 | |
| $ | 18 | |
| $ | 721 | |
Contracts with insurance companies | 62 | |
| (1 | ) |
| (21 | ) |
| 40 | |
| 2 | |
| - | |
| 42 | | |||||||
Total | $ | 453 | |
| $ | 55 | |
| $ | 167 | |
| $ | 675 | |
| $ | 70 | |
| $ | 18 | |
| $ | 763 | |
Retiree Medical Cost Trend Rates
An average increase of 6% in the cost of covered retiree medical benefits is assumed for 2015 . This average increase is then projected to decline gradually to 5% in 2025 and thereafter. These assumed health care cost trend rates have an impact on the retiree medical plan expense and liability, however the cap on our share of retiree medical costs limits the impact. A 1-percentage-point change in the assumed health care trend rate would have the following effects:
| 1% |
| 1% | ||||
2014 service and interest cost components | $ | 4 | |
| $ | (3 | ) |
2014 benefit liability | $ | 46 | |
| $ | (40 | ) |
Savings Plan
Certain U.S. employees are eligible to participate in 401(k) savings plans, which are voluntary defined contribution plans. The plans are designed to help employees accumulate additional savings for retirement, and we make Company matching contributions for certain employees on a portion of eligible pay based on years of service.
As of February 2012, certain U.S. employees earning a benefit under one of our defined benefit pension plans were no longer eligible for Company matching contributions on their 401(k) contributions.
Certain U.S. salaried employees, who are not eligible to participate in a defined benefit pension plan, are also eligible to receive an employer contribution to the 401(k) savings plan based on age and years of service regardless of employee contribution.
In 2014 , 2013 and 2012 , our total Company contributions were $130 million , $122 million and $109 million , respectively.
For additional unaudited information on our pension and retiree medical plans and related accounting policies and assumptions, see "Our Critical Accounting Policies" in Management's Discussion and Analysis of Financial Condition and Results of Operations.
Note 8 - Related Party Transactions
Our related party transactions in 2014 , 2013 and 2012 are not material.
We coordinate, on an aggregate basis, the contract negotiations of sweeteners and other raw material requirements, including aluminum cans and plastic bottles and closures for us and certain of our independent bottlers. Once we have negotiated the contracts, the bottlers order and take delivery directly from the supplier and pay the suppliers directly. Consequently, these transactions are not reflected in our consolidated financial statements. As the contracting party, we could be liable to these suppliers in the event of any nonpayment by our bottlers, but we consider this exposure to be remote.
101
Table of Contents
In addition, our joint ventures with Unilever (under the Lipton brand name) and Starbucks sell finished goods (ready-to-drink teas and coffees, respectively) to us and our noncontrolled bottling affiliates. Consistent with accounting for equity method investments, our joint venture revenue is not included in our consolidated net revenue.
Certain members of our Board of Directors also serve on the boards of certain vendors and customers. These Board members do not participate in our vendor selection and negotiations nor in our customer negotiations. Our transactions with these vendors and customers are in the normal course of business and are consistent with terms negotiated with other vendors and customers. In addition, certain of our employees serve on the boards of Pepsi Bottling Ventures LLC and other affiliated companies of PepsiCo and do not receive incremental compensation for such services.
Note 9 - Debt Obligations and Commitments
The following table summarizes the Company's debt obligations:
| 2014 | |
| 2013 | | ||
Short-term debt obligations |
|
|
| ||||
Current maturities of long-term debt | $ | 4,096 | |
| $ | 2,224 | |
Commercial paper (0.1% and 0.1%) | 746 | |
| 2,924 | | ||
Other borrowings (17.7% and 12.4%) | 234 | |
| 158 | | ||
| $ | 5,076 | |
| $ | 5,306 | |
Long-term debt obligations |
|
|
| ||||
Notes due 2014 (5.3%) | $ | - | |
| $ | 2,219 | |
Notes due 2015 (1.4% and 1.2%) | 4,093 | |
| 4,116 | | ||
Notes due 2016 (2.6% and 2.5%) | 3,099 | |
| 3,106 | | ||
Notes due 2017 (1.6% and 2.0%) | 2,004 | |
| 1,258 | | ||
Notes due 2018 (4.4% and 4.3%) | 3,410 | | | 3,439 | | ||
Notes due 2019 (3.7% and 3.7%) | 1,631 | |
| 1,635 | | ||
Notes due 2020-2044 (3.9% and 4.0%) | 13,640 | |
| 10,738 | | ||
Other, due 2015-2019 (4.4% and 4.4%) | 40 | |
| 46 | | ||
| 27,917 | |
| 26,557 | | ||
Less: current maturities of long-term debt obligations | (4,096 | ) |
| (2,224 | ) | ||
Total | $ | 23,821 | |
| $ | 24,333 | |
The interest rates in the above table reflect weighted-average rates at year-end.
In 2014 , we issued:
• | $750 million of 0.950% senior notes maturing in February 2017 ; |
• | $1.250 billion of 3.600% senior notes maturing in March 2024 ; |
• | €500 million of 1.750% senior notes maturing in April 2021 ; |
• | €500 million of 2.625% senior notes maturing in April 2026 ; and |
• | $500 million of 4.250% senior notes maturing in October 2044 . |
The net proceeds from the issuances of the above notes were used for general corporate purposes, including the repayment of commercial paper.
In 2014 , $2.2 billion of senior notes matured and were paid.
102
Table of Contents
In 2014 , we entered into a new five-year unsecured revolving credit agreement (Five-Year Credit Agreement) which expires on June 9, 2019. The Five-Year Credit Agreement enables us and our borrowing subsidiaries to borrow up to $3.7725 billion , subject to customary terms and conditions. We may request that commitments under this agreement be increased up to $4.5 billion . Additionally, we may, once a year, request renewal of the agreement for an additional one-year period.
Also, in 2014 , we entered into a new 364-day unsecured revolving credit agreement (364-Day Credit Agreement) which expires on June 8, 2015. The 364-Day Credit Agreement enables us and our borrowing subsidiaries to borrow up to $3.7725 billion , subject to customary terms and conditions. We may request that commitments under this agreement be increased up to $4.5 billion . We may request renewal of this facility for an additional 364-day period or convert any amounts outstanding into a term loan for a period of up to one year, which would mature no later than the then effective termination date. The Five-Year Credit Agreement and the 364-Day Credit Agreement together replaced our $2.925 billion five-year credit agreement dated as of June 10, 2013 and our $2.925 billion 364-Day credit agreement dated as of June 10, 2013. Funds borrowed under the Five-Year Credit Agreement and the 364-Day Credit Agreement may be used for general corporate purposes. Subject to certain conditions, we may borrow, prepay and reborrow amounts under these agreements. As of December 27, 2014 , there were no outstanding borrowings under the Five-Year Credit Agreement or the 364-Day Credit Agreement.
In addition, as of December 27, 2014 , our international debt of $228 million was related to borrowings from external parties including various lines of credit. These lines of credit are subject to normal banking terms and conditions and are fully committed at least to the extent of our borrowings.
Long-Term Contractual Commitments (a)
The following table summarizes our long-term contractual commitments by period:
| Payments Due by Period | ||||||||||||||||||
| Total | |
| 2015 | |
| 2016 – 2017 | |
| 2018 – 2019 | |
| 2020 and beyond | | |||||
Long-term debt obligations (b) | $ | 23,446 | |
| $ | - | |
| $ | 5,108 | |
| $ | 4,863 | |
| $ | 13,475 | |
Interest on debt obligations (c) | 8,839 | |
| 873 | |
| 1,553 | |
| 1,245 | |
| 5,168 | | |||||
Operating leases | 1,894 | |
| 403 | |
| 631 | |
| 387 | |
| 473 | | |||||
Purchasing commitments (d) | 1,985 | |
| 693 | |
| 873 | |
| 293 | |
| 126 | | |||||
Marketing commitments (d) | 2,178 | |
| 391 | |
| 647 | |
| 525 | |
| 615 | | |||||
| $ | 38,342 | |
| $ | 2,360 | |
| $ | 8,812 | |
| $ | 7,313 | |
| $ | 19,857 | |
(a) | Based on year-end foreign exchange rates. We expect to make net cash tax payments of approximately $300 million within the next 12 months, as discussed further in Note 5. Reserves for uncertain tax positions are excluded from the table above as we are unable to reasonably predict the ultimate amount or timing of any other settlements. |
(b) | Excludes $4,096 million related to current maturities of long-term debt, $196 million related to the fair value step-up of debt acquired in connection with our acquisitions of PBG and PAS and $179 million related to the increase in carrying value of long-term debt representing the gains on our fair value interest rate swaps. |
(c) | Interest payments on floating-rate debt are estimated using interest rates effective as of December 27, 2014 . |
(d) | Primarily reflects non-cancelable commitments as of December 27, 2014 . |
Most long-term contractual commitments, except for our long-term debt obligations, are not recorded on our balance sheet. Operating leases primarily represent building leases. Non-cancelable purchasing commitments are primarily for oranges and orange juice. Non-cancelable marketing commitments are primarily for sports marketing. Bottler funding to independent bottlers is not reflected in our long-term contractual commitments as it is negotiated on an annual basis. Accrued liabilities for pension and retiree medical plans are not reflected in our long-term contractual commitments. See Note 7 for additional information regarding our pension and retiree medical obligations.
103
Table of Contents
Off-Balance-Sheet Arrangements
It is not our business practice to enter into off-balance-sheet arrangements, other than in the normal course of business. See Note 8 regarding contracts related to certain of our bottlers.
See "Our Liquidity and Capital Resources" in Management's Discussion and Analysis of Financial Condition and Results of Operations for further unaudited information on our borrowings.
Note 10 - Financial Instruments
Derivatives
We are exposed to market risks arising from adverse changes in:
• | commodity prices, affecting the cost of our raw materials and energy; |
• | foreign exchange rates and currency restrictions; and |
• | interest rates. |
In the normal course of business, we manage commodity price, foreign exchange and interest rate risks through a variety of strategies, including productivity initiatives, global purchasing programs and hedging. Ongoing productivity initiatives involve the identification and effective implementation of meaningful cost-saving opportunities or efficiencies, including the use of derivatives. Our global purchasing programs include fixed-price purchase orders and pricing agreements.
Our hedging strategies include the use of derivatives. Certain derivatives are designated as either cash flow or fair value hedges and qualify for hedge accounting treatment, while others do not qualify and are marked to market through earnings. Cash flows from derivatives used to manage commodity price, foreign exchange or interest rate risks are classified as operating activities in the Consolidated Statement of Cash Flows. We classify both the earnings and cash flow impact from these derivatives consistent with the underlying hedged item. See "Our Business Risks" in Management's Discussion and Analysis of Financial Condition and Results of Operations for further unaudited information on our business risks.
For cash flow hedges, the effective portion of changes in fair value are deferred in accumulated other comprehensive loss within common shareholders' equity until the underlying hedged item is recognized in net income. For fair value hedges, changes in fair value are recognized immediately in earnings, consistent with the underlying hedged item. Hedging transactions are limited to an underlying exposure. As a result, any change in the value of our derivative instruments would be substantially offset by an opposite change in the value of the underlying hedged items. We do not use derivative instruments for trading or speculative purposes. We perform assessments of our counterparty credit risk regularly, including reviewing netting agreements, if any, and a review of credit ratings, credit default swap rates and potential nonperformance of the counterparty. Based on our most recent assessment of our counterparty credit risk, we consider this risk to be low. In addition, we enter into derivative contracts with a variety of financial institutions that we believe are creditworthy in order to reduce our concentration of credit risk.
Commodity Prices
We are subject to commodity price risk because our ability to recover increased costs through higher pricing may be limited in the competitive environment in which we operate. This risk is managed through the use of fixed-price contracts and purchase orders, pricing agreements and derivative instruments, which include swaps and futures. In addition, risk to our supply of certain raw materials is mitigated through purchases from multiple geographies and suppliers. We use derivatives, with terms of no more than three years, to economically hedge price fluctuations related to a portion of our anticipated commodity purchases, primarily for agricultural products, energy and metals. Ineffectiveness for those derivatives that qualify for hedge
104
Table of Contents
accounting treatment was not material for all periods presented. Derivatives used to hedge commodity price risk that do not qualify for hedge accounting treatment are marked to market each period with the resulting gains and losses recorded in corporate unallocated expenses as either cost of sales or selling, general and administrative expenses, depending on the underlying commodity. These gains and losses are subsequently reflected in division results when the divisions recognize the cost of the underlying commodity in operating profit.
Our open commodity derivative contracts had a notional value of $1.2 billion as of December 27, 2014 and $1.4 billion as of December 28, 2013 .
Foreign Exchange
Our operations outside of the U.S. generate 49% of our net revenue, with Russia, Mexico, Canada, the United Kingdom and Brazil comprising approximately 23% of our net revenue in 2014 . As a result, we are exposed to foreign exchange risks.
Additionally, we are exposed to foreign exchange risk from foreign currency purchases and foreign currency assets and liabilities created in the normal course of business. We manage this risk through sourcing purchases from local suppliers, negotiating contracts in local currencies with foreign suppliers and through the use of derivatives, primarily forward contracts with terms of no more than two years. Exchange rate gains or losses related to foreign currency transactions are recognized as transaction gains or losses in our income statement as incurred.
Our foreign currency derivatives had a total notional value of $2.7 billion as of December 27, 2014 and $2.5 billion as of December 28, 2013 . Ineffectiveness for those derivatives that qualify for hedge accounting was not material for all periods presented. For foreign currency derivatives that do not qualify for hedge accounting treatment, all losses and gains were offset by changes in the underlying hedged items, resulting in no material net impact on earnings.
Interest Rates
We centrally manage our debt and investment portfolios considering investment opportunities and risks, tax consequences and overall financing strategies. We use various interest rate derivative instruments including, but not limited to, interest rate swaps, cross-currency interest rate swaps, Treasury locks and swap locks to manage our overall interest expense and foreign exchange risk. These instruments effectively change the interest rate and currency of specific debt issuances. Certain of our fixed rate indebtedness has been swapped to floating rates. The notional amount, interest payment and maturity date of the interest rate and cross-currency interest rate swaps match the principal, interest payment and maturity date of the related debt. Our Treasury locks and swap locks are entered into to protect against unfavorable interest rate changes relating to forecasted debt transactions.
The notional values of the interest rate derivative instruments outstanding as of December 27, 2014 and December 28, 2013 were $9.3 billion and $7.9 billion , respectively. Ineffectiveness, for those interest rate derivative instruments that qualify for cash flow hedge accounting were not material for all periods presented.
As of December 27, 2014 , approximately 25% of total debt, after the impact of the related interest rate derivative instruments, was exposed to variable rates, compared to 31% as of December 28, 2013 .
Available-for-Sale Securities
Investments in debt and equity marketable securities, other than investments accounted for under the equity method, are classified as available-for-sale. All highly liquid investments with original maturities of three
105
Table of Contents
months or less are classified as cash equivalents. Our investments in available-for-sale securities are reported at fair value. Unrealized gains and losses related to changes in the fair value of available-for-sale securities are recognized in accumulated other comprehensive loss within common shareholders' equity. Unrealized gains and losses on our investments in marketable debt securities as of December 27, 2014 were not material. The pre-tax unrealized gains on our investments in marketable equity securities were $111 million and $122 million as of December 27, 2014 and December 28, 2013 , respectively.
Changes in the fair value of available-for-sale securities impact net income only when such securities are sold or an other-than-temporary impairment is recognized. We regularly review our investment portfolio to determine if any security is other-than-temporarily impaired. In making this judgment, we evaluate, among other things, the duration and extent to which the fair value of a security is less than its cost; the financial condition of the issuer and any changes thereto; and our intent to sell, or whether we will more likely than not be required to sell, the security before recovery of its amortized cost basis. Our assessment on whether a security is other-than-temporarily impaired could change in the future due to new developments or changes in assumptions related to any particular security. We recorded no other-than-temporary impairment charges for the years ended December 27, 2014 and December 28, 2013 .
106
Table of Contents
Fair Value Measurements
The fair values of our financial assets and liabilities as of December 27, 2014 and December 28, 2013 are categorized as follows:
| 2014 |
| 2013 | ||||||||||||
| Assets(a) |
| Liabilities(a) |
| Assets (a) |
| Liabilities (a) | ||||||||
Available-for-sale securities: |
|
|
|
|
|
|
| ||||||||
Equity securities (b) | $ | 124 | |
| $ | - | |
| $ | 135 | |
| $ | - | |
Debt securities (c) | 3,167 | |
| - | |
| - | |
| - | | ||||
| $ | 3,291 | |
| $ | - | |
| $ | 135 | |
| $ | - | |
Short-term investments (d) | $ | 197 | |
| $ | - | |
| $ | 184 | |
| $ | - | |
Prepaid forward contracts (e) | $ | 26 | |
| $ | - | |
| $ | 24 | |
| $ | - | |
Deferred compensation (f) | $ | - | |
| $ | 504 | |
| $ | - | |
| $ | 504 | |
Derivatives designated as fair value hedging instruments: |
|
|
|
|
|
|
| ||||||||
Interest rate (g) | $ | 140 | |
| $ | - | |
| $ | 176 | |
| $ | 10 | |
Derivatives designated as cash flow hedging instruments: |
|
|
|
|
|
|
| ||||||||
Foreign exchange (h) | $ | 76 | |
| $ | 12 | |
| $ | 22 | |
| $ | 13 | |
Interest rate (h) | 1 | |
| 117 | |
| 19 | |
| - | | ||||
Commodity (i) | 3 | |
| 10 | |
| 6 | |
| 29 | | ||||
| $ | 80 | |
| $ | 139 | |
| $ | 47 | |
| $ | 42 | |
Derivatives not designated as hedging instruments: |
|
|
|
|
|
|
| ||||||||
Foreign exchange (h) | $ | 12 | |
| $ | 13 | |
| $ | 12 | |
| $ | 8 | |
Interest rate (g) | 57 | |
| 75 | |
| 71 | |
| 94 | | ||||
Commodity (i) | 18 | |
| 166 | |
| 20 | |
| 89 | | ||||
| $ | 87 | |
| $ | 254 | |
| $ | 103 | |
| $ | 191 | |
Total derivatives at fair value (j) | $ | 307 | |
| $ | 393 | |
| $ | 326 | |
| $ | 243 | |
Total | $ | 3,821 | |
| $ | 897 | |
| $ | 669 | |
| $ | 747 | |
(a) | Unless otherwise noted, financial assets are classified on our consolidated balance sheet within prepaid expenses and other current assets and other assets. Financial liabilities are classified on our consolidated balance sheet within accounts payable and other current liabilities and other liabilities. Unless specifically indicated, all financial assets and liabilities are categorized as Level 2 assets or liabilities. |
(b) | Based on the price of common stock. Categorized as a Level 1 asset. These equity securities are classified as investments in noncontrolled affiliates. |
(c) | Based on quoted broker prices or other significant inputs derived from or corroborated by observable market data. As of December 27, 2014 , $0.8 billion and $2.4 billion of debt securities were classified as cash equivalents and short-term investments, respectively. All of the Company's available-for-sale debt securities have contractual maturities of one year or less. |
(d) | Based on the price of index funds. Categorized as a Level 1 asset. These investments are classified as short-term investments and are used to manage a portion of market risk arising from our deferred compensation liability. |
(e) | Based primarily on the price of our common stock. |
(f) | Based on the fair value of investments corresponding to employees' investment elections. |
(g) | Based on LIBOR forward rates and recently reported market transactions of spot and forward rates. As of December 27, 2014 and December 28, 2013 , amounts related to non-designated instruments are presented as a net liability on our consolidated balance sheet. |
(h) | Based on recently reported market transactions of spot and forward rates. |
(i) | Based on recently reported market transactions, primarily swap arrangements. |
(j) | Unless otherwise noted, derivative assets and liabilities are presented on a gross basis on our consolidated balance sheet. Amounts subject to enforceable master netting arrangements or similar agreements which are not offset on the consolidated balance sheet as of December 27, 2014 and December 28, 2013 were immaterial. Collateral received against any of our asset positions was immaterial. |
107
Table of Contents
The carrying amounts of our cash and cash equivalents and short-term investments approximate fair value due to their short-term maturity. The fair value of our debt obligations as of December 27, 2014 and December 28, 2013 was $31 billion and $30 billion , respectively, based upon prices of similar instruments in the marketplace.
Pre-tax losses/(gains) on our derivative instruments are categorized as follows:
| Fair Value/Non-designated Hedges |
| Cash Flow Hedges | ||||||||||||||||||||
| Losses/(Gains)Recognized inIncome Statement(a) |
| Losses/(Gains)Recognized inAccumulated OtherComprehensive Loss |
| Losses/(Gains)Reclassified fromAccumulated OtherComprehensive Lossinto IncomeStatement(b) | ||||||||||||||||||
2014 | |
| 2013 | |
| 2014 | |
| 2013 | |
| 2014 | |
| 2013 | | |||||||
Foreign exchange | $ | 2 | |
| $ | (9 | ) |
| $ | (70 | ) |
| $ | (24 | ) |
| $ | (16 | ) |
| $ | - | |
Interest rate | 21 | |
| 99 | |
| 135 | |
| (13 | ) |
| 233 | |
| 3 | | ||||||
Commodity | 170 | |
| 126 | |
| 23 | |
| 57 | |
| 32 | |
| 42 | | ||||||
Total | $ | 193 | |
| $ | 216 | |
| $ | 88 | |
| $ | 20 | |
| $ | 249 | |
| $ | 45 | |
(a) | Foreign exchange derivative gains/losses are primarily included in selling, general and administrative expenses. Interest rate derivative gains/losses are primarily from fair value hedges and are included in interest expense. These gains/losses are substantially offset by increases/decreases in the value of the underlying debt, which are also included in interest expense. Commodity derivative gains/losses are included in either cost of sales or selling, general and administrative expenses, depending on the underlying commodity. |
(b) | Foreign exchange derivative gains/losses are primarily included in cost of sales. Interest rate derivative gains/losses are included in interest expense. Commodity derivative gains/losses are included in either cost of sales or selling, general and administrative expenses, depending on the underlying commodity. |
During the next 12 months, we expect to reclassify net gains of $21 million related to our cash flow hedges from accumulated other comprehensive loss into net income.
Note 11 - Net Income Attributable to PepsiCo per Common Share
Basic net income attributable to PepsiCo per common share is net income available for PepsiCo common shareholders divided by the weighted average of common shares outstanding during the period. Diluted net income attributable to PepsiCo per common share is calculated using the weighted average of common shares outstanding adjusted to include the effect that would occur if in-the-money employee stock options were exercised and RSUs, PSUs, PEPunits and preferred shares were converted into common shares. Out-of-the-money options during 2014 were nominal. Options to purchase 0.6 million shares in 2013 and 9.6 million shares in 2012 were not included in the calculation of diluted earnings per common share because these options were out-of-the-money. These out-of-the-money options had average exercise prices of $82.25 in 2014, $75.69 in 2013 and $67.64 in 2012 .
108
Table of Contents
The computations of basic and diluted net income attributable to PepsiCo per common share are as follows:
| 2014 |
| 2013 |
| 2012 | |||||||||||||||
| Income |
| Shares(a) |
| Income |
| Shares (a) |
| Income |
| Shares (a) | |||||||||
Net income attributable to PepsiCo | $ | 6,513 | |
|
|
| $ | 6,740 | |
|
|
| $ | 6,178 | |
|
| |||
Preferred shares: |
|
|
|
|
|
|
|
|
|
|
| |||||||||
Dividends | (1 | ) |
|
|
| (1 | ) |
|
|
| (1 | ) |
|
| ||||||
Redemption premium | (9 | ) |
|
|
| (7 | ) |
|
|
| (6 | ) |
|
| ||||||
Net income available for PepsiCo common shareholders | $ | 6,503 | |
| 1,509 | |
| $ | 6,732 | |
| 1,541 | |
| $ | 6,171 | |
| 1,557 | |
Basic net income attributable to PepsiCo per common share | $ | 4.31 | |
|
|
| $ | 4.37 | |
|
|
| $ | 3.96 | |
|
| |||
Net income available for PepsiCo common shareholders | $ | 6,503 | |
| 1,509 | |
| $ | 6,732 | |
| 1,541 | |
| $ | 6,171 | |
| 1,557 | |
Dilutive securities: |
|
|
|
|
|
|
|
|
|
|
| |||||||||
Stock options, RSUs, PSUs, PEPunits and Other | - | |
| 17 | |
| - | |
| 18 | |
| - | |
| 17 | | |||
ESOP convertible preferred stock | 10 | |
| 1 | |
| 8 | |
| 1 | |
| 7 | |
| 1 | | |||
Diluted | $ | 6,513 | |
| 1,527 | |
| $ | 6,740 | |
| 1,560 | |
| $ | 6,178 | |
| 1,575 | |
Diluted net income attributable to PepsiCo per common share | $ | 4.27 | |
|
|
| $ | 4.32 | |
|
|
| $ | 3.92 | |
|
| |||
(a) | Weighted-average common shares outstanding (in millions). |
Note 12 - Preferred Stock
As of December 27, 2014 and December 28, 2013 , there were 3 million shares of convertible preferred stock authorized. The preferred stock was issued for an ESOP established by Quaker and these shares are redeemable for common stock by the ESOP participants. The preferred stock accrues dividends at an annual rate of $5.46 per share. As of December 27, 2014 and December 28, 2013 , there were 803,953 preferred shares issued and 145,453 and 167,053 shares outstanding, respectively. The outstanding preferred shares had a fair value of $70 million as of December 27, 2014 and $69 million as of December 28, 2013 . Each share is convertible at the option of the holder into 4.9625 shares of common stock. Under certain conditions, the preferred shares may be called by us upon written notice at $78 per share plus accrued and unpaid dividends. Quaker made the final award to its ESOP in June 2001.
The following summarizes our preferred stock activity:
| 2014 |
| 2013 |
| 2012 | |||||||||||||||
| Shares(a) |
| Amount |
| Shares (a) |
| Amount |
| Shares (a) |
| Amount | |||||||||
Preferred stock | 0.8 | |
| $ | 41 | |
| 0.8 | |
| $ | 41 | |
| 0.8 | |
| $ | 41 | |
Repurchased preferred stock | |
|
|
|
|
|
|
|
|
| | |||||||||
Balance, beginning of year | 0.6 | |
| $ | 171 | |
| 0.6 | |
| $ | 164 | |
| 0.6 | |
| $ | 157 | |
Redemptions | 0.1 | |
| 10 | |
| - | |
| 7 | |
| - | |
| 7 | | |||
Balance, end of year | 0.7 | |
| $ | 181 | |
| 0.6 | |
| $ | 171 | |
| 0.6 | |
| $ | 164 | |
(a) | In millions. |
109
Table of Contents
Note 13 - Accumulated Other Comprehensive Loss Attributable to PepsiCo
Comprehensive income is a measure of income which includes both net income and other comprehensive income or loss. Other comprehensive income or loss results from items deferred from recognition into our income statement. Accumulated other comprehensive income or loss is separately presented on our balance sheet as part of common shareholders' equity. Other comprehensive (loss)/income attributable to PepsiCo was $(5,542) million in 2014 , $360 million in 2013 and $742 million in 2012 . The accumulated balances for each component of other comprehensive loss attributable to PepsiCo are as follows:
| 2014 | |
| 2013 | |
| 2012 | | |||
Currency translation adjustment (a) | $ | (8,255 | ) |
| $ | (3,247 | ) |
| $ | (1,946 | ) |
Cash flow hedges, net of tax | 34 | |
| (76 | ) |
| (94 | ) | |||
Unamortized pension and retiree medical, net of tax (b) | (2,500 | ) |
| (1,861 | ) |
| (3,491 | ) | |||
Unrealized gain on securities, net of tax | 87 | |
| 93 | |
| 64 | | |||
Other | (35 | ) |
| (36 | ) |
| (20 | ) | |||
Accumulated other comprehensive loss attributable to PepsiCo | $ | (10,669 | ) |
| $ | (5,127 | ) |
| $ | (5,487 | ) |
(a) | The change from 2013 to 2014 primarily reflects depreciation of the Russian ruble. |
(b) | Net of taxes of $1,260 million in 2014 , $945 million in 2013 and $1,832 million in 2012 . |
The following table summarizes the reclassifications from Accumulated Other Comprehensive Loss to the Consolidated Statement of Income for the years ended December 27, 2014 and December 28, 2013 :
| 2014 |
| 2013 |
|
| ||||
| Amount Reclassified from Accumulated Other Comprehensive Loss |
| Affected Line Item in the Consolidated Statement of Income | ||||||
|
|
|
|
|
| ||||
(Gains)/Losses on cash flow hedges: |
|
|
|
|
| ||||
Foreign exchange contracts | $ | (16 | ) |
| $ | - | |
| Cost of sales |
Interest rate derivatives | 233 | |
| 3 | |
| Interest expense | ||
Commodity contracts | 31 | |
| 44 | |
| Cost of sales | ||
Commodity contracts | 1 | |
| (2 | ) |
| Selling, general and administrative expenses | ||
Net losses before tax | 249 | |
| 45 | |
|
| ||
Tax amounts | (95 | ) |
| (17 | ) |
|
| ||
Net losses after tax | $ | 154 | |
| $ | 28 | |
|
|
|
|
|
|
|
| ||||
Pension and retiree medical items: |
|
|
|
|
| ||||
Amortization of net prior service credit (a) | $ | (6 | ) |
| $ | (2 | ) |
|
|
Amortization of net actuarial losses (a) | 226 | |
| 357 | |
|
| ||
Settlement/curtailment (a) | 149 | |
| (2 | ) |
|
| ||
Net losses before tax | 369 | |
| 353 | |
|
| ||
Tax amounts | (122 | ) |
| (123 | ) |
|
| ||
Net losses after tax | 247 | |
| 230 | |
|
| ||
Total net losses reclassified for the period, net of tax | $ | 401 | |
| $ | 258 | |
|
|
(a) | These items are included in the components of net periodic benefit cost for pension and retiree medical plans (see Note 7 for additional details). |
110
Table of Contents
Note 14 - Supplemental Financial Information
Supplemental information for accounts and notes receivable and inventories is summarized as follows:
| 2014 | |
| 2013 | |
| 2012 | | |||
Accounts and notes receivable |
|
|
|
|
| ||||||
Trade receivables | $ | 5,817 | |
| $ | 6,178 | |
|
| ||
Other receivables | 971 | |
| 921 | |
|
| ||||
| 6,788 | |
| 7,099 | |
|
| ||||
Allowance, beginning of year | 145 | |
| 157 | |
| $ | 157 | | ||
Net amounts charged to expense | 38 | |
| 29 | |
| 28 | | |||
Deductions (a) | (27 | ) |
| (34 | ) |
| (27 | ) | |||
Other (b) | (19 | ) |
| (7 | ) |
| (1 | ) | |||
Allowance, end of year | 137 | |
| 145 | |
| $ | 157 | | ||
Net receivables | $ | 6,651 | |
| $ | 6,954 | |
|
| ||
|
|
|
|
|
| ||||||
Inventories (c) |
|
|
|
|
| ||||||
Raw materials | $ | 1,593 | |
| $ | 1,732 | |
|
| ||
Work-in-process | 173 | |
| 168 | |
|
| ||||
Finished goods | 1,377 | |
| 1,509 | |
|
| ||||
| $ | 3,143 | |
| $ | 3,409 | |
|
| ||
(a) | Includes accounts written off. |
(b) | Includes adjustments related to acquisitions and divestitures, currency translation and other adjustments. |
(c) | Approximately 3% of the inventory cost in both 2014 and 2013 was computed using the LIFO method. The differences between LIFO and FIFO methods of valuing these inventories were not material. |
Supplemental information for other assets and accounts payable and other current liabilities is summarized as follows:
| 2014 | |
| 2013 | | ||
Other assets |
|
|
| ||||
Noncurrent notes and accounts receivable | $ | 93 | |
| $ | 105 | |
Deferred marketplace spending | 179 | |
| 214 | | ||
Pension plans (a) | 141 | |
| 687 | | ||
Other | 447 | |
| 419 | | ||
| $ | 860 | |
| $ | 1,425 | |
Accounts payable and other current liabilities |
|
|
| ||||
Accounts payable | $ | 5,127 | |
| $ | 4,874 | |
Accrued marketplace spending | 2,222 | |
| 2,245 | | ||
Accrued compensation and benefits | 1,746 | |
| 1,789 | | ||
Dividends payable | 1,009 | |
| 899 | | ||
Other current liabilities | 2,912 | |
| 2,726 | | ||
| $ | 13,016 | |
| $ | 12,533 | |
(a) | See Note 7 for additional information regarding our pension plans. |
111
Table of Contents
| 2014 | |
| 2013 | |
| 2012 | | |||
Other supplemental information |
|
|
|
|
| ||||||
Rent expense | $ | 707 | |
| $ | 639 | |
| $ | 581 | |
Interest paid | $ | 925 | |
| $ | 1,007 | |
| $ | 1,074 | |
Income taxes paid, net of refunds | $ | 1,847 | |
| $ | 3,076 | |
| $ | 1,840 | |
Note 15 - Acquisitions and Divestitures
Tingyi-Asahi Beverages Holding Co. Ltd.
On March 31, 2012, we completed a transaction with Tingyi. Under the terms of the agreement, we contributed our Company-owned and joint venture bottling operations in China to Tingyi's beverage subsidiary, Tingyi-Asahi Beverages Holding Co. Ltd. (TAB), and received as consideration a 5% indirect equity interest in TAB. As a result of this transaction, TAB is now our franchise bottler in China. We also have a call option to increase our indirect holding in TAB to 20% by the fourth quarter of 2015. We recorded restructuring and other charges of $150 million ( $176 million after-tax or $0.11 per share), primarily consisting of employee-related charges, in our 2012 results. This charge is reflected in items affecting comparability. See additional unaudited information in "Items Affecting Comparability" in Management's Discussion and Analysis of Financial Condition and Results of Operations.
Suntory Holdings Limited
During our second quarter of 2013, as part of the refranchising of our beverage business in Vietnam, we completed a transaction with Suntory Holdings Limited. Under the terms of the agreement, we sold a controlling interest in our Vietnam bottling operations. The alliance serves as the franchise bottler for both companies. As a result of this transaction, we recorded a pre- and after-tax gain of $137 million (or $0.09 per share) in our 2013 results.
112
Table of Contents
Management's Responsibility for Financial Reporting
To Our Shareholders:
At PepsiCo, our actions – the actions of all our associates – are governed by our Global Code of Conduct. This Code is clearly aligned with our stated values – a commitment to deliver sustained growth through empowered people acting with responsibility and building trust. Both the Code and our core values enable us to operate with integrity – both within the letter and the spirit of the law. Our Code of Conduct is reinforced consistently at all levels and in all countries. We have maintained strong governance policies and practices for many years.
The management of PepsiCo is responsible for the objectivity and integrity of our consolidated financial statements. The Audit Committee of the Board of Directors has engaged independent registered public accounting firm, KPMG LLP, to audit our consolidated financial statements, and they have expressed an unqualified opinion.
We are committed to providing timely, accurate and understandable information to investors. Our commitment encompasses the following:
Maintaining strong controls over financial reporting.
Our system of internal control is based on the control criteria framework of the Committee of Sponsoring Organizations of the Treadway Commission published in their report titled Internal Control – Integrated Framework (2013). The system is designed to provide reasonable assurance that transactions are executed as authorized and accurately recorded; that assets are safeguarded; and that accounting records are sufficiently reliable to permit the preparation of financial statements that conform in all material respects with accounting principles generally accepted in the U.S. We maintain disclosure controls and procedures designed to ensure that information required to be disclosed in reports under the Securities Exchange Act of 1934 is recorded, processed, summarized and reported within the specified time periods. We monitor these internal controls through self-assessments and an ongoing program of internal audits. Our internal controls are reinforced through our Global Code of Conduct, which sets forth our commitment to conduct business with integrity, and within both the letter and the spirit of the law.Exerting rigorous oversight of the business.
We continuously review our business results and strategies. This encompasses financial discipline in our strategic and daily business decisions. Our Executive Committee is actively involved – from understanding strategies and alternatives to reviewing key initiatives and financial performance. The intent is to ensure we remain objective in our assessments, constructively challenge our approach to potential business opportunities and issues, and monitor results and controls.Engaging strong and effective Corporate Governance from our Board of Directors.
We have an active, capable and diligent Board that meets the required standards for independence, and we welcome the Board's oversight as a representative of our shareholders. Our Audit Committee is comprised of independent directors with the financial literacy, knowledge and experience to provide appropriate oversight. We review our critical accounting policies, financial reporting and internal control matters with them and encourage their direct communication with KPMG LLP, with our Internal Auditor, and with our General Counsel. We also have a Compliance & Ethics Department, led by our Chief Compliance & Ethics Officer, to coordinate our compliance policies and practices.Providing investors with financial results that are complete, transparent and understandable.
The consolidated financial statements and financial information included in this report are the responsibility of management. This includes preparing the financial statements in accordance with accounting principles generally accepted in the U.S., which require estimates based on management's best judgment.113
Table of Contents
PepsiCo has a strong history of doing what's right.
We realize that great companies are built on trust, strong ethical standards and principles. Our financial results are delivered from that culture of accountability, and we take responsibility for the quality and accuracy of our financial reporting.February 12, 2015
|
|
| /s/ MARIE T. GALLAGHER |
| Marie T. Gallagher |
| Senior Vice President and Controller |
|
|
| /s/ HUGH F. JOHNSTON |
| Hugh F. Johnston |
| Executive Vice President and Chief Financial Officer |
|
|
| /s/ INDRA K. NOOYI |
| Indra K. Nooyi |
| Chairman of the Board of Directors and Chief Executive Officer |
114
Table of Contents
Report of Independent Registered Public Accounting Firm
The Board of Directors and Shareholders
PepsiCo, Inc.:
We have audited the accompanying Consolidated Balance Sheets of PepsiCo, Inc. and Subsidiaries ("PepsiCo, Inc." or "the Company") as of December 27, 2014 and December 28, 2013 , and the related Consolidated Statements of Income, Comprehensive Income, Cash Flows and Equity for each of the fiscal years in the three-year period ended December 27, 2014 . We also have audited PepsiCo, Inc.'s internal control over financial reporting as of December 27, 2014 , based on criteria established in Internal Control - Integrated Framework (2013) issued by the Committee of Sponsoring Organizations of the Treadway Commission ("COSO"). PepsiCo, Inc.'s management is responsible for these consolidated financial statements, for maintaining effective internal control over financial reporting, and for its assessment of the effectiveness of internal control over financial reporting, included in the accompanying Management's Report on Internal Control over Financial Reporting under Item 9A. Our responsibility is to express an opinion on these consolidated financial statements and an opinion on the Company's internal control over financial reporting based on our audits.
We conducted our audits in accordance with the standards of the Public Company Accounting Oversight Board (United States). Those standards require that we plan and perform the audits to obtain reasonable assurance about whether the financial statements are free of material misstatement and whether effective internal control over financial reporting was maintained in all material respects. Our audits of the consolidated financial statements included examining, on a test basis, evidence supporting the amounts and disclosures in the financial statements, assessing the accounting principles used and significant estimates made by management, and evaluating the overall financial statement presentation. Our audit of internal control over financial reporting included obtaining an understanding of internal control over financial reporting, assessing the risk that a material weakness exists, and testing and evaluating the design and operating effectiveness of internal control based on the assessed risk. Our audits also included performing such other procedures as we considered necessary in the circumstances. We believe that our audits provide a reasonable basis for our opinions.
A company's internal control over financial reporting is a process designed to provide reasonable assurance regarding the reliability of financial reporting and the preparation of financial statements for external purposes in accordance with generally accepted accounting principles. A company's internal control over financial reporting includes those policies and procedures that (1) pertain to the maintenance of records that, in reasonable detail, accurately and fairly reflect the transactions and dispositions of the assets of the company; (2) provide reasonable assurance that transactions are recorded as necessary to permit preparation of financial statements in accordance with generally accepted accounting principles, and that receipts and expenditures of the company are being made only in accordance with authorizations of management and directors of the company; and (3) provide reasonable assurance regarding prevention or timely detection of unauthorized acquisition, use, or disposition of the company's assets that could have a material effect on the financial statements.
Because of its inherent limitations, internal control over financial reporting may not prevent or detect misstatements. Also, projections of any evaluation of effectiveness to future periods are subject to the risk that controls may become inadequate because of changes in conditions, or that the degree of compliance with the policies or procedures may deteriorate.
115
Table of Contents
In our opinion, the consolidated financial statements referred to above present fairly, in all material respects, the financial position of PepsiCo, Inc. as of December 27, 2014 and December 28, 2013 , and the results of its operations and its cash flows for each of the fiscal years in the three-year period ended December 27, 2014 , in conformity with U.S. generally accepted accounting principles. Also in our opinion, PepsiCo, Inc. maintained, in all material respects, effective internal control over financial reporting as of December 27, 2014 , based on criteria established in Internal Control − Integrated Framework (2013) issued by COSO.
/s/ KPMG LLP
New York, New York
February 12, 2015
116
Table of Contents
Selected Financial Data
Selected quarterly financial data for 2014 and 2013 is summarized as follows (in millions except per share amounts, unaudited):
| 2014 |
| 2013 | ||||||||||||||||||||||||||||
| First Quarter | |
| Second Quarter | |
| Third Quarter | |
| Fourth Quarter | |
| First Quarter | |
| Second Quarter | |
| Third Quarter | |
| Fourth Quarter | | ||||||||
Net revenue | $ | 12,623 | |
| $ | 16,894 | |
| $ | 17,218 | |
| $ | 19,948 | |
| $ | 12,581 | |
| $ | 16,807 | |
| $ | 16,909 | |
| $ | 20,118 | |
Gross profit | $ | 6,876 | |
| $ | 9,116 | |
| $ | 9,223 | |
| $ | 10,584 | |
| $ | 6,747 | |
| $ | 8,909 | |
| $ | 8,963 | |
| $ | 10,553 | |
Mark-to-market net (gains)/losses (a) | $ | (34 | ) |
| $ | (31 | ) |
| $ | 33 | |
| $ | 100 | |
| $ | 16 | |
| $ | 39 | |
| $ | 19 | |
| $ | (2 | ) |
Merger and integration charges/(credits) (b) | - | |
| - | |
| - | |
| - | |
| $ | 1 | |
| $ | (1 | ) |
| $ | 9 | |
| $ | 1 | | ||||
Restructuring and impairment charges (c) | $ | 98 | |
| $ | 92 | |
| $ | 68 | |
| $ | 160 | |
| $ | 11 | |
| $ | 19 | |
| $ | 7 | |
| $ | 126 | |
Pension lump sum settlement charge (d) | - | |
| - | |
| - | |
| $ | 141 | |
| - | |
| - | |
| - | |
| - | | |||||||
Venezuela remeasurement charges (e) | - | |
| - | |
| - | |
| $ | 105 | |
| $ | 111 | |
| - | |
| - | |
| - | | ||||||
Gain on Vietnam refranchising (f) | - | |
| - | |
| - | |
| - | |
| - | |
| $ | (137 | ) |
| - | |
| - | | |||||||
Tax benefits (g) | - | |
| - | |
| - | |
| - | |
| - | |
| - | |
| - | |
| $ | (209 | ) | |||||||
Net income attributable to PepsiCo | $ | 1,216 | |
| $ | 1,978 | |
| $ | 2,008 | |
| $ | 1,311 | |
| $ | 1,075 | |
| $ | 2,010 | |
| $ | 1,913 | |
| $ | 1,742 | |
Net income attributable to PepsiCo per common share – basic | $ | 0.80 | |
| $ | 1.30 | |
| $ | 1.33 | |
| $ | 0.87 | |
| $ | 0.69 | |
| $ | 1.30 | |
| $ | 1.24 | |
| $ | 1.14 | |
Net income attributable to PepsiCo per common share – diluted | $ | 0.79 | |
| $ | 1.29 | |
| $ | 1.32 | |
| $ | 0.87 | |
| $ | 0.69 | |
| $ | 1.28 | |
| $ | 1.23 | |
| $ | 1.12 | |
Cash dividends declared per common share | $ | 0.5675 | |
| $ | 0.655 | |
| $ | 0.655 | |
| $ | 0.655 | |
| $ | 0.5375 | |
| $ | 0.5675 | |
| $ | 0.5675 | |
| $ | 0.5675 | |
Stock price per share (h) |
|
|
|
|
|
|
|
|
|
|
|
|
|
|
| ||||||||||||||||
High | $ | 83.99 | |
| $ | 88.72 | |
| $ | 93.51 | |
| $ | 100.70 | |
| $ | 79.27 | |
| $ | 84.78 | |
| $ | 87.06 | |
| $ | 86.73 | |
Low | $ | 77.01 | |
| $ | 81.53 | |
| $ | 86.71 | |
| $ | 89.82 | |
| $ | 67.39 | |
| $ | 77.60 | |
| $ | 78.20 | |
| $ | 78.67 | |
(a) | In 2014 and 2013 , we recognized mark-to-market net losses of $68 million ( $44 million after-tax or $0.03 per share) and $72 million ($ 44 million after-tax or $0.03 per share), respectively, on commodity hedges in corporate unallocated expenses. |
(b) | In 2013 , we incurred merger and integration charges of $10 million ($8 million after-tax or $0.01 per share) related to our acquisition of WBD. |
(c) | In 2014 and 2013 , restructuring and impairment charges were $418 million ( $316 million after-tax or $0.21 per share) and $163 million ( $129 million after-tax or $0.08 per share), respectively. In addition to the charges in the table above, we incurred pre-tax charges of $67 million ( $54 million after-tax or $0.04 per share) in the fourth quarter of 2014 related to productivity initiatives outside the scope of the 2014 and 2012 Productivity Plans. See Note 3 to our consolidated financial statements. |
(d) | In 2014, we recorded a pension lump sum settlement charge in corporate unallocated expenses of $141 million ( $88 million after-tax or $0.06 per share) related to payments for pension liabilities to certain former employees who had vested benefits. See Note 7 to our consolidated financial statements. |
(e) | In 2014, we recorded a $105 million net charge related to our remeasurement of the bolivar for certain net monetary assets of our Venezuela businesses. $126 million of this charge was recorded in corporate unallocated expenses, with the balance (equity income of $21 million ) recorded in our PAB segment. In total, this net charge had an after-tax impact of $105 million or $0.07 per share. In 2013, we recorded a $ 111 million net charge related to the devaluation of the bolivar for our Venezuela businesses. $ 124 million of this charge was recorded in corporate unallocated expenses, with the balance (equity income of $ 13 million ) recorded in our PAB segment. In total, this net charge had an after-tax impact of $ 111 million or $ 0.07 per share. |
(f) | In 2013 , we recognized a pre- and after-tax gain of $137 million (or $0.09 per share) in connection with the refranchising of our beverage business in Vietnam, which was offset by incremental investments in our business. See Note 15 to our consolidated financial statements. |
(g) | In the fourth quarter of 2013 , we recognized a non-cash tax benefit of $ 209 million ($ 0.13 per share) associated with our agreement with the IRS resolving all open matters related to the audits for taxable years 2003 through 2009, which reduced our reserve for uncertain tax positions for the tax years 2003 through 2012. The amount above excludes a fourth quarter reduction of our reserve for uncertain tax positions for the tax year 2013 of $107 million, reversing in full amounts accrued in the first three quarters of 2013; this reduction was more than offset by other tax related adjustments in the fourth quarter of 2013. See Note 5 to our consolidated financial statements. |
(h) | Represents the composite high and low sales price for one share of PepsiCo common stock. |
117
Table of Contents
Five-Year Summary
(unaudited)
| 2014 |
| 2013 |
| 2012 |
| 2011 |
| 2010 | ||||||||||
Net revenue | $ | 66,683 | |
| $ | 66,415 | |
| $ | 65,492 | |
| $ | 66,504 | |
| $ | 57,838 | |
Net income attributable to PepsiCo | $ | 6,513 | |
| $ | 6,740 | |
| $ | 6,178 | |
| $ | 6,443 | |
| $ | 6,320 | |
Net income attributable to PepsiCo per common share – basic | $ | 4.31 | |
| $ | 4.37 | |
| $ | 3.96 | |
| $ | 4.08 | |
| $ | 3.97 | |
Net income attributable to PepsiCo per common share – diluted | $ | 4.27 | |
| $ | 4.32 | |
| $ | 3.92 | |
| $ | 4.03 | |
| $ | 3.91 | |
Cash dividends declared per common share | $ | 2.5325 | |
| $ | 2.24 | |
| $ | 2.1275 | |
| $ | 2.025 | |
| $ | 1.890 | |
Total assets | $ | 70,509 | |
| $ | 77,478 | |
| $ | 74,638 | |
| $ | 72,882 | |
| $ | 68,153 | |
Long-term debt | $ | 23,821 | |
| $ | 24,333 | |
| $ | 23,544 | |
| $ | 20,568 | |
| $ | 19,999 | |
Return on invested capital (a) | 13.2 | % |
| 14.0 | % |
| 13.7 | % |
| 14.3 | % |
| 17.0 | % | |||||
(a) | Return on invested capital is defined as adjusted net income attributable to PepsiCo divided by the sum of average common shareholders' equity and average total debt. Adjusted net income attributable to PepsiCo is defined as net income attributable to PepsiCo plus interest expense after-tax. Interest expense after-tax was $582 million in 2014 , $583 million in 2013 , $576 million in 2012 , $548 million in 2011 and $578 million in 2010 . |
• Includes mark-to-market net losses/(gains) of:
| 2014 | |
| 2013 | |
| 2012 | |
| 2011 | |
| 2010 | | |||||
Pre-tax | $ | 68 | |
| $ | 72 | |
| $ | (65 | ) |
| $ | 102 | |
| $ | (91 | ) |
After-tax | $ | 44 | |
| $ | 44 | |
| $ | (41 | ) |
| $ | 71 | |
| $ | (58 | ) |
Per share | $ | 0.03 | |
| $ | 0.03 | |
| $ | (0.03 | ) |
| $ | 0.04 | |
| $ | (0.04 | ) |
• | Includes restructuring and impairment charges of: |
| 2014 | |
| 2013 | |
| 2012 | |
| 2011 | | ||||
Pre-tax | $ | 418 | |
| $ | 163 | |
| $ | 279 | |
| $ | 383 | |
After-tax | $ | 316 | |
| $ | 129 | |
| $ | 215 | |
| $ | 286 | |
Per share | $ | 0.21 | |
| $ | 0.08 | |
| $ | 0.14 | |
| $ | 0.18 | |
• | In 2014, we recorded pre-tax charges of $67 million ( $54 million after-tax or $0.04 per share) related to productivity initiatives outside the scope of the 2014 and 2012 Productivity Plans. |
• | In 2014, we recorded a pension lump sum settlement charge of $141 million ( $88 million after-tax or $0.06 per share) related to payments for pension liabilities to certain former employees who had vested benefits. |
• | In 2014, we recorded a $105 million net charge related to our remeasurement of the bolivar for certain net monetary assets of our Venezuela businesses. $126 million of this charge was recorded in corporate unallocated expenses, with the balance (equity income of $21 million ) recorded in our PAB segment. In total, this net charge had an after-tax impact of $105 million or $0.07 per share. |
• | In 2013 , we incurred merger and integration charges of $ 10 million ($ 8 million after-tax or $ 0.01 per share) related to our acquisition of WBD. |
• | In 2013 , we recorded a $ 111 million net charge related to the devaluation of the bolivar for our Venezuela businesses. $ 124 million of this charge was recorded in corporate unallocated expenses, with the balance (equity income of $ 13 million ) recorded in our PAB segment. In total, this net charge had an after-tax impact of $ 111 million or $ 0.07 per share. |
• | In 2013 , we recognized a pre- and after-tax gain of $137 million (or $0.09 per share) in connection with the refranchising of our beverage business in Vietnam, which was offset by incremental investments in our business. |
• | In 2013 , we recognized a non-cash tax benefit of $ 209 million ($ 0.13 per share) associated with our agreement with the IRS resolving all open matters related to the audits for taxable years 2003 through 2009, which reduced our reserves for uncertain tax positions for the tax years 2003 through 2012. |
• | In 2012 , we incurred merger and integration charges of $ 16 million ($ 12 million after-tax or $ 0.01 per share) related to our acquisition of WBD. |
• | In 2012 , we recorded restructuring and other charges of $ 150 million ($ 176 million after-tax or $ 0.11 per share) related to the transaction with Tingyi. |
118
Table of Contents
• | In 2012 , we recorded a pension lump sum settlement charge of $195 million ( $131 million after-tax or $ 0.08 per share) related to payments for pension liabilities to certain former employees who had vested benefits. |
• | In 2012 , we recognized a non-cash tax benefit of $217 million ( $0.14 per share) associated with a favorable tax court decision related to the classification of financial instruments. |
• | In 2011 , we incurred merger and integration charges of $329 million ( $271 million after-tax or $0.17 per share) related to our acquisitions of PBG, PAS and WBD. |
• | The 2011 fiscal year consisted of fifty-three weeks compared to fifty-two weeks in our normal fiscal year. The 53 rd week increased 2011 net revenue by $623 million and net income attributable to PepsiCo by $64 million or $0.04 per share. |
• | In 2011 , we recorded $46 million ($28 million after-tax or $0.02 per share) of incremental costs related to fair value adjustments to the acquired inventory included in WBD's balance sheet at the acquisition date and hedging contracts included in PBG's and PAS's balance sheets at the acquisition date. |
• | In 2010 , we incurred merger and integration charges of $799 million related to our acquisitions of PBG and PAS, as well as advisory fees in connection with our acquisition of WBD. In addition, we recorded $9 million of merger-related charges, representing our share of the respective merger costs of PBG and PAS. In total, these costs had an after-tax impact of $648 million or $0.40 per share. |
• | In 2010 , we recorded $398 million ($333 million after-tax or $0.21 per share) of incremental costs related to fair value adjustments to the acquired inventory and other related hedging contracts included in PBG's and PAS's balance sheets at the acquisition date. |
• | In 2010 , in connection with our acquisitions of PBG and PAS, we recorded a gain on our previously held equity interests of $958 million ($0.60 per share), comprising $735 million which was non-taxable and recorded in bottling equity income and $223 million related to the reversal of deferred tax liabilities associated with these previously held equity interests. |
• | In 2010 , we recorded a $120 million net charge ($120 million after-tax or $0.07 per share) related to our change to highly inflationary accounting for our Venezuelan businesses and the related devaluation of the bolivar. |
• | In 2010 , we recorded a $145 million charge ($92 million after-tax or $0.06 per share) related to a change in scope of one release in our ongoing migration to SAP software. |
• | In 2010 , we made a $100 million ($64 million after-tax or $0.04 per share) contribution to the PepsiCo Foundation Inc., in order to fund charitable and social programs over the next several years. |
• | In 2010 , we paid $672 million in a cash tender offer to repurchase $500 million (aggregate principal amount) of our 7.90% senior unsecured notes maturing in 2018. As a result of this debt repurchase, we recorded a $178 million charge to interest expense ($114 million after-tax or $0.07 per share), primarily representing the premium paid in the tender offer. |
119
Table of Contents
GLOSSARY
Acquisitions and divestitures
: all mergers and acquisitions activity, including the impact of acquisitions, divestitures and changes in ownership or control in consolidated subsidiaries and nonconsolidated equity investees.Bottler Case Sales (BCS)
: measure of physical beverage volume shipped to retailers and independent distributors from both PepsiCo and our independent bottlers.Bottler funding
: financial incentives we give to our independent bottlers to assist in the distribution and promotion of our beverage products.Concentrate Shipments and Equivalents (CSE)
: measure of our physical beverage volume shipments to independent bottlers, retailers and independent distributors.Constant currency
: financial results assuming constant foreign currency exchange rates used for translation based on the rates in effect for the comparable prior-year period. In order to compute our constant currency results, we multiply or divide, as appropriate, our current year U.S. dollar results by the current year average foreign exchange rates and then multiply or divide, as appropriate, those amounts by the prior year average foreign exchange rates.Consumers
: people who eat and drink our products.CSD
: carbonated soft drinks.Customers
: authorized independent bottlers, distributors and retailers.Derivatives
: financial instruments, such as futures, swaps, Treasury locks, cross currency swaps, options and forward contracts that we use to manage our risk arising from changes in commodity prices, interest rates, foreign exchange rates and stock prices.Direct-Store-Delivery (DSD)
: delivery system used by us and our independent bottlers to deliver snacks and beverages directly to retail stores where our products are merchandised.Effective net pricing
: reflects the year-over-year impact of discrete pricing actions, sales incentive activities and mix resulting from selling varying products in different package sizes and in different countries.Free cash flow
: net cash provided by operating activities less capital spending plus sales of property, plant and equipment.Hedge accounting
: treatment for qualifying hedges that allows fluctuations in a hedging instrument's fair value to offset corresponding fluctuations in the hedged item in the same reporting period. Hedge accounting is allowed only in cases where the hedging relationship between the hedging instruments and hedged items is highly effective, and only prospectively from the date a hedging relationship is formally documented.Independent bottlers
: customers to whom we have granted exclusive contracts to sell and manufacture certain beverage products bearing our trademarks within a specific geographical area.Mark-to-market net gain or loss
: change in market value for commodity contracts that we purchase to mitigate the volatility in costs of energy and raw materials that we consume. The market value is determined based on average prices on national exchanges and recently reported transactions in the marketplace.120
Table of Contents
Organic
:a measure that adjusts for impacts of acquisitions, divestitures and other structural changes and foreign exchange translation. In excluding the impact of foreign exchange translation, we assume constant foreign exchange rates used for translation based on the rates in effect for the comparable prior-year period. See the definition of "Constant currency" for additional information.
Servings
: common metric reflecting our consolidated physical unit volume. Our divisions' physical unit measures are converted into servings based on U.S. Food and Drug Administration guidelines for single-serving sizes of our products.Total marketplace spending
: includes sales incentives and discounts offered through various programs to our customers, consumers or independent bottlers, as well as advertising and other marketing activities.Transaction gains and losses
: the impact on our consolidated financial statements of exchange rate changes arising from specific transactions.Translation adjustment
: the impact of converting our foreign affiliates' financial statements into U.S. dollars for the purpose of consolidating our financial statements.
121
Table of Contents
Item 7A. Quantitative and Qualitative Disclosures About Market Risk.
Included in "Item 7. Management's Discussion and Analysis of Financial Condition and Results of Operations – Our Business Risks."
Item 8. Financial Statements and Supplementary Data.
See "Item 15. Exhibits and Financial Statement Schedules."
Item 9. Changes in and Disagreements with Accountants on Accounting and Financial Disclosure.
Not applicable.
Item 9A. Controls and Procedures.
(a) Disclosure Controls and Procedures. As of the end of the period covered by this report, we carried out an evaluation, under the supervision and with the participation of our management, including our Chief Executive Officer and Chief Financial Officer, of the effectiveness of the design and operation of our disclosure controls and procedures, as such term is defined in Rules 13a-15(e) and 15d-15(e) of the Securities Exchange Act of 1934, as amended (the Exchange Act). Based upon that evaluation, our Chief Executive Officer and Chief Financial Officer concluded that as of the end of the period covered by this report our disclosure controls and procedures were effective to ensure that information required to be disclosed by us in reports we file or submit under the Exchange Act is (1) recorded, processed, summarized and reported within the time periods specified in Securities and Exchange Commission rules and forms, and (2) accumulated and communicated to our management, including our Chief Executive Officer and Chief Financial Officer, as appropriate, to allow timely decisions regarding required disclosure.
(b) Management's Annual Report on Internal Control over Financial Reporting. Our management is responsible for establishing and maintaining adequate internal control over financial reporting, as such term is defined in Rule 13a-15(f) of the Exchange Act. Under the supervision and with the participation of our management, including our Chief Executive Officer and Chief Financial Officer, we conducted an evaluation of the effectiveness of our internal control over financial reporting based upon criteria established in Internal Control – Integrated Framework (2013) by the Committee of Sponsoring Organizations of the Treadway Commission. Based on that evaluation, our management concluded that our internal control over financial reporting was effective as of December 27, 2014 .
.
KPMG LLP, an independent registered public accounting firm, has audited the consolidated financial statements included in this Annual Report on Form 10-K and, as part of their audit, has issued their report, included herein, on the effectiveness of our internal control over financial reporting.(c) Changes in Internal Control over Financial Reporting. During our fourth fiscal quarter of 2014 , we continued migrating certain of our financial processing systems to an enterprise-wide systems solution. These systems implementations are part of our ongoing global business transformation initiative, and we plan to continue implementing such systems throughout other parts of our businesses over the course of the next few years. In connection with these implementations and resulting business process changes, we continue to enhance the design and documentation of our internal control over financial reporting processes to maintain effective controls over our financial reporting.
Except as described above, there were no changes in our internal control over financial reporting during our fourth fiscal quarter of 2014 that have materially affected, or are reasonably likely to materially affect, our internal control over financial reporting.
122
Table of Contents
Item 9B. Other Information.
Not applicable.
PART III
Item 10. Directors, Executive Officers and Corporate Governance.
Information about our directors and persons nominated to become directors is contained under the caption "Election of Directors" in our Proxy Statement for our 2015 Annual Meeting of Shareholders to be filed with the SEC within 120 days of the fiscal year ended December 27, 2014 (the 2015 Proxy Statement) and is incorporated herein by reference. Information about our executive officers is reported under the caption "Executive Officers of the Registrant" in Part I of this report.
Information on beneficial ownership reporting compliance is contained under the caption "Ownership of PepsiCo Common Stock – Section 16(a) Beneficial Ownership Reporting Compliance" in our 2015 Proxy Statement and is incorporated herein by reference.
We have a written code of conduct that applies to all of our employees, including our Chairman of the Board of Directors and Chief Executive Officer, Chief Financial Officer and Controller, and to our Board of Directors. Our Global Code of Conduct is distributed to all employees and is available on our website at http://www.pepsico.com . A copy of our Global Code of Conduct may be obtained free of charge by writing to Investor Relations, PepsiCo, Inc., 700 Anderson Hill Road, Purchase, New York 10577. Any amendment to our Global Code of Conduct and any waiver applicable to our executive officers or senior financial officers will be posted on our website within the time period required by the SEC and New York Stock Exchange.
Information about the procedures by which security holders may recommend nominees to our Board of Directors can be found in our 2015 Proxy Statement under the caption "Corporate Governance at PepsiCo – Committees of the Board of Directors – The Nominating and Corporate Governance Committee – Recommendations for Director Nominees" and is incorporated herein by reference.
Information concerning the composition of the Audit Committee and our Audit Committee financial experts is contained in our 2015 Proxy Statement under the captions "Corporate Governance at PepsiCo – Committees of the Board of Directors" and "Corporate Governance at PepsiCo – Committees of the Board of Directors – The Audit Committee" and is incorporated herein by reference.
Item 11. Executive Compensation.
Information about director and executive officer compensation, Compensation Committee interlocks and the Compensation Committee Report is contained in our 2015 Proxy Statement under the captions "2014 Director Compensation," "Executive Compensation," "Corporate Governance at PepsiCo – Committees of the Board of Directors – The Compensation Committee – Compensation Committee Interlocks and Insider Participation" and "Compensation Committee Report" and is incorporated herein by reference.
Item 12. Security Ownership of Certain Beneficial Owners and Management and Related Stockholder Matters.
Information with respect to securities authorized for issuance under equity compensation plans can be found under the caption "Securities Authorized for Issuance Under Equity Compensation Plans" in our 2015 Proxy Statement and is incorporated herein by reference.
Information on the number of shares of PepsiCo Common Stock beneficially owned by each director and named executive officer, by all directors and executive officers as a group and on each beneficial owner of more than 5% of PepsiCo Common Stock is contained under the caption "Ownership of PepsiCo Common Stock" in our 2015 Proxy Statement and is incorporated herein by reference.
123
Table of Contents
Item 13. Certain Relationships and Related Transactions, and Director Independence.
Information with respect to certain relationships and related transactions and director independence is contained under the captions "Corporate Governance at PepsiCo – Related Person Transactions" and "Corporate Governance at PepsiCo – Director Independence" in our 2015 Proxy Statement and is incorporated herein by reference.
Item 14. Principal Accounting Fees and Services.
Information on our Audit Committee's pre-approval policy and procedures for audit and other services and information on our principal accountant fees and services is contained in our 2015 Proxy Statement under the caption "Audit and Other Fees" and is incorporated herein by reference.
124
Table of Contents
PART IV
Item 15. Exhibits and Financial Statement Schedules.
(a)1. | Financial Statements |
| The following consolidated financial statements of PepsiCo, Inc. and its affiliates are included herein by reference to the pages indicated on the index appearing in "Item 7. Management's Discussion and Analysis of Financial Condition and Results of Operations": |
| Consolidated Statement of Income – Fiscal years ended December 27, 2014, December 28, 2013 and December 29, 2012 |
| Consolidated Statement of Comprehensive Income – Fiscal years ended December 27, 2014, December 28, 2013 and December 29, 2012 |
| Consolidated Statement of Cash Flows – Fiscal years ended December 27, 2014, December 28, 2013 and December 29, 2012 |
| Consolidated Balance Sheet – December 27, 2014 and December 28, 2013 |
| Consolidated Statement of Equity – Fiscal years ended December 27, 2014, December 28, 2013 and December 29, 2012 |
| Notes to Consolidated Financial Statements, and |
| Report of Independent Registered Public Accounting Firm. |
(a)2. | Financial Statement Schedules |
| These schedules are omitted because they are not required or because the information is set forth in the financial statements or the notes thereto. |
(a)3. | Exhibits |
| See Index to Exhibits. |
125
Table of Contents
SIGNATURES
Pursuant to the requirements of Section 13 or 15(d) of the Securities Exchange Act of 1934, PepsiCo has duly caused this report to be signed on its behalf by the undersigned, thereunto duly authorized.
Dated: February 12, 2015
|
|
|
| PepsiCo, Inc. | |
|
|
|
| By: | /s/ Indra K. Nooyi |
|
| Indra K. Nooyi |
|
| Chairman of the Board of Directors and Chief Executive Officer |
126
Table of Contents
Pursuant to the requirements of the Securities Exchange Act of 1934, this report has been signed below by the following persons on behalf of PepsiCo and in the capacities and on the date indicated.
|
|
|
SIGNATURE | TITLE | DATE |
/s/ Indra K. Nooyi | Chairman of the Board of Directors and | February 12, 2015 |
Indra K. Nooyi | Chief Executive Officer |
|
/s/ Hugh F. Johnston | Executive Vice President and | February 12, 2015 |
Hugh F. Johnston | Chief Financial Officer |
|
/s/ Marie T. Gallagher | Senior Vice President and Controller | February 12, 2015 |
Marie T. Gallagher | (Principal Accounting Officer) |
|
/s/ Shona L. Brown | Director | February 12, 2015 |
Shona L. Brown |
|
|
/s/ George W. Buckley | Director | February 12, 2015 |
George W. Buckley |
|
|
/s/ Ian M. Cook | Director | February 12, 2015 |
Ian M. Cook |
|
|
/s/ Dina Dublon | Director | February 12, 2015 |
Dina Dublon |
|
|
/s/ Rona A. Fairhead | Director | February 12, 2015 |
Rona A. Fairhead |
|
|
/s/ Ray L. Hunt | Director | February 12, 2015 |
Ray L. Hunt |
|
|
/s/ Alberto Ibargüen | Director | February 12, 2015 |
Alberto Ibargüen |
|
|
/s/ David C. Page | Director | February 12, 2015 |
David C. Page |
|
|
/s/ Sharon Percy Rockefeller | Director | February 12, 2015 |
Sharon Percy Rockefeller |
|
|
/s/ Lloyd G. Trotter | Director | February 12, 2015 |
Lloyd G. Trotter |
|
|
/s/ Daniel Vasella | Director | February 12, 2015 |
Daniel Vasella |
|
|
/s/ Alberto Weisser | Director | February 12, 2015 |
Alberto Weisser |
|
|
127
Table of Contents
INDEX TO EXHIBITS
ITEM 15(a)(3)
The following is a list of the exhibits filed as part of this Form 10-K. The documents incorporated by reference are located in the SEC's Public Reference Room in Washington, D.C. in the SEC's file no. 1-1183.
EXHIBIT
3.1 | Articles of Incorporation of PepsiCo, Inc., as amended and restated, effective as of May 9, 2011, which are incorporated herein by reference to Exhibit 3.1 to PepsiCo, Inc.'s Current Report on Form 8-K filed with the Securities and Exchange Commission on May 9, 2011. |
|
|
3.2 | By-laws of PepsiCo, Inc., as amended, effective as of November 22, 2013, which are incorporated herein by reference to Exhibit 3.2 to PepsiCo, Inc.'s Current Report on Form 8-K filed with the Securities and Exchange Commission on November 27, 2013. |
|
|
4.1 | PepsiCo, Inc. agrees to furnish to the SEC, upon request, a copy of any instrument defining the rights of holders of long-term debt of PepsiCo, Inc. and all of its subsidiaries for which consolidated or unconsolidated financial statements are required to be filed with the Securities and Exchange Commission. |
|
|
4.2 | Indenture dated May 21, 2007 between PepsiCo, Inc. and The Bank of New York Mellon (formerly known as The Bank of New York), as Trustee, which is incorporated herein by reference to Exhibit 4.3 to PepsiCo, Inc.'s Registration Statement on Form S-3ASR (Registration No. 333-154314) filed with the Securities and Exchange Commission on October 15, 2008. |
|
|
4.3 | Form of 5.00% Senior Note due 2018, which is incorporated herein by reference to Exhibit 4.2 to PepsiCo, Inc.'s Current Report on Form 8-K filed with the Securities and Exchange Commission on May 21, 2008. |
|
|
4.4 | Form of 7.90% Senior Note due 2018, which is incorporated herein by reference to Exhibit 4.1 to PepsiCo, Inc.'s Current Report on Form 8-K filed with the Securities and Exchange Commission on October 24, 2008. |
|
|
4.5 | Form of 3.10% Senior Note due 2015, which is incorporated herein by reference to Exhibit 4.2 to PepsiCo, Inc.'s Current Report on Form 8-K filed with the Securities and Exchange Commission on January 13, 2010. |
|
|
4.6 | Form of 4.50% Senior Note due 2020, which is incorporated herein by reference to Exhibit 4.3 to PepsiCo, Inc.'s Current Report on Form 8-K filed with the Securities and Exchange Commission on January 13, 2010. |
|
|
4.7 | Form of 5.50% Senior Note due 2040, which is incorporated herein by reference to Exhibit 4.4 to PepsiCo, Inc.'s Current Report on Form 8-K filed with the Securities and Exchange Commission on January 13, 2010. |
|
|
4.8 | Form of 3.125% Senior Note due 2020, which is incorporated herein by reference to Exhibit 4.2 to PepsiCo, Inc.'s Current Report on Form 8-K filed with the Securities and Exchange Commission on October 25, 2010. |
|
|
4.9 | Form of 4.875% Senior Note due 2040, which is incorporated herein by reference to Exhibit 4.3 to PepsiCo, Inc.'s Current Report on Form 8-K filed with the Securities and Exchange Commission on October 25, 2010. |
|
|
4.10 | Form of 0.950% Senior Notes due 2017, which is incorporated herein by reference to Exhibit 4.1 to PepsiCo, Inc.'s Current Report on Form 8-K filed with the Securities and Exchange Commission on February 28, 2014. |
|
|
128
Table of Contents
4.11 | Form of 3.600% Senior Notes due 2024, which is incorporated herein by reference to Exhibit 4.2 to PepsiCo, Inc.'s Current Report on Form 8-K filed with the Securities and Exchange Commission on February 28, 2014. |
|
|
4.12 | Form of 1.750% Senior Notes due 2021, which is incorporated herein by reference to Exhibit 4.1 to PepsiCo, Inc.'s Current Report on Form 8-K filed with the Securities and Exchange Commission on April 28, 2014. |
|
|
4.13 | Form of 2.625% Senior Notes due 2026, which is incorporated herein by reference to Exhibit 4.2 to PepsiCo, Inc.'s Current Report on Form 8-K filed with the Securities and Exchange Commission on April 28, 2014. |
|
|
4.14 | Form of 4.250% Senior Notes due 2044, which is incorporated herein by reference to Exhibit 4.1 of PepsiCo, Inc.'s Current Report on Form 8-K filed with the Securities and Exchange Commission on October 22, 2014. |
|
|
4.15 | Board of Directors Resolutions Authorizing PepsiCo, Inc.'s Officers to Establish the Terms of the 3.10% Senior Note due 2015, 4.50% Senior Note due 2020, 5.50% Senior Note due 2040, 3.125% Senior Note due 2020 and 4.875% Senior Note due 2040, which are incorporated herein by reference to Exhibit 4.1 to PepsiCo, Inc.'s Quarterly Report on Form 10-Q for the 24 weeks ended June 12, 2010. |
|
|
4.16 | Form of 2.500% Senior Note due 2016, which is incorporated herein by reference to Exhibit 4.2 to PepsiCo, Inc.'s Current Report on Form 8-K filed with the Securities and Exchange Commission on May 6, 2011. |
|
|
4.17 | Board of Directors Resolutions Authorizing PepsiCo, Inc.'s Officers to Establish the Terms of the 2.500% Senior Note due 2016, the 3.000% Senior Note due 2021, the 0.750% Senior Note due 2015, the 2.750% Senior Note due 2022, the 4.000% Senior Note due 2042, the 0.700% Senior Note due 2015, the 1.250% Senior Note due 2017, the 3.600% Senior Note due 2042 and the 2.500% Senior Note due 2022, which are incorporated herein by reference to Exhibit 4.3 to PepsiCo, Inc.'s Current Report on Form 8-K filed with the Securities and Exchange Commission on May 6, 2011. |
|
|
4.18 | Form of 3.000% Senior Note due 2021, which is incorporated herein by reference to Exhibit 4.2 to PepsiCo, Inc.'s Current Report on Form 8-K filed with the Securities and Exchange Commission on August 25, 2011. |
|
|
4.19 | Form of 0.750% Senior Note due 2015, which is incorporated herein by reference to Exhibit 4.1 to PepsiCo, Inc.'s Current Report on Form 8-K filed with the Securities and Exchange Commission on March 2, 2012. |
|
|
4.20 | Form of 2.750% Senior Note due 2022, which is incorporated herein by reference to Exhibit 4.2 to PepsiCo, Inc.'s Current Report on Form 8-K filed with the Securities and Exchange Commission on March 2, 2012. |
|
|
4.21 | Form of 4.000% Senior Note due 2042, which is incorporated herein by reference to Exhibit 4.3 to PepsiCo, Inc.'s Current Report on Form 8-K filed with the Securities and Exchange Commission on March 2, 2012. |
|
|
4.22 | Form of 0.700% Senior Note due 2015, which is incorporated herein by reference to Exhibit 4.1 to PepsiCo, Inc.'s Current Report on Form 8-K filed with the Securities and Exchange Commission on August 13, 2012. |
|
|
4.23 | Form of 1.250% Senior Note due 2017, which is incorporated herein by reference to Exhibit 4.2 to PepsiCo, Inc.'s Current Report on Form 8-K filed with the Securities and Exchange Commission on August 13, 2012. |
|
|
4.24 | Form of 3.600% Senior Note due 2042, which is incorporated herein by reference to Exhibit 4.3 to PepsiCo, Inc.'s Current Report on Form 8-K filed with the Securities and Exchange Commission on August 13, 2012. |
|
|
129
Table of Contents
4.25 | Form of 2.500% Senior Note due 2022, which is incorporated herein by reference to Exhibit 4.1 to PepsiCo, Inc.'s Current Report on Form 8-K filed with the Securities and Exchange Commission on October 30, 2012. |
|
|
4.26 | Indenture dated as of October 24, 2008 among PepsiCo, Inc., Bottling Group, LLC and The Bank of New York Mellon, as Trustee, which is incorporated herein by reference to Exhibit 4.2 to PepsiCo, Inc.'s Current Report on Form 8-K filed with the Securities and Exchange Commission on October 24, 2008. |
|
|
4.27 | Form of PepsiCo Guarantee of 6.95% Senior Note due 2014 of Bottling Group, LLC, which is incorporated herein by reference to Exhibit 4.4 to PepsiCo, Inc.'s Current Report on Form 8-K filed with the Securities and Exchange Commission on October 24, 2008. |
|
|
4.28 | Form of Floating Rate Note due 2016, which is incorporated herein by reference to Exhibit 4.1 to PepsiCo, Inc.'s Current Report on Form 8-K filed with the Securities and Exchange Commission on February 28, 2013. |
|
|
4.29 | Form of 0.700% Senior Note due 2016, which is incorporated herein by reference to Exhibit 4.2 to PepsiCo, Inc.'s Current Report on Form 8-K filed with the Securities and Exchange Commission on February 28, 2013. |
|
|
4.30 | Form of 2.750% Senior Note due 2023, which is incorporated herein by reference to Exhibit 4.3 to PepsiCo, Inc.'s Current Report on Form 8-K filed with the Securities and Exchange Commission on February 28, 2013. |
|
|
4.31 | Board of Directors Resolutions Authorizing PepsiCo, Inc.'s Officers to Establish the Terms of the Floating Rate Note due 2016, the 0.700% Senior Note due 2016, the 2.750% Senior Note due 2023, the Floating Rate Notes due 2015, the 2.250% Senior Notes due 2019, the 0.950% Senior Notes due 2017, the 3.600% Senior Notes due 2024, the 1.750% Senior Notes due 2021, the 2.625% Senior Notes due 2026 and the 4.250% Senior Notes due 2044, which are incorporated herein by reference to Exhibit 4.4 to PepsiCo, Inc.'s Current Report on Form 8-K filed with the Securities and Exchange Commission on February 28, 2013. |
|
|
4.32 | Form of Floating Rate Notes due 2015, which is incorporated herein by reference to Exhibit 4.1 to PepsiCo, Inc.'s Current Report on Form 8-K filed with the Securities and Exchange Commission on July 30, 2013. |
|
|
4.33 | Form of 2.250% Senior Notes due 2019, which is incorporated herein by reference to Exhibit 4.2 to PepsiCo, Inc.'s Current Report on Form 8-K filed with the Securities and Exchange Commission on July 30, 2013. |
|
|
4.34 | First Supplemental Indenture, dated as of February 26, 2010, among Pepsi-Cola Metropolitan Bottling Company, Inc., The Pepsi Bottling Group, Inc., Bottling Group, LLC and The Bank of New York Mellon to the Indenture dated March 8, 1999 between The Pepsi Bottling Group, Inc., Bottling Group, LLC and The Chase Manhattan Bank, which is incorporated herein by reference to Exhibit 4.1 to PepsiCo, Inc.'s Current Report on Form 8-K filed with the Securities and Exchange Commission on March 1, 2010. |
|
|
4.35 | Indenture, dated as of March 8, 1999, by and among The Pepsi Bottling Group, Inc., as obligor, Bottling Group, LLC, as guarantor, and The Chase Manhattan Bank, as trustee, relating to $1,000,000,000 7% Series B Senior Note due 2029, which is incorporated herein by reference to Exhibit 10.14 to The Pepsi Bottling Group, Inc.'s Registration Statement on Form S-1 (Registration No. 333-70291). |
|
|
130
Table of Contents
4.36 | Second Supplemental Indenture, dated as of February 26, 2010, among Pepsi-Cola Metropolitan Bottling Company, Inc., PepsiAmericas, Inc. and The Bank New York Mellon Trust Company, N.A. to the Indenture dated as of January 15, 1993 between Whitman Corporation and The First National Bank of Chicago, as trustee, which is incorporated herein by reference to Exhibit 4.2 to PepsiCo, Inc.'s Current Report on Form 8-K filed with the Securities and Exchange Commission on March 1, 2010. |
|
|
4.37 | First Supplemental Indenture, dated as of May 20, 1999, including the Indenture dated as of January 15, 1993, between Whitman Corporation and The First National Bank of Chicago, as trustee, which is incorporated herein by reference to Exhibit 4.3 to Post-Effective Amendment No. 1 to PepsiAmericas, Inc.'s Registration Statement on Form S-8 (Registration No. 333-64292) filed with the Securities and Exchange Commission on December 29, 2005. |
|
|
4.38 | Form of PepsiAmericas, Inc. 7.625% Note due 2015, which is incorporated herein by reference to Exhibit 4.6 to PepsiCo, Inc.'s Quarterly Report on Form 10-Q for the quarterly period ended March 20, 2010. |
|
|
4.39 | Form of PepsiAmericas, Inc. 7.29% Note due 2026, which is incorporated herein by reference to Exhibit 4.7 to PepsiCo, Inc.'s Quarterly Report on Form 10-Q for the quarterly period ended March 20, 2010. |
|
|
4.40 | Form of PepsiAmericas, Inc. 7.44% Note due 2026, which is incorporated herein by reference to Exhibit 4.8 to PepsiCo, Inc.'s Quarterly Report on Form 10-Q for the quarterly period ended March 20, 2010. |
|
|
4.41 | First Supplemental Indenture, dated as of February 26, 2010, among Pepsi-Cola Metropolitan Bottling Company, Inc., PepsiAmericas, Inc. and Wells Fargo Bank, National Association to the Indenture dated as of August 15, 2003 between PepsiAmericas, Inc. and Wells Fargo Bank Minnesota, National Association, as trustee, which is incorporated herein by reference to Exhibit 4.3 to PepsiCo, Inc.'s Current Report on Form 8-K filed with the Securities and Exchange Commission on March 1, 2010. |
|
|
4.42 | Indenture dated as of August 15, 2003 between PepsiAmericas, Inc. and Wells Fargo Bank Minnesota, National Association, as trustee, which is incorporated herein by reference to Exhibit 4 to PepsiAmericas, Inc.'s Registration Statement on Form S-3 (Registration No. 333-108164) filed with the Securities and Exchange Commission on August 22, 2003. |
|
|
4.43 | Form of PepsiAmericas, Inc. 4.375% Note due 2014, which is incorporated herein by reference to Exhibit 4.1 to PepsiAmericas, Inc.'s Current Report on Form 8-K filed with the Securities and Exchange Commission on February 10, 2009. |
|
|
4.44 | Form of PepsiAmericas, Inc. 4.875% Note due 2015, which is incorporated herein by reference to Exhibit 4.15 to PepsiCo, Inc.'s Quarterly Report on Form 10-Q for the quarterly period ended March 20, 2010. |
|
|
4.45 | Form of PepsiAmericas, Inc. 5.00% Note due 2017, which is incorporated herein by reference to Exhibit 4.16 to PepsiCo, Inc.'s Quarterly Report on Form 10-Q for the quarterly period ended March 20, 2010. |
|
|
4.46 | Form of PepsiAmericas, Inc. 5.50% Note due 2035, which is incorporated herein by reference to Exhibit 4.17 to PepsiCo, Inc.'s Quarterly Report on Form 10-Q for the quarterly period ended March 20, 2010. |
|
|
4.47 | Indenture, dated as of June 10, 2003 by and between Bottling Group, LLC, as obligor, and JPMorgan Chase Bank, as trustee, relating to $250,000,000 4 1/8% Senior Note due June 15, 2015, which is incorporated herein by reference to Exhibit 4.1 to Bottling Group, LLC's registration statement on Form S-4 (Registration No. 333-106285) filed with the Securities and Exchange Commission on June 19, 2003. |
|
|
131
Table of Contents
4.48 | Indenture, dated as of October 1, 2003, by and between Bottling Group, LLC, as obligor, and JPMorgan Chase Bank, as trustee, which is incorporated herein by reference to Exhibit 4.1 to Bottling Group, LLC's Current Report on Form 8-K filed with the Securities and Exchange Commission on October 3, 2003. |
|
|
4.49 | Indenture, dated as of March 30, 2006, by and between Bottling Group, LLC, as obligor, and JPMorgan Chase Bank, N.A., as trustee, which is incorporated herein by reference to Exhibit 4.1 to The Pepsi Bottling Group, Inc.'s Quarterly Report on Form 10-Q for the quarter ended March 25, 2006. |
|
|
4.50 | Form of Bottling Group, LLC 5.50% Senior Note due April 1, 2016, which is incorporated herein by reference to Exhibit 4.2 to The Pepsi Bottling Group, Inc.'s Quarterly Report on Form 10-Q for the quarter ended March 25, 2006. |
|
|
4.51 | Form of Bottling Group, LLC 6.95% Senior Note due March 15, 2014, which is incorporated herein by reference to Exhibit 4.3 to Bottling Group, LLC's Current Report on Form 8-K filed with the Securities and Exchange Commission on October 24, 2008. |
|
|
4.52 | Form of Bottling Group, LLC 5.125% Senior Note due January 15, 2019, which is incorporated herein by reference to Exhibit 4.1 to Bottling Group, LLC's Current Report on Form 8-K filed with the Securities and Exchange Commission on January 20, 2009. |
|
|
4.53 | Form of PepsiCo Guarantee of Pepsi-Cola Metropolitan Bottling Company, Inc.'s 7.00% Note due 2029, 7.625% Note due 2015, 7.29% Note due 2026, 7.44% Note due 2026, 4.375% Note due 2014, 4.875% Note due 2015, 5.00% Note due 2017, 5.50% Note due 2035 and Bottling Group, LLC's 4.125% Note due 2015, 5.50% Note due 2016 and 5.125% Note due 2019, which is incorporated herein by reference to Exhibit 4.1 to PepsiCo, Inc.'s Current Report on Form 8-K filed with the Securities and Exchange Commission on October 5, 2010. |
|
|
10.1 | PepsiCo, Inc. 1994 Long-Term Incentive Plan, as amended and restated, effective October 1, 1999, which is incorporated herein by reference to Exhibit 10.6 to PepsiCo, Inc.'s Annual Report on Form 10-K for the fiscal year ended December 25, 1999.* |
|
|
10.2 | PepsiCo Executive Income Deferral Program (Plan Document for the Pre-409A Program), amended and restated effective July 1, 1997, which is incorporated herein by reference to Exhibit 10.1 to PepsiCo, Inc.'s Quarterly Report on Form 10-Q for the fiscal quarter ended September 6, 2008.* |
|
|
10.3 | PepsiCo SharePower Stock Option Plan, as amended and restated effective August 3, 2001, which is incorporated herein by reference to Exhibit 10.13 to PepsiCo, Inc.'s Annual Report on Form 10-K for the fiscal year ended December 28, 2002.* |
|
|
10.4 | PepsiCo, Inc. 1995 Stock Option Incentive Plan (as amended and restated effective August 2, 2001), which is incorporated herein by reference to Exhibit 10.14 to PepsiCo, Inc.'s Annual Report on Form 10-K for the fiscal year ended December 28, 2002.* |
|
|
10.5 | The Quaker Long-Term Incentive Plan of 1990, which is incorporated herein by reference to Exhibit 10.16 to PepsiCo, Inc.'s Annual Report on Form 10-K for the fiscal year ended December 28, 2002.* |
|
|
10.6 | The Quaker Long-Term Incentive Plan of 1999, which is incorporated herein by reference to Exhibit 10.17 to PepsiCo, Inc.'s Annual Report on Form 10-K for the fiscal year ended December 28, 2002.* |
|
|
132
Table of Contents
10.7 | PepsiCo, Inc. 2003 Long-Term Incentive Plan, as amended and restated effective September 12, 2008, which is incorporated herein by reference to Exhibit 10.4 to PepsiCo, Inc.'s Quarterly Report on Form 10-Q for the fiscal quarter ended September 6, 2008.* |
|
|
10.8 | PepsiCo, Inc. Executive Incentive Compensation Plan, which is incorporated herein by reference to Exhibit B to PepsiCo, Inc.'s Proxy Statement for its 2009 Annual Meeting of Shareholders filed with the Securities and Exchange Commission on March 24, 2009.* |
|
|
10.9 | Form of Regular Performance-Based Long-Term Incentive Award Agreement, which is incorporated herein by reference to Exhibit 99.1 to PepsiCo, Inc.'s Current Report on Form 8-K filed with the Securities and Exchange Commission on January 28, 2005.* |
|
|
10.10 | Form of Regular Long-Term Incentive Award Agreement, which is incorporated herein by reference to Exhibit 99.2 to PepsiCo, Inc.'s Current Report on Form 8-K filed with the Securities and Exchange Commission on January 28, 2005.* |
|
|
10.11 | Form of Special Long-Term Incentive Award Agreement (Restricted Stock Units Terms and Conditions), which is incorporated herein by reference to Exhibit 99.3 to PepsiCo, Inc.'s Current Report on Form 8-K filed with the Securities and Exchange Commission on January 28, 2005.* |
|
|
10.12 | Form of Special Long-Term Incentive Award Agreement (Stock Option Agreement), which is incorporated herein by reference to Exhibit 99.4 to PepsiCo, Inc.'s Current Report on Form 8-K filed with the Securities and Exchange Commission on January 28, 2005.* |
|
|
10.13 | Form of Non-Employee Director Restricted Stock Unit Agreement, which is incorporated herein by reference to Exhibit 99.5 to PepsiCo, Inc.'s Current Report on Form 8-K filed with the Securities and Exchange Commission on January 28, 2005.* |
|
|
10.14 | Form of Non-Employee Director Stock Option Agreement, which is incorporated herein by reference to Exhibit 99.6 to PepsiCo, Inc.'s Current Report on Form 8-K filed with the Securities and Exchange Commission on January 28, 2005.* |
|
|
10.15 | Form of PepsiCo, Inc. Director Indemnification Agreement, which is incorporated herein by reference to Exhibit 10.20 to PepsiCo, Inc.'s Annual Report on Form 10-K for the fiscal year ended December 25, 2004.* |
|
|
10.16 | Severance Plan for Executive Employees of PepsiCo, Inc. and Affiliates, which is incorporated herein by reference to Exhibit 10.5 to PepsiCo, Inc.'s Quarterly Report on Form 10-Q for the fiscal quarter ended September 6, 2008.* |
|
|
10.17 | Form of Annual Long-Term Incentive Award Agreement, which is incorporated herein by reference to Exhibit 99.1 to PepsiCo, Inc.'s Current Report on Form 8-K filed with the Securities and Exchange Commission on February 2, 2006.* |
|
|
10.18 | Form of Performance-Based Long-Term Incentive Award Agreement, which is incorporated herein by reference to Exhibit 99.2 to PepsiCo, Inc.'s Current Report on Form 8-K filed with the Securities and Exchange Commission on February 2, 2006.* |
|
|
10.19 | Form of Pro Rata Performance-Based Long-Term Incentive Award Agreement, which is incorporated herein by reference to Exhibit 99.3 to PepsiCo, Inc.'s Current Report on Form 8-K filed with the Securities and Exchange Commission on February 2, 2006.* |
|
|
133
Table of Contents
10.20 | Form of Restricted Stock Unit Retention Award Agreement, which is incorporated herein by reference to Exhibit 99.5 to PepsiCo, Inc.'s Current Report on Form 8-K filed with the Securities and Exchange Commission on February 2, 2006.* |
|
|
10.21 | Form of Stock Option Retention Award Agreement, which is incorporated herein by reference to Exhibit 99.4 to PepsiCo, Inc.'s Current Report on Form 8-K filed with the Securities and Exchange Commission on February 2, 2006.* |
|
|
10.22 | PepsiCo Executive Income Deferral Program (Plan Document for the 409A Program), amended and restated effective as of January 1, 2005, which is incorporated herein by reference to Exhibit 10.2 to PepsiCo, Inc.'s Quarterly Report on Form 10-Q for the fiscal quarter ended September 6, 2008.* |
|
|
10.23 | PepsiCo Director Deferral Program, amended and restated effective as of January 1, 2005 with revisions through September 19, 2012, which is incorporated herein by reference to Exhibit 10.1 to PepsiCo, Inc.'s Quarterly Report on Form 10-Q for the fiscal quarter ended September 8, 2012.* |
|
|
10.24 | Amendments to the PepsiCo, Inc. 2003 Long-Term Incentive Plans, the PepsiCo, Inc. 1994 Long-Term Incentive Plan, the PepsiCo, Inc. 1995 Stock Option Incentive Plan, the PepsiCo SharePower Stock Option Plan, the PepsiCo, Inc. 1987 Incentive Plan effective as of December 31, 2005, which are incorporated herein by reference to Exhibit 10.31 to PepsiCo, Inc.'s Annual Report on Form 10-K for the fiscal year ended December 31, 2005.* |
|
|
10.25 | Amendments to the PepsiCo, Inc. 2003 Long-Term Incentive Plan, the PepsiCo SharePower Stock Option Plan, the PepsiCo, Inc. 1995 Stock Option Incentive Plan, the Quaker Long-Term Incentive Plan of 1999, the Quaker Long-Term Incentive Plan of 1990 and the PepsiCo, Inc. Director Stock Plan, effective as of November 17, 2006, which are incorporated herein by reference to Exhibit 10.31 to PepsiCo, Inc.'s Annual Report on Form 10-K for the fiscal year ended December 30, 2006.* |
|
|
10.26 | Form of Non-Employee Director Long-Term Incentive Award Agreement, which is incorporated herein by reference to Exhibit 10.2 to PepsiCo, Inc.'s Quarterly Report on Form 10-Q for the fiscal quarter ended September 9, 2006.* |
|
|
10.27 | Form of Annual Long-Term Incentive Award Agreement, which is incorporated herein by reference to Exhibit 10.2 to PepsiCo, Inc.'s Current Report on Form 8-K filed with the Securities and Exchange Commission on February 7, 2007.* |
|
|
10.28 | Form of Performance-Based Long-Term Incentive Award Agreement, which is incorporated herein by reference to Exhibit 10.3 to PepsiCo, Inc.'s Current Report on Form 8-K filed with the Securities and Exchange Commission on February 7, 2007.* |
|
|
10.29 | Amendment to the PepsiCo, Inc. 1994 Long-Term Incentive Plan, the PepsiCo, Inc. 1995 Stock Option Incentive Plan, the PepsiCo SharePower Stock Option Plan and the PepsiCo, Inc. 1987 Incentive Plan, effective as of February 2, 2007, which is incorporated herein by reference to Exhibit 10.41 to PepsiCo, Inc.'s Annual Report on Form 10-K for the fiscal year ended December 30, 2006.* |
|
|
10.30 | Form of Pro Rata Long-Term Incentive Award Agreement, which is incorporated herein by reference to Exhibit 10.2 to PepsiCo, Inc.'s Current Report on Form 8-K filed with the Securities and Exchange Commission on May 8, 2007.* |
|
|
10.31 | Form of Stock Option Retention Award Agreement, which is incorporated herein by reference to Exhibit 10.3 to PepsiCo, Inc.'s Current Report on Form 8-K filed with the Securities and Exchange Commission on May 8, 2007.* |
|
|
134
Table of Contents
10.32 | Form of Restricted Stock Unit Retention Award Agreement, which is incorporated herein by reference to Exhibit 10.4 to PepsiCo, Inc.'s Current Report on Form 8-K filed with the Securities and Exchange Commission on May 8, 2007.* |
|
|
10.33 | PepsiCo, Inc. 2007 Long-Term Incentive Plan, as amended and restated March 12, 2010, which is incorporated herein by reference to Exhibit 10.1 to PepsiCo, Inc.'s Current Report on Form 8-K filed with the Securities and Exchange Commission on May 11, 2010.* |
|
|
10.34 | Form of Annual Long-Term Incentive Award Agreement, which is incorporated herein by reference to Exhibit 10.1 to PepsiCo, Inc.'s Current Report on Form 8-K filed with the Securities and Exchange Commission on February 7, 2008.* |
|
|
10.35 | Form of Performance-Based Long-Term Incentive Award Agreement, which is incorporated herein by reference to Exhibit 10.2 to PepsiCo, Inc.'s Current Report on Form 8-K filed with the Securities and Exchange Commission on February 7, 2008.* |
|
|
10.36 | Form of Annual Long-Term Incentive Award Agreement, which is incorporated herein by reference to Exhibit 10.1 to PepsiCo, Inc.'s Current Report on Form 8-K filed with the Securities and Exchange Commission on February 11, 2009.* |
|
|
10.37 | Form of Performance-Based Long-Term Incentive Award Agreement, which is incorporated herein by reference to Exhibit 10.2 to PepsiCo, Inc.'s Current Report on Form 8-K filed with the Securities and Exchange Commission on February 11, 2009.* |
|
|
10.38 | Form of Pro Rata Long-Term Incentive Award Agreement, which is incorporated herein by reference to Exhibit 10.3 to PepsiCo, Inc.'s Current Report on Form 8-K filed with the Securities and Exchange Commission on February 11, 2009.* |
|
|
10.39 | Form of Stock Option Retention Award Agreement, which is incorporated herein by reference to Exhibit 10.4 to PepsiCo, Inc.'s Current Report on Form 8-K filed with the Securities and Exchange Commission on February 11, 2009.* |
|
|
10.40 | Form of Restricted Stock Unit Retention Award Agreement, which is incorporated herein by reference to Exhibit 10.5 to PepsiCo, Inc.'s Current Report on Form 8-K filed with the Securities and Exchange Commission on February 11, 2009.* |
|
|
10.41 | PepsiCo Pension Equalization Plan (Plan Document for the 409A Plan), January 1, 2005 Restatement, As Amended Through December 31, 2008, which is incorporated herein by reference to Exhibit 10.46 to PepsiCo, Inc.'s Annual Report on Form 10-K for the fiscal year ended December 27, 2008.* |
|
|
10.42 | Form of Aircraft Time Sharing Agreement, which is incorporated herein by reference to Exhibit 10 to PepsiCo, Inc.'s Quarterly Report on Form 10-Q for the fiscal quarter ended March 21, 2009.* |
|
|
10.43 | PepsiCo Pension Equalization Plan (Plan Document for the Pre-Section 409A Program), January 1, 2005 Restatement, As Amended Through December 31, 2008, which is incorporated herein by reference to Exhibit 10.1 to PepsiCo, Inc.'s Quarterly Report on Form 10-Q for the fiscal quarter ended June 13, 2009.* |
|
|
10.44 | PBG 2004 Long Term Incentive Plan, which is incorporated herein by reference to Exhibit 99.1 to PepsiCo, Inc.'s Registration Statement on Form S-8 as filed with the Securities and Exchange Commission on February 26, 2010 (Registration No. 333-165107).* |
|
|
10.45 | PBG 2002 Long Term Incentive Plan, which is incorporated herein by reference to Exhibit 99.2 to PepsiCo, Inc.'s Registration Statement on Form S-8 as filed with the Securities and Exchange Commission on February 26, 2010 (Registration No. 333-165107).* |
|
|
135
Table of Contents
10.46 | PBG Long Term Incentive Plan, which is incorporated herein by reference to Exhibit 99.3 to PepsiCo, Inc.'s Registration Statement on Form S-8 as filed with the Securities and Exchange Commission on February 26, 2010 (Registration No. 333-165107).* |
|
|
10.47 | The Pepsi Bottling Group, Inc. 1999 Long Term Incentive Plan, which is incorporated herein by reference to Exhibit 99.4 to PepsiCo, Inc.'s Registration Statement on Form S-8 as filed with the Securities and Exchange Commission on February 26, 2010 (Registration No. 333-165107).* |
|
|
10.48 | PBG Directors' Stock Plan, which is incorporated herein by reference to Exhibit 99.5 to PepsiCo, Inc.'s Registration Statement on Form S-8 as filed with the Securities and Exchange Commission on February 26, 2010 (Registration No. 333-165107).* |
|
|
10.49 | PBG Stock Incentive Plan, which is incorporated herein by reference to Exhibit 99.6 to PepsiCo, Inc.'s Registration Statement on Form S-8 as filed with the Securities and Exchange Commission on February 26, 2010 (Registration No. 333-165107).* |
|
|
10.50 | Amendments to PBG 2002 Long Term Incentive Plan, PBG Long Term Incentive Plan, The Pepsi Bottling Group, Inc. 1999 Long Term Incentive Plan and PBG Stock Incentive Plan (effective February 8, 2007), which are incorporated herein by reference to Exhibit 99.7 to PepsiCo, Inc.'s Registration Statement on Form S-8 as filed with the Securities and Exchange Commission on February 26, 2010 (Registration No. 333-165107).* |
|
|
10.51 | Amendments to PBG 2004 Long Term Incentive Plan, PBG 2002 Long Term Incentive Plan, The Pepsi Bottling Group, Inc. Long Term Incentive Plan, The Pepsi Bottling Group, Inc. 1999 Long Term Incentive Plan, PBG Directors' Stock Plan and PBG Stock Incentive Plan (effective February 19, 2010), which are incorporated herein by reference to Exhibit 99.8 to PepsiCo, Inc.'s Registration Statement on Form S-8 as filed with the Securities and Exchange Commission on February 26, 2010 (Registration No. 333-165107).* |
|
|
10.52 | PepsiAmericas, Inc. 2000 Stock Incentive Plan (including Amendments No. 1, No. 2 and No. 3 thereto), which is incorporated herein by reference to Exhibit 99.9 to PepsiCo, Inc.'s Registration Statement on Form S-8 as filed with the Securities and Exchange Commission on February 26, 2010 (Registration No. 333-165107).* |
|
|
10.53 | Amendment No. 4 to PepsiAmericas, Inc. 2000 Stock Incentive Plan (effective February 18, 2010), which is incorporated herein by reference to Exhibit 99.10 to PepsiCo, Inc.'s Registration Statement on Form S-8 as filed with the Securities and Exchange Commission on February 26, 2010 (Registration No. 333-165107).* |
|
|
10.54 | Amendment to the PepsiCo Executive Income Deferral Program Document for the 409A Program, adopted February 18, 2010, which is incorporated herein by reference to Exhibit 10.11 to PepsiCo, Inc.'s Quarterly Report on Form 10-Q for the quarterly period ended March 20, 2010.* |
|
|
10.55 | Amendment to the PepsiCo Pension Equalization Plan Document for the 409A Program, adopted February 18, 2010, which is incorporated herein by reference to Exhibit 10.12 to PepsiCo, Inc.'s Quarterly Report on Form 10-Q for the quarterly period ended March 20, 2010.* |
|
|
10.56 | Specified Employee Amendments to Arrangements Subject to Section 409A of the Internal Revenue Code, adopted February 18, 2010 and March 29, 2010, which is incorporated herein by reference to Exhibit 10.13 to PepsiCo, Inc.'s Quarterly Report on Form 10-Q for the quarterly period ended March 20, 2010.* |
|
|
136
Table of Contents
10.57 | Form of Performance-Based Long-Term Incentive Award Agreement, which is incorporated herein by reference to Exhibit 10.1 to PepsiCo, Inc.'s Current Report on Form 8-K filed with the Securities and Exchange Commission on April 16, 2010.* |
|
|
10.58 | Amendment to the PepsiCo Executive Income Deferral Program Document for the 409A Program, adopted June 28, 2010, which is incorporated herein by reference to Exhibit 10.1 to PepsiCo, Inc.'s Quarterly Report on Form 10-Q for the quarterly period ended September 4, 2010.* |
|
|
10.59 | Amendment to the PepsiCo Pension Equalization Plan (Plan Document for the 409A Program and Plan Document for the Pre-409A Document), effective as of January 1, 2011, which is incorporated herein by reference to Exhibit 10.63 to PepsiCo, Inc.'s Annual Report on Form 10-K for the fiscal year ended December 25, 2010.* |
|
|
10.60 | PBG Pension Equalization Plan (Plan Document for the 409A Program), as amended, which is incorporated herein by reference to Exhibit 10.65 to PepsiCo, Inc.'s Annual Report on Form 10-K for the fiscal year ended December 25, 2010.* |
|
|
10.61 | PBG Pension Equalization Plan (Plan Document for the Pre-409A Program), as amended, which is incorporated herein by reference to Exhibit 10.66 to PepsiCo, Inc.'s Annual Report on Form 10-K for the fiscal year ended December 25, 2010.* |
|
|
10.62 | PBG Executive Income Deferral Program (Plan Document for the 409A Program), as amended, which is incorporated herein by reference to Exhibit 10.67 to PepsiCo, Inc.'s Annual Report on Form 10-K for the fiscal year ended December 25, 2010.* |
|
|
10.63 | PBG Executive Income Deferral Program (Plan Document for the Pre-409A Program), as amended, which is incorporated herein by reference to Exhibit 10.68 to PepsiCo, Inc.'s Annual Report on Form 10-K for the fiscal year ended December 25, 2010.* |
|
|
10.64 | Amendment to the PBG Pension Equalization Plan (Plan Document for the 409A Program and Plan Document for the Pre-409A Program), effective as of January 1, 2011, which is incorporated herein by reference to Exhibit 10.1 to PepsiCo, Inc.'s Quarterly Report on Form 10-Q for the quarterly period ended September 3, 2011.* |
|
|
10.65 | The PepsiCo International Retirement Plan Defined Benefit Program, as amended and restated effective as of January 1, 2010, which is incorporated herein by reference to Exhibit 10.68 to PepsiCo, Inc.'s Annual Report on Form 10-K for the fiscal year ended December 31, 2011.* |
|
|
10.66 | Amendment to the PepsiCo International Retirement Plan Defined Benefit Program, effective as of January 1, 2011, which is incorporated herein by reference to Exhibit 10.69 to PepsiCo, Inc.'s Annual Report on Form 10-K for the fiscal year ended December 31, 2011.* |
|
|
10.67 | PepsiCo Automatic Retirement Contribution Equalization Plan, effective as of January 1, 2011, which is incorporated herein by reference to Exhibit 10.70 to PepsiCo, Inc.'s Annual Report on Form 10-K for the fiscal year ended December 31, 2011.* |
|
|
10.68 | Amendment to the PepsiCo Pension Equalization Plan (both the Plan Document for the 409A Program and Plan Document for the Pre-409A Program) and the PBG Pension Equalization Plan (both the Plan Document for the 409A Program and Plan Document for the Pre-409A Program), generally, effective January 1, 2011 and merging the PBG Pension Equalization Plan into the PepsiCo Pension Equalization Plan as of the end of the day on December 31, 2011, which is incorporated herein by reference to Exhibit 10.71 to PepsiCo, Inc.'s Annual Report on Form 10-K for the fiscal year ended December 31, 2011.* |
|
|
137
Table of Contents
10.69 | Form of Annual Long-Term Incentive Award Agreement, which is incorporated herein by reference to Exhibit 10.1 to PepsiCo, Inc.'s Quarterly Report on Form 10-Q for the quarterly period ended March 24, 2012.* |
|
|
10.70 | Amendment to the PepsiCo Pension Equalization Plan (both the Plan Document for the 409A Program and Plan Document for the Pre-409A Program), effective as of December 1, 2012, which is incorporated herein by reference to Exhibit 10.75 to PepsiCo, Inc.'s Annual Report on Form 10-K for the fiscal year ended December 29, 2012.* |
|
|
10.71 | Form of Annual Long-Term Incentive Award Agreement, which is incorporated herein by reference to Exhibit 10.1 to PepsiCo, Inc.'s Current Report on Form 8-K filed with the Securities and Exchange Commission on February 11, 2013.* |
|
|
10.72 | Form of Annual Long-Term Incentive Award Agreement, which is incorporated herein by reference to Exhibit 10.1 to PepsiCo, Inc.'s Current Report on Form 8-K filed with the Securities and Exchange Commission on March 18, 2013.* |
|
|
10.73 | Amendment to the PepsiCo Pension Equalization Plan (both the Plan Document for the 409A Program and Plan Document for the Pre-409A Program), generally effective as of January 1, 2013, which is incorporated herein by reference to Exhibit 10.77 to PepsiCo, Inc.'s Annual Report on Form 10-K for the fiscal year ended December 28, 2013.* |
|
|
10.74 | PepsiCo, Inc. 2007 Long-Term Incentive Plan, as amended and restated March 13, 2014, which is incorporated herein by reference to Exhibit 10.1 to PepsiCo, Inc.'s Current Report on Form 8-K filed with the Securities and Exchange Commission on March 14, 2014.* |
|
|
10.75 | PepsiCo, Inc. Executive Incentive Compensation Plan, as amended and restated effective February 7, 2014, which is incorporated herein by reference to Exhibit B to PepsiCo, Inc.'s Proxy Statement for its 2014 Annual Meeting of Shareholders filed with the Securities and Exchange Commission on March 21, 2014.* |
|
|
10.76 | Five-Year Credit Agreement, dated as of June 9, 2014, among PepsiCo, Inc., as borrower, the lenders named therein, and Citibank, N.A., as administrative agent, which is incorporated herein by reference to Exhibit 10.1 to PepsiCo, Inc.'s Current Report on Form 8-K filed with the Securities and Exchange Commission on June 11, 2014. |
|
|
10.77 | Amendment to the PepsiCo Pension Equalization Plan (the Plan Document for the 409A Program), effective as of October 1, 2014.* |
|
|
10.78 | Amendment to the PepsiCo International Retirement Plan Defined Benefit Program, effective as of January 1, 2015.* |
|
|
10.79 | Amendment to the PepsiCo Pension Equalization Plan (both the Plan Document for the 409A Program and the Plan Document for the Pre-409A Program), generally effective as of January 1, 2014.* |
|
|
12 | Computation of Ratio of Earnings to Fixed Charges. |
|
|
21 | Subsidiaries of PepsiCo, Inc. |
|
|
23 | Consent of KPMG LLP. |
|
|
24 | Power of Attorney. |
|
|
31 | Certification of our Chief Executive Officer and our Chief Financial Officer pursuant to Section 302 of the Sarbanes-Oxley Act of 2002. |
|
|
32 | Certification of our Chief Executive Officer and our Chief Financial Officer pursuant to Section 906 of the Sarbanes-Oxley Act of 2002. |
|
|
138
Table of Contents
101 | The following materials from PepsiCo, Inc.'s Annual Report on Form 10-K for the fiscal year ended December 27, 2014 formatted in XBRL (eXtensible Business Reporting Language): (i) the Consolidated Statement of Income, (ii) the Consolidated Statement of Comprehensive Income, (iii) the Consolidated Statement of Cash Flows, (iv) the Consolidated Balance Sheet, (v) the Consolidated Statement of Equity and (vi) Notes to Consolidated Financial Statements. |
* | Management contracts and compensatory plans or arrangements required to be filed as exhibits pursuant to Item 15(a)(3) of this report. |
139