|
UNITED STATES
SECURITIES AND EXCHANGE COMMISSION
Washington, D.C. 20549
_______________________________
FORM 10-K
(Mark One)
x | ANNUAL REPORT PURSUANT TO SECTION 13 OR 15(d) OF THE SECURITIES EXCHANGE ACT OF 1934 |
For the fiscal year ended
October 31, 2012
or
¨ | TRANSITION REPORT PURSUANT TO SECTION 13 OR 15(d) OF THE SECURITIES EXCHANGE ACT OF 1934 |
Commission file number 1-33913
_______________________________
QUANEX BUILDING PRODUCTS CORPORATION
Delaware |
| 26-1561397 |
(State or other jurisdiction of incorporation or organization) |
| (I.R.S. Employer Identification No.) |
|
|
|
1900 West Loop South, Suite 1500, Houston, Texas |
| 77027 |
(Address of principal executive offices) |
| (Zip code) |
Registrant's telephone number, including area code: (713) 961-4600
Securities registered pursuant to Section 12(b) of the Act:
Title of each class |
| Name of each exchange on which registered |
Common Stock, $0.01 par value |
| New York Stock Exchange, Inc. |
Securities registered pursuant to Section 12(g) of the Act: NONE
_______________________________
Indicate by check mark if the registrant is a well-known seasoned issuer, as defined in Rule 405 of the Securities Act. Yes x No ¨
Indicate by check mark if the registrant is not required to file reports pursuant to Section 13 or Section 15(d) of the Act. Yes ¨ No x
Indicate by check mark whether the registrant: (1) has filed all reports required to be filed by Section 13 or 15(d) of the Securities Exchange Act of 1934 during the preceding 12 months (or for such shorter period that the registrant was required to file such reports), and (2) has been subject to such filing requirements for the past 90 days. Yes x No ¨
Indicate by check mark whether the registrant has submitted electronically and posted on its corporate Web site, if any, every Interactive Data File required to be submitted and posted pursuant to Rule 405 of Regulation S-T during the preceding 12 months (or for such shorter period that the registrant was required to submit and post such files). Yes x No ¨
Indicate by check mark if disclosure of delinquent filers pursuant to Item 405 of Regulation S-K is not contained herein, and will not be contained, to the best of registrant's knowledge, in definitive proxy or information statements incorporated by reference in Part III of this Form 10-K or any amendment to this Form 10-K. ¨
Indicate by check mark whether the registrant is a large accelerated filer, an accelerated filer, a non-accelerated filer, or a smaller reporting company. See the definition of "large accelerated filer," "accelerated filer," and "smaller reporting company" in Rule 12b-2 of the Exchange Act. (Check one):
Large accelerated filer |
| x |
| Accelerated filer |
| ¨ |
|
|
|
|
|
| |
Non-accelerated filer |
| ¨ |
| Smaller reporting company |
| ¨ |
Indicate by check mark whether the registrant is a shell company (as defined in Rule 12b-2 of the Act). Yes ¨ No x
The aggregate market value of the voting and non-voting common equity held by non-affiliates as of April 30, 2012, computed by reference to the closing price for the Common Stock on the New York Stock Exchange, Inc. on that date, was $672,023,844. Such calculation assumes only the registrant's current officers and directors were affiliates of the registrant.
At December 14, 2012, there were outstanding 37,037,341 shares of the registrant's Common Stock, $0.01 par value.
_______________________________
DOCUMENTS INCORPORATED BY REFERENCE
|
Table of Contents
TABLE OF CONTENTS
|
| Page |
PART I |
| |
Item 1. | Business | 3 |
| General | 3 |
| Business Developments | 3 |
| Manufacturing Processes, Markets, and Product Sales by Business Segment | 4 |
| Strategy | 5 |
| Raw Materials and Supplies | 5 |
| Competition | 5 |
| Sales, Marketing, and Distribution | 6 |
| Seasonal Nature of Business | 6 |
| Working Capital | 6 |
| Service Marks, Trademarks, Trade Names and Patents | 6 |
| Research and Development | 6 |
| Environmental and Employee Safety Matters | 7 |
| Employees | 8 |
| Financial Information about Geographic Areas | 8 |
| Communication with the Company | 8 |
Item 1A. | Risk Factors | 10 |
|
|
|
Item 1B. | Unresolved Staff Comments | 17 |
|
|
|
Item 2. | Properties | 18 |
|
|
|
Item 3. | Legal Proceedings | 19 |
|
| |
PART II |
| |
|
|
|
Item 5. | Market for Registrant's Common Equity, Related Stockholder Matters and Issuer Purchases of Equity Securities | 20 |
|
|
|
Item 6. | Selected Financial Data | 23 |
|
|
|
Item 7. | Management's Discussion and Analysis of Financial Condition and Results of Operations | 26 |
|
|
|
Item 7A. | Quantitative and Qualitative Disclosures about Market Risk | 42 |
|
|
|
Item 8. | Financial Statements and Supplementary Data | 45 |
|
|
|
Item 9. | Change in and Disagreements with Accountants on Accounting and Financial Disclosure | 88 |
|
|
|
Item 9A. | Controls and Procedures | 88 |
|
| |
PART III |
| |
|
|
|
Item 10. | Directors, Executive Officers and Corporate Governance | 90 |
|
|
|
Item 11. | Executive Compensation | 90 |
|
|
|
Item 12. | Security Ownership of Certain Beneficial Owners and Management and Related Stockholder Matters | 90 |
|
|
|
Item 13. | Certain Relationships and Related Transactions, and Director Independence | 90 |
|
|
|
Item 14. | Principal Accountant Fees and Services | 90 |
|
| |
PART IV |
| |
|
|
|
Item 15. | Exhibits and Financial Statement Schedules | 91 |
Table of Contents
PART I
Item 1. | Business |
General
Quanex was organized in 1927 as a Michigan corporation under the name Michigan Seamless Tube Company. It reincorporated in Delaware in 1968 under the same name and then changed its name to Quanex Corporation in 1977. On December 12, 2007, Quanex Building Products Corporation was incorporated in the state of Delaware as a subsidiary of Quanex Corporation to facilitate the separation of Quanex Corporation's vehicular products and building products businesses. The separation occurred on April 23, 2008, through the spin-off of Quanex Corporation's building products business to its shareholders, immediately followed by the merger of Quanex Corporation (consisting principally of the Vehicular Products business and all non-building products related corporate accounts) with a wholly-owned subsidiary of Gerdau S.A. (Gerdau). This transaction is hereafter referred to as the "Separation". The Company's executive offices are located at 1900 West Loop South, Suite 1500, Houston, Texas 77027. For purposes of describing the events related to the Separation as well as other events, transactions and financial results of Quanex Building Products Corporation and its subsidiaries related to periods prior to April 23, 2008, the terms "Quanex" or the "Company" also refer to Quanex Building Products Corporation's accounting predecessor, Quanex Corporation.
The Company's manufacturing businesses are managed on a decentralized basis and operate in two reportable business segments: Engineered Products and Aluminum Sheet Products. Each business has administrative, operating and marketing functions. The Company measures each business' earnings, cash flow and return on investment and seeks to reward superior performance with incentive compensation, which is a significant portion of total compensation for salaried employees. Intercompany sales are conducted on an arms-length basis and appropriate eliminating entries are performed. The Engineered Products segment has a unified sales and marketing group, which is tasked with selling and marketing Engineered Products' complete range of components, products and systems. Operational activities and policies are managed by corporate officers and key division executives. Also, a small corporate staff provides corporate accounting, financial and treasury management, tax, legal, internal audit, information technology, payroll and human resource services to the operating divisions.
Quanex is a technological leader in the production of extruded vinyl profiles, flexible insulating glass (IG) spacer systems, solar panel sealants, aluminum flat-rolled sheet and metal and wood products that primarily serve the North American residential new construction and remodeling markets. The Company uses low-cost production processes, and engineering and metallurgical expertise, to provide customers with specialized products for their specific window and door applications. Quanex believes these capabilities also provide the Company with unique competitive advantages. The Company's growth strategy is focused on developing its Engineered Products businesses, introducing innovative products and components, and pursuing expansion through organic growth and the acquisition of companies that produce complementary products and serve similar building products markets.
Business Developments
The Company has grown primarily through the strategic acquisition of residential-related building products businesses that complement its fenestration (door and window) product base. The following business developments occurred in the past five years.
On March 31, 2011, the Company acquired Edgetech, I.G. Inc. and its German subsidiary, adding three manufacturing facilities (U.S., U.K. and Germany) that produce and market a full line of flexible insulating glass spacer systems for window and door customers in North America and abroad. In March 2011, the Company also acquired JELD-WEN's vinyl extrusion assets in Yakima, Washington. In January 2011, management closed its finished window screen facility located in The Dalles, Oregon. In November 2011, management committed to a plan to consolidate its Truseal and U.S. Edgetech facilities. The consolidation plan, in part, called for the permanent closing of the Company's Barbourville, Kentucky facility, and relocation of the equipment used to manufacture the single seal, warm edge spacer system to the Company's Cambridge, Ohio facility. The Company believes this consolidation will allow it to better serve customers through streamlined operations. The consolidation of operations and the subsequent closure of the Barbourville facility were completed in August 2012 with residual cash payments and minor program costs expected to continue into fiscal 2013. All equipment to be retained has been relocated with the main outstanding activities only related to selling remaining equipment and the Barbourville facility itself.
In February 2010, the Company bought production assets in Shawano, Wisconsin for manufacturing engineered wood flooring. In 2010, management closed its start-up facility in China due to the contraction of demand and the Company's ability to serve the overseas thin film solar panel market from its North American operations. Accordingly, the China assets and liabilities, results of operations and cash flows are reported as discontinued operations for all periods presented.
3
Table of Contents
Manufacturing Processes, Markets, and Product Sales by Business Segment
The Company has 19 manufacturing facilities in 9 states in the United States, the United Kingdom, and Germany. These facilities feature efficient plant design and flexible manufacturing processes, enabling the Company to produce a wide variety of custom engineered products and components primarily focused on the residential building products markets. The Company is able to maintain minimal levels of finished goods inventories at most locations because it typically manufactures products upon order to customer specifications. Payments for purchases and collections from customers are generally consistent with industry practices which are based on average 30 day terms for Engineered Products and 30 to 60 day terms for Aluminum Sheet Products. The majority of the Company's products are sold into the residential building products markets. Residential remodeling activity and housing starts are its primary market drivers.
For financial information regarding each of the Company's reportable business segments, see "Management's Discussion and Analysis of Financial Condition and Results of Operations" herein and Note 12 to the Consolidated Financial Statements. For net sales of the Company by major product lines see Note 12 to the Consolidated Financial Statements. For the years ended October 31, 2012 , 2011 and 2010 , no single customer represented 10% or more of the consolidated net sales of the Company, respectively.
Quanex operates in two reportable business segments: Engineered Products and Aluminum Sheet Products.
Engineered Products
The Engineered Products segment is comprised of four polyvinyl chloride (vinyl) extrusion facilities, four fabricated metal components operations, two facilities producing wood fenestration (door and window) components, one facility producing engineered wood flooring and three flexible IG (insulating glass) spacer facilities. The segment's operations produce window and door components for Original Equipment Manufacturers (OEMs) that primarily serve the residential new construction, commercial construction, and residential remodeling markets. Products include vinyl window and door profiles, IG spacer systems, window and patio door screens, aluminum cladding and other roll formed metal window components, door components such as thresholds and astragals, patio doors and custom window grilles, trim and architectural moldings in a variety of woods, thin film solar panel sealants, and engineered wood flooring.
Engineered Products' extrusion operations use highly automated production facilities to manufacture vinyl and composite profiles, the framing material used by fenestration OEMs in the assembly of vinyl windows and patio doors. Value-added capabilities include compound blending, window system design, tooling design and fabrication, in-line weatherstrip installation and miter cutting, and the application of painted and co-extruded integrated weather-resistant coatings. Metal fabrication operations include roll forming, stamping, and end-product assembly to produce a variety of fenestration products. The IG systems business uses compound-extrusion and laminating technology to produce highly engineered window spacer products produced from butyl, EPDM, and silicone-based raw materials. These window spacer products are used to separate two or three panes of glass in an IG unit to improve its thermal performance. Engineered Products customers' end-use applications include windows and window components, entry and patio door systems, custom hardwood architectural moldings and flooring, and thin film solar panels. Engineered Products' key success factors include design expertise, engineering support, quality audit support, marketing support, industry and governmental advocacy, new technology development, flexible, world-class quality manufacturing capability, unique patented products, customer service, and just-in-time delivery.
Aluminum Sheet Products
The Aluminum Sheet Products segment is comprised of an aluminum mini-mill operation and three stand-alone aluminum sheet finishing operations. Aluminum sheet finishing capabilities include reducing reroll coil (hot-rolled aluminum sheet) to specific gauge, annealing, slitting and custom coating. Customer end-use applications of the finished sheet include residential windows and screens, patio doors, exterior home trim, siding, fascias, roof edgings, soffits, downspouts and gutters. A secondary market includes transportation (truck trailer, RV and mobile home).
The segment's aluminum mini-mill can produce approximately 360 million annualized finished pounds using an in-line casting process. The mini-mill converts aluminum scrap to reroll through melting, continuous casting, and in-line hot rolling processes. It also has scrap shredding and blending capabilities, as well as specialized equipment such as two rotary barrel melting furnaces, a delacquering furnace and a dross recovery system that broaden the mini-mill's use of raw materials, allowing it to utilize a broader range of scrap while improving raw material yields. Scrap is blended using computerized processes to most economically achieve the desired aluminum alloy composition. Management believes its production capabilities result in both cost advantages and savings from reduced raw material costs, optimized scrap utilization, reduced unit energy cost and lower labor costs.
4
Table of Contents
For financial information related to each segment, see Note 12 of the Financial Statements contained in this Annual Report on Form 10-K.
Strategy
Management's vision is to be the preferred supplier in every market we serve. Execution of the following strategies will be essential for attainment of this vision:
• | Achieve robust organic growth, both within our current customer base and through new market opportunities with national and regional customers, fueled by a robust system of quality and unmatched customer service, new product introduction, a systems approach and development of superior product attributes, particularly thermal efficiency, enhanced functionality, weatherability, appearance and best-in-class quality for Engineered Products; |
• | Realize improved Aluminum Sheet profitability through a strong preventive maintenance program and through investments focused on furthering our best-in-class processes, including the specialized ability to process low grades of scrap aluminum, while increasing capacity through internal advancements and expanding sales of value added products; |
• | Lead the Company's industry in safety, the reduction of accidents and education of the Company's work force in safety practices; |
• | Offer logistic solutions that provide our customers with just-in-time service that reduces their processing costs; |
• | Enhance our profitability through continued efforts to adopt, promulgate and formalize Lean Manufacturing practices within our current businesses and future acquisitions, including eliminating waste, minimizing scrap, optimizing work flow and improving productivity; |
• | Attract and retain outstanding leadership and facilitate broad-based employee development through open communication, active feedback, meaningful goal setting and well-designed incentives; and |
• | Pursue an active acquisition program to grow the existing fenestration footprint into clear leadership positions through expansion of components and systems the Company offers and markets it serves. |
Raw Materials and Supplies
The Engineered Products businesses purchase a diverse range of raw materials, which include polyvinyl chloride (PVC), epoxy resin, butyl, desiccant powder, silicone and EPDM rubber compounds, coated and uncoated aluminum sheet and wood (both hardwood and softwood). In most cases, the raw materials are available from several suppliers at market prices. Aluminum sheet is generally purchased from the Aluminum Sheet Products business at prices based upon arms-length transactions. Sole sourcing arrangements are entered into from time to time if beneficial savings can be realized and only when it is determined that a vendor can reliably supply all of the business' raw material requirements.
The Aluminum Sheet Products business' most significant raw material is aluminum scrap that is purchased on the open market, where availability and delivery can be adversely affected by, among other things, extreme weather conditions. Firm fixed price forward purchases matched to firm fixed price forward sales are used on a limited basis to hedge against fluctuations in the price of aluminum scrap required to manufacture products for fixed-price sales contracts. To a lesser extent, aluminum ingot futures contracts are bought and sold on the London Metal Exchange to hedge aluminum scrap requirements.
Although the Company has material sole sourcing arrangements, its agreements have clauses that allow for termination. In addition, there are several other qualified suppliers from which the Company could purchase raw materials and supplies.
Competition
The Company's products are sold under highly competitive conditions. The Company competes with a number of companies, some of which have greater financial resources than Quanex. Competitive factors include product quality, price, delivery, and the ability to manufacture to customer specifications. The volume of aluminum sheet products and engineered building products that the Company manufactures represent a small percentage of annual domestic consumption.
Engineered Products competes against a range of small and midsize metal, vinyl and wood products suppliers and wood molding companies. The Company also competes against IG spacer manufacturing firms. IG systems are used in numerous end markets including residential housing, commercial, appliances and transportation vehicles, but the Company primarily serves the residential housing market. Competition is primarily based on regional presence, custom engineering, product development, quality,
5
Table of Contents
service and price. The business also competes with in-house operations of vertically integrated fenestration OEMs. Some of the primary competitors of the Engineered Products business include Royal Group, Veka, Deceuninck, Vision Extrusions, GED Integrated Solutions, Technoform, Swiss Spacer, Thermix, Allmetal and Endura.
The Aluminum Sheet Products business competes with small to large aluminum sheet manufacturers such as Aleris, Jupiter, and JW Aluminum, some of which are divisions or subsidiaries of major corporations with substantially greater resources than the Company. The Company competes in common alloy coil-coated and mill finished products, primarily on the basis of the breadth of product lines, the quality and responsiveness of its services, and price.
Sales, Marketing, and Distribution
The Company has sales representatives whose territories essentially cover all of the United States, Canada, much of Europe, and to a lesser extent, the Middle East, Latin and South America, Australia and Asia as the Company sells into numerous countries worldwide. Engineered Products segment sales are primarily to window and door OEMs through a direct sales force, along with the limited use of distributors and independent sales agents. In 2010, its three standalone sales and marketing groups (one group for each of its three divisions) were combined into one unified group, which is tasked with selling and marketing Engineered Products' complete range of components, products and systems to national and regional OEMs. The Edgetech sales and marketing resources were integrated into this unified group during 2011 and 2012. Aluminum Sheet Products segment sales are to OEM and distribution customers through both direct and indirect sales representatives.
Seasonal Nature of Business
Sales of Engineered Products and Aluminum Sheet Products businesses are seasonal. Winter weather typically reduces homebuilding and home improvement activity. The Company typically experiences its lowest sales during the first half of its fiscal year. Profits tend to be lower in quarters with lower sales because a high percentage of manufacturing overhead and operating expense is due to labor and other costs that are generally semi-variable throughout the year.
Working Capital
The Company funds operations through a combination of available cash and equivalents, short-term investments, and cash flow generated from operations. In addition, the Company's revolving credit facility is available for working capital needs. The Company extends credit to its domestic customers in the ordinary course of business generally for 30 to 60 day terms and its international customers varying from cash advance to 90 day terms. Inventory of raw materials are carried in quantities deemed necessary to ensure a smooth production process, some of which are governed by consignment agreements with suppliers. The Company maintains minimal finished goods inventories sufficient to manage customer needs.
Service Marks, Trademarks, Trade Names, and Patents
The Company's federally registered trademarks or service marks include QUANEX, QUANEX and design, "Q" design, TRUSEAL TECHNOLOGIES, DURASEAL, DURALITE, SOLARGAIN EDGE TAPE, ENVIROSEALED WINDOWS, EDGETHERM, COLONIAL CRAFT, EDGETECH, ECOBLEND, SUPER SPACER, TSS, TRUE WARM, E & Design, QUIET EDGE, HEALTH SMART WINDOWS, ENERGY WISE WINDOWS, DESI-ROPE, 360 and design, INTELLICLIP, SUSTAINAVIEW, MIKRON, MIKRONWOOD, MIKRONBLEND, MIKRON BLEND and design, ENERGYCORE, FUSION INSULATED SYSTEM, AIRCELL, SUPERCOAT, SUPERCAP, STYLELOCK, STYLELOCK and design, K2 MIKRON and design, HOMESHIELD, HOMESHIELD and design, and STORM SEAL. The trade name Nichols Aluminum is used in connection with the sale of our aluminum mill sheet products. The HOMESHIELD, COLONIAL CRAFT, TRUSEAL TECHNOLOGIES, EDGETECH, MIKRON and QUANEX word and design marks and associated trade names are considered valuable in the conduct of business. The Company's business generally does not depend upon patent protection, but patents obtained at its vinyl extrusion, fabricated metal component operations and window sealant business units remain critical in providing a competitive advantage over other building products manufacturers. The Company's vinyl extrusion business unit obtains patent protection for various dies and other tooling created in connection with its production of customer-specific designs and extrusions. The Company's fabricated metal components business obtains patent protection for its thresholds, which gives it an advantage in the threshold markets. The Company's window sealant business unit relies on patents to protect the design of several of its window spacer products. Although the Company holds numerous patents, the proprietary process technology that has been developed is also the source of considerable competitive advantage.
Research and Development
Although not technically defined as research and development for accounting purposes, a significant amount of time,
6
Table of Contents
effort and expense is devoted to (a) custom engineering which qualifies products for specific customer applications, (b) developing superior, proprietary process technology and (c) partnering with customers to develop new products.
Environmental and Employee Safety Matters
The Company is subject to extensive laws and regulations concerning the discharge of materials into the environment, the remediation of chemical contamination and worker safety. To satisfy such requirements, the Company must make capital and other expenditures on an ongoing basis. The cost of environmental matters and worker safety has not had a material adverse effect on the Company's operations or financial condition in the past, and management is not currently aware of any existing conditions that it believes are likely to have a material adverse effect on its operations, financial condition, or cash flows.
Worker Safety
The Company for many years has maintained effective compliance policies that have helped to minimize liabilities and other financial impacts related to worker safety and environmental issues. These policies include extensive employee training and education, as well as internal policies embodied in the Company's Code of Conduct and elsewhere. The Company has a Quanex-wide Safety Council, comprised of leaders from across the organization, which meets regularly to discuss safety issues and drive safety improvements. In addition, the Company hired its first company-wide Director of Environmental, Health and Safety during 2012. The Company plans to continue these practices in the future and believes that they are a vital component of the Company's improving performance.
Remediation
Under applicable state and federal laws, the Company may be responsible for, among other things, all or part of the costs required to remove or remediate wastes or hazardous substances at locations it has owned or operated at any time. The Company currently is engaged in material environmental remediation activities at only one of its plant sites.
From time to time, the Company also has been alleged to be liable for all or part of the costs incurred to clean up third-party sites where it is alleged to have arranged for disposal of hazardous substances. At present, the Company is not involved in any such matters.
Total environmental reserves and corresponding recovery as of October 31, 2012 and October 31, 2011 were as follows:
| October 31, |
| October 31, | ||||
| (In thousands) | ||||||
Current (1) | $ | 1,700 | |
| $ | 1,965 | |
Non-current | 9,827 | |
| 11,221 | | ||
Total environmental reserves | $ | 11,527 | |
| $ | 13,186 | |
Receivable for recovery of remediation costs (2) | $ | 11,195 | |
| $ | 12,304 | |
(1) | Reported in Accrued liabilities on the Consolidated Balance Sheets |
(2) | The current portion reported in Accounts receivable and non-current portion reported in Other assets on the Consolidated Balance Sheets |
The Company currently is engaged in ongoing remediation activities at one of its subsidiaries, Nichols Aluminum-Alabama, LLC (NAA). NAA operates a plant in Decatur, Alabama that is subject to an Alabama Hazardous Wastes Management and Minimization Act Post-Closure Permit. Among other things, the permit requires NAA to remediate, as directed by the state, historical environmental releases of wastes and waste constituents. Consistent with the permit, NAA has undertaken various studies of site conditions and, during the first quarter of 2006, started a phased program to treat in-place free product petroleum that had been released underneath the plant. During the second quarter 2010, NAA submitted to the state the first component of its proposed workplan for implementing a site-wide remedy. The full workplan was submitted to the state during the third quarter 2010, revised during the second quarter 2011 to reflect both additional sampling data and responses to state comments, and revised again in the fourth quarter 2011 in response to another round of state comments. Based on those plans, which remain subject to further comment, revision, and state approval, the Company's remediation reserve at NAA's Decatur plant is $11.5 million as of October 31, 2012 . Approximately $1.1 million of the October 31, 2012 reserve represents administrative costs; the balance of $10.4 million represents estimated costs for investigation, studies, cleanup, and treatment. The reserve has not been discounted.
NAA was acquired through a stock purchase in which the sellers agreed to indemnify Quanex and NAA for identified
7
Table of Contents
environmental matters related to the business and based on conditions initially created or events initially occurring prior to the acquisition. Environmental conditions are presumed to relate to the period prior to the acquisition unless proved to relate to releases occurring entirely after closing. The limit on indemnification is $21.5 million excluding legal fees. While the Company's current estimates indicate it will not reach this limit, changing circumstances could result in additional costs or expense that are not foreseen at this time. In accordance with the indemnification, the indemnitors paid the first $1.5 million of response costs and have been paying 90% of ongoing costs. Based on its experience to date, its estimated cleanup costs going forward, and costs incurred to date as of October 31, 2012 , the Company expects to recover from the sellers' shareholders an additional $11.2 million which has not been discounted. Of that, $10.4 million is recorded in Other assets on the Consolidated Balance Sheets, and the balance is reflected in Accounts receivable on the Consolidated Balance Sheets. The undiscounted recovery from indemnitors as of October 31, 2011 , was $12.3 million . Of that, $11.6 million is recorded in Other assets on the Consolidated Balance Sheets, and the balance is reflected in Accounts receivable on the Consolidated Balance Sheets.
The Company's final remediation costs and the timing of those expenditures will depend on such factors as the nature and extent of contamination, the cleanup technologies employed, the effectiveness of the cleanup measures that are employed, and regulatory concurrences. While actual remediation costs may be more or less than amounts accrued, the Company believes it has established adequate reserves for all probable and reasonably estimable remediation liabilities. It is not possible at this point to reasonably estimate the amount of any obligation for remediation in excess of current accruals because of uncertainties as to the extent of environmental impact, cleanup technologies, and concurrence of governmental authorities. The Company currently expects to pay the accrued remediation reserve through at least fiscal 2034, although some of the same factors discussed earlier could accelerate or extend the timing.
Compliance
Quanex incurred expenses of approximately $1.8 million during fiscal 2012 to comply with existing environmental regulations. This compares to $1.5 million of expense incurred during fiscal 2011 . For fiscal 2013 , the Company estimates expenses at its facilities will be approximately $1.5 million for continuing environmental compliance. There were no capital expenditures for environmental matters during fiscal 2012 or fiscal 2011 and no environmental capital expenditures are expected for fiscal 2013 . Future expenditures relating to environmental matters will depend upon the application to the Company and its facilities of future regulations and government decisions. The Company will continue to have expenditures beyond fiscal 2013 in connection with environmental matters, including control of air emissions, control of water discharges and plant decommissioning costs. It is not possible at this time to reasonably estimate the amount of those expenditures, except as discussed above, due to uncertainties about emission levels, control technologies, the positions of governmental authorities and the application of requirements to the Company. Based upon its experience to date, the Company does not believe that its compliance with environmental requirements will have a material adverse effect on its operations, financial condition, or cash flows.
Employees
The Company had 2,228 employees at October 31, 2012 . Of the total employed, approximately 19% are covered by collective bargaining agreements. Following is a table of collective bargaining agreements currently in place:
Facility | Expires |
| Union | Covered Employees at 10/31/12 | |
|
|
|
|
| |
Nichols Aluminum–Lincolnshire | Jan. 2013 |
| International Association of Machinists and Aerospace Workers | 85 | |
|
|
|
|
| |
Nichols Aluminum–Alabama | Nov. 2014 |
| United Steelworkers of America | 88 | |
|
|
|
|
| |
Nichols Aluminum–Davenport/Casting | Nov. 2017 |
| International Brotherhood of Teamsters | 247 | |
Financial Information about Geographic Areas
For financial information on the Company's foreign and domestic operations, see Note 12 of the Financial Statements contained in this Annual Report on Form 10-K.
Communication with the Company
8
Table of Contents
The Company's website is www.quanex.com . Inquiries to the Company and its Board of Directors are invited. Interested persons may contact the appropriate individual or department by choosing one of the options below.
General
Investor Information:
For Investor Relations matters or to obtain a printed copy of the Company's Code of Business Conduct and Ethics, Corporate Governance Guidelines or charters for the Audit, Compensation and Management Development, and Nominating and Corporate Governance Committees of the Board of Directors, send a request to the Company's principal address below or [email protected] . This material may also be obtained from the Company website at www.quanex.com/investor-relations/corporate-governance.
The Company's required regulatory filings such as annual reports on Form 10-K, quarterly reports on Form 10-Q, current reports on Form 8-K, and amendments to those reports are available free of charge through the Company's website, as soon as reasonably practicable after they have been filed with or furnished to the Securities and Exchange Commission (SEC) pursuant to Section 13(a) or 15(d) of the Securities and Exchange Act of 1934 (the 1934 Act). Forms 3, 4 and 5 filed with respect to equity securities under Section 16(a) of the 1934 Act are also available on the Company's website. All of these materials are located at the "Investor Relations" link under SEC filings. They can also be obtained free of charge upon request to [email protected] or to the Company's principal address below.
Communications with the Company's Board of Directors:
Persons wishing to communicate to the Company's Board of Directors or specified individual directors may do so by sending them in care of The Chairman of the Board of Directors at the Company's principal address below or by sending an email to [email protected] .
Alert Line
Accounting Issues:
Persons who have questions or concerns regarding potential questionable accounting, internal accounting controls or auditing matters may submit them to the Senior Vice President – Finance & Chief Financial Officer at the Company's principal address or online by visiting the Company's Alert Line located at https://quanex.alertline.com . The Audit Committee will be informed of the call or report and the Company's response.
Such communications will be kept confidential to the fullest extent possible. If the individual is not satisfied with the response, they may contact the Audit Committee or the Nominating and Corporate Governance Committee of the Board of Directors of the Company. If concerns or complaints require confidentiality, then this confidentiality will be protected, subject to applicable laws.
Reporting Potential Illegal or Unethical Behavior:
Employees, officers and directors who suspect or know of violations of the Company's Code of Business Conduct and Ethics, or illegal or unethical business or workplace conduct by employees, officers or directors, have an obligation to report it. If the individuals to whom such information is conveyed are not responsive, or if there is reason to believe that reporting to such individuals is inappropriate in particular cases, then the employee, officer or director may contact the Chief Compliance Officer, Chief Financial Officer, Director of Internal Audit, or any corporate officer in person, by telephone, letter to the Company's principal address or e-mail below. Quanex Building Products also encourages persons who are not affiliated with the Company to report any suspected illegal or unethical behavior. The Audit and Nominating & Corporate Governance Committees will be informed.
9
Table of Contents
| 1) |
| In Person or By Letter |
|
|
|
|
| Quanex Building Products Corporation |
|
|
|
|
| 1900 West Loop South, Suite 1500 |
|
|
|
|
| Houston, Texas 77027 |
|
|
|
|
|
|
|
|
| 2) |
| By United States Telephone |
|
|
|
|
| Direct Telephone |
| (713) 877-5349 |
|
|
| Toll Free Telephone |
| (800) 231-8176 |
|
|
| Toll Free Anonymous Alert Line |
| (888) 475-0633 |
|
|
|
|
|
|
| 3) |
| By UK Telephone |
|
|
|
|
| Direct Telephone |
| +44 (0) 8700.566844, ext. 6726 |
|
|
| Anonymous Alert Line |
| 0808.234.8922 |
|
|
|
|
|
|
| 4) |
| By German Telephone |
|
|
|
|
| Direct Telephone |
| +49 (0) 2452.96491.15 |
|
|
| Anonymous Alert Line |
| +49 (0) 8883.934356 |
|
|
|
|
|
|
| 5) |
| Electronically |
|
|
|
|
| https://quanex.alertline.com |
|
|
|
|
| Or |
|
|
|
|
| https://quanexeu.alertline.com |
|
|
Such communications will be kept confidential to the fullest extent possible, and all communications received in Germany and the United Kingdom will be treated in accordance with all applicable privacy laws. If the individual is not satisfied with the response, he or she may contact the Nominating and Corporate Governance Committee of the Board of Directors of the Company at the Company's principal address above. If concerns or complaints require confidentiality, then this confidentiality will be protected, subject to applicable laws.
Item 1A. | Risk Factors |
In addition to the factors discussed elsewhere in this report and in Management's Discussion and Analysis of Financial Condition and Results of Operations, the following are some of the potential risk factors that could cause the Company's actual results to differ materially from those projected in any forward-looking statements. These factors, as well as the other information contained in this document, should be carefully considered when evaluating an investment in the Company's securities. Any of the following risks could have material adverse effects on the Company's financial condition, operating results and cash flow. The below list of important factors is not all-inclusive or necessarily in order of importance.
The Company is subject to business risks and general economic factors that are largely out of its control, any of which could have a material adverse effect on its business, financial condition and results of operations.
The primary drivers of the Company's business are residential remodeling activities and housing starts. The building and construction industry is cyclical and seasonal, and product demand is based on numerous factors such as interest rates, general economic conditions, consumer confidence and other factors beyond the Company's control. Declines in housing starts and remodeling activities due to such factors could have a material adverse effect on the Company's business, results of operations and financial condition. The downturn in the housing market has had an adverse effect on the operating results of the Company's building products business. Further deterioration or prolonged depressed states in industry conditions or in the broader economic conditions of the markets where the Company operates could further decrease demand and pricing for its products and have additional adverse effects on its operations and financial results.
The Company's business is subject to a number of general economic factors that may adversely affect its business, financial condition and results of operations, many of which are largely out of its control. These factors include domestic and international recessionary economic cycles, changes in foreign currency exchange rates, and downturns in customers' business cycles and changes in their business practices, particularly in market segments and industries where the Company has a significant
10
Table of Contents
concentration of customers. There could be a number of follow-on effects on the Company's business, including insolvency of key suppliers resulting in product delays, inability of customers to obtain credit to finance purchases of the Company's products, an inability of customers to pay accounts receivable owed to the Company, or delays in the payment of such receivables. Additionally, if these economic conditions persist, the Company's assets may become further impaired.
The price of our common stock has historically been volatile and could continue to fluctuate in the future.
The market price of the Company's common stock has fluctuated significantly and is likely to continue to fluctuate in the future. Announcements by the Company or others regarding the receipt of customer orders, quarterly variations in operating results, acquisitions or divestitures, additional equity or debt financings, litigation, product developments, patent or proprietary rights, government regulation and general market conditions may have a significant impact on the market price of the Company's common stock.
If the Company's raw materials or energy were to significantly increase in price or raw materials were to become unavailable, the Company might not be able to timely produce products for its customers or maintain its profit levels.
Quanex requires significant amounts of raw materials, such as butyl, TiO 2 , and resin. Substantially all of these materials are purchased from outside sources. The Company does not have long-term contracts for the supply of most of its raw materials. The availability and prices of raw materials may be subject to curtailment or change due to new laws or regulations, suppliers' allocations to other purchasers, or interruptions in production by suppliers. In addition, the operation of the Company's facilities requires substantial amounts of electric power and natural gas. Any change in the supply of, or price for, these raw materials could affect its ability to timely produce products for its customers.
The Company depends on supplier relationships, insurance providers, and other vendors, and any disruption in these relationships may cause damage to its customer relationships or delays to its business.
There can be no assurance that the Company's suppliers will be able to meet the Company's future requirements for products and components in a timely fashion. In addition, the availability of many of these components is dependent in part on the Company's ability to provide its suppliers with accurate forecasts of the Company's future requirements. Delays or lost sales could be caused by other factors beyond the Company's control, including late deliveries by vendors. If the Company were required to identify alternative suppliers for any of its required components, qualification and pre-production periods could be lengthy and may cause an increase in component costs and delays in providing products to customers. Any extended interruption in the supply of any of the key components currently obtained from limited sources could disrupt the Company's operations and have a material adverse effect on customer relationships and profitability.
The Company is subject to various environmental requirements and is currently engaged in remediation activities at one location. Compliance with, or liabilities under, existing or future environmental laws and regulations could significantly increase the Company's costs of doing business.
The Company is subject to extensive federal, state and local laws and regulations concerning the discharge of materials into the environment and the remediation of chemical contamination. To satisfy such requirements, the Company must make capital and other expenditures on an ongoing basis. For example, environmental agencies continue to develop regulations implementing the Federal Clean Air Act. Depending on the nature of the regulations adopted, the Company may be required to incur additional capital and other expenditures in the next several years for air pollution control equipment, to maintain or obtain operating permits and approvals, and to address other air emission-related issues. Future expenditures relating to environmental matters will necessarily depend upon the application to the Company and its facilities of future regulations and government decisions. It is likely that the Company will be subject to increasingly stringent environmental standards and the additional expenditures related to compliance with such standards. Furthermore, if the Company fails to comply with applicable environmental regulations, the Company could be subject to substantial fines or penalties and to civil and criminal liability. In addition, the Company continues to engage in remediation efforts at its facility in Decatur, Alabama, for which a third party is indemnifying us for 90% of costs. The limit on indemnification is $21.5 million excluding legal fees. The work plan related to the Company's ongoing remediation efforts at its Decatur, Alabama facility remains subject to further comment, revision and state approval. If these remediation efforts are not successful or prove more expensive than our current estimates, or if the company currently indemnifying us fails to continue doing so, then our remediation costs could significantly increase. During fiscal 2012, the Company spent approximately $3.1 million on environmental compliance, including mandatory remediation activities.
The Company may not be able to successfully identify, manage or integrate future acquisitions, and if it is unable to do so, the Company's rate of growth and profitability could be adversely affected.
11
Table of Contents
The Company cannot provide any assurance that it will be able to identify appropriate acquisition candidates or, if it does, that it will be able to successfully negotiate the terms of an acquisition, finance the acquisition, or integrate the acquired business effectively and profitably into its existing operations. Integration of future acquired businesses could disrupt the Company's business by diverting management's attention away from day-to-day operations. Further, failure to successfully integrate any acquisition may cause significant operating inefficiencies and could adversely affect the Company's profitability. Consummating an acquisition could require the Company to raise additional funds through additional equity or debt financing. Additional equity financing could depress the market price of the Company's common stock. In addition, we are currently continuing with the process of integrating Edgetech into our Insulating Glass division. If this integration effort fails or does not meet our cost, timing, or expected benefit assumptions, then our profitability could be adversely affected.
If the Company's information technology systems fail, or if the Company experiences an interruption in their operation, then the Company's business, financial condition and results of operations could be materially adversely affected.
The efficient operation of the Company's business is dependent on its information technology systems. The Company relies on those systems generally to manage the day-to-day operation of its business, manage relationships with its customers, fulfill customer orders, and maintain its financial and accounting records. In fiscal 2011, the Company launched a multi-year, company-wide program to transform certain business processes, including the transition to a single enterprise resource planning (ERP) software system to perform various functions. The new system is expected to improve access to and consistency of information, enable standardization of business activities, help deliver business process improvements and support business growth. The implementation of an ERP system entails certain risks, including difficulties with changes in business processes that could disrupt the Company's operations, such as its ability to process orders and timely ship products, project inventory requirements, provide services and customer support, send invoices and track payments, fulfill contractual obligations, and aggregate financial and operational data. The ERP implementation project will likely consume significant business resources, including personnel and financial resources. The failure of the Company's information technology systems, its inability to successfully maintain, enhance and/or replace its information technology systems, or a significant compromise of the integrity or security of the data that is generated from information technology systems, could adversely affect the Company's results of operations, disrupt business and make the Company unable, or severely limit the Company's ability, to respond to customer demands. In addition, the Company's information technology systems are vulnerable to damage or interruption from:
• | earthquake, fire, flood and other natural disasters; |
• | employee or other theft; |
• | attacks by computer viruses or hackers; |
• | power outages; and |
• | computer systems, internet, telecommunications or data network failure. |
A significant interruption of the Company's information technology systems could result in decreased revenue, increased expenses, increased capital expenditures, customer dissatisfaction and potential lawsuits, which could have a material adverse effect on the Company's results of operations or financial condition.
The Company operates in competitive markets, and its business will suffer if it is unable to adequately address potential downward pricing pressures and other factors that may reduce operating margins.
The principal markets that the Company serves are highly competitive. Competition is based primarily on the precision and range of achievable tolerances, quality, price and the ability to meet delivery schedules dictated by customers. The Company's competition in the markets in which it participates comes from companies of various sizes, some of which have greater financial and other resources than the Company does and some of which have more established brand names in the markets the Company serves. Any of these competitors may foresee the course of market development more accurately than the Company does, develop products that are superior to the Company's products, have the ability to produce similar products at a lower cost than the Company can, or adapt more quickly than the Company to new technologies or evolving customer requirements. Increased competition could force the Company to lower its prices or to offer additional services at a higher cost to the Company, which could reduce its gross profit and net income.
Original Equipment Manufacturers (OEMs) have significant pricing leverage over suppliers and may be able to achieve price reductions over time, which could reduce the Company's profits.
The Company's products are sold primarily to OEMs, and to a much lesser extent, sold through distributors and independent representative agents. There is substantial and continuing pressure from OEMs in all industries to reduce the prices they pay to suppliers. The Company attempts to manage such downward pricing pressure, while trying to preserve its business relationships
12
Table of Contents
with its OEM customers, by seeking to reduce its production costs through various measures, including purchasing raw materials and components at lower prices and implementing cost-effective process improvements. However, the Company's suppliers may resist pressure to lower their prices and may seek to impose price increases. If the Company is unable to offset OEM price reductions through these measures, its gross margins and profitability could be adversely affected. In addition, OEMs have substantial leverage in setting purchasing and payment terms, including the terms of accelerated payment programs under which payments are made prior to the account due date in return for an early payment discount.
Loss or financial weakness of any of the Company's largest customers could adversely affect our financial results.
The Company has certain product lines associated with some of the Company's larger customers. Although the Company has an extensive customer base, loss of or material financial weakness of its largest customers could adversely affect the Company's financial condition and results of operations until such business is replaced and no assurances can be made that the Company would be able to regain or replace any lost customers.
The Company could lose customers and the related revenues due to customers 1) vertically integrating, 2) transferring their manufacturing capacity out of the United States to lower-cost regions of the world or 3) diversifying their supplier base. In addition, new competitors could enter the market and diminish our market share.
The Company produces products primarily for OEMs. These customers may choose to vertically integrate or bring production in-house decreasing their demand for the Company's products. In addition, new competitors could enter our markets which could also lead to a loss of customers and revenues if the customer no longer purchases products from the Company.
In addition, U.S. manufacturers have migrated production to other regions of the world that offer lower cost labor forces. The combined effect is that U.S. manufacturers can reduce product costs by manufacturing and assembling in other regions of the world and then importing those products to the United States. Some of the Company's customers have shifted production to other regions of the world and there can be no assurance that this trend will not continue. The Company may lose customers and revenues if its customers locate in areas that the Company chooses not to serve or cannot economically serve.
If the Company's relationship with its employees were to deteriorate, the Company could be faced with labor shortages, disruptions or stoppages, which could shut down certain of its operations, reducing revenue, net earnings, and cash flows.
The Company's operations rely heavily on its employees, and any labor shortage, disruption or stoppage caused by poor relations with its employees and/or renegotiation of labor contracts could shut down certain of its operations. Approximately 19% of the Company's employees are covered by collective bargaining agreements which expire between 2013 and 2017. It is possible that the Company could become subject to additional work rules imposed by agreements with labor unions, or that work stoppages or other labor disturbances could occur in the future, any of which could impact financial results. Similarly, any failure to negotiate a new labor agreement when required might result in a work stoppage that could reduce the Company's operating margins and income.
Changes in regulatory requirements or new technologies may render the Company's products obsolete or less competitive.
Changes in legislative, regulatory or industry requirements or in competitive technologies may render certain of the Company's products obsolete or less competitive, preventing the Company from selling them at profitable prices, or at all. The Company's ability to anticipate changes in technology and regulatory standards and to successfully develop and introduce new and enhanced products on a timely and cost-efficient basis will be a significant factor in its ability to remain competitive. The Company's business may, therefore, require significant ongoing and recurring additional capital expenditures and investments in research and development. The Company may not be able to achieve the technological advances necessary for it to remain competitive or certain of its products may become obsolete. The Company is also subject to the risks generally associated with new product introductions and applications, including lack of market acceptance, certification issues, delays in product development and failure of products to operate properly. Any such delays or cost overruns or the inability to obtain such certifications could negatively affect the returns from any proposed or new products.
Equipment failures, delays in deliveries or catastrophic loss at any of the Company's manufacturing facilities could lead to production curtailments or shutdowns that prevent the Company from producing its products.
An interruption in production capabilities at any of the Company's facilities as a result of equipment failure or other reasons could result in the Company's inability to produce its products, which would reduce its sales and earnings for the affected period. In addition, the Company generally manufactures its products only after receiving the order from the customer and thus does not hold large inventories. If there is a stoppage in production at any of the Company's manufacturing facilities, even if only temporarily, or if the Company experiences delays as a result of events that are beyond its control, delivery times could be severely affected. Any significant delay in deliveries to the Company's customers could lead to increased returns or cancellations and cause
13
Table of Contents
the Company to lose future sales. The Company's manufacturing facilities are also subject to the risk of catastrophic loss due to unanticipated events such as fires, explosions or violent weather conditions. The Company has in the past and may in the future experience plant shutdowns or periods of reduced production as a result of equipment failure, delays in deliveries or catastrophic loss, which could have a material adverse effect on the Company's results of operations or financial condition. The Company may not have adequate insurance to compensate it for all losses that result from any of these events.
Product liability claims and product replacements could harm the Company's reputation, sales and financial condition.
The Company designs and manufactures most of its products and expects to continue to do so. The Company has, on occasion, found flaws and deficiencies in the manufacturing, design, testing and installation of its products. Some deficiencies may not become apparent until after the products are installed by customers.
The Company may need to replace products, and it may be liable for any costs necessary to retrofit the affected structures. Any such replacement or retrofit could entail substantial costs and adversely affect the Company's reputation, sales and financial condition. The Company generally does not carry insurance against product replacement costs or the adverse business effect of a product replacement, and its product liability insurance may not cover retrofit costs.
The Company's business involves complex manufacturing processes that may result in costly accidents or other disruptions of its operations.
The Company's business involves complex manufacturing processes. Some of these processes involve high pressures, temperatures, hot metal and other hazards that present certain safety risks to workers employed at the Company's manufacturing facilities. The potential exists for accidents involving death or serious injury. The potential liability resulting from any such accident, to the extent not covered by insurance, could cause the Company to incur unexpected cash expenditures, thereby reducing the cash available to operate its business. Such an accident could disrupt operations at any of the Company's facilities, which could adversely affect its ability to deliver product to its customers on a timely basis and to retain its current business.
Flaws in the design or manufacture of the Company's products could cause future product liability or warranty claims for which it does not have adequate insurance or affect its reputation among customers.
The Company's products are essential components in buildings and other applications where problems in the design or manufacture of its products could result in property damage, personal injury or death. While the Company believes that its liability insurance is adequate to protect it from future product liability and warranty liabilities, its insurance may not cover all liabilities or be available in the future at a cost acceptable to the Company. In addition, if any of the Company's products prove to be defective, it may be required in the future to participate in a recall involving such products. A successful claim brought against the Company in excess of available insurance coverage, if any, or a requirement to participate in any product recall, could significantly reduce the Company's profits or negatively affect its reputation with customers. In addition, flaws in the Company's products could lead to customer complaints, weaken its relationships with its customers, affect its reputation in the industry and lead to lost revenues or customers.
The Company's credit facility contains restrictions on the Company's ability to implement its acquisition program.
The Company's credit facility contains certain restrictions on the Company's ability to enter into acquisitions, including:
• | the Company must comply with all terms and conditions of the credit facility on a pro forma basis based on the combined operating results of the acquisition target and the Company; |
• | if the Company's leverage ratio is greater than 2.50x, acquisitions are limited to 15% of the Company's net worth per transaction; and |
• | the Company is restricted from incurring certain additional indebtedness. |
The above restrictions may impede the Company's ability to carry out an active acquisition program, which is an important component of the Company's future growth strategy. The Company's failure to comply with the terms and covenants in its credit facility could lead to a default under the terms of those documents, which would entitle the lenders to accelerate the indebtedness and declare all amounts owed due and payable.
The Company's credit facility contains certain financial covenants that limit the aggregate availability of funds.
The availability of funds under the credit facility is a function of both the facility amount utilized and meeting covenant requirements. The aggregate availability under the Credit Facility is limited by the Consolidated Leverage Ratio which is based on EBITDA. These restrictions on fund availability could:
14
Table of Contents
• | limit the Company's ability to plan for or react to market conditions or meet capital needs |
• | restrict activities or business plans |
• | adversely affect the Company's ability to fund operations, or engage in other business activities that would be in the Company's interest. |
An inability to access capital could adversely affect our business, operating results and financial condition and ultimately adversely affect liquidity.
The Company's access to external sources of financing, as well as the cost of such financing, is dependent on various factors, including perceptions of the Company's financial strength. The perceptions of the Company's financial strength are influenced by numerous factors, either in absolute terms or relative to our peer group, such as financial leverage, balance sheet strength, and capital structure and earnings trends. We are currently in negotiations to renew our revolving credit facility, which is scheduled to expire on April 23, 2013. If we are not able to continue accessing the capital markets on favorable terms or at all, our business and future growth prospects could be adversely affected.
Failure to obtain alternative financing created by a potential breach of the lender's funding commitment could negatively impact the Company's growth strategy.
The turmoil affecting the banking system and financial markets during the prior years has resulted in a tightening in the credit markets, a low level of liquidity in many financial markets, and extreme volatility in fixed income, credit, currency and equity markets. There is no assurance that the Company's lenders will provide any future funding under the credit facility. If the Company's lenders were unable or unwilling to fulfill their lending commitment, the Company would be required to seek alternative funding sources in order to conduct operations. Alternative funding could result in higher interest rates. However, there can be no assurance that alternative financial resources will be available promptly, on favorable terms or at all. Failure to obtain necessary funding could adversely affect the Company's short-term liquidity and ability to make investment in research and development to fund new product initiatives, continue to upgrade process technology and manufacturing capabilities, and actively seek out potential acquisition candidates and could adversely affect our business, financial condition and operating results.
The Company's corporate governance documents as well as Delaware law may delay or prevent an acquisition that stockholders may consider favorable, which could decrease the value of the Company's shares.
The Company's certificate of incorporation and bylaws and Delaware law contain provisions that could make it more difficult for a third party to acquire the Company without the consent of its board of directors. These provisions include restrictions on the ability of the Company's stockholders to remove directors and supermajority voting requirements for stockholders to amend the Company's organizational documents, a classified board of directors and limitations on action by the Company's stockholders by written consent. In addition, the Company's board of directors has the right to issue preferred stock without stockholder approval, which could be used to dilute the stock ownership of a potential hostile acquirer. Delaware law also imposes some restrictions on mergers and other business combinations between any holder of 15% or more of the Company's outstanding common stock and the Company. Although the Company believes these provisions protect its stockholders from coercive or otherwise unfair takeover tactics and thereby provide for an opportunity to receive a higher bid by requiring potential acquirers to negotiate with its board of directors, these provisions apply even if the offer may be considered beneficial by some stockholders.
The Company's operations outside the United States require it to comply with a number of United States and international regulations, violations of which could have a material adverse effect on its consolidated results of operations and consolidated financial condition.
The Company's operations outside the United States require it to comply with a number of United States and international regulations. For example, its operations in countries outside the United States are subject to the Foreign Corrupt Practices Act (FCPA), which prohibits United States companies or their agents and employees from providing anything of value to a foreign official for the purposes of influencing any act or decision of these individuals in their official capacity to help obtain or retain business, direct business to any person or corporate entity, or obtain any unfair advantage. The Company's activities create the risk of unauthorized payments or offers of payments by one of its employees or agents that could be in violation of the FCPA, even though these parties are not always subject to its control. The Company has internal control policies and procedures and has implemented training and compliance programs for its employees and agents with respect to the FCPA. However, the Company cannot assure that its policies, procedures and programs always will protect it from reckless or criminal acts committed by its employees or agents. Allegations of violations of applicable anti-corruption laws, including the FCPA, may result in internal, independent, or government investigations. Violations of the FCPA may result in severe criminal or civil sanctions, and the Company may be subject to other liabilities, which could have a material adverse effect on its business, consolidated results of operations and consolidated financial condition. In addition, investigations by governmental authorities as well as legal, social, economic,
15
Table of Contents
and political issues in these countries could have a material adverse effect on its business and consolidated results of operations. The Company is also subject to the risk that its employees and agents outside of the United States may fail to comply with other applicable laws.
The Company's expansion plans outside the United States may not succeed.
Any expansion to markets outside the United States will present different and successive risks, expenses and difficulties with regard to applying or modifying our business model to different countries and regions of the world. There can be no assurance that any of the Company's efforts to expand outside the United States will prove successful, that it will not incur operating losses in the future as a result of these efforts or that such efforts will not have a material adverse impact.
The Company may not have the right infrastructure (people, systems, and processes) in place to achieve its growth initiatives.
If the Company does not effectively develop and implement its organic growth strategies, or if there are delays or difficulties in enhancing business processes, it may not realize anticipated productivity improvements or cost efficiencies, and may experience operational difficulties, increased costs, manufacturing interruptions or delays, quality issues, increased product time-to-market, and/or inefficient allocation of human resources, any or all of which could materially and adversely affect the Company's business, financial condition and results of operations.
The Company's success depends upon its ability to develop new products and services, integrate acquired products and services and enhance its existing products and services through product development initiatives and technological advances.
The Company has continuing programs designed to develop new products and to enhance and improve its products. The Company is expending resources for the development of new products in all aspects of its business, including products that can reach a broader customer base. Some of these new products must be developed due to changes in legislative, regulatory or industry requirements or in competitive technologies that render certain of the Company's products obsolete or less competitive. The successful development of the Company's products and product enhancements are subject to numerous risks, both known and unknown, including unanticipated delays, access to significant capital, budget overruns, technical problems and other difficulties that could result in the abandonment or substantial change in the design, development and commercialization of these new products.
Given the uncertainties inherent with product development and introduction, including lack of market acceptance, the Company cannot provide assurance that any of its product development efforts will be successful on a timely basis or within budget, if at all. Failure to develop new products and product enhancements on a timely basis or within budget could harm the Company's business and prospects. In addition, the Company may not be able to achieve the technological advances necessary for it to remain competitive.
The Company's goodwill and indefinite-lived intangible assets may become impaired and result in a charge to income.
The Company's management must use judgment in making estimates of future operating results and appropriate residual values to allocate the purchase price paid for acquisitions to the fair value of the net tangible and identifiable intangible assets. Future operating results and residual values could reasonably differ from the estimates and could require a provision for impairment in a future period which would result in a charge to income from operations in the year of the impairment with a resulting decrease in the Company's recorded net worth.
The Company may not be able to protect its intellectual property.
A significant amount of time, effort and expense is devoted to custom engineering which qualifies the Company's products for specific customer applications and developing superior, proprietary process technology. The Company relies on a combination of copyright, patent, trade secrets, confidentiality procedures and contractual commitments to protect its proprietary information. Despite the Company's efforts, these measures can only provide limited protection. Unauthorized third parties may try to copy or reverse engineer portions of the Company's products or otherwise obtain and use its intellectual property. Any patents the Company owns may be invalidated, circumvented or challenged. Any of the Company's pending or future patent applications, whether or not being currently challenged, may not be issued with the scope of the claims it seeks, if at all. If the Company cannot protect its proprietary information against unauthorized use, it may not remain competitive, which would have a material adverse effect on the Company's results of operations.
The Company has the ability to issue additional equity securities, which would lead to dilution of its issued and outstanding common stock.
The issuance of additional equity securities or securities convertible into equity securities would result in dilution of existing stockholders' equity interests in the Company. The Company is authorized to issue, without stockholder approval, 1,000,000 shares of preferred stock, no par value, in one or more series, which may give other stockholders dividend, conversion,
16
Table of Contents
voting, and liquidation rights, among other rights, which may be superior to the rights of holders of the Company's common stock. The Company's board of directors has no present intention of issuing any such preferred shares, but reserves the right to do so in the future. In addition, the Company is authorized, by prior stockholder approval, to issue up to 125,000,000 shares of common stock, $0.01 par value per share. The Company is authorized to issue, without stockholder approval, securities convertible into either common stock or preferred stock.
The Company's insurance providers may be unable to perform under their obligations.
The Company purchases insurance as part of its risk management strategy. An insurer's insolvency or refusal to make payments under the terms of its agreements with the Company could have an adverse effect on our results of operations or liquidity. One of the Company's insurance carriers recently entered rehabilitation proceedings, which could affect our ability to recover amounts due for outstanding claims or to pursue recoveries for future claims. However, the Company's exposure to the carrier is not significant at this time, and we do not currently expect it to have a material effect on our future operating results.
The Company is subject to various existing and contemplated laws, regulations and government initiatives that may materially impact its demand, profitability, or costs of doing business.
The Company's business may be materially impacted by various governmental laws, regulations and initiatives that may artificially create, deflate, accelerate, or decelerate consumer demand for its products. For example, when the government issues tax credits designed to encourage increased homebuilding or energy efficient window purchases, the credits may create a spike in demand that would not otherwise have occurred and our production capabilities may not be able to keep pace, which could materially impact our profitability. Likewise, when such laws, regulations or initiatives expire, our business may experience a material loss in sales volume or an increase in production costs as a result of the decline in consumer demand that follows such expiration.
If aluminum prices on the London Metals Exchange (LME) were to decline quickly and significantly, the Company's profitability could be adversely affected.
At the Company's Aluminum Sheet Products segment, profitability in part depends on the market price of aluminum ingot as compared to the market price of aluminum scrap. If aluminum ingot prices experience a rapid and significant decline, then the Company's aluminum business could experience a corresponding decline in spread (sales less material costs), which could adversely affect its profitability.
Item 1B. | Unresolved Staff Comments |
None.
17
Table of Contents
Item 2. | Properties |
The following table lists the Company's principal properties together with their locations, general character and the industry segment which uses the facility. Listed facilities are owned by the Company, unless indicated otherwise. See Item 1, "Business," for discussion of the capacity of various facilities.
Location |
| Principal Products |
Engineered Products Segment |
|
|
Rice Lake, Wisconsin |
| Fenestration products |
Chatsworth, Illinois |
| Fenestration products |
Richmond, Indiana |
| Fenestration products |
Solon, Ohio |
| Flexible spacer and adhesive research & sales |
Leased (expires 2017) |
|
|
|
|
|
Luck, Wisconsin |
| Fenestration products |
Richmond, Kentucky |
| Vinyl and composite extrusions |
Winnebago, Illinois |
| Vinyl extrusions |
Mounds View, Minnesota |
| Fenestration products |
Leased (expires 2016) |
|
|
Kent, Washington |
| Vinyl and composite extrusions |
Leased (expires 2015) |
|
|
Yakima, Washington |
| Vinyl extrusions |
Leased (expires 2015) |
|
|
Dubuque, Iowa |
| Fenestration products |
Leased (expires Dec. 2012) (2) |
|
|
Shawano, Wisconsin |
| Fenestration products |
Leased (expires 2015) |
|
|
Cambridge, Ohio |
| Flexible spacer/solar adhesives |
Leased (expires 2021) |
|
|
Coventry, United Kingdom |
| Flexible spacer |
Heinsberg, Germany |
| Flexible spacer |
Leased (expires 2025) |
|
|
|
|
|
Aluminum Sheet Products Segment |
|
|
Lincolnshire, Illinois |
| Finishing |
Davenport, Iowa |
| Mini-mill and finishing/painting (two plants) |
Decatur, Alabama |
| Finishing/painting |
Owned and leased (expires 2018) |
|
|
|
|
|
Executive Offices |
|
|
Houston, Texas |
| Corporate Office |
Two Leases (expiring 2013 and 2023) (1) |
|
|
(1) | The corporate executive offices will be relocating to a newly leased location in Houston, TX in fiscal 2013. The lease on this new location expires in 2023. The current lease will terminate upon vacating. |
(2) | The Dubuque, Iowa lease expires in December of 2012. The Company is currently in negotiations to renew the lease. |
The Company believes that its operating properties are generally in good condition, are well maintained, and are generally suitable and adequate to carry on the Company's business. In fiscal 2012 , the Company's facilities operated at approximately 57% of capacity.
18
Table of Contents
Item 3. | Legal Proceedings |
The Company believes there are no material legal proceedings to which Quanex, its subsidiaries, or their property is subject. For discussion of environmental issues, see Item 1 of this Form 10-K, Note 16 to the Consolidated Financial Statements, located in Item 8 of this Form 10-K.
19
Table of Contents
PART II
Item 5. | Market for Registrant's Common Equity, Related Stockholder Matters and Issuer Purchases of Equity Securities |
Quanex Building Products' common stock, $0.01 par value, is traded on the New York Stock Exchange, under the ticker symbol NX. The following tables present the quarterly common stock cash dividends and the high and low prices for the Company's common stock during each fiscal quarter within the two most recent fiscal years.
Quarterly Common Stock Cash Dividends
Paid for the Quarter Ended | 2012 |
| 2011 | ||||
January | $ | 0.04 | |
| $ | 0.04 | |
April | 0.04 | |
| 0.04 | | ||
July | 0.04 | |
| 0.04 | | ||
October | 0.04 | |
| 0.04 | | ||
Total | $ | 0.16 | |
| $ | 0.16 | |
Quarterly Common Stock Sales Price (High & Low Sales Price)
Quarter Ended | 2012 |
| 2011 | ||||
January | $ | 17.58 | |
| $ | 20.96 | |
| 12.71 | |
| 16.17 | | ||
April | 18.78 | |
| 21.62 | | ||
| 14.89 | |
| 18.28 | | ||
July | 19.10 | |
| 21.02 | | ||
| 14.98 | |
| 14.09 | | ||
October | 20.36 | |
| 16.04 | | ||
| 16.48 | |
| 10.01 | | ||
The terms of Quanex's revolving credit agreement do not specifically limit the total amount of dividends or other distributions to its shareholders. Dividends and other distributions are permitted so long as after giving effect to such dividend or stock repurchase, there is no event of default.
There were approximately 4,015 holders of Quanex Building Product's common stock (excluding individual participants in securities positions listings) on record as of December 14, 2012.
The following graph compares the performance of the Company's common stock to the performance of the Standard & Poor's 500 Index (S&P 500), the Russell 2000 Index, and the Company's peer group.
20
Table of Contents
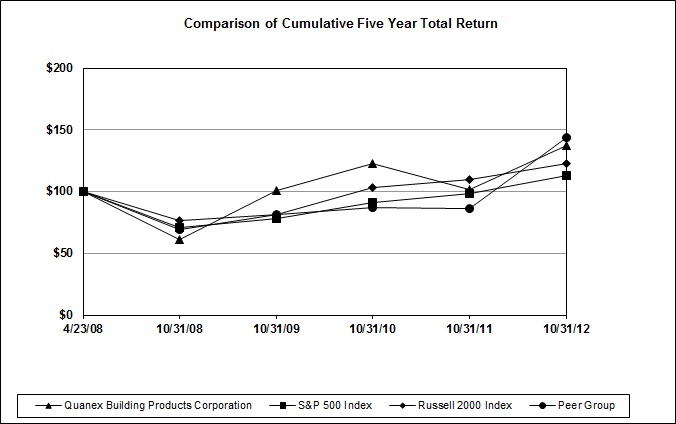
| Base Period |
| INDEXED RETURNS Years Ending | ||||||||||||||
Company Name / Index | 4/23/2008 |
| 10/31/2008 |
| 10/31/2009 |
| 10/31/2010 |
| 10/31/2011 |
| 10/31/2012 | ||||||
Quanex | 100 | |
| 61.21 | |
| 100.55 | |
| 122.85 | |
| 101.59 | |
| 137.44 | |
S&P 500 Index | 100 | |
| 71.01 | |
| 77.97 | |
| 90.85 | |
| 98.20 | |
| 113.13 | |
Russell 2000 Index | 100 | |
| 76.49 | |
| 81.43 | |
| 103.07 | |
| 109.99 | |
| 122.43 | |
Peer Group | 100 | |
| 68.95 | |
| 81.66 | |
| 87.15 | |
| 86.40 | |
| 143.64 | |
Quanex Building Products Corporation was initially listed and began trading on the New York Stock Exchange on April 24, 2008. The graph assumes $100 invested on April 23, 2008 in Quanex Building Products Corporation common stock, in the S&P 500, Russell 2000 Index and in the Industry Peer Group. The companies included in the Industry Peer Group are: American Woodmark Corp, Apogee Enterprises Inc, Builders Firstsource, Drew Industries Inc, Eagle Materials Inc, Gibraltar Industries Inc, Griffon Corp, Louisiana-Pacific Corp, Simpson Manufacturing Inc, Trex Co Inc, and Universal Forest Products Inc.
Equity Compensation Plan Information
The following table summarizes as of October 31, 2012 certain information regarding equity compensation to the Company's employees, officers, directors and other persons under equity compensation plans.
Equity Compensation Plan Information
Plan Category | Number of securities to be issued upon exercise of outstanding options, warrants and rights |
| Weighted-average exercise price of outstanding options, warrants and rights |
| Number of securities remaining available for future issuance under equity compensation plans (excluding securities reflected in column (a)) | ||||
| (a) |
| (b) |
| (c) | ||||
Equity compensation plans approved by security holders | 2,473,250 | |
| $ | 14.57 | |
| 1,985,973 | |
21
Table of Contents
Issuer Purchases of Equity Securities
On May 27, 2010, the Board of Directors approved a stock repurchase program that authorized the repurchase of 1.0 million shares of the Company's common stock, and on August 25, 2011, the Board of Directors authorized an additional 1.0 million shares to the program. The program does not have a dollar limit or an expiration date. There were no repurchases of shares during the quarter ended October 31, 2012 and there were 905,663 shares remaining in the program at October 31, 2012 .
22
Table of Contents
Item 6. | Selected Financial Data |
The following selected consolidated financial data for the years ended October 31, 2008 through October 31, 2012 is derived from the Company's audited Consolidated Financial Statements. Unless otherwise noted, all information in the table below reflects only continuing operations. The data set forth should be read in conjunction with the Company's Consolidated Financial Statements and accompanying notes to the Consolidated Financial Statements included in Item 8 of this Form 10-K. The historical information is not necessarily indicative of the results to be expected in the future.
Glossary of Terms
The exact definitions of commonly used financial terms and ratios vary somewhat among different companies and investment analysts. The following list gives the definition of certain financial terms that are used in this report:
Asset turnover (continuing): Net sales divided by the average of beginning of year and end of year total assets excluding discontinued operations' assets.
Conversion capital: Accounts receivable plus inventory less accounts payable.
Working capital (continuing): Current assets less current liabilities (both excluding discontinued operations).
Current ratio (continuing): Current assets divided by current liabilities (both excluding discontinued operations).
Continuing return on common stockholders' equity: Income from continuing operations attributable to common stockholders divided by the average of beginning of year and end of year common stockholders' equity.
Continuing return on investment: The sum of income from continuing operations and the after-tax effect of interest expense less capitalized interest divided by the sum of the beginning of year and end of year averages for short and long-term debt and stockholders' equity.
23
Table of Contents
Selected Financial Data 2008 – 2012
| Fiscal years ended October 31, | ||||||||||||||||||
| 2012 |
| 2011 (1)(2) |
| 2010 (1) (3) |
| 2009 (1) |
| 2008 (1) | ||||||||||
| (In thousands, except per share data and employees) | ||||||||||||||||||
Selected Operating Results Data: |
|
|
|
|
|
|
|
|
| ||||||||||
Net sales | $ | 828,976 | |
| $ | 848,294 | |
| $ | 798,314 | |
| $ | 585,010 | |
| $ | 868,933 | |
Operating income (loss) (4)(7)(8)(9) | (24,953 | ) |
| 16,478 | |
| 37,297 | |
| (179,098 | ) |
| 21,100 | | |||||
Income (loss) from continuing operations | (16,534 | ) |
| 9,078 | |
| 24,201 | |
| (136,079 | ) |
| 15,993 | | |||||
Percent of net sales | (2.0 | )% |
| 1.1 | % |
| 3.0 | % |
| (23.3 | )% |
| 1.8 | % | |||||
Income (loss) from discontinued operations, net of tax (4)(7)(8)(9) | - | |
| (12 | ) |
| (1,103 | ) |
| (1,012 | ) |
| 5,586 | | |||||
Net income (loss) (4)(7)(8)(9) | $ | (16,534 | ) |
| $ | 9,066 | |
| $ | 23,098 | |
| $ | (137,091 | ) |
| $ | 21,579 | |
Diluted Earnings Per Share Data: |
|
|
|
|
|
|
|
|
| ||||||||||
Income (loss) from continuing operations | $ | (0.45 | ) |
| $ | 0.24 | |
| $ | 0.64 | |
| $ | (3.64 | ) |
| $ | 0.42 | |
Net income (loss) | $ | (0.45 | ) |
| $ | 0.24 | |
| $ | 0.61 | |
| $ | (3.67 | ) |
| $ | 0.56 | |
Cash dividends declared (5) | $ | 0.16 | |
| $ | 0.16 | |
| $ | 0.14 | |
| $ | 0.12 | |
| $ | 0.34 | |
Financial Position-Year End: |
|
|
|
|
|
|
|
|
| ||||||||||
Total assets, including discontinued operations (6) | $ | 589,538 | |
| $ | 584,929 | |
| $ | 591,250 | |
| $ | 543,600 | |
| $ | 680,847 | |
Asset turnover (continuing) | 1.4 | |
| 1.4 | |
| 1.4 | |
| 1.0 | |
| 1.4 | | |||||
Conversion capital | 70,563 | |
| 71,472 | |
| 61,221 | |
| 59,676 | |
| 85,547 | | |||||
Working capital (continuing) | 123,058 | |
| 140,324 | |
| 223,401 | |
| 178,320 | |
| 130,882 | | |||||
Current ratio (continuing) | 2.0 to 1 | |
| 2.3 to 1 | |
| 2.9 to 1 | |
| 2.8 to 1 | |
| 2.1 to 1 | | |||||
Total debt | $ | 1,401 | |
| $ | 1,666 | |
| $ | 1,943 | |
| $ | 2,266 | |
| $ | 2,551 | |
Stockholders' equity | 421,827 | |
| 437,226 | |
| 441,432 | |
| 422,526 | |
| 547,828 | | |||||
Total capitalization | $ | 423,228 | |
| $ | 438,892 | |
| $ | 443,375 | |
| $ | 424,792 | |
| $ | 550,379 | |
Depreciation and amortization | 37,596 | |
| 33,932 | |
| 28,214 | |
| 32,453 | |
| 35,068 | | |||||
Capital expenditures, net | 42,871 | |
| 25,312 | |
| 14,720 | |
| 15,696 | |
| 15,020 | | |||||
Other Data: |
|
|
|
|
|
|
|
|
| ||||||||||
Continuing return on investment–percent | (3.8 | )% |
| 2.1 | % |
| 5.6 | % |
| (27.8 | )% |
| 2.3 | % | |||||
Continuing return on common stockholders' equity–percent | (3.8 | )% |
| 2.1 | % |
| 5.6 | % |
| (28.0 | )% |
| 2.2 | % | |||||
Average number of employees | 2,201 |
| 2,104 |
| 1,947 |
| 1,961 |
| 2,373 | ||||||||||
Net sales per average employee | $ | 377 | |
| $403 |
| $410 |
| $298 |
| $366 | ||||||||
(1) | In 2010, management closed its start-up facility in China due to the contraction of demand and the Company's ability to serve the overseas thin film solar panel market from its North American operations. During the second quarter of 2008, the Company spun off Quanex Corporation's Building Products business immediately followed by the merger of Quanex Corporation (consisting primarily of the Vehicular Products business and all non-Building Products related corporate accounts) with a wholly-owned subsidiary of Gerdau. Accordingly, the assets and liabilities of the start-up facility in China, the Vehicular Products business and all non-Building Products related corporate accounts are reported as discontinued operations in the Consolidated Balance Sheets for all periods presented, and their operating results are reported as discontinued operations in the Consolidated Statements of Income for all periods presented. |
(2) | On March 31, 2011, the Company acquired Edgetech, I.G. Inc. and its German subsidiary. Headquartered in Cambridge, Ohio, Edgetech has three manufacturing facilities (U.S., U.K. and Germany) that produce and market a full line of warm edge insulating glass spacer systems for window and door customers in North America and abroad. In March 2011, the Company also acquired JELD-WEN's vinyl extrusion assets in Yakima, Washington. Accordingly, the estimated fair value of assets acquired in the acquisition and the results of operations are included in the Company's Consolidated |
24
Table of Contents
Financial Statements as of the effective date of the acquisition.
(3) | In February 2010, the Company completed a small acquisition which was effected through an asset purchase through a receivership proceeding and no liabilities were assumed. Accordingly, the estimated fair value of assets acquired in the acquisition and the results of operations are included in the Company's Consolidated Financial Statements as of the effective date of the acquisition. |
(4) | Includes effects in fiscal 2009 of the Company's $182.6 million (pretax) and $141.4 million (after-tax) asset impairment charge in accordance with ASC Topic 350 and ASC Topic 360. |
(5) | The quarterly common stock cash dividends prior to April 23, 2008 reflect dividends of Quanex Corporation prior to the Separation, while dividends after April 23, 2008 reflect dividends of Quanex Building Products, the accounting successor to Quanex Corporation. |
(6) | Total assets include assets of discontinued operations of $0.5 million, $1.8 million and $1.4 million at October 31, 2010, 2009, and 2008, respectively. |
(7) | In fiscal 2012, the Company experienced a strike at two of Nichols' Davenport, Iowa facilities which had a negative impact on operating income of approximately $11.1 million (pretax) and $7.3 million (after tax), including the reduction in sales volume as well as incremental direct costs. |
(8) | In November 2011, the Company announced a consolidation program for its IG spacer manufacturing facility in Barbourville, Kentucky into its IG spacer manufacturing facility in Cambridge, Ohio. The facility consolidation was completed ahead of schedule in August 2012 and the Barbourville facility is permanently closed. The Company recorded expenses related to this plant closure in fiscal 2012 of $9.0 million (pretax) and $5.9 million (after-tax). |
(9) | During fiscal 2011, the Company recognized an expense of $1.9 million (pretax) or $1.1 million (after-tax) to increase the warranty reserve associated with a discontinued legacy product and claims. |
25
Table of Contents
Item 7. | Management's Discussion and Analysis of Financial Condition and Results of Operations |
General
The discussion and analysis of the Company's financial condition and results of operations should be read in conjunction with the Selected Financial Data and the Consolidated Financial Statements of the Company and the accompanying notes.
Private Securities Litigation Reform Act
Certain of the statements contained in this document and in documents incorporated by reference herein, including those made under the caption "Management's Discussion and Analysis of Financial Condition and Results of Operations" are "forward-looking" statements as defined under the Private Securities Litigation Reform Act of 1995. Generally, the words "expect," "believe," "intend," "estimate," "anticipate," "project," "will" and similar expressions identify forward-looking statements, which generally are not historical in nature. All statements which address future operating performance, events or developments that the Company expects or anticipates will occur in the future, including statements relating to volume, sales, operating income and earnings per share, and statements expressing general outlook about future operating results, are forward-looking statements. Forward-looking statements are subject to certain risks and uncertainties that could cause actual results to differ materially from the Company's historical experience and the present projections or expectations. As and when made, management believes that these forward-looking statements are reasonable. However, caution should be taken not to place undue reliance on any such forward-looking statements since such statements speak only as of the date when made and there can be no assurance that such forward-looking statements will occur. The Company undertakes no obligation to publicly update or revise any forward-looking statements, whether as a result of new information, future events or otherwise.
Factors exist that could cause the Company's actual results to differ materially from the expected results described in or underlying the Company's forward-looking statements. Such factors include domestic and international economic activity, prevailing prices of aluminum scrap and other raw material costs, the rate of change in prices for aluminum scrap, fluctuations in foreign currency exchange rates, energy costs, interest rates, construction delays, market conditions, particularly in the home building and remodeling markets, any material changes in purchases by the Company's principal customers, labor supply and relations, environmental regulations, changes in estimates of costs for known environmental remediation projects and situations, world-wide political stability and economic growth, warranty obligations, the Company's successful implementation of its internal operating plans, acquisition strategies and integration, performance issues with key customers, suppliers and subcontractors, and regulatory changes and legal proceedings. Accordingly, there can be no assurance that the forward-looking statements contained herein will occur or that objectives will be achieved. All written and verbal forward-looking statements attributable to the Company or persons acting on its behalf are expressly qualified in their entirety by such factors. For more information, please see Item 1A, "Risk Factors."
About Third-Party Information
In this report, the Company relies on and refers to information regarding industry data obtained from market research, publicly available information, industry publications, U.S. government sources and other third parties. Although the Company believes the information is reliable, it cannot guarantee the accuracy or completeness of the information and has not independently verified it.
Description of Business
The Company operates two businesses: Engineered Products and Aluminum Sheet Products. The Engineered Products segment produces engineered systems, products and components primarily serving the window and door industry, while the Aluminum Sheet Products segment produces mill finished and coated aluminum sheet serving the broader building products markets and secondary markets such as transportation.
On March 31, 2011 , the Company acquired Edgetech for $104.4 million in an all cash transaction (net of cash acquired). Headquartered in Cambridge, Ohio, Edgetech added three manufacturing facilities located in the United States, the United Kingdom and Germany that produce a full line of warm-edge, dual seal insulating glass spacer systems for window and door customers in North America and abroad. Edgetech's products separate and seal double and triple pane glass within a window and act as a thermal barrier that enhances the window's energy efficiency. Edgetech was integrated into the Engineered Products segment. Acquiring Edgetech allows the Company to better serve its growing base of national and regional customers and will further accelerate its international growth as Edgetech has a solid market presence overseas. In March 2011, the Company also acquired JELD-WEN's vinyl extrusion assets in Yakima, Washington. In January 2011, management closed its finished window screen facility located in The Dalles, Oregon. In November 2011, management committed to a plan to consolidate its Truseal and U.S. Edgetech operations.
26
Table of Contents
The consolidation plan, in part, called for the permanent closing of the Company's Barbourville, Kentucky facility with the equipment used to manufacture the single seal spacer system relocated to the Company's Cambridge, Ohio facility. The Company believes this consolidation will allow it to better serve customers through streamlined operations. The consolidation of operations and the subsequent closure of the Barbourville facility were completed in August 2012 with minor residual cash payments expected in fiscal 2013. All equipment to be retained has been relocated, with the main outstanding activities only related to selling remaining equipment and the facility itself.
In 2010, management closed its start-up facility in China due to the contraction of demand and the Company's ability to serve the overseas thin film solar panel market from its North American operations. Accordingly, the China assets and liabilities, results of operations and cash flows are reported as discontinued operations for all periods presented. Unless otherwise noted, all disclosures in the notes accompanying the Consolidated Financial Statements as well as all discussion in Management's Discussion and Analysis of Financial Condition and Results of Operations reflect only continuing operations.
Results of Operations
Summary Information as % of Sales
| Years Ended October 31, (1) | |||||||||||||||||||
| (Dollars in millions) | |||||||||||||||||||
| 2012 |
| 2011 |
| 2010 | |||||||||||||||
| Dollar Amount |
| % of Sales |
| Dollar Amount |
| % of Sales |
| Dollar Amount |
| % of Sales | |||||||||
Net sales | $ | 829.0 | |
| 100 | % |
| $ | 848.3 | |
| 100 | % |
| $ | 798.3 | |
| 100 | % |
Cost of sales (2) | 703.8 | |
| 85 | |
| 712.1 | |
| 84 | |
| 660.8 | |
| 83 | | |||
Selling, general and administrative | 111.6 | |
| 13 | |
| 84.0 | |
| 10 | |
| 72.0 | |
| 9 | | |||
Asset impairment charges | 0.9 | |
| - | |
| 1.8 | |
| - | |
| - | |
| - | | |||
Depreciation and amortization | 37.7 | |
| 5 | |
| 33.9 | |
| 4 | |
| 28.2 | |
| 4 | | |||
Operating income (loss) | (25.0 | ) |
| (3 | ) |
| 16.5 | |
| 2 | |
| 37.3 | |
| 4 | | |||
Interest expense | (0.4 | ) |
| - | |
| (0.4 | ) |
| - | |
| (0.4 | ) |
| - | | |||
Other, net | 0.2 | |
| - | |
| (0.5 | ) |
| - | |
| 2.6 | |
| - | | |||
Income tax (expense) benefit | 8.7 | |
| 1 | |
| (6.5 | ) |
| (1 | ) |
| (15.3 | ) |
| (2 | ) | |||
Income from continuing operations | $ | (16.5 | ) |
| (2 | )% |
| $ | 9.1 | |
| 1 | % |
| $ | 24.2 | |
| 2 | % |
(1) | All periods presented exclude the operations of Truseal China, the vehicular products business and all non-building products related corporate accounts which are included in discontinued operations. |
(2) | Exclusive of items shown separately below. |
Overview
During fiscal 2012 , the Company saw positive signs in the residential new construction market, including rising home starts, falling home inventory levels, and improving trends in home prices. Performance of the Company's end markets varied as new construction continued on a path towards recovery while the repair and replacement ("R&R") segment retreated, a result of weakness in consumer confidence, unemployment and reduced availability of home equity lines of credit. Quanex believes the best indicator of the strength of its end markets is U.S. window shipments as reported by Ducker Worldwide ("Ducker"), a market intelligence firm. For the twelve months ended September 30, 2012 , Ducker reported new construction window shipments increased 21% while repair and replacement window shipments declined approximately 7%. In total, Ducker reported overall window shipments increased approximately 1%. This is challenging as Quanex estimates about two-thirds of its Engineered Products segment sales are related to the residential R&R window market. Quanex is focused more on the repair and replacement segment due to it being a higher-end product mix and a better fit for the Company's value-added products and services. The lag in the repair and replacement segment is likely to continue as long as consumer confidence remains low, home equity loans are difficult to obtain and unemployment remains a concern. The encouraging news is that the recent favorable trend in home prices is a clear positive sign that is needed for a recovery to begin in the repair and replacement segment.
The decline in Quanex Net sales for fiscal 2012 compared to the year ago period was entirely driven by reduced aluminum shipments and lower aluminum prices within the Aluminum Sheet Products segment whose Net sales declined by $78.2 million
27
Table of Contents
during fiscal 2012 compared to fiscal 2011 . The segment experienced a strike at two of Nichols' Davenport, Iowa facilities (see further discussion in Aluminum Sheet Products) which had a significant negative impact on shipments. Ducker reported that total U.S. window shipments for the twelve months ended September 30, 2012 increased 1.4% while the Company's Engineered Products segment experienced a 6% increase in same store sales predominately related to higher vinyl extrusion sales. Same store sales reflect the Net sales of Edgetech, acquired on March 31, 2011, for only comparable months of the last twelve month period. Operating income declined for fiscal 2012 by $41.4 million , compared to prior year, with the majority of the decrease at the Aluminum Sheet Products segment. Fiscal 2012 was negatively impacted by the strike which resulted in direct strike related losses coupled with additional strike related inefficiencies, lower aluminum shipments and lower aluminum prices. Additionally, Quanex incurred an increase in facility related consolidation expenses of $5.3 million and higher ERP implementation costs of $5.4 million during fiscal 2012 compared to 2011 .
Quanex outperformed in the face of difficult end markets in fiscal 2011 . Prime window demand dropped to new lows in 2011 to an estimated 38.7 million units as measured by Ducker for the twelve months ended September 30, 2011. While the first quarter of 2011 experienced demand pull-forward in advance of the $1,500 window tax credit that expired on December 31, 2010, demand was lackluster for the remainder of the fiscal year as the building and construction market did not experience a meaningful spring bounce as is typical as the year progresses. The 2011 figures include financial results from the Edgetech acquisition beginning in April 2011. Net sales increased in 2011 by $50.0 million compared to the same period of last year of which $53.4 million was driven by the Edgetech acquisition. Despite weak end markets, same store 2011 revenues from Engineered Products were slightly higher compared to 2010, supported by price increases and surcharges. Operating income for 2011 was $20.8 million lower than 2010 due to lower aluminum sheet shipments, higher maintenance costs at Aluminum Sheet Products, coupled with higher costs at Engineered Products associated with rationalizing operations, incremental sales and marketing costs as the Company invested in long-term organic growth initiatives, acquisition related costs, higher raw material costs and warranty expense.
Window shipments have declined significantly in recent years from record highs in 2005 of 70.5 million units to an estimated 39.6 million in calendar 2012 . The following table sets forth the annual calendar year market information from the 2005 peak to the current 2012 estimates:
| Housing Starts (1) |
| Window Shipments (2) | ||||||||
| Starts (millions) |
| % Change |
| Shipments (millions) |
| % Change | ||||
2005 | 2.1 | |
|
|
| 70.5 | |
|
| ||
2006 | 1.8 | |
| (12.6 | )% |
| 66.7 | |
| (5.4 | )% |
2007 | 1.3 | |
| (25.9 | )% |
| 59.1 | |
| (11.4 | )% |
2008 | 0.9 | |
| (32.9 | )% |
| 48.4 | |
| (18.1 | )% |
2009 | 0.6 | |
| (38.7 | )% |
| 38.9 | |
| (19.6 | )% |
2010 | 0.6 | |
| 6.2 | % |
| 41.6 | |
| 6.9 | % |
2011 | 0.6 | |
| 4.4 | % |
| 37.9 | |
| (8.9 | )% |
2012E | 0.8 | |
| 27.1 | % |
| 39.6 | |
| 4.5 | % |
(1) | As published by the National Association of Home Builders. |
(2) | As published by Ducker Worldwide. |
While fiscal 2012 presented several challenges, in 2013 Quanex is expecting improved operational performance at its Aluminum Sheet Products business as the new management team pushes lean process initiatives and investments in equipment, maintenance reliability, and throughput. Quanex continues to drive productivity improvements, lower costs, customer service and growth in its regional customer base. The Company believes that consumer demand for more energy efficient products and its ability to provide innovative window and door systems in addition to stand-alone components will fuel long-term organic growth incremental to the housing market recovery. The integration of Edgetech into the Engineered Products sales and marketing organization was completed in September 2011 and it is clear that Quanex is already a stronger, more customer-focused organization as a result. While Quanex is cautious on the near-term repair and remodel market, the Company remains bullish long-term as the existing housing stock ages and demographics for long-term housing demand in the U.S. remain favorable when factoring the projected population increase and continuing immigration. The Company believes taking a disciplined approach to the way it seeks new business opportunities will make it a more successful company and a stronger competitor by offering a broader range of customers a more robust slate of systems, products, services and solutions, while intensely focusing on continuously improving customer service. Additionally, the Company continues to elevate its programs to develop more energy efficient products. These
28
Table of Contents
programs and initiatives, coupled with an eventual return to a more normal new home construction market and R&R market, will benefit Quanex over the long term.
Business Segments
Business segments are reported in accordance with ASC Topic 280 " Segment Reporting " (ASC 280). ASC 280 requires that the Company disclose certain information about its operating segments, where operating segments are defined as "components of an enterprise about which separate financial information is available that is evaluated regularly by the chief operating decision maker (CODM) in deciding how to allocate resources and in assessing performance." Generally, financial information is required to be reported on the basis that it is used internally for evaluating segment performance and deciding how to allocate resources to segments.
Quanex has two reportable segments: Engineered Products and Aluminum Sheet Products. The Engineered Products segment produces systems, finished products, and components serving the OEM residential window and door industry, while the Aluminum Sheet Products segment produces mill finished and coated aluminum sheet serving the broader residential building and construction markets. The primary market drivers of both segments are residential repair and remodel (R&R) activity and new home construction.
For financial reporting purposes, three of the Company's four operating segments, Engineered Components, Insulating Glass (IG) and Window & Door Systems, have been aggregated into the Engineered Products reportable segment. The remaining operating segment, Aluminum Sheet Products (Nichols Aluminum), is reported as a separate reportable segment. Corporate & Other is comprised of corporate office expenses and certain inter-division eliminations. The sale of products between segments is recognized at market prices. The financial performance of the operations is based upon operating income. The segments follow the accounting principles described in the Summary of Significant Accounting Principles, see Item 8, Note 1. The two reportable segments value inventory on a FIFO or weighted-average basis while the LIFO reserve relating to those operations accounted for under the LIFO method of inventory valuation is computed on a consolidated basis in a single pool and treated as a corporate item.
Engineered Products – Three Years Ended October 31, 2012
The following table sets forth selected operating data for the Engineered Products segment:
| Years Ended October 31, |
| % Change | ||||||||||||||
(Dollars in millions) |
| 2012 vs. |
| 2011 vs. | |||||||||||||
2012 |
| 2011 |
| 2010 |
|
| |||||||||||
Net sales | $ | 478.6 | |
| $ | 420.3 | |
| $ | 361.1 | |
| 13.9 | % |
| 16.4 | % |
Cost of sales (1) | 355.5 | |
| 314.9 | |
| 267.7 | |
| 12.9 | |
| 17.6 | | |||
Selling, general and administrative | 65.6 | |
| 48.0 | |
| 39.3 | |
| 36.7 | |
| 22.1 | | |||
Asset impairment charges | 0.9 | |
| 1.8 | |
| - | |
| (50.0 | ) |
| 0 | | |||
Depreciation and amortization | 28.1 | |
| 25.3 | |
| 19.8 | |
| 11.1 | |
| 27.8 | | |||
Operating income (loss) | $ | 28.5 | |
| $ | 30.3 | |
| $ | 34.3 | |
| (5.9 | )% |
| (11.7 | )% |
Operating income (loss) margin | 6.0 | % |
| 7.2 | % |
| 9.5 | % |
| (1.2 | )% |
| (2.3 | )% | |||
(1) | Exclusive of items shown separately below. |
Engineered Products is focused on providing window and door OEM customers with fenestration components, products and systems. Key end markets are residential R&R and new home construction.
Engineered Products finished the year with sales up $58.3 million or 14% for fiscal 2012 compared to 2011 . Results include twelve months of Edgetech sales in 2012 compared to seven months in 2011 as Edgetech was acquired on March 31, 2011 representing approximately $32 million of the year over year increase. Considering Edgetech's partial year contribution, comparable Net sales for year ended October 31, 2012 were 6% higher than 2011 . The comparable increase was primarily from higher vinyl fenestration extrusion sales as well as growth in international spacer sales. A major OEM customer that produces mid to high-end wood and vinyl windows, gained significant market share this year at the big box stores by displacing a competitor that did not buy Quanex extrusions, benefiting sales in 2012. International spacer sales for the second half of fiscal 2012 exceeded the same prior year period by 25% as demand for warm-edge spacer products is rising in European markets due to codes and standards. The beginning of fiscal 2011 benefited from a pull-forward of demand as a result of a $1,500 energy efficient window tax credit program that expired on December 31, 2010. There were no similar tax credits in fiscal 2012 . The 6% increase in comparable Net sales exceeded industry performance as measured by Ducker which reported overall U.S. window shipments up only 1.4%
29
Table of Contents
for the twelve months ended September 30, 2012 and window shipments associated with the repair and remodel window market down 6.6%. There were favorable signs in new home construction in fiscal 2012 , and indications are that a new recovery is underway. U.S. residential replacement window shipments, which drive an estimated two-thirds of Engineered Products' sales, were down in 2012 and a long-term recovery is likely to take better hold once housing prices, credit availability and consumer confidence turn more positive.
Net sales for fiscal 2011 exceeded the prior year 2010 period by $59.2 million due to the March 2011 acquisition of Edgetech. Edgetech contributed $53.4 million in Net Sales in fiscal 2011 . Engineered Products' same store Net sales were essentially flat in fiscal 2011 despite difficult end markets. For the twelve months ended October 31, 2011, Engineered Products' Net sales before contributions from acquisitions were up 0.3% compared to the previous twelve months, versus U.S. window shipments as reported by Ducker that were down approximately 8%.
Net sales less Cost of sales (Contribution margin) at Engineered Products for fiscal 2012 compared to last year improved by $17.8 million. The increase in contribution margin for 2012 over 2011 is predominately due to the higher vinyl extrusion sales in 2012. Approximately half of the improvement in contribution margin for fiscal 2012 compared to the fiscal 2011 is from the rise in vinyl extrusion sales while approximately one-third of the increase is related to a full year of Edgetech sales in 2012 compared to seven months of Edgetech business during the same 2011 period. Net sales less Cost of sales as a percent of Net sales for the year ended October 31, 2012 is higher than 2011 even with the weak market and pressure on volume. Increased revenues, combined with pricing initiatives, cost controls, productivity improvements, warranty benefits and 2011 purchase accounting costs strengthened margins. One such pricing initiative was the oil-based raw material surcharge initiated May 1, 2011 at Truseal, one of the Company's insulating glass spacer operations. The surcharge helped Truseal offset the higher cost of butyl, a key raw material of the business that is highly correlated to the price of oil. Fiscal 2012 margins were negatively impacted by customer mix and additional freight costs incurred to ship spacer product overseas to support the increase in international demand. In 2011, Quanex consolidated buildings in Kent, Washington and closed a facility in The Dalles, Oregon. Of the $2.8 million in 2011 plant consolidation costs, $1.3 million is recognized in Cost of sales benefiting the margin comparison. Fiscal year 2012 includes a warranty benefit of $0.8 million from a change in warranty estimate for pre-existing warranties due to a decline in claims experience. The year ended October 31, 2011 reflects a $1.9 million charge to increase the warranty reserve estimate associated with a legacy product that Quanex discontinued some years ago, which also contributed to the year over year improvement in margins. Because the establishment of the warranty reserve is an inherently uncertain process involving estimates of the number of future claims and the cost to settle claims, the Company's ultimate losses may differ from the warranty reserve and future adjustments to the reserve may be necessary. Finally, 2011 results were negatively impacted by $1.9 million of additional non-cash Cost of goods sold during 2011 due to the increased value of inventory sold from applying purchase accounting to the Edgetech inventory acquired.
Net sales less Cost of sales (Contribution margin) at Engineered Products for 2011 compared to 2010 improved by $11.9 million including Edgetech's contribution of $13.4 million. Net sales less Cost of sales as a percent of Net sales for the year ended October 31, 2011 are slightly below the same 2010 period due to higher raw material costs and temporary increases in labor expense as the Company used overtime to meet a hike in orders in November and December; additionally, the first fiscal quarter of 2010 benefited from hourly labor savings associated with the strike at the segment's Barbourville, Kentucky facility in mid-December 2009. Although Engineered Products experienced higher raw material costs in 2011, these higher costs were generally offset by higher prices, the oil-based raw material surcharge, cost controls and productivity improvements, which strengthened margins. Further reducing contribution margins during 2011 was the aforementioned $1.3 million of plant consolidation costs, the $1.9 million warranty expense, and $1.9 million of purchase accounting costs recognized in Cost of sales
Selling, general and administrative costs for the full fiscal year of 2012 were higher than fiscal 2011 due to the IG spacer consolidation project, a full twelve months of expense associated with the Edgetech acquisition, and increased incentive wages . On November 7, 2011, the Company announced a consolidation program for its IG spacer manufacturing facility in Barbourville, Kentucky into its IG spacer manufacturing facility in Cambridge, Ohio. The facility consolidation was completed ahead of schedule in August 2012 , and the Barbourville facility is permanently closed. Total cash spending associated with the consolidation plan was approximately $15.0 million (excludes a pre-tax, non-cash impairment charge of $1.6 million taken in the fourth quarter 2011). Of the $15.0 million of cash, total expenses (to be recognized in Selling, general and administrative costs) were $9.0 million for the project, comprised of $3.4 million for employee-related costs and $5.6 million for plant closure, equipment moving and set up costs, substantially all of which will be charged to Selling, general and administrative expense. The Company expects an estimated annual pre-tax cash savings of $8.0 million to begin in fiscal 2013. Selling, general and administrative costs increased by $17.6 million for fiscal 2012 compared to fiscal 2011, primarily due to more plant consolidation expenses in fiscal 2012 compared to fiscal 2011. The fiscal year 2012 Selling, general and administrative costs include expenses of $9.0 million associated with the Company's IG spacer consolidation program compared to $1.1 million (included in the total $2.8 million discussed above) of costs associated with the aforementioned plant consolidations and closing during the first fiscal quarter of 2011. The majority of the $1.1 million represents an estimated liability to terminate a facility operating lease; this estimated liability is net of an
30
Table of Contents
associated sublease benefit. Also, fiscal 2012 Selling, general and administrative costs are higher than 2011 from the acquisition of Edgetech in 2011, which contributed $6.3 million of the higher expenses. In March 2012, a portion of the roof collapsed at the Barbourville, Kentucky facility due to extreme weather. Customers had minimal service interruption as the clean-up activities were well executed and equipment moves to Cambridge were expedited. The Company did experience inefficiencies from the accelerated move and incurred costs of $1.4 million associated with the roof collapse, including business interruption costs. The Company received a $2.4 million insurance recovery resulting in a net gain of $1.0 million primarily associated with insurance proceeds received on property and equipment that had been previously depreciated or impaired.
Selling, general and administrative costs increased by $8.7 million during fiscal 2011 compared to the prior year from the 2011 acquisition of Edgetech which reported $9.0 million of Selling, general and administrative costs for 2011. Additionally, the increase in Selling, general and administrative costs for the year were attributable to $1.1 million (included in the total $2.8 million discussed above) of costs associated with the aforementioned plant consolidations and closing during the first fiscal quarter of 2011. Furthermore, Engineered Products incurred additional sales and marketing expenses of $1.8 million in 2011 associated with the roll out of new products and programs and increasing resources necessary to achieve long-term organic growth, with a focus on expanding further into the regional segment of the residential market. Benefiting the comparative 2011 results is $1.0 million of costs associated with the aforementioned strike in mid December 2009 (partially offset by the direct labor savings in Cost of sales) as well as reduced incentives corresponding to lower earnings.
The Company recorded $0.9 million of impairment charges in fiscal 2012 of which $0.6 million relates to the Barbourville roof and building. The Company initially recorded a $1.6 million non-cash asset impairment charge on its Barbourville, Kentucky real property during the fourth quarter of fiscal 2011 related to its plan to consolidate its insulating glass operations.
Depreciation and amortization increased for fiscal 2012 compared to 2011 and in 2011 compared to 2010 primarily due to the acquisition of Edgetech on March 31, 2011. In fiscal 2012, Edgetech had a full year of expense and contributed $3.4 million higher depreciation and amortization over 2011. In fiscal 2011, Edgetech incurred $4.8 million (seven months) in deprecation and amortization. Partially offsetting the increase for the year ended ended October 31, 2012 compared to 2011 was $0.3 million (included in the $2.8 million discussed above) of accelerated depreciation related to the plant consolidations recognized in the first quarter of 2011.
Engineered Products' fiscal 2012 operating income declined compared to 2011 by $1.8 million. While the 2012 results benefited from the increase in vinyl extrusion sales and favorable changes in warranty estimates, the 2012 reported results and margins were negatively impacted by the aforementioned IG spacer consolidation program as well as the Company's start up spacer facility in Germany and reduced higher margin non-fenestration IG sales. Fiscal 2012 saw $9.0 million in IG consolidation expense compared to $2.8 million of combined facility consolidation in 2011. The Company continues to believe that investments in growth opportunities like its Germany facility and plant consolidations like the IG consolidation program will have long-term benefits that will outweigh these current year costs and lead to revenue growth and margin improvements in future years.
Operating income for fiscal 2011 was down by $4.0 million of which $0.3 million is attributable to the Edgetech operating loss since acquisition in 2011. Operating income for the remaining Engineered Products businesses for fiscal 2011 was below prior year levels primarily due to weak end markets and rising material costs as well as negative impacts from current year costs to consolidate facilities, warranty expense associated with legacy products and incremental sales and marketing investment to support Engineered Products' organic growth initiatives. The fiscal 2011 Edgetech operating loss was driven by production start up costs at its Germany facility as well as inventory step up expenses from acquisition accounting.
Fiscal 2012 comparable Net sales increased 6%, during fiscal 2012 compared to 2011 from the strong performance of vinyl fenestration extrusions and increased international spacer sales. Engineered Products' long-term organic growth programs are focused on driving profitable growth through a single sales and marketing team that is intensely focused on driving continuous improvement of customer satisfaction. The Company believes this will drive profitable growth at Engineered Products by furthering the goal of becoming the leading energy efficiency expert in the market by offering customers state-of-the-art engineering, design and marketing support. While the Company believes that it is competitively strong in its energy efficient product offerings, the higher price points often associated with these higher-end products may limit sales volumes in these times of tight credit conditions and low consumer confidence. Engineered Products is in the early stages of its long-term organic growth initiatives but believes they will have a meaningful impact on its long-term growth and profitability.
Aluminum Sheet Products – Three Years Ended October 31, 2012
The following table sets forth selected operating data for the Aluminum Sheet Products segment:
31
Table of Contents
| Years Ended October 31, |
| % Change | ||||||||||||||
(Dollars in millions) |
| 2012 vs. |
| 2011 vs. | |||||||||||||
2012 |
| 2011 |
| 2010 |
|
| |||||||||||
Net sales | $ | 362.3 | |
| $ | 440.5 | |
| $ | 449.5 | |
| (17.8 | )% |
| (2.0 | )% |
Cost of sales (1) | 361.6 | |
| 406.8 | |
| 401.1 | |
| (11.1 | ) |
| 1.4 | | |||
Selling, general and administrative | 10.2 | |
| 8.1 | |
| 9.9 | |
| 25.9 | |
| (18.2 | ) | |||
Asset impairment charges | - | |
| - | |
| - | |
| - | |
| - | | |||
Depreciation and amortization | 7.6 | |
| 8.5 | |
| 8.3 | |
| (10.6 | ) |
| 2.4 | | |||
Operating income (loss) | $ | (17.1 | ) |
| $ | 17.1 | |
| $ | 30.2 | |
| (200.0 | )% |
| (43.4 | )% |
Operating income (loss) margin | (4.7 | )% |
| 3.9 | % |
| 6.7 | % |
| (8.6 | )% |
| (2.8 | )% | |||
Shipped pounds | 252.6 | |
| 277.3 | |
| 322.6 | |
| (8.9 | )% |
| (14.0 | )% | |||
(1) | Exclusive of items shown separately below. |
The primary market drivers for the Aluminum Sheet Products segment are residential repair and remodel activity and new home construction (together approximately 77% of the segment's sales) and transportation (approximately 7.0% of the segment's sales) markets.
Fiscal 2012 was one of the most challenging years in Nichols' history. The Aluminum Sheet Products segment started fiscal 2012 off poorly with quality issues at the Alabama paint facility and weak demand as customers destocked inventory. Then, on January 20, 2012, Nichols Aluminum experienced a strike by about 240 bargaining unit employees at its two facilities located in Davenport, Iowa. During the second quarter, Nichols offered permanent positions to the approximately 100 temporary employees it hired since the strike began, and the majority of those employees accepted a full time position. Shortly after that action, the union ended its strike. A new five-year agreement was eventually ratified in September 2012. Fiscal 2012 was negatively impacted by this strike which resulted in direct strike related losses coupled with additional inefficiencies that were experienced even after the strike ended in April but prior to the ratification of the new agreement. Another significant contributing factor to the operating income decline was the reduced spread realized that was generally the result of lower global London Metal Exchange (LME) aluminum prices in fiscal 2012 as compared to fiscal 2011.
The decrease in net sales at the Aluminum Sheet Products segment for fiscal 2012 was the result of an 8.9% decrease in shipments and a 9.7% decrease in average selling price compared to fiscal 2011. Shipments were down 24.6 million pounds in 2012 from 2011 due to 1) reduced production related to the second quarter strike 2) reliability and quality issues and 3) weaker end demand experienced early in the fiscal year from the absence of the window tax credit program compared to the available program in 2011. The Company estimates that approximately one half of the fiscal year's volume decline is attributable to the strike. The Aluminum Association, which tracks aluminum industry shipments of sheet products, reported non-can sheet aluminum shipments during fiscal 2012 were up 8.6% from a year ago, while Aluminum Sheet Products' shipments were down. Nichols underperformance is primarily attributed to the impact of the strike as well as facility performance issues and relatively weaker residential demand, where it has a large presence, compared to relatively stronger distribution and transportation demand, where it has a smaller presence. Average selling price decreased primarily due to lower LME aluminum prices in the comparative periods. LME aluminum prices are the most commonly used index for correlating aluminum sheet prices and have averaged around 95 cents per pound in fiscal 2012 compared to about $1.10 per pound in the prior year.
Net sales were negatively impacted by a decline in shipped pounds of 14.0% for the 2011 year compared to the same period of 2010 due to weaker demand for building and construction sheet. The Aluminum Association reported non-can sheet aluminum shipments for year-to-date October up 2% from the prior year, while Aluminum Sheet Products' shipments were down 14.0%. Part of the Company's underperformance versus the industry can be attributed to relatively weaker building and construction demand compared to stronger distribution and transportation demand. This decrease in Net sales at the Aluminum Sheet Products segment for 2011 was partially offset by a 14.0% increase in average selling price per pound compared to 2010. Average selling price increased primarily due to higher LME aluminum prices in the comparative period.
Selling, general and administrative costs increased by $2.1 million for fiscal 2012 compared to 2011 primarily due to $1.0 million of strike expenses as well as employee related expenses incurred during 2012. The strike costs are directly associated with the negotiating activities themselves and include such items as legal fees and security. Selling, general and administrative costs decreased by $1.8 million for 2011 compared to 2010. The decrease in expense is primarily due to a $1.0 million expense in 2010 associated with the discontinuation of a new Microsoft Dynamics AX enterprise resource planning system for the segment, a $0.8 million decline in environmental related expense, and to a lesser extent a decrease in variable pay incentives associated with a lower level of earnings in 2011. For additional information on the environmental reserve, see Note 16, "Contingencies"
32
Table of Contents
in the Notes to Consolidated Financial Statements in Item 8 of this Form 10-K.
Depreciation and amortization has declined for fiscal 2012 compared to the same 2011 period primarily due to equipment reaching the end of its depreciable life and accelerated depreciation during the first quarter of fiscal 2011 related to the reduction of an asset's remaining useful life.
Operating income decreased at the Aluminum Sheet Products segment for fiscal 2012, compared to the prior year due to reduced volume, higher costs associated with purchasing semi-finished aluminum coils from third parties, higher conversion costs associated with the processing of semi-finished coils into finished sheet, and the impact of a lower spread (sales less material costs) associated with a general reduction in LME aluminum prices. Additionally, repair and maintenance expenses were $1.8 million higher in fiscal 2012 than 2011 as the business incurred various equipment outages during the year and also used more outside contractors for repairs than in prior years. While the reduced shipments impacted the results for the year, the decline in aluminum spread, which is calculated as the difference between the average sales price and the average raw material cost, negatively impacted the year over year results. Spread declined by 17% in fiscal 2012 compared to 2011. The segment's operating income and margins are impacted by changes in LME aluminum prices as its spread is correlated with aluminum prices over time. Declines in aluminum prices generally result in spread compression; however, as aluminum prices rebound, spread and profits generally expand. With LME aluminum prices averaging around 95 cents per pound (a 14% drop from a year ago), and without a corresponding decline in aluminum scrap costs, Nichols' spread in 2012 has been dramatically reduced from last year. This means that aluminum scrap costs are expensive relative to the LME price of aluminum. Also, in an attempt to meet improving demand, Nichols purchased semi-finished aluminum coils from third parties to help make up for reduced casting capacity from the strike. Third party coils are expensive relative to Nichols' internal cost of production, and third party coils require additional finishing. Nichols is a high fixed cost business, so as its shipments drop, its ability to substantially reduce operating costs is limited. In fiscal 2012, estimated direct expenses associated with the strike were approximately $7 million and the volume related operating income impact in the second quarter 2012 (and impacting fiscal 2012 results) is estimated at about $4 million for total strike related expenses of $11 million. The net direct expenses of $7 million for fiscal 2012 represent the aforementioned costs associated with the purchase of semi-finished aluminum coils from third parties and to a lesser extent include outside maintenance, legal fees, security costs and incremental expenses associated with the salary workforce that stepped in to continue to keep the two facilities operating; estimated labor savings are included as a benefit in the net direct expenses figure. Although the strike hurt the 2012 results, Quanex believes the outcome has improved the competitiveness of the Nichols business and will benefit the overall long-term position of the Company.
Operating income decreased at the Aluminum Sheet Products segment for 2011, compared to prior year due to lower shipped pounds and to a lesser extent lower painted sales. The Aluminum Sheet Products segment is a high fixed cost business, so as shipments drop due to weaker demand, its ability to substantially reduce operating costs is limited. Operating income was further impacted by high repair and maintenance expenses and to a lesser extent by higher energy costs and higher freight costs. Repair and maintenance expense in 2011 increased by $3.8 million over the same 2010 period in part due to projects that were previously deferred in prior years. This decline in operating income was partially offset by an 8.6% increase in spread (sales price less material costs). The higher spread compared to the previous year was primarily a result of higher aluminum prices that rose faster than material costs.
Corporate and Other – Three Years Ended October 31, 2012
| Years Ended October 31, |
| $ Change | ||||||||||||||||
| (Dollars in millions) |
| 2012 vs. |
| 2011 vs. | ||||||||||||||
| 2012 |
| 2011 |
| 2010 |
|
| ||||||||||||
Net sales | $ | (11.9 | ) |
| $ | (12.5 | ) |
| $ | (12.3 | ) |
| $ | 0.6 | |
| $ | (0.2 | ) |
Cost of sales (1) | (13.3 | ) |
| (9.6 | ) |
| (8.0 | ) |
| (3.7 | ) |
| (1.6 | ) | |||||
Selling, general and administrative | 35.8 | |
| 27.9 | |
| 22.8 | |
| 7.9 | |
| 5.1 | | |||||
Depreciation and amortization | 2.0 | |
| 0.1 | |
| 0.1 | |
| 1.9 | |
| - | | |||||
Operating income (loss) | $ | (36.4 | ) |
| $ | (30.9 | ) |
| $ | (27.2 | ) |
| $ | (5.5 | ) |
| $ | (3.7 | ) |
(1) | Exclusive of items shown separately below. |
Corporate and Other operating expenses, which are not in the segments mentioned above, include inter-segment eliminations, the consolidated LIFO inventory adjustments (calculated on a combined pool basis), corporate office expenses and Quanex-wide program expenses such as a company-wide ERP project. Net sales amounts represent intersegment eliminations between the Engineered Products segment and the Aluminum Sheet Products segment with an equal and offsetting elimination in
33
Table of Contents
Cost of sales. LIFO adjustments are reported in Corporate Cost of sales. The Company incurred LIFO income of $1.7 million in fiscal 2012 and LIFO expense of $2.3 million and $3.8 million in fiscal 2011 and fiscal year 2010, respectively. LIFO income was incurred in fiscal 2012 primarily due to a fall in pricing of aluminum while LIFO expense was incurred in fiscal 2011 and 2010 primarily due to a rise in pricing of aluminum based inventory held by the Company at year-end. Fluctuations associated with the LIFO inventory adjustment comprise a majority of the change from year to year in the Corporate and Other Net sales less Cost of sales.
Corporate Selling, general and administrative costs increased by $7.9 million for fiscal 2012 compared to 2011. The Company initiated a company-wide ERP project (Project Quest) in 2011 to support the drive for long-term organic growth by bringing the myriad of disparate systems currently existing throughout the Company together into a single standard system supported by a common set of processes. The current plan anticipates the conversion of all of the Company's disparate systems to a single system. Due to a full year of activity in fiscal 2012, expenses associated with the development of Project Quest increased by $3.9 million compared to 2011. Project Quest costs recognized in Selling, general and administrative expenses during fiscal 2012 and fiscal 2011 were $5.5 million and $1.5 million , respectively. Project Quest expenses will continue in preparation for conversion of the legacy systems. The initial system conversion is anticipated in fiscal 2013. While specific project costs will decline as Quanex migrates to this single platform over these next few years, the Company has incurred and will incur technology infrastructure and support costs. Mark-to-market expense associated with the Company's deferred compensation plan increased by $1.6 million during fiscal 2012 compared to 2011, reflecting an increase in the the Company's stock price as well as the market value of other investments held by the deferred compensation plan during fiscal 2012 compared to a decline in 2011. Approximately 46% of the deferred compensation plan balance is indexed to the Company's stock price, and the Quanex stock price increased by $5.02 per share for fiscal 2012 compared to a decrease of $3.27 per share during 2011. Corporate general and administrative costs also increased in fiscal 2012 due to increased personnel related costs in support of the Company's strategic and operational initiatives, including an increase in incentives as incentive payments were relatively low in 2011. Transaction related costs associated with the acquisition of Edgetech during fiscal 2011 partially offset the higher Project Quest, mark to market costs, and personnel related costs in 2012. Included in the results for fiscal 2011, were $4.1 million of transaction and related integration costs with little costs in 2012.
Project Quest depreciation expense of $1.5 million was incurred for fiscal 2012 in conjunction with the 2012 implementation of the human capital management module of the ERP system. As the new ERP system is placed in service (replacing the legacy systems) the Company expects depreciation expense to increase.
Selling, general and administrative costs increased by $5.1 million for fiscal 2011 over fiscal 2010. The single largest reason for the increase is $4.1 million of transaction and integration related costs associated with the acquisition of Edgetech during fiscal 2011. Also increasing Selling, general and administrative costs are those costs associated with the development and rollout of Project Quest. During fiscal 2011, the Company recognized $1.5 million of Project Quest expense. Fiscal 2011 Selling, general, and administrative expense includes a $1.0 million increase in estimated workers compensation self-insurance reserves partially associated with higher open claims with limited development experience. Selling, general and administrative costs in 2011 also reflect various other programs including lean six sigma employee training that the Company believes will result in future cost savings. Partially offsetting these increases was a $1.5 million decline during fiscal 2011 in mark-to-market expense associated with the deferred compensation plan reflecting the decrease in the Company's stock price as well as the market value of other investments held by the deferred compensation plan during the 2011 period. As of October 31, 2011, approximately 47% of the deferred compensation plan balance was indexed to the Company's stock price, and the Quanex stock price decreased by $3.27 per share during fiscal 2011 compared to an increase of $3.15 per share during fiscal 2010. Additionally, Selling, general and administrative costs have declined in 2011 from lower estimated variable pay incentive costs corresponding to the Company's lower earnings.
Other Items – Three Years Ended October 31, 2012
Interest expense for fiscal 2012, 2011 and 2010 remained flat at $0.4 million for each year. No amounts were borrowed against the revolving credit facility during fiscal 2012, 2011, and 2010. Interest expense could increase slightly in future years depending on the terms of the anticipated new Credit Facility.
Other, net typically includes interest income earned on the Company's cash and equivalents and beginning with the acquisition of Edgetech in March 2011 foreign currency transaction gains and losses.
For fiscal 2012, other income increased by $0.7 million, primarily due to a decline in net foreign currency transaction losses of $0.9 million compared to 2011, Other, net for fiscal 2011 was a loss of $0.5 million compared to income of $2.6 million in fiscal 2010. During fiscal 2011, the Company incurred $0.9 million of transaction losses which are included in determining net income primarily related to Edgetech's international operations and foreign currency denominated receivables. There are no transaction gains or losses during the fiscal 2010. Other, net for fiscal 2010 includes the recognition of a $0.9 million gain on involuntary conversion of a non-monetary asset related to the May 2009 tornado that struck and damaged the Company's Mikron
34
Table of Contents
facility in Richmond, Kentucky. Additionally, fiscal 2010 included a $1.3 million bargain purchase gain related to an acquisition during the second fiscal quarter of 2010. In February 2010, the Company completed a small acquisition for approximately $1.6 million in consideration. The acquisition was effected through an asset purchase through a receivership proceeding and no liabilities were assumed. ASC 805 " Business Combinations " requires that a gain be recorded when the fair value of the net assets acquired is greater than the fair value of the consideration transferred. Though uncommon, bargain purchases can occur because of underpayments for the business acquired due to a forced liquidation or distress sale. As such, the Company obtained the assets at a bargain and recognized a gain of approximately $1.3 million in Other, net.
The Company's annual effective tax rate for fiscal 2012 was 34.3% compared to 41.5% in fiscal 2011 and 38.7% in fiscal 2010 . The decrease in the 2012 tax rate benefit is primarily attributable to a state valuation allowance and nondeductible employee related items in the current year. The effective rate in 2011 increased primarily due to nondeductible transaction costs in 2011 and the mix of domestic and foreign results partially offset by general business credits.
Income from discontinued operations, net of tax was $12 thousand for fiscal 2011 and a loss of $1.1 million for fiscal 2010 and represents the results of the Truseal China business.
Liquidity and Capital Resources
Sources of Funds
The Company's principal sources of funds are cash on hand, cash flow from operations, and borrowings under its $270.0 million Senior Unsecured Revolving Credit Facility (the Credit Facility). As of October 31, 2012 , the Company has a solid liquidity position, comprised of cash and equivalents and adequate availability under the Company's Credit Facility. The Company has $71.3 million of cash and equivalents, $102.6 million of current availability under the revolving credit facility and minimal debt of $1.4 million as of October 31, 2012 . Cash equivalents for the year ended October 31, 2012 decreased by $18.4 million to $71.3 million . The Company used cash on hand during fiscal 2012 as well as cash flow from operations for planned capital expenditures, the planned IG spacer consolidation project and the Nichols strike. Again in 2012, Quanex has self-funded its activities as the Company has never borrowed cash on its Credit Facility even during these challenging economic times and even after spending $110.8 million of cash on acquisitions in fiscal 2011. The Company's strategy for cash uses is to invest in organic growth opportunities, its infrastructure and its facilities and to make strategic acquisitions that fit its fenestration vision. Other uses of cash include funding the common stock cash dividend and buying back Quanex stock
The Company's excess cash and equivalents are invested only in large, overnight money market funds due to the conditions of the financial market. The funds are diversified by security type across Treasuries, Government Agencies and Prime Corporate. These funds are all AAA-rated, approved by the NAIC and compliant with Rule 2A-7 of the Investment Company Act of 1940. The Company's current investments are diversified across multiple institutions that the Company believes to be financially sound. The Company intends to remain in highly rated money market funds, financial institutions and treasuries following a prudent investment philosophy. From time to time, to prepare for potential disruption in the money markets, the Company may temporarily move funds into operating bank accounts of highly-rated financial institutions to meet on-going operational liquidity requirements. The Company had no material losses on its cash and marketable securities investments.
The Credit Facility was executed on April 23, 2008 and has a five-year term. Proceeds from the Credit Facility may be used to provide availability for acquisitions, working capital, capital expenditures, and general corporate purposes. Borrowings under the Credit Facility bear interest at a spread above LIBOR based on a combined leverage and ratings grid. There are certain limitations on additional indebtedness, asset or equity sales, and acquisitions. Dividends and other distributions are permitted so long as after giving effect to such dividend or stock repurchase, there is no event of default. Under the Credit Facility, the Company is obligated to comply with certain financial covenants requiring the Company to maintain a Consolidated Leverage Ratio of no more than 3.25 to 1 and a Consolidated Interest Coverage Ratio of no less than 3.00 to 1. As defined by the indenture, the Consolidated Leverage Ratio is the ratio of consolidated indebtedness as of such date to consolidated EBITDA (Earnings Before Interest, Taxes, Depreciation and Amortization) for the previous four fiscal quarters, and the Consolidated Interest Coverage Ratio is the ratio of consolidated EBITDA to consolidated interest expense, in each case for the previous four consecutive fiscal quarters. EBITDA is defined by the indenture to include proforma EBITDA of acquisitions and to exclude certain items like goodwill and intangible asset impairments and certain other non-cash charges and non-recurring items. The availability under the Credit Facility is a function of both the facility amount utilized and meeting covenant requirements. Additionally, the availability of the Credit Facility is dependent upon the financial viability of the Company's lenders. The Credit Facility is funded by a syndicate of nine banks, with three banks comprising over 55% of the commitment. If any of the banks in the syndicate were unable to perform on their commitments to fund the facility, the availability under the Credit Facility could be reduced; however, the Company has no reason to believe that such liquidity will be unavailable or decreased. Quanex is currently in the process of negotiating a new Credit Facility, and expects to have finalized terms and conditions by the end of the first quarter.
35
Table of Contents
As of October 31, 2012 , the Company had no borrowings under the Credit Facility, and the Company was in compliance with all Credit Facility covenants as seen by the table below:
At October 31, 2012 |
| Required |
| Actual |
Consolidated Interest Coverage Ratio |
| No less than 3.00 to 1 |
| 74.52 to 1 |
Consolidated Leverage Ratio |
| No more than 3.25 to 1 |
| 0.22 to 1 |
Although there were no borrowings on the Credit Facility and there was only $5.5 million of outstanding letters of credit under the Credit Facility, the aggregate availability under the Credit Facility was limited by the Consolidated Leverage Ratio resulting in an availability of $102.6 million at October 31, 2012 . Because the Consolidated Leverage Ratio is based on a rolling twelve months of EBITDA, a change in future earnings will impact the amount available under the Credit Facility in future quarters, absent any pro-forma EBITDA benefit from any potential acquisitions. To have access to the full availability of the $270.0 million Credit Facility, the Company must have a minimum rolling EBITDA of $84 million for the previous four fiscal quarters. Actual rolling EBITDA for the previous four fiscal quarters was $33.8 million as of October 31, 2012 . Increased earnings for any future periods could increase availability under the Credit Facility; conversely, reduced earnings for any future periods could adversely impact the amount available under the Credit Facility in future quarters, absent any pro-forma EBITDA benefit from any potential acquisitions.
The Company believes that it has sufficient funds and adequate financial resources available to meet its anticipated liquidity needs. The Company also believes that cash balances and cash flow from operations will be sufficient in the next twelve months and foreseeable future to finance anticipated working capital requirements, capital expenditures, debt service requirements, environmental expenditures, and dividends.
The Company's working capital was $123.1 million on October 31, 2012 compared to $140.3 million on October 31, 2011 . Working capital declined by $17.2 million from a reduction in cash and equivalents primarily related to capital expenditures. Conversion capital (accounts receivable plus inventory less accounts payable) of $71million was flat at October 31, 2012 compared to prior year. Within conversion capital, accounts payable increased $14.6 million in support of increased inventory of $10.0 million.
The following table summarizes the Company's cash flow results from continuing operations for fiscal years 2012 , 2011 and 2010 :
| Years ended October 31, | ||||||||||
| 2012 |
| 2011 |
| 2010 | ||||||
| (In millions) | ||||||||||
Cash flows from operating activities | $ | 26.5 | |
| $ | 52.9 | |
| $ | 89.6 | |
Cash flows from investing activities | (41.7 | ) |
| (135.4 | ) |
| (15.9 | ) | |||
Cash flows from financing activities | (3.9 | ) |
| (14.9 | ) |
| (10.0 | ) | |||
Highlights from the Company's cash flow results for the fiscal years ended 2012 , 2011 and 2010 are as follows:
Operating Activities – Continuing Operations
Cash provided from operating activities from continuing operations for fiscal 2012 decreased by $26.4 million compared to fiscal 2011. Lower cash provided by operating activities is primarily attributable to reduced earnings in 2012, including strike related expenditures; $8.7 million of IG spacer consolidation payments made during fiscal 2012; and a $2.3 million increase in pension contributions. Net conversion capital activity was essentially zero in both fiscal 2012 and fiscal 2011. Quanex remitted a total of $3.5 million relating to reorganization taxes assumed in the Edgetech acquisition, of which $2.8 million was paid in fiscal 2011 and the remaining $0.7 million was paid during fiscal 2012. In addition to the Edgetech related tax, the Company paid $0.5 million in taxes in fiscal 2012, The Company expects to contribute approximately $3.3 million to its pension plan in fiscal 2013. The IG consolidation project is complete and accordingly Quanex does not expect any significant project expenditures in fiscal 2013 other than minimal residual payments. Despite the continued weak condition of the Company's primary end markets, the Nichols strike and the planned IG spacer consolidation, Quanex generated cash flow from operating activities of $26.5 million during fiscal 2012.
36
Table of Contents
Cash provided by operating activities from continuing operations during fiscal 2011 compared to fiscal 2010 declined by $36.7 million . This decline is primarily attributable to reduced income in fiscal 2011 due to acquisition related costs, lower aluminum sheet shipments, and higher maintenance costs at Aluminum Sheet Product. Also, the decline resulted from higher costs at Engineered Products associated with rationalizing operations, incremental sales and marketing costs as the Company invested in long-term organic growth initiatives, and higher raw material costs. Additionally, during fiscal 2010, the Company received a federal income tax refund of $11.4 million. In fiscal 2011, the Company did not receive a tax refund coupled with the remittance of $2.8 million (of the total estimated $3.5 million) associated with reorganization taxes assumed in the Edgetech acquisition. Partially offsetting these cash flow declines is a $3.5 million reduction in pension contributions in fiscal 2011 compared to fiscal 2010. The Company contributed approximately $5.3 million to its pension plan during fiscal 2010 in an effort to target a 100% funding threshold while the 2011 contribution amounted to $1.9 million.
Investing Activities – Continuing Operations
Cash used in investing activities from continuing operations during fiscal 2012, declined $93.7 million compared to fiscal 2011 while fiscal 2011 spending was $119.5 million over fiscal 2010 levels. The high investing expenditures in fiscal 2011 and resulting variation from year to year is attributable to the Company's acquisition activity in fiscal 2011 whereby Quanex spent $104.4 million to acquire Edgetech and $6.4 million to acquire JELD-WEN's vinyl extrusion assets in Yakima, Washington.
Capital expenditures for fiscal years 2012 , 2011 and 2010 were $42.9 million , $25.3 million and $14.7 million , respectively. Capital spending increased by $17.6 million during fiscal 2012 compared to fiscal 2011 and increased by $10.6 million in fiscal 2011 over fiscal 2010. To date, the Company has spent $19.4 million in capital on the rollout of its company-wide ERP system (Project Quest), initiated in March 2011; in fiscal 2012, the Company incurred $14.5 million associated with Project Quest compared to $4.9 million during fiscal 2011, with the increase attributable to a full year of project activities in fiscal 2012. The current plan anticipates the conversion of all of the Company's disparate systems to a single system over a period of at least three years with the first conversion anticipated in fiscal 2013. The Company expects additional Project Quest capital spending through such time as its larger operations are converted to the new system. Additionally, in fiscal 2012, the Company incurred capital expenditures of $6.3 million related to its IG spacer consolidation program initiated in fiscal 2012 and completed in the fourth fiscal quarter of 2012. The additional increase in spending relates to organic growth initiatives including capital to support new product development as well as spending on previously deferred projects. Fiscal 2011 includes capital spending related to Edgetech of $2.3 million which was the first year of Quanex ownership while fiscal 2012 includes $1.1 million of capital related insurance proceeds associated with the Barbourville roof collapse.
At October 31, 2012, the Company had commitments of approximately $7.2 million for the purchase or construction of capital assets. The Company plans to fund these capital expenditures through current cash and equivalents. The Company expects 2013 capital expenditures to approximate $40 million , which includes spending associated with Project Quest. While the IG consolidation capital expenditures will not continue in 2013, Quanex intends to increase its capital spending in its aluminum sheet facilities. During the fourth quarter, the Company completed installation of a new $1.5 million annealing furnace that will help improve throughput at one of the finishing facilities. In the second fiscal quarter of 2013, Quanex expects to replace the paint oven in its Alabama facility. Over the past five years, capital expenditures at the Aluminum Sheet Products facilities have averaged approximately $7 million. Quanex expects Nichols capital expenditures to increase to a range of $10 million to $13 million over the next few years which the Company believes will improve quality and reliability. The Company plans to fund these capital expenditures through cash flow from operations.
On December 17, 2012, the Company announced the signing of a definitive agreement to acquire the assets of Alumco, Inc. and its subsidiaries in an all cash transaction, expected to close during the first fiscal quarter of 2013. The assets to be purchased include Aluminite, a screen producer for the window and door industry. This acquisition will not be deemed to involve a significant amount of assets, and cash on hand will be used for the purchase price.
Financing Activities – Continuing Operations
Quanex spent $3.9 million , $14.9 million and $10.0 million in cash from financing activities from continuing operations in fiscal years 2012 , 2011 and 2010 , respectively. The Company spent $8.8 million less on purchases of Quanex common stock in 2012 compared to 2011 and received $2.4 million less from stock option exercises during fiscal 2012 compared to the prior year. The $4.9 million increase in cash spending from financing activities during 2011 compared to 2010 was primarily the result of the Company's stock repurchase program and to a lesser extent an increase in the cash dividend in mid fiscal 2010 . This increase in spending was partially offset by more proceeds from stock option exercises of $0.6 million. During fiscal 2012, Quanex purchased 94,337 shares of common stock compared to 750,000 shares and 250,000 shares during fiscal 2011 and fiscal 2010 , respectively. In fiscal 2012 and 2011 the Company paid quarterly dividends totaling $0.16 per common share compared to fiscal
37
Table of Contents
2010 dividends at $0.14 per common share, with shares outstanding remaining relatively flat. The Company increased its quarterly cash dividend in May 2010 by 33% to $0.04 per share from $0.03 per share.
Discontinued Operations
Cash flows from discontinued operations represent results related to the Company's start-up facility in China that was closed in fiscal year 2010 . Residual 2011 cash flows represent wind-up activities, including repayment by the China facility (discontinued cash outflow) to its Quanex parent (offsetting financing cash inflow in continuing operations).
Debt Structure and Activity
Refer to Item 8, Note 10 "Long-Term Debt and Financing Arrangements" for a discussion of the Company's debt structure.
Contractual Obligations and Commercial Commitments
Contractual Obligations
The following tables set forth certain information concerning the Company's unconditional obligations and commitments to make future payments under contracts with remaining terms in excess of one year, such as debt and lease agreements, and under contingent commitments.
Payments Due by Period | |||||||||||||||||||
Contractual Obligations | Total |
| Less than 1 Year |
| 1-3 Years |
| 3-5 Years |
| More Than 5 Years | ||||||||||
| (In thousands) | ||||||||||||||||||
Long-term debt, including interest (1) | $ | 1,430 | |
| $ | 378 | |
| $ | 518 | |
| $ | 220 | |
| $ | 314 | |
Operating leases (2) | $ | 32,117 | |
| 5,808 | |
| 10,156 | |
| 6,146 | |
| 10,007 | | ||||
Unconditional purchase obligations (3) | $ | 4,444 | |
| 4,148 | |
| 296 | |
| - | |
| - | | ||||
Total contractual cash obligations (4) | $ | 37,991 | |
| $ | 10,334 | |
| $ | 10,970 | |
| $ | 6,366 | |
| $ | 10,321 | |
(1) | The debt interest amounts are based on rates as of October 31, 2012 . |
(2) | Operating leases cover a range of items from facilities and fork lift trucks to fax machines and other miscellaneous equipment. |
(3) | The unconditional purchase obligations are made up of gas supply agreements and $4.3 million of scrap aluminum purchases. |
(4) | The above table excludes reserves recorded in accordance with ASC Topic 740 " Income Taxes ," as the Company is unable to reasonably estimate the timing of future cash flows related to these reserves. For additional information see Note 9, "Income Taxes," in the Notes to Consolidated Financial Statements in Item 8 of this Form 10-K. |
During fiscal 2013 , the Company expects to contribute approximately $3.3 million to the pension plan to continue to target a 100% funding threshold and meet minimum contribution requirements. Pension contributions beyond 2013 are not determinable since the amount of any contribution is heavily dependent on the future economic environment and investment returns on pension plan assets. Obligations to these plans are based on current and projected obligations of the plans, performance of the plan assets, if applicable, and any participant contributions. Refer to Note 11 of Item 8 to the Consolidated Financial Statements for further information on these plans. Management believes the effect of the plans on liquidity is not significant to the Company's overall financial condition.
The timing of payments related to the Company's Supplemental Benefit Plan and Deferred Compensation Plan cannot be readily determined due to their uncertainty. The Supplemental Benefit Plan liability of $2.5 million at October 31, 2012 was recorded as part of Other (non-current) liabilities. Based on the $5.9 million market value of the Company's Deferred Compensation Plan, payments for fiscal 2013 are estimated to be approximately $0.2 million and are recorded in Accrued liabilities on the Consolidated Balance Sheets. The remaining liability balance of $5.7 million is recorded in Other liabilities on the Consolidated Balance Sheets.
Other Commercial Commitments
The following table reflects other commercial commitments or potential cash outflows that may result from a contingent
38
Table of Contents
event, such as a need to borrow short-term funds for liquidity purposes.
Amount of Commitment Expiration per Period | |||||||||||||||||||
Other Commercial Commitments | Total Amounts Committed |
| Less than 1 Year |
| 1-3 Years |
| 3-5 Years |
| More Than 5 Years | ||||||||||
| (In thousands) | ||||||||||||||||||
Standby letters of credit | $ | 5,952 | |
| $ | 5,140 | |
| $ | - | |
| $ | - | |
| $ | 812 | |
Off-Balance Sheet Arrangements
The Company does not have any off-balance sheet arrangements, as such term is defined in the rules promulgated by the Securities and Exchange Commission, that have or are reasonably likely to have a current or future effect on the Company's financial condition, changes in financial condition, revenues or expenses, results of operations, liquidity, capital expenditures or capital resources that are material to investors.
Effects of Inflation
Inflation has not had a significant effect on earnings and other financial statement items.
Critical Accounting Estimates
The preparation of these financial statements requires management to make estimates and assumptions that affect the amounts reported in the financial statements and accompanying footnotes. Estimates and assumptions about future events and their effects cannot be perceived with certainty. Estimates may change as new events occur, as more experience is acquired, as additional information becomes available and as the Company's operating environment changes. Actual results could differ from estimates.
The Company believes the following are the most critical accounting policies used in the preparation of the Company's Consolidated Financial Statements as well as the significant judgments and uncertainties affecting the application of these policies.
Revenue Recognition and Allowance for Doubtful Accounts
The Company recognizes revenue when products are shipped and the title has passed to the customer. The following factors are considered to determine if title has passed: (a) pervasive evidence that a contractual sales arrangement exists; (b) delivery has occurred; (c) the price to the buyer is fixed or determinable; (d) collection is reasonably assured. Sales allowances and customer incentives are treated as reductions to revenue and are provided for based on historical experience and current estimates. The Company has established an allowance for doubtful accounts to estimate the risk of loss associated with its accounts receivable balances. This allowance is maintained at a level the Company considers appropriate based on factors that affect collectability, including: (a) historical trends of write-offs, recoveries and credit losses;(b) the credit quality of the Company's customers; and (c) projected economic and market conditions. Different assumptions or changes in economic circumstances could result in changes to the allowance.
Inventory
The Company records inventory valued at the lower of cost or market value. Inventories are valued using the first-in first-out (FIFO) and last-in first-out (LIFO) methods. The Company uses the dollar-value link chain LIFO method, and the LIFO reserve is calculated on a consolidated basis in a single consolidated pool. Acquisitions are integrated into the Company's operations with some valuing inventories on a LIFO basis and others on a FIFO basis. Fixed costs related to excess manufacturing capacity have been expensed in the period, and therefore, are not capitalized into inventory. Inventory quantities are regularly reviewed and provisions for excess or obsolete inventory are recorded primarily based on the Company's forecast of future demand and market conditions. Significant unanticipated changes to the Company's forecasts could require a change in the provision for excess or obsolete inventory.
Environmental Contingencies
Quanex is subject to extensive laws and regulations concerning the discharge of materials into the environment and the remediation of chemical contamination. To satisfy such requirements, Quanex must make capital and other expenditures on an
39
Table of Contents
ongoing basis. The Company accrues its best estimates of its remediation obligations and adjusts such accruals as further information and circumstances develop. Those estimates may change substantially depending on information about the nature and extent of contamination, appropriate remediation technologies, and regulatory approvals. In accruing for environmental remediation liabilities, costs of future expenditures are not discounted to their present value, unless the amount and timing of the expenditures are fixed or reliably determinable. Legal costs are expensed as incurred except incremental direct costs of the remediation effort which are accrued as part of the measurement of the environmental remediation liability. When environmental laws might be deemed to impose joint and several liability for the costs of responding to contamination, the Company accrues its allocable share of the liability taking into account the number of parties participating, their ability to pay their shares, the volumes and nature of the wastes involved, the nature of anticipated response actions, and the nature of the Company's alleged connections. Recoveries of environmental remediation costs from other parties are recorded as assets when their receipt is deemed probable. Unanticipated changes in circumstances and/or legal requirements could extend the length of time over which the Company pays its remediation costs or could increase actual cash expenditures for remediation in any period.
Warranty Obligations
The Company's estimated obligations for warranty are accrued concurrently with the revenue recognized. The Company records a provision for its warranty obligations based on historical costs incurred for such obligations and adjusts, where appropriate, for current conditions and factors. The Company's ability to estimate its warranty obligations is subject to significant uncertainties, including continuous changes in product designs.
Insurance
The Company manages its costs of workers' compensation, group medical, property, casualty and other liability exposures through a combination of self-insurance retentions and insurance coverage with third-party carriers. Liabilities associated with the Company's portion of these exposures are not discounted and are estimated by considering various factors which may include historical claims experience, severity factors, estimated claims incurred but not reported and loss development factors, which are estimates on how claims will develop over time until the claims are closed, as appropriate. While the Company considers a number of factors in preparing the estimates, sensitive assumptions using significant judgment are made in determining the amounts accrued in the financial statements. Actual claims can differ significantly from estimated liabilities if future claims experience differs from historical experience and assumptions used in the Company's analysis are adjusted. Insurance recoveries are not recognized until any contingencies relating to the claim have been resolved.
Impairment or Disposal of Long-Lived Assets
Property, Plant and Equipment and Intangibles
The Company makes judgments and estimates in conjunction with the carrying value of property, plant and equipment, other intangibles, and other assets, including amounts to be capitalized, depreciation and amortization methods and useful lives. Additionally, the carrying values of these assets are reviewed for impairment whenever events or changes in circumstances indicate that carrying value may not be recoverable. The Company determines that the carrying amount is not recoverable if it exceeds the sum of the undiscounted cash flows expected to result from the use and eventual disposition of the asset. If the carrying value exceeds the sum of the undiscounted cash flows, an impairment charge is recorded in the period in which such review is performed. The Company measures the impairment loss as the amount by which the carrying amount of the long-lived asset exceeds its fair value as determined by quoted market prices in active markets or by discounted cash flows. This requires the Company to make long-term forecasts of its future revenues and costs related to the assets subject to review. Forecasts require assumptions about demand for the Company's products and future market conditions. Future events and unanticipated changes to assumptions could require a provision for impairment in a future period.
The Company monitors relevant circumstances, including industry trends, general economic conditions, and the potential impact that such circumstances might have on the valuation of its identifiable intangibles. Events and changes in circumstances that may cause a triggering event and necessitate such a review include, but are not limited to: a decrease in sales for certain customers, improvements or changes in technology, and/or a decision to phase-out a trademark or trade name. Such events could negatively impact the carrying value of the Company's identifiable intangibles. It is possible that changes in such circumstances or in the numerous variables associated with the judgments, assumptions, and estimates made by the Company in assessing the appropriate valuation of its identifiable intangibles could require the Company to further write down a portion of its identifiable intangibles and record related non-cash impairment charges in the future. The Company applies a variety of techniques to establish the carrying value of its intangible assets, including the relief from royalty and excess current year earnings methods.
Goodwill
40
Table of Contents
The acquisition method of accounting for business combinations requires the Company to make use of estimates and judgments to allocate the purchase price paid for acquisitions to the fair value of the net tangible and identifiable intangible assets. The Company performs a goodwill impairment test annually as of August 31. In addition, goodwill would be tested more frequently if changes in circumstances or the occurrence of events indicates that a potential impairment exists. The Company tests for impairment of its goodwill using a two-step approach as prescribed in ASC Topic 350 " Intangibles – Goodwill and Other " (ASC 350). The first step of the Company's goodwill impairment test compares the fair value of each reporting unit with its carrying value including assigned goodwill. The second step of the Company's goodwill impairment test is required only in situations where the carrying value of the reporting unit exceeds its fair value as determined in the first step. In such instances, the Company compares the implied fair value of goodwill to its carrying value. The implied fair value of goodwill is determined by allocating the fair value of a reporting unit to all of the assets and liabilities of that unit as if the reporting unit had been acquired in a business combination and the fair value of the reporting unit was the price paid to acquire the reporting unit. The excess of the fair value of a reporting unit over the amounts assigned to its assets and liabilities is the implied fair value of goodwill. An impairment loss is recorded to the extent that the carrying amount of the reporting unit goodwill exceeds the implied fair value of that goodwill. The Company uses the present value of future cash flows to determine fair value in combination with the market approach. Future cash flows are typically based upon appropriate future periods for the businesses and an estimated residual value. Management judgment is required in the estimation of future operating results and to determine the appropriate residual values. The residual values are determined by reference to an exchange transaction in an existing market for that asset. Future operating results and residual values could reasonably differ from the estimates and could require a provision for impairment in a future period.
Income Taxes
The Company records the estimated future tax effects of temporary differences between the tax basis of assets and liabilities and the amounts reported in the Company's Consolidated Balance Sheets, as well as net operating losses and tax credit carry forwards. The Company evaluates the carrying value of the net deferred tax assets and determines whether it will be able to generate sufficient future taxable income to realize its deferred tax assets. This evaluation is based on estimating future taxable income using the same forecasts used to test long-lived assets and intangibles for impairment, scheduling out the future reversal of existing taxable temporary differences and reviewing the Company's most recent financial operations. In the event the estimates and assumptions indicate the Company will not generate sufficient future taxable income to realize its deferred tax assets, the Company records a valuation allowance against a portion of its deferred tax assets.
Stock–Based Compensation
In accordance with ASC Topic 718 " Compensation – Stock Compensation " (ASC 718), the Company determines the fair value of share awards on the date of grant using the Black-Scholes valuation model. The Company recognizes the fair value as compensation expense on a straight-line basis over the requisite service period of the award based on awards ultimately expected to vest. Under ASC 718, the Company amortizes new option grants to retirement-eligible employees immediately upon grant, consistent with the retirement vesting acceleration provisions of these grants. For employees near retirement age, the Company amortizes such grants over the period from the grant date to the retirement date if such period is shorter than the standard vesting schedule. In accordance with ASC Topic 230-10-45-14 " Statement of Cash Flows – Cash Flows From Financing Activities " (ASC 230-10-45-14), the Consolidated Statements of Cash Flow report the excess tax benefits from the stock-based compensation as financing cash inflows. See Note 14 of Item 8 for additional information related to the Company's stock-based compensation.
The Company's fair value determination of stock-based payment awards on the date of grant using an option-pricing model is affected by the Company's stock price as well as assumptions regarding a number of highly complex and subjective variables. These variables include, but are not limited to, the Company's expected stock price volatility over the term of the awards and actual and projected employee stock option exercise behavior. Option-pricing models were developed for use in estimating the value of traded options that have no vesting or hedging restrictions and are fully transferable. Because the Company's employee stock options have certain characteristics that are significantly different from traded options, and because changes in the subjective assumptions can materially affect the estimated value, in management's opinion, the existing valuation models may not provide an accurate measure of the fair value of the Company's employee stock options. Accordingly, that value may not be indicative of the fair value observed in a willing buyer/willing seller market transaction.
Retirement Plans
The Company sponsors a defined benefit pension plan and an unfunded postretirement plan that provides health care and life insurance benefits for eligible retirees and dependents. The measurement of liabilities related to these plans is based on
41
Table of Contents
management's assumptions related to future events, including expected return on plan assets, rate of compensation increases, and heath care cost trend rates. The discount rate reflects the rate at which benefits could be effectively settled on the measurement date. The Company determines its discount rate based on a pension discount curve, and the rate represents the single rate that, if applied to every year of projected benefits payments, would result in the same discounted value as the array of rates that comprise the pension discount curve. Actual pension plan asset investment performance, as well as other economic experience such as discount rate and demographic experience, will either reduce or increase unamortized pension losses at the end of any fiscal year, which ultimately affects future pension costs. Refer to Note 11 of Item 8 to the Consolidated Financial Statements for further information on these plans.
The effects of the decrease in selected assumptions, assuming no changes in benefit levels and no amortization of gains or losses for the pension plans in fiscal 2012 , is shown below:
| Effect on all Defined Benefit Pension Plans | ||||||||
| October 31, 2012 | ||||||||
Assumption | Percentage Point Change |
| Increase (Decrease) in Projected Benefit Obligation |
| Increase (Decrease) in 2012 Pension Expense | ||||
| (In thousands) | ||||||||
Discount rate | -1.0 pts |
| $ | 2,658 | |
| $ | 420 | |
Assumed return on plan assets | -1.0 pts |
| N/A | |
| 202 | | ||
As of October 31, 2012 , the Company's projected benefit obligation (PBO) and accumulated benefit obligation (ABO) exceed the fair value of the plan assets by $5.8 million and $5.2 million , respectively. As a comparison, the Company's PBO and ABO exceeded the fair value of plan assets by $6.7 million and $5.4 million , respectively, as of October 31, 2011 . In 2011 , a decrease in the discount rate and additional participants from the Edgetech acquisition increased the obligation more than the increase in the fair value of the plan assets. In 2012, the discount rate decreased further, however, contributions more closely matched the increase in obligation. During fiscal 2012 , the Company contributed $4.2 million to its defined benefit plan. During fiscal 2013 , the Company expects to contribute approximately $3.3 million to the pension plan to continue to target a 100% funding threshold and to meet minimum contribution requirements. Expected contributions are dependent on many variables, including the variability of the market value of the assets as compared to the obligation and other market or regulatory conditions. In addition, the Company takes into consideration its business investment opportunities and resulting cash requirements. Accordingly, actual funding may differ greatly from current estimates.
Accounting guidance applicable to pensions does not require immediate recognition of the effects of a deviation between actual and assumed experience and the revision of an estimate. This approach allows the favorable and unfavorable effects that fall within an acceptable range to be netted and disclosed as an unrecognized gain or loss. Accumulated other comprehensive income as of October 31, 2012 includes pretax net actuarial losses and net prior service costs of $4.8 million . A portion of the loss will be amortized in fiscal year 2013 . The effect on fiscal years after 2013 will depend on the actual experience of the plans.
Mortality assumptions used to determine the obligations for the Company's pension plans are related to the experience of the plans and to our third-party actuary's best estimate of expected plan mortality.
New Accounting Pronouncements
In June 2011, the FASB issued Accounting Standards Update No. 2011-05 (ASU 2011-05), Presentation of Comprehensive Income . This amendment will require companies to present the components of net income and other comprehensive income either as one continuous statement or as two consecutive statements. It eliminates the option to present components of other comprehensive income as part of the statement of changes in stockholders' equity. The amended guidance, which must be applied retroactively, is effective for fiscal years, and interim periods within those years, beginning after December 15, 2011 (November 1, 2012 for the Company), with earlier adoption permitted. ASU 2011-05 impacts presentation only and will have no effect on the Company's financial condition, results of operations or cash flows. In December 2011, the FASB issued Accounting Standards Update No. 2011-12 (ASU 2011-12), " Deferral of the Effective Date for Amendments to the Presentation of Reclassifications of Items Out of Accumulated Other Comprehensive Income in Accounting Standards Update No. 2011-05 ." ASU 2011-12 deferred the effective date of ASU 2011-05 related to the presentation of reclassifications of items out of accumulated other comprehensive income. All other requirements of ASU 2011-05 were not affected by ASU 2011-12.
Item 7A. | Quantitative and Qualitative Disclosures about Market Risk |
42
Table of Contents
The following discussion of the Company and its subsidiaries' exposure to various market risks contains "forward looking statements" that involve risks and uncertainties. These projected results have been prepared utilizing certain assumptions considered reasonable in light of information currently available to the Company. Nevertheless, because of the inherent unpredictability of interest rates, foreign currency rates and metal commodity prices as well as other factors, actual results could differ materially from those projected in such forward looking information. The Company does not use derivative financial instruments for speculative or trading purposes. For a description of the Company's significant accounting policies associated with these activities, see Note 1 to the Consolidated Financial Statements.
Commodity Price Risk
Within the Aluminum Sheet Products segment, the Company uses various grades of aluminum scrap as well as minimal amounts of prime aluminum as raw materials for its manufacturing processes. The price of this raw material is subject to fluctuations due to many factors in the aluminum market. In the normal course of business, Nichols Aluminum enters into firm price sales commitments with its customers. In an effort to reduce the risk of fluctuating raw material prices, Nichols Aluminum enters into firm price raw material purchase commitments (which are designated as "normal purchases" under ASC Topic 815 " Derivatives and Hedging " (ASC 815)) as well as contracts on the London Metal Exchange (LME). The Company's risk management policy as it relates to these LME contracts is to enter into contracts as needed, so that the raw material inventory levels, including both fixed price purchase commitments as well as LME contracts match the needs of the Company to meet committed sales orders. This is done through the use of both LME forward purchase contracts as well as LME forward sales contracts.
Nichols Aluminum maintains a balanced metals book position which excludes a normal operational inventory level. This operating inventory level as a matter of practice is not hedged against material price (LME) movements. This practice reflects that over the commodity price cycle, no gain or loss is incurred on this inventory. Through the use of firm price raw material purchase commitments and LME contracts, the Company intends to protect cost of sales from the effects of changing prices of aluminum. To the extent that the raw material costs factored into the firm price sales commitments are matched with firm price raw material purchase commitments, changes in aluminum prices should have no effect. While the Company considers the LME derivative contracts to provide an economic hedge against changes in aluminum prices, the derivatives have not been designated as hedges in accordance with ASC 815 for accounting purposes. As such, any mark-to-market net gain or loss was recorded in Cost of sales with the offsetting amount reflected as a current asset or liability on the balance sheet. During fiscal 2012 , 2011 and 2010 , the Company primarily relied upon firm price raw material purchase commitments to protect cost of sales tied to firm price sales commitments.
The table below indicates the notional volume as well as the fair value of the open LME forward contracts as of October 31, 2012 and 2011 . For additional information about these commodity based derivatives, see Note 18 of the financial statements.
| Notional in Lbs |
| Fair Value in $ | ||||||||||
| October 31, | ||||||||||||
| 2012 |
| 2011 |
| 2012 |
| 2011 | ||||||
| (In thousands) | ||||||||||||
Commodity based derivatives: |
| ||||||||||||
Forward purchase aluminum contracts | 2,370 | |
| 3,417 | |
| $ | (164 | ) |
| $ | (58 | ) |
Forward sales aluminum contracts | - | |
| (5,346 | ) |
| - | |
| 90 | | ||
Within the Engineered Products segment, polyvinyl resin (PVC) is the significant raw material consumed during the manufacture of vinyl extrusions. The Company has a monthly resin adjuster in place with the majority of its customers and resin supplier that is adjusted based upon published industry resin prices for the prior month. This adjuster effectively shares the base pass-through price changes of PVC with the Company's customers commensurate with the market at large. The Company's long-term exposure to changes in PVC prices is thus significantly reduced due to the contractual component of the resin adjuster program; however, there is a level of exposure to short-term volatility due to the one month lag.
Effective May 1, 2011, IG, the Company's warm-edge, insulating glass spacer division initiated an oil-based materials surcharge on one of its major product lines. The surcharge helps offset the rising cost of butyl and other oil-based raw materials, pricing of which are highly correlated to the price of oil. The surcharge is in place with the majority of its customers who purchase these products and is adjusted monthly based upon the 90 day average published price for Brent crude. The oil-based raw materials
43
Table of Contents
purchased by the company are subject to similar pricing schemes. Therefore, the Company's long-term exposure to changes in oil-based raw materials prices is significantly reduced due to the contractual component of the surcharge program.
Foreign Currency Rate Risk
The Company's international operations have exposure to foreign currency rate risks primarily due to fluctuations in the Euro, the British Pound and the Canadian dollar. From time to time, the Company enters into foreign exchange contracts associated with its exposures from operations to manage a portion of the foreign currency rate risk.
At October 31, 2012 and 2011 , the Company held foreign currency derivative contracts hedging cross-border intercompany and commercial activity at IG Systems. Although these derivatives hedge exposures to fluctuations in foreign currency rates, the Company elected not to utilize hedge accounting. As a result, the change in the fair value of these foreign currency derivatives was recorded directly to other income and expense ("Other, net"). To the extent the gain or loss on the derivatives is offset by the gain or loss from remeasuring the underlying foreign currency transaction or balance, changes in exchange rates should have no effect. The notional and fair market values of these positions at October 31, 2012 and 2011 , were as follows:
| Notional |
| Fair Value in $ | |||||||||||
|
| October 31, | ||||||||||||
|
| 2012 |
| 2011 |
| 2012 |
| 2011 | ||||||
|
| (In thousands) | ||||||||||||
Foreign currency exchange derivatives: |
|
| ||||||||||||
Sell EUR, buy GBP | EUR | 545 | |
| - | |
| $ | - | |
| $ | - | |
Sell EUR, buy US dollar | EUR | 7,663 | |
| 8,500 | |
| (23 | ) |
| 147 | | ||
Sell CAD, buy USD | CAD | 608 | |
| - | |
| 1 | |
| - | | ||
Buy GBP, sell US dollar | GBP | 1,934 | |
| 600 | |
| 5 | |
| 2 | | ||
Buy US dollar, sell CAD | CAD | - | |
| 894 | |
| - | |
| (15 | ) | ||
For additional information about the Company's use of foreign currency derivatives, see Note 18 - Derivative Instruments and Fair Value Measurement of Assets and Liabilities.
44
Table of Contents
Item 8. | Financial Statements and Supplementary Data |
REPORT OF INDEPENDENT REGISTERED PUBLIC ACCOUNTING FIRM
To the Board of Directors and Stockholders
Quanex Building Products Corporation
Houston, Texas
We have audited the accompanying consolidated balance sheets of Quanex Building Products Corporation and subsidiaries (the "Company") as of October 31, 2012 and 2011, and the related consolidated statements of income, stockholders' equity, and cash flow for each of the three years in the period ended October 31, 2012. Our audits also included the financial statement schedule listed in the Index at Item 15. These consolidated financial statements and financial statement schedule are the responsibility of the Company's management. Our responsibility is to express an opinion on the financial statements and financial statement schedule based on our audits.
We conducted our audits in accordance with the standards of the Public Company Accounting Oversight Board (United States). Those standards require that we plan and perform the audit to obtain reasonable assurance about whether the financial statements are free of material misstatement. An audit includes examining, on a test basis, evidence supporting the amounts and disclosures in the financial statements. An audit also includes assessing the accounting principles used and significant estimates made by management, as well as evaluating the overall financial statement presentation. We believe that our audits provide a reasonable basis for our opinion.
In our opinion, such consolidated financial statements present fairly, in all material respects, the financial position of the Company and subsidiaries as of October 31, 2012 and 2011, and the results of their operations and their cash flows for each of the three years in the period ended October 31, 2012, in conformity with accounting principles generally accepted in the United States of America. Also, in our opinion, such financial statement schedule, when considered in relation to the basic consolidated financial statements taken as a whole, presents fairly, in all material respects, the information set forth therein.
We have also audited, in accordance with the standards of the Public Company Accounting Oversight Board (United States), the Company's internal control over financial reporting as of October 31, 2012, based on the criteria established in Internal Control-Integrated Framework issued by the Committee of Sponsoring Organizations of the Treadway Commission and our report dated December 31, 2012 expressed an unqualified opinion on the Company's internal control over financial reporting.
/s/ DELOITTE & TOUCHE LLP |
|
|
|
Houston, Texas |
|
December 31, 2012 |
|
45
Table of Contents
QUANEX BUILDING PRODUCTS CORPORATION
CONSOLIDATED BALANCE SHEETS
| October 31, | ||||||
| 2012 |
| 2011 | ||||
| (In thousands, except share amounts) | ||||||
ASSETS |
|
|
| ||||
Current assets: |
|
|
| ||||
Cash and equivalents | $ | 71,255 | |
| $ | 89,619 | |
Accounts receivable, net of allowance of $1,026 and $1,062, respectively | 85,644 | |
| 81,969 | | ||
Inventories, net | 65,904 | |
| 55,842 | | ||
Deferred income taxes | 20,439 | |
| 11,220 | | ||
Prepaid and other current assets | 7,628 | |
| 6,423 | | ||
Total current assets | 250,870 | |
| 245,073 | | ||
Property, plant and equipment, net | 168,877 | |
| 158,209 | | ||
Deferred income taxes | 8,911 | |
| 7,669 | | ||
Goodwill | 68,331 | |
| 69,432 | | ||
Intangible assets, net | 78,380 | |
| 87,943 | | ||
Other assets | 14,169 | |
| 16,603 | | ||
Total assets | $ | 589,538 | |
| $ | 584,929 | |
LIABILITIES AND STOCKHOLDERS' EQUITY |
|
|
| ||||
Current liabilities: |
|
|
| ||||
Accounts payable | $ | 80,985 | |
| $ | 66,339 | |
Accrued liabilities | 46,459 | |
| 38,058 | | ||
Current maturities of long-term debt | 368 | |
| 352 | | ||
Total current liabilities | 127,812 | |
| 104,749 | | ||
Long-term debt | 1,033 | |
| 1,314 | | ||
Deferred pension and postretirement benefits | 6,873 | |
| 7,784 | | ||
Liability for uncertain tax positions | 6,736 | |
| 8,412 | | ||
Non-current environmental reserves | 9,827 | |
| 11,221 | | ||
Other liabilities | 15,430 | |
| 14,223 | | ||
Total liabilities | 167,711 | |
| 147,703 | | ||
Commitments and contingencies (Notes 15 and 16) | |
| | ||||
Stockholders' equity: |
|
|
| ||||
Preferred stock, no par value, shares authorized 1,000,000; issued and outstanding–none | - | |
| - | | ||
Common stock, $0.01 par value, shares authorized 125,000,000; issued 37,788,804 and 37,843,134, respectively | 378 | |
| 378 | | ||
Additional paid-in-capital | 245,144 | |
| 241,983 | | ||
Retained earnings | 193,105 | |
| 213,143 | | ||
Accumulated other comprehensive income (loss) | (5,299 | ) |
| (3,642 | ) | ||
Less treasury stock at cost, 816,302 and 1,035,288 shares, respectively | (11,501 | ) |
| (14,636 | ) | ||
Total stockholders' equity | 421,827 | |
| 437,226 | | ||
Total liabilities and stockholders' equity | $ | 589,538 | |
| $ | 584,929 | |
See notes to consolidated financial statements.
46
Table of Contents
QUANEX BUILDING PRODUCTS CORPORATION
CONSOLIDATED STATEMENTS OF INCOME
| Year ended October 31, | ||||||||||
| 2012 |
| 2011 |
| 2010 | ||||||
| (In thousands, except per share amounts) | ||||||||||
Net sales | $ | 828,976 | |
| $ | 848,294 | |
| $ | 798,314 | |
Cost and expenses: |
|
|
|
|
| ||||||
Cost of sales (exclusive of items shown separately below) | 703,844 | |
| 712,091 | |
| 660,849 | | |||
Selling, general and administrative | 111,577 | |
| 83,994 | |
| 71,954 | | |||
Depreciation and amortization | 37,596 | |
| 33,932 | |
| 28,214 | | |||
Asset impairment charges | 912 | |
| 1,799 | |
| - | | |||
Operating income (loss) | (24,953 | ) |
| 16,478 | |
| 37,297 | | |||
Non-operating income (expense): |
|
|
|
|
| ||||||
Interest expense | (454 | ) |
| (449 | ) |
| (440 | ) | |||
Other, net | 222 | |
| (514 | ) |
| 2,645 | | |||
Income (loss) from continuing operations before income taxes | (25,185 | ) |
| 15,515 | |
| 39,502 | | |||
Income tax benefit (expense) | 8,651 | |
| (6,437 | ) |
| (15,301 | ) | |||
Income (loss) from continuing operations | (16,534 | ) |
| 9,078 | |
| 24,201 | | |||
Income (loss) from discontinued operations, net of taxes | - | |
| (12 | ) |
| (1,103 | ) | |||
Net income (loss) | $ | (16,534 | ) |
| $ | 9,066 | |
| $ | 23,098 | |
Basic earnings per common share: |
|
|
|
|
| ||||||
Earnings (loss) from continuing operations | $ | (0.45 | ) |
| $ | 0.24 | |
| $ | 0.65 | |
Income (loss) from discontinued operations | - | |
| - | |
| (0.03 | ) | |||
Basic earnings (loss) per share | $ | (0.45 | ) |
| $ | 0.24 | |
| $ | 0.62 | |
Diluted earnings per common share: |
|
|
|
|
| ||||||
Earnings (loss) from continuing operations | $ | (0.45 | ) |
| $ | 0.24 | |
| $ | 0.64 | |
Income (loss) from discontinued operations | - | |
| - | |
| (0.03 | ) | |||
Diluted earnings (loss) per share | $ | (0.45 | ) |
| $ | 0.24 | |
| $ | 0.61 | |
Weighted average common shares outstanding: |
|
|
|
|
| ||||||
Basic | 36,622 | |
| 37,007 | |
| 37,220 | | |||
Diluted | 36,622 | |
| 37,537 | |
| 37,671 | | |||
See notes to consolidated financial statements.
47
Table of Contents
QUANEX BUILDING PRODUCTS CORPORATION
CONSOLIDATED STATEMENTS OF STOCKHOLDERS' EQUITY
|
|
|
|
|
|
|
|
|
| Accumulated Other Comprehensive Income |
|
|
|
| ||||||||||||||||||
Years Ended October 31, 2012, |
| Compre- hensive Income |
| Common Stock |
| Additional Paid-in Capital |
| Retained Earnings |
| Pension & Postret- irement Benefit Related |
| Foreign Currency Translation Adjustment |
| Treasury Stock & Other |
| Total Stockholders' Equity | ||||||||||||||||
|
|
|
| (In thousands, except per share amounts) | ||||||||||||||||||||||||||||
Balance at October 31, 2009 |
|
| $ | 378 | |
| $ | 233,452 | |
| $ | 192,546 | |
| $ | (2,636 | ) |
| $ | 156 | |
| $ | (1,370 | ) |
| $ | 422,526 | | |||
Net income (loss) | $ | 23,098 | |
|
|
|
|
| 23,098 | |
|
|
|
|
|
|
| 23,098 | | |||||||||||||
Change in pension from net unamortized gain (loss) (net of taxes of $441) | 701 | |
|
|
|
|
|
|
| 701 | |
|
|
|
|
| 701 | | ||||||||||||||
Foreign currency translation adjustment (net of taxes of $0) | 23 | |
|
|
|
|
|
|
|
|
| 23 | |
|
|
| 23 | | ||||||||||||||
Total comprehensive income (loss) | $ | 23,822 | |
|
|
|
|
|
|
|
|
|
|
|
|
| | |||||||||||||||
Common dividends ($0.14 per share) |
|
|
|
|
|
| (5,275 | ) |
|
|
|
|
|
|
| (5,275 | ) | |||||||||||||||
Treasury shares purchased, at cost |
|
|
|
|
|
|
|
|
|
|
|
| (4,274 | ) |
| (4,274 | ) | |||||||||||||||
Stock-based compensation activity: |
|
|
|
|
|
|
|
|
|
|
|
|
|
|
| |||||||||||||||||
Stock-based compensation earned |
|
|
|
| 4,205 | |
|
|
|
|
|
|
|
|
| 4,205 | | |||||||||||||||
Stock options exercised |
|
| | |
| 435 | |
| (2 | ) |
|
|
|
|
| 9 | |
| 442 | | ||||||||||||
Restricted stock awards |
|
| 1 | |
| (54 | ) |
|
|
|
|
|
|
|
|
| (53 | ) | ||||||||||||||
Stock-based compensation tax benefit |
|
|
|
| 41 | |
| | |
|
|
|
|
|
|
| 41 | | ||||||||||||||
Other |
|
| | |
| | |
| (1 | ) |
|
|
| (1 | ) |
|
|
| (2 | ) | ||||||||||||
Balance at October 31, 2010 |
|
| $ | 379 | |
| $ | 238,079 | |
| $ | 210,366 | |
| $ | (1,935 | ) |
| $ | 178 | |
| $ | (5,635 | ) |
| $ | 441,432 | | |||
Net income (loss) | $ | 9,066 | |
|
|
|
|
| 9,066 | |
|
|
|
|
|
|
| 9,066 | | |||||||||||||
Change in pension from net unamortized gain (loss) (net of taxes of $818) | (1,350 | ) |
|
|
|
|
|
|
| (1,350 | ) |
|
|
|
|
| (1,350 | ) | ||||||||||||||
Foreign currency translation adjustment (net of taxes of $15) | (536 | ) |
|
|
|
|
|
|
|
|
| (536 | ) |
|
|
| (536 | ) | ||||||||||||||
Total comprehensive income (loss) | $ | 7,180 | |
|
|
|
|
|
|
|
|
|
|
|
|
|
| |||||||||||||||
Common dividends ($0.16 per share) |
|
|
|
|
|
| (5,979 | ) |
|
|
|
|
|
|
| (5,979 | ) | |||||||||||||||
Treasury shares purchased, at cost |
|
|
|
|
|
|
|
|
|
|
|
| (10,080 | ) |
| (10,080 | ) | |||||||||||||||
Stock-based compensation activity: |
|
|
|
|
|
|
|
|
|
|
|
|
|
|
| |||||||||||||||||
Stock-based compensation earned |
|
|
|
| 4,703 | |
|
|
|
|
|
|
|
|
| 4,703 | | |||||||||||||||
Stock options exercised |
|
|
|
| (20 | ) |
| (111 | ) |
|
|
|
|
| 998 | |
| 867 | | |||||||||||||
Restricted stock awards |
|
| 1 | |
| (82 | ) |
|
|
|
|
|
|
| 81 | |
| - | | |||||||||||||
Stock-based compensation tax benefit |
|
|
|
| 194 | |
|
|
|
|
|
|
|
|
| 194 | | |||||||||||||||
Other |
|
| (2 | ) |
| (891 | ) |
| (199 | ) |
|
|
| 1 | |
|
|
| (1,091 | ) | ||||||||||||
Balance at October 31, 2011 |
|
| $ | 378 | |
| $ | 241,983 | |
| $ | 213,143 | |
| $ | (3,285 | ) |
| $ | (357 | ) |
| $ | (14,636 | ) |
| $ | 437,226 | | |||
Net income (loss) | $ | (16,534 | ) |
|
|
|
|
| (16,534 | ) |
|
|
|
|
|
|
| (16,534 | ) | |||||||||||||
Change in pension from net unamortized gain (loss) (net of taxes of $70) | 150 | |
|
|
|
|
|
|
| 150 | |
|
|
|
|
| 150 | | ||||||||||||||
Foreign currency translation adjustment (net of taxes of $26) | (1,806 | ) |
|
|
|
|
|
|
|
|
| (1,806 | ) |
|
|
| (1,806 | ) | ||||||||||||||
Total comprehensive income (loss) | $ | (18,190 | ) |
|
|
|
|
|
|
|
|
|
|
|
|
|
| |||||||||||||||
Common dividends ($0.16 per share) |
|
|
|
|
|
| (5,891 | ) |
|
|
|
|
|
|
| (5,891 | ) | |||||||||||||||
Treasury shares purchased, at cost |
|
|
|
|
|
|
|
|
|
|
|
| (1,284 | ) |
| (1,284 | ) | |||||||||||||||
Stock-based compensation activity: |
|
|
|
|
|
|
|
|
|
|
|
|
|
|
| |||||||||||||||||
Stock-based compensation earned |
|
|
|
| 4,403 | |
|
|
|
|
|
|
|
|
| 4,403 | | |||||||||||||||
Stock options exercised |
|
|
|
| (66 | ) |
| (151 | ) |
|
|
|
|
| 3,233 | |
| 3,016 | | |||||||||||||
Restricted stock awards |
|
|
|
| (1,186 | ) |
|
|
|
|
|
|
| 1,186 | |
| - | | ||||||||||||||
Stock-based compensation tax benefit |
|
|
|
| 341 | |
|
|
|
|
|
|
|
|
| 341 | | |||||||||||||||
Reduction of unrecognized tax benefit liability related to Separation |
|
|
|
|
|
| 2,851 | |
|
|
|
|
|
|
| 2,851 | | |||||||||||||||
Other |
|
|
|
| (331 | ) |
| (313 | ) |
|
|
| (1 | ) |
|
|
| (645 | ) | |||||||||||||
Balance at October 31, 2012 |
|
| $ | 378 | |
| $ | 245,144 | |
| $ | 193,105 | |
| $ | (3,135 | ) |
| $ | (2,164 | ) |
| $ | (11,501 | ) |
| $ | 421,827 | | |||
See notes to consolidated financial statements.
48
Table of Contents
QUANEX BUILDING PRODUCTS CORPORATION
CONSOLIDATED STATEMENTS OF STOCKHOLDERS' EQUITY (continued)
| Years Ended October 31, 2012, | |||||||||||||
| Preferred Shares Issued |
| Common Shares | |||||||||||
| Issued |
| Treasury |
| Rabbi Trust |
| Net Outstanding | |||||||
Balance at October 31, 2009 | - | |
| 37,752,437 | |
| - | |
| (102,125 | ) |
| 37,650,312 | |
Treasury shares purchased, at cost | - | |
| - | |
| (250,000 | ) |
| - | |
| (250,000 | ) |
Transfer of Rabbi trust shares | - | |
| - | |
| (102,125 | ) |
| 102,125 | |
| - | |
Stock options exercised | - | |
| 38,142 | |
| 499 | |
| - | |
| 38,641 | |
Restricted stock awards | - | |
| 74,900 | |
| - | |
| - | |
| 74,900 | |
Cancellation of restricted stock | - | |
| (3,038 | ) |
| - | |
| - | |
| (3,038 | ) |
Balance at October 31, 2010 | - | |
| 37,862,441 | |
| (351,626 | ) |
| - | |
| 37,510,815 | |
Treasury shares purchased, at cost | - | |
| - | |
| (750,000 | ) |
| - | |
| (750,000 | ) |
Stock options exercised | - | |
| - | |
| 61,338 | |
| - | |
| 61,338 | |
Restricted stock awards | - | |
| 64,200 | |
| 5,000 | |
| - | |
| 69,200 | |
Cancellation of restricted stock | - | |
| (83,507 | ) |
| - | |
| - | |
| (83,507 | ) |
Balance at October 31, 2011 | - | |
| 37,843,134 | |
| (1,035,288 | ) |
| - | |
| 36,807,846 | |
Treasury shares purchased, at cost | - | |
| - | |
| (94,337 | ) |
| - | |
| (94,337 | ) |
Stock options exercised | - | |
| - | |
| 229,423 | |
| - | |
| 229,423 | |
Restricted stock awards | - | |
| - | |
| 83,900 | |
| - | |
| 83,900 | |
Cancellation of restricted stock | - | |
| (54,330 | ) |
| - | |
| - | |
| (54,330 | ) |
Balance at October 31, 2012 | - | |
| 37,788,804 | |
| (816,302 | ) |
| - | |
| 36,972,502 | |
See notes to consolidated financial statements.
49
Table of Contents
QUANEX BUILDING PRODUCTS CORPORATION
CONSOLIDATED STATEMENTS OF CASH FLOW
| Years Ended October 31, | ||||||||||
| 2012 |
| 2011 |
| 2010 | ||||||
| (In thousands) | ||||||||||
Operating Activities: |
|
|
|
|
| ||||||
Net income (loss) | $ | (16,534 | ) |
| $ | 9,066 | |
| $ | 23,098 | |
Loss (income) from discontinued operations | - | |
| 12 | |
| 1,103 | | |||
Adjustments to reconcile net income (loss) to cash provided by operating activities from continuing operations: |
|
|
|
|
| ||||||
Depreciation and amortization | 37,666 | |
| 34,000 | |
| 28,283 | | |||
(Gain) loss on disposition of property | (989 | ) |
| 374 | |
| (677 | ) | |||
Asset impairment charges | 912 | |
| 1,799 | |
| - | | |||
Gain on bargain purchase | - | |
| - | |
| (1,272 | ) | |||
Restructuring charges | (122 | ) |
| 721 | |
| - | | |||
Deferred income taxes | (9,843 | ) |
| 3,361 | |
| 12,294 | | |||
Stock-based compensation | 5,604 | |
| 4,852 | |
| 4,456 | | |||
Changes in assets and liabilities, net of effects from acquisitions and dispositions: |
|
|
|
|
| ||||||
Decrease (increase) in accounts receivable | (4,250 | ) |
| 13,761 | |
| (6,365 | ) | |||
Decrease (increase) in inventory | (10,288 | ) |
| (530 | ) |
| 3,142 | | |||
Decrease (increase) in other current assets | (50 | ) |
| 741 | |
| (510 | ) | |||
Increase (decrease) in accounts payable | 14,920 | |
| (13,349 | ) |
| 4,572 | | |||
Increase (decrease) in accrued liabilities | 9,313 | |
| (6,952 | ) |
| 9,509 | | |||
Increase (decrease) in income taxes | (547 | ) |
| (493 | ) |
| 9,599 | | |||
Increase (decrease) in deferred pension and postretirement benefits | (693 | ) |
| 2,768 | |
| (1,846 | ) | |||
Other, net | 1,379 | |
| 2,813 | |
| 4,176 | | |||
Cash provided by (used for) operating activities from continuing operations | 26,478 | |
| 52,944 | |
| 89,562 | | |||
Cash provided by (used for) operating activities from discontinued operations | - | |
| (68 | ) |
| (430 | ) | |||
Cash provided by (used for) operating activities | 26,478 | |
| 52,876 | |
| 89,132 | | |||
Investing Activities: |
|
|
|
|
| ||||||
Acquisitions, net of cash acquired | - | |
| (110,845 | ) |
| (1,590 | ) | |||
Capital expenditures | (42,871 | ) |
| (25,312 | ) |
| (14,720 | ) | |||
Proceeds from property insurance claim | 1,123 | |
| - | |
| 392 | | |||
Proceeds from executive life insurance | - | |
| 683 | |
| - | | |||
Other, net | 44 | |
| 107 | |
| 43 | | |||
Cash provided by (used for) investing activities from continuing operations | (41,704 | ) |
| (135,367 | ) |
| (15,875 | ) | |||
Cash provided by (used for) investing activities from discontinued operations | - | |
| - | |
| 90 | | |||
Cash provided by (used for) investing activities | (41,704 | ) |
| (135,367 | ) |
| (15,785 | ) | |||
Financing Activities: |
|
|
|
|
| ||||||
Repayments of long-term debt | (264 | ) |
| (340 | ) |
| (323 | ) | |||
Purchase of treasury stock | (1,284 | ) |
| (10,080 | ) |
| (4,274 | ) | |||
Common stock dividends paid | (5,891 | ) |
| (5,979 | ) |
| (5,275 | ) | |||
Issuance of common stock from stock option exercises, including related tax benefits | 3,511 | |
| 1,093 | |
| 502 | | |||
Other, net | - | |
| 392 | |
| (665 | ) | |||
Cash provided by (used for) financing activities from continuing operations | (3,928 | ) |
| (14,914 | ) |
| (10,035 | ) | |||
Cash provided by (used for) financing activities from discontinued operations | - | |
| (392 | ) |
| 665 | | |||
Cash provided by (used for) financing activities | (3,928 | ) |
| (15,306 | ) |
| (9,370 | ) | |||
Effect of exchange rate changes on cash and equivalents | 790 | |
| (222 | ) |
| 27 | | |||
Less: (Increase) decrease in cash and equivalents from discontinued operations | - | |
| 460 | |
| (325 | ) | |||
Increase (decrease) in cash and equivalents from continuing operations | (18,364 | ) |
| (97,559 | ) |
| 63,679 | | |||
Cash and equivalents at beginning of period | 89,619 | |
| 187,178 | |
| 123,499 | | |||
Cash and equivalents at end of period | $ | 71,255 | |
| $ | 89,619 | |
| $ | 187,178 | |
See notes to consolidated financial statements.
50
Table of Contents
QUANEX BUILDING PRODUCTS CORPORATION
NOTES TO CONSOLIDATED FINANCIAL STATEMENTS
1. | Organization and Significant Accounting Policies |
Quanex Building Products Corporation and its subsidiaries (Quanex or the Company) are managed on a decentralized basis and operate in two business segments: Engineered Products and Aluminum Sheet Products. The Engineered Products segment produces engineered systems, products and components primarily serving the window and door industry, while the Aluminum Sheet Products segment produces mill finished and coated aluminum sheet serving the broader building products markets and secondary markets such as capital goods and transportation. The primary market drivers are remodeling expenditures and residential housing starts. Quanex believes it is a technological leader in the production of aluminum sheet products, flexible insulating glass spacer systems, extruded vinyl profiles, thin film solar panel sealants, and precision-formed metal and wood products which primarily serve the North American building products markets. The Company uses low-cost production processes, and engineering and metallurgical expertise to provide customers with specialized products for specific applications.
On December 12, 2007, Quanex Building Products Corporation was incorporated in the state of Delaware as a subsidiary of Quanex Corporation to facilitate the separation of Quanex Corporation's vehicular products and building products businesses. The separation occurred on April 23, 2008 through the spin-off of Quanex Corporation's building products business to its shareholders immediately followed by the merger of Quanex Corporation (consisting principally of the vehicular products business and all non-building products related corporate accounts) with a wholly-owned subsidiary of Gerdau S.A. (Gerdau). This is hereafter referred to as the "Separation."
In March 2011, the Company acquired Edgetech I.G., Inc. and its German subsidiary. Headquartered in Cambridge, Ohio, Edgetech has three manufacturing facilities (U.S., U.K. and Germany) that produce and market a full line of insulating glass (IG) spacer systems for window and door customers in North America and abroad. In March 2011, the Company also acquired JELD-WEN's vinyl extrusion assets in Yakima, Washington. In November 2011, management committed to a program to consolidate its IG spacer manufacturing facility in Barbourville, Kentucky into its IG spacer manufacturing facility in Cambridge, Ohio. The facility consolidation was completed in August 2012 . In 2010, management closed its start-up facility in China and accordingly, the China assets and liabilities, results of operations and cash flows are reported as discontinued operations for all periods presented. Unless otherwise noted, all disclosures in the notes accompanying the consolidated financial statements reflect only continuing operations.
The following are significant accounting policies used in the preparation of the Company's Consolidated Financial Statements as well as the significant judgments and uncertainties affecting the application of these policies.
Principles of Consolidation
The accompanying financial statements include the accounts of the Company and its wholly-owned subsidiaries. All intercompany transactions have been eliminated in consolidation.
Use of Estimates
The preparation of financial statements in conformity with accounting principles generally accepted in the United States requires management to make estimates and assumptions that affect the amounts reported. Estimates and assumptions about future events and their effects cannot be perceived with certainty. Estimates may change as new events occur, as more experience is acquired, as additional information becomes available and as the Company's operating environment changes. Therefore, the Company's estimates could differ, perhaps materially, from its estimates.
Revenue Recognition and Allowance for Doubtful Accounts
The Company recognizes revenue when products are shipped and the title has passed to the customer. The following factors are considered to determine if title has passed: (a) pervasive evidence that a contractual sales arrangement exists; (b) delivery has occurred; (c) the price to the buyer is fixed or determinable; (d) collection is reasonably assured. Sales allowances and customer incentives are treated as reductions to revenue and are provided for based on historical experience and current estimates. The Company has established an allowance for doubtful accounts to estimate the risk of loss associated with its accounts receivable balances. This allowance is maintained at a level the Company considers appropriate based on factors that affect collectability, including: (a) historical trends of write-offs, recoveries and credit losses; (b) the credit quality of the Company's customers; and (c) projected economic and market conditions. Different assumptions or changes in economic circumstances could
51
Table of Contents
QUANEX BUILDING PRODUCTS CORPORATION
NOTES TO CONSOLIDATED FINANCIAL STATEMENTS (continued)
result in changes to the allowance.
Inventory
The Company records inventory valued at the lower of cost or market value. Inventories are valued using the first-in first-out (FIFO) and last-in first-out (LIFO) methods. The Company uses the dollar-value link chain LIFO method, and the LIFO reserve is calculated on a consolidated basis in a single consolidated pool. Acquisitions are integrated into the Company's operations with some valuing inventories on a LIFO basis and others on a FIFO basis. Fixed costs related to excess manufacturing capacity have been expensed in the period, and therefore, are not capitalized into inventory. Inventory quantities are regularly reviewed and provisions for excess or obsolete inventory are recorded primarily based on the Company's forecast of future demand and market conditions. Significant unanticipated changes to the Company's forecasts could require a change in the provision for excess or obsolete inventory.
Environmental Contingencies
Quanex is subject to extensive laws and regulations concerning the discharge of materials into the environment and the remediation of chemical contamination. To satisfy such requirements, Quanex must make capital and other expenditures on an ongoing basis. The Company accrues its best estimates of its remediation obligations and adjusts such accruals as further information and circumstances develop. Those estimates may change substantially depending on information about the nature and extent of contamination, appropriate remediation technologies, and regulatory approvals. In accruing for environmental remediation liabilities, costs of future expenditures are not discounted to their present value, unless the amount and timing of the expenditures are fixed or reliably determinable. Legal costs are expensed as incurred except incremental direct costs of the remediation effort which are accrued as part of the measurement of the environmental remediation liability. When environmental laws might be deemed to impose joint and several liability for the costs of responding to contamination, the Company accrues its allocable share of the liability taking into account the number of parties participating, their ability to pay their shares, the volumes and nature of the wastes involved, the nature of anticipated response actions, and the nature of the Company's alleged connections. Recoveries of environmental remediation costs from other parties are recorded as assets when their receipt is deemed probable. Unanticipated changes in circumstances and/or legal requirements could extend the length of time over which the Company pays its remediation costs or could increase actual cash expenditures for remediation in any period.
Warranty Obligations
The Company's estimated obligations for warranty are accrued concurrently with the revenue recognized. The Company records a provision for its warranty obligations based on historical costs incurred for such obligations and adjusts, where appropriate, for current conditions and factors. The Company's ability to estimate its warranty obligations is subject to significant uncertainties, including continuous changes in product designs.
Long-Lived Assets
Property, Plant and Equipment and Intangibles
The Company makes judgments and estimates in conjunction with the carrying value of property, plant and equipment, other intangibles, and other assets, including amounts to be capitalized, depreciation and amortization methods and useful lives. Additionally, the carrying values of these assets are reviewed for impairment whenever events or changes in circumstances indicate that carrying value may not be recoverable. The Company determines that the carrying amount is not recoverable if it exceeds the sum of the undiscounted cash flows expected to result from the use and eventual disposition of the asset. If the carrying value exceeds the sum of the undiscounted cash flows, an impairment charge is recorded in the period in which such review is performed. The Company measures the impairment loss as the amount by which the carrying amount of the long-lived asset exceeds its fair value as determined by quoted market prices in active markets or by discounted cash flows. This requires the Company to make long-term forecasts of its future revenues and costs related to the assets subject to review. Forecasts require assumptions about demand for the Company's products and future market conditions. Future events and unanticipated changes to assumptions could require a provision for impairment in a future period.
The Company monitors relevant circumstances, including industry trends, general economic conditions, and the potential impact that such circumstances might have on the valuation of its identifiable intangibles. Events and changes in circumstances that may cause a triggering event and necessitate such a review include, but are not limited to: a decrease in sales for certain customers, improvements or changes in technology, and/or a decision to phase-out a trademark or trade name. Such events could
52
Table of Contents
QUANEX BUILDING PRODUCTS CORPORATION
NOTES TO CONSOLIDATED FINANCIAL STATEMENTS (continued)
negatively impact the carrying value of the Company's identifiable intangibles. It is possible that changes in such circumstances or in the numerous variables associated with the judgments, assumptions, and estimates made by the Company in assessing the appropriate valuation of its identifiable intangibles could require the Company to further write down a portion of its identifiable intangibles and record related non-cash impairment charges in the future. The Company applies a variety of techniques to establish the carrying value of its intangible assets, including the relief from royalty and excess current year earnings methods.
Software development costs, including costs incurred to purchase third-party software, are capitalized when we have determined that technology exists to achieve the Company's performance requirements and management has authorized funding for the project. Capitalization of software costs ceases when the software is substantially complete and is ready for its intended use, at which time they are amortized over their estimated useful life. When events or circumstances indicate the carrying value of internal use software might not be recoverable, the Company assesses the recoverability of these assets by determining whether the amortization of the asset balance over its remaining life can be recovered through undiscounted future operating cash flows.
Property, plant and equipment is stated at cost and is depreciated using the straight-line method over the estimated useful lives of the assets. The estimated useful lives of certain categories are as follows:
| Years |
Land improvements | 7 to 25 |
Buildings | 25 to 40 |
Building improvements | 5 to 20 |
Leasehold improvements | Over lease term (1) |
Machinery and equipment | 2 to 15 |
(1) | Leasehold improvements are depreciated over the shorter of their estimated useful lives or the term of the lease. |
Goodwill
The acquisition method of accounting for business combinations requires the Company to make use of estimates and judgments to allocate the purchase price paid for acquisitions to the fair value of the net tangible and identifiable intangible assets. The Company performs a goodwill impairment test annually as of August 31. In addition, goodwill would be tested more frequently if changes in circumstances or the occurrence of events indicates that a potential impairment exists. The Company tests for impairment of its goodwill using a two-step approach as prescribed in ASC Topic 350 " Intangibles – Goodwill and Other " (ASC 350). The first step of the Company's goodwill impairment test compares the fair value of each reporting unit with its carrying value including assigned goodwill. The second step of the Company's goodwill impairment test is required only in situations where the carrying value of the reporting unit exceeds its fair value as determined in the first step. In such instances, the Company compares the implied fair value of goodwill to its carrying value. The implied fair value of goodwill is determined by allocating the fair value of a reporting unit to all of the assets and liabilities of that unit as if the reporting unit had been acquired in a business combination and the fair value of the reporting unit was the price paid to acquire the reporting unit. The excess of the fair value of a reporting unit over the amounts assigned to its assets and liabilities is the implied fair value of goodwill. An impairment loss is recorded to the extent that the carrying amount of the reporting unit goodwill exceeds the implied fair value of that goodwill. The Company uses the present value of future cash flows to determine fair value in combination with the market approach. Future cash flows are typically based upon appropriate future periods for the businesses and an estimated residual value. Management judgment is required in the estimation of future operating results and to determine the appropriate residual values. The residual values are determined by reference to an exchange transaction in an existing market for that asset. Future operating results and residual values could reasonably differ from the estimates and could require a provision for impairment in a future period.
Income Taxes
The Company records the estimated future tax effects of temporary differences between the tax basis of assets and liabilities and the amounts reported in the Company's Consolidated Balance Sheets, as well as net operating losses and tax credit carry forwards. The Company evaluates the carrying value of the net deferred tax assets and determines whether it will be able to generate sufficient future taxable income to realize its deferred tax assets. This evaluation is based on estimating future taxable income using the same forecasts used to test long-lived assets and intangibles for impairment, scheduling out the future reversal of existing taxable temporary differences and reviewing the Company's most recent financial operations. In the event the estimates
53
Table of Contents
QUANEX BUILDING PRODUCTS CORPORATION
NOTES TO CONSOLIDATED FINANCIAL STATEMENTS (continued)
and assumptions indicate the Company will not generate sufficient future taxable income to realize its deferred tax assets, the Company records a valuation allowance against a portion of its deferred tax assets.
Insurance
The Company manages its costs of workers' compensation, group medical, property, casualty and other liability exposures through a combination of self-insurance retentions and insurance coverage with third-party carriers. Liabilities associated with the Company's portion of these exposures are not discounted and are estimated by considering various factors which may include historical claims experience, severity factors, estimated claims incurred but not reported and loss development factors, which are estimates on how claims will develop over time until the claims are closed, as appropriate. While the Company considers a number of factors in preparing the estimates, sensitive assumptions using significant judgment are made in determining the amounts accrued in the financial statements. Actual claims can differ significantly from estimated liabilities if future claims experience differs from historical experience and assumptions used in the Company's analysis are adjusted. Insurance recoveries are not recognized until any contingencies relating to the claim have been resolved.
Stock–Based Compensation
In accordance with ASC Topic 718 " Compensation – Stock Compensation " (ASC 718), the Company determines the fair value of share awards on the date of grant using the Black-Scholes valuation model. The Company recognizes the fair value as compensation expense on a straight-line basis over the requisite service period of the award based on awards ultimately expected to vest. Under ASC 718, the Company amortizes new option grants to retirement-eligible employees immediately upon grant, consistent with the retirement vesting acceleration provisions of these grants. For employees near retirement age, the Company amortizes such grants over the period from the grant date to the retirement date if such period is shorter than the standard vesting schedule. In accordance with ASC Topic 230-10-45-14 " Statement of Cash Flows – Cash Flows From Financing Activities " (ASC 230-10-45-14), the Consolidated Statements of Cash Flow report the excess tax benefits from the stock-based compensation as financing cash inflows. See Note 14 for additional information related to the Company's stock-based compensation.
The Company's fair value determination of stock-based payment awards on the date of grant using an option-pricing model is affected by the Company's stock price as well as assumptions regarding a number of highly complex and subjective variables. These variables include, but are not limited to, the Company's expected stock price volatility over the term of the awards and actual and projected employee stock option exercise behavior. Option-pricing models were developed for use in estimating the value of traded options that have no vesting or hedging restrictions and are fully transferable.
Retirement Plans
The Company sponsors a defined benefit pension plan and an unfunded postretirement plan that provides health care and life insurance benefits for eligible retirees and dependents. The measurement of liabilities related to these plans is based on management's assumptions related to future events, including expected return on plan assets, rate of compensation increases, and heath care cost trend rates. The discount rate reflects the rate at which benefits could be effectively settled on the measurement date. The Company determines its discount rate based on a pension discount curve, and the rate represents the single rate that, if applied to every year of projected benefits payments, would result in the same discounted value as the array of rates that comprise the pension discount curve. Actual pension plan asset investment performance, as well as other economic experience such as discount rate and demographic experience, will either reduce or increase unamortized pension losses at the end of any fiscal year, which ultimately affects future pension costs.
Treasury Stock
The Company records treasury stock purchases under the cost method whereby the entire cost of the acquired stock is recorded as treasury stock. The Company uses a moving average method on the subsequent reissuance of shares, and any resulting proceeds in excess of cost are credited to additional paid in capital while any deficiency is charged to retained earnings.
Foreign Currency Translation
The Company's consolidated financial statements are presented in U.S. dollars. The assets and liabilities of operations denominated in other functional currencies are translated to U.S dollars using the exchange rates as of the balance sheet date. Revenues and expenses are translated at the average exchange rates during the period. The translation adjustments resulting from this process are reflected in Accumulated other comprehensive income (loss) on the Consolidated Balance Sheets.
54
Table of Contents
QUANEX BUILDING PRODUCTS CORPORATION
NOTES TO CONSOLIDATED FINANCIAL STATEMENTS (continued)
Occasionally, an entity will enter into transactions that are denominated in currencies other than its functional currency. In these cases, the assets/liabilities and revenues/expenses related to these transactions are translated into the functional currency and the resulting gains or losses are recorded as a component of Other, net in the Consolidated Statements of Income.
Derivative Instruments
The Company utilizes financial and commodity-based derivative contracts to manage its exposure to fluctuations in foreign currency exchange rates and aluminum prices. All derivatives are measured at fair value on a recurring basis and the methodology and classifications are discussed further in Note 18. The derivative instruments utilized by the Company have not been designated as hedges under ASC Topic 815 " Derivatives and Hedging " (ASC 815) and therefore all gains and losses, both realized and unrealized are recognized in the Consolidated Statements of Income. The Company does not enter into derivative instruments for speculative or trading purposes, therefore, they are considered economic hedges which are reflected in the operating activities section of the Consolidated Statements of Cash Flow.
Discontinued Operations
In accordance with ASC Topic 205-20 " Presentation of Financial Statements-Discontinued Operations " (ASC 205-20), the Company presents the results of operations, financial position and cash flows of operations that have either been sold or that meet the criteria for "held for sale accounting" as discontinued operations. At the time an operation qualifies for held for sale accounting, the operation is evaluated to determine whether or not the carrying value exceeds its fair value less cost to sell. Any loss as a result of carrying value in excess of fair value less cost to sell is recorded in the period the operation meets held for sale accounting. Management judgment is required to (1) assess the criteria required to meet held for sale accounting, and (2) estimate fair value. Changes to the operation could cause it to no longer qualify for held for sale accounting and changes to fair value could result in an increase to previously recognized losses.
Reclassifications
Certain reclassifications included within the Consolidated Statements of Cash Flow in prior year financial statements have been made to conform to the 2012 presentation. The reclassifications include providing more detail related to Restructuring charges as well as (Gain) loss on disposition of property to conform with the current year presentation. Such reclassifications have no impact on earnings or cash flows provided by operations.
Earnings per Share Data
Basic earnings per share are based on the weighted average number of common shares outstanding. Diluted earnings per share are based on the weighted average number of common shares outstanding plus all potentially dilutive securities that are assumed to be converted into common shares at the beginning of the period under the treasury stock method. This method requires that the effect of potentially dilutive common stock equivalents (options and restricted stock) be excluded from the calculation of diluted earnings per share for the periods in which losses from continuing operations are reported because the effect is anti-dilutive.
Statements of Cash Flows
The Company generally considers all highly liquid debt instruments purchased with a maturity of three months or less to be cash equivalents. Similar investments with original maturities beyond three months are considered short-term investments.
Supplemental cash flow information is as follows:
55
Table of Contents
QUANEX BUILDING PRODUCTS CORPORATION
NOTES TO CONSOLIDATED FINANCIAL STATEMENTS (continued)
| Years Ended October 31, | ||||||||||
| 2012 |
| 2011 |
| 2010 | ||||||
Supplemental cash flow information: | (In thousands) | ||||||||||
Cash paid for interest | $ | 381 | |
| $ | 425 | |
| $ | 373 | |
Cash paid for income taxes | 1,265 | |
| 3,260 | |
| 5,635 | | |||
Cash received for income tax refunds | 19 | |
| 132 | |
| 12,280 | | |||
Supplemental disclosure of noncash investing and financing activities: |
|
|
|
|
| ||||||
Share value cancelled to satisfy tax withholdings | $ | 645 | |
| $ | 1,066 | |
| $ | 53 | |
Reduction of unrecognized tax benefit related to Separation | 3,571 | |
| - | |
| - | | |||
Capitalized expenditures financed through accounts payable and accrued liabilities | 395 | |
| 2,459 | |
| 3,015 | | |||
2. | New Accounting Pronouncements |
In May 2011, the FASB issued Accounting Standards Update No. 2011-04 (ASU 2011-04), Fair Value Measurement (ASC Topic 820) Amendments to Achieve Common Fair Value Measurement and Disclosure Requirements in U.S. GAAP and IFRSs . The amended guidance changes the wording used to describe many requirements in U.S. GAAP for measuring fair value and for disclosing information about fair value measurements. Additionally, the amendments clarify the FASB's intent about the application of existing fair value measurement requirements. The guidance provided in ASU 2011-04 is effective for interim and annual periods beginning after December 15, 2011 (February 1, 2012 for the Company) and is applied prospectively. The adoption of ASU 2011-04 did not have a material impact on the Company's consolidated financial statements.
In June 2011, the FASB issued Accounting Standards Update No. 2011-05 (ASU 2011-05), Presentation of Comprehensive Income . This amendment will require companies to present the components of net income and other comprehensive income either as one continuous statement or as two consecutive statements. It eliminates the option to present components of other comprehensive income as part of the statement of changes in stockholders' equity. The amended guidance, which must be applied retroactively, is effective for fiscal years, and interim periods within those years, beginning after December 15, 2011 (November 1, 2012 for the Company), with earlier adoption permitted. ASU 2011-05 impacts presentation only and will have no effect on the Company's financial condition, results of operations or cash flows. In December 2011, the FASB issued Accounting Standards Update No. 2011-12 (ASU 2011-12), " Deferral of the Effective Date for Amendments to the Presentation of Reclassifications of Items Out of Accumulated Other Comprehensive Income in Accounting Standards Update No. 2011-05 ." ASU 2011-12 deferred the effective date of ASU 2011-05 related to the presentation of reclassifications of items out of accumulated other comprehensive income. All other requirements of ASU 2011-05 were not affected by ASU 2011-12.
In September 2011, the FASB issued Accounting Standards Update No. 2011-08 (ASU 2011-08), Testing Goodwill for Impairment which amends the guidance in ASC 350-20. The amendments in ASU 2011-08 provide entities with the option of performing a qualitative assessment before performing the first step of the two-step impairment test. If entities determine, on the basis of qualitative factors, it is not more likely than not that the fair value of the reporting unit is less than the carrying amount, then performing the two-step impairment test would be unnecessary. However, if an entity concludes otherwise, then it is required to perform the first step of the two-step impairment test by calculating the fair value of the reporting unit and comparing the fair value with the carrying amount of the reporting unit. If the carrying amount of a reporting unit exceeds its fair value, then the entity is required to perform the second step of the goodwill impairment test to measure the amount of the impairment loss, if any. ASU 2011-08 also provides entities with the option to bypass the qualitative assessment for any reporting unit in any period and proceed directly to the first step of the two-step impairment test. ASU 2011-08 is effective for annual and interim goodwill impairment tests performed for fiscal years beginning after December 15, 2011, although early adoption is permitted (November 1, 2012 for the Company). The provisions of ASU 2011-08 will not have a material effect on the Company's consolidated financial statements.
In December 2011, the FASB issued Accounting Standards Update No. 2011-11 (ASU 2011-11), Disclosures about Offsetting Assets and Liabilities, where entities are required to disclose both gross information and net information about both instruments and transactions eligible for offset in the statement of financial position and instruments and transactions subject to an agreement similar to a master netting arrangement. ASU 2011-11 is effective for the Company on November 1, 2013. The Company currently discloses gross and net information for transactions within the scope of this statement.
56
Table of Contents
QUANEX BUILDING PRODUCTS CORPORATION
NOTES TO CONSOLIDATED FINANCIAL STATEMENTS (continued)
3. | Acquisitions |
On March 31, 2011 , Quanex completed its acquisition of Edgetech I.G., Inc., an Ohio corporation (Edgetech I.G.), the United Kingdom division of Edgetech (Edgetech UK), and Edgetech Europe GmbH, a German company (Edgetech Germany). These entities are hereafter referred to as "Edgetech." Headquartered in Cambridge, Ohio, Edgetech has three manufacturing facilities located in the United States, the United Kingdom and Germany that produce a full line of warm-edge, dual seal insulating glass spacer systems for window and door customers in North America and abroad. Edgetech's products separate and seal double and triple paned glass within a window and act as a thermal barrier that enhances the window's energy efficiency.
Quanex acquired Edgetech by merging its wholly-owned subsidiary, QSB Inc., a Delaware corporation (QSB), with and into Lauren International, Inc. formerly known as Lauren Holdco Inc., an Ohio corporation and parent of the Edgetech Entities (Holdco), pursuant to the terms and conditions of the previously filed Agreement and Plan of Merger (the Merger Agreement), dated as of January 31, 2011, among the Company, QSB, Lauren International Ltd. fka Lauren International Inc., a privately-held Ohio corporation (Lauren), Holdco and Kevin E. Gray, as agent for the shareholders of Holdco (Agent). Holdco is now the Company's wholly-owned subsidiary. As consideration for the acquisition of all of the issued and outstanding capital shares of Holdco, Quanex paid $104.4 million in cash, net of $0.8 million of cash acquired. Of the cash paid, $7.0 million was placed into an escrow fund to satisfy certain indemnity obligations under the Merger Agreement. Of the $7.0 million escrow, $3.5 million has been released in accordance with the terms of the agreement and $3.5 million remains as of October 31, 2012 . Additionally, Quanex is responsible for and has paid the tax liability resulting from the pre-closing reorganization of Lauren and its subsidiaries of $3.5 million .
Edgetech has been integrated into the Engineered Products segment. The acquisition of Edgetech complements Quanex's ongoing efforts to provide its customers with the broadest range of high quality components, products, systems and services the fenestration industry has to offer. The vast majority of windows manufactured today feature double or triple pane insulating glass, and with window production set to rise as the housing and R&R markets recover, Quanex believes that the long-term outlook for the business is excellent. The acquisition of Edgetech allows the Company to better serve its growing base of national and regional customers and further accelerate its international growth as Edgetech has a solid market presence overseas.
The Edgetech acquisition was accounted for as a business combination using the acquisition method of accounting under which the total purchase price consideration is allocated to assets and liabilities assumed based upon their fair values. Fair value measurements have been applied based on assumptions that market participants would use in the pricing of the asset or liability. The excess of the purchase price over the amounts assigned to tangible or intangible assets acquired and liabilities assumed is recognized as goodwill. The following table summarizes the fair values assigned to the assets and liabilities acquired as of the March 31, 2011 acquisition date:
57
Table of Contents
QUANEX BUILDING PRODUCTS CORPORATION
NOTES TO CONSOLIDATED FINANCIAL STATEMENTS (continued)
| As of Date of Opening Balance Sheet | ||
| (In thousands) | ||
Current assets: |
| ||
Cash and equivalents | $ | 828 | |
Accounts receivable | 9,181 | | |
Inventories | 10,123 | | |
Prepaid and other current assets | 2,023 | | |
Total current assets | 22,155 | | |
Property, plant and equipment | 21,086 | | |
Goodwill | 44,623 | | |
Intangible assets | 48,750 | | |
Other assets | 1,377 | | |
Total assets | $ | 137,991 | |
Current liabilities: |
| ||
Accounts payable | $ | 6,905 | |
Accrued liabilities | 1,315 | | |
Income taxes payable | 3,780 | | |
Deferred income taxes | 322 | | |
Current maturities of long-term debt | 24 | | |
Total current liabilities | 12,346 | | |
Long-term debt | 40 | | |
Deferred income taxes | 20,374 | | |
Total liabilities | 32,760 | | |
Investment | 105,231 | | |
Total liabilities and equity | $ | 137,991 | |
The purchase price allocation resulted in goodwill of $44.6 million , which is not deductible for income tax purposes. Goodwill consists of the excess of the purchase price over the fair value of the acquired assets and represents the estimated economic value attributable to future operations. The other intangible assets are being amortized over periods which reflect the pattern in which the economic benefits of the assets are expected to be realized. Specifically, the trademarks and trade names are being amortized over an average estimated useful life of 7 years, patents and other developed technology is being amortized over an average life of 10 years and customer relationships are being amortized over an average of 11 years. The weighted average useful life of intangible assets, excluding goodwill, created as a result of the acquisition is 10 years. No residual value is estimated for the intangible assets. The Company did not record any material adjustments to the original purchase price allocation during the year ended October 31, 2012 .
The Company recorded $2.5 million of transaction-related costs in connection with the Edgetech acquisition within Selling, general and administrative expense in its Consolidated Statement of Income during the year ended October 31, 2011 .
The Consolidated Statements of Income for the year ended October 31, 2011 , include seven months of financial results of Edgetech. For the seven months ended October 31, 2011 , Edgetech net sales and operating loss are $53.4 million and $0.3 million , respectively. In connection with applying the provisions of purchase accounting to state inventory at fair value, the Company increased Edgetech's inventory value by $2.0 million , which negatively impacts Quanex's Cost of sales following the acquisition. The Edgetech results were negatively impacted by $1.9 million of additional non-cash Cost of goods sold during the year ended October 31, 2011 due to the increased value of inventory sold from applying purchase accounting to the Edgetech inventory acquired. Additionally, Edgetech results include $3.0 million in amortization expense from the acquired intangibles for the year ended October 31, 2011 .
The following table provides unaudited pro forma consolidated results of operations for the combined entity for years
58
Table of Contents
QUANEX BUILDING PRODUCTS CORPORATION
NOTES TO CONSOLIDATED FINANCIAL STATEMENTS (continued)
ended October 31, 2011 and 2010 as if Edgetech had been acquired as of the first day of the Company's fiscal 2010 period.
| Unaudited Pro forma | ||||||
| Year Ended October 31, | ||||||
| 2011 |
| 2010 | ||||
| (In thousands, except per share amounts) | ||||||
Net sales | $ | 878,291 | |
| $ | 872,691 | |
Operating income (loss) | 20,530 | |
| 33,706 | | ||
Income (loss) from continuing operations | $ | 11,496 | |
| $ | 21,256 | |
Diluted earnings (loss) per common share from continuing operations | $ | 0.31 | |
| $ | 0.56 | |
The unaudited pro forma consolidated results of operations were prepared using the acquisition method of accounting and are based on the historical financial information of the Company and Edgetech. The unaudited pro forma financial information does not purport to reflect the results the combined company may achieve in future periods or the results that would have been obtained had Quanex acquired Edgetech on the first day of its fiscal 2010 period. The unaudited pro forma financial information does not include any operating efficiencies or cost savings that may be achieved or any integration expenses. Additionally, the historical Edgetech financial information has not been adjusted to remove expenses that will cease under Quanex's ownership, such as the prior parent company allocation, or to add incremental anticipated stand-alone expenses going forward. Generally, the pro forma financial information reflects the allocation of the purchase price to the appropriate assets and liabilities based upon their fair values, and related changes in depreciation and amortization expense. Accordingly, such amounts are not necessarily indicative of the results that would have occurred if the acquisition had occurred on the dates indicated or that may result in the future. The unaudited pro forma information reflects primarily the following unaudited pro forma adjustments:
• | Amortization expense related to the fair value of identifiable intangible assets acquired; |
• | Additional depreciation expense related to the fair value adjustment to property, plant and equipment acquired; |
• | Additional facility rental expense; |
• | Additional cost of goods sold of $2.0 million in the year ended October 31, 2010 to reflect the increased value of inventory sold as a result of applying purchase accounting, and a partially offsetting benefit in cost of goods sold of $1.8 million in the year ended October 31, 2011 ; |
• | Additional expense of $2.5 million in the year ended October 31, 2010 to reflect the transaction-related costs incurred, and an offsetting reduction of expense of $2.5 million in the year ended October 31, 2011 ; |
• | The Edgetech historical results and all of the above adjustments were adjusted for the applicable tax impact. |
In March 2011 , the Company also acquired JELD-WEN's vinyl extrusion assets in Yakima, Washington (Yakima) for $6.4 million in cash consideration. This acquisition was effected through an asset purchase of vinyl extrusion related equipment and certain other assets. Yakima was integrated into one of the Company's existing Engineered Products businesses, and the net assets acquired primarily included $5.0 million of property, plant and equipment and $1.4 million of intangible assets. There was no goodwill recognized in connection with the Yakima acquisition.
On December 17, 2012, the Company announced the signing of a definitive agreement to acquire the assets of Alumco, Inc. and its subsidiaries in an all cash transaction, expected to close during the first fiscal quarter of 2013. The assets to be purchased include Aluminite, a screen producer for the window and door industry. This acquisition will not be deemed to involve a significant amount of assets, and cash on hand will be used for the purchase price.
4. | Goodwill and Acquired Intangible Assets |
Goodwill
All of the Company's goodwill relates to the Engineered Products segment. The changes in the carrying amount of goodwill for the years ended October 31, 2012 and 2011 are as follows (in thousands):
59
Table of Contents
QUANEX BUILDING PRODUCTS CORPORATION
NOTES TO CONSOLIDATED FINANCIAL STATEMENTS (continued)
| Engineered Products Goodwill | ||
Balance at October 31, 2010 | $ | 25,189 | |
Acquisition | 44,623 | | |
Foreign currency translation adjustment | (380 | ) | |
Balance at October 31, 2011 | $ | 69,432 | |
Foreign currency translation adjustment | (1,101 | ) | |
Balance at October 31, 2012 | $ | 68,331 | |
In accordance with ASC Topic 350, " Goodwill and Other Intangible Assets ," a detailed determination of the fair value of the reporting unit may be carried forward from one year to the next if all of the following conditions are met: a) assets and liabilities that make up the reporting unit have not changed since the previous year's fair value determination, b) the most recent fair value determination resulted in an amount that exceeded the carrying amount of the reporting unit by a substantial margin, c) based on analysis of events that have occurred and circumstances that have changed since the most recent fair value determination, the likelihood that a current fair value determination would be less than the current carrying amount of the reporting unit is remote. Based on the Company's analysis of the above criteria, the Company carried forward the fiscal 2009 detailed determination of the fair value of its reporting units to fiscal 2010 . As the fair value of the reporting units exceeded their respective carrying amount, no impairment of goodwill was incurred at August 31, 2010.
Pursuant to the policy described in Note 2, the Company tested the recoverability of its goodwill balances as of August 31, 2012 and 2011 and concluded that they were not impaired at either date.
Acquired Intangible Assets
Intangible assets consist of the following (in thousands):
| As of October 31, 2012 |
| As of October 31, 2011 | ||||||||||||
| Gross Carrying Amount |
| Accumulated Amortization |
| Gross Carrying Amount |
| Accumulated Amortization | ||||||||
Intangible assets subject to amortization: |
|
|
|
|
|
|
| ||||||||
Patents and other technology | $ | 24,773 | |
| $ | (9,382 | ) |
| $ | 25,300 | |
| $ | (7,552 | ) |
Trademarks and trade names | 44,519 | |
| (14,520 | ) |
| 44,857 | |
| (11,540 | ) | ||||
Customer relationships | 43,737 | |
| (11,675 | ) |
| 44,260 | |
| (8,588 | ) | ||||
Other | 1,392 | |
| (464 | ) |
| 1,392 | |
| (186 | ) | ||||
Total | $ | 114,421 | |
| $ | (36,041 | ) |
| $ | 115,809 | |
| $ | (27,866 | ) |
The intangible assets are being amortized over the period they are expected to contribute to the future cash flows of the Company. No residual value is estimated for the intangible assets.
The aggregate amortization expense for intangibles for the years ended October 31, 2012 , 2011 , and 2010 is $8.2 million , $6.3 million and $3.1 million , respectively. Estimated amortization expense for the next five years for existing intangibles follows (in thousands):
60
Table of Contents
QUANEX BUILDING PRODUCTS CORPORATION
NOTES TO CONSOLIDATED FINANCIAL STATEMENTS (continued)
Fiscal Years Ending October 31, |
| Estimated Amortization | ||
2013 |
| $ | 8,124 | |
2014 |
| 8,015 | | |
2015 |
| 7,887 | | |
2016 |
| 7,682 | | |
2017 |
| 7,590 | | |
The Company did not recognize any material impairments to its intangible assets during the years ended October 31, 2012 , 2011 or 2010 .
5. | Earnings per Share |
The Company incurred a loss from continuing operations during the year ended October 31, 2012 . As such, common stock equivalents, which included 0.1 million restricted shares and 0.4 million options, were excluded from the calculation of diluted earnings per share because the effect would be anti-dilutive. Therefore, the basic and diluted earnings per share presented on the Consolidated Statements of Income are the same.
The tables below set forth the computation of basic and diluted earnings per share for the years ended October 31, 2011 and 2010 .
| For the Year Ended October 31, 2011 | |||||||||
| Numerator (Income) |
| Denominator (Shares) |
| Per Share Amount | |||||
Basic earnings and earnings per share | $ | 9,078 | |
| 37,007 | |
| $ | 0.24 | |
Effect of dilutive securities: |
|
|
|
|
| |||||
Common stock equivalents arising from stock options | - | |
| 328 | |
|
| |||
Restricted stock | - | |
| 202 | |
|
| |||
Diluted earnings and earnings per share | $ | 9,078 | |
| 37,537 | |
| $ | 0.24 | |
| For the Year Ended October 31, 2010 | |||||||||
| Numerator (Income) |
| Denominator (Shares) |
| Per Share Amount | |||||
Basic earnings and earnings per share | $ | 24,201 | |
| 37,220 | |
| $ | 0.65 | |
Effect of dilutive securities: |
|
|
|
|
| |||||
Common stock equivalents arising from stock options | - | |
| 261 | |
|
| |||
Restricted stock | - | |
| 190 | |
|
| |||
Diluted earnings and earnings per share | $ | 24,201 | |
| 37,671 | |
| $ | 0.64 | |
For the years ended October 31, 2012 , 2011 and 2010 , the Company had 0.8 million , 0.7 million and 0.3 million of stock options, respectively, that are potentially dilutive in future earnings per share calculations. Such dilution will be dependent on the excess of the market price of the Company's stock over the exercise price and other components of the treasury stock method.
6. | Inventories |
Inventories consist of the following:
61
Table of Contents
QUANEX BUILDING PRODUCTS CORPORATION
NOTES TO CONSOLIDATED FINANCIAL STATEMENTS (continued)
| October 31, | ||||||
| 2012 |
| 2011 | ||||
| (In thousands) | ||||||
Raw materials | $ | 30,400 | |
| $ | 27,862 | |
Finished goods and work in process | 32,937 | |
| 24,988 | | ||
Supplies and other | 2,567 | |
| 2,992 | | ||
Total | $ | 65,904 | |
| $ | 55,842 | |
Fixed costs related to excess manufacturing capacity, if any, have been expensed in the period, and therefore, are not capitalized into inventory. The values of inventories are based on the following accounting methods:
| October 31, | ||||||
| 2012 |
| 2011 | ||||
| (In thousands) | ||||||
LIFO | $ | 28,224 | |
| $ | 18,782 | |
FIFO | 37,680 | |
| 37,060 | | ||
Total | $ | 65,904 | |
| $ | 55,842 | |
With respect to inventories valued using the LIFO method, replacement cost exceeded the LIFO value by approximately $10.7 million and $12.3 million at October 31, 2012 and 2011 , respectively. During fiscal 2011 and fiscal 2010 , there were LIFO liquidations that resulted in a reduction of the LIFO reserve (credit to cost of sales) of approximately $0.9 million and $1.2 million , respectively. The LIFO liquidations increased the amount of income recognized in the respective years compared to what would have been recognized had there been no liquidations. There were no LIFO liquidations during fiscal 2012 .
LIFO reserve adjustments are treated as corporate expenses as this matches how management reviews the businesses. The LIFO reserve adjustments are calculated on a consolidated basis in a single consolidated pool using the dollar-value link chain method. Upon completion of the consolidated calculation, the resulting reserve that is recorded to reflect inventories at their LIFO values is not allocated to the segments. Management believes LIFO reserves to be a corporate item and thus performs all reviews of segment operations on a FIFO or weighted-average basis.
Acquisitions are integrated into the Company's operations with some valuing inventory on a LIFO basis and others on a FIFO basis. The selection of the inventory valuation treatment of each acquisition depends on the facts and circumstances that existed at the time of the acquisition, including expected inventory levels and pricing expected in the foreseeable future; this evaluation is applied on each transaction individually. As discussed above, management reviews all of the businesses on a FIFO or weighted-average basis for comparability, with the LIFO reserve treated as a corporate item.
7. | Property, Plant and Equipment |
Property, plant and equipment consist of the following:
| October 31, | ||||||
| 2012 |
| 2011 | ||||
| (In thousands) | ||||||
Land and land improvements | $ | 9,553 | |
| $ | 9,608 | |
Buildings and building improvements | 76,810 | |
| 71,170 | | ||
Machinery and equipment | 391,897 | |
| 374,733 | | ||
Construction in progress | 24,515 | |
| 14,983 | | ||
Property, plant and equipment, gross | 502,775 | |
| 470,494 | | ||
Less: accumulated depreciation and amortization | (333,898 | ) |
| (312,285 | ) | ||
Property, plant and equipment, net | $ | 168,877 | |
| $ | 158,209 | |
62
Table of Contents
QUANEX BUILDING PRODUCTS CORPORATION
NOTES TO CONSOLIDATED FINANCIAL STATEMENTS (continued)
As of October 31, 2012 and 2011 , Construction in progress included approximately $15.8 million and $8.2 million of capitalized software costs related to the Company's implementation of an enterprise resource planning system that had not yet been placed in service.
Depreciation expense for the years ended October 31, 2012 , 2011 , and 2010 was $29.4 million , $27.6 million , and $25.1 million , respectively. During 2012 and 2011 , the Company recognized impairments of $0.7 million and $1.6 million , primarily related to a manufacturing facility that it intends to market for sale during fiscal 2013. Please refer to Note 20 for additional details. The Company had commitments for the purchase or construction of capital assets amounting to approximately $7.2 million at October 31, 2012 .
8. | Accrued Liabilities |
Accrued liabilities consist of the following:
| October 31, | ||||||
| 2012 |
| 2011 | ||||
| (In thousands) | ||||||
Payroll, payroll taxes and employee benefits | $ | 21,458 | |
| $ | 13,877 | |
Accrued insurance and workers compensation | 4,212 | |
| 6,337 | | ||
Sales allowances | 5,509 | |
| 3,572 | | ||
Accrued capital expenditures | 1,242 | |
| 2,576 | | ||
Deferred revenue | 2,353 | |
| 2,593 | | ||
Environmental | 1,700 | |
| 1,965 | | ||
Warranties | 2,045 | |
| 1,671 | | ||
Audit, legal, and other miscellaneous professional fees | 2,847 | |
| 1,380 | | ||
Accrued rent | 1,076 | |
| 1,267 | | ||
Other | 4,017 | |
| 2,820 | | ||
Accrued liabilities | $ | 46,459 | |
| $ | 38,058 | |
9. | Income Taxes |
Income taxes are provided on taxable income at the statutory rates applicable to such income. Components of income taxes excluding discontinued operations are as follows:
| Year Ended October 31, | ||||||||||
| 2012 |
| 2011 |
| 2010 | ||||||
Income / (loss) from continuing operations before income taxes (in thousands) |
|
|
|
|
| ||||||
U.S. | $ | (24,858 | ) |
| $ | 17,610 | |
| $ | 39,602 | |
Non-U.S. | (327 | ) |
| (2,095 | ) |
| (100 | ) | |||
Total | $ | (25,185 | ) |
| $ | 15,515 | |
| $ | 39,502 | |
63
Table of Contents
QUANEX BUILDING PRODUCTS CORPORATION
NOTES TO CONSOLIDATED FINANCIAL STATEMENTS (continued)
| Year Ended October 31, | ||||||||||
| 2012 |
| 2011 |
| 2010 | ||||||
Income tax expense / (benefit) (in thousands) |
|
|
|
|
| ||||||
Current |
|
|
|
|
| ||||||
Federal | $ | 257 | |
| $ | 1,949 | |
| $ | 2,729 | |
State and local | 320 | |
| 390 | |
| 386 | | |||
Non-U.S. | 615 | |
| 737 | |
| (108 | ) | |||
Total current | 1,192 | |
| 3,076 | |
| 3,007 | | |||
Deferred |
|
|
|
|
| ||||||
Federal | (9,060 | ) |
| 3,964 | |
| 10,806 | | |||
State and local | (213 | ) |
| 596 | |
| 1,450 | | |||
Non-U.S. | (570 | ) |
| (1,199 | ) |
| 38 | | |||
Total deferred | (9,843 | ) |
| 3,361 | |
| 12,294 | | |||
Total | $ | (8,651 | ) |
| $ | 6,437 | |
| $ | 15,301 | |
| Year Ended October 31, | |||||||
| 2012 |
| 2011 |
| 2010 | |||
Reconciliation of effective tax rate |
|
|
|
|
| |||
U.S. tax at statutory rate | 35.0 | % |
| 35.0 | % |
| 35.0 | % |
State and local income tax | 3.9 | |
| 4.4 | |
| 3.0 | |
Non-U.S. income tax | (0.5 | ) |
| 1.1 | |
| - | |
Employee related items | (2.1 | ) |
| - | |
| - | |
Transaction costs | - | |
| 4.7 | |
| - | |
General business credits | 1.1 | |
| (2.6 | ) |
| - | |
Valuation allowance | (4.4 | ) |
| - | |
| - | |
Other | 1.3 | |
| (1.1 | ) |
| 0.7 | |
Effective tax rate | 34.3 | % |
| 41.5 | % |
| 38.7 | % |
Prepaid and other current assets on the Consolidated Balance Sheets include an income tax receivable of $1.3 million and $0.2 million as of October 31, 2012 and 2011 , respectively.
Significant components of the Company's net deferred tax assets are as follows:
64
Table of Contents
QUANEX BUILDING PRODUCTS CORPORATION
NOTES TO CONSOLIDATED FINANCIAL STATEMENTS (continued)
| October 31, | ||||||
| 2012 |
| 2011 | ||||
| (In thousands) | ||||||
Deferred tax assets: |
|
|
| ||||
Employee benefit obligations | $ | 14,948 | |
| $ | 11,224 | |
Goodwill and intangibles | 3,055 | |
| 6,580 | | ||
Accrued liabilities and reserves | 4,349 | |
| 4,122 | | ||
Pension and other benefit obligations | 3,720 | |
| 3,694 | | ||
Inventory | 3,858 | |
| 3,277 | | ||
Loss and tax credit carry forwards | 13,168 | |
| 2,505 | | ||
Other | 291 | |
| 373 | | ||
Total gross deferred tax assets | 43,389 | |
| 31,775 | | ||
Less: valuation allowance | (1,694 | ) |
| - | | ||
Total deferred tax assets, net of valuation allowance | 41,695 | |
| 31,775 | | ||
Deferred tax liabilities: |
|
|
| ||||
Property, plant and equipment | 3,322 | |
| 2,256 | | ||
Net deferred tax assets | $ | 38,373 | |
| $ | 29,519 | |
|
|
|
| ||||
Deferred income tax assets, non-current | $ | 17,934 | |
| $ | 18,299 | |
Deferred income tax assets, current | 20,439 | |
| 11,220 | | ||
Net deferred tax assets | $ | 38,373 | |
| $ | 29,519 | |
Operating loss carry forwards for tax purposes, mostly comprised of federal and state, were $69.0 million at October 31, 2012 . Most of these losses begin to expire in 2025. Tax credits available to offset future tax liabilities are $0.6 million and are not expected to be utilized within the next twelve months. Tax benefits of operating losses and tax credit carry forwards are evaluated on an ongoing basis, including a review of historical and projected future operation results, the eligible carry forward period and other circumstances. The Company recorded a state operating loss valuation allowance, net of federal taxes, of $1.1 million in 2012 . In assessing the need for a valuation allowance, the Company considers both positive and negative evidence related to the likelihood of realization of the deferred tax assets.
A reconciliation of the change in the unrecognized income tax benefit balance from November 1, 2009 to October 31, 2012 is as follows (in thousands):
| Accrued Interest and Penalties |
| Unrecognized Income Tax Benefits | ||||
Balance at November 1, 2009 | $ | 209 | |
| $ | 18,332 | |
Additions for tax positions related to the current year | - | |
| 13 | | ||
Additions for tax positions related to the prior year | 227 | |
| 270 | | ||
Balance at October 31, 2010 | $ | 436 | |
| $ | 18,615 | |
Additions for tax positions related to the current year | - | |
| 13 | | ||
Additions for tax positions related to the prior year | 301 | |
| 414 | | ||
Balance at October 31, 2011 | $ | 737 | |
| $ | 19,042 | |
Additions for tax positions related to the current year | - | |
| 12 | | ||
Additions for tax positions related to the prior year | 266 | |
| 276 | | ||
Lapse in statute of limitations | (440 | ) |
| (3,571 | ) | ||
Balance at October 31, 2012 | $ | 563 | |
| $ | 15,759 | |
The table below indicates where the unrecognized tax benefit (UTB) is reflected in the Consolidated Balance Sheets:
65
Table of Contents
QUANEX BUILDING PRODUCTS CORPORATION
NOTES TO CONSOLIDATED FINANCIAL STATEMENTS (continued)
| October 31, | ||||||
| 2012 |
| 2011 | ||||
| (In thousands) | ||||||
Amounts Reflected in the Consolidated Balance Sheet: |
|
|
| ||||
Liability for uncertain tax positions | $ | 6,736 | |
| $ | 8,412 | |
Deferred income taxes (non-current assets) | 9,023 | |
| 10,630 | | ||
Total unrecognized tax benefit | $ | 15,759 | |
| $ | 19,042 | |
The Company's UTB is related to the Separation as discussed in Note 1 and state tax items regarding the interpretations of tax laws and regulations. The UTB includes $14.7 million for which the disallowance of such items would not affect the annual effective tax rate. In 2012 , the Company reduced the liability for uncertain tax positions related to the Separation by $3.6 million as a result of a lapse in the statute of limitations. This resulted in a non-cash increase to retained earnings in stockholders' equity of $2.9 million and a decrease in income tax expense of $0.7 million . For the years ended October 31, 2012 , 2011 and 2010 the Company recognized $0.3 million , $0.3 million and $0.2 million , respectively in interest and penalties, which are reported as Income tax expense in the Consolidated Statements of Income consistent with past practice.
The Company and its subsidiaries file income tax returns in the U.S. federal and various state jurisdictions as well as in the U.K., Germany and Canada. The Company is not currently under a tax examination, but in certain jurisdictions the statute of limitations has not yet expired. The Company generally remains subject to examination of its U.S. federal income tax returns for 2009 and subsequent years. The Company generally remains subject to examination of its various state income tax returns for a period of four to five years from the date the return was filed. The state impact of any federal changes remains subject to examination by various states for a period of up to one year after formal notification to the state of the federal change.
Judgment is required in assessing the future tax consequences of events that have been recognized in the Company's financial statements or income tax returns. The final outcome of the future tax consequences of legal proceedings, if any, as well as the outcome of competent authority proceedings, changes in regulatory tax laws, or interpretation of those tax laws could impact the Company's financial statements. The Company is subject to the effects of these matters occurring in various jurisdictions. The Company believes that it is reasonably possible that a decrease of approximately $2.7 million in the UTB may be recognized within the next twelve months as a result of a lapse in the statute of limitations.
10. | Long-Term Debt and Capital Lease Obligations |
Long-term debt consists of the following:
| October 31, | ||||||
| 2012 |
| 2011 | ||||
| (In thousands) | ||||||
Revolving Credit Facility | $ | - | |
| $ | - | |
City of Richmond, Kentucky Industrial Building Revenue Bonds | 800 | |
| 900 | | ||
Scott County, Iowa Industrial Waste Recycling Revenue Bonds | 400 | |
| 600 | | ||
Capital lease obligations and other | 201 | |
| 166 | | ||
Total debt | $ | 1,401 | |
| $ | 1,666 | |
Less: maturities due within one year included in current liabilities | 368 | |
| 352 | | ||
Long-term debt | $ | 1,033 | |
| $ | 1,314 | |
Credit Facility
The Company's $270.0 million Senior Unsecured Revolving Credit Facility (the Credit Facility) was executed on April 23, 2008 . The Credit Facility has a five -year term and is unsecured. The Credit Facility expires April 23, 2013 and provides for up to $50.0 million for standby letters of credit, limited to the undrawn amount available under the Credit Facility. Borrowings under the Credit Facility bear interest at a spread above LIBOR based on a combined leverage and ratings grid. Proceeds from the Credit Facility may be used to provide availability for acquisitions, working capital, capital expenditures and general corporate purposes.
66
Table of Contents
QUANEX BUILDING PRODUCTS CORPORATION
NOTES TO CONSOLIDATED FINANCIAL STATEMENTS (continued)
Under the Credit Facility, the Company is obligated to comply with certain financial covenants requiring the Company to maintain a Consolidated Leverage Ratio of no more than 3.25 to 1 and a Consolidated Interest Coverage Ratio of no less than 3.00 to 1. As defined by the Credit Facility's indenture, the Consolidated Leverage Ratio is the ratio of consolidated indebtedness as of such date to consolidated EBITDA and the Consolidated Interest Coverage Ratio is the ratio of consolidated EBITDA to consolidated interest expense, in each case for the previous four consecutive fiscal quarters. EBITDA is defined by the indenture to include proforma EBITDA of acquisitions and to exclude certain items like non-cash charges. Additionally, the Credit Facility contains certain limitations on additional indebtedness, asset or equity sales, and acquisitions. Dividends and other distributions are permitted so long as after giving effect to such dividend or stock repurchase, there is no event of default.
As of October 31, 2012 , the Company had no borrowings under the Credit Facility, and the Company was in compliance with all Credit Facility financial covenants. The availability under the Credit Facility is a function of both the facility amount utilized and meeting covenant requirements. Although there were no borrowings on the Credit Facility and only $5.5 million of outstanding letters of credit under the Credit Facility, the aggregate availability under the Credit Facility was limited by the Consolidated Leverage Ratio resulting in an availability of $102.6 million at October 31, 2012 . Quanex is currently in the process of negotiating a new Credit Facility, and expects to have finalized terms and conditions by the end of the first quarter.
Other Debt Instruments
The City of Richmond, Kentucky Industrial Building Revenue Bonds are due in annual installments through October 2020. Interest is payable monthly at a variable rate. The average rate during fiscal 2012 and fiscal 2011 was 0.6% and 0.6% , respectively. The Company has pledged the land, building and certain equipment of a facility located in Richmond, Kentucky. In addition, a $0.8 million letter of credit under the Credit Facility serves as a conduit for making the scheduled payments.
In June 1999, the Company borrowed $3.0 million through Scott County, Iowa Variable Rate Demand Industrial Waste Recycling Revenue Bonds Series 1999. The bonds require 15 annual principal payments of $200,000 beginning on July 1, 2000 . The variable interest rate is established by the remarketing agent based on the lowest weekly rate of interest that would permit the sale of the bonds at par, on the basis of prevailing financial market conditions. Interest is payable on the first business day of each calendar month . Interest rates on these bonds during fiscal 2012 have ranged from 0.5% to 1.6% . These bonds are secured by a Letter of Credit.
Additional Debt Disclosures
The Company's consolidated debt had a weighted average interest rate of 1.0% and 1.2% as of October 31, 2012 and October 31, 2011 , respectively. Approximately 86% and 90% of the total debt had a variable interest rate at October 31, 2012 and 2011 , respectively. As of October 31, 2012 and 2011 , the Company's debt of $1.4 million and $1.7 million approximates fair value as nearly all the Company's debt is at a variable interest rate. As of October 31, 2012 , the Company has $6.0 million in letters of credit, of which $5.5 million in letters of credit fall under the Credit Facility sublimit.
Aggregate maturities of long-term debt at October 31, 2012 , are as follows (in thousands):
2013 | $ | 368 | |
2014 | 352 | | |
2015 | 154 | | |
2016 | 108 | | |
2017 | 107 | | |
Thereafter | 312 | | |
Total | $ | 1,401 | |
11. | Retirement Plans |
The Company has a number of retirement plans covering substantially all employees. The Company provides both defined benefit and defined contribution plans. In general, the plant or location of his/her employment determines an employee's coverage for retirement benefits.
Pension Plan
67
Table of Contents
QUANEX BUILDING PRODUCTS CORPORATION
NOTES TO CONSOLIDATED FINANCIAL STATEMENTS (continued)
The Company has a non-contributory, single employer defined benefit pension plan that covers substantially all non-union employees. Effective January 1, 2007, the Company amended this defined benefit pension plan to include a new cash balance formula for all new salaried employees hired on or after January 1, 2007 and for any non-union employees who were not participating in a defined benefit plan prior to January 1, 2007. All new salaried employees are eligible to receive credits equivalent to 4% of their annual eligible wages, while some of the employees at the time of the amendment were "grandfathered" and are eligible to receive credits ranging up to 6.5% based upon a percentage they received in the defined contribution plan prior to the amendment of the pension plan. Additionally, every year the participants will receive an interest related credit on their respective balance equivalent to the prevailing 30-year Treasury rate . Benefits for participants in this plan prior to January 1, 2007 continue to be based on a more traditional formula for retirement benefits where the plan pays benefits to employees upon retirement, using a formula based upon years of service and pensionable compensation prior to retirement. Of the Company's participants, 99% are under the cash balance formula.
The Medicare Prescription Drug, Improvement and Modernization Act of 2003 was signed into law on December 8, 2003. This Act introduces a Medicare prescription-drug benefit beginning in 2006 as well as a federal subsidy to sponsors of retiree health care plans that provide a benefit at least "actuarially equivalent" to the Medicare benefit. Management has concluded that the Company's plans are at least "actuarially equivalent" to the Medicare benefit. The Company has not included the federal subsidy from the Act for those eligible. The impact to net periodic benefit cost and to benefits paid did not have a material impact on the Consolidated Financial Statements.
Funded Status and Net Periodic Benefit Cost
The funded status of the defined benefit pension plan at the respective year-ends was as follows:
| October 31, | ||||||
| 2012 |
| 2011 | ||||
| (In thousands) | ||||||
Change in Benefit Obligation |
|
|
| ||||
Benefit obligation at beginning of year (1) | $ | 20,662 | |
| $ | 15,615 | |
Service cost | 3,652 | |
| 3,794 | | ||
Interest cost | 815 | |
| 795 | | ||
Actuarial loss (gain) | 731 | |
| 1,760 | | ||
Benefits paid | (1,183 | ) |
| (994 | ) | ||
Administrative expenses | (270 | ) |
| (308 | ) | ||
Benefit obligation at end of year (1) | $ | 24,407 | |
| $ | 20,662 | |
Change in Plan Assets |
|
|
| ||||
Fair value of plan assets at beginning of year | $ | 14,004 | |
| $ | 12,950 | |
Actual return on plan assets | 1,811 | |
| 474 | | ||
Employer contributions | 4,200 | |
| 1,882 | | ||
Benefits paid | (1,183 | ) |
| (994 | ) | ||
Administrative expenses | (270 | ) |
| (308 | ) | ||
Fair value of plan assets at end of year | $ | 18,562 | |
| $ | 14,004 | |
Funded Status | $ | (5,845 | ) |
| $ | (6,658 | ) |
(1) | The benefit obligation is the projected benefit obligation. |
68
Table of Contents
QUANEX BUILDING PRODUCTS CORPORATION
NOTES TO CONSOLIDATED FINANCIAL STATEMENTS (continued)
| October 31, | ||||||
| 2012 |
| 2011 | ||||
| (In thousands) | ||||||
Amounts Recognized in the Consolidated Balance Sheet: |
|
|
| ||||
Deferred pension and postretirement benefits | $ | (5,845 | ) |
| $ | (6,658 | ) |
Net amount recognized | $ | (5,845 | ) |
| $ | (6,658 | ) |
| October 31, | ||||||
| 2012 |
| 2011 | ||||
| (In thousands) | ||||||
Amounts Recognized in Accumulated Other Comprehensive Income (pretax): |
|
|
| ||||
Net actuarial (gain) loss | $ | 4,771 | |
| $ | 4,837 | |
Net prior service cost (credit) | - | |
| - | | ||
Net transition obligation (asset) | - | |
| - | | ||
Total | $ | 4,771 | |
| $ | 4,837 | |
The accumulated benefit obligation is the present value of pension benefits (whether vested or unvested) attributed to employee service rendered before the measurement date and based on employee service and compensation prior to that date. The accumulated benefit obligation differs from the projected benefit obligation in that it includes no assumption about future compensation levels. The accumulated benefit obligations of the Company's pension plans as of the measurement dates in 2012 and 2011 were $23.7 million and $19.4 million , respectively. The projected benefit obligation, accumulated benefit obligation and fair value of plan assets for pension plans with accumulated benefit obligations in excess of plan assets were:
| October 31, | ||||||
| 2012 |
| 2011 | ||||
| (In thousands) | ||||||
Projected benefit obligation | $ | 24,407 | |
| $ | 20,662 | |
Accumulated benefit obligation | 23,749 | |
| 19,395 | | ||
Fair value of plan assets | 18,562 | |
| 14,004 | | ||
The net periodic benefit cost and other changes in plan assets and benefit obligations recognized in other comprehensive loss (income) (pretax) for the years ended October 31, 2012 , 2011 and 2010 were:
69
Table of Contents
QUANEX BUILDING PRODUCTS CORPORATION
NOTES TO CONSOLIDATED FINANCIAL STATEMENTS (continued)
| October 31, | ||||||||||
| 2012 |
| 2011 |
| 2010 | ||||||
| (In thousands) | ||||||||||
Net Periodic Benefit Cost: |
|
|
|
|
| ||||||
Service cost | $ | 3,652 | |
| $ | 3,794 | |
| $ | 3,357 | |
Interest cost | 815 | |
| 795 | |
| 661 | | |||
Expected return on plan assets | (1,161 | ) |
| (986 | ) |
| (754 | ) | |||
Amortization of net loss | 147 | |
| 134 | |
| 146 | | |||
Net periodic benefit cost | $ | 3,453 | |
| $ | 3,737 | |
| $ | 3,410 | |
Other changes in plan assets and benefit obligations recognized in other comprehensive loss (income) (pretax): |
|
|
|
|
| ||||||
Net loss (gain) arising during the period | $ | 81 | |
| $ | 2,271 | |
| $ | (998 | ) |
Prior service cost (credit) arising during the period | - | |
| - | |
| - | | |||
Amortization of gain (loss) | (147 | ) |
| (134 | ) |
| (146 | ) | |||
Amortization of prior service (cost) credit | - | |
| - | |
| - | | |||
Total recognized in other comprehensive loss (income) | $ | (66 | ) |
| $ | 2,137 | |
| $ | (1,144 | ) |
Total recognized in net periodic benefit cost and other comprehensive loss (income) | $ | 3,387 | |
| $ | 5,874 | |
| $ | 2,266 | |
The decrease in net pension cost from 2011 to 2012 is primarily attributable to a decrease in the expected return on plan assets. The increase in net pension cost from 2010 to 2011 is primarily attributable to a decrease in the discount rate which effectively increases pension costs and an increase in participants from the Edgetech acquisition.
The amount of prior service cost and net actuarial loss for the defined benefit pension plans that is expected to be amortized from accumulated other comprehensive income and reported as a component of net periodic benefit cost during fiscal 2012 is $0 and $249 thousand , respectively.
Measurement Date and Assumptions
The Company uses an October 31 measurement date for its defined benefit plans. The Company generally determines its actuarial assumptions on an annual basis. The assumptions for the pension benefit calculations for the years ended October 31, are as follows:
| Pension Benefits | |||||||
| October 31, | |||||||
| 2012 |
| 2011 |
| 2010 | |||
Weighted average assumptions to determine benefit obligation at year-end: |
|
|
|
|
| |||
Discount rate | 3.29 | % |
| 4.40 | % |
| 5.15 | % |
Rate of compensation increase | 2.50 | % |
| 4.00 | % |
| 4.00 | % |
Weighted average assumptions to determine net periodic benefit costs: |
|
|
|
|
| |||
Discount rate | 4.40 | % |
| 5.15 | % |
| 5.65 | % |
Expected return on plan assets | 7.25 | % |
| 7.25 | % |
| 8.00 | % |
Rate of compensation increase | 4.00 | % |
| 4.00 | % |
| 4.00 | % |
The discount rate is used to calculate the present value of the projected benefit obligation for pension benefits. The rate reflects the rate at which benefits could be effectively settled on the measurement date. For 2012 , 2011 and 2010 , the Company determined its discount rate based on a pension discount curve; and the rate represents the single rate that, if applied to every year
70
Table of Contents
QUANEX BUILDING PRODUCTS CORPORATION
NOTES TO CONSOLIDATED FINANCIAL STATEMENTS (continued)
of projected benefits payments, would result in the same discounted value as the array of rates that comprise the pension discount curve.
The expected return on plan assets is used to determine net periodic pension expense. The rate of return assumptions are based on projected long-term market returns for the various asset classes in which the plans are invested, weighted by the target asset allocations. The return assumption is reviewed at least annually. The rate of compensation increase represents the long-term assumption for expected increases to salaries.
Plan Assets
The Company's target allocation for the year ending October 31, 2012 and actual asset allocation by asset category and fair value measurements as of October 31, 2012 and 2011 are as follows:
| Target Allocation |
| Actual Allocation at | |||||
|
| October 31, | ||||||
|
| 2012 |
| 2011 | ||||
Equity securities | 60.0 | % |
| 60.0 | % |
| 59.0 | % |
Fixed income | 40.0 | % |
| 40.0 | % |
| 41.0 | % |
| Fair Value Measurements at | ||||||
| October 31, | ||||||
| 2012 |
| 2011 | ||||
| (In thousands) | ||||||
Large capitalization | $ | 5,918 | |
| $ | 4,426 | |
Small capitalization | 2,218 | |
| 1,679 | | ||
International equity | 1,993 | |
| 1,499 | | ||
Other | 929 | |
| 592 | | ||
Equity securities | $ | 11,058 | |
| $ | 8,196 | |
High-quality core bond | $ | 3,645 | |
| $ | 2,807 | |
High-quality government bond | 1,831 | |
| 1,434 | | ||
High-yield bond | 1,861 | |
| 1,463 | | ||
Fixed income | $ | 7,337 | |
| $ | 5,704 | |
Total securities (1) | $ | 18,395 | |
| $ | 13,900 | |
(1) | Quoted fair value prices are as of October 31, 2012 and 2011 and are quoted prices in active markets for identical assets (Level 1). |
Inputs and valuation techniques used to measure the fair value of plan assets vary according to the type of security being valued. All of the equity and debt securities held directly by the plans are actively traded and fair values are determined based on quoted market prices.
The Company's investment objective for defined benefit plan assets is to meet the plans' benefit obligations, while minimizing the potential for future required Company plan contributions. The investment strategies focus on asset class diversification, liquidity to meet benefit payments and an appropriate balance of long-term investment return and risk. Target ranges for asset allocations are determined by matching the actuarial projections of the plans' future liabilities and benefit payments with expected long-term rates of return on the assets, taking into account investment return volatility and correlations across asset classes. Plan assets are diversified across several investment managers and are generally invested in liquid funds that are selected to track broad market equity and bond indices. Investment risk is carefully controlled with plan assets rebalanced to target allocations on a periodic basis and continual monitoring of investment managers performance relative to the investment guidelines established with each investment manager.
71
Table of Contents
QUANEX BUILDING PRODUCTS CORPORATION
NOTES TO CONSOLIDATED FINANCIAL STATEMENTS (continued)
Expected Benefit Payments and Funding
The Company's pension funding policy generally has been to make the minimum annual contributions required by applicable regulations while considering targeted funded percentages. In fiscal 2010 , the Company decided to modify its funding strategy and accelerate contributions to target a 100% funding threshold. Additionally, the Company will consider funding fiscal year requirements early in the fiscal year to potentially maximize returns on assets. During the third quarter 2010, the Company contributed $2.7 million in addition to minimum funding requirements to achieve a 100% funded threshold. In fiscal 2012 and 2011 , the Company made total pension contributions of $4.2 million and $1.9 million , respectively.
During fiscal 2013 , the Company expects to contribute approximately $3.3 million to the pension plan to reach targeted funding levels and meet minimum contribution requirements. For the pension benefit plan, this is comprised of expected contributions to the plan. Expected contributions are dependent on many variables, including the variability of the market value of the assets as compared to the obligation and other market or regulatory conditions. In addition, the Company takes into consideration its business investment opportunities and resulting cash requirements. Accordingly, actual funding may differ greatly from current estimates.
Total benefit payments expected to be paid to participants, which include payments funded from the Company's assets, as discussed above, as well as payments paid from the plan are as follows:
Years Ended October 31, |
| Pension Benefits | ||
|
| (In thousands) | ||
2013 |
| $ | 1,773 | |
2014 |
| 1,823 | | |
2015 |
| 2,051 | | |
2016 |
| 2,214 | | |
2017 |
| 2,331 | | |
2018- 2022 |
| 13,785 | | |
Postretirement Benefit Plan
The Company provides certain healthcare and life insurance benefits for a small number of eligible retired employees employed prior to January 1, 1993. Certain employees may become eligible for those benefits if they reach normal retirement age while working for the Company. The Company continues to fund benefit costs on a pay-as-you-go basis. The table below indicates the amount and where the liability is recognized on the Consolidated Balance Sheets:
| October 31, | ||||||
| 2012 |
| 2011 | ||||
| (In thousands) | ||||||
Amounts Recognized in the Consolidated Balance Sheets: |
|
|
| ||||
Accrued liabilities | $ | 74 | |
| $ | 80 | |
Deferred pension and postretirement benefits | 1,035 | |
| 1,127 | | ||
Total | $ | 1,109 | |
| $ | 1,207 | |
72
Table of Contents
QUANEX BUILDING PRODUCTS CORPORATION
NOTES TO CONSOLIDATED FINANCIAL STATEMENTS (continued)
Defined Contribution Plans
The Company also has defined contribution plans to which both employees and the Company make contributions. Effective April 1, 2009, the Company temporarily suspended its matching contributions to the Quanex Building Products Salaried and Non-Union Employee 401(k) Plan as part of its efforts to reduce controllable spending. Effective February 1, 2010, these matching contributions were reinstated. The Company matches 50% up to the first 5% of employee deferrals. The Company contributed approximately $2.5 million , $3.1 million and $2.2 million to these plans in fiscal 2012 , 2011 and 2010 , respectively. No shares of the Company's common stock were held by the Company's defined contribution plan as of October 31, 2012 and 2011 as Company stock is no longer an investment option offered under the Plan.
Other
Quanex has a Supplemental Benefit Plan covering certain key officers of the Company. Earned vested benefits under the Supplemental Benefit Plan were approximately $2.5 million , $1.8 million and $1.1 million at October 31, 2012 , 2011 and 2010 , respectively. The entire October 31, 2012 and 2011 balance is recorded as part of Other (non-current) liabilities. The Company also has a non-qualified Deferred Compensation Plan covering members of the Board of Directors and certain key employees of the Company. The estimated market values of the Deferred Compensation Plan as of October 31, 2012 , 2011 and 2010 , respectively were approximately $5.9 million , $5.9 million and $5.0 million .
12. | Industry Segment Information |
Business segments are reported in accordance with ASC Topic 280 " Segment Reporting " (ASC 280). ASC 280 requires the Company to disclose certain information about its operating segments where operating segments are defined as "components of an enterprise about which separate financial information is available that is evaluated regularly by the chief operating decision maker (CODM) in deciding how to allocate resources and in assessing performance." Generally, financial information is required to be reported on the basis that it is used internally for evaluating segment performance and deciding how to allocate resources to segments.
Quanex has two reportable segments: Engineered Products and Aluminum Sheet Products. The Engineered Products segment produces systems, finished products and components serving the OEM residential window and door industry, while the Aluminum Sheet Products segment produces mill finished and coated aluminum sheet serving the broader building and construction markets. The primary market drivers of both segments are residential repair and remodel activity (R&R) and new home construction.
For financial reporting purposes three of the Company's four operating segments, Engineered Components, Insulating Glass (IG) and Window & Door Systems, have been aggregated, primarily based on similar economic characteristics, products, services and processes into the Engineered Products reportable segment. The remaining operating segment, Nichols Aluminum, is reported as a separate reportable segment, Aluminum Sheet Products. The financial performance of the operations is based upon operating income.
The accounting policies of the segments are the same as those described in the summary of significant accounting policies, with the exception of the inventory valuation method. The Company measures its inventory at the segment level on a FIFO or weighted-average basis; however at the consolidated Company level, approximately half of the inventory is measured on a LIFO basis. The LIFO reserve is computed on a consolidated basis as a single pool and is thus treated as a corporate expense. See Note 6 to the financial statements for more information. LIFO inventory adjustments along with corporate office charges and intersegment eliminations are reported as Corporate, Intersegment Eliminations or Other. The Company accounts for intersegment sales and transfers as though the sales or transfers were to third parties, that is, at current market prices. Corporate assets primarily include cash and equivalents partially offset by the Company's consolidated LIFO inventory reserve.
For the years ended October 31, 2012 , 2011 and 2010 , no one customer represented 10% or more of the consolidated net sales of the Company. Following is selected segment information.
73
Table of Contents
QUANEX BUILDING PRODUCTS CORPORATION
NOTES TO CONSOLIDATED FINANCIAL STATEMENTS (continued)
| For the Years Ended October 31, | ||||||||||
| 2012 |
| 2011 |
| 2010 | ||||||
| (In thousands) | ||||||||||
Net Sales: |
|
|
|
|
| ||||||
Engineered Products | $ | 478,578 | |
| $ | 420,258 | |
| $ | 361,062 | |
Aluminum Sheet Products (5) | 362,315 | |
| 440,495 | |
| 449,529 | | |||
Intersegment Eliminations | (11,917 | ) |
| (12,459 | ) |
| (12,277 | ) | |||
Consolidated | $ | 828,976 | |
| $ | 848,294 | |
| $ | 798,314 | |
Depreciation and Amortization: |
|
|
|
|
| ||||||
Engineered Products | 28,115 | |
| 25,232 | |
| 19,760 | | |||
Aluminum Sheet Products | 7,621 | |
| 8,542 | |
| 8,334 | | |||
Corporate & Other | 1,860 | |
| 158 | |
| 120 | | |||
Consolidated | $ | 37,596 | |
| $ | 33,932 | |
| $ | 28,214 | |
Operating Income (Loss): |
|
|
|
|
| ||||||
Engineered Products (3)(6)(7) | 28,490 | |
| 30,293 | |
| 34,278 | | |||
Aluminum Sheet Products | (17,098 | ) |
| 17,115 | |
| 30,223 | | |||
Corporate & Other | (36,345 | ) |
| (30,930 | ) |
| (27,204 | ) | |||
Consolidated | $ | (24,953 | ) |
| $ | 16,478 | |
| $ | 37,297 | |
Capital Expenditures: |
|
|
|
|
| ||||||
Engineered Products | 17,540 | |
| 11,248 | |
| 9,789 | | |||
Aluminum Sheet Products | 10,381 | |
| 8,749 | |
| 4,806 | | |||
Corporate & Other | 14,950 | |
| 5,315 | |
| 125 | | |||
Consolidated | $ | 42,871 | |
| $ | 25,312 | |
| $ | 14,720 | |
Identifiable Assets: |
|
|
|
|
| ||||||
Engineered Products (4) | 380,551 | |
| 389,889 | |
| 258,919 | | |||
Aluminum Sheet Products | 139,733 | |
| 132,161 | |
| 152,113 | | |||
Corporate, Intersegment Eliminations & Other (1) | 69,254 | |
| 62,879 | |
| 179,756 | | |||
Discontinued Operations (2) | - | |
| - | |
| 462 | | |||
Consolidated | $ | 589,538 | |
| $ | 584,929 | |
| $ | 591,250 | |
(1) | Decrease in Corporate, Intersegment Eliminations & Other identifiable assets in 2011 are primarily attributable to cash paid of $ 110.8 million for the Edgetech and Yakima acquisitions. |
(2) | In 2010 , management closed its start-up facility in China; therefore, the China assets are included in discontinued operations for all periods presented. |
(3) | In fiscal 2012 and 2011 , Engineered Products recorded asset impairment charges of $0.9 million and $1.8 million , respectively, primarily related to a manufacturing facility that it intends to market for sale during fiscal 2013. |
(4) | Increase in Engineered Products identifiable assets in 2011 are primarily attributable to the Edgetech acquisition on March 31, 2011. See Note 3 for discussion of the acquisition. |
(5) | In fiscal 2012, the Company experienced a strike at two of Nichols' Davenport, Iowa facilities which had a negative impact on operating income of approximately $ 11.1 million , including the reduction in sales volume as well as incremental direct costs. |
(6) | In November 2011, the Company announced a consolidation program for its IG spacer manufacturing facility in Barbourville, Kentucky into its IG spacer manufacturing facility in Cambridge, Ohio. The facility consolidation was completed ahead of schedule in August 2012 and the Barbourville facility is permanently closed. The Company recorded expenses related to this plant closure in fiscal 2012 of $9.0 million in its Engineered Products segment. |
(7) | During fiscal 2011, Engineered Products recognized an expense of $1.9 million to increase the warranty reserve associated with a discontinued legacy product and claims. |
Net Sales by Product Information
The Engineered Products segment primarily sells window and door components and the Aluminum Sheet Products segment
74
Table of Contents
QUANEX BUILDING PRODUCTS CORPORATION
NOTES TO CONSOLIDATED FINANCIAL STATEMENTS (continued)
sells aluminum sheet products. Product sales within the Engineered Products segment that are not considered window and door components do not exceed 10% of the Company's consolidated revenue and as such are considered immaterial.
Geographic Information
Operations of the Company and all long-lived assets are located in the United States, Germany and U.K.. Net sales by geographic region are attributed to countries based on the location of the customer and are as follows:
| Years Ended October 31, | ||||||||||
| 2012 |
| 2011 |
| 2010 | ||||||
| (In thousands) | ||||||||||
Net sales |
|
|
|
|
| ||||||
United States | $ | 657,235 | |
| $ | 696,335 | |
| $ | 691,508 | |
Mexico | 11,138 | |
| 12,105 | |
| 12,277 | | |||
Canada | 89,381 | |
| 83,570 | |
| 67,856 | | |||
Asian countries | 18,504 | |
| 19,181 | |
| 15,810 | | |||
European countries | 49,687 | |
| 35,003 | |
| 10,048 | | |||
Other foreign countries | 3,031 | |
| 2,100 | |
| 815 | | |||
Total foreign | 171,741 | |
| 151,959 | |
| 106,806 | | |||
Total net sales | $ | 828,976 | |
| $ | 848,294 | |
| $ | 798,314 | |
| October 31, | ||||||||||
| 2012 |
| 2011 |
| 2010 | ||||||
| (In thousands) | ||||||||||
Long-lived assets, net |
|
|
|
|
| ||||||
United States | $ | 267,110 | |
| $ | 261,443 | |
| $ | 205,374 | |
|
|
|
|
|
| ||||||
Germany | 34,544 | |
| 39,898 | |
| - | | |||
U.K. | 13,934 | |
| 14,243 | |
| - | | |||
Total foreign | 48,478 | |
| 54,141 | |
| - | | |||
|
|
|
|
|
| ||||||
Total long-lived assets, net | $ | 315,588 | |
| $ | 315,584 | |
| $ | 205,374 | |
13. | Stockholders' Equity |
The Company's authorized capital stock consists of 125,000,000 shares of Common Stock, par value $0.01 per share, and 1,000,000 shares of Preferred Stock, no par value, as of October 31, 2012 . As of October 31, 2012 and 2011 , there were no shares of Preferred Stock issued or outstanding.
Stock Repurchase Program and Treasury Stock
On May 27, 2010, the Board of Directors approved a stock repurchase program of 1.0 million shares, and on August 25, 2011, the Board of Directors authorized an additional 1.0 million shares to this program. As of October 31, 2012 , the remaining shares authorized for repurchase under this program was 905,663 .
The objectives of this program are to manage the dilution created by shares issued under stock-based compensation plans and to repurchase shares opportunistically. The Company records treasury stock purchases under the cost method whereby the entire cost of the acquired stock is recorded as treasury stock. The Company uses a moving-average method on the subsequent reissuance of shares, and any resulting proceeds in excess of cost are credited to additional paid in capital while any deficiency is charged to retained earnings.
75
Table of Contents
QUANEX BUILDING PRODUCTS CORPORATION
NOTES TO CONSOLIDATED FINANCIAL STATEMENTS (continued)
14. | Stock-Based Compensation |
The Company's 2008 Omnibus Incentive Plan, (the 2008 Plan), provides for the granting of stock options, stock appreciation rights, restricted stock awards, restricted stock units (RSUs), performance stock awards, performance unit awards, annual incentive awards, other stock-based awards and cash-based awards. The 2008 Plan is administered by the Compensation and Management Development Committee of the Board of Directors and allows for immediate, graded or cliff vesting options, but options must be exercised no later than ten years from the date of grant. The aggregate number of shares of common stock originally authorized for grant under the 2008 Plan was 2,900,000 . At the Company's annual shareholder meeting in February 2011, the shareholders approved an amendment which increased the aggregate number of shares available for grant under the 2008 Plan by an additional 2,400,000 shares. Any officer, key employee and / or non-employee director of the Company or any of its affiliates is eligible for awards under the 2008 Plan. The initial awards granted under the 2008 Plan were on April 23, 2008 ; service is the vesting condition.
The Company's practice is to grant options and restricted stock awards or RSUs to non-employee directors on the last business day of each fiscal year, with an additional grant of options to each director on the date of his or her first anniversary of service. Additionally, the Company's practice is to grant options, restricted stock awards and RSUs to employees at the Company's December board meeting and occasionally to key employees as deemed appropriate at other times during the year. The exercise price of the option awards is equal to the closing market price on the date granted. The Company generally issues shares from treasury stock, if available, to satisfy stock option exercises and grants of restricted stock. If there are no shares in treasury stock, the Company issues additional shares of common stock.
The Company's stock-based compensation is related to the Company's stock awards governed by the 2008 Plan. Stock-based compensation recorded in Selling, general and administrative expense for the years ended October 31, 2012 , 2011 and 2010 was as follows:
| Years Ended October 31, | ||||||||||
| 2012 |
| 2011 |
| 2010 | ||||||
| (In thousands) | ||||||||||
Stock option expense | $ | 3,287 | |
| $ | 3,166 | |
| $ | 2,812 | |
Restricted stock amortization | 1,117 | |
| 1,537 | |
| 1,393 | | |||
Restricted stock unit expense | 1,200 | |
| 149 | |
| 251 | | |||
Total pretax stock-based compensation expense included in income from continuing operations | $ | 5,604 | |
| $ | 4,852 | |
| $ | 4,456 | |
Income tax benefit related to stock-based compensation included in net income | $ | 1,922 | |
| $ | 2,003 | |
| $ | 1,724 | |
The Company has not capitalized any stock-based compensation cost as part of inventory or fixed assets during the years ended October 31, 2012 , 2011 and 2010 . Cash proceeds from stock option exercises and the related tax benefits are a component of financing cash flows from continuing operations. Cash received from stock option exercises for the year ended October 31, 2012 , 2011 and 2010 was $3.0 million , $0.9 million and $0.4 million , respectively while the actual tax benefit realized for the tax deductions from these stock option exercises, as well as lapses on restricted stock awards, was $0.5 million , $0.2 million and $0.1 million , respectively.
Stock Options
The Company uses the Black-Scholes-Merton option-pricing model to estimate the fair value of its stock options. A description of the methodology for the valuation assumption follows:
• | Expected Volatility –For the 2012 , 2011 and 2010 grants, expected volatility was determined based on the historical data available for peer companies as Quanex Building Products Corporation is a relatively new company with limited historical price data available. The expected volatility assumption is adjusted if future volatility is expected to vary from historical experience. |
• | Expected Term - The expected term of options represents the period of time that options granted are expected to be outstanding and falls between the option's vesting and contractual expiration dates. Quanex Building Products Corporation |
76
Table of Contents
QUANEX BUILDING PRODUCTS CORPORATION
NOTES TO CONSOLIDATED FINANCIAL STATEMENTS (continued)
is a relatively new company with insufficient company specific exercise behavior available. Accordingly, for the 2012 , 2011 and 2010 grants, expected term was determined based on historical data from Quanex Corporation considering that Quanex Corporation's employee group was the most similar to Quanex Building Products Corporation's employee group. Separate groups of employees that have similar historical exercise behavior are considered separately. Accordingly, the expected term range given below results from certain groups of employees exhibiting different behavior.
• | Risk-Free Rate - The risk-free rate is based on the yield at the date of grant of a zero-coupon U.S. Treasury bond whose maturity period equals the option's expected term. |
• | Expected Dividend Yield –For the 2012 , 2011 , and 2010 grants, this valuation assumption was based on the expected dividend yield of Quanex Building Products Corporation. |
The fair value of each option was estimated on the date of grant. The following is a summary of valuation assumptions and grant-date fair values for grants during the years ended October 31, 2012 , 2011 and 2010 :
| Grants During the | ||||||||||
| Years Ended October 31, | ||||||||||
Valuation assumptions | 2012 |
| 2011 |
| 2010 | ||||||
Weighted-average expected volatility | 54.0 | % |
| 53.0 | % |
| 55.0 | % | |||
Expected term (in years) | 4.9-5.1 | |
| 4.9-5.1 | |
| 4.9-5.1 | | |||
Risk-free interest rate | 0.9 | % |
| 1.7 | % |
| 2.0 | % | |||
Expected dividend yield over expected term | 1.0 | % |
| 1.0 | % |
| 1.0 | % | |||
Weighted-average grant-date fair value per share | $ | 6.80 | |
| $ | 7.42 | |
| $ | 7.38 | |
The fluctuation in the weighted average grant-date fair value is primarily related to the Company's stock price; the weighted-average market price on the date of grant was $15.82 in 2012 compared to $17.13 in 2011 and $16.39 in 2010 .
Below is a table summarizing the stock option activity for the 2008 Plan, since October 31, 2011 :
| Shares |
| Weighted-Average Exercise Price Per Share |
| Weighted-Average Remaining Contractual Term (in years) |
| Aggregate Intrinsic Value (In thousands) | ||||||
Outstanding at October 31, 2011 | 2,137,436 | |
| $ | 14.08 | |
|
|
|
| |||
Granted | 607,972 | |
| 15.82 | |
|
|
|
| ||||
Exercised | (229,423 | ) |
| 13.14 | |
|
|
|
| ||||
Cancelled/Expired | (42,735 | ) |
| 15.71 | |
|
|
|
| ||||
Outstanding at October 31, 2012 | 2,473,250 | |
| 14.57 | |
| 7.2 | |
| $ | 12,908 | | |
Vested or expected to vest at October 31, 2012 | 2,398,208 | |
| 14.49 | |
| 7.2 | |
| $ | 12,689 | | |
Exercisable at October 31, 2012 | 1,558,226 | |
| 13.61 | |
| 6.4 | |
| $ | 9,618 | | |
The total intrinsic value of options (the amount by which the market price of the stock on the date of exercise exceeded the exercise price of the option) exercised during the years ended October 31, 2012 , 2011 and 2010 were $1.2 million , $0.3 million and $0.3 million , respectively. The total fair value of shares vested during the year ended October 31, 2012 and October 31, 2011 was $2.6 million and $2.9 million , respectively. Total unrecognized compensation cost related to stock options granted under the 2008 Plan was $3.2 million as of October 31, 2012 . This cost is expected to be recognized over a weighted-average period of 1.5 years.
Restricted Stock Awards
Under the 2008 Plan, common stock may be awarded to key employees, officers and non-employee directors. The recipient is entitled to all of the rights of a shareholder, except that during the forfeiture period the shares are nontransferable. The awards vest over a specified time period, but typically either immediately vest or cliff vest over a three-year period with service as the vesting condition. Upon issuance of stock under the plan, fair value is measured by the grant date price of the Company's shares.
77
Table of Contents
QUANEX BUILDING PRODUCTS CORPORATION
NOTES TO CONSOLIDATED FINANCIAL STATEMENTS (continued)
This fair value is then expensed over the restricted period with a corresponding increase to additional paid-in-capital. A summary of non-vested restricted shares at October 31, 2011 , and changes during the year ended October 31, 2012 follows.
| Shares |
| Weighted- Average Grant- Date Fair Value Per Share | |||
Nonvested at October 31, 2011 | 256,390 | |
| $ | 12.67 | |
Granted | 83,900 | |
| 15.08 | | |
Vested | (115,790 | ) |
| 7.82 | | |
Cancelled | (11,800 | ) |
| 16.07 | | |
Nonvested at October 31, 2012 | 212,700 | |
| $ | 16.08 | |
The weighted-average grant-date fair value of restricted stock awards granted during the years ended October 31, 2012 , 2011 , and 2010 was $15.08 , $17.14 , and $16.21 , respectively. The total fair value of restricted stock awards vested during the years ended October 31, 2012 , 2011 , and 2010 were $0.9 million , $2.5 million , and $0.1 million , respectively. Total unrecognized compensation cost related to unamortized restricted stock awards was $1.3 million as of October 31, 2012 . This cost is expected to be recognized over a weighted-average period of 1.7 years.
Restricted Stock Units
RSUs were historically awarded to non-employee directors in lieu of restricted stock. Beginning in fiscal 2010, RSUs were awarded to key employees. RSUs are granted under the 2008 Plan. RSUs vest over a specified time period, but typically either immediately vest or cliff vest over a three -year period with service as the vesting condition. RSUs are not considered to be outstanding shares of common stock and do not have voting rights. Holders of RSUs receive cash for an equivalent amount of cash dividends paid on the underlying common stock. Upon the earlier of the date the director ceases to be a board member or a change of control or upon vesting for the employee grants, each RSU is payable in cash in an amount equal to the market value of one share of the Company's common stock. Accordingly, the RSU liability will be adjusted to fair market value at each reporting date. A summary of non-vested restricted stock units at October 31, 2011 , and changes during the year ended October 31, 2012 follows.
| Units |
| Weighted- Average Grant- Date Fair Value Per Unit | |||
Nonvested at October 31, 2011 | 21,000 | |
| $ | 18.35 | |
Granted | 162,632 | |
| 15.60 | | |
Vested | (7,632 | ) |
| 19.77 | | |
Cancelled | (15,000 | ) |
| 18.35 | | |
Nonvested at October 31, 2012 | 161,000 | |
| $ | 15.47 | |
The weighted-average grant-date fair value of restricted stock units granted during the years ended October 31, 2012 , 2011 and 2010 was $15.60 , $14.75 and $18.26 per share, respectively. Total unrecognized compensation cost based on service related to unamortized restricted stock units was $1.7 million as of October 31, 2012 . This cost does not include market fluctuations and is expected to be recognized over a weighted-average period of 2.2 years. Cash used to settle restricted stock units during the year ended October 31, 2012 was $0.2 million . There was no cash used to settle restricted stock units during the year ended October 31, 2011 . The number of RSU awards outstanding as of October 31, 2012 and 2011 was 194,358 and 56,410 , respectively.
15. | Commitments |
Quanex has operating leases for certain real estate and equipment. Rental expense for the years ended October 31, 2012 ,
78
Table of Contents
QUANEX BUILDING PRODUCTS CORPORATION
NOTES TO CONSOLIDATED FINANCIAL STATEMENTS (continued)
2011 , and 2010 was $6.9 million , $6.0 million , and $4.8 million , respectively. Total minimum rentals to be received in the future under non-cancelable subleases as of October 31, 2012 were $1.9 million . Quanex is a party to non-cancelable purchase obligations primarily for natural gas and aluminum scrap used in the manufacturing process. Amounts purchased under these purchase obligations for the years ended October 31, 2012 , 2011 and 2010 were $4.0 million , $2.8 million and $1.6 million , respectively.
Future minimum payments as of October 31, 2012 , by year and in the aggregate under operating leases having original non-cancelable lease terms in excess of one year and estimated non-cancelable purchase obligations with remaining terms in excess of a year as of October 31, 2012 , by year and in the aggregate were as follows (in thousands):
| Operating Leases |
| Purchase Obligations | ||||
2013 | $ | 5,808 | |
| $ | 4,148 | |
2014 | 5,495 | |
| 296 | | ||
2015 | 4,661 | |
| - | | ||
2016 | 3,409 | |
| - | | ||
2017 | 2,737 | |
| - | | ||
Thereafter | 10,007 | |
| - | | ||
Total | $ | 32,117 | |
| $ | 4,444 | |
16. | Contingencies |
Environmental
Quanex is subject to extensive laws and regulations concerning the discharge of materials into the environment and the remediation of chemical contamination. To satisfy such requirements, Quanex must make capital and other expenditures on an ongoing basis. The Company accrues its best estimates of its remediation obligations and adjusts such accruals as further information and circumstances develop. Those estimates may change substantially depending on information about the nature and extent of contamination, appropriate remediation technologies, and regulatory approvals. In accruing for environmental remediation liabilities, costs of future expenditures are not discounted to their present value, unless the amount and timing of the expenditures are fixed or reliably determinable. Legal costs are expensed as incurred except incremental direct costs of the remediation effort at Nichols Alabama, which are accrued as part of the measurement of the environmental remediation liability. When environmental laws might be deemed to impose joint and several liability for the costs of responding to contamination, the Company accrues its allocable share of liability taking into account the number of parties participating, their ability to pay their shares, the volumes and nature of the wastes involved, the nature of anticipated response actions, and the nature of the Company's alleged connections. The cost of environmental matters has not had a material adverse effect on Quanex's operations or financial condition in the past, and management is not currently aware of any conditions that it believes are likely to have a material adverse effect on Quanex's operations, financial condition or cash flows.
Total environmental reserves and corresponding recovery as of October 31, 2012 and October 31, 2011 were as follows:
| October 31, |
| October 31, | ||||
| (In thousands) | ||||||
Current (1) | $ | 1,700 | |
| $ | 1,965 | |
Non-current | 9,827 | |
| 11,221 | | ||
Total environmental reserves | $ | 11,527 | |
| $ | 13,186 | |
Receivable for recovery of remediation costs (2) | $ | 11,195 | |
| $ | 12,304 | |
(1) | Reported in Accrued liabilities on the Consolidated Balance Sheets |
(2) | Reported in Accounts receivable and Other assets on the Consolidated Balance Sheets |
Currrently, the Company's ongoing remediation activities are at one of its subsidiaries, Nichols Aluminum-Alabama, LLC (NAA). NAA operates a plant in Decatur, Alabama that is subject to an Alabama Hazardous Wastes Management and
79
Table of Contents
QUANEX BUILDING PRODUCTS CORPORATION
NOTES TO CONSOLIDATED FINANCIAL STATEMENTS (continued)
Minimization Act Post-Closure Permit. Among other things, the permit requires NAA to remediate, as directed by the state, historical environmental releases of wastes and waste constituents. Consistent with the permit, NAA has undertaken various studies of site conditions and, during the first quarter of 2006, started a phased program to treat in-place free product petroleum that had been released underneath the plant. During the second quarter 2010, NAA submitted to the state the first component of its proposed workplan for implementing a site-wide remedy. The full workplan was submitted to the state during the third quarter 2010, revised during the second quarter 2011 to reflect both additional sampling data and responses to state comments, and revised again in the fourth quarter 2011 in response to another round of state comments. Based on those plans, which remain subject to further comment, revision, and state approval, the Company's remediation reserve at NAA's Decatur plant is $11.5 million as of October 31, 2012 . Approximately $1.1 million of the October 31, 2012 reserve represents administrative costs; the balance of $10.4 million represents estimated costs for investigation, studies, cleanup, and treatment. The reserve has not been discounted. NAA was acquired through a stock purchase in which the sellers agreed to indemnify Quanex and NAA for identified environmental matters related to the business and based on conditions initially created or events initially occurring prior to the acquisition. Environmental conditions are presumed to relate to the period prior to the acquisition unless proved to relate to releases occurring entirely after closing. The limit on indemnification is $21.5 million excluding legal fees. While the Company's current estimates indicate it will not reach this limit, changing circumstances could result in additional costs or expense that are not foreseen at this time. In accordance with the indemnification, the indemnitors paid the first $1.5 million of response costs and have been paying 90% of ongoing costs. Based on its experience to date, its estimated cleanup costs going forward, and costs incurred to date as of October 31, 2012 , the Company expects to recover from the sellers' shareholders an additional $11.2 million which has not been discounted. Of that, $10.4 million is recorded in Other assets on the Consolidated Balance Sheets, and the balance is reflected in Accounts receivable on the Consolidated Balance Sheets. The undiscounted recovery from indemnitors as of October 31, 2011 was $12.3 million . Of that, $11.6 million is recorded in Other assets on the Consolidated Balance Sheets, and the balance is reflected in Accounts receivable on the Consolidated Balance Sheets.
The Company's final remediation costs and the timing of those expenditures will depend upon such factors as the nature and extent of contamination, the cleanup technologies employed, the effectiveness of the cleanup measures that are employed, and regulatory concurrences. While actual remediation costs, therefore, may be more or less than amounts accrued, the Company believes it has established adequate reserves for all probable and reasonably estimable remediation liabilities. It is not possible at this point to reasonably estimate the amount of any obligation for remediation in excess of current accruals because of uncertainties as to the extent of environmental impact, cleanup technologies, and concurrence of governmental authorities. The Company currently expects to pay the accrued remediation reserve through at least fiscal 2034, although some of the same factors discussed earlier could accelerate or extend the timing.
Other
From time to time, the Company and its subsidiaries are involved in various litigation matters arising in the ordinary course of their business. Although the ultimate resolution and impact of such litigation on the Company is not presently determinable, the Company's management believes that the eventual outcome of such litigation will not have a material adverse effect on the overall financial condition, results of operations or cash flows of the Company.
17. | Warranty Obligations |
The Company's estimated obligations for warranty are accrued concurrently with the revenue recognized. The Company makes provisions for its warranty obligations based upon historical experience incurred for such obligations adjusted, as necessary, for current conditions and factors. Due to the significant uncertainties and judgments involved in estimating the Company's warranty obligations, including changing product designs, variance in customer installation process and future claims experience varying from historical claims experience, the ultimate amount incurred for warranty costs could change in the near and long-term from the current estimate.
The following table provides a reconciliation of the activity related to the Company's accrued warranty, including both the current (reported in Accrued liabilities on the Consolidated Balance Sheets) and long-term portions (reported in Other liabilities on the Consolidated Balance Sheets), for the year ended October 31, 2012 and 2011 (in thousands):
80
Table of Contents
QUANEX BUILDING PRODUCTS CORPORATION
NOTES TO CONSOLIDATED FINANCIAL STATEMENTS (continued)
| Year Ended October 31, | ||||||
| 2012 |
| 2011 | ||||
Beginning balance | $ | 5,262 | |
| $ | 3,697 | |
Provision for warranty expense | 652 | |
| 2,638 | | ||
Change in accrual for preexisting warranties | (838 | ) |
| - | | ||
Warranty costs paid | (295 | ) |
| (1,073 | ) | ||
Total accrued warranty | $ | 4,781 | |
| $ | 5,262 | |
Less: long-term portion | 2,736 | |
| 3,591 | | ||
Current accrued warranty | $ | 2,045 | |
| $ | 1,671 | |
During the year ended October 31, 2012 , the Company changed its estimate for preexisting warranties due to a decline in claims experience. During the year ended October 31, 2011 , the reserve was increased by $1.9 million related to a rise in projected experience for a discontinued legacy product and claims from some years ago.
18. | Derivative Instruments and Fair Value Measurement of Assets and Liabilities |
Derivative Instruments
The Company's derivative activities are subject to the management, direction, and control of the Chief Financial Officer and Chief Executive Officer and other officers and employees they select. Certain transactions in excess of specified levels require further approval from the Board of Directors.
The nature of the Company's business activities requires the management of various financial and market risks, including those related to changes in foreign currency exchange rates and aluminum scrap prices. The Company uses foreign currency forwards and options and aluminum forward contracts to mitigate or eliminate certain of those risks. Specifically, the foreign currency forwards are used to offset fluctuations in the value of accounts receivable and payable balances that are denominated in currencies other than the U.S. dollar, which consist principally of the Euro, British Pound and Canadian Dollar. The aluminum forwards are used to minimize the price risk related to customer sales contracts. The Company enters into firm price raw material purchase commitments (which are designed as "normal purchases" under ASC 815) as well as contracts on the London Metal Exchange (LME). The Company's risk management policy as it relates to these LME contracts is to enter into contracts as needed so that raw material purchase levels, including both fixed price purchase commitments as well as LME contracts match the needs of the Company to meet committed sales orders. This is done through the use of both LME forward purchase contracts as well as LME forward sales contracts. The Company does not currently enter into derivative transactions for speculative or trading purposes.
The Company is exposed to credit loss in the event of nonperformance by the counterparties to its derivative transactions. The Company attempts to mitigate this risk by monitoring the creditworthiness of its counterparties and limiting its exposure to individual counterparties. In addition, the Company has established master netting agreements in certain cases to facilitate the settlement of gains and losses on specific derivative contracts.
The Company has not designated any of its derivative contracts for hedge accounting treatment. Therefore, changes in the fair value of these contracts are recorded in the Consolidated Statements of Income as follows:
|
|
| For the Years Ended |
| ||||||||||
Derivatives Not Designated as | Location of Gain or (Loss) |
| October 31, |
| ||||||||||
Hedging Instruments | Recognized in Earnings |
| 2012 |
| 2011 |
| 2010 |
| ||||||
|
|
| (In thousands) |
| ||||||||||
Aluminum forward contracts | Cost of sales |
| $ | (476 | ) |
| $ | (307 | ) |
| $ | - | |
|
Foreign currency derivatives | Other, net |
| $ | 895 | |
| $ | (175 | ) |
| $ | - | |
|
The fair value of outstanding derivative contracts recorded as assets and liabilities on the accompanying Consolidated Balance Sheet is indicated in the table below:
81
Table of Contents
QUANEX BUILDING PRODUCTS CORPORATION
NOTES TO CONSOLIDATED FINANCIAL STATEMENTS (continued)
| October 31, 2012 |
| October 31, 2011 | ||||
| (In thousands) | ||||||
Asset Derivatives |
|
|
| ||||
Accounts receivable, net of allowance: |
|
|
| ||||
Aluminum forward contracts | $ | - | |
| $ | 110 | |
Prepaid and other current assets: |
|
|
| ||||
Aluminum forward contracts | $ | 10 | |
| $ | - | |
Foreign currency derivatives | $ | 6 | |
| $ | - | |
|
|
|
| ||||
Liability Derivatives |
|
|
| ||||
Accrued liabilities: |
|
|
| ||||
Aluminum forward contracts | $ | 170 | |
| $ | 78 | |
Foreign currency derivatives | $ | 23 | |
| $ | (134 | ) |
Other liabilities (non-current): |
|
|
| ||||
Aluminum forward contracts | $ | 4 | |
| $ | - | |
The following table summarizes the notional amounts and fair value of the Company's outstanding derivative contracts:
| Notional as indicated |
| Fair Value in $ | |||||||||||
| October 31, |
| October 31, | |||||||||||
|
| 2012 |
| 2011 |
| 2012 |
| 2011 | ||||||
|
| (In thousands) | ||||||||||||
Aluminum forward contracts: |
|
|
|
|
|
|
|
| ||||||
Forward purchase aluminum contracts | LBS | 2,370 | |
| 3,417 | |
| $ | (164 | ) |
| $ | (58 | ) |
Forward sales aluminum contracts | LBS | - | |
| (5,346 | ) |
| $ | - | |
| $ | 90 | |
|
|
|
|
|
|
|
|
| ||||||
Foreign currency exchange derivatives: |
|
|
|
|
|
|
|
| ||||||
Sell EUR, buy GBP | EUR | 545 | |
| - | |
| $ | - | |
| $ | - | |
Sell EUR, buy USD | EUR | 7,663 | |
| 8,500 | |
| $ | (23 | ) |
| $ | 147 | |
Sell CAD, buy USD | CAD | 608 | |
| - | |
| $ | 1 | |
| $ | - | |
Buy GBP, sell USD | GBP | 1,934 | |
| 600 | |
| $ | 5 | |
| $ | 2 | |
Buy USD, sell CAD | CAD | - | |
| 894 | |
| $ | - | |
| $ | (15 | ) |
Fair Value Measurement
Fair value is defined as the price that would be received to sell an asset or paid to transfer a liability in an orderly transaction between market participants at the measurement date. The fair value hierarchy distinguishes between (1) market participant assumptions developed based on market data obtained from independent sources (observable inputs) and (2) an entity's own assumptions about market participant assumptions developed based on the best information available in the circumstances (unobservable inputs). The fair value hierarchy consists of three broad levels, which gives the highest priority to unadjusted quoted pries in active markets for identical assets or liabilities (Level 1) and the lowest priority to unobservable inputs (Level 3). The three levels of the fair value hierarchy are described below:
• | Level 1 - Unadjusted quoted prices in active markets that are accessible at the measurement date for identical, unrestricted assets or liabilities. |
• | Level 2 - Inputs other than quoted prices included within Level 1 that are observable for the asset or liability either directly or indirectly including quoted prices for similar assets or liabilities in active markets; quoted prices for identical or similar assets or liabilities in market that are not active; inputs other than quoted prices that are observable for the asset or liability (e.g., interest rates) and inputs that are derived principally from or corroborated by observable market data by correlation or other means. |
• | Level 3 - Inputs that are both significant to the fair value measurement and unobservable. |
82
Table of Contents
QUANEX BUILDING PRODUCTS CORPORATION
NOTES TO CONSOLIDATED FINANCIAL STATEMENTS (continued)
The Money Market Fund investments as well as the pension plan assets are measured at fair value based on active market quotations and are therefore classified as Level 1. All of the Company's derivative contracts are valued using quoted market prices from brokers or exchanges and are classified within Level 2 of the fair value hierarchy.
The Company holds Money Market Fund investments that are classified as cash equivalents, pension plan assets and derivative contracts that are measured at fair value on a recurring basis. The Money Market Fund investments are classified as Cash and equivalents, while the pension plan assets are included in Deferred pension and postretirement benefits on the Consolidated Balance Sheets. See Note 11 for further information on the pension plan assets. The derivative instruments are included in various asset and liability accounts as discussed earlier in this footnote.
The following table summarizes the assets and liabilities measured on a recurring basis based on the fair value hierarchy:
|
| ||||||||||||||||||||||||
| October 31, 2012 |
| October 31, 2011 | ||||||||||||||||||||||
| Level 1 | Level 2 | Level 3 | Total |
| Level 1 | Level 2 | Level 3 | Total | ||||||||||||||||
| (In thousands) | ||||||||||||||||||||||||
Assets |
| ||||||||||||||||||||||||
Money market fund investments | $ | 67,819 | | $ | - | | $ | - | | $ | 67,819 | |
| $ | 80,688 | | $ | - | | $ | - | | $ | 80,688 | |
Commodity derivatives | - | | 10 | | - | | 10 | |
| - | | 110 | | - | | 110 | | ||||||||
Foreign currency exchange derivatives | - | | 6 | | - | | 6 | |
| - | | 150 | | - | | 150 | | ||||||||
Pension plan assets | 18,562 | | - | | - | | 18,562 | |
| 14,004 | | - | | - | | 14,004 | | ||||||||
Total assets | $ | 86,381 | | $ | 16 | | $ | - | | $ | 86,397 | |
| $ | 94,692 | | $ | 260 | | $ | - | | $ | 94,952 | |
|
|
|
|
|
|
|
|
|
| ||||||||||||||||
Liabilities |
|
|
|
|
|
|
|
|
| ||||||||||||||||
Commodity derivatives | $ | - | | $ | (174 | ) | $ | - | | $ | (174 | ) |
| $ | - | | $ | (78 | ) | $ | - | | $ | (78 | ) |
Foreign currency exchange derivatives | - | | (23 | ) | - | | (23 | ) |
| - | | (16 | ) | - | | (16 | ) | ||||||||
Total liabilities | $ | - | | $ | (197 | ) | $ | - | | $ | (197 | ) |
| $ | - | | $ | (94 | ) | $ | - | | $ | (94 | ) |
|
|
|
|
|
|
|
|
|
| ||||||||||||||||
Net assets (liabilities) | $ | 86,381 | | $ | (181 | ) | $ | - | | $ | 86,200 | |
| $ | 94,692 | | $ | 166 | | $ | - | | $ | 94,858 | |
As of October 31, 2012 and 2011 , the Company did not have any assets or liabilities measured at fair value on a recurring basis classified as Level 3. As of October 31, 2012 and 2011 , the Company held approximately $1.2 million and $2.0 million , respectively, of property, plant and equipment recorded at fair value on a non-recurring basis that is classified as Level 3 assets.
19. | Other Income (Expense) |
Other income (expense) for the years ended October 31, 2012 , 2011 , and 2010 are as follows:
| Years Ended October 31, | ||||||||||
| 2012 |
| 2011 |
| 2010 | ||||||
| (In thousands) | ||||||||||
Other income (expense) |
|
|
|
|
| ||||||
Foreign currency transaction gains (losses) | $ | (857 | ) |
| $ | (729 | ) |
| $ | - | |
Foreign currency exchange derivative gains (losses) | 895 | |
| (175 | ) |
| - | | |||
Gain on bargain purchase | - | |
| - | |
| 1,272 | | |||
Gain on involuntary conversion | - | |
| - | |
| 914 | | |||
Interest income | 206 | |
| 311 | |
| 411 | | |||
Other | (22 | ) |
| 79 | |
| 48 | | |||
Other income (expense) | $ | 222 | |
| $ | (514 | ) |
| $ | 2,645 | |
83
Table of Contents
QUANEX BUILDING PRODUCTS CORPORATION
NOTES TO CONSOLIDATED FINANCIAL STATEMENTS (continued)
The impact of IG's foreign currency denominated exposure and transaction gains and losses as well as the gains and losses associated with the offsetting foreign currency derivatives used to manage that exposure are included in Other, net on the Consolidated Statements of Income and detailed above. See Note 18 for further explanation of the foreign currency exchange derivatives.
In February 2010, the Company completed a small acquisition for approximately $1.6 million in consideration. This operation has been integrated into one of its existing Engineered Products businesses. ASC 805 " Business Combinations " requires that a gain be recorded when the fair value of the net assets acquired is greater than the fair value of the consideration transferred. Though uncommon, bargain purchases can occur because of underpayments for the business acquired due to a forced liquidation or distress sale. These assets were acquired at auction due to the business being in Wisconsin receivership proceedings. As such, the Company obtained the assets at a bargain and recognized a gain of approximately $1.3 million in Other, net in its second fiscal quarter of 2010.
In May 2009, a tornado struck and damaged the Company's Mikron facility in Richmond, Kentucky. In May 2010, the Company received the final insurance payment bringing the total cash proceeds from property insurance settlement to $1.8 million of which $0.4 million was received in fiscal 2010 and $1.4 million was received in fiscal 2009. In its third fiscal quarter of 2010, the Company recorded a gain on involuntary conversion in Other, net of approximately $0.9 million , which represents the amount of insurance proceeds received over the carrying value of the damaged property.
20. | Restructuring and Related Activities |
IG Spacer Consolidation
In November 2011, management committed to a plan to close its Barbourville, Kentucky facility (Barbourville) which is included in the Engineered Products segment. The consolidation plan, in part, called for the permanent closing of Barbourville, with the equipment used to manufacture the single seal, warm edge spacer system relocated to the Company's Cambridge, Ohio facility. The Company believes this consolidation will allow it to better serve customers through streamlined operations. The consolidation of operations and the subsequent closure of the Barbourville facility was completed in August 2012 , with residual cash payments and minor program costs expected to continue into fiscal 2013 . All equipment to be retained has been relocated with the main outstanding activities only related to selling remaining equipment and the facility itself.
Under ASC Topic 712, "Compensation - Nonretirement Postemployment Benefits ", the Company is required to record charges for contractual termination benefits and other ongoing benefit arrangements when it is probable that employees will be entitled to benefits under the contract's terms and the amount can be reasonably estimated. The Company determined that certain severance pay qualifies as either a contractual termination benefit or an ongoing benefit arrangement, and accordingly recognized $3.4 million in severance during the year ended October 31, 2012 . Severance was paid out during 2012 as employees exited. Under ASC Topic 420, " Exit or Disposal Cost Obligations ," the Company is required to record charges for one-time employee termination benefits, contract termination costs, and other associated costs as incurred. No exit costs or termination benefits were incurred as of October 31, 2011 and no liability was accrued for the Barbourville closing as of October 31, 2011 . In February 2012, the Company and the union reached an agreement to pay a one-time incentive bonus to employees upon their planned exit date termination, providing certain performance criteria are met. The salaried employees were offered the same one-time incentive bonus under the same terms as the union employees. For the year ended October 31, 2012 , the Company expensed total employee-related termination costs of $3.4 million and facility consolidation costs of $5.6 million . All other costs related to the closure and relocation activities are being recorded as incurred, when they meet the definition of a liability, and they are included in the statements of income as selling, general, and administrative expenses, in accordance with the applicable accounting guidance. Cumulative costs incurred as of October 31, 2012 total $9.0 million .
The Dalles facility shutdown
During November 2010, the Company committed to a plan to shut down its plant in The Dalles (included in the Engineered Products segment) and service its clients out of other locations. The Dalles shutdown was completed in January 2011. The Company accrued a net lease liability for the difference between remaining lease rental payments offset by sublease income, since management subleased the facility in November 2011. The Company does not expect to have any additional charges for contract termination and other exit costs related to The Dalles.
Total Restructuring Cost Summary
84
Table of Contents
QUANEX BUILDING PRODUCTS CORPORATION
NOTES TO CONSOLIDATED FINANCIAL STATEMENTS (continued)
A reconciliation of the beginning and ending liability balances showing charges to expense, cash payments and other adjustments for the year ended October 31, 2012 is as follows (in thousands):
| Employee termination costs |
| Facility consolidation costs |
| Contract termination and other exit costs |
| Total | ||||||||
Reconciliation of the liability in the balance sheet |
|
|
|
|
|
|
| ||||||||
Beginning balance, October 31, 2011 | $ | - | |
| $ | - | |
| $ | 722 | |
| $ | 722 | |
Charges to expense, continuing operations | 3,372 | |
| 5,621 | |
| 10 | |
| 9,003 | | ||||
Cash payments | (3,199 | ) |
| (5,530 | ) |
| (309 | ) |
| (9,038 | ) | ||||
Other adjustments | - | |
| (26 | ) |
| (61 | ) |
| (87 | ) | ||||
Ending balance, October 31, 2012 | $ | 173 | |
| $ | 65 | |
| $ | 362 | |
| $ | 600 | |
The employee termination and facility consolidation activity above related to the IG systems consolidation program while the contract termination and other exit costs relate to The Dalles shut down.
21. | Quarterly Results of Operations (Unaudited) |
The following sets forth the selected quarterly information for the years ended October 31, 2012 and 2011 .
85
Table of Contents
QUANEX BUILDING PRODUCTS CORPORATION
NOTES TO CONSOLIDATED FINANCIAL STATEMENTS (continued)
| First Quarter |
| Second Quarter |
| Third Quarter |
| Fourth Quarter | ||||||||
| (In thousands except per share amounts) | ||||||||||||||
2012: |
|
|
|
|
|
|
| ||||||||
Net sales | $ | 161,579 | |
| $ | 194,444 | |
| $ | 237,905 | |
| $ | 235,048 | |
Cost of sales (1) | 138,042 | |
| 171,837 | |
| 200,663 | |
| 193,302 | | ||||
Depreciation and amortization (2) | 6,625 | |
| 6,168 | |
| 5,801 | |
| 5,707 | | ||||
Operating income (loss) (3)(4)(5) | (11,304 | ) |
| (16,079 | ) |
| 1,452 | |
| 978 | | ||||
Income (loss) from continuing operations | (6,748 | ) |
| (12,285 | ) |
| 1,531 | |
| 968 | | ||||
Net income (loss) | (6,748 | ) |
| (12,285 | ) |
| 1,531 | |
| 968 | | ||||
Earnings per share: |
|
|
|
|
|
|
| ||||||||
Basic earnings (loss) from continuing operations | $ | (0.18 | ) |
| $ | (0.34 | ) |
| $ | 0.04 | |
| $ | 0.03 | |
Basic earnings (loss) | $ | (0.18 | ) |
| $ | (0.34 | ) |
| $ | 0.04 | |
| $ | 0.03 | |
Diluted earnings (loss) from continuing operations | $ | (0.18 | ) |
| $ | (0.34 | ) |
| $ | 0.04 | |
| $ | 0.03 | |
Diluted earnings (loss) | $ | (0.18 | ) |
| $ | (0.34 | ) |
| $ | 0.04 | |
| $ | 0.03 | |
2011: |
|
|
|
|
|
|
| ||||||||
Net sales | $ | 159,808 | |
| $ | 203,112 | |
| $ | 252,413 | |
| $ | 232,961 | |
Cost of sales (1)(6) | 139,655 | |
| 175,512 | |
| 209,667 | |
| 187,257 | | ||||
Depreciation and amortization (2) | 6,059 | |
| 5,847 | |
| 6,326 | |
| 6,294 | | ||||
Operating income (loss) (3) | (7,666 | ) |
| (2,285 | ) |
| 14,637 | |
| 11,792 | | ||||
Income (loss) from continuing operations | (4,728 | ) |
| (1,389 | ) |
| 9,016 | |
| 6,179 | | ||||
Net income (loss) | (4,740 | ) |
| (1,389 | ) |
| 9,016 | |
| 6,179 | | ||||
Earnings per share: |
|
|
|
|
|
|
| ||||||||
Basic earnings (loss) from continuing operations | $ | (0.13 | ) |
| $ | (0.04 | ) |
| $ | 0.24 | |
| $ | 0.17 | |
Basic earnings (loss) | $ | (0.13 | ) |
| $ | (0.04 | ) |
| $ | 0.24 | |
| $ | 0.17 | |
Diluted earnings (loss) from continuing operations | $ | (0.13 | ) |
| $ | (0.04 | ) |
| $ | 0.24 | |
| $ | 0.17 | |
Diluted earnings (loss) | $ | (0.13 | ) |
| $ | (0.04 | ) |
| $ | 0.24 | |
| $ | 0.17 | |
(1) | Cost of sales excludes depreciation and amortization shown separately. |
(2) | Depreciation and amortization represent depreciation and amortization directly associated with or allocated to products sold and services rendered and excludes corporate depreciation and amortization. |
(3) | The Company recorded asset impairment charges during the fourth quarter of fiscal 2012 and 2011 of $0.9 million and $1.8 million , respectively, primarily related to a manufacturing facility that it intends to sell during fiscal 2013 which is reported in Asset impairment charges on the Consolidated Statements of Income. |
(4) | In fiscal 2012, the Company experienced a strike at the two Nichols Davenport, Iowa facilities, which had a negative impact on operating income of approximately $9.0 million in the second fiscal quarter of 2012 and $2.1 million in the third fiscal quarter of 2012. This negative impact included a reduction in sales volume as well as incremental direct costs. |
(5) | In November 2011, the Company announced a consolidation program for its IG spacer manufacturing facility in Barbourville, Kentucky into its IG spacer manufacturing facility in Cambridge, Ohio. The facility consolidation was completed ahead of schedule in August 2012 and the Barbourville facility is permanently closed. The Company recorded expenses related to this plant closure in fiscal 2012 of $9.0 million . |
(6) | During the first quarter of fiscal 2011, Engineered Products recognized an expense of $1.9 million to increase the warranty reserve associated with a discontinued legacy product and claims. |
86
Table of Contents
QUANEX BUILDING PRODUCTS CORPORATION
SUPPLEMENTARY FINANCIAL DATA
SCHEDULE II-VALUATION AND QUALIFYING ACCOUNTS
Description | Balance at Beginning of Year |
| Charged (Credited) to Costs & Expenses |
|
| Write-offs |
| Other |
| Balance at End of Year | ||||||||||
| (In thousands) | |||||||||||||||||||
Allowance for doubtful accounts (1) : |
|
|
|
|
|
|
|
|
|
| ||||||||||
Year ended October 31, 2012 | $ | 1,062 | |
| $ | 593 | |
|
| $ | (688 | ) |
| $ | 59 | |
| $ | 1,026 | |
Year ended October 31, 2011 | 1,037 | |
| 635 | |
|
| (627 | ) |
| 17 | |
| 1,062 | | |||||
Year ended October 31, 2010 | 1,696 | |
| (482 | ) | (2) |
| (178 | ) |
| 1 | |
| 1,037 | | |||||
Inventory reserves (primarily LIFO) (1) : |
|
|
|
|
|
|
|
|
|
| ||||||||||
Year ended October 31, 2012 | $ | 15,660 | |
| $ | (163 | ) |
|
| $ | (400 | ) |
| $ | (135 | ) |
| $ | 14,962 | |
Year ended October 31, 2011 | 12,768 | |
| 3,432 | |
|
| (491 | ) |
| (49 | ) |
| 15,660 | | |||||
Year ended October 31, 2010 | 8,165 | |
| 5,444 | | |
| (840 | ) |
| (1 | ) |
| 12,768 | | |||||
Income tax valuation allowance (3) |
|
|
|
|
|
|
|
|
|
| ||||||||||
Year ended October 31, 2012 | $ | - | |
| $ | 1,694 | |
|
| $ | - | |
| $ | - | |
| $ | 1,694 | |
Year ended October 31, 2011 | - | |
| - | |
|
| - | |
| - | |
| - | | |||||
Year ended October 31, 2010 | - | |
| - | |
|
| - | |
| - | |
| - | | |||||
(1) | As more fully described in Note 1, the Company's start-up facility in China is reported in discontinued operations for all periods presented. |
(2) | During the fiscal year ended 2009, a customer filed for Chapter 11 bankruptcy, so a special reserve was recorded. During the second quarter of fiscal 2010, the customer completed its balance sheet restructuring and emerged from bankruptcy resulting in a reversal of the special reserve. |
(3) | During the fiscal year ended 2012, the Company recorded a state net operating loss valuation allowance. In assessing the need for a valuation allowance, the Company considers both positive and negative evidence related to the likelihood of realization of the deferred tax assets. |
87
Table of Contents
Item 9. | Changes in and Disagreements with Accountants on Accounting and Financial Disclosure |
None.
Item 9A. | Controls and Procedures |
Evaluation of Disclosure Controls and Procedures
Under the supervision and with the participation of our management, including the Chief Executive Officer and Chief Financial Officer, we have evaluated the effectiveness of our disclosure controls and procedures pursuant to Exchange Act Rule 13a-15(b) as of the end of the period covered by this report. Based on that evaluation, the Chief Executive Officer and Chief Financial Officer have concluded that these disclosure controls and procedures are effective.
Changes in Internal Control over Financial Reporting
There have been no changes in internal controls over financial reporting (as defined in Rules 13a-15(f) and 15d-15(f) under the 1934 Act) during the most recent fiscal quarter that have materially affected or are reasonably likely to materially affect the Company's internal control over financial reporting.
MANAGEMENT'S ANNUAL REPORT ON INTERNAL CONTROL OVER FINANCIAL REPORTING
The management of Quanex Building Products Corporation and its subsidiaries (the Company) is responsible for establishing and maintaining adequate internal control over financial reporting. The Company's internal control system was designed to provide reasonable assurance to management and the Board of Directors regarding the reliability of financial reporting and the preparation of financial statements for external purposes in accordance with generally accepted accounting principles.
All internal control systems, no matter how well designed, have inherent limitations. Even those systems determined to be effective can provide only reasonable assurance with respect to financial statement presentation and preparation. Further, because of changes in conditions, the effectiveness of internal control may vary over time.
Management conducted an evaluation of the effectiveness of the Company's internal control over financial reporting based on the framework in Internal Control – Integrated Framework issued by the Committee of Sponsoring Organizations of the Treadway Commission. Based on this evaluation, management concluded that the Company's internal control over financial reporting was effective as of October 31, 2012. Deloitte & Touche LLP, the registered public accounting firm that audited the financial statements contained in this report, has issued an attestation report on the Company's internal control over financial reporting.
88
Table of Contents
REPORT OF INDEPENDENT REGISTERED PUBLIC ACCOUNTING FIRM
To the Board of Directors and Stockholders
Quanex Building Products Corporation
Houston, Texas
We have audited the internal control over financial reporting of Quanex Building Products Corporation and subsidiaries (the"Company") as of October 31, 2012, based on criteria established in Internal Control-Integrated Framework issued by the Committee of Sponsoring Organizations of the Treadway Commission. The Company's management is responsible for maintaining effective internal control over financial reporting and for its assessment of the effectiveness of internal control over financial reporting, included in the accompanying Management's Annual Report on Internal Control over Financial Reporting. Our responsibility is to express an opinion on the effectiveness of the Company's internal control over financial reporting based on our audit.
We conducted our audit in accordance with the standards of the Public Company Accounting Oversight Board (United States). Those standards require that we plan and perform the audit to obtain reasonable assurance about whether effective internal control over financial reporting was maintained in all material respects. Our audit included obtaining an understanding of internal control over financial reporting, assessing the risk that a material weakness exists, testing and evaluating the design and operating effectiveness of internal control, based on the assessed risk, and performing such other procedures as we considered necessary in the circumstances. We believe that our audit provides a reasonable basis for our opinion.
A company's internal control over financial reporting is a process designed by, or under the supervision of, the company's principal executive and principal financial officers, or persons performing similar functions, and effected by the company's board of directors, management, and other personnel to provide reasonable assurance regarding the reliability of financial reporting and the preparation of financial statements for external purposes in accordance with generally accepted accounting principles. A company's internal control over financial reporting includes those policies and procedures that (1) pertain to the maintenance of records that, in reasonable detail, accurately and fairly reflect the transactions and dispositions of the assets of the company; (2) provide reasonable assurance that transactions are recorded as necessary to permit preparation of financial statements in accordance with generally accepted accounting principles, and that receipts and expenditures of the company are being made only in accordance with authorizations of management and directors of the company; and (3) provide reasonable assurance regarding prevention or timely detection of unauthorized acquisition, use, or disposition of the company's assets that could have a material effect on the financial statements.
Because of the inherent limitations of internal control over financial reporting, including the possibility of collusion or improper management override of controls, material misstatements due to error or fraud may not be prevented or detected on a timely basis. Also, projections of any evaluation of the effectiveness of the internal control over financial reporting to future periods are subject to the risk that the controls may become inadequate because of changes in conditions, or that the degree of compliance with the policies or procedures may deteriorate.
In our opinion, the Company maintained, in all material respects, effective internal control over financial reporting as of October 31, 2012, based on the criteria established in Internal Control-Integrated Framework issued by the Committee of Sponsoring Organizations of the Treadway Commission.
We have also audited, in accordance with the standards of the Public Company Accounting Oversight Board (United States), the consolidated financial statements and financial statement schedule as of and for the year ended October 31, 2012 of the Company and our report dated December 31, 2012 expressed an unqualified opinion on those financial statements and financial statement schedule.
/s/ DELOITTE & TOUCHE LLP |
|
Houston, Texas |
December 31, 2012 |
89
Table of Contents
PART III
Item 10. | Directors, Executive Officers and Corporate Governance. |
Pursuant to General Instruction G(3) to Form 10-K, additional information on directors, executive officers and corporate governance of the Registrant is incorporated herein by reference from the Registrant's Definitive Proxy Statement or an amendment to this Form 10-K to be filed pursuant to Regulation 14A within 120 days after the close of the fiscal year ended October 31, 2012.
Item 11. | Executive Compensation. |
Pursuant to General Instruction G(3) to Form 10-K, information on executive compensation is incorporated herein by reference from the Registrant's Definitive Proxy Statement or an amendment to this Form 10-K to be filed pursuant to Regulation 14A within 120 days after the close of the fiscal year ended October 31, 2012.
Item 12. | Security Ownership of Certain Beneficial Owners and Management and Related Stockholder Matters. |
Pursuant to General Instruction G(3) to Form 10-K, information on security ownership of certain beneficial owners and management and related stockholder matters is incorporated herein by reference from the Registrant's Definitive Proxy Statement or an amendment to this Form 10-K to be filed pursuant to Regulation 14A within 120 days after the close of the fiscal year ended October 31, 2012.
Item 13. | Certain Relationships and Related Transactions, and Director Independence. |
Pursuant to General Instruction G(3) to Form 10-K, information on certain relationships and related transactions, and director independence is incorporated herein by reference from the Registrant's Definitive Proxy Statement or an amendment to this Form 10-K to be filed pursuant to Regulation 14A within 120 days after the close of the fiscal year ended October 31, 2012.
Item 14. | Principal Accountant Fees and Services. |
Pursuant to General Instruction G(3) to Form 10-K, information on principal accountant fees and services is incorporated herein by reference from the Registrant's Definitive Proxy Statement or an amendment to this Form 10-K to be filed pursuant to Regulation 14A within 120 days after the close of the fiscal year ended October 31, 2012.
90
Table of Contents
PART IV
Item 15. | Exhibits and Financial Statement Schedules |
(a) | Listing of Documents |
|
|
| Page |
1. |
| Financial Statements |
|
|
|
|
|
|
| Report of Independent Registered Public Accounting Firm | 45 |
|
| Consolidated Balance Sheets | 46 |
|
| Consolidated Statements of Income | 47 |
|
| Consolidated Statements of Stockholders' Equity | 48 |
|
| Consolidated Statements of Cash Flow | 50 |
|
| Notes to Consolidated Financial Statements | 51 |
|
|
|
|
2. |
| Financial Statement Schedule |
|
|
|
|
|
|
| Schedule II-Valuation and Qualifying Accounts | 87 |
|
|
|
|
Schedules not listed or discussed above have been omitted as they are either inapplicable or the required information has been given in the Consolidated Financial Statements or the notes thereto. |
| ||
|
|
|
|
3. |
| Exhibits | 92 |
91
Table of Contents
EXHIBIT INDEX
Exhibit Number |
| Description of Exhibits | |||
|
| 2.1 | |
| Distribution Agreement among Quanex Corporation, Quanex Building Products LLC and Quanex Building Products Corporation (incorporated by reference to Exhibit 10.1 to Quanex Corporation's Current Report on Form 8-K filed with the Commission on December 24, 2007). |
|
|
|
|
| |
|
| 2.2 | |
| Agreement and Plan of Merger, dated as of January 31, 2011, by and among Quanex Building Products Corporation, QSB Inc., Lauren Holdco Inc., Lauren International, Inc. and Kevin E. Gray, as agent for the shareholders of Lauren Holdco Inc., filed as Exhibit 2.1 of the Registrant's Current Report on Form 8-K (Reg. No. 001-33913) as filed with the Securities and Exchange Commission on February 2, 2011, and incorporated herein by reference. |
|
|
|
|
| |
|
| 3.1 | |
| Certificate of Incorporation of the Registrant dated as of December 12, 2007, filed as Exhibit 3.1 of the Registrant's Registration Statement on Form 10 (Reg. No. 001-33913) as filed with the Securities and Exchange Commission on January 11, 2008, and incorporated herein by reference. |
|
|
|
|
| |
|
| 3.2 | |
| Amended and Restated Bylaws of the Registrant dated as of August 28, 2008, filed as Exhibit 3.2 of the Registrant's Quarterly Report on Form 10-Q (Reg. No. 001-33913) as filed with the Securities and Exchange Commission for the quarter ended July 31, 2008, and incorporated herein by reference. |
|
|
|
|
| |
|
| 4.1 | |
| Form of Registrant's common stock certificate, filed as Exhibit 4.1 of Amendment No. 1 to the Registrant's Registration Statement on Form 10 (Reg. No. 001-33913), as filed with the Securities and Exchange Commission on February 14, 2008, and incorporated herein by reference. |
|
|
|
|
| |
|
| 4.2 | |
| Credit Agreement dated as of April 23, 2008, among the Company, certain of its subsidiaries as guarantors, Wells Fargo Bank, National Association, in its capacity as administrative agent, and certain lender parties, filed as Exhibit 10.1 of the Registrant's Current Report on Form 8-K (Reg. No. 001-33913) dated April 23, 2008, and incorporated herein by reference. |
|
|
|
|
| |
† |
| 10.1 | |
| Quanex Building Products Corporation 2008 Omnibus Incentive Plan, as amended effective February 24, 2011, filed as Exhibit 10.1 to the Registrant's Quarterly Report on Form 10-Q (Reg. No. 001-33913), as filed with the Securities and Exchange Commission for the quarter ended January 31, 2011, and incorporated herein by reference. |
|
|
|
|
| |
† |
| 10.2 | |
| Quanex Building Products Corporation Deferred Compensation Plan, filed as Exhibit 10.7 of Amendment No. 4 to the Registrant's Registration Statement on Form 10 (Reg. No. 001-33913), as filed with the Securities and Exchange Commission on March 17, 2008, and incorporated herein by reference. |
|
|
|
|
| |
† |
| 10.3 | |
| Quanex Building Products Corporation Restoration Plan, filed as Exhibit 10.8 of Amendment No. 4 to the Registrant's Registration Statement on Form 10 (Reg. No. 001-33913), as filed with the Securities and Exchange Commission on March 17, 2008, and incorporated herein by reference. |
|
|
|
|
| |
† |
| 10.4 | |
| Quanex Building Products Corporation Supplemental Employees Retirement Plan, filed as Exhibit 10.9 of Amendment No. 4 to the Registrant's Registration Statement on Form 10 (Reg. No. 001-33913), as filed with the Securities and Exchange Commission on March 17, 2008, and incorporated herein by reference. |
|
|
|
|
| |
† |
| 10.5 | |
| Form of Severance Agreement between the Registrant and certain of its executive officers, filed as Exhibit 10.5 of Amendment No. 1 to the Registrant's Registration Statement on Form 10 (Reg. No. 001-33913), as filed with the Securities and Exchange Commission on February 14, 2008, and incorporated herein by reference. |
|
|
|
|
| |
† |
| 10.6 | |
| Form of Change in Control Agreement between the Registrant and certain of its executive officers, filed as Exhibit 10.6 of Amendment No. 1 to the Registrant's Registration Statement on Form 10 (Reg. No. 001-33913), as filed with the Securities and Exchange Commission on February 14, 2008, and incorporated herein by reference. |
|
|
|
|
| |
† |
| 10.7 | |
| Letter Agreement between the Registrant and David D. Petratis, effective as of July 1, 2008, filed as Exhibit 10.1 of the Registrant's Current Report on Form 8-K (Reg. No. 001-33913), as filed with the Securities and Exchange Commission on May 22, 2008, and incorporated herein by reference. |
|
|
|
|
| |
† |
| 10.8 | |
| Form of Indemnity Agreement between the Registrant and each of its independent directors, effective September 2, 2008, filed as Exhibit 10.1 of the Registrant's Current Report on Form 8-K (Reg. No. 001-33913), as filed with the Securities and Exchange Commission on August 29, 2008, and incorporated herein by reference. |
|
|
|
|
| |
† |
| 10.9 | |
| Form of Indemnity Agreement between the Registrant and each of its officers, effective September 2, 2008, filed as Exhibit 10.2 of the Registrant's Current Report on Form 8-K (Reg. No. 001-33913), as filed with the Securities and Exchange Commission on August 29, 2008, and incorporated herein by reference. |
|
|
|
|
| |
92
Table of Contents
Exhibit Number |
| Description of Exhibits | |||
|
| 10.10 | |
| Lease Agreement between Cabot Industrial Properties, L.P. and Quanex Corporation dated August 30, 2002 (and assumed by Quanex Homeshield, LLC on November 1, 2007), filed as Exhibit 10.52 to the Annual Report on Form 10-K of Quanex Corporation (Reg. No. 001-05725) for the fiscal year ended October 31, 2003 and incorporated herein by reference. |
|
|
|
|
| |
|
| 10.11 | |
| First Amendment to Lease Agreement between Cabot Industrial Properties, L.P. and Quanex Corporation dated May 22, 2007 (and assumed by Quanex Homeshield, LLC on November 1, 2007), filed as Exhibit 10.11 to the Company's Annual Report on Form 10-K (Reg. No. 001-33913) for the fiscal year ended October 31, 2008, and incorporated herein by reference. |
|
|
|
|
| |
* |
| 10.12 | |
| Second Amendment to Lease Agreement between Dexus Industrial SPE Financed Portfolio LLC, successor in interest to Cabot Industrial Properties, L.P. and Quanex Building Products Corporation dated April 28, 2010, filed herewith. |
|
|
|
|
| |
|
| 10.13 | |
| Lease dated May 3, 1989, and Lease Extension dated June 9, 2004, between Mikron Industries, Inc. and the W.R. Sandwith and Michael G. Ritter Partnership, filed as Exhibit 10.12 to the Company's Annual Report on Form 10-K (Reg. No. 001-33913) for the fiscal year ended October 31, 2008, and incorporated herein by reference. |
|
|
|
|
| |
|
| 10.14 | |
| Amendment to Lease by and between W.R. Sandwith and Michael G. Ritter Partnership and Mikron Washington LLC, filed as Exhibit 10.1 to the Company's Quarterly Report on Form 10-Q (Reg. No. 001-33913) for the quarter ended April 30, 2010, and incorporated herein by reference. |
|
|
|
|
| |
* |
| 10.15 | |
| Lease Agreement dated March 31, 2011 between Lauren Real Estate Holding LLC and Edgetech I.G. Inc., filed herewith. |
|
|
|
|
| |
* |
| 21.1 | |
| Subsidiaries of the Registrant. |
|
|
|
|
| |
* |
| 23.1 | |
| Consent of Deloitte and Touche LLP. |
|
|
|
|
| |
* |
| 31.1 | |
| Certification by chief executive officer pursuant to Rule 13a-14(a)/15d-14(a). |
|
|
|
|
| |
* |
| 31.2 | |
| Certification by chief financial officer pursuant to Rule 13a-14(a)/15d-14(a). |
|
|
|
|
| |
* |
| 32 | |
| Certification pursuant to Section 906 of the Sarbanes-Oxley Act of 2002. |
|
|
|
|
| |
* |
| 101.INS | |
| XBRL Instance Document |
|
|
|
|
| |
* |
| 101.SCH | |
| XBRL Taxonomy Extension Schema Document |
|
|
|
|
| |
* |
| 101.CAL | |
| XBRL Taxonomy Extension Calculation Linkbase Document |
|
|
|
|
| |
* |
| 101.DEF | |
| XBRL Taxonomy Extension Definition Linkbase Document |
|
|
|
|
| |
* |
| 101.LAB | |
| XBRL Taxonomy Extension Label Linkbase Document |
|
|
|
|
| |
* |
| 101.PRE | |
| XBRL Taxonomy Extension Presentation Linkbase Document |
* | Filed herewith. |
† | Management Compensation or Incentive Plan |
As permitted by Item 601(b)(4)(iii)(A) of Regulation S-K, the Registrant has not filed with this Annual Report on Form 10-K certain instruments defining the rights of holders of long-term debt of the Registrant and its subsidiaries because the total amount of securities authorized under any of such instruments does not exceed 10% of the total assets of the Registrant and its subsidiaries on a consolidated basis. The Registrant agrees to furnish a copy of any such agreements to the Securities and Exchange Commission upon request.
93
Table of Contents
SIGNATURES
Pursuant to the requirements of Section 13 or 15(d) of the Securities Exchange Act of 1934, the Registrant has duly caused this report to be signed on its behalf by the undersigned, thereunto duly authorized.
Q UANEX B UILDING P RODUCTS C ORPORATION |
|
| ||
|
|
|
|
|
By: |
| /s/ David D. Petratis |
| December 31, 2012 |
|
| David D. Petratis Chairman of the Board, President and Chief Executive Officer |
|
|
Pursuant to the requirements of the Securities Exchange Act of 1934, this report has been signed below by the following persons on behalf of the Registrant and in the capacities and on the dates indicated.
Name |
| Title |
| Date |
|
|
|
|
|
/s/ David D. Petratis |
| Chairman of the Board, President and |
| December 31, 2012 |
David D. Petratis |
| Chief Executive Officer |
|
|
|
|
|
|
|
|
|
|
|
|
|
|
|
|
|
|
|
|
|
|
/s/ Susan F. Davis |
| Director |
| December 31, 2012 |
Susan F. Davis |
|
|
|
|
|
|
|
|
|
/s/ William C. Griffiths |
| Director |
| December 31, 2012 |
William C. Griffiths |
|
|
|
|
|
|
|
|
|
/s/ LeRoy D. Nosbaum |
| Director |
| December 31, 2012 |
LeRoy D. Nosbaum |
|
|
|
|
|
|
|
|
|
/s/ Joseph D. Rupp |
| Director |
| December 31, 2012 |
Joseph D. Rupp |
|
|
|
|
|
|
|
|
|
/s/ Curtis M. Stevens |
| Director |
| December 31, 2012 |
Curtis M. Stevens |
|
|
|
|
|
|
|
|
|
/s/ Robert R. Buck |
| Director |
| December 31, 2012 |
Robert R. Buck |
|
|
|
|
|
|
|
|
|
/s/ Brent L. Korb |
| Senior Vice President-Finance |
| December 31, 2012 |
Brent L. Korb |
| Chief Financial Officer (Principal Financial Officer) |
|
|
|
|
|
|
|
/s/ Deborah M. Gadin |
| Vice President and Controller (Principal Accounting Officer) |
| December 31, 2012 |
Deborah M. Gadin |
|
|
| |
94