UNITED STATES
SECURITIES AND EXCHANGE COMMISSION
Washington D.C. 20549
Form 10-K
ý | ANNUAL REPORT PURSUANT TO SECTION 13 OR 15(d) OF THE SECURITIES EXCHANGE ACT OF 1934 |
For the fiscal year ended
March 31, 2015
Or
¨ | TRANSITION REPORT PURSUANT TO SECTION 13 OR 15(d) OF THE SECURITIES EXCHANGE ACT OF 1934 |
For the transition period from to .
Commission file number 001-32312
Novelis Inc.
(Exact name of registrant as specified in its charter)
Canada |
| 98-0442987 |
(State or other jurisdiction of incorporation or organization) |
| (I.R.S. Employer Identification Number) |
|
| |
3560 Lenox Road, Suite 2000, Atlanta, GA |
| 30326 |
(Address of principal executive offices) |
| (Zip Code) |
(404) 760-4000
(Registrant's telephone number, including area code)
Securities registered pursuant to Section 12(b) of the Act:
None
Securities registered pursuant to Section 12(g) of the Act:
None
Indicate by check mark if the Registrant is a well-known seasoned issuer, as defined in Rule 405 of the Securities Act of 1933.
Yes ¨ No ý
Indicate by check mark if the Registrant is not required to file reports pursuant to Section 13 or Section 15(d) of the Securities Exchange Act of 1934 (the "Exchange Act"). Yes ¨ No ý
Indicate by check mark whether the registrant (1) has filed all reports required to be filed by Section 13 or 15(d) of the Exchange Act during the preceding 12 months (or for such shorter period that the Registrant was required to file such reports), and (2) has been subject to such filing requirements for the past 90 days. Yes ý No ¨
Indicate by check mark whether the registrant has submitted electronically and posted on its corporate Web site, if any, every Interactive Data File required to be submitted and posted pursuant to Rule 405 of Regulation S-T during the preceding 12 months (or for such shorter period that the registrant was required to submit and post such files). Yes ý No ¨
Indicate by check mark if disclosure of delinquent filers pursuant to Item 405 of Regulation S-K is not contained herein, and will not be contained, to the best of Registrant's knowledge, in definitive proxy or information statements incorporated by reference in Part III of this Form 10-K or any amendment to this Form 10-K. ý
Indicate by check mark whether the registrant is a large accelerated filer, an accelerated filer, a non-accelerated filer, or a smaller reporting company. See the definitions of "large accelerated filer," "accelerated filer" and "smaller reporting company" in Rule 12b-2 of the Exchange Act. (Check one):
Large accelerated filer | ¨ | Accelerated filer | ¨ |
|
|
|
|
Non-accelerated filer | x (Do not check if a smaller reporting company) | Smaller reporting company | ¨ |
Indicate by check mark whether the Registrant is a shell company (as defined in Rule 12b-2 of the Exchange Act). Yes ¨ No ý
As of May 11, 2015 , the registrant had 1,000 common shares outstanding. All of the Registrant's outstanding shares were held indirectly by Hindalco Industries Ltd., the Registrant's parent company.
DOCUMENTS INCORPORATED BY REFERENCE
None
TABLE OF CONTENTS
|
|
SPECIAL NOTE REGARDING FORWARD-LOOKING STATEMENTS AND MARKET DATA |
|
PART I |
|
Item 1. Business | 4 |
Item 1A. Risk Factors | 15 |
Item 1B. Unresolved Staff Comments | 23 |
Item 2. Properties | 23 |
Item 3. Legal Proceedings | 26 |
Item 4. Mine Safety Disclosures | 26 |
PART II |
|
Item 5. Market for Registrant's Common Equity, Related Shareholder Matters and Issuer Purchases of Equity Securities | 27 |
Item 6. Selected Financial Data | 27 |
Item 7. Management's Discussion and Analysis of Financial Condition and Results of Operations | 28 |
Item 7A. Quantitative and Qualitative Disclosures About Market Risk | 62 |
Item 8. Financial Statements and Supplementary Data | 65 |
Item 9. Changes In and Disagreements With Accountants On Accounting and Financial Disclosure | 141 |
Item 9A. Controls and Procedures | 141 |
Item 9B. Other Information | 141 |
PART III |
|
Item 10. Directors, Executive Officers and Corporate Governance | 142 |
Item 11. Executive Compensation | 146 |
Item 12. Security Ownership of Certain Beneficial Owners and Management and Related Shareholder Matters | 163 |
Item 13. Certain Relationships and Related Transactions and Director Independence | 164 |
Item 14. Principal Accountant Fees and Services | 165 |
PART IV |
|
I tem 15. Exhibits and Financial Statement Schedules | 166 |
2
SPECIAL NOTE REGARDING FORWARD-LOOKING STATEMENTS AND MARKET DATA
This document contains forward-looking statements that are based on current expectations, estimates, forecasts and projections about the industry in which we operate, and beliefs and assumptions made by our management. Such statements include, in particular, statements about our plans, strategies and prospects under the headings "Item 1. Business," "Item 1A. Risk Factors" and "Item 7. Management's Discussion and Analysis of Financial Condition and Results of Operations." Words such as "expect," "anticipate," "intend," "plan," "believe," "seek," "estimate" and variations of such words and similar expressions are intended to identify such forward-looking statements. Examples of forward-looking statements in this Annual Report on Form 10-K include, but are not limited to, our expectations with respect to the impact of metal price movements on our financial performance; the effectiveness of our hedging programs and controls; and our future borrowing availability. These statements are based on beliefs and assumptions of Novelis' management, which in turn are based on currently available information. These statements are not guarantees of future performance and involve assumptions and risks and uncertainties that are difficult to predict. Therefore, actual outcomes and results may differ materially from what is expressed, implied or forecasted in such forward-looking statements. We do not intend, and we disclaim any obligation, to update any forward-looking statements, whether as a result of new information, future events or otherwise.
This document also contains information concerning our markets and products generally, which is forward-looking in nature and is based on a variety of assumptions regarding the ways in which these markets and product categories will develop. These assumptions have been derived from information currently available to us and to the third party industry analysts quoted herein. This information includes, but is not limited to, product shipments and share of production. Actual market results may differ from those predicted. We do not know what impact any of these differences may have on our business, our results of operations, financial condition, and cash flow. Factors that could cause actual results or outcomes to differ from the results expressed or implied by forward-looking statements include, among other things:
• | relationships with, and financial and operating conditions of, our customers, suppliers and other stakeholders; |
• | changes in the prices and availability of aluminum (or premiums associated with aluminum prices) or other materials and raw materials we use; |
• | fluctuations in the supply of, and prices for, energy in the areas in which we maintain production facilities; |
• | our ability to access financing to fund current operations and for future capital requirements; |
• | the level of our indebtedness and our ability to generate cash to service our indebtedness; |
• | lowering of our ratings by a credit rating agency; |
• | changes in the relative values of various currencies and the effectiveness of our currency hedging activities; |
• | union disputes and other employee relations issues; |
• | factors affecting our operations, such as litigation (including product liability claims), environmental remediation and clean-up costs, breakdown of equipment and other events; |
• | changes in general economic conditions, including deterioration in the global economy; |
• | the capacity and effectiveness of our hedging activities; |
• | impairment of our goodwill, other intangible assets, and long-lived assets; |
• | loss of key management and other personnel, or an inability to attract such management and other personnel; |
• | risks relating to future acquisitions or divestitures; |
• | our inability to successfully implement our growth initiatives; |
• | changes in interest rates that have the effect of increasing the amounts we pay under our senior secured credit facilities, other financing agreements and our defined benefit pension plans; |
• | risks relating to certain joint ventures and subsidiaries that we do not entirely control; |
• | the effect of derivatives legislation on our ability to hedge risks associated with our business; |
• | competition from other aluminum rolled products producers as well as from substitute materials such as steel, glass, plastic and composite materials; |
• | demand and pricing within the principal markets for our products as well as seasonality in certain of our customers' industries; |
• | economic, regulatory and political factors within the countries in which we operate or sell our products, including changes in duties or tariffs; and |
• | changes in government regulations, particularly those affecting taxes and tax rates, health care reform, climate change, environmental, health or safety compliance. |
The above list of factors is not exhaustive. These and other factors are discussed in more detail under "Item 1A. Risk Factors" and "Item 7. Management's Discussion and Analysis of Financial Condition and Results of Operations."
In this Annual Report on Form 10-K, unless otherwise specified, the terms "we," "our," "us," "Company," and "Novelis." refer to Novelis Inc., a company incorporated in Canada under the Canadian Business Corporations Act and its subsidiaries. References herein to "Hindalco" refer to Hindalco Industries Limited, which acquired Novelis in May 2007. In October 2007, Rio Tinto Group purchased all of the outstanding shares of Alcan Inc. References herein to "RTA" refer to Rio Tinto Alcan Inc.
Exchange Rate Data
We report our financial statements in United States (U.S.) dollars. The following table sets forth exchange rate information expressed in terms of Canadian dollars per U.S. dollar based on exchange data published daily from Citibank as of 16:00 Greenwich Mean Time (GMT) (11:00 A.M. Eastern Standard Time). The rates set forth below may differ from the actual rates used in our accounting processes and in the preparation of our consolidated financial statements.
Period |
| At Period End |
| Average Rate(A) |
| High |
| Low | ||||
Year Ended March 31, 2011 |
| 0.9709 | |
| 1.0206 | |
| 1.0663 | |
| 0.9709 | |
Year Ended March 31, 2012 |
| 0.9973 | |
| 0.9922 | |
| 1.0433 | |
| 0.9510 | |
Year Ended March 31, 2013 |
| 1.0160 | |
| 1.0030 | |
| 1.0334 | |
| 0.9601 | |
Year Ended March 31, 2014 |
| 1.1044 | |
| 1.0577 | |
| 1.1127 | |
| 1.0074 | |
Year Ended March 31, 2015 |
| 1.2666 | |
| 1.1467 | |
| 1.2681 | |
| 1.0665 | |
(A) | This represents the average of the 16:00 GMT buying rates on the last day of each month during the period. |
All dollar figures herein are in U.S. dollars unless otherwise indicated.
Commonly Referenced Data
As used in this Annual Report, consolidated "aluminum rolled product shipments," "flat rolled product shipments," or "shipments" refers to aluminum rolled products shipments to third parties. "Aluminum rolled product shipments," "flat rolled product shipments," or "shipments" associated with the regions refers to aluminum rolled product shipments to third parties and intersegment shipments to other Novelis regions. Shipment amounts also include tolling shipments. References to "total shipments" include aluminum rolled product shipments as well as certain other non-rolled product shipments, primarily scrap, used beverage cans (UBCs), ingot, billets, and primary remelt. The term "aluminum rolled products" is synonymous with the terms "flat rolled products" and "FRP" commonly used by manufacturers and third party analysts in our industry. All tonnages are stated in metric tonnes. One metric tonne is equivalent to 2,204.6 pounds. One kilotonne (kt) is 1,000 metric tonnes.
A significant amount of our business is conducted under a conversion model, which allows us to pass through increases or decreases in the price of aluminum to our customers. Most of our flat-rolled products have a price structure with two components: (i) a pass-through aluminum price based on the London Metal Exchange (LME) plus local market premiums and (ii) a "conversion premium" to produce the rolled product which reflects, among other factors, the competitive market conditions for that product. The use of the term "conversion premium" in this Annual Report, refers to the conversion costs plus a margin we charge our customers to produce the rolled product which reflects, among other factors, the competitive market conditions for that product, exclusive of the pass through aluminum price.
3
PART I
Item 1. Business
Overview
We are the world's leading aluminum rolled products producer based on shipment volume in fiscal 2015 , with flat rolled product shipments during that period of approximately 3,050 kt. We are also the global leader in the recycling of aluminum. We are the only company of our size and scope focused solely on aluminum rolled products markets and capable of local supply of technologically sophisticated aluminum products in all four major industrialized continents: North America, South America, Europe and Asia. We had "Net sales" of approximately $11 billion for the year ended March 31, 2015 .
Our History
Organization and Description of Business
All of the common shares of Novelis are owned directly by AV Metals Inc. and indirectly by Hindalco Industries Limited. We produce aluminum sheet and light gauge products primarily for use in the beverage can, automotive, specialty products (including consumer electronics, architecture, and other transportation) and foil markets. We also have recycling operations in many of our plants to recycle aluminum, such as UBCs. As of March 31, 2015 , we had manufacturing operations in eleven countries on four continents: North America, South America, Asia and Europe, through 25 operating facilities, including recycling operations in eleven of these plants. In addition to aluminum rolled products plants, our South American business includes power generation facilities, although we divested the majority of these facilities during fiscal 2015.
Our Industry
The aluminum rolled products market represents the global supply of, and demand for, aluminum sheet, plate and foil produced either from sheet ingot or continuously cast roll-stock in rolling mills operated by both independent aluminum rolled products producers and integrated aluminum companies.
Aluminum rolled products are semi-finished aluminum products that constitute the raw material for the manufacture of finished goods ranging from automotive structures and body panels to food and beverage cans. There are two major types of manufacturing processes for aluminum rolled products differing mainly in the process used to achieve the initial stage of processing:
• | hot mills - which require sheet ingot, a rectangular slab of aluminum, as starter material; and |
• | continuous casting mills - which can convert molten metal directly into semi-finished sheet. |
Both processes require subsequent rolling, which we refer to as cold rolling, and finishing steps such as annealing, coating, leveling or slitting to achieve the desired thickness, width and metal properties. Most customers receive shipments in the form of aluminum coil, a large roll of metal, which can be utilized in their fabrication processes.
Industry Sources of Metal
There are two sources of input material: (1) recycled aluminum, produced by remelting post-industrial and post-consumer scraps such as UBCs; and (2) primary aluminum, produced from bauxite, processed in a smelter.
Primary aluminum and sheet ingot can generally be purchased at prices set on the LME, plus a local market premium that varies by geographic region of delivery, alloying material, form (ingot or molten metal) and purity.
Recycled aluminum is an important and growing source of input material. Aluminum is infinitely recyclable and recycling it requires approximately 5% of the energy needed to produce primary aluminum. As a result, in regions where aluminum is widely used, manufacturers and customers are active in setting up collection processes in which UBCs and other recyclable aluminum products are collected for re-melting and reuse. Manufacturers may also enter into agreements with customers who return processed scrap and pay to have it re-melted and rolled into the same product again; which is referred to as tolling.
Recycled aluminum is generally purchased at a discount compared to the price of primary aluminum. The spread between the prices for recycled aluminum and the price of primary aluminum varies by the LME primary aluminum price, type and quality of the scrap, geographic region, and other market factors. The overall benefit we receive from utilizing recycled metal is influenced by: 1) the overall price levels of the LME and local market premiums, 2) the spread between the price for recycled aluminum and the LME primary aluminum price and 3) our consumption levels of the recycled material inputs.
4
Industry End-use Markets
Aluminum rolled products companies produce and sell a wide range of products, which can be grouped into five end-use markets: (1) packaging; (2) transportation; (3) consumer electronics; (4) architectural and (5) industrial and other. Within each end-use market, aluminum rolled products are manufactured with a variety of alloy mixtures; a range of tempers (hardness), gauges (thickness) and widths; and various coatings and finishes. Large customers typically have customized needs resulting in the development of close relationships, including technical development relationships, with their supplying mills.
Aluminum, because of its light weight, recyclability and formability, has a wide variety of uses in packaging and other end-use markets. The recyclability of aluminum enables it to be used, collected, melted and returned to the original product form an unlimited number of times, unlike paper and polyethylene terephthalate (PET) plastic, which deteriorate with every iteration of recycling.
Packaging. Aluminum is used in beverage cans and bottles, food cans, beverage screw caps and foil, among others. Packaging is the largest aluminum rolled products application, according to market data from Commodity Research Unit International Limited (CRU), an independent business analysis and consultancy group. Beverage cans are one of the largest aluminum rolled products applications. In addition to their recyclability, aluminum beverage cans offer advantages in fabricating efficiency and product shelf life. Fabricators are able to produce and fill beverage cans at very high speeds, and non-porous aluminum cans provide longer shelf life than PET plastic containers. Additionally, the use of aluminum to package beverages such as craft beer is increasing, as aluminum blocks sunlight and therefore maintains the quality and taste of the product longer. Aluminum cans are light, stackable and use space efficiently, making them convenient and cost-efficient to ship.
Beverage can sheet is sold in coil form for the production of can bodies, ends and tabs. The material can be ordered as rolled, degreased, pre-lubricated, pre-treated and/or lacquered. Typically, can makers define their own specifications for material to be delivered in terms of alloy, gauge, width and surface finish.
Foil wrap is another packaging application and it includes household and institutional aluminum foil. Known in the industry as packaging foil, it is manufactured in thicknesses ranging from 11 microns to 23 microns. Container foil is used to produce semi-rigid containers such as pie plates and take-out food trays and is usually ordered in a range of thicknesses from 60 microns to 200 microns.
Transportation. Aluminum rolled products are used in vehicle structures as well as automotive body panel applications, including hoods, deck lids, fenders and lift gates. These uses typically result from cooperative efforts between aluminum rolled products manufacturers and their customers that yield tailor-made solutions for specific requirements in alloy selection, fabrication procedure, surface quality and joining. There has been recent growth in certain geographic markets in automotive applications due to the lighter weight, better fuel economy and improved emissions performance associated with these applications. We expect increased growth in this end-use market driven by government regulations, improved emissions and better fuel economy; while also maintaining or improving vehicle handling, braking, and safety.
Heat exchangers, such as radiators and air conditioners, are an important application for aluminum rolled products in the truck and automobile categories of the transportation end-use market. Original equipment manufacturers also use aluminum sheet with specially treated surfaces and other specific properties for interior and exterior applications. Newly developed alloys are being used in transportation tanks and rigid containers allowing for safer and more economical transportation of hazardous and corrosive materials.
Aluminum is also used in aerospace applications, as well as in the construction of ships' hulls, superstructures and passenger rail cars because of its strength, light weight, formability and corrosion resistance.
Consumer Electronics. Aluminum's lightweight characteristics, high formability, ability to conduct electricity and dissipate heat and to offer corrosion resistance makes it useful in a wide variety of electronic applications. Uses of aluminum rolled products in electronics include flat screen televisions, personal computers, laptops, mobile devices, and digital music players.
Architectural. Construction is the largest application within this end-use market. Aluminum rolled products developed for the construction industry are often decorative and non-flammable, offer insulating properties, are durable and corrosion resistant, and have a high strength-to-weight ratio. Aluminum siding, gutters, and downspouts comprise a significant amount of construction volume. Other applications include doors, windows, awnings, canopies, facades, roofs and ceilings.
Industrial and Other. Industrial applications include heat exchangers, process and electrical machinery, lighting fixtures, furniture and insulation. Other uses of aluminum rolled products in consumer durables include microwaves, coffee makers, air conditioners and cooking utensils.
5
Market Structure and Competition
North America | Asia |
Alcoa, Inc. (Alcoa) | Alcoa |
Aleris International, Inc. (Aleris) | UACJ Corporation |
Constellium | Kobe Steel Ltd. |
Noranda Aluminum | Nanshan Aluminum |
UACJ Corporation/ Tri-Arrows Aluminum Inc. (Tri-Arrows) | Chinalco Group |
| Mingtai |
Europe | Henan Zhongfu Industrial Co., Ltd |
Alcoa | BinZhou WeiQiao Aluminium Science & Technology Co.Ltd |
Aleris | China Zhongwang Holdings Limited |
Hydro A.S.A. |
|
Constellium | South America |
| Alcoa |
| Companhia Brasileira de Alumínio |
The factors influencing competition vary by region and end-use market, but generally we compete on the basis of our value proposition; which includes price, product quality, the ability to meet customers' specifications, range of products offered, lead times, technical support and customer service. In some end-use markets, competition is also affected by fabricators' requirements that suppliers complete a qualification process to supply their plants. This process can be rigorous and may take many months to complete. As a result, obtaining business from these customers can be a lengthy and expensive process. However, the ability to obtain and maintain these qualifications can represent a competitive advantage.
In addition to competition from others within the aluminum rolled products industry, we, as well as the other aluminum rolled products manufacturers, face competition from non-aluminum material producers, as fabricators and end-users have, in the past, demonstrated a willingness to substitute other materials for aluminum. In packaging (primarily beverage and food cans), aluminum rolled products' primary competitors are glass, PET plastic, and in some regions, steel. In the transportation end-use market, aluminum rolled products compete mainly with steel and composites. Aluminum competes with wood, plastic, cement and steel in building products applications. Factors affecting competition with substitute materials include price, ease to manufacture, consumer preference and performance characteristics.
6
Key Factors Affecting Supply and Demand
The following factors have historically affected the supply of aluminum rolled products:
Production Capacity and Alternative Technology. In the aluminum rolled products industry, the addition of rolling capacity requires large capital investments and significant plant construction or expansion, and typically requires long lead-time equipment orders. Advances in technological capabilities allow aluminum rolled products producers to better align product portfolios and supply with industry demand. In addition, there are lower cost ways to enter the industry such as continuous casting, which offers the ability to increase capacity in smaller increments than is possible with hot mill additions. This enables production capacity to better adjust to small year-over-year increases in demand; however, the continuous casting process results in a more limited range of products.
Trade. Some trade flows do occur between regions despite shipping costs, import duties and the lack of localized customer support. Higher value-added products are more likely to be traded internationally, especially if demand in certain markets exceeds local supply. With respect to less technically demanding applications, emerging markets with low cost inputs may export commodity aluminum rolled products to larger, more mature markets, as we have seen with China. Accordingly, regional changes in supply, such as plant expansions, have some impact on the worldwide supply of aluminum rolled products.
The following factors have historically affected the demand for aluminum rolled products:
Economic Growth. We believe that economic growth is a significant driver of aluminum rolled products demand. In mature markets, growth in demand has typically correlated closely with growth in industrial production.
In many emerging markets, growth in demand typically exceeds industrial production growth largely because of expanding infrastructures, capital investments and rising incomes that often accompany economic growth in these markets.
Substitution Trends. Manufacturers' willingness to substitute other materials for aluminum in their products and competition from substitution materials suppliers also affect demand. There has been a strong substitution trend toward aluminum in the use of vehicles as automobile manufacturers look for ways to meet fuel efficiency regulations, improve performance and reduce carbon emissions in a cost-efficient manner. As a result of aluminum's durability, strength and light weight, automobile manufacturers are substituting heavier alternatives such as steel and iron with aluminum. Carbon fiber is another lightweight material option, but its relatively high cost and limited end-of-life recyclability reduce its competitiveness as a widespread material substitute today. Consequently, demand for flat rolled aluminum products has increased. We also see strong substitution trends toward aluminum and away from steel in the beverage can market globally; except for North America, which is already a mature market.
Seasonality. During our third fiscal quarter, we typically experience seasonal slowdowns resulting in lower shipment volumes. This is a result of declines in overall production output due primarily to holidays and cooler weather in North America and Europe, our two largest operating regions. We also experience downtime at our mills and customers' mills due to scheduled plant maintenance and are impacted to a lesser extent by the seasonal downturn in construction activity.
Sustainability. Growing awareness of environmentalism and demand for recyclable products has increased the demand for aluminum rolled products. Unlike other commonly recycled materials such as paper or PET plastic, aluminum can be recycled an unlimited number of times without affecting the quality of the product. Additionally, the recycling process uses 95% less energy than is required to produce primary aluminum from mining and smelting, with an equivalent reduction in greenhouse gas emissions.
Our Business Strategy
Our primary objective is to deliver customer and shareholder value by being the most technologically advanced, innovative and profitable aluminum rolled products company in the world. We intend to achieve this objective through the following areas of focus:
Operate as "One Novelis" - a Fully-integrated Global Company
We intend to continue to build on our focused business model to operate as "One Novelis." The term "One Novelis" refers to our focus on being a truly integrated, global company driven by a singular focus. An important part of the One Novelis concept is our highly-focused, pass-through business model that utilizes our manufacturing excellence, our risk management expertise, our value-added conversion premium-based pricing, and, more importantly, our growing ability to leverage our global assets according to a single, corporate-wide vision. We believe this integrated approach is the foundation for the effective execution of our strategy across the Novelis system.
7
We strive to service our customers in a consistent, global manner through seamless alignment of goals, methods and metrics across the organization to improve communication and by implementation of strategic initiatives. These initiatives have resulted in solid operating margins and performance, and we will continue to take actions to ensure we are aligned to best leverage our operations globally.
Focus on Our Core Premium Products to Drive Enhanced Profitability
We focus on capturing the global growth we see in our premium product markets of beverage can, automotive and specialty products. We plan to continue improving our product mix and margins by leveraging our world-class assets and technical capabilities. Our management approach helps us to systematically identify opportunities to improve the profitability of our operations through product portfolio analysis. This ensures that we focus on growing in attractive market segments, while also taking actions to exit unattractive ones. During fiscal year 2013, we sold three foil and packaging plants in Europe. During fiscal year 2015, we sold our consumer foil operations in North America. Additionally, we have taken steps to exit certain non-core operations in Brazil, including ceasing operations at the smelter in Ouro Preto, Brazil and selling certain hydroelectric facilities. We will continue to focus on our core products while investing in growth markets.
Pursue Organic Growth Through Capital Investments in Growth Markets
Location |
| Description of Expansion |
| Estimated Capacity (at full capacity) |
| Actual or estimated commission start date |
North America |
|
|
|
|
|
|
Oswego, NY |
| Automotive sheet finishing capacity |
| 240 kt |
| July 2013 |
Oswego, NY |
| Automotive sheet finishing capacity |
| 120 kt |
| End CY2015 |
Europe |
|
|
|
|
|
|
Nachterstedt, Germany |
| Recycling plant |
| 400 kt |
| June 2014 |
Nachterstedt, Germany |
| Automotive sheet finishing expansion |
| 120 kt |
| End CY2015 |
Asia |
|
|
|
|
|
|
Ulsan & Yeongju, South Korea |
| Rolling expansion |
| 350 kt |
| July 2013 |
Yeongju, South Korea |
| Recycling expansion |
| 265 kt |
| October 2012 |
Changzhou, China |
| Automotive sheet finishing plant |
| 120 kt |
| July 2014 |
South America |
|
|
|
|
|
|
Pinda, Brazil |
| Rolling expansion |
| 220 kt |
| December 2012 |
Pinda, Brazil |
| Can coating line |
| 100 kt |
| January 2014 |
Pinda, Brazil |
| Recycling expansion |
| 190 kt |
| February 2014 |
Creating a Closed-Loop Business Model for a Sustainable Future
Novelis is in the process of shifting our business model from a traditional linear structure to a circular economy, closed-loop model. Although creating a true closed loop business model will take some time and require working with many stakeholders in our value chain, we are focusing right now on the most material aspects, which will have the most impact. To embark upon tackling our biggest issues, we have set 10 goals, which address recycled inputs, greenhouse gas emissions, energy, water and waste; as well as social targets for health and safety, ethical guidelines, employee performance and the communities where we operate. One of our goals is to reach 80% recycled content in our products, which significantly reduces our environmental footprint. Since 2011, we have invested approximately $500 million to increase our global recycling capacity. The results of these investments are beginning to be realized, as our recycled input has increased from 33% in fiscal 2011 to 53% by the end of fiscal year 2015. We report our progress against these targets annually through our global sustainability report.
8
Novelis is working closely with our customers on innovation to drive more sustainable products for society. Through lifecycle analysis, aluminum has shown to be a key material for light-weighting automobiles in order to increase fuel-efficiency. We are positioning ourselves to meet dramatically increased global demand for aluminum from our automobile customers by increasing the number of automotive finishing lines in our facilities in North America, Europe, and Asia. We are also working closely with our automobile customers to redesign automobile alloys to be made with more scrap, as well as to close the loop with them by taking back their production scrap and, in the longer term, end-of-life scrap. For our can customers, Novelis introduced the evercan ™ sheet, the first-of-its-kind, independently certified, high-recycled content aluminum beverage can sheet in fiscal 2014. In March 2015, we launched the sale of certified high-recycled content aluminum for specialty applications called evercycle ™ sheet in North America. This product, which is the only material of its kind in the market, is certified by SCS Global Services to contain 100% recycled aluminum, made up of 90% post-consumer content and 10% customer manufacturing scrap. Our evercycle sheet is expected to become available globally as demand grows.
Maintaining a Competitive Cost Structure
We are focused on managing our costs by pursuing a standardization of our core operations globally. To achieve this objective, we continue working to standardize our manufacturing processes and the associated upstream and downstream production elements where possible while still allowing the flexibility to respond to local market demands. In addition, we have implemented numerous restructuring initiatives, including the shutdown or sale of facilities, staff rationalization and other activities, all of which have led to significant cost savings that will benefit Novelis for years to come. We plan to focus on maintaining a competitive cost structure, even as we invest in expansions, and we intend to continuously evaluate and implement initiatives to improve operational efficiencies across our plants globally.
Our Operating Segments
Due in part to the regional nature of supply and demand of aluminum rolled products and in order to best serve our customers, we manage our activities on the basis of geographical areas and are organized under four operating segments: North America, Europe, Asia and South America. Each segment manufactures aluminum sheet and light gauge products, and recycles aluminum.
The table below shows "Net sales" and total shipments by segment. For additional financial information related to our operating segments, see Note 21 - Segment, Geographical Area, Major Customer and Major Supplier Information to our accompanying audited consolidated financial statements.
Net sales in millions |
| Year Ended March 31, | ||||||||||
Shipments in kilotonnes |
| 2015 |
| 2014 |
| 2013 | ||||||
Consolidated |
|
|
|
|
|
| ||||||
Net sales |
| $ | 11,147 | |
| $ | 9,767 | |
| $ | 9,812 | |
Total shipments |
| 3,374 | |
| 3,061 | |
| 2,930 | | |||
North America(A) |
|
|
|
|
|
| ||||||
Net sales |
| $ | 3,483 | |
| $ | 3,050 | |
| $ | 3,405 | |
Total shipments |
| 1,030 | |
| 994 | |
| 1,012 | | |||
Europe(A) |
|
|
|
|
|
| ||||||
Net sales |
| $ | 3,783 | |
| $ | 3,280 | |
| $ | 3,181 | |
Total shipments |
| 1,153 | |
| 977 | |
| 919 | | |||
Asia(A) |
|
|
|
|
|
| ||||||
Net sales |
| $ | 2,340 | |
| $ | 1,876 | |
| $ | 1,762 | |
Total shipments |
| 770 | |
| 640 | |
| 562 | | |||
South America(A) |
|
|
|
|
|
| ||||||
Net sales |
| $ | 1,850 | |
| $ | 1,588 | |
| $ | 1,391 | |
Total shipments |
| 583 | |
| 534 | |
| 471 | | |||
(A) | "Net sales" and "Total shipments" by segment include intersegment sales and the results of our affiliates on a proportionately consolidated basis, which is consistent with the way we manage our business segments. |
9
The following is a description of our operating segments as of March 31, 2015 :
North America
Headquartered in Atlanta, Georgia, Novelis North America operates eight aluminum rolled products facilities, including two fully dedicated recycling facilities and one facility with recycling operations; and manufactures a broad range of aluminum sheet and light gauge products. End-use markets for this segment include beverage and food cans, containers and packaging, automotive and other transportation applications, architectural and other industrial applications. The majority of North America's volumes are currently directed toward the beverage can sheet market. The beverage can end-use market is technically demanding to supply. There is currently overcapacity in the beverage can market which has resulted in competitive pricing.
We believe we have a competitive advantage in North America due to our low-cost and technologically advanced manufacturing facilities and technical support capability. Recycling is important in the manufacturing process and we have three facilities in North America that re-melt post-consumer aluminum and recycled process material. Most of the recycled material is from UBCs and the material is cast into sheet ingot at our plants in Greensboro, Georgia; Berea, Kentucky; and Oswego, New York. Additionally, our Logan Aluminum joint venture facility ("Logan facility") in Russellville, Kentucky is a dedicated manufacturer of aluminum sheet products for the can stock market and operates modern and high-speed equipment for ingot casting, hot-rolling, cold-rolling and finishing.
In response to the lightweighting trend in the automotive industry, we have expanded our Oswego, New York facility by constructing two automotive finishing lines and supporting automotive scrap recycling capabilities. A third automotive finishing line is under construction at our Oswego facility.
Europe
Headquartered in Küsnacht, Switzerland, Novelis Europe operates ten aluminum rolled product facilities, including two fully dedicated recycling facilities and two facilities with recycling operations; and manufactures a broad range of sheet and foil products. We also have distribution centers in Italy and sales offices in several European countries. End-use markets for this segment include beverage and food can, automotive, architectural and industrial products, foil and technical products and lithographic sheet. Beverage and food can represent the largest end-use market in terms of shipment volume for Europe. Operations include our 50% joint venture interest in Aluminium Norf GmbH (Alunorf), which is the world's largest aluminum rolling and remelt facility. Alunorf supplies high quality can stock, foilstock and feeder stock for finishing at our other European operations.
We have built a fully integrated recycling facility at our Nachterstedt, Germany plant, which commissioned in fiscal 2015 and is the largest aluminum recycling facility in the world. Additionally, a second automotive finishing line at our Nachterstedt, Germany facility is under construction, which is consistent with our plans to further expand our production of aluminum automotive sheet products in Europe.
Asia
Headquartered in Seoul, South Korea, Novelis Asia operates five facilities, including three facilities with recycling operations; and manufactures a broad range of sheet and light gauge products. End-use markets include beverage and food cans, electronics, architectural, automotive, foil, industrial and other products. The beverage can market represents the largest end-use market in terms of volume. Recycling is an important part of our operations with recycling facilities at both the Ulsan and Yeongju, South Korea plants. Additionally, we have a facility in Binh Duong, Vietnam, which handles the collection and processing of UBCs.
In response to the growing demand in the broader Asia region, we expanded our aluminum rolling operations beginning in fiscal 2014 and our recycling operations in fiscal 2013 in South Korea. The move is designed to rapidly bring to market high-quality aluminum rolling capacity aligned with the projected needs of a growing customer base. The expansion includes the construction of a state-of-the-art recycling center primarily for UBCs and a casting operation. Additionally, during fiscal year 2015 we began the commissioning of an aluminum automotive sheet finishing plant in Changzhou, China.
South America
Headquartered in Sao Paulo, Brazil, Novelis South America operates two aluminum rolled product facilities, including one facility with recycling operations, both of which are located in Brazil. Novelis South America manufactures aluminum rolled products, including can sheet, industrial sheet and light gauge. The main markets are beverage and food can, specialty, industrial, foil and other packaging and transportation end-use applications. Beverage can represents the largest end-use application in terms of shipment volume.
10
In response to the growing demand for our products in South America, we expanded our aluminum rolling operations to increase capacity at our Pindamonhangaba (Pinda) facility in fiscal 2013. Additionally, we installed a new coating line for beverage can end stock and expanded our recycling capacity in our Pinda facility in fiscal 2014.
During fiscal 2015, we closed the Ouro Preto smelter facility and we sold the majority of our hydroelectric generation operations in Brazil.
Financial Information About Geographic Areas
Certain financial information about geographic areas is contained in Note 21- Segment, Geographical Area, Major Customer and Major Supplier Information to our accompanying audited consolidated financial statements.
Raw Materials and Suppliers
The input materials we use in manufacturing include primary aluminum, recycled aluminum, sheet ingot, alloying elements and grain refiners. These raw materials are generally available from several sources and are not generally subject to supply constraints under normal market conditions. We also consume considerable amounts of energy in the operation of our facilities.
Aluminum
We obtain aluminum from a number of sources, including the following:
Primary Aluminum Sourcing. We purchased or tolled approximately 1,726 kt of primary aluminum in fiscal 2015 in the form of sheet ingot, standard ingot and molten metal, approximately 28% of which we purchased from Rio Tinto Alcan.
Aluminum Products Recycling. We operate facilities in several plants to recycle post-consumer aluminum, such as UBCs collected through recycling programs. In addition, we have agreements with several of our large customers where we have a closed-looped system whereby we take recycled processed material from their fabricating activity and re-melt, cast and roll it to re-supply these customers with aluminum sheet. Other sources of recycled material include lithographic plates, and products with longer lifespans, like cars and buildings, which are starting to become high volume sources of recycled material. We purchased or tolled approximately 1,622 kt of recycled material inputs in fiscal 2015 and have made recycling investments in all of our operating regions to increase the amount of recycled material we use as raw materials.
The materials that we recycle are remelted, cast and then used in our operations. The net effect of all recycling activities was that on average approximately 49% of our total aluminum rolled products shipments in fiscal 2015 were made from recycled inputs. Our recycled content performance and methodology are detailed in our annual sustainability report, which can be found at www.novelis.com/sustainability. Information in our sustainability report does not constitute part of this Annual Report on Form 10-K.
Energy
We use several sources of energy in the manufacture and delivery of our aluminum rolled products. In fiscal 2015 , natural gas and electricity represented approximately 97% of our energy consumption by cost. We also use fuel oil and transport fuel. The majority of energy usage occurs at our casting centers and during the hot rolling of aluminum. Our cold rolling facilities require relatively less energy. We purchase our natural gas on the open market, which subjects us to market pricing fluctuations. We have in the past and may continue to seek to stabilize our future exposure to natural gas prices through the purchase of derivative instruments. Natural gas prices in Europe, Asia and South America have historically been more stable than in the United States.
A portion of our electricity requirements are purchased pursuant to long-term contracts in the local regions in which we operate. A number of our facilities are located in regions with regulated prices, which affords relatively stable costs. We have fixed pricing on some of our energy supply arrangements. When the market price of energy is above the fixed price within the contract, we are subject to the credit risk of the counterparty in terms of fulfilling the contract to its term, including those favorable contracts which existed at the date of Hindalco's purchase of Novelis and for which an intangible asset was recorded in purchase accounting.
In South America, we owned and operated hydroelectric facilities that met all of our electricity requirements for our smelter operations in fiscal 2015 . In December 2014, Novelis ceased operations at its remaining smelting facilities in South America. In addition, during the same period we sold our share of the Consorcio Candonga joint venture and the associated power generation operations in South America. We also sold the majority of our remaining power generation operations in South America in February 2015.
11
Our Customers
In fiscal 2015 , approximately 55% of our total "Net sales" were to our ten largest customers, most of whom we have been supplying for more than 20 years. To address consolidation trends, we focus significant efforts on developing and maintaining close working relationships with our customers and end-users. Our major customers include:
Beverage and Food Cans |
| Automotive |
Anheuser-Busch LLC |
| BMW Group |
Affiliates of Ball Corporation |
| Fiat Chrysler Automobiles |
Can-Pack S.A. |
| Daimler Group |
Crown Cork & Seal Company |
| Ford Motor Company |
Rexam Plc |
| General Motors LLC |
Various bottlers of the Coca-Cola System |
| Jaguar Land Rover Limited |
|
| Volkswagen Group |
|
| Honda Motor Company, Ltd. |
Construction, Industrial and Other |
|
|
Amcor Limited |
| Electronics |
Lotte Aluminum Co. Ltd. |
| LG International Corporation |
Pactiv Corporation |
| Samsung Electronics Co., Ltd |
Ryerson Inc. |
|
|
Our single largest end-use market is beverage can sheet. We sell can sheet directly to beverage makers and bottlers as well as to can fabricators that sell the cans they produce to bottlers. In certain cases, we operate under umbrella agreements with beverage makers and bottlers under which they direct their can fabricators to source their requirements for beverage can body, end and tab stock from us.
The table below shows our "Net sales" to Rexam Plc (Rexam), Anheuser-Busch LLC (Anheuser-Busch), and Affiliates of Ball Corporation, our three largest customers, as a percentage of total "Net sales."
|
| Year Ended March 31, | |||||||
|
| 2015 |
| 2014 |
| 2013 | |||
Rexam Plc (A) |
| 18 | % |
| 17 | % |
| 15 | % |
Affiliates of Ball Corporation (A) |
| 10 | % |
| 10 | % |
| 10 | % |
Anheuser-Busch LLC |
| 7 | % |
| 8 | % |
| 11 | % |
(A) | In February of 2015, Ball Corporation made an offer to acquire Rexam Plc. This acquisition will be subject to regulatory and shareholder approval. |
Distribution and Backlog
|
| Year Ended March 31, | |||||||
|
| 2015 |
| 2014 |
| 2013 | |||
Direct sales as a percentage of total "Net sales" |
| 92 | % |
| 94 | % |
| 93 | % |
Distributor sales as a percentage of total "Net sales" |
| 8 | % |
| 6 | % |
| 7 | % |
12
Direct Sales
We supply various end-use markets all over the world through a direct sales force operating from individual plants or sales offices, as well as from regional sales offices in 13 countries. The direct sales channel typically serves very large, sophisticated fabricators and original equipment manufacturers. Longstanding relationships are maintained with leading companies in industries using aluminum rolled products. Supply contracts for large global customers generally range from one to five years in length and historically there has been a high degree of renewal business with these customers. Given the customized nature of products and in some cases, large order sizes, switching costs are significant, thus adding to the overall consistency of the customer base.
We also use third party agents or traders in some regions to complement our own sales force. These agents provide service to our customers in countries where we do not have local expertise. We tend to use third party agents in Asia more frequently than in other regions.
Distributors
We also sell our products through aluminum distributors, particularly in North America and Europe. Customers of distributors are widely dispersed, and sales through this channel are highly fragmented. Distributors sell mostly commodity or less specialized products into many end-use markets in small quantities, including the construction and industrial markets. We collaborate with our distributors to develop new end-use markets and improve the supply chain and order efficiencies.
Backlog
We believe order backlog is not a material aspect of our business.
Research and Development
The table below summarizes our "Research and development expenses" in our plants and modern research facilities, which include mini-scale production lines equipped with hot mills, can lines and continuous casters (in millions).
|
| Year Ended March 31, | ||||||||||
|
| 2015 |
| 2014 |
| 2013 | ||||||
Research and development expenses |
| $ | 50 | |
| $ | 45 | |
| $ | 46 | |
We conduct research and development activities at our plants in order to satisfy current and future customer requirements, improve our products and reduce our conversion costs. Our customers work closely with our research and development professionals to improve their production processes and market options. We have approximately 310 employees dedicated to research and development, located in many of our plants and research centers. We have a global research and technology center in Kennesaw, Georgia, which offers state of the art research and development capabilities to help Novelis meet the global long-term demand for aluminum used for the automotive, beverage can and specialty markets. To reach the Company's sustainability commitments, a key focus is to increase the amount of recycled metal content across all product lines while meeting performance requirements.
Our Employees
The table below summarizes our approximate number of employees by region.
Employees |
| North America |
| Europe |
| Asia |
| South America |
| Total | |||||
March 31, 2015 |
| 3,210 | |
| 4,890 | |
| 1,970 | |
| 1,490 | |
| 11,560 | |
March 31, 2014 |
| 3,150 | |
| 4,550 | |
| 1,890 | |
| 1,820 | |
| 11,410 | |
We consider our employee relations to be satisfactory. Approximately 49% of our employees are represented by labor unions and their employment conditions are governed by collective bargaining agreements. Collective bargaining agreements are negotiated on a site, regional or national level, and are of varying durations. As of March 31, 2015 , approximately 1,829 of our employees were covered under collective bargaining agreements that expire within one year.
13
Intellectual Property
We actively review intellectual property arising from our operations and our research and development activities and, when appropriate, we apply for patents in appropriate jurisdictions, including the United States and Canada. We currently hold patents and patent applications on approximately 180 different items of intellectual property. While these patents and patent applications are important to our business on an aggregate basis, no single patent or patent application is deemed to be material to our business.
We have applied for, or received registrations for, the "Novelis" word trademark and the Novelis logo trademark in approximately 50 countries where we have significant sales or operations. Novelis uses the Aditya Birla logo under license from Aditya Birla Management Corporation Private Limited.
We have also registered the word "Novelis" and several derivations thereof as domain names in numerous top level domains around the world to protect our presence on the world wide web.
Environment, Health and Safety
We own and operate numerous manufacturing and other facilities in various countries around the world. Our operations are subject to environmental laws and regulations from various jurisdictions, which govern, among other things, air emissions, wastewater discharges, the handling, storage and disposal of hazardous substances and wastes, the remediation of contaminated sites, post-mining reclamation and restoration of natural resources, and employee health and safety. Future environmental regulations may impose stricter compliance requirements on the industries in which we operate. Additional equipment or process changes at some of our facilities may be needed to meet future requirements. The cost of meeting these requirements may be significant. Failure to comply with such laws and regulations could subject us to administrative, civil or criminal penalties, obligations to pay damages or other costs, and injunctions and other orders, including orders to cease operations.
We are involved in proceedings under the U.S. Comprehensive Environmental Response, Compensation, and Liability Act, also known as CERCLA or Superfund, or analogous state provisions regarding our liability arising from the usage, storage, treatment or disposal of hazardous substances and wastes at a number of sites in the United States, as well as similar proceedings under the laws and regulations of the other jurisdictions in which we have operations, including Brazil and certain countries in the European Union. Many of these jurisdictions have laws that impose joint and several liability, without regard to fault or the legality of the original conduct, for the costs of environmental remediation, natural resource damages, third party claims, and other expenses. In addition, we are, from time to time, subject to environmental reviews and investigations by relevant governmental authorities.
We have established procedures for regularly evaluating environmental loss contingencies, including those arising from environmental reviews and investigations and any other environmental remediation or compliance matters. We believe we have a reasonable basis for evaluating these environmental loss contingencies, and we also believe we have made reasonable estimates for the costs that are reasonably possible for these environmental loss contingencies. Accordingly, we have established liabilities based on our estimates for the currently anticipated costs associated with these environmental matters. Management has determined the currently anticipated costs associated with these environmental matters will not, individually or in the aggregate, materially impair our operations or materially adversely affect our financial condition.
Available Information
We are subject to the reporting and information requirements of the Securities Exchange Act of 1934, as amended (Exchange Act) and, as a result, we file periodic reports and other information with the Securities and Exchange Commission (SEC). We make these filings available on our website free of charge, the URL of which is http://www.novelis.com, as soon as reasonably practicable after we electronically file such material with, or furnish it to, the SEC. The SEC maintains a website (http://www.sec.gov) that contains our annual, quarterly and current reports and other information we file electronically with the SEC. You can read and copy any materials we file with the SEC at the SEC's Public Reference Room at 100 F Street, N.E., Washington, D.C. 20549. You may obtain information on the operation of the Public Reference Room by calling the SEC at 1-800-SEC-0330. Information on our website does not constitute part of this Annual Report on Form 10-K.
14
Item 1A. Risk Factors
In addition to the factors discussed elsewhere in this report, you should consider the following factors, which could materially affect our business, financial condition or results of operations in the future. The following factors, among others, could cause our actual results to differ from those projected in any forward looking statements we make.
Certain of our customers are significant to our revenues, and we could be adversely affected by changes in the business or financial condition of these significant customers or by the loss of their business.
Our ten largest customers accounted for approximately 55% , 54% and 51% of our total "Net sales" for the year ended March 31, 2015 , 2014 and 2013 , respectively, with Rexam Plc, a leading global beverage can maker, and its affiliates representing approximately 18% , 17% and 15% of our total "Net sales" in the respective periods. A significant downturn in the business or financial condition of our significant customers could materially adversely affect our results of operations and cash flows. In addition, some of our customer contracts are subject to renewal, renegotiation or re-pricing at periodic intervals or upon changes in competitive supply conditions. Our failure to successfully renew, renegotiate or re-price such agreements could result in a reduction or loss in customer purchase volume or revenue, and if we are not successful in replacing business lost from such customers, our results of operations and cash flows could be adversely affected. Additionally, in the event of consolidation among our customers, our customers may be able to use increased leverage in negotiating prices and other contract terms. Consolidation in our customer base may also lead to reduced demand for our products or cancellations of sales orders, which could adversely affect our results of operations and cash flows.
We face significant price and other forms of competition from other aluminum rolled products producers, which could hurt our results of operations and cash flows.
Generally, the markets in which we operate are highly competitive. We compete primarily on the basis of our value proposition, including price, product quality, ability to meet customers' specifications, range of products offered, lead times, technical support and customer service. Some of our competitors may benefit from greater capital resources, more efficient technologies, lower raw material and energy costs and may be able to sustain longer periods of price competition. In particular, we face increased competition from producers in China, which have significantly lower production costs and pricing. This lower pricing could erode the market prices of our products in the Chinese market and elsewhere.
In addition, our competitive position within the global aluminum rolled products industry may be affected by, among other things, consolidation among our competitors, exchange rate fluctuations that may make our products less competitive in relation to the products of companies based in other countries (despite the U.S. dollar-based input cost and the marginal costs of shipping) and economies of scale in purchasing, production and sales, which accrue to the benefit of some of our competitors. For example, the price gap for aluminum between the Shanghai Futures Exchange ("SHFE") and the LME may make our products manufactured in Asia based off LME prices less competitive compared to products manufactured by competitors in China based off SHFE prices.
Increased competition could cause a reduction in our shipment volumes and profitability or increase our expenditures, either of which could have a material adverse effect on our financial results and cash flows.
The end-use markets for certain of our products are highly competitive and customers are willing to accept substitutes for our products.
The end-use markets for certain aluminum rolled products are highly competitive. Aluminum competes with other materials, such as steel, plastics, composite materials and glass, among others, for various applications, including in beverage and food cans, electronics and automotive end-use markets. In the past, customers have demonstrated a willingness to substitute other materials for aluminum. For example, changes in consumer preferences in beverage containers have increased the use of PET plastic containers and glass bottles in recent years. These trends may continue. The willingness of customers to accept substitutes for aluminum products could have a material adverse effect on our financial results and cash flows.
Economic conditions could negatively affect our financial condition and results of operations.
Our financial condition and results of operations depend significantly on worldwide economic conditions. Uncertainty about current or future global economic conditions poses a risk as our customers may postpone purchases in response to tighter credit and negative financial news, which could adversely impact demand for our products. In addition, there can be no assurance that actions we may take in response to economic conditions will be sufficient to counter any continuation or any downturn or disruption. A significant global economic downturn or disruption in the financial markets could have a material adverse effect on our financial condition and results of operations.
15
If we are unable to obtain sufficient quantities of primary aluminum, recycled aluminum, sheet ingot and other raw materials used in the production of our products, our ability to produce and deliver products or to manufacture products using the desired mix of metal inputs could be adversely affected.
The supply risks relating to our metal inputs vary by input type. Our sheet ingot requirements have historically been supplied, in part, by Rio Tinto Alcan pursuant to agreements with us. For the year ended March 31, 2015 , we purchased a majority of our third party sheet ingot requirements from Rio Tinto Alcan's primary metal group. If Rio Tinto Alcan or any other significant supplier of sheet ingot is unable to deliver sufficient quantities of this material on a timely basis, our production may be disrupted and our net sales, profitability and cash flows could be materially adversely affected. Although aluminum is traded on the world markets, developing alternative suppliers of sheet ingot could be time consuming and expensive.
Certain of our manufacturing operations rely on UBCs and other types of aluminum scrap for a portion of our base metal inputs. Competition for UBCs and other types of aluminum scrap is significant, and while we believe we will be able to obtain sufficient quantities to meet our production needs, if we are unable to do so, we could be required to purchase more expensive metal inputs which could have an adverse effect on our profitability and cash flows.
Remelt ingot, which is traded on the LME, may become subject to supply risk created by supply and demand anomalies associated with speculative financing transactions. In a period of rapidly rising demand, restrictions on access to metal that is stored in LME warehouses or restrained in financing transactions could create shortages in the spot market which could interfere with supplies to our facilities and limit production.
Our operations consume energy and our profitability and cash flows may decline if energy costs were to rise, or if our energy supplies were interrupted.
We consume substantial amounts of energy in our rolling and casting operations. The factors affecting our energy costs and supply reliability tend to be specific to each of our facilities. A number of factors could materially affect our energy position adversely including:
• | increases in costs of natural gas; |
• | increases in costs of supplied electricity or fuel oil related to transportation; |
• | interruptions in energy supply due to equipment failure or other causes; |
• | the inability to extend energy supply contracts upon expiration on economical terms; and |
• | the inability to pass through energy costs in certain sales contracts. |
In addition, global climate change may increase our costs for energy sources, supplies or raw materials. See We may be affected by global climate change or by legal, regulatory or market responses to such change . If energy costs were to rise, or if energy supplies or supply arrangements were disrupted, our profitability and cash flows could decline.
Our results and short term liquidity can be negatively impacted by timing differences between the prices we pay under purchase contracts and metal prices we charge our customers.
Our purchase and sales contracts for primary aluminum are based on the LME price plus a regional market premium, which is a surcharge in addition to the LME price. There are typically timing differences between the pricing periods for purchases and sales where purchase prices we pay tend to be fixed and paid earlier than sales prices we charge our customers. This creates a price exposure we call "metal price lag." We use derivative instruments to manage the timing differences related to LME associated with metal price lag. However, because there is no established market for derivative instruments associated with regional premiums, our ability to manage metal price lag associated with these premiums is limited. The timing difference associated with metal price lag could positively or negatively impact our operating results and short term liquidity position.
16
A deterioration of our financial condition or a downgrade of our ratings by a credit rating agency could limit our ability or increase or costs to enter into into hedging and financing transactions, and our business relationships and financial condition could be adversely affected.
A deterioration of our financial condition or a downgrade of our credit ratings for any reason could increase our borrowing costs and have an adverse effect on our business relationships with customers, suppliers and hedging counterparties. We enter into various forms of hedging activities against currency, interest rate, energy or metal price fluctuations. We also factor and forfeit trade receivables from time to time to manage working capital. Financial strength and credit ratings are important to the availability and terms of these hedging and financing activities. As a result, any deterioration of our financial condition or downgrade of our credit ratings may make it more difficult or costly for us to engage in these activities in the future.
Adverse changes in currency exchange rates could negatively affect our financial results or cash flows and the competitiveness of our aluminum rolled products relative to other materials.
Our businesses and operations are exposed to the effects of changes in the exchange rates of the U.S. dollar, the Euro, the British pound, the Brazilian real, the Canadian dollar, the Korean won, the Swiss franc and other currencies. We have implemented a hedging policy that attempts to manage currency exchange rate risks to an acceptable level based on management's judgment of the appropriate trade-off between risk, opportunity and cost; however, this hedging policy may not successfully or completely eliminate the effects of currency exchange rate fluctuations which could have a material adverse effect on our financial results and cash flows.
We prepare our consolidated financial statements in U.S. dollars, but a portion of our earnings and expenditures are denominated in other currencies, primarily the Euro, the Korean won and the Brazilian real. Changes in exchange rates will result in increases or decreases in our operating results and may also affect the book value of our assets located outside the U.S.
Most of our facilities are staffed by a unionized workforce, and union disputes and other employee relations issues could materially adversely affect our financial results.
Approximately 49% of our employees are represented by labor unions under a large number of collective bargaining agreements with varying durations and expiration dates. We may not be able to satisfactorily renegotiate our collective bargaining agreements when they expire. In addition, existing collective bargaining agreements may not prevent a strike or work stoppage at our facilities in the future.
Loss of our key management and other personnel, or an inability to attract and retain such management and other personnel, could adversely impact our business.
We employ all of our senior executive officers and other highly-skilled key employees on an at-will basis, and their employment can be terminated by us or them at any time, for any reason and without notice, subject, in certain cases, to severance payment obligations. Competition for qualified employees among companies that rely heavily on engineering and technology is intense, and if our highly skilled key employees leave us, we may be unable to promptly attract and retain qualified replacement personnel, which could result in our inability to improve manufacturing operations, conduct research activities successfully, develop marketable products, execute expansion projects, and compete effectively for our share of the growth in key markets.
We could be adversely affected by disruptions of our operations.
Breakdown of equipment or other events, including catastrophic events such as war or natural disasters, leading to production interruptions at our plants could have a material adverse effect on our financial results and cash flows. Further, because many of our customers are, to varying degrees, dependent on planned deliveries from our plants, those customers that have to reschedule their own production due to our missed deliveries could pursue claims against us and reduce their future business with us. We may incur costs to correct any of these problems, in addition to facing claims from customers. Further, our reputation among actual and potential customers may be harmed, resulting in a loss of business. While we maintain insurance policies covering, among other things, physical damage, business interruptions and product liability, these policies would not cover all of our losses.
17
Our operations have been and will continue to be exposed to various business and other risks, changes in conditions and events beyond our control in countries where we have operations or sell products.
We are, and will continue to be, subject to financial, political, economic and business risks in connection with our global operations. We have made investments and carry on production activities in various emerging markets, including China, Brazil, Korea and Malaysia, and we market our products in these countries, as well as certain other countries in Asia, the Middle East and emerging markets in South America. While we anticipate higher growth or attractive production opportunities from these emerging markets, they also present a higher degree of risk than more developed markets. In addition to the business risks inherent in developing and servicing new markets, economic conditions may be more volatile, legal and regulatory systems less developed and predictable, and the possibility of various types of adverse governmental action more pronounced. In addition, inflation, fluctuations in currency and interest rates, competitive factors, civil unrest and labor problems could affect our revenues, expenses and results of operations. Our operations could also be adversely affected by acts of war, terrorism or the threat of any of these events as well as government actions such as controls on imports, exports and prices, tariffs, new forms of taxation, or changes in fiscal regimes and increased government regulation in the countries in which we operate or service customers. Unexpected or uncontrollable events or circumstances in any of these markets could have a material adverse effect on our financial results and cash flows.
We face risks relating to certain joint ventures and subsidiaries that we do not entirely control.
Some of our activities are, and will in the future be, conducted through entities that we do not entirely control or wholly-own. These entities include our Alunorf, Germany; and Logan, Kentucky joint ventures, as well as our majority-owned Malaysian subsidiary. Our Malaysian subsidiary is a public company whose shares are listed for trading on the Bursa Malaysia. Under the governing documents, agreements or securities laws applicable to or stock exchange listing rules relative to certain of these joint ventures and subsidiaries, our ability to fully control certain operational matters may be limited. Further, in some cases we do not have rights to prevent a joint venture partner from selling its joint venture interests to a third party.
Our results of operations, cash flows and liquidity could be adversely affected if we were unable to purchase derivative instruments or if counterparties to our derivative instruments fail to honor their agreements.
We use various derivative instruments to manage the risks arising from fluctuations in aluminum prices, exchange rates, energy prices and interest rates. If for any reason we were unable to purchase derivative instruments to manage these risks, our results of operations, cash flows and liquidity could be adversely affected. In addition, we may be exposed to losses in the future if the counterparties to our derivative instruments fail to honor their agreements. In particular, deterioration in the financial condition of our counterparties and any resulting failure to pay amounts owed to us or to perform obligations or services owed to us could have a negative effect on our business and financial condition. Further, if major financial institutions consolidate and are forced to operate under more restrictive capital constraints and regulations, there could be less liquidity in the derivative markets, which could have a negative effect on our ability to hedge and transact with creditworthy counterparties.
Derivatives legislation could have an adverse impact on our ability to hedge risks associated with our business and on the cost of our hedging activities.
We use over-the-counter (OTC) derivative products to hedge our metal commodity risks and our interest rate and currency risks. The Commodity Futures Trading Commission and the SEC recently have finalized certain rules and regulations to increase regulatory oversight of the OTC markets and the entities that participate in those markets. Other regulations implementing the Dodd-Frank Wall Street Reform and Consumer Protection Act (Dodd-Frank Act) remain to be finalized or implemented and it is not possible to predict when this will be accomplished or what impact these regulations will have on our ability to hedge our business risks, or the costs of doing so.
In addition, the European Market Infrastructure Regulation (EMIR), which became effective in 2012, includes regulations related to the trading, reporting and clearing of derivatives. We have entities and counterparties located in jurisdictions subject to EMIR. Our efforts to comply with EMIR, and EMIR's effect on the derivatives markets and their participants, creates similar risks and could have similar adverse impacts as those under the Dodd-Frank Act.
If future regulations subject us to additional capital or margin requirements or other restrictions on our trading and commodity positions, they could have an adverse effect on our ability to hedge risks associated with our business and on the cost of our hedging activities. It is also possible that additional similar regulations may be imposed in other jurisdictions where we conduct business and any such regulations could pose risks and have adverse effects on our operations and profitability.
18
We may not be able to successfully develop and implement new technology initiatives.
We have invested in, and are involved with, a number of technology and process initiatives. Several technical aspects of these initiatives are still unproven, and the eventual commercial outcomes cannot be assessed with any certainty. Even if we are successful with these initiatives, we may not be able to deploy them in a timely fashion. Accordingly, the costs and benefits from our investments in new technologies and the consequent effects on our financial results may vary from present expectations.
Issues arising during the implementation of our enterprise resource planning system could affect our operating results and ability to manage our business effectively.
During fiscal year 2013, we implemented a new enterprise resource planning (ERP) system in two of our North America plants and in our corporate headquarters, which resulted in temporary business interruptions that adversely impacted our North America operating results. During fiscal year 2015, we successfully implemented the ERP system in our European headquarters and our new recycling plant in Germany, and we also implemented new releases at certain of our North America locations. As we implement additional releases of the ERP systems in other locations, we may experience temporary business interruptions that could adversely impact our operating results and our ability to report accurate quarterly results in a timely manner and comply with existing covenants in all our debt agreements. There is no assurance the new ERP system will operate as designed, which could result in an adverse impact on our operating results, cash flows and financial condition.
Security breaches and other disruptions to our information technology networks and systems could interfere with our operations, and could compromise the confidentiality of our proprietary information.
We rely upon information technology networks and systems, some of which are managed by third parties, to process, transmit and store electronic information, and to manage or support a variety of business and manufacturing processes and activities. Additionally, we collect and store sensitive data, including intellectual property, proprietary business information, as well as personally identifiable information of our employees, in data centers and on information technology networks. The secure operation of these information technology networks, and the processing and maintenance of this information is important to our business operations and strategy. Despite security measures and business continuity plans, our information technology networks and systems may be vulnerable to damage, disruptions or shutdowns due to attacks by hackers or breaches due to errors or malfeasance by employees, contractors and others who have access to our networks and systems, or other disruptions during the process of upgrading or replacing computer software or hardware, power outages, computer viruses, telecommunication or utility failures or natural disasters or other catastrophic events. The occurrence of any of these events could compromise our networks and the information stored there could be accessed, publicly disclosed, lost or stolen. Any such access, disclosure or other loss of information could result in legal claims or proceedings, liability or regulatory penalties under laws protecting the privacy of personal information, disrupt operations and reduce the competitive advantage we hope to derive from our investment in new or proprietary business initiatives.
Future acquisitions, divestitures or restructuring actions may adversely affect our financial results.
As part of our strategy for growth, we may pursue acquisitions, divestitures or strategic alliances, which may not be completed or, if completed, may not be ultimately beneficial to us. There are numerous risks commonly encountered in strategic transactions, including the risk that we may not be able to complete a transaction that has been announced, effectively integrate businesses acquired or generate the cost savings and synergies anticipated. Failure to do so could have a material adverse effect on our financial results.
In addition, we may undertake additional restructuring efforts in the future which could in some instances result in significant severance-related costs, environmental remediation expenses and impairment and other restructuring charges. Any additional restructuring efforts could result in significant severance-related costs, environmental remediation expenses, impairment charges, restructuring charges and related costs and expenses, which could adversely affect our profitability and cash flows.
19
Capital investments in organic growth initiatives may not produce the returns we anticipate.
A significant element of our strategy is to invest in opportunities to increase the production capacity of our operating facilities through modifications of and investments in existing facilities and equipment and to evaluate other investments in organic growth in our target markets. In particular, over the past several years we have invested substantial resources into projects intended to raise the recycled content of our products, increase our global automotive finishing capacity and grow our portfolio of premium products. These projects involve numerous risks and uncertainties, including the risk that our forecasted demand levels prove to be inaccurate and the risk that aluminum price trends diminish the benefits we anticipate from our recycling investments. If our capital investments do not produce the benefits we anticipate, our financial condition and results of operations could be adversely affected.
Our goodwill, other intangible assets and other long-lived assets could become impaired, which could require us to take non-cash charges against earnings.
We assess, at least annually and potentially more frequently, whether the value of our goodwill has been impaired. We assess the recoverability of finite-lived other intangible assets and other long-lived assets whenever events or changes in circumstances indicate we may not be able to recover the asset's carrying amount. Any impairment of goodwill, other intangible assets, or long-lived assets as a result of such analysis would result in a non-cash charge against earnings, which charge could materially adversely affect our reported results of operations.
A significant and sustained decline in our future cash flows, a significant adverse change in the economic environment or slower growth rates could result in the need to perform additional impairment analysis in future periods. If we were to conclude a write-down of goodwill or other intangible assets is necessary, then we would record such additional charges, which could materially adversely affect our results of operations.
We could be required to make unexpected contributions to our defined benefit pension plans as a result of adverse changes in interest rates and the capital markets.
Most of our pension obligations relate to funded defined benefit pension plans for our employees in the U.S., the U.K. and Canada, unfunded pension benefits in Germany and lump sum indemnities payable to our employees in France, Italy, Korea and Malaysia upon retirement or termination. Our pension plan assets consist primarily of funds invested in listed stocks and bonds. Our estimates of liabilities and expenses for pensions and other postretirement benefits incorporate a number of assumptions, including expected long-term rates of return on plan assets and interest rates used to discount future benefits. Our results of operations, liquidity or shareholder's (deficit) equity in a particular period could be adversely affected by capital market returns that are less than their assumed long-term rate of return or a decline of the rate used to discount future benefits.
If the assets of our pension plans do not achieve assumed investment returns for any period, such deficiency could result in one or more charges against our earnings. In addition, changing economic conditions, poor pension investment returns or other factors may require us to make unexpected cash contributions to the pension plans in the future, preventing the use of such cash for other purposes.
We are subject to a broad range of environmental, health and safety laws and regulations, and we may be exposed to substantial environmental, health and safety costs and liabilities.
We are subject to a broad range of environmental, health and safety laws and regulations in the jurisdictions in which we operate. These laws and regulations impose stringent environmental, health and safety protection standards and permitting requirements regarding, among other things, air emissions, wastewater storage, treatment and discharges, the use and handling of hazardous or toxic materials, waste disposal practices, the remediation of environmental contamination, post-mining reclamation and working conditions for our employees. Some environmental laws, such as Superfund and comparable laws in U.S. states and other jurisdictions worldwide, impose joint and several liability for the cost of environmental remediation, natural resource damages, third party claims, and other expenses, without regard to the fault or the legality of the original conduct.
The costs of complying with these laws and regulations, including participation in assessments and remediation of contaminated sites and installation of pollution control facilities, have been, and in the future could be, significant. In addition, these laws and regulations may also result in substantial environmental liabilities associated with divested assets, third party locations and past activities. In certain instances, these costs and liabilities, as well as related action to be taken by us, could be accelerated or increased if we were to close, divest of or change the principal use of certain facilities with respect to which we may have environmental liabilities or remediation obligations. Currently, we are involved in a number of compliance efforts, remediation activities and legal proceedings concerning environmental matters, including certain activities and proceedings arising under Superfund and comparable laws in U.S. states and other jurisdictions worldwide in which we have operations.
20
We have established liabilities for environmental remediation activities where appropriate. However, the cost of addressing environmental matters (including the timing of any charges related thereto) cannot be predicted with certainty, and these liabilities may not ultimately be adequate, especially in light of changing interpretations of laws and regulations by regulators and courts, the discovery of previously unknown environmental conditions, the risk of governmental orders to carry out additional compliance on certain sites not initially included in remediation in progress, our potential liability to remediate sites for which provisions have not been previously established and the adoption of more stringent environmental laws including, for example, the possibility of increased regulation of the use of bisphenol-A, a chemical component commonly used in the coating of aluminum cans. Such future developments could result in increased environmental costs and liabilities, which could have a material adverse effect on our financial condition, results or cash flows. Furthermore, the failure to comply with our obligations under the environmental laws and regulations could subject us to administrative, civil or criminal penalties, obligations to pay damages or other costs, and injunctions or other orders, including orders to cease operations. In addition, the presence of environmental contamination at our properties could adversely affect our ability to sell property, receive full value for a property or use a property as collateral for a loan.
Some of our current and potential operations are located or could be located in or near communities that may regard such operations as having a detrimental effect on their social and economic circumstances. Community objections could have a material adverse impact upon the profitability or, in extreme cases, the viability of an operation.
We use a variety of hazardous materials and chemicals in our rolling processes and in connection with maintenance work on our manufacturing facilities. Because of the nature of these substances or related residues, we may be liable for certain costs, including, among others, costs for health-related claims or removal or re-treatment of such substances. Certain of our current and former facilities incorporate asbestos-containing materials, a hazardous substance that has been the subject of health-related claims for occupational exposure. In addition, although we have developed environmental, health and safety programs for our employees, including measures to reduce employee exposure to hazardous substances, and conduct regular assessments at our facilities, we are currently, and in the future may be, involved in claims and litigation filed on behalf of persons alleging injury predominantly as a result of occupational exposure to substances or other hazards at our current or former facilities. It is not possible to predict the ultimate outcome of these claims and lawsuits due to the unpredictable nature of personal injury litigation. If these claims and lawsuits, individually or in the aggregate, were finally resolved against us, our results of operations and cash flows could be adversely affected.
We may be exposed to significant legal proceedings or investigations.
From time to time, we are involved in, or the subject of, disputes, proceedings and investigations with respect to a variety of matters, including environmental, health and safety, product liability, employee, tax, personal injury, contractual and other matters as well as other disputes and proceedings that arise in the ordinary course of business. Certain of these matters are discussed in the preceding risk factor. Any claims against us or any investigations involving us, whether meritorious or not, could be costly to defend or comply with and could divert management's attention as well as operational resources. Any such dispute, litigation or investigation, whether currently pending or threatened or in the future, may have a material adverse effect on our financial results and cash flows.
In addition, we are sometimes exposed to warranty and product liability claims. There can be no assurance that we will not experience material product liability losses arising from individual suits or class actions alleging product liability defects or related claims in the future and that these will not have a negative impact on us. We generally maintain insurance against many product liability risks, but there can be no assurance that this coverage will be adequate for any liabilities ultimately incurred. In addition, there is no assurance that insurance will continue to be available on terms acceptable to us. A successful claim that exceeds our available insurance coverage could have a material adverse effect on our financial results and cash flows.
We may be affected by global climate change or by legal, regulatory, or market responses to such change.
Increased concern over climate change has led to new and proposed legislative and regulatory initiatives, such as cap-and-trade systems and additional limits on emissions of greenhouse gases. New laws enacted could directly and indirectly affect our customers and suppliers (through an increase in the cost of production or their ability to produce satisfactory products) or our business (through an impact on our inventory availability, cost of sales, operations or demand for the products we sell), which could result in an adverse effect on our financial condition, results of operations and cash flows. Compliance with any new or more stringent laws or regulations, or stricter interpretations of existing laws, could require additional expenditures by us, our customers or our suppliers. Also, we rely on natural gas, electricity, fuel oil and transport fuel to operate our facilities. Any increased costs of these energy sources because of new laws could be passed along to us and our customers and suppliers, which could also have a negative impact on our profitability.
21
Income tax payments may ultimately differ from amounts currently recorded by the Company. Future tax law changes may materially increase the Company's prospective income tax expense.
We are subject to income taxation in many jurisdictions. Judgment is required in determining our worldwide income tax provision and accordingly there are many transactions and computations for which our final income tax determination is uncertain. We are routinely audited by income tax authorities in many tax jurisdictions. Although we believe the recorded tax estimates are reasonable, the ultimate outcome from any audit (or related litigation) could be materially different from amounts reflected in our income tax provisions and accruals. Future settlements of income tax audits may have a material effect on earnings between the period of initial recognition of tax estimates in the financial statements and the point of ultimate tax audit settlement. Additionally, it is possible that future income tax legislation in any jurisdiction to which we are subject may be enacted that could have a material impact on our worldwide income tax provision beginning with the period that such legislation becomes effective.
Hindalco and its interests as equity holder may conflict with the interests of the holders of our senior notes in the future.
Novelis is an indirectly wholly-owned subsidiary of Hindalco. As a result, Hindalco may exercise control over our decisions to enter into any corporate transaction or capital restructuring and has the ability to approve or prevent any transaction that requires the approval of our shareholder. Hindalco may have an interest in pursuing acquisitions, divestitures, financings or other transactions that, in its judgment, could enhance its equity investment, even though such transactions might involve risks to holders of our Senior Notes.
Additionally, Hindalco operates in the aluminum industry and may from time to time acquire and hold interests in businesses that compete, directly or indirectly, with us. Hindalco has no obligation to provide us with financing and is able to sell their equity ownership in us at any time.
Our substantial indebtedness could adversely affect our business.
We have a relatively high degree of leverage. As of March 31, 2015 , we had $5.3 billion of indebtedness outstanding. Our substantial indebtedness and interest expense could have important consequences to our company and holders of notes, including:
• | limiting our ability to borrow additional amounts for working capital, capital expenditures or other general corporate purposes; |
• | increasing our vulnerability to general adverse economic and industry conditions, including volatility in LME aluminum prices; |
• | limiting our ability to capitalize on business opportunities and to react to competitive pressures and adverse changes in government regulation; and |
• | limiting our ability or increasing the costs to refinance indebtedness. |
The covenants in our senior secured credit facilities and the indentures governing our Senior Notes impose operating and financial restrictions on us.
Our senior secured credit facilities and the indentures governing our senior notes impose certain operating and financial restrictions on us. These restrictions limit our ability and the ability of our restricted subsidiaries, among other things, to:
• | incur additional debt and provide additional guarantees; |
• | pay dividends and make other restricted payments, including certain investments; |
• | create or permit certain liens; |
• | make certain asset sales; |
• | use the proceeds from the sales of assets and subsidiary stock; |
• | create or permit restrictions on the ability of our restricted subsidiaries to pay dividends or make other distributions to us; |
• | engage in certain transactions with affiliates; |
• | enter into sale and leaseback transactions; and |
• | consolidate, merge or transfer all or substantially all of our assets or the assets of our restricted subsidiaries. |
See Note 11 - Debt for additional discussion.
22
Item 1B. Unresolved Staff Comments
None.
Item 2. Properties
Our global headquarters are located in Atlanta, Georgia. Our global research and technology center is located in Kennesaw, Georgia, which contains state-of-the-art research and development capabilities to help us better partner and innovate with our customers. Our regional headquarters are located in the following cities: North America - Atlanta, Georgia; Europe - Kusnacht, Switzerland; Asia - Seoul, South Korea; and South America - Sao Paulo, Brazil. We also have a research facility in Spokane, Washington specializing in molten metal processing.
The total number of operating facilities within our operating segments as of March 31, 2015 is shown in the table below, including operating facilities we jointly own and operate with third parties.
|
| Total Operating Facilities |
| Facilities with recycling operations | ||
North America |
| 8 | |
| 3 | |
Europe |
| 10 | |
| 4 | |
Asia |
| 5 | |
| 3 | |
South America |
| 2 | |
| 1 | |
Total |
| 25 | |
| 11 | |
The following tables provide information, by operating segment, about the plant locations, processes and major end-use markets/applications for the aluminum rolled products, recycling and primary metal facilities we operated during all or part of the year ended March 31, 2015 .
North America
Location |
| Plant Processes |
| Major End-Use Markets |
Berea, Kentucky |
| Recycling |
| Recycled ingot |
Burnaby, British Columbia (A) |
| Finishing |
| Foil containers |
Fairmont, West Virginia |
| Cold rolling, finishing |
| Foil, HVAC material |
Greensboro, Georgia |
| Recycling |
| Recycled ingot |
Kingston, Ontario |
| Cold rolling, finishing |
| Automotive, construction/industrial |
Russellville, Kentucky (B) |
| Hot rolling, cold rolling, finishing |
| Can stock |
Oswego, New York (C) |
| Sheet ingot casting, hot rolling, cold rolling, recycling, brazing, finishing |
| Can stock, automotive, construction/industrial, semi-finished coil |
Terre Haute, Indiana |
| Cold rolling, finishing |
| Foil |
Toronto, Ontario (A) |
| Finishing |
| Foil, foil containers |
Warren, Ohio |
| Coating |
| Can end stock |
(A) | We sold these foil facilities to Reynolds Consumer Products Inc. in June 2014. |
(B) | We own 40% of the outstanding common shares of Logan, but we have made equipment investments such that our portion of Logan's total machine hours has provided us approximately 55% of Logan's total production. |
(C) | In fiscal 2015, we began production at two new automotive sheet finishing lines and have also expanded our recycling operations in our Oswego, New York facility. |
Our Oswego, New York facility operates modern equipment used for recycling beverage cans and other aluminum scrap, ingot casting, hot rolling, cold rolling and finishing. The Oswego facility produces can stock, automotive sheet stock, as well as building and industrial products. The facility also provides feedstock to our Kingston, Ontario facility, which produces heat-treated automotive sheet and products for construction and industrial applications, and to our Fairmont, West Virginia facility, which produces foil and light-gauge sheet.
23
Our Logan facility in Russellville, Kentucky is a processing joint venture between us and Tri-Arrows Aluminum Inc. (Tri-Arrows). Logan is a dedicated manufacturer of aluminum sheet products for the can stock market and operates modern and high-speed equipment for ingot casting, hot-rolling, cold-rolling and finishing. A portion of the can end stock is coated at North America's Warren, Ohio facility, in addition to Logan's on-site coating assets. Together with Tri-Arrows, we operate Logan as a production cooperative, with each party supplying its own primary metal inputs for conversion at the facility. The converted product is then returned to the supplying party at cost. Logan does not own any of the primary metal inputs or any of the converted products. Most of the fixed assets at Logan are directly owned by us and Tri-Arrows in varying ownership percentages or solely by each party.
We share control of the management of Logan with Tri-Arrows through a board of directors with seven voting members of which we appoint four members and Tri-Arrows appoints three members. Management of Logan is led jointly by two executive officers who are subject to approval by at least five members of the board of directors.
Along with our recycling center in Oswego, New York, we own two other fully dedicated recycling facilities in North America, located in Berea, Kentucky and Greensboro, Georgia. Each offers a modern, cost-efficient process to recycle UBCs and other aluminum scrap into sheet ingot to supply our hot mills in Logan and Oswego.
Europe
Location |
| Plant Processes |
| Major End-Use Markets |
Bresso, Italy |
| Finishing, painting |
| Painted sheet, architectural |
Göttingen, Germany |
| Cold rolling, finishing, painting |
| Can end, can tab, food can, lithographic, painted sheet, automotive |
Latchford, United Kingdom |
| Recycling |
| Sheet ingot from recycled metal |
Ludenscheid, Germany |
| Foil rolling, finishing, converting |
| Foil, packaging |
Nachterstedt, Germany |
| Cold rolling, finishing, painting, recycling |
| Automotive, can end, industrial, painted sheet, architectural, recycled ingot |
Neuss, Germany (A) |
| Hot rolling, cold rolling, recycling |
| Can stock, foilstock, feeder stock for finishing operations |
Ohle, Germany |
| Cold rolling, finishing, converting |
| Foil, packaging |
Pieve, Italy |
| Continuous casting, cold rolling, finishing, recycling |
| Coil for Bresso, industrial |
Sierre, Switzerland (B) |
| Sheet ingot casting, hot rolling, cold rolling, finishing |
| Automotive, industrial |
Wednesbury, United Kingdom |
| Finishing |
| Automotive |
(A) | Operated as a 50/50 joint venture between us and Hydro Aluminium Deutschland GmbH (Hydro). This joint venture is known as "Norf" or "Alunorf". |
(B) | Operated under a long-term lease arrangement with a third party lessor. |
Aluminium Norf GmbH (Alunorf) in Germany, a 50/50 production-sharing joint venture between us and Hydro, is a large scale, modern manufacturing hub, located in Neuss, Germany, for several of our operations in Europe, and is the largest aluminum rolling mill and remelting operation in the world. Alunorf supplies hot coil for further processing through cold rolling to some of our other plants, including Göttingen and Nachterstedt in Germany and provides foilstock to our plants in Ohle and Lüdenscheid in Germany. The Ohle and Lüdenscheid cold mill and finishing lines produce products for a number of end use applications, such as flexible tubes and bare, container, and converter foil.
Together with Hydro, we operate Alunorf as a production cooperative, with each party supplying its own primary metal inputs for transformation at the facility. The transformed product is then transferred back to the supplying party on a pre-determined cost-plus basis. We own 50% of the equity interest in Alunorf and Hydro owns the other 50%. We share control of the management of Alunorf with Hydro through a jointly-controlled shareholders' committee. Management of Alunorf is led jointly by two managing executives, one nominated by us and one nominated by Hydro.
Our Göttingen plant has a cold mill and paint line as well as finishing capability for can, food, and automotive sheet. Our Nachterstedt plant cold rolls and finishes automotive, can, industrial, and architectural sheet. In October 2014, we opened
24
the world's largest recycling center at our Nachterstedt, Germany site. It is a fully integrated recycling facility, capable of recycling a wide variety of scrap. The Pieve plant, located near Milan, Italy, produces continuous cast coil that is cold rolled into paintstock and sent to the Bresso, Italy plant for painting and finishing.
The Sierre rolling mill and remelt operation in Switzerland, along with the Nachterstedt and Göttingen plants in Germany, combine to make Novelis Europe's leading producer of automotive sheet in terms of shipments.
We lease a facility in Wednesbury, U.K., that houses a small finishing operation for automotive products.
Asia
Location |
| Plant Processes |
| Major End-Use Markets |
Binh Doung, Vietnam |
| Recycling |
| Recycled material |
Bukit Raja, Malaysia(A) |
| Continuous casting, cold rolling, coating |
| Construction/industrial, heavy and light gauge foils |
Changzhou, China |
| Finishing |
| Automotive |
Ulsan, South Korea |
| Sheet ingot casting, hot rolling, cold rolling, recycling, finishing |
| Can stock, construction/industrial, electronics, foilstock, and recycled material |
Yeongju, South Korea |
| Sheet ingot casting, hot rolling, cold rolling, recycling, finishing |
| Can stock, construction/industrial, electronics, foilstock and recycled material |
(A) | Ownership of the Bukit Raja plant corresponds to our 59% equity interest in Aluminium Company of Malaysia Berhad, a publicly traded company that operates in Bukit Raja, Selangor, Malaysia. |
In addition to its rolling operations, Novelis Asia operates recycling furnaces at both its Ulsan and Yeongju facilities in South Korea for the conversion of customer and third-party recycled aluminum. During fiscal 2015, we began the commissioning phase of an aluminum automotive sheet finishing plant in Changzhou, China. In addition, we have a facility in Binh Duong, Vietnam, which handles the collection and processing of UBCs.
South America
Location |
| Plant Processes |
| Major End-Use Markets |
Pindamonhangaba, Brazil |
| Sheet ingot casting, hot rolling, cold rolling, recycling, finishing, coating |
| Can stock, construction/industrial, foilstock, recycled ingot |
Santo Andre, Brazil |
| Foil rolling, finishing |
| Foil |
Our Pinda rolling and recycling facility in Brazil has an integrated process including sheet ingot casting, hot rolling, cold rolling, coating, finishing, and recycling operations. We expanded our rolling operations in fiscal 2013 and our recycling operations in fiscal 2014 to increase capacity in our Pinda facility. Additionally, we installed a new coating line for beverage can end stock in our Pinda facility in fiscal 2014. A leased coating line also produces painted products, including can end stock. Pinda supplies foilstock to our Santo Andre foil plant, which produces converter, household and container foil, among others.
Pinda is the largest aluminum rolling and recycling facility in South America in terms of shipments and the only facility in South America capable of producing can body and end stock. Pinda recycles primarily UBCs, and is engaged in tolling recycled metal for our customers.
During fiscal 2015, we operated primary aluminum smelting operations and casting at our Ouro Preto, Brazil facility and hydroelectric power generation operations in the state of Minas Gerais. Our owned power generation operations supplied all of our smelter needs in fiscal 2015. The Ouro Preto facility was closed in December 2014, and we sold our share of the joint venture of the Consorcio Candonga in December 2014 and certain of our other hydroelectric power assets in February 2015.
25
Item 3. Legal Proceedings
We are a party to litigation incidental to our business from time to time. For additional information regarding litigation to which we are a party, see Note 20 - Commitments and Contingencies to our accompanying audited consolidated financial statements, which are incorporated by reference into this item.
Item 4. Mine Safety Disclosures
Not applicable.
26
PART II
Item 5. Market for Registrant's Common Equity, Related Shareholder Matters and Issuer Purchases of Equity Securities
There is no established public trading market for the Company's common stock. All of the common shares of Novelis are owned directly by AV Metals Inc. and indirectly by Hindalco Industries Limited. None of the equity securities of the Company are authorized for issuance under any equity compensation plan.
Dividends or returns of capital are at the discretion of the board of directors and will depend on, among other things, our financial resources, cash flows generated by our business, our cash requirements, restrictions under and covenant compliance under the instruments governing our indebtedness, being in compliance with the appropriate indentures and covenants under the instruments that govern our indebtedness that would allow us to legally pay dividends or return capital and other relevant factors.
In March 2014, we declared a return of capital to our shareholder, AV Metals Inc., in the amount of $250 million, which we subsequently paid on April 30, 2014.
Item 6. Selected Financial Data
The selected consolidated financial data should be read in conjunction with our consolidated financial statements for the respective periods and the related notes included elsewhere in this Form 10-K.
All of our common shares were indirectly held by Hindalco; thus, earnings per share data are not reported. Amounts in the tables below are in millions.
|
| Year Ended March 31, | ||||||||||||||||||
|
| 2015 |
| 2014 |
| 2013 |
| 2012 |
| 2011 | ||||||||||
Net sales |
| $ | 11,147 | |
| $ | 9,767 | |
| $ | 9,812 | |
| $ | 11,063 | |
| $ | 10,577 | |
Net income attributable to our common shareholder |
| $ | 148 | |
| $ | 104 | |
| $ | 202 | |
| $ | 63 | |
| $ | 116 | |
Return of capital (A) |
| $ | - | |
| $ | 250 | |
| $ | - | |
| $ | - | |
| $ | 1,700 | |
|
| March 31, | ||||||||||||||||||
|
| 2015 |
| 2014 |
| 2013 |
| 2012 |
| 2011 | ||||||||||
Total assets |
| $ | 9,102 | |
| $ | 9,114 | |
| $ | 8,522 | |
| $ | 8,021 | |
| $ | 8,296 | |
Long-term debt (including current portion) |
| $ | 4,457 | |
| $ | 4,451 | |
| $ | 4,464 | |
| $ | 4,344 | |
| $ | 4,086 | |
Short-term borrowings |
| $ | 846 | |
| $ | 723 | |
| $ | 468 | |
| $ | 18 | |
| $ | 17 | |
Cash and cash equivalents |
| $ | 628 | |
| $ | 509 | |
| $ | 301 | |
| $ | 317 | |
| $ | 311 | |
Total (deficit) equity |
| $ | (70 | ) |
| $ | 268 | |
| $ | 239 | |
| $ | 123 | |
| $ | 445 | |
(A) | In December 2010, we declared and paid $1.7 billion to our shareholder, AV Metals Inc., as a return of capital. In March 2014, we declared a return of capital to our shareholder in the amount of $250 million, which we subsequently paid on April 30, 2014. |
27
Item 7. Management's Discussion and Analysis of Financial Condition and Results of Operations
OVERVIEW AND REFERENCES
Novelis is the world's leading aluminum rolled products producer based on shipment volume in fiscal 2015. We produce aluminum sheet and light gauge products for use in the packaging market, which includes beverage and food can and foil products, as well as for use in the automotive, transportation, electronics, architectural and industrial product markets. We are also the world's largest recycler of aluminum and have recycling operations in many of our plants to recycle both post-consumer aluminum and post-industrial aluminum. As of March 31, 2015 , we had manufacturing operations in eleven countries on four continents, which include 25 operating plants, and recycling operations in eleven of these plants. In addition to aluminum rolled products plants, our South American businesses have historically included primary aluminum smelting and power generation facilities. In fiscal 2015, Novelis ceased operations at our remaining smelting facilities in South America and sold the majority of the power generation operations which supported those facilities. We are the only company of our size and scope focused solely on the aluminum rolled products markets and capable of local supply of technologically sophisticated products in all of our geographic regions, but with the global footprint to service global customers.
The following discussion contains forward-looking statements that reflect our plans, estimates and beliefs. Our actual results could differ materially from those discussed in these forward-looking statements. Factors that could cause or contribute to these differences include, but are not limited to, those discussed below and elsewhere in this Annual Report, particularly in "Special Note Regarding Forward-Looking Statements and Market Data" and "Risk Factors."
28
HIGHLIGHTS
We reported "Segment income" of $902 million for the year ended March 31, 2015 , which is up 2% compared to the prior year. The "Segment income" was driven by continued growth in shipment levels and higher recycling benefits, despite a significant amount of global economic uncertainty, unfavorable impacts from the strengthening of the U.S. dollar compared to the international functional currencies in which we operate and higher costs associated with the commissioning of our expansion projects. Global economic uncertainty, foreign currency volatility and uncertainty in commodity markets, while not impacting the efficiency and success of our operations, will ultimately impact our financial results in the near term.
Aluminum metal prices were higher during most of fiscal 2015 as compared to fiscal 2014, including local market premiums. Base aluminum metal prices began a declining trend in the third quarter of fiscal 2015, as did local market premiums in the fourth quarter of fiscal 2015.
Shipments of our flat rolled products increased from 2,895 kt in fiscal 2014 to 3,050 kt in fiscal 2015, supported by our recent rolling expansions in Asia and South America and our automotive heat treatment investments in the U.S. and China. Sales growth in North America and Europe is driven by higher demand in the automotive sector and higher can shipments in Europe. Sales growth in Asia was achieved due to higher shipments to customers in the Middle East and other regions, despite highly competitive market conditions throughout Southeast Asia, which led to lower pricing. The can market continued to be strong in South America.
We have made significant investments in our automotive sheet finishing operations as the automotive industry is using more aluminum to improve vehicle performance and fuel efficiency by reducing vehicle weight. In fiscal 2015, we began production at two new automotive sheet finishing lines in our Oswego, New York facility, and began the commissioning of a new automotive sheet finishing plant in Changzhou, China. As a result of this added capacity, our global automotive shipments grew to 11% of our flat rolled product shipments in fiscal 2015, up from 9% of flat rolled product shipments in fiscal 2014. We expect automotive shipments to continue to increase in fiscal 2016 as productivity improves on these three lines and as additional new capacity comes on line. A third automotive finishing line is under construction at our Oswego, New York facility, as is a second automotive finishing line at our Nachterstedt, Germany facility. These projects are on track to begin commissioning in late calendar year 2015.
We increased the average amount of recycled content in our products over the past fiscal year. By the end of fiscal 2015, 53% of our input materials were recycled aluminum. The full year average for recycled content was 49% , up from an average 46% in fiscal 2014. Our various recycling expansion projects are significant components of our strategy to achieve 80% recycled content in our products. Our newest recycling facility in Nachterstedt, Germany is the largest aluminum recycling facility in the world, and with recent recycling expansion in South Korea, Brazil and the U.S., we are increasing the use of recycled content in all regions. We have also expanded our recycling operations in Oswego, New York to support higher levels of automotive scrap processing. In fiscal 2015, one of our craft beer customers launched the world's first commercial use of evercan ™, the Company's high-recycled content aluminum sheet for beverage cans. In March 2015, we launched the sale of certified high-recycled content aluminum for specialty applications called evercycle ™ in North America.
The competitive landscape in Asia, which includes competition from FRP suppliers in China, has resulted in lower conversion premiums with the renewal of certain customer contracts. Additionally, the local market premium in Asia has increased rapidly compared to historical levels, increasing our cost of metal to levels we have not been able to pass through to some of our customers.
In late December 2014, there was an outage at the hot mill in the Logan Aluminum joint venture facility ("Logan facility") in North America due to an unexpected failure of a motor. A repaired motor was installed and operations at the hot mill resumed within approximately three weeks, at which time we began the process of ramping up to full capacity. This event negatively impacted our results in the fourth quarter of the current fiscal year.
In the current fiscal year, we ceased operations at our remaining smelting facilities in South America. We also sold our share of the hydroelectric generation operations of the Consorcio Candonga joint venture for $63 million in cash (net of related gains on currency derivatives and transaction fees), as well as certain of our other hydroelectric generation operations for cash proceeds (net of transaction fees) of $17 million.
We reported "Net income" of $148 million for the year ended March 31, 2015 , an increase of $44 million compared to $104 million for the year ended March 31, 2014 . Net cash provided by operating activities was $604 million for the year ended March 31, 2015 compared to net cash provided by operating activities of $702 million in the prior year, reflecting increasing working capital requirements. Our capital expenditures have declined as some of our larger strategic expansion projects have either recently commissioned or are in the commissioning phase. Our global capital expenditures for the year ended March 31, 2015 were $518 million compared to $717 million in prior year.
29
BUSINESS AND INDUSTRY CLIMATE
The demand for aluminum by the automotive industry continues to grow rapidly. This demand has been driven by the benefits that result from using lighter weight materials in vehicles, as companies respond to government regulations, which are driving improved emissions and better fuel economy; while also maintaining or improving vehicle handling, braking, and safety. We expect the automotive aluminum market to grow significantly through the end of the decade, which is driving the significant investments we are making in our automotive sheet finishing capacity in North America, Europe and Asia.
While economic growth and material substitution continues to drive increasing global demand for aluminum beverage cans, consumer demand for carbonated soft drinks in North America has declined, creating excess capacity in the can market in the region. We expect the overcapacity for can products in North America to eventually lessen as producers of flat rolled aluminum products shift more hot mill rolling capacity toward automotive products. Slower economic growth in China and increased competition from Chinese suppliers of flat rolled aluminum products has put downward pressure on conversion premiums, primarily in can and specialty products in Asia. Additionally, the local market premium in Asia was significantly higher on average compared to historical levels, increasing our cost of metal to levels we have not been able to pass through to some of our customers, due to competitive conditions in the region.
Key Sales and Shipment Trends
(in millions, except shipments which are in kt) | ||||||||||||||||||||||||||||||||||||||||
|
| Three Months Ended |
| Year Ended |
| Three Months Ended |
| Year Ended | ||||||||||||||||||||||||||||||||
|
| Jun 30, |
| Sept 30, 2013 |
| Dec 31, |
| Mar 31, |
| Mar 31, |
| Jun 30, |
| Sept 30, 2014 |
| Dec 31, |
| Mar 31, |
| Mar 31, | ||||||||||||||||||||
Net sales |
| $ | 2,401 | |
| $ | 2,414 | |
| $ | 2,403 | |
| $ | 2,549 | |
| $ | 9,767 | |
| $ | 2,680 | |
| $ | 2,831 | |
| $ | 2,847 | |
| $ | 2,789 | |
| $ | 11,147 | |
Percentage increase (decrease) in net sales versus comparable previous year period |
| (6 | )% |
| (1 | )% |
| 4 | % |
| 2 | % |
| - | % |
| 12 | % |
| 17 | % |
| 18 | % |
| 9 | % |
| 14 | % | ||||||||||
Rolled product shipments: |
|
|
|
|
|
|
|
|
|
|
|
|
|
|
|
|
|
| ||||||||||||||||||||||
North America |
| 238 | |
| 238 | |
| 235 | |
| 247 | |
| 958 | |
| 249 | |
| 260 | |
| 255 | |
| 243 | |
| 1,007 | | ||||||||||
Europe |
| 232 | |
| 225 | |
| 212 | |
| 242 | |
| 911 | |
| 246 | |
| 234 | |
| 218 | |
| 240 | |
| 938 | | ||||||||||
Asia |
| 162 | |
| 156 | |
| 165 | |
| 157 | |
| 640 | |
| 188 | |
| 186 | |
| 198 | |
| 196 | |
| 768 | | ||||||||||
South America |
| 92 | |
| 108 | |
| 123 | |
| 124 | |
| 447 | |
| 114 | |
| 116 | |
| 129 | |
| 131 | |
| 490 | | ||||||||||
Eliminations |
| (16 | ) |
| (14 | ) |
| (14 | ) |
| (17 | ) |
| (61 | ) |
| (27 | ) |
| (31 | ) |
| (43 | ) |
| (52 | ) |
| (153 | ) | ||||||||||
Total |
| 708 | |
| 713 | |
| 721 | |
| 753 | |
| 2,895 | |
| 770 | |
| 765 | |
| 757 | |
| 758 | |
| 3,050 | | ||||||||||
|
|
|
|
|
|
|
|
|
|
|
|
|
|
|
|
|
|
|
| | | |||||||||||||||||||
The following summarizes the percentage increase (decrease) in rolled product shipments versus the comparable previous year period: | ||||||||||||||||||||||||||||||||||||||||
North America |
| (11 | )% |
| (12 | )% |
| 9 | % |
| 3 | % |
| (3 | )% |
| 5 | % |
| 9 | % |
| 9 | % |
| (2 | )% |
| 5 | % | ||||||||||
Europe |
| - | % |
| 3 | % |
| 10 | % |
| 11 | % |
| 6 | % |
| 6 | % |
| 4 | % |
| 3 | % |
| (1 | )% |
| 3 | % | ||||||||||
Asia |
| 19 | % |
| 10 | % |
| 17 | % |
| 10 | % |
| 14 | % |
| 16 | % |
| 19 | % |
| 20 | % |
| 25 | % |
| 20 | % | ||||||||||
South America |
| 3 | % |
| 17 | % |
| 15 | % |
| 16 | % |
| 13 | % |
| 24 | % |
| 7 | % |
| 5 | % |
| 6 | % |
| 10 | % | ||||||||||
Total |
| (2 | )% |
| (1 | )% |
| 11 | % |
| 8 | % |
| 4 | % |
| 9 | % |
| 7 | % |
| 5 | % |
| 1 | % |
| 5 | % | ||||||||||
For the sixth consecutive quarter, total consolidated shipment levels increased versus the comparable year period, despite lost sales associated with a major hotmill outage in North America and production issues in Europe.
30
Business Model and Key Concepts
Conversion Business Model
A significant amount of our business is conducted under a conversion model, which allows us to pass through increases or decreases in the price of aluminum to our customers. Nearly all of our flat-rolled products have a price structure with three components: (i) a base aluminum price quoted off the LME; (ii) local market premiums; and (iii) a "conversion premium" to produce the rolled product which reflects, among other factors, the competitive market conditions for that product. Base aluminum prices are typically driven by macroeconomic factors and global supply and demand of aluminum. The local market premiums tend to vary based on the supply and demand for metal in a particular region and associated transportation costs.
LME Base Aluminum Prices and Local Market Premiums
|
|
|
| Percent Change | ||||||||||||||
|
| Year Ended March 31, |
| Year Ended March 31, 2015 versus |
| Year Ended March 31, 2014 versus | ||||||||||||
|
| 2015 |
| 2014 |
| 2013 |
| March 31, 2014 |
| March 31, 2013 | ||||||||
London Metal Exchange Prices |
|
|
|
|
|
|
|
|
|
| ||||||||
Aluminum (per metric tonne, and presented in U.S. dollars): | ||||||||||||||||||
Closing cash price as of beginning of period |
| $ | 1,731 | |
| $ | 1,882 | |
| $ | 2,099 | |
| (8 | )% |
| (10 | )% |
Average cash price during period |
| $ | 1,889 | |
| $ | 1,773 | |
| $ | 1,976 | |
| 7 | % |
| (10 | )% |
Closing cash price as of end of period |
| $ | 1,789 | |
| $ | 1,731 | |
| $ | 1,882 | |
| 3 | % |
| (8 | )% |
Although full year average aluminum prices were higher by 7% in fiscal 2015 compared to fiscal 2014 , the trend in these prices during the second half of fiscal 2015 was declining. Average aluminum prices during fiscal 2014 were lower by 10% compared to fiscal 2013 . The fluctuating prices and timing of when derivatives are realized resulted in $3 million of net unrealized gains on undesignated metal derivatives in fiscal 2015 , $9 million of net losses in fiscal 2014 , and $8 million of net gains in fiscal 2013 .
The prices we pay for aluminum also include local market premiums, which we pass through to most of our customers. These premiums globally have historically been fairly stable but have increased rapidly over the past two years. Although the local market premiums in all four of our regions were significantly higher for the year ended March 31, 2015 compared to the year ended March 31, 2014 , there was a decline in these premiums during the fourth quarter of fiscal 2015 compared to the previous sequential quarter. The weighted average local market premium was as follows:
|
|
|
|
|
|
|
|
|
|
| ||||||||
|
|
|
|
|
|
|
| Percent Change | ||||||||||
|
| Year Ended March 31, |
| Year Ended |
| Year Ended | ||||||||||||
|
| 2015 |
| 2014 |
| 2013 |
|
| ||||||||||
Weighted average Local Market Premium (per metric tonne, and presented in U.S. dollars) |
| $ | 464 | |
| $ | 281 | |
| $ | 254 | |
| 65 | % |
| 11 | % |
The higher base aluminum prices and local market premiums, increased our metal input costs as compared to the prior year comparable periods. These higher market price levels, along with our higher production and shipment levels, increased our reported "Net sales," "Cost of goods sold (exclusive of depreciation and amortization)," and working capital.
In North America, Europe and South America, we pass through local market premiums to our customers which are recorded through "Net sales." In Asia, historically high local market premiums result in a higher cost of metal than some of our competitors in the region, which we are unable to fully pass through to some of our customers. The competitive landscape in Asia results in many of our competitors in China pricing their metal off the Shanghai Futures Exchange, which does not have a local market premium. We purchase our metal inputs in this region based on the LME and incur a local market premium, resulting in a competitive disadvantage.
31
Recycled aluminum is generally purchased at a discount as compared to the price of primary aluminum. The overall benefit we receive from utilizing recycled metal is influenced by: 1) the overall price levels of the LME and local market premiums, 2) the spread between the price for recycled aluminum and the LME primary aluminum price and 3) our consumption levels of the recycled metal inputs. For the year ended March 31, 2015 , the overall recycling benefit increased as a result of these three factors.
Metal Price Lag and Related Hedging Activities
Increases or decreases in the average price of aluminum based on the LME directly impact "Net sales," "Cost of goods sold (exclusive of depreciation and amortization)" and working capital. The timing of these impacts varies based on contractual arrangements with customers and metal suppliers in each region. These timing impacts are referred to as metal price lag. Metal price lag exists due to: 1) the period of time between the pricing of our purchases of metal, holding and processing the metal, and the pricing of the sale of finished inventory to our customers, and 2) certain customer contracts containing fixed forward price commitments which result in exposure to changes in metal prices for the period of time between when our sales price fixes and the sale actually occurs.
We use LME aluminum forward contracts to preserve our conversion margins and manage the timing differences associated with metal price lag. These derivatives directly hedge the economic risk of future metal price fluctuations to better match the purchase price of metal with the sales price of metal. The volatility in local market premiums also results in metal price lag, although we do not have significant derivatives contracts associated with local market premiums as these are not prevalent in the market.
We elect to apply hedge accounting to better match the recognition of gains or losses on certain derivative instruments with the recognition of the underlying exposure being hedged in the statement of operations. For undesignated metal derivatives, there are timing differences between the recognition of unrealized gains or losses on the derivatives and the recognition of the underlying exposure in the statement of operations. The recognition of unrealized gains and losses on undesignated metal derivative positions typically precedes inventory cost recognition, customer delivery and revenue recognition. The timing difference between the recognition of unrealized gains and losses on undesignated metal derivatives and cost or revenue recognition impacts "Income before income taxes" and "Net income." Gains and losses on metal derivative contracts are not recognized in "Segment income" until realized.
See Segment Review below for the impact of metal price lag on each of our segments.
Foreign Currency and Related Hedging Activities
We operate a global business and conduct business in various currencies around the world. We have exposure to foreign currency risk as fluctuations in foreign exchange rates impact our operating results as we translate the operating results from various functional currencies into our U.S. dollar reporting currency at the current average rates. We also record foreign exchange remeasurement gains and losses when business transactions are denominated in currencies other than the functional currency of that operation. Global economic uncertainty is contributing to higher levels of volatility among the currency pairs in which we conduct business. The recent devaluation of the Euro against the U.S. dollar and the Swiss Franc have had a negative impact on our financial results. In Brazil, where our functional currency is the U.S. dollar, the devaluation of the Brazilian real against the U.S. dollar has had a positive impact on our financial results. The following table presents the exchange rates as of the end of each period and the average of the month-end exchange rates for the years ended March 31, 2015 , 2014 , and 2013 :
|
| Exchange Rate as of March 31, |
| Average Exchange Rate Year Ended March 31, | ||||||||||||||
|
| 2015 |
| 2014 |
| 2013 |
| 2015 |
| 2014 |
| 2013 | ||||||
U.S. dollar per Euro |
| 1.075 | |
| 1.378 | |
| 1.282 | |
| 1.256 | |
| 1.344 | |
| 1.289 | |
Brazilian real per U.S. dollar |
| 3.208 | |
| 2.263 | |
| 2.014 | |
| 2.504 | |
| 2.261 | |
| 2.017 | |
South Korean won per U.S. dollar |
| 1,105 | |
| 1,069 | |
| 1,112 | |
| 1,059 | |
| 1,090 | |
| 1,115 | |
Canadian dollar per U.S. dollar |
| 1.267 | |
| 1.104 | |
| 1.016 | |
| 1.147 | |
| 1.058 | |
| 1.003 | |
Swiss franc per Euro |
| 1.045 | |
| 1.218 | |
| 1.217 | |
| 1.170 | |
| 1.227 | |
| 1.210 | |
In both South Korea and Europe, operations are recorded in their local currency and translated into the U.S. dollar reporting currency. When comparing fiscal 2015 operating results with fiscal 2014 , in Europe, the stronger U.S. dollar resulted
32
in unfavorable foreign exchange translation. In South Korea, the weaker U.S. dollar, compared to the prior year period, resulted in favorable foreign exchange translation.
In Brazil and Canada, the U.S. dollar is the functional currency due to predominantly U.S. dollar selling prices while our operating costs are predominately denominated in the Brazilian real and the Canadian dollar. The stronger U.S. dollar compared to the Brazilian real and the Canadian dollar resulted in a favorable remeasurement of local currency operating costs and liabilities into the U.S. dollar in fiscal 2015 compared to fiscal 2014 .
In January 2015, the Swiss National Bank discontinued its policy to support a minimum exchange rate between the Euro and the Swiss franc. Following this announcement, the Swiss franc rapidly appreciated in value. This adversely impacted our Swiss operations, where operating costs are incurred primarily in the Swiss franc, and a large portion of revenues are denominated in the Euro.
We use foreign exchange forward contracts, options and cross-currency swaps to manage our exposure arising from recorded assets and liabilities, firm commitments, and forecasted cash flows denominated in currencies other than the functional currency of certain operations, which include capital expenditures and net investment in foreign subsidiaries. The impact of foreign exchange remeasurement, net of related hedges, was a net loss of $27 million in fiscal 2015 and a net gain of $7 million in fiscal 2014. For the year ended March 31, 2015 , the balance sheet remeasurement hedging gains and losses partially offset the foreign currency exchange remeasurement gains and losses arising from the non-functional currency denominated assets and liabilities being remeasured to the functional currency of certain operations. The increased volatility in the daily Brazilian real, Swiss Franc and Euro exchange rates versus the U.S. dollar resulted in a portion of the balance sheet remeasurement gains and losses not being fully offset by the foreign currency exchange hedges. In South America, foreign currency exchange hedging losses were partially offset by foreign currency remeasurement gains on the Brazilian real denominated liabilities being remeasured to the U.S. dollar. In Europe, foreign currency exchange remeasurement losses were partially offset by foreign currency exchange hedging gains on the U.S dollar denominated liabilities being remeasured to the Euro. For other foreign currency hedging programs, the unrealized gains or losses on other undesignated derivatives will be recognized in the statement of operations prior to the hedged transaction. The movement of currency exchange rates during fiscal 2015 and fiscal 2014 resulted in $3 million of unrealized gains and $3 million of unrealized losses on undesignated foreign currency derivatives (excluding balance sheet remeasurement hedges), respectively, which were not recognized in the statement of operations in the same period as the hedged transaction.
See Segment Review below for the impact of foreign currency on each of our segments.
33
Results of Operations
Year Ended March 31, 2015 Compared with the Year Ended March 31, 2014
"Net sales" were $11.1 billion , which is higher compared to the prior year. Factors impacting "Net sales" include higher average base aluminum prices, higher local market premiums, an increase in shipments of our can and automotive products, and higher non-FRP shipments, partially offset by the sale of our North American consumer foil operations in the first quarter of the current year.
"Cost of goods sold (exclusive of depreciation and amortization)" was $9.8 billion , which is also higher compared to the prior year. Factors impacting "Cost of goods sold (exclusive of depreciation and amortization)" include higher average base aluminum prices, higher average local market premiums, an increase in shipments, higher costs related to our strategic expansion projects, cost reductions due to an amendment we made to a non-union retiree medical plan in the prior year, partially offset by higher recycled metal benefits, and the sale of our North American consumer foil operations in the first quarter of fiscal 2015. Total metal input costs included in "Cost of goods sold (exclusive of depreciation and amortization)" increased $1.5 billion .
"Income before income taxes" for the year ended March 31, 2015 was $162 million , which compared to $115 million reported in the year ended March 31, 2014 . In addition to the factors noted above, the following items affected "Income before income taxes:"
• | "Selling, general and administrative expenses" decreased $34 million primarily due to tighter cost control in the current year and an amendment made to our long term incentive plan last year, which resulted in higher benefit costs in the prior year; |
• | "Depreciation and amortization" increased by $18 million due to the recent commissioning of some of our global expansion projects, partially offset by accelerated depreciation on certain non-core assets in the prior year; |
• | "Restructuring and impairment, net" of $37 million for the year ended March 31, 2015 , includes $28 million of charges related to ceasing operations of the Ouro Preto smelter in South America, $7 million of severance, contract termination and other restructuring charges in North America, Europe and South America related to past restructuring actions, and $2 million of impairment charges related to certain non-core assets in North America. In the prior year, we incurred $75 million , primarily related to restructuring actions in South America, Europe, and North America and impairment charges in South America. (See Note 2 - Restructuring and impairment to our accompanying consolidated financial statements for further details on restructuring activities); |
• | "Gain on assets held for sale, net" of $22 million for the year ended March 31, 2015 , includes $23 million from the sale of our share of the joint venture of the Consorcio Candonga, $7 million from the sale of our consumer foil operations in North America and $6 million from property and mining rights sales in South America. These gains were offset by a $14 million loss on the sale of certain hydroelectric assets in South America. The $6 million gain for the year ended March 31, 2014 relates to the disposal of three foil rolling and packaging operations in Europe; |
• | "Interest expense and amortization of debt issuance costs" increased $22 million due to higher outstanding debt balances; |
• | A $19 million gain on business interruption recovery claims for the year ended March 31, 2015 was partially comprised of an insurance settlement which resulted in a gain of $6 million related to an electrical short circuit impacting a hot mill motor at one of our facilities in our Europe segment in the second quarter of 2015. Additionally, the Logan Aluminum joint venture facility in North America stopped operations in the fourth quarter of fiscal 2015 for approximately three weeks due to an unexpected failure of a motor, and the partial insurance settlement resulted in a gain of $13 million . The insurance settlement gains partially offset the lost shipments we incurred from these issues; and |
• | Unrealized gains on changes in fair value of undesignated derivatives other than foreign currency remeasurement were immaterial for the year ended March 31, 2015 as compared to $10 million of losses in the same period in the prior year, which is reported as "Other expense (income), net." |
Our effective tax rate for the year ended March 31, 2015 was 8% , compared to 9% for the year ended March 31, 2014 . The effective tax rate in these periods was primarily driven by favorable movement in foreign currency rates on translation and remeasurement of deferred income taxes.
We reported "Net income attributable to our common shareholder" of $148 million for the year ended March 31, 2015 as compared to $104 million for the year ended March 31, 2014 , primarily as a result of the factors discussed above.
34
Segment Review
Due in part to the regional nature of supply and demand of aluminum rolled products and in order to best serve our customers, we manage our activities on the basis of geographical regions and are organized under four operating segments: North America, Europe, Asia and South America.
We measure the profitability and financial performance of our operating segments based on "Segment income." We define "Segment income" as earnings before (a) "depreciation and amortization"; (b) "interest expense and amortization of debt issuance costs"; (c) "interest income"; (d) unrealized gains (losses) on changes in fair value of derivative instruments, net, except for foreign currency remeasurement hedging activities, which are included in segment income; (e) impairment of goodwill; (f) gain or loss on extinguishment of debt; (g) noncontrolling interests' share; (h) adjustments to reconcile our proportional share of "Segment income" from non-consolidated affiliates to income as determined on the equity method of accounting; (i) "restructuring and impairment, net"; (j) gains or losses on disposals of property, plant and equipment and businesses, net; (k) other costs, net; (l) litigation settlement, net of insurance recoveries; (m) sale transaction fees; (n) provision or benefit for taxes on income (loss) and (o) cumulative effect of accounting changes, net of tax. The financial information for our segments includes the results of our affiliates on a proportionately consolidated basis, which is consistent with the way we manage our business segments. See Note 8 - Consolidation and Note 9 - Investment in and Advances to Non-Consolidated Affiliates and Related Party Transactions for further information about these affiliates. Our presentation of "Segment income" on a consolidated basis is a non-GAAP financial measure. See "Non-GAAP Financial Measures" below for additional discussion about our use of "Total Segment income."
The tables below show selected segment financial information (in millions, except shipments which are in kt). For additional financial information related to our operating segments, see Note 21 - Segment, Geographical Area, Major Customer and Major Supplier Information. In order to reconcile the financial information for the segments shown in the tables below to the relevant U.S. GAAP-based measures, "Eliminations and other" must adjust for proportional consolidation of each line item, and eliminate intersegment shipments (in kt) and intersegment "Net sales."
Selected Operating Results Year Ended March 31, 2015 |
| North America |
| Europe |
| Asia |
| South America |
| Eliminations and other |
| Total | ||||||||||||
Net sales |
| $ | 3,483 | |
| $ | 3,783 | |
| $ | 2,340 | |
| $ | 1,850 | |
| $ | (309 | ) |
| $ | 11,147 | |
Shipments |
|
|
|
|
|
|
|
|
|
|
|
| ||||||||||||
Rolled products - third party |
| 1,002 | |
| 889 | |
| 701 | |
| 458 | |
| - | |
| 3,050 | | ||||||
Rolled products - intersegment |
| 5 | |
| 49 | |
| 67 | |
| 32 | |
| (153 | ) |
| - | | ||||||
Total Rolled Products |
| 1,007 | |
| 938 | |
| 768 | |
| 490 | |
| (153 | ) |
| 3,050 | | ||||||
Non-rolled products |
| 23 | |
| 215 | |
| 2 | |
| 93 | |
| (9 | ) |
| 324 | | ||||||
Total shipments |
| 1,030 | |
| 1,153 | |
| 770 | |
| 583 | |
| (162 | ) |
| 3,374 | | ||||||
Selected Operating Results Year Ended March 31, 2014 |
| North America |
| Europe |
| Asia |
| South America |
| Eliminations and other |
| Total | ||||||||||||
Net sales |
| $ | 3,050 | |
| $ | 3,280 | |
| $ | 1,876 | |
| $ | 1,588 | |
| $ | (27 | ) |
| $ | 9,767 | |
Shipments |
|
|
|
|
|
|
|
|
|
|
|
| ||||||||||||
Rolled products - third party |
| 956 | |
| 877 | |
| 630 | |
| 432 | |
| - | |
| 2,895 | | ||||||
Rolled products - intersegment |
| 2 | |
| 34 | |
| 10 | |
| 15 | |
| (61 | ) |
| - | | ||||||
Total Rolled Products |
| 958 | |
| 911 | |
| 640 | |
| 447 | |
| (61 | ) |
| 2,895 | | ||||||
Non-rolled products |
| 36 | |
| 66 | |
| - | |
| 87 | |
| (23 | ) |
| 166 | | ||||||
Total shipments |
| 994 | |
| 977 | |
| 640 | |
| 534 | |
| (84 | ) |
| 3,061 | | ||||||
35
The following table reconciles changes in "Segment income" for the year ended March 31, 2014 to the year ended March 31, 2015 (in millions).
Changes in Segment income |
| North |
| Europe |
| Asia |
| South |
| Eliminations (B) |
| Total | ||||||||||||
Segment income - Year Ended March 31, 2014 |
| $ | 229 | |
| $ | 265 | |
| $ | 160 | |
| $ | 231 | |
| $ | - | |
| $ | 885 | |
Volume |
| 45 | |
| 25 | |
| 92 | |
| 44 | |
| (73 | ) |
| 133 | | ||||||
Conversion premium and product mix |
| 14 | |
| 26 | |
| (33 | ) |
| (14 | ) |
| 30 | |
| 23 | | ||||||
Conversion costs (C) |
| (30 | ) |
| (35 | ) |
| (82 | ) |
| (37 | ) |
| 41 | |
| (143 | ) | ||||||
Metal price lag |
| (14 | ) |
| (10 | ) |
| 12 | |
| - | |
| - | |
| (12 | ) | ||||||
Foreign exchange |
| - | |
| (37 | ) |
| 4 | |
| 15 | |
| - | |
| (18 | ) | ||||||
Primary operations |
| - | |
| - | |
| - | |
| (2 | ) |
| - | |
| (2 | ) | ||||||
Selling, general & administrative and research & development costs (D) |
| 16 | |
| 20 | |
| (4 | ) |
| (10 | ) |
| - | |
| 22 | | ||||||
Other changes |
| 13 | |
| (4 | ) |
| (8 | ) |
| 13 | |
| - | |
| 14 | | ||||||
Segment income - Year Ended March 31, 2015 |
| $ | 273 | |
| $ | 250 | |
| $ | 141 | |
| $ | 240 | |
| $ | (2 | ) |
| $ | 902 | |
(A) | Included in the North America "Segment income" for the year ended March 31, 2015 were the operating results of our consumer foil operations in North America that we sold on June 30, 2014. The change to "Segment income" attributable to these operations for the year ended March 31, 2015 compared to the prior year was unfavorable by $6 million . The following table reconciles changes in "Segment income" for the year ended March 31, 2014 to the year ended March 31, 2015 (in millions), with the impact of the consumer foil operations separately identified. |
Changes in Segment income |
| North America |
| Total | ||||
Segment income - Year Ended March 31, 2014 |
| $ | 229 | |
| $ | 885 | |
Volume |
| 56 | |
| 144 | | ||
Conversion premium and product mix |
| 60 | |
| 69 | | ||
Conversion costs |
| (74 | ) |
| (187 | ) | ||
Metal price lag |
| (14 | ) |
| (12 | ) | ||
Foreign exchange |
| - | |
| (18 | ) | ||
Primary metal production |
| - | |
| (2 | ) | ||
Selling, general & administrative and research & development costs |
| 9 | |
| 15 | | ||
Other changes |
| 13 | |
| 14 | | ||
Net impact of North America consumer foil operations sold in fiscal 2015 |
| (6 | ) |
| (6 | ) | ||
Segment income - Year Ended March 31, 2015 |
| $ | 273 | |
| $ | 902 | |
(B) | The recognition of "Segment income" by a region on an intersegment shipment could occur in a period prior to the recognition of "Segment income" on a consolidated basis, depending on the timing of when the inventory is sold to the third party customer. The "Eliminations" column adjusts regional "Segment income" for intersegment shipments that occur in a period prior to recognition of "Segment income" on a consolidated basis. The "Eliminations" column also reflects adjustments for changes in regional volume, conversion premium and product mix, and conversion costs related to intersegment shipments for consolidation. |
(C) | Conversion costs include expenses incurred in production such as direct and indirect labor, energy, freight, scrap usage, alloys and hardeners, coatings, alumina, melt loss, the benefit of utilizing scrap and other metal costs. Fluctuations in this component reflect cost efficiencies (inefficiencies) during the period as well as cost (inflation) deflation. |
(D) | Selling, general & administrative costs and research & development costs include costs incurred directly by each segment and all corporate related costs, which are allocated to each of our segments. Certain changes were made to our long-term incentive plan in fiscal 2014, which resulted in higher benefit costs in that period. These costs were allocated to each segment. |
36
North America
"Net sales" increased $433 million , or 14% , reflecting higher average base aluminum prices, higher local market premiums, and higher industrial and automotive shipments, partially offset by lower can shipments which were impacted by a three week unscheduled outage at our Logan facility. We expect shipments of our automotive products to continue to increase in the upcoming year, as a result of a customer's production of an aluminum intensive vehicle.
"Segment income" was $273 million , an increase of 19% , reflecting higher shipment levels as discussed above, higher conversion premiums for our automotive products, and improved cost containment of general and administrative expenses, partially offset by higher conversion costs, unfavorable metal price lag, and lower conversion premiums of our can products. Excluding the impact of our North American foil business, which was sold in June 2014, conversion premiums and conversion costs increased during the period. Conversion premiums increased due to improved conversion premiums in our automotive products. Conversion costs increased due to higher freight costs, higher costs associated with the commissioning of our automotive lines, higher repairs and maintenance costs, and higher market premiums on the procurement of metal.
In December 2014, there was an outage at the hot mill in the Logan Aluminum joint venture facility ("Logan facility") in North America due to an unexpected failure of a motor. A repaired motor was installed and operations at the hot mill resumed within approximately three weeks, at which time we began the process of ramping up to full capacity. The business disruption resulting from this unscheduled outage significantly reduced "Segment income" during the fourth quarter of fiscal 2015 in spite of a partial insurance settlement gain we realized during the quarter.
We have commissioned two automotive sheet finishing lines at our Oswego, New York facility. These two lines will result in approximately 240 kt of additional automotive finishing capacity annually when operating at full capacity. A third automotive finishing line is under construction in our Oswego, New York facility. This third automotive finishing line is expected to become operational at the end of calendar year 2015 and will add an additional 120 kt of finishing capacity. We have also invested in a new recycling line at our Oswego, New York facility for the automotive business.
Europe
"Net sales" increased $503 million , or 15% , due to higher average base aluminum prices, higher local market premiums and higher shipments of can, automotive and non-rolled products, partially offset by a decline in shipments of industrial products. Higher shipments of our can products were largely driven by a customer's recent conversion from steel to aluminum in one of its plants. We continue to experience an increase in demand and shipments of our automotive products. Our non-rolled product shipments increased compared to prior year driven by scrap sales to third party sheet ingot tollers in advance of our new recycling facility in Nachterstedt, Germany becoming fully commissioned.
"Segment income" was $250 million , a decrease of 6% , reflecting unfavorable changes in foreign currency rates, net of realized gains and losses on hedging, increased conversion costs, and unfavorable metal price lag, partially offset by higher shipment levels discussed above, improved conversion premiums, and lower general and administrative costs. Conversion costs were unfavorable due to higher wages, a higher cost base related to the commissioning of our recycling plant in Nachterstedt, Germany, higher freight costs, and higher repairs and maintenance, partially offset by an increase in the benefits from the utilization of recycled metal. Our conversion premiums were favorable due to an improved product portfolio mix. General and administrative costs were favorable due to lower costs as a result of our restructuring activities to optimize our business in Europe in the prior year.
During the second quarter of fiscal 2015, there was an outage caused by an electrical short circuit in a hot mill motor at one of our facilities in Europe. The business disruption resulting from this outage reduced "Segment income" during the year in spite of an insurance settlement gain we realized in the fourth quarter.
In June 2014, we began the commissioning of our fully integrated recycling facility at our Nachterstedt, Germany plant, which will have an annual capacity of approximately 400 kt when operating at full capacity. We are in the process of constructing a second automotive finishing line in our Nachterstedt, Germany facility, which will add an additional 120 kt of finishing capacity. The second line is expected to become operational at the end of calendar year 2015.
37
Asia
"Net sales" increased $464 million , or 25% , reflecting higher average aluminum prices and higher shipments of our can and automotive products. The increase in our can volumes was driven by shipments to customers in the Middle East. We also increased intersegment shipments of automotive products to Novelis Europe and industrial products to Novelis North America. A portion of the increase in demand for our automotive products was driven by customers in China.
"Segment income" was $141 million , a decrease of 12% , reflecting higher conversion costs and lower conversion premiums, partially offset by higher shipment levels discussed above, favorable impacts of foreign exchange, favorable metal price lag, and a positive impact from certain operating efficiencies gained during the year associated with higher production. Many of our competitors in China price their metal off the Shanghai Futures Exchange, which does not have a local market premium. The purchase price for our metal inputs is based on the LME and results in us paying a local market premium, which we are unable to fully pass along to some of our customers. The local market premium was significantly higher during fiscal 2015 as compared with historical levels. Although prices moderated somewhat during the fourth quarter, this increased our conversion costs because we were not able to pass these higher market premiums through to some of our customers. Other factors resulting in higher conversion costs include an increase in labor costs, higher energy rates, higher maintenance costs, higher freight, and unfavorable metal mix, partially offset by an increase in the benefits from the utilization of recycled metal. Conversion premiums were unfavorable due to competitive pressures from FRP suppliers in China with the renewal of certain beverage can product customer contracts and a higher mix of intersegment shipments.
In fiscal 2015, we began the commissioning of our new automotive sheet finishing plant at our Changzhou, China plant, which will have an annual capacity of approximately 120 kt when operating at full capacity.
South America
"Net sales" increased $262 million , or 16% , driven by higher average aluminum prices and higher shipments of our can products, partially offset by lower shipments of our industrial products. Shipments of our can products were higher compared to prior year due to an increase in can consumption in the region. The increase in demand associated with the FIFA World Cup in Brazil in June 2014 contributed to an increase in shipments as compared to prior year.
"Segment income" was $240 million , an increase of 4% , due to higher volumes discussed above, favorable foreign currency, partially offset by higher conversion costs and lower conversion premiums. Conversion costs were unfavorable in fiscal 2015 due to production issues related to the start up of certain expansion projects, higher headcount, higher market premiums on the procurement of metal, higher freight and an increase in repairs and maintenance costs. Energy sales positively impacted our results during the year ended March 31, 2015 , partially offset by sales of alumina in the comparable period. The decline in conversion premiums was primarily related to changes in customer mix. Other changes impacting "Segment income" include higher general and administrative costs.
In December 2014, we finalized the sale of our share of the joint venture of the Consorcio Candonga. The sale of the majority of our other hydroelectric power generation operations was completed in February 2015. Additionally, in December 2014, we ceased operations at our last primary aluminum smelter in Ouro Preto, Brazil. Our new can end stock coating line and recycling facility in Pindamonhangaba, Brazil (Pinda), both of which began the commissioning process in early 2014, continue to ramp up production.
38
Reconciliation of segment results to "Net income attributable to our common shareholder"
Costs such as depreciation and amortization, interest expense and unrealized gains (losses) on changes in the fair value of derivatives (except for derivatives used to manage our foreign currency remeasurement activities) are not utilized by our chief operating decision maker in evaluating segment performance. The table below reconciles income from reportable segments to "Net income attributable to our common shareholder" for the years ended March 31, 2015 and 2014 (in millions).
| Year ended March 31, | ||||||
| 2015 |
| 2014 | ||||
North America | $ | 273 | |
| $ | 229 | |
Europe | 250 | |
| 265 | | ||
Asia | 141 | |
| 160 | | ||
South America | 240 | |
| 231 | | ||
Intersegment eliminations | (2 | ) |
| - | | ||
Total Segment income | 902 | |
| 885 | | ||
Depreciation and amortization | (352 | ) |
| (334 | ) | ||
Interest expense and amortization of debt issuance costs | (326 | ) |
| (304 | ) | ||
Adjustment to eliminate proportional consolidation | (33 | ) |
| (40 | ) | ||
Unrealized losses on change in fair value of derivative instruments, net | - | |
| (10 | ) | ||
Realized (losses) gains on derivative instruments not included in segment income | (6 | ) |
| 5 | | ||
Restructuring and impairment, net | (37 | ) |
| (75 | ) | ||
Gain on assets held for sale | 22 | |
| 6 | | ||
Loss on sale of fixed assets | (5 | ) |
| (9 | ) | ||
Other costs, net | (3 | ) |
| (9 | ) | ||
Income before income taxes | 162 | |
| 115 | | ||
Income tax provision | 14 | |
| 11 | | ||
Net income | 148 | |
| 104 | | ||
Net income attributable to noncontrolling interests | - | |
| - | | ||
Net income attributable to our common shareholder | $ | 148 | |
| $ | 104 | |
"Depreciation and amortization" increased by $18 million due to the recent commissioning of some of our expansion projects, partially offset by accelerated depreciation in the prior year on certain non-core assets.
"Adjustment to eliminate proportional consolidation" relates to depreciation and amortization and income taxes at our Aluminium Norf GmbH (Alunorf) joint venture. Income taxes related to our equity method investments are reflected in the carrying value of the investment and not in our consolidated "Income tax provision."
"Realized (losses) gains on derivative instruments not included in segment income" represents realized gains on foreign currency derivatives related to asset sales, capital expenditures and net investment.
"Other costs, net" related primarily to losses on certain indirect tax expenses in Brazil, partially offset by interest income.
39
Year Ended March 31, 2014 Compared with the Year Ended March 31, 2013
"Net sales" were $9.8 billion, which was flat compared to the prior year. Factors impacting "Net sales" include a 10% decrease in average aluminum prices, lower sales due to the sale of three foil and packaging plants in Europe in the prior year, and a decline in conversion premiums in our can products driven by global competitive market conditions, which were offset by higher shipments of automotive, can and non-FRP.
"Cost of goods sold (exclusive of depreciation and amortization)" was $8.5 billion, which was flat compared to the prior year. Factors impacting "Cost of goods sold (exclusive of depreciation and amortization)" include lower average aluminum prices, cost reductions from utilizing more recycled metal, incremental costs we incurred in the prior year related to supply disruptions from our ERP implementation that didn't recur this year, cost reductions due to an amendment we made to a non-union retiree medical plan in the current year, and lower costs due to the sale of three foil and packaging plants in Europe in the prior year. Offsetting these declines were higher total shipments, reduction in the benefits from utilizing recycled metal due to lower average aluminum prices and a reduction in the discount off primary aluminum prices for the procurement of recycled metal. Total metal input costs included in "Cost of goods sold (exclusive of depreciation and amortization)" declined $176 million.
"Income before income taxes" for the year ended March 31, 2014 was $115 million, which compared to $286 million reported in the year ended March 31, 2013. In addition to the factors noted above, the following items affected "Income before income taxes:"
• | "Selling, general and administrative expenses" increased $63 million primarily due to higher annual and long term incentive costs; |
• | "Depreciation and amortization" increased by $42 million due to the recent commissioning of some of our global expansion projects and accelerated depreciation on certain non-core assets; |
• | "Gain on assets held for sale" of $6 million for the year ended March 31, 2014, relates to real property we sold in Brazil, while the $3 million gain for the year ended March 31, 2013 relates to the disposal of three foil rolling and packaging operations in Europe; |
• | "Loss on extinguishment of debt" of $7 million for the year ended March 31, 2013 related to the refinancing transaction we completed on our Term Loan Facility in prior year; |
• | "Restructuring and impairment, net" of $75 million for the year ended March 31, 2014, is related to $36 million of impairment, severance, and environmental charges related to our non-core assets in Brazil; $27 million of severance charges and a pension curtailment loss related to continuing efforts to reduce the cost of our business support organization for the Europe region; and $12 million of other impairment and restructuring charges. In fiscal 2013, we incurred $47 million which is comprised of severance and other impairment and restructuring charges in our South America, North America and Europe regions. (see Note 2 - Restructuring and impairment to our accompanying audited consolidated financial statements for further details on restructuring activities); |
• | An $11 million gain on business interruption insurance recovery for the year ended March 31, 2013, related to an insurance settlement for lost business as a result of a fire at a customer's plant, which is reported as "Other expense (income), net"; and |
• | Unrealized losses of $10 million for the year ended March 31, 2014 comprised of changes in fair value of undesignated derivatives other than foreign currency remeasurement hedging activities as compared to $14 million of gains in prior year, which is reported in "Other expense (income), net." |
Our effective tax rate for the year ended March 31, 2014 was 9%, compared to 27% for the year ended March 31, 2013. The effective tax rate was lower in the current year primarily due to lower pre-tax income, higher tax credits, and the release of certain deferred tax asset valuation allowances.
We reported "Net income attributable to our common shareholder" of $104 million for the year ended March 31, 2014 as compared to $202 million for the year ended March 31, 2013, primarily as a result of the factors discussed above.
40
Segment Review
Due in part to the regional nature of supply and demand of aluminum rolled products and in order to best serve our customers, we manage our activities on the basis of geographical regions and are organized under four operating segments: North America, Europe, Asia and South America.
The tables below show selected segment financial information (in millions, except shipments which are in kt). In order to reconcile the financial information for the segments shown in the tables below to the relevant U.S. GAAP-based measures, "Eliminations and other" must adjust for proportional consolidation of each line item, and eliminate intersegment shipments (in kt) and intersegment "Net sales."
Selected Operating Results Year Ended March 31, 2014 |
| North America |
| Europe |
| Asia |
| South America |
| Eliminations and other |
| Total | ||||||||||||
Net sales |
| $ | 3,050 | |
| $ | 3,280 | |
| $ | 1,876 | |
| $ | 1,588 | |
| $ | (27 | ) |
| $ | 9,767 | |
Shipments |
|
|
|
|
|
|
|
|
|
|
|
| ||||||||||||
Rolled products - third party |
| 956 | |
| 877 | |
| 630 | |
| 432 | |
| - | |
| 2,895 | | ||||||
Rolled products - intersegment |
| 2 | |
| 34 | |
| 10 | |
| 15 | |
| (61 | ) |
| - | | ||||||
Total Rolled Products |
| 958 | |
| 911 | |
| 640 | |
| 447 | |
| (61 | ) |
| 2,895 | | ||||||
Non-rolled products |
| 36 | |
| 66 | |
| - | |
| 87 | |
| (23 | ) |
| 166 | | ||||||
Total shipments |
| 994 | |
| 977 | |
| 640 | |
| 534 | |
| (84 | ) |
| 3,061 | | ||||||
Selected Operating Results Year Ended March 31, 2013 |
| North America |
| Europe |
| Asia |
| South America |
| Eliminations and other |
| Total | ||||||||||||
Net sales |
| $ | 3,405 | |
| $ | 3,181 | |
| $ | 1,762 | |
| $ | 1,391 | |
| $ | 73 | |
| $ | 9,812 | |
Shipments |
|
|
|
|
|
|
|
|
|
|
|
| ||||||||||||
Rolled products - third party |
| 988 | |
| 847 | |
| 556 | |
| 395 | |
| - | |
| 2,786 | | ||||||
Rolled products - intersegment |
| 2 | |
| 14 | |
| 6 | |
| - | |
| (22 | ) |
| - | | ||||||
Total Rolled Products |
| 990 | |
| 861 | |
| 562 | |
| 395 | |
| (22 | ) |
| 2,786 | | ||||||
Non-rolled products |
| 22 | |
| 58 | |
| - | |
| 76 | |
| (12 | ) |
| 144 | | ||||||
Total shipments |
| 1,012 | |
| 919 | |
| 562 | |
| 471 | |
| (34 | ) |
| 2,930 | | ||||||
The following table reconciles changes in "Segment income" for the year ended March 31, 2013 to the year ended March 31, 2014 (in millions).
Changes in Segment income |
| North America |
| Europe (A) |
| Asia |
| South America |
| Total | ||||||||||
Segment income - Year Ended March 31, 2013 |
| $ | 324 | |
| $ | 261 | |
| $ | 174 | |
| $ | 202 | |
| $ | 961 | |
Volume |
| (35 | ) |
| 49 | |
| 31 | |
| 38 | |
| 83 | | |||||
Conversion premium and product mix |
| (38 | ) |
| (59 | ) |
| (31 | ) |
| (1 | ) |
| (129 | ) | |||||
Conversion costs (B) |
| - | |
| 31 | |
| - | |
| (17 | ) |
| 14 | | |||||
Metal price lag |
| (3 | ) |
| (9 | ) |
| 5 | |
| 1 | |
| (6 | ) | |||||
Foreign exchange |
| (6 | ) |
| 9 | |
| (1 | ) |
| 17 | |
| 19 | | |||||
Primary metal production |
| - | |
| - | |
| - | |
| 15 | |
| 15 | | |||||
Selling, general & administrative and research & development costs (C) |
| (2 | ) |
| (23 | ) |
| (17 | ) |
| (22 | ) |
| (64 | ) | |||||
Other changes |
| (11 | ) |
| 6 | |
| (1 | ) |
| (2 | ) |
| (8 | ) | |||||
Segment income - Year Ended March 31, 2014 |
| $ | 229 | |
| $ | 265 | |
| $ | 160 | |
| $ | 231 | |
| $ | 885 | |
41
(A) | Included in the Europe "Segment income" for the year ended March 31, 2013, were the operating results of three foil and packaging plants (Rugles, France; Dudelange, Luxembourg; and Berlin, Germany) that we sold on June 28, 2012. The change to "Segment income" attributable to these three foil plants for the year ended March 31, 2014 compared to the prior year was unfavorable by $1 million. The following table reconciles changes in "Segment income" for the year ended March 31, 2013 to the year ended March 31, 2014 (in millions), with the impact of the foil and packaging plants separately identified. |
Changes in Segment income |
| Europe |
| Total | ||||
Segment income - Year Ended March 31, 2013 |
| $ | 261 | |
| $ | 961 | |
Volume |
| 63 | |
| 97 | | ||
Conversion premium and product mix |
| (34 | ) |
| (104 | ) | ||
Conversion costs |
| (4 | ) |
| (21 | ) | ||
Metal price lag |
| (10 | ) |
| (7 | ) | ||
Foreign exchange |
| 10 | |
| 20 | | ||
Primary metal production |
| - | |
| 15 | | ||
Selling, general & administrative and research & development costs |
| (26 | ) |
| (67 | ) | ||
Other changes |
| 6 | |
| (8 | ) | ||
Net impact of three foil plants sold in fiscal 2013 |
| (1 | ) |
| (1 | ) | ||
Segment income - Year Ended March 31, 2014 |
| $ | 265 | |
| $ | 885 | |
(B) | Conversion costs include expenses incurred in production such as direct and indirect labor, energy, freight, recycled metal usage, alloys and hardeners, coatings, alumina, melt loss, the benefit of utilizing recycled metal and other metal costs. Fluctuations in this component reflect cost efficiencies (inefficiencies) during the period as well as cost (inflation) deflation. |
(C) | Selling, general & administrative costs and research & development costs include costs incurred directly by each segment and all corporate related costs, which are allocated to each of our segments. These costs increased in fiscal 2014 compared to fiscal 2013 for the following reasons: 1) higher employee incentive costs attributable to the modification of our long term incentive plan, 2) higher valuation of the Company's long term incentive awards indexed in Hindalco's stock price, 3) higher annual employee incentive costs, and 4) wage inflation. Other significant fluctuations are discussed below. |
42
North America
"Net sales" declined $355 million, or 10%, reflecting a decline in our can volumes, lower conversion premiums, and lower average price of aluminum, partially offset by increases in our automotive and light gauge product shipments. Excess capacity in the can market in North America has negatively impacted our volumes and resulted in competitive pricing pressures we experienced with the renewal of existing customers' supply contracts at the end of the prior fiscal year. We continue to experience an increase in demand and shipments of our automotive products.
"Segment income" was $229 million, down 29%, reflecting the items above, as well as, unfavorable metal price lag, higher general and administrative costs, and an unfavorable foreign currency impact. Conversion costs were flat compared to prior year. Conversion costs were favorably impacted by a reduction in employee benefit costs in the current year due to an amendment made to our non-union U.S. retiree medical plan and the prior year production and supply chain issues we experienced with our ERP implementation and transferring our Saguenay plant capacity to other North America plants. Conversion costs were unfavorably impacted by a reduction in the benefits from the utilization of recycled metal, higher energy costs, and higher fixed costs associated with the commissioning of our automotive lines. Metal price lag was unfavorable due to an increase in certain metal procurement costs. General and administrative costs were slightly higher due to an increase in employee incentive costs offset by an increase in the capitalization of labor costs in the current year related to our automotive expansion project. Other changes include an $11 million insurance settlement gain in the prior year that did not recur in the current period.
Europe
"Net sales" increased $99 million, or 3%, reflecting higher total shipments, partially offset by lower average aluminum prices and lower conversion premiums. Higher shipments of flat rolled products were driven by our automotive and can products, partially offset by declines in light gauge and industrial products. The reduction in shipments of our light gauge products was due to the sale of our European aluminum foil and packaging rolling plants in June of 2012. Our conversion premiums declined as a result of competitive market conditions that resulted in lower can prices and a shift in product mix due to the sale of certain plants, previously noted, and lower prices on certain intersegment shipments.
"Segment income" was $265 million, which is slightly higher than prior year reflecting the factors above, as well as unfavorable metal price lag and higher general and administrative costs, partially offset by lower conversion costs and favorable foreign currency translation. Excluding the impact of the conversion costs of the three European foil and packaging plants which we sold, conversion costs were unfavorable due to higher employment and freight costs, partially offset by an increase in the benefits from utilization of recycled metal and reductions in certain metal procurement costs. General and administrative costs increased due to higher employee incentive costs. Metal price lag was unfavorable due primarily to gains we realized in the prior year and an increase in other metal costs.
Asia
"Net sales" increased $114 million, or 6%, reflecting higher shipments of our can products, partially offset by declines in our foil stock products, lower average prices of aluminum, and lower conversion premiums. The increase in our can volumes were driven by our Asia segment shipping more can products to customers in the Middle East. We are facing more competition, primarily from FRP suppliers in China, who are able to price their metal off the Shanghai Futures Exchange, which does not have a local market premium. We price our metal based on the LME, which charges a local market premium resulting in significant pressure on the the conversion premiums we charge our customers. Conversion premiums were also lower due to unfavorable product mix compared to prior year.
"Segment income" was $160 million, down 8%, reflecting the items above, as well as higher general and administrative expenses, partially offset by favorable metal price lag. General and administrative costs were higher due to an increase in employee incentive costs and increased headcount for our Middle East operations, our new Vietnam recycling center, and the construction of our new automotive sheet finishing plant in China. Our conversion costs were relatively flat compared to prior year and reflect a favorable impact from the use of more recycled metal through our new recycling capabilities in our Yeongju, South Korea facility partially offset by higher employment, freight, and energy costs.
43
South America
"Net sales" increased $197 million, or 14%, due to both higher flat rolled and non-flat rolled product volumes and higher conversion premiums, partially offset by lower average prices of aluminum. Shipments of our can products increased compared to prior year due to an increase in can demand combined with the additional rolling capacity that we added with the expansion of our Pinda facility. Shipments of our non-flat rolled products increased due to higher alumina and billet sales from our primary metal production operations.
"Segment income" was $231 million, up 14%, reflecting the items above, as well as favorable foreign currency impact, partially offset by higher conversion costs and general and administrative costs. Conversion costs were unfavorable due to wage inflation, higher headcount, higher market premiums on the procurement of metal, higher freight costs, and an increase in repairs and maintenance, partially offset by reductions in other metal procurement costs and favorable benefits from the utilization of recycled metal. General and administrative costs increased due to higher employee incentive costs and higher working capital financing costs.
Reconciliation of segment results to "Net income attributable to our common shareholder"
Costs such as depreciation and amortization, interest expense and unrealized gains (losses) on changes in the fair value of derivatives (except for derivatives used to manage our foreign currency remeasurement activities) are not utilized by our chief operating decision maker in evaluating segment performance. The table below reconciles income from reportable segments to "Net income attributable to our common shareholder" for the years ended March 31, 2014 and 2013 (in millions).
| Year ended March 31, | ||||||
| 2014 |
| 2013 | ||||
North America | $ | 229 | |
| $ | 324 | |
Europe | 265 | |
| 261 | | ||
Asia | 160 | |
| 174 | | ||
South America | 231 | |
| 202 | | ||
Total Segment income | 885 | |
| 961 | | ||
Depreciation and amortization | (334 | ) |
| (292 | ) | ||
Interest expense and amortization of debt issuance costs | (304 | ) |
| (298 | ) | ||
Adjustment to eliminate proportional consolidation | (40 | ) |
| (41 | ) | ||
Unrealized (losses) gains on change in fair value of derivative instruments, net | (10 | ) |
| 14 | | ||
Realized gains on derivative instruments not included in segment income | 5 | |
| 5 | | ||
Loss on extinguishment of debt | - | |
| (7 | ) | ||
Restructuring and impairment, net | (75 | ) |
| (47 | ) | ||
Gain on assets held for sale | 6 | |
| 3 | | ||
Other costs, net | (18 | ) |
| (12 | ) | ||
Income before income taxes | 115 | |
| 286 | | ||
Income tax provision | 11 | |
| 83 | | ||
Net income | 104 | |
| 203 | | ||
Net income attributable to noncontrolling interests | - | |
| 1 | | ||
Net income attributable to our common shareholder | $ | 104 | |
| $ | 202 | |
"Depreciation and amortization" increased by $42 million due to new depreciable assets including our rolling expansion project in Pinda, Brazil; our rolling expansion in South Korea; our recycling expansion in Yeongju, South Korea; and amortization of our new ERP system, as well as accelerated depreciation on certain non-core assets.
44
"Adjustment to eliminate proportional consolidation" typically relates to depreciation and amortization and income taxes at our Aluminium Norf GmbH (Alunorf) joint venture. Income taxes related to our equity method investments are reflected in the carrying value of the investment and not in our consolidated "Income tax provision."
"Other costs, net" related primarily to losses on the disposal of assets and certain indirect tax expenses in Brazil, partially offset by interest income.
45
Liquidity and Capital Resources
Over the past four years, we have been in a transitional period in which we invested heavily in strategically expanding rolling capacity, recycling operations and automotive finishing capabilities. Several of our expansion projects are ramping up operations, and we expect others to begin commissioning in the next year which, when operational, will generate additional operating cash flows. In addition to completing these projects, we have announced an additional expansion of our automotive sheet finishing capabilities in the U.S. and Germany. Our significant investments in the business were funded through cash flows generated by our operations, and a combination of local financing and our senior secured credit facilities. We expect to be able to fund our continued expansions, service our debt obligations and provide sufficient liquidity to run our business through one or more of the following: the generation of operating cash flows; our existing debt facilities, including refinancing; and new debt issuances, as necessary.
Our ABL Revolver extends until October 6, 2019, subject to certain conditions and maturities of other debt instruments. For our remaining short-term debt obligations, we expect to refinance a significant portion of the debt maturing within the next twelve months.
Available Liquidity
Our available liquidity as of March 31, 2015 and 2014 is as follows (in millions):
| March 31, | ||||||
| 2015 |
| 2014 | ||||
Cash and cash equivalents | $ | 628 | |
| $ | 509 | |
Availability under committed credit facilities | 510 | |
| 511 | | ||
Total liquidity | $ | 1,138 | |
| $ | 1,020 | |
We reported available liquidity of $1,138 million as of March 31, 2015 , which represents an increase compared to $1,020 million reported as of March 31, 2014 . The increase is attributable to net proceeds under our debt instruments of $127 million , proceeds from asset sales of $117 million , positive free cash flow of $71 million , and new committed credit facilities of $70 million . This increase was partially offset by a $250 million return of capital payment we made to our parent company during the year ended March 31, 2015 and a decrease from the impact of foreign currency on cash and other of $17 million during this same period. As of March 31, 2015 , our availability under committed credit facilities of $510 million was comprised of $307 million under our ABL Revolver and $203 million under our Korea and China loan facilities.
The "Cash and cash equivalents" balance above includes cash held in foreign countries in which we operate. As of March 31, 2015 , we held approximately $4 million of "Cash and cash equivalents" in Canada, in which we are incorporated, with the rest held in other countries in which we operate. As of March 31, 2015 , we held $160 million of cash in jurisdictions for which we have asserted that earnings are permanently reinvested and we plan to continue to fund operations and local expansions with cash held in those jurisdictions. Our significant future uses of cash include funding our expansion projects globally, which we plan to fund with cash flows from operating activities and local financing, and servicing our debt obligations domestically, which we plan to fund with cash flows from operating activities and, if necessary, repatriating cash from jurisdictions for which we have not asserted earnings are permanently reinvested. Cash held outside Canada is free from significant restrictions that would prevent the cash from being accessed to meet the Company's liquidity needs including, if necessary, to fund operations and service debt obligations in Canada. Upon the repatriation of any earnings to Canada, in the form of dividends or otherwise, we could be subject to Canadian income taxes (subject to adjustment for foreign taxes paid and the utilization of the large cumulative net operating losses we have in Canada) and withholding taxes payable to the various foreign jurisdictions. As of March 31, 2015 , we do not believe adverse tax consequences exist that restrict our use of "Cash or cash equivalents" in a material manner.
46
Free Cash Flow
We define "Free cash flow" (which is a non-GAAP measure) as: (a) "net cash provided by (used in) operating activities," (b) plus "net cash provided by (used in) investing activities" and (c) less "net proceeds from sales of assets, net of transaction fees and hedging." Management believes "Free cash flow" is relevant to investors as it provides a measure of the cash generated internally that is available for debt service and other value creation opportunities. However, "Free cash flow" does not necessarily represent cash available for discretionary activities, as certain debt service obligations must be funded out of "Free cash flow." Our method of calculating "Free cash flow" may not be consistent with that of other companies.
The following table shows the "Free cash flow" for the year ended March 31, 2015 , 2014 and 2013 , the change between periods, as well as the ending balances of cash and cash equivalents (in millions).
|
|
|
| Change | ||||||||||||||||
|
| Year Ended March 31, |
| 2015 versus |
| 2014 versus | ||||||||||||||
|
| 2015 |
| 2014 |
| 2013 |
| 2014 |
| 2013 | ||||||||||
Net cash provided by operating activities |
| $ | 604 | |
| $ | 702 | |
| $ | 203 | |
| $ | (98 | ) |
| $ | 499 | |
Net cash used in investing activities |
| (416 | ) |
| (702 | ) |
| (747 | ) |
| 286 | |
| 45 | | |||||
Less: Proceeds from sales of assets, net of transactions fees and hedging |
| (117 | ) |
| (16 | ) |
| (21 | ) |
| (101 | ) |
| 5 | | |||||
Free cash flow |
| $ | 71 | |
| $ | (16 | ) |
| $ | (565 | ) |
| $ | 87 | |
| $ | 549 | |
Ending cash and cash equivalents |
| $ | 628 | |
| $ | 509 | |
| $ | 301 | |
| $ | 119 | |
| $ | 208 | |
"Free cash flow" was positive $71 million in fiscal 2015 , an increase of $87 million as compared to fiscal 2014 . "Free cash flow" was negative $16 million in fiscal 2014 , an increase of $549 million as compared to fiscal 2013 . The changes in "Free cash flow" are described in greater detail below.
Operating Activities
Net cash provided by operating activities was $604 million for the year ended March 31, 2015 , which compares unfavorably to $702 million in the year ended March 31, 2014 . The decrease in net cash provided by operating activities was primarily related to unfavorable changes to certain components of working capital, including "Accounts receivable" and "Inventories," partially offset by higher "Segment income" and higher "Accounts payable." The following summarizes changes in working capital accounts (in millions).
|
|
| Change | ||||||||||||||||
| Year Ended March 31, |
| 2015 versus |
| 2014 versus | ||||||||||||||
| 2015 |
| 2014 |
| 2013 |
| 2014 |
| 2013 | ||||||||||
Net cash provided by (used in) operating activities due to changes in working capital: |
|
|
|
|
|
|
|
|
| ||||||||||
Accounts receivable | $ | (54 | ) |
| $ | 106 | |
| $ | (121 | ) |
| $ | (160 | ) |
| $ | 227 | |
Inventories | (390 | ) |
| 17 | |
| (160 | ) |
| (407 | ) |
| 177 | | |||||
Accounts payable | 578 | |
| 159 | |
| 6 | |
| 419 | |
| 153 | | |||||
Other current assets and liabilities | 39 | |
| 32 | |
| (8 | ) |
| 7 | |
| 40 | | |||||
Net change in working capital | $ | 173 | |
| $ | 314 | |
| $ | (283 | ) |
| $ | (141 | ) |
| $ | 597 | |
47
Year Ended March 31, 2015
We experienced an increase in "Accounts receivable, net" due to an increase in shipments, as well as higher base aluminum prices and local market premiums compared to the end of the fourth quarter of prior year, partially offset by higher factoring of accounts receivable. As of March 31, 2015 and March 31, 2014 , we had factored, without recourse, certain trade receivable aggregating $591 million and $245 million , respectively, which had a favorable impact to net cash provided by operating activities of $346 million for the year ended March 31, 2015 . We determine the need to factor our receivables based on local cash needs including the need to fund our strategic investments, as well as attempting to balance the timing of cash flows of trade payables and receivables. "Inventories" were higher due to an increase in quantities on hand, as well as higher base aluminum prices and local market premiums when compared to the fourth quarter of fiscal 2014. The higher quantities of inventory on hand at March 31, 2015 is the result of recent capacity expansions, as well as longer supply chains to support the automotive sector and expand our scrap procurement network. As of March 31, 2015 , we had sold certain inventories to third parties and have agreed to repurchase the same or similar inventory back from the third parties subsequent to March 31, 2015 . Our estimated repurchase obligation for this inventory as of March 31, 2015 is $206 million , based on market prices as of this date. We sell and repurchase inventory with third parties in an attempt to better manage inventory levels and to better match the purchasing of inventory with the demand for our products. We experienced an increase in "Accounts payable" due to higher purchases of inventory, higher base aluminum prices and higher local market premiums when compared to the end of the fourth quarter of prior year, the timing of payments on vendor payables outstanding as of March 31, 2015 , and obtaining longer payment terms with certain vendors.
Included in cash flows from operating activities for the year ended March 31, 2015 were $303 million of interest payments, $131 million of cash paid for income taxes, $32 million of payments on restructuring programs, and $59 million of contributions to our pension plans. As of March 31, 2015 , we had $32 million of outstanding restructuring liabilities, of which $16 million we estimate will result in cash outflows within the next twelve months. We also expect to incur restructuring charges in future periods as we fully dismantle the smelter site in South America. On July 6, 2012, the Moving Ahead for Progress in the 21st Century Act (MAP-21) was signed into law by the United States government. MAP-21, in part, provides temporary relief for employers who sponsor defined benefit pension plans related to funding contributions under the Employee Retirement Income Security Act of 1974. Beginning in fiscal 2014, we utilized the relief provided by MAP-21, which reduced our minimum required defined benefit pension funding. The Highway and Transportation Funding Act was signed into law in August 2014. This law provides further funding relief for defined benefit plans which reduced our minimum required defined benefit pension funding. During fiscal 2016 , we expect to contribute an additional $30 million to our funded pension plans, $12 million to our unfunded pension plans and $19 million to our savings and defined contribution plans.
Year Ended March 31, 2014
During the year ended March 31, 2014, net cash provided by our working capital was $314 million, which is the result of various working capital actions we made in the year. "Accounts receivable, net" declined due to an increase in our factored accounts receivable and an 8% reduction in aluminum prices, partially offset by higher shipments. As of March 31, 2014 and March 31, 2013, we had factored, without recourse, certain trade receivables aggregating $245 million and $124 million, respectively, which increased net cash provided by operating activities by $121 million for the year ended March 31, 2014. "Inventories" declined due to lower average aluminum prices, partially offset by higher quantities on hand. The higher quantities of inventory on hand at March 31, 2014 is the result of additional capacity from our expansions that we commissioned in fiscal 2014. As of March 31, 2014, we had sold certain inventories to third parties and agreed to repurchase the same or similar inventory back from third parties subsequent to March 31 2014. Our estimated repurchase obligation for this inventory as of March 31, 2014 was approximately $74 million, based on market prices at the time of repurchase. "Accounts payable" increased due to the timing of payments on vendor payables outstanding as of March 31, 2014, obtaining longer payment terms with certain vendors, and an increase in the quantities of inventory purchases, partially offset by lower average aluminum prices.
Included in cash flows provided by operating activities during the year ended March 31, 2014 were $278 million of interest payments, $120 million of cash payments for income taxes, $34 million of payments on our restructuring programs, and $64 million of contributions to our pension plans.
48
Year Ended March 31, 2013
During the year ended March 31, 2013, net cash provided from our working capital was $283 million. "Accounts receivable, net" increased due to longer payment terms with specific customers and billing delays we experienced with a new ERP system in North America at the end of fiscal 2013. As of March 31, 2013 and March 31, 2012, we had factored, without recourse, certain trade receivable aggregating $123 million and $53 million, respectively, which increased net cash provided by operating activities by $70 million for the year ended March 31, 2013. "Inventories" increased due to higher quantities on hand related to a) efforts to secure access to metal supplies, particularly scrap and UBCs, in support of the strategic investments we are making to expand our recycling capacity, and b) metal purchase requirements with certain primary metal suppliers. "Accounts payable" reported in our consolidated balance sheet declined from March 31, 2012 to March 31, 2013 due to lower outstanding payables on capital expenditures, which are reflected as cash outflows in Investing Activities. Excluding the impact of accounts payable on capital expenditures, "Accounts payable" increased by $6 million due to the timing of certain vendor payments, partially offset by lower average aluminum prices.
Included in cash flows provided by operating activities during the year ended March 31, 2013 were $271 million of interest payments, $121 million of cash payments for income taxes, $34 million of payments on our restructuring programs, and $78 million of contributions to our pension plans.
Hedging Activities
We use derivative contracts to manage risk as well as liquidity. Under our terms of credit with counterparties to our derivative contracts, we do not have any material margin call exposure. No material amounts have been posted by Novelis nor do we hold any material amounts of margin posted by our counterparties. We settle derivative contracts in advance of billing on the underlying physical inventory and collecting payment from our customers, which temporarily impacts our liquidity position. The lag between derivative settlement and customer collection typically ranges from 30 to 90 days. Based on our outstanding derivative instruments and their respective valuations as of the year ended March 31, 2015 , we estimate there will be a net cash outflow of $2 million on the instruments that will settle in the three months ended June 30, 2015.
More details on our operating activities can be found above in "Results of operations for the Year Ended March 31, 2015 compared with the Year Ended March 31, 2014 ."
Investing Activities
The following table presents information regarding our "Net cash used in investing activities" (in millions).
|
|
|
| Change | ||||||||||||||||
|
| Year Ended March 31, |
| 2015 versus |
| 2014 versus | ||||||||||||||
|
| 2015 |
| 2014 |
| 2013 |
| 2014 |
| 2013 | ||||||||||
Capital expenditures |
| $ | (518 | ) |
| $ | (717 | ) |
| $ | (775 | ) |
| $ | 199 | |
| $ | 58 | |
Proceeds from settlement of other undesignated derivative instruments, net |
| 5 | |
| 15 | |
| 4 | |
| (10 | ) |
| 11 | | |||||
Proceeds from sales of assets, third party, net of transaction fees and hedging |
| 117 | |
| 8 | |
| 19 | |
| 109 | |
| (11 | ) | |||||
Proceeds from the sale of assets, related party, net of transaction fees |
| - | |
| 8 | |
| 2 | |
| (8 | ) |
| 6 | | |||||
(Outflows) proceeds from investments in and advances to non-consolidated affiliates, net |
| (20 | ) |
| (16 | ) |
| 3 | |
| (4 | ) |
| (19 | ) | |||||
Net cash used in investing activities |
| $ | (416 | ) |
| $ | (702 | ) |
| $ | (747 | ) |
| $ | 286 | |
| $ | 45 | |
49
We had $518 million of cash outflows for "Capital expenditures" for the year ended March 31, 2015 , compared to $717 million for the year ended March 31, 2014 and $775 million for the year ended March 31, 2013 . For the year ended March 31, 2015 , our "Capital expenditures" were primarily attributable to our automotive sheet finishing expansions in the U.S., China and Germany, our recycling expansion in Germany, and expenditures related to our ERP implementation. For the year ended March 31, 2014 , our "Capital expenditures" were primarily attributable to our rolling expansions in South Korea, our automotive sheet finishing plants in the U.S. and China, our recycling expansions in Germany and Brazil, and expenditures related to our ERP implementation. For the year ended March 31, 2013 , our "Capital expenditures" were primarily attributable to our rolling expansions in Brazil and South Korea, our recycling expansions in Brazil and South Korea, our automotive sheet finishing capacity in the U.S., and expenditures related to our ERP implementation.
The following table summarizes our global expansion projects:
Location | | Description of Expansion | | Estimated Capacity (at full capacity) | | Actual or estimated commission start date |
North America | | | | | | |
Oswego, NY | | Automotive sheet finishing capacity | | 240 kt | | July 2013 |
Oswego, NY |
| Automotive sheet finishing capacity |
| 120 kt |
| End CY2015 |
Europe | | | | | | |
Nachterstedt, Germany | | Recycling plant | | 400 kt | | June 2014 |
Nachterstedt, Germany |
| Automotive sheet finishing expansion |
| 120 kt |
| End CY2015 |
Asia | | | | | | |
Ulsan & Yeongju, South Korea | | Rolling expansion | | 350 kt | | July 2013 |
Yeongju, South Korea | | Recycling expansion | | 265 kt | | October 2012 |
Changzhou, China | | Automotive sheet finishing plant | | 120 kt | | July 2014 |
South America | | | | | | |
Pinda, Brazil | | Rolling expansion | | 220 kt | | December 2012 |
Pinda, Brazil | | Can coating line | | 100 kt | | January 2014 |
Pinda, Brazil | | Recycling expansion | | 190 kt | | February 2014 |
As of March 31, 2015 , we had $110 million of outstanding accounts payable and accrued liabilities related to capital expenditures in which the cash outflows will occur subsequent to March 31, 2015 .
The settlement of undesignated derivative instruments resulted in cash inflow of $5 million , $15 million , and $4 million for the year ended March 31, 2015 , 2014 , and 2013, respectively. The variance in these cash flows related primarily to changes in average aluminum prices and foreign currency rates which impact gains or losses we realize on the settlement of derivatives.
The net proceeds from asset sales for the year ended March 31, 2015 were $29 million related to the sale of our consumer foil operations in North America and $63 million for the sale of our share of the joint venture of the Consorcio Candonga, net of related gains on currency derivatives and transactions fees, and proceeds of $17 million from the sale of the majority of our other hydroelectric power generation operations in South America. In addition, we received proceeds of $8 million from the land and mining rights sale in South America. During the year ended March 31, 2014 , we sold our bauxite mining rights and certain alumina assets and related liabilities in South America to our parent company, Hindalco, and received cash proceeds of $8 million. Additionally, during the fiscal 2014 we also sold certain assets, namely land in South America, to a third party and received cash proceeds of $8 million . The proceeds from asset sales in the year ended March 31, 2013 related primarily to our sale of three foil and packaging plants in Europe to American Industrial Acquisition Corporation.
50
Financing Activities
The following table presents information regarding our "Net cash (used in) provided by financing activities" (in millions).
|
|
|
| Change | ||||||||||||||||
|
| Year Ended March 31, |
| 2015 versus |
| 2014 versus | ||||||||||||||
|
| 2015 |
| 2014 |
| 2013 |
| 2014 |
| 2013 | ||||||||||
Proceeds from issuance of long-term and short-term borrowings |
| $ | 362 | |
| $ | 169 | |
| $ | 319 | |
| $ | 193 | |
| $ | (150 | ) |
Principal payments of long-term and short-term borrowings |
| (324 | ) |
| (164 | ) |
| (97 | ) |
| (160 | ) |
| (67 | ) | |||||
Revolving credit facilities and other, net |
| 160 | |
| 208 | |
| 332 | |
| (48 | ) |
| (124 | ) | |||||
Return of capital to our common shareholder |
| (250 | ) |
| - | |
| - | |
| (250 | ) |
| - | | |||||
Dividends, noncontrolling interest |
| (1 | ) |
| - | |
| (2 | ) |
| (1 | ) |
| 2 | | |||||
Acquisition of noncontrolling interest in Novelis Korea, Ltd. |
| - | |
| - | |
| (9 | ) |
| - | |
| 9 | | |||||
Debt issuance costs |
| (3 | ) |
| (8 | ) |
| (8 | ) |
| 5 | |
| - | | |||||
Net cash (used in) provided by financing activities |
| $ | (56 | ) |
| $ | 205 | |
| $ | 535 | |
| $ | (261 | ) |
| $ | (330 | ) |
Year Ended March 31, 2015
During the year ended March 31, 2015 , we received proceeds related to the issuance of new short-term loans in Brazil, Korea, Vietnam, and other locations of $315 million , $27 million , $19 million , and $1 million , respectively. We made principal repayments of $253 million on short-term loans in Brazil, $30 million on Vietnam principal repayments, $18 million on our Term Loan Facility, $9 million on capital leases, $7 million on long-term loans in Korea and $7 million in other principal repayments. The change in our credit facilities balance is related to net incremental borrowings of $124 million on our ABL Revolver and a net increase of $29 million on our Korea facilities, and an increase in other borrowings of $7 million . On April 30, 2014, we made a return of capital payment to our direct shareholder, AV Metals Inc., in the amount of $250 million.
As of March 31, 2015 , our short-term borrowings were $846 million consisting of $609 million of loans under our ABL Revolver, $166 million in Novelis Brazil loans, $52 million in Novelis Korea bank loans, $9 million in Novelis Vietnam loans, $8 million in Novelis China loans, and $2 million in other short-term borrowings. The weighted average interest rate on our total short-term borrowings was 3.21% as of March 31, 2015 . As of March 31, 2015 , we had $307 million in remaining availability under the ABL Revolver and $203 million in availability under our Korea and China loan facilities. As of March 31, 2015 , $8 million of the ABL Revolver was utilized for letters of credit, reducing our availability under that facility. In October 2014, we amended and extended our ABL Revolver by entering into a $1.2 billion, five-year, senior secured ABL Revolver. However, our current Term Loan Facility limits our indebtedness under the ABL Revolver to $1.0 billion.
Year Ended March 31, 2014
During the year ended March 31, 2014, we received proceeds of $147 million related to the issuance of new short-term loans in Brazil and $22 million related to the issuance of new short-term loans in Vietnam. We made principal repayments of $133 million on short-term loans in Brazil, $18 million on our Term Loan Facility, $4 million on long-term loans in Brazil, $7 million on capital leases and $2 million on other principal repayments. In May 2013, we amended and extended our former ABL Facility by entering into a $1 billion, five-year, Senior Secured Asset-Backed Revolving Credit Facility (ABL Revolver). We received net proceeds of an additional $206 million under our amended ABL Revolver and $2 million of other short-term loans. We paid $8 million in debt issuance fees in the year ended March 31, 2014 related to amendment and extension of the ABL Revolver.
51
Year Ended March 31, 2013
During the year ended March 31, 2013, we received proceeds from additional borrowings on our Korean loans of $138 million, $94 million in Brazil loans, additional borrowings on our Term Loan Facility of $80 million, $3 million in Vietnam loans, and an additional $4 million in other loans. We made principal repayments of $76 million to retire our 7.25% senior notes, $18 million on our Term Loan Facility, and $3 million of other principal repayments. We received net proceeds of $332 million in short-term borrowings, which consists of an additional $319 million in increased borrowings under our former ABL Facility, and $13 million in increases in bank overdrafts. We paid dividends to our noncontrolling interests of $2 million related to our Asia operating segment. We paid $8 million in debt issuance fees related to the additional borrowings on our Term Loan Facility.
Additionally, during the year ended March 31, 2013, we acquired 0.75% of the outstanding shares of Novelis Korea Limited for $9 million. The transaction resulted in our ownership of substantially all of the shares of Novelis Korea Limited.
52
OFF-BALANCE SHEET ARRANGEMENTS
In accordance with SEC rules, the following qualify as off-balance sheet arrangements:
• | any obligation under certain derivative instruments; |
• | any obligation under certain guarantees or contracts; |
• | a retained or contingent interest in assets transferred to an unconsolidated entity or similar entity or similar arrangement that serves as credit, liquidity or market risk support to that entity for such assets; and |
• | any obligation under a material variable interest held by the registrant in an unconsolidated entity that provides financing, liquidity, market risk or credit risk support to the registrant, or engages in leasing, hedging or research and development services with the registrant. |
The following discussion addresses the applicable off-balance sheet items for our Company.
Derivative Instruments
See Note 15 - Financial Instruments and Commodity Contracts to our accompanying audited consolidated financial statements for a full description of derivative instruments.
Guarantees of Indebtedness
We have issued guarantees on behalf of certain of our subsidiaries. The indebtedness guaranteed is for trade accounts payable to third parties. Some of the guarantees have annual terms while others have no expiration and have termination notice requirements. Neither we nor any of our subsidiaries holds any assets of any third parties as collateral to offset the potential settlement of these guarantees. Since we consolidate wholly-owned and majority-owned subsidiaries in our consolidated financial statements, all liabilities associated with trade payables and short-term debt facilities for these entities are already included in our consolidated balance sheets.
We have guaranteed the indebtedness for a credit facility and loan on behalf of Alunorf. The guarantee is limited to 50% of the outstanding debt, not to exceed 6 million euros. As of March 31, 2015 , there were no amounts outstanding under our guarantee with Alunorf. We have also guaranteed the payment of early retirement benefits on behalf of Alunorf. As of March 31, 2015 , this guarantee totaled $2 million .
Other Arrangements
Factoring of Trade Receivables
We factor and forfait trade receivables (collectively, we refer to these as "factoring" programs) based on local cash needs including the need to fund our strategic investments, as well as attempting to balance the timing of cash flows of trade payables and receivables, fund strategic investments, and fund other business needs. Factored invoices are not included in our consolidated balance sheets when we do not retain a financial or legal interest. If a financial or legal interest is retained, we classify these factorings as secured borrowings.
Summary of Disclosures of Factored Financial Amounts
The following tables summarize our factoring amounts (in millions).
|
| Year Ended March 31, | ||||||||||
|
| 2015 |
| 2014 |
| 2013 | ||||||
Receivables factored |
| $ | 1,796 | |
| $ | 1,081 | |
| $ | 464 | |
Factoring expense |
| $ | 10 | |
| $ | 5 | |
| $ | 2 | |
|
| March 31, | ||||||
|
| 2015 |
| 2014 | ||||
Factored receivables outstanding |
| $ | 591 | |
| $ | 245 | |
53
Other
As part of our ongoing business, we do not participate in transactions that generate relationships with unconsolidated entities or financial partnerships, such as entities often referred to as structured finance or special purpose entities (SPEs), which would have been established for the purpose of facilitating off-balance sheet arrangements or other contractually narrow or limited purposes. As of March 31, 2015 and 2014 , we were not involved in any unconsolidated SPE transactions.
CONTRACTUAL OBLIGATIONS
We have future obligations under various contracts relating to debt and interest payments, capital and operating leases, long-term purchase obligations, and postretirement benefit plans. The following table presents our estimated future payments under contractual obligations that exist as of March 31, 2015 , based on undiscounted amounts (in millions). The future cash flow commitments we may have related to derivative contracts are excluded from our contractual obligations table as these are fair value measurements determined at an interim date within the contractual term of the arrangement and, accordingly, do not represent the ultimate contractual obligation (which could ultimately become a receivable). As a result, the timing and amount of the ultimate future cash flows related to our derivative contracts, including the $173 million of derivative liabilities recorded on our balance sheet as of March 31, 2015 , are uncertain. See the Liquidity section of Management's Discussion and Analysis for a discussion of potential future cash flows from derivatives in the first quarter of fiscal 2016 . Furthermore, due to the difficulty in determining the timing of settlements, the table excludes $37 million of uncertain tax positions. See Note 19 - Income Taxes to our accompanying audited consolidated financial statements.
|
| Less Than 1 Year |
| 1-3 Years |
| 3-5 Years |
| More Than 5 Years |
| Total | ||||||||||
Debt(A) |
| $ | 943 | |
| $ | 2,931 | |
| $ | 2 | |
| $ | 1,400 | |
| $ | 5,276 | |
Interest on long-term debt (B) |
| 279 | |
| 463 | |
| 245 | |
| 87 | |
| 1,074 | | |||||
Capital leases (C) |
| 11 | |
| 19 | |
| 12 | |
| - | |
| 42 | | |||||
Operating leases (D) |
| 27 | |
| 40 | |
| 34 | |
| 54 | |
| 155 | | |||||
Purchase obligations (E) |
| 5,026 | |
| 3,030 | |
| 479 | |
| - | |
| 8,535 | | |||||
Unfunded pension plan benefits (F) |
| 12 | |
| 20 | |
| 21 | |
| 56 | |
| 109 | | |||||
Other post-employment benefits (F) |
| 10 | |
| 17 | |
| 14 | |
| 43 | |
| 84 | | |||||
Funded pension plans (F) |
| 50 | |
| 112 | |
| 127 | |
| 385 | |
| 674 | | |||||
Total |
| $ | 6,358 | |
| $ | 6,632 | |
| $ | 934 | |
| $ | 2,025 | |
| $ | 15,949 | |
(A) | Includes only principal payments on our Senior Notes, term loans, revolving credit facilities and notes payable to banks and others. These amounts exclude payments under capital lease obligations. |
(B) | Interest on our fixed rate debt is estimated using the stated interest rate. Interest on our variable-rate debt is estimated using the rate in effect as of March 31, 2015 . Actual future interest payments may differ from these amounts based on changes in floating interest rates or other factors or events. These amounts include an estimate for unused commitment fees. Excluded from these amounts are interest related to capital lease obligations, the amortization of debt issuance and other costs related to indebtedness. |
(C) | Includes both principal and interest components of future minimum capital lease payments. Excluded from these amounts are insurance, taxes and maintenance associated with the property. |
(D) | Includes the minimum lease payments for non-cancelable leases for property and equipment used in our operations. We do not have any operating leases with contingent rents. Excluded from these amounts are insurance, taxes and maintenance associated with the properties and equipment. |
(E) | Includes agreements to purchase goods (including raw materials, inventory repurchase obligations, and capital expenditures) and services that are enforceable and legally binding on us, and that specify all significant terms. Some of our raw material purchase contracts have minimum annual volume requirements. In these cases, we estimate our future purchase obligations using annual minimum volumes and costs per unit that are in effect as of March 31, 2015 . Due to volatility in the cost of our raw materials, actual amounts paid in the future may differ from these amounts. Excluded from these amounts are the impact of any derivative instruments and any early contract termination fees, such as those typically present in energy contracts. |
(F) | Obligations for postretirement benefit plans are estimated based on actuarial estimates using benefit assumptions for, among other factors, discount rates, rates of compensation increases and health care cost trends. Payments for unfunded pension plan benefits and other post-employment benefits are estimated through 2025. For funded pension plans, estimating the requirements beyond fiscal 2016 is not practical, as it depends on the performance of the plans' investments, among other factors. |
54
RETURN OF CAPITAL
Payments to our shareholder are at the discretion of the board of directors and will depend on, among other things, our financial resources, cash flows generated by our business, our cash requirements, restrictions under the instruments governing our indebtedness, being in compliance with the appropriate indentures and covenants under the instruments that govern our indebtedness and other relevant factors.
In March 2014, we declared a return of capital to our shareholder, AV Metals Inc., in the amount of $250 million, which we subsequently paid on April 30, 2014.
ENVIRONMENT, HEALTH AND SAFETY
We strive to be a leader in environment, health and safety (EHS). Our EHS system is aligned with ISO 14001, an international environmental management standard, and OHSAS 18001, an international occupational health and safety management standard. As of March 31, 2015 , 23 of our established manufacturing facilities worldwide were ISO 14001 certified and OHSAS 18001 certified and all have dedicated quality improvement management systems.
Our expenditures for environmental protection (including estimated and probable environmental remediation costs as well as general environmental protection costs at our facilities) and the betterment of working conditions in our facilities were $29 million in fiscal 2015 , of which $20 million was expensed and $9 million capitalized. We expect these expenditures will be approximately $21 million in fiscal 2016 , of which we estimate $10 million will be expensed and $11 million capitalized. Generally, expenses for environmental protection are recorded in "Cost of goods sold (exclusive of depreciation and amortization)." However, significant remediation costs that are not associated with on-going operations are recorded in "Restructuring and impairment, net."
CRITICAL ACCOUNTING POLICIES AND ESTIMATES
Our discussion and analysis of our results of operations, liquidity and capital resources are based on our consolidated financial statements which have been prepared in accordance with accounting principles generally accepted in the United States (U.S. GAAP). In connection with the preparation of our consolidated financial statements, we are required to make assumptions and estimates about future events, and apply judgments that affect the reported amounts of assets, liabilities, revenue, expenses, and the related disclosures. We base our assumptions, estimates and judgments on historical experience, current trends and other factors we believe to be relevant at the time we prepare our consolidated financial statements. On a regular basis, we review the accounting policies, assumptions, estimates and judgments to ensure that our consolidated financial statements are presented fairly and in accordance with U.S. GAAP. However, because future events and their effects cannot be determined with certainty, actual results could differ from our assumptions and estimates, and such differences could be material.
Our significant accounting policies are discussed in Note 1 - Business and Summary of Significant Accounting Policies to our accompanying consolidated financial statements. We believe the following accounting policies are the most critical to aid in fully understanding and evaluating our reported financial results, as they require management to make difficult, subjective or complex judgments, and to make estimates about the effect of matters that are inherently uncertain. Although management believes that the estimates and judgments discussed herein are reasonable, actual results could differ, which could result in gains or losses that could be material. We have reviewed these critical accounting policies and related disclosures with the Audit Committee of our board of directors.
Derivative Financial Instruments
We hold derivatives for risk management purposes and not for trading. We use derivatives to mitigate uncertainty and volatility caused by underlying exposures to aluminum prices, foreign exchange rates, interest rates, and energy prices. The fair values of all derivative instruments are recognized as assets or liabilities at the balance sheet date and are reported gross.
The majority of our derivative contracts are valued using industry-standard models that use observable market inputs as their basis, such as time value, forward interest rates, volatility factors, and current (spot) and forward market prices for foreign exchange rates. See Note 15 - Financial Instruments and Commodity Contracts and Note 17 - Fair Value Measurements to our accompanying consolidated audited financial statements for discussion on fair value of derivative instruments.
55
We may be exposed to losses in the future if the counterparties to our derivative contracts fail to perform. We are satisfied that the risk of such non-performance is remote due to our monitoring of credit exposures. Additionally, we enter into master netting agreements with contractual provisions that allow for netting of counterparty positions in case of default, and we do not face credit contingent provisions that would result in the posting of collateral.
For derivatives designated as fair value hedges, we assess hedge effectiveness by formally evaluating the high correlation of changes in the fair value of the hedged item and the derivative hedging instrument. The changes in the fair values of the underlying hedged items are reported in other current and noncurrent assets and liabilities in the consolidated balance sheets. Changes in the fair values of these derivatives and underlying hedged items generally offset and the effective portion is recorded in "Net sales" consistent with the underlying hedged item and the net ineffectiveness is recorded in "Other income, net."
For derivatives designated as cash flow hedges or net investment hedges, we assess hedge effectiveness by formally evaluating the high correlation of the expected future cash flows of the hedged item and the derivative hedging instrument. The effective portion of gain or loss on the derivative is included in OCI and reclassified to earnings in the period in which earnings are impacted by the hedged items or in the period that the transaction becomes probable of not occurring. Gains or losses representing reclassifications of OCI to earnings are recognized in the line item most reflective of the underlying risk exposure. We exclude the time value component of foreign currency and aluminum price risk hedges when measuring and assessing ineffectiveness to align our accounting policy with risk management objectives when it is necessary. If at any time during the life of a cash flow hedge relationship we determine that the relationship is no longer effective, the derivative will no longer be designated as a cash flow hedge and future gains or losses on the derivative will be recognized in "Other expense (income), net."
For all derivatives designated in hedging relationships, gains or losses representing hedge ineffectiveness or amounts excluded from effectiveness testing are recognized in "Other expense (income), net" in our current period earnings. If no hedging relationship is designated, gains or losses are recognized in "Other expense (income), net" in our current period earnings.
Consistent with the cash flows from the underlying risk exposure, we classify cash settlement amounts associated with designated derivatives as part of either operating or investing activities in the consolidated statements of cash flows. If no hedging relationship is designated, we classify cash settlement amounts as part of investing activities in the consolidated statement of cash flows.
Impairment of Goodwill
Goodwill represents the excess of the purchase price over the fair value of the identifiable net assets of acquired companies. As a result of Hindalco's purchase of Novelis, we estimated fair value of the identifiable net assets using a number of factors, including the application of multiples and discounted cash flow estimates. The carrying value of goodwill for each of our reporting units, which is tested for impairment annually, is as follows (in millions):
| As of March 31, 2015 | ||
North America | $ | 285 | |
Europe | 181 | | |
South America | 141 | | |
| $ | 607 | |
Goodwill is not amortized; instead, it is tested for impairment annually or more frequently if indicators of impairment exist. On an ongoing basis, absent any impairment indicators, we perform our goodwill impairment testing as of the last day of February of each fiscal year. We do not aggregate components of operating segments to arrive at our reporting units, and as such our reporting units are the same as our operating segments.
The accounting guidance provides an entity the option to first assess qualitative factors to determine whether the existence of events or circumstances leads to a determination that it is more likely than not that the estimated fair value of a reporting unit is less than its carrying amount. If an entity elects to perform a qualitative assessment and determines that an impairment is more likely than not, the entity is then required to perform the existing two-step quantitative impairment test, otherwise no further analysis is required. An entity also may elect not to perform the qualitative assessment and, instead, proceed directly to the two-step quantitative impairment test. The ultimate outcome of the goodwill impairment review for a reporting unit should be the same whether an entity chooses to perform the qualitative assessment or proceeds directly to the two-step quantitative impairment test.
56
For our February 28, 2015 test, we elected to perform the two-step quantitative impairment test, where step one compares the fair value of each reporting unit to its carrying amount, and if step one indicates that the carrying value of a reporting unit exceeds the fair value, step two is performed to measure the amount of impairment, if any. For purposes of our step one analysis, our estimate of fair value for each reporting unit is based on discounted cash flows (the income approach). When available and as appropriate, we use quoted market prices/relationships (the market approach) to corroborate the estimated fair value. The approach to determining fair value for all reporting units is consistent given the similarity of our operations in each region.
Under the income approach, the fair value of each reporting unit is based on the present value of estimated future cash flows. The income approach is dependent on a number of significant management assumptions including markets and market share, sales volumes and prices, costs to produce, capital spending, working capital changes and the discount rate. We estimate future cash flows for each of our reporting units based on our projections for the respective reporting unit. These projected cash flows are discounted to the present value using a weighted average cost of capital (discount rate). The discount rate is commensurate with the risk inherent in the projected cash flows and reflects the rate of return required by an investor in the current economic conditions. For our annual impairment test, we used a discount rate of 8.5% for all reporting units. An increase or decrease of 0.5% in the discount rate would have impacted the estimated fair value of each reporting unit by approximately $175-$300 million, depending on the relative size of the reporting unit. The projections are based on both past performance and the expectations of future performance and assumptions used in our current operating plan. We use specific revenue growth assumptions for each reporting unit based on history and economic conditions, and the terminal year revenue growth assumptions was approximately 2.0%.
Under the market approach, the fair value of each reporting unit is determined based upon comparisons to public companies engaged in similar businesses.
As a result of our annual goodwill impairment test for the year ended March 31, 2015 , no goodwill impairment was identified. The fair values of the reporting units exceeded their respective carrying amounts as of February 28, 2015 by 64% for North America, by 66% for Europe and by 122% for South America.
Equity Investments
We invest in certain joint ventures and consortiums. We use the equity method to account for our investments in entities that we do not control, but where we have the ability to exercise significant influence over operating and financial policies. We exercise judgment to determine which investments should be accounted for using the equity method and which investments should be consolidated.
As of result of Hindalco's purchase of Novelis, investments in and advances to equity method affiliates were adjusted to reflect fair value as of May 16, 2007. We review these investments for impairment whenever certain indicators are present suggesting that the carrying value of an investment is not recoverable. This analysis requires a significant amount of judgment to identify events or circumstances indicating that an investment may be impaired. Once an impairment indicator is identified, we must determine if an impairment exists, and if so, whether the impairment is other than temporary, in which case the investment would be written down to its estimated fair value.
Impairment of Long Lived Assets and Other Intangible Assets
We assess the recoverability of long-lived assets and finite-lived intangible assets whenever events or changes in circumstances indicate that we may not be able to recover the asset's carrying amount. Such events or circumstances include, but are not limited to, a significant decrease in the fair value of the underlying business or a change in utilization of property and equipment.
We group assets to test for impairment at the lowest level for which identifiable cash flows are largely independent of the cash flows of other groups of assets and liabilities. These levels are dependent upon an asset's usage, which may be on an individual asset level or aggregated at a higher level including a region-wide grouping. The metal flow and management of supply within our regions creates an interdependency of the plants within a region on one another to generate cash flows. Accordingly, under normal operating conditions, our assets are grouped on a region-wide basis for impairment testing. Any expected change in usage, retirement, disposal or sale of an individual asset or group of assets below the region level which would generate a separate cash flow stream outside of normal operations could result in grouping assets below the region level for impairment testing.
57
When evaluating long-lived assets and finite-lived intangible assets for potential impairment, we first compare the carrying value of the asset to the asset's estimated future net cash flows (undiscounted and without interest charges). If the estimated future net cash flows are less than the carrying value of the asset, we calculate and recognize an impairment loss. If we recognize an impairment loss, the carrying amount of the asset is adjusted to fair value based on the discounted estimated future net cash flows and will be its new cost basis. For a depreciable long-lived asset, the new cost basis will be depreciated over the remaining useful life of that asset. For an amortizable intangible asset, the new cost basis will be amortized over the remaining useful life of the asset.
Our impairment loss calculations require management to apply judgments in estimating future cash flows to determine asset fair values, including forecasting useful lives of the assets and selecting the discount rate that represents the risk inherent in future cash flows. Impairment charges are recorded in "Restructuring and impairment, net" in our consolidated statement of operations. For the year ended March 31, 2015 , we recorded impairment charges on long-lived assets and intangible assets of $2 million of certain non core assets in North America. For the year ended March 31, 2014 , we recorded impairment charges on long-lived assets and intangible assets of $19 million which included $17 million related to certain non-core assets in Brazil and $2 million on other assets in North America. For the year ended March 31, 2013 , we recorded impairment charges of $4 million related to our exit from the Evermore joint venture, the closure of an aluminum smelter line in Ouro Preto, Brazil, and other long-lived assets.
Our other intangible assets of $584 million as of March 31, 2015 consist of tradenames, technology and software, customer relationships and favorable energy and supply contracts and are amortized over an original period of 3 to 20 years. As of March 31, 2015 , we do not have any other intangible assets with indefinite useful lives, other than Goodwill. We recorded an impairment of $5 million for the year ended March 31, 2014 related to certain capitalized software assets. No impairments of intangible assets were identified during the year ended March 31, 2013.
If actual results are not consistent with our assumptions and judgments used in estimating future cash flows and asset fair values, we may be exposed to additional impairment losses that could be material to our results of operations.
Pension and Other Postretirement Plans
We account for our pensions and other postretirement benefits in accordance with ASC 715, Compensation - Retirement Benefits (ASC 715). Liabilities and expense for pension plans and other postretirement benefits are determined using actuarial methodologies and incorporate significant assumptions, including the rate used to discount the future estimated liability, the long-term rate of return on plan assets, and several assumptions related to the employee workforce (compensation increases, health care cost trend rates, expected service period, retirement age, and mortality). These assumptions bear the risk of change as they require significant judgment and they have inherent uncertainties that management may not be able to control.
The actuarial models use an attribution approach that generally spreads the financial impact of changes to the plan and actuarial assumptions over the average remaining service lives of the employees in the plan. The principle underlying the required attribution approach is that employees render service over their average remaining service lives on a relatively smooth basis and, therefore, the accounting for benefits earned under the pension or non-pension postretirement benefits plans should follow the same relatively smooth pattern. Changes in the liability due to changes in actuarial assumptions such as discount rate, rate of compensation increases and mortality, as well as annual deviations between what was assumed and what was experienced by the plan are treated as actuarial gains or losses. The gains and losses are initially recorded to "Other comprehensive income" and are subsequently amortized over periods of 15 years or less, which represent the group's average future service life of the employees or the group's average life expectancy.
The most significant assumption used to calculate pension and other postretirement obligations is the discount rate used to determine the present value of benefits. The discount rate is based on spot rate yield curves and individual bond matching models for pension and other postretirement plans in Canada, the United States, United Kingdom, and other Euro zone countries, and on published long-term high quality corporate bond indices in other countries with adjustments made to the index rates based on the duration of the plans' obligations for each country, at the end of each fiscal year. This bond matching approach matches the bond yields with the year-to-year cash flow projections from the actuarial valuation to determine a discount rate that more accurately reflects the timing of the expected payments. The weighted average discount rate used to determine the pension benefit obligation was 3.1% , 4.0% , and 3.9% , and other postretirement benefit obligation was 3.6% , 4.1% and 3.8% as of March 31, 2015 , 2014 , and 2013 , respectively. The weighted average discount rate used to determine the net periodic benefit cost is the rate used to determine the benefit obligation at the end of the previous fiscal year.
58
As of March 31, 2015 , an increase in the discount rate of 0.5%, assuming inflation remains unchanged, would result in a decrease of $147 million in the pension and other postretirement obligations and in a pre-tax decrease of $9 million in the net periodic benefit cost in the following year. A decrease in the discount rate of 0.5% as of March 31, 2015 , assuming inflation remains unchanged, would result in an increase of $163 million in the pension and other postretirement obligations and in a pre-tax increase of $20 million in the net periodic benefit cost in the following year.
The long term expected return on plan assets is based upon historical experience, expected future performance as well as current and projected investment portfolio diversification. The weighted average expected return on plan assets was 6.1% for 2015 , 6.3% for 2014 , and 6.4% for 2013 . The expected return on assets is a long-term assumption whose accuracy can only be measured over a long period based on past experience. A variation in the expected return on assets of 0.5% as of March 31, 2015 would result in a pre-tax variation of approximately $6 million in the net periodic benefit cost in the following year.
Income Taxes
We account for income taxes using the asset and liability method. Under the asset and liability method, deferred tax assets and liabilities are recognized for the estimated future tax consequences attributable to differences between the financial statement carrying amounts of existing assets and liabilities and their respective tax bases. In addition, deferred tax assets are also recorded with respect to net operating losses and other tax attribute carryforwards. Deferred tax assets and liabilities are measured using enacted tax rates in effect for the year in which those temporary differences are expected to be recovered or settled. Valuation allowances are established when realization of the benefit of deferred tax assets is not deemed to be more likely than not. The effect on deferred tax assets and liabilities of a change in tax rates is recognized in income in the period that includes the enactment date.
We considered all available evidence, both positive and negative, in determining the appropriate amount of the valuation allowance against our deferred tax assets as of March 31, 2015 . In evaluating the need for a valuation allowance, we consider all potential sources of taxable income, including income available in carryback periods, future reversals of taxable temporary differences, projections of taxable income, and income from tax planning strategies, as well as any other available and relevant information. Positive evidence includes factors such as a history of profitable operations, projections of future profitability within the carryforward period and potential income from prudent and feasible tax planning strategies. Negative evidence includes items such as cumulative losses, projections of future losses, and carryforward periods that are not long enough to allow for the utilization of the deferred tax asset based on existing projections of income. In certain jurisdictions, deferred tax assets related to loss carryforwards and other temporary differences exist without a valuation allowance where in our judgment the weight of the positive evidence more than offsets the negative evidence.
Upon changes in facts and circumstances, we may conclude that certain deferred tax assets for which no valuation allowance is currently recorded may not be realizable in future periods, resulting in a charge to income. Existing valuation allowances are re-examined under the same standards of positive and negative evidence. If it is determined that it is more likely than not that a deferred tax asset will be realized, the appropriate amount of the valuation allowance, if any, is released, in the period this determination is made.
As of March 31, 2015 , the Company concluded that valuation allowances totaling $528 million were required against its deferred tax assets comprised of the following:
• | $381 million of the valuation allowance relates to loss carryforwards in Canada and certain foreign jurisdictions, $53 million relates to New York tax credit carryforwards, and $46 million relates to tax credit carryforwards in Canada. |
• | $48 million of the valuation allowance relates to other deferred tax assets originating from temporary differences in Canada and certain foreign jurisdictions. |
In determining these amounts, the Company considered the reversal of existing temporary differences as a source of taxable income. The ultimate realization of the remaining deferred tax assets is contingent on the Company's ability to generate future taxable income within the carryforward period and within the period in which the temporary differences become deductible. Due to the history of negative earnings in these jurisdictions and future projections of losses, the Company believes it is more likely than not the deferred tax assets will not be realized prior to expiration.
59
Through March 31, 2015 , the Company recognized deferred tax assets related to loss carryforwards and other temporary items of approximately $507 million . The Company determined that existing taxable temporary differences will reverse within the same period and jurisdiction, and are of the same character as the deductible temporary items generating sufficient taxable income to support realization of $382 million of these deferred tax assets. Realization of the remaining $125 million of deferred tax assets is dependent on our ability to earn pretax income aggregating approximately $445 million in those jurisdictions to realize those deferred tax assets. The realization of our deferred tax assets is not dependent on tax planning strategies.
By their nature, tax laws are often subject to interpretation. Further complicating matters is that in those cases where a tax position is open to interpretation, differences of opinion can result in differing conclusions as to the amount of tax benefits to be recognized under ASC 740, Income Taxes . We utilize a two-step approach for evaluating tax positions. Recognition (Step 1) occurs when we conclude that a tax position, based solely on its technical merits, is more likely than not to be sustained upon examination. Measurement (Step 2) is only addressed if Step 1 has been satisfied. Under Step 2, we measure the tax benefit as the largest amount of benefit, determined on a cumulative probability basis that is more likely than not to be realized upon ultimate settlement. Consequently, the level of evidence and documentation necessary to support a position prior to being given recognition and measurement within the financial statements is a matter of judgment that depends on all available evidence.
Assessment of Loss Contingencies
We have legal and other contingencies, including environmental liabilities, which could result in significant losses upon the ultimate resolution of such contingencies. Environmental liabilities that are not legal asset retirement obligations are accrued on an undiscounted basis when it is probable that a liability exists for past events.
We have provided for losses in situations where we have concluded that it is probable that a loss has been or will be incurred and the amount of the loss is reasonably estimable. A significant amount of judgment is involved in determining whether a loss is probable and reasonably estimable due to the uncertainty involved in determining the likelihood of future events and estimating the financial statement impact of such events. If further developments or resolution of a contingent matter are not consistent with our assumptions and judgments, we may need to recognize a significant charge in a future period related to an existing contingency.
RECENTLY ISSUED ACCOUNTING STANDARDS
See Note 1 - Business and Summary of Significant Accounting Policies to our accompanying audited consolidated financial statements for a full description of recent accounting pronouncements including the respective expected dates of adoption and expected effects on results of operations and financial condition.
60
NON-GAAP FINANCIAL MEASURES
Total "Segment income" presents the sum of the results of our four operating segments on a consolidated basis. We believe that total "Segment income" is an operating performance measure that measures operating results unaffected by differences in capital structures, capital investment cycles and ages of related assets among otherwise comparable companies. In reviewing our corporate operating results, we also believe it is important to review the aggregate consolidated performance of all of our segments on the same basis we review the performance of each of our regions and to draw comparisons between periods based on the same measure of consolidated performance.
Management believes investors' understanding of our performance is enhanced by including this non-GAAP financial measure as a reasonable basis for comparing our ongoing results of operations. Many investors are interested in understanding the performance of our business by comparing our results from ongoing operations from one period to the next and would ordinarily add back items that are not part of normal day-to-day operations of our business. By providing total "Segment income," together with reconciliations, we believe we are enhancing investors' understanding of our business and our results of operations, as well as assisting investors in evaluating how well we are executing strategic initiatives.
However, total "Segment income" is not a measurement of financial performance under U.S. GAAP, and our total "Segment income" may not be comparable to similarly titled measures of other companies. Total "Segment income" has important limitations as an analytical tool and should not be considered in isolation or as a substitute for analysis of our results as reported under U.S. GAAP. For example, total "Segment income":
• | does not reflect the company's cash expenditures or requirements for capital expenditures or capital commitments; |
• | does not reflect changes in, or cash requirements for, the company's working capital needs; and |
• | does not reflect any costs related to the current or future replacement of assets being depreciated and amortized. |
We also use total "Segment income":
• | as a measure of operating performance to assist us in comparing our operating performance on a consistent basis because it removes the impact of items not directly resulting from our core operations; |
• | for planning purposes, including the preparation of our internal annual operating budgets and financial projections; |
• | to evaluate the performance and effectiveness of our operational strategies; and |
• | as a basis to calculate incentive compensation payments for our key employees. |
Total "Segment income" is equivalent to our Adjusted EBITDA, which we refer to in our earnings announcements and other external presentations to analysts and investors.
"Free cash flow" consists of: (a) net cash provided by (used in) operating activities; (b) plus net cash provided by (used in) investing activities and (c) less proceeds from sales of assets, net of transaction fees and hedging. Management believes "Free cash flow" is relevant to investors as it provides a measure of the cash generated internally that is available for debt service and other value creation opportunities. However, "Free cash flow" is not a measurement of financial performance or liquidity under U.S. GAAP and does not necessarily represent cash available for discretionary activities, as certain debt service obligations must be funded out of "Free cash flow." In addition, the company's method of calculating "Free cash flow" may not be consistent with that of other companies.
61
Item 7A. Quantitative and Qualitative Disclosures About Market Risk
We are exposed to certain market risks as part of our ongoing business operations, including risks from changes in commodity prices (primarily LME aluminum prices and natural gas), local market premiums, electricity rates, foreign currency exchange rates and interest rates that could impact our results of operations and financial condition. We manage our exposure to these and other market risks through regular operating and financing activities and derivative financial instruments. We use derivative financial instruments as risk management tools only, and not for speculative purposes.
By their nature, all derivative financial instruments involve risk, including the credit risk of non-performance by counterparties. All derivative contracts are executed with counterparties that, in our judgment, are creditworthy. Our maximum potential loss may exceed the amount recognized in the accompanying March 31, 2015 consolidated balance sheet.
The decision of whether and when to execute derivative instruments, along with the duration of the instrument, can vary from period to period depending on market conditions and the relative costs of the instruments. The duration is linked to the timing of the underlying exposure, with the connection between the two being regularly monitored.
The market risks we are exposed to as part of our ongoing business operations are materially consistent with our risk exposures in the prior year, as we have not entered into any new material hedging programs.
Commodity Price Risks
We have commodity price risk with respect to purchases of certain raw materials including aluminum, electricity, natural gas and transport fuel.
Aluminum
A significant amount of our business is conducted under a conversion model, which allows us to pass through increases or decreases in the price of aluminum to our customers. Nearly all of our flat-rolled products have a price structure with three components: (i) a base aluminum price quoted off the LME; (ii) local market premiums; and (iii) a "conversion premium" to produce the rolled product which reflects, among other factors, the competitive market conditions for that product. Base aluminum prices are typically driven by macroeconomic factors and global supply and demand of aluminum. The local market premiums tend to vary based on the supply and demand for metal in a particular region and associated transportation costs.
Increases or decreases in the average price of aluminum based on the LME directly impact "Net sales," "Cost of goods sold (exclusive of depreciation and amortization)" and working capital. The timing of these impacts varies based on contractual arrangements with customers and metal suppliers in each region. These timing impacts are referred to as metal price lag. Metal price lag exists due to: 1) certain customer contracts containing fixed forward price commitments which result in exposure to changes in metal prices for the period of time between when our sales price fixes and the sale actually occurs, and 2) the period of time between the pricing of our purchases of metal, holding and processing the metal, and the pricing of the sale of finished inventory to our customers.
We use derivative instruments to preserve our conversion margins and manage the timing differences associated with metal price lag. We use over-the-counter derivatives indexed to the London Metals Exchange (LME) and from time to time we also use over-the-counter derivatives indexed to the Midwest transaction premium (collectively referred to as our "aluminum derivative contracts") to reduce our exposure to fluctuating metal prices associated with the period of time between the pricing of our purchases of inventory and the pricing of the sale of that inventory to our customers. We also purchase forward LME aluminum contracts simultaneous with our sales contracts with customers that contain fixed metal prices. These LME aluminum forward contracts directly hedge the economic risk of future metal price fluctuations to ensure we sell metal for the same price at which we purchase metal.
Sensitivities
The following table presents the estimated potential effect on the fair values of these derivative instruments as of March 31, 2015 , given a 10% increase in prices.
| Change in |
| Change in | |||
LME aluminum | 10 | % |
| $ | (56 | ) |
62
Energy
We use several sources of energy in the manufacturing and delivery of our aluminum rolled products. For the year ended March 31, 2015 , natural gas and electricity represented approximately 97% of our energy consumption by cost. We also use fuel oil and transport fuel. The majority of energy usage occurs at our casting centers and during the hot rolling of aluminum. Prior to the smelter facilities in South America ceasing operations, our smelter operations also required a significant amount of energy. Our cold rolling facilities require relatively less energy.
We purchase our natural gas on the open market, subjecting us to market price fluctuations. We seek to stabilize our future exposure to natural gas prices through the use of forward purchase contracts.
A portion of our electricity requirements are purchased pursuant to long-term contracts in the local regions in which we operate. A number of our facilities are located in regions with regulated prices, which affords relatively stable costs. In North America, we have entered into an electricity swap to fix a portion of the cost of our electricity requirements.
Fluctuating energy costs worldwide, due to the changes in supply and international and geopolitical events, expose us to earnings volatility as changes in such costs cannot be immediately recovered under existing contracts and sales agreements, and may only be mitigated in future periods under future pricing arrangements.
Sensitivities
The following table presents the estimated potential effect on the fair values of these derivative instruments as of March 31, 2015 , given a 10% decline in spot prices for energy contracts ($ in millions).
|
| Change in Price |
| Change in Fair Value | |||
Electricity |
| (10 | )% |
| $ | - | |
Natural Gas |
| (10 | )% |
| (2 | ) | |
Foreign Currency Exchange Risks
Exchange rate movements, particularly the Euro, the Brazilian real and the Korean won against the U.S. dollar, have an impact on our operating results. In Europe, where we have predominantly local currency selling prices and operating costs, we benefit as the Euro strengthens, but are adversely affected as the Euro weakens. In South Korea, where we have local currency operating costs and U.S. dollar denominated selling prices for exports, we benefit as the won weakens but are adversely affected as the won strengthens. In Brazil, where we have predominately U.S. dollar selling prices and local currency operating costs, we benefit as the real weakens, but are adversely affected as the real strengthens. Foreign currency contracts may be used to hedge the economic exposures at our foreign operations.
It is our policy to minimize exposures from non-functional currency denominated transactions within each of our operating segments. As such, the majority of our foreign currency exposures are from either forecasted net sales or forecasted purchase commitments in non-functional currencies. Our most significant non-U.S. dollar functional currency operations have the Euro and the Korean won as their functional currencies, respectively. Our Brazilian operations are U.S. dollar functional.
We also face translation risks related to the changes in foreign currency exchange rates which are generally not hedged. Amounts invested in these foreign operations are translated into U.S. dollars at the exchange rates in effect at the balance sheet date. The resulting translation adjustments are recorded as a component of "Accumulated other comprehensive (loss) income" in the Shareholder's (deficit) equity section of the accompanying consolidated balance sheets. Net sales and expenses at these non-U.S. dollar functional currency entities are translated into varying amounts of U.S. dollars depending upon whether the U.S. dollar weakens or strengthens against other currencies. Therefore, changes in exchange rates may either positively or negatively affect our net sales and expenses as expressed in U.S. dollars.
Any negative impact of currency movements on the currency contracts we have entered into to hedge foreign currency commitments to purchase or sell goods and services would be offset by an approximately equal and opposite favorable exchange impact on the commitments being hedged. For a discussion of accounting policies and other information relating to currency contracts, see Note 1 - Business and Summary of Significant Accounting Policies and Note 15 - Financial Instruments and Commodity Contracts.
63
Sensitivities
The following table presents the estimated potential effect on the fair values of these derivative instruments as of March 31, 2015 , given a 10% change in rates ($ in millions).
|
| Change in Exchange Rate |
| Change in Fair Value | |||
Currency measured against the U.S. dollar |
|
|
|
| |||
Brazilian real |
| (10 | )% |
| $ | (24 | ) |
Euro |
| 10 | % |
| (27 | ) | |
Korean won |
| (10 | )% |
| (40 | ) | |
Canadian dollar |
| (10 | )% |
| (3 | ) | |
British pound |
| (10 | )% |
| (4 | ) | |
Swiss franc |
| (10 | )% |
| (22 | ) | |
Chinese yuan |
| (10 | )% |
| (1 | ) | |
Interest Rate Risks
We use interest rate swaps to manage our exposure to changes in benchmark interest rates which impact our variable-rate debt.
Our Term Loan Facility is a floating rate obligation with a floor feature. Our interest rate paid is a spread of 2.75% plus the higher of LIBOR or 100 basis points (1% floor). As of March 31, 2015 , this floor feature was in effect, which resulted in an interest rate of 3.75%. Due to the floor feature of the Term Loan Facility as of March 31, 2015 , a 10 basis point increase or decrease in LIBOR interest rates would have had no impact on our annual pre-tax income. To be above the Term Loan Facility floor, future interest rates would have to increase by 73 basis points (bp).
From time to time, we have used interest rate swaps to manage our debt cost. As of March 31, 2015 , there were no USD LIBOR based interest rate swaps outstanding.
In Korea, we periodically enter into interest rate swaps to fix the interest rate on various floating rate debt in order to manage our exposure to changes in the 3M-CD interest rate. See Note 15- Financial Instruments and Commodity Contracts for further information on the amounts outstanding as of March 31, 2015 .
Sensitivities
The following table presents the estimated potential effect on the fair values of these derivative instruments as of March 31, 2015 , given a 100 bps negative shift in the benchmark interest rate ($ in millions).
| Change in Rate |
|
| Change in Fair Value | |||
Interest Rate Contracts |
|
|
|
| |||
Asia – KRW-CD-3200 | (100 | ) | bps |
| $ | - | |
64
Item 8. Financial Statements and Supplementary Data
TABLE OF CONTENTS
|
|
Management's Report on Internal Control over Financial Reporting | 66 |
Report of Independent Registered Public Accounting Firm | 67 |
Consolidated Statements of Operations | 68 |
Consolidated Statements of Comprehensive Income (Loss) | 69 |
Consolidated Balance Sheets | 70 |
Consolidated Statements of Cash Flows | 71 |
Consolidated Statements of Shareholder's (Deficit) Equity | 72 |
Notes to the Consolidated Financial Statements | 73 |
65
Management's Report on Internal Control over Financial Reporting
Management is responsible for establishing and maintaining adequate internal control over financial reporting as defined in Rule 13a-15(f) under the Exchange Act, as amended. The Company's internal control over financial reporting is designed to provide reasonable assurance as to the reliability of the Company's financial reporting and the preparation of financial statements in accordance with U.S. GAAP. Our internal control over financial reporting includes those policies and procedures that:
• | Pertain to the maintenance of records that in reasonable detail accurately and fairly reflect the transactions and dispositions of the assets of the Company; |
• | Provide reasonable assurance that transactions are recorded as necessary to permit preparation of financial statements in accordance with U.S. GAAP, and that receipts and expenditures of the Company are being made only in accordance with authorizations of management and directors of the Company; and |
• | Provide reasonable assurance regarding prevention or timely detection of unauthorized acquisition, use or disposition of the Company's assets that could have a material effect on the Company's consolidated financial statements. |
Because of its inherent limitations, internal control over financial reporting may not prevent or detect misstatements. Also, projections of any evaluation of effectiveness to future periods are subject to the risk that controls may become inadequate because of changes in conditions, or that the degree of compliance with the policies or procedures may deteriorate.
Management has assessed the effectiveness of the Company's internal control over financial reporting as of March 31, 2015 . In making this assessment, management used the criteria established by the Committee of Sponsoring Organizations of the Treadway Commission (COSO) in "Internal Control - Integrated Framework (2013)." Based on its assessment, management has concluded that, as of March 31, 2015 , the Company's internal control over financial reporting was effective based on those criteria.
The effectiveness of the Company's internal control over financial reporting as of March 31, 2015 has been audited by PricewaterhouseCoopers LLP, an independent registered public accounting firm, as stated in their report which appears herein.
/s/ Steven Fisher
Steven Fisher
Interim President and Chief Executive Officer;
Senior Vice President and Chief Financial Officer
May 12, 2015
66
Report of Independent Registered Public Accounting Firm
To the Board of Directors and Shareholder of Novelis Inc.:
In our opinion, the accompanying consolidated balance sheets and the related consolidated statements of operations, comprehensive income (loss), shareholder's (deficit) equity and cash flows present fairly, in all material respects, the financial position of Novelis Inc. and its subsidiaries at March 31, 2015 and March 31, 2014 , and the results of their operations and their cash flows for each of the three years in the period ended March 31, 2015 in conformity with accounting principles generally accepted in the United States of America. Also in our opinion, the Company maintained, in all material respects, effective internal control over financial reporting as of March 31, 2015 , based on criteria established in Internal Control - Integrated Framework (2013) issued by the Committee of Sponsoring Organizations of the Treadway Commission (COSO). The Company's management is responsible for these financial statements, for maintaining effective internal control over financial reporting and for its assessment of the effectiveness of internal control over financial reporting, included in the accompanying Management's Report on Internal Control over Financial Reporting. Our responsibility is to express opinions on these financial statements and on the Company's internal control over financial reporting based on our integrated audits. We conducted our audits in accordance with the standards of the Public Company Accounting Oversight Board (United States). Those standards require that we plan and perform the audits to obtain reasonable assurance about whether the financial statements are free of material misstatement and whether effective internal control over financial reporting was maintained in all material respects. Our audits of the financial statements included examining, on a test basis, evidence supporting the amounts and disclosures in the financial statements, assessing the accounting principles used and significant estimates made by management, and evaluating the overall financial statement presentation. Our audit of internal control over financial reporting included obtaining an understanding of internal control over financial reporting, assessing the risk that a material weakness exists, and testing and evaluating the design and operating effectiveness of internal control based on the assessed risk. Our audits also included performing such other procedures as we considered necessary in the circumstances. We believe that our audits provide a reasonable basis for our opinions.
A company's internal control over financial reporting is a process designed to provide reasonable assurance regarding the reliability of financial reporting and the preparation of financial statements for external purposes in accordance with generally accepted accounting principles. A company's internal control over financial reporting includes those policies and procedures that (i) pertain to the maintenance of records that, in reasonable detail, accurately and fairly reflect the transactions and dispositions of the assets of the company; (ii) provide reasonable assurance that transactions are recorded as necessary to permit preparation of financial statements in accordance with generally accepted accounting principles, and that receipts and expenditures of the company are being made only in accordance with authorizations of management and directors of the company; and (iii) provide reasonable assurance regarding prevention or timely detection of unauthorized acquisition, use, or disposition of the company's assets that could have a material effect on the financial statements.
Because of its inherent limitations, internal control over financial reporting may not prevent or detect misstatements. Also, projections of any evaluation of effectiveness to future periods are subject to the risk that controls may become inadequate because of changes in conditions, or that the degree of compliance with the policies or procedures may deteriorate.
/s/ PricewaterhouseCoopers LLP
Atlanta, Georgia
May 12, 2015
67
Novelis Inc.
CONSOLIDATED STATEMENTS OF OPERATIONS
(In millions)
|
| Year Ended March 31, | ||||||||||
|
| 2015 |
| 2014 |
| 2013 | ||||||
Net sales |
| $ | 11,147 | |
| $ | 9,767 | |
| $ | 9,812 | |
Cost of goods sold (exclusive of depreciation and amortization) |
| 9,793 | |
| 8,468 | |
| 8,477 | | |||
Selling, general and administrative expenses |
| 427 | |
| 461 | |
| 398 | | |||
Depreciation and amortization |
| 352 | |
| 334 | |
| 292 | | |||
Research and development expenses |
| 50 | |
| 45 | |
| 46 | | |||
Interest expense and amortization of debt issuance costs |
| 326 | |
| 304 | |
| 298 | | |||
Gain on assets held for sale, net |
| (22 | ) |
| (6 | ) |
| (3 | ) | |||
Loss on extinguishment of debt |
| - | |
| - | |
| 7 | | |||
Restructuring and impairment, net |
| 37 | |
| 75 | |
| 47 | | |||
Equity in net loss of non-consolidated affiliates |
| 5 | |
| 12 | |
| 16 | | |||
Other expense (income), net |
| 17 | |
| (41 | ) |
| (52 | ) | |||
|
| 10,985 | |
| 9,652 | |
| 9,526 | | |||
Income before income taxes |
| 162 | |
| 115 | |
| 286 | | |||
Income tax provision |
| 14 | |
| 11 | |
| 83 | | |||
Net income |
| 148 | |
| 104 | |
| 203 | | |||
Net income attributable to noncontrolling interests |
| - | |
| - | |
| 1 | | |||
Net income attributable to our common shareholder |
| $ | 148 | |
| $ | 104 | |
| $ | 202 | |
See accompanying notes to the consolidated financial statements.
68
Novelis Inc.
CONSOLIDATED STATEMENTS OF COMPREHENSIVE INCOME (LOSS)
(In millions)
|
| Year Ended March 31, | ||||||||||
|
| 2015 |
| 2014 |
| 2013 | ||||||
Net income |
| $ | 148 | |
| $ | 104 | |
| $ | 203 | |
Other comprehensive (loss) income: |
|
|
|
|
|
| ||||||
Currency translation adjustment |
| (304 | ) |
| 120 | |
| (53 | ) | |||
Change in fair value of effective portion of hedges, net |
| (44 | ) |
| (21 | ) |
| 5 | | |||
Change in pension and other benefits, net |
| (209 | ) |
| 120 | |
| (44 | ) | |||
Other comprehensive (loss) income before income tax effect |
| (557 | ) |
| 219 | |
| (92 | ) | |||
Income tax (benefit) provision related to items of other comprehensive (loss) income |
| (72 | ) |
| 44 | |
| (15 | ) | |||
Other comprehensive (loss) income, net of tax |
| (485 | ) |
| 175 | |
| (77 | ) | |||
Comprehensive (loss) income |
| $ | (337 | ) |
| $ | 279 | |
| $ | 126 | |
Less: Comprehensive (loss) income attributable to noncontrolling interest, net of tax |
| (15 | ) |
| (2 | ) |
| 1 | | |||
Comprehensive (loss) income attributable to our common shareholder |
| $ | (322 | ) |
| $ | 281 | |
| $ | 125 | |
See accompanying notes to the consolidated financial statements.
69
Novelis Inc.
CONSOLIDATED BALANCE SHEETS
(In millions, except number of shares) |
| March 31, | ||||||
|
| 2015 |
| 2014 | ||||
ASSETS |
|
|
|
| ||||
Current assets |
|
|
|
| ||||
Cash and cash equivalents |
| $ | 628 | |
| $ | 509 | |
Accounts receivable, net |
|
|
|
| ||||
- third parties (net of uncollectible accounts of $3 and $4 as of March 31, 2015 and 2014, respectively) |
| 1,289 | |
| 1,382 | | ||
- related parties |
| 53 | |
| 54 | | ||
Inventories |
| 1,431 | |
| 1,173 | | ||
Prepaid expenses and other current assets |
| 112 | |
| 101 | | ||
Fair value of derivative instruments |
| 77 | |
| 51 | | ||
Deferred income tax assets |
| 79 | |
| 101 | | ||
Assets held for sale |
| 6 | |
| 102 | | ||
Total current assets |
| 3,675 | |
| 3,473 | | ||
Property, plant and equipment, net |
| 3,542 | |
| 3,513 | | ||
Goodwill |
| 607 | |
| 611 | | ||
Intangible assets, net |
| 584 | |
| 640 | | ||
Investment in and advances to non–consolidated affiliates |
| 447 | |
| 612 | | ||
Deferred income tax assets |
| 95 | |
| 80 | | ||
Other long–term assets |
|
|
|
| ||||
- third parties |
| 137 | |
| 173 | | ||
- related parties |
| 15 | |
| 12 | | ||
Total assets |
| $ | 9,102 | |
| $ | 9,114 | |
LIABILITIES AND SHAREHOLDER'S (DEFICIT) EQUITY |
|
|
|
| ||||
Current liabilities |
|
|
|
| ||||
Current portion of long–term debt |
| $ | 108 | |
| $ | 92 | |
Short–term borrowings |
| 846 | |
| 723 | | ||
Accounts payable |
|
|
|
| ||||
- third parties |
| 1,854 | |
| 1,418 | | ||
- related parties |
| 44 | |
| 53 | | ||
Fair value of derivative instruments |
| 149 | |
| 60 | | ||
Accrued expenses and other current liabilities |
|
|
|
| ||||
- third parties |
| 572 | |
| 547 | | ||
- related party |
| - | |
| 250 | | ||
Deferred income tax liabilities |
| 20 | |
| 16 | | ||
Liabilities held for sale |
| - | |
| 11 | | ||
Total current liabilities |
| 3,593 | |
| 3,170 | | ||
Long–term debt, net of current portion |
| 4,349 | |
| 4,359 | | ||
Deferred income tax liabilities |
| 261 | |
| 425 | | ||
Accrued postretirement benefits |
| 748 | |
| 621 | | ||
Other long–term liabilities |
| 221 | |
| 271 | | ||
Total liabilities |
| 9,172 | |
| 8,846 | | ||
Commitments and contingencies |
| | |
| | | ||
Shareholder's (deficit) equity |
|
|
|
| ||||
Common stock, no par value; unlimited number of shares authorized; 1,000 shares issued and outstanding as of March 31, 2015 and 2014 |
| - | |
| - | | ||
Additional paid–in capital |
| 1,404 | |
| 1,404 | | ||
Accumulated deficit |
| (925 | ) |
| (1,073 | ) | ||
Accumulated other comprehensive loss |
| (561 | ) |
| (91 | ) | ||
Total (deficit) equity of our common shareholder |
| (82 | ) |
| 240 | | ||
Noncontrolling interests |
| 12 | |
| 28 | | ||
Total (deficit) equity |
| (70 | ) |
| 268 | | ||
Total liabilities and (deficit) equity |
| $ | 9,102 | |
| $ | 9,114 | |
See accompanying notes to the consolidated financial statements.
70
Novelis Inc.
CONSOLIDATED STATEMENTS OF CASH FLOWS
(In millions)
|
| Year Ended March 31, | ||||||||||
|
| 2015 |
| 2014 |
| 2013 | ||||||
OPERATING ACTIVITIES |
|
|
|
|
|
| ||||||
Net income |
| $ | 148 | |
| $ | 104 | |
| $ | 203 | |
Adjustments to determine net cash provided by operating activities: |
|
|
|
|
|
| ||||||
Depreciation and amortization |
| 352 | |
| 334 | |
| 292 | | |||
Loss (gain) on unrealized derivatives and other realized derivatives in investing activities, net |
| 39 | |
| (3 | ) |
| (28 | ) | |||
Gain on assets held for sale, net |
| (22 | ) |
| (6 | ) |
| (3 | ) | |||
Loss on sale of assets |
| 5 | |
| 9 | |
| 6 | | |||
Impairment charges |
| 7 | |
| 24 | |
| 4 | | |||
Loss on extinguishment of debt |
| - | |
| - | |
| 7 | | |||
Deferred income taxes |
| (88 | ) |
| (129 | ) |
| (31 | ) | |||
Amortization of fair value adjustments, net |
| 10 | |
| 12 | |
| 12 | | |||
Equity in net loss of non-consolidated affiliates |
| 5 | |
| 12 | |
| 16 | | |||
(Gain) loss on foreign exchange remeasurement of debt |
| (5 | ) |
| (2 | ) |
| 8 | | |||
Amortization of debt issuance costs and carrying value adjustments |
| 25 | |
| 26 | |
| 27 | | |||
Other, net |
| 1 | |
| (4 | ) |
| 1 | | |||
Changes in assets and liabilities including assets and liabilities held for sale (net of effects from divestitures): |
|
|
|
|
|
| ||||||
Accounts receivable |
| (54 | ) |
| 106 | |
| (121 | ) | |||
Inventories |
| (390 | ) |
| 17 | |
| (160 | ) | |||
Accounts payable |
| 578 | |
| 159 | |
| 6 | | |||
Other current assets |
| (27 | ) |
| - | |
| (36 | ) | |||
Other current liabilities |
| 66 | |
| 32 | |
| 28 | | |||
Other noncurrent assets |
| 7 | |
| (9 | ) |
| (10 | ) | |||
Other noncurrent liabilities |
| (53 | ) |
| 20 | |
| (18 | ) | |||
Net cash provided by operating activities |
| 604 | |
| 702 | |
| 203 | | |||
INVESTING ACTIVITIES |
|
|
|
|
|
| ||||||
Capital expenditures |
| (518 | ) |
| (717 | ) |
| (775 | ) | |||
Proceeds from sales of assets, third party, net of transaction fees and hedging |
| 117 | |
| 8 | |
| 19 | | |||
Proceeds from the sale of assets, related party, net of transaction fees |
| - | |
| 8 | |
| 2 | | |||
(Outflows) proceeds from investments in and advances to non-consolidated affiliates, net |
| (20 | ) |
| (16 | ) |
| 3 | | |||
Proceeds from settlement of other undesignated derivative instruments, net |
| 5 | |
| 15 | |
| 4 | | |||
Net cash used in investing activities |
| (416 | ) |
| (702 | ) |
| (747 | ) | |||
FINANCING ACTIVITIES |
|
|
|
|
|
| ||||||
Proceeds from issuance of long-term and short-term borrowings |
| 362 | |
| 169 | |
| 319 | | |||
Principal payments of long-term and short-term borrowings |
| (324 | ) |
| (164 | ) |
| (97 | ) | |||
Revolving credit facilities and other, net |
| 160 | |
| 208 | |
| 332 | | |||
Return of capital to our common shareholder |
| (250 | ) |
| - | |
| - | | |||
Dividends, noncontrolling interest |
| (1 | ) |
| - | |
| (2 | ) | |||
Acquisition of noncontrolling interest in Novelis Korea Ltd. |
| - | |
| - | |
| (9 | ) | |||
Debt issuance costs |
| (3 | ) |
| (8 | ) |
| (8 | ) | |||
Net cash (used in) provided by financing activities |
| (56 | ) |
| 205 | |
| 535 | | |||
Net increase (decrease) in cash and cash equivalents |
| 132 | |
| 205 | |
| (9 | ) | |||
Effect of exchange rate changes on cash |
| (13 | ) |
| 3 | |
| (7 | ) | |||
Cash and cash equivalents - beginning of period |
| 509 | |
| 301 | |
| 317 | | |||
Cash and cash equivalents - end of period |
| $ | 628 | |
| $ | 509 | |
| $ | 301 | |
See accompanying notes to the consolidated financial statements.
71
Novelis Inc.
CONSOLIDATED STATEMENTS OF SHAREHOLDER'S (DEFICIT) EQUITY
(In millions, except number of shares)
|
| (Deficit) Equity of our Common Shareholder |
|
|
|
| |||||||||||||||||||||
|
| Common Stock |
|
|
|
|
|
|
|
|
|
| |||||||||||||||
|
| Shares |
| Amount |
| Additional Paid-in Capital |
| Retained Earnings/ (Accumulated Deficit) |
| Accumulated Other Comprehensive Income (Loss) (AOCI) |
| Non- Controlling Interests |
| Total (Deficit) Equity | |||||||||||||
Balance as of March 31, 2012 |
| 1,000 | |
| $ | - | |
| $ | 1,659 | |
| $ | (1,379 | ) |
| $ | (191 | ) |
| $ | 34 | |
| $ | 123 | |
Net income attributable to our common shareholder |
| | |
| | |
| | |
| 202 | |
| - | |
| - | |
| 202 | | ||||||
Net income attributable to noncontrolling interests |
| | |
| - | |
| - | |
| - | |
| - | |
| 1 | |
| 1 | | ||||||
Currency translation adjustment, net of tax provision of $- in AOCI |
| | |
| - | |
| - | |
| - | |
| (53 | ) |
| - | |
| (53 | ) | ||||||
Change in fair value of effective portion of hedges, net of tax provision of $- included in AOCI |
| - | |
| - | |
| - | |
| - | |
| 5 | |
| - | |
| 5 | | ||||||
Change in pension and other benefits, net of tax benefit of $15 included in AOCI |
| - | |
| - | |
| - | |
| - | |
| (29 | ) |
| - | |
| (29 | ) | ||||||
Acquisition of noncontrolling interest in Novelis Korea Ltd. |
| - | |
| - | |
| (5 | ) |
| - | |
| - | |
| (4 | ) |
| (9 | ) | ||||||
Noncontrolling interests cash dividends declared |
| - | |
| - | |
| - | |
| - | |
| - | |
| (1 | ) |
| (1 | ) | ||||||
Balance as of March 31, 2013 |
| 1,000 | |
| - | |
| 1,654 | |
| (1,177 | ) |
| (268 | ) |
| 30 | |
| 239 | | ||||||
Net income attributable to our common shareholder |
| - | |
| - | |
| - | |
| 104 | |
| - | |
| - | |
| 104 | | ||||||
Currency translation adjustment, net of tax provision of $- in AOCI |
| - | |
| - | |
| - | |
| - | |
| 122 | |
| (2 | ) |
| 120 | | ||||||
Change in fair value of effective portion of hedges, net of tax provision of $3 included in AOCI |
| - | |
| - | |
| - | |
| - | |
| (18 | ) |
| - | |
| (18 | ) | ||||||
Change in pension and other benefits, net of tax benefit of $47 included in AOCI |
| - | |
| - | |
| - | |
| - | |
| 73 | |
| - | |
| 73 | | ||||||
Return of capital |
| - | |
| - | |
| (250 | ) |
| - | |
| - | |
| - | |
| (250 | ) | ||||||
Balance as of March 31, 2014 |
| 1,000 | |
| - | |
| 1,404 | |
| (1,073 | ) |
| (91 | ) |
| 28 | |
| 268 | | ||||||
Net income attributable to our common shareholder |
| - | |
| - | |
| - | |
| 148 | |
| - | |
| - | |
| 148 | | ||||||
Currency translation adjustment, net of tax provision of $ - included in AOCI |
| - | |
| - | |
| - | |
| - | |
| (302 | ) |
| (2 | ) |
| (304 | ) | ||||||
Change in fair value of effective portion of cash flow hedges, net of tax benefit of $1 million included in AOCI |
| - | |
| - | |
| - | |
| - | |
| (43 | ) |
| - | |
| (43 | ) | ||||||
Change in pension and other benefits, net of tax benefit of $71 million included in AOCI |
| - | |
| - | |
| - | |
| - | |
| (125 | ) |
| (13 | ) |
| (138 | ) | ||||||
Noncontrolling interests cash dividends declared |
| - | |
| - | |
| - | |
| - | |
| - | |
| (1 | ) |
| (1 | ) | ||||||
Balance as of March 31, 2015 |
| 1,000 | |
| $ | - | |
| $ | 1,404 | |
| $ | (925 | ) |
| $ | (561 | ) |
| $ | 12 | |
| $ | (70 | ) |
See accompanying notes to the consolidated financial statements.
72
Novelis Inc.
NOTES TO THE CONSOLIDATED FINANCIAL STATEMENTS
1. BUSINESS AND SUMMARY OF SIGNIFICANT ACCOUNTING POLICIES
References herein to "Novelis," the "Company," "we," "our," or "us" refer to Novelis Inc. and its subsidiaries unless the context specifically indicates otherwise. References herein to "Hindalco" refer to Hindalco Industries Limited. Hindalco acquired Novelis in May 2007. All of the common shares of Novelis are owned directly by AV Metals Inc. and indirectly by Hindalco Industries Limited.
Organization and Description of Business
We produce aluminum sheet and light gauge products for use in the packaging market, which includes beverage and food can and foil products, as well as for use in the automotive, transportation, electronics, architectural and industrial product markets. We have recycling operations in many of our plants to recycle post-consumer aluminum, such as used-beverage cans and post-industrial aluminum, such as class scrap. As of March 31, 2015 , we had manufacturing operations in eleven countries on four continents: North America, South America, Asia and Europe, through 25 operating facilities, including recycling operations in eleven of these plants. In December 2014, Novelis ceased operations at its remaining smelting facilities in South America. In addition, during the same period we sold our share of the Consorcio Candonga joint venture which operates power generation facilities in South America. We also sold the majority of our remaining power generation operations in South America in February 2015.
Consolidation Policy
Our consolidated financial statements include the assets, liabilities, revenues and expenses of all wholly-owned subsidiaries, majority-owned subsidiaries over which we exercise control and entities in which we have a controlling financial interest or are deemed to be the primary beneficiary. We eliminate all significant intercompany accounts and transactions from our consolidated financial statements.
We use the equity method to account for our investments in entities that we do not control, but where we have the ability to exercise significant influence over operating and financial policies. Consolidated "Net income attributable to our common shareholder" includes our share of net income (loss) of these entities. The difference between consolidation and the equity method impacts certain of our financial ratios because of the presentation of the detailed line items reported in the consolidated financial statements for consolidated entities, compared to a two-line presentation of "Investment in and advances to non-consolidated affiliates" and "Equity in net loss of non-consolidated affiliates."
Use of Estimates and Assumptions
The preparation of our consolidated financial statements in conformity with accounting principles generally accepted in the United States of America (U.S. GAAP) requires us to make estimates and assumptions. These estimates and assumptions affect the reported amounts of assets and liabilities and the disclosures of contingent assets and liabilities as of the date of the financial statements, and the reported amounts of revenues and expenses during the reporting periods. The principal areas of judgment relate to (1) the fair value of derivative financial instruments; (2) impairment of goodwill; (3) impairment of long lived assets and other intangible assets; (4) impairment and assessment of consolidation of equity investments; (5) actuarial assumptions related to pension and other postretirement benefit plans; (6) tax uncertainties and valuation allowances; and (7) assessment of loss contingencies, including environmental and litigation liabilities. Future events and their effects cannot be predicted with certainty, and accordingly, our accounting estimates require the exercise of judgment. The accounting estimates used in the preparation of our consolidated financial statements may change as new events occur, as more experience is acquired, as additional information is obtained and as our operating environment changes. We evaluate and update our assumptions and estimates on an ongoing basis and may employ outside experts to assist in our evaluations. Actual results could differ from the estimates we have used.
Risks and Uncertainties
We are exposed to a number of risks in the normal course of our operations that could potentially affect our financial position, results of operations, and cash flows.
73
Novelis Inc.
NOTES TO THE CONSOLIDATED FINANCIAL STATEMENTS - (Continued)
Laws and regulations
We operate in an industry that is subject to a broad range of environmental, health and safety laws and regulations in the jurisdictions in which we operate. These laws and regulations impose increasingly stringent environmental, health and safety protection standards and permitting requirements regarding, among other things, air emissions, wastewater storage, treatment and discharges, the use and handling of hazardous or toxic materials, waste disposal practices, the remediation of environmental contamination, post-mining reclamation and working conditions for our employees. Some environmental laws, such as the U.S. Comprehensive Environmental Response, Compensation, and Liability Act, also known as CERCLA or Superfund, and comparable state laws, impose joint and several liability for the cost of environmental remediation, natural resource damages, third party claims, and other expenses, without regard to the fault or the legality of the original conduct.
The costs of complying with these laws and regulations, including participation in assessments and remediation of contaminated sites and installation of pollution control facilities, have been, and in the future could be, significant. In addition, these laws and regulations may also result in substantial environmental liabilities associated with divested assets, third party locations and past activities. In certain instances, these costs and liabilities, as well as related action to be taken by us, could be accelerated or increased if we were to close, divest of or change the principal use of certain facilities with respect to which we may have environmental liabilities or remediation obligations. Currently, we are involved in a number of compliance efforts, remediation activities and legal proceedings concerning environmental matters, including certain activities and proceedings arising under U.S. Superfund and comparable laws in other jurisdictions where we have operations.
We have established liabilities for environmental remediation where appropriate. However, the cost of addressing environmental matters (including the timing of any charges related thereto) cannot be predicted with certainty, and these liabilities may not ultimately be adequate, especially in light of potential changes in environmental conditions, changing interpretations of laws and regulations by regulators and courts, the discovery of previously unknown environmental conditions, the risk of governmental orders to carry out additional compliance on certain sites not initially included in remediation in progress, our potential liability to remediate sites for which provisions have not been previously established and the adoption of more stringent environmental laws. Such future developments could result in increased environmental costs and liabilities and could require significant capital expenditures, any of which could have a material adverse effect on our financial position or results of operations or cash flows. Furthermore, the failure to comply with our obligations under the environmental laws and regulations could subject us to administrative, civil or criminal penalties, obligations to pay damages or other costs, and injunctions or other orders, including orders to cease operations. In addition, the presence of environmental contamination at our properties could adversely affect our ability to sell a property, receive full value for a property or use a property as collateral for a loan.
Some of our current and potential operations are located or could be located in or near communities that may regard such operations as having a detrimental effect on their social and economic circumstances. Environmental laws typically provide for participation in permitting decisions, site remediation decisions and other matters. Concern about environmental justice issues may affect our operations. Should such community objections be presented to government officials, the consequences of such a development may have a material adverse impact upon the profitability or, in extreme cases, the viability of an operation. In addition, such developments may adversely affect our ability to expand or enter into new operations in such location or elsewhere and may also have an effect on the cost of our environmental remediation projects.
We use a variety of hazardous materials and chemicals in our rolling processes and in connection with maintenance work on our manufacturing facilities. Because of the nature of these substances or related residues, we may be liable for certain costs, including, among others, costs for health-related claims or removal or re-treatment of such substances. Certain of our current and former facilities incorporated asbestos-containing materials, a hazardous substance that has been the subject of health-related claims for occupation exposure. In addition, although we have developed environmental, health and safety programs for our employees, including measures to reduce employee exposure to hazardous substances, and conduct regular assessments at our facilities, we are currently, and in the future may be, involved in claims and litigation filed on behalf of persons alleging injury predominantly as a result of occupational exposure to substances at our current or former facilities. It is not possible to predict the ultimate outcome of these claims and lawsuits due to the unpredictable nature of personal injury litigation. If these claims and lawsuits, individually or in the aggregate, were finally resolved against us, our financial position, results of operations and cash flows could be adversely affected.
Materials and labor
In the aluminum rolled products industry, our raw materials are subject to continuous price volatility. We may not be able to pass on the entire cost of the increases to our customers or offset fully the effects of higher raw material costs through productivity improvements, which may cause our profitability to decline. In addition, there is a potential time lag between changes in prices under our purchase contracts and the point when we can implement a corresponding change under our sales contracts with our customers. As a result, we could be exposed to fluctuations in raw materials prices, including metal, since, during the time lag period, we may have to temporarily bear the additional cost of the change under our purchase contracts, which could have a material adverse effect on our financial position, results of operations and cash flows. Significant price increases may result in our customers' substituting other materials, such as plastic or glass, for aluminum or switching to another aluminum rolled products producer, which could have a material adverse effect on our financial position, results of operations and cash flows.
We consume substantial amounts of energy in our rolling operations and our cast house operations. The factors that affect our energy costs and supply reliability tend to be specific to each of our facilities. A number of factors could materially adversely affect our energy position including, but not limited to: (a) increases in the cost of natural gas; (b) increases in the cost of supplied electricity or fuel oil related to transportation; (c) interruptions in energy supply due to equipment failure or other causes and (d) the inability to extend energy supply contracts upon expiration on economical terms. A significant increase in energy costs or disruption of energy supplies or supply arrangements could have a material adverse effect on our financial position, results of operations and cash flows.
Approximately 49% of our employees are represented by labor unions under a large number of collective bargaining agreements with varying durations and expiration dates. We may not be able to satisfactorily renegotiate our collective bargaining agreements when they expire. In addition, existing collective bargaining agreements may not prevent a strike or work stoppage at our facilities in the future, and any such work stoppage could have a material adverse effect on our financial position, results of operations and cash flows.
Geographic markets
We are, and will continue to be, subject to financial, political, economic and business risks in connection with our global operations. We have made investments and carry on production activities in various emerging markets, including China, Brazil, South Korea and Malaysia, and we market our products in these countries, as well as certain other countries in Asia, Africa, and the Middle East. While we anticipate higher growth or attractive production opportunities from these emerging markets, they also present a higher degree of risk than more developed markets. In addition to the business risks inherent in developing and servicing new markets, economic conditions may be more volatile, legal and regulatory systems less developed and predictable, and the possibility of various types of adverse governmental action more pronounced. In addition, inflation, fluctuations in currency and interest rates, competitive factors, civil unrest and labor problems could affect our revenues, expenses and results of operations. Our operations could also be adversely affected by acts of war, terrorism or the threat of any of these events as well as government actions such as controls on imports, exports and prices, tariffs, new forms of taxation, or changes in fiscal regimes and increased government regulation in the countries in which we operate or service customers. Unexpected or uncontrollable events or circumstances in any of these markets could have a material adverse effect on our financial position, results of operations and cash flows.
Other risks and uncertainties
In addition, refer to Note 17 - Fair Value Measurements and Note 20 - Commitments and Contingencies for a discussion of financial instruments and commitments and contingencies.
Revenue Recognition
We recognize sales when the revenue is realized or realizable, and has been earned. We record sales when a firm sales agreement is in place, delivery has occurred and collectability of the fixed or determinable sales price is reasonably assured.
We recognize product revenue, net of trade discounts, allowances, and estimated billing adjustments, in the reporting period in which the products are shipped and the title and risk of ownership pass to the customer. We sell most of our products under contracts based on a "conversion premium," which is subject to periodic adjustments based on market factors. As a result, the aluminum price risk is largely absorbed by the customer. In situations where we offer customers fixed prices for future delivery of our products, we enter into derivative instruments for all or a portion of the cost of metal inputs to protect our profit on the conversion of the product.
74
Novelis Inc.
NOTES TO THE CONSOLIDATED FINANCIAL STATEMENTS - (Continued)
Shipping and handling amounts we bill to our customers are included in "Net sales" and the related shipping and handling costs we incur are included in "Cost of goods sold (exclusive of depreciation and amortization)."
Our customers can receive or earn certain incentives including, but not limited to, contract signing bonuses, cash discounts, volume based incentive programs, and support for infrastructure programs. The incentives are recorded as reductions to "Net sales," and are recognized over the minimum contractual period in which the customer is obligated to make purchases from Novelis. For incentives that must be earned, management must make estimates related to customer performance and sales volume to determine the total amounts earned and to be recorded in deductions from "Net sales". In making these estimates, management considers historical results. The actual amounts may differ from these estimates.
On occasion, and in an attempt to better manage inventory levels, we sell inventory to third parties and have agreed to repurchase the same or similar inventory back from the third parties over a future period, based on market prices at the time of repurchase. For transactions in which the Company sells inventory and agrees to repurchase at a later date, we record the initial sale of the inventory on a net basis in our consolidated statement of operations through "Cost of goods sold (exclusive of depreciation and amortization)."
Cost of Goods Sold (Exclusive of Depreciation and Amortization)
"Cost of goods sold (exclusive of depreciation and amortization)" includes all costs associated with inventories, including the procurement of materials, the conversion of such materials into finished product, and the costs of warehousing and distributing finished goods to customers. Material procurement costs include inbound freight charges as well as purchasing, receiving, inspection and storage costs. Conversion costs include the costs of direct production inputs such as labor and energy, as well as allocated overheads from indirect production centers and plant administrative support areas. Warehousing and distribution costs include inside and outside storage costs, outbound freight charges and the costs of internal transfers.
Selling, General and Administrative Expenses
"Selling, general and administrative expenses" include selling, marketing and advertising expenses; salaries, travel and office expenses of administrative employees and contractors; legal and professional fees; software license fees and bad debt expenses.
Research and Development
We incur costs in connection with research and development programs that are expected to contribute to future earnings, and charge such costs against income as incurred. Research and development costs consist primarily of salaries and administrative costs.
Restructuring Activities
Restructuring charges, which are recorded within "Restructuring and impairment, net," include employee severance and benefit costs, impairments of assets, and other costs associated with exit activities. We apply the provisions of ASC 420, Exit or Disposal Cost Obligations (ASC 420). Severance costs accounted for under ASC 420 are recognized when management with the proper level of authority has committed to a restructuring plan and communicated those actions to employees. Impairment losses are based upon the estimated fair value less costs to sell, with fair value estimated based on existing market prices for similar assets. Other exit costs include environmental remediation costs and contract termination costs, primarily related to equipment and facility lease obligations. At each reporting date, we evaluate the accruals for restructuring costs to ensure the accruals are still appropriate. See Note 2 - Restructuring and Impairment for further discussion.
Cash and Cash Equivalents
"Cash and cash equivalents" includes investments that are highly liquid and have maturities of three months or less when purchased. The carrying values of cash and cash equivalents approximate their fair value due to the short-term nature of these instruments.
We maintain amounts on deposit with various financial institutions, which may, at times, exceed federally insured limits. However, management periodically evaluates the credit-worthiness of those institutions, and we have not experienced any losses on such deposits.
75
Novelis Inc.
NOTES TO THE CONSOLIDATED FINANCIAL STATEMENTS - (Continued)
Accounts Receivable
Our accounts receivable are geographically dispersed. We do not obtain collateral relating to our accounts receivable. We do not believe there are any significant concentrations of revenues from any particular customer or group of customers that would subject us to any significant credit risks in the collection of our accounts receivable. We report accounts receivable at the estimated net realizable amount we expect to collect from our customers.
Additions to the allowance for doubtful accounts are made by means of the provision for doubtful accounts. We write-off uncollectible accounts receivable against the allowance for doubtful accounts after exhausting collection efforts. For each of the periods presented, we performed an analysis of our historical cash collection patterns and considered the impact of any known material events in determining the allowance for doubtful accounts. See Note 3 - Accounts Receivable for further discussion.
Derivative Instruments
We hold derivatives for risk management purposes and not for trading. We use derivatives to mitigate uncertainty and volatility caused by underlying exposures to aluminum prices, foreign exchange rates, interest rates, and energy prices. The fair values of all derivative instruments are recognized as assets or liabilities at the balance sheet date and are reported gross.
We may be exposed to losses in the future if the counterparties to our derivative contracts fail to perform. We are satisfied that the risk of such non-performance is remote due to our monitoring of credit exposures. Additionally, we enter into master netting agreements with contractual provisions that allow for netting of counterparty positions in case of default, and we do not face credit contingent provisions that would result in the posting of collateral.
For derivatives designated as cash flow hedges or net investment hedges, we assess hedge effectiveness by formally evaluating the high correlation of the expected future cash flows of the hedged item and the derivative hedging instrument. The effective portion of gain or loss on the derivative is included in other comprehensive income (OCI) and reclassified to earnings in the period in which earnings are impacted by the hedged items or in the period that the transaction becomes probable of not occurring. Gains or losses representing reclassifications of OCI to earnings are recognized in the line item most reflective of the underlying risk exposure. We exclude the time value component of foreign currency and aluminum price risk hedges when measuring and assessing ineffectiveness to align our accounting policy with risk management objectives when it is necessary. If at any time during the life of a cash flow hedge relationship we determine that the relationship is no longer effective, the derivative will no longer be designated as a cash flow hedge and future gains or losses on the derivative will be recognized in "Other expense (income), net."
For derivatives designated as fair value hedges, we assess hedge effectiveness by formally evaluating the high correlation of changes in the fair value of the hedged item and the derivative hedging instrument. The changes in the fair values of the underlying hedged items are reported in "Prepaid expenses and other current assets," "Other long-term assets", "Accrued expenses and other current liabilities," and "Other long-term liabilities" in the consolidated balance sheets. Changes in the fair values of these derivatives and underlying hedged items generally offset and the effective portion is recorded in "Net sales" consistent with the underlying hedged item and the net ineffectiveness is recorded in "Other expense (income), net."
If no hedging relationship is designated, gains or losses are recognized in "Other expense (income), net" in our current period earnings.
Consistent with the cash flows from the underlying risk exposure, we classify cash settlement amounts associated with designated derivatives as part of either operating or investing activities in the consolidated statements of cash flows. If no hedging relationship is designated, we classify cash settlement amounts as part of investing activities in the consolidated statement of cash flows.
The majority of our derivative contracts are valued using industry-standard models that use observable market inputs as their basis, such as time value, forward interest rates, volatility factors, and current (spot) and forward market prices for foreign exchange rates. See Note 15 - Financial Instruments and Commodity Contracts and Note 17 - Fair Value Measurements for additional discussion related to derivative instruments.
Inventories
We carry our inventories at the lower of their cost or market value, reduced for obsolete and excess inventory. We use the average cost method to determine cost. Included in inventories are stores inventories, which are carried at cost; determined based on the first-in first-out method. See Note 4 - Inventories for further discussion.
76
Novelis Inc.
NOTES TO THE CONSOLIDATED FINANCIAL STATEMENTS - (Continued)
Property, Plant and Equipment
We record land, buildings, leasehold improvements and machinery and equipment at cost. We record assets under capital lease obligations at the lower of their fair value or the present value of the aggregate future minimum lease payments as of the beginning of the lease term. We generally depreciate our assets using the straight-line method over the shorter of the estimated useful life of the assets or the lease term, excluding any lease renewals, unless the lease renewals are reasonably assured. See Note 6 - Property, Plant and Equipment for further discussion. We assign useful lives to and depreciate major components of our property, plant and equipment.
The ranges of estimated useful lives are as follows:
|
| Years |
Buildings |
| 30 to 40 |
Leasehold improvements |
| 7 to 20 |
Machinery and equipment |
| 2 to 25 |
Furniture, fixtures and equipment |
| 3 to 10 |
Equipment under capital lease obligations |
| 5 to 15 |
As noted above, our machinery and equipment have useful lives of 2 to 25 years. Most of our large scale machinery, including hot mills, cold mills, continuous casting mills, furnaces and finishing mills have useful lives of 15 to 25 years. Supporting machinery and equipment, including automation and work rolls, have useful lives of 2 to 15 years.
Maintenance and repairs of property and equipment are expensed as incurred. We capitalize replacements and improvements that increase the estimated useful life of an asset, and we capitalize interest on major construction and development projects while in progress.
We retain fully depreciated assets in property and accumulated depreciation accounts until we remove them from service. In the case of sale, retirement or disposal, the asset cost and related accumulated depreciation balances are removed from the respective accounts, and the resulting net amount, after consideration of any proceeds, is included as a gain or loss in "Other income, net" or "(Gain) loss on assets held for sale" in our consolidated statements of operations.
We account for operating leases under the provisions of ASC 840, Leases. These pronouncements require us to recognize escalating rents, including any rent holidays, on a straight-line basis over the term of the lease for those lease agreements where we receive the right to control the use of the entire leased property at the beginning of the lease term.
Goodwill
We test for impairment at least annually as of the last day of February of each fiscal year, unless a triggering event occurs that would require an interim impairment assessment. We do not aggregate components of operating segments to arrive at our reporting units and, as such, our reporting units are the same as our operating segments.
In performing our goodwill impairment test, we have the option to first assess qualitative factors to determine whether the existence of events or circumstances leads to a determination that it is more likely than not that the estimated fair value of a reporting unit is less than its carrying amount. If we perform a qualitative assessment and determine that an impairment is more likely than not, then we perform the two-step quantitative impairment test, otherwise no further analysis is required. We also may elect not to perform the qualitative assessment and, instead, proceed directly to the two-step quantitative impairment test. The ultimate outcome of the goodwill impairment assessment will be the same whether we choose to perform the qualitative assessment or proceed directly to the two-step quantitative impairment test.
For the years ended March 31, 2015 and, 2014 , we elected to perform the two-step quantitative impairment test, and for the year ended March 31, 2013 , we elected to perform the qualitative assessment. No goodwill impairment was identified in any of the years. See Note 7 - Goodwill and Intangible Assets for further discussion.
77
Novelis Inc.
NOTES TO THE CONSOLIDATED FINANCIAL STATEMENTS - (Continued)
In years where we elect to perform the two-step quantitative impairment test, we use the present value of estimated future cash flows to establish the estimated fair value of our reporting units as of the testing date. This approach includes many assumptions related to future growth rates, discount factors and tax rates, among other considerations. Changes in economic and operating conditions impacting these assumptions could result in goodwill impairment in future periods. When available and as appropriate, we use the market approach to corroborate the estimated fair value. If the carrying amount of a reporting unit's goodwill exceeds its estimated fair value, the second step of the impairment test is performed in order to determine the amount of impairment loss, if any. The second step compares the implied fair value of the reporting unit goodwill with the carrying amount of that goodwill. If the carrying amount of the reporting unit's goodwill exceeds its implied fair value we would recognize an impairment charge in an amount equal to that excess in our consolidated statements of operations.
When a business within a reporting unit is disposed of, goodwill is allocated to the gain or loss on disposition using the relative fair value methodology.
Long-Lived Assets and Other Intangible Assets
We amortize the cost of intangible assets over their respective estimated useful lives to their estimated residual value. See Note 7 - Goodwill and Intangible Assets for further discussion.
We assess the recoverability of long-lived assets (excluding goodwill) and finite-lived intangible assets, whenever events or changes in circumstances indicate that we may not be able to recover the asset's carrying amount. We measure the recoverability of assets to be held and used by a comparison of the carrying amount of the asset (groups) to the expected, undiscounted future net cash flows to be generated by that asset (groups), or, for identifiable intangible assets, by determining whether the amortization of the intangible asset balance over its remaining life can be recovered through undiscounted future cash flows. The amount of impairment of identifiable intangible assets is based on the present value of estimated future cash flows. We measure the amount of impairment of other long-lived assets and intangible assets (excluding goodwill) as the amount by which the carrying value of the asset exceeds the fair value of the asset, which is generally determined as the present value of estimated future cash flows or as the appraised value. Impairments of long-lived assets and intangible assets are included in "Restructuring and impairment, net" in the consolidated statement of operations. See Note 2 - Restructuring and Impairment to our accompanying consolidated audited financial statements for discussion on impairments.
Assets and Liabilities Held for Sale
We classify long-lived assets (disposal groups) to be sold as held for sale in the period in which all of the following criteria are met: management, having the authority to approve the action, commits to a plan to sell the asset (disposal group); the asset (disposal group) is available for immediate sale in its present condition subject only to terms that are usual and customary for sales of such assets (disposal groups); an active program to locate a buyer and other actions required to complete the plan to sell the asset (disposal group) have been initiated; the sale of the asset (disposal group) is probable, and transfer of the asset (disposal group) is expected to qualify for recognition as a completed sale within one year, except if events or circumstances beyond our control extend the period of time required to sell the asset (disposal group) beyond one year; the asset (disposal group) is being actively marketed for sale at a price that is reasonable in relation to its current fair value; and actions required to complete the plan indicate that it is unlikely that significant changes to the plan will be made or that the plan will be withdrawn.
We initially measure a long-lived asset (disposal group) that is classified as held for sale at the lower of its carrying value or fair value less any costs to sell. Any loss resulting from this measurement is recognized in the period in which the held for sale criteria are met. Conversely, gains are not recognized on the sale of a long-lived asset (disposal group) until the date of sale. We assess the fair value of a long-lived asset (disposal group) less any costs to sell each reporting period it remains classified as held for sale and report any reduction in fair value as an adjustment to the carrying value of the asset (disposal group). Upon being classified as held for sale we cease depreciation. We continue to depreciate long-lived assets to be disposed of other than by sale.
Upon determining that a long-lived asset (disposal group) meets the criteria to be classified as held for sale, we report the assets and liabilities of the disposal group, if material, in the line items "Assets held for sale" and "Liabilities held for sale," respectively, in our consolidated balance sheets. See Note 5 - Assets Held for Sale for further discussion.
78
Novelis Inc.
NOTES TO THE CONSOLIDATED FINANCIAL STATEMENTS - (Continued)
Investment in and Advances to Non-Consolidated Affiliates
We assess the potential for other-than-temporary impairment of our equity method investments when impairment indicators are identified. We consider all available information, including the recoverability of the investment, the earnings and near-term prospects of the affiliate, factors related to the industry, conditions of the affiliate, and our ability, if any, to influence the management of the affiliate. We assess fair value based on valuation methodologies, as appropriate, including the present value of estimated future cash flows, estimates of sales proceeds, and external appraisals. If an investment is considered to be impaired and the decline in value is other than temporary, we record an appropriate write-down. See Note 9 - Investment in and Advances to Non-Consolidated Affiliates for further discussion.
Financing Costs
We amortize financing costs and premiums, and accrete discounts, over the remaining life of the related debt using the effective interest amortization method. The expense is included in "Interest expense and amortization of debt issuance costs" in our consolidated statements of operations. We record discounts or premiums as a direct deduction from, or addition to, the face amount of the financing. Financing costs are included in "Other long-term assets" in our consolidated balance sheets.
Fair Value of Financial Instruments
ASC 820, Fair Value Measurements and Disclosures (ASC 820), defines fair value, establishes a framework for measuring fair value, and expands disclosures about fair value measurements. ASC 820 also applies to measurements under other accounting pronouncements, such as ASC 825, Financial Instruments (ASC 825) that require or permit fair value measurements. ASC 825 requires disclosures of the fair value of financial instruments. Our financial instruments include: cash and cash equivalents; certificates of deposit; accounts receivable; accounts payable; foreign currency, energy and interest rate derivative instruments; cross-currency swaps; metal option and forward contracts; share-based compensation; related party notes receivable and payable; letters of credit; short-term borrowings and long-term debt.
The carrying amounts of cash and cash equivalents, certificates of deposit, accounts receivable, accounts payable and current related party notes receivable and payable approximate their fair value because of the short-term maturity and highly liquid nature of these instruments. The fair value of our letters of credit is deemed to be the amount of payment guaranteed on our behalf by third party financial institutions. We determine the fair value of our short-term borrowings and long-term debt based on various factors including maturity schedules, call features and current market rates. We also use quoted market prices, when available, or the present value of estimated future cash flows to determine fair value of our share-based compensation liabilities, short-term borrowings and long-term debt. When quoted market prices are not available for various types of financial instruments (such as currency, energy and interest rate derivative instruments, swaps, options and forward contracts), we use standard pricing models with market-based inputs, which take into account the present value of estimated future cash flows. See Note 17 - Fair Value Measurements for further discussion.
Pensions and Postretirement Benefits
Our pension obligations relate to funded defined benefit pension plans in the U.S., Canada, Switzerland and the U.K., unfunded pension plans in the U.S., Canada, and Germany, and unfunded lump sum indemnities in France, Malaysia and Italy; and partially funded lump sum indemnities in South Korea. Our other postretirement obligations include unfunded health care and life insurance benefits provided to retired employees in Canada, the U.S. and Brazil.
We account for our pensions and other postretirement benefits in accordance with ASC 715, Compensation - Retirement Benefits (ASC 715). We recognize the funded status of our benefit plans as a net asset or liability, with an offsetting adjustment to AOCI in shareholder's (deficit) equity. The funded status is calculated as the difference between the fair value of plan assets and the benefit obligation. For the years ended March 31, 2015 and 2014 , we used March 31 as the measurement date.
We use standard actuarial methods and assumptions to account for our pension and other postretirement benefit plans. Pension and postretirement benefit obligations are actuarially calculated using management's best estimates of the rate used to discount the future estimated liability, the long-term rate of return on plan assets, and several assumptions related to the employee workforce (compensation increases, health care cost trend rates, expected service period, retirement age, and mortality). Pension and postretirement benefit expense includes the actuarially computed cost of benefits earned during the current service period, the interest cost on accrued obligations, the expected return on plan assets based on fair market value and the straight-line amortization of net actuarial gains and losses and adjustments due to plan amendments, curtailments, and settlements. Net actuarial gains and losses are amortized over periods of 15 years or less, which represent the group's average future service life of the employees or the group's average life expectancy. See Note 13 - Postretirement Benefit Plans for further discussion.
79
Novelis Inc.
NOTES TO THE CONSOLIDATED FINANCIAL STATEMENTS - (Continued)
Noncontrolling Interests in Consolidated Affiliates
These financial statements reflect the application of ASC 810, Consolidations (ASC 810), which establishes accounting and reporting standards that require: (i) the ownership interest in subsidiaries held by parties other than the parent to be clearly identified and presented in the consolidated balance sheet within shareholder's (deficit) equity, but separate from the parent's (deficit) equity; (ii) the amount of consolidated net income attributable to the parent and the noncontrolling interest to be clearly identified and presented on the face of the consolidated statement of operations and (iii) changes in a parent's ownership interest while the parent retains its controlling financial interest in its subsidiary to be accounted for consistently.
Our consolidated financial statements include all assets, liabilities, revenues and expenses of less-than-100%-owned affiliates that we control or for which we are the primary beneficiary. We record a noncontrolling interest for the allocable portion of income or loss and comprehensive income or loss to which the noncontrolling interest holders are entitled based upon their ownership share of the affiliate. Distributions made to the holders of noncontrolling interests are charged to the respective noncontrolling interest balance.
Losses attributable to the noncontrolling interest in an affiliate may exceed our interest in the affiliate's equity. The excess, and any further losses attributable to the noncontrolling interest, shall be attributed to those interests. The noncontrolling interest shall continue to be attributed its share of losses even if that attribution results in a deficit noncontrolling interest balance. As of March 31, 2015 and 2014 , we have no such losses.
Environmental Liabilities
We record accruals for environmental matters when it is probable that a liability has been incurred and the amount of the liability can be reasonably estimated, based on current law and existing technologies. We adjust these accruals periodically as assessment and remediation efforts progress or as additional technical or legal information becomes available. Accruals for environmental liabilities are stated at undiscounted amounts. Environmental liabilities are included in our consolidated balance sheets in "Accrued expenses and other current liabilities" and "Other long-term liabilities," depending on their short- or long-term nature. Any receivables for related insurance or other third party recoveries for environmental liabilities are recorded when it is probable that a recovery will be realized and are included in our consolidated balance sheets in "Prepaid expenses and other current assets."
Costs related to environmental matters are charged to expense. Estimated future incremental operations, maintenance and management costs directly related to remediation are accrued in the period in which such costs are determined to be probable and estimable. See Note 20 - Commitments and Contingencies for further discussion.
Litigation Contingencies
We accrue for loss contingencies associated with outstanding litigation, claims and assessments for which management has determined it is probable that a loss contingency exists and the amount of loss can be estimated. We expense professional fees associated with litigation claims and assessments as incurred. See Note 20 - Commitments and Contingencies for further discussion.
Income Taxes
We account for income taxes using the asset and liability method. This approach recognizes the amount of income taxes payable or refundable for the current year, as well as deferred tax assets and liabilities for the future tax consequence of events recognized in the consolidated financial statements and income tax returns. Deferred income tax assets and liabilities are adjusted to recognize the effects of changes in tax laws or enacted tax rates. Under ASC 740 Income Taxes , (ASC 740) a valuation allowance is required when it is more likely than not that some portion of the deferred tax assets will not be realized. Realization is dependent on generating sufficient taxable income through various sources.
We record tax benefits related to uncertain tax positions taken or expected to be taken on a tax return when such benefits meet a more than likely than not threshold. Otherwise, these tax benefits are recorded when a tax position has been effectively settled, the statute of limitation has expired or the appropriate taxing authority has completed their examination. Interest and penalties related to uncertain tax positions are recognized as part of the provision for income taxes and are accrued beginning in the period that such interest and penalties would be applicable under relevant tax law until such time that the related tax benefits are recognized. See Note 19 - Income Taxes for further discussion.
80
Novelis Inc.
NOTES TO THE CONSOLIDATED FINANCIAL STATEMENTS - (Continued)
Share-Based Compensation
In accordance with ASC 718, Compensation - Stock Compensation (ASC 718), we recognize compensation expense for a share-based award over an employee's requisite service period based on the award's grant date fair value, subject to adjustment. Our share-based awards are settled in cash and are accounted for as liability based awards. As such, liabilities for awards under these plans are required to be measured at fair value at each reporting date until the date of settlement. See Note 12 - Share-Based Compensation for further discussion.
Foreign Currency Translation
The assets and liabilities of foreign operations, whose functional currency is other than the U.S. dollar (located in Europe and Asia), are translated to U.S. dollars at the period end exchange rates and revenues and expenses are translated at average exchange rates for the period. Differences arising from this translation are included in the currency translation adjustment (CTA) component of AOCI and Noncontrolling Interest. If there is a planned or completed sale or liquidation of our ownership in a foreign operation, the relevant CTA is recognized in our consolidated statement of operations.
For all operations, the monetary items denominated in currencies other than the functional currency are remeasured at period-end exchange rates and transaction gains and losses are included in "Other expense (income), net" in our consolidated statements of operations. Non-monetary items are remeasured at historical rates.
Recently Adopted Accounting Standards
Effective for the first quarter of fiscal 2015, we adopted Financial Accounting Standards Board ASU No. 2013-11, Income Taxes (Topic 740): Presentation of an Unrecognized Tax Benefit When a Net Operating Loss Carryforward, a Similar Tax Loss, or a Tax Credit Carryforward Exists. The amendments in this update provide guidance on the presentation of unrecognized tax benefits and will better reflect the manner in which an entity would settle, at the reporting date, any additional income taxes that would result from the disallowance of a tax position when net operating loss carryforwards, similar tax losses, or tax credit carryforwards exist. The adoption of this standard had an insignificant impact on our consolidated financial position.
Recently Issued Accounting Standards
In March 2013, the FASB issued ASU No. 2013-05, Foreign Currency Matters (Topic 830): Parent's Accounting for the Cumulative Translation Adjustment upon Derecognition of Certain Subsidiaries or Groups of Assets within a Foreign Entity or of an Investment in a Foreign Entity. The amendments in this update provide clarification regarding the release of a cumulative translation adjustment into net income when a parent either sells a part or all of its investment in a foreign entity or no longer holds a controlling financial interest in a subsidiary or group of assets within a foreign entity. The guidance will be effective for annual reporting periods beginning after December 15, 2014, and interim periods within those annual periods. We will adopt this standard prospectively in our first quarter ending June 30, 2015 and our current accounting policies comply with this guidance. Therefore, there will be no change in how we account for these transactions.
In April 2014, the FASB issued ASU No. 2014-08, Presentation of Financial Statements (Topic 205) and Property, Plant, and Equipment (Topic 360): Reporting Discontinued Operations and Disclosures of Disposals of Components of an Entity. The amendment changes the criteria for determining which disposals can be presented as discontinued operations and modifies related disclosure requirements. Under the revised standard, a discontinued operation is (1) a component of an entity or group of components that has been disposed of by sale, disposed of other than by sale or is classified as held for sale that represents a strategic shift that has or will have a major effect on an entity's operations and financial results or (2) an acquired business or nonprofit activity that is classified as held for sale on the date of the acquisition. The guidance is effective for annual periods beginning on or after December 15, 2014 and interim periods within that year. The guidance will be applied prospectively. Early adoption is permitted but only for disposals (or classifications as held for sale) that have not been reported in financial statements previously issued or available for issue. We will adopt this standard prospectively in our first quarter ending June 30, 2015 on future disposals. The accounting treatment and classification of future disposals under this new standard could differ from our current treatment and classification of disposals.
In May 2014, the FASB issued ASU 2014-09, Revenue from Contracts with Customers (ASC 606) , which, when effective, will supersede the guidance in former ASC 605, Revenue Recognition . The new guidance requires entities to recognize revenue based on the transfer of promised goods or services to customers in an amount that reflects the consideration to which the entity expects to be entitled in exchange for those goods or services. The guidance is effective for annual periods beginning after December 15, 2016 and interim periods within that year. Early adoption is not permitted. We will adopt this standard in our first quarter ending June 30, 2017. We are currently evaluating the impact of this standard on our consolidated financial position and results of operations.
81
Novelis Inc.
NOTES TO THE CONSOLIDATED FINANCIAL STATEMENTS - (Continued)
In February 2015, the FASB issued ASU 2015-02, Consolidations - Amendments to the Consolidations Analysis (ASC 801) , which when effective, will (i) modify the evaluation of whether limited partnerships and similar legal entities are variable interest entities or voting interest entities, (ii) eliminate the presumption that a general partner should consolidate a limited partnership, (iii) affect the consolidation analysis of reporting entities that are involved with variable interest entities, particularly those that have fee arrangements and related party relationships, and (iv) provide a scope exception from consolidation guidance for reporting entities with interests in legal entities that are required to comply with or operate in accordance with requirements that are similar to those in Rule 2a-7 of the Investment Company Act of 1940 for registered money market funds. This guidance is effective for annual periods beginning after December 15, 2015 and interim periods within that year. Early adoption is permitted. We will adopt this standard in our first quarter ending June 30, 2015. We do not anticipate the adoption of this standard having a material impact on our consolidated financial position, results of operations, or disclosures.
In April 2015, the FASB issued ASU 2015-03, Interest - Imputation of Interest (ASC 835-30) , which, when effective, will require that debt issuance costs related to a recognized debt liability be presented in the balance sheet as a direct deduction from the carrying amount of that debt liability, consistent with debt discounts. The recognition and measurement guidance for debt issuance costs are not affected by the amendments in this update. The guidance is effective for annual periods beginning after December 15, 2015 and interim periods within that year. An entity should apply the new guidance on a retrospective basis, wherein the balance sheet or each individual period presented should be adjusted to reflect the period-specific effects of applying the new guidance. Early adoption is permitted. We will adopt this standard in our first quarter ending June 30, 2016. Adoption of this standard will impact the presentation of deferred debt issuance costs on our consolidated financial position.
82
Novelis Inc.
NOTES TO THE CONSOLIDATED FINANCIAL STATEMENTS - (Continued)
2. RESTRUCTURING AND IMPAIRMENT
"Restructuring and impairment, net" for the year ended March 31, 2015 was $37 million , which included impairment charges unrelated to restructuring actions of $2 million on certain non-core fixed assets in North America. "Restructuring and impairment, net" for the year ended March 31, 2014 was $75 million , included impairment charges unrelated to restructuring actions of $17 million on certain non-core assets in Brazil, $5 million on certain capitalized software assets, and $2 million on other long-lived assets. "Restructuring and impairment, net" for the year ended March 31, 2013 was $47 million , which included impairment charges unrelated to restructuring actions of $2 million on long-lived assets in South Korea and Brazil.
The following table summarizes our restructuring liability activity and other impairment charges (in millions).
|
| Total restructuring liabilities |
| Other restructuring charges (A) |
| Total restructuring charges |
| Other impairments (B) |
| Total and impairments, net | ||||||||||
Balance as of March 31, 2012 |
| $ | 28 | |
|
|
|
|
|
|
|
| ||||||||
Fiscal 2013 Activity: |
|
|
|
|
|
|
|
|
|
| ||||||||||
Expenses |
| 40 | |
| $ | 5 | |
| $ | 45 | |
| $ | 2 | |
| $ | 47 | | |
Cash payments |
| (34 | ) |
|
|
|
|
|
|
|
| |||||||||
Foreign currency translation and other |
| (1 | ) |
|
|
|
|
|
|
|
| |||||||||
Balance as of March 31, 2013 |
| 33 | |
|
|
|
|
|
|
|
| |||||||||
Fiscal 2014 Activity: |
|
|
|
|
|
|
|
|
|
| ||||||||||
Expenses |
| 48 | |
| 3 | |
| 51 | |
| 24 | |
| 75 | | |||||
Cash payments |
| (34 | ) |
|
|
|
|
|
|
|
| |||||||||
Balance as of March 31, 2014 |
| 47 | |
|
|
|
|
|
|
|
| |||||||||
Fiscal 2015 Activity: |
|
|
|
|
|
|
|
|
|
| ||||||||||
Expenses |
| 30 | |
| $ | 5 | |
| $ | 35 | |
| $ | 2 | |
| $ | 37 | | |
Cash payments |
| (32 | ) |
|
|
|
|
|
|
|
| |||||||||
Foreign currency translation and other |
| (13 | ) |
|
|
|
|
|
|
|
| |||||||||
Balance as of March 31, 2015 |
| $ | 32 | |
|
|
|
|
|
|
|
| ||||||||
(A) | Other restructuring charges include period expenses that were not recorded through the restructuring liability and impairments related to a restructuring activity. |
(B) | Other impairment charges not related to a restructuring activity. |
As of March 31, 2015 , $16 million of restructuring liabilities was classified as short-term and was included in "Accrued expenses and other current liabilities" and $16 million was classified as long-term and was included in "Other long-term liabilities" on our consolidated balance sheets. During the year ended March 31, 2015 , we made payments of $1 million for outstanding lease termination costs related to the relocation of our corporate headquarters from Cleveland, Ohio to Atlanta, Georgia. The regional restructuring activities are described in more detail on the subsequent pages.
83
Novelis Inc.
NOTES TO THE CONSOLIDATED FINANCIAL STATEMENTS - (Continued)
North America
The following table summarizes our restructuring activity for the North America segment by plan (in millions).
|
| Year ended March 31, |
|
| ||||||||||||
|
| 2015 |
| 2014 |
| 2013 |
| Prior to | ||||||||
Restructuring charges - North America |
|
|
|
|
|
|
| |||||||||
Saguenay Plant Closure: |
|
|
|
|
|
|
| |||||||||
| Severance | $ | - | |
| $ | - | |
| $ | 5 | |
| $ | - | |
| Fixed asset impairment (A) | - | |
| - | |
| - | |
| 28 | | ||||
| Other exit related costs | 1 | |
| 1 | |
| - | |
| - | | ||||
| Period expenses (A) | - | |
| 1 | |
| 3 | |
| - | | ||||
|
|
|
|
|
|
|
|
| ||||||||
Relocation of R&D operations to Kennesaw, Georgia |
|
|
|
|
|
|
| |||||||||
| Severance | - | |
| 1 | |
| 8 | |
| 3 | | ||||
| Relocation costs | - | |
| 1 | |
| - | |
| - | | ||||
| Period expenses (A) | - | |
| 1 | |
| - | |
| - | | ||||
|
|
|
|
|
|
|
|
| ||||||||
Evermore joint venture exit |
|
|
|
|
|
|
| |||||||||
| Contract termination penalty fee | - | |
| - | |
| 2 | |
| - | | ||||
| Fixed asset impairment (A) | - | |
| - | |
| 1 | |
| - | | ||||
Total restructuring charges - North America | $ | 1 | |
| $ | 5 | |
| $ | 19 | |
| $ | 31 | | |
|
|
|
|
|
|
|
|
| ||||||||
Restructuring payments - North America |
|
|
|
|
|
|
| |||||||||
| Severance | $ | (2 | ) |
| $ | (4 | ) |
| $ | (10 | ) |
|
| ||
| Other | (1 | ) |
| (2 | ) |
| (3 | ) |
|
| |||||
Total restructuring payments - North America | $ | (3 | ) |
| $ | (6 | ) |
| $ | (13 | ) |
|
| |||
(A) These charges were not recorded through the restructuring liability.
In fiscal 2012, we closed our Saguenay Works facility in Canada and relocated our North America research and development operations to a new global research and technology facility in Kennesaw, Georgia. In fiscal 2013, we withdrew from the UBC recycling joint venture with Alcoa Inc., known as Evermore, and established a new organization for the procurement of scrap in North America, which allows us to more seamlessly operate a global recycling network and strategy.
As of March 31, 2015 , the outstanding restructuring liability for the North America segment was $1 million , which relates to severance charges.
84
Novelis Inc.
NOTES TO THE CONSOLIDATED FINANCIAL STATEMENTS - (Continued)
Europe
The following table summarizes our restructuring activity for the Europe segment by plan (in millions).
|
| Year ended March 31, |
|
| ||||||||||||
|
| 2015 |
| 2014 |
| 2013 |
| Prior to | ||||||||
Restructuring charges - Europe |
|
|
|
|
|
|
| |||||||||
Business optimization |
|
|
|
|
|
|
| |||||||||
| Severance | $ | 3 | |
| $ | 26 | |
| $ | 10 | |
| $ | 6 | |
| Pension settlement loss (A) | - | |
| 1 | |
| - | |
| - | | ||||
|
|
|
|
|
|
|
|
| ||||||||
Rogerstone plant closure |
|
|
|
|
|
|
| |||||||||
| Severance | - | |
| - | |
| - | |
| 18 | | ||||
| Fixed asset impairments | - | |
| - | |
| - | |
| 22 | | ||||
| Other exit costs | - | |
| - | |
| 1 | |
| 3 | | ||||
|
|
|
|
|
|
|
|
| ||||||||
Total restructuring charges - Europe | $ | 3 | |
| $ | 27 | |
| $ | 11 | |
| $ | 49 | | |
|
|
|
|
|
|
|
| |||||||||
Restructuring payments - Europe |
|
|
|
|
|
|
| |||||||||
| Severance | $ | (12 | ) |
| $ | (18 | ) |
| $ | (17 | ) |
|
| ||
| Other | - | |
| (1 | ) |
| (2 | ) |
|
| |||||
Total restructuring payments - Europe | $ | (12 | ) |
| $ | (19 | ) |
| $ | (19 | ) |
|
| |||
(A) These charges were not recorded through the restructuring liability.
The business optimization actions include the shutdown of facilities, staff rationalization and other activities, to optimize our business in Europe. Additionally, in fiscal 2010, we also closed our aluminum sheet mill in Rogerstone, South Wales, U.K. to reduce labor and overhead costs through capacity and staff reductions in Europe. Other restructuring charges refers to additional restructuring activities, including severance at various plants and other exit costs.
As of March 31, 2015 , the outstanding restructuring liability for the Europe segment was $6 million , which relates to severance charges.
85
Novelis Inc.
NOTES TO THE CONSOLIDATED FINANCIAL STATEMENTS - (Continued)
South America
|
| Year ended March 31, |
|
| ||||||||||||
|
| 2015 |
| 2014 |
| 2013 |
| Prior to | ||||||||
Restructuring charges - South America |
|
|
|
|
|
|
| |||||||||
Ouro Preto smelter closures |
|
|
|
|
|
|
| |||||||||
| Severance | $ | 14 | |
| $ | 2 | |
| $ | 3 | |
| $ | - | |
| Asset impairments (A) | 5 | |
| - | |
| 1 | |
| - | | ||||
| Environmental charges | 6 | |
| 16 | |
| - | |
| - | | ||||
| Contract termination and other exit related costs | 5 | |
| 1 | |
| 5 | |
| - | | ||||
|
|
|
|
|
|
|
|
| ||||||||
Aratu plant closure |
|
|
|
|
|
|
| |||||||||
| Severance | - | |
| - | |
| - | |
| 7 | | ||||
| Asset impairments (A) | - | |
| - | |
| - | |
| 7 | | ||||
| Contract termination and other exit related costs | 1 | |
| - | |
| 6 | |
| - | | ||||
Total restructuring charges - South America | $ | 31 | |
| $ | 19 | |
| $ | 15 | |
| $ | 14 | | |
|
|
|
|
|
|
|
|
| ||||||||
Restructuring payments - South America |
|
|
|
|
|
|
| |||||||||
| Severance | $ | (12 | ) |
| $ | (4 | ) |
| $ | (1 | ) |
|
| ||
| Other | (4 | ) |
| (4 | ) |
| (1 | ) |
|
| |||||
Total restructuring payments - South America | $ | (16 | ) |
| $ | (8 | ) |
| $ | (2 | ) |
|
| |||
(A) These charges were not recorded through the restructuring liability.
As of March 31, 2015 , the outstanding restructuring liability for the South America segment was $25 million and relates to $18 million of environmental charges, $5 million of other exit related costs, $1 million of certain labor related charges and $1 million of contract termination charges.
We ceased operations at the smelter in Ouro Preto, Brazil, in December 2014. This decision was made in an effort to further align our global sustainability strategy, as we work towards our goal of having higher recycled content in our products. Certain charges associated with this closure are reflected within the "Ouro Preto smelter closures" section above, along with our closure of a pot line in Ouro Preto, Brazil, in fiscal 2013. In fiscal 2011, we closed our primary aluminum smelter in Aratu, Brazil.
For additional information on environmental charges see Note 20 – Commitments and Contingencies.
|
|
|
|
|
|
|
|
|
86
Novelis Inc.
NOTES TO THE CONSOLIDATED FINANCIAL STATEMENTS - (Continued)
3. ACCOUNTS RECEIVABLE
"Accounts receivable, net" consists of the following (in millions).
|
| March 31, | ||||||
|
| 2015 |
| 2014 | ||||
Trade accounts receivable |
| $ | 1,158 | |
| $ | 1,303 | |
Other accounts receivable |
| 134 | |
| 83 | | ||
Accounts receivable - third parties |
| 1,292 | |
| 1,386 | | ||
Allowance for doubtful accounts - third parties |
| (3 | ) |
| (4 | ) | ||
Accounts receivable, net - third parties |
| $ | 1,289 | |
| $ | 1,382 | |
|
|
|
|
| ||||
Accounts receivable, net - related parties |
| $ | 53 | |
| $ | 54 | |
Allowance for Doubtful Accounts
As of March 31, 2015 and 2014 , our allowance for doubtful accounts represented approximately 0.2% and 0.3% , respectively, of gross accounts receivable.
Activity in the allowance for doubtful accounts is as follows (in millions).
|
| Balance at Beginning of Period |
| Additions Charged to Expense |
| Accounts Recovered/ (Written- Off) |
| Foreign Exchange and Other |
| Balance at End of Period | ||||||||||
Year Ended March 31, 2015 |
| $ | 4 | |
| $ | - | |
| $ | - | |
| $ | (1 | ) |
| $ | 3 | |
Year Ended March 31, 2014 |
| $ | 3 | |
| $ | 2 | |
| $ | (1 | ) |
| $ | - | |
| $ | 4 | |
Year Ended March 31, 2013 |
| $ | 5 | |
| $ | 2 | |
| $ | (4 | ) |
| $ | - | |
| $ | 3 | |
Factoring of Trade Receivables
We factor and forfait trade receivables (collectively, we refer to these as "factoring" programs) based on local cash needs including the need to fund our strategic investments, as well as attempting to balance the timing of cash flows of trade payables and receivables and fund other business needs. Factored invoices are not included in our consolidated balance sheets when we do not retain a financial or legal interest. If a financial or legal interest is retained, we classify these factorings as secured borrowings.
|
| Year Ended March 31, | ||||||||||
|
| 2015 |
| 2014 |
| 2013 | ||||||
Aggregated receivables factored |
| $ | 1,796 | |
| $ | 1,081 | |
| $ | 464 | |
Factoring expense |
| $ | 10 | |
| $ | 5 | |
| $ | 2 | |
|
| March 31, | ||||||
|
| 2015 |
| 2014 | ||||
Factored receivables outstanding |
| $ | 591 | |
| $ | 245 | |
87
Novelis Inc.
NOTES TO THE CONSOLIDATED FINANCIAL STATEMENTS - (Continued)
4. INVENTORIES
"Inventories" consists of the following (in millions).
|
| March 31, | ||||||
|
| 2015 |
| 2014 | ||||
Finished goods |
| $ | 358 | |
| $ | 259 | |
Work in process |
| 531 | |
| 419 | | ||
Raw materials |
| 419 | |
| 382 | | ||
Supplies |
| 123 | |
| 113 | | ||
Inventories |
| $ | 1,431 | |
| $ | 1,173 | |
Certain amounts within the components of "Inventories" as of March 31, 2014 have been revised. The immaterial revision had no impact on total "Inventories" as presented in the historical footnote or consolidated balance sheet.
88
Novelis Inc.
NOTES TO THE CONSOLIDATED FINANCIAL STATEMENTS - (Continued)
5. ASSETS HELD FOR SALE
We are focused on capturing the global growth we see in our premium product markets of beverage can, automotive and specialty products. We continually analyze our product portfolio to ensure we are focused on growing in attractive market segments. The following transactions relate to exiting certain non-core operations and are steps to align our growth strategy in the premium product markets.
In March 2014, we made a decision to sell our hydroelectric power generation operations, including our investment in the joint venture of the Consorcio Candonga, in Brazil. In April 2014, we entered into agreements to sell the hydroelectric generation operations and our share of the joint venture of the Consorcio Candonga to two separate parties. In December 2014, we sold our share of the joint venture of the Consorcio Candonga to a third party for cash of $63 million (net of related gains on currency derivatives and transaction fees) and recognized a $23 million gain. Additionally, there are certain hydroelectric power generation operations fully owned by the Company that were sold in February 2015. We received proceeds (net of transaction fees) of $17 million and recognized a $14 million loss on the sale of these assets. The gain on the sale of our share of the joint venture of the Consorcio Candonga and the loss on the other hydroelectric power generation operations were recorded in "Gain on assets held for sale, net" in the consolidated statement of operations in the year ended March 31, 2015 . The remaining hydroelectric generation operation assets totaling $6 million have been classified as "Assets held for sale" in our consolidated balance sheet as of March 31, 2015. The hydroelectric generation operations assets, described above, of $70 million were classified as "Assets held for sale" in our consolidated balance sheet as of March 31, 2014.
During fiscal 2015, we received $8 million of payments from the sale of land and mining rights in Brazil and recognized a $6 million "Gain on assets held for sale, net." The related assets of $1 million were classified as "Assets held for sale" as of March 31, 2014.
In September 2013, we executed an agreement to sell most of our North America consumer foil operations to a third party. In June 2014, we sold these operations for $29 million in cash (net of transaction fees). We recognized a $7 million "Gain on assets held for sale, net" in the consolidated statement of operations in the year ended March 31, 2015 . The related assets of $31 million and liabilities of $11 million were classified as "Assets held for sale" and "Liabilities held for sale" in our consolidated balance sheet as of March 31, 2014.
In December 2013, we sold certain land in Brazil for $6 million in cash and recognized a $6 million "Gain on assets held for sale" in the consolidated statement of operations.
In August 2013, we sold our bauxite mining rights and certain alumina assets and related liabilities in Brazil to our parent company, Hindalco, for $8 million in cash. The sales price approximated the net book value of the assets and liabilities sold; therefore, we recorded no gain or loss.
The following table summarizes the carrying amounts of the major classes of assets and liabilities held for sale (in millions).
| March 31, | ||||||
| 2015 |
| 2014 | ||||
Assets held for sale |
|
|
| ||||
Accounts receivable | $ | - | |
| $ | 10 | |
Inventories | - | |
| 15 | | ||
Prepaid expenses and other current assets | - | |
| 1 | | ||
Property, plant and equipment, net | 6 | |
| 37 | | ||
Investment in and advances to non-consolidated affiliates | - | |
| 39 | | ||
Total assets held for sale | $ | 6 | |
| $ | 102 | |
|
|
|
| ||||
Liabilities held for sale |
|
|
| ||||
Accounts payable | $ | - | |
| $ | 4 | |
Accrued expenses and other current liabilities | - | |
| 7 | | ||
Total liabilities held for sale | $ | - | |
| $ | 11 | |
89
Novelis Inc.
NOTES TO THE CONSOLIDATED FINANCIAL STATEMENTS - (Continued)
6. PROPERTY, PLANT AND EQUIPMENT
"Property, plant and equipment, net" consists of the following (in millions).
|
| March 31, | ||||||
|
| 2015 |
| 2014 | ||||
Land and property rights |
| $ | 180 | |
| $ | 174 | |
Buildings |
| 1,183 | |
| 1,029 | | ||
Machinery and equipment |
| 3,947 | |
| 3,606 | | ||
|
| 5,310 | |
| 4,809 | | ||
Accumulated depreciation and amortization |
| (2,132 | ) |
| (1,977 | ) | ||
|
| 3,178 | |
| 2,832 | | ||
Construction in progress |
| 364 | |
| 681 | | ||
Property, plant and equipment, net |
| $ | 3,542 | |
| $ | 3,513 | |
As of March 31, 2015 and 2014 , there were $756 million and $752 million , respectively, of fully depreciated assets included in our consolidated balance sheets.
For the years ended March 31, 2015 , 2014 and 2013 , we capitalized $ 20 million , $33 million and $36 million of interest related to construction of property, plant and equipment and intangibles under development, respectively. Depreciation expense related to property, plant, and equipment, net is shown in the table below (in millions).
|
| Year Ended March 31, | ||||||||||
|
| 2015 |
| 2014 |
| 2013 | ||||||
Depreciation expense related to property, plant and equipment, net |
| $ | 294 | |
| $ | 279 | |
| $ | 242 | |
Asset impairments
Impairment charges are recorded in "Restructuring and impairment, net." See Note 2 - Restructuring and impairment for additional information.
Leases
We lease certain land, buildings and equipment under non-cancelable operating leases expiring at various dates, and we lease assets in Sierre, Switzerland, including a fifteen -year capital lease through December 2019 from RTA. During fiscal 2013, 2014 and 2015 we entered into various capital lease arrangements to upgrade and expand our information technology infrastructure. Operating leases generally have five to ten-year terms, with one or more renewal options, with terms to be negotiated at the time of renewal. Various facility leases include provisions for rent escalation to recognize increased operating costs or require us to pay certain maintenance and utility costs.
The following table summarizes rent expense included in our consolidated statements of operations (in millions):
|
| Year Ended March 31, | ||||||||||
|
| 2015 |
| 2014 |
| 2013 | ||||||
Rent expense |
| $ | 22 | |
| $ | 21 | |
| $ | 21 | |
90
Novelis Inc.
NOTES TO THE CONSOLIDATED FINANCIAL STATEMENTS - (Continued)
Future minimum lease payments as of March 31, 2015 , for our operating and capital leases having an initial or remaining non-cancelable lease term in excess of one year are as follows (in millions).
Year Ending March 31, |
| Operating Leases |
| Capital Lease Obligations | ||||
2016 |
| $ | 27 | |
| $ | 11 | |
2017 |
| 21 | |
| 11 | | ||
2018 |
| 19 | |
| 8 | | ||
2019 |
| 18 | |
| 7 | | ||
2020 |
| 16 | |
| 5 | | ||
Thereafter |
| 54 | |
| - | | ||
Total minimum lease payments |
| $ | 155 | |
| $ | 42 | |
Less: interest portion on capital lease |
|
|
| 6 | | |||
Principal obligation on capital leases |
|
|
| $ | 36 | | ||
Assets and related accumulated amortization under capital lease obligations as of March 31, 2015 and 2014 are as follows (in millions).
|
| March 31, | ||||||
|
| 2015 |
| 2014 | ||||
Assets under capital lease obligations: |
|
|
|
| ||||
Buildings |
| $ | 11 | |
| $ | 12 | |
Machinery and equipment |
| 76 | |
| 81 | | ||
|
| 87 | |
| 93 | | ||
Accumulated amortization |
| (65 | ) |
| (65 | ) | ||
|
| $ | 22 | |
| $ | 28 | |
91
Novelis Inc.
NOTES TO THE CONSOLIDATED FINANCIAL STATEMENTS - (Continued)
7. GOODWILL AND INTANGIBLE ASSETS
There were no material changes to the gross carrying amount and no changes to the accumulated impairment of goodwill during the years ended March 31, 2015 and 2014 . The following table summarizes "Goodwill" (in millions) for the years ended March 31, 2015 and 2014 .
|
| March 31, 2015 |
| March 31, 2014 | ||||||||||||||||||||
|
| Gross Carrying Amount |
| Accumulated Impairment |
| Net Carrying Value |
| Gross |
| Accumulated |
| Net | ||||||||||||
North America |
| $ | 1,145 | |
| $ | (860 | ) |
| $ | 285 | |
| $ | 1,148 | |
| $ | (860 | ) |
| $ | 288 | |
Europe |
| 511 | |
| (330 | ) |
| 181 | |
| 511 | |
| (330 | ) |
| 181 | | ||||||
South America |
| 291 | |
| (150 | ) |
| 141 | |
| 292 | |
| (150 | ) |
| 142 | | ||||||
|
| $ | 1,947 | |
| $ | (1,340 | ) |
| $ | 607 | |
| $ | 1,951 | |
| $ | (1,340 | ) |
| $ | 611 | |
The components of "Intangible assets, net" are as follows (in millions).
|
| March 31, 2015 |
| March 31, 2014 | ||||||||||||||||||||||
|
| Weighted Average Life |
| Gross Carrying Amount |
| Accumulated Amortization |
| Net Carrying Amount |
| Gross Carrying Amount |
| Accumulated Amortization |
| Net Carrying Amount | ||||||||||||
Tradenames |
| 20 years |
| $ | 142 | |
| $ | (56 | ) |
| $ | 86 | |
| $ | 142 | |
| $ | (49 | ) |
| $ | 93 | |
Technology and software |
| 10.7 years |
| 357 | |
| (149 | ) |
| 208 | |
| 335 | |
| (129 | ) |
| 206 | | ||||||
Customer-related intangible assets |
| 20 years |
| 444 | |
| (173 | ) |
| 271 | |
| 470 | |
| (160 | ) |
| 310 | | ||||||
Favorable energy supply contract |
| 9.5 years |
| 124 | |
| (105 | ) |
| 19 | |
| 124 | |
| (93 | ) |
| 31 | | ||||||
|
| 15.7 years |
| $ | 1,067 | |
| $ | (483 | ) |
| $ | 584 | |
| $ | 1,071 | |
| $ | (431 | ) |
| $ | 640 | |
Our favorable energy supply contract is amortized over its estimated useful life using a method that reflects the pattern in which the economic benefits are expected to be consumed. All other intangible assets are amortized using the straight-line method.
|
| Year Ended March 31, | ||||||||||
|
| 2015 |
| 2014 |
| 2013 | ||||||
Total Amortization expense related to intangible assets |
| $ | 70 | |
| $ | 67 | |
| $ | 63 | |
Less: Amortization expense related to intangible assets included in "Cost of goods sold (exclusive of depreciation and amortization)" (A) |
| (12 | ) |
| (12 | ) |
| (13 | ) | |||
Amortization expense related to intangible assets included in "Depreciation and amortization" |
| $ | 58 | |
| $ | 55 | |
| $ | 50 | |
(A) | Relates to amortization of favorable energy supply contract. |
Estimated total amortization expense related to "Intangible assets, net" for each of the five succeeding fiscal years is as follows (in millions). Actual amounts may differ from these estimates due to such factors as customer turnover, raw material consumption patterns, impairments, additional intangible asset acquisitions and other events.
Fiscal Year Ending March 31, |
| ||
2016 | $ | 74 | |
2017 | 70 | | |
2018 | 63 | | |
2019 | 63 | | |
2020 | 63 | | |
92
Novelis Inc.
NOTES TO THE CONSOLIDATED FINANCIAL STATEMENTS - (Continued)
8. CONSOLIDATION
Variable Interest Entities (VIE)
The entity that has a controlling financial interest in a VIE is referred to as the primary beneficiary and consolidates the VIE. An entity is deemed to have a controlling financial interest and is the primary beneficiary of a VIE if it has both the power to direct the activities of the VIE that most significantly impact the VIE's economic performance and an obligation to absorb losses or the right to receive benefits that could potentially be significant to the VIE.
We have a joint interest in Logan Aluminum Inc. (Logan) with Tri-Arrows Aluminum Inc. (Tri-Arrows). Logan processes metal received from Novelis and Tri-Arrows and charges the respective partner a fee to cover expenses. Logan is thinly capitalized and relies on the regular reimbursement of costs and expenses by Novelis and Tri-Arrows to fund its operations. This reimbursement is considered a variable interest as it constitutes a form of financing of the activities of Logan. Other than these contractually required reimbursements, we do not provide other material support to Logan. Logan's creditors do not have recourse to our general credit.
We have a majority voting right on Logan's board of directors and have the ability to direct the majority of Logan's production operations. We also have the ability to take the majority share of production and associated costs. These facts qualify us as Logan's primary beneficiary and this entity is consolidated for all periods presented. All significant intercompany transactions and balances have been eliminated.
The following table summarizes the carrying value and classification of assets and liabilities owned by the Logan joint venture and consolidated in our consolidated balance sheets (in millions). There are significant other assets used in the operations of Logan that are not part of the joint venture, as they are directly owned and consolidated by Novelis or Tri-Arrows.
|
| March 31, | ||||||
|
| 2015 |
| 2014 | ||||
Assets |
|
|
|
| ||||
Current assets |
|
|
|
| ||||
Cash and cash equivalents |
| $ | 2 | |
| $ | 1 | |
Accounts receivable |
| 40 | |
| 38 | | ||
Inventories |
| 52 | |
| 42 | | ||
Prepaid expenses and other current assets |
| 1 | |
| 1 | | ||
Total current assets |
| 95 | |
| 82 | | ||
Property, plant and equipment, net |
| 20 | |
| 14 | | ||
Goodwill |
| 12 | |
| 12 | | ||
Deferred income taxes |
| 65 | |
| 63 | | ||
Other long-term assets |
| 4 | |
| 3 | | ||
Total assets |
| $ | 196 | |
| $ | 174 | |
Liabilities |
|
|
|
| ||||
Current liabilities |
|
|
|
| ||||
Accounts payable |
| $ | 33 | |
| $ | 26 | |
Accrued expenses and other current liabilities |
| 12 | |
| 13 | | ||
Total current liabilities |
| 45 | |
| 39 | | ||
Accrued postretirement benefits |
| 166 | |
| 141 | | ||
Other long-term liabilities |
| 2 | |
| 2 | | ||
Total liabilities |
| $ | 213 | |
| $ | 182 | |
93
Novelis Inc.
NOTES TO THE CONSOLIDATED FINANCIAL STATEMENTS - (Continued)
9. | INVESTMENT IN AND ADVANCES TO NON-CONSOLIDATED AFFILIATES AND RELATED PARTY TRANSACTIONS |
The following table summarizes the ownership structure and our ownership percentage of the non-consolidated affiliates in which we have an investment as of March 31, 2015 and 2014 , and which we account for using the equity method. We do not control our non-consolidated affiliates, but have the ability to exercise significant influence over their operating and financial policies. We have no material investments that we account for using the cost method.
Affiliate Name |
| Ownership Structure |
| Ownership Percentage |
Aluminium Norf GmbH (Alunorf) |
| Corporation |
| 50% |
Consorcio Candonga (A) |
| Unincorporated Joint Venture |
| 50% |
(A) | In December 2014, we sold our share of the joint venture of Consorcio Candonga to a third party for cash of $63 million (net of related gains on currency derivatives and transaction fees). |
The following table summarizes the assets, liabilities and equity of our equity method affiliates in the aggregate as of March 31, 2015 and 2014 (in millions).
|
| March 31, | ||||||
|
| 2015 |
| 2014 | ||||
Assets: |
|
|
|
| ||||
Current assets |
| $ | 145 | |
| $ | 183 | |
Non-current assets |
| 357 | |
| 484 | | ||
Total assets |
| $ | 502 | |
| $ | 667 | |
Liabilities: |
|
|
|
| ||||
Current liabilities |
| $ | 51 | |
| $ | 132 | |
Non-current liabilities |
| 232 | |
| 268 | | ||
Total liabilities |
| 283 | |
| 400 | | ||
Equity: |
|
|
|
| ||||
Total equity |
| 219 | |
| 267 | | ||
Total liabilities and equity |
| $ | 502 | |
| $ | 667 | |
As of March 31, 2015 , the investment in our equity method investee exceeded our proportionate share of the net assets of the equity method investee by $337 million . The difference is primarily related to the unamortized fair value adjustments that are included in our investment balance as a result of the acquisition of Novelis by Hindalco in 2007.
94
Novelis Inc.
NOTES TO THE CONSOLIDATED FINANCIAL STATEMENTS - (Continued)
|
| Year Ended March 31, | ||||||||||
|
| 2015 |
| 2014 |
| 2013 | ||||||
Net sales |
| $ | 524 | |
| $ | 550 | |
| $ | 489 | |
Costs and expenses related to net sales |
| 527 | |
| 543 | |
| 488 | | |||
Provision for taxes on income |
| - | |
| 4 | |
| 2 | | |||
Net (loss) income |
| $ | (3 | ) |
| $ | 3 | |
| $ | (1 | ) |
Purchase of tolling services from Aluminium Norf GmbH (Alunorf) |
| $ | 261 | |
| $ | 275 | |
| $ | 244 | |
Included in the accompanying consolidated financial statements are transactions and balances arising from business we conduct with these non-consolidated affiliates, which we classify as related party transactions and balances. The following table describes the period-end account balances that we had with these non-consolidated affiliates, shown as related party balances in the accompanying consolidated balance sheets (in millions). We had no other material related party balances with non-consolidated affiliates.
|
| March 31, | ||||||
|
| 2015 |
| 2014 | ||||
Accounts receivable-related parties |
| $ | 53 | |
| $ | 54 | |
Other long-term assets-related parties |
| $ | 15 | |
| $ | 12 | |
Accounts payable-related parties |
| $ | 44 | |
| $ | 53 | |
We earned less than $1 million of interest income on a loan due from Alunorf during each of the years presented in "Other long-term assets-related parties" in the table above. We believe collection of the full receivable from Alunorf is probable; thus no allowance for loan loss was provided for this loan as of March 31, 2015 and 2014 .
We have guaranteed the indebtedness for a credit facility and loan on behalf of Alunorf. The guarantee is limited to 50% of the outstanding debt, not to exceed 6 million euros. As of March 31, 2015 , there were no amounts outstanding under our guarantee with Alunorf. We have also guaranteed the payment of early retirement benefits on behalf of Alunorf. As of March 31, 2015 , this guarantee totaled $2 million .
Transactions with Hindalco and AV Metals Inc.
We occasionally have related party transactions with our indirect parent company, Hindalco. During the years ended March 31, 2015 , 2014 and 2013 we recorded "Net sales" of less than $1 million , $1 million , and $5 million , respectively, between Novelis and our parent related primarily to sales of equipment and other services. During the year ended March 31, 2014, we sold our bauxite mining rights and certain alumina assets and liabilities in Brazil to our parent for $8 million in cash. As of March 31, 2015 and 2014 there was $1 million and less than $1 million of "Accounts receivable, net - related parties" outstanding related to transactions with Hindalco, respectively.
In March 2014, we declared a return of capital to our direct shareholder, AV Metals Inc., in the amount of $250 million , which we subsequently paid on April 30, 2014.
95
Novelis Inc.
NOTES TO THE CONSOLIDATED FINANCIAL STATEMENTS - (Continued)
10. ACCRUED EXPENSES AND OTHER CURRENT LIABILITIES
"Accrued expenses and other current liabilities" consists of the following (in millions).
|
| March 31, | ||||||
|
| 2015 |
| 2014 | ||||
Accrued compensation and benefits |
| $ | 172 | |
| $ | 182 | |
Accrued interest payable |
| 67 | |
| 66 | | ||
Accrued income taxes |
| 11 | |
| 31 | | ||
Other current liabilities |
| 322 | |
| 268 | | ||
Accrued expenses and other current liabilities - third parties |
| $ | 572 | |
| $ | 547 | |
|
|
|
|
| ||||
Accrued expenses and other current liabilities - related party |
| $ | - | |
| $ | 250 | |
96
Novelis Inc.
NOTES TO THE CONSOLIDATED FINANCIAL STATEMENTS - (Continued)
11. DEBT
Debt consists of the following (in millions).
| March 31, 2015 |
| March 31, 2014 | |||||||||||||||||||||||||||
| Interest Rates (A) |
| Principal |
| Unamortized Carrying Value Adjustments |
|
|
| Carrying Value |
| Principal |
| Unamortized Carrying Value Adjustments |
|
|
| Carrying Value | |||||||||||||
Third party debt: |
|
|
|
|
|
|
|
|
|
|
|
|
|
|
|
|
| |||||||||||||
Short term borrowings | 3.21 | % |
| $ | 846 | |
| $ | - | |
|
|
| $ | 846 | |
| $ | 723 | |
| $ | - | |
|
|
| $ | 723 | |
Novelis Inc. |
|
|
|
|
|
|
|
|
|
|
|
|
|
|
|
|
| |||||||||||||
Floating rate Term Loan Facility, due March 2017 | 3.75 | % |
| 1,731 | |
| (13 | ) |
| (B) |
| 1,718 | |
| 1,749 | |
| (20 | ) |
| (B) |
| 1,729 | | ||||||
8.375% Senior Notes, due December 2017 | 8.375 | % |
| 1,100 | |
| - | |
|
|
| 1,100 | |
| 1,100 | |
| - | |
|
|
| 1,100 | | ||||||
8.75% Senior Notes, due December 2020 | 8.75 | % |
| 1,400 | |
| - | |
|
|
| 1,400 | |
| 1,400 | |
| - | |
|
|
| 1,400 | | ||||||
Capital lease obligations, due through July 2017 | 3.64 | % |
| 9 | |
| - | |
|
|
| 9 | |
| 11 | |
| - | |
|
|
| 11 | | ||||||
Novelis Korea Limited |
|
|
|
|
|
|
|
|
|
|
|
|
|
|
|
|
| |||||||||||||
Bank loans, due through September 2020 (KRW 212 billion) | 2.93 | % |
| 192 | |
| - | |
|
|
| 192 | |
| 155 | |
| - | |
|
|
| 155 | | ||||||
Novelis Switzerland S.A. |
|
|
|
|
|
|
|
|
|
|
|
|
|
|
|
|
| |||||||||||||
Capital lease obligation, due through December 2019 (Swiss francs (CHF) 27 million) | 7.50 | % |
| 28 | |
| (1 | ) |
| (C) |
| 27 | |
| 36 | |
| (1 | ) |
| (C) |
| 35 | | ||||||
Novelis do Brasil Ltda. |
|
|
|
|
|
|
|
|
|
|
|
|
|
|
|
|
| |||||||||||||
BNDES loans, due through April 2021 (BRL 22 million) | 5.91 | % |
| 7 | |
| (1 | ) |
| (D) |
| 6 | |
| 13 | |
| (2 | ) |
| (D) |
| 11 | | ||||||
Other |
|
|
|
|
|
|
|
|
|
|
|
|
|
|
|
|
| |||||||||||||
Other debt, due through December 2020 | 6.08 | % |
| 5 | |
| - | |
|
|
| 5 | |
| 10 | |
| - | |
|
|
| 10 | | ||||||
Total debt |
|
| 5,318 | |
| (15 | ) |
|
|
| 5,303 | |
| 5,197 | |
| (23 | ) |
|
|
| 5,174 | | |||||||
Less: Short term borrowings |
|
| (846 | ) |
| - | |
|
|
| (846 | ) |
| (723 | ) |
| - | |
|
|
| (723 | ) | |||||||
Current portion of long term debt |
|
| (108 | ) |
| - | |
|
|
| (108 | ) |
| (92 | ) |
| - | |
|
|
| (92 | ) | |||||||
Long-term debt, net of current portion: |
|
| $ | 4,364 | |
| $ | (15 | ) |
|
|
| $ | 4,349 | |
| $ | 4,382 | |
| $ | (23 | ) |
|
|
| $ | 4,359 | | |
(A) | I nterest rates are the stated rates of interest on the debt instrument (not the effective interest rate) as of March 31, 2015 , and therefore, exclude the effects of related interest rate swaps and accretion/amortization of fair value adjustments as a result of purchase accounting in connection with Hindalco's purchase of Novelis and accretion/amortization of debt issuance costs related to the debt exchange completed in fiscal 2009 and the series of refinancing transactions and additional borrowings we completed in fiscal 2011 through 2015. We present stated rates of interest because they reflect the rate at which cash will be paid for future debt service. |
(B) | Debt existing at the time of Hindalco's purchase of Novelis was recorded at fair value. In connection with a series of refinancing transactions, a portion of the historical fair value adjustments were allocated to the Term Loan Facility, resulting in carrying value adjustments on this debt obligation. The unamortized carrying value balances also include an issuance discount. |
97
Novelis Inc.
NOTES TO THE CONSOLIDATED FINANCIAL STATEMENTS - (Continued)
(C) | Debt existing at the time of Hindalco's purchase of Novelis was recorded at fair value resulting in carrying value adjustments to our capital lease obligations in Novelis Switzerland. |
(D) | The unamortized carrying value balance includes issuance discounts related to the difference resulting from the contractual rates of interest specified in the instruments that are lower than the market rates of interest upon issuance. |
Principal repayment requirements for our total debt over the next five years and thereafter (excluding unamortized carrying value adjustments and using exchange rates as of March 31, 2015 for our debt denominated in foreign currencies) are as follows (in millions).
As of March 31, 2015 | Amount | ||
Short-term borrowings and Current portion of long term debt due within one year | $ | 954 | |
2 years | 1,747 | | |
3 years | 1,203 | | |
4 years | 8 | | |
5 years | 6 | | |
Thereafter | 1,400 | | |
Total | $ | 5,318 | |
|
| ||
Senior Secured Credit Facilities
As of March 31, 2015 , the senior secured credit facilities consist of (1) a $1.7 billion four -year secured term loan credit facility (Term Loan Facility) and (2) a $1.2 billion five -year asset based loan facility (ABL Revolver) which has a provision that allows the facility to be increased by an additional $500 million . The Term Loan Facility interest rate is equal to LIBOR (with a floor of 1% ) plus a spread of 2.75% , at all times.
In October 2014, we amended and extended our ABL Revolver by entering into a $1.2 billion , five -year, senior secured ABL Revolver bearing an interest rate of LIBOR plus a spread of 1.50% to 2.00% plus a prime spread of 0.50% to 1.00% based on excess availability. However, our current Term Loan Facility limits our indebtedness under the ABL Revolver to $1.0 billion . The ABL Revolver has a provision that allows the facility to be increased by an additional $500 million . The ABL Revolver has various customary covenants including maintaining a minimum fixed charge coverage ratio of 1.25 to 1 if excess availability is less than the greater of (1) $110 million and (2) 12.5% of the lesser of (a) the maximum size of the ABL Revolver and (b) the borrowing base. The fixed charge coverage ratio will be equal to the ratio of (1) (a) ABL Revolver defined Earnings Before Interest, Taxes, Depreciation and Amortization ("EBITDA") less (b) maintenance capital expenditures less (c) cash taxes; to (2) (a) interest expense plus (b) scheduled principal payments plus (c) dividends to the Company's direct holding company to pay certain taxes, operating expenses and management fees and repurchases of equity interests from employees, officers and directors. The ABL Revolver matures on October 6, 2019; provided that, in the event that any of the Notes, the Term Loan Facility, or certain other indebtedness are outstanding (and not refinanced with a maturity date later than April 6, 2020) 90 days prior to their respective maturity dates, then the ABL Revolver will mature 90 days prior to the maturity date for the Notes, the Term Loan Facility or such other indebtedness, as applicable; unless excess availability under the ABL Revolver is at least (i) 25% of the lesser of (x) the total ABL Revolver commitment and (y) the then applicable borrowing base and (ii) 20% of the lesser of (x) the total ABL Revolver commitment and (y) the then applicable borrowing base, and a minimum fixed charged ratio test of at least 1.25 to 1 is met.
The senior secured credit facilities contain various affirmative covenants, including covenants with respect to our financial statements, litigation and other reporting requirements, insurance, payment of taxes, employee benefits and (subject to certain limitations) causing new subsidiaries to pledge collateral and guaranty our obligations. The senior secured credit facilities also include various customary negative covenants and events of default, including limitations on our ability to (1) make certain restricted payments, (2) incur additional indebtedness, (3) sell certain assets, (4) enter into sale and leaseback transactions, (5) make investments, loans and advances, (6) pay dividends or returns of capital and distributions beyond certain amounts, (7) engage in mergers, amalgamations or consolidations, (8) engage in certain transactions with affiliates, and (9) prepay certain indebtedness. The senior secured credit facilities include a cross-default provision under which lenders could accelerate repayment of the loans if a payment or non-payment default arises under any other indebtedness with an aggregate principal amount of more than $100 million (or, in the case of the Term Loan Facility, under the ABL Revolver regardless of the amount outstanding). Substantially all of our assets are pledged as collateral under the senior secured credit facilities. As of March 31, 2015 , we were in compliance with the covenants in the Term Loan Facility and ABL Revolver.
98
Novelis Inc.
NOTES TO THE CONSOLIDATED FINANCIAL STATEMENTS - (Continued)
Short-Term Borrowings
As of March 31, 2015 , our short-term borrowings were $846 million consisting of $609 million of short-term loans under our ABL Revolver, $52 million (KRW 58 billion ) in Novelis Korea bank loans, $166 million in Novelis Brazil loans, $9 million (VND 199 billion ) in Novelis Vietnam loans, $8 million in Novelis China loans (CNY 48 million ), and $2 million of other short term borrowings.
As of March 31, 2015 , $8 million of the ABL Revolver was utilized for letters of credit, and we had $307 million in remaining availability under the ABL Revolver.
In fiscal years 2014 and 2015 , Novelis Korea entered into various short-term facilities, including revolving loan facilities and committed credit lines. As of March 31, 2015 , we had $186 million (KRW 206 billion ) in remaining availability under these facilities.
In December 2014, Novelis China entered into a committed facility. As of March 31, 2015 , we had $17 million (CNY 102 million ) in remaining availability under this facility.
Senior Notes
In December 2010, we issued $1.1 billion in aggregate principal amount of 8.375% Senior Notes Due 2017 (the 2017 Notes) and $1.4 billion in aggregate principal amount of 8.75% Senior Notes Due 2020 (the 2020 Notes, and together with the 2017 Notes, the Notes).
The Notes contain customary covenants and events of default that will limit our ability and, in certain instances, the ability of certain of our subsidiaries to (1) incur additional debt and provide additional guarantees, (2) pay dividends or return capital beyond certain amounts and make other restricted payments, (3) create or permit certain liens, (4) make certain asset sales, (5) use the proceeds from the sales of assets and subsidiary stock, (6) create or permit restrictions on the ability of certain of the Company's subsidiaries to pay dividends or make other distributions to the Company, (7) engage in certain transactions with affiliates, (8) enter into sale and leaseback transactions, (9) designate subsidiaries as unrestricted subsidiaries and (10) consolidate, merge or transfer all or substantially all of our assets and the assets of certain of our subsidiaries. During any future period in which either Standard & Poor's Ratings Group, Inc. or Moody's Investors Service, Inc. have assigned an investment grade credit rating to the Notes and no default or event of default under the indenture has occurred and is continuing, most of the covenants will be suspended. The Notes include a cross-acceleration event of default triggered if (1) any other indebtedness with an aggregate principal amount of more than $100 million is (1) accelerated prior to its maturity or (2) not repaid at its maturity. As of March 31, 2015 , we were in compliance with the covenants in the Notes. The Notes also contain customary call protection provisions for our bond holders that extend through December 2016 for the 2017 Notes and through December 2018 for the 2020 Notes.
Korean Bank Loans
As of March 31, 2015 , Novelis Korea had $192 million (KRW 212 billion ) of outstanding long-term loans with various banks, of which $78 million is due within one year. All loans have variable interest rates with base rates tied to Korea's 91-day CD rate plus an applicable spread ranging from 0.80% to 1.38% .
Brazil BNDES Loans
Novelis Brazil entered into loan agreements with Brazil's National Bank for Economic and Social Development (the BNDES loans) related to the plant expansion in Pindamonhangaba, Brazil (Pinda). As of March 31, 2015 , there are $2 million of BNDES loans due within one year.
Other Long-term Debt
In December 2004, we entered into a fifteen -year capital lease obligation with Alcan for assets in Sierre, Switzerland, which has an interest rate of 7.5% and fixed quarterly payments of CHF 1.7 million , (USD $1.8 million ).
During fiscal 2013 and 2014, Novelis Inc. entered into various five -year capital lease arrangements to upgrade and expand our information technology infrastructure.
As of March 31, 2015 , we had $5 million of other debt, including certain capital lease obligations, with due dates through December 2020.
99
Novelis Inc.
NOTES TO THE CONSOLIDATED FINANCIAL STATEMENTS - (Continued)
Interest Rate Swaps
We use interest rate swaps to manage our exposure to changes in benchmark interest rates which impact our variable-rate debt. See Note 15- Financial Instruments and Commodity Contracts for further information about these interest rate swaps.
100
Novelis Inc.
NOTES TO THE CONSOLIDATED FINANCIAL STATEMENTS - (Continued)
12. SHARE-BASED COMPENSATION
The Company's board of directors has authorized long term incentive plans (LTIPs), under which Hindalco stock appreciation rights (Hindalco SARs), Novelis stock appreciation rights (Novelis SARs), and phantom restricted stock units (RSUs) are granted to certain executive officers and key employees.
The Hindalco SARs and Novelis SARs vest at the rate of 25% per year, subject to the achievement of an annual performance target, and expire 7 years from their original grant date. Each Hindalco SAR is to be settled in cash based on the difference between the market value of one Hindalco share on the date of grant and the market value on the date of exercise. Each Novelis SAR is to be settled in cash based on the difference between the fair value of one Novelis phantom share on the original date of grant and the fair value of a phantom share on the date of the exercise. The amount of cash paid to settle Hindalco SARs and Novelis SARs are limited to two and a half or three times the target payout , depending on the plan year. The Hindalco SARs and Novelis SARs do not transfer any shareholder rights in Hindalco or Novelis to a participant. The Hindalco SARs and Novelis SARs are classified as liability awards and are remeasured at fair value each reporting period until the SARs are settled.
The performance criterion for vesting of both the Hindalco SARs and Novelis SARs is based on the actual overall Novelis operating EBITDA compared to the target established and approved each fiscal year. The minimum threshold for vesting each year is 75% of each annual target operating EBITDA. Given that the performance criterion is based on an earnings target in a future period for each fiscal year, the grant date of the awards for accounting purposes is generally not established until the performance criterion has been defined.
The RSUs vest in full three years from the grant date, subject to continued employment with the Company, but are not subject to performance criteria. Each RSU is to be settled in cash equal to the market value of one Hindalco share. The payout on the RSUs is limited to three times the market value of one Hindalco share measured on the original date of grant. The RSUs are classified as liability awards and expensed over the requisite service period (three years) based on the Hindalco stock price as of each balance sheet date.
On May 13, 2013, the Company's board of directors amended the long-term incentive plans for fiscal years 2010 - 2013 (FY 2010 Plan), fiscal years 2011- 2014 (FY 2011 Plan), fiscal years 2012 - 2015 (FY 2012 Plan) and fiscal years 2013 - 2016 (FY 2013 Plan). The amendment gave each participant the option to cancel a portion of their outstanding Hindalco SARs for a lump-sum cash payment and/or the issuance of new Novelis SARs. The remaining Hindalco SARs and the new Novelis SARs continue to vest according to the terms and conditions of the original grant. The following tables reflect the activity related to the participants' elections under the amendment.
Total compensation expense related to Hindalco SARs, Novelis SARs, and RSUs under the plans for the respective periods is presented in the table below (in millions). These amounts are included in "Selling, general and administrative expenses" or "Cost of goods sold (exclusive of depreciation and amortization)" in our consolidated statements of operations. As the performance criteria for fiscal years 2016, 2017 and 2018 have not yet been established, measurement periods for Hindalco SARs and Novelis SARs relating to those periods have not yet commenced. As a result, only compensation expense for vested and current year Hindalco SARs and Novelis SARs has been recorded.
|
| Year Ended March 31, | ||||||||||
|
| 2015 |
| 2014 |
| 2013 | ||||||
Total compensation expense (income) |
| $ | 9 | |
| $ | 27 | |
| $ | (3 | ) |
|
| Number of RSUs |
| Grant Date Fair Value (in Indian Rupees) |
| Aggregate Intrinsic Value (USD in millions) | ||||
RSUs outstanding as of March 31, 2014 |
| 4,490,860 | |
| 120.42 | |
| $ | 11 | |
Granted |
| 1,913,537 | |
| 145.81 | |
| - | | |
Exercised |
| (748,108 | ) |
| 181.20 | |
| 3 | | |
Forfeited/Cancelled |
| (317,677 | ) |
| 124.04 | |
| - | | |
RSUs outstanding as of March 31, 2015 |
| 5,338,612 | |
| 120.77 | |
| $ | 12 | |
101
Novelis Inc.
NOTES TO THE CONSOLIDATED FINANCIAL STATEMENTS - (Continued)
|
| Number of Hindalco SARs |
| Weighted Average Exercise Price (in Indian Rupees) |
| Weighted Average Remaining Contractual Term (In years) |
| Aggregate Intrinsic Value (USD in millions) | |||||
SARs outstanding as of March 31, 2014 |
| 21,635,392 | |
| 112.26 | |
| 4.3 | |
| $ | 13 | |
Granted |
| 6,402,218 | |
| 145.81 | |
| 6.1 | |
| - | | |
Exercised |
| (5,423,673 | ) |
| 90.48 | |
| - | |
| 7 | | |
Forfeited/Cancelled |
| (1,437,380 | ) |
| 129.29 | |
| - | |
| - | | |
SARs outstanding as of March 31, 2015 |
| 21,176,557 | |
| 126.77 | |
| 4.4 | |
| 6 | | |
SARs exercisable as of March 31, 2015 |
| 6,917,124 | |
| 126.61 | |
| 2.6 | |
| $ | 3 | |
The table below shows the Novelis SARs activity for the year ended March 31, 2015 .
|
| Number of |
| Weighted |
| Weighted Average |
| Aggregate | ||||||
SARs outstanding as of March 31, 2014 |
| 668,402 | |
| $ | 90.09 | |
| 5.3 | |
| $ | 2 | |
Granted |
| 495,030 | |
| 94.40 | |
| 6.1 | |
| - | | ||
Exercised |
| (55,554 | ) |
| 80.09 | |
| - | |
| 1 | | ||
Forfeited/Cancelled |
| (74,143 | ) |
| 87.89 | |
| - | |
| - | | ||
SARs outstanding as of March 31, 2015 |
| 1,033,735 | |
| $ | 92.85 | |
| 5.2 | |
| 3 | | |
SARs exercisable as of March 31, 2015 |
| 173,661 | |
| $ | 90.50 | |
| 4.1 | |
| $ | 1 | |
|
| Year ended March 31, | |||||||
|
| 2015 |
| 2014 |
| 2013 | |||
Risk-free interest rate |
| 7.75% - 7.79% | |
| 8.67% - 8.96% | |
| 7.84% - 7.96% | |
Dividend yield |
| 0.78 | % |
| 0.99 | % |
| 1.69 | % |
Volatility |
| 39% - 46% | |
| 37% - 51% | |
| 37% - 52% | |
The fair value of each unvested Novelis SAR was estimated using the following assumptions:
|
| Year ended March 31, | |||||||
|
| 2015 |
| 2014 |
| 2013 | |||
Risk-free interest rate |
| 0.96% - 1.59% | |
| 0.96% - 2.05% | |
| - | % |
Dividend yield |
| - | % |
| - | % |
| - | % |
Volatility |
| 27% - 34% | |
| 28% - 41% | |
| - | % |
The fair value of each unvested Hindalco SAR was based on the difference between the fair value of a long call and a short call option. The fair value of each of these call options was determined using the Monte Carlo Simulation model. We used historical stock price volatility data of Hindalco on the National Stock Exchange of India to determine expected volatility assumptions. The risk-free interest rate is based on Indian treasury yields interpolated for a time period corresponding to the remaining contractual life. The forfeiture rate is estimated based on actual historical forfeitures. The dividend yield is estimated to be the annual dividend of the Hindalco stock over the remaining contractual lives of the Hindalco SARs. The value of each vested Hindalco SAR is remeasured at fair value each reporting period based on the excess of the current stock price over the exercise price, not to exceed the maximum payout as defined by the plans. The fair value of the Hindalco SARs is being recognized over the requisite performance and service period of each tranche, subject to the achievement of any performance criteria.
102
Novelis Inc.
NOTES TO THE CONSOLIDATED FINANCIAL STATEMENTS - (Continued)
The fair value of each unvested Novelis SAR was based on the difference between the fair value of a long call and a short call option. The fair value of each of these call options was determined using the Monte Carlo Simulation model. We used the historical volatility of comparable companies to determine expected volatility assumptions. The risk-free interest rate is based on U.S. treasury yields for a time period corresponding to the remaining contractual life. The forfeiture rate is estimated based on actual historical forfeitures of Hindalco SARs. The value of each vested Novelis SAR is remeasured at fair value each reporting period based on the percentage increase in the current Novelis phantom stock price over the exercise price, not to exceed the maximum payout as defined by the plans. The fair value of the Novelis SARs is being recognized over the requisite performance and service period of each tranche, subject to the achievement of any performance criteria.
The cash payments made to settle SAR liabilities were $8 million , $15 million , and $2 million , in the years ended March 31, 2015 , 2014 , and 2013 , respectively. Total cash payments made to settle Hindalco RSUs were $3 million and $2 million , in the years ended March 31, 2015 and 2014 . There were no payments made to settle Hindalco RSUs during the year ended March 31, 2013 as these instruments were not yet vested. Unrecognized compensation expense related to the non-vested Hindalco SARs (assuming all future performance criteria are met) was $9 million which is expected to be recognized over a weighted average period of 2.6 years . Unrecognized compensation expense related to the non-vested Novelis SARs (assuming all future performance criteria are met) was $13 million , which is expected to be recognized over a weighted average period of 2.7 years . Unrecognized compensation expense related to the RSUs was $18 million , which will be recognized over the remaining weighted average vesting period of 1.1 years.
103
Novelis Inc.
NOTES TO THE CONSOLIDATED FINANCIAL STATEMENTS - (Continued)
13. POSTRETIREMENT BENEFIT PLANS
Our pension obligations relate to: (1) funded defined benefit pension plans in the U.S., Canada, Switzerland, and the U.K.; (2) unfunded defined benefit pension plans in Germany; (3) unfunded lump sum indemnities payable upon retirement to employees in France, Malaysia and Italy; and (4) partially funded lump sum indemnities in South Korea. Our other postretirement obligations (Other Benefits, as shown in certain tables below) include unfunded health care and life insurance benefits provided to retired employees in the U.S., Canada, and Brazil. We have combined our domestic (i.e. Canadian Plans) and foreign (i.e. All other Plans other than Canadian Plans) postretirement benefit plan disclosures because our domestic benefit obligation is not significant as compared to our total benefit obligation, as our foreign benefit obligation is 94% of the total benefit obligation, and the assumptions used to value domestic and foreign plans were not significantly different.
During fiscal year 2015 and as a result of the sale of our North America foil operations, $11 million of benefits were transferred out of the pension plan along with a corresponding amount of plan assets resulting in settlement accounting. Various other pension plans recognized settlements totaling $3 million as a result of restructuring initiatives and other factors. The settlements resulted in an insignificant impact to the statement of operations.
In October 2014, the Society of Actuaries published an updated mortality table and mortality improvement scale for U.S. plans. We recognized an increase of $33 million to our benefit obligation and net actuarial loss as a result of updating mortality assumptions applicable to our U.S. plans. These deferred costs will be amortized on a straight-line basis to net periodic benefit costs in future years.
In June 2014, the Company amended its U.S. non-union retiree medical plan to extend retirees' option to participate in a Retiree Health Access Exchange (RHA). For calendar years 2014 through 2017, the Company will subsidize a portion of the retiree medical premium rates of the RHA. The Company will not provide a subsidy beginning in calendar year 2018. The amendment to the plan resulted in a plan remeasurement and recognition of prior service costs of approximately $11 million which is being amortized on a straight-line basis through December 31, 2017, subject to an annual remeasurement adjustment.
In August 2013, the Company amended its U.S. non-union retiree medical plan. Beginning January 2014, the health care benefits provided by the Company to retirees' was discontinued and replaced with the retirees' option to participate in a new Retiree Health Access Exchange. For calendar year 2014 and 2015, the Company will subsidize a portion of the retiree medical premium rates of the RHA. The amendment resulted in the Company no longer providing a subsidy beginning in calendar year 2016. The amendments to the plan resulted in a plan remeasurement and recognition of a negative plan amendment, which reduced our obligation by $97 million as of August 31, 2013. The negative plan amendment, net of unrecognized actuarial losses resulted in a credit balance of $70 million recorded in AOCI as of August 31, 2013. The $70 million is being amortized, on a straight-line basis, as a reduction to net periodic benefit cost from September 1, 2013 through December 31, 2015, subject to an annual remeasurement adjustment.
In June 2012, the Company amended a U.S. nonunion benefit plan which reduced postretirement life insurance benefits to retirees and eliminated the postretirement life insurance benefits for active employees. As a result, we recognized a negative plan amendment and a curtailment gain of $14 million which was recorded as an adjustment to "Accumulated other comprehensive loss" during the first quarter of fiscal 2013 and is being amortized, on a straight-line basis, as a reduction to net periodic benefit cost.
Employer Contributions to Plans
For pension plans, our policy is to fund an amount required to provide for contractual benefits attributed to service to-date, and amortize unfunded actuarial liabilities typically over periods of 15 years or less. We also participate in savings plans in Canada and the U.S., as well as defined contribution pension plans in the U.S., U.K., Canada, Germany, Italy, Switzerland, Malaysia and Brazil. We contributed the following amounts (in millions) to all plans.
|
| Year Ended March 31, | ||||||||||
|
| 2015 |
| 2014 |
| 2013 | ||||||
Funded pension plans |
| $ | 28 | |
| $ | 31 | |
| $ | 47 | |
Unfunded pension plans |
| 13 | |
| 13 | |
| 13 | | |||
Savings and defined contribution pension plans |
| 18 | |
| 20 | |
| 18 | | |||
Total contributions |
| $ | 59 | |
| $ | 64 | |
| $ | 78 | |
104
Novelis Inc.
NOTES TO THE CONSOLIDATED FINANCIAL STATEMENTS - (Continued)
During fiscal year 2016 , we expect to contribute $30 million to our funded pension plans, $12 million to our unfunded pension plans and $19 million to our savings and defined contribution pension plans.
Benefit Obligations, Fair Value of Plan Assets, Funded Status and Amounts Recognized in Financial Statements
The following tables present the change in benefit obligation, change in fair value of plan assets and the funded status for pension and other benefits (in millions).
|
| Pension Benefits |
| Other Benefits | ||||||||||||
|
| Year Ended March 31, |
| Year Ended | ||||||||||||
|
| 2015 |
| 2014 |
| 2015 |
| 2014 | ||||||||
Benefit obligation at beginning of period |
| $ | 1,672 | |
| $ | 1,581 | |
| $ | 135 | |
| $ | 234 | |
Service cost |
| 43 | |
| 48 | |
| 5 | |
| 8 | | ||||
Interest cost |
| 66 | |
| 63 | |
| 5 | |
| 7 | | ||||
Members' contributions |
| 5 | |
| 5 | |
| - | |
| - | | ||||
Benefits paid |
| (56 | ) |
| (51 | ) |
| (10 | ) |
| (9 | ) | ||||
Amendments |
| (3 | ) |
| (5 | ) |
| 11 | |
| (89 | ) | ||||
Curtailments, settlements and special termination benefits |
| (16 | ) |
| (8 | ) |
| (1 | ) |
| - | | ||||
Actuarial losses (gains) |
| 296 | |
| (5 | ) |
| (4 | ) |
| (15 | ) | ||||
Other |
| (2 | ) |
| (1 | ) |
| - | |
| - | | ||||
Currency (gains) losses |
| (142 | ) |
| 45 | |
| (2 | ) |
| (1 | ) | ||||
Benefit obligation at end of period |
| $ | 1,863 | |
| $ | 1,672 | |
| $ | 139 | |
| $ | 135 | |
Benefit obligation of funded plans |
| $ | 1,558 | |
| $ | 1,417 | |
| $ | - | |
| $ | - | |
Benefit obligation of unfunded plans |
| 305 | |
| 255 | |
| 139 | |
| 135 | | ||||
Benefit obligation at end of period |
| $ | 1,863 | |
| $ | 1,672 | |
| $ | 139 | |
| $ | 135 | |
|
| Pension Benefits | ||||||
|
| Year Ended March 31, | ||||||
|
| 2015 |
| 2014 | ||||
Change in fair value of plan assets |
|
|
|
| ||||
Fair value of plan assets at beginning of period |
| $ | 1,163 | |
| $ | 1,066 | |
Actual return on plan assets |
| 159 | |
| 79 | | ||
Members' contributions |
| 5 | |
| 5 | | ||
Benefits paid |
| (56 | ) |
| (51 | ) | ||
Company contributions |
| 41 | |
| 44 | | ||
Settlements |
| (14 | ) |
| (4 | ) | ||
Other |
| (2 | ) |
| (2 | ) | ||
Currency (losses) gains |
| (63 | ) |
| 26 | | ||
Fair value of plan assets at end of period |
| $ | 1,233 | |
| $ | 1,163 | |
105
Novelis Inc.
NOTES TO THE CONSOLIDATED FINANCIAL STATEMENTS - (Continued)
|
| March 31, | ||||||||||||||
|
| 2015 |
| 2014 | ||||||||||||
|
| Pension Benefits |
| Other Benefits |
| Pension Benefits |
| Other Benefits | ||||||||
Funded status |
|
|
|
|
|
|
|
| ||||||||
Funded status at end of period: |
|
|
|
|
|
|
|
| ||||||||
Assets less the benefit obligation of funded plans |
| $ | (325 | ) |
| $ | - | |
| $ | (254 | ) |
| $ | - | |
Benefit obligation of unfunded plans |
| (305 | ) |
| (139 | ) |
| (255 | ) |
| (135 | ) | ||||
|
| $ | (630 | ) |
| $ | (139 | ) |
| $ | (509 | ) |
| $ | (135 | ) |
As included in our consolidated balance sheets within Total assets / (Total liabilities) |
|
|
|
|
|
|
|
| ||||||||
Other non- current assets |
| $ | 1 | |
| $ | - | |
| $ | - | |
| $ | - | |
Accrued expenses and other current liabilities |
| (12 | ) |
| (10 | ) |
| (14 | ) |
| (9 | ) | ||||
Accrued postretirement benefits |
| (619 | ) |
| (129 | ) |
| (495 | ) |
| (126 | ) | ||||
|
| $ | (630 | ) |
| $ | (139 | ) |
| $ | (509 | ) |
| $ | (135 | ) |
The postretirement amounts recognized in "Accumulated other comprehensive loss," before tax effects, are presented in the table below (in millions), and includes the impact related to our equity method investments. Amounts are amortized to net periodic benefit cost over the group's average future service life of the employees or the group's average life expectancy.
|
| March 31, | ||||||||||||||
|
| 2015 |
| 2014 | ||||||||||||
|
| Pension Benefits |
| Other Benefits |
| Pension Benefits |
| Other Benefits | ||||||||
Net actuarial (losses) |
| $ | (450 | ) |
| $ | (14 | ) |
| $ | (281 | ) |
| $ | (24 | ) |
Prior service credit |
| 11 | |
| 32 | |
| 13 | |
| 80 | | ||||
Total postretirement amounts recognized in Accumulated other comprehensive (loss) income |
| $ | (439 | ) |
| $ | 18 | |
| $ | (268 | ) |
| $ | 56 | |
The estimated amounts that will be amortized from "Accumulated other comprehensive loss" into net periodic benefit costs in fiscal year 2016 (exclusive of equity method investments) are $35 million for pension benefit costs related to net actuarial losses of $37 million partially offset by prior service credits of $2 million , and $23 million for other postretirement benefits, related to amortization of prior service credits of $27 million partially offset by net actuarial losses of $4 million .
The postretirement changes recognized in "Accumulated other comprehensive loss," before tax effects, are presented in the table below (in millions), and include the impact related to our equity method investments.
|
| March 31, | ||||||||||||||
|
| 2015 |
| 2014 | ||||||||||||
|
| Pension Benefits |
| Other Benefits |
| Pension Benefits |
| Other Benefits | ||||||||
Beginning balance in Accumulated other comprehensive (loss) income |
| $ | (268 | ) |
| $ | 56 | |
| $ | (301 | ) |
| $ | (31 | ) |
Curtailments and settlements |
| - | |
| - | |
| 1 | |
| - | | ||||
Plan amendment |
| 3 | |
| (11 | ) |
| 5 | |
| 89 | | ||||
Net actuarial (loss) gain |
| (249 | ) |
| 5 | |
| 8 | |
| 15 | | ||||
Amortization of: |
| |
| |
|
|
|
| ||||||||
Prior service credits |
| (2 | ) |
| (37 | ) |
| (2 | ) |
| (24 | ) | ||||
Actuarial losses |
| 24 | |
| 5 | |
| 31 | |
| 7 | | ||||
Effect of currency exchange |
| 53 | |
| - | |
| (10 | ) |
| - | | ||||
Total postretirement amounts recognized in Accumulated other comprehensive (loss) income |
| $ | (439 | ) |
| $ | 18 | |
| $ | (268 | ) |
| $ | 56 | |
106
Novelis Inc.
NOTES TO THE CONSOLIDATED FINANCIAL STATEMENTS - (Continued)
Pension Plan Obligations
|
| March 31, | ||||||
|
| 2015 |
| 2014 | ||||
The projected benefit obligation and accumulated benefit obligation for all defined benefit pension plans: |
|
|
|
| ||||
Projected benefit obligation |
| $ | 1,863 | |
| $ | 1,672 | |
Accumulated benefit obligation |
| $ | 1,689 | |
| $ | 1,527 | |
Pension plans with projected benefit obligations in excess of plan assets: |
|
|
|
| ||||
Projected benefit obligation |
| $ | 1,760 | |
| $ | 1,672 | |
Fair value of plan assets |
| $ | 1,129 | |
| $ | 1,163 | |
Pension plans with accumulated benefit obligations in excess of plan assets: |
|
|
|
| ||||
Accumulated benefit obligation |
| $ | 1,563 | |
| $ | 1,507 | |
Fair value of plan assets |
| $ | 1,093 | |
| $ | 1,136 | |
Pension plans with projected benefit obligations less than plan assets: |
|
|
|
| ||||
Projected benefit obligation |
| $ | 103 | |
| $ | - | |
Fair value of plan assets |
| $ | 104 | |
| $ | - | |
Future Benefit Payments
|
| Pension Benefits |
| Other Benefits | ||||
2016 |
| $ | 62 | |
| $ | 10 | |
2017 |
| 65 | |
| 9 | | ||
2018 |
| 67 | |
| 8 | | ||
2019 |
| 71 | |
| 7 | | ||
2020 |
| 76 | |
| 7 | | ||
2021 through 2025 |
| 442 | |
| 43 | | ||
Total |
| $ | 783 | |
| $ | 84 | |
107
Novelis Inc.
NOTES TO THE CONSOLIDATED FINANCIAL STATEMENTS - (Continued)
Components of Net Periodic Benefit Cost
The components of net periodic benefit cost for the respective periods are listed in the table below (in millions).
|
| Pension Benefits |
| Other Benefits | ||||||||||||||||||||
|
| Year Ended March 31, |
| Year Ended | ||||||||||||||||||||
|
| 2015 |
| 2014 |
| 2013 |
| 2015 |
| 2014 |
| 2013 | ||||||||||||
Net periodic benefit costs |
|
|
|
|
|
|
|
|
|
|
|
| ||||||||||||
Service cost |
| $ | 43 | |
| $ | 48 | |
| $ | 43 | |
| $ | 5 | |
| $ | 8 | |
| $ | 10 | |
Interest cost |
| 66 | |
| 63 | |
| 64 | |
| 5 | |
| 7 | |
| 10 | | ||||||
Expected return on assets |
| (69 | ) |
| (67 | ) |
| (64 | ) |
| - | |
| - | |
| - | | ||||||
Amortization - losses |
| 22 | |
| 30 | |
| 28 | |
| 5 | |
| 7 | |
| 3 | | ||||||
Amortization - prior service (credit) |
| (2 | ) |
| (2 | ) |
| (2 | ) |
| (37 | ) |
| (24 | ) |
| (1 | ) | ||||||
Curtailment/settlement/special termination losses (gains) |
| 1 | |
| 1 | |
| 1 | |
| (1 | ) |
| - | |
| - | | ||||||
Net periodic benefit cost (income) |
| $ | 61 | |
| $ | 73 | |
| $ | 70 | |
| $ | (23 | ) |
| $ | (2 | ) |
| $ | 22 | |
Proportionate share of non-consolidated affiliates' pension costs |
| 7 | |
| 7 | |
| 5 | |
| - | |
| - | |
| - | | ||||||
Total net periodic benefit costs (income) recognized |
| $ | 68 | |
| $ | 80 | |
| $ | 75 | |
| $ | (23 | ) |
| $ | (2 | ) |
| $ | 22 | |
Actuarial Assumptions and Sensitivity Analysis
The weighted average assumptions used to determine benefit obligations and net periodic benefit costs for the respective periods are listed in the table below.
|
| Pension Benefits |
| Other Benefits | ||||||||||||||
|
| Year Ended March 31, |
| Year Ended March 31, | ||||||||||||||
|
| 2015 |
| 2014 |
| 2013 |
| 2015 |
| 2014 |
| 2013 | ||||||
Weighted average assumptions used to determine benefit obligations |
|
|
|
|
|
|
|
|
|
|
|
| ||||||
Discount rate |
| 3.1 | % |
| 4.0 | % |
| 3.9 | % |
| 3.6 | % |
| 4.1 | % |
| 3.8 | % |
Average compensation growth |
| 3.1 | % |
| 3.1 | % |
| 3.1 | % |
| 3.5 | % |
| 3.5 | % |
| 3.5 | % |
Weighted average assumptions used to determine net periodic benefit cost |
|
|
|
|
|
|
|
|
|
|
|
| ||||||
Discount rate |
| 4.0 | % |
| 3.9 | % |
| 4.4 | % |
| 4.1 | % |
| 3.8 | % |
| 4.2 | % |
Average compensation growth |
| 3.1 | % |
| 3.1 | % |
| 3.4 | % |
| 3.5 | % |
| 3.5 | % |
| 3.9 | % |
Expected return on plan assets |
| 6.1 | % |
| 6.3 | % |
| 6.4 | % |
| - | % |
| - | % |
| - | % |
In selecting the appropriate discount rate for each plan, for pension and other postretirement plans in Canada, the U.S., U.K., and other Euro zone countries, we used spot rate yield curves and individual bond matching models. For other countries we used published long-term high quality corporate bond indices with adjustments made to the index rates based on the duration of the plans' obligation.
In estimating the expected return on assets of a pension plan, consideration is given primarily to its target allocation, the current yield on long-term bonds in the country where the plan is established, and the historical risk premium of equity or real estate over long-term bond yields in each relevant country. The approach is consistent with the principle that assets with higher risk provide a greater return over the long-term. The expected long-term rate of return on plan assets is 5.6% in fiscal 2016 .
We provide unfunded health care and life insurance benefits to our retired employees in Canada, the U.S. and Brazil, for which we paid $10 million , $9 million , and $8 million in fiscal 2015 , 2014 and 2013 , respectively. The assumed health care cost trend used for measurement purposes is 7.1% for fiscal 2016 , decreasing gradually to 5% in 2019 and remaining at that level thereafter.
108
Novelis Inc.
NOTES TO THE CONSOLIDATED FINANCIAL STATEMENTS - (Continued)
A change of one percentage point in the assumed health care cost trend rates would have the following effects on our other benefits (in millions).
|
| 1% Increase |
| 1% Decrease | ||||
Sensitivity Analysis |
|
|
|
| ||||
Effect on service and interest costs |
| $ | 2 | |
| $ | (1 | ) |
Effect on benefit obligation |
| $ | 12 | |
| $ | (10 | ) |
In addition, we provide post-employment benefits, including disability, early retirement and continuation of benefits (medical, dental, and life insurance) to our former or inactive employees, which are accounted for on the accrual basis in accordance with ASC No. 712, Compensation - Retirement Benefits . "Other long-term liabilities" and "Accrued expenses and other current liabilities" on our consolidated balance sheets include $10 million and $4 million , respectively, as of March 31, 2015 , for these benefits. Comparatively, "Other long-term liabilities" and "Accrued expenses and other current liabilities" on our consolidated balance sheets include $12 million and $5 million , respectively, as of March 31, 2014 .
Investment Policy and Asset Allocation
The Company's overall investment strategy is to achieve a mix of approximately 50% of investments for long-term growth (equities, real estate) and 50% for near-term benefit payments (debt securities, other) with a wide diversification of asset categories, investment styles, fund strategies and fund managers. Since most of the defined benefit plans are closed to new entrants, we expect this strategy to gradually shift more investments toward near-term benefit payments.
Each of our funded pension plans is governed by an Investment Fiduciary, who establishes an investment policy appropriate for the pension plan. The Investment Fiduciary is responsible for selecting the asset allocation for each plan, monitoring investment managers, monitoring returns versus benchmarks and monitoring compliance with the investment policy. The targeted allocation ranges by asset class, and the actual allocation percentages for each class are listed in the table below.
Asset Category |
| Target Allocation Ranges |
| Allocation in Aggregate as of March 31, | ||
2015 |
| 2014 | ||||
Equity |
| 17 - 53% |
| 36% |
| 39% |
Fixed income |
| 47 - 77% |
| 60% |
| 57% |
Real estate |
| 0 - 15% |
| 1% |
| 1% |
Other |
| 0 - 11% |
| 3% |
| 3% |
Fair Value of Plan Assets
The following pension plan assets are measured and recognized at fair value on a recurring basis (in millions). Please see Note 17- Fair value measurements for a description of the fair value hierarchy. The U.S. and Canadian pension plan assets are invested exclusively in commingled funds and classified in Level 2, and the U.K., Switzerland, and South Korea pension plan assets are invested in both direct investments (Levels 1 and 2) and commingled funds (Level 2).
Pension Plan Assets
|
| March 31, 2015 |
| March 31, 2014 | ||||||||||||||||||||||||||||
|
| Level 1 |
| Level 2 |
| Level 3 |
| Total |
| Level 1 |
| Level 2 |
| Level 3 |
| Total | ||||||||||||||||
Equity |
| $ | 85 | |
| $ | 361 | |
| $ | - | |
| $ | 446 | |
| $ | 48 | |
| $ | 405 | |
| $ | - | |
| $ | 453 | |
Fixed income |
| 135 | |
| 608 | |
| - | |
| 743 | |
| - | |
| 665 | |
| - | |
| 665 | | ||||||||
Real estate |
| - | |
| 15 | |
| - | |
| 15 | |
| - | |
| 15 | |
| - | |
| 15 | | ||||||||
Cash and cash equivalents |
| 8 | |
| - | |
| - | |
| 8 | |
| 6 | |
| - | |
| - | |
| 6 | | ||||||||
Other |
| - | |
| 21 | |
| - | |
| 21 | |
| - | |
| 24 | |
| - | |
| 24 | | ||||||||
Total |
| $ | 228 | |
| $ | 1,005 | |
| $ | - | |
| $ | 1,233 | |
| $ | 54 | |
| $ | 1,109 | |
| $ | - | |
| $ | 1,163 | |
109
Novelis Inc.
NOTES TO THE CONSOLIDATED FINANCIAL STATEMENTS - (Continued)
14. CURRENCY (GAINS) LOSSES
The following currency (gains) losses are included in "Other expense (income), net" in the accompanying consolidated statements of operations (in millions).
|
| Year Ended March 31, | ||||||||||
|
| 2015 |
| 2014 |
| 2013 | ||||||
Loss (gain) on remeasurement of monetary assets and liabilities, net |
| $ | 14 | |
| $ | (26 | ) |
| $ | (16 | ) |
Loss released from accumulated other comprehensive income |
| 3 | |
| 2 | |
| 1 | | |||
Loss recognized on balance sheet remeasurement currency exchange contracts, net |
| 10 | |
| 17 | |
| 5 | | |||
Currency losses (gains), net |
| $ | 27 | |
| $ | (7 | ) |
| $ | (10 | ) |
The following currency (losses) gains are included in Accumulated other comprehensive loss ("AOCI") and "Noncontrolling interests" in the accompanying consolidated balance sheets (in millions).
|
| Year Ended March 31, | ||||||||||
|
| 2015 |
| 2014 |
| 2013 | ||||||
Cumulative currency translation adjustment - beginning of period |
| $ | 90 | |
| $ | (30 | ) |
| $ | 23 | |
Effect of changes in exchange rates |
| (304 | ) |
| 120 | |
| (42 | ) | |||
Sale of investment in foreign entities (A) |
| - | |
| - | |
| (11 | ) | |||
Cumulative currency translation adjustment - end of period |
| $ | (214 | ) |
| $ | 90 | |
| $ | (30 | ) |
(A) | We reclassified $11 million of cumulative currency gains from AOCI to "Gain on assets held for sale, net" in the year ended March 31, 2013, related to the sale of three aluminum foil and packaging plants in Europe. |
110
Novelis Inc.
NOTES TO THE CONSOLIDATED FINANCIAL STATEMENTS - (Continued)
15. FINANCIAL INSTRUMENTS AND COMMODITY CONTRACTS
The following tables summarize the gross fair values of our financial instruments and commodity contracts as of March 31, 2015 and 2014 (in millions):
|
| March 31, 2015 | ||||||||||||||||||
|
| Assets |
| Liabilities |
| Net Fair Value | ||||||||||||||
|
| Current |
| Noncurrent(A) |
| Current |
| Noncurrent(A) |
| Assets/(Liabilities) | ||||||||||
Derivatives designated as hedging instruments: |
|
|
|
|
|
|
|
|
|
| ||||||||||
Cash flow hedges |
|
|
|
|
|
|
|
|
|
| ||||||||||
Aluminum contracts |
| $ | 15 | |
| $ | - | |
| $ | (5 | ) |
| $ | - | |
| $ | 10 | |
Currency exchange contracts |
| 4 | |
| - | |
| (42 | ) |
| (15 | ) |
| (53 | ) | |||||
Energy contracts |
| - | |
| - | |
| (6 | ) |
| (2 | ) |
| (8 | ) | |||||
Interest rate swaps |
| - | |
| - | |
| (1 | ) |
| - | |
| (1 | ) | |||||
Net Investment hedges |
|
|
|
|
|
|
|
|
|
| ||||||||||
Currency exchange contracts |
| 5 | |
| - | |
| - | |
| - | |
| 5 | | |||||
Total derivatives designated as hedging instruments |
| 24 | |
| - | |
| (54 | ) |
| (17 | ) |
| (47 | ) | |||||
Derivatives not designated as hedging instruments |
|
|
|
|
|
|
|
|
|
| ||||||||||
Aluminum contracts |
| 24 | |
| - | |
| (26 | ) |
| - | |
| (2 | ) | |||||
Currency exchange contracts |
| 26 | |
| - | |
| (54 | ) |
| - | |
| (28 | ) | |||||
Energy contracts |
| 3 | |
| - | |
| (15 | ) |
| (7 | ) |
| (19 | ) | |||||
Total derivatives not designated as hedging instruments |
| 53 | |
| - | |
| (95 | ) |
| (7 | ) |
| (49 | ) | |||||
Total derivative fair value |
| $ | 77 | |
| $ | - | |
| $ | (149 | ) |
| $ | (24 | ) |
| $ | (96 | ) |
|
| March 31, 2014 | ||||||||||||||||||
|
| Assets |
| Liabilities |
| Net Fair Value | ||||||||||||||
|
| Current |
| Noncurrent(A) |
| Current |
| Noncurrent(A) |
| Assets/(Liabilities) | ||||||||||
Derivatives designated as hedging instruments: |
|
|
|
|
|
|
|
|
|
| ||||||||||
Cash flow hedges |
|
|
|
|
|
|
|
|
|
| ||||||||||
Aluminum contracts |
| $ | 4 | |
| $ | - | |
| $ | (7 | ) |
| $ | - | |
| $ | (3 | ) |
Currency exchange contracts |
| 15 | |
| 4 | |
| (13 | ) |
| (6 | ) |
| - | | |||||
Energy contracts |
| 3 | |
| - | |
| - | |
| - | |
| 3 | | |||||
Net Investment hedges |
|
|
|
|
|
|
|
|
|
| ||||||||||
Currency exchange contracts |
| - | |
| - | |
| (1 | ) |
| - | |
| (1 | ) | |||||
Fair value hedges |
|
|
|
|
|
|
|
|
|
| ||||||||||
Aluminum contracts |
| - | |
| - | |
| (1 | ) |
| - | |
| (1 | ) | |||||
Total derivatives designated as hedging instruments |
| 22 | |
| 4 | |
| (22 | ) |
| (6 | ) |
| (2 | ) | |||||
Derivatives not designated as hedging instruments |
|
|
|
|
|
|
|
|
|
| ||||||||||
Aluminum contracts |
| 19 | |
| - | |
| (28 | ) |
| - | |
| (9 | ) | |||||
Currency exchange contracts |
| 9 | |
| - | |
| (3 | ) |
| - | |
| 6 | | |||||
Energy contracts |
| 1 | |
| - | |
| (7 | ) |
| (13 | ) |
| (19 | ) | |||||
Total derivatives not designated as hedging instruments |
| 29 | |
| - | |
| (38 | ) |
| (13 | ) |
| (22 | ) | |||||
Total derivative fair value |
| $ | 51 | |
| $ | 4 | |
| $ | (60 | ) |
| $ | (19 | ) |
| $ | (24 | ) |
111
Novelis Inc.
NOTES TO THE CONSOLIDATED FINANCIAL STATEMENTS - (Continued)
(A) | The noncurrent portions of derivative assets and liabilities are included in "Other long-term assets-third parties" and in "Other long-term liabilities" respectively, in the accompanying consolidated balance sheets. |
Aluminum
We use derivative instruments to preserve our conversion margins and manage the timing differences associated with metal price lag. We use over-the-counter derivatives indexed to the London Metals Exchange (LME) and from time to time we also use over-the-counter derivatives indexed to the Midwest transaction premium (collectively referred to as our "aluminum derivative forward contracts") to reduce our exposure to fluctuating metal prices associated with the period of time between the pricing of our purchases of inventory and the pricing of the sale of that inventory to our customers. We also purchase forward LME aluminum contracts simultaneously with our sales contracts with customers that contain fixed metal prices. These LME aluminum forward contracts directly hedge the economic risk of future metal price fluctuations to better match the selling price of the metal with the purchase price of the metal.
Price risk exposure arises from commitments to sell aluminum in future periods at fixed prices. We identify and designate certain LME aluminum forward contracts as fair value hedges of the metal price risk associated with fixed price sales commitments that qualify as firm commitments. Such exposures do not extend beyond two years in length. We had 2 kt and 9 kt of outstanding aluminum forward purchase contracts designated as fair value hedges as of March 31, 2015 and 2014 , respectively. One kilotonne (kt) is 1,000 metric tonnes.
|
| Amount of Gain (Loss) Recognized on Changes in Fair Value | ||||||
|
| Year Ended March 31, | ||||||
|
| 2015 |
| 2014 | ||||
Fair Value Hedges of Metal Price Risk |
|
|
|
| ||||
Derivative Contracts |
| $ | - | |
| $ | (3 | ) |
Designated Hedged Items |
| - | |
| 3 | | ||
Net Ineffectiveness (A) |
| $ | - | |
| $ | - | |
(A) | Effective portion is recorded in "Net sales" and net ineffectiveness in "Other expense (income), net". There was no amount excluded from the assessment of hedge effectiveness related to Fair Value Hedges. |
Price risk arises due to fluctuating aluminum prices between the time the sales order is committed and the time the order is shipped. We identify and designate certain LME aluminum forward purchase contracts as cash flow hedges of the metal price risk associated with our future metal purchases that vary based on changes in the price of aluminum. Such exposures do not extend beyond two years in length. We had 1 kt and 16 kt of outstanding aluminum forward purchase contracts designated as cash flow hedges as of March 31, 2015 and 2014 , respectively.
Price risk exposure arises due to the timing lag between the LME based pricing of raw material metal purchases and the LME based pricing of finished product sales. We identify and designate certain LME aluminum forward sales contracts as cash flow hedges of the metal price risk associated with our future metal sales that vary based on changes in the price of aluminum. Such exposures do not extend beyond two years in length. We had 285 kt and 222 kt of outstanding aluminum forward sales contracts designated as cash flow hedges as of March 31, 2015 and 2014 , respectively.
The remaining balance of our aluminum derivative contracts are not designated as accounting hedges. As of March 31, 2015 and 2014 , we had 36 kt and 105 kt, respectively, of outstanding aluminum sales contracts not designated as hedges. The average duration of undesignated contracts is less than six months . The following table summarizes our notional amount (in kt).
112
Novelis Inc.
NOTES TO THE CONSOLIDATED FINANCIAL STATEMENTS - (Continued)
|
| March 31, | ||||
|
| 2015 |
| 2014 | ||
Hedge Type |
|
|
|
| ||
Purchase (Sale) |
|
|
|
| ||
Cash flow purchases |
| 1 | |
| 16 | |
Cash flow sales |
| (285 | ) |
| (222 | ) |
Fair value |
| 2 | |
| 9 | |
Not designated |
| (36 | ) |
| (105 | ) |
Total, net |
| (318 | ) |
| (302 | ) |
Foreign Currency
We use foreign exchange forward contracts, cross-currency swaps and options to manage our exposure to changes in exchange rates. These exposures arise from recorded assets and liabilities, firm commitments and forecasted cash flows denominated in currencies other than the functional currency of certain operations.
We use foreign currency contracts to hedge expected future foreign currency transactions, which include capital expenditures. These contracts cover the same periods as known or expected exposures. We had total notional amounts of $590 million and $724 million in outstanding foreign currency forwards designated as cash flow hedges as of March 31, 2015 and 2014 , respectively.
We use foreign currency contracts to hedge our foreign currency exposure to our net investment in foreign subsidiaries. We had $28 million outstanding foreign currency forwards designated as net investment hedges as of March 31, 2015 . As of March 31, 2014 , we had $61 million outstanding foreign currency forwards designated as net investment hedges.
As of March 31, 2015 and 2014 , we had outstanding currency exchange contracts with a total notional amount of $868 million and $649 million , respectively, which were not designated as hedges. Contracts representing the majority of this notional amount will mature during the first and second quarter of fiscal 2016 .
Energy
We own an interest in an electricity swap which we formerly designated as a cash flow hedge of our exposure to fluctuating electricity prices. As of March 31, 2011, due to significant credit deterioration of our counterparty, we discontinued hedge accounting for this electricity swap. Less than 1 million of notional megawatt hours remained outstanding as of March 31, 2015 , and the fair value of this swap was a liability of $16 million as of March 31, 2015 . As of March 31, 2014 , the fair value of this electricity swap was a liability of $19 million .
We use natural gas forward purchase contracts to manage our exposure to fluctuating energy prices in North America. We had 7 million MMBTUs designated as cash flow hedges as of March 31, 2015 , and the fair value was a liability of $8 million . There were 9.5 million MMBTUs of natural gas forward purchase contracts designated as cash flow hedges as of March 31, 2014 and the fair value was an asset of $3 million . As of March 31, 2015 and 2014 , we had 2 million MMBTUs and 1.5 million MMBTUs, respectively, of natural gas forward purchase contracts that were not designated as hedges. The fair value as of March 31, 2015 and 2014 was a liability of $3 million and an asset of less than $1 million , respectively, for the forward purchase contracts not designated as hedges. The average duration of undesignated contracts is approximately one year in length. One MMBTU is the equivalent of one decatherm, or one million British Thermal Units.
Interest Rate
As of March 31, 2015 , we swapped $78 million ( KRW 86 billion ) floating rate loans to a weighted average fixed rate of 3.69% . All swaps expire concurrent with the maturity of the related loans. As of March 31, 2015 and 2014 , $78 million ( KRW 86 billion ) and $127 million ( KRW 136 billion ) were designated as cash flow hedges, respectively.
113
Novelis Inc.
NOTES TO THE CONSOLIDATED FINANCIAL STATEMENTS - (Continued)
Gain (Loss) Recognition
The following table summarizes the gains (losses) associated with the change in fair value of derivative instruments not designated as hedges and the ineffectiveness of designated derivatives recognized in "Other expense (income), net" (in millions). Gains (losses) recognized in other line items in the consolidated statement of operations are separately disclosed within this footnote.
|
| Year Ended March 31, | ||||||||||
|
| 2015 |
| 2014 |
| 2013 | ||||||
Derivative Instruments Not Designated as Hedges |
|
|
|
|
|
| ||||||
Aluminum contracts |
| $ | (31 | ) |
| $ | (4 | ) |
| $ | (10 | ) |
Currency exchange contracts |
| (5 | ) |
| (15 | ) |
| 3 | | |||
Energy contracts (A) |
| 2 | |
| 14 | |
| 15 | | |||
(Loss) gain recognized in "Other expense (income), net" |
| (34 | ) |
| (5 | ) |
| 8 | | |||
Derivative Instruments Designated as Hedges |
|
|
|
|
|
| ||||||
Gain recognized in "Other expense (income), net" (B) |
| 19 | |
| 38 | |
| 28 | | |||
Total (loss) gain recognized in "Other expense (income), net" |
| $ | (15 | ) |
| $ | 33 | |
| $ | 36 | |
Balance sheet remeasurement currency exchange contract losses |
| $ | (13 | ) |
| $ | (19 | ) |
| $ | (6 | ) |
Realized (losses) gains, net |
| (2 | ) |
| 62 | |
| 28 | | |||
Unrealized (losses) gains on other derivative instruments, net |
| - | |
| (10 | ) |
| 14 | | |||
Total (loss) gain recognized in "Other expense (income), net" |
| $ | (15 | ) |
| $ | 33 | |
| $ | 36 | |
(A) | Includes amounts related to de-designated electricity swap and natural gas swaps not designated as hedges. |
(B) | Amount includes: forward market premium/discount excluded from hedging relationship and ineffectiveness on designated aluminum and foreign currency capex contracts; releases to income from AOCI on balance sheet remeasurement contracts; and ineffectiveness of fair value hedges involving aluminum derivatives. |
The following table summarizes the impact on AOCI and earnings of derivative instruments designated as cash flow and net investment hedges (in millions). Within the next twelve months, we expect to reclassify $36 million of losses from "AOCI" to earnings, before taxes.
|
| Amount of Gain (Loss) Recognized in OCI (Effective Portion) |
| Amount of Gain (Loss) Recognized in "Other Expense (Income), net" (Ineffective and Excluded Portion) | ||||||||||||||||||||
|
| Year Ended March 31, |
| Year Ended March 31, | ||||||||||||||||||||
|
| 2015 |
| 2014 |
| 2013 |
| 2015 |
| 2014 |
| 2013 | ||||||||||||
Cash flow hedging derivatives |
|
|
|
|
|
|
|
|
|
|
|
| ||||||||||||
Aluminum contracts |
| $ | (26 | ) |
| $ | 35 | |
| $ | 34 | |
| $ | 24 | |
| $ | 39 | |
| $ | 29 | |
Currency exchange contracts |
| (44 | ) |
| (16 | ) |
| (21 | ) |
| (2 | ) |
| 1 | |
| 2 | | ||||||
Energy contracts |
| (12 | ) |
| 1 | |
| 1 | |
| - | |
| - | |
| - | | ||||||
Interest Rate Swaps |
| (1 | ) |
| - | |
| (1 | ) |
| - | |
| - | |
| - | | ||||||
Total cash flow hedging derivatives |
| (83 | ) |
| 20 | |
| 13 | |
| 22 | |
| 40 | |
| 31 | | ||||||
Net Investment derivatives |
|
|
|
|
|
|
|
|
|
|
|
| ||||||||||||
Currency exchange contracts |
| 11 | |
| (3 | ) |
| 1 | |
| - | |
| - | |
| - | | ||||||
Total |
| $ | (72 | ) |
| $ | 17 | |
| $ | 14 | |
| $ | 22 | |
| $ | 40 | |
| $ | 31 | |
114
Novelis Inc.
NOTES TO THE CONSOLIDATED FINANCIAL STATEMENTS - (Continued)
Gain (Loss) Reclassification
|
| Amount of Gain (Loss) Reclassified from AOCI into Income/(Expense) (Effective Portion) Year Ended March 31, |
| Location of Gain (Loss) Reclassified from AOCI into Earnings | ||||||||||
Cash flow hedging derivatives |
| 2015 |
| 2014 |
| 2013 |
|
| ||||||
Energy contracts (A) |
| $ | (5 | ) |
| $ | (5 | ) |
| $ | (5 | ) |
| Other expense (income), net |
Aluminum contracts |
| (40 | ) |
| 53 | |
| 19 | |
| Cost of goods sold (B) | |||
Aluminum contracts |
| - | |
| 7 | |
| 12 | |
| Net sales | |||
Currency exchange contracts |
| (14 | ) |
| (14 | ) |
| (15 | ) |
| Cost of goods sold (B) | |||
Currency exchange contracts |
| (1 | ) |
| (1 | ) |
| (2 | ) |
| SG&A | |||
Currency exchange contracts |
| 18 | |
| 3 | |
| - | |
| Net sales | |||
Currency exchange contracts |
| (3 | ) |
| (2 | ) |
| (1 | ) |
| Other expense (income), net | |||
Currency exchange contracts |
| 7 | |
| - | |
| - | |
| Gain on assets held for sale, net | |||
Currency exchange contracts |
| (1 | ) |
| - | |
| - | |
| Depreciation and amortization | |||
Total |
| (39 | ) |
| 41 | |
| 8 | |
| (Loss) income before taxes | |||
|
| 8 | |
| (16 | ) |
| (2 | ) |
| Income tax benefit (provision) | |||
|
| $ | (31 | ) |
| $ | 25 | |
| $ | 6 | |
| Net (loss) income |
(A) | Includes amounts related to de-designated electricity swap. AOCI related to this swap is amortized to income over the remaining term of the hedged item. Amounts reclassified from AOCI into income/(expense) related to natural gas swaps for the periods presented were less than $1 million . AOCI releases related to natural gas swaps are recorded in "Cost of goods sold (exclusive of depreciation and amortization)." |
(B) | "Cost of goods sold" is exclusive of depreciation and amortization. |
115
Novelis Inc.
NOTES TO THE CONSOLIDATED FINANCIAL STATEMENTS - (Continued)
16. ACCUMULATED OTHER COMPREHENSIVE LOSS
The following table summarizes the change in the components of accumulated other comprehensive loss net of tax and "Noncontrolling interests", for the periods presented (in millions).
|
| (A) Currency Translation |
|
(B) Cash Flow Hedges |
| (C) Postretirement Benefit Plans |
| Total | ||||||||
Balance as of March 31, 2012 |
| $ | 20 | |
| $ | (7 | ) |
| $ | (204 | ) |
| $ | (191 | ) |
Other comprehensive income before reclassifications |
| (42 | ) |
| 11 | |
| (49 | ) |
| (80 | ) | ||||
Amounts reclassified from AOCI, net |
| (11 | ) |
| (6 | ) |
| 20 | |
| 3 | | ||||
Net current-period other comprehensive income (loss) |
| (53 | ) |
| 5 | |
| (29 | ) |
| (77 | ) | ||||
Balance as of March 31, 2013 |
| (33 | ) |
| (2 | ) |
| (233 | ) |
| (268 | ) | ||||
Other comprehensive income before reclassifications |
| 122 | |
| 7 | |
| 64 | |
| 193 | | ||||
Amounts reclassified from AOCI, net |
| - | |
| (25 | ) |
| 9 | |
| (16 | ) | ||||
Net current-period other comprehensive income (loss) |
| 122 | |
| (18 | ) |
| 73 | |
| 177 | | ||||
Balance as of March 31, 2014 |
| 89 | |
| (20 | ) |
| (160 | ) |
| (91 | ) | ||||
Other comprehensive income before reclassifications |
| (302 | ) |
| (74 | ) |
| (118 | ) |
| (494 | ) | ||||
Amounts reclassified from AOCI, net |
| - | |
| 31 | |
| (7 | ) |
| 24 | | ||||
Net current-period other comprehensive (loss) income |
| (302 | ) |
| (43 | ) |
| (125 | ) |
| (470 | ) | ||||
Balance as of March 31, 2015 |
| $ | (213 | ) |
| $ | (63 | ) |
| $ | (285 | ) |
| $ | (561 | ) |
(A) We reclassified $11 million of cumulative currency gains from AOCI to "Gain on assets held for sale" in the year ended March 31, 2013, related to the sale of three aluminum foil and packaging plants in Europe.
(B) | For additional information on our cash flow hedges see Note 15 - Financial Instruments and Commodity Contracts. |
(C) | For additional information on our postretirement benefit plans see Note 13 - Postretirement Benefit Plans. |
For the year ended March 31, 2015, we recorded a $9 million reclassification adjustment of previous period s' accumulated actuarial net losses in postretirement benefit plans, net of tax, for our Logan joint venture from "AOCI attributable to our common shareholder" to "Non-controlling interests." This adjustment is not material to the current or any prior periods' financial statements.
116
Novelis Inc.
NOTES TO THE CONSOLIDATED FINANCIAL STATEMENTS - (Continued)
17. FAIR VALUE MEASUREMENTS
We record certain assets and liabilities, primarily derivative instruments, on our consolidated balance sheets at fair value. We also disclose the fair values of certain financial instruments, including debt and loans receivable, which are not recorded at fair value. Our objective in measuring fair value is to estimate an exit price in an orderly transaction between market participants on the measurement date. We consider factors such as liquidity, bid/offer spreads and nonperformance risk, including our own nonperformance risk, in measuring fair value. We use observable market inputs wherever possible. To the extent observable market inputs are not available, our fair value measurements will reflect the assumptions we used. We grade the level of the inputs and assumptions used according to a three-tier hierarchy:
Level 1 - Unadjusted quoted prices in active markets for identical, unrestricted assets or liabilities we have the ability to access at the measurement date.
Level 2 - Inputs other than quoted prices included within Level 1 that are observable for the asset or liability, either directly or indirectly.
Level 3 - Unobservable inputs for which there is little or no market data, which require us to develop our own assumptions based on the best information available as what market participants would use in pricing the asset or liability.
The following section describes the valuation methodologies we used to measure our various financial instruments at fair value, including an indication of the level in the fair value hierarchy in which each instrument is generally classified.
Derivative Contracts
For certain derivative contracts with fair values based upon trades in liquid markets, such as aluminum, foreign exchange and natural gas forward contracts and options, valuation model inputs can generally be verified and valuation techniques do not involve significant judgment. The fair values of such financial instruments are generally classified within Level 2 of the fair value hierarchy.
The majority of our derivative contracts are valued using industry-standard models with observable market inputs as their basis, such as time value, forward interest rates, volatility factors, and current (spot) and forward market prices. We generally classify these instruments within Level 2 of the valuation hierarchy. Such derivatives include interest rate swaps, cross-currency swaps, foreign currency contracts, aluminum derivative contracts, and natural gas forward contracts.
We classify derivative contracts that are valued based on models with significant unobservable market inputs as Level 3 of the valuation hierarchy. Our electricity swap, which is our only Level 3 derivative contract, represents an agreement to buy electricity at a fixed price at our Oswego, New York facility. Forward prices are not observable for this market, so we must make certain assumptions based on available information we believe to be relevant to market participants. We use observable forward prices for a geographically nearby market and adjust for 1) historical spreads between the cash prices of the two markets, and 2) historical spreads between retail and wholesale prices.
The average forward price at March 31, 2015 , estimated using the method described above, was $51 per megawatt hour, which represented a $5 premium over forward prices in the nearby observable market. The actual rate from the most recent swap settlement was approximately $50 per megawatt hour. Each $1 per megawatt hour decline in price decreases the valuation of the electricity swap by less than $1 million .
For Level 2 and 3 of the fair value hierarchy, where appropriate, valuations are adjusted for various factors such as liquidity, bid/offer spreads and credit considerations (nonperformance risk). We regularly monitor these factors along with significant market inputs and assumptions used in our fair value measurements and evaluate the level of the valuation input according to the fair value hierarchy. This may result in a transfer between levels in the hierarchy from period to period. As of March 31, 2015 and March 31, 2014 , we did not have any Level 1 derivative contracts. No amounts were transferred between levels in the fair value hierarchy.
All of the Company's derivative instruments are carried at fair value in the statements of financial position prior to considering master netting agreements. The table below also discloses the net fair value of the derivative instruments after considering the impact of master netting agreements.
117
Novelis Inc.
NOTES TO THE CONSOLIDATED FINANCIAL STATEMENTS - (Continued)
The following tables present our derivative assets and liabilities which were measured and recognized at fair value on a recurring basis classified under the appropriate level of the fair value hierarchy as of March 31, 2015 and March 31, 2014 (in millions).
|
| March 31, | ||||||||||||||
|
| 2015 |
| 2014 | ||||||||||||
|
| Assets |
| Liabilities |
| Assets |
| Liabilities | ||||||||
Level 2 instruments |
|
|
|
|
|
|
|
| ||||||||
Aluminum contracts |
| $ | 39 | |
| $ | (31 | ) |
| $ | 23 | |
| $ | (36 | ) |
Currency exchange contracts |
| 35 | |
| (111 | ) |
| 28 | |
| (23 | ) | ||||
Energy contracts |
| 3 | |
| (14 | ) |
| 4 | |
| (1 | ) | ||||
Interest rate swaps |
| - | |
| (1 | ) |
| - | |
| - | | ||||
Total level 2 instruments |
| 77 | |
| (157 | ) |
| 55 | |
| (60 | ) | ||||
Level 3 instruments |
|
|
|
|
|
|
|
| ||||||||
Energy contracts |
| - | |
| (16 | ) |
| - | |
| (19 | ) | ||||
Total level 3 instruments |
| - | |
| (16 | ) |
| - | |
| (19 | ) | ||||
Total gross |
| $ | 77 | |
| $ | (173 | ) |
| $ | 55 | |
| $ | (79 | ) |
Netting adjustment (A) |
| $ | (28 | ) |
| $ | 28 | |
| $ | (20 | ) |
| $ | 20 | |
Total net |
| $ | 49 | |
| $ | (145 | ) |
| $ | 35 | |
| $ | (59 | ) |
(A) Amounts represent the impact of legally enforceable master netting agreements that allow the Company to settle positive and negative positions with the same counterparties.
We recognized unrealized losses of $2 million for the year ended March 31, 2015 related to Level 3 financial instruments that were still held as of March 31, 2015 . These unrealized losses were included in "Other expense (income), net."
The following table presents a reconciliation of fair value activity for Level 3 derivative contracts (in millions).
| Level 3 – Derivative Instruments (A) | ||
Balance as of March 31, 2013 | $ | (27 | ) |
Unrealized gain included in earnings (B) | 19 | | |
Settlements | (11 | ) | |
Balance as of March 31, 2014 | $ | (19 | ) |
Unrealized gain included in earnings (B) | 10 | | |
Settlements | (7 | ) | |
Balance as of March 31, 2015 | $ | (16 | ) |
(A) Represents net derivative liabilities.
(B) Included in "Other expense (income), net."
118
Novelis Inc.
NOTES TO THE CONSOLIDATED FINANCIAL STATEMENTS - (Continued)
Financial Instruments Not Recorded at Fair Value
The table below presents the estimated fair value of certain financial instruments not recorded at fair value on a recurring basis (in millions). The table excludes short-term financial assets and liabilities for which we believe carrying value approximates fair value. The fair value of long-term receivables is based on anticipated cash flows, which approximates carrying value and is classified as Level 2. We value long-term debt using Level 2 inputs. Valuations are based on either market and/or broker ask prices when available or on a standard credit adjusted discounted cash flow model using market observable inputs.
|
| March 31, | ||||||||||||||
|
| 2015 |
| 2014 | ||||||||||||
|
| Carrying Value |
| Fair Value |
| Carrying Value |
| Fair Value | ||||||||
Assets |
|
|
|
|
|
|
|
| ||||||||
Long-term receivables from related parties |
| $ | 15 | |
| $ | 15 | |
| $ | 12 | |
| $ | 12 | |
Liabilities |
|
|
|
|
|
|
|
| ||||||||
Total debt - third parties (excluding short term borrowings) |
| $ | 4,457 | |
| $ | 4,659 | |
| $ | 4,451 | |
| $ | 4,734 | |
119
Novelis Inc.
NOTES TO THE CONSOLIDATED FINANCIAL STATEMENTS - (Continued)
18. OTHER EXPENSE (INCOME)
"Other expense (income), net" is comprised of the following (in millions).
|
| Year Ended March 31, | ||||||||||
|
| 2015 |
| 2014 |
| 2013 | ||||||
Foreign currency remeasurement losses (gains), net (A) |
| $ | 27 | |
| $ | (7 | ) |
| $ | (10 | ) |
Loss (gain) on change in fair value of other unrealized derivative instruments, net |
| - | |
| 10 | |
| (14 | ) | |||
Loss (gain) on change in fair value of other realized derivative instruments, net |
| 2 | |
| (62 | ) |
| (28 | ) | |||
Loss on sale of assets, net |
| 5 | |
| 9 | |
| 6 | | |||
Loss on Brazilian tax litigation, net (B) |
| 7 | |
| 6 | |
| 8 | | |||
Interest income |
| (7 | ) |
| (6 | ) |
| (5 | ) | |||
Gain on business interruption insurance recovery, net (C) |
| (19 | ) |
| - | |
| (11 | ) | |||
Other, net |
| 2 | |
| 9 | |
| 2 | | |||
Other expense (income), net |
| $ | 17 | |
| $ | (41 | ) |
| $ | (52 | ) |
(A) | Includes "(Gain) loss recognized on balance sheet remeasurement currency exchange contracts, net." |
(B) | See Note 20 – Commitments and Contingencies – Brazil Tax and Legal Matters for further details. |
(C) | We recognized a total gain of $19 million during the year ended March 31, 2015 related to business interruption recovery claims, which partially offset actual business losses experienced in the same fiscal year. This gain includes an insurance settlement which resulted in a gain of $6 million related to lost shipments and profits resulting from an electrical short circuit impacting a hot mill motor at one of our facilities in our Europe segment in the second quarter of 2015. Additionally, we experienced an outage at the hot mill in the Logan facility in North America due to an unexpected failure of a motor, which resulted in lost shipments and profits. A repaired motor was installed and operations at the hot mill resumed within approximately three weeks. The Company reached a partial insurance settlement, which resulted in a gain of $13 million . |
We recognized a net gain of $11 million during the year ended March 31, 2013 related to another business interruption recovery claim from an earlier fiscal year. This settlement related to a fire at the sole can plant of one of our customers, which caused the loss of a supply contract in our North America segment.
120
Novelis Inc.
NOTES TO THE CONSOLIDATED FINANCIAL STATEMENTS - (Continued)
19. INCOME TAXES
We are subject to Canadian and United States federal, state, and local income taxes as well as other foreign income taxes. The domestic (Canada) and foreign components of our "Income before income taxes" (and after removing our "Equity in net loss of non-consolidated affiliates") are as follows (in millions).
|
| Year Ended March 31, | ||||||||||
|
| 2015 |
| 2014 |
| 2013 | ||||||
Domestic (Canada) |
| $ | (267 | ) |
| $ | (294 | ) |
| $ | (263 | ) |
Foreign (all other countries) |
| 434 | |
| 421 | |
| 565 | | |||
Pre-tax income before equity in net loss of non-consolidated affiliates |
| $ | 167 | |
| $ | 127 | |
| $ | 302 | |
|
| Year Ended March 31, | ||||||||||
|
| 2015 |
| 2014 |
| 2013 | ||||||
Current provision (benefit): |
|
|
|
|
|
| ||||||
Domestic (Canada) |
| $ | 4 | |
| $ | 12 | |
| $ | 11 | |
Foreign (all other countries) |
| 98 | |
| 128 | |
| 103 | | |||
Total current |
| 102 | |
| 140 | |
| 114 | | |||
Deferred provision (benefit): |
|
|
|
|
|
| ||||||
Domestic (Canada) |
| - | |
| - | |
| - | | |||
Foreign (all other countries) |
| (88 | ) |
| (129 | ) |
| (31 | ) | |||
Total deferred |
| (88 | ) |
| (129 | ) |
| (31 | ) | |||
Income tax provision |
| $ | 14 | |
| $ | 11 | |
| $ | 83 | |
|
| Year Ended March 31, | ||||||||||
|
| 2015 |
| 2014 |
| 2013 | ||||||
Pre-tax income before equity in net loss on non-consolidated affiliates |
| $ | 167 | |
| $ | 127 | |
| $ | 302 | |
Canadian Statutory tax rate |
| 25 | % |
| 25 | % |
| 26 | % | |||
Provision at the Canadian statutory rate |
| $ | 42 | |
| $ | 32 | |
| $ | 79 | |
Increase (decrease) for taxes on income (loss) resulting from: |
|
|
|
|
|
| ||||||
Exchange translation items |
| (22 | ) |
| - | |
| (2 | ) | |||
Exchange remeasurement of deferred income taxes |
| (31 | ) |
| (20 | ) |
| (19 | ) | |||
Change in valuation allowances |
| 95 | |
| 94 | |
| 84 | | |||
Tax credits and other allowances |
| (22 | ) |
| (38 | ) |
| (8 | ) | |||
Income items not subject to tax |
| 2 | |
| (6 | ) |
| - | | |||
State tax (benefit) expense, net |
| (7 | ) |
| (7 | ) |
| 3 | | |||
Dividends not subject to tax |
| (52 | ) |
| (52 | ) |
| (53 | ) | |||
Enacted tax rate changes |
| (1 | ) |
| 3 | |
| 1 | | |||
Tax rate differences on foreign earnings |
| 7 | |
| (4 | ) |
| 9 | | |||
Uncertain tax positions |
| 10 | |
| 8 | |
| 2 | | |||
Prior year adjustments |
| 2 | |
| (1 | ) |
| (5 | ) | |||
Income tax settlements |
| (6 | ) |
| - | |
| - | | |||
Other - net |
| (3 | ) |
| 2 | |
| (8 | ) | |||
Income tax provision |
| $ | 14 | |
| $ | 11 | |
| $ | 83 | |
Effective tax rate |
| 8 | % |
| 9 | % |
| 27 | % | |||
121
Novelis Inc.
NOTES TO THE CONSOLIDATED FINANCIAL STATEMENTS - (Continued)
Our effective tax rate differs from the Canadian statutory rate primarily due to the following factors: (1) pre-tax foreign currency gains or losses with no tax effect and the tax effect of U.S. dollar denominated currency gains or losses with no pre-tax effect, which is shown above as exchange translation items; (2) the remeasurement of deferred income taxes due to foreign currency changes, which is shown above as exchange remeasurement of deferred income taxes; (3) changes in valuation allowances; (4) non-taxable dividends; (5) income tax settlements; (6) differences between the Canadian statutory and foreign effective tax rates applied to entities in different jurisdictions shown above as tax rate differences on foreign earnings; (7) tax credits in various jurisdictions; (8) state income tax benefit; and (9) increases or decreases in uncertain tax positions recorded under the provisions of ASC 740.
On March 31, 2014, New York State enacted corporate tax reform legislation that overhauls the State corporate tax rate. One of the changes is the enactment of a zero tax rate for qualified New York manufacturers effective for tax years beginning on or after January 1, 2014.
We continue to maintain valuation allowances in Canada and certain foreign jurisdictions primarily related to tax losses where we believe it is more likely than not that we will be unable to utilize those losses. The impact on our income tax provision of the change in these valuation allowances during the year ended March 31, 2015 was an increase of $95 million .
We earn tax credits in a number of the jurisdictions in which we operate. Primarily comprised of empire zone credits in New York in the current year of $8 million , and foreign tax credits in the U.K. of $11 million . The impact on our income tax provision of these credits during the year ended March 31, 2015 was a benefit of $22 million . However, the current year empire zone credits in New York are offset with a corresponding valuation allowance of $8 million.
In 2005, we entered into a tax sharing and disaffiliation agreement with Alcan that provides indemnification if certain factual representations are breached or if certain transactions are undertaken or certain actions are taken that have the effect of negatively affecting the tax treatment of our spin-off from Alcan. It further governs the disaffiliation of the tax matters of Alcan and its subsidiaries or affiliates other than us, on the one hand, and us and our subsidiaries or affiliates, on the other hand. In this respect it allocates taxes accrued prior to the spin-off and after the spin-off as well as transfer taxes resulting there from. It also allocates obligations for filing tax returns and the management of certain pending or future tax contests and creates mutual collaboration obligations with respect to tax matters.
We receive the benefits of favorable tax holidays in various jurisdictions, which resulted in a $9 million reduction to tax expense for the year ended March 31, 2015 , and phase out as of December 31, 2015.
Deferred Income Taxes
Deferred income taxes recognize the net tax effects of temporary differences between the carrying amounts of assets and liabilities for financial reporting purposes and the carrying amounts used for income tax purposes, and the impact of available net operating loss (NOL) and tax credit carryforwards. These items are stated at the enacted tax rates that are expected to be in effect when taxes are actually paid or recovered.
122
Novelis Inc.
NOTES TO THE CONSOLIDATED FINANCIAL STATEMENTS - (Continued)
|
| March 31, | ||||||
|
| 2015 |
| 2014 | ||||
Deferred income tax assets: |
|
|
|
| ||||
Provisions not currently deductible for tax purposes |
| $ | 366 | |
| $ | 315 | |
Tax losses/benefit carryforwards, net |
| 627 | |
| 493 | | ||
Depreciation and amortization |
| 38 | |
| 46 | | ||
Other assets |
| 4 | |
| 8 | | ||
Total deferred income tax assets |
| 1,035 | |
| 862 | | ||
Less: valuation allowance |
| (528 | ) |
| (426 | ) | ||
Net deferred income tax assets |
| $ | 507 | |
| $ | 436 | |
Deferred income tax liabilities: |
|
|
|
| ||||
Depreciation and amortization |
| $ | 477 | |
| $ | 529 | |
Inventory valuation reserves |
| 102 | |
| 87 | | ||
Monetary exchange gains, net |
| 9 | |
| 46 | | ||
Other liabilities |
| 26 | |
| 34 | | ||
Total deferred income tax liabilities |
| $ | 614 | |
| $ | 696 | |
Net deferred income tax liabilities |
| $ | 107 | |
| $ | 260 | |
ASC 740 requires that we reduce our deferred income tax assets by a valuation allowance if, based on the weight of the available evidence, it is more likely than not that all or a portion of a deferred tax asset will not be realized. After consideration of all evidence, both positive and negative, management concluded that it is more likely than not that we will be unable to realize a portion of our deferred tax assets and that valuation allowances of $528 million and $426 million were necessary as of March 31, 2015 and 2014 , respectively.
It is reasonably possible that our estimates of future taxable income may change within the next 12 months, resulting in a change to the valuation allowance in one or more jurisdictions.
As of March 31, 2015 , we had net operating loss carryforwards of approximately $515 million (tax effected) and tax credit carryforwards of $112 million , which will be available to offset future taxable income and tax liabilities, respectively. The carryforwards will begin expiring in fiscal year 2019 with some amounts being carried forward indefinitely. As of March 31, 2015 , valuation allowances of $381 million , $99 million and $48 million had been recorded against net operating loss carryforwards, tax credit carryforwards and other deferred tax assets, respectively, where it appeared more likely than not that such benefits will not be realized. The net operating loss carryforwards are predominantly in Canada, the U.S., Italy, Germany, Switzerland, China and the U.K.
As of March 31, 2014 , we had net operating loss carryforwards of approximately $396 million (tax effected) and tax credit carryforwards of $97 million , which will be available to offset future taxable income and tax liabilities, respectively. The carryforwards will begin expiring in fiscal 2020 with some amounts being carried forward indefinitely. As of March 31, 2014 , valuation allowances of $287 million , $84 million and $55 million had been recorded against net operating loss carryforwards, tax credit carryforwards and other deferred tax assets, respectively, where it appeared more likely than not that such benefits will not be realized. The net operating loss carryforwards are predominantly in Canada, the U.S., Italy, and the U.K.
Although realization is not assured, management believes it is more likely than not that all the remaining net deferred tax assets will be realized. In the near term, the amount of deferred tax assets considered realizable could be reduced if we do not generate sufficient taxable income in certain jurisdictions.
123
Novelis Inc.
NOTES TO THE CONSOLIDATED FINANCIAL STATEMENTS - (Continued)
As of March 31, 2015 , we had cumulative earnings of approximately $2 billion for which we had not provided Canadian income tax or withholding taxes because we consider them to be indefinitely reinvested. We acknowledge that we would need to accrue and pay taxes should we decide to repatriate cash and short term investments generated from earnings of our foreign subsidiaries that are considered indefinitely reinvested. Except for those jurisdictions where we have already distributed and paid taxes on the earnings, we have reinvested and expect to continue to reinvest undistributed earnings of foreign subsidiaries indefinitely. Cash and cash equivalents held by foreign subsidiaries that are indefinitely reinvested are used to cover expansion and short-term cash flow needs of such subsidiaries. The amounts considered indefinitely reinvested would be subject to possible Canadian taxation only if remitted as dividends. However, due to our full valuation allowance position of $446 million in Canada, in excess of $357 million of net operating loss carryforwards, exempt surpluses for Canadian tax purposes, and $46 million of tax credits in Canada, a portion of the cumulative earnings would not be taxed if distributed. Due to the complex structure of our international holdings, and the various methods available for repatriation, quantification of the deferred tax liability, if any, associated with these undistributed earnings is not practicable.
Tax Uncertainties
As of March 31, 2015 and 2014 , the total amount of unrecognized benefits that, if recognized, would affect the effective income tax rate in future periods based on anticipated settlement dates is $37 million and $39 million , respectively.
Tax authorities continue to examine certain other of our tax filings for fiscal years 2005 through 2013. As a result of further settlement of audits, judicial decisions, the filing of amended tax returns or the expiration of statutes of limitations, our reserves for unrecognized tax benefits, as well as reserves for interest and penalties, may decrease in the next 12 months by an amount up to approximately $13 million . With few exceptions, tax returns for all jurisdictions for all tax years before 2003 are no longer subject to examination by taxing authorities.
Our policy is to record interest and penalties related to unrecognized tax benefits in the income tax provision (benefit). As of March 31, 2015 , 2014 and 2013 , we had $5 million , $4 million and $3 million accrued, respectively, for interest and penalties. For the year ended March 31, 2015 , we recognized $1 million expense related to accrued interest and penalties. For the years ended March 31, 2014 and 2013 we recognized a tax expense and benefit of $1 million and $8 million , respectively, related to reductions in accrued interest and penalties.
A reconciliation of the beginning and ending amount of unrecognized tax benefits is as follows (in millions):
|
| Year Ended March 31, | ||||||||||
|
| 2015 |
| 2014 |
| 2013 | ||||||
Beginning balance |
| $ | 39 | |
| $ | 30 | |
| $ | 28 | |
Additions based on tax positions related to the current period |
| 7 | |
| 7 | |
| 5 | | |||
Additions based on tax positions of prior years |
| 3 | |
| 1 | |
| 3 | | |||
Reductions based on tax positions of prior years |
| (1 | ) |
| - | |
| - | | |||
Settlements |
| (3 | ) |
| - | |
| (5 | ) | |||
Foreign exchange |
| (8 | ) |
| 1 | |
| (1 | ) | |||
Ending Balance |
| $ | 37 | |
| $ | 39 | |
| $ | 30 | |
Income Taxes Payable
Our consolidated balance sheets include income taxes payable (net) of $14 million and $52 million as of March 31, 2015 and 2014 , respectively. Of these amounts, $11 million and $31 million are reflected in "Accrued expenses and other current liabilities" as of March 31, 2015 and 2014 , respectively.
124
Novelis Inc.
NOTES TO THE CONSOLIDATED FINANCIAL STATEMENTS - (Continued)
20. COMMITMENTS AND CONTINGENCIES
We are party to, and may in the future be involved in, or subject to, disputes, claims and proceedings arising in the ordinary course of our business, including some we assert against others, such as environmental, health and safety, product liability, employee, tax, personal injury and other matters. We have established a liability with respect to contingencies for which a loss is probable and estimable. While the ultimate resolution of and liability and costs related to these matters cannot be determined with certainty, we do not believe any of these pending actions, individually or in the aggregate, will materially impair our operations or materially affect our financial condition or liquidity.
For certain matters in which the Company is involved, for which a loss is reasonably possible, we are unable to estimate a loss. For certain other matters for which a loss is reasonably possible and the loss is estimable, we have estimated the aggregated range of loss as $0 to $60 million . This estimated aggregate range of reasonably possible losses is based upon currently available information. The Company's estimates involve significant judgment, and therefore, the estimate will change from time to time and actual losses may differ from the current estimate. We review the status of, and estimated liability related to, pending claims and civil actions on a quarterly basis. The evaluation model includes all asserted and unasserted claims that can be reasonably identified including claims relating to our responsibility for compliance with environmental, health and safety laws and regulations in the jurisdictions in which we operate or formerly operated. The estimated costs in respect of such reported liabilities are not offset by amounts related to insurance or indemnification arrangements unless otherwise noted.
The following describes certain contingencies relating to our business, including those for which we assumed liability as a result of our spin-off from Alcan Inc.
Environmental Matters
We own and operate numerous manufacturing and other facilities in various countries around the world. Our operations are subject to environmental laws and regulations from various jurisdictions, which govern, among other things, air emissions, wastewater discharges, the handling, storage and disposal of hazardous substances and wastes, the remediation of contaminated sites, post-mining reclamation and restoration of natural resources, and employee health and safety. Future environmental regulations may impose stricter compliance requirements on the industries in which we operate. Additional equipment or process changes at some of our facilities may be needed to meet future requirements. The cost of meeting these requirements may be significant. Failure to comply with such laws and regulations could subject us to administrative, civil or criminal penalties, obligations to pay damages or other costs, and injunctions and other orders, including orders to cease operations.
We are involved in proceedings under the U.S. Comprehensive Environmental Response, Compensation, and Liability Act, also known as CERCLA or Superfund, or analogous state provisions regarding liability arising from the usage, storage, treatment or disposal of hazardous substances and wastes at a number of sites in the United States, as well as similar proceedings under the laws and regulations of the other jurisdictions in which we have operations, including Brazil and certain countries in the European Union. Many of these jurisdictions have laws that impose joint and several liability, without regard to fault or the legality of the original conduct, for the costs of environmental remediation, natural resource damages, third party claims, and other expenses. In addition, we are, from time to time, subject to environmental reviews and investigations by relevant governmental authorities. We are also involved in claims and litigation filed on behalf of persons alleging exposure to substances and other hazards at our current and former facilities.
We have established liabilities based on our estimates for the currently anticipated costs associated with these environmental matters. We estimated that the remaining undiscounted clean-up costs related to our environmental liabilities as of March 31, 2015 were approximately $22 million , of which $18 million was associated with a restructuring action and the remaining undiscounted clean-up costs were approximately $4 million . Additionally, $18 million of the environmental liability was included in "Other long-term liabilities," with the remaining $4 million included in "Accrued expenses and other current liabilities" in our consolidated balance sheet as of March 31, 2015 . As of March 31, 2014 , $21 million of the environmental liability was included in "Other long-term liabilities," with the remaining $3 million included in "Accrued expenses and other current liabilities" in our consolidated balance sheet. Management has reviewed the environmental matters, including those for which we assumed liability as a result of our spin-off from Alcan Inc. As a result of management's review of these items, management has determined that the currently anticipated costs associated with these environmental matters will not, individually or in the aggregate, materially impact our operations or materially adversely affect our financial condition, results of operations or liquidity.
125
Novelis Inc.
NOTES TO THE CONSOLIDATED FINANCIAL STATEMENTS - (Continued)
Brazil Tax and Legal Matters
Under a federal tax dispute settlement program established by the Brazilian government, we have settled several disputes with Brazil's tax authorities regarding various forms of manufacturing taxes and social security contributions. In most cases, we are paying the settlement amounts over a period of 180 months , although in some cases we are paying the settlement amounts over a shorter period. The assets and liabilities related to these settlements are presented in the table below (in millions).
| March 31, |
| March 31, | ||||
Cash deposits (A) | $ | 3 | |
| $ | 6 | |
|
|
|
| ||||
Short-term settlement liability (B) | $ | 7 | |
| $ | 11 | |
Long-term settlement liability (B) | 66 | |
| 96 | | ||
Total settlement liability | $ | 73 | |
| $ | 107 | |
|
|
|
| ||||
Liability for other disputes and claims (C) | $ | 12 | |
| $ | 18 | |
(A) We have maintain these cash deposits as a result of legal proceedings with Brazil's tax authorities. These deposits, which are included in "Other long-term assets - third parties" in our accompanying consolidated balance sheets, will be expended toward these legal proceedings.
(B) The short-term and long-term settlement liabilities are included in "Accrued expenses and other current liabilities" and "Other long-term liabilities", respectively, in our accompanying consolidated balance sheets.
(C) | In addition to the disputes we have settled under the federal tax dispute settlement program, we are involved in several other unresolved tax and other legal claims in Brazil. The related liabilities are included in "Other long-term liabilities" in our accompanying consolidated balance sheets. |
The interest cost recorded on these settlement liabilities, partially offset by interest earned on the cash deposits is included in the table below (in millions).
| Year Ended March 31, | ||||||||||
| 2015 |
| 2014 |
| 2013 | ||||||
Loss on Brazilian tax litigation, net | $ | 7 | |
| $ | 6 | |
| $ | 8 | |
Additionally, we have included in the range of reasonably possible losses disclosed above, any unresolved tax disputes or other contingencies for which a loss is reasonably possible and estimable.
Other Commitments
As of March 31, 2015 and 2014, we had sold certain inventories to third parties and have agreed to repurchase the same or similar inventory back from the third parties subsequent to the balance sheet dates. Our estimated outstanding repurchase obligations for this inventory as of March 31, 2015 is $206 million and as of March 31, 2014 was approximately $74 million , based on market prices as of these dates. We sell and repurchase inventory with third parties in an attempt to better manage inventory levels and to better match the purchasing of inventory with the demand for our products. As of March 31, 2015 and 2014, there was no liability related to these repurchase obligations on our accompanying consolidated balance sheets.
126
Novelis Inc.
NOTES TO THE CONSOLIDATED FINANCIAL STATEMENTS - (Continued)
21. SEGMENT, GEOGRAPHICAL AREA, MAJOR CUSTOMER AND MAJOR SUPPLIER INFORMATION
Segment Information
Due in part to the regional nature of supply and demand of aluminum rolled products and to best serve our customers, we manage our activities based on geographical areas and are organized under four operating segments: North America, Europe, Asia and South America. All of our segments manufacture aluminum sheet and light gauge products.
The following is a description of our operating segments:
North America. Headquartered in Atlanta, Georgia, this segment operates eight plants, including two fully dedicated recycling facilities and one facility with recycling operations, in two countries.
Europe. Headquartered in Kusnacht, Switzerland, this segment operates ten plants, including two fully dedicated recycling facilities and two facilities with recycling operations, in four countries.
Asia. Headquartered in Seoul, South Korea, this segment operates five plants, including three facilities with recycling operations, in four countries.
South America. Headquartered in Sao Paulo, Brazil, this segment comprises power generation operation, and operates two plants, including a facility with recycling operations, in Brazil. Our remaining smelting operations facilities ceased operations in December 2014. The majority of our power generation operations were sold during the fourth quarter of fiscal 2015.
Net sales and expenses are measured in accordance with the policies and procedures described in Note 1 - Business and Summary of Significant Accounting Policies.
We measure the profitability and financial performance of our operating segments based on "Segment income." "Segment income" provides a measure of our underlying segment results that is in line with our approach to risk management. We define "Segment income" as earnings before (a) "depreciation and amortization"; (b) "interest expense and amortization of debt issuance costs"; (c) "interest income"; (d) unrealized gains (losses) on change in fair value of derivative instruments, net, except for foreign currency remeasurement hedging activities, which are included in segment income; (e) impairment of goodwill; (f) gain or loss on extinguishment of debt; (g) noncontrolling interests' share; (h) adjustments to reconcile our proportional share of "Segment income" from non-consolidated affiliates to income as determined on the equity method of accounting; (i) "restructuring and impairment, net"; (j) gains or losses on disposals of property, plant and equipment and businesses, net; (k) other costs, net; (l) litigation settlement, net of insurance recoveries; (m) sale transaction fees; (n) provision or benefit for taxes on income (loss) and (o) cumulative effect of accounting change, net of tax.
The tables below show selected segment financial information (in millions). The "Eliminations and Other" column in the table below includes eliminations and functions that are managed directly from our corporate office that have not been allocated to our operating segments, as well as the adjustments for proportional consolidation, and eliminations of intersegment "Net sales." The financial information for our segments includes the results of our affiliates on a proportionately consolidated basis, which is consistent with the way we manage our business segments. In order to reconcile the financial information for the segments shown in the tables below to the relevant U.S. GAAP-based measures, we must adjust proportional consolidation of each line item. The "Eliminations and Other" in "Net sales – third party" includes the net sales attributable to our joint venture party, Tri-Arrows, for our Logan affiliate because we consolidate 100% of the Logan joint venture for U.S. GAAP, but we manage our Logan affiliate on a proportionately consolidated basis. See Note 8- Consolidation and Note 9 - Investment in and Advances to Non-Consolidated Affiliates and Related Party Transactions for further information about these affiliates. Additionally, we eliminate intersegment sales and intersegment income for reporting on a consolidated basis.
127
Novelis Inc.
NOTES TO THE CONSOLIDATED FINANCIAL STATEMENTS - (Continued)
Selected Segment Financial Information
|
|
|
|
|
|
|
|
|
|
|
|
| ||||||||||||
Selected Operating Results Year Ended March 31, 2015 |
| North America |
| Europe |
| Asia |
| South America |
| Eliminations and Other |
| Total | ||||||||||||
Net sales - third party |
| $ | 3,465 | |
| $ | 3,609 | |
| $ | 2,139 | |
| $ | 1,749 | |
| $ | 185 | |
| $ | 11,147 | |
Net sales - intersegment |
| 18 | |
| 174 | |
| 201 | |
| 101 | |
| (494 | ) |
| - | | ||||||
Net sales |
| $ | 3,483 | |
| $ | 3,783 | |
| $ | 2,340 | |
| $ | 1,850 | |
| $ | (309 | ) |
| $ | 11,147 | |
|
|
|
|
|
|
|
|
|
|
|
|
| ||||||||||||
Depreciation and amortization |
| $ | 137 | |
| $ | 103 | |
| $ | 71 | |
| $ | 63 | |
| $ | (22 | ) |
| $ | 352 | |
Income tax (benefit) provision |
| $ | (27 | ) |
| $ | 12 | |
| $ | 16 | |
| $ | (1 | ) |
| $ | 14 | |
| $ | 14 | |
Capital expenditures |
| $ | 122 | |
| $ | 257 | |
| $ | 85 | |
| $ | 53 | |
| $ | 1 | |
| $ | 518 | |
|
|
|
|
|
|
|
|
|
|
|
|
| ||||||||||||
March 31, 2015 |
|
|
|
|
|
|
|
|
|
|
|
| ||||||||||||
Investment in and advances to non–consolidated affiliates |
| $ | - | |
| $ | 447 | |
| $ | - | |
| $ | - | |
| $ | - | |
| $ | 447 | |
Total assets |
| $ | 2,744 | |
| $ | 2,952 | |
| $ | 1,663 | |
| $ | 1,588 | |
| $ | 155 | |
| $ | 9,102 | |
|
|
|
|
|
|
|
|
|
|
|
|
| ||||||||||||
Selected Operating Results Year Ended March 31, 2014 |
| North America |
| Europe |
| Asia |
| South America |
| Eliminations and Other |
| Total | ||||||||||||
Net sales - third party |
| $ | 3,042 | |
| $ | 3,145 | |
| $ | 1,849 | |
| $ | 1,543 | |
| $ | 188 | |
| $ | 9,767 | |
Net sales - intersegment |
| 8 | |
| 135 | |
| 27 | |
| 45 | |
| (215 | ) |
| - | | ||||||
Net sales |
| $ | 3,050 | |
| $ | 3,280 | |
| $ | 1,876 | |
| $ | 1,588 | |
| $ | (27 | ) |
| $ | 9,767 | |
|
|
|
|
|
|
|
|
|
|
|
|
| ||||||||||||
Depreciation and amortization |
| $ | 126 | |
| $ | 103 | |
| $ | 68 | |
| $ | 69 | |
| $ | (32 | ) |
| $ | 334 | |
Income tax (benefit) provision |
| $ | (34 | ) |
| $ | 6 | |
| $ | 16 | |
| $ | 6 | |
| $ | 17 | |
| $ | 11 | |
Capital expenditures |
| $ | 147 | |
| $ | 241 | |
| $ | 198 | |
| $ | 117 | |
| $ | 14 | |
| $ | 717 | |
|
|
|
|
|
|
|
|
|
|
|
|
| ||||||||||||
March 31, 2014 |
|
|
|
|
|
|
|
|
|
|
|
| ||||||||||||
Investment in and advances to non–consolidated affiliates |
| $ | - | |
| $ | 612 | |
| $ | - | |
| $ | - | |
| $ | - | |
| $ | 612 | |
Assets held for sale - Investment in and advances to non-consolidated affiliates |
| $ | - | |
| $ | - | |
| $ | - | |
| $ | 39 | |
| $ | - | |
| $ | 39 | |
Total assets |
| $ | 2,998 | |
| $ | 3,046 | |
| $ | 1,440 | |
| $ | 1,583 | |
| $ | 47 | |
| $ | 9,114 | |
|
|
|
|
|
|
|
|
|
|
|
|
| ||||||||||||
Selected Operating Results Year Ended March 31, 2013 |
| North America |
| Europe |
| Asia |
| South America |
| Eliminations and Other |
| Total | ||||||||||||
Net sales - third party |
| $ | 3,397 | |
| $ | 3,096 | |
| $ | 1,746 | |
| $ | 1,391 | |
| $ | 182 | |
| $ | 9,812 | |
Net sales - intersegment |
| 8 | |
| 85 | |
| 16 | |
| - | |
| (109 | ) |
| - | | ||||||
Net sales |
| $ | 3,405 | |
| $ | 3,181 | |
| $ | 1,762 | |
| $ | 1,391 | |
| $ | 73 | |
| $ | 9,812 | |
|
|
|
|
|
|
|
|
|
|
|
|
| ||||||||||||
Depreciation and amortization |
| $ | 118 | |
| $ | 103 | |
| $ | 53 | |
| $ | 51 | |
| $ | (33 | ) |
| $ | 292 | |
Income tax provision |
| $ | 13 | |
| $ | 30 | |
| $ | 18 | |
| $ | 13 | |
| $ | 9 | |
| $ | 83 | |
Capital expenditures |
| $ | 183 | |
| $ | 80 | |
| $ | 251 | |
| $ | 197 | |
| $ | 64 | |
| $ | 775 | |
128
Novelis Inc.
NOTES TO THE CONSOLIDATED FINANCIAL STATEMENTS - (Continued)
The following table shows the reconciliation from income from reportable segments to "Net income attributable to our common shareholder" (in millions).
|
| Year Ended March 31, | ||||||||||
|
| 2015 |
| 2014 |
| 2013 | ||||||
North America |
| $ | 273 | |
| $ | 229 | |
| $ | 324 | |
Europe |
| 250 | |
| 265 | |
| 261 | | |||
Asia |
| 141 | |
| 160 | |
| 174 | | |||
South America |
| 240 | |
| 231 | |
| 202 | | |||
Intersegment eliminations |
| (2 | ) |
| - | |
| - | | |||
Depreciation and amortization |
| (352 | ) |
| (334 | ) |
| (292 | ) | |||
Interest expense and amortization of debt issuance costs |
| (326 | ) |
| (304 | ) |
| (298 | ) | |||
Adjustment to eliminate proportional consolidation |
| (33 | ) |
| (40 | ) |
| (41 | ) | |||
Unrealized (losses) gains on change in fair value of derivative instruments, net |
| - | |
| (10 | ) |
| 14 | | |||
Realized (losses) gains on derivative instruments not included in segment income |
| (6 | ) |
| 5 | |
| 5 | | |||
Gain on assets held for sale, net |
| 22 | |
| 6 | |
| 3 | | |||
Loss on extinguishment of debt |
| - | |
| - | |
| (7 | ) | |||
Restructuring and impairment, net |
| (37 | ) |
| (75 | ) |
| (47 | ) | |||
Loss on sale of fixed assets |
| (5 | ) |
| (9 | ) |
| (6 | ) | |||
Other costs, net |
| (3 | ) |
| (9 | ) |
| (6 | ) | |||
Income before income taxes |
| 162 | |
| 115 | |
| 286 | | |||
Income tax provision |
| 14 | |
| 11 | |
| 83 | | |||
Net income |
| 148 | |
| 104 | |
| 203 | | |||
Net income attributable to noncontrolling interests |
| - | |
| - | |
| 1 | | |||
Net income attributable to our common shareholder |
| $ | 148 | |
| $ | 104 | |
| $ | 202 | |
Geographical Area Information
We had 25 operating facilities in eleven countries as of March 31, 2015 . The tables below present "Net sales" and "Long-lived assets and other intangible assets" by geographical area (in millions). "Net sales" are attributed to geographical areas based on the origin of the sale. "Long-lived assets and other intangible assets" are attributed to geographical areas based on asset location and exclude investments in and advances to our non-consolidated affiliates and goodwill.
|
| Year Ended March 31, | ||||||||||
|
| 2015 |
| 2014 |
| 2013 | ||||||
Net sales: |
|
|
|
|
|
| ||||||
United States |
| $ | 3,507 | |
| $ | 3,021 | |
| $ | 3,350 | |
Asia and Other Pacific |
| 2,139 | |
| 1,845 | |
| 1,745 | | |||
Brazil |
| 1,750 | |
| 1,544 | |
| 1,391 | | |||
Canada |
| 144 | |
| 209 | |
| 230 | | |||
Germany |
| 2,976 | |
| 2,449 | |
| 2,391 | | |||
United Kingdom |
| 139 | |
| 135 | |
| 53 | | |||
Other Europe |
| 492 | |
| 564 | |
| 652 | | |||
Total Net sales |
| $ | 11,147 | |
| $ | 9,767 | |
| $ | 9,812 | |
129
Novelis Inc.
NOTES TO THE CONSOLIDATED FINANCIAL STATEMENTS - (Continued)
|
| March 31, | ||||||
|
| 2015 |
| 2014 | ||||
Long-lived assets and other intangibles: |
|
|
|
| ||||
United States |
| $ | 1,518 | |
| $ | 1,504 | |
Asia and Other Pacific |
| 840 | |
| 866 | | ||
Brazil |
| 866 | |
| 889 | | ||
Canada |
| 78 | |
| 82 | | ||
Germany |
| 251 | |
| 268 | | ||
United Kingdom |
| 45 | |
| 46 | | ||
Other Europe |
| 528 | |
| 498 | | ||
Total long-lived assets |
| $ | 4,126 | |
| $ | 4,153 | |
Information about Product Sales, Major Customers and Primary Supplier
The percentage of "Net sales" generated from beverage and food can products were 56% , 55% , and 55% in the years ended March 31, 2015, 2014, and 2013, respectively. The percentage of "Net sales" generated from automotive products increased to 13% in the year ended March 31, 2015, compared to 11% and 8% in the years ended March 31, 2014 and 2013, respectively.
The table below shows our net sales to Rexam Plc (Rexam), Anheuser-Busch LLC (Anheuser-Busch), and Affiliates of Ball Corporation (Ball Corporation), our three largest customers, as a percentage of total "Net sales."
|
| Year Ended March 31, | |||||||
|
| 2015 |
| 2014 |
| 2013 | |||
Rexam (A) |
| 18 | % |
| 17 | % |
| 15 | % |
Ball Corporation (A) |
| 10 | % |
| 10 | % |
| 10 | % |
Anheuser-Busch LLC |
| 7 | % |
| 8 | % |
| 11 | % |
(A) | In February of 2015, Ball Corporation made an offer to acquire Rexam. This acquisition will be subject to regulatory and shareholder approval. |
Rio Tinto Alcan (RTA) is our primary supplier of metal inputs, including prime and sheet ingot. The table below shows our purchases from RTA as a percentage of our total combined metal purchases.
|
| Year Ended March 31, | |||||||
|
| 2015 |
| 2014 |
| 2013 | |||
Purchases from RTA as a percentage of total combined metal purchases |
| 15 | % |
| 17 | % |
| 24 | % |
130
Novelis Inc.
NOTES TO THE CONSOLIDATED FINANCIAL STATEMENTS - (Continued)
22. SUPPLEMENTAL INFORMATION
Supplemental cash flow information is as follows (in millions).
|
| Year Ended March 31, | ||||||||||
|
| 2015 |
| 2014 |
| 2013 | ||||||
Supplemental disclosures of cash flow information: |
|
|
|
|
|
| ||||||
Interest paid |
| $ | 303 | |
| $ | 278 | |
| $ | 271 | |
Income taxes paid |
| $ | 131 | |
| $ | 120 | |
| $ | 121 | |
As of March 31, 2015 , we recorded $110 million of outstanding accounts payable and accrued liabilities related to capital expenditures in which the cash outflows will occur subsequent to March 31, 2015 . During the years ended March 31, 2015 , 2014 , and 2013 we incurred capital lease obligations of less than $1 million , less than $1 million and $16 million , respectively, related to capital lease acquisitions.
131
Novelis Inc.
NOTES TO THE CONSOLIDATED FINANCIAL STATEMENTS - (Continued)
23. QUARTERLY RESULTS (UNAUDITED)
The tables below present select operating results (in millions) by period:
|
| (Unaudited) Quarter Ended | ||||||||||||||
|
| June 30, |
| September 30, |
| December 31, |
| March 31, | ||||||||
Net sales |
| $ | 2,680 | |
| $ | 2,831 | |
| $ | 2,847 | |
| $ | 2,789 | |
Cost of goods sold (exclusive of depreciation and amortization) |
| 2,329 | |
| 2,483 | |
| 2,498 | |
| 2,483 | | ||||
Selling, general and administrative expenses |
| 108 | |
| 103 | |
| 108 | |
| 108 | | ||||
Depreciation and amortization |
| 89 | |
| 90 | |
| 87 | |
| 86 | | ||||
Research and development expenses |
| 12 | |
| 12 | |
| 14 | |
| 12 | | ||||
Interest expense and amortization of debt issuance costs |
| 81 | |
| 82 | |
| 85 | |
| 78 | | ||||
(Gain) loss on assets held for sale, net |
| (11 | ) |
| - | |
| (12 | ) |
| 1 | | ||||
Restructuring and impairment, net |
| 6 | |
| 7 | |
| 25 | |
| (1 | ) | ||||
Equity in net loss of non-consolidated affiliates |
| 2 | |
| - | |
| 2 | |
| 1 | | ||||
Other expense (income), net |
| 5 | |
| 18 | |
| (9 | ) |
| 3 | | ||||
Income tax provision (benefit) |
| 24 | |
| (2 | ) |
| 3 | |
| (11 | ) | ||||
Net income |
| 35 | |
| 38 | |
| 46 | |
| 29 | | ||||
Net income attributable to noncontrolling interests |
| - | |
| - | |
| - | |
| - | | ||||
Net income attributable to our common shareholder |
| $ | 35 | |
| $ | 38 | |
| $ | 46 | |
| $ | 29 | |
|
| (Unaudited) Quarter Ended | ||||||||||||||
|
| June 30, |
| September 30, |
| December 31, |
| March 31, | ||||||||
Net sales |
| $ | 2,401 | |
| $ | 2,414 | |
| $ | 2,403 | |
| $ | 2,549 | |
Cost of goods sold (exclusive of depreciation and amortization) |
| 2,098 | |
| 2,074 | |
| 2,093 | |
| 2,203 | | ||||
Selling, general and administrative expenses |
| 120 | |
| 109 | |
| 115 | |
| 117 | | ||||
Depreciation and amortization |
| 77 | |
| 79 | |
| 91 | |
| 87 | | ||||
Research and development expenses |
| 10 | |
| 12 | |
| 12 | |
| 11 | | ||||
Interest expense and amortization of debt issuance costs |
| 76 | |
| 75 | |
| 76 | |
| 77 | | ||||
Gain on assets held for sale |
| - | |
| - | |
| (6 | ) |
| - | | ||||
Restructuring and impairment, net |
| 9 | |
| 18 | |
| 19 | |
| 29 | | ||||
Equity in net loss of non-consolidated affiliates |
| 4 | |
| 3 | |
| 5 | |
| - | | ||||
Other income, net |
| (10 | ) |
| (5 | ) |
| (12 | ) |
| (14 | ) | ||||
Income tax provision (benefit) |
| 3 | |
| 26 | |
| (3 | ) |
| (15 | ) | ||||
Net income |
| 14 | |
| 23 | |
| 13 | |
| 54 | | ||||
Net income attributable to noncontrolling interests |
| - | |
| - | |
| - | |
| - | | ||||
Net income attributable to our common shareholder |
| $ | 14 | |
| $ | 23 | |
| $ | 13 | |
| $ | 54 | |
132
Novelis Inc.
NOTES TO THE CONSOLIDATED FINANCIAL STATEMENTS - (Continued)
24. SUPPLEMENTAL GUARANTOR INFORMATION
In connection with the issuance of Novelis Inc.'s (the Parent and Issuer) 2017 Notes and 2020 Notes, certain of our wholly-owned subsidiaries, which are 100% owned within the meaning of Rule 3-10(h)(1) of Regulation S-X, provided guarantees. These guarantees are full and unconditional as well as joint and several. In the periods presented below, the guarantor subsidiaries (the Guarantors) are comprised of the majority of our businesses in Canada, the U.S., the U.K., Brazil, Portugal and Switzerland, as well as certain businesses in Germany and France. The remaining subsidiaries (the Non-Guarantors) of the Parent are not guarantors of the Notes.
CONSOLIDATING STATEMENT OF OPERATIONS
(In millions)
| Year Ended March 31, 2015 | ||||||||||||||||||
| Parent |
| Guarantors |
| Non- |
| Eliminations |
| Consolidated | ||||||||||
Net sales | $ | 665 | |
| $ | 9,525 | |
| $ | 2,743 | |
| $ | (1,786 | ) |
| $ | 11,147 | |
Cost of goods sold (exclusive of depreciation and amortization) | 650 | |
| 8,413 | |
| 2,514 | |
| (1,784 | ) |
| 9,793 | | |||||
Selling, general and administrative expenses | 6 | |
| 344 | |
| 77 | |
| - | |
| 427 | | |||||
Depreciation and amortization | 18 | |
| 258 | |
| 76 | |
| - | |
| 352 | | |||||
Research and development expenses | - | |
| 49 | |
| 1 | |
| - | |
| 50 | | |||||
Interest expense and amortization of debt issuance costs | 319 | |
| 74 | |
| 7 | |
| (74 | ) |
| 326 | | |||||
Gain on assets held for sale, net | (5 | ) |
| (17 | ) |
| - | |
| - | |
| (22 | ) | |||||
Restructuring and impairment, net | 1 | |
| 33 | |
| 3 | |
| - | |
| 37 | | |||||
Equity in net loss of non-consolidated affiliates | - | |
| 5 | |
| - | |
| - | |
| 5 | | |||||
Equity in net (income) loss of consolidated subsidiaries | (456 | ) |
| (30 | ) |
| - | |
| 486 | |
| - | | |||||
Other (income) expense, net | (18 | ) |
| (46 | ) |
| 7 | |
| 74 | |
| 17 | | |||||
| 515 | |
| 9,083 | |
| 2,685 | |
| (1,298 | ) |
| 10,985 | | |||||
Income before income taxes | 150 | |
| 442 | |
| 58 | |
| (488 | ) |
| 162 | | |||||
Income tax provision (benefit) | 2 | |
| (8 | ) |
| 20 | |
| - | |
| 14 | | |||||
Net income | 148 | |
| 450 | |
| 38 | |
| (488 | ) |
| 148 | | |||||
Net income attributable to noncontrolling interests | - | |
| - | |
| - | |
| - | |
| - | | |||||
Net income attributable to our common shareholder | $ | 148 | |
| $ | 450 | |
| $ | 38 | |
| $ | (488 | ) |
| $ | 148 | |
Comprehensive (loss) income | $ | (322 | ) |
| $ | 30 | |
| $ | (7 | ) |
| $ | (38 | ) |
| $ | (337 | ) |
Less: Comprehensive loss attributable to noncontrolling interest | - | |
| - | |
| (15 | ) |
| - | |
| (15 | ) | |||||
Comprehensive (loss) income attributable to our common shareholder | $ | (322 | ) |
| $ | 30 | |
| $ | 8 | |
| $ | (38 | ) |
| $ | (322 | ) |
133
Novelis Inc.
NOTES TO THE CONSOLIDATED FINANCIAL STATEMENTS - (Continued)
CONSOLIDATING STATEMENT OF OPERATIONS
(In millions)
| Year Ended March 31, 2014 | ||||||||||||||||||
| Parent |
| Guarantors |
| Non- |
| Eliminations |
| Consolidated | ||||||||||
Net sales | $ | 693 | |
| $ | 8,080 | |
| $ | 2,416 | |
| $ | (1,422 | ) |
| $ | 9,767 | |
Cost of goods sold (exclusive of depreciation and amortization) | 677 | |
| 7,055 | |
| 2,158 | |
| (1,422 | ) |
| 8,468 | | |||||
Selling, general and administrative expenses | 48 | |
| 338 | |
| 75 | |
| - | |
| 461 | | |||||
Depreciation and amortization | 16 | |
| 246 | |
| 72 | |
| - | |
| 334 | | |||||
Research and development expenses | 1 | |
| 43 | |
| 1 | |
| - | |
| 45 | | |||||
Interest expense and amortization of debt issuance costs | 315 | |
| 28 | |
| 1 | |
| (40 | ) |
| 304 | | |||||
Gain on assets held for sale, net | - | |
| (6 | ) |
| - | |
| - | |
| (6 | ) | |||||
Restructuring and impairment, net | 8 | |
| 59 | |
| 8 | |
| - | |
| 75 | | |||||
Equity in net loss of non-consolidated affiliates | - | |
| 12 | |
| - | |
| - | |
| 12 | | |||||
Equity in net (income) loss of consolidated subsidiaries | (448 | ) |
| (99 | ) |
| - | |
| 547 | |
| - | | |||||
Other (income) expense, net | (35 | ) |
| (57 | ) |
| 11 | |
| 40 | |
| (41 | ) | |||||
| 582 | |
| 7,619 | |
| 2,326 | |
| (875 | ) |
| 9,652 | | |||||
Income before income taxes | 111 | |
| 461 | |
| 90 | |
| (547 | ) |
| 115 | | |||||
Income tax provision (benefit) | 7 | |
| 16 | |
| (12 | ) |
| - | |
| 11 | | |||||
Net income | 104 | |
| 445 | |
| 102 | |
| (547 | ) |
| 104 | | |||||
Net income attributable to noncontrolling interests | - | |
| - | |
| - | |
| - | |
| - | | |||||
Net income attributable to our common shareholder | $ | 104 | |
| $ | 445 | |
| $ | 102 | |
| $ | (547 | ) |
| $ | 104 | |
Comprehensive income | $ | 281 | |
| $ | 590 | |
| $ | 152 | |
| $ | (744 | ) |
| $ | 279 | |
Less: Comprehensive loss attributable to noncontrolling interest | - | |
| - | |
| (2 | ) |
| - | |
| (2 | ) | |||||
Comprehensive income attributable to our common shareholder | $ | 281 | |
| $ | 590 | |
| $ | 154 | |
| $ | (744 | ) |
| $ | 281 | |
134
Novelis Inc.
NOTES TO THE CONSOLIDATED FINANCIAL STATEMENTS - (Continued)
CONSOLIDATING STATEMENT OF OPERATIONS
(In millions)
|
| Year Ended March 31, 2013 | ||||||||||||||||||
|
| Parent |
| Guarantors |
| Non- Guarantors |
| Eliminations |
| Consolidated | ||||||||||
Net sales |
| $ | 781 | |
| $ | 8,076 | |
| $ | 2,440 | |
| $ | (1,485 | ) |
| $ | 9,812 | |
Cost of goods sold (exclusive of depreciation and amortization) |
| 740 | |
| 7,028 | |
| 2,194 | |
| (1,485 | ) |
| 8,477 | | |||||
Selling, general and administrative expenses |
| (19 | ) |
| 341 | |
| 76 | |
| - | |
| 398 | | |||||
Depreciation and amortization |
| 14 | |
| 220 | |
| 58 | |
| - | |
| 292 | | |||||
Research and development expenses |
| 7 | |
| 39 | |
| - | |
| - | |
| 46 | | |||||
Interest expense and amortization of debt issuance costs |
| 320 | |
| 16 | |
| (3 | ) |
| (35 | ) |
| 298 | | |||||
Gain (loss) on assets held for sale |
| (5 | ) |
| 2 | |
| - | |
| - | |
| (3 | ) | |||||
Loss on extinguishment of debt |
| 7 | |
| - | |
| - | |
| - | |
| 7 | | |||||
Restructuring and impairment, net |
| 12 | |
| 33 | |
| 2 | |
| - | |
| 47 | | |||||
Equity in net loss of non-consolidated affiliates |
| - | |
| 16 | |
| - | |
| - | |
| 16 | | |||||
Equity in net (income) loss of consolidated subsidiaries |
| (455 | ) |
| (89 | ) |
| - | |
| 544 | |
| - | | |||||
Other (income) expense, net |
| (49 | ) |
| (49 | ) |
| 11 | |
| 35 | |
| (52 | ) | |||||
|
| 572 | |
| 7,557 | |
| 2,338 | |
| (941 | ) |
| 9,526 | | |||||
Income before income taxes |
| 209 | |
| 519 | |
| 102 | |
| (544 | ) |
| 286 | | |||||
Income tax provision |
| 7 | |
| 57 | |
| 19 | |
| - | |
| 83 | | |||||
Net income |
| 202 | |
| 462 | |
| 83 | |
| (544 | ) |
| 203 | | |||||
Net income attributable to noncontrolling interests |
| - | |
| - | |
| 1 | |
| - | |
| 1 | | |||||
Net income attributable to our common shareholder |
| $ | 202 | |
| $ | 462 | |
| $ | 82 | |
| $ | (544 | ) |
| $ | 202 | |
Comprehensive income |
| $ | 125 | |
| $ | 364 | |
| $ | 85 | |
| $ | (448 | ) |
| $ | 126 | |
Less: Comprehensive income attributable to noncontrolling interest |
| - | |
| - | |
| 1 | |
| - | |
| 1 | | |||||
Comprehensive income attributable to our common shareholder |
| $ | 125 | |
| $ | 364 | |
| $ | 84 | |
| $ | (448 | ) |
| $ | 125 | |
135
Novelis Inc.
NOTES TO THE CONSOLIDATED FINANCIAL STATEMENTS - (Continued)
| As of March 31, 2015 | ||||||||||||||||||
| Parent |
| Guarantors |
| Non- |
| Eliminations |
| Consolidated | ||||||||||
ASSETS | |||||||||||||||||||
Current assets |
|
|
|
|
|
|
|
|
| ||||||||||
Cash and cash equivalents | $ | 4 | |
| $ | 365 | |
| $ | 259 | |
| $ | - | |
| $ | 628 | |
Accounts receivable, net of allowances |
|
|
|
|
|
|
|
|
| ||||||||||
- third parties | 23 | |
| 1,034 | |
| 232 | |
| - | |
| 1,289 | | |||||
- related parties | 385 | |
| 154 | |
| 158 | |
| (644 | ) |
| 53 | | |||||
Inventories | 55 | |
| 1,084 | |
| 294 | |
| (2 | ) |
| 1,431 | | |||||
Prepaid expenses and other current assets | 6 | |
| 89 | |
| 17 | |
| - | |
| 112 | | |||||
Fair value of derivative instruments | 19 | |
| 55 | |
| 9 | |
| (6 | ) |
| 77 | | |||||
Deferred income tax assets | - | |
| 70 | |
| 9 | |
| - | |
| 79 | | |||||
Assets held for sale | - | |
| 6 | |
| - | |
| - | |
| 6 | | |||||
Total current assets | 492 | |
| 2,857 | |
| 978 | |
| (652 | ) |
| 3,675 | | |||||
Property, plant and equipment, net | 95 | |
| 2,549 | |
| 898 | |
| - | |
| 3,542 | | |||||
Goodwill | - | |
| 596 | |
| 11 | |
| - | |
| 607 | | |||||
Intangible assets, net | 19 | |
| 562 | |
| 3 | |
| - | |
| 584 | | |||||
Investments in and advances to non-consolidated affiliates | - | |
| 447 | |
| - | |
| - | |
| 447 | | |||||
Investments in consolidated subsidiaries | 3,013 | |
| 597 | |
| - | |
| (3,610 | ) |
| - | | |||||
Deferred income tax assets | - | |
| 47 | |
| 48 | |
| - | |
| 95 | | |||||
Other long-term assets |
|
|
|
|
|
|
|
|
| ||||||||||
- third parties | 57 | |
| 70 | |
| 10 | |
| - | |
| 137 | | |||||
- related parties | 1,265 | |
| 64 | |
| - | |
| (1,314 | ) |
| 15 | | |||||
Total assets | $ | 4,941 | |
| $ | 7,789 | |
| $ | 1,948 | |
| $ | (5,576 | ) |
| $ | 9,102 | |
LIABILITIES AND (DEFICIT) EQUITY | |||||||||||||||||||
Current liabilities |
|
|
|
|
|
|
|
|
| ||||||||||
Current portion of long-term debt | $ | 22 | |
| $ | 8 | |
| $ | 78 | |
| $ | - | |
| $ | 108 | |
Short-term borrowings |
|
|
|
|
|
|
|
|
| ||||||||||
- third parties | 394 | |
| 381 | |
| 71 | |
| - | |
| 846 | | |||||
- related parties | - | |
| 122 | |
| - | |
| (122 | ) |
| - | | |||||
Accounts payable |
|
|
|
|
|
|
|
|
| ||||||||||
- third parties | 27 | |
| 1,195 | |
| 632 | |
| - | |
| 1,854 | | |||||
- related parties | 78 | |
| 393 | |
| 42 | |
| (469 | ) |
| 44 | | |||||
Fair value of derivative instruments | 83 | |
| 62 | |
| 10 | |
| (6 | ) |
| 149 | | |||||
Accrued expenses and other current liabilities |
|
|
|
|
|
|
|
|
| ||||||||||
- third parties | 99 | |
| 412 | |
| 61 | |
| - | |
| 572 | | |||||
- related parties | - | |
| 47 | |
| 6 | |
| (53 | ) |
| - | | |||||
Deferred income tax liabilities | - | |
| 20 | |
| - | |
| - | |
| 20 | | |||||
Total current liabilities | 703 | |
| 2,640 | |
| 900 | |
| (650 | ) |
| 3,593 | | |||||
Long-term debt, net of current portion |
|
|
|
|
|
|
|
|
| ||||||||||
- third parties | 4,205 | |
| 28 | |
| 116 | |
| - | |
| 4,349 | | |||||
- related parties | 49 | |
| 1,209 | |
| 56 | |
| (1,314 | ) |
| - | | |||||
Deferred income tax liabilities | - | |
| 254 | |
| 7 | |
| - | |
| 261 | | |||||
Accrued postretirement benefits | 30 | |
| 534 | |
| 184 | |
| - | |
| 748 | | |||||
Other long-term liabilities | 36 | |
| 175 | |
| 10 | |
| - | |
| 221 | | |||||
Total liabilities | 5,023 | |
| 4,840 | |
| 1,273 | |
| (1,964 | ) |
| 9,172 | | |||||
Commitments and contingencies | | |
| | |
| | |
| | |
| | | |||||
Temporary equity - intercompany | - | |
| 1,681 | |
| - | |
| (1,681 | ) |
| - | | |||||
Shareholder's (deficit) equity |
|
|
|
|
|
|
|
|
| ||||||||||
Common stock | - | |
| - | |
| - | |
| - | |
| - | | |||||
Additional paid-in capital | 1,404 | |
| - | |
| - | |
| - | |
| 1,404 | | |||||
(Accumulated deficit) retained earnings | (925 | ) |
| 1,831 | |
| 711 | |
| (2,542 | ) |
| (925 | ) | |||||
Accumulated other comprehensive (loss) income | (561 | ) |
| (563 | ) |
| (48 | ) |
| 611 | |
| (561 | ) | |||||
Total (deficit) equity of our common shareholder | (82 | ) |
| 1,268 | |
| 663 | |
| (1,931 | ) |
| (82 | ) | |||||
Noncontrolling interests | - | |
| - | |
| 12 | |
| - | |
| 12 | | |||||
Total (deficit) equity | (82 | ) |
| 1,268 | |
| 675 | |
| (1,931 | ) |
| (70 | ) | |||||
Total liabilities and (deficit) equity | $ | 4,941 | |
| $ | 7,789 | |
| $ | 1,948 | |
| $ | (5,576 | ) |
| $ | 9,102 | |
136
Novelis Inc.
NOTES TO THE CONSOLIDATED FINANCIAL STATEMENTS - (Continued)
CONSOLIDATING BALANCE SHEET (In millions)
| As of March 31, 2014 | ||||||||||||||||||
| Parent |
| Guarantors |
| Non- |
| Eliminations |
| Consolidated | ||||||||||
ASSETS | |||||||||||||||||||
Current assets |
|
|
|
|
|
|
|
|
| ||||||||||
Cash and cash equivalents | $ | 4 | |
| $ | 372 | |
| $ | 133 | |
| $ | - | |
| $ | 509 | |
Accounts receivable, net of allowances |
|
|
|
|
|
|
|
|
| ||||||||||
- third parties | 15 | |
| 1,121 | |
| 246 | |
| - | |
| 1,382 | | |||||
- related parties | 1,093 | |
| 193 | |
| 57 | |
| (1,289 | ) |
| 54 | | |||||
Inventories | 36 | |
| 880 | |
| 257 | |
| - | |
| 1,173 | | |||||
Prepaid expenses and other current assets | 5 | |
| 76 | |
| 20 | |
| - | |
| 101 | | |||||
Fair value of derivative instruments | 12 | |
| 26 | |
| 14 | |
| (1 | ) |
| 51 | | |||||
Deferred income tax assets | - | |
| 96 | |
| 5 | |
| - | |
| 101 | | |||||
Assets held for sale | 28 | |
| 74 | |
| - | |
| - | |
| 102 | | |||||
Total current assets | 1,193 | |
| 2,838 | |
| 732 | |
| (1,290 | ) |
| 3,473 | | |||||
Property, plant and equipment, net | 100 | |
| 2,485 | |
| 928 | |
| - | |
| 3,513 | | |||||
Goodwill | - | |
| 600 | |
| 11 | |
| - | |
| 611 | | |||||
Intangible assets, net | 19 | |
| 617 | |
| 4 | |
| - | |
| 640 | | |||||
Investments in and advances to non-consolidated affiliates | - | |
| 612 | |
| - | |
| - | |
| 612 | | |||||
Investments in consolidated subsidiaries | 3,273 | |
| 612 | |
| - | |
| (3,885 | ) |
| - | | |||||
Deferred income tax assets | - | |
| 28 | |
| 52 | |
| - | |
| 80 | | |||||
Other long-term assets |
|
|
|
|
|
|
|
|
| ||||||||||
- third parties | 73 | |
| 89 | |
| 11 | |
| - | |
| 173 | | |||||
- related parties | 844 | |
| 61 | |
| - | |
| (893 | ) |
| 12 | | |||||
Total assets | $ | 5,502 | |
| $ | 7,942 | |
| $ | 1,738 | |
| $ | (6,068 | ) |
| $ | 9,114 | |
LIABILITIES AND EQUITY | |||||||||||||||||||
Current liabilities |
|
|
|
|
|
|
|
|
| ||||||||||
Current portion of long-term debt | $ | 21 | |
| $ | 10 | |
| $ | 61 | |
| $ | - | |
| $ | 92 | |
Short-term borrowings |
|
|
|
|
|
|
|
|
| ||||||||||
- third parties | 367 | |
| 287 | |
| 69 | |
| - | |
| 723 | | |||||
- related parties | 32 | |
| 809 | |
| - | |
| (841 | ) |
| - | | |||||
Accounts payable |
|
|
|
|
|
|
|
|
| ||||||||||
- third parties | 35 | |
| 912 | |
| 471 | |
| - | |
| 1,418 | | |||||
- related parties | 89 | |
| 377 | |
| 29 | |
| (442 | ) |
| 53 | | |||||
Fair value of derivative instruments | 14 | |
| 40 | |
| 7 | |
| (1 | ) |
| 60 | | |||||
Accrued expenses and other current liabilities |
|
|
|
|
|
|
|
|
| ||||||||||
- third parties | 104 | |
| 358 | |
| 85 | |
| - | |
| 547 | | |||||
- related parties | 250 | |
| 4 | |
| 2 | |
| (6 | ) |
| 250 | | |||||
Deferred income tax liabilities | - | |
| 16 | |
| - | |
| - | |
| 16 | | |||||
Liabilities held for sale | 10 | |
| 1 | |
| - | |
| - | |
| 11 | | |||||
Total current liabilities | 922 | |
| 2,814 | |
| 724 | |
| (1,290 | ) |
| 3,170 | | |||||
Long-term debt, net of current portion |
|
|
|
|
|
|
|
|
| ||||||||||
- third parties | 4,219 | |
| 40 | |
| 100 | |
| - | |
| 4,359 | | |||||
- related parties | 49 | |
| 788 | |
| 56 | |
| (893 | ) |
| - | | |||||
Deferred income tax liabilities | - | |
| 419 | |
| 6 | |
| - | |
| 425 | | |||||
Accrued postretirement benefits | 44 | |
| 422 | |
| 155 | |
| - | |
| 621 | | |||||
Other long-term liabilities | 28 | |
| 236 | |
| 7 | |
| - | |
| 271 | | |||||
Total liabilities | 5,262 | |
| 4,719 | |
| 1,048 | |
| (2,183 | ) |
| 8,846 | | |||||
Commitments and contingencies |
|
|
|
|
|
|
|
|
| ||||||||||
Temporary equity - intercompany | - | |
| 1,681 | |
| - | |
| (1,681 | ) |
| - | | |||||
Shareholder's equity |
|
|
|
|
|
|
|
|
| ||||||||||
Common stock | - | |
| - | |
| - | |
| - | |
| - | | |||||
Additional paid-in capital | 1,404 | |
| - | |
| - | |
| - | |
| 1,404 | | |||||
(Accumulated deficit) retained earnings | (1,073 | ) |
| 1,684 | |
| 680 | |
| (2,364 | ) |
| (1,073 | ) | |||||
Accumulated other comprehensive (loss) income | (91 | ) |
| (142 | ) |
| (18 | ) |
| 160 | |
| (91 | ) | |||||
Total equity of our common shareholder | 240 | |
| 1,542 | |
| 662 | |
| (2,204 | ) |
| 240 | | |||||
Noncontrolling interests | - | |
| - | |
| 28 | |
| - | |
| 28 | | |||||
Total equity | 240 | |
| 1,542 | |
| 690 | |
| (2,204 | ) |
| 268 | | |||||
Total liabilities and equity | $ | 5,502 | |
| $ | 7,942 | |
| $ | 1,738 | |
| $ | (6,068 | ) |
| $ | 9,114 | |
137
Novelis Inc.
NOTES TO THE CONSOLIDATED FINANCIAL STATEMENTS - (Continued)
CONSOLIDATING STATEMENT OF CASH FLOWS
(In millions)
|
| Year Ended March 31, 2015 | ||||||||||||||||||
|
| Parent |
| Guarantors |
| Non- |
| Eliminations |
| Consolidated | ||||||||||
OPERATING ACTIVITIES |
|
|
|
|
|
|
|
|
|
| ||||||||||
Net cash provided by (used in) operating activities |
| $ | 29 | |
| $ | 659 | |
| $ | 161 | |
| $ | (245 | ) |
| $ | 604 | |
INVESTING ACTIVITIES |
|
|
|
|
|
|
|
|
|
| ||||||||||
Capital expenditures |
| (17 | ) |
| (404 | ) |
| (97 | ) |
| - | |
| (518 | ) | |||||
Proceeds from sales of assets, net of transaction fees and hedging |
|
|
|
|
|
|
|
|
| | | |||||||||
- third parties |
| 29 | |
| 88 | |
| - | |
| - | |
| 117 | | |||||
Proceeds (outflows) from investment in and advances to affiliates, net |
| 250 | |
| 5 | |
| - | |
| (275 | ) |
| (20 | ) | |||||
(Outflows) proceeds from settlement of other undesignated derivative instruments, net |
| (19 | ) |
| 23 | |
| 1 | |
| - | |
| 5 | | |||||
Net cash provided by (used in) investing activities |
| 243 | |
| (288 | ) |
| (96 | ) |
| (275 | ) |
| (416 | ) | |||||
FINANCING ACTIVITIES |
|
|
|
|
|
|
|
|
|
| ||||||||||
Proceeds from issuance of long-term and short-term borrowings |
|
|
|
|
|
|
|
|
|
| ||||||||||
- third parties |
| - | |
| 315 | |
| 47 | |
| - | |
| 362 | | |||||
- related parties |
| - | |
| 500 | |
| 3 | |
| (503 | ) |
| - | | |||||
Principal payments of long-term and short-term borrowings |
|
|
|
|
|
|
|
|
|
| ||||||||||
- third parties |
| (21 | ) |
| (266 | ) |
| (37 | ) |
| - | |
| (324 | ) | |||||
- related parties |
| - | |
| (80 | ) |
| - | |
| 80 | |
| - | | |||||
Revolving credit facilities and other, net |
|
|
|
|
|
|
|
|
|
| ||||||||||
- third parties |
| 27 | |
| 97 | |
| 36 | |
| - | |
| 160 | | |||||
- related parties |
| (25 | ) |
| (686 | ) |
| - | |
| 711 | |
| - | | |||||
Return of capital to our common shareholder |
| (250 | ) |
| - | |
| - | |
| - | |
| (250 | ) | |||||
Proceeds from issuance of intercompany equity |
| - | |
| - | |
| 13 | |
| (13 | ) |
| - | | |||||
Dividends, noncontrolling interests and intercompany |
| - | |
| (244 | ) |
| (2 | ) |
| 245 | |
| (1 | ) | |||||
Debt issuance costs |
| (3 | ) |
| - | |
| - | |
| - | |
| (3 | ) | |||||
Net cash (used in) provided by financing activities |
| (272 | ) |
| (364 | ) |
| 60 | |
| 520 | |
| (56 | ) | |||||
Net increase in cash and cash equivalents |
| - | |
| 7 | |
| 125 | |
| - | |
| 132 | | |||||
Effect of exchange rate changes on cash |
| - | |
| (14 | ) |
| 1 | |
| - | |
| (13 | ) | |||||
Cash and cash equivalents - beginning of period |
| 4 | |
| 372 | |
| 133 | |
| - | |
| 509 | | |||||
Cash and cash equivalents - end of period |
| $ | 4 | |
| $ | 365 | |
| $ | 259 | |
| $ | - | |
| $ | 628 | |
138
Novelis Inc.
NOTES TO THE CONSOLIDATED FINANCIAL STATEMENTS - (Continued)
CONSOLIDATING STATEMENT OF CASH FLOWS
(In millions)
| Year Ended March 31, 2014 | ||||||||||||||||||
| Parent |
| Guarantors |
| Non- |
| Eliminations |
| Consolidated | ||||||||||
OPERATING ACTIVITIES |
|
|
|
|
|
|
|
|
| ||||||||||
Net cash provided by (used in) operating activities | $ | 144 | |
| $ | 893 | |
| $ | 233 | |
| $ | (568 | ) |
| $ | 702 | |
INVESTING ACTIVITIES |
|
|
|
|
|
|
|
|
| ||||||||||
Capital expenditures | (22 | ) |
| (492 | ) |
| (203 | ) |
| - | |
| (717 | ) | |||||
Proceeds from the sale of assets, net of transaction fees |
|
|
|
|
|
|
|
|
| ||||||||||
- third parties | - | |
| 7 | |
| 1 | |
| - | |
| 8 | | |||||
- related parties | - | |
| 8 | |
| - | |
| - | |
| 8 | | |||||
(Outflows) proceeds from investment in and advances to affiliates, net | (261 | ) |
| (41 | ) |
| - | |
| 286 | |
| (16 | ) | |||||
(Outflows) proceeds from settlement of other undesignated derivative instruments, net | (21 | ) |
| 21 | |
| 15 | |
| - | |
| 15 | | |||||
Net cash (used in) provided by investing activities | (304 | ) |
| (497 | ) |
| (187 | ) |
| 286 | |
| (702 | ) | |||||
FINANCING ACTIVITIES |
|
|
|
|
|
|
|
|
| ||||||||||
Proceeds from issuance of long-term and short-term borrowings |
|
|
|
|
|
|
|
|
| ||||||||||
- third parties | - | |
| 147 | |
| 22 | |
| - | |
| 169 | | |||||
- related parties | - | |
| - | |
| 56 | |
| (56 | ) |
| - | | |||||
Principal payments of long-term and short-term borrowings |
|
|
|
|
|
|
|
|
| ||||||||||
- third parties | (19 | ) |
| (143 | ) |
| (2 | ) |
| - | |
| (164 | ) | |||||
Revolving credit facilities and other, net |
|
|
|
|
|
|
|
|
| ||||||||||
- third parties | 162 | |
| 44 | |
| 2 | |
| - | |
| 208 | | |||||
- related parties | 25 | |
| 208 | |
| - | |
| (233 | ) |
| - | | |||||
Intercompany return of capital | - | |
| - | |
| (3 | ) |
| 3 | |
| - | | |||||
Intercompany dividends | - | |
| (479 | ) |
| (89 | ) |
| 568 | |
| - | | |||||
Debt issuance costs | (8 | ) |
| - | |
| - | |
| - | |
| (8 | ) | |||||
Net cash provided by (used in) financing activities | 160 | |
| (223 | ) |
| (14 | ) |
| 282 | |
| 205 | | |||||
Net increase in cash and cash equivalents | - | |
| 173 | |
| 32 | |
| - | |
| 205 | | |||||
Effect of exchange rate changes on cash | - | |
| 3 | |
| - | |
| - | |
| 3 | | |||||
Cash and cash equivalents - beginning of period | 4 | |
| 196 | |
| 101 | |
| - | |
| 301 | | |||||
Cash and cash equivalents - end of period | $ | 4 | |
| $ | 372 | |
| $ | 133 | |
| $ | - | |
| $ | 509 | |
139
Novelis Inc.
NOTES TO THE CONSOLIDATED FINANCIAL STATEMENTS - (Continued)
CONSOLIDATING STATEMENT OF CASH FLOWS
(In millions)
|
| Year Ended March 31, 2013 | ||||||||||||||||||
|
| Parent |
| Guarantors |
| Non- Guarantors |
| Eliminations |
| Consolidated | ||||||||||
OPERATING ACTIVITIES |
|
|
|
|
|
|
|
|
|
| ||||||||||
Net cash provided by (used in) operating activities |
| $ | 87 | |
| $ | 230 | |
| $ | 202 | |
| $ | (316 | ) |
| $ | 203 | |
INVESTING ACTIVITIES |
|
|
|
|
|
|
|
|
|
| ||||||||||
Capital expenditures |
| (11 | ) |
| (491 | ) |
| (273 | ) |
| - | |
| (775 | ) | |||||
Proceeds from the sale of assets, net of transaction fees |
|
|
|
|
|
|
|
|
| | | |||||||||
- third parties |
| 7 | |
| 12 | |
| - | |
| - | |
| 19 | | |||||
- related parties |
| - | |
| 2 | |
| - | |
| - | |
| 2 | | |||||
(Outflows) proceeds from investment in and advances to affiliates, net |
| (313 | ) |
| (20 | ) |
| - | |
| 336 | |
| 3 | | |||||
Proceeds (outflow) from settlement of undesignated derivative instruments, net |
| 13 | |
| 4 | |
| (13 | ) |
| - | |
| 4 | | |||||
Net cash (used in) provided by investing activities |
| (304 | ) |
| (493 | ) |
| (286 | ) |
| 336 | |
| (747 | ) | |||||
FINANCING ACTIVITIES |
|
|
|
|
|
|
|
|
|
| ||||||||||
Proceeds from issuance of long-term and short-term borrowings |
|
|
|
|
|
|
|
|
|
| ||||||||||
- third parties |
| 80 | |
| 98 | |
| 141 | |
| - | |
| 319 | | |||||
- related parties |
| 49 | |
| 9 | |
| - | |
| (58 | ) |
| - | | |||||
Principal payments of long-term and short-term borrowings |
|
|
|
|
|
|
|
|
|
| ||||||||||
- third parties |
| (92 | ) |
| (5 | ) |
| - | |
| - | |
| (97 | ) | |||||
- related parties |
| - | |
| (26 | ) |
| - | |
| 26 | |
| - | | |||||
Revolving credit facilities and other, net |
|
|
|
|
|
|
|
|
|
| ||||||||||
- third parties |
| 205 | |
| 127 | |
| - | |
| - | |
| 332 | | |||||
- related parties |
| (10 | ) |
| 286 | |
| (17 | ) |
| (259 | ) |
| - | | |||||
Proceeds from the issuances of intercompany equity |
| - | |
| 1 | |
| 44 | |
| (45 | ) |
| - | | |||||
Dividends, noncontrolling interests and intercompany |
| - | |
| (237 | ) |
| (81 | ) |
| 316 | |
| (2 | ) | |||||
Acquisition of noncontrolling interest in Novelis Korea Ltd. |
| (9 | ) |
| - | |
| - | |
| - | |
| (9 | ) | |||||
Debt issuance costs |
| (8 | ) |
| - | |
| - | |
| - | |
| (8 | ) | |||||
Net cash provided by (used in) financing activities |
| 215 | |
| 253 | |
| 87 | |
| (20 | ) |
| 535 | | |||||
Net (decrease) increase in cash and cash equivalents |
| (2 | ) |
| (10 | ) |
| 3 | |
| - | |
| (9 | ) | |||||
Effect of exchange rate changes on cash |
| - | |
| (9 | ) |
| 2 | |
| - | |
| (7 | ) | |||||
Cash and cash equivalents - beginning of period |
| 6 | |
| 215 | |
| 96 | |
| - | |
| 317 | | |||||
Cash and cash equivalents - end of period |
| $ | 4 | |
| $ | 196 | |
| $ | 101 | |
| $ | - | |
| $ | 301 | |
140
Item 9. Changes in and Disagreements with Accountants on Accounting and Financial Disclosure
None.
Item 9A. Controls and Procedures
Evaluation of Disclosure Controls and Procedures
We maintain disclosure controls and procedures designed to ensure that information required to be disclosed in the reports that we file or submit under the Securities Exchange Act of 1934, as amended (the Exchange Act) is recorded, processed, summarized and reported within the time periods specified in the SEC's rules and forms. Disclosure controls and procedures, as defined in Rules 13a-15(e) and 15d-15(e) under the Exchange Act, include controls and procedures designed to ensure that information required to be disclosed in the reports we file or submit under the Exchange Act is accumulated and communicated to our management, including the Principal Executive Officer and the Principal Financial Officer, as appropriate, to allow timely decisions regarding required disclosure. Any system of controls, however well designed and operated, can provide only reasonable, and not absolute, assurance that the objectives of the system are met.
As required by Securities and Exchange Commission rules, we have evaluated the effectiveness of the design and operation of our disclosure controls and procedures as of the end of the period covered by this Annual Report on Form 10-K. This evaluation was carried out under the supervision and with the participation of our management, including our Principal Executive Officer and Principal Financial Officer. Based on this evaluation, our management, including our Principal Executive Officer and Principal Financial Officer have concluded that our disclosure controls and procedures were effective as of March 31, 2015 .
Management's Report on Internal Control over Financial Reporting
The report of management on our internal control over financial reporting as of March 31, 2015 is set forth in Part II, "Item 8. Financial Statements and Supplementary Data" in this report.
Changes in Internal Control Over Financial Reporting
There have been no changes in our internal control over financial reporting (as defined in Rule 13a-15(f) under the Exchange Act) during the most recently completed fiscal quarter that have materially affected, or are reasonably likely to materially affect, our internal control over financial reporting.
Item 9B. Other Information
Fiscal Year 2016 Incentive Compensation Plans
On May 7, 2015, our Board of Directors approved a fiscal year 2016 annual incentive plan (2016 AIP) and a long term incentive plan covering fiscal years 2016 through 2019 (2016 LTIP). For additional information regarding the 2016 AIP and the 2016 LTIP, see Item 11 - Executive Compensation, Fiscal Year 2016 Incentive Compensation Plans, which is incorporated by reference into this item.
Interim President and Chief Executive Officer Compensation Arrangement
Also on May 7, 2015, our Board of Directors approved a compensation arrangement with one of our named executive officers, Steven Fisher, in respect of his service as the Company's Interim President and Chief Executive Officer. Under the terms of the arrangement, Mr. Fisher will receive an amount up to $400,000 for up to six months of service. The actual payment amount will be prorated based on the number of months Mr. Fisher serves as Interim President and Chief Executive Officer and is subject to the Board's discretion.
141
PART III
Item 10. Directors, Executive Officers and Corporate Governance
Our Directors
Our Board of Directors is currently comprised of six directors. All of our directors were appointed by our sole shareholder, Hindalco. Our directors' terms will expire at each annual shareholder meeting, provided that if an election of directors is not held at an annual shareholder meeting, the directors then in office shall continue in office or until their successors shall be elected. Biographical details for each of our directors are set forth below.
Name |
| Director Since |
| Age |
| Position |
Kumar Mangalam Birla |
| May 15, 2007 |
| 47 |
| Chairman of the Board |
Askaran Agarwala (B) |
| May 15, 2007 |
| 81 |
| Director |
D. Bhattacharya (A)(B) |
| May 15, 2007 |
| 66 |
| Director and Vice Chairman of the Board |
Clarence J. Chandran (A)(B) |
| January 6, 2005 |
| 66 |
| Director |
Donald A. Stewart (A) |
| May 15, 2007 |
| 68 |
| Director |
Satish Pai (B) |
| August 6, 2013 |
| 53 |
| Director |
(A) | Member of our Audit Committee |
(B) | Member of our Compensation Committee |
Mr. Kumar Mangalam Birla was elected as the Chairman of the Board of Directors of Novelis on May 15, 2007. Mr. Birla is the Chairman of Hindalco Industries Limited which is an industry leader in aluminum and copper. He is also the Chairman of Aditya Birla Group's leading blue-chip companies including Grasim, UltraTech Cement, Aditya Birla Nuvo and Idea Cellular; and globally, Novelis, Aditya Birla Chemicals (Thailand) Limited and Indo Phil Textile Mills Inc. Philippines. Mr. Birla also serves as director on the board of the Group's international companies spanning Thailand, Indonesia, Philippines, Egypt, and Canada. Additionally, Mr. Birla is the Chancellor of the Birla Institute of Technology & Science, Pilani. He is a member of the London Business School's Asia Pacific Advisory Board. Mr. Birla's past affiliations include service on the boards of Maruti Udyog Limited and Tata Iron and Steel Co. Limited. Mr. Birla brings to the board significant global leadership experience acquired through his service as a director of numerous corporate, professional and regulatory entities in various regions of the world. Mr. Birla provides valuable insight into the business and political conditions in which we conduct our global operations.
Mr. Askaran Agarwala has served as a Director of Hindalco since July 2004. He was Chairman of the Business Review Council of the Aditya Birla Group from October 2003 to March 2010. From 1982 to October 2003, he was President of Hindalco. Mr. Agarwala serves on the Compensation Committee of the Novelis Board of Directors. Mr. Agarwala also serves as a director on several boards, including Udyog Services Ltd., Aditya Birla Chemicals (India) Limited, formerly known as Bihar Caustic & Chemicals Ltd., Tanfac Industries Ltd., Birla Insurance Brokers, Aditya Birla Health Services Limited, P.T. Elegant Textile Industry (Indonesia), P.T. Indo Bharat Rayon (Indonesia) and Swiss Singapore Overseas Enterprises PTE Ltd. (Singapore). He is a Trustee of G.D. Birla Medical Research and Education Foundation, Vaibhav Medical and Education Foundation, Sarla Basant Birla Memorial Trust and Aditya Vikram Birla Memorial Trust, Trident Trust, Ladsaria Charitable and Welfare Trust and Hellen Keller Institute of Deaf and Blind. Mr. Agarwala has served as a director of Renusagar Engineering & Power Services Limited, Rosa Power Supply Company Ltd., Aditya Birla Science & Technology Company. Mr. Agarwala's past and current service as a director of several companies and industry associations in the metals and manufacturing industries adds a valuable perspective to the board. Having served as president of our parent company, Hindalco, Mr. Agarwala also brings a depth of understanding of our business and operations.
Mr. Debnarayan Bhattacharya has served as Managing Director of Hindalco since 2004. Mr. Bhattacharya is Vice Chairman of Novelis and serves on the Audit and Compensation Committees of the Novelis Board of Directors. He is the Chairman of Aditya Birla Minerals Limited in Australia. Mr. Bhattacharya also serves as a Director of Aditya Birla Management Corporation Private Ltd. and Pidilite Industries Limited. In the past, Mr. Bhattacharya has served as a director of Dahej Harbour and Infrastructure Limited, Birla Management Centre Services Limited, Utkal Alumina International Limited, Aditya Power Company Limited, Minerals and Minerals Limited, Hindalco-Almex Aerospace Limited, Mahan Coal Limited and Pidilite Industries Limited. Mr. Bhattacharya's extensive knowledge of the aluminum and metals industries provides a valuable resource to the company in the setting and implementation of its operating business plans as the Company considers various strategic alternatives. Mr. Bhattacharya brings to the board a high degree of financial literacy.
142
Clarence J. Chandran has been a director of the Company since 2005. Mr. Chandran serves on the Compensation and Audit Committees of the Novelis Board of Directors, and acts as the Chairman of the Compensation Committee. Mr. Chandran is Chairman of 4Front Capital Partners Inc. and CEO of GreenEdge Capital Inc. Mr. Chandran also serves as Venture Partner of The Walsingham Fund. He is a past director of Marport Deep Sea Technologies Inc. and is a past director of Alcan Inc. and MDS Inc. He retired as Chief Operating Officer of Nortel Networks Corporation (communications) in 2001. Mr. Chandran is a member of the Board of Visitors of the Pratt School of Engineering at Duke University. He has acquired years of significant experience through his leadership and management of companies with international business operations. Mr. Chandran brings to the board his deep knowledge in the areas of technology, sales and global operations.
Donald A. Stewart is the retired Chief Executive Officer and Director of Sun Life Financial Inc. and Sun Life Assurance Company of Canada. Mr. Stewart serves on the Audit Committee of the Novelis Board of Directors and serves as its Chairman. Mr. Stewart also serves as a director of Birla Sun Life Insurance Company Limited, Birla Sun Life Asset Management Company Limited, Sun Life Global Investments Inc., Sun Life Everbright Life Insurance Company Limited, Sun Life Assurance Company of Canada (UK) Limited, and SLFC Assurance (UK) Limited. He is the Chairman of AV Cell Inc., AV Nackawic Inc., AV Terrace Bay Inc., and the federal-provincial Nominating Committee for the Canada Pension Plan Investment Board. His past affiliations include service as a director of CI Financial Corp and Sun Life Financial Inc. Mr. Stewart brings extensive financial management and operating experience to the board.
Mr. Satish Pai has served as Deputy Managing Director of Hindalco Industries Limited since February 2014. He previously served as Chief Executive Officer - Aluminum Business of Hindalco Industries Limited from August 2013 to January 2014. Prior to that, Mr. Pai served as Executive Vice President, Worldwide Operations of Schlumberger Ltd. Prior to that, Mr. Pai joined Schlumberger Ltd. in 1985 as a field engineer and held various positions of increased responsibility over the course of his 28 year tenure with the company. He serves on the Compensation Committee of the Novelis Board of Directors and also serves as a director of Hindalco. Mr. Pai brings extensive industry and global operating experience to the board.
Our Executive Officers
The following table sets forth information for persons serving as executive officers of our Company as of April 30, 2015. Biographical details for each of our executive officers are also set forth below.
Name |
| Age |
| Position |
Steven Fisher |
| 44 |
| Interim President and Chief Executive Officer, Senior Vice President and Chief Financial Officer |
Shashi Maudgal |
| 61 |
| Senior Vice President and President, Novelis Asia |
Erwin Mayr |
| 45 |
| Senior Vice President and President, Novelis Europe |
Antonio Tadeu Coelho Nardocci |
| 57 |
| Senior Vice President and President, Novelis South America |
Marco Palmieri |
| 58 |
| Senior Vice President and President, Novelis North America |
Jack Clark |
| 55 |
| Senior Vice President and Chief Technical Officer |
Leslie Joyce |
| 53 |
| Senior Vice President and Chief People Officer |
Nicholas Madden |
| 58 |
| Senior Vice President and Chief Procurement Officer |
Randal Miller |
| 52 |
| Vice President, Treasurer |
Robert Nelson |
| 57 |
| Vice President, Controller and Chief Accounting Officer |
Leslie J. Parrette, Jr. |
| 53 |
| Senior Vice President, General Counsel, Compliance Officer and Corporate Secretary |
Karen Renner |
| 53 |
| Vice President and Chief Information Officer |
Manfred Stanek |
| 45 |
| Vice President and Chief Strategy and Commercial Officer |
Steven Fisher is our Interim President and Chief Executive Officer and our Senior Vice President and Chief Financial Officer. Mr. Fisher joined Novelis in February 2006 as Vice President, Strategic Planning and Corporate Development. He was appointed as our Interim Chief Executive Officer on April 20, 2015, while our board completes its search for a permanent chief executive. Mr. Fisher was appointed as our Chief Financial Officer in May 2007 following the acquisition of Novelis by Hindalco. Mr. Fisher served as Vice President and Controller for TXU Energy, the non-regulated subsidiary of TXU Corp. from July 2005 to February 2006. Prior to joining TXU Energy, Mr. Fisher served in various senior finance roles at Aquila, Inc., an international electric and gas utility and energy trading company, including Vice President, Controller and Strategic Planning, from 2001 to 2005. He is also a member of the board of directors of Lionbridge Technologies, Inc. since 2009. Mr. Fisher is a
143
graduate of the University of Iowa in 1993, where he earned a B.B.A. in Finance and Accounting. He is a Certified Public Accountant.
Shashi Maudgal joined Novelis May 14, 2012, as Senior Vice President and President of Novelis Asia. Mr. Maudgal was previously Chief Marketing Officer for Hindalco from February 2001 to May 2012. During his tenure at Hindalco, Mr. Maudgal built and led the company's marketing department, led the European due diligence process during Hindalco's acquisition of Novelis in 2007, and served as a member of the executive leadership team in setting strategic direction. In addition, Mr. Maudgal is a member of the Aditya Birla Group's Business Review Councils for Grasim Viscose Fiber and Ultratech's Birla White Cement. Mr. Maudgal earned his Bachelor of Technology in Chemical Engineering from the Indian Institute of Technology, Delhi, and his M.B.A. in Marketing & Finance from the Indian Institute of Management, Calcutta.
Erwin Mayr has served as our Senior Vice President and President, Novelis Europe since May 2013. He previously served as Senior Vice President and Chief Strategy and Commercial Officer from October 2009 to April 2013. Prior to that, Mr. Mayr held a number of leadership positions within our European operations, including Business Unit President, Advanced Rolled Products, from 2002 to 2009. Before joining our company in 2002, Mr. Mayr was an associate partner with the consulting firm Monitor Group. Mr. Mayr earned his Ph.D., Physics from Ulm University (Germany).
Antonio Tadeu Coelho Nardocci has served as our Senior Vice President and President, Novelis South America since May 2013. He previously served as our Senior Vice President and President, Novelis Europe from June 2009 to April 2013. Prior to that, he served as our Strategy, Innovation and Technology from August 2008 to June 2009, and as Senior Vice President and President of our South American operations from February 2005 to August 2008. Before our spin-off from Alcan, Mr. Nardocci held a number of leadership positions with Alcan, most recently serving as President of Rolled Products South America from March 2002 until January 2005. Mr. Nardocci graduated from the University of São Paulo in Brazil with a degree in metallurgy.
Marco Palmieri has served as our Senior Vice President and President, Novelis North America since June 2013. He previously served as Senior Vice President and President, Novelis South America from August 2011 to May 2013. Prior to joining Novelis, Mr. Palmieri spent more than 30 years in the metals and engineering industries, including more than 25 years with Rio Tinto Alcan, where he held a succession of international leadership positions in various areas, including business development, primary metal and energy production. Before joining Novelis, Mr. Palmieri was most recently Aluminum Business Director for Votorantim Metais Ltd.
Jack Clark has served as our Senior Vice President and Chief Technical Officer since May 2013, having previously served as our Chief Technical Officer since April 2012. Mr. Clark joined Novelis in April 2010 to lead the global engineering group. Mr. Clark has more than 30 years of industry experience, having begun his career with Alcoa as a mechanical engineer at Davenport Works in Iowa. He went on to roles of increasing responsibility at Alcoa in North America and Europe, culminating in his role as Vice President of Operations for Alcoa China Rolled Products. Mr. Clark graduated from Purdue University with a B.S. in Mechanical Engineering.
Leslie W. Joyce has served as our Senior Vice President and Chief People Officer since September 2011. Dr. Joyce previously served as our Vice President, Global Talent Management from 2009 to 2011. Prior to joining Novelis in 2009, she was employed by The Home Depot where she served as Vice President and Chief Learning Officer from 2004 to 2008 and Senior Director, Organization Effectiveness from 2002 to 2004. Prior to that, she held positions of increasing responsibility with GlaxoSmithKline, a leading global pharmaceutical company. Dr. Joyce earned a Masters of Science, and a Doctorate from North Carolina State University in Industrial and Organizational Psychology.
Nicholas Madden is our Senior Vice President and Chief Supply Chain Officer. Prior to this role, which he assumed in January 2012, Mr. Madden served as Senior Vice President and Chief Procurement Officer from May 2009 until December 2011 and Vice President, Global Procurement and Metal Management beginning in 2006. Mr. Madden served as President of Novelis Europe's Can, Litho and Recycling business unit beginning in October 2004. He was Vice President of Metal Management and Procurement for Alcan's Rolled Products division in Europe from December 2000 until September 2004 and was also responsible for the secondary recycling business. Mr. Madden holds a B.Sc. (Hons) degree in Economics and Social Studies from University College in Cardiff, Wales.
Randal P. Miller is our Vice President, Treasurer. Prior to joining Novelis in July 2008, Mr. Miller served as Vice President and Treasurer of Transocean Offshore Deepwater Drilling from May 2006 to November 2007 where he was responsible for all treasury, banking, and capital markets activities for Transocean and its subsidiaries. From 2001 to 2006, Mr. Miller served as Vice President Finance, Treasurer of Aquila, Inc. Mr. Miller earned his B.S.B.A. from Iowa State University and M.B.A from the University of Missouri - Kansas City.
144
Robert Nelson is our Vice President, Controller and Chief Accounting Officer. Mr. Nelson served as the Acting Controller of Novelis Inc. beginning in July 2008 and was appointed Vice President, Controller and Chief Accounting Officer in November 2008. Previously, he was employed for 22 years by Georgia Pacific, one of the world's leading manufacturers of tissue, pulp, paper, packaging, and building products. Mr. Nelson served in a variety of corporate and operational financial roles at Georgia Pacific, most recently as Vice President and Controller from 2004 to 2006. Prior to that, he was Vice President Finance, Consumer Products & Packaging. Mr. Nelson earned a degree in Accountancy from the University of Illinois - Urbana - Champaign and is a Certified Public Accountant in the state of Georgia.
Leslie J. Parrette, Jr. rejoined our company in October 2009 to serve as our Senior Vice President, General Counsel and Compliance Officer, and he was appointed Corporate Secretary in February 2010. Before rejoining Novelis, Mr. Parrette served as Senior Vice President, Legal Affairs and General Counsel for WESCO International, Inc. (formerly Westinghouse Electric Supply Co.) (electrical product distribution) from March 2009 until October 2009. From March 2005 until March 2009, he served as our Senior Vice President, General Counsel, Secretary and Compliance Officer. Prior to that, Mr. Parrette served as Senior Vice President, General Counsel and Secretary for Aquila, Inc. (gas and electric utility; energy trading) from July 2000 until February 2005. Mr. Parrette holds an A.B. in Sociology from Harvard College and received his J.D. from Harvard Law School.
Karen Renner has served as our Vice President and Chief Information Officer since October 2010. Prior to joining Novelis, Ms. Renner was employed by General Electric Company where she spent 18 years in progressively senior information technology leadership roles, including CIO of GE Digital Energy, GE Security and GE Share Services/Quality. Ms. Renner earned both her undergraduate and Master's degree in Industrial Engineering from Auburn University as well as an M.B.A. from Georgia State University.
Manfred Stanek has served as our Vice President, Strategy and Chief Commercial Officer since April 1, 2014. In this role, Mr. Stanek is responsible for developing Novelis' company-wide strategy and leading the global commercial teams for the Automotive, Can and Specialty Products value streams. He previously served Vice President, Commercial and Strategy for Novelis South America from January 2013 to March 2014 and as Director, Specialty Products from June 2012 to December 2012. Mr. Stanek came to Novelis from U.S. Zinc in Houston, Texas, where he served as CEO from 2009 to 2012. Prior to that, he served as Commercial Director for Votorantim Metais in Sao Paulo, Brazil. Mr. Stanek earned a master's degree in Business Administration from the University of Economics and Business Administration in Vienna, Austria.
Board of Directors and Corporate Governance Matters
We are committed to our corporate governance practices, which we believe are essential to our success and to the enhancement of shareholder value. Our Senior Notes are publicly traded in the U.S., and, accordingly, we make required filings with U.S. securities regulators. We make these filings available on our website at www.novelis.com as soon as reasonably practicable after they are electronically filed. We are subject to a variety of corporate governance and disclosure requirements. Our corporate governance practices meet applicable regulatory requirements to ensure transparency and effective governance of the company.
Our Board of Directors reviews corporate governance practices in light of developing requirements in this field. As new provisions come into effect, our Board of Directors will reassess our corporate governance practices and implement changes as and when appropriate. The following is an overview of our corporate governance practices.
Novelis Board of Directors
Our Board of Directors currently has six members, all of whom are appointed by our sole shareholder. Our Board of Directors has the responsibility for stewardship of Novelis Inc., including the responsibility to ensure that we are managed in the interest of our sole shareholder, while taking into account the interests of other stakeholders. Our Board of Directors supervises the management of our business and affairs and discharges its duties and obligations in accordance with the provisions of: (1) our articles of incorporation and bylaws; (2) the charters of its committees and (3) other applicable legislation and company policies.
Our corporate governance practices require that, in addition to certain statutory duties, the following matters be subject to our Board of Directors' approval: (1) capital expenditure budgets and significant investments and divestments; (2) our strategic and value-maximizing plans; (3) the number of directors within the limits provided by our by-laws and (4) any matter which may have the potential for substantial impact on Novelis. Our Board of Directors reviews its composition and size once a year. Senior management makes regular presentations to our Board of Directors on the main areas of our business.
145
Corporate Governance
Holders of our Senior Notes and other interested parties may communicate with the Board of Directors, a committee or an individual director by writing to Novelis Inc., Two Alliance Center, 3560 Lenox Road N.E., Suite 2000, Atlanta, GA 30326, Attention: Corporate Secretary - Board Communication. All such communications will be compiled by the Corporate Secretary and submitted to the appropriate director or board committee. The Corporate Secretary will reply or take other actions in accordance with instructions from the applicable board contact.
Committees of Our Board of Directors
Our Board of Directors has established two standing committees: the Audit Committee and the Compensation Committee. Each committee is governed by its own charter. According to their authority as set out in their charters, our Board of Directors and each of its committees may engage outside advisors at the expense of Novelis.
Audit Committee and Financial Experts
Our Board of Directors has established an Audit Committee. Messrs. Stewart, Bhattacharya and Chandran are the members of the Audit Committee. Mr. Stewart, an independent director, has been identified as an "audit committee financial expert" as that term is defined in the rules and regulations of the SEC.
Our Audit Committee's main objective is to assist our Board of Directors in fulfilling its oversight responsibilities for the integrity of our financial statements, our compliance with legal and regulatory requirements, the qualifications and independence of our independent registered public accounting firm and the performance of both our internal audit function and our independent registered public accounting firm. Under the Audit Committee charter, the Audit Committee is responsible for, among other matters:
• | evaluating and compensating our independent registered public accounting firm; |
• | making recommendations to the Board of Directors and shareholder relating to the appointment, retention and termination of our independent registered public accounting firm; |
• | discussing with our independent registered public accounting firm its qualifications and independence from management; |
• | reviewing with our independent registered public accounting firm the scope and results of its audit; |
• | pre-approving all audit and permissible non-audit services to be performed by our independent registered public accounting firm; |
• | reviewing areas of potential significant financial risk and the steps taken to monitor and manage such exposures; |
• | overseeing the financial reporting process and discussing with management and our independent registered public accounting firm the interim and annual financial statements that we file with the SEC; and |
• | reviewing and monitoring our accounting principles, accounting policies and disclosure, internal control over financial reporting and disclosure controls and procedures. |
Compensation Committee
Our Compensation Committee establishes our general compensation philosophy and oversees the development and implementation of compensation policies and programs. It also reviews and approves the level of and/or changes in the compensation of individual executive officers taking into consideration individual performance and competitive compensation practices. The committee's specific roles and responsibilities are set out in its charter. Our Compensation Committee periodically reviews the effectiveness of our overall management organization structure and succession planning for senior management, reviews recommendations for the appointment of executive officers, and reviews annually the development process for high potential employees.
Code of Conduct and Guidelines for Ethical Behavior
Novelis has adopted a Code of Conduct and maintains a Code of Ethics for Senior Financial Officers that applies to our senior financial officers including our principal executive officer, principal financial officer, principal accounting officer, or persons performing similar functions. Copies of the Code of Conduct and the Code of Ethics for Senior Financial Officers are available on our website at www.novelis.com. We will promptly disclose any future amendments to these codes on our website as well as any waivers from these codes for executive officers and directors. Copies of these codes are also available in print from our Corporate Secretary upon request.
146
Item 11. Executive Compensation
This section provides a discussion of the background and objectives of our compensation programs for senior management, as well as a discussion of the material compensation elements of each named executive officer for fiscal 2015 identified in the following table. The named executive officers are determined in accordance with rules of the Securities and Exchange Commission and include our principal executive officer, our principal financial officer and the three other highest paid executive officers that were employed by the Company on March 31, 2015. Philip Martens served as our President and Chief Executive Officer through the end of fiscal 2015 and ceased employment with Novelis Inc. on April 20, 2015. Steven Fisher was named Interim President and Chief Executive Officer on April 20, 2015.
Named Executive Officer for Fiscal 2015 | Title |
Philip Martens | President and Chief Executive Officer |
Steven Fisher | Senior Vice President and Chief Financial Officer |
Leslie J. Parrette, Jr. | Senior Vice President, General Counsel, Compliance Officer and Corporate Secretary |
Erwin Mayr | Senior Vice President and President of Novelis Europe |
Marco Palmieri | Senior Vice President and President of Novelis North America |
Compensation Committee and Role of Management
The Compensation Committee of our board of directors (the "Committee") is responsible for approving the compensation programs for our named executive officers and making decisions regarding specific compensation to be paid or awarded to them. The Committee acts pursuant to a charter approved by our board.
Our Chief Human Resources Officer serves as the primary management liaison officer for the Committee. Our human resources and legal departments provide assistance to the Committee in the administration of the Committee's responsibilities.
Our named executive officers have no direct role in setting their own compensation. The Committee, however, meets with members of our management team to evaluate performance against pre-established goals, and management makes recommendations to the board regarding budgets, production/sales forecasts and other information, which affect certain goals. Our Principal Executive Officer may also share his observations and make recommendations to the Committee regarding individual performance, expected future contributions and compensation matters related to other named executive officers and provide input regarding executive compensation programs and policies generally.
Management assists the Committee by providing information needed or requested by the Committee (such as our performance against budget and objectives, historical compensation, compensation expense, current Company policies and programs, country-specific prevalent compensation practices, peer group metrics and peer group target pay levels) and by providing input and advice regarding potential changes to compensation programs and policies and their impact on the Company and its executives.
In the first quarter of each fiscal year, the Committee (1) reviews prior year performance and approves the distribution of short-term incentive and long-term incentive earned payouts, if any, for the prior year, (2) reviews and approves base pay and short-term incentive targets for executives for the current year, and (3) recommends to the board of directors the form of long-term incentive award vehicles and vesting performance criteria for the current cycle of the program. The Committee may deviate from the above practice when appropriate under the circumstances.
Although the Committee did not independently engage a third party compensation consultant to assist in developing our fiscal 2015 compensation program, management worked with Mercer LLC (a global human resource consulting firm) to evaluate and benchmark our executive compensation program, and management provided the Committee with the outcome of the Mercer analysis. Management also routinely reviews compensation surveys published by other leading global human resources consulting firms. Hay Group (a global human resource consulting firm) periodically assists management with the internal leveling of executive jobs to ensure internal equity and external competitiveness of pay opportunities based on an executive's job scope and complexity.
For executive compensation benchmarking purposes, in addition to large global companies headquartered in the southeastern United States with whom Novelis may compete for executive talent, management focuses on other major companies in the manufacturing and materials sectors having revenues in excess of $1 billion. The companies that comprise our peer group may change from year to year as a result of merger/acquisition activity or revenue growth of relevant companies that moves such
147
companies into consideration. The peer group considered in management's most recent compensation competitive analysis consisted of the following companies and have median revenues of approximately $13 billion:
AGCO | Coca-Cola Co. | Noranda Aluminum Holding |
Air Products & Chemicals Inc. | Dow Chemical | Southern Co. |
Alcoa Inc. | Ingersoll- Rand PLC | Genuine Parts Co. |
Altria Group Inc. | PPG Industries | Praxair |
Ashland | Eastman Chemical Co. | Newell Rubbermaid |
Caterpillar Inc. | Kennametal |
|
While the Committee and management review compensation data (both in surveys and public filings) to confirm that our executives' compensation program is competitive, discretion is retained in setting an individual executive's compensation. As a result, compensation for an executive may differ materially from the survey or peer group data and may be influenced by factors including past performance, experience and potential, retention needs, job position and/or tenure. Management and the Committee focus on target compensation opportunities disclosed in survey and peer group compensation data (and not actual compensation earned, which is influenced by the historical company or individual performance of the survey and peer group participants).
Objectives and Design of Our Compensation Program
Our executive compensation program is designed to attract, retain, and reward talented executives who will contribute to our long-term financial and operational success and thereby build value for our shareholder. The program is organized around three fundamental principles:
• | Provide Total Cash and Total Direct Compensation Opportunities that are Competitive with Similar Positions at Comparable Companies : To enable us to attract, motivate and retain qualified executives to build long-term stockholder value, total cash compensation (base pay plus annual short-term incentives) and total direct compensation (total cash compensation plus the value of long-term incentives) opportunities for each executive are targeted at levels to be market competitive and reflect the value paid to executives in similar positions at comparable companies and also be appropriately positioned within the Company to ensure internal equity based on the scope and complexity of the role as it is designed at Novelis. |
• | A Substantial Portion of Total Direct Compensation Should be at Risk Because it is Performance-Based : We believe an executive's actual compensation should be linked directly to the Company's short-term and long-term financial performance and each individual's annual contribution. Consequently, a substantial portion of an executive's total direct compensation should be at risk, with amounts that are paid dependent on actual performance against pre-established objectives for both the individual and financial goals of the Company. The portion of an individual's total direct compensation that is based upon these performance objectives and financial goals should increase as the individual's business responsibilities and job scope increase. Additionally, we believe performance that exceeds target goals should be appropriately rewarded and aligned with prevalent market practices. |
• | A Substantial Portion of Total Direct Compensation Should be Delivered in the Form of Long-Term Performance Based Awards : We believe a long-term stake in the sustained financial performance of Novelis effectively aligns executive and shareholder interests and provides motivation for enhancing shareholder value. |
The Committee recognizes that the engagement of strong talent in critical functions may require the recruitment of new executives and involve negotiations with individual candidates. As a result, the Committee may determine in a particular situation that it is in our best interests to negotiate a compensation package that deviates from the principles set forth above.
148
Key Elements of Our Compensation Program
Our compensation program consists of four key elements: base pay, short-term (annual) incentives, long-term incentives, and employee benefits, which includes certain executive perquisites. The Committee reviews these compensation elements, generally during the first quarter of the fiscal year. On a regular basis, the Committee compares the competitiveness of these key elements to that of companies in our peer group and/or to available compensation survey market data. Our objective for named executive officer compensation is to be at or near the peer group median (50th percentile) for both target total cash compensation and total direct compensation. The competitive analysis conducted by Mercer LLC during the fourth quarter of fiscal 2014 that was used to help establish compensation opportunities for fiscal 2015 revealed that, in aggregate, both target total cash compensation and total direct compensation for our named executive officers were below (i.e., approximately 75% of) the peer group median. Unless otherwise indicated, all amounts paid in currencies other than U.S. dollars are reflected in the Compensation Discussion and Analysis in U.S. dollars as adjusted by the March 31, 2015 exchange rates.
Base Pay. Based on market practices, we believe it is appropriate that a minimum portion of total direct compensation be provided in a form that is fixed and recognizes individual performance in the prior fiscal year. Any changes in base salaries are generally effective the week of July 1 (i.e., the start of the Company's second quarter of the fiscal year). The Committee's objective is to position base salaries for the named executive officers at or near the median of comparable positions at companies in our peer group. The competitive analysis conducted by Mercer LLC during the fourth quarter of fiscal 2014 revealed that, in aggregate, base salaries for our named executive officers were slightly below the peer group median.
Named executive officers' salaries were increased in fiscal 2015 as shown in the table below, in part based upon a review of Novelis' compensation competitiveness relative to the comparator peer group. All increases reflect changes in annual base salary in an officer's home country currency and exclude any additional payments related to a job assignment outside of one's home country.
Named Executive Officer |
| Fiscal 2015 % Salary Increase |
Philip Martens |
| 5.0% |
Steven Fisher |
| 3.5% |
Leslie Parrette |
| 3.0% |
Erwin Mayr |
| 4.0% |
Marco Palmieri |
| 6.0% |
Short-Term (Annual) Cash Incentives. We believe that an annual incentive opportunity is necessary to attract, retain and reward our executives. Our philosophy concerning annual incentive program design for executives is based on the guiding values below:
• | Annual incentives should be directly linked with and clearly communicate the strategic priorities set by the board. |
• | Annual incentives should be primarily weighted on the achievement of Company-wide financial goals. |
• | Annual incentives should be 100% at-risk, and there should be a minimum financial performance threshold that must be attained to receive any payout. |
• | Performance goals should be sufficiently ambitious to drive enterprise value creation, but also be based on metrics that executives can meaningfully influence over the annual timeframe, and payouts should not be concentrated on a single metric. |
• | Threshold, target and maximum opportunity payouts (as a percent of salary) should be comparable with opportunity payouts of executives in similar roles at other benchmark companies/industries. |
• | The Committee retains the discretion to adjust, up or down, annual incentives earned based on the Committee's subjective assessment of individual performance. |
Our Committee and board, after input from management, approved our fiscal 2015 annual incentive plan ("AIP") on May 13, 2014. The performance benchmarks for the year were tied to three key metrics: (1) the Company's normalized earnings before interest, taxes, depreciation and amortization ("EBITDA") performance; (2) the Company's operating free cash flow performance; and (3) the executive's individual performance in recognition of each individual's unique job responsibilities and annual objectives.
No AIP bonuses are payable with respect to any of the three incentive metrics unless the EBITDA performance for fiscal 2015 achieves at least 75% of the financial target. If the EBITDA threshold is achieved, the actual payout under the two financial
149
metrics will range from 50% to 200% of target payout opportunity depending upon the actual performance results attributable to each metric, and the individual performance metric's actual payout can range from 60% to 200% of target payout opportunity. Actual performance below the threshold for a particular metric results in no payout for that specific metric.
The table below shows the 2015 AIP target and actual performance for each goal and the amount earned based on actual performance. The AIP payable to Mr. Martens was included in his negotiated severance arrangement resulting from his separation from service on April 20, 2015 and is shown in the Summary Compensation Table.
Named Executive Officer | Target Bonus as Percentage of Salary | Performance Metric (A) | Performance Metric Weighting | Bonus Payable at Target Performance (B) $ | Bonus Earned Based on Actual Performance (B) $ | Actual Bonus as a Percentage of Target Bonus (rounded) |
Steven Fisher | 85% | EBITDA Cash Flow Individual | 50% 40% 10% 100% | 234,014 187,211 46,803 468,028 | 156,321 374,422 46,803 577,546 | 67% 200% 100% 123% |
Erwin Mayr | 65% | EBITDA Cash Flow Individual | 50% 40% 10% 100% | 173,252 138,602 34,650 346,504 | 115,732 277,203 41,580 434,515 | 67% 200% 120% 125% |
Leslie Parrette | 60% | EBITDA Cash Flow Individual | 50% 40% 10% 100% | 156,818 125,454 31,364 313,636 | 104,754 250,908 37,636 393,298 | 67% 200% 120% 125% |
Marco Palmieri | 65% | EBITDA Cash Flow Individual | 50% 40% 10% 100% | 116,133 92,906 23,227 232,266 | 77,577 185,812 27,872 291,261 | 67% 200% 120% 125% |
(A) | AIP fiscal 2015 performance metric definitions are approved by the Compensation Committee and defined in the footnotes to the Grants of Plan-Based Awards table. |
(B) | Amounts for Messrs. Mayr and Palmieri are reflected in U.S. dollars as adjusted by the March 31, 2015 exchange rates. |
Long-Term Incentives. We believe a long-term incentive program that comprises a substantial portion of each executive's total direct compensation opportunity is necessary to reward our executives. Our philosophy concerning long-term incentive design for executives is based on the guiding values below:
• | Long-term incentives should motivate achievement of long-term strategic and financial goals and incent actions that are intended to create sustainable value for our shareholder. |
• | Long-term incentives should be designed to effectively retain valuable executive talent. |
• | Long-term incentives should create a clear and understandable platform for wealth creation that is tied closely with the long-term performance of Novelis. |
• | A majority of the long-term incentive award value should be at-risk and tied to financial and/or stock-price performance. |
• | Vesting schedules generally should span several years to reward long-term service. |
• | The value of long-term incentives as a percent of salary should be competitive with opportunity payouts of executives in similar roles at other benchmark companies/industries. |
• | Long-term incentive award intended values should not be affected by currency exchange rates once the awards have been authorized by the Committee. |
On May 13, 2014, the Committee authorized the long term incentive plan covering fiscal years 2015 through 2018 ("2015 LTIP"). Under the 2015 LTIP, participants are awarded three types of long-term incentive vehicles. Thirty percent of a participant's total long term incentive opportunity consists of performance-based Hindalco stock appreciation rights ("Hindalco SARs"), 20% of a participant's total long term incentive opportunity consists of Hindalco restricted stock units ("Hindalco RSUs") and the remaining 50% consists of Novelis stock appreciation rights ("Novelis SARs"). See Grants of Plan-Based Awards in Fiscal 2015 below for additional information. The aggregate value of all long-term incentive award vehicles for the named executive officers are approved by the Committee and apportioned appropriately among the three vehicles. The actual number of Hindalco SARs and Novelis SARs awarded are determined using a Black-Scholes multiple.
150
The Hindalco SARs and Novelis SARs awarded in fiscal 2015 have seven year terms and vest at a rate of 25% per year measured from the authorization date, subject to the threshold performance hurdle being met for the year (as described in the paragraph below). Each SAR is to be settled in cash based on the increase in market value of one Hindalco or Novelis share, as applicable, from the date of award through the date of exercise. As Novelis shares are not publicly traded on a stock exchange, an annual Company valuation is performed by a global financial services company, and this valuation is the basis for the number of Novelis SARs awarded and is also the basis for the stock price appreciation each year for Novelis SARs. The total amount of cash paid is limited to three times the value of the SARs authorized by the Committee. SARs do not transfer any shareholder rights in Hindalco or Novelis to a participant, and dividend equivalents are neither accumulated nor paid during or after vesting between the award date and date of exercise, forfeiture or cancellation of the awards.
The performance hurdle for vesting each year for both Hindalco SARs and Novelis SARs is based on achieving at least 75% of the EBITDA target established and approved each fiscal year by the Committee. The definition of EBITDA has the same definition used in the short-term annual cash incentive program.
The Hindalco RSUs awarded in fiscal 2015 fully vest over three years and are not subject to performance criteria. Payout on the Hindalco RSUs is also limited to three times the award value. RSUs do not transfer any shareholder rights in Hindalco to a participant, and dividend equivalents are neither accumulated nor paid between the award date and date of vesting or forfeiture of the awards.
The fiscal 2015 target value for the total of the three long-term incentive vehicles awarded and subsequently communicated under the 2015 LTIP to our named executive officers are as follows:
Named Executive Officer | 2015 LTIP Target Awarded May 13, 2014 ($) | ||
Philip Martens |
| 4,500,000 | |
Steven Fisher |
| 850,000 | |
Leslie Parrette |
| 600,000 | |
Erwin Mayr |
| 620,000 | |
Marco Palmieri |
| 650,000 | |
The fiscal 2015 LTIP awards are not affected by currency exchange rates, and prior outstanding LTIP awards were modified on May 13, 2014 so that those awards also will not be affected by currency exchange rate fluctuations after the awards are authorized by the Committee.
Named Executive Officers' Total Direct Compensation Mix of Pay Elements. The chart below illustrates the fiscal 2015 target compensation elements for the Company's named executive officers as a percentage of their total direct compensation (i.e., salary plus the target short-term annual cash incentive and the target value of long-term incentives). Salary and target annual incentive percentages reflect the value of compensation in an officer's home currency as of the end of fiscal 2015, and long-term incentives reflect fiscal 2015 award values in U.S. dollars and then converted to an officer's home currency as of the authorization date of the award. The chart shows that 85% of the President and Chief Executive Officer's total direct compensation is variable at-risk pay, which is tied to both short-term and long-term financial, individual and stock-price performance. The other four named executive officers' percentages of total direct compensation that is variable ranges from 63% to 70%.
151
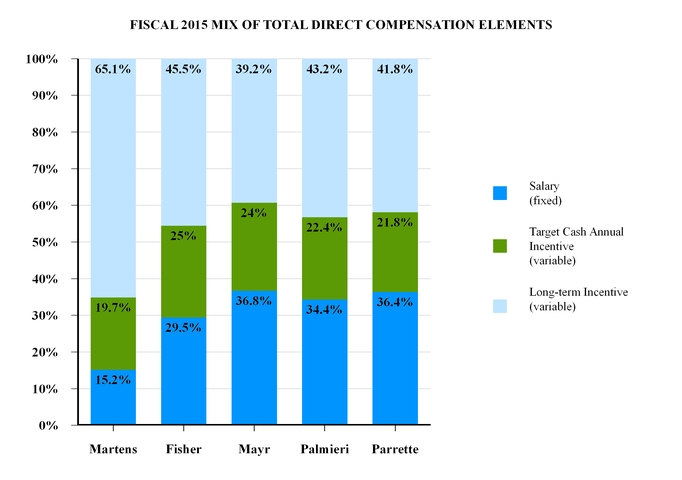
Employee Benefits. Our named executive officers are eligible to participate in our broad-based retirement, health and welfare, and other employee benefit plans on the same basis as other Company employees. In addition to these broad-based plans, some of our named executive officers may be eligible for certain non-qualified retirement benefits, which are designed to provide levels of retirement benefits that are limited under broad-based retirement plan caps mandated by certain regulatory restrictions on highly-compensated employees. Our named executive officers are also eligible for certain perquisites consistent with market practice. We do not view our executive perquisites as a significant element of our overall compensation structure. See the All Other Compensation column and related footnotes under the Summary Compensation Table below for details.
Employment-Related Agreements
Agreements with Mr. Martens. Mr. Martens and the Company entered into a separation agreement related to Mr. Marten's separation from service on April 20, 2015. The terms of Mr. Martens' severance arrangements were disclosed in a Form 8-K filing with the Securities and Exchange Commission on April 29, 2015.
Retention Agreements. On July 1, 2014, we entered into individual retention agreements with each named executive officer (other than Mr. Martens). These agreements were developed to supplement the long term incentive opportunity available to each executive while the Novelis SARs introduced into the LTIP in fiscal 2014 and continued in fiscal 2015 mature. These retention agreements provide cash payments to the named executive officers as follows: $50,000 in December 2014 (or $37,500 for Mr. Parrette), $25,000 in December 2015 (or $18,750 for Mr. Parrette) and $25,000 in December 2016 (or $18,750 for Mr. Parrette) if the officer remains employed with the Company through the applicable vesting date. If the named executive officer voluntarily terminates employment prior to December 31, 2016 or is terminated by the Company for cause prior to that date, the named executive officer will be required to repay any payments made under the agreements in the previous 12 months, less applicable taxes, and will be not be entitled to any other payments thereafter. If the named executive officer is terminated involuntarily without cause, any unpaid cash installments will not occur.
152
Change in Control Agreements. Each of our named executive officers is party to a Change in Control Agreement, which provides that the executive will be entitled to certain payments and benefits if the executive's employment is terminated by the Company without cause, or by the executive for good reason, within 24 months following a change in control of the Company. The change in control severance payment is equal to 2.0 times the sum of the executive's annual base salary plus target short-term incentive for the year and is payable in a lump sum. The executive may also receive (i) a special one-time payment to assist with post-employment medical coverage; (ii) continuation of coverage under the Company's group life insurance plan for a period of 12 months; (iii) 12 months of additional credit for benefit accrual or contribution purposes under our retirement plans; and (iv) accelerated vesting, if applicable, under our retirement plans.
Severance Compensation Agreements. We have entered into Severance Agreements with each named executive officer (other than Mr. Martens), which provide that the executives will be entitled to certain payments and benefits if their employment is terminated by the Company without cause. The severance payment is equal to 1.5 times the executive's annual base salary in effect at termination. Severance payments for these executives are payable in a lump sum. The executive may also receive (i) a special one-time payment to assist with post-employment medical coverage; (ii) continuation of coverage under the Company's group life insurance plan for a period of 12 months; (iii) 12 months of additional credit for benefit accrual or contribution purposes under our retirement plans; and (iv) accelerated vesting, if applicable, under our retirement plans. Each agreement also contains a non-competition and non-solicitation provision which prohibits the executive from competing with us or soliciting our customers, suppliers or employees for a period of 18 months following termination. An executive may be required to sign a general release of claims against the Company as a condition to receive the payments and benefits described above. See Potential Payments Upon Termination or Change in Control below for details.
Compensation Risk Assessment
In fiscal 2015, the Committee reviewed the Company's executive compensation policies and practices, and determined that the Company's executive compensation programs are not reasonably likely to have a material adverse effect on the Company. Our compensation programs contain design features that mitigate the incentive for our employees, including the named executive officers, to take unreasonable risks in managing the business, which include:
• | An appropriate balance between short-term and long-term incentive compensation with multiple time horizons; |
• | Short-term incentives that provide for lower payouts for lower performance and higher payouts for higher performance; |
• | Short-term incentives that must have minimum financial performance to achieve any payouts and also set capped maximum payouts at 200% of target; |
• | Short-term incentive payouts that are tied to multiple performance factors with no one performance factor having excessive weighting; |
• | Long-term incentives with multi-year vesting schedules, which reward employees for long-term performance; |
• | Goals that are not unreasonable and that are approved by the Committee on an annual basis and goals with no excessive payout opportunities at certain performance levels that may encourage short-term decisions and actions to meet payout thresholds; |
• | Oversight of the compensation programs by the Committee and a broad group of functions within the Company and at various levels within the functions to gain different viewpoints and prevent a small number of people to be exclusively involved in compensation decisions; and |
• | Advice from expert outside advisors regarding the design of the compensation program. |
Based on its review, the Committee determined that the Company's compensation programs do not encourage excessive risk and instead encourage behaviors that support sustainable value creation.
Compensation Committee Report
The Committee has reviewed and discussed the foregoing Compensation Discussion and Analysis with management. Based on the Committee's review and discussions with management, the Committee recommended to the board of directors that the Compensation Discussion and Analysis be included in the Company's Annual Report on Form 10-K for fiscal 2015.
The foregoing report is provided by the following directors, who constitute the Committee:
Mr. Clarence J. Chandran, Chairman
Mr. Debnarayan Bhattacharya
Mr. Askaran Agarwala
Mr. Satish Pai
153
Summary Compensation Table
The table below sets forth information regarding compensation for our named executive officers for fiscal 2015 and the two prior fiscal years, as applicable. Any amounts paid to our named executive officers in a foreign currency are reflected in the table below and elsewhere in U.S. dollars as adjusted by the March 31, 2015 exchange rate.
Name and Principal Position | Fiscal Year | Salary ($) | Stock Awards ($) (A) |
| Option Awards ($) (A) |
| Non-Equity Incentive Plan Compensation ($) (B) |
| All Other Compensation ($) (C) |
| Total ($) |
|
|
|
|
|
|
|
|
|
|
|
|
Philip Martens, President and Chief Executive Officer | 2015 | 1,036,539 | 900,000 |
| 3,600,000 |
| 1,678,950 |
| 1,367,708 |
| 8,583,197 |
2014 | 960,577 | 800,000 |
| 3,200,000 |
| 1,461,600 |
| 4,841,762 |
| 11,263,939 | |
2013 | 940,050 | 800,000 |
| 3,200,000 |
| - |
| 229,981 |
| 5,170,031 | |
|
|
|
|
|
|
|
|
|
|
|
|
Steven Fisher, Senior Vice President and Chief Financial Officer | 2015 | 545,607 | 170,000 |
| 680,000 |
| 577,545 |
| 195,925 |
| 2,169,077 |
2014 | 513,427 | 170,000 |
| 680,000 |
| 517,902 |
| 863,371 |
| 2,744,700 | |
2013 | 511,250 | 170,000 |
| 680,000 |
| - |
| 423,032 |
| 1,784,282 | |
|
|
|
|
|
|
|
|
|
|
|
|
Erwin Mayr, Senior Vice President and President of Novelis Europe | 2015 | 515,608 | 124,000 |
| 496,000 |
| 434,516 |
| 279,309 |
| 1,849,433 |
2014 | 563,434 | 72,100 |
| 288,400 |
| 391,170 |
| 1,148,060 |
| 2,463,164 | |
2013 | 529,751 | 72,100 |
| 288,400 |
| - |
| 1,308,703 |
| 2,198,954 | |
|
|
|
|
|
|
|
|
|
|
|
|
Marco Palmieri, Senior Vice President and President of Novelis North America | 2015 2014 | 560,961 512,383 | 130,000 123,600 |
| 520,000 494,400 |
| 291,260 372,152 |
| 885,784 614,310 |
| 2,388,005 2,116,845 |
|
|
|
|
|
|
|
|
|
|
|
|
Leslie Parrette, Senior Vice President, General Counsel, Compliance Officer and Corporate Secretary | 2015 | 518,626 | 120,000 |
| 480,000 |
| 393,298 |
| 176,710 |
| 1,688,634 |
(A) | These awards are granted under the 2015 LTIP. Please see the Grants of Plan-Based Awards in Fiscal 2015 table for more information. |
(B) | This amount reflects the cash award earned under the 2015 AIP. Mr. Martens' amount is part of his negotiated severance arrangement resulting from his separation from service on April 20, 2015. |
(C) | The amounts shown in the All Other Compensation Column reflect the values from the table below. |
154
Name | Company Contribution to Defined Contribution Plans and Nonqualified Plans ($) |
| Group Life Insurance ($) (d) |
| Retention Payments ($) (e) |
| Relocation, Assignee and Housing Related Payments ($) |
| Other Perquisites and Personal Benefits ($) |
| Total ($) | |
|
|
|
|
|
|
|
|
|
|
|
| |
Philip Martens | 215,173 | (a) | 2,844 |
| 1,085,000 |
| - | |
| 64,691 | (j) | 1,367,708 |
Steven Fisher | 89,738 | (a) | 1,566 |
| 50,000 |
| - | |
| 54,621 | (k) | 195,925 |
Erwin Mayr | 99,229 | (b) | 1,545 |
| 50,000 |
| 118,693 | | (f) | 9,842 | (l) | 279,309 |
Marco Palmieri | 42,408 | (c) | 1,621 |
| 50,000 |
| 774,339 | | (g) | 17,416 | (m) | 885,784 |
Leslie Parrette | 87,596 | (a) | 1,488 |
| 37,500 |
| - | |
| 50,126 | (n) | 176,710 |
(a) | This amount represents the Company's contribution to our U.S. qualified and non-qualified defined contribution plans. See the Non-Qualified Deferred Compensation table below for more information. |
(b) | This amount represents the Company's contribution to our Swiss defined contribution plan (Novelis Pensionskasse) and our Swiss supplemental defined contribution plan (Novelis Zusatzkasse). |
(c) | This amount represents the Company's contribution to our Brazilian defined contribution plan. |
(d) | This amount represents additional Company-paid life insurance for named executive officers beyond the regular employee coverage. |
(e) | This amount represents payment to Mr. Martens pursuant to his retention agreement dated May 13, 2013, and represents payment to the other named executive officers pursuant to retention agreements dated July 1, 2014. |
(f) | This amount represents tax payments related to Mr. Mayr's foreign assignment. |
(g) | This amount includes $51,782 housing allowance, $58,458 goods and services adjustment, $21,486 home leave, $12,250 for automobile lease, $19,319 services related to the executive's global assignment, and $611,044 relating to tax payments for foreign assignment. |
(j) | This amount includes $60,000 flex allowance and $4,691 executive physical. |
(k) | This amount includes $50,000 flex allowance and $4,621 executive physical. |
(l) | This amount represents Mr. Mayr's automobile lease. |
(m) | This amount represents the cost of the Brazilian health plan for Mr. Palmieri and his family. |
(n) This amount includes $48,000 flex allowance and $2,126 executive physical.
155
Grants of Plan-Based Awards in Fiscal 2015
The table below sets forth information regarding grants of plan-based awards made to our named executive officers for the year ended March 31, 2015.
Name | Date of Award | Estimated Future Payout Under Non-Equity Incentive Plan Awards (A) |
| All Other Stock Awards: Number of Shares of Stock or Units (#) (B) | All Other Option Awards: Number of Securities Underlying Options (#) (C) |
| Exercise or Base Price of Option Awards ($/Sh) | Value of Stock and Option Awards (D) | ||
Threshold ($) | Target ($) | Maximum ($) |
| Award Type | ||||||
Philip Martens | 5/13/2014 | 696,150 | 1,365,000 | 2,730,000 |
| - | - | - | - | - |
| 5/13/2014 | - | - | - |
| 370,376 | - | Hindalco RSU | - | 900,000 |
5/13/2014 | - | - | - |
| - | 1,239,266 | Hindalco SAR | 2.43 | 1,350,000 | |
5/13/2014 | - | - | - |
| - | 95,722 | Novelis SAR | 94.40 | 2,250,000 | |
|
|
|
|
|
|
|
|
|
|
|
Steven Fisher | 5/13/2014 | 238,694 | 468,027 | 936,054 |
| - | - | - | - | - |
5/13/2014 | - | - | - |
| 69,960 | - | Hindalco RSU | - | 170,000 | |
5/13/2014 | - | - | - |
| - | 234,084 | Hindalco SAR | 2.43 | 255,000 | |
5/13/2014 | - | - | - |
| - | 18,081 | Novelis SAR | 94.40 | 425,000 | |
|
|
|
|
|
|
|
|
|
|
|
Leslie Parrette | 5/13/2014 | 159,954 | 313,635 | 627,270 |
| - | - | - | - | - |
5/13/2014 | - | - | - |
| 49,384 | - | Hindalco RSU | - | 120,000 | |
5/13/2014 | - | - | - |
| - | 165,236 | Hindalco SAR | 2.43 | 180,000 | |
5/13/2014 | - | - | - |
| - | 12,763 | Novelis SAR | 94.40 | 300,000 | |
|
|
|
|
|
|
|
|
|
|
|
Erwin Mayr | 5/13/2014 | 176,717 | 346,504 | 693,008 |
| - | - | - | - | - |
5/13/2014 | - | - | - |
| 51,030 | - | Hindalco RSU | - | 124,000 | |
5/13/2014 | - | - | - |
| - | 170,744 | Hindalco SAR | 2.43 | 186,000 | |
5/13/2014 | - | - | - |
| - | 13,189 | Novelis SAR | 94.40 | 310,000 | |
|
|
|
|
|
|
|
|
|
|
|
Marco Palmieri | 5/13/2014 | 118,455 | 232,265 | 464,530 |
| - | - | - | - | - |
5/13/2014 | - | - | - |
| 53,499 | - | Hindalco RSU | - | 130,000 | |
5/13/2014 | - | - | - |
| - | 179,005 | Hindalco SAR | 2.43 | 195,000 | |
5/13/2014 | - | - | - |
| - | 13,827 | Novelis SAR | 94.40 | 325,000 | |
(A) | These amounts reflect potential cash awards under our 2015 AIP. The financial performance metrics for fiscal 2015 are: (1) "EBTIDA", which refers to our Adjusted EBITDA and is calculated by removing the following items from Operating EBITDA (the equivalent to "Segment Income" as reported in our external U.S. GAAP financial statements): i) the impact from timing differences in the pass-through of metal price changes to our customers, net of realized derivative instruments; and ii) the impact from re-measuring to current exchange rates any monetary assets and liabilities which are denominated in a currency other than the functional currency of the reporting unit, net of realized and unrealized derivative instruments and (2) "Cash Flow", which refers to our operating free cash flow and is calculated by removing the following items from "Free cash flow" (as defined in the "Liquidity and Capital Resources" section of this 10-K): i) the impact from timing differences in the pass-through of metal price changes to our customers, net of realized derivative instruments; and ii) the impact of fourth quarter variations in metal prices (LME and local market premiums) from the Plan. See the Summary Compensation Table for actual results. |
156
( B) | These amounts represent the number of Hindalco RSUs granted under the 2015 LTIP and were calculated using a value of $2.43. See discussion of 2015 LTIP above. |
(C) | The number of SARs awarded were calculated using a Black-Scholes value of $1.09 (rounded) per Hindalco SAR and $23.51 (rounded) per Novelis SAR. |
(D) | As outlined under the Key Elements of Our Compensation Program above, SARs awarded under our 2015 LTIP are divided into four equal tranches and vest at a rate of 25% per year, subject to satisfaction of a threshold performance hurdle being met for the year. The performance hurdle for each tranche is determined prior to the start of each applicable vesting year. Therefore, for purposes of ASC 718, each tranche has a separate grant date, and the Company's financials have been prepared consistent with ASC 718. For purposes of this table and the Summary Compensation Table, the amounts shown for SARs and RSUs represent intended target values of long-term incentive awards authorized by the Committee on the date the awards were authorized and subsequently communicated to the executives. |
Outstanding Equity Awards as of March 31, 2015
| Novelis Options | Hindalco Options |
|
| Hindalco RSUs | ||||||||||||||
Name | Number of Securities Underlying Unexercised Options # Exercisable | Number of Securities Underlying Unexercised Options # Unexercisable |
| Option Exercise Price ($) | Number of Securities Underlying Unexercised Options # Exercisable | Number of Securities Underlying Unexercised Options # Unexercisable | Option Exercise Price ($) |
| Option Expiration Date for Both Novelis and Hindalco Options | Number of Shares or Units of Stock That Have Not Vested |
| Market Value of Shares or Units of Stock That Have Not Vested | |||||||
Martens | - | | 95,722 | | (A ) | 94.40 | | - | | 1,239,266 | | 2.43 | (A ) | May 13, 2021 | 370,376 | | (A ) | 796,394 | |
| - | | 54,245 | | (B ) | 91.87 | | - | | 1,069,005 | | 1.91 | (B ) | May 13, 2020 | 418,670 | | (B ) | 983,009 | |
| 16,884 | | 20,780 | | (C ) | 101.81 | | - | | 641,072 | | 1.98 | (C ) | May 22, 2019 | 403,960 | | (C ) | 939,995 | |
| - | | 12,273 | | (D ) | 73.55 | | 319,646 | | 126,843 | | 4.28 | (D ) | May 20, 2018 | - | |
| - | |
| - | | - | |
| - | | 413,520 | | - | | 3.13 | (E ) | May 25, 2017 | - | |
| - | |
|
|
|
|
|
|
|
|
|
|
|
|
| |||||||
Fisher | - | | 18,081 | | (A ) | 94.40 | | - | | 234,084 | | 2.43 | (A ) | May 13, 2021 | 69,960 | | (A ) | 150,430 | |
| 3,842 | | 11,528 | | (B ) | 91.87 | | 75,721 | | 227,164 | | 1.91 | (B ) | May 13, 2020 | 88,967 | | (B ) | 208,889 | |
| 3,588 | | 4,416 | | (C ) | 101.81 | | 110,687 | | 136,228 | | 1.98 | (C ) | May 22, 2019 | 85,842 | | (C ) | 199,750 | |
| 2,030 | | 2,422 | | (D ) | 73.55 | | 63,090 | | 25,035 | | 4.28 | (D ) | May 20, 2018 | - | |
| - | |
| 1,876 | | - | | (E ) | 63.23 | | 95,526 | | - | | 3.13 | (E ) | May 25, 2017 | - | |
| - | |
|
|
|
|
|
|
|
|
|
|
|
|
| |||||||
Mayr | - | | 13,189 | | (A ) | 94.40 | | - | | 170,744 | | 2.43 | (A ) | May 13, 2021 | 51,030 | | (A ) | 109,726 | |
| 1,630 | | 4,889 | | (B ) | 91.87 | | 32,115 | | 96,345 | | 1.91 | (B ) | May 13, 2020 | 37,733 | | (B ) | 88,595 | |
| 1,521 | | 1,872 | | (C ) | 101.81 | | 46,945 | | 57,778 | | 1.98 | (C ) | May 22, 2019 | 36,407 | | (C ) | 84,717 | |
| 947 | | 1,130 | | (D ) | 73.55 | | 29,442 | | 11,684 | | 4.28 | (D ) | May 20, 2018 | - | |
| - | |
| 975 | | - | | (E ) | 63.23 | | 49,624 | | - | | 3.13 | (E ) | May 25, 2017 | - | |
| - | |
| - | | - | |
| - | | 96,930 | | - | | 1.79 | (F ) | June 25, 2016 | - | |
| - | |
|
|
|
|
|
|
|
|
|
|
|
|
| |||||||
Palmieri | - | | 13,827 | | (A ) | 94.40 | | - | | 179,005 | | 2.43 | (A ) | May 13, 2021 | 53,499 | | (A ) | 115,035 | |
| - | | 8,382 | | (B ) | 91.87 | | - | | 165,162 | | 1.91 | (B ) | May 13, 2020 | 64,684 | | (B ) | 151,874 | |
| 1,521 | | 1,872 | | (C ) | 101.81 | | - | | 57,778 | | 1.98 | (C ) | May 22, 2019 | 36,407 | | (C ) | 84,717 | |
| - | | 1,884 | | (D ) | 73.55 | | - | | 19,476 | | 2.57 | (D ) | May 20, 2018 | - | |
| - | |
|
|
|
|
|
|
|
|
|
|
|
|
| |||||||
Parrette | - | | 12,763 | | (A ) | 94.40 | | - | | 165,236 | | 2.43 | (A ) | May 13, 2021 | 49,384 | | (A ) | 106,187 | |
| 2,712 | | 8,137 | | (B ) | 91.87 | | 53,450 | | 160,350 | | 1.91 | (B ) | May 13, 2020 | 62,800 | | (B ) | 147,450 | |
| 2,532 | | 3,116 | | (C ) | 101.81 | | 78,132 | | 96,162 | | 1.98 | (C ) | May 22, 2019 | 60,594 | | (C ) | 140,999 | |
| 1,624 | | 1,938 | | (D ) | 73.55 | | 50,471 | | 20,028 | | 4.28 | (D ) | May 20, 2018 | - | |
| - | |
| 1,072 | | - | | (E ) | 63.23 | | 54,587 | | - | | 3.13 | (E ) | May 25, 2017 | - | |
| - | |
| - | | - | |
| - | | 92,611 | | - | | 1.79 | (F ) | June 25, 2016 | - | |
| - | |
(A) | These awards were granted pursuant to our 2015 LTIP. The SARs vest over four years (25% per anniversary year) commencing May 13, 2014, and are subject to satisfaction of a predetermined normalized EBITDA performance hurdle. RSUs vest on the third anniversary of the date of grant. |
(B) | These awards were granted pursuant to our 2014 LTIP. The SARs vest over four years (25% per anniversary year) commencing May 13, 2013, and are subject to satisfaction of a predetermined normalized EBITDA performance hurdle. RSUs vest on the third anniversary of the date of grant. |
157
(C) | These awards were granted pursuant to our 2013 LTIP (as amended by the amendment adopted on May 13, 2013). The SARs vest over four years (25% per anniversary year) commencing May 22, 2012, and are subject to satisfaction of a predetermined normalized EBITDA performance hurdle. RSUs vest on the third anniversary of the date of grant. |
(D) | These awards were granted pursuant to our 2012 LTIP (as amended by the amendment adopted on May 13, 2013). The SARs vest over four years (25% per anniversary year) commencing May 20, 2011, and are subject to satisfaction of a predetermined normalized EBITDA performance hurdle. RSUs vest on the third anniversary of the date of grant. |
(E) | These awards were granted pursuant to our 2011 LTIP (as amended by the amendment adopted on May 13, 2013). The SARs vest over four years (25% per anniversary year) commencing May 25, 2010, and are subject to satisfaction of a predetermined normalized EBITDA performance hurdle. RSUs vest on the third anniversary of the date of grant. |
(F) | These awards were granted pursuant to our 2010 LTIP (as amended by the amendment adopted on May 13, 2013). The SARs vest over four years (25% per anniversary year) commencing June 25, 2009, and are subject to satisfaction of a predetermined normalized EBITDA performance hurdle. RSUs vest on the third anniversary of the date of grant. |
Option Exercises and Stock Vested in Fiscal Year 2015
The table below sets forth the information regarding stock options that were exercised during fiscal 2015 and stock awards that vested and were paid out during fiscal 2015.
|
| Option Awards |
| Stock Awards | ||||||||||
Name |
| Number of Shares Acquired on Exercise, but Settled in Cash |
| Value Realized on Exercise ($) |
| Number of Shares Acquired on Vesting, but Settled in Cash |
| Value Realized on Vesting ($) | ||||||
Philip Martens |
| 1,405,682 | |
|
| 2,053,304 | |
|
| 177,749 |
|
| 614,995 |
|
Steven Fisher |
| 205,930 | |
|
| 361,068 | |
|
| 35,082 |
|
| 121,380 |
|
Erwin Mayr |
| 157,905 | |
|
| 269,598 | |
|
| 16,371 |
|
| 56,642 |
|
Marco Palmieri |
| 155,450 | |
|
| 177,588 | |
|
| 27,291 |
|
| 86,572 |
|
Les Parrette |
| - | |
|
| - | |
|
| 28,065 |
|
| 97,102 |
|
Non-Qualified Deferred Compensation
This table summarizes contributions and earnings under our Defined Contribution Supplemental Executive Retirement Plan for fiscal year 2015. The plan is an unfunded, non-qualified defined contribution plan for U.S. based executives. The plan provides eligible executives with the opportunity to voluntarily defer, on a pre-tax basis, a portion of their base salary and annual incentive pay that otherwise may not be deferred under the Company's tax-qualified savings plan due to limitations under the U.S. Internal Revenue Code. The plan also provides eligible executives with Company non-elective and matching contribution credits which they are restricted from receiving under the tax-qualified savings plan due to those same limitations.
Name |
| Elective Contributions in Last Fiscal Year ($) |
| Registrant Contributions in Last Fiscal Year ($) (A) |
| Aggregate Earnings in Last Fiscal Year ($) (A) |
| Aggregate Withdrawals/ Distributions ($) |
| Aggregate Balance at Last Fiscal Year End ($) (B) | |||||||
Philip Martens |
| - | |
|
| 185,944 |
|
| 17,310 |
|
| - | |
|
| 1,085,668 |
|
Steven Fisher |
| - | |
|
| 64,241 |
|
| 30,036 |
|
| - | |
|
| 535,479 |
|
Leslie Parrette |
| - | |
|
| 64,171 |
|
| 8,079 |
|
| - | |
|
| 257,441 |
|
(A) | Registrant contributions, but not Earnings, are included in the Summary Compensation Table above. |
(B) | Of the balance at the end of the fiscal year, $555,769 for Mr. Martens, $247,697 for Mr. Fisher and $220,261 for Mr. Parrette represents cumulative Company contributions. |
158
Potential Payments Upon Termination or Change in Control
This section provides an estimate of the payments and benefits that would be paid to certain of our named executive officers, on March 31, 2015, upon voluntary termination or involuntary termination of employment without cause and were adjusted by the March 31, 2015 Swiss and Brazilian exchange rates for Messrs. Mayr and Palmieri, respectively. This section, however, does not reflect any payments or benefits that would be paid to our salaried employees generally, including for example accrued salary and vacation pay; regular retirement plan benefits under our defined contribution plans; or normal retirement, death or disability benefits. See Employment-Related Agreements above for a discussion of the change in control, severance compensation and retention agreements for our named executive officers and any restrictive covenants contained therein.
As noted above, Mr. Martens separated from the Company on April 20, 2015. The terms of Mr. Martens' separation agreement and the amount payable thereunder are described in a current report on Form 8-K filed with the Securities and Exchange Commission on April 29, 2015.
159
Name | Type of Payment | Voluntary Termination by Executive ($) |
| Termination Without Cause ($) (C) (D) (J) |
| Termination Without Cause or by Executive for Good Reason in Connection with Change in Control ($) (E) (F) |
| Death or Disability($) |
Philip Martens | Short-Term Incentive Payment (A) | 1,365,000 |
| 1,365,000 |
| 1,365,000 |
| 1,365,000 |
| Long-Term Incentive Plan (B) | - |
| 2,388,559 |
| 3,800,136 |
| 2,790,461 |
| Severance | - |
| 4,830,000 |
| 4,830,000 |
| - |
| Retirement plans | - |
| 223,250 |
| 223,250 |
| - |
| Lump sum cash payment for continuation of health coverage (G) | - |
| 26,303 |
| 26,303 |
| - |
| Continued group life insurance coverage (H) | - |
| 5,688 |
| 5,688 |
| - |
| Tax Gross Up (I) | - |
| - |
| - |
| - |
| Total | 1,365,000 |
| 8,838,800 |
| 10,250,377 |
| 4,155,461 |
Steven Fisher | Short-Term Incentive Payment (A) | 468,027 |
| 468,027 |
| 468,027 |
| 468,027 |
| Long-Term Incentive Plan (B) | 181,849 |
| 680,499 |
| 966,698 |
| 765,725 |
| Severance | - |
| 825,930 |
| 2,037,294 |
| - |
| Retirement plans | - |
| 88,445 |
| 88,445 |
| - |
| Lump sum cash payment for continuation of health coverage (G) | - |
| 26,303 |
| 26,303 |
| - |
| Continued group life insurance coverage (H) | - |
| 3,132 |
| 3,132 |
| - |
| Total | 649,876 |
| 2,092,336 |
| 3,589,899 |
| 1,233,752 |
Erwin Mayr | Short-Term Incentive Payment (A) | 346,504 |
| 346,504 |
| 346,504 |
| 346,504 |
| Long-Term Incentive Plan (B) | 170,832 |
| 397,127 |
| 551,771 |
| 433,368 |
| Severance | - |
| 799,625 |
| 1,759,174 |
| - |
| Retirement plans | - |
| 100,281 |
| 100,281 |
| - |
| Lump sum cash payment for continuation of health coverage (G) | - |
| - |
| - |
| - |
| Continued group life insurance coverage (H) | - |
| 1,545 |
| 1,545 |
| - |
| Total | 517,336 |
| 1,645,082 |
| 2,759,275 |
| 779,872 |
Marco Palmieri | Short-Term Incentive Payment (A) | 232,265 |
| 232,265 |
| 232,265 |
| 232,265 |
| Long-Term Incentive Plan (B) | - |
| 300,390 |
| 505,187 |
| 358,341 |
| Severance | - |
| 535,996 |
| 1,179,192 |
| - |
| Retirement plans | - |
| 42,846 |
| 42,846 |
| - |
| Lump sum cash payment for continuation of health coverage (G) | - |
| 35,263 |
| 35,263 |
| - |
| Continued group life insurance coverage (H) | - |
| 2,605 |
| 2,605 |
| - |
| Total | 232,265 |
| 1,149,365 |
| 1,997,358 |
| 590,606 |
Les Parrette | Short-Term Incentive Payment (A) | 313,635 |
| 313,635 |
| 313,635 |
| 313,635 |
| Long-Term Incentive Plan (B) | 206,959 |
| 563,513 |
| 765,731 |
| 623,867 |
| Severance | - |
| 784,088 |
| 1,672,720 |
| - |
| Retirement plans | - |
| 79,454 |
| 79,454 |
| - |
| Lump sum cash payment for continuation of health coverage (G) | - |
| 7,948 |
| 7,948 |
| - |
| Continued group life insurance coverage (H) | - |
| 2,975 |
| 2,975 |
| - |
| Total | 520,594 |
| 1,751,613 |
| 2,842,463 |
| 937,502 |
(A) | These amounts represent 100% of the executive's target AIP opportunity for the fiscal year. |
(B) | These amounts reflect the estimated value of the vested SARs and RSUs granted pursuant to our long term incentive plans. |
(C) | These amounts would be paid pursuant to the executive's severance compensation agreement (or employment agreement in the case of Mr. Martens). Except for the retirement and life insurance benefits, these amounts would be paid in a single lump sum following termination of employment. The retirement benefit represents one additional year of benefit accrual or contribution credit, as applicable. The life insurance benefit represents the estimate value of coverage for one additional year. |
160
(D) | Termination for "cause" means (i) the executive's conviction of any crime (whether or not involving the Company) constituting a felony in the applicable jurisdiction; (ii) willful and material violation of the Company's policies, including, but not limited to, those relating to sexual harassment and confidential information; (iii) willful misconduct in the performance of the executive's duties for the Company; or (iv) willful failure or refusal to perform the executive's material duties and responsibilities which is not remedied within ten days after written demand from the board of directors to remedy such failure or refusal. |
(E) | Under the executive's change in control agreement, these amounts would be paid to the executive if his employment is terminated without cause, or he resigns for good reason, within 24 months of a change of control. Except for the retirement and life insurance benefits, these amounts would be paid in a single lump sum following termination of employment. The retirement benefit represents one additional year of benefit accrual or contribution credit, as applicable. The life insurance benefit represents the estimate value of coverage for one additional year. |
(F) | See footnote (D) above for definition of "cause." Termination for "good reason" means (i) a material reduction in the executive's position, duties, reporting relationships, responsibilities, authority, or status with the Company; (ii) a reduction in the executive's base salary and target short term and long term incentive opportunities in effect on the date hereof or as the same may be increased from time to time; or (iii) a failure of the Company to comply with its obligations under the change in control agreement. A "change in control" means the first to occur of any of the following events: (i) any person or entity (excluding any person or entity affiliated with the Aditya Birla Group) is or becomes the beneficial owner, directly or indirectly through any parent entity of the Company or otherwise, of securities of the Company representing 35% or more of either the then outstanding shares of common stock of the Company or the combined voting power of the Company's then outstanding securities (the "Value or Vote of the Company"); provided, however, that a Change in Control shall not be deemed to have occurred in the event that (A) any person or entity becomes the beneficial owner of securities representing 50% or less of the Value or Vote of the Company through (i) an initial public offering, (ii) a secondary offering, (iii) a private placement of securities, (iv) a share exchange transaction, or (v) any similar share purchase transaction in which the Company or any of its affiliates issues securities (any such transaction, a "Share Issuance Transaction"); and (B) a person or entity's beneficial ownership interest in the Value or Vote of the Company is diluted solely as a result of any Share Issuance Transaction; or (ii) the majority of the members of the Board of Directors of the Company is replaced during any 12-month period by directors whose appointment or election is not endorsed by a majority of the members of the Board prior to the date of the appointment or election; or (iii) the consummation of a merger or consolidation of the Company with any other entity not affiliated with the Aditya Birla Group, other than (a) a merger or consolidation which would result in the voting securities of the Company outstanding immediately prior to such merger or consolidation continuing to represent (either by remaining outstanding or by being converted into voting securities of the surviving entity or any parent thereof), in combination with the ownership of any trustee or other fiduciary holding securities under an employee benefit plan of the Company, 50% or more of the combined voting power of the voting securities of the Company or such surviving entity or any parent thereof outstanding immediately after such merger or consolidation, or (b) a merger or consolidation effected to implement a recapitalization of the Company (or similar transaction) in which no person or entity is or becomes the beneficial owner, directly or indirectly, of securities of the Company (not including in the securities beneficially owned by such person or entity any securities acquired directly from the Company or its affiliates, other than in connection with the acquisition by the Company or its affiliates of a business) representing 50% or more of either the then outstanding shares of common stock of the Company or the combined voting power of the Company's then outstanding securities; or (iv) the stockholders of the Company approve a plan of complete liquidation or dissolution; or (v) the sale or disposition of all or substantially all of the Company's assets, other than a sale or disposition by the Company of all or substantially all of its assets to a member of the Aditya Birla Group. |
(G) | This amount is intended to assist the executive in paying post-employment health coverage and is equal to 12 months times the COBRA premium rate (except for Mr. Mayr, who will be covered under country-specific statutory benefits), grossed up for applicable taxes using an assumed tax rate of 40%. This amount would be paid in a single lump sum following termination of employment. |
(H) | This amount represents the estimate value of one additional year of coverage under our group life insurance plan. |
(I) | Under Mr. Marten's change in control agreement, the Company is required to reimburse him for any excise tax liability under Section 4999 of the U.S. Internal Revenue Code. We do not believe any such excise tax liability would have been imposed under Section 4999 had a change in control occurred on March 31, 2015. |
(J) | In the event of a Termination for Cause, all vested and unvested AIP and LTIP awards will be forfeited. |
161
Director Compensation for Fiscal 2015
The Chairman of our board of directors is entitled to receive cash compensation equal to $250,000 per year, and the Chair of our Audit Committee is entitled to receive $175,000 per year. Each of our other directors is entitled to receive compensation equal to $150,000 per year, plus an additional $5,000 if he is a member of our Audit Committee. Directors' fees are paid in quarterly installments.
Since July 2008, our Chairman, Mr. Birla has declined to receive the director compensation to which he is entitled. All directors continue to receive reimbursement for out-of-pocket expenses associated with attending board and Committee meetings. The table below sets forth the total compensation received by our non-employee directors for fiscal 2015.
Name | Fees Earned or Paid in Cash ($) |
Kumar Mangalam Birla | - |
D. Bhattacharya | 155,000 |
Askaran K. Agarwala | 150,000 |
Clarence J. Chandran | 155,000 |
Donald A. Stewart | 175,000 |
Satish Pai | 150,000 |
Compensation Committee Interlocks and Insider Participation
In fiscal 2015, only Independent Directors served on the Committee. Clarence J. Chandran was the Chairman of the Committee. The other Committee members during all or part of the year were Mr. D. Bhattacharya, Mr. Askaran Agarwala and Mr. Satish Pai. During fiscal 2015, none of our executive officers served as:
• | a member of the Committee (or other board committee performing equivalent functions or, in the absence of any such committee, the entire board of directors) of another entity, one of whose executive officers served on our Committee; |
• | a director of another entity, one of whose executive officers served on our Committee; or |
• | a member of the Committee (or other board committee performing equivalent functions or, in the absence of any such committee, the entire board of directors) of another entity, one of whose executive officers served as one of our directors. |
Fiscal Year 2016 Incentive Compensation Plans
On May 7, 2015, our board of directors approved our fiscal 2016 annual incentive plan (2016 AIP) and a long term incentive plan covering fiscal years 2016 through 2019 (2016 LTIP). Both 2016 plans are substantially identical in design to our 2015 plans as described above under Key Elements of Our Compensation Program. The target amounts for each plan for our named executive officers are as follows:
Executive | 2016 AIP Target (as % of base salary) | 2016 LTIP Target Awarded May 7, 2015 ($) | ||
Steven Fisher | 85 |
| 950,000 |
|
Erwin Mayr | 65 |
| 700,000 |
|
Marco Palmieri | 65 |
| 700,000 |
|
Leslie Parrette | 70 |
| 700,000 |
|
162
Item 12. Security Ownership of Certain Beneficial Owners and Management and Related Shareholder Matters
On May 15, 2007, the Company was acquired by Hindalco through its indirect wholly-owned subsidiary AV Metals Inc. pursuant to a plan of arrangement entered into on February 10, 2007 and approved by the Ontario Superior Court of Justice on May 14, 2007.
Subsequent to completion of the Arrangement on May 15, 2007, all of our common shares were indirectly held by Hindalco.
163
Item 13. Certain Relationships and Related Transactions and Director Independence
We maintain various policies and procedures that govern related party transactions. Pursuant to our Code of Conduct and our Code of Ethics for Senior Financial Officers, senior managers and directors of the company (a) must avoid any action that creates or appears to create, a conflict of interest between their own interest and the interest of the company, (b) cannot usurp corporate opportunities, and (c) must deal fairly with third parties. This policy is available on our website at www.novelis.com. In addition, we have enacted procedures to monitor related party transactions by (x) identifying possible related parties through questions in our director and officer questionnaires, (y) determining whether we receive payments from or make payments to any of the identified related parties, and (z) if we determine payments are made or received, researching the nature of the interactions between the company and the related parties and ensuring that the related person does not have an interest in the transaction with the company. The Audit Committee is responsible for reviewing material related party transactions that involve the company, one of our directors or executive officers or any of their immediate family members.
We have entered into various transactions with our parent company, Hindalco, for the sale of products of less than $1 million in the aggregate and technical services of less than $1 million. These transactions are not material individually or in the aggregate. Because of the relationship four of our directors have with Hindalco, we consider these sales to be related party transactions.
In March 2014, we declared a return of capital to our shareholder, AV Metals Inc., in the amount of $250 million, which we subsequently paid on April 30, 2014.
164
Item 14. Principal Accountant Fees and Services
PricewaterhouseCoopers LLP has served as our independent registered public accounting firm since our spin-off from Alcan on January 6, 2005. The following table shows fees and expenses paid to PricewaterhouseCoopers LLP for services rendered for the years ended March 31, 2015 and 2014 :
|
| March 31, | ||||||
|
| 2015 |
| 2014 | ||||
Audit fees (1) |
| $ | 8,602,583 | |
| $ | 7,052,434 | |
Audit-Related Fees (2) |
| 50,000 | |
| - | | ||
Tax Fees (3) |
| 131,137 | |
| 326,505 | | ||
All Other Fees (4) |
| 71,541 | |
| 5,609 | | ||
Total |
| $ | 8,855,261 | |
| $ | 7,384,548 | |
(1) | Represent fees for professional services rendered and expenses incurred for the audit of the Company's annual financial statements, review of financial statements included in the Company's Form 10-Qs and services that are normally provided by PricewaterhouseCoopers LLP in connection with statutory and regulatory filings or engagements for those fiscal periods. |
(2) | Represent fees for assurance related services that are reasonably related to the performance of the audit or review of our consolidated financial statements and are not reported under "Audit Fees." In the fiscal year ended March 31, 2015, this fee includes consultations on accounting and disclosure matters. Note that the nature of such advice did not result in the principal auditor firm acting in a management function or providing services that would be book-keeping in nature. |
(3) | Represent fees for services related to transfer pricing studies and international tax consulting services. In the fiscal year ended March 31, 2014, this fee includes fees for services related to transfer pricing studies. |
(4) | Represent fees for services not included in the Audit, Audit Related, and Tax categories. In the year ended March 31, 2015, this fee includes attest services performed over the Company's application for energy credits and certain agreed upon procedures work. |
Pre-Approval of Audit and Permissible Non-Audit Services
The charter of the Audit Committee provides that the Committee is responsible for the pre-approval of all audit and permissible non-audit services to be performed by the independent auditors. The Audit Committee has adopted a policy for the pre-approval of services provided by the independent auditors. The policy gives detailed guidance to management as to the specific services that are eligible for general pre-approval and provides specific cost limits for certain services on an annual basis. Pursuant to the policy and the Audit Committee charter, the Audit Committee has granted to its chairman the authority to address any requests for pre-approval of individual services.
165
PART IV
Item 15. Exhibits and Financial Statement Schedules
1. Financial Statement Schedules
None.
2. Exhibits
Exhibit No. |
| Description |
|
| |
2.1 |
| Arrangement Agreement by and among Hindalco Industries Limited, AV Aluminum Inc. and Novelis Inc., dated as of February 10, 2007 (incorporated by reference to Exhibit 2.1 to our Current Report on Form 8-K filed on February 13, 2007 (File No. 001-32312)) |
|
| |
3.1 |
| Restated Certificate and Articles of Incorporation of Novelis Inc. (incorporated by reference to Exhibit 3.1 to our Current Report on Form 8-K filed on January 7, 2005 (File No. 001-32312)) |
|
| |
3.2 |
| Certificate and Articles of Amalgamation of Novelis Inc., dated March 31, 2015 |
|
| |
3.3 |
| Novelis Inc. Amended and Restated Bylaws, adopted as of July 24, 2008 (incorporated by reference to Exhibit 3.2 to our Current Report on Form 8-K filed on July 25, 2008 (File No. 001-32312)) |
|
| |
4.1 |
| Specimen Certificate of Novelis Inc. Common Shares (incorporated by reference to Exhibit 4.2 to our Registration Statement on Form 10-12B filed on December 27, 2004 (File No. 001-32312)) |
|
| |
4.2 |
| Indenture, relating to the 8.375% Senior Notes due 2017, dated as of December 17, 2010, between Novelis Inc., the guarantors named on the signature pages thereto and The Bank of New York Mellon Trust Company, N.A., as trustee (incorporated by reference to Exhibit 4.1 to our Current Report on Form 8-K filed on December 17, 2010 (File No. 001-32312)) |
|
| |
4.3 |
| Indenture, relating to the 8.75% Senior Notes due 2020, dated as of December 17, 2010, between Novelis Inc., the guarantors named on the signature pages thereto and The Bank of New York Mellon Trust Company, N.A., as trustee (incorporated by reference to Exhibit 4.2 to our Current Report on Form 8-K filed on December 17, 2010 (File No. 001-32312)) |
|
| |
4.4 |
| Form of 8.375% Senior Note due 2017 (incorporated by reference to Exhibit 4.3 to our Current Report on Form 8-K filed on December 17, 2010 (File No. 001-32312)) |
|
| |
4.5 |
| Form of 8.75% Senior Note due 2020 (incorporated by reference to Exhibit 4.4 to our Current Report on Form 8-K filed on December 17, 2010 (File No. 001-32312)) |
|
| |
4.6 |
| Supplemental Indenture, relating to the 8.375% Senior Notes due 2017, among the Company, the guarantor named on the signature page thereto and The Bank of New York Mellon Trust Company, N.A., as trustee, dated as of December 7, 2011 (incorporated by reference to Exhibit 4.1 to our Quarterly Report on Form 10-Q filed on February 8, 2012 (File No. 001-32312)) |
|
| |
4.7 |
| Supplemental Indenture, relating to the 8.75% Senior Notes due 2017, among the Company, the guarantor named on the signature page thereto and The Bank of New York Mellon Trust Company, N.A., as trustee, dated as of December 7, 2011 (incorporated by reference to Exhibit 4.2 to our Quarterly Report on Form 10-Q filed on February 8, 2012 (File No. 001-32312)) |
|
| |
166
4.8 |
| Supplemental Indenture, relating to the 8.375% Senior Notes due 2017, among Novelis Inc., Novelis Delaware LLC, and The Bank of New York Mellon Trust Company, N.A., as Trustee, dated as of March 27, 2012 (incorporated by reference into Exhibit 4.20 to our Annual Report on Form 10-K filed on May 24, 2012 (File No. 001-32312)) |
|
| |
4.9 |
| Supplemental Indenture, relating to the 8.75% Senior Notes due 2020, among Novelis Inc., Novelis Delaware LLC, and The Bank of New York Mellon Trust Company, N.A., as Trustee, dated as of March 27, 2012 (incorporated by reference into Exhibit 4.21 to our Annual Report on Form 10-K filed on May 24, 2012 (File No. 001-32312)) |
|
|
|
4.10 |
| Supplemental Indenture, relating to the 8.375% Senior Notes due 2017, among Novelis Inc., 8018243 Canada Limited, and The Bank of New York Mellon Trust Company, N.A., as Trustee, dated as of March 27, 2012 (incorporated by reference into Exhibit 4.22 to our Annual Report on Form 10-K filed on May 24, 2012 (File No. 001-32312)) |
|
| |
4.11 |
| Supplemental Indenture, relating to the 8.75% Senior Notes due 2020, among Novelis Inc., 8018243 Canada Limited, and The Bank of New York Mellon Trust Company, N.A., as Trustee, dated as of March 27, 2012 (incorporated by reference into Exhibit 4.23 to our Annual Report on Form 10-K filed on May 24, 2012 (File No. 001-32312)) |
|
| |
4.12 |
| Supplemental Indenture, relating to the 8.75% Senior Notes due 2020, among Novelis Inc., Novelis Sheet Ingot GmbH and The Bank of New York Mellon Trust Company, N.A., as Trustee, dated as of August 8, 2012 (incorporated by reference to Exhibit 4.2 to our Quarterly Report on Form 10-Q filed on August 14, 2012 (File No. 001-32312)) |
|
| |
4.13
|
| Supplemental Indenture, relating to the 8.375% Senior Notes due 2017, among Novelis Inc., Novelis Sheet Ingot GmbH and The Bank of New York Mellon Trust Company, N.A., as Trustee, dated as of August 8, 2012 (incorporated by reference to Exhibit 4.1 to our Quarterly Report on Form 10-Q filed on August 14, 2012 (File No. 001-32312)) |
|
| |
10.1 |
| $800 million asset-based lending credit facility dated as of December 17, 2010 among Novelis Inc., as Parent Borrower, Novelis Corporation, Novelis PAE Corporation, Novelis Brand LLC, Novelis South America Holdings LLC, Aluminum Upstream Holdings LLC, as U.S. Borrowers, Novelis UK Limited, AV Metals Inc., and the other loan parties from time to time party thereto, the lenders from time to time party thereto, the Collateral Agent, Bank of America, N.A., as Issuing Bank, U.S. Swingline Lender and Administrative Agent, The Royal Bank of Scotland plc, as European Swingline Lender, and the other parties from time to time party thereto (incorporated by reference to Exhibit 10.1 to our Quarterly Report on Form 10-Q filed on February 8, 2011 (File No. 001-32312)) |
|
| |
10.2 |
| $1.5 billion term loan facility dated as of December 17, 2010 among Novelis Inc., as Borrower, AV Metals Inc., as Holdings, and the other guarantors party thereto, with the lenders party thereto, Bank of America, N.A., as administrative agent, JPMorgan Chase Bank, N.A., as syndication agent, Citibank, N.A., The Royal Bank of Scotland PLC and UBS AG, Stamford Branch, as co-documentation agents, and Merrill Lynch, Pierce, Fenner and Smith Incorporated and J.P. Morgan Securities LLC, as joint lead arrangers and Merrill Lynch, Pierce, Fenner and Smith Incorporated, J.P. Morgan Securities LLC, Citigroup Global Markets Inc., RBS Securities Inc. and UBS Securities LLC, as joint bookrunners (incorporated by reference to Exhibit 10.2 to our Quarterly Report on Form 10-Q filed on February 8, 2011 (File No. 001-32312)) |
|
| |
10.3 |
| Amendment No. 1 to Credit Agreement, dated as of March 10, 2011, among Novelis Inc., as borrower, AV Metals Inc., as holdings, and the other loan parties party thereto, the lenders party thereto, Bank of America, N.A., as administrative agent, and Merrill Lynch, Pierce, Fenner and Smith Incorporated, Citigroup Global Markets Inc. and UBS Securities LLC, as joint lead arrangers and joint bookrunners (incorporated by reference to Exhibit 10.1 to our Current Report on Form 8-K filed on March 14, 2011 (File No. 001-32312)) |
|
| |
10.4 |
| Amendment No. 2 to Credit Facility, dated as of October 12, 2012, by and among Novelis Inc., AV Metals, Inc., the Subsidiary Guarantors Party thereto, Novelis Italia S.P.A. and Bank of America, N.A. as Administrative Agent (incorporated by reference to Exhibit 10.1 to our Quarterly Report on Form 10-Q filed on November 6, 2012 (File No. 001-32312)) |
167
|
| |
10.5 |
| Amendment No. 3 to Credit Facility, dated as of March 5, 2013, by and among Novelis Inc., AV Metals, Inc., the Subsidiary Guarantors Party thereto, Novelis Italia S.P.A. and Bank of America, N.A. as Administrative Agent (incorporated by reference to Exhibit 10.5 to our Annual Report on Form 10-K filed on May 15, 2013 (File No. 001-32312)) |
|
| |
10.6 |
| Intercreditor Agreement dated as of December 17, 2010 by and among Novelis Inc., Novelis Corporation, Novelis PAE Corporation, Novelis Brand LLC, Novelis South America Holdings LLC, Aluminum Upstream Holdings LLC, Novelis UK Limited, AV Metals Inc., and the subsidiary guarantors party thereto, as grantors, Bank of America, N.A., as revolving credit administrative agent, revolving credit collateral agent, Term Loan administrative agent, and Term Loan collateral agent (incorporated by reference to Exhibit 10.3 to our Quarterly Report on Form 10-Q filed on February 8, 2011 (File No. 001-32312)) |
|
| |
10.7 |
| Security Agreement made by Novelis Inc., as Parent Borrower, Novelis Corporation, Novelis PAE Corporation, Novelis Brand LLC, Novelis South America Holdings LLC, Aluminum Upstream Holdings LLC, as U.S. Borrowers and the guarantors from time to time party thereto in favor of Bank of America, N.A., as collateral agent dated as of December 17, 2010 (incorporated by reference to Exhibit 10.4 to our Quarterly Report on Form 10-Q filed on February 8, 2011) (File No. 001-32312)) |
|
| |
10.8 |
| Security Agreement made by Novelis Inc., as the Borrower and the guarantors from time to time party thereto in favor of Bank of America, N.A., as collateral agent dated as of December 17, 2010 (incorporated by reference to Exhibit 10.5 to our Quarterly Report on Form 10-Q filed on February 8, 2011) (File No. 001-32312)) |
|
| |
10.9 |
| $225 million Increase Joinder Agreement dated as of December 7, 2011 among Novelis, Inc., AV Metals Inc. The Third Party Security Providers named therein and Bank of America, N.A., as Administrative Agent under the Credit Agreements (incorporated by reference to Exhibit 10.1 to our Quarterly Report on Form 10-Q filed on February 8, 2012 (File No. 001-32312)) |
|
| |
10.10 |
| Increase Joinder Agreement, dated as of October 12, 2012, by and among Novelis Inc., AV Metals Inc., the Subsidiary Guarantors party thereto, Bank of America, N.A., as Administrative Agent and the Lenders Signatory thereto (incorporated by reference to Exhibit 10.1 to our Quarterly Report filed on November 6, 2012 (File No. 001-32312)) |
|
| |
10.11 |
| Registration Rights Agreement relating to the 8.375% Senior Notes due 2017, dated as of December 17, 2010 among the Company, the guarantors named on the signature pages thereto and Citigroup Global Markets Inc., as representative of the initial purchasers (incorporated by reference to Exhibit 10.1 to our Current Report on Form 8-K filed on December 17, 2010 (File No. 001-32312)) |
|
| |
10.12 |
| Registration Rights Agreement relating to the 8.75% Notes Senior Notes due 2020, dated as of December 17, 2010 among the Company, the guarantors named on the signature pages thereto and Citigroup Global Markets Inc., as representative of the initial purchasers (incorporated by reference to Exhibit 10.2 to our Current Report on Form 8-K filed on December 17, 2010 (File No. 001-32312)) |
|
| |
10.13 |
| Amended and Restated Credit Agreement dated as of May 13, 2013 among Novelis Inc. and subsidiary borrowers party thereto, guarantors party thereto, Wells Fargo as Administrative Agent and the Lenders signatory thereto (incorporated by reference to Exhibit 10.13 to our Annual Report on Form 10-K filed on May 15, 2013 (File No. 001-32312)) |
|
| |
10.14 |
| Second Amended and Restated Credit Agreement dated as of October 6, 2014, by and among Novelis Inc. and other borrowers and guarantors party thereto and Wells Fargo Bank, National Association as Administrative Agent, Collateral Agent, Issuing Bank and U.S. Swingline Lender and other lenders party thereto (incorporated by reference to Exhibit 10.1 to our Quarterly Report on Form 10-Q filed on November 10, 2014 (File No. 001-32312)) |
|
|
|
10.15 |
| Supplemental Indenture, dated as of July 30, 2013, among Novelis MEA Ltd, Novelis Inc., and The Bank of New York Mellon Trust Company N.A., as Trustee (incorporated by reference to Exhibit 10.2 to our Quarterly Report on Form 10-Q filed on November 10, 2014 (File No. 001-32312)) |
168
|
|
|
10.16 |
| Supplemental Indenture, dated as of July 30, 2013, among Novelis MEA Ltd, Novelis Inc., and The Bank of New York Mellon Trust Company N.A., as Trustee (incorporated by reference to Exhibit 10.3 to our Quarterly Report on Form 10-Q filed on November 10, 2014 (File No. 001-32312)) |
|
|
|
10.17** |
| Amended and Restated Metal Supply Agreement between Novelis Inc., as Purchaser, and Alcan Inc., as Supplier, for the supply of re-melt aluminum ingot (incorporated by reference to Exhibit 10.6 to our Annual Report on Form 10-K filed on June 19, 2008 (File No. 001-32312)) |
|
| |
10.18** |
| Amended and Restated Molten Metal Supply Agreement between Novelis Inc., as Purchaser, and Alcan Inc., as Supplier, for the supply of molten metal to Purchaser's Saguenay Works facility) (incorporated by reference to Exhibit 10.7 to our Annual Report on Form 10-K filed on June 19, 2008 (File No. 001-32312)) |
|
| |
10.19** |
| Metal Supply Agreement between Novelis Inc., as Purchaser, and Rio Tinto Alcan Inc., as Supplier, for the supply of sheet ingot in North America, dated October 26, 2011 (incorporated by reference to Exhibit 10.10 to our Annual Report on Form 10-K filed on May 24, 2012 (File No. 001-32312)) |
|
| |
10.20** |
| Amended and Restated Metal Supply Agreement between Novelis Inc., as Purchaser, and Alcan Inc., as Supplier, for the supply of sheet ingot in Europe (incorporated by reference to Exhibit 10.9 to our Annual Report on Form 10-K filed on June 19, 2008) (File No. 001-32312)) |
|
| |
10.21* |
| Form of Indemnity Agreement between Novelis Inc. and Members of the Board of Directors of Novelis Inc. (incorporated by reference to Exhibit 10.1 to our Current Report on Form 8-K filed on May 21, 2007 (File No. 001-32312)) |
|
| |
10.22* |
| Form of Indemnity Agreement between Novelis Inc. and certain executive officers dated as of June 27, 2007 (incorporated by reference to Exhibit 10.1 to our Current Report on Form 8-K filed on June 28, 2007 (File No. 001-32312)) |
|
| |
10.22* |
| Form of Change in Control Agreement between Novelis Inc. and certain executive officers ((incorporated by reference to Exhibit 10.33 to our Annual Report on Form 10-K filed on May 24, 2012 (File No. 001-32312)) |
|
| |
10.24* |
| Form of Change in Control Agreement between Novelis Inc. and certain executive officers ((incorporated by reference to Exhibit 10.34 to our Annual Report on Form 10-K filed on May 24, 2012 (File No. 001-32312)) |
|
| |
10.25* |
| Form of Severance Agreement (incorporated by reference to Exhibit 10.4 to our Current Report on Form 8-K filed on July 1, 2009 (File No. 001-32312)) |
|
| |
10.26* |
| Novelis 2011 Long-Term Incentive Plan (incorporated by reference to Exhibit 10.1 to our Current Report on Form 8-K filed on May 18, 2010 (File No. 001-32312)) |
|
| |
10.27* |
| Novelis 2012 Long-Term Incentive Plan (incorporated by reference to Exhibit 10.1 to our Current Report on Form 8-K filed on May 26, 2011 (File No. 001-32312)) |
|
| |
10.28* |
| Novelis Inc. 2013 Long-Term Incentive Plan (incorporated by reference into Exhibit 10.1 to our Current Report on Form 8-K filed on May 25, 2012 (File No. 001-32312)) |
|
| |
10.29* |
| Novelis Inc. Fiscal Year 2014 Long-Term Incentive Plan (incorporated by reference to Exhibit 10.42 to our Annual Report on Form 10-K filed on May 15, 2013 (File No. 001-32312)) |
|
| |
10.30* |
| Novelis Inc. Fiscal Year 2015 Long-Term Incentive Plan (incorporated by reference to Exhibit 10.30 to our Annual Report on Form 10-K filed on May 16, 2014 (File No. 001-32312)) |
|
| |
169
10.31* |
| Novelis Inc. Fiscal Year 2016 Long-Term Incentive Plan |
|
| |
10.32* |
| Novelis Inc. Long-Term Incentive Plans Amendment dated May 13, 2013 (incorporated by reference to Exhibit 10.44 to our Annual Report on Form 10-K filed on May 15, 2013 (File No. 001-32312)) |
|
| |
10.33* |
| Novelis Inc. Fiscal Year 2013 Annual Incentive Plan (incorporated by reference into Exhibit 10.2 to our Current Report on Form 8-K filed on May 25, 2012 (File No. 001-32312)) |
|
| |
10.34* |
| Novelis Inc. Fiscal Year 2014 Annual Incentive Plan (incorporated by reference to Exhibit 10.43 to our Annual Report on Form 10-K filed on May 15, 2013 (File No. 001-32312)) |
|
| |
10.35* |
| Novelis Inc. Fiscal Year 2015 Annual Incentive Plan (incorporated by reference to Exhibit 10.35 to our Annual Report on Form 10-K filed on May 16, 2014 (File No. 001-32312)) |
|
| |
10.36* |
| Novelis Inc. Fiscal Year 2016 Annual Incentive Plan |
|
| |
10.37* |
| Novelis Supplementary Pension Plan dated January 1, 2012 ((incorporated by reference to Exhibit 10.31 to our Annual Report on Form 10-K filed on May 24, 2012 (File No. 001-32312)) |
|
| |
10.38* |
| Employment Agreement between Philip Martens and Novelis Inc., dated as of April 11, 2009 (incorporated by reference to Exhibit 10.36 to our Annual Report on Form 10-K filed on June 29, 2009 (File No. 001-32312)) |
|
| |
10.39* |
| Retention Agreement between Novelis Inc. and Philip Martens, dated as of May 13, 2013 (incorporated by reference to Exhibit 10.38 to our Annual Report on Form 10-K filed on May 16, 2014 (File No. 001-32312)) |
|
| |
10.40* |
| Separation and Release Agreement between Novelis Inc. and Philip Martens, dated April 23, 2015 |
|
| |
10.41* |
| Employment Agreement between Novelis Inc. and Steven Fisher (incorporated by reference to our Current Report on Form 8-K filed on May 21, 2007 and our Current Report on Form 8-K/A filed on August 15, 2007 (File No. 001-32312)) |
|
| |
10.42* |
| Employment Agreement between Novelis Inc. and Antonio Tadeu Coelho Nardocci dated September 4, 2009 (incorporated by reference to Exhibit 10.1 to our Current Report on Form 8-K/A filed on September 9, 2009 (File No. 001-32312)) |
|
| |
10.43* |
| Employment Agreement between Novelis Inc. and Erwin Mayr, dated as of September 17, 2009 (incorporated by reference in Exhibit 10.29 of our Annual Report on Form 10-K filed May 26, 2011) File No. 001-32312)) |
|
| |
10.44* |
| Employment Agreement between Novelis do Brasil Ltda. and Marco Antonio Palmieri dated August 8, 2011 (incorporated by reference to Exhibit 10.1 to our Quarterly Report on Form 10-Q filed on November 9, 2011 (File No. 001-32312)) |
|
| |
10.45* |
| Employment Agreement between Novelis Inc. and Shashi Maudgal dated February 23, 2012 ((incorporated by reference to Exhibit 10.32 to our Annual Report on Form 10-K filed on May 24, 2012 (File No. 001-32312)) |
|
| |
10.46* |
| Employment Agreement between Novelis Inc. and Leslie J. Parrette, Jr., dated September 21, 2009 |
|
| |
10.47* |
| Retention Award Letter to Steven Fisher, dated July 1, 2014 |
170
|
| |
10.48* |
| Retention Award Letter to Marco Palmieri, dated July 1, 2014 |
|
| |
10.49* |
| Retention Award Letter to Erwin Mayr, dated July 1, 2014 |
|
| |
10.50* |
| Retention Award Letter to Leslie J. Parrette, dated July 1, 2014 |
|
| |
21.1 |
| List of Subsidiaries of Novelis Inc. |
|
| |
31.1 |
| Section 302 Certification of Principal Executive Officer and Principal Financial Officer |
|
| |
32.1 |
| Section 906 Certification of Principal Executive Officer and Principal Financial Officer |
|
| |
101.INS |
| XBRL Instance Document |
|
| |
101.SCH |
| XBRL Taxonomy Extension Schema Document |
|
| |
101.CAL |
| XBRL Taxonomy Extension Calculation Linkbase |
|
| |
101.DEF |
| XBRL Taxonomy Extension Definition Linkbase |
|
| |
101.LAB |
| XBRL Taxonomy Extension Label Linkbase |
|
| |
101.PRE |
| XBRL Taxonomy Extension Presentation Linkbase |
* | Indicates a management contract or compensatory plan or arrangement. |
** | Confidential treatment requested for certain portions of this Exhibit, which portions have been omitted and filed separately with the Securities and Exchange Commission. |
171
SIGNATURES
Pursuant to the requirements of Section 13 or 15(d) of the Securities Exchange Act of 1934, the registrant has duly caused this report to be signed on its behalf by the undersigned, thereunto duly authorized.
| NOVELIS INC. |
|
|
| By: |
| /s/ Steven Fisher |
| Name: |
| Steven Fisher |
| Title: |
| Interim President and Chief Executive Officer |
Date: May 12, 2015
Pursuant to the requirements of the Securities Exchange Act of 1934, this report has been signed below by the following persons on behalf of the registrant and in the capacities and on the dates indicated.
|
|
|
|
|
/s/ Steven Fisher |
| (Principal Executive Officer) |
| Date May 12, 2015 |
Steven Fisher |
|
|
|
|
|
|
| ||
/s/ Steven Fisher |
| (Principal Financial Officer) |
| Date May 12, 2015 |
Steven Fisher |
|
|
|
|
|
|
| ||
/s/ Robert Nelson |
| (Principal Accounting Officer) |
| Date May 12, 2015 |
Robert Nelson |
|
|
|
|
|
|
| ||
/s/ Kumar Mangalam Birla |
| (Chairman of the Board of Directors) |
| Date May 12, 2015 |
Kumar Mangalam Birla |
|
|
|
|
|
|
| ||
/s/ Askaran Agarwala |
| (Director) |
| Date May 12, 2015 |
Askaran Agarwala |
|
|
|
|
|
|
| ||
/s/ Debnarayan Bhattacharya |
| (Director) |
| Date May 12, 2015 |
Debnarayan Bhattacharya |
|
|
|
|
|
|
| ||
/s/ Clarence J. Chandran |
| (Director) |
| Date May 12, 2015 |
Clarence J. Chandran |
|
|
|
|
|
|
| ||
/s/ Donald A. Stewart |
| (Director) |
| Date May 12, 2015 |
Donald A. Stewart |
|
|
|
|
|
|
|
|
|
/s/ Satish Pai |
| (Director) |
| Date May 12, 2015 |
Satish Pai |
|
|
|
|
172
EXHIBIT INDEX
Exhibit No. |
| Description |
|
| |
2.1 |
| Arrangement Agreement by and among Hindalco Industries Limited, AV Aluminum Inc. and Novelis Inc., dated as of February 10, 2007 (incorporated by reference to Exhibit 2.1 to our Current Report on Form 8-K filed on February 13, 2007 (File No. 001-32312)) |
|
| |
3.1 |
| Restated Certificate and Articles of Incorporation of Novelis Inc. (incorporated by reference to Exhibit 3.1 to our Current Report on Form 8-K filed on January 7, 2005 (File No. 001-32312)) |
|
| |
3.2 |
| Certificate and Articles of Amalgamation of Novelis Inc., dated March 31, 2015 |
|
| |
3.3 |
| Novelis Inc. Amended and Restated Bylaws, adopted as of July 24, 2008 (incorporated by reference to Exhibit 3.2 to our Current Report on Form 8-K filed on July 25, 2008 (File No. 001-32312)) |
|
| |
4.1 |
| Specimen Certificate of Novelis Inc. Common Shares (incorporated by reference to Exhibit 4.2 to our Registration Statement on Form 10-12B filed on December 27, 2004 (File No. 001-32312)) |
|
| |
4.2 |
| Indenture, relating to the 8.375% Senior Notes due 2017, dated as of December 17, 2010, between Novelis Inc., the guarantors named on the signature pages thereto and The Bank of New York Mellon Trust Company, N.A., as trustee (incorporated by reference to Exhibit 4.1 to our Current Report on Form 8-K filed on December 17, 2010 (File No. 001-32312)) |
|
| |
4.3 |
| Indenture, relating to the 8.75% Senior Notes due 2020, dated as of December 17, 2010, between Novelis Inc., the guarantors named on the signature pages thereto and The Bank of New York Mellon Trust Company, N.A., as trustee (incorporated by reference to Exhibit 4.2 to our Current Report on Form 8-K filed on December 17, 2010 (File No. 001-32312)) |
|
| |
4.4 |
| Form of 8.375% Senior Note due 2017 (incorporated by reference to Exhibit 4.3 to our Current Report on Form 8-K filed on December 17, 2010 (File No. 001-32312)) |
|
| |
4.5 |
| Form of 8.75% Senior Note due 2020 (incorporated by reference to Exhibit 4.4 to our Current Report on Form 8-K filed on December 17, 2010 (File No. 001-32312)) |
|
| |
4.6 |
| Supplemental Indenture, relating to the 8.375% Senior Notes due 2017, among the Company, the guarantor named on the signature page thereto and The Bank of New York Mellon Trust Company, N.A., as trustee, dated as of December 7, 2011 (incorporated by reference to Exhibit 4.1 to our Quarterly Report on Form 10-Q filed on February 8, 2012 (File No. 001-32312)) |
|
| |
4.7 |
| Supplemental Indenture, relating to the 8.75% Senior Notes due 2017, among the Company, the guarantor named on the signature page thereto and The Bank of New York Mellon Trust Company, N.A., as trustee, dated as of December 7, 2011 (incorporated by reference to Exhibit 4.2 to our Quarterly Report on Form 10-Q filed on February 8, 2012 (File No. 001-32312)) |
|
| |
4.8 |
| Supplemental Indenture, relating to the 8.375% Senior Notes due 2017, among Novelis Inc., Novelis Delaware LLC, and The Bank of New York Mellon Trust Company, N.A., as Trustee, dated as of March 27, 2012 (incorporated by reference into Exhibit 4.20 to our Annual Report on Form 10-K filed on May 24, 2012 (File No. 001-32312)) |
|
| |
4.9 |
| Supplemental Indenture, relating to the 8.75% Senior Notes due 2020, among Novelis Inc., Novelis Delaware LLC, and The Bank of New York Mellon Trust Company, N.A., as Trustee, dated as of March 27, 2012 (incorporated by reference into Exhibit 4.21 to our Annual Report on Form 10-K filed on May 24, 2012 (File No. 001-32312)) |
173
|
| |
4.10 |
| Supplemental Indenture, relating to the 8.375% Senior Notes due 2017, among Novelis Inc., 8018243 Canada Limited, and The Bank of New York Mellon Trust Company, N.A., as Trustee, dated as of March 27, 2012 (incorporated by reference into Exhibit 4.22 to our Annual Report on Form 10-K filed on May 24, 2012 (File No. 001-32312)) |
|
| |
4.11 |
| Supplemental Indenture, relating to the 8.75% Senior Notes due 2020, among Novelis Inc., 8018243 Canada Limited, and The Bank of New York Mellon Trust Company, N.A., as Trustee, dated as of March 27, 2012 (incorporated by reference into Exhibit 4.23 to our Annual Report on Form 10-K filed on May 24, 2012 (File No. 001-32312)) |
|
| |
4.12 |
| Supplemental Indenture, relating to the 8.75% Senior Notes due 2020, among Novelis Inc., Novelis Sheet Ingot GmbH and The Bank of New York Mellon Trust Company, N.A., as Trustee, dated as of August 8, 2012 (incorporated by reference to Exhibit 4.2 to our Quarterly Report on Form 10-Q filed on August 14, 2012 (File No. 001-32312)) |
|
| |
4.13
|
| Supplemental Indenture, relating to the 8.375% Senior Notes due 2017, among Novelis Inc., Novelis Sheet Ingot GmbH and The Bank of New York Mellon Trust Company, N.A., as Trustee, dated as of August 8, 2012 (incorporated by reference to Exhibit 4.1 to our Quarterly Report on Form 10-Q filed on August 14, 2012 (File No. 001-32312)) |
|
| |
10.1 |
| $800 million asset-based lending credit facility dated as of December 17, 2010 among Novelis Inc., as Parent Borrower, Novelis Corporation, Novelis PAE Corporation, Novelis Brand LLC, Novelis South America Holdings LLC, Aluminum Upstream Holdings LLC, as U.S. Borrowers, Novelis UK Limited, AV Metals Inc., and the other loan parties from time to time party thereto, the lenders from time to time party thereto, the Collateral Agent, Bank of America, N.A., as Issuing Bank, U.S. Swingline Lender and Administrative Agent, The Royal Bank of Scotland plc, as European Swingline Lender, and the other parties from time to time party thereto (incorporated by reference to Exhibit 10.1 to our Quarterly Report on Form 10-Q filed on February 8, 2011 (File No. 001-32312)) |
|
| |
10.2 |
| $1.5 billion term loan facility dated as of December 17, 2010 among Novelis Inc., as Borrower, AV Metals Inc., as Holdings, and the other guarantors party thereto, with the lenders party thereto, Bank of America, N.A., as administrative agent, JPMorgan Chase Bank, N.A., as syndication agent, Citibank, N.A., The Royal Bank of Scotland PLC and UBS AG, Stamford Branch, as co-documentation agents, and Merrill Lynch, Pierce, Fenner and Smith Incorporated and J.P. Morgan Securities LLC, as joint lead arrangers and Merrill Lynch, Pierce, Fenner and Smith Incorporated, J.P. Morgan Securities LLC, Citigroup Global Markets Inc., RBS Securities Inc. and UBS Securities LLC, as joint bookrunners (incorporated by reference to Exhibit 10.2 to our Quarterly Report on Form 10-Q filed on February 8, 2011 (File No. 001-32312)) |
|
| |
10.3 |
| Amendment No. 1 to Credit Agreement, dated as of March 10, 2011, among Novelis Inc., as borrower, AV Metals Inc., as holdings, and the other loan parties party thereto, the lenders party thereto, Bank of America, N.A., as administrative agent, and Merrill Lynch, Pierce, Fenner and Smith Incorporated, Citigroup Global Markets Inc. and UBS Securities LLC, as joint lead arrangers and joint bookrunners (incorporated by reference to Exhibit 10.1 to our Current Report on Form 8-K filed on March 14, 2011 (File No. 001-32312)) |
|
| |
10.4 |
| Amendment No. 2 to Credit Facility, dated as of October 12, 2012, by and among Novelis Inc., AV Metals, Inc., the Subsidiary Guarantors Party thereto, Novelis Italia S.P.A. and Bank of America, N.A. as Administrative Agent (incorporated by reference to Exhibit 10.1 to our Quarterly Report on Form 10-Q filed on November 6, 2012 (File No. 001-32312)) |
|
| |
10.5 |
| Amendment No. 3 to Credit Facility, dated as of March 5, 2013, by and among Novelis Inc., AV Metals, Inc., the Subsidiary Guarantors Party thereto, Novelis Italia S.P.A. and Bank of America, N.A. as Administrative Agent (incorporated by reference to Exhibit 10.5 to our Annual Report on Form 10-K filed on May 15, 2013 (File No. 001-32312)) |
|
| |
174
10.6 |
| Intercreditor Agreement dated as of December 17, 2010 by and among Novelis Inc., Novelis Corporation, Novelis PAE Corporation, Novelis Brand LLC, Novelis South America Holdings LLC, Aluminum Upstream Holdings LLC, Novelis UK Limited, AV Metals Inc., and the subsidiary guarantors party thereto, as grantors, Bank of America, N.A., as revolving credit administrative agent, revolving credit collateral agent, Term Loan administrative agent, and Term Loan collateral agent (incorporated by reference to Exhibit 10.3 to our Quarterly Report on Form 10-Q filed on February 8, 2011 (File No. 001-32312)) |
|
| |
10.7 |
| Security Agreement made by Novelis Inc., as Parent Borrower, Novelis Corporation, Novelis PAE Corporation, Novelis Brand LLC, Novelis South America Holdings LLC, Aluminum Upstream Holdings LLC, as U.S. Borrowers and the guarantors from time to time party thereto in favor of Bank of America, N.A., as collateral agent dated as of December 17, 2010 (incorporated by reference to Exhibit 10.4 to our Quarterly Report on Form 10-Q filed on February 8, 2011) (File No. 001-32312)) |
|
| |
10.8 |
| Security Agreement made by Novelis Inc., as the Borrower and the guarantors from time to time party thereto in favor of Bank of America, N.A., as collateral agent dated as of December 17, 2010 (incorporated by reference to Exhibit 10.5 to our Quarterly Report on Form 10-Q filed on February 8, 2011) (File No. 001-32312)) |
|
| |
10.9 |
| $225 million Increase Joinder Agreement dated as of December 7, 2011 among Novelis, Inc., AV Metals Inc. The Third Party Security Providers named therein and Bank of America, N.A., as Administrative Agent under the Credit Agreements (incorporated by reference to Exhibit 10.1 to our Quarterly Report on Form 10-Q filed on February 8, 2012 (File No. 001-32312)) |
|
| |
10.10 |
| Increase Joinder Agreement, dated as of October 12, 2012, by and among Novelis Inc., AV Metals Inc., the Subsidiary Guarantors party thereto, Bank of America, N.A., as Administrative Agent and the Lenders Signatory thereto (incorporated by reference to Exhibit 10.1 to our Quarterly Report filed on November 6, 2012 (File No. 001-32312)) |
|
| |
10.11 |
| Registration Rights Agreement relating to the 8.375% Senior Notes due 2017, dated as of December 17, 2010 among the Company, the guarantors named on the signature pages thereto and Citigroup Global Markets Inc., as representative of the initial purchasers (incorporated by reference to Exhibit 10.1 to our Current Report on Form 8-K filed on December 17, 2010 (File No. 001-32312)) |
|
| |
10.12 |
| Registration Rights Agreement relating to the 8.75% Notes Senior Notes due 2020, dated as of December 17, 2010 among the Company, the guarantors named on the signature pages thereto and Citigroup Global Markets Inc., as representative of the initial purchasers (incorporated by reference to Exhibit 10.2 to our Current Report on Form 8-K filed on December 17, 2010 (File No. 001-32312)) |
|
| |
10.13 |
| Amended and Restated Credit Agreement dated as of May 13, 2013 among Novelis Inc. and subsidiary borrowers party thereto, guarantors party thereto, Wells Fargo as Administrative Agent and the Lenders signatory thereto (incorporated by reference to Exhibit 10.13 to our Annual Report on Form 10-K filed on May 15, 2013 (File No. 001-32312)) |
|
|
|
10.14 |
| Second Amended and Restated Credit Agreement dated as of October 6, 2014, by and among Novelis Inc. and other borrowers and guarantors party thereto and Wells Fargo Bank, National Association as Administrative Agent, Collateral Agent, Issuing Bank and U.S. Swingline Lender and other lenders party thereto (incorporated by reference to Exhibit 10.1 to our Quarterly Report on Form 10-Q filed on November 10, 2014 (File No. 001-32312)) |
|
|
|
10.15 |
| Supplemental Indenture, dated as of July 30, 2013, among Novelis MEA Ltd, Novelis Inc., and The Bank of New York Mellon Trust Company N.A., as Trustee (incorporated by reference to Exhibit 10.2 to our Quarterly Report on Form 10-Q filed on November 10, 2014 (File No. 001-32312)) |
|
|
|
175
10.16 |
| Supplemental Indenture, dated as of July 30, 2013, among Novelis MEA Ltd, Novelis Inc., and The Bank of New York Mellon Trust Company N.A., as Trustee (incorporated by reference to Exhibit 10.3 to our Quarterly Report on Form 10-Q filed on November 10, 2014 (File No. 001-32312)) |
|
| |
10.17** |
| Amended and Restated Metal Supply Agreement between Novelis Inc., as Purchaser, and Alcan Inc., as Supplier, for the supply of re-melt aluminum ingot (incorporated by reference to Exhibit 10.6 to our Annual Report on Form 10-K filed on June 19, 2008 (File No. 001-32312)) |
|
| |
10.18** |
| Amended and Restated Molten Metal Supply Agreement between Novelis Inc., as Purchaser, and Alcan Inc., as Supplier, for the supply of molten metal to Purchaser's Saguenay Works facility) (incorporated by reference to Exhibit 10.7 to our Annual Report on Form 10-K filed on June 19, 2008 (File No. 001-32312)) |
|
| |
10.19** |
| Metal Supply Agreement between Novelis Inc., as Purchaser, and Rio Tinto Alcan Inc., as Supplier, for the supply of sheet ingot in North America, dated October 26, 2011 (incorporated by reference to Exhibit 10.10 to our Annual Report on Form 10-K filed on May 24, 2012 (File No. 001-32312)) |
|
| |
10.20** |
| Amended and Restated Metal Supply Agreement between Novelis Inc., as Purchaser, and Alcan Inc., as Supplier, for the supply of sheet ingot in Europe (incorporated by reference to Exhibit 10.9 to our Annual Report on Form 10-K filed on June 19, 2008) (File No. 001-32312)) |
|
| |
10.21* |
| Form of Indemnity Agreement between Novelis Inc. and Members of the Board of Directors of Novelis Inc. (incorporated by reference to Exhibit 10.1 to our Current Report on Form 8-K filed on May 21, 2007 (File No. 001-32312)) |
|
| |
10.22* |
| Form of Indemnity Agreement between Novelis Inc. and certain executive officers dated as of June 27, 2007 (incorporated by reference to Exhibit 10.1 to our Current Report on Form 8-K filed on June 28, 2007 (File No. 001-32312)) |
|
| |
10.23* |
| Form of Change in Control Agreement between Novelis Inc. and certain executive officers ((incorporated by reference to Exhibit 10.33 to our Annual Report on Form 10-K filed on May 24, 2012 (File No. 001-32312)) |
|
| |
10.24* |
| Form of Change in Control Agreement between Novelis Inc. and certain executive officers ((incorporated by reference to Exhibit 10.34 to our Annual Report on Form 10-K filed on May 24, 2012 (File No. 001-32312)) |
|
| |
10.25* |
| Form of Severance Agreement (incorporated by reference to Exhibit 10.4 to our Current Report on Form 8-K filed on July 1, 2009 (File No. 001-32312)) |
|
| |
10.26* |
| Novelis 2011 Long-Term Incentive Plan (incorporated by reference to Exhibit 10.1 to our Current Report on Form 8-K filed on May 18, 2010 (File No. 001-32312)) |
|
|
|
10.27* |
| Novelis 2012 Long-Term Incentive Plan (incorporated by reference to Exhibit 10.1 to our Current Report on Form 8-K filed on May 26, 2011 (File No. 001-32312)) |
|
| |
10.28* |
| Novelis Inc. 2013 Long-Term Incentive Plan (incorporated by reference into Exhibit 10.1 to our Current Report on Form 8-K filed on May 25, 2012 (File No. 001-32312)) |
|
| |
10.29* |
| Novelis Inc. Fiscal Year 2014 Long-Term Incentive Plan (incorporated by reference to Exhibit 10.42 to our Annual Report on Form 10-K filed on May 15, 2013 (File No. 001-32312)) |
|
| |
10.30* |
| Novelis Inc. Fiscal Year 2015 Long-Term Incentive Plan (incorporated by reference to Exhibit 10.30 to our Annual Report on Form 10-K filed on May 16, 2014 (File No. 001-32312)) |
|
| |
10.31* |
| Novelis Inc. Fiscal Year 2016 Long-Term Incentive Plan |
176
|
| |
10.32* |
| Novelis Inc. Long-Term Incentive Plans Amendment dated May 13, 2013 (incorporated by reference to Exhibit 10.44 to our Annual Report on Form 10-K filed on May 15, 2013 (File No. 001-32312)) |
|
| |
10.33* |
| Novelis Inc. Fiscal Year 2013 Annual Incentive Plan (incorporated by reference into Exhibit 10.2 to our Current Report on Form 8-K filed on May 25, 2012 (File No. 001-32312)) |
|
| |
10.34* |
| Novelis Inc. Fiscal Year 2014 Annual Incentive Plan (incorporated by reference to Exhibit 10.43 to our Annual Report on Form 10-K filed on May 15, 2013 (File No. 001-32312)) |
|
| |
10.35* |
| Novelis Inc. Fiscal Year 2015 Annual Incentive Plan (incorporated by reference to Exhibit 10.35 to our Annual Report on Form 10-K filed on May 16, 2014 (File No. 001-32312)) |
|
| |
10.36* |
| Novelis Inc. Fiscal Year 2016 Annual Incentive Plan |
|
| |
10.37* |
| Novelis Supplementary Pension Plan dated January 1, 2012 ((incorporated by reference to Exhibit 10.31 to our Annual Report on Form 10-K filed on May 24, 2012 (File No. 001-32312)) |
|
| |
10.38* |
| Employment Agreement betweeen Philip Martens and Novelis Inc., dated as of April 11, 2009 (incorporated by reference to Exhibit 10.36 to our Annual Report on Form 10-K filed on June 29, 2009 (File No. 001-32312)) |
|
| |
10.39* |
| Retention Agreement between Novelis Inc. and Philip Martens, dated as of May 13, 2013 (incorporated by reference to Exhibit 10.38 to our Annual Report on Form 10-K filed on May 16, 2014 (File No. 001-32312)) |
|
| |
10.40* |
| Separation and Release Agreement between Novelis Inc. and Philip Martens, dated April 23, 2015 |
|
| |
10.41* |
| Employment Agreement between Novelis Inc. and Steven Fisher (incorporated by reference to our Current Report on Form 8-K filed on May 21, 2007 and our Current Report on Form 8-K/A filed on August 15, 2007 (File No. 001-32312)) |
|
| |
10.42* |
| Employment Agreement between Novelis Inc. and Antonio Tadeu Coelho Nardocci dated September 4, 2009 (incorporated by reference to Exhibit 10.1 to our Current Report on Form 8-K/A filed on September 9, 2009 (File No. 001-32312)) |
|
| |
10.43* |
| Employment Agreement between Novelis Inc. and Erwin Mayr, dated as of September 17, 2009 (incorporated by reference in Exhibit 10.29 of our Annual Report on Form 10-K filed May 26, 2011) File No. 001-32312)) |
|
| |
10.44* |
| Employment Agreement between Novelis do Brasil Ltda. and Marco Antonio Palmieri dated August 8, 2011 (incorporated by reference to Exhibit 10.1 to our Quarterly Report on Form 10-Q filed on November 9, 2011 (File No. 001-32312)) |
|
| |
10.45* |
| Employment Agreement between Novelis Inc. and Shashi Maudgal dated February 23, 2012 ((incorporated by reference to Exhibit 10.32 to our Annual Report on Form 10-K filed on May 24, 2012 (File No. 001-32312)) |
|
| |
10.46* |
| Employment Agreement between Novelis Inc. and Leslie J. Parrette, dated September 21, 2009 |
|
| |
10.47* |
| Retention Award Letter to Steven Fisher, dated July 1, 2014 |
|
| |
10.48* |
| Retention Award Letter to Marco Palmieri, dated July 1, 2014 |
|
| |
177
10.49* |
| Retention Award Letter to Erwin Mayr, dated July 1, 2014 |
|
| |
10.50* |
| Retention Award Letter to Leslie J. Parrette, dated July 1, 2014 |
|
| |
21.1 |
| List of Subsidiaries of Novelis Inc. |
|
| |
31.1 |
| Section 302 Certification of Principal Executive Officer and Principal Financial Officer |
|
| |
32.1 |
| Section 906 Certification of Principal Executive Officer and Principal Financial Officer |
|
| |
101.INS |
| XBRL Instance Document |
|
| |
101.SCH |
| XBRL Taxonomy Extension Schema Document |
|
| |
101.CAL |
| XBRL Taxonomy Extension Calculation Linkbase |
|
| |
101.DEF |
| XBRL Taxonomy Extension Definition Linkbase |
|
| |
101.LAB |
| XBRL Taxonomy Extension Label Linkbase |
|
| |
101.PRE |
| XBRL Taxonomy Extension Presentation Linkbase |
* | Indicates a management contract or compensatory plan or arrangement. |
** | Confidential treatment requested for certain portions of this Exhibit, which portions have been omitted and filed separately with the Securities and Exchange Commission. |
178