|
UNITED STATES
SECURITIES AND EXCHANGE COMMISSION
Washington, D.C. 20549
__________________________
FORM 10-Q
__________________________
☒ QUARTERLY REPORT PURSUANT TO SECTION 13 OR 15(d) OF THE SECURITIES EXCHANGE ACT OF 1934 |
For the quarterly period ended November 30, 2017
OR
☐ TRANSITION REPORT PURSUANT TO SECTION 13 OR 15(d) OF THE SECURITIES EXCHANGE ACT OF 1934 |
For the transition period from to
Commission File Number: 1-7102
__________________________
NATIONAL RURAL UTILITIES
COOPERATIVE FINANCE CORPORATION
(Exact name of registrant as specified in its charter)
__________________________
District of Columbia |
| 52-0891669 |
(State or other jurisdiction of incorporation or organization) |
| (I.R.S. Employer Identification No.) |
20701 Cooperative Way, Dulles, Virginia, 20166 |
(Address of principal executive offices) (Zip Code) |
Registrant's telephone number, including area code: (703) 467-1800
__________________________
Indicate by check mark whether the registrant (1) has filed all reports required to be filed by Section 13 or 15(d) of the Securities Exchange Act of 1934 during the preceding 12 months (or for such shorter period that the registrant was required to file such reports), and (2) has been subject to such filing requirements for the past 90 days. Yes ☒ No ☐
Indicate by check mark whether the registrant has submitted electronically and posted on its corporate Web site, if any, every Interactive Data File required to be submitted and posted pursuant to Rule 405 of Regulation S-T (§232.405 of this chapter) during the preceding 12 months (or for such shorter period that the registrant was required to submit and post such files). Yes ☒ No ☐
Indicate by check mark whether the registrant is a large accelerated filer, an accelerated filer, a non-accelerated filer, smaller reporting company, or an emerging growth company. See the definitions of "large accelerated filer," "accelerated filer," "smaller reporting company," and "emerging growth company" in Rule 12b-2 of the Exchange Act. Large accelerated filer ☐ Accelerated filer ☐ Non-accelerated filer ☒ Smaller reporting company ☐ Emerging growth company ☐
(Do not check if a smaller reporting company)
If an emerging growth company, indicate by check mark if the registrant has elected not to use the extended transaction period for complying with any new or revised financial accounting standards provided pursuant to Section13(a) of the Exchange Act. ☐
Indicate by check mark whether the registrant is a shell company (as defined in Rule 12b-2 of the Exchange Act). Yes ☐ No ☒
|
TABLE OF CONTENTS
|
|
|
| Page |
PART I - FINANCIAL INFORMATION |
| 1 | ||
Item 1. |
| Financial Statements |
| 44 |
|
| Condensed Consolidated Statements of Operations |
| 45 |
|
| Condensed Consolidated Statements of Comprehensive Income |
| 46 |
|
| Condensed Consolidated Balance Sheets |
| 47 |
|
| Condensed Consolidated Statements of Changes in Equity |
| 48 |
|
| Condensed Consolidated Statements of Cash Flows |
| 49 |
|
| Notes to Condensed Consolidated Financial Statements |
| 50 |
|
| Note 1 - Summary of Significant Accounting Policies |
| 50 |
|
| Note 2 - Variable Interest Entities |
| 54 |
|
| Note 3 - Investment Securities |
| 55 |
|
| Note 4 - Loans and Commitments |
| 58 |
|
| Note 5 - Short-Term Borrowings |
| 67 |
|
| Note 6 - Long-Term Debt |
| 69 |
|
| Note 7 - Subordinated Deferrable Debt |
| 70 |
|
| Note 8 - Derivative Instruments and Hedging Activities |
| 70 |
|
| Note 9 - Equity |
| 73 |
|
| Note 10 - Guarantees |
| 76 |
|
| Note 11 - Fair Value Measurement |
| 77 |
|
| Note 12 - Business Segments |
| 80 |
Item 2. |
| Management's Discussion and Analysis of Financial Condition and Results of Operations ("MD&A") |
| 1 |
|
| Forward-Looking Statements |
| 1 |
|
| Introduction |
| 1 |
|
| Summary of Selected Financial Data |
| 2 |
|
| Executive Summary |
| 4 |
|
| Critical Accounting Policies and Estimates |
| 6 |
|
| Accounting Changes and Other Developments |
| 7 |
|
| Consolidated Results of Operations |
| 7 |
|
| Consolidated Balance Sheet Analysis |
| 17 |
|
| Off-Balance Sheet Arrangements |
| 23 |
|
| Risk Management |
| 26 |
|
| Credit Risk |
| 26 |
|
| Liquidity Risk |
| 33 |
|
| Market Risk |
| 39 |
|
| Non-GAAP Financial Measures |
| 41 |
Item 3. |
| Quantitative and Qualitative Disclosures about Market Risk |
| 85 |
Item 4. |
| Controls and Procedures |
| 85 |
|
|
| ||
PART II-OTHER INFORMATION |
| 85 | ||
Item 1. |
| Legal Proceedings |
| 85 |
Item 1A. |
| Risk Factors |
| 85 |
Item 2. |
| Unregistered Sales of Equity Securities and Use of Proceeds |
| 85 |
Item 3. |
| Defaults Upon Senior Securities |
| 85 |
Item 4. |
| Mine Safety Disclosures |
| 85 |
Item 5. |
| Other Information |
| 85 |
Item 6. |
| Exhibits |
| 86 |
|
|
| ||
SIGNATURES |
| 87 | ||
i
INDEX OF MD&A TABLES
Table |
| Description |
| Page | |
- |
| MD&A Tables: |
|
| |
1 |
| Summary of Selected Financial Data |
| 2 | |
2 |
| Average Balances, Interest Income/Interest Expense and Average Yield/Cost |
| 8 | |
3 |
| Rate/Volume Analysis of Changes in Interest Income/Interest Expense |
| 11 | |
4 |
| Non-Interest Income |
| 13 | |
5 |
| Derivative Average Notional Amounts and Average Interest Rates |
| 14 | |
6 |
| Derivative Gains (Losses) |
| 15 | |
7 |
| Non-Interest Expense |
| 16 | |
8 |
| Loans Outstanding by Type and Member Class |
| 17 | |
9 |
| Historical Retention Rate and Repricing Selection |
| 18 | |
10 |
| Total Debt Outstanding |
| 19 | |
11 |
| Member Investments |
| 20 | |
12 |
| Collateral Pledged |
| 21 | |
13 |
| Unencumbered Loans |
| 22 | |
14 |
| Guarantees Outstanding |
| 23 | |
15 |
| Maturities of Guarantee Obligations |
| 24 | |
16 |
| Unadvanced Loan Commitments |
| 24 | |
17 |
| Notional Maturities of Unadvanced Loan Commitments |
| 24 | |
18 |
| Maturities of Notional Amount of Unconditional Committed Lines of Credit |
| 25 | |
19 |
| Loan Portfolio Security Profile |
| 27 | |
20 |
| Credit Exposure to 20 Largest Borrowers |
| 29 | |
21 |
| TDR Loans |
| 30 | |
22 |
| Net Charge-Offs (Recoveries) |
| 30 | |
23 |
| Allowance for Loan Losses |
| 31 | |
24 |
| Rating Triggers for Derivatives |
| 32 | |
25 |
| Liquidity Reserve |
| 33 | |
26 |
| Committed Bank Revolving Line of Credit Agreements |
| 34 | |
27 |
| Short-Term Borrowings |
| 35 | |
28 |
| Issuances and Maturities of Long-Term and Subordinated Debt |
| 36 | |
29 |
| Principal Maturity of Long-Term and Subordinated Debt |
| 36 | |
30 |
| Projected Sources and Uses of Liquidity |
| 38 | |
31 |
| Credit Ratings |
| 38 | |
32 |
| Interest Rate Gap Analysis |
| 40 | |
33 |
| Adjusted Financial Measures - Income Statement |
| 41 | |
34 |
| TIER and Adjusted TIER |
| 42 | |
35 |
| Adjusted Financial Measures - Balance Sheet |
| 42 | |
36 |
| Debt-to-Equity Ratio |
| 43 | |
ii
PART I-FINANCIAL INFORMATION
Item 2. | Management's Discussion and Analysis of Financial Condition and Results of Operations ("MD&A " ) |
FORWARD-LOOKING STATEMENTS |
This Quarterly Report on Form 10-Q contains certain statements that are considered "forward-looking statements" within the Securities Act of 1933, as amended, and the Exchange Act of 1934, as amended. Forward-looking statements, which are based on certain assumptions and describe our future plans, strategies and expectations, are generally identified by our use of words such as "intend," "plan," "may," "should," "will," "project," "estimate," "anticipate," "believe," "expect," "continue," "potential," "opportunity" and similar expressions, whether in the negative or affirmative. All statements about future expectations or projections, including statements about loan volume, the appropriateness of the allowance for loan losses, operating income and expenses, debt-to-equity ratio, borrower financial performance, impaired loans, and sources and uses of liquidity, are forward-looking statements. Although we believe that the expectations reflected in our forward-looking statements are based on reasonable assumptions, actual results and performance may differ materially from our forward-looking statements due to several factors. Factors that could cause future results to vary from our forward-looking statements include, but are not limited to, general economic conditions, legislative changes including those that could affect our tax status, governmental monetary and fiscal policies, demand for our loan products, lending competition, changes in the quality or composition of our loan portfolio, changes in our ability to access external financing, changes in the credit ratings on our debt, valuation of collateral supporting impaired loans, charges associated with our operation or disposition of foreclosed assets, regulatory and economic conditions in the rural electric industry, nonperformance of counterparties to our derivative agreements, the costs and effects of legal or governmental proceedings involving us or our members and the factors listed and described under "Item 1A. Risk Factors" of our Annual Report on Form 10-K for the fiscal year ended May 31, 2017 (" 2017 Form 10-K"). Except as required by law, we undertake no obligation to update or publicly release any revisions to forward-looking statements to reflect events, circumstances or changes in expectations after the date on which the statement is made.
INTRODUCTION |
National Rural Utilities Cooperative Finance Corporation ("CFC") is a member-owned cooperative association incorporated under the laws of the District of Columbia in April 1969. CFC's principal purpose is to provide its members with financing to supplement the loan programs of the Rural Utilities Service ("RUS") of the United States Department of Agriculture ("USDA"). CFC makes loans to its rural electric members so they can acquire, construct and operate electric distribution, generation, transmission and related facilities. CFC also provides its members with credit enhancements in the form of letters of credit and guarantees of debt obligations. As a cooperative, CFC is owned by and exclusively serves its membership, which consists of not-for-profit entities or subsidiaries or affiliates of not-for-profit entities. CFC is exempt from federal income taxes under Section 501(c)(4) of the Internal Revenue Code. As a member-owned cooperative, CFC's objective is not to maximize profit, but rather to offer its members cost-based financial products and services. CFC funds its activities primarily through a combination of public and private issuances of debt securities, member investments and retained equity. As a Section 501(c)(4) tax-exempt, member-owned cooperative, we cannot issue equity securities.
Our financial statements include the consolidated accounts of CFC, National Cooperative Services Corporation ("NCSC"), Rural Telephone Finance Cooperative ("RTFC") and subsidiaries created and controlled by CFC to hold foreclosed assets resulting from defaulted loans or bankruptcy. NCSC is a taxable member-owned cooperative that may provide financing to members of CFC, government or quasi-government entities which own electric utility systems that meet the Rural Electrification Act definition of "rural" and for-profit and nonprofit entities that are owned, operated or controlled by, or provide significant benefits to certain members of CFC. RTFC is a taxable Subchapter T cooperative association that provides financing for its rural telecommunications members and their affiliates. CFC did not have any entities that held foreclosed assets as of November 30, 2017 or May 31, 2017 . See "Item 1. Business-Overview" of our 2017 Form 10-K for additional information on the business activities of each of these entities. Unless stated otherwise, references to "we," "our" or "us" relate to CFC and its consolidated entities. All references to members within this document include members, associates and affiliates of CFC and its consolidated entities.
1
Management monitors a variety of key indicators to evaluate our business performance. The following MD&A is intended to provide the reader with an understanding of our results of operations, financial condition and liquidity by discussing the drivers of changes from period to period and the key measures used by management to evaluate performance, such as net interest income, net interest yield, loan growth, debt-to-equity ratio, growth and credit quality metrics. MD&A is provided as a supplement to, and should be read in conjunction with our unaudited condensed consolidated financial statements and related notes in this Report, our audited consolidated financial statements and related notes in our 2017 Form 10-K and additional information contained in our 2017 Form 10-K, including the risk factors discussed under "Part I-Item 1A. Risk Factors," as well as any risk factors identified under "Part II-Item 1A. Risk Factors" in this Report.
SUMMARY OF SELECTED FINANCIAL DATA |
Table 1 provides a summary of consolidated selected financial data for the three and six months ended November 30, 2017 and 2016 , and as of November 30, 2017 and May 31, 2017 . In addition to financial measures determined in accordance with generally accepted accounting principles in the United States ("GAAP"), management also evaluates performance based on certain non-GAAP measures and metrics, which we refer to as "adjusted" measures. Certain financial covenant provisions in our credit agreements are also based on non-GAAP financial measures. Our key non-GAAP financial measures are adjusted net income, adjusted net interest income, adjusted interest expense, adjusted net interest yield, adjusted times interest earned ratio ("adjusted TIER") and adjusted debt-to-equity ratio. The most comparable GAAP measures are net income, net interest income, interest expense, net interest yield, TIER and debt-to-equity ratio, respectively. The primary adjustments we make to calculate these non-GAAP measures consist of (i) adjusting interest expense and net interest income to include the impact of net periodic derivative cash settlements; (ii) adjusting net income, senior debt and total equity to exclude the non-cash impact of the accounting for derivative financial instruments; (iii) adjusting senior debt to exclude the amount that funds CFC member loans guaranteed by RUS, subordinated deferrable debt and members' subordinated certificates; and (iv) adjusting total equity to include subordinated deferrable debt and members' subordinated certificates and exclude cumulative derivative forward value gains and losses and accumulated other comprehensive income. We believe our non-GAAP adjusted measures, which are not a substitute for GAAP and may not be consistent with similarly titled non-GAAP measures used by other companies, provide meaningful information and are useful to investors because management evaluates performance based on these metrics, and certain financial covenants in our committed bank revolving line of credit agreements and debt indentures are based on adjusted measures. See "Non-GAAP Financial Measures" for a detailed reconciliation of these adjusted measures to the most comparable GAAP measures.
Table 1 : Summary of Selected Financial Data
|
| Three Months Ended November 30, |
|
|
| Six Months Ended November 30, |
|
| ||||||||||||
(Dollars in thousands) |
| 2017 |
| 2016 |
| Change |
| 2017 |
| 2016 |
| Change | ||||||||
Statement of operations |
|
|
|
|
|
|
|
|
|
|
|
| ||||||||
Interest income |
| $ | 265,823 | |
| $ | 257,156 | |
| 3% |
| $ | 531,738 | |
| $ | 513,991 | |
| 3% |
Interest expense |
| (195,170 | ) |
| (183,654 | ) |
| 6 |
| (387,901 | ) |
| (364,734 | ) |
| 6 | ||||
Net interest income |
| 70,653 | |
| 73,502 | |
| (4) |
| 143,837 | |
| 149,257 | |
| (4) | ||||
Fee and other income |
| 5,542 | |
| 5,097 | |
| 9 |
| 9,487 | |
| 9,627 | |
| (1) | ||||
Total net revenue |
| 76,195 | |
| 78,599 | |
| (3) |
| 153,324 | |
| 158,884 | |
| (3) | ||||
Benefit (provision) for loan losses |
| 304 | |
| (738 | ) |
| ** |
| 602 | |
| (2,666 | ) |
| ** | ||||
Derivative gains (1) |
| 125,593 | |
| 340,660 | |
| (63) |
| 79,395 | |
| 152,367 | |
| (48) | ||||
Results of operations of foreclosed assets |
| (10 | ) |
| (549 | ) |
| (98) |
| (34 | ) |
| (1,661 | ) |
| (98) | ||||
Operating expenses (2) |
| (21,914 | ) |
| (20,632 | ) |
| 6 |
| (43,550 | ) |
| (41,491 | ) |
| 5 | ||||
Other non-interest expense |
| (618 | ) |
| (517 | ) |
| 20 |
| (1,140 | ) |
| (960 | ) |
| 19 | ||||
Income before income taxes |
| 179,550 | |
| 396,823 | |
| (55) |
| 188,597 | |
| 264,473 | |
| (29) | ||||
Income tax expense |
| (827 | ) |
| (1,519 | ) |
| (46) |
| (859 | ) |
| (1,430 | ) |
| (40) | ||||
Net income |
| $ | 178,723 | |
| $ | 395,304 | |
| (55) |
| $ | 187,738 | |
| $ | 263,043 | |
| (29) |
2
|
| Three Months Ended November 30, |
|
|
| Six Months Ended November 30, |
|
| ||||||||||||
|
| 2017 |
| 2016 |
| Change |
| 2017 | | 2016 |
| Change | ||||||||
Adjusted operational financial measures |
|
|
|
|
|
|
|
|
|
|
|
| ||||||||
Adjusted interest expense (3) |
| $ | (214,805 | ) |
| $ | (205,241 | ) |
| 5% |
| $ | (427,758 | ) |
| $ | (409,711 | ) |
| 4% |
Adjusted net interest income (3) |
| 51,018 | |
| 51,915 | |
| (2) |
| 103,980 | |
| 104,280 | |
| - | ||||
Adjusted net income (3) |
| 33,495 | |
| 33,057 | |
| 1 |
| 68,486 | |
| 65,699 | |
| 4 | ||||
|
|
|
|
|
|
|
|
|
|
|
|
| ||||||||
Selected ratios |
|
|
|
|
|
|
|
|
|
|
|
| ||||||||
Fixed-charge coverage ratio/TIER (4) |
| 1.92 | |
| 3.15 | |
| (123) bps |
| 1.48 | |
| 1.72 | |
| (24) bps | ||||
Adjusted TIER (3) |
| 1.16 | |
| 1.16 | |
| - |
| 1.16 | |
| 1.16 | |
| - | ||||
Net interest yield (5) |
| 1.12 | % |
| 1.21 | % |
| (9) |
| 1.14 | % |
| 1.23 | % |
| (9) | ||||
Adjusted net interest yield (3)(6) |
| 0.81 | |
| 0.86 | |
| (5) |
| 0.83 | |
| 0.86 | |
| (3) | ||||
Net charge-off rate (7) |
| - | |
| - | |
| - |
| - | |
| 0.02 | |
| (2) | ||||
|
|
|
|
|
|
|
|
|
|
|
|
| ||||||||
|
|
|
|
|
|
|
| November 30, 2017 |
| May 31, 2017 |
| Change | ||||||||
Balance sheet |
|
|
|
|
|
|
|
|
|
|
|
| ||||||||
Cash and cash equivalents |
|
|
|
|
|
|
| $ | 280,315 | |
| $ | 166,615 | |
| 68% | ||||
Investment securities |
|
|
|
|
|
|
| 339,566 | |
| 92,554 | |
| 267 | ||||||
Loans to members (8) |
|
|
|
|
|
|
| 24,824,691 | |
| 24,367,044 | |
| 2 | ||||||
Allowance for loan losses |
|
|
|
|
|
|
| (36,774 | ) |
| (37,376 | ) |
| (2) | ||||||
Loans to members, net |
|
|
|
|
|
|
| 24,787,917 | |
| 24,329,668 | |
| 2 | ||||||
Total assets |
|
|
|
|
|
|
| 25,880,243 | |
| 25,205,692 | |
| 3 | ||||||
Short-term borrowings |
|
|
|
|
|
|
| 3,557,192 | |
| 3,342,900 | |
| 6 | ||||||
Long-term debt |
|
|
|
|
|
|
| 18,386,819 | |
| 17,955,594 | |
| 2 | ||||||
Subordinated deferrable debt |
|
|
|
|
|
|
| 742,341 | |
| 742,274 | |
| - | ||||||
Members' subordinated certificates |
|
|
|
|
|
|
| 1,399,675 | |
| 1,419,025 | |
| (1) | ||||||
Total debt outstanding |
|
|
|
|
|
|
| 24,086,027 | |
| 23,459,793 | |
| 3 | ||||||
Total liabilities |
|
|
|
|
|
|
| 24,640,195 | |
| 24,106,887 | |
| 2 | ||||||
Total equity |
|
|
|
|
|
|
| 1,240,048 | |
| 1,098,805 | |
| 13 | ||||||
Guarantees (9) |
|
|
|
|
|
|
| 662,496 | |
| 889,617 | |
| (26) | ||||||
|
|
|
|
|
|
|
|
|
|
|
|
| ||||||||
Selected ratios period end |
|
|
|
|
|
|
|
|
|
|
| | ||||||||
Allowance coverage ratio (10) |
|
|
|
|
|
|
| 0.15 | % |
| 0.15 | % |
| - | ||||||
Debt-to-equity ratio (11) |
|
|
|
|
|
|
| 19.87 | |
| 21.94 | |
| (207) | ||||||
Adjusted debt-to-equity ratio (3) |
|
|
|
|
|
|
| 6.12 | |
| 5.95 | |
| 17 | ||||||
** Change is not meaningful.
(1) Consists of derivative cash settlements and derivative forward value gains (losses). Derivative cash settlement amounts represent net periodic contractual interest accruals related to derivatives not designated for hedge accounting. Derivative forward value gains (losses) represent changes in fair value during the period, excluding net periodic contractual interest accruals, related to derivatives not designated for hedge accounting and expense amounts reclassified into income related to the cumulative transition loss recorded in accumulated other comprehensive income as of June 1, 2001, as a result of the adoption of the derivative accounting guidance that required derivatives to be reported at fair value on the balance sheet.
(2) Consists of salaries and employee benefits and the other general and administrative expenses components of non-interest expense, each of which are presented separately on our consolidated statements of operations.
(3) See "Non-GAAP Financial Measures" for details on the calculation of these non-GAAP adjusted measures and the reconciliation to the most comparable GAAP measures.
(4) Calculated based on net income (loss) plus interest expense for the period divided by interest expense for the period. The fixed-charge coverage ratios and TIER were the same during each period presented because we did not have any capitalized interest during these periods.
(5) Calculated based on annualized net interest income for the period divided by average interest-earning assets for the period.
(6) Calculated based on annualized adjusted net interest income for the period divided by average interest-earning assets for the period.
3
(7) Calculated based on annualized net charge-offs (recoveries) for the period divided by average total outstanding loans for the period.
(8) Consists of the outstanding principal balance of member loans plus unamortized deferred loan origination costs, which totaled $11 million as of both November 30, 2017 and May 31, 2017 .
(9) Reflects the total amount of member obligations for which CFC has guaranteed payment to a third party as of the end of each period. This amount represents our maximum exposure to loss, which significantly exceeds the guarantee liability recorded on our consolidated balance sheets. See "Note 10-Guarantees" for additional information.
(10) Calculated based on the allowance for loan losses at period end divided by total outstanding loans at period end.
(11) Calculated based on total liabilities at period end divided by total equity at period end.
EXECUTIVE SUMMARY |
Our primary objective as a member-owned cooperative lender is to provide cost-based financial products to our rural electric members while maintaining a sound financial position required for investment-grade credit ratings on our debt instruments. Our objective is not to maximize net income; therefore, the rates we charge our member-borrowers reflect our adjusted interest expense plus a spread to cover our operating expenses, a provision for loan losses and earnings sufficient to achieve interest coverage to meet our financial objectives. Our goal is to earn an annual minimum adjusted TIER of 1.10 and to maintain an adjusted debt-to-equity ratio at approximately or below 6.00-to-1.
We are subject to period-to-period volatility in our reported GAAP results due to changes in market conditions and differences in the way our financial assets and liabilities are accounted for under GAAP. Our financial assets and liabilities expose us to interest-rate risk. We use derivatives, primarily interest rate swaps, as part of our strategy in managing this risk. Our derivatives are intended to economically hedge and manage the interest-rate sensitivity mismatch between our financial assets and liabilities. We are required under GAAP to carry derivatives at fair value on our consolidated balance sheet; however, the financial assets and liabilities for which we use derivatives to economically hedge are carried at amortized cost. Changes in interest rates and spreads result in periodic fluctuations in the fair value of our derivatives, which may cause volatility in our earnings because we do not apply hedge accounting. As a result, the mark-to-market changes in our derivatives are recorded in earnings. Based on the composition of our derivatives, we generally record derivative losses in earnings when interest rates decline and derivative gains when interest rates rise. This earnings volatility generally is not indicative of the underlying economics of our business, as the derivative forward fair value gains or losses recorded each period may or may not be realized over time, depending on the terms of our derivative instruments and future changes in market conditions that impact actual derivative cash settlement amounts. As such, management uses our adjusted non- GAAP results, which include realized net periodic derivative settlements but exclude the impact of unrealized derivative forward fair value gains and losses, to evaluate our operating performance. Because derivative forward fair value gains and losses do not impact our cash flows, liquidity or ability to service our debt costs, our financial debt covenants are also based on our non-GAAP adjusted results.
Financial Performance
Reported Results
We reported net income of $179 million and a TIER of 1.92 for the quarter ended November 30, 2017 ("current quarter"), compared with a net income of $395 million and a TIER of 3.15 for the same prior-year quarter. We reported net income of $188 million and a TIER of 1.48 for the six months ended November 30, 2017 , compared with a net income of $263 million and a TIER of 1.72 for the same prior-year period. Our debt-to-equity ratio decreased to 19.87 -to-1 as of November 30, 2017 , from 21.94 -to-1 as of May 31, 2017 , primarily due to an increase in equity resulting from our reported net income of $188 million for the six months ended November 30, 2017 , which was partially offset by patronage capital retirement of $45 million in September 2017.
The variance of $217 million between our reported net income of $179 million in the current quarter and our net income of $395 million for the same prior-year quarter was driven primarily by mark-to-market changes in the fair value of our derivatives. We recognized derivative gains of $126 million in the current quarter, which were largely attributable to a net increase in the fair value of our pay-fixed swaps as interest rates increased across the yield curve. In comparison, we recognized derivative gains of $341 million in the same prior-year quarter, attributable to a net increase in the fair value of our pay-fixed swaps due to an increase in medium-term and longer-term interest rates and a general steepening of the yield curve. In addition, we experienced a decrease in net interest income of $3 million as a result of compression in the net
4
interest yield and an increase in operating expenses of $1 million , which were partially offset by a favorable shift in the provision for loan losses of $1 million . Our net interest yield was 1.12% for the current quarter, a decrease of 9 basis points from the same prior-year quarter due to an increase in our cost of funds.
The variance of $75 million between our reported net income of $188 million for the six months ended November 30, 2017 and our net income of $263 million for the same prior-year period was also driven primarily by mark-to-market changes in the fair value of our derivatives. We recognized derivative gains of $79 million for the six months ended November 30, 2017 , largely due to the increase in interest rates across the yield curve. In comparison, we recognized derivative gains of $152 million in the same prior-year period, attributable to the increase in medium-term and longer-term interest rates during the period. In addition, we experienced a decrease in net interest income of $5 million due to the compression in the net interest yield and an increase in operating expenses of $2 million , which were partially offset by a favorable shift in the provision for loan losses of $3 million . Our net interest yield was 1.14% for the six months ended November 30, 2017 , a decrease of 9 basis points from the same prior-year period due to an increase in our cost of funds.
Adjusted Non-GAAP Results
Our adjusted net income totaled $33 million and our adjusted TIER was 1.16 for both the current quarter and the same prior-year quarter. Our adjusted net income totaled $68 million and adjusted TIER was 1.16 for the six months ended November 30, 2017 , compared with adjusted net income of $66 million and adjusted TIER of 1.16 for the same prior-year period. Our adjusted debt-to-equity ratio increased to 6.12 -to-1 as of November 30, 2017 , from 5.95 -to-1 as of May 31, 2017 , largely due to an increase in debt outstanding to fund loan growth.
While adjusted net income for the current quarter and six months ended November 30, 2017 remained relatively unchanged from the same prior-year periods, adjusted net interest income decreased slightly due to compression in the adjusted net interest yield resulting from an increase in our cost of funds. The combined impact of the decrease in adjusted net interest income and the increase in operating expenses was offset by the favorable shift in the provision for loan losses. Our adjusted net interest yield was 0.81% and 0.83% for current quarter and the six months ended November 30, 2017 , respectively, a decrease of 5 basis points and 3 basis points, respectively, from the same prior-year period due to an increase in our adjusted cost of funds.
Lending Activity
Loans to members totaled $24,825 million as of November 30, 2017 , an increase of $458 million , or 2% , from May 31, 2017 . The increase was primarily due to an increase in CFC distribution loans of $405 million , an increase in NCSC loans of $126 million and an increase in RTFC loans of $17 million , which were partially offset by a decrease in CFC power supply loans of $91 million .
Long-term loan advances totaled $1,127 million during the six months ended November 30, 2017 , with approximately 58% of those advances for capital expenditures by members and 31% for the refinancing of loans made by other lenders. CFC had long-term fixed-rate loans totaling $519 million that were scheduled to reprice during the six months ended November 30, 2017 . Of this total, $441 million repriced to a new long-term fixed rate, $78 million repriced to a long-term variable rate and $1 million were repaid in full.
Financing Activity
Our outstanding debt volume generally increases and decreases in response to member loan demand. As total outstanding loans increased during the six months ended November 30, 2017 , our debt volume also increased. Total debt outstanding was $24,086 million as of November 30, 2017 , an increase of $626 million , or 3% , from May 31, 2017 . The increase was primarily attributable to a net increase in member commercial paper and daily liquidity fund notes of $543 million , a net increase in dealer medium-term notes of $394 million and a net increase in notes payable to the Federal Financing Bank under the Guaranteed Underwriter Program of the USDA ("Guaranteed Underwriter Program") of $74 million . These increases were partially offset by a net decrease in dealer commercial paper outstanding of $420 million .
On November 9, 2017, we closed on a $750 million committed loan facility ("Series M") from the Federal Financing Bank under the Guaranteed Underwriter Program. Pursuant to this facility, we may borrow any time before July 15, 2022. Each
5
advance is subject to quarterly amortization and a final maturity not longer than 20 years from the advance date. With the closing of this committed loan facility, the amount available for access under the Guaranteed Underwriter Program increased to $1,375 million as of November 30, 2017 .
On November 20, 2017 , we amended and restated the three-year and five-year committed bank revolving line of credit agreements to extend the maturity dates to November 20, 2020 and November 20, 2022 , respectively, and to terminate certain third-party bank commitments totaling $40 million under the three-year agreement and $40 million under the five-year agreement. The total commitment amount from third-parties under the amended three-year and five-year bank revolving line of credit agreements is $1,493 million and $1,592 million , respectively, resulting in a combined total commitment amount under the two facilities of $3,085 million .
We provide additional information on our financing activities below under "Consolidated Balance Sheet Analysis-Debt" and "Liquidity Risk."
Outlook for the Next 12 Months
We currently expect the amount of long-term loan advances to exceed anticipated loan repayments over the next 12 months. We have scheduled maturities of higher-cost debt over the next 12 months, including $1,875 million in collateral trust bonds with a weighted average coupon rate of 8.18%. We expect that we will be able to replace this higher-cost debt with lower-cost funding, which will reduce our aggregate weighted average funding cost. As a result of the anticipated decrease in our funding cost, we expect that our net interest income, net interest yield, adjusted net interest income and adjusted net interest yield will increase.
Long-term debt scheduled to mature over the next 12 months totaled $2,880 million as of November 30, 2017 . In addition, during the third quarter of fiscal year 2018 we expect to redeem $325 million of long-term debt prior to maturity. We believe we have sufficient liquidity from the combination of existing cash, member loan repayments, committed bank revolving lines of credit and our ability to issue debt in the capital markets, to our members and in private placements, to meet the demand for member loan advances and satisfy our obligations to repay long-term debt maturing over the next 12 months. As of November 30, 2017 , we had access to liquidity reserves totaling $7,047 million , which consisted of (i) $280 million in cash and cash equivalents (ii) up to $1,375 million available under committed loan facilities under the Guaranteed Underwriter Program, (iii) up to $3,083 million available under committed bank revolving line of credit agreements, (iv) up to $300 million available under a committed revolving note purchase agreement with Farmer Mac, and (v) up to $2,009 million available under a revolving note purchase agreement with Farmer Mac, subject to market conditions.
We believe we can continue to roll over outstanding member short-term debt of $2,977 million as of November 30, 2017 , based on our expectation that our members will continue to reinvest their excess cash in our commercial paper, daily liquidity fund, select notes and medium-term notes. Although we expect to continue accessing the dealer commercial paper market to help meet our liquidity needs, we intend to manage our short-term wholesale funding risk by maintaining outstanding dealer commercial paper at an amount below $1,250 million for the foreseeable future. We expect to continue to be in compliance with the covenants under our committed bank revolving line of credit agreements, which will allow us to mitigate our roll-over risk as we can draw on these facilities to repay dealer or member commercial paper that cannot be
rolled over.
While we are not subject to bank regulatory capital rules, we generally aim to maintain an adjusted debt-to-equity ratio at approximately or below 6.00-to-1. Our adjusted debt-to-equity ratio was 6.12 as of November 30, 2017 , above our targeted threshold due to the increase in debt outstanding to fund loan growth. Due to anticipated asset growth, we expect our adjusted debt-to-equity ratio to be above 6.00-to-1 over the next 12 months.
CRITICAL ACCOUNTING POLICIES AND ESTIMATES |
The preparation of financial statements in accordance with GAAP requires management to make a number of judgments, estimates and assumptions that affect the amount of assets, liabilities, income and expenses in the consolidated financial statements. Understanding our accounting policies and the extent to which we use management's judgment and estimates in
6
applying these policies is integral to understanding our financial statements. We provide a discussion of our significant accounting policies under "Note 1-Summary of Significant Accounting Policies" in our 2017 Form 10-K.
We have identified certain accounting policies as critical because they involve significant judgments and assumptions about highly complex and inherently uncertain matters, and the use of reasonably different estimates and assumptions could have a material impact on our results of operations or financial condition. Our most critical accounting policies and estimates involve the determination of the allowance for loan losses and fair value. We evaluate our critical accounting estimates and judgments required by our policies on an ongoing basis and update them as necessary based on changing conditions. There were no material changes in the key inputs and assumptions used in our critical accounting policies during the six months ended November 30, 2017 . Management has discussed significant judgments and assumptions in applying our critical accounting policies with the Audit Committee of our board of directors. We provide additional information on our critical accounting policies and estimates under "MD&A-Critical Accounting Policies and Estimates" in our 2017 Form 10-K. See "Item 1A. Risk Factors" in our 2017 Form 10-K for a discussion of the risks associated with management's judgments and estimates in applying our accounting policies and methods.
ACCOUNTING CHANGES AND OTHER DEVELOPMENTS |
See "Note 1-Summary of Significant Accounting Policies" for information on accounting standards adopted during the current quarter, as well as recently issued accounting standards not yet required to be adopted and the expected impact of these accounting standards. To the extent we believe the adoption of new accounting standards has had or will have a material impact on our consolidated results of operations, financial condition or liquidity, we discuss the impact in the applicable section(s) of this MD&A. We also discuss the expected impact of H.R. 1, the Tax Cuts and Jobs Act ("The Act"), which the President of the United States signed and enacted into law on December 22, 2017.
CONSOLIDATED RESULTS OF OPERATIONS |
The section below provides a comparative discussion of our condensed consolidated results of operations between the three months ended November 30, 2017 and 2016 and the six months ended November 30, 2017 and 2016 . Following this section, we provide a comparative analysis of our condensed consolidated balance sheets as of November 30, 2017 and May 31, 2017 . You should read these sections together with our "Executive Summary-Outlook for the Next 12 Months" where we discuss trends and other factors that we expect will affect our future results of operations.
Net Interest Income
Net interest income represents the difference between the interest income earned on our interest-earning assets, which include loans and investment securities, and the interest expense on our interest-bearing liabilities. Our net interest yield represents the difference between the yield on our interest-earning assets and the cost of our interest-bearing liabilities plus the impact from non-interest bearing funding. We expect net interest income and our net interest yield to fluctuate based on changes in interest rates and changes in the amount and composition of our interest-earning assets and interest-bearing liabilities. We do not fund each individual loan with specific debt. Rather, we attempt to minimize costs and maximize efficiency by funding large aggregated amounts of loans.
Table 2 presents our average balance sheets for the three and six months ended November 30, 2017 and 2016 , and for each major category of our interest-earning assets and interest-bearing liabilities, the interest income earned or interest expense incurred, and the average yield or cost. Table 2 also presents non-GAAP adjusted interest expense, adjusted net interest income and adjusted net interest yield, which reflect the inclusion of net accrued periodic derivative cash settlements in interest expense. We provide reconciliations of our non-GAAP adjusted measures to the most comparable GAAP measures under "Non-GAAP Financial Measures."
7
Table 2 : Average Balances, Interest Income/Interest Expense and Average Yield/Cost
|
| Three Months Ended November 30, | ||||||||||||||||||||
(Dollars in thousands) |
| 2017 |
| 2016 | ||||||||||||||||||
Assets: |
| Average Balance |
| Interest Income/Expense |
| Average Yield/Cost |
| Average Balance |
| Interest Income/Expense |
| Average Yield/Cost | ||||||||||
Long-term fixed-rate loans (1) |
| $ | 22,458,429 | |
| $ | 248,926 | |
| 4.45 | % |
| $ | 21,772,579 | |
| $ | 243,817 | |
| 4.49 | % |
Long-term variable-rate loans |
| 886,257 | |
| 6,097 | |
| 2.76 | |
| 751,460 | |
| 4,987 | |
| 2.66 | | ||||
Line of credit loans |
| 1,330,776 | |
| 8,588 | |
| 2.59 | |
| 1,046,826 | |
| 5,553 | |
| 2.13 | | ||||
TDR loans (2) |
| 12,929 | |
| 222 | |
| 6.89 | |
| 13,505 | |
| 231 | |
| 6.86 | | ||||
Other income, net (3) |
| - | |
| (306 | ) |
| - | |
| - | |
| (281 | ) |
| - | | ||||
Total loans |
| 24,688,391 | |
| 263,527 | |
| 4.28 | |
| 23,584,370 | |
| 254,307 | |
| 4.32 | | ||||
Cash, time deposits and investment securities |
| 528,158 | |
| 2,296 | |
| 1.74 | |
| 761,354 | |
| 2,849 | |
| 1.50 | | ||||
Total interest-earning assets |
| $ | 25,216,549 | |
| $ | 265,823 | |
| 4.23 | % |
| $ | 24,345,724 | |
| $ | 257,156 | |
| 4.24 | % |
Other assets, less allowance for loan losses |
| 526,627 | |
|
|
|
|
| 624,014 | |
|
|
|
| ||||||||
Total assets |
| $ | 25,743,176 | |
|
|
|
|
| $ | 24,969,738 | |
|
|
|
| ||||||
|
|
|
|
|
|
|
|
|
|
|
|
| ||||||||||
Liabilities: |
|
|
|
|
|
|
|
|
|
|
|
| ||||||||||
Short-term debt |
| $ | 2,998,298 | |
| $ | 10,116 | |
| 1.35 | % |
| $ | 3,037,831 | |
| $ | 5,409 | |
| 0.71 | % |
Medium-term notes |
| 3,375,389 | |
| 27,544 | |
| 3.27 | |
| 3,399,885 | |
| 24,705 | |
| 2.91 | | ||||
Collateral trust bonds |
| 7,637,919 | |
| 85,321 | |
| 4.48 | |
| 7,256,608 | |
| 84,951 | |
| 4.70 | | ||||
Guaranteed Underwriter Program notes payable |
| 5,066,574 | |
| 35,688 | |
| 2.83 | |
| 4,862,958 | |
| 36,216 | |
| 2.99 | | ||||
Farmer Mac notes payable |
| 2,496,587 | |
| 11,947 | |
| 1.92 | |
| 2,288,013 | |
| 7,587 | |
| 1.33 | | ||||
Other notes payable |
| 35,295 | |
| 391 | |
| 4.44 | |
| 41,026 | |
| 458 | |
| 4.48 | | ||||
Subordinated deferrable debt |
| 742,319 | | | 9,417 | |
| 5.09 | |
| 742,187 | | | 9,411 | |
| 5.09 | | ||||
Subordinated certificates |
| 1,415,352 | |
| 14,746 | |
| 4.18 | |
| 1,442,871 | |
| 14,917 | |
| 4.15 | | ||||
Total interest-bearing liabilities |
| $ | 23,767,733 | |
| $ | 195,170 | |
| 3.29 | % |
| $ | 23,071,379 | |
| $ | 183,654 | |
| 3.19 | % |
Other liabilities |
| 842,246 | |
|
|
|
|
| 1,101,635 | |
|
|
|
| ||||||||
Total liabilities |
| 24,609,979 | |
|
|
|
|
| 24,173,014 | |
|
|
|
| ||||||||
Total equity |
| 1,133,197 | |
|
|
|
|
| 796,724 | |
|
|
|
| ||||||||
Total liabilities and equity |
| $ | 25,743,176 | |
|
|
|
|
| $ | 24,969,738 | |
|
|
|
| ||||||
|
|
|
|
|
|
|
|
|
|
|
|
| ||||||||||
Net interest spread (4) |
|
|
|
|
| 0.94 | % |
|
|
|
|
| 1.05 | % | ||||||||
Impact of non-interest bearing funding (5) |
|
|
|
|
| 0.18 | |
|
|
|
|
| 0.16 | | ||||||||
Net interest income/net interest yield (6) |
|
|
| $ | 70,653 | |
| 1.12 | % |
|
|
| $ | 73,502 | |
| 1.21 | % | ||||
|
|
|
|
|
|
|
|
|
|
|
|
| ||||||||||
Adjusted net interest income/adjusted net interest yield: |
|
|
|
|
|
|
|
|
|
|
|
| ||||||||||
Interest income |
|
|
| $ | 265,823 | |
| 4.23 | % |
|
|
| $ | 257,156 | |
| 4.24 | % | ||||
Interest expense |
|
|
| 195,170 | |
| 3.29 | |
|
|
| 183,654 | |
| 3.19 | | ||||||
Add: Net accrued periodic derivative cash settlements (7) |
|
|
| 19,635 | |
| 0.72 | |
|
|
| 21,587 | |
| 0.81 | | ||||||
Adjusted interest expense/adjusted average cost (8) |
|
|
| $ | 214,805 | |
| 3.63 | % |
|
|
| $ | 205,241 | |
| 3.57 | % | ||||
|
|
|
|
|
|
|
|
|
|
|
|
| ||||||||||
Adjusted net interest spread (4) |
|
|
|
|
| 0.60 | % |
|
|
|
|
| 0.67 | % | ||||||||
Impact of non-interest bearing funding |
|
|
|
|
| 0.21 | |
|
|
|
|
| 0.19 | | ||||||||
Adjusted net interest income/adjusted net interest yield (9) |
|
|
| $ | 51,018 | |
| 0.81 | % |
|
|
| $ | 51,915 | |
| 0.86 | % | ||||
8
|
| Six Months Ended November 30, | ||||||||||||||||||||
(Dollars in thousands) |
| 2017 |
| 2016 | ||||||||||||||||||
Assets: |
| Average Balance |
| Interest Income/Expense |
| Average Yield/Cost |
| Average Balance |
| Interest Income/Expense |
| Average Yield/Cost | ||||||||||
Long-term fixed-rate loans (1) |
| $ | 22,414,622 | |
| $ | 498,290 | |
| 4.43 | % |
| $ | 21,698,651 | |
| $ | 487,945 | |
| 4.49 | % |
Long-term variable-rate loans |
| 864,494 | |
| 11,960 | |
| 2.76 | |
| 740,594 | |
| 9,514 | |
| 2.56 | | ||||
Line of credit loans |
| 1,342,124 | |
| 17,295 | |
| 2.57 | |
| 1,045,303 | |
| 11,519 | |
| 2.20 | | ||||
TDR loans (2) |
| 13,026 | |
| 448 | |
| 6.86 | |
| 15,374 | |
| 449 | |
| 5.83 | | ||||
Other income, net (3) |
| - | |
| (538 | ) |
| - | |
| - | |
| (565 | ) |
| - | | ||||
Total loans |
| 24,634,266 | |
| 527,455 | |
| 4.27 | |
| 23,499,922 | |
| 508,862 | |
| 4.32 | | ||||
Cash, time deposits and investment securities |
| 445,452 | |
| 4,283 | |
| 1.92 | |
| 687,575 | |
| 5,129 | |
| 1.49 | | ||||
Total interest-earning assets |
| $ | 25,079,718 | |
| $ | 531,738 | |
| 4.23 | % |
| $ | 24,187,497 | |
| $ | 513,991 | |
| 4.24 | % |
Other assets, less allowance for loan losses |
| 543,490 | |
|
|
|
|
| 643,236 | |
|
|
|
| ||||||||
Total assets |
| $ | 25,623,208 | |
| | |
|
|
| $ | 24,830,733 | |
| | |
| | | |||
|
|
|
|
|
|
|
|
|
|
|
|
| ||||||||||
Liabilities: |
|
|
| | |
| | |
| | |
| | |
| | | |||||
Short-term borrowings |
| $ | 3,111,502 | |
| $ | 20,655 | |
| 1.32 | % |
| $ | 2,980,748 | |
| $ | 10,291 | |
| 0.69 | % |
Medium-term notes |
| 3,192,063 | |
| 52,660 | |
| 3.29 | |
| 3,341,054 | |
| 48,290 | |
| 2.88 | | ||||
Collateral trust bonds |
| 7,636,669 | |
| 170,598 | |
| 4.46 | |
| 7,255,508 | |
| 170,000 | |
| 4.67 | | ||||
Guaranteed Underwriter Program notes payable |
| 5,030,955 | |
| 71,290 | |
| 2.83 | |
| 4,818,512 | |
| 71,988 | |
| 2.98 | | ||||
Farmer Mac notes payable |
| 2,502,096 | |
| 23,437 | |
| 1.87 | |
| 2,292,798 | |
| 14,486 | |
| 1.26 | | ||||
Other notes payable |
| 35,269 | |
| 781 | |
| 4.42 | |
| 40,996 | |
| 916 | |
| 4.46 | | ||||
Subordinated deferrable debt |
| 742,302 | |
| 18,833 | |
| 5.06 | |
| 742,171 | |
| 18,837 | |
| 5.06 | | ||||
Subordinated certificates |
| 1,416,619 | |
| 29,647 | |
| 4.17 | |
| 1,442,753 | |
| 29,926 | |
| 4.14 | | ||||
Total interest-bearing liabilities |
| $ | 23,667,475 | |
| $ | 387,901 | |
| 3.27 | % |
| $ | 22,914,540 | |
| $ | 364,734 | |
| 3.17 | % |
Other liabilities |
| 847,751 | |
|
|
| |
| 1,127,727 | |
| |
|
| ||||||||
Total liabilities |
| 24,515,226 | |
|
|
| |
| 24,042,267 | |
| |
|
| ||||||||
Total equity |
| 1,107,982 | |
|
|
|
|
| 788,466 | |
| |
|
| ||||||||
Total liabilities and equity |
| $ | 25,623,208 | |
| | |
|
|
| $ | 24,830,733 | |
| | |
|
| ||||
|
|
|
|
|
|
|
|
|
|
|
|
| ||||||||||
Net interest spread (4) |
|
|
| | |
| 0.96 | % |
| | |
| | |
| 1.07 | % | |||||
Impact of non-interest bearing funding (5) |
|
|
|
|
| 0.18 | |
|
|
|
|
| 0.16 | | ||||||||
Net interest income/net interest yield (6) |
|
|
| $ | 143,837 | |
| 1.14 | % |
|
|
| $ | 149,257 | |
| 1.23 | % | ||||
|
|
|
|
|
|
|
|
|
|
|
|
| ||||||||||
Adjusted net interest income/adjusted net interest yield: |
|
|
|
|
| | |
|
|
|
|
|
| |||||||||
Interest income |
|
|
| $ | 531,738 | |
| 4.23 | % |
|
|
| $ | 513,991 | |
| 4.24 | % | ||||
Interest expense |
|
|
| 387,901 | |
| 3.27 | |
|
|
| 364,734 | |
| 3.17 | | ||||||
Add: Net accrued periodic derivative cash settlements (7) |
|
|
| 39,857 | |
| 0.74 | |
|
|
| 44,977 | |
| 0.85 | | ||||||
Adjusted interest expense/adjusted average cost (8) |
|
|
| $ | 427,758 | |
| 3.60 | % |
| | |
| $ | 409,711 | |
| 3.57 | % | |||
|
|
|
|
|
|
|
|
|
|
|
|
| ||||||||||
Adjusted net interest spread (4) |
|
|
|
|
| 0.63 | % |
| |
|
|
| 0.67 | % | ||||||||
Impact of non-interest bearing funding |
|
|
|
|
| 0.20 | |
|
|
|
|
| 0.19 | | ||||||||
Adjusted net interest income/adjusted net interest yield (9) |
|
|
| $ | 103,980 | |
| 0.83 | % |
| |
| $ | 104,280 | | | 0.86 | % | ||||
____________________________
(1) Interest income on long-term, fixed-rate loans includes loan conversion fees, which are generally deferred and recognized as interest income using the effective interest method.
(2) Troubled debt restructuring ("TDR") loans.
(3) Consists of late payment fees and net amortization of deferred loan fees and loan origination costs.
9
(4) Net interest spread represents the difference between the average yield on interest-earning assets and the average cost of interest-bearing liabilities. Adjusted net interest spread represents the difference between the average yield on total interest-earning assets and the adjusted average cost of total interest-bearing liabilities.
(5) Includes other liabilities and equity.
(6) Net interest yield is calculated based on annualized net interest income for the period divided by total average interest-earning assets for the period.
(7) Represents the impact of net accrued periodic derivative cash settlements during the period, which is added to interest expense to derive non-GAAP adjusted interest expense. The average (benefit)/cost associated with derivatives is calculated based on annualized net accrued periodic derivative cash settlements during the period divided by the average outstanding notional amount of derivatives during the period. The average outstanding notional amount of derivatives was $ 10,902 million and $ 10,651 million for the three months ended November 30, 2017 and 2016, respectively. The average outstanding notional amount of derivatives was $ 10,791 million and $ 10,494 million for the six months ended November 30, 2017 and 2016 , respectively.
(8) Adjusted interest expense represents interest expense plus net accrued periodic derivative cash settlements during the period. Net accrued periodic derivative cash settlements are reported on our consolidated statements of operations as a component of derivative gains (losses). Adjusted average cost is calculated based on annualized adjusted interest expense for the period divided by total average interest-bearing liabilities during the period.
(9) Adjusted net interest yield is calculated based on annualized adjusted net interest income for the period divided by total average interest-earning assets for the period.
10
Table 3 displays the change in net interest income between periods and the extent to which the variance is attributable to: (i) changes in the volume of our interest-earning assets and interest-bearing liabilities or (ii) changes in the interest rates of these assets and liabilities. The table also presents the change in adjusted net interest income between periods.
|
| Three Months Ended November 30, |
| Six Months Ended November 30, | ||||||||||||||||||||
|
| 2017 versus 2016 |
| 2017 versus 2016 | ||||||||||||||||||||
|
|
|
| Variance due to: (1) |
|
|
| Variance due to: (1) | ||||||||||||||||
(Dollars in thousands) |
| Total Variance |
| Volume |
| Rate |
| Total Variance |
| Volume |
| Rate | ||||||||||||
Interest income: |
|
|
|
|
|
|
|
|
|
|
|
| ||||||||||||
Long-term fixed-rate loans |
| $ | 5,109 | |
| $ | 7,680 | |
| $ | (2,571 | ) |
| $ | 10,345 | |
| $ | 16,100 | |
| $ | (5,755 | ) |
Long-term variable-rate loans |
| 1,110 | |
| 895 | |
| 215 | |
| 2,446 | |
| 1,592 | |
| 854 | | ||||||
Line of credit loans |
| 3,035 | |
| 1,506 | |
| 1,529 | |
| 5,776 | |
| 3,271 | |
| 2,505 | | ||||||
Restructured loans |
| (9 | ) |
| (10 | ) |
| 1 | |
| (1 | ) |
| (69 | ) |
| 68 | | ||||||
Other income, net |
| (25 | ) |
| - | |
| (25 | ) |
| 27 | |
| - | |
| 27 | | ||||||
Total loans |
| 9,220 | |
| 10,071 | |
| (851 | ) |
| 18,593 | |
| 20,894 | |
| (2,301 | ) | ||||||
Cash, time deposits and investment securities |
| (553 | ) |
| (873 | ) |
| 320 | |
| (846 | ) |
| (1,806 | ) |
| 960 | | ||||||
Interest income |
| 8,667 | |
| 9,198 | |
| (531 | ) |
| 17,747 | |
| 19,088 | |
| (1,341 | ) | ||||||
|
|
|
|
|
|
|
|
|
|
|
|
| ||||||||||||
Interest expense: |
|
|
|
|
|
|
|
|
|
|
|
| ||||||||||||
Short-term borrowings |
| 4,707 | |
| (70 | ) |
| 4,777 | |
| 10,364 | |
| 451 | |
| 9,913 | | ||||||
Medium-term notes |
| 2,839 | |
| (178 | ) |
| 3,017 | |
| 4,370 | |
| (2,153 | ) |
| 6,523 | | ||||||
Collateral trust bonds |
| 370 | |
| 4,464 | |
| (4,094 | ) |
| 598 | |
| 8,931 | |
| (8,333 | ) | ||||||
Guaranteed Underwriter Program notes payable |
| (528 | ) |
| 1,518 | |
| (2,046 | ) |
| (698 | ) |
| 3,174 | |
| (3,872 | ) | ||||||
Farmer Mac notes payable |
| 4,360 | |
| 692 | |
| 3,668 | |
| 8,951 | |
| 1,322 | |
| 7,629 | | ||||||
Other notes payable |
| (67 | ) |
| (64 | ) |
| (3 | ) |
| (135 | ) |
| (128 | ) |
| (7 | ) | ||||||
Subordinated deferrable debt |
| 6 | |
| 2 | |
| 4 | |
| (4 | ) |
| 3 | |
| (7 | ) | ||||||
Subordinated certificates |
| (171 | ) |
| (285 | ) |
| 114 | |
| (279 | ) |
| (542 | ) |
| 263 | | ||||||
Interest expense |
| 11,516 | |
| 6,079 | |
| 5,437 | |
| 23,167 | |
| 11,058 | |
| 12,109 | | ||||||
Net interest income |
| $ | (2,849 | ) |
| $ | 3,119 | |
| $ | (5,968 | ) |
| $ | (5,420 | ) |
| $ | 8,030 | |
| $ | (13,450 | ) |
|
|
|
|
|
|
|
|
|
|
|
|
| ||||||||||||
Adjusted net interest income: |
|
|
|
|
|
|
|
|
|
|
|
| ||||||||||||
Interest income |
| $ | 8,667 | |
| $ | 9,198 | |
| $ | (531 | ) |
| $ | 17,747 | |
| $ | 19,088 | |
| $ | (1,341 | ) |
Interest expense |
| 11,516 | |
| 6,079 | |
| 5,437 | |
| 23,167 | |
| 11,058 | |
| 12,109 | | ||||||
Net accrued periodic derivative cash settlements (2) |
| (1,952 | ) |
| 508 | |
| (2,460 | ) |
| (5,120 | ) |
| 1,276 | |
| (6,396 | ) | ||||||
Adjusted interest expense (3) |
| 9,564 | |
| 6,587 | |
| 2,977 | |
| 18,047 | |
| 12,334 | |
| 5,713 | | ||||||
Adjusted net interest income |
| $ | (897 | ) |
| $ | 2,611 | |
| $ | (3,508 | ) |
| $ | (300 | ) |
| $ | 6,754 | |
| $ | (7,054 | ) |
____________________________
(1) The changes for each category of interest income and interest expense are divided between the portion of change attributable to the variance in volume and the portion of change attributable to the variance in rate for that category. The amount attributable to the combined impact of volume and rate has been allocated to each category based on the proportionate absolute dollar amount of change for that category.
(2) For net accrued periodic derivative cash settlements, the variance due to average volume represents the change in derivative cash settlements resulting from the change in the average notional amount of derivative contracts outstanding. The variance due to average rate represents the change in derivative cash settlements resulting from the net difference between the average rate paid and the average rate received for interest rate swaps during the period.
(3) See "Non-GAAP Financial Measures" for additional information on our adjusted non-GAAP measures.
11
Net interest income of $71 million for the current quarter decreased by $3 million , or 4% , from the same prior-year quarter, driven by a decrease in net interest yield of 7% ( 9 basis points) to 1.12% , which was partially offset by an increase in average interest-earning assets of 4% .
Net interest income of $144 million for the six months ended November 30, 2017 decreased by $5 million , or 4% , from the same prior-year period, driven by a decrease in net interest yield of 7% ( 9 basis points) to 1.14% , which was partially offset by an increase in average interest-earning assets of 4% .
• | Average Interest-Earning Assets: The increase in average interest-earning assets for the current quarter and six months ended November 30, 2017 was primarily attributable to growth in average total loans of $1,104 million , or 5% and $1,134 million , or 5% , respectively, over the same prior-year periods, as members obtained advances to fund capital investments and refinanced with us loans made by other lenders. |
• | Net Interest Yield: The decrease in the net interest yield for the current quarter and six months ended November 30, 2017 was largely due to an increase in our average cost of funds, as the average yield on interest-earning assets remained relatively stable. Our average cost of funds increased by 10 basis points during both the current quarter and six months ended November 30, 2017 to 3.29% and 3.27% , respectively, largely due to increases in the cost of our short-term and variable-rate debt resulting from an increase in short-term interest rates. The 3-month London Interbank Offered Rate ("LIBOR") was 1.49% as of November 30, 2017 , an increase of 55 basis points from the same prior-year period, while the federal funds rate ranged from 1.00% to 1.25% as November 30, 2017 , up 75 basis points from the end of the same prior-year period. |
Adjusted net interest income of $51 million for the current quarter decreased by $1 million , or 2% , from the same prior-year quarter, driven by a decrease in the adjusted net interest yield of 6% ( 5 basis points) to 0.81% , which was partially offset by an increase in average interest-earning assets of 4% . The decrease in the adjusted net interest yield was primarily attributable to an increase in the adjusted average cost of funds of 6 basis points to 3.63% .
Adjusted net interest income of $104 million for the six months ended November 30, 2017 was flat compared to the same prior-year period. The decrease in the adjusted net interest yield of 3% ( 3 basis points) to 0.83% was offset by an increase in average interest-earning assets of 4% . The decrease in the adjusted net interest yield was primarily attributable to an increase in the adjusted average cost of funds of 3 basis points to 3.60% .
Our adjusted net interest income and adjusted net interest yield include the impact of net accrued periodic derivative cash settlements during the period. We recorded net periodic derivative cash settlement expense of $20 million and $22 million for the three months ended November 30, 2017 and 2016, respectively, and $40 million and $45 million for the six months ended November 30, 2017 and 2016 , respectively. See "Non-GAAP Financial Measures" for additional information on our adjusted measures.
Provision for Loan Losses
Our provision for loan losses in each period is primarily driven by the level of allowance that we determine is necessary for probable incurred loan losses inherent in our loan portfolio as of each balance sheet date.
We recorded a benefit for loan losses of less than $1 million for the current quarter and $1 million for the six months ended November 30, 2017 , respectively, compared with a provision for loan losses of $1 million and $3 million , respectively, for the same prior-year periods. The credit quality and performance statistics of our loan portfolio continued to remain strong. We experienced no charge-offs during the three and six months ended November 30, 2017 and we had no loans classified as nonperforming as of the end of the period. In comparison, we recorded a net charge-off of $2 million during the six months ended November 30, 2016 .
We provide additional information on our allowance for loan losses under "Credit Risk-Allowance for Loan Losses" and "Note 4-Loans and Commitments" of this Report. For additional information on our allowance methodology, see "MD&A-Critical Accounting Policies and Estimates" and "Note 1-Summary of Significant Accounting Policies" in our 2017 Form 10-K.
12
Non-Interest Income
Non-interest income consists of fee and other income, gains and losses on derivatives not accounted for in hedge accounting relationships and results of operations of foreclosed assets.
We recorded non-interest income of $131 million and $89 million for the three and six months ended November 30, 2017 , respectively. In comparison, we recorded non-interest income of $345 million and $160 million for the three and six months ended November 30, 2016 , respectively. The significant variances in non-interest income for the three and six months ended November 30, 2017 from the same prior year periods were primarily attributable to changes in net derivative gains recognized in our consolidated statements of operations.
Table 4 presents the components of non-interest income recorded in our condensed consolidated results of operations for the three and six months ended November 30, 2017 and 2016 .
Table 4 : Non-Interest Income
|
| Three Months Ended November 30, |
| Six Months Ended November 30, | ||||||||||||
(Dollars in thousands) |
| 2017 |
| 2016 |
| 2017 | | 2016 | ||||||||
Non-interest income: |
|
|
|
|
|
|
|
| ||||||||
Fee and other income |
| $ | 5,542 | |
| $ | 5,097 | |
| $ | 9,487 | |
| $ | 9,627 | |
Derivative gains |
| 125,593 | |
| 340,660 | |
| 79,395 | |
| 152,367 | | ||||
Results of operations of foreclosed assets |
| (10 | ) |
| (549 | ) |
| (34 | ) |
| (1,661 | ) | ||||
Total non-interest income |
| $ | 131,125 | |
| $ | 345,208 | |
| $ | 88,848 | |
| $ | 160,333 | |
Derivative Gains (Losses)
Our derivative instruments are an integral part of our interest rate risk management strategy. Our principal purpose in using derivatives is to manage our aggregate interest rate risk profile within prescribed risk parameters. The derivative instruments we use primarily include interest rate swaps, which we typically hold to maturity. The primary factors affecting the fair value of our derivatives and derivative gains (losses) recorded in our results of operations include changes in interest rates, the shape of the yield curve and the composition of our derivative portfolio. We generally do not designate our interest rate swaps, which currently account for all of our derivatives, for hedge accounting. Accordingly, changes in the fair value of interest rate swaps are reported in our consolidated statements of operations under derivative gains (losses). We did not have any derivatives designated as accounting hedges as of November 30, 2017 or May 31, 2017 .
We currently use two types of interest rate swap agreements: (i) we pay a fixed rate and receive a variable rate ("pay-fixed swaps") and (ii) we pay a variable rate and receive a fixed rate ("receive-fixed swaps"). The benchmark rate for the substantial majority of the floating rate payments under our swap agreements is LIBOR. Table 5 displays the average notional amount outstanding, by swap agreement type, and the weighted-average interest rate paid and received for derivative cash settlements during the three and six months ended November 30, 2017 and 2016 . As indicated in Table 5 , our derivative portfolio currently consists of a higher proportion of pay-fixed swaps than receive-fixed swaps. The profile of our derivative portfolio, however, may change as a result of changes in market conditions and actions taken to manage our interest rate risk.
13
|
| Three Months Ended November 30, | ||||||||||||||||||
|
| 2017 |
| 2016 | ||||||||||||||||
(Dollars in thousands) |
| Average Notional Balance |
| Weighted- Average Rate Paid |
| Weighted- Average Rate Received |
| Average Notional Balance |
| Weighted- Average Rate Paid |
| Weighted- Average Rate Received | ||||||||
Pay-fixed swaps |
| $ | 7,052,629 | |
| 2.84 | % |
| 1.35 | % |
| $ | 6,786,130 | |
| 2.91 | % |
| 0.82 | % |
Receive-fixed swaps |
| 3,849,001 | |
| 1.91 | |
| 2.63 | |
| 3,864,934 | |
| 1.24 | |
| 2.78 | | ||
Total |
| $ | 10,901,630 | |
| 2.51 | % |
| 1.80 | % |
| $ | 10,651,064 | |
| 2.31 | % |
| 1.53 | % |
|
| Six Months Ended November 30, | ||||||||||||||||||
|
| 2017 |
| 2016 | ||||||||||||||||
|
| Average Notional Balance |
| Weighted- Average Rate Paid |
| Weighted- Average Rate Received |
| Average Notional Balance |
| Weighted- Average Rate Paid |
| Weighted- Average Rate Received | ||||||||
Pay-fixed swaps |
| $ | 7,003,898 | |
| 2.84 | % |
| 1.31 | % |
| $ | 6,812,841 | |
| 2.91 | % |
| 0.75 | % |
Receive-fixed swaps |
| 3,787,525 | |
| 1.87 | |
| 2.63 | |
| 3,680,967 | |
| 1.14 | |
| 2.80 | | ||
Total |
| $ | 10,791,423 | |
| 2.50 | % |
| 1.77 | % |
| $ | 10,493,808 | |
| 2.29 | % |
| 1.47 | % |
The average remaining maturity of our pay-fixed and receive-fixed swaps was 19 years and four years, respectively, as of November 30, 2017 , unchanged from fiscal year end May 31, 2017 . In comparison, the average remaining maturity of our pay-fixed and receive-fixed swaps was 18 years and three years, respectively, as of November 30, 2016 .
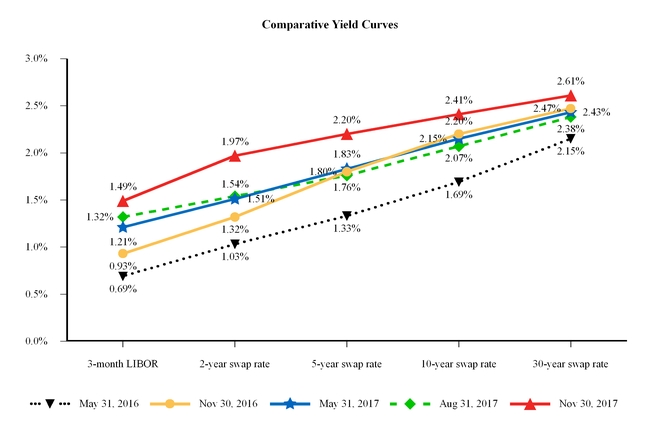
Pay-fixed swaps generally decrease in value as interest rates decline and increase in value as interest rates rise. In contrast, receive-fixed swaps generally increase in value as interest rates decline and decrease in value as interest rates rise. Because our pay-fixed and receive-fixed swaps are referenced to different maturity terms along the swap yield curve, different changes in the swap yield curve- parallel, flattening or steepening-will result in differences in the fair value of our derivatives. The chart below provides comparative swap yield curves as of the end of November 30, 2017 , August 31, 2017, May 31, 2017 , November 30, 2016 and May 31, 2016 .
14
____________________________
Benchmark rates obtained from Bloomberg.
Table 6 presents the components of net derivative gains (losses) recorded in our condensed consolidated results of operations for the three and six months ended November 30, 2017 and 2016 . Derivative cash settlements represent the net periodic contractual interest amount for our interest-rate swaps for the reporting period. Derivative forward value gains (losses) represent the change in fair value of our interest rate swaps during the reporting period due to changes in expected future interest rates over the remaining life of our derivative contracts.
Table 6 : Derivative Gains (Losses)
|
| Three Months Ended November 30, |
| Six Months Ended November 30, | ||||||||||||
(Dollars in thousands) |
| 2017 |
| 2016 |
| 2017 |
| 2016 | ||||||||
Derivative gains (losses) attributable to: |
|
|
|
|
|
|
|
| ||||||||
Derivative cash settlements |
| $ | (19,635 | ) |
| $ | (21,587 | ) |
| $ | (39,857 | ) |
| $ | (44,977 | ) |
Derivative forward value gains |
| 145,228 | |
| 362,247 | |
| 119,252 | |
| 197,344 | | ||||
Derivative gains |
| $ | 125,593 | |
| $ | 340,660 | |
| $ | 79,395 | |
| $ | 152,367 | |
The net derivative gains of $126 million and $79 million for the three and six months ended November 30, 2017 , respectively, were largely attributable to a net increase in the fair value of our pay-fixed swaps as interest rates increased across the yield curve.
The net derivative gains of $341 million and $152 million for the three and six months ended November 30, 2016 , respectively, were primarily attributable to net increase in the fair value of our pay-fixed swaps due to an increase in medium-term and longer-term interest rates and a general steepening of the yield curve during the periods.
15
See "Note 8-Derivative Instruments and Hedging Activities" for additional information on our derivative instruments.
Results of Operations of Foreclosed Assets
Results of operations of foreclosed assets consists of the operating results of entities controlled by CFC that hold foreclosed assets, impairment charges related to those entities, gains or losses related to the disposition of the entities and potential subsequent charges related to those assets. On July 1, 2016, we completed the sale of Caribbean Asset Holdings, LLC ("CAH"). As a result, we did not carry any foreclosed assets on our consolidated balance sheet as of November 30, 2017 or May 31, 2017 .
We recorded charges related to CAH of less than $1 million for the three and six months ended November 30, 2017 . These charges were attributable to legal fees. We recorded charges related to CAH of $1 million and $2 million for the three and six months ended November 30, 2016 , respectively, attributable to the combined impact of adjustments recorded at the closing date of the sale of CAH, post-closing purchase price adjustments and certain legal costs incurred pertaining to CAH.
In connection with the sale of CAH, $16 million of the sale proceeds was deposited into escrow to fund potential indemnification claims for a period of 15 months following the closing. On September 27, 2017, we received a claim notice from the purchaser of CAH asserting potential indemnification claims and seeking funding from the escrow. On November 10, 2017, funds held in escrow totaling $13 million were released to CFC. The remaining $3 million remains in escrow for claims under evaluation for indemnification.
Non-Interest Expense
Non-interest expense consists of salaries and employee benefit expense, general and administrative expenses, losses on early extinguishment of debt and other miscellaneous expenses.
Table 7 presents the components of non-interest expense recorded in our condensed consolidated results of operations for the three and six months ended November 30, 2017 and 2016 .
Table 7 : Non-Interest Expense
|
| Three Months Ended November 30, |
| Six Months Ended November 30, | ||||||||||||
(Dollars in thousands) |
| 2017 |
| 2016 |
| 2017 |
| 2016 | ||||||||
Non-interest expense: |
|
|
|
|
|
|
|
| ||||||||
Salaries and employee benefits |
| $ | (12,009 | ) |
| $ | (11,451 | ) |
| $ | (23,832 | ) |
| $ | (22,875 | ) |
Other general and administrative expenses |
| (9,905 | ) |
| (9,181 | ) |
| (19,718 | ) |
| (18,616 | ) | ||||
Other non-interest expense |
| (618 | ) |
| (517 | ) |
| (1,140 | ) |
| (960 | ) | ||||
Total non-interest expense |
| $ | (22,532 | ) |
| $ | (21,149 | ) |
| $ | (44,690 | ) |
| $ | (42,451 | ) |
Non-interest expense of $23 million for the current quarter increased by $1 million , or 7% , from the same prior-year quarter. Non-interest expense of $45 million for the six months ended November 30, 2017 increased by $2 million , 5% , from the prior-year period. These increases were primarily attributable to higher expenses related to salaries and employee benefits and other general and administrative operating expenses.
Net Income (Loss) Attributable to Noncontrolling Interests
Net income (loss) attributable to noncontrolling interests represents 100% of the results of operations of NCSC and RTFC, as the members of NCSC and RTFC own or control 100% of the interest in their respective companies. The fluctuations in net income (loss) attributable to noncontrolling interests are primarily due to changes in the fair value of NCSC's derivative instruments recognized in NCSC's earnings.
We recorded net income attributable to noncontrolling interests of $1 million during both the three and six months ended November 30, 2017 . In comparison, we recorded net income attributable to noncontrolling interests of $3 million and $2 million for the three and six months ended November 30, 2016 , respectively.
16
CONSOLIDATED BALANCE SHEET ANALYSIS |
Total assets of $25,880 million as of November 30, 2017 increased by $675 million , or 3% , from May 31, 2017 , primarily due to growth in our loan portfolio. Total liabilities of $24,640 million as of November 30, 2017 increased by $533 million , or 2% , from May 31, 2017 , largely due to debt issuances to fund loan growth. Total equity increased by $141 million to $1,240 million as of November 30, 2017 , attributable to our reported net income of $188 million for the six months ended November 30, 2017 , which was partially offset by patronage capital retirement of $45 million .
Following is a discussion of changes in the major components of our assets and liabilities during the six months ended November 30, 2017 . Period-end balance sheet amounts may vary from average balance sheet amounts due to liquidity and balance sheet management activities that are intended to manage liquidity requirements for the company and our customers, and our market risk exposure in accordance with our risk appetite.
Loan Portfolio
We offer long-term fixed- and variable-rate loans and line of credit variable-rate loans. The substantial majority of loans in our portfolio represent advances under secured long-term facilities with terms up to 35 years. Borrowers have the option of selecting a fixed or variable interest rate for each advance for periods ranging from one year to the final maturity of the facility. Line of credit loans are typically revolving facilities and are generally unsecured.
Loans Outstanding
Table 8 summarizes loans to members, by loan type and by member class, as of November 30, 2017 and May 31, 2017 . As indicated in Table 8 , long-term fixed-rate loans accounted for 90% and 91% of loans to members as of November 30, 2017 and May 31, 2017 , respectively.
Table 8 : Loans Outstanding by Type and Member Class
|
| November 30, 2017 |
| May 31, 2017 |
| Increase/ | ||||||||||||
(Dollars in thousands) |
| Amount |
| % of Total |
| Amount |
| % of Total |
| (Decrease) | ||||||||
Loans by type: |
|
|
|
|
|
|
|
|
|
| ||||||||
Long-term loans: |
|
|
|
|
|
|
|
|
|
| ||||||||
Fixed-rate |
| $ | 22,415,833 | |
| 90 | % |
| $ | 22,136,690 | |
| 91 | % |
| $ | 279,143 | |
Variable-rate |
| 906,453 | |
| 4 | |
| 847,419 | |
| 3 | |
| 59,034 | | |||
Total long-term loans |
| 23,322,286 | |
| 94 | |
| 22,984,109 | |
| 94 | |
| 338,177 | | |||
Lines of credit |
| 1,491,256 | |
| 6 | |
| 1,372,221 | |
| 6 | |
| 119,035 | | |||
Total loans outstanding |
| 24,813,542 | |
| 100 | |
| 24,356,330 | |
| 100 | |
| 457,212 | | |||
Deferred loan origination costs | | 11,149 | | | - | | | 10,714 | | | - | | | 435 | | |||
Loans to members | | $ | 24,824,691 | | | 100 | % | | $ | 24,367,044 | | | 100 | % | | $ | 457,647 | |
|
|
|
|
|
|
|
|
|
|
| ||||||||
Loans by member class: |
|
|
|
|
|
|
|
|
|
| ||||||||
CFC: |
|
|
|
|
|
|
|
|
|
| ||||||||
Distribution |
| $ | 19,230,740 | |
| 78 | % |
| $ | 18,825,366 | |
| 77 | % |
| $ | 405,374 | |
Power supply |
| 4,414,257 | |
| 18 | |
| 4,504,791 | |
| 19 | |
| (90,534 | ) | |||
Statewide and associate |
| 57,107 | |
| - | |
| 57,830 | |
| - | |
| (723 | ) | |||
CFC total |
| 23,702,104 | |
| 96 | |
| 23,387,987 | |
| 96 | |
| 314,117 | | |||
NCSC |
| 739,707 | |
| 3 | |
| 613,924 | |
| 3 | |
| 125,783 | | |||
RTFC |
| 371,731 | |
| 1 | |
| 354,419 | |
| 1 | |
| 17,312 | | |||
Total loans outstanding |
| 24,813,542 | |
| 100 | |
| 24,356,330 | |
| 100 | |
| 457,212 | | |||
Deferred loan origination costs |
| 11,149 | |
| - | |
| 10,714 | |
| - | |
| 435 | | |||
Loans to members |
| $ | 24,824,691 | |
| 100 | % |
| $ | 24,367,044 | |
| 100 | % |
| $ | 457,647 | |
17
Loans to members totaled $24,825 million as of November 30, 2017 , an increase of $458 million , or 2% , from May 31, 2017 . The increase was primarily due to an increase in CFC distribution loans of $405 million , an increase in NCSC loans of $126 million and an increase in RTFC loans of $17 million , which was partially offset by a decrease in CFC power supply loans of $91 million . Long-term loan advances totaled $1,127 million during the six months ended November 30, 2017 , with approximately 58% of those advances for capital expenditures by members and 31% for the refinancing of loans made by other lenders.
We provide ad ditional information on our loan product types in "Item 1. Business-Loan Programs " and "Note 4-Loans and Commitments" in our 2017 Form 10-K. See "Debt-Secured Borrowings" below for information on encumbered and unencumbered loans and "Credit Risk Management" for information on the credit risk profile of our loan portfolio.
Loan Retention Rate
Table 9 presents a comparison between the historical retention rate of CFC's long-term fixed-rate loans that repriced during the six months ended November 30, 2017 and loans that repriced during fiscal year 2017, and provides information on the percentage of loans that repriced to either another fixed-rate term or a variable rate. The retention rate is calculated based on the election made by the borrower at the repricing date. The average annual retention rate of CFC's repriced loans has been 97% over the last three fiscal years.
|
| Six Months Ended |
| Fiscal Year Ended | ||||||||||
|
| November 30, 2017 |
| May 31, 2017 | ||||||||||
(Dollars in thousands) |
| Amount |
| % of Total |
| Amount |
| % of Total | ||||||
Loans retained: |
|
|
|
|
|
|
|
| ||||||
Long-term fixed rate selected |
| $ | 440,556 | |
| 85 | % |
| $ | 824,415 | |
| 84 | % |
Long-term variable rate selected |
| 77,746 | |
| 15 | |
| 137,835 | |
| 14 | | ||
Loans repriced and sold by CFC |
| - | |
| - | |
| 1,401 | |
| - | | ||
Total loans retained by CFC |
| 518,302 | |
| 100 | |
| 963,651 | |
| 98 | | ||
Total loans repaid |
| 1,165 | |
| - | |
| 23,675 | |
| 2 | | ||
Total |
| $ | 519,467 | |
| 100 | % |
| $ | 987,326 | |
| 100 | % |
____________________________
(1) Does not include NCSC and RTFC loans.
Debt
We utilize both short-term and long-term borrowings as part of our funding strategy and asset/liability interest rate risk management. We seek to maintain diversified funding sources across products, programs and markets to manage funding concentrations and reduce our liquidity or debt roll-over risk. Our funding sources include a variety of secured and unsecured debt securities in a wide range of maturities to our members and affiliates and in the capital markets.
Debt Outstanding
Table 10 displays the composition, by product type, of our outstanding debt as of November 30, 2017 and May 31, 2017 . Table 10 also displays the composition of our debt based on several additional selected attributes.
18
(Dollars in thousands) |
| November 30, 2017 |
| May 31, 2017 |
| Increase/ | ||||||
Debt product type: |
|
|
|
|
|
| ||||||
Commercial paper: |
|
|
|
|
|
| ||||||
Members, at par |
| $ | 1,133,057 | |
| $ | 928,158 | |
| $ | 204,899 | |
Dealer, net of discounts |
| 579,859 | |
| 999,691 | |
| (419,832 | ) | |||
Total commercial paper |
| 1,712,916 | |
| 1,927,849 | |
| (214,933 | ) | |||
Select notes to members |
| 770,376 | |
| 696,889 | |
| 73,487 | | |||
Daily liquidity fund notes to members |
| 866,065 | |
| 527,990 | |
| 338,075 | | |||
Medium-term notes: |
|
|
|
|
| | | |||||
Members, at par |
| 612,402 | |
| 612,951 | |
| (549 | ) | |||
Dealer, net of discounts |
| 2,758,190 | |
| 2,364,671 | |
| 393,519 | | |||
Total medium-term notes |
| 3,370,592 | |
| 2,977,622 | |
| 392,970 | | |||
Collateral trust bonds |
| 7,637,324 | |
| 7,634,048 | |
| 3,276 | | |||
Guaranteed Underwriter Program notes payable |
| 5,059,943 | |
| 4,985,484 | |
| 74,459 | | |||
Farmer Mac notes payable |
| 2,491,463 | |
| 2,513,389 | |
| (21,926 | ) | |||
Other notes payable |
| 35,332 | |
| 35,223 | |
| 109 | | |||
Subordinated deferrable debt |
| 742,341 | |
| 742,274 | |
| 67 | | |||
Members' subordinated certificates: |
|
|
|
|
|
| ||||||
Membership subordinated certificates |
| 630,391 | |
| 630,098 | |
| 293 | | |||
Loan and guarantee subordinated certificates |
| 548,187 | |
| 567,830 | |
| (19,643 | ) | |||
Member capital securities |
| 221,097 | |
| 221,097 | |
| - | | |||
Total members' subordinated certificates |
| 1,399,675 | |
| 1,419,025 | |
| (19,350 | ) | |||
Total debt outstanding |
| $ | 24,086,027 | |
| $ | 23,459,793 | | | $ | 626,234 | |
|
|
|
|
|
|
| ||||||
Security type: |
|
|
|
|
|
| ||||||
Unsecured debt |
| 37 | % |
| 35 | % |
|
| ||||
Secured debt |
| 63 | |
| 65 | |
|
| ||||
Total |
| 100 | % |
| 100 | % |
|
| ||||
|
|
|
|
|
|
| ||||||
Funding source: |
|
|
|
|
|
| ||||||
Members |
| 20 | % |
| 18 | % |
|
| ||||
Private placement: |
|
|
|
|
|
| ||||||
Guaranteed Underwriter Program notes payable |
| 21 | |
| 21 | |
|
| ||||
Farmer Mac notes payable |
| 10 | |
| 11 | |
|
| ||||
Other |
| - | |
| - | |
|
| ||||
Total private placement |
| 31 | |
| 32 | |
|
| ||||
Capital markets |
| 49 | |
| 50 | |
|
| ||||
Total |
| 100 | % |
| 100 | % |
|
| ||||
|
|
|
|
|
|
| ||||||
Interest rate type: |
|
|
|
|
|
| ||||||
Fixed-rate debt |
| 73 | % |
| 74 | % |
|
| ||||
Variable-rate debt |
| 27 | |
| 26 | |
|
| ||||
Total |
| 100 | % |
| 100 | % |
|
| ||||
Interest rate type, including the impact of swaps: |
|
|
|
|
|
| ||||||
Fixed-rate debt (1) |
| 86 | % |
| 87 | % |
|
| ||||
Variable-rate debt (2) |
| 14 | |
| 13 | |
|
| ||||
Total |
| 100 | % |
| 100 | % |
|
| ||||
|
|
|
|
|
|
| ||||||
Maturity classification: (3) |
|
|
|
|
|
| ||||||
Short-term borrowings |
| 15 | % |
| 14 | % |
|
| ||||
Long-term and subordinated debt (4) |
| 85 | |
| 86 | |
|
| ||||
Total |
| 100 | % |
| 100 | % |
|
| ||||
19
____________________________
(1) Includes variable-rate debt that has been swapped to a fixed rate, net of any fixed-rate debt that has been swapped to a variable rate.
(2) Includes fixed-rate debt that has been swapped to a variable rate, net of any variable-rate debt that has been swapped to a fixed rate. Also includes commercial paper notes, which generally have maturities of less than 90 days. The interest rate on commercial paper notes does not change once the note has been issued; however, the interest rate for new commercial paper issuances changes daily.
(3) Borrowings with an original contractual maturity of one year or less are classified as short-term borrowings. Borrowings with an original contractual maturity of greater than one year are classified as long-term debt.
(4) Consists of long-term debt, subordinated deferrable debt and total members' subordinated debt reported on the condensed consolidated balance sheets. Maturity classification is based on the original contractual maturity as of the date of issuance of the debt.
Our outstanding debt volume generally increases and decreases in response to member loan demand. As outstanding loan balances increased during the six months ended November 30, 2017 , our debt volume also increased. Total debt outstanding was $24,086 million as of November 30, 2017 , an increase of $626 million , or 3% , from May 31, 2017 . The increase was primarily attributable to a net increase in member commercial paper and daily liquidity fund notes of $543 million , a net increase in dealer medium-term notes of $394 million and a net increase in notes payable under the Guaranteed Underwriter Program of $74 million . These increases were partially offset by a net decrease in dealer commercial paper outstanding of $420 million .
Below is a summary of significant financing activities during the six months ended November 30, 2017 .
• | On November 9, 2017 , we closed a $750 million committed loan facility ("Series M") from the Federal Financing Bank under the Guaranteed Underwriter Program. |
• | On November 20, 2017 , we amended and restated the three-year and five-year committed bank revolving line of credit agreements to extend the maturity dates to November 20, 2020 and November 20, 2022 , respectively, and to terminate certain third-party bank commitments. |
Member Investments
Debt securities issued to our members represent an important, stable source of funding. Table 11 displays outstanding member debt, by debt product type, as of November 30, 2017 and May 31, 2017 .
Table 11 : Member Investments
|
| November 30, 2017 |
| May 31, 2017 |
| Increase/ (Decrease) | ||||||||||||
(Dollars in thousands) |
| Amount |
| % of Total (1) |
| Amount |
| % of Total (1) |
| |||||||||
Commercial paper |
| $ | 1,133,057 | |
| 66 | % |
| $ | 928,158 | |
| 48 | % |
| $ | 204,899 | |
Select notes |
| 770,376 | |
| 100 | |
| 696,889 | |
| 100 | |
| 73,487 | | |||
Daily liquidity fund notes |
| 866,065 | |
| 100 | |
| 527,990 | |
| 100 | |
| 338,075 | | |||
Medium-term notes |
| 612,402 | |
| 18 | |
| 612,951 | |
| 20 | |
| (549 | ) | |||
Members' subordinated certificates |
| 1,399,675 | |
| 100 | |
| 1,419,025 | |
| 100 | |
| (19,350 | ) | |||
Total outstanding member debt |
| $ | 4,781,575 | |
|
|
| $ | 4,185,013 | |
|
|
| $ | 596,562 | | ||
|
|
|
|
|
|
|
|
|
|
| ||||||||
Percentage of total debt outstanding |
| 20 | % |
|
|
| 18 | % |
|
|
|
| | |||||
____________________________
(1) Represents outstanding debt attributable to members for each debt product type as a percentage of the total outstanding debt for each debt product type.
Member investments accounted for 20% and 18% of total debt outstanding as of November 30, 2017 and May 31, 2017 , respectively. Over the last three fiscal years, outstanding member investments have averaged $4,273 million on a quarterly basis.
Short-Term Borrowings
Short-term borrowings consist of borrowings with an original contractual maturity of one year or less and do not include the current portion of long-term debt. Short-term borrowings totaled $3,557 million and accounted for 15% of total debt
20
outstanding as of November 30, 2017 , compared with $3,343 million , or 14% , of total debt outstanding as of May 31, 2017 . See Table 27 under "Liquidity Risk" for the composition of our short-term borrowings.
Long-Term and Subordinated Debt
Long-term debt, defined as debt with an original contractual maturity term of greater than one year, primarily consists of medium-term notes, collateral trust bonds, notes payable under the Guaranteed Underwriter Program and notes payable under our note purchase agreement with Farmer Mac. Subordinated debt consists of subordinated deferrable debt and members' subordinated certificates. Our subordinated deferrable debt and members' subordinated certificates have original contractual maturity terms of greater than one year.
Long-term and subordinated debt totaled $20,529 million and accounted for 85% of total debt outstanding as of November 30, 2017 , compared with $20,117 million , or 86% , of total debt outstanding as of May 31, 2017 . As discussed above, the increase in total debt outstanding, including long-term and subordinated debt, was primarily due to the issuance of debt to fund the growth in our loan and investments portfolios.
Collateral Pledged
We are required to pledge loans or other collateral in borrowing transactions under our collateral trust bond indentures, note purchase agreements with Farmer Mac and bond agreements under the Guaranteed Underwriter Program. We are required to maintain pledged collateral equal to at least 100% of the face amount of outstanding borrowings. However, we typically maintain pledged collateral in excess of the required percentage to ensure that required collateral levels are maintained and to facilitate the timely execution of debt issuances by reducing or eliminating the lead time to pledge additional collateral. Under the provisions of our committed bank revolving line of credit agreements, the excess collateral that we are allowed to pledge cannot exceed 150% of the outstanding borrowings under our collateral trust bond indentures, Farmer Mac note purchase agreements or the Guaranteed Underwriter Program. In certain cases, provided that all conditions of eligibility under the different programs are satisfied, we may withdraw excess pledged collateral or transfer collateral from one borrowing program to another to facilitate a new debt issuance.
Table 12 displays the collateral coverage ratios as of November 30, 2017 and May 31, 2017 for the debt agreements noted above that require us to pledge collateral.
Table 12 : Collateral Pledged
|
| Requirement/Limit |
|
| ||||||||
|
| Debt Indenture Minimum |
| Committed Bank Revolving Line of Credit Agreements Maximum |
| Actual (1) | ||||||
Debt Agreement |
|
|
| November 30, 2017 |
| May 31, 2017 | ||||||
Collateral trust bonds 1994 indenture |
| 100 | % |
| 150 | % |
| 115 | % |
| 117 | % |
Collateral trust bonds 2007 indenture |
| 100 | |
| 150 | |
| 113 | |
| 115 | |
Guaranteed Underwriter Program notes payable |
| 100 | |
| 150 | |
| 116 | |
| 117 | |
Farmer Mac notes payable |
| 100 | |
| 150 | |
| 115 | |
| 117 | |
Clean Renewable Energy Bonds Series 2009A |
| 100 | |
| 150 | |
| 106 | |
| 113 | |
____________________________
(1) Calculated based on the amount of collateral pledged divided by the face amount of outstanding secured debt.
Of our total debt outstanding of $24,086 million as of November 30, 2017 , $15,202 million , or 63% , was secured by pledged loans totaling $17,691 million . In comparison, of our total debt outstanding of $23,460 million as of May 31, 2017 , $15,146 million , or 65% , was secured by pledged loans totaling $17,941 million . Total debt outstanding on our condensed consolidated balance sheet is presented net of unamortized discounts and issuance costs. However, our collateral pledging requirements are based on the face amount of secured outstanding debt, which does not take into consideration the impact of net unamortized discounts and issuance costs.
21
Table 13 displays the unpaid principal balance of loans pledged for secured debt, the excess collateral pledged and unencumbered loans as of November 30, 2017 and May 31, 2017 .
Table 13 : Unencumbered Loans
(Dollars in thousands) |
| November 30, 2017 |
| May 31, 2017 | ||||
Total loans outstanding (1) |
| $ | 24,813,542 | |
| $ | 24,356,330 | |
Less: Loans required to be pledged for secured debt (2) |
| (15,482,581 | ) |
| (15,435,062 | ) | ||
Loans pledged in excess of requirement (2)(3) |
| (2,208,115 | ) |
| (2,505,804 | ) | ||
Total pledged loans |
| (17,690,696 | ) |
| (17,940,866 | ) | ||
Unencumbered loans |
| $ | 7,122,846 | |
| $ | 6,415,464 | |
Unencumbered loans as a percentage of total loans |
| 29 | % |
| 26 | % | ||
____________________________
(1) Reflects unpaid principal balance. Excludes unamortized deferred loan origination costs of $11 million as of both November 30, 2017 and May 31, 2017 .
(2) Reflects unpaid principal balance of pledged loans.
(3) Excludes cash collateral pledged to secure debt. If there is an event of default under most of our indentures, we can only withdraw the excess collateral if we substitute cash or permitted investments of equal value.
As displayed above in Table 13 , we had excess loans pledged as collateral totaling $2,208 million and $2,506 million as of November 30, 2017 and May 31, 2017 , respectively. We typically pledge loans in excess of the required amount for the following reasons: (i) our distribution and power supply loans are typically amortizing loans that require scheduled principal payments over the life of the loan, whereas the debt securities issued under secured indentures and agreements typically have bullet maturities; (ii) distribution and power supply borrowers have the option to prepay their loans; and (iii) individual loans may become ineligible for various reasons, some of which may be temporary.
We provide additional information on our borrowings, including the maturity profile, below in "Liquidity Risk." Refer to "Note 4-Loans and Commitments-Pledging of Loans" for additional information related to pledged collateral. Also refer to "Note 6-Short-Term Borrowings," "Note 7-Long-Term Debt," "Note 8-Subordinated Deferrable Debt" and "Note 9-Members' Subordinated Certificates" in our 2017 Form 10-K for a more detailed description of each of our debt product types.
Equity
Total equity increased by $141 million to $1,240 million as of November 30, 2017 . The increase was primarily attributable to our net income of $188 million for the six months ended November 30, 2017 , which was partially offset by patronage capital retirement of $45 million in September 2017.
In July 2017, the CFC Board of Directors authorized the allocation of fiscal year 2017 adjusted net income as follows: $90 million to members in the form of patronage capital; $43 million to members' capital reserve; and $1 million to the Cooperative Educational Fund. The amount of patronage capital allocated each year by CFC's Board of Directors is based on adjusted non-GAAP net income, which excludes the impact of derivative forward value gains (losses). See "Non-GAAP Financial Measures" for information on adjusted net income.
In July 2017, the CFC Board of Directors authorized the retirement of patronage capital totaling $45 million , which represented 50% of the fiscal year 2017 allocation of patronage capital of $90 million . We returned the $45 million to members in cash in September 2017. The remaining portion of the allocated amount will be retained by CFC for 25 years under guidelines adopted by the CFC Board of Directors in June 2009.
The CFC Board of Directors is required to make annual allocations of adjusted net income, if any. CFC has made annual retirements of allocated net earnings in 38 of the last 39 fiscal years; however, future retirements of allocated amounts are determined based on CFC's financial condition. The CFC Board of Directors has the authority to change the current practice for allocating and retiring net earnings at any time, subject to applicable laws. See "Item 1. Business-Allocation and Retirement of Patronage Capital" of our 2017 Form 10-K for additional information.
22
OFF-BALANCE SHEET ARRANGEMENTS |
In the ordinary course of business, we engage in financial transactions that are not presented on our condensed consolidated balance sheets, or may be recorded on our condensed consolidated balance sheets in amounts that are different from the full contract or notional amount of the transaction. Our off-balance sheet arrangements consist primarily of guarantees of member obligations and unadvanced loan commitments intended to meet the financial needs of our members.
Guarantees
We provide guarantees for certain contractual obligations of our members to assist them in obtaining various forms of financing. Table 14 displays the notional amount of our outstanding guarantee obligations, by guarantee type and by company, as of November 30, 2017 and May 31, 2017 .
Table 14 : Guarantees Outstanding
(Dollars in thousands) |
| November 30, 2017 |
| May 31, 2017 |
| Increase/ | ||||||
Guarantee type: |
|
|
|
|
|
| ||||||
Long-term tax-exempt bonds |
| $ | 318,425 | |
| $ | 468,145 | |
| $ | (149,720 | ) |
Letters of credit |
| 230,117 | |
| 307,321 | |
| (77,204 | ) | |||
Other guarantees |
| 113,954 | |
| 114,151 | |
| (197 | ) | |||
Total |
| $ | 662,496 | |
| $ | 889,617 | |
| $ | (227,121 | ) |
|
|
|
|
|
|
| ||||||
Company: |
|
| |
|
|
|
| |||||
CFC |
| $ | 645,695 | |
| $ | 874,920 | |
| $ | (229,225 | ) |
NCSC |
| 15,227 | |
| 13,123 | |
| 2,104 | | |||
RTFC |
| 1,574 | |
| 1,574 | |
| - | | |||
Total |
| $ | 662,496 | |
| $ | 889,617 | |
| $ | (227,121 | ) |
Of the total notional amount of our outstanding guarantee obligations of $662 million and $890 million as of November 30, 2017 and May 31, 2017 , respectively, 54% and 67%, respectively, were secured by a mortgage lien on substantially all of the assets and future revenue of the borrowers. We recorded a guarantee liability of $8 million and $15 million as of November 30, 2017 and May 31, 2017 , respectively, related to the contingent and noncontingent exposures for guarantee and liquidity obligations associated with our members' debt.
We were the liquidity provider for long-term variable-rate, tax-exempt bonds issued for our member cooperatives totaling $251 million as of November 30, 2017 . We also provide a guarantee of payment of principal and interest for $251 million of these long-term variable-rate, tax-exempt bonds, which is included above in Table 14 as a component of the long-term tax-exempt bonds of $318 million as of November 30, 2017 . As liquidity provider on these tax-exempt bonds, we may be required to purchase bonds that are tendered or put by investors. Investors provide notice to the remarketing agent that they will tender or put a certain amount of bonds at the next interest rate reset date. If the remarketing agent is unable to sell such bonds to other investors by the next interest rate reset date, we have unconditionally agreed to purchase such bonds. We were not required to perform as liquidity provider pursuant to these obligations during the six months ended November 30, 2017 or the prior fiscal year.
We had outstanding letters of credit for the benefit of our members totaling $230 million as of November 30, 2017 , which are related to obligations for which we may be required to advance funds based on various trigger events specified in the letters of credit agreements. If we are required to advance funds, the member is obligated to repay the advance amount, and accrued interest, to us.
In addition to the letters of credit presented in Table 14 , we had master letter of credit facilities in place as of November 30, 2017 , under which we may be required to issue up to an additional $65 million in letters of credit to third parties for the benefit of our members. All of our master letter of credit facilities as of November 30, 2017 were subject to material adverse
23
change clauses at the time of issuance. Prior to issuing a letter of credit under these facilities, we confirm that there has been no material adverse change in the business or condition, financial or otherwise, of the borrower since the time the loan was approved and that the borrower is currently in compliance with the letter of credit terms and conditions.
Table 15 presents the maturities for each of the next five fiscal years and thereafter of the notional amount of our outstanding guarantee obligations as of November 30, 2017 .
|
| Outstanding |
| Maturities of Guaranteed Obligations | ||||||||||||||||||||||||
(Dollars in thousands) |
|
| 2018 |
| 2019 |
| 2020 |
| 2021 |
| 2022 |
| Thereafter | |||||||||||||||
Guarantees |
| $ | 662,496 | |
| $ | 168,729 | |
| $ | 108,460 | |
| $ | 52,057 | |
| $ | 109,486 | |
| $ | 31,613 | |
| $ | 192,151 | |
We provide additional information about our guarantee obligations in "Note 10-Guarantees."
Unadvanced Loan Commitments
Unadvanced loan commitments represent approved and executed loan contracts for which funds have not been advanced to borrowers. Our line of credit commitments include both contracts that are subject to material adverse change clauses and contracts that are not subject to material adverse change clauses, while our long-term loan commitments are typically subject to material adverse change clauses.
Table 16 displays the amount of unadvanced loan commitments, which consist of line of credit and long-term loan commitments, as of November 30, 2017 and May 31, 2017 .
|
| November 30, 2017 |
| May 31, 2017 |
| Increase/ | ||||||||||||
(Dollars in thousands) |
| Amount |
| % of Total |
| Amount |
| % of Total |
| (Decrease) | ||||||||
Line of credit commitments: |
|
|
|
|
|
|
|
|
|
| ||||||||
Conditional (1) |
| $ | 4,790,605 | |
| 38 | % |
| $ | 5,170,393 | |
| 41 | % |
| $ | (379,788 | ) |
Unconditional (2) |
| 2,784,511 | |
| 22 | |
| 2,602,262 | |
| 21 | |
| 182,249 | | |||
Total line of credit unadvanced commitments |
| 7,575,116 | | | 60 | |
| 7,772,655 | |
| 62 | |
| (197,539 | ) | |||
Total long-term loan unadvanced commitments (1) |
| 4,950,905 | | | 40 | |
| 4,802,319 | |
| 38 | |
| 148,586 | | |||
Total unadvanced loan commitments |
| $ | 12,526,021 | | | 100 | % |
| $ | 12,574,974 | |
| 100 | % |
| $ | (48,953 | ) |
____________________________
(1) Represents amount related to facilities that are subject to material adverse change clauses.
(2) Represents amount related to facilities that are not subject to material adverse change clauses.
Table 17 presents the amount of unadvanced loan commitments, by loan type, as of November 30, 2017 and the maturities of the commitment amounts for each of the next five fiscal years and thereafter.
|
| Available Balance |
| Notional Maturities of Unadvanced Loan Commitments | ||||||||||||||||||||||||
(Dollars in thousands) |
|
| 2018 |
| 2019 |
| 2020 |
| 2021 |
| 2022 |
| Thereafter | |||||||||||||||
Line of credit loans |
| $ | 7,575,116 | |
| $ | 342,159 | |
| $ | 4,343,222 | |
| $ | 641,613 | |
| $ | 950,998 | |
| $ | 773,772 | |
| $ | 523,352 | |
Long-term loans |
| 4,950,905 | |
| 215,806 | |
| 986,952 | |
| 649,436 | |
| 676,899 | |
| 1,885,338 | |
| 536,474 | | |||||||
Total |
| $ | 12,526,021 | |
| $ | 557,965 | |
| $ | 5,330,174 | |
| $ | 1,291,049 | |
| $ | 1,627,897 | |
| $ | 2,659,110 | |
| $ | 1,059,826 | |
Unadvanced line of credit commitments accounted for 60% of total unadvanced loan commitments as of November 30, 2017 , while unadvanced long-term loan commitments accounted for 40% of total unadvanced loan commitments.
24
Unadvanced line of credit commitments are typically revolving facilities for periods not to exceed five years. Unadvanced line of credit commitments generally serve as supplemental back-up liquidity to our borrowers. Historically, borrowers have not drawn the full commitment amount for line of credit facilities, and we have experienced a very low utilization rate on line of credit loan facilities regardless of whether or not we are obligated to fund the facility where a material adverse change exists. Our unadvanced long-term loan commitments have a five-year draw period under which a borrower may advance funds prior to the expiration of the commitment. We expect that the majority of the long-term unadvanced loan commitments of $4,951 million will be advanced prior to the expiration of the commitment.
Because we historically have experienced a very low utilization rate on line of credit loan facilities, which account for the majority of our total unadvanced loan commitments, we believe the unadvanced loan commitment total of $12,526 million as of November 30, 2017 is not necessarily representative of our future funding cash requirements.
Unadvanced Loan Commitments-Conditional
The substantial majority of our line of credit commitments and all our unadvanced long-term loan commitments include material adverse change clauses. Unadvanced loan commitments subject to material adverse change clauses totaled $9,741 million and $9,973 million as of November 30, 2017 and May 31, 2017 , respectively, and accounted for 78% and 79% of the combined total of unadvanced line of credit and long-term loan commitments as of November 30, 2017 and May 31, 2017 , respectively. Prior to making advances on these facilities, we confirm that there has been no material adverse change in the borrower's business or condition, financial or otherwise, since the time the loan was approved and confirm that the borrower is currently in compliance with loan terms and conditions. In some cases, the borrower's access to the full amount of the facility is further constrained by use of proceeds restrictions, imposition of borrower-specific restrictions, or by additional conditions that must be met prior to advancing funds. Since we generally do not charge a fee for the borrower to have an unadvanced amount on a loan facility that is subject to a material adverse change clause, our borrowers tend to request amounts in excess of their immediate estimated loan requirements.
Unadvanced Loan Commitments-Unconditional
Unadvanced loan commitments not subject to material adverse change clauses at the time of each advance consisted of unadvanced committed lines of credit totaling $2,785 million and $2,602 million as of November 30, 2017 and May 31, 2017 , respectively. For contracts not subject to a material adverse change clause, we are generally required to advance amounts on the committed facilities as long as the borrower is in compliance with the terms and conditions of the facility.
Syndicated loan facilities, where the pricing is set at a spread over LIBOR as agreed upon by all of the participating banks based on market conditions at the time of syndication, accounted for 85% of unconditional line of credit commitments as of November 30, 2017 . The remaining 15% represented unconditional committed line of credit loans which under any new advance would be made at rates determined by us based on our cost, and we have the option to pass on to the borrower any cost increase related to the advance.
Table 18 presents the maturities for each of the next five fiscal years and thereafter of the notional amount of unconditional committed lines of credit not subject to a material adverse change clause as of November 30, 2017 .
Table 18 : Maturities of Notional Amount of Unconditional Committed Lines of Credit
|
| Available Balance |
| Notional Maturities of Unconditional Committed Lines of Credit | ||||||||||||||||||||||||
(Dollars in thousands) |
|
| 2018 |
| 2019 |
| 2020 |
| 2021 |
| 2022 |
| Thereafter | |||||||||||||||
Committed lines of credit |
| $ | 2,784,511 | |
| $ | 130,000 | |
| $ | 517,130 | |
| $ | 395,711 | |
| $ | 630,631 | |
| $ | 677,818 | |
| $ | 433,221 | |
See "MD&A-Off-Balance Sheet Arrangements" in our 2017 Form 10-K for additional information on our off-balance sheet arrangements.
25
RISK MANAGEMENT |
Overview
We face a variety of risks that can significantly affect our financial performance, liquidity, reputation and ability to meet the expectations of our members, investors and other stakeholders. As a financial services company, the major categories of risk exposures inherent in our business activities include credit risk, liquidity risk, market risk and operational risk. These risk categories are summarized below.
• | Credit risk is the risk that a borrower or other counterparty will be unable to meet its obligations in accordance with agreed-upon terms. |
• | Liquidity risk is the risk that we will be unable to fund our operations and meet our contractual obligations or that we will be unable to fund new loans to borrowers at a reasonable cost and tenor in a timely manner. |
• | Market risk is the risk that changes in market variables, such as movements in interest rates, may adversely affect the match between the timing of the contractual maturities, re-pricing and prepayments of our financial assets and the related financial liabilities funding those assets. |
• | Operational risk is the risk of loss resulting from inadequate or failed internal controls, processes, systems, human error or external events. Operational risk also includes compliance risk, fiduciary risk, reputational risk and litigation risk. |
Effective risk management is critical to our overall operations and in achieving our primary objective of providing cost-based financial products to our rural electric members while maintaining the sound financial results required for investment-grade credit ratings on our debt instruments. Accordingly, we have a risk management framework that is intended to govern the principal risks we face in conducting our business and the aggregate amount of risk we are willing to accept, referred to as risk appetite, in the context of CFC's mission and strategic objectives and initiatives. We provide information on our risk management framework in our 2017 Form 10-K under "Item 7. MD&A-Risk Management-Risk Management Framework."
CREDIT RISK |
Our loan portfolio, which represents the largest component of assets on our balance sheet, and guarantees account for the substantial majority of our credit risk exposure. We also engage in certain non-lending activities that may give rise to credit and counterparty settlement risk, including the purchase of investment securities and entering into derivative transactions to manage our interest rate risk. Our primary credit exposure is to rural electric cooperatives that provide essential electric services to end-users, the majority of which are residential customers. We also have a limited portfolio of loans to not-for-profit and for-profit telecommunication companies.
Credit Risk Management
We manage portfolio and borrower credit risk consistent with credit policies established by the CFC Board of Directors and through credit underwriting, approval and monitoring processes and practices adopted by management. Our board-established credit policies include guidelines regarding the types of credit products we offer, limits on credit we extend to individual borrowers, approval authorities delegated to management, and use of syndications and loan sales. We maintain an internal risk rating system in which we assign a rating to each borrower and credit facility. We review and update the risk ratings at least annually. Assigned risk ratings inform our credit approval, borrower monitoring and portfolio review processes. Our Corporate Credit Committee approves individual credit actions within its own authority and together with our Credit Risk Management group, establishes standards for credit underwriting, oversees credits deemed to be higher risk, reviews assigned risk ratings for accuracy, and monitors the overall credit quality and performance statistics of our loan portfolio and guarantees.
26
Loan and Guarantee Portfolio Credit Risk
Below we provide information on the credit risk profile of our loan portfolio and guarantees, including security provisions, loan concentration, credit performance and our allowance for loan losses.
Security Provisions
Except when providing line of credit loans, we generally lend to our members on a senior secured basis. Long-term loans are generally secured on parity with other secured lenders (primarily RUS), if any, by all assets and revenue of the borrower with exceptions typical in utility mortgages. Line of credit loans are generally unsecured. In addition to the collateral pledged to secure our loans, distribution and power supply borrowers also are required to set rates charged to customers to achieve certain specified financial ratios.
Table 19 presents, by loan type and by company, the amount and percentage of secured and unsecured loans in our loan portfolio as of November 30, 2017 and May 31, 2017 . Of our total loans outstanding, 92% were secured and 8% were unsecured as of both November 30, 2017 and May 31, 2017 .
Table 19 : Loan Portfolio Security Profile (1)
|
| November 30, 2017 | ||||||||||||||||
(Dollars in thousands) |
| Secured |
| % of Total |
| Unsecured |
| % of Total |
| Total | ||||||||
Loan type: |
|
|
|
|
|
|
|
|
|
| ||||||||
Long-term loans: |
|
|
|
|
|
|
|
|
|
| ||||||||
Long-term fixed-rate loans |
| $ | 21,825,249 | |
| 97 | % |
| $ | 590,584 | |
| 3 | % |
| $ | 22,415,833 | |
Long-term variable-rate loans |
| 857,907 | |
| 95 | |
| 48,546 | |
| 5 | |
| 906,453 | | |||
Total long-term loans |
| 22,683,156 | |
| 97 | |
| 639,130 | |
| 3 | |
| 23,322,286 | | |||
Line of credit loans |
| 72,505 | |
| 5 | |
| 1,418,751 | |
| 95 | |
| 1,491,256 | | |||
Total loans outstanding |
| $ | 22,755,661 | |
| 92 | % |
| $ | 2,057,881 | |
| 8 | % |
| $ | 24,813,542 | |
|
|
|
|
|
|
|
|
|
|
| ||||||||
Company: |
|
|
|
|
|
|
|
|
|
| ||||||||
CFC |
| $ | 21,814,316 | |
| 92 | % |
| $ | 1,887,788 | |
| 8 | % |
| $ | 23,702,104 | |
NCSC |
| 588,161 | |
| 80 | |
| 151,546 | |
| 20 | |
| 739,707 | | |||
RTFC |
| 353,184 | |
| 95 | |
| 18,547 | |
| 5 | |
| 371,731 | | |||
Total loans outstanding |
| $ | 22,755,661 | |
| 92 | % |
| $ | 2,057,881 | |
| 8 | % |
| $ | 24,813,542 | |
27
|
| May 31, 2017 | ||||||||||||||||
(Dollars in thousands) |
| Secured |
| % of Total |
| Unsecured |
| % of Total |
| Total | ||||||||
Loan type: |
|
|
|
|
|
|
|
|
|
| ||||||||
Long-term loans: |
|
|
|
|
|
|
|
|
|
| ||||||||
Long-term fixed-rate loans |
| $ | 21,503,871 | |
| 97 | % |
| $ | 632,819 | |
| 3 | % |
| $ | 22,136,690 | |
Long-term variable-rate loans |
| 795,326 | |
| 94 | |
| 52,093 | |
| 6 | |
| 847,419 | | |||
Total long-term loans |
| 22,299,197 | |
| 97 | |
| 684,912 | |
| 3 | |
| 22,984,109 | | |||
Line of credit loans |
| 54,258 | |
| 4 | |
| 1,317,963 | |
| 96 | |
| 1,372,221 | | |||
Total loans outstanding |
| $ | 22,353,455 | |
| 92 | |
| $ | 2,002,875 | |
| 8 | |
| $ | 24,356,330 | |
|
|
|
|
|
|
|
|
|
|
| ||||||||
Company: |
|
|
|
|
|
|
|
|
|
| ||||||||
CFC |
| $ | 21,591,723 | |
| 92 | % |
| $ | 1,796,264 | |
| 8 | % |
| $ | 23,387,987 | |
NCSC |
| 424,636 | |
| 69 | |
| 189,288 | |
| 31 | |
| 613,924 | | |||
RTFC |
| 337,096 | |
| 95 | |
| 17,323 | |
| 5 | |
| 354,419 | | |||
Total loans outstanding |
| $ | 22,353,455 | |
| 92 | |
| $ | 2,002,875 | |
| 8 | |
| $ | 24,356,330 | |
____________________________
(1) Excludes deferred loan origination costs of $11 million as of both November 30, 2017 and May 31, 2017 .
As part of our strategy in managing our credit risk exposure, we entered into a long-term standby purchase commitment agreement with Farmer Mac on August 31, 2015, as amended on May 31, 2016. Under this agreement, we may designate certain loans to be covered under the commitment, as approved by Farmer Mac, and in the event any such loan later goes into payment default for at least 90 days, upon request by us, Farmer Mac must purchase such loan at par value. The outstanding principal balance of loans covered under this agreement totaled $792 million as of November 30, 2017 , compared with $843 million as of May 31, 2017 . No loans have been put to Farmer Mac for purchase pursuant to this agreement. In addition, RUS guaranteed long-term loans totaling $164 million and $167 million as of November 30, 2017 and May 31, 2017 , respectively.
Credit Concentration
As a tax-exempt, member-owned finance cooperative, CFC's principal purpose is to provide funding to America's rural electric utility cooperatives to assist them in acquiring, constructing and operating electric distribution, transmission and related facilities. We serve electric and telecommunications members throughout the United States and its territories, including 49 states, the District of Columbia, American Samoa and Guam. Texas had the largest concentration of outstanding loans to borrowers in any one state, with approximately 15% of total loans outstanding as of both November 30, 2017 and May 31, 2017 . Our consolidated membership totaled 1,459 members and 217 associates as of November 30, 2017 . As such, we have a loan portfolio with single-industry and single-obligor concentration risk. Outstanding loans to electric utility organizations represented approximately 99% of the total outstanding loan portfolio as of November 30, 2017 , unchanged from May 31, 2017 . The remaining outstanding loans in our portfolio were to RTFC members, affiliates and associates in the telecommunications industry.
Single-Obligor Concentration
Table 20 displays the outstanding exposure of the 20 largest borrowers, by exposure type and by company, as of November 30, 2017 and May 31, 2017 . The 20 largest borrowers consisted of 10 distribution systems, 9 power supply systems and 1 NCSC associate member as of both November 30, 2017 and May 31, 2017 . The largest total outstanding exposure to a single borrower or controlled group represented approximately 2% of total loans and guarantees outstanding as of both November 30, 2017 and May 31, 2017 .
28
Table 20 : Credit Exposure to 20 Largest Borrowers
|
| November 30, 2017 |
| May 31, 2017 |
| Change | ||||||||||||
(Dollars in thousands) |
| Amount |
| % of Total |
| Amount |
| % of Total |
| |||||||||
By exposure type: |
|
|
|
|
|
|
|
|
|
| ||||||||
Loans |
| $ | 5,832,139 | |
| 23 | % |
| $ | 5,749,885 | |
| 23 | % |
| $ | 82,254 | |
Guarantees |
| 129,070 | |
| - | |
| 354,619 | |
| 1 | |
| (225,549 | ) | |||
Total exposure to 20 largest borrowers |
| 5,961,209 | |
| 23 | |
| 6,104,504 | |
| 24 | |
| (143,295 | ) | |||
Less: Loans covered under Farmer Mac standby purchase commitment |
| (367,464 | ) |
| (1 | ) |
| (351,699 | ) |
| (1 | ) |
| (15,765 | ) | |||
Net exposure to 20 largest borrowers |
| $ | 5,593,745 | |
| 22 | % |
| $ | 5,752,805 | |
| 23 | % |
| $ | (159,060 | ) |
|
|
|
|
|
|
|
|
|
|
| ||||||||
By company: |
|
|
|
|
|
|
|
|
|
| ||||||||
CFC |
| $ | 5,711,341 | |
| 22 | % |
| $ | 5,899,709 | |
| 23 | % |
| $ | (188,368 | ) |
NCSC |
| 249,868 | |
| 1 | |
| 204,795 | |
| 1 | |
| 45,073 | | |||
Total exposure to 20 largest borrowers |
| 5,961,209 | |
| 23 | |
| 6,104,504 | |
| 24 | |
| (143,295 | ) | |||
Less: Loans covered under Farmer Mac standby purchase commitment |
| (367,464 | ) |
| (1 | ) |
| (351,699 | ) |
| (1 | ) |
| (15,765 | ) | |||
Net exposure to 20 largest borrowers |
| $ | 5,593,745 | |
| 22 | % |
| $ | 5,752,805 | |
| 23 | % |
| $ | (159,060 | ) |
Credit Performance
As part of our credit risk management process, we monitor and evaluate each borrower and loan in our loan portfolio and assign numeric internal risk ratings based on quantitative and qualitative assessments. Our ratings are intended to align with the federal banking regulatory credit risk rating classification definitions of pass, special mention, substandard and doubtful. The special mention, substandard, and doubtful categories are intended to comply with the definition of criticized loans by the banking regulatory authorities. Internal risk ratings and payment status trends are indicators, among others, of the level of credit risk in our loan portfolio.
The overall credit risk of our loan portfolio remained low, as evidenced by our strong asset quality metrics, including senior secured positions on most of our loans and low levels of criticized exposure, nonaccrual loans and charge-offs. As displayed in Table 19 above, 92% of our total outstanding loans were secured as of both November 30, 2017 and May 31, 2017 . As displayed in "Note 4-Loans and Commitments," 0.5% of the loans in our portfolio were classified as criticized as of both November 30, 2017 and May 31, 2017 . Below we provide information on certain additional credit quality indicators, including modified loans that are considered to be troubled debt restructurings ("TDRs"), nonperforming loans and net charge-offs.
Troubled Debt Restructurings
We actively monitor problem loans and, from time to time, attempt to work with borrowers to manage such exposures through loan workouts or modifications that better align with the borrower's current ability to pay. A loan restructuring or modification of terms is accounted for as a TDR if, for economic or legal reasons related to the borrower's financial difficulties, a concession is granted to the borrower that we would not otherwise consider. TDR loans generally are initially placed on nonaccrual status, although in many cases such loans were already on nonaccrual status prior to modification. Interest accrued but not collected at the date a loan is placed on nonaccrual status is reversed against earnings. These loans may be returned to performing status and the accrual of interest resumed if the borrower performs under the modified terms for an extended period of time, and we expect the borrower to continue to perform in accordance with the modified terms. In certain limited circumstances in which a TDR loan is current at the modification date, the loan may remain on accrual status at the time of modification.
Table 21 presents the carrying value of loans modified as TDRs in prior periods as of November 30, 2017 and May 31, 2017 . These loans were considered individually impaired as of the end of each period presented.
29
Table 21 : TDR Loans
|
| November 30, 2017 |
| May 31, 2017 | ||||||||||
(Dollars in thousands) |
| Carrying Amount |
| % of Total Loans Outstanding |
| Carrying Amount |
| % of Total Loans Outstanding | ||||||
TDR loans: |
|
|
|
|
|
|
|
| ||||||
CFC |
| $ | 6,507 | |
| 0.03 | % |
| $ | 6,581 | |
| 0.02 | % |
RTFC |
| 6,341 | |
| 0.02 | |
| 6,592 | |
| 0.03 | | ||
Total TDR loans |
| $ | 12,848 | |
| 0.05 | % |
| $ | 13,173 | |
| 0.05 | % |
|
|
|
|
|
|
|
|
| ||||||
Performance status of TDR loans: |
|
|
|
|
|
|
|
| ||||||
Performing TDR loans |
| $ | 12,848 | |
| 0.05 | % |
| $ | 13,173 | |
| 0.05 | % |
As indicated in Table 21 , we did not have any TDR loans classified as nonperforming as of November 30, 2017 or May 31, 2017 . TDR loans classified as performing as of November 30, 2017 and May 31, 2017 were performing in accordance with the terms of their respective restructured loan agreement and on accrual status as of the respective reported dates.
Nonperforming Loans
In addition to TDR loans that may be classified as nonperforming, we also may have nonperforming loans that have not been modified as a TDR loan. We classify such loans as nonperforming at the earlier of the date when we determine: (i) interest or principal payments on the loan is past due 90 days or more; (ii) as a result of court proceedings, the collection of interest or principal payments based on the original contractual terms is not expected; or (iii) the full and timely collection of interest or principal is otherwise uncertain. Once a loan is classified as nonperforming, we generally place the loan on nonaccrual status. Interest accrued but not collected at the date a loan is placed on nonaccrual status is reversed against earnings. We had no loans classified as nonperforming as of November 30, 2017 or May 31, 2017 . In addition, we did not have any past due loans as of either November 30, 2017 or May 31, 2017 .
We provide additional information on the credit quality of our loan portfolio in "Note 4-Loans and Commitments."
Net Charge-Offs
Table 22 presents charge-offs, net of recoveries, and the net charge-off rate for the three and six months ended November 30, 2017 and 2016 .
Table 22 : Net Charge-Offs (Recoveries)
|
| Three Months Ended November 30, |
| Six Months Ended November 30, | ||||||||||||
(Dollars in thousands) |
| 2017 |
| 2016 |
| 2017 | | 2016 | ||||||||
Charge-offs: |
|
|
|
|
|
|
|
| ||||||||
RTFC |
| $ | - | |
| $ | - | |
| $ | - | |
| $ | 2,119 | |
Recoveries: |
|
|
|
|
|
|
|
| ||||||||
CFC |
| - | |
| (53 | ) |
| - | |
| (106 | ) | ||||
Net charge-offs (recoveries) |
| $ | - | |
| $ | (53 | ) |
| $ | - | |
| $ | 2,013 | |
|
|
|
|
|
|
|
|
| ||||||||
Average total loans outstanding |
| $ | 24,688,391 | |
| $ | 23,584,370 | |
| $ | 24,634,266 | |
| $ | 23,499,922 | |
|
|
|
|
|
|
|
|
| ||||||||
Net charge-off rate (1) |
| - | % |
| - | % |
| - | % |
| 0.02 | % | ||||
____________________________
(1) Calculated based on annualized net charge-offs (recoveries) for the period divided by average total outstanding loans for the period.
As displayed in Table 22 , we experienced no charge-offs during the current quarter and the six months ended November 30, 2017 . Charge-offs totaled $2 million during the six months ended November 30, 2016 , all of which were related to
30
telecommunications loans in the RTFC portfolio. Our average annual net charge-off rate has been less than 0.01% over the last three fiscal years.
Allowance for Loan Losses
The allowance for loan losses is determined based upon evaluation of the loan portfolio, past loss experience, specific problem loans, economic conditions and other pertinent factors that, in management's judgment, could affect the risk of loss in the loan portfolio. We review and adjust the allowance quarterly to cover estimated probable losses inherent in our loan portfolio as of each balance sheet date.
Table 23 summarizes changes in the allowance for loan losses for the three and six months ended November 30, 2017 and 2016 , and provides a comparison of the allowance by company as of November 30, 2017 and May 31, 2017 .
Table 23 : Allowance for Loan Losses
|
| Three Months Ended November 30, |
| Six Months Ended November 30, | ||||||||||||
(Dollars in thousands) |
| 2017 |
| 2016 |
| 2017 |
| 2016 | ||||||||
Beginning balance |
| $ | 37,078 | |
| $ | 33,120 | |
| $ | 37,376 | |
| $ | 33,258 | |
(Benefit) provision for loan losses |
| (304 | ) |
| 738 | |
| (602 | ) |
| 2,666 | | ||||
Net recoveries (charge-offs) |
| - | |
| 53 | |
| - | |
| (2,013 | ) | ||||
Ending balance |
| $ | 36,774 | |
| $ | 33,911 | |
| $ | 36,774 | |
| $ | 33,911 | |
|
|
|
|
|
|
|
|
| ||||||||
|
|
|
|
|
| November 30, 2017 |
| May 31, 2017 | ||||||||
Allowance for loan losses by company: |
|
|
|
|
|
|
|
| ||||||||
CFC |
|
|
|
|
| $ | 28,799 | |
| $ | 29,499 | | ||||
NCSC |
|
|
|
|
| 3,117 | |
| 2,910 | | ||||||
RTFC |
|
|
|
|
| 4,858 | |
| 4,967 | | ||||||
Total |
|
|
|
|
| $ | 36,774 | |
| $ | 37,376 | | ||||
|
|
|
|
|
|
|
|
| ||||||||
Allowance coverage ratios: |
|
|
|
|
|
|
|
| ||||||||
Loans to members |
|
|
|
|
| $ | 24,824,691 | |
| $ | 24,367,044 | | ||||
Percentage of loans to members |
|
|
|
|
| 0.15 | % |
| 0.15 | % | ||||||
The allowance for loan losses of $37 million as of November 30, 2017 decreased slightly from fiscal year end May 31, 2017 , while the allowance coverage ratio remained unchanged at 0.15% . The credit quality and performance statistics of our loan portfolio continued to remain strong. We experienced no charge-offs during the three and six months ended November 30, 2017 and we had no loans classified as nonperforming as of the end of the period. In comparison, we recorded a net charge-off of $2 million during the six months ended November 30, 2016 . Loans designated as individually impaired totaled $13 million as of both November 30, 2017 and May 31, 2017 , and the specific allowance related to these loans totaled $1 million and $2 million , respectively.
For additional information on our methodology for determining the allowance for loan losses, see "Note 1-Summary of Significant Accounting Policies" in our 2017 Form 10-K. See "Note 4-Loans and Commitments" of this Report for additional information on the credit quality of our loan portfolio and the allowance for loan losses.
Counterparty Credit Risk
We are exposed to counterparty risk related to the performance of the parties with which we entered into financial transactions, primarily for derivative instruments, cash, time deposits and investment securities that we have with various financial institutions. To mitigate this risk, we only enter into these transactions with financial institutions with investment-grade ratings. Our cash and time deposits with financial institutions generally have an original maturity of less than one year.
31
We manage our derivative counterparty credit risk by requiring that derivative counterparties participate in one of our committed bank revolving line of credit agreements, monitoring the overall credit worthiness of each counterparty, using counterparty specific credit risk limits, executing master netting arrangements and diversifying our derivative transactions among multiple counterparties. Our derivative counterparties had credit ratings ranging from A1 to Baa2 by Moody's Investors Service ("Moody's") and from AA- to A- by S&P Global Ratings ("S&P") as of November 30, 2017 . Our largest counterparty exposure, based on the outstanding notional amount, represented approximately 23% of the total outstanding notional amount of derivatives as of both November 30, 2017 and May 31, 2017 , respectively.
Credit Risk-Related Contingent Features
Our derivative contracts typically contain mutual early termination provisions, generally in the form of a credit rating trigger. Under the mutual credit rating trigger provisions, either counterparty may, but is not obligated to, terminate and settle the agreement if the credit rating of the other counterparty falls to a level specified in the agreement. If a derivative contract is terminated, the amount to be received or paid by us would be equal to the mark-to-market value, as defined in the agreement, as of the termination date.
Our senior unsecured credit ratings from Moody's and S&P were A2 and A, respectively, as of November 30, 2017 . Both Moody's and S&P had our ratings on stable outlook as of November 30, 2017 . Table 24 displays the notional amounts of our derivative contracts with rating triggers as of November 30, 2017 , and the payments that would be required if the contracts were terminated as of that date because of a downgrade of our unsecured credit ratings or the counterparty's unsecured credit ratings below A3/A-, below Baa1/BBB+ to or below Baa2/BBB, below Baa3/BBB- or to or below Ba2/BB+ by Moody's or S&P, respectively. In calculating the payment amounts that would be required upon termination of the derivative contracts, we assumed that the amounts for each counterparty would be netted in accordance with the provisions of the counterparty's master netting agreements. The net payment amounts are based on the fair value of the underlying derivative instrument, excluding the credit risk valuation adjustment, plus any unpaid accrued interest amounts.
Table 24 : Rating Triggers for Derivatives
(Dollars in thousands) |
| Notional Amount |
| Payable Due From CFC |
| Receivable Due to CFC |
| Net (Payable)/Receivable | ||||||||
Impact of rating downgrade trigger: |
|
|
|
|
|
|
|
| ||||||||
Falls below A3/A- (1) |
| $ | 56,985 | |
| $ | (11,670 | ) |
| $ | - | |
| $ | (11,670 | ) |
Falls below Baa1/BBB+ |
| 7,236,383 | |
| (143,459 | ) |
| 7,428 | |
| (136,031 | ) | ||||
Falls to or below Baa2/BBB (2) |
| 455,152 | |
| - | |
| 1,577 | |
| 1,577 | | ||||
Falls below Baa3/BBB- |
| 264,981 | |
| (18,102 | ) |
| - | |
| (18,102 | ) | ||||
Total |
| $ | 8,013,501 | |
| $ | (173,231 | ) |
| $ | 9,005 | |
| $ | (164,226 | ) |
____________________________
(1) Rating trigger for CFC falls below A3/A-, while rating trigger for counterparty falls below Baa1/BBB+ by Moody's or S&P, respectively.
(2) Rating trigger for CFC falls to or below Baa2/BBB, while rating trigger for counterparty falls to or below Ba2/BB+ by Moody's or S&P, respectively.
The aggregate fair value amount, including the credit risk valuation adjustment, of all interest rate swaps with rating triggers that were in a net liability position was $173 million as of November 30, 2017 . There were no counterparties that fell below the rating trigger levels in our interest swap contracts as of November 30, 2017 . If a counterparty has a credit rating that falls below the rating trigger level specified in the interest swap contract, we have the option to terminate all derivatives with the counterparty. However, we generally do not terminate such agreements early because our interest rate swaps are critical to our matched funding strategy.
See "Item 1A. Risk Factors" in our 2017 Form 10-K for additional information about credit risk related to our business.
32
LIQUIDITY RISK |
We consider liquidity to be the ability to access funding or convert assets to cash quickly and efficiently, or to rollover or issue new debt, both under normal operating conditions and under periods of market stress, at a reasonable cost to ensure that we can meet borrower loan requests and other short-term cash obligations.
Liquidity Risk Management
Our liquidity risk management framework is designed to meet our liquidity objectives of providing a reliable source of funding to members, meet maturing debt and other obligations, issue new debt and fund our operations on a cost-effective basis under normal operating conditions as well as under CFC-specific and/or market stress conditions. We engage in various activities to manage liquidity risk and achieve our liquidity objectives. Our Asset Liability Committee establishes guidelines that are intended to ensure that we maintain sufficient, diversified sources of liquidity to cover potential funding requirements as well as unanticipated contingencies. Our Treasury group develops strategies to manage our targeted liquidity position, projects our funding needs under various scenarios, including adverse circumstances, and monitors our liquidity position on an ongoing basis.
Liquidity Reserve
As part of our strategy in meeting our liquidity objectives, we seek to maintain access to liquidity in the form of both on-balance sheet and off-balance sheet funding sources that are readily accessible for immediate liquidity needs. Table 25 below presents the components of our liquidity reserve and a comparison of the amounts available as of November 30, 2017 and May 31, 2017 .
Table 25 : Liquidity Reserve
|
| November 30, 2017 |
| May 31, 2017 | ||||||||||||||||||||
(Dollars in millions) |
| Total |
| Accessed |
| Available |
| Total |
| Accessed |
| Available | ||||||||||||
Cash and cash equivalents |
| $ | 280 | |
| $ | - | |
| $ | 280 | |
| $ | 167 | |
| $ | - | |
| $ | 167 | |
Committed bank revolving line of credit agreements-unsecured (1) |
| 3,085 | |
| 2 | |
| 3,083 | |
| 3,165 | |
| 1 | |
| 3,164 | | ||||||
Guaranteed Underwriter Program committed facilities-secured (2) |
| 6,548 | |
| 5,173 | |
| 1,375 | |
| 5,798 | |
| 5,073 | |
| 725 | | ||||||
Farmer Mac revolving note purchase agreement, dated March 24, 2011-secured (3) |
| 4,500 | |
| 2,491 | |
| 2,009 | |
| 4,500 | |
| 2,513 | |
| 1,987 | | ||||||
Farmer Mac revolving note purchase agreement, dated July 31, 2015-secured |
| 300 | |
| - | |
| 300 | |
| 300 | |
| - | |
| 300 | | ||||||
Total |
| $ | 14,713 | |
| $ | 7,666 | |
| $ | 7,047 | |
| $ | 13,930 | |
| $ | 7,587 | |
| $ | 6,343 | |
(1) The accessed amount of $2 million and $1 million as of November 30, 2017 and May 31, 2017 , respectively, relates to letters of credit issued pursuant
to the line of credit agreement.
(2) The committed facilities under the Guaranteed Underwriting Program are not revolving.
(3) Availability subject to market conditions.
Borrowing Capacity
In addition to cash, our liquidity reserve includes access to funds under committed revolving line of credit agreements with banks, committed loan facilities under the Guaranteed Underwriter Program and our revolving note purchase agreements with Farmer Mac. Following is a discussion of our borrowing capacity and key terms and conditions under each of these facilities.
33
Committed Bank Revolving Line of Credit Agreements-Unsecured
Our committed bank revolving lines of credit may be used for general corporate purposes; however, we generally rely on them as a backup source of liquidity for our member and dealer commercial paper. We had $3,085 million of commitments under committed bank revolving line of credit agreements as of November 30, 2017 . Under our current committed bank revolving line of credit agreements, we have the ability to request up to $300 million of letters of credit, which would result in a reduction in the remaining available amount under the facilities.
On November 20, 2017 , we amended and restated the three-year and five-year committed bank revolving line of credit agreements to extend the maturity dates to November 20, 2020 and November 20, 2022 , respectively, and to terminate certain third-party bank commitments totaling $40 million under the three-year agreement and $40 million under the five- year agreement. As a result, the total commitment amount from third-parties under the three-year facility and the five-year facility is $1,493 million and $1,592 million , respectively, resulting in a combined total commitment amount under the two facilities of $3,085 million .
Table 26 presents the total commitment, the net amount available for use and the outstanding letters of credit under our committed bank revolving line of credit agreements as of November 30, 2017 . We did not have any outstanding borrowings under our bank revolving line of credit agreements as of November 30, 2017 .
Table 26 : Committed Bank Revolving Line of Credit Agreements
|
| November 30, 2017 |
|
|
|
| ||||||||||
(Dollars in millions) |
| Total Commitment |
| Letters of Credit Outstanding |
| Net Available for Advance |
| Maturity |
| Annual Facility Fee (1) | ||||||
3-year agreement |
| $ | 1,493 | |
| $ | - | |
| $ | 1,493 | |
| November 20, 2020 |
| 7.5 bps |
5-year agreement |
| 1,592 | |
| 2 | |
| 1,590 | |
| November 20, 2022 |
| 10 bps | |||
Total |
| $ | 3,085 | |
| $ | 2 | |
| $ | 3,083 | |
|
|
|
|
____________________________
(1) Facility fee based on CFC's senior unsecured credit ratings in accordance with the established pricing schedules at the inception of the related agreement.
Our committed bank revolving line of credit agreements do not contain a material adverse change clause or rating triggers that would limit the banks' obligations to provide funding under the terms of the agreements; however, we must be in compliance with the covenants to draw on the facilities. We have been and expect to continue to be in compliance with the covenants under our committed bank revolving line of credit agreements. As such, we could draw on these facilities to repay dealer or member commercial paper that cannot be rolled over. See "Debt Covenants and Financial Ratios" below for additional information, including the specific financial ratio requirements under our committed bank revolving line of credit agreements.
Guaranteed Underwriter Program Committed Facilities-Secured
Under the Guaranteed Underwriter Program we can borrow from the Federal Financing Bank and use the proceeds to refinance existing indebtedness. As part of the program, we pay fees, based on outstanding borrowings, that support the USDA Rural Economic Development Loan and Grant program. The borrowings under this program are guaranteed by RUS.
On November 9, 2017 , we closed on a $750 million committed loan facility ("Series M") from the Federal Financing Bank under the Guaranteed Underwriter Program. Pursuant to this facility, we may borrow any time before July 15, 2022. Each advance is subject to quarterly amortization and a final maturity not longer than 20 years from the advance date. The closing of this committed loan facility increased the amount available for access under the Guaranteed Underwriter Program to $1,375 million as of November 30, 2017 . Of this amount, $250 million is available for advance through January 15, 2019, $375 million is available for advance through October 15, 2019 and $750 million is available through July 15, 2022.
We are required to pledge eligible distribution system or power supply system loans as collateral in an amount at least equal to the total outstanding borrowings under the Guaranteed Underwriter Program. See "Consolidated Balance Sheet Analysis-Debt-Collateral Pledged" and "Note 4-Loans and Commitments" for additional information on pledged collateral.
34
Farmer Mac Revolving Note Purchase Agreements-Secured
As indicated in Table 25 , we have two revolving note purchase agreements with Farmer Mac, which together allow us to borrow up to $4,800 million from Farmer Mac. Under the terms of the first revolving note purchase agreement with Farmer Mac dated March 24, 2011, as amended, we can borrow, subject to market conditions, up to $4,500 million at any time through January 11, 2020, and such date shall automatically extend on each anniversary date of the closing for an additional year, unless prior to any such anniversary date, Farmer Mac provides us with a notice that the draw period will not be extended beyond the remaining term. This revolving note purchase agreement allows us to borrow, repay and re-borrow funds at any time through maturity, as market conditions permit, provided that the outstanding principal amount at any time does not exceed the total available under the agreement. Each borrowing under the note purchase agreement is evidenced by a pricing agreement setting forth the interest rate, maturity date and other related terms as we may negotiate with Farmer Mac at the time of each such borrowing. We may select a fixed rate or variable rate at the time of each advance with a maturity as determined in the applicable pricing agreement. We had outstanding secured notes payable totaling $2,491 million and $2,513 million as of November 30, 2017 and May 31, 2017 , respectively, under the Farmer Mac revolving note purchase agreement of $4,500 million . The available borrowing amount totaled $2,009 million as of November 30, 2017 .
Under the terms of the second revolving note purchase agreement with Farmer Mac dated July 31, 2015, we can borrow up to $300 million at any time through July 31, 2018 at a fixed spread over LIBOR. This agreement also allows us to borrow, repay and re-borrow funds at any time through maturity, provided that the outstanding principal amount at any time does not exceed the total available under the agreement. We had no outstanding notes payable under this agreement as of November 30, 2017 and May 31, 2017 . We currently do not expect to renew this agreement.
Pursuant to both Farmer Mac revolving note purchase agreements, we are required to pledge eligible distribution system or power supply system loans as collateral in an amount at least equal to the total principal amount of notes outstanding. See "Consolidated Balance Sheet Analysis-Debt-Collateral Pledged" and "Note 4-Loans and Commitments" for additional information on pledged collateral.
Short-Term Borrowings
We rely on short-term borrowings, which we refer to as our short-term funding portfolio, as a source to meet our daily, near-term funding needs. Our short-term funding portfolio consists of commercial paper, which we offer to members and dealers, select notes and daily liquidity fund notes offered to members, and bank-bid notes and medium-term notes offered to members and dealers. Table 27 displays the composition of our short-term borrowings as of November 30, 2017 and May 31, 2017 .
Table 27 : Short-Term Borrowings
|
| November 30, 2017 |
| May 31, 2017 | ||||||||||
(Dollars in thousands) |
| Amount Outstanding |
| % of Total Debt Outstanding |
| Amount |
| % of Total Debt Outstanding | ||||||
Short-term borrowings: |
|
|
|
|
|
|
|
| ||||||
Commercial paper: |
|
|
|
|
|
|
|
| ||||||
Commercial paper sold through dealers, net of discounts |
| $ | 579,859 | |
| 2 | % |
| $ | 999,691 | |
| 4 | % |
Commercial paper sold directly to members, at par |
| 1,133,057 | |
| 5 | |
| 928,158 | |
| 4 | | ||
Total commercial paper |
| 1,712,916 | |
| 7 | |
| 1,927,849 | |
| 8 | | ||
Select notes |
| 770,376 | |
| 3 | |
| 696,889 | |
| 3 | | ||
Daily liquidity fund notes |
| 866,065 | |
| 4 | |
| 527,990 | |
| 2 | | ||
Medium-term notes sold to members |
| 207,835 | |
| 1 | |
| 190,172 | |
| 1 | | ||
Total short-term borrowings |
| $ | 3,557,192 | |
| 15 | % |
| $ | 3,342,900 | |
| 14 | % |
Our short-term borrowings totaled $3,557 million and accounted for 15% of total debt outstanding as of November 30, 2017 , compared with $3,343 million , or 14% , of total debt outstanding as of May 31, 2017 . Of the total outstanding commercial paper, $580 million and $1,000 million was issued to dealers as of November 30, 2017 and May 31, 2017 ,
35
respectively. We intend to manage our short-term wholesale funding risk by maintaining outstanding dealer commercial paper at an amount below $1,250 million for the foreseeable future.
Long-Term and Subordinated Debt
Long-term and subordinated debt represents the most significant component of our funding. The issuance of long-term debt allows us to reduce our reliance on short-term borrowings and manage our refinancing and interest rate risk, due in part to the multi-year contractual maturity structure of long-term debt. In addition to access to private debt facilities, we also issue debt in the public capital markets. Under the SEC rules, we are classified as a "well-known seasoned issuer." In November 2017, we filed a new shelf registration statement for our senior and subordinated debt securities under which we can register an unlimited amount of senior and subordinated debt securities, including medium-term notes, member capital securities and subordinated deferrable debt, until November 2020. Notwithstanding the foregoing, we have contractual limitations with respect to the amount of senior indebtedness we may incur. See "MD&A-Liquidity Risk" of our 2017 Form 10-K for additional information on our shelf registration statements with the SEC.
As discussed in " Consolidated Balance Sheet Analysis-Debt, " l ong-term and subordinated debt totaled $20,529 million and accounted for 85% of total debt outstanding as of November 30, 2017 , compared with $20,117 million , or 86% , of total debt outstanding as of May 31, 2017 . The increase in total debt outstanding, including long-term and subordinated debt, was primarily due to the issuance of debt to fund loan portfolio growth. Table 28 summarizes long-term and subordinated debt issuances and principal maturities and amortizations, including repurchases and redemptions, during the six months ended November 30, 2017 .
Table 28 : Issuances and Maturities of Long-Term and Subordinated Debt (1)
|
| Six Months Ended November 30, 2017 | ||||||||||
(Dollars in thousands) |
| Issuances |
| Maturities |
| Increase/Decrease | ||||||
Long-term and subordinated debt activity: (1) |
|
|
|
|
|
| ||||||
Collateral trust bonds |
| $ | - | |
| $ | 5,000 | |
| $ | (5,000 | ) |
Guaranteed Underwriter Program notes payable |
| 100,000 | |
| 25,556 | |
| 74,444 | | |||
Farmer Mac notes payable |
| - | |
| 21,925 | |
| (21,925 | ) | |||
Medium-term notes sold to members |
| 125,335 | |
| 143,547 | |
| (18,212 | ) | |||
Medium-term notes sold to dealers |
| 402,592 | |
| 7,791 | |
| 394,801 | | |||
Members' subordinated certificates |
| 3,989 | |
| 23,340 | |
| (19,351 | ) | |||
Total |
| $ | 631,916 | |
| $ | 227,159 | |
| $ | 404,757 | |
____________________________
(1) Amounts exclude unamortized debt issuance costs and discounts.
Table 29 summarizes the scheduled amortization of the principal amount of long-term debt, subordinated deferrable debt and members' subordinated certificates as of November 30, 2017 .
Table 29 : Principal Maturity of Long-Term and Subordinated Debt
(Dollars in thousands) |
| Amount Maturing (1) |
| % of Total | |||
Fiscal year ending: |
|
|
|
| |||
May 31, 2018 |
| $ | 1,065,619 | |
| 5 | % |
May 31, 2019 |
| 2,672,139 | |
| 13 | | |
May 31, 2020 |
| 1,428,928 | |
| 7 | | |
May 31, 2021 |
| 1,323,843 | |
| 6 | | |
May 31, 2022 |
| 1,573,604 | |
| 8 | | |
Thereafter |
| 12,463,802 | |
| 61 | | |
Total |
| $ | 20,527,935 | |
| 100 | % |
36
____________________________
(1) Excludes $1 million in subscribed and unissued member subordinated certificates for which a payment has been received. Member loan subordinated certificates totaling $290 million amortize annually based on the unpaid principal balance of the related loan.
On January 2, 2018, we provided notice to RUS that on January 16, 2018 we will redeem $325 million of notes payable outstanding under the Guaranteed Underwriter Program, with an original maturity of April 15, 2026.
We provide additional information on our financing activities above under "Consolidated Balance Sheet Analysis-Debt."
Investment Portfolio
In addition to our primary sources of liquidity discussed above, we have an investment portfolio, composed of time deposits, available-for-sale investment securities and held-to-maturity investment securities, which totaled $391 million and $319 million as of November 30, 2017 and May 31, 2017 , respectively. We intend for our investment portfolio to remain adequately liquid to serve as a contingent supplemental source of liquidity for unanticipated liquidity needs.
During the second quarter of fiscal year 2018, we commenced the purchase of additional investment securities, consisting primarily of certificates of deposit, commercial paper, corporate debt securities, commercial mortgage-backed securities, and other asset-backed securities. Pursuant to our investment policy guidelines, all fixed-income securities, at the time of purchase, must be rated at least investment grade based on external credit ratings, when available, or the corresponding equivalent, when not available. Securities rated investment grade, that is those rated Baa3 or higher by Moody's or BBB- or higher by S&P, are generally considered by the rating agencies to be of lower credit risk than non-investment grade securities. We have the positive intent and ability to hold these securities to maturity. As such, we have classified them as held to maturity on our condensed consolidated balance sheet.
Our investment portfolio is unencumbered and structured so that securities have active secondary or resale markets under normal market conditions. The objective of the portfolio is to achieve returns commensurate with the level of risk assumed subject to CFC's investment policy guidelines and liquidity requirements.
We provide additional information on available-for-sale and held-to-maturity investment securities held in our our investment portfolio in "Note 3-Investment Securities."
Projected Near-Term Sources and Uses of Liquidity
As discussed above, our primary sources of liquidity include cash flows from operations, our short-term funding portfolio, our liquidity reserve and the issuance of long-term and subordinated debt, as well as loan principal and interest payments. Our primary uses of liquidity include loan advances to members, principal and interest payments on borrowings, periodic settlement payments related to derivative contracts, costs related to the disposition of foreclosed assets and operating expenses.
Table 30 below displays our projected sources and uses of cash, by quarter, over the next six quarters through the quarter ending May 31, 2019 . Our projected liquidity position, reflects our current plan to expand our investment portfolio. Our assumptions also include the following: (i) the estimated issuance of long-term debt, including collateral trust bonds and private placement of term debt, is based on maintaining a matched funding position within our loan portfolio with our bank revolving lines of credit serving as a backup liquidity facility for commercial paper and on maintaining outstanding dealer commercial paper at an amount below $1,250 million; (ii) long-term loan scheduled amortization payments represent the scheduled long-term loan payments for loans outstanding as of November 30, 2017 , and our current estimate of long-term loan prepayments, which the amount and timing of are subject to change; (iii) other loan repayments and other loan advances primarily relate to line of credit repayments and advances; (iv) long-term debt maturities reflect scheduled maturities of outstanding term debt for the periods presented; and (v) long-term loan advances reflect our current estimate of member demand for loans, the amount and timing of which are subject to change.
37
Table 30 : Projected Sources and Uses of Liquidity (1)
|
| Projected Sources of Liquidity |
| Projected Uses of Liquidity |
|
| ||||||||||||||||||||||||||||||
(Dollars in millions) |
| Long-Term Debt Issuance |
| Anticipated Long-Term |
| Other Loan Repayments (3) |
| Total Projected |
| Long-Term Debt Maturities (4) |
| Long-Term |
| Other Loan Advances (5) |
| Total Projected |
| Other Sources/ (Uses) of Liquidity (6) | ||||||||||||||||||
|
|
|
|
|
|
|
|
|
|
|
|
|
|
|
|
|
|
| ||||||||||||||||||
3Q FY 2018 |
| $ | 1,070 | |
| $ | 309 | |
| $ | 36 | |
| $ | 1,415 | |
| $ | 1,141 | |
| $ | 741 | |
| $ | 62 | |
| $ | 1,944 | |
| $ | 463 | |
4Q FY 2018 |
| 490 | |
| 286 | |
| - | |
| 776 | |
| 333 | |
| 307 | |
| - | |
| 640 | |
| (141 | ) | |||||||||
1Q FY 2019 |
| 385 | |
| 305 | |
| 52 | |
| 742 | |
| 162 | |
| 313 | |
| - | |
| 475 | |
| (262 | ) | |||||||||
2Q FY 2019 |
| 1,335 | |
| 323 | |
| - | |
| 1,658 | |
| 1,569 | |
| 290 | |
| 13 | |
| 1,872 | |
| 227 | | |||||||||
3Q FY 2019 |
| 845 | |
| 291 | |
| - | |
| 1,136 | |
| 696 | |
| 493 | |
| - | |
| 1,189 | |
| 28 | | |||||||||
4Q FY 2019 |
| 585 | |
| 272 | |
| - | |
| 857 | |
| 398 | |
| 485 | |
| - | |
| 883 | |
| 40 | | |||||||||
Total |
| $ | 4,710 | |
| $ | 1,786 | |
| $ | 88 | |
| $ | 6,584 | |
| $ | 4,299 | |
| $ | 2,629 | |
| $ | 75 | |
| $ | 7,003 | |
| $ | 355 | |
____________________________
(1) The dates presented represent the end of each quarterly period through the quarter ending May 31, 2019 .
(2) Anticipated long-term loan repayments include scheduled long-term loan amortizations, repricings and sales.
(3) Other loan repayments include anticipated short-term loan repayments.
(4) Long-term debt maturities also includes medium-term notes with an original maturity of one year or less and expected early redemptions of debt.
(5) Other loan advances include anticipated short-term loan advances.
(6) Includes net increase or decrease to dealer commercial paper, and purchases and maturity of investments.
As displayed in Table 30 , we currently project long-term advances of $1,651 million over the next 12 months, which we anticipate will exceed anticipated loan repayments over the same period of $1,223 million by approximately $428 million . The estimates presented above are developed at a particular point in time based on our expected future business growth and funding. Our actual results and future estimates may vary, perhaps significantly, from the current projections, as a result of changes in market conditions, management actions or other factors.
Credit Ratings
Our funding and liquidity, borrowing capacity, ability to access capital markets and other sources of funds and the cost of these funds are partially dependent on our credit ratings. Rating agencies base their ratings on numerous factors, including liquidity, capital adequacy, industry position, member support, management, asset quality, quality of earnings and the probability of systemic support. Significant changes in these factors could result in different ratings. Table 31 displays our credit ratings as of November 30, 2017 , which were unchanged as of the date of the filing of this Report.
Table 31 : Credit Ratings
|
| November 30, 2017 | ||||
|
| Moody's |
| S&P |
| Fitch |
Long-term issuer credit rating (1) |
| A2 |
| A |
| A |
Senior secured debt (2) |
| A1 |
| A |
| A+ |
Senior unsecured debt (3) |
| A2 |
| A |
| A |
Commercial paper |
| P-1 |
| A-1 |
| F1 |
Outlook |
| Stable |
| Stable |
| Stable |
___________________________
(1) Based on our senior unsecured debt rating.
(2) Applies to our collateral trust bonds.
(3) Applies to our medium-term notes.
During the three months ended November 30, 2017 , Moody's and S&P affirmed our ratings and outlook. In order to access the commercial paper markets at attractive rates, we believe we need to maintain our current commercial paper credit ratings of P-1 by Moody's, A-1 by S&P and F1 by Fitch. In addition, the notes payable to the Federal Financing Bank and guaranteed by RUS under the Guaranteed Underwriter Program contain a provision that if during any portion of the fiscal
38
year, our senior secured credit ratings do not have at least two of the following ratings: (i) A3 or higher from Moody's, (ii) A- or higher from S&P, (iii) A- or higher from Fitch or (iv) an equivalent rating from a successor rating agency to any of the above rating agencies, we may not make cash patronage capital distributions in excess of 5% of total patronage capital. See "Credit Risk-Counterparty Credit Risk-Credit Risk-Related Contingent Features" above for information on credit rating provisions related to our derivative contracts.
Financial Ratios
Our debt-to-equity ratio decreased to 19.87 -to-1 as of November 30, 2017 , from 21.94 -to-1 as of May 31, 2017 , primarily due to an increase in equity resulting from our reported net income of $188 million for the six months ended November 30, 2017 , which was partially offset by patronage capital retirement of $45 million in September 2017.
Our adjusted debt-to-equity ratio increased to 6.12 -to-1 as of November 30, 2017 , from 5.95 -to-1 as of May 31, 2017 , largely due to an increase in debt outstanding to fund loan growth. We provide a reconciliation of our adjusted debt-to-equity ratio to the most comparable GAAP measure and an explanation of the adjustments below in "Non-GAAP Financial Measures."
Debt Covenants
As part of our short-term and long-term borrowing arrangements, we are subject to various financial and operational covenants. If we fail to maintain specified financial ratios, such failure could constitute a default by CFC of certain debt covenants under our committed bank revolving line of credit agreements and senior debt indentures. We were in compliance with all covenants and conditions under our committed bank revolving line of credit agreements and senior debt indentures as of November 30, 2017 .
As discussed above in "Summary of Selected Financial Data," the financial covenants set forth in our committed bank revolving line of credit agreements and senior debt indentures are based on adjusted financial measures, including adjusted TIER. We provide a reconciliation of adjusted TIER and other non-GAAP measures disclosed in this Report to the most comparable GAAP measures and an explanation of the adjustments below in "Non-GAAP Financial Measures."
MARKET RISK |
Interest rate risk represents our primary market risk. Interest rate risk is the risk arising from movements in interest rates that may result in differences between the timing of contractual maturities, re-pricing characteristics and prepayments on our assets and their related liabilities.
Interest Rate Risk Management
Our interest rate risk exposure is primarily related to the funding of the fixed-rate loan portfolio. Our Asset Liability Committee provides oversight over maintaining our interest rate position within a prescribed policy range using approved strategies. The Asset Liability Committee reviews a complete interest rate risk analysis, reviews proposed modifications, if any, to our interest rate risk management strategy and considers adopting strategy changes. Our Asset Liability Committee monitors interest rate risk and meets quarterly to review and discuss information such as national economic forecasts, federal funds and interest rate forecasts, interest rate gap analysis, our liquidity position, loan and debt maturities, short-term and long-term funding needs, anticipated loan demands, credit concentration risk, derivative counterparty exposure and financial forecasts. The Asset Liability Committee also discusses the composition of fixed-rate versus variable-rate lending, new funding opportunities, changes to the nature and mix of assets and liabilities for structural mismatches, and interest rate swap transactions.
Matched Funding Objective
Our funding objective is to manage the matched funding of asset and liability repricing terms within a range of adjusted total assets (calculated by excluding derivative assets from total assets) deemed appropriate by the Asset Liability Committee based on the current environment and extended outlook for interest rates. We refer to the difference between fixed-rate loans
39
scheduled for amortization or repricing and the fixed-rate liabilities and equity funding those loans as our interest rate gap. Our primary strategies for managing our interest rate risk include the use of derivatives and limiting the amount of fixed-rate assets that can be funded by variable-rate debt to a specified percentage of adjusted total assets based on market conditions.
We provide our members with many options on loans with regard to interest rates, the term for which the selected interest rate is in effect and the ability to convert or prepay the loan. Long-term loans generally have maturities of up to 35 years. Borrowers may select fixed interest rates for periods of one year through the life of the loan. We do not match fund the majority of our fixed-rate loans with a specific debt issuance at the time the loans are advanced. We fund the amount of fixed-rate assets that exceed fixed-rate debt and members' equity with short-term debt, primarily commercial paper.
Interest Rate Gap Analysis
To monitor and mitigate interest rate risk in the funding of fixed-rate loans, we perform a monthly interest rate gap analysis that provides a comparison between fixed-rate assets repricing or maturing by year and fixed-rate liabilities and members' equity maturing by year.
We maintain an unmatched position on our fixed-rate assets within a targeted range of adjusted total assets. The limited unmatched position is intended to provide flexibility to ensure that we are able to match the current maturing portion of long-term fixed rate loans based on maturity date and the opportunity in the current low interest rate environment to increase the gross yield on our fixed rate assets without taking what we would consider to be excessive risk.
Table 32 displays the scheduled amortization and repricing of fixed-rate assets and liabilities outstanding as of November 30, 2017 . We exclude variable-rate loans from our interest rate gap analysis as we do not consider the interest rate risk on these loans to be significant because they are subject to repricing at least monthly. Loans with variable interest rates accounted for 10% and 9% of our total loan portfolio as of November 30, 2017 and May 31, 2017 , respectively. Fixed-rate liabilities include debt issued at a fixed rate as well as variable-rate debt swapped to a fixed rate using interest rate swaps. Fixed-rate debt swapped to a variable rate using interest rate swaps is excluded from the analysis since it is used to match fund the variable-rate loan pool. With the exception of members' subordinated certificates, which are generally issued with extended maturities, and commercial paper, our liabilities have average maturities that closely match the repricing terms (but not the maturities) of our fixed-rate loans.
(Dollars in millions) |
| Prior to 5/31/18 |
| Two Years 6/1/18 to 5/31/20 |
| Two Years 6/1/20 to |
| Five Years 6/1/22 to |
| 10 Years 6/1/27 to 5/31/37 |
| 6/1/37 and Thereafter |
| Total | ||||||||||||||
Asset amortization and repricing |
| $ | 987 | |
| $ | 3,409 | |
| $ | 2,847 | |
| $ | 5,551 | |
| $ | 6,652 | |
| $ | 2,970 | |
| $ | 22,416 | |
Liabilities and members' equity: |
|
| |
|
|
|
|
|
|
|
|
|
|
|
| |||||||||||||
Long-term debt |
| $ | 1,909 | |
| $ | 3,687 | |
| $ | 2,249 | |
| $ | 5,331 | |
| $ | 4,206 | |
| $ | 1,298 | |
| $ | 18,680 | |
Subordinated certificates |
| 11 | |
| 36 | |
| 69 | |
| 946 | |
| 162 | |
| 665 | |
| 1,889 | | |||||||
Members' equity (1) |
| - | |
| 23 | |
| 24 | |
| 108 | |
| 297 | |
| 856 | |
| 1,308 | | |||||||
Total liabilities and members' equity (2) |
| $ | 1,920 | |
| $ | 3,746 | |
| $ | 2,342 | |
| $ | 6,385 | |
| $ | 4,665 | |
| $ | 2,819 | |
| $ | 21,877 | |
Gap (3) |
| $ | (933 | ) |
| $ | (337 | ) |
| $ | 505 | |
| $ | (834 | ) |
| $ | 1,987 | |
| $ | 151 | |
| $ | 539 | |
|
|
|
|
|
|
|
|
|
|
|
|
|
|
| ||||||||||||||
Cumulative gap |
| (933 | ) |
| (1,270 | ) |
| (765 | ) |
| (1,599 | ) |
| 388 | |
| 539 | |
|
| ||||||||
Cumulative gap as a % of total assets |
| (3.61 | )% |
| (4.91 | )% |
| (2.96 | )% |
| (6.18 | )% |
| 1.50 | % |
| 2.08 | % |
|
| ||||||||
Cumulative gap as a % of adjusted total assets (4) |
| (3.62 | ) |
| (4.92 | ) |
| (2.97 | ) |
| (6.20 | ) |
| 1.50 | |
| 2.09 | |
|
| ||||||||
____________________________
(1) Includes the portion of the allowance for loan losses and subordinated deferrable debt allocated to fund fixed-rate assets and excludes noncash adjustments from the accounting for derivative financial instruments.
(2) Debt is presented based on call date.
(3) Calculated based on the amount of assets amortizing and repricing less total liabilities and members' equity.
(4) Adjusted total assets represents total assets reported in our condensed consolidated balance sheets less derivative assets.
40
The difference, or interest rate gap, of $539 million between the fixed-rate loans scheduled for amortization or repricing of $22,416 million and the fixed-rate liabilities and equity funding the loans of $21,877 million presented in Table 32 reflects the amount of fixed-rate assets that are funded with short-term and variable-rate debt as of November 30, 2017 . The gap of $539 million represented 2.08% of total assets and 2.09% of adjusted total assets (total assets excluding derivative assets) as of November 30, 2017 . As discussed above, we manage this gap within a prescribed range because funding long-term, fixed-rate loans with short-term and variable-rate debt may expose us to higher interest rate and liquidity risk.
NON-GAAP FINANCIAL MEASURES |
In addition to financial measures determined in accordance with GAAP, management evaluates performance based on certain non-GAAP measures, which we refer to as "adjusted" measures. We provide a discussion of each of these non-GAAP measures in our 2017 Form 10-K under "Item 7. MD&A-Non-GAAP Measures." Below we provide a reconciliation of our adjusted measures to the most comparable GAAP measures in this section. We believe our non-GAAP adjusted metrics, which are not a substitute for GAAP and may not be consistent with similarly titled non-GAAP measures used by other companies, provide meaningful information and are useful to investors because management uses these metrics to compare operating results across financial reporting periods, for internal budgeting and forecasting purposes, for compensation decisions and for short- and long-term strategic planning decisions. In addition, certain of the financial covenants in our committed bank revolving line of credit agreements and debt indentures are based on our adjusted measures.
Statements of Operations Non-GAAP Adjustments
Table 33 provides a reconciliation of adjusted interest expense, adjusted net interest income and adjusted net income to the comparable GAAP measures three and six months ended November 30, 2017 and 2016 . The adjusted amounts are used in the calculation of our adjusted net interest yield and adjusted TIER.
|
| Three Months Ended November 30, |
| Six Months Ended November 30, | ||||||||||||
(Dollars in thousands) |
| 2017 |
| 2016 |
| 2017 |
| 2016 | ||||||||
Interest expense |
| $ | (195,170 | ) |
| $ | (183,654 | ) |
| $ | (387,901 | ) |
| $ | (364,734 | ) |
Include: Derivative cash settlements |
| (19,635 | ) |
| (21,587 | ) |
| (39,857 | ) |
| (44,977 | ) | ||||
Adjusted interest expense |
| $ | (214,805 | ) |
| $ | (205,241 | ) |
| $ | (427,758 | ) |
| $ | (409,711 | ) |
|
|
|
|
|
|
|
|
| ||||||||
Net interest income |
| $ | 70,653 | |
| $ | 73,502 | |
| $ | 143,837 | |
| $ | 149,257 | |
Include: Derivative cash settlements |
| (19,635 | ) |
| (21,587 | ) |
| (39,857 | ) |
| (44,977 | ) | ||||
Adjusted net interest income |
| $ | 51,018 | |
| $ | 51,915 | |
| $ | 103,980 | |
| $ | 104,280 | |
|
|
|
|
|
|
|
|
| ||||||||
Net income |
| $ | 178,723 | |
| $ | 395,304 | |
| $ | 187,738 | |
| $ | 263,043 | |
Exclude: Derivative forward value gains |
| 145,228 | |
| 362,247 | |
| 119,252 | |
| 197,344 | | ||||
Adjusted net income |
| $ | 33,495 | |
| $ | 33,057 | |
| $ | 68,486 | |
| $ | 65,699 | |
We consider the cost of derivatives to be an inherent cost of funding and hedging our loan portfolio and, therefore, economically similar to the interest expense that we recognize on debt issued for funding. We therefore include derivative cash settlements in our adjusted interest expense and exclude the unrealized forward value of derivatives from our adjusted net income.
41
TIER and Adjusted TIER
Table 34 presents our TIER and adjusted TIER for the three and six months ended November 30, 2017 and 2016 .
Table 34 : TIER and Adjusted TIER
|
| Three Months Ended November 30, |
| Six Months Ended November 30, | ||||||||
|
| 2017 |
| 2016 |
| 2017 |
| 2016 | ||||
TIER (1) |
| 1.92 | |
| 3.15 | |
| 1.48 | |
| 1.72 | |
|
|
|
|
|
|
|
|
| ||||
Adjusted TIER (2) |
| 1.16 | |
| 1.16 | |
| 1.16 | |
| 1.16 | |
____________________________
(1) TIER is calculated based on net income plus interest expense for the period divided by interest expense for the period.
(2) Adjusted TIER is calculated based on adjusted net income plus adjusted interest expense for the period divided by adjusted interest expense for the period.
Debt-to-Equity and Adjusted Debt-to-Equity
Table 35 provides a reconciliation between the liabilities and equity used to calculate the debt-to-equity and the adjusted debt-to-equity ratios as of November 30, 2017 and May 31, 2017 . As indicated in the table below, subordinated debt is treated in the same manner as equity in calculating our adjusted-debt-to-equity ratio.
(Dollars in thousands) |
| November 30, 2017 | | May 31, 2017 | ||||
Total liabilities |
| $ | 24,640,195 | |
| $ | 24,106,887 | |
Exclude: |
|
|
|
| ||||
Derivative liabilities |
| 304,307 | |
| 385,337 | | ||
Debt used to fund loans guaranteed by RUS |
| 164,172 | |
| 167,395 | | ||
Subordinated deferrable debt |
| 742,341 | |
| 742,274 | | ||
Subordinated certificates |
| 1,399,675 | |
| 1,419,025 | | ||
Adjusted total liabilities |
| $ | 22,029,700 | |
| $ | 21,392,856 | |
|
|
|
|
| ||||
Total equity |
| $ | 1,240,048 | |
| $ | 1,098,805 | |
Include: |
| |
|
| ||||
Subordinated deferrable debt |
| 742,341 | |
| 742,274 | | ||
Subordinated certificates |
| 1,399,675 | |
| 1,419,025 | | ||
Total subordinated debt and certificates |
| 2,142,016 | |
| 2,161,299 | | ||
Exclude: |
|
|
|
| ||||
Prior year-end cumulative derivative forward value losses |
| (340,976 | ) |
| (520,357 | ) | ||
Current year derivative forward value gains |
| 119,252 | |
| 179,381 | | ||
Total cumulative derivative forward value losses |
| (221,724 | ) |
| (340,976 | ) | ||
Accumulated other comprehensive income (1) |
| 3,316 | |
| 3,702 | | ||
Adjusted total equity |
| $ | 3,600,472 | |
| $ | 3,597,378 | |
____________________________
(1) Represents the AOCI related to derivatives. See "Note 9-Equity" for a breakout of our AOCI components.
42
Table 36 displays the calculations of our debt-to-equity and adjusted debt-to-equity ratios as of November 30, 2017 and May 31, 2017 .
Table 36 : Debt-to-Equity Ratio
|
| November 30, 2017 |
| May 31, 2017 | ||
Debt-to-equity ratio (1) |
| 19.87 | |
| 21.94 | |
Adjusted debt-to-equity ratio (2) |
| 6.12 | |
| 5.95 | |
____________________________
(1) Calculated based on total liabilities as of the end of the period divided by total equity as of the end of the period.
(2) Calculated based on adjusted total liabilities at period end divided by adjusted total equity at period end.
43
Item 1. | Financial Statements |
|
|
| Page |
| Condensed Consolidated Statements of Operations |
| 45 |
| Condensed Consolidated Statements of Comprehensive Income |
| 46 |
| Condensed Consolidated Balance Sheets |
| 47 |
| Condensed Consolidated Statements of Changes in Equity |
| 48 |
| Condensed Consolidated Statements of Cash Flows |
| 49 |
| Notes to Condensed Consolidated Financial Statements |
| 50 |
| Note 1 - Summary of Significant Accounting Policies |
| 50 |
| Note 2 - Variable Interest Entities |
| 54 |
| Note 3 - Investment Securities |
| 55 |
| Note 4 - Loans and Commitments |
| 58 |
| Note 5 - Short-Term Borrowings |
| 67 |
| Note 6 - Long-Term Debt |
| 69 |
| Note 7 - Subordinated Deferrable Debt |
| 70 |
| Note 8 - Derivative Instruments and Hedging Activities |
| 70 |
| Note 9 - Equity |
| 73 |
| Note 10 - Guarantees |
| 76 |
| Note 11 - Fair Value Measurement |
| 77 |
| Note 12 - Business Segments |
| 80 |
44
NATIONAL RURAL UTILITIES COOPERATIVE FINANCE CORPORATION
CONDENSED CONSOLIDATED STATEMENTS OF OPERATIONS
(UNAUDITED)
|
| Three Months Ended November 30, |
| Six Months Ended November 30, | ||||||||||||
(Dollars in thousands) |
| 2017 |
| 2016 |
| 2017 | | 2016 | ||||||||
Interest income |
| $ | 265,823 | |
| $ | 257,156 | |
| $ | 531,738 | |
| $ | 513,991 | |
Interest expense |
| (195,170 | ) |
| (183,654 | ) |
| (387,901 | ) |
| (364,734 | ) | ||||
Net interest income |
| 70,653 | |
| 73,502 | |
| 143,837 | |
| 149,257 | | ||||
Benefit (provision) for loan losses |
| 304 | |
| (738 | ) |
| 602 | |
| (2,666 | ) | ||||
Net interest income after benefit (provision) for loan losses |
| 70,957 | |
| 72,764 | |
| 144,439 | |
| 146,591 | | ||||
Non-interest income: |
|
| |
|
| |
|
| |
|
| | ||||
Fee and other income |
| 5,542 | |
| 5,097 | |
| 9,487 | |
| 9,627 | | ||||
Derivative gains |
| 125,593 | |
| 340,660 | |
| 79,395 | |
| 152,367 | | ||||
Results of operations of foreclosed assets |
| (10 | ) |
| (549 | ) |
| (34 | ) |
| (1,661 | ) | ||||
Total non-interest income |
| 131,125 | |
| 345,208 | |
| 88,848 | |
| 160,333 | | ||||
Non-interest expense: |
|
| |
|
| |
|
| |
|
| | ||||
Salaries and employee benefits |
| (12,009 | ) |
| (11,451 | ) |
| (23,832 | ) |
| (22,875 | ) | ||||
Other general and administrative expenses |
| (9,905 | ) |
| (9,181 | ) |
| (19,718 | ) |
| (18,616 | ) | ||||
Other non-interest expense |
| (618 | ) |
| (517 | ) |
| (1,140 | ) |
| (960 | ) | ||||
Total non-interest expense |
| (22,532 | ) |
| (21,149 | ) |
| (44,690 | ) |
| (42,451 | ) | ||||
Income before income taxes |
| 179,550 | |
| 396,823 | |
| 188,597 | |
| 264,473 | | ||||
Income tax expense |
| (827 | ) |
| (1,519 | ) |
| (859 | ) |
| (1,430 | ) | ||||
Net income |
| 178,723 | |
| 395,304 | |
| 187,738 | |
| 263,043 | | ||||
Less: Net income attributable to noncontrolling interests |
| (1,150 | ) |
| (2,575 | ) |
| (1,032 | ) |
| (1,885 | ) | ||||
Net income attributable to CFC |
| $ | 177,573 | |
| $ | 392,729 | |
| $ | 186,706 | |
| $ | 261,158 | |
|
|
|
|
|
|
|
|
| ||||||||
|
|
|
|
|
|
|
|
| ||||||||
|
|
|
|
|
|
|
|
| ||||||||
|
|
|
|
|
|
|
|
| ||||||||
|
|
|
|
|
|
|
|
| ||||||||
|
|
|
|
|
|
|
|
| ||||||||
See accompanying notes to condensed consolidated financial statements. | ||||||||||||||||
45
NATIONAL RURAL UTILITIES COOPERATIVE FINANCE CORPORATION
CONDENSED CONSOLIDATED STATEMENTS OF COMPREHENSIVE INCOME
(UNAUDITED)
|
| Three Months Ended November 30, |
| Six Months Ended November 30, | ||||||||||||
(Dollars in thousands) |
| 2017 |
| 2016 |
| 2017 |
| 2016 | ||||||||
Net income |
| $ | 178,723 | |
| $ | 395,304 | |
| $ | 187,738 | |
| $ | 263,043 | |
Other comprehensive income (loss): |
|
| |
|
| |
|
| |
|
| | ||||
Unrealized gains (losses) on available-for-sale investment securities |
| 8 | |
| (1,761 | ) |
| (1,143 | ) |
| (1,772 | ) | ||||
Reclassification of losses on foreclosed assets to net income |
| - | |
| - | |
| - | |
| 9,823 | | ||||
Reclassification of derivative gains to net income |
| (194 | ) |
| (199 | ) |
| (386 | ) |
| (396 | ) | ||||
Defined benefit plan adjustments |
| 126 | |
| 44 | |
| 253 | |
| 88 | | ||||
Other comprehensive income (loss) |
| (60 | ) |
| (1,916 | ) |
| (1,276 | ) |
| 7,743 | | ||||
Total comprehensive income |
| 178,663 | |
| 393,388 | |
| 186,462 | |
| 270,786 | | ||||
Less: Total comprehensive income attributable to noncontrolling interests |
| (1,150 | ) |
| (2,575 | ) |
| (1,032 | ) |
| (1,885 | ) | ||||
Total comprehensive income attributable to CFC |
| $ | 177,513 | |
| $ | 390,813 | |
| $ | 185,430 | |
| $ | 268,901 | |
|
|
|
|
|
|
|
|
| ||||||||
|
|
|
|
|
|
|
|
| ||||||||
|
|
|
|
|
|
|
|
| ||||||||
|
|
|
|
|
|
|
|
| ||||||||
|
|
|
|
|
|
|
|
| ||||||||
|
|
|
|
|
|
|
|
| ||||||||
See accompanying notes to condensed consolidated financial statements. | ||||||||||||||||
46
NATIONAL RURAL UTILITIES COOPERATIVE FINANCE CORPORATION
CONDENSED CONSOLIDATED BALANCE SHEETS
(UNAUDITED)
(Dollars in thousands) |
| November 30, 2017 | | May 31, 2017 | ||||
Assets: |
|
|
|
| ||||
Cash and cash equivalents |
| $ | 280,315 | |
| $ | 166,615 | |
Restricted cash |
| 11,323 | |
| 21,806 | | ||
Time deposits |
| 51,000 | |
| 226,000 | | ||
Investment securities: |
|
|
|
| ||||
Available for sale, at fair value |
| 91,411 | |
| 92,554 | | ||
Held to maturity, at amortized cost |
| 248,155 | |
| - | | ||
Total investment securities |
| 339,566 | |
| 92,554 | | ||
Loans to members |
| 24,824,691 | |
| 24,367,044 | | ||
Less: Allowance for loan losses |
| (36,774 | ) |
| (37,376 | ) | ||
Loans to members, net |
| 24,787,917 | |
| 24,329,668 | | ||
Accrued interest receivable |
| 116,770 | |
| 111,493 | | ||
Other receivables |
| 38,410 | |
| 45,469 | | ||
Fixed assets, net |
| 125,444 | |
| 122,260 | | ||
Derivative assets |
| 87,453 | |
| 49,481 | | ||
Other assets |
| 42,045 | |
| 40,346 | | ||
Total assets |
| $ | 25,880,243 | |
| $ | 25,205,692 | |
|
|
|
|
| ||||
Liabilities: |
| | |
|
| |||
Accrued interest payable |
| $ | 143,085 | |
| $ | 137,476 | |
Debt outstanding: |
|
|
|
| ||||
Short-term borrowings |
| 3,557,192 | |
| 3,342,900 | | ||
Long-term debt |
| 18,386,819 | |
| 17,955,594 | | ||
Subordinated deferrable debt |
| 742,341 | |
| 742,274 | | ||
Members' subordinated certificates: |
|
| |
|
| | ||
Membership subordinated certificates |
| 630,391 | |
| 630,098 | | ||
Loan and guarantee subordinated certificates |
| 548,187 | |
| 567,830 | | ||
Member capital securities |
| 221,097 | |
| 221,097 | | ||
Total members' subordinated certificates |
| 1,399,675 | |
| 1,419,025 | | ||
Total debt outstanding |
| 24,086,027 | |
| 23,459,793 | | ||
Deferred income |
| 67,690 | |
| 73,972 | | ||
Derivative liabilities |
| 304,307 | |
| 385,337 | | ||
Other liabilities |
| 39,086 | |
| 50,309 | | ||
Total liabilities |
| 24,640,195 | |
| 24,106,887 | | ||
|
|
|
|
| ||||
Commitments and contingencies |
| | |
| | | ||
|
|
|
|
| ||||
Equity: |
|
|
|
| ||||
CFC equity: |
|
| |
|
| | ||
Retained equity |
| 1,197,730 | |
| 1,056,778 | | ||
Accumulated other comprehensive income |
| 11,899 | |
| 13,175 | | ||
Total CFC equity |
| 1,209,629 | |
| 1,069,953 | | ||
Noncontrolling interests |
| 30,419 | |
| 28,852 | | ||
Total equity |
| 1,240,048 | |
| 1,098,805 | | ||
Total liabilities and equity |
| $ | 25,880,243 | |
| $ | 25,205,692 | |
|
|
|
|
| ||||
|
|
|
|
| ||||
See accompanying notes to condensed consolidated financial statements. | ||||||||
47
NATIONAL RURAL UTILITIES COOPERATIVE FINANCE CORPORATION
CONDENSED CONSOLIDATED STATEMENTS OF CHANGES IN EQUITY
(UNAUDITED)
(Dollars in thousands) |
| Membership |
| Patronage |
| Members' |
| Unallocated |
| CFC |
| Accumulated |
| Total |
| Non-controlling |
| Total | ||||||||||||||||||
Balance as of May 31, 2017 |
| $ | 2,900 | |
| $ | 761,701 | |
| $ | 630,305 | |
| $ | (338,128 | ) |
| $ | 1,056,778 | |
| $ | 13,175 | |
| $ | 1,069,953 | |
| $ | 28,852 | |
| $ | 1,098,805 | |
Net income |
| - | |
| - | |
| - | |
| 186,706 | |
| 186,706 | |
| - | |
| 186,706 | |
| 1,032 | |
| 187,738 | | |||||||||
Other comprehensive loss |
| - | |
| - | |
| - | |
| - | |
| - | |
| (1,276 | ) |
| (1,276 | ) |
| | |
| (1,276 | ) | |||||||||
Patronage capital retirement |
| - | |
| (45,220 | ) |
| - | |
| - | |
| (45,220 | ) |
| - | |
| (45,220 | ) |
| - | |
| (45,220 | ) | |||||||||
Other |
| (534 | ) |
| - | |
| - | |
| - | |
| (534 | ) |
| - | |
| (534 | ) |
| 535 | |
| 1 | | |||||||||
Balance as of November 30, 2017 |
| $ | 2,366 | |
| $ | 716,481 | |
| $ | 630,305 | |
| $ | (151,422 | ) |
| $ | 1,197,730 | |
| $ | 11,899 | |
| $ | 1,209,629 | |
| $ | 30,419 | |
| $ | 1,240,048 | |
|
|
|
|
|
|
|
|
|
|
|
|
|
|
|
|
|
|
| ||||||||||||||||||
|
|
|
|
|
|
|
|
|
|
|
|
|
|
|
|
|
|
| ||||||||||||||||||
Balance as of May 31, 2016 |
| $ | 2,772 | |
| $ | 713,853 | |
| $ | 587,219 | |
| $ | (513,610 | ) |
| $ | 790,234 | |
| $ | 1,058 | |
| $ | 791,292 | |
| $ | 26,086 | |
| $ | 817,378 | |
Net income |
| - | |
| - | |
| - | |
| 261,158 | |
| 261,158 | |
| - | |
| 261,158 | |
| 1,885 | |
| 263,043 | | |||||||||
Other comprehensive income |
| - | |
| - | |
| - | |
| - | |
| - | |
| 7,743 | |
| 7,743 | |
| - | |
| 7,743 | | |||||||||
Patronage capital retirement |
| - | |
| (42,129 | ) |
| - | |
| - | |
| (42,129 | ) |
| - | |
| (42,129 | ) |
| - | |
| (42,129 | ) | |||||||||
Other |
| (578 | ) |
| - | |
| - | |
| - | |
| (578 | ) |
| - | |
| (578 | ) |
| 620 | |
| 42 | | |||||||||
Balance as of November 30, 2016 |
| $ | 2,194 | |
| $ | 671,724 | |
| $ | 587,219 | |
| $ | (252,452 | ) |
| $ | 1,008,685 | |
| $ | 8,801 | |
| $ | 1,017,486 | |
| $ | 28,591 | |
| $ | 1,046,077 | |
|
|
|
|
|
|
|
|
|
|
|
|
|
|
|
|
|
|
| ||||||||||||||||||
|
|
|
|
|
|
|
|
|
|
|
|
|
|
|
|
|
|
| ||||||||||||||||||
|
|
|
|
|
|
|
|
|
|
|
|
|
|
|
|
|
|
| ||||||||||||||||||
|
|
|
|
|
|
|
|
|
|
|
|
|
|
|
|
|
|
| ||||||||||||||||||
|
|
|
|
|
|
|
|
|
|
|
|
|
|
|
|
|
|
| ||||||||||||||||||
|
|
|
|
|
|
|
|
|
|
|
|
|
|
|
|
|
|
| ||||||||||||||||||
See accompanying notes to condensed consolidated financial statements. | ||||||||||||||||||||||||||||||||||||
48
NATIONAL RURAL UTILITIES COOPERATIVE FINANCE CORPORATION
CONDENSED CONSOLIDATED STATEMENTS OF CASH FLOWS
(UNAUDITED)
|
| Six Months Ended November 30, | ||||||
(Dollars in thousands) |
| 2017 |
| 2016 | ||||
Cash flows from operating activities: |
|
|
|
| ||||
Net income |
| $ | 187,738 | |
| $ | 263,043 | |
Adjustments to reconcile net income to net cash provided by operating activities: |
|
|
|
| ||||
Amortization of deferred loan fees |
| (6,149 | ) |
| (6,024 | ) | ||
Amortization of debt issuance costs and deferred charges |
| 5,148 | |
| 4,619 | | ||
Amortization of discount on long-term debt |
| 4,943 | |
| 4,666 | | ||
Amortization of issuance costs for bank revolving bank line of credit |
| 2,768 | |
| 2,925 | | ||
Depreciation and amortization of fixed assets |
| 3,769 | |
| 3,578 | | ||
Provision (benefit) for loan losses |
| (602 | ) |
| 2,666 | | ||
Results of operations of foreclosed assets |
| - | |
| 1,661 | | ||
Derivative forward value gains |
| (119,252 | ) |
| (197,344 | ) | ||
Changes in operating assets and liabilities: |
|
|
|
| ||||
Accrued interest receivable |
| (5,277 | ) |
| 520 | | ||
Accrued interest payable |
| 5,609 | |
| 2,559 | | ||
Deferred income |
| (133 | ) |
| 1,784 | | ||
Other |
| (7,589 | ) |
| (5,711 | ) | ||
Net cash provided by operating activities |
| 70,973 | |
| 78,942 | | ||
|
|
|
|
| ||||
Cash flows from investing activities: |
|
|
|
| ||||
Advances on loans |
| (4,185,985 | ) |
| (3,925,089 | ) | ||
Principal collections on loans |
| 3,728,773 | |
| 3,295,412 | | ||
Net investment in fixed assets |
| (6,437 | ) |
| (11,294 | ) | ||
Net cash proceeds from sale of foreclosed assets |
| - | |
| 47,094 | | ||
Proceeds from foreclosed assets |
| - | |
| 4,036 | | ||
Net proceeds from (investments in) time deposits |
| 175,000 | |
| (300,000 | ) | ||
Purchases of held-to-maturity investments |
| (248,181 | ) |
| - | | ||
Change in restricted cash |
| 10,483 | |
| (17,644 | ) | ||
Net cash used in investing activities |
| (526,347 | ) |
| (907,485 | ) | ||
|
|
|
|
| ||||
Cash flows from financing activities: |
|
|
|
| ||||
Proceeds from short-term borrowings, net |
| 181,501 | |
| 750,466 | | ||
Proceeds from short-term borrowings with original maturity greater than 90 days |
| 570,060 | |
| 443,960 | | ||
Repayments of short term-debt with original maturity greater than 90 days |
| (537,269 | ) |
| (469,314 | ) | ||
Payments for issuance costs for revolving bank lines of credit |
| (2,402 | ) |
| (2,478 | ) | ||
Proceeds from issuance of long-term debt, net of issuance costs |
| 625,021 | |
| 690,277 | | ||
Payments for retirement of long-term debt |
| (203,819 | ) |
| (555,874 | ) | ||
Payments for issuance costs for subordinated deferrable debt |
| - | |
| (68 | ) | ||
Proceeds from issuance of members' subordinated certificates |
| 3,989 | |
| 1,660 | | ||
Payments for retirement of members' subordinated certificates |
| (23,340 | ) |
| (3,020 | ) | ||
Payments for retirement of patronage capital |
| (44,667 | ) |
| (41,510 | ) | ||
Net cash provided by financing activities |
| 569,074 | |
| 814,099 | | ||
Net increase (decrease) in cash and cash equivalents |
| 113,700 | |
| (14,444 | ) | ||
Beginning cash and cash equivalents |
| 166,615 | |
| 204,540 | | ||
Ending cash and cash equivalents |
| $ | 280,315 | |
| $ | 190,096 | |
|
|
|
|
| ||||
Supplemental disclosure of cash flow information: |
|
|
|
| ||||
Cash paid for interest |
| $ | 374,098 | |
| $ | 349,965 | |
Cash paid for income taxes |
| 152 | |
| 383 | | ||
|
|
|
|
| ||||
See accompanying notes to condensed consolidated financial statements. | ||||||||
49
NATIONAL RURAL UTILITIES COOPERATIVE FINANCE CORPORATION
NOTES TO CONDENSED CONSOLIDATED FINANCIAL STATEMENTS
(UNAUDITED)
NOTE 1-SUMMARY OF SIGNIFICANT ACCOUNTING POLICIES |
The Company
National Rural Utilities Cooperative Finance Corporation ("CFC") is a member-owned cooperative association incorporated under the laws of the District of Columbia in April 1969. CFC's principal purpose is to provide its members with financing to supplement the loan programs of the Rural Utilities Service ("RUS") of the United States Department of Agriculture ("USDA"). CFC makes loans to its rural electric members so they can acquire, construct and operate electric distribution, generation, transmission and related facilities. CFC also provides its members with credit enhancements in the form of letters of credit and guarantees of debt obligations. As a cooperative, CFC is owned by and exclusively serves its membership, which consists of not-for-profit entities or subsidiaries or affiliates of not-for-profit entities. CFC is exempt from federal income taxes.
Basis of Presentation and Use of Estimates
The accompanying unaudited interim condensed consolidated financial statements have been prepared in accordance with accounting principles generally accepted in the United States ("GAAP") and should be read in conjunction with the audited consolidated financial statements, and related notes thereto, included in CFC's Annual Report on Form 10-K for the fiscal year ended May 31, 2017 (" 2017 Form 10-K"). We believe that all necessary adjustments, which consisted only of normal recurring items, have been included in the accompanying financial statements to present fairly the results of the interim periods. The preparation of financial statements in conformity with GAAP requires management to make estimates and assumptions that affect the reported amounts and related disclosures. While management makes its best judgment, actual amounts or results could differ from these estimates. Our most significant estimates and assumptions involve determining the allowance for loan losses and the fair value of financial assets and liabilities. The results of operations in the interim financial statements is not necessarily indicative of the results that may be expected for other interim periods or for the full fiscal year ending May 31, 2018.
Principles of Consolidation
The accompanying condensed consolidated financial statements include the accounts of CFC, variable interest entities ("VIEs") where CFC is the primary beneficiary and subsidiary entities created and controlled by CFC to hold foreclosed assets. CFC did not have any entities that held foreclosed assets as of November 30, 2017 or May 31, 2017 . All intercompany balances and transactions have been eliminated. National Cooperative Services Corporation ("NCSC") and Rural Telephone Finance Cooperative ("RTFC") are VIEs which are required to be consolidated by CFC. NCSC is a taxable member-owned cooperative that may provide financing to members of CFC, government or quasi-government entities which own electric utility systems that meet the Rural Electrification Act definition of "rural", and for-profit and nonprofit entities that are owned, operated or controlled by, or provide significant benefits to certain members of CFC. RTFC is a taxable Subchapter T cooperative association that provides financing for its rural telecommunications members and their affiliates. Unless stated otherwise, references to "we," "our" or "us" relate to CFC and its consolidated entities.
Restricted Cash
Restricted cash, which totaled $11 million and $22 million as of November 30, 2017 and May 31, 2017 , respectively, consisted primarily of funds held in escrow. On July 1, 2016, CFC completed the sale of Caribbean Asset Holdings, LLC ("CAH"), an entity that held foreclosed assets, to ATN VI Holdings, LLC. In connection with the sale, $16 million of the sale proceeds was deposited into escrow to fund potential indemnification claims for a period of 15 months following the closing. On September 27, 2017, we received a claim notice from the purchaser of CAH asserting potential indemnification claims and seeking funding from the escrow. On November 10, 2017, funds held in escrow totaling $13 million were released to CFC. The remaining $3 million remains in escrow for claims under evaluation for indemnification.
50
NATIONAL RURAL UTILITIES COOPERATIVE FINANCE CORPORATION
NOTES TO CONDENSED CONSOLIDATED FINANCIAL STATEMENTS
(UNAUDITED)
Interest Income
The following table presents interest income, by interest-earning asset category, for the three and six months ended November 30, 2017 and 2016 .
|
| Three Months Ended November 30, |
| Six Months Ended November 30, | ||||||||||||
(Dollars in thousands) |
| 2017 |
| 2016 |
| 2017 | | 2016 | ||||||||
Interest income by interest-earning asset type: |
|
|
|
|
|
|
|
| ||||||||
Long-term fixed-rate loans (1) |
| $ | 248,926 | |
| $ | 243,817 | |
| $ | 498,290 | |
| $ | 487,945 | |
Long-term variable-rate loans |
| 6,097 | |
| 4,987 | |
| 11,960 | |
| 9,514 | | ||||
Line of credit loans |
| 8,588 | |
| 5,553 | |
| 17,295 | |
| 11,519 | | ||||
TDR loans (2) |
| 222 | |
| 231 | |
| 448 | |
| 449 | | ||||
Other income, net (3) |
| (306 | ) |
| (281 | ) |
| (538 | ) |
| (565 | ) | ||||
Total loans |
| 263,527 | |
| 254,307 | |
| 527,455 | |
| 508,862 | | ||||
Cash, time deposits and investment securities |
| 2,296 | |
| 2,849 | |
| 4,283 | |
| 5,129 | | ||||
Total interest income |
| $ | 265,823 | |
| $ | 257,156 | |
| $ | 531,738 | |
| $ | 513,991 | |
____________________________
(1) Includes loan conversion fees, which are generally deferred and recognized as interest income using the effective interest method.
(2) Troubled debt restructuring ("TDR") loans.
(3) Consists of late payment fees and net amortization of deferred loan fees and loan origination costs.
Deferred income of $68 million and $74 million as of November 30, 2017 and May 31, 2017 , respectively, consists primarily of deferred loan conversion fees totaling $63 million and $68 million , respectively.
Interest Expense
The following table presents interest expense, by debt product type, for the three and six months ended November 30, 2017 and 2016 .
|
| Three Months Ended November 30, |
| Six Months Ended November 30, | ||||||||||||
(Dollars in thousands) |
| 2017 |
| 2016 |
| 2017 |
| 2016 | ||||||||
Interest expense by debt product type: (1)(2) |
|
|
|
|
|
|
|
| ||||||||
Short-term borrowings |
| $ | 10,116 | |
| $ | 5,409 | |
| $ | 20,655 | |
| $ | 10,291 | |
Medium-term notes |
| 27,544 | |
| 24,705 | |
| 52,660 | |
| 48,290 | | ||||
Collateral trust bonds |
| 85,321 | |
| 84,951 | |
| 170,598 | |
| 170,000 | | ||||
Guaranteed Underwriter Program notes payable |
| 35,688 | |
| 36,216 | |
| 71,290 | |
| 71,988 | | ||||
Farmer Mac notes payable |
| 11,947 | |
| 7,587 | |
| 23,437 | |
| 14,486 | | ||||
Other notes payable |
| 391 | |
| 458 | |
| 781 | |
| 916 | | ||||
Subordinated deferrable debt |
| 9,417 | |
| 9,411 | |
| 18,833 | |
| 18,837 | | ||||
Subordinated certificates |
| 14,746 | |
| 14,917 | |
| 29,647 | |
| 29,926 | | ||||
Total interest expense |
| $ | 195,170 | |
| $ | 183,654 | |
| $ | 387,901 | |
| $ | 364,734 | |
____________________________
(1) Includes amortization of debt discounts and debt issuance costs, which are generally deferred and recognized as interest expense using the effective interest method. Issuance costs related to dealer commercial paper, however, are recognized as interest expense immediately as incurred.
51
NATIONAL RURAL UTILITIES COOPERATIVE FINANCE CORPORATION
NOTES TO CONDENSED CONSOLIDATED FINANCIAL STATEMENTS
(UNAUDITED)
(2) Includes fees related to funding arrangements, such as up-front fees paid to banks participating in our committed bank revolving line of credit agreements. Depending on the nature of the fee, amounts may be deferred and recognized as interest expense ratably over the term of the arrangement or recognized immediately as incurred.
Recently Issued But Not Yet Adopted Accounting Standards and Tax Reform
Tax Cuts and Jobs Act
On December 22, 2017, the President of the United States signed and enacted into law H.R. 1, the Tax Cuts and Jobs Act ("The Act"), which, except for certain provisions, is effective for tax years beginning on or after January 1, 2018. The Act significantly changes existing U.S. tax law and includes numerous provisions that will affect businesses. One of the primary changes is a reduction in the federal statutory corporate U.S. income tax rate to 21% percent from 35% and other changes that impact business-related exclusions, deductions and credits. CFC is exempt from federal income tax under Section 501(c)(4) of the Internal Revenue Code. NCSC is subject to federal income tax; however, NCSC's annual taxable income and federal income tax is not material to our consolidated results of operations, financial position or liquidity. RTFC is subject to federal income tax; however, the allocation of patronage capital to its members is a deduction that historically has resulted in a significant reduction in its annual taxable income and federal income tax. Therefore, we do not expect The Act to have a material impact on our consolidated results of operations, financial condition or liquidity.
Derivatives and Hedging-Targeted Improvements to Accounting for Hedging Activities
In August 2017, the Financial Accounting Standards Board ("FASB") issued Accounting Standards Update ("ASU") 2017-12, Derivatives and Hedging-Targeted Improvements to Accounting for Hedging Acti vities, which is intended to simplify and amend the application of hedge accounting to more clearly portray the economics of an entity's risk management strategies in its financial statements. The new guidance will make more financial and nonfinancial hedging strategies eligible for hedge accounting, reduce complexity in fair value hedges of interest rate risk and eases certain documentation and assessment requirements of hedge effectiveness. It also changes how companies assess effectiveness and amends the presentation and disclosure requirements. The guidance is effective for public entities for fiscal years beginning after December 15, 2018, including interim periods within those years. Early adoption is permitted in any interim period or fiscal year before the effective date. The guidance is effective for us beginning June 1, 2019. We currently do not apply hedge accounting. If we continue to not apply hedge accounting to our derivatives, the adoption of the new guidance will have no impact on our consolidated financial statements.
Receivables-Nonrefundable Fees and Other Cost
In March 2017, FASB issued ASU 2017-08, Receivables-Nonrefundable Fees and Other Costs, which shortens the amortization period for the premium on certain purchased callable debt securities, that have a set call date and price, to the earliest call date. The guidance is effective for public entities in fiscal years beginning after December 15, 2018, including interim periods within those fiscal years. This update is effective for us beginning June 1, 2019. The adoption of this guidance will change the amortization period to the earliest call date for our purchased callable debt securities held at a premium; however, we do not expect that the adoption of this guidance will have a material impact on our consolidated financial statements.
Statement of Cash Flows-Restricted Cash
In November 2016, FASB issued ASU 2016-18, Statement of Cash Flows-Restricted Cash, which requires that a statement of cash flows explains the change during the period in the total of cash, cash equivalents, and amounts generally described as restricted cash or restricted cash equivalents. Therefore, amounts generally described as restricted cash and restricted cash equivalents should be included with cash and cash equivalents when reconciling the beginning-of-period and end-of-period total amounts shown on the statement of cash flows. The guidance is effective for public entities in fiscal years beginning after December 15, 2017, including interim periods within those fiscal years. This update is effective for us beginning June
52
NATIONAL RURAL UTILITIES COOPERATIVE FINANCE CORPORATION
NOTES TO CONDENSED CONSOLIDATED FINANCIAL STATEMENTS
(UNAUDITED)
1, 2018. The adoption of this guidance will change the presentation of restricted cash presented on our statement of cash flows; however, it will have no impact on our consolidated results of operations, financial condition or liquidity.
Financial Instruments-Credit Losses: Measurement of Credit Losses on Financial Instruments
In June 2016, the FASB issued ASU 2016-13, Financial Instruments-Credit Losses: Measurement of Credit Losses on Financial Instruments, which changes the accounting for credit losses on certain financial assets to an expected loss model from the incurred loss model currently in use. The new guidance will likely result in earlier recognition of credit losses based on measuring the expected credit losses over the estimated life of financial assets held at each reporting date. The expected loss model will be the basis for determining the allowance for credit losses for loans and leases, unfunded lending commitments, held-to-maturity debt securities and other debt instruments measured at amortized cost. In addition, the new guidance modifies the other-than-temporary impairment model for available-for-sale debt securities to require the recognition of credit losses through a valuation allowance, which allows for the reversal of credit impairments in future periods. The ASU will also require enhanced disclosures to help users of financial statements better understand significant estimates and judgments used in estimating credit losses, as well as the credit quality and underwriting standards of an entity's portfolio. The new standard is effective for fiscal years and interim periods within those fiscal years, beginning after December 15, 2019. Early application will be permitted for all entities for fiscal years, and interim periods within those fiscal years, beginning after December 15, 2018. This update is effective for us beginning June 1, 2020. Upon adoption, we will be required to record a cumulative-effect adjustment to retained earnings. The impact on our consolidated financial statements from the adoption of this new guidance will depend on the composition and risk profile of our loan portfolio as of the date of adoption. We do not expect to early adopt this guidance.
Financial Instruments-Overall: Recognition and Measurement of Financial Assets and Financial Liabilities
In January 2016, the FASB issued ASU 2016-01, Financial Instruments-Overall: Recognition and Measurement of Financial Assets and Financial Liabilities, which amends certain aspects of the recognition, measurement, presentation and disclosure of certain financial instruments, including equity investments and liabilities measured at fair value under the fair value option. The guidance also updates fair value presentation and disclosure requirements for financial instruments measured at amortized cost. The ASU requires investments in equity securities that do not result in consolidation and are not accounted for under the equity method to be measured at fair value with changes in the fair value recognized through net income, unless one of two available exceptions apply. For financial liabilities where the fair value option has been elected, the portion of the total change in fair value caused by changes in the company's own credit risk is required to be presented separately in OCI. The classification and measurement guidance is effective for public entities in fiscal years beginning after December 15, 2017, including interim periods within those fiscal years. This update will be effective for us beginning June 1, 2018. Upon adoption, we will be required to reclassify the gain (loss) related to our equity investment securities classified as available-for-sale from accumulated other comprehensive income ("AOCI") to retained earnings as a cumulative-effect adjustment and begin recording future changes in fair value through earnings. We had a gain of $11 million recorded in AOCI for our available-for-sale equity investments as of November 30, 2017 . The impact on our consolidated financial statements at adoption will depend on the net unrealized gains (losses) recorded in AOCI for these equity investments as of the date of adoption.
Revenue from Contracts with Customers
In May 2014, the FASB issued ASU 2014-09, Revenue from Contracts with Customers , which modifies the guidance used to recognize revenue from contracts with customers for transfers of goods or services and transfers of nonfinancial assets, unless those contracts are within the scope of other guidance. The new guidance is effective for us beginning June 1, 2018. Because the scope of the guidance explicitly excludes net interest income as well as many other revenues for financial assets and liabilities including loans, securities, and derivatives, which account for the substantial majority of our revenues, we do not expect that the adoption of the guidance will have a material impact, if any, on our consolidated financial statements.
53
NATIONAL RURAL UTILITIES COOPERATIVE FINANCE CORPORATION
NOTES TO CONDENSED CONSOLIDATED FINANCIAL STATEMENTS
(UNAUDITED)
NOTE 2-VARIABLE INTEREST ENTITIES |
NCSC and RTFC meet the definition of a VIE because they do not have sufficient equity investment at risk to finance their activities without financial support. CFC is the primary source of funding for NCSC and the sole source of funding for RTFC. Under the terms of management agreements, CFC manages the business operations of NCSC and RTFC. CFC also unconditionally guarantees full indemnification for any loan losses of NCSC and RTFC pursuant to guarantee agreements with each company. CFC earns management and guarantee fees from its agreements with NCSC and RTFC.
NCSC and RTFC creditors have no recourse against CFC in the event of a default by NCSC and RTFC, unless there is a guarantee agreement under which CFC has guaranteed NCSC or RTFC debt obligations to a third party. The following table provides information on incremental consolidated assets and liabilities of VIE's included in CFC's condensed consolidated financial statements, after applying intercompany eliminations, as of November 30, 2017 and May 31, 2017 .
(Dollars in thousands) |
| November 30, 2017 |
| May 31, 2017 | ||||
Total loans outstanding |
| $ | 1,111,438 | |
| $ | 968,343 | |
Other assets |
| 10,477 | |
| 10,157 | | ||
Total assets |
| $ | 1,121,915 | |
| $ | 978,500 | |
|
|
|
|
| ||||
Long-term debt |
| $ | 10,000 | |
| $ | 10,000 | |
Other liabilities |
| 38,202 | |
| 36,899 | | ||
Total liabilities |
| $ | 48,202 | |
| $ | 46,899 | |
The following table provides information on CFC's credit commitments to NCSC and RTFC, and its potential exposure to loss as of November 30, 2017 and May 31, 2017 .
(Dollars in thousands) |
| November 30, 2017 | | May 31, 2017 | ||||
CFC credit commitments |
| $ | 5,500,000 | |
| $ | 5,500,000 | |
Outstanding commitments: |
|
|
|
| ||||
Borrowings payable to CFC (1) |
| 1,075,319 | |
| 931,686 | | ||
CFC third-party guarantees |
| 16,801 | |
| 14,697 | | ||
Other credit enhancements |
| 19,052 | |
| 20,963 | | ||
Total credit enhancements |
| 35,853 | |
| 35,660 | | ||
Total outstanding commitments |
| 1,111,172 | |
| 967,346 | | ||
CFC available credit commitments |
| $ | 4,388,828 | |
| $ | 4,532,654 | |
____________________________
(1) Borrowings payable to CFC are eliminated in consolidation.
CFC loans to NCSC and RTFC are secured by all assets and revenues of NCSC and RTFC. CFC's maximum potential exposure for the credit enhancements totaled $39 million . The maturities for obligations guaranteed by CFC extend through 2031.
54
NATIONAL RURAL UTILITIES COOPERATIVE FINANCE CORPORATION
NOTES TO CONDENSED CONSOLIDATED FINANCIAL STATEMENTS
(UNAUDITED)
NOTE 3-INVESTMENT SECURITIES |
We record purchases and sales of securities on a trade-date basis. The accounting and measurement framework for investment securities differs depending on the security classification. We currently classify and account for our investment securities as either available for sale ("AFS") or held to maturity ("HTM") based on our investment strategy and management's assessment of our intent and ability to hold the securities until maturity. Securities that we may sell prior to maturity in response to changes in our investment strategy, liquidity needs, credit risk mitigating considerations, market risk profile or for other reasons are classified as AFS. Securities that we have the positive intent and ability to hold until maturity are classified as HTM.
We report securities classified as AFS on our condensed consolidated balance sheets at fair value with unrealized gains or losses recorded as a component of accumulated other comprehensive income ("AOCI"). We report securities classified as HTM on our condensed consolidated balance sheets at amortized cost. Interest income on fixed-income securities, including amortization of premiums and accretion of discounts, is generally recognized over the contractual life of the securities based on the effective yield method.
We did not have any securities classified as HTM as of May 31, 2017 . During the second quarter of fiscal year 2018, we commenced the purchase of additional investment securities, consisting primarily of certificates of deposit, commercial paper, corporate debt securities, commercial mortgage-backed securities ("MBS") and other asset-backed securities ("ABS"). We have the positive intent and ability to hold these securities to maturity. As such, we have classified them as held to maturity on our condensed consolidated balance sheet.
Pursuant to our investment policy guidelines, all fixed-income securities, at the time of purchase, must be rated at least investment grade based on external credit ratings, when available, or the corresponding equivalent, when not available. Securities rated investment grade, that is those rated Baa3 or higher by Moody's Investors Service ("Moody's") or BBB- or higher by S&P Global Ratings ("S&P"), are generally considered by the rating agencies to be of lower credit risk than non-investment grade securities.
Amortized Cost and Fair Value of Investment Securities
The following tables present the amortized cost and fair value our investment securities and the corresponding gross unrealized gains and losses, by classification category and major security type, as of November 30, 2017 and May 31, 2017 .
55
NATIONAL RURAL UTILITIES COOPERATIVE FINANCE CORPORATION
NOTES TO CONDENSED CONSOLIDATED FINANCIAL STATEMENTS
(UNAUDITED)
|
| November 30, 2017 | ||||||||||||||
(Dollars in thousands) |
| Amortized Cost |
| Gross Unrealized Gains |
| Gross Unrealized Losses |
| Fair Value | ||||||||
Available for sale: |
|
|
|
|
|
|
|
| ||||||||
Farmer Mac-Series A Non-Cumulative Preferred Stock |
| $ | 30,000 | |
| $ | 1,032 | |
| $ | - | |
| $ | 31,032 | |
Farmer Mac-Series B Non-Cumulative Preferred Stock |
| 25,000 | |
| 1,924 | |
| - | |
| 26,924 | | ||||
Farmer Mac-Series C Non-Cumulative Preferred Stock |
| 25,000 | |
| 2,750 | |
| - | |
| 27,750 | | ||||
Farmer Mac-Class A Common Stock |
| 538 | |
| 5,167 | |
| - | |
| 5,705 | | ||||
Total investment securities, available-for-sale |
| 80,538 | |
| 10,873 | |
| - | |
| 91,411 | | ||||
|
|
|
|
|
|
|
|
| ||||||||
Held to maturity: |
|
|
|
|
|
|
|
| ||||||||
Certificates of deposit |
| 4,146 | |
| 1 | |
| (1 | ) |
| 4,146 | | ||||
Commercial paper |
| 7,196 | |
| 1 | |
| (1 | ) |
| 7,196 | | ||||
Corporate bonds |
| 210,099 | |
| 5 | |
| (872 | ) |
| 209,232 | | ||||
Commercial MBS, non-agency |
| 4,041 | |
| - | |
| (3 | ) |
| 4,038 | | ||||
Other ABS (1) |
| 22,673 | |
| - | |
| (28 | ) |
| 22,645 | | ||||
Total investment securities, held-to-maturity |
| 248,155 | |
| 7 | |
| (905 | ) |
| 247,257 | | ||||
|
|
|
|
|
|
|
|
| ||||||||
Total investment securities |
| $ | 328,693 | |
| $ | 10,880 | | | $ | (905 | ) | | $ | 338,668 | |
____________________________
(1) Consists primarily of securities backed by auto lease loans, equipment-backed loans, auto loans and credit card loans.
|
| May 31, 2017 | ||||||||||||||
(Dollars in thousands) |
| Amortized Cost |
| Gross Unrealized Gains |
| Gross Unrealized Losses |
| Fair Value | ||||||||
Available for sale: |
|
|
|
|
|
|
|
| ||||||||
Farmer Mac-Series A Non-Cumulative Preferred Stock |
| $ | 30,000 | |
| $ | 1,585 | |
| $ | - | |
| $ | 31,585 | |
Farmer Mac-Series B Non-Cumulative Preferred Stock |
| 25,000 | |
| 1,940 | |
| - | |
| 26,940 | | ||||
Farmer Mac-Series C Non-Cumulative Preferred Stock |
| 25,000 | |
| 4,150 | |
| - | |
| 29,150 | | ||||
Farmer Mac-Class A Common Stock |
| 538 | |
| 4,341 | |
| - | |
| 4,879 | | ||||
Total investment securities, available-for-sale |
| $ | 80,538 | |
| $ | 12,016 | |
| $ | - | |
| $ | 92,554 | |
For additional information on the unrealized gains (losses) losses recorded on our available-for-sale investment securities, see "Note 9-Equity-Accumulated Other Comprehensive Income."
Investment Securities in Gross Unrealized Loss Position
An unrealized loss exists when the current fair value of an individual security is less than its amortized cost basis. The following table presents the fair value and gross unrealized losses for investments in a gross loss position, aggregated by security type, and the length of time the securities have been in a continuous unrealized loss position as of November 30, 2017 . The securities are segregated between investments that have been in a continuous unrealized loss position for less than twelve months and twelve months or more based on the point in time that the fair value declined below the amortized cost basis. We did not have any investment securities in a gross unrealized loss position as of May 31, 2017 .
56
NATIONAL RURAL UTILITIES COOPERATIVE FINANCE CORPORATION
NOTES TO CONDENSED CONSOLIDATED FINANCIAL STATEMENTS
(UNAUDITED)
|
| November 30, 2017 | ||||||||||||||||||||||
|
| Unrealized Loss Position Less than 12 Months |
| Unrealized Loss Position 12 Months or Longer |
| Total | ||||||||||||||||||
(Dollars in thousands) |
| Fair Value |
| Gross Unrealized Losses |
| Fair Value |
| Gross Unrealized Losses |
| Fair Value |
| Gross Unrealized Losses | ||||||||||||
Held to maturity: |
|
|
|
|
|
|
|
|
|
|
|
| ||||||||||||
Certificates of deposit |
| $ | 1,898 | |
| $ | (1 | ) |
| $ | - | |
| $ | - | |
| $ | 1,898 | |
| $ | (1 | ) |
Commercial paper |
| 5,594 | |
| (1 | ) |
| - | |
| - | |
| 5,594 | |
| (1 | ) | ||||||
Corporate bonds |
| 200,170 | |
| (872 | ) |
| - | |
| - | |
| 200,170 | |
| (872 | ) | ||||||
Commercial MBS, non-agency |
| 4,038 | |
| (3 | ) |
| - | |
| - | |
| 4,038 | |
| (3 | ) | ||||||
Other asset-backed securities (1) |
| 22,645 | |
| (28 | ) |
| - | |
| - | |
| 22,645 | |
| (28 | ) | ||||||
Total |
| $ | 234,345 | |
| $ | (905 | ) |
| $ | - | |
| $ | - | |
| $ | 234,345 | |
| $ | (905 | ) |
____________________________
(1) Consists primarily of securities backed by auto lease loans, equipment-backed loans, auto loans and credit card loans.
Other-Than-Temporary Impairment
We conduct periodic reviews of all securities with unrealized losses to evaluate whether the impairment is other than temporary. The number of individual securities in an unrealized loss position was 170 as of November 30, 2017 . We have assessed each security with gross unrealized losses included in the above table for credit impairment. As part of that assessment, we concluded that the unrealized losses are primarily driven by changes in market interest rates rather than by adverse changes in the credit quality of these securities. Based on our assessment, we expect to recover the entire amortized cost basis of these securities, as we do not intend to sell any of the securities and believe that it is more likely than not that we will not be required to sell prior to recovery of the amortized cost basis. Accordingly, we currently consider the impairment of these securities to be temporary.
Contractual Maturity and Yield
The following table presents, by major security type, the remaining contractual maturity based on amortized cost and fair value as of November 30, 2017 of our HTM investment securities. Because borrowers may have the right to call or prepay certain obligations, the expected maturities of our investments may differ from the scheduled contractual maturities presented below.
57
NATIONAL RURAL UTILITIES COOPERATIVE FINANCE CORPORATION
NOTES TO CONDENSED CONSOLIDATED FINANCIAL STATEMENTS
(UNAUDITED)
|
| November 30, 2017 | ||||||||||||||||||
(Dollars in thousands) |
| Due in 1 Year or Less |
| Due > 1 Year through 5 Years |
| Due > 5 Years through 10 Years |
| Due >10 Years |
| Total | ||||||||||
Amortized cost: |
|
|
|
|
|
|
|
|
|
| ||||||||||
Certificates of deposit |
| $ | 4,146 | |
| $ | - | |
| $ | - | |
| $ | - | |
| $ | 4,146 | |
Commercial paper |
| 7,196 | |
| - | |
| - | |
| - | |
| 7,196 | | |||||
Corporate bonds |
| - | |
| 193,477 | |
| 16,622 | |
| - | |
| 210,099 | | |||||
Commercial MBS, non-agency |
| - | |
| - | |
| - | |
| 4,041 | |
| 4,041 | | |||||
Other asset-backed securities (1) |
| - | |
| 20,681 | |
| 1,992 | |
| - | |
| 22,673 | | |||||
Total |
| $ | 11,342 | |
| $ | 214,158 | |
| $ | 18,614 | |
| $ | 4,041 | |
| $ | 248,155 | |
|
|
|
|
|
|
|
|
|
|
| ||||||||||
Fair value: |
|
|
|
|
|
|
|
|
|
| ||||||||||
Certificates of deposit |
| $ | 4,146 | |
| $ | - | |
| $ | - | |
| $ | - | |
| $ | 4,146 | |
Commercial paper |
| 7,196 | |
| - | |
| - | |
| - | |
| 7,196 | | |||||
Corporate bonds |
| - | |
| 192,677 | |
| 16,555 | |
| - | |
| 209,232 | | |||||
Commercial MBS, non-agency |
| - | |
| - | |
| - | |
| 4,038 | |
| 4,038 | | |||||
Other ABS (1) |
| - | |
| 20,653 | |
| 1,992 | |
| - | |
| 22,645 | | |||||
Total |
| $ | 11,342 | |
| $ | 213,330 | |
| $ | 18,547 | |
| $ | 4,038 | |
| $ | 247,257 | |
|
|
|
|
|
|
|
|
|
|
| ||||||||||
Weighted average coupon (2) |
| 0.60 | % |
| 2.68 | % |
| 2.95 | % |
| 2.20 | % |
| 2.60 | % | |||||
____________________________
(1) Consists primarily of securities backed by auto lease loans, equipment-backed loans, auto loans and credit card loans.
(2) Calculated based on the weighted average coupon rate, which excludes the impact of amortization of premium and accretion of discount.
The average contractual maturity and weighted average coupon of our HTM investment securities was four years and 2.60% , respectively, as of November 30, 2017 . The average credit rating of these securities, based on their lowest credit rating by Moody's and S&P was A3 and A-, respectively, as of November 30, 2017 .
Realized Gains and Losses
We have not sold any of our investment securities during the three and six months ended November 30, 2017 and 2016 , and therefore have not recorded any realized gains or losses.
NOTE 4-LOANS AND COMMITMENTS |
Loans, which are classified as held for investment, are carried at the outstanding unpaid principal balance net of unamortized loan origination costs. The following table presents loans outstanding, by loan type and by member class, as of November 30, 2017 and May 31, 2017 .
58
NATIONAL RURAL UTILITIES COOPERATIVE FINANCE CORPORATION
NOTES TO CONDENSED CONSOLIDATED FINANCIAL STATEMENTS
(UNAUDITED)
|
| November 30, 2017 |
| May 31, 2017 | ||||||||||||
(Dollars in thousands) |
| Loans Outstanding |
| Unadvanced Commitments (1) |
| Loans Outstanding |
| Unadvanced Commitments (1) | ||||||||
Loan type: |
|
|
|
|
|
|
|
| ||||||||
Long-term loans: |
|
|
|
|
|
|
|
| ||||||||
Fixed rate |
| $ | 22,415,833 | |
| $ | - | |
| $ | 22,136,690 | |
| $ | - | |
Variable rate |
| 906,453 | |
| 4,950,905 | |
| 847,419 | |
| 4,802,319 | | ||||
Total long-term loans |
| 23,322,286 | |
| 4,950,905 | |
| 22,984,109 | |
| 4,802,319 | | ||||
Lines of credit |
| 1,491,256 | |
| 7,575,116 | |
| 1,372,221 | |
| 7,772,655 | | ||||
Total loans outstanding |
| 24,813,542 | |
| 12,526,021 | |
| 24,356,330 | |
| 12,574,974 | | ||||
Deferred loan origination costs | | 11,149 | | | - | | | 10,714 | | | - | | ||||
Loans to members | | $ | 24,824,691 | | | $ | 12,526,021 | | | $ | 24,367,044 | | | $ | 12,574,974 | |
|
|
|
|
|
|
|
|
| ||||||||
Member class: |
|
|
|
|
|
|
|
| ||||||||
CFC: |
|
|
|
|
|
|
|
| ||||||||
Distribution |
| $ | 19,230,740 | |
| $ | 8,098,698 | |
| $ | 18,825,366 | |
| $ | 8,295,146 | |
Power supply |
| 4,414,257 | |
| 3,412,557 | |
| 4,504,791 | |
| 3,276,113 | | ||||
Statewide and associate |
| 57,107 | |
| 127,622 | |
| 57,830 | |
| 144,406 | | ||||
Total CFC |
| 23,702,104 | |
| 11,638,877 | |
| 23,387,987 | |
| 11,715,665 | | ||||
NCSC |
| 739,707 | |
| 591,119 | |
| 613,924 | |
| 584,944 | | ||||
RTFC |
| 371,731 | |
| 296,025 | |
| 354,419 | |
| 274,365 | | ||||
Total loans outstanding |
| 24,813,542 | |
| 12,526,021 | |
| 24,356,330 | |
| 12,574,974 | | ||||
Deferred loan origination costs |
| 11,149 | |
| - | |
| 10,714 | |
| - | | ||||
Loans to members |
| $ | 24,824,691 | |
| $ | 12,526,021 | |
| $ | 24,367,044 | |
| $ | 12,574,974 | |
____________________________
(1) The interest rate on unadvanced loan commitments is not set until an advance is made; therefore, all long-term unadvanced loan commitments are reported as variable-rate. However, the borrower may select either a fixed or a variable rate when an advance on a commitment is made.
Unadvanced Loan Commitments
Unadvanced loan commitments represent approved and executed loan contracts for which funds have not been advanced to borrowers. The following table summarizes the available balance under unadvanced loan commitments as of November 30, 2017 and the related maturities by fiscal year and thereafter by loan type:
|
| Available Balance |
| Notional Maturities of Unadvanced Loan Commitments | ||||||||||||||||||||||||
(Dollars in thousands) |
|
| 2018 |
| 2019 |
| 2020 |
| 2021 |
| 2022 |
| Thereafter | |||||||||||||||
Line of credit loans |
| $ | 7,575,116 | | | $ | 342,159 | | | $ | 4,343,222 | | | $ | 641,613 | | | $ | 950,998 | | | $ | 773,772 | | | $ | 523,352 | |
Long-term loans |
| 4,950,905 | | | 215,806 | | | 986,952 | | | 649,436 | | | 676,899 | | | 1,885,338 | | | 536,474 | | |||||||
Total |
| $ | 12,526,021 | | | $ | 557,965 | | | $ | 5,330,174 | | | $ | 1,291,049 | | | $ | 1,627,897 | | | $ | 2,659,110 | | | $ | 1,059,826 | |
Unadvanced line of credit commitments accounted for 60% of total unadvanced loan commitments as of November 30, 2017 , while unadvanced long-term loan commitments accounted for 40% of total unadvanced loan commitments. Unadvanced line of credit commitments are typically revolving facilities for periods not to exceed five years. Unadvanced
59
NATIONAL RURAL UTILITIES COOPERATIVE FINANCE CORPORATION
NOTES TO CONDENSED CONSOLIDATED FINANCIAL STATEMENTS
(UNAUDITED)
line of credit commitments generally serve as supplemental back-up liquidity to our borrowers. Historically, borrowers have not drawn the full commitment amount for line of credit facilities, and we have experienced a very low utilization rate on line of credit loan facilities regardless of whether or not we are obligated to fund the facility where a material adverse change exists. Our unadvanced long-term loan commitments have a five-year draw period under which a borrower may advance funds prior to the expiration of the commitment. We expect that the majority of the long-term unadvanced loan commitments of $4,951 million will be advanced prior to the expiration of the commitment.
Because we historically have experienced a very low utilization rate on line of credit loan facilities, which account for the majority of our total unadvanced loan commitments, we believe the unadvanced loan commitment total of $12,526 million as of November 30, 2017 is not necessarily representative of our future funding cash requirements.
Unadvanced Loan Commitments-Conditional
The substantial majority of our line of credit commitments and all of our unadvanced long-term loan commitments include material adverse change clauses. Unadvanced loan commitments subject to material adverse change clauses totaled $9,741 million and $9,973 million as of November 30, 2017 and May 31, 2017 , respectively. Prior to making an advance on these facilities, we confirm that there has been no material adverse change in the business or condition, financial or otherwise, of the borrower since the time the loan was approved and confirm that the borrower is currently in compliance with loan terms and conditions. In some cases, the borrower's access to the full amount of the facility is further constrained by the designated purpose, imposition of borrower-specific restrictions or by additional conditions that must be met prior to advancing funds.
Unadvanced Loan Commitments-Unconditional
Unadvanced loan commitments not subject to material adverse change clauses at the time of each advance consisted of unadvanced committed lines of credit totaling $2,785 million and $2,602 million as of November 30, 2017 and May 31, 2017 , respectively. As such, we are required to advance amounts on these committed facilities as long as the borrower is in compliance with the terms and conditions of the facility.
The following table summarizes the available balance under unconditional committed lines of credit, and the related maturities by fiscal year and thereafter, as of November 30, 2017 .
|
| Available Balance |
| Notional Maturities of Unconditional Committed Lines of Credit | ||||||||||
(Dollars in thousands) |
|
| 2018 |
| 2019 |
| 2020 |
| 2021 |
| 2022 |
| Thereafter | |
Committed lines of credit |
| $2,784,511 |
| $130,000 |
| $517,130 |
| $395,711 |
| $630,631 |
| $677,818 |
| $433,221 |
Loan Sales
We transfer, from time to time, loans to third parties under our direct loan sale program. We sold CFC loans with outstanding balances totaling $110 million and $31 million , at par for cash, during the six months ended November 30, 2017 and 2016 , respectively. We recorded immaterial losses upon the sale of these loans, attributable to the unamortized deferred loan origination costs associated with the transferred loans.
Pledging of Loans
We are required to pledge eligible mortgage notes in an amount at least equal to the outstanding balance of our secured debt. The following table summarizes our loans outstanding as collateral pledged to secure our collateral trust bonds, Clean Renewable Energy Bonds, notes payable to Farmer Mac and notes payable to the Federal Financing Bank and guaranteed by RUS under the Guaranteed Underwriter Program of the USDA ("Guaranteed Underwriter Program") and the amount of the
60
NATIONAL RURAL UTILITIES COOPERATIVE FINANCE CORPORATION
NOTES TO CONDENSED CONSOLIDATED FINANCIAL STATEMENTS
(UNAUDITED)
corresponding debt outstanding as of November 30, 2017 and May 31, 2017 . See "Note 5-Short-Term Borrowings" and "Note 6-Long-Term Debt" for information on our borrowings.
(Dollars in thousands) |
| November 30, 2017 |
| May 31, 2017 | ||||
Collateral trust bonds: |
|
|
|
| ||||
2007 indenture: |
|
|
|
| ||||
Distribution system mortgage notes |
| $ | 8,527,458 | |
| $ | 8,740,572 | |
RUS-guaranteed loans qualifying as permitted investments |
| 143,564 | |
| 146,373 | | ||
Total pledged collateral |
| $ | 8,671,022 | |
| $ | 8,886,945 | |
Collateral trust bonds outstanding |
| 7,697,711 | |
| 7,697,711 | | ||
|
|
|
|
| ||||
1994 indenture: |
|
|
|
| ||||
Distribution system mortgage notes |
| $ | 253,323 | |
| $ | 263,007 | |
Collateral trust bonds outstanding |
| 220,000 | |
| 225,000 | | ||
|
|
|
|
| ||||
Farmer Mac: |
|
|
|
| ||||
Distribution and power supply system mortgage notes |
| $ | 2,876,351 | |
| $ | 2,942,456 | |
Notes payable outstanding |
| 2,491,464 | |
| 2,513,389 | | ||
|
|
|
|
| ||||
Clean Renewable Energy Bonds Series 2009A: |
|
|
|
| ||||
Distribution and power supply system mortgage notes |
| $ | 13,950 | |
| $ | 14,943 | |
Cash |
| 1,225 | |
| 481 | | ||
Total pledged collateral |
| $ | 15,175 | |
| $ | 15,424 | |
Notes payable outstanding |
| 13,214 | |
| 13,214 | | ||
|
|
|
|
| ||||
Federal Financing Bank: |
|
|
|
| ||||
Distribution and power supply system mortgage notes |
| $ | 5,876,050 | |
| $ | 5,833,515 | |
Notes payable outstanding |
| 5,060,192 | |
| 4,985,748 | | ||
Credit Concentration
We serve electric and telecommunications members throughout the United States and its territories, including 49 states, the District of Columbia, American Samoa and Guam. Texas had the largest concentration of outstanding loans to borrowers in any one state, with approximately 15% of total loans outstanding as of both November 30, 2017 and May 31, 2017 . Our consolidated membership totaled 1,459 members and 217 associates as of November 30, 2017 . As such, we have a loan portfolio with single-industry and single-obligor concentration risk. Outstanding loans to electric utility organizations represented approximately 99% of the total outstanding loan portfolio as of November 30, 2017 , unchanged from May 31, 2017 . The remaining outstanding loans in our portfolio were to RTFC members, affiliates and associates in the telecommunications industry.
Single-Obligor Concentration
The outstanding exposure of the 20 largest borrowers was 23% and 24% as of November 30, 2017 and May 31, 2017 , respectively. The 20 largest borrowers consisted of 10 distribution systems, 9 power supply systems and 1 NCSC associate member as of both November 30, 2017 and May 31, 2017 . The largest total outstanding exposure to a single borrower or controlled group represented approximately 2% of total loans and guarantees outstanding as of both November 30, 2017 and May 31, 2017 .
61
NATIONAL RURAL UTILITIES COOPERATIVE FINANCE CORPORATION
NOTES TO CONDENSED CONSOLIDATED FINANCIAL STATEMENTS
(UNAUDITED)
Credit Quality
We closely monitor loan performance trends to manage and evaluate our credit risk exposure. We seek to provide a balance between meeting the credit needs of our members, while also ensuring the sound credit quality of our loan portfolio. Payment status and internal risk ratings are key indicators, among others, of the level of credit risk in our loan portfolio.
As part of our strategy in managing our credit risk exposure, we entered into a long-term standby purchase commitment agreement with Farmer Mac. Under this agreement, we may designate certain long-term loans to be covered under the commitment, subject to approval by Farmer Mac, and in the event any such loan later goes into payment default for at least 90 days, upon request by us, Farmer Mac must purchase such loan at par value. The aggregate unpaid principal balance of designated and Farmer Mac approved loans was $792 million and $843 million as of November 30, 2017 and May 31, 2017 , respectively. Under the agreement, we are required to pay Farmer Mac a monthly fee based on the unpaid principal balance of loans covered under the purchase commitment. No loans had been put to Farmer Mac for purchase, pursuant to this agreement, as of November 30, 2017 . Also, we had long-term loans totaling $164 million and $167 million as of November 30, 2017 and May 31, 2017 , respectively, that were guaranteed by the Rural Utilities Service ("RUS") of the United States Department of Agriculture.
Payment Status of Loans
The tables below present the payment status of loans outstanding by member class as of November 30, 2017 and May 31, 2017 . As indicated in the table, we did not have any past due loans as of either November 30, 2017 or May 31, 2017 .
|
| November 30, 2017 | ||||||||||||||||||||||
(Dollars in thousands) |
| Current |
| 30-89 Days Past Due |
| 90 Days or More Past Due (1) |
| Total Past Due |
| Total Financing Receivables |
| Nonaccrual Loans | ||||||||||||
CFC: |
|
|
|
|
|
|
|
|
|
|
|
| ||||||||||||
Distribution |
| $ | 19,230,740 | |
| $ | - | |
| $ | - | |
| $ | - | |
| $ | 19,230,740 | |
| $ | - | |
Power supply |
| 4,414,257 | |
| - | |
| - | |
| - | |
| 4,414,257 | |
| - | | ||||||
Statewide and associate |
| 57,107 | |
| - | |
| - | |
| - | |
| 57,107 | |
| - | | ||||||
CFC total |
| 23,702,104 | |
| - | |
| - | |
| - | |
| 23,702,104 | |
| - | | ||||||
NCSC |
| 739,707 | |
| - | |
| - | |
| - | |
| 739,707 | |
| - | | ||||||
RTFC |
| 371,731 | |
| - | |
| - | |
| - | |
| 371,731 | |
| - | | ||||||
Total loans outstanding |
| $ | 24,813,542 | |
| $ | - | |
| $ | - | |
| $ | - | |
| $ | 24,813,542 | |
| $ | - | |
|
|
|
|
|
|
|
|
|
|
|
|
| ||||||||||||
Percentage of total loans |
| 100.00 | % |
| - | % |
| - | % |
| - | % |
| 100.00 | % |
| - | % | ||||||
62
NATIONAL RURAL UTILITIES COOPERATIVE FINANCE CORPORATION
NOTES TO CONDENSED CONSOLIDATED FINANCIAL STATEMENTS
(UNAUDITED)
|
| May 31, 2017 | ||||||||||||||||||||||
(Dollars in thousands) |
| Current |
| 30-89 Days Past Due |
| 90 Days or More Past Due (1) |
| Total |
| Total Financing |
| Nonaccrual Loans | ||||||||||||
CFC: |
|
|
|
|
|
|
|
|
|
|
|
| ||||||||||||
Distribution |
| $ | 18,825,366 | |
| $ | - | |
| $ | - | |
| $ | - | |
| $ | 18,825,366 | |
| $ | - | |
Power supply |
| 4,504,791 | |
| - | |
| - | |
| - | |
| 4,504,791 | |
| - | | ||||||
Statewide and associate |
| 57,830 | |
| - | |
| - | |
| - | |
| 57,830 | |
| - | | ||||||
CFC total |
| 23,387,987 | |
| - | |
| - | |
| - | |
| 23,387,987 | |
| - | | ||||||
NCSC |
| 613,924 | |
| - | |
| - | |
| - | |
| 613,924 | |
| - | | ||||||
RTFC |
| 354,419 | |
| - | |
| - | |
| - | |
| 354,419 | |
| - | | ||||||
Total loans outstanding |
| $ | 24,356,330 | |
| $ | - | |
| $ | - | |
| $ | - | |
| $ | 24,356,330 | |
| $ | - | |
|
|
|
|
|
|
|
|
|
|
|
|
| ||||||||||||
Percentage of total loans |
| 100.00 | % |
| - | % |
| - | % |
| - | % |
| 100.00 | % |
| - | % | ||||||
____________________________
(1) All loans 90 days or more past due are on nonaccrual status.
Troubled Debt Restructured ("TDR") Loans
We did not have any loans modified as TDRs during the six months ended November 30, 2017 . The following table provides a summary of loans modified as TDRs in prior periods, the performance status of these loans and the unadvanced loan commitments related to the TDR loans, by member class, as of November 30, 2017 and May 31, 2017 .
|
| November 30, 2017 |
| May 31, 2017 | ||||||||||||||||||
(Dollars in thousands) |
| Loans Outstanding |
| % of Total Loans |
| Unadvanced Commitments |
| Loans Outstanding |
| % of Total Loans |
| Unadvanced Commitments | ||||||||||
TDR loans: |
|
|
|
|
|
|
|
|
|
|
|
| ||||||||||
Performing TDR loans: |
|
|
|
|
|
|
|
|
|
|
|
| ||||||||||
CFC/Distribution |
| $ | 6,507 | |
| 0.03 | % |
| $ | - | |
| $ | 6,581 | |
| 0.02 | % |
| $ | - | |
RTFC |
| 6,341 | |
| 0.02 | |
| - | |
| 6,592 | |
| 0.03 | |
| - | | ||||
Total performing TDR loans |
| 12,848 | |
| 0.05 | |
| - | |
| 13,173 | |
| 0.05 | |
| - | | ||||
Total TDR loans |
| $ | 12,848 | |
| 0.05 | % |
| $ | - | |
| $ | 13,173 | |
| 0.05 | % |
| $ | - | |
We did not have any TDR loans classified as nonperforming as of November 30, 2017 or May 31, 2017 . TDR loans classified as performing as of November 30, 2017 and May 31, 2017 were performing in accordance with the terms of their respective restructured loan agreement and on accrual status as of the respective reported dates. One borrower with a TDR loan also had a line of credit facility, restricted for fuel purchases only, totaling $6 million as of both November 30, 2017 and May 31, 2017 . The outstanding amount under this facility totaled approximately $1 million and $0.5 million as of November 30, 2017 and May 31, 2017 , respectively, and was classified as performing as of each respective date.
Nonperforming Loans
In addition to TDR loans that may be classified as nonperforming, we also may have nonperforming loans that have not been modified as a TDR loan. We did not have any loans classified as nonperforming as of November 30, 2017 or May 31, 2017 .
We had no foregone interest income for loans on nonaccrual status during the three and six months ended November 30,
63
NATIONAL RURAL UTILITIES COOPERATIVE FINANCE CORPORATION
NOTES TO CONDENSED CONSOLIDATED FINANCIAL STATEMENTS
(UNAUDITED)
2017 . We had foregone interest income for loans on nonaccrual status totaling $31 thousand during the six months ended November 30, 2016 .
Impaired Loans
The following table provides information on loans classified as individually impaired loans as of November 30, 2017 and May 31, 2017 .
|
| November 30, 2017 |
| May 31, 2017 | ||||||||||||
(Dollars in thousands) |
| Recorded Investment |
| Related Allowance |
| Recorded Investment |
| Related Allowance | ||||||||
With no specific allowance recorded: |
|
|
|
|
|
|
|
| ||||||||
CFC |
| $ | 6,507 | |
| $ | - | |
| $ | 6,581 | |
| $ | - | |
|
|
|
|
|
|
|
|
| ||||||||
With a specific allowance recorded: |
|
|
|
|
|
|
|
| ||||||||
RTFC |
| 6,341 | |
| 1,330 | |
| 6,592 | |
| 1,640 | | ||||
Total impaired loans |
| $ | 12,848 | |
| $ | 1,330 | |
| $ | 13,173 | |
| $ | 1,640 | |
The following table presents, by company, the average recorded investment for individually impaired loans and the interest income recognized on these loans for the three and six months ended November 30, 2017 and 2016 .
|
| Three Months Ended November 30, | ||||||||||||||
|
| 2017 |
| 2016 |
| 2017 |
| 2016 | ||||||||
(Dollars in thousands) |
| Average Recorded Investment |
| Interest Income Recognized | ||||||||||||
CFC |
| $ | 6,507 | |
| $ | 6,581 | |
| $ | 142 | |
| $ | 144 | |
RTFC |
| 6,423 | |
| 6,924 | |
| 80 | |
| 87 | | ||||
Total impaired loans |
| $ | 12,930 | |
| $ | 13,505 | |
| $ | 222 | |
| $ | 231 | |
|
| Six Months Ended November 30, | ||||||||||||||
|
| 2017 |
| 2016 |
| 2017 |
| 2016 | ||||||||
(Dollars in thousands) |
| Average Recorded Investment |
| Interest Income Recognized | ||||||||||||
CFC |
| $ | 6,541 | |
| $ | 6,645 | |
| $ | 286 | |
| $ | 274 | |
RTFC |
| 6,486 | |
| 8,729 | |
| 162 | |
| 175 | | ||||
Total impaired loans |
| $ | 13,027 | |
| $ | 15,374 | |
| $ | 448 | |
| $ | 449 | |
Internal Risk Ratings of Loans
We evaluate the credit quality of our loans using an internal risk rating system that employs similar criteria for all member classes. Our internal risk rating system is based on a determination of a borrower's risk of default utilizing both quantitative and qualitative measurements. Each risk rating is reassessed annually following the receipt of the borrower's audited financial statements; however, interim risk rating downgrades or upgrades may occur as a result of significant developments or trends. Our borrower risk ratings fall into the following four categories based on the criteria identified below.
• | Pass : Borrowers that are not experiencing difficulty and/or not showing a potential or well-defined credit weakness. |
• | Special Mention : Borrowers that may be characterized by a potential credit weakness or deteriorating financial condition that is not sufficiently serious to warrant a classification of substandard or doubtful. |
64
NATIONAL RURAL UTILITIES COOPERATIVE FINANCE CORPORATION
NOTES TO CONDENSED CONSOLIDATED FINANCIAL STATEMENTS
(UNAUDITED)
• | Substandard : Borrowers that display a well-defined credit weakness that may jeopardize the full collection of principal and interest. |
• | Doubtful : Borrowers that have a well-defined weakness and the full collection of principal and interest is questionable or improbable. |
Loans to borrowers in the pass and special mention categories are generally included in the collective loan portfolio for purposes of determining the allowance for loan losses. Loans to borrowers in the substandard and doubtful categories are generally considered to be individually impaired and therefore reflected in the impaired loan portfolio. The special mention, substandard, and doubtful categories are intended to comply with the definition of criticized loans by the banking regulatory authorities.
|
| November 30, 2017 | ||||||||||||||||||
(Dollars in thousands) |
| Pass |
| Special Mention |
| Substandard |
| Doubtful |
| Total | ||||||||||
CFC: |
|
|
|
|
|
|
|
|
|
| ||||||||||
Distribution |
| $ | 19,122,976 | |
| $ | 107,764 | |
| $ | - | |
| $ | - | |
| $ | 19,230,740 | |
Power supply |
| 4,414,257 | |
| - | |
| - | |
| - | |
| 4,414,257 | | |||||
Statewide and associate |
| 57,107 | |
| - | |
| - | |
| - | |
| 57,107 | | |||||
CFC total |
| 23,594,340 | |
| 107,764 | |
| - | |
| - | |
| 23,702,104 | | |||||
NCSC |
| 739,707 | |
| - | |
| - | |
| - | |
| 739,707 | | |||||
RTFC |
| 365,390 | |
| - | |
| 6,341 | |
| - | |
| 371,731 | | |||||
Total loans outstanding |
| $ | 24,699,437 | |
| $ | 107,764 | |
| $ | 6,341 | |
| $ | - | |
| $ | 24,813,542 | |
|
| May 31, 2017 | ||||||||||||||||||
(Dollars in thousands) |
| Pass |
| Special Mention |
| Substandard |
| Doubtful |
| Total | ||||||||||
CFC: |
|
|
|
|
|
|
|
|
|
| ||||||||||
Distribution |
| $ | 18,715,810 | |
| $ | 109,556 | |
| $ | - | |
| $ | - | |
| $ | 18,825,366 | |
Power supply |
| 4,504,791 | |
| - | |
| - | |
| - | |
| 4,504,791 | | |||||
Statewide and associate |
| 56,654 | |
| 1,176 | |
| - | |
| - | |
| 57,830 | | |||||
CFC total |
| 23,277,255 | |
| 110,732 | |
| - | |
| - | |
| 23,387,987 | | |||||
NCSC |
| 612,592 | |
| 1,332 | |
| - | |
| - | |
| 613,924 | | |||||
RTFC |
| 346,944 | |
| - | |
| 7,475 | |
| - | |
| 354,419 | | |||||
Total loans outstanding |
| $ | 24,236,791 | |
| $ | 112,064 | |
| $ | 7,475 | |
| $ | - | |
| $ | 24,356,330 | |
Allowance for Loan Losses
We maintain an allowance for loan losses at a level estimated by management to provide for probable losses inherent in the loan portfolio as of each balance sheet date. Our allowance for loan losses consists of an amount for loans collectively evaluated for impairment, referred to as our collective allowance, and an amount for loans designated as individually impaired, referred to as our specific allowance.
65
NATIONAL RURAL UTILITIES COOPERATIVE FINANCE CORPORATION
NOTES TO CONDENSED CONSOLIDATED FINANCIAL STATEMENTS
(UNAUDITED)
|
| Three Months Ended November 30, 2017 | ||||||||||||||
(Dollars in thousands) |
| CFC |
| NCSC |
| RTFC |
| Total | ||||||||
Balance as of August 31, 2017 |
| $ | 29,521 | |
| $ | 2,736 | |
| $ | 4,821 | |
| $ | 37,078 | |
Provision (benefit) for loan losses |
| (722 | ) |
| 381 | |
| 37 | |
| (304 | ) | ||||
Balance as of November 30, 2017 |
| $ | 28,799 | |
| $ | 3,117 | |
| $ | 4,858 | |
| $ | 36,774 | |
|
| Three Months Ended November 30, 2016 | ||||||||||||||
(Dollars in thousands) |
| CFC |
| NCSC |
| RTFC |
| Total | ||||||||
Balance as of August 31, 2016 |
| $ | 25,062 | |
| $ | 3,281 | |
| $ | 4,777 | |
| $ | 33,120 | |
Provision (benefit) for loan losses |
| 742 | |
| 383 | |
| (387 | ) |
| 738 | | ||||
Recoveries |
| 53 | |
| - | |
| - | |
| 53 | | ||||
Balance as of November 30, 2016 |
| $ | 25,857 | |
| $ | 3,664 | |
| $ | 4,390 | |
| $ | 33,911 | |
|
| Six Months Ended November 30, 2017 | ||||||||||||||
(Dollars in thousands) |
| CFC |
| NCSC |
| RTFC |
| Total | ||||||||
Balance as of May 31, 2017 |
| $ | 29,499 | |
| $ | 2,910 | |
| $ | 4,967 | |
| $ | 37,376 | |
Provision (benefit) for loan losses |
| (700 | ) |
| 207 | |
| (109 | ) |
| (602 | ) | ||||
Balance as of November 30, 2017 |
| $ | 28,799 | |
| $ | 3,117 | |
| $ | 4,858 | |
| $ | 36,774 | |
|
| Six Months Ended November 30, 2016 | ||||||||||||||
(Dollars in thousands) |
| CFC |
| NCSC |
| RTFC |
| Total | ||||||||
Balance as of May 31, 2016 |
| $ | 24,559 | |
| $ | 3,134 | |
| $ | 5,565 | |
| $ | 33,258 | |
Provision for loan losses |
| 1,192 | |
| 530 | |
| 944 | |
| 2,666 | | ||||
Charge-offs |
| - | |
| - | |
| (2,119 | ) |
| (2,119 | ) | ||||
Recoveries |
| 106 | |
| - | |
| - | |
| 106 | | ||||
Net (charge-offs) recoveries |
| 106 | |
| - | |
| (2,119 | ) |
| (2,013 | ) | ||||
Balance as of November 30, 2016 |
| $ | 25,857 | |
| $ | 3,664 | |
| $ | 4,390 | |
| $ | 33,911 | |
The tables below present, by company, the components of our allowance for loan losses and the recorded investment of the related loans as of November 30, 2017 and May 31, 2017 .
66
NATIONAL RURAL UTILITIES COOPERATIVE FINANCE CORPORATION
NOTES TO CONDENSED CONSOLIDATED FINANCIAL STATEMENTS
(UNAUDITED)
|
| November 30, 2017 | ||||||||||||||
(Dollars in thousands) |
| CFC |
| NCSC |
| RTFC |
| Total | ||||||||
Allowance by company: |
|
|
|
|
|
|
|
| ||||||||
Collective allowance |
| $ | 28,799 | |
| $ | 3,117 | |
| $ | 3,528 | |
| $ | 35,444 | |
Specific allowance |
| - | |
| - | |
| 1,330 | |
| 1,330 | | ||||
Total allowance for loan losses |
| $ | 28,799 | |
| $ | 3,117 | |
| $ | 4,858 | |
| $ | 36,774 | |
|
|
|
|
|
|
|
|
| ||||||||
Recorded investment in loans: |
|
|
|
|
|
|
|
| ||||||||
Collectively evaluated loans |
| $ | 23,695,597 | |
| $ | 739,707 | |
| $ | 365,390 | |
| $ | 24,800,694 | |
Individually evaluated loans |
| 6,507 | |
| - | |
| 6,341 | |
| 12,848 | | ||||
Total recorded investment in loans |
| $ | 23,702,104 | |
| $ | 739,707 | |
| $ | 371,731 | |
| $ | 24,813,542 | |
|
|
|
|
|
|
|
|
| ||||||||
Total recorded investment in loans, net (1) |
| $ | 23,673,305 | |
| $ | 736,590 | |
| $ | 366,873 | |
| $ | 24,776,768 | |
|
| May 31, 2017 | ||||||||||||||
(Dollars in thousands) |
| CFC |
| NCSC |
| RTFC |
| Total | ||||||||
Allowance by company: |
|
|
|
|
|
|
|
| ||||||||
Collective allowance |
| $ | 29,499 | |
| $ | 2,910 | |
| $ | 3,327 | |
| $ | 35,736 | |
Specific allowance |
| - | |
| - | |
| 1,640 | |
| 1,640 | | ||||
Total ending balance of the allowance |
| $ | 29,499 | |
| $ | 2,910 | |
| $ | 4,967 | |
| $ | 37,376 | |
|
|
|
|
|
|
|
|
| ||||||||
Recorded investment in loans: |
|
|
|
|
|
|
|
| ||||||||
Collectively evaluated loans |
| $ | 23,381,406 | |
| $ | 613,924 | |
| $ | 347,827 | |
| $ | 24,343,157 | |
Individually evaluated loans |
| 6,581 | |
| - | |
| 6,592 | |
| 13,173 | | ||||
Total recorded investment in loans |
| $ | 23,387,987 | |
| $ | 613,924 | |
| $ | 354,419 | |
| $ | 24,356,330 | |
|
|
|
|
|
|
|
|
| ||||||||
Total recorded investment in loans, net (1) |
| $ | 23,358,488 | |
| $ | 611,014 | |
| $ | 349,452 | |
| $ | 24,318,954 | |
____________________________
(1) Excludes unamortized deferred loan origination costs $11 million as of both November 30, 2017 and May 31, 2017 .
Reserve for Unadvanced Commitments
We also maintain a reserve for unadvanced loan commitments at a level estimated by management to provide for probable losses under these commitments as of each balance sheet dated. Unadvanced loan commitments are analyzed and segregated by loan type and risk using our internal risk rating scales. We use these risk classifications, in combination with the probability of commitment usage, and any other pertinent information to estimate a reserve for unadvanced loan commitments, which we record as a liability on our condensed consolidated balance sheets. The reserve for these commitments was $0.1 million as of both November 30, 2017 and May 31, 2017 .
NOTE 5-SHORT-TERM BORROWINGS | ||||
|
|
|
|
|
67
NATIONAL RURAL UTILITIES COOPERATIVE FINANCE CORPORATION
NOTES TO CONDENSED CONSOLIDATED FINANCIAL STATEMENTS
(UNAUDITED)
Committed Bank Revolving Line of Credit Agreements
We had $3,085 million and $3,165 million of commitments under committed bank revolving line of credit agreements as of November 30, 2017 and May 31, 2017 , respectively. Under our current committed bank revolving line of credit agreements, we have the ability to request up to $300 million of letters of credit, which would result in a reduction in the remaining available amount under the facilities.
On November 20, 2017 , we amended and restated the three-year and five-year committed bank revolving line of credit agreements to extend the maturity dates to November 20, 2020 and November 20, 2022 , respectively, and to terminate certain third-party bank commitments totaling $40 million under the three-year agreement and $40 million under the five- year agreement. As a result, the total commitment amount from third-parties under the three-year facility and the five-year facility is $1,493 million and $1,592 million , respectively, resulting in a combined total commitment amount under the two facilities of $3,085 million .
The following table presents the total commitment, the net amount available for use and the outstanding letters of credit under our committed bank revolving line of credit agreements as of November 30, 2017 and May 31, 2017 .
|
| November 30, 2017 | | May 31, 2017 | |
| |
| ||||||||||||||||||||
(Dollars in millions) |
| Total Commitment | | Letters of Credit Outstanding | | Net Available for Use | | Total Commitment | | Letters of Credit Outstanding | | Net Available for Use | | Maturity | | Annual Facility Fee (1) | ||||||||||||
3-year agreement |
| $ | - | |
| $ | - | |
| $ | - | |
| $ | 1,533 | |
| $ | - | |
| $ | 1,533 | |
| November 19, 2019 |
| 7.5 bps |
3-year agreement |
| 1,493 | |
| - | |
| 1,493 | |
| - | |
| - | |
| - | |
| November 20, 2020 |
| 7.5 bps | ||||||
Total 3-year agreement |
| 1,493 | |
| - | |
| 1,493 | |
| 1,533 | |
| - | |
| 1,533 | |
|
|
|
| ||||||
5-year agreement |
| - | |
| - | |
| - | |
| 1,632 | |
| 1 | |
| 1,631 | |
| November 19, 2021 |
| 10 bps | ||||||
5-year agreement |
| 1,592 | |
| 2 | |
| 1,590 | |
| - | |
| - | |
| - | |
| November 20, 2022 |
| 10 bps | ||||||
Total 5-year agreement |
| 1,592 | | | 2 | | | 1,590 | | | 1,632 | | | 1 | | | 1,631 | | |
| |
| ||||||
Total |
| $ | 3,085 | |
| $ | 2 | |
| $ | 3,083 | |
| $ | 3,165 | |
| $ | 1 | |
| $ | 3,164 | |
|
|
|
|
____________________________
(1) Facility fee determined by CFC's senior unsecured credit ratings based on the pricing schedules put in place at the inception of the related agreement.
We were in compliance with all covenants and conditions under our committed bank revolving line of credit agreements and there were no borrowings outstanding under these agreements as of November 30, 2017 and May 31, 2017 .
68
NATIONAL RURAL UTILITIES COOPERATIVE FINANCE CORPORATION
NOTES TO CONDENSED CONSOLIDATED FINANCIAL STATEMENTS
(UNAUDITED)
NOTE 6-LONG-TERM DEBT | ||||
The following table displays long-term debt outstanding, by debt type, as of November 30, 2017 and May 31, 2017 .
(Dollars in thousands) |
| November 30, 2017 |
| May 31, 2017 | ||||
Unsecured long-term debt: |
|
|
|
| ||||
Medium-term notes sold through dealers |
| $ | 2,781,757 | |
| $ | 2,386,956 | |
Medium-term notes sold to members |
| 404,567 | |
| 422,779 | | ||
Subtotal medium-term notes |
| 3,186,324 | |
| 2,809,735 | | ||
Unamortized discount |
| (375 | ) |
| (382 | ) | ||
Debt issuance costs |
| (23,192 | ) |
| (21,903 | ) | ||
Total unsecured medium-term notes |
| 3,162,757 | |
| 2,787,450 | | ||
Unsecured notes payable |
| 22,799 | |
| 22,799 | | ||
Unamortized discount |
| (324 | ) |
| (379 | ) | ||
Debt issuance costs |
| (80 | ) |
| (94 | ) | ||
Total unsecured notes payable |
| 22,395 | |
| 22,326 | | ||
Total unsecured long-term debt |
| 3,185,152 | |
| 2,809,776 | | ||
Secured long-term debt: |
|
| |
|
| | ||
Collateral trust bonds |
| 7,917,711 | |
| 7,922,711 | | ||
Unamortized discount |
| (253,449 | ) |
| (258,329 | ) | ||
Debt issuance costs |
| (26,938 | ) |
| (30,334 | ) | ||
Total collateral trust bonds |
| 7,637,324 | |
| 7,634,048 | | ||
Guaranteed Underwriter Program notes payable |
| 5,060,192 | |
| 4,985,748 | | ||
Debt issuance costs |
| (249 | ) |
| (264 | ) | ||
Total Guaranteed Underwriter Program notes payable |
| 5,059,943 | |
| 4,985,484 | | ||
Farmer Mac notes payable |
| 2,491,463 | |
| 2,513,389 | | ||
Other secured notes payable |
| 13,214 | |
| 13,214 | | ||
Debt issuance costs |
| (277 | ) |
| (317 | ) | ||
Total other secured notes payable |
| 12,937 | |
| 12,897 | | ||
Total secured notes payable |
| 7,564,343 | |
| 7,511,770 | | ||
Total secured long-term debt |
| 15,201,667 | |
| 15,145,818 | | ||
Total long-term debt |
| $ | 18,386,819 | |
| $ | 17,955,594 | |
Secured Notes Payable
We had outstanding secured notes payable totaling $5,060 million and $4,985 million as of November 30, 2017 and May 31, 2017 , respectively, under bond purchase agreements with Federal Financing Bank and a bond guarantee agreement with RUS issued under the Guaranteed Underwriter Program, which provides guarantees to Federal Financing Bank. We pay RUS a fee of 30 basis points per year on the total amount outstanding. On November 9, 2017 , we closed on a $750 million committed loan facility ("Series M") from the Federal Financing Bank under the Guaranteed Underwriter Program. Pursuant to this facility, we may borrow any time before July 15, 2022. Each advance is subject to quarterly amortization and a final maturity not longer than 20 years from the advance date. The closing of this committed loan facility increased the amount available for access under the Guaranteed Underwriter Program to $1,375 million as of November 30, 2017 .
We are required to pledge eligible distribution system or power supply system loans as collateral in an amount at least equal to the total principal amount of notes outstanding under the Guaranteed Underwriter Program. See "Note 4-Loans and Commitments" for additional information on the collateral pledged to secure notes payable under this program.
69
NATIONAL RURAL UTILITIES COOPERATIVE FINANCE CORPORATION
NOTES TO CONDENSED CONSOLIDATED FINANCIAL STATEMENTS
(UNAUDITED)
We have two revolving note purchase agreements with Farmer Mac, which together allow us to borrow up to $4,800 million from Farmer Mac. Under the terms of the first revolving note purchase agreement with Farmer Mac dated March 24, 2011, as amended, we can borrow, subject to market conditions, up to $4,500 million at any time through January 11, 2020, and such date shall automatically extend on each anniversary date of the closing for an additional year, unless prior to any such anniversary date, Farmer Mac provides us with a notice that the draw period will not be extended beyond the remaining term. This revolving note purchase agreement allows us to borrow, repay and re-borrow funds at any time through maturity, as market conditions permit, provided that the outstanding principal amount at any time does not exceed the total available under the agreement. Each borrowing under the revolving note purchase agreement is evidenced by a pricing agreement setting forth the interest rate, maturity date and other related terms as we may negotiate with Farmer Mac at the time of each such borrowing. We may select a fixed rate or variable rate at the time of each advance with a maturity as determined in the applicable pricing agreement. Under this note purchase agreement with Farmer Mac, we had outstanding secured notes payable totaling $2,491 million and $2,513 million as of November 30, 2017 and May 31, 2017 , respectively.
Under the terms of the second revolving note purchase agreement with Farmer Mac dated July 31, 2015, we can borrow up to $300 million at any time through July 31, 2018 at a fixed spread over LIBOR. This agreement also allows us to borrow, repay and re-borrow funds at any time through maturity, provided that the outstanding principal amount at any time does not exceed the total available under the agreement. We had no notes payable outstanding under this revolving note purchase agreement with Farmer Mac as of November 30, 2017 and May 31, 2017 .
We are required to pledge eligible distribution system or power supply system loans as collateral in an amount at least equal to the total principal amount of notes outstanding under each of our Farmer Mac revolving note purchase agreements. See "Note 4-Loans and Commitments" for additional information on the collateral pledged to secure notes payable under these programs.
We were in compliance with all covenants and conditions under our senior debt indentures as of November 30, 2017 and May 31, 2017 .
NOTE 7-SUBORDINATED DEFERRABLE DEBT | ||||
The following table presents subordinated deferrable debt outstanding as of November 30, 2017 and May 31, 2017 .
|
| November 30, 2017 |
| May 31, 2017 | ||||
(Dollars in thousands) |
| Amount |
| Amount | ||||
4.75% due 2043 with a call date of April 30, 2023 |
| $ | 400,000 | |
| $ | 400,000 | |
5.25% due 2046 with a call date of April 20, 2026 |
| 350,000 | |
| 350,000 | | ||
Debt issuance costs |
| (7,659 | ) |
| (7,726 | ) | ||
Total subordinated deferrable debt |
| $ | 742,341 | |
| $ | 742,274 | |
NOTE 8-DERIVATIVE INSTRUMENTS AND HEDGING ACTIVITIES |
Use of Derivatives
We are an end user of derivative financial instruments and do not engage in derivative trading. We use derivatives, primarily interest rate swaps and Treasury rate locks, to manage interest rate risk. Derivatives may be privately negotiated contracts, which are often referred to as over-the-counter ("OTC") derivatives, or they may be listed and traded on an exchange. We generally engage in OTC derivative transactions.
70
NATIONAL RURAL UTILITIES COOPERATIVE FINANCE CORPORATION
NOTES TO CONDENSED CONSOLIDATED FINANCIAL STATEMENTS
(UNAUDITED)
Accounting for Derivatives
In accordance with the accounting standards for derivatives and hedging activities, we record derivative instruments at fair value as either a derivative asset or derivative liability on our condensed consolidated balance sheets. We report derivative asset and liability amounts on a gross basis based on individual contracts, which does not take into consideration the effects of master netting agreements or collateral netting. Derivatives in a gain position are reported as derivative assets on our condensed consolidated balance sheets, while derivatives in a loss position are reported as derivative liabilities. Accrued interest related to derivatives is reported on our condensed consolidated balance sheets as a component of either accrued interest and other receivables or accrued interest payable.
If we do not elect hedge accounting treatment, changes in the fair value of derivative instruments, which consist of net accrued periodic derivative cash settlements and derivative forward value amounts, are recognized in our consolidated statements of operations under derivative gains (losses). If we elect hedge accounting treatment for derivatives, we formally document, designate and assess the effectiveness of the hedge relationship. Changes in the fair value of derivatives designated as qualifying fair value hedges are recorded in earnings together with offsetting changes in the fair value of the hedged item and any related ineffectiveness. Changes in the fair value of derivatives designated as qualifying cash flow hedges are recorded as a component of OCI, to the extent that the hedge relationships are effective, and reclassified AOCI to earnings using the effective interest method over the term of the forecasted transaction. Any ineffectiveness in the hedging relationship is recognized as a component of derivative gains (losses) in our consolidated statement of operations.
We generally do not designate interest rate swaps, which currently represent all of our outstanding derivatives, for hedge accounting. Accordingly, changes in the fair value of interest rate swaps are reported in our consolidated statements of operations under derivative gains (losses). Net periodic cash settlements related to interest rate swaps are classified as an operating activity in our consolidated statements of cash flows.
Outstanding Notional Amount of Derivatives
The notional amount provides an indication of the volume of our derivatives activity, but this amount is not recorded on our condensed consolidated balance sheets. The notional amount is used only as the basis on which interest payments are determined and is not the amount exchanged. The following table shows the outstanding notional amounts and the weighted-average rate paid and received for our interest rate swaps, by type, as of November 30, 2017 and May 31, 2017 . The substantial majority of our interest rate swaps use an index based on the London Interbank Offered Rate ("LIBOR") for either the pay or receive leg of the swap agreement.
|
| November 30, 2017 |
| May 31, 2017 | ||||||||||||||||
(Dollars in thousands) |
| Notional Amount |
| Weighted- Average Rate Paid |
| Weighted- Average Rate Received |
| Notional |
| Weighted- |
| Weighted- | ||||||||
Pay-fixed swaps |
| $ | 6,974,906 | |
| 2.84 | % |
| 1.39 | % |
| $ | 6,807,013 | |
| 2.85 | % |
| 1.16 | % |
Receive-fixed swaps |
| 3,849,000 | |
| 1.94 | |
| 2.63 | |
| 3,699,000 | |
| 1.72 | |
| 2.64 | | ||
Total interest rate swaps |
| 10,823,906 | |
| 2.52 | |
| 1.83 | |
| 10,506,013 | |
| 2.46 | |
| 1.68 | | ||
Forward pay-fixed swaps |
| 226,255 | |
|
|
|
|
| 285,383 | |
|
|
|
| ||||||
Total |
| $ | 11,050,161 | |
|
|
|
|
| $ | 10,791,396 | |
|
|
|
| ||||
Impact of Derivatives on Condensed Consolidated Balance Sheets
The following table displays the fair value of the derivative assets and derivative liabilities recorded on our condensed consolidated balance sheets and the related outstanding notional amount of our interest rate swaps as of November 30, 2017 and May 31, 2017 .
71
NATIONAL RURAL UTILITIES COOPERATIVE FINANCE CORPORATION
NOTES TO CONDENSED CONSOLIDATED FINANCIAL STATEMENTS
(UNAUDITED)
|
| November 30, 2017 |
| May 31, 2017 | ||||||||||||
(Dollars in thousands) |
| Fair Value |
| Notional Balance |
| Fair Value |
| Notional Balance | ||||||||
Derivative assets |
| $ | 87,453 | |
| $ | 3,916,647 | |
| $ | 49,481 | |
| $ | 3,754,120 | |
Derivative liabilities |
| (304,307 | ) |
| 7,133,514 | |
| (385,337 | ) |
| 7,037,276 | | ||||
Total |
| $ | (216,854 | ) |
| $ | 11,050,161 | |
| $ | (335,856 | ) |
| $ | 10,791,396 | |
All of our master swap agreements include legally enforceable netting provisions that allow for offsetting of all contracts with a given counterparty in the event of default by one of the two parties. However, as indicated above, we report derivative asset and liability amounts on a gross basis by individual contracts. The following table presents the gross fair value of derivative assets and liabilities reported on our condensed consolidated balance sheets as of November 30, 2017 and May 31, 2017 , and provides information on the impact of netting provisions and collateral pledged.
|
| November 30, 2017 | ||||||||||||||||||||||
|
| Gross Amount of Recognized Assets/ Liabilities |
| Gross Amount Offset in the Balance Sheet |
| Net Amount of Assets/ Liabilities Presented in the Balance Sheet |
| Gross Amount Not Offset in the Balance Sheet |
|
| ||||||||||||||
(Dollars in thousands) |
|
|
|
| Financial Instruments |
| Cash Collateral Pledged |
| Net Amount | |||||||||||||||
Derivative assets: |
|
|
|
|
|
|
|
|
|
|
|
| ||||||||||||
Interest rate swaps |
| $ | 87,453 | |
| $ | - | |
| $ | 87,453 | |
| $ | 79,373 | |
| $ | - | |
| $ | 8,080 | |
Derivative liabilities: |
|
|
|
|
|
|
|
|
|
|
|
| ||||||||||||
Interest rate swaps |
| 304,307 | |
| - | |
| 304,307 | |
| 79,373 | |
| - | |
| 224,934 | | ||||||
|
| May 31, 2017 | ||||||||||||||||||||||
|
| Gross Amount of Recognized Assets/ Liabilities |
| Gross Amount Offset in the Balance Sheet |
| Net Amount of Assets/ Liabilities Presented in the Balance Sheet |
| Gross Amount Not Offset in the Balance Sheet |
|
| ||||||||||||||
(Dollars in thousands) |
|
|
|
| Financial Instruments |
| Cash Collateral Pledged |
| Net Amount | |||||||||||||||
Derivative assets: |
|
|
|
|
|
|
|
|
|
|
|
| ||||||||||||
Interest rate swaps |
| $ | 49,481 | |
| $ | - | |
| $ | 49,481 | |
| $ | 49,481 | |
| $ | - | |
| $ | - | |
Derivative liabilities: |
|
|
|
|
|
|
|
|
|
|
|
| ||||||||||||
Interest rate swaps |
| 385,337 | |
| - | |
| 385,337 | |
| 49,481 | |
| - | |
| 335,856 | | ||||||
Impact of Derivatives on Condensed Consolidated Statements of Operations
Derivative gains (losses) reported in our condensed consolidated statements of operations consist of derivative cash settlements and derivative forward value gains (losses). Derivative cash settlements represent net contractual interest expense accruals on interest rate swaps during the period. The derivative forward value gains (losses) represent the change in fair value of our interest rate swaps during the reporting period due to changes in the estimate of future interest rates over the remaining life of our derivative contracts.
The following table presents the components of the derivative gains (losses) reported in our condensed consolidated statements of operations for our interest rate swaps for the three and six months ended November 30, 2017 and 2016 .
72
NATIONAL RURAL UTILITIES COOPERATIVE FINANCE CORPORATION
NOTES TO CONDENSED CONSOLIDATED FINANCIAL STATEMENTS
(UNAUDITED)
|
| Three Months Ended November 30, |
| Six Months Ended November 30, | ||||||||||||
(Dollars in thousands) |
| 2017 |
| 2016 |
| 2017 |
| 2016 | ||||||||
Derivative cash settlements |
| $ | (19,635 | ) |
| $ | (21,587 | ) |
| $ | (39,857 | ) |
| $ | (44,977 | ) |
Derivative forward value gains |
| 145,228 | |
| 362,247 | |
| 119,252 | |
| 197,344 | | ||||
Derivative gains |
| $ | 125,593 | |
| $ | 340,660 | |
| $ | 79,395 | |
| $ | 152,367 | |
Credit-Risk-Related Contingent Features
Our derivative contracts typically contain mutual early termination provisions, generally in the form of a credit rating trigger. Under the mutual credit rating trigger provisions, either counterparty may, but is not obligated to, terminate and settle the agreement if the credit rating of the other counterparty falls to a level specified in the agreement. If a derivative contract is terminated, the amount to be received or paid by us would be equal to the mark-to-market value, as defined in the agreement, as of the termination date.
Our senior unsecured credit ratings from Moody's and S&P were A2 and A, respectively, as of November 30, 2017 . Both Moody's and S&P had our ratings on stable outlook as of November 30, 2017 . The following table displays the notional amounts of our derivative contracts with rating triggers as of November 30, 2017 and the payments that would be required if the contracts were terminated as of that date because of a downgrade of our unsecured credit ratings or the counterparty's unsecured credit ratings below A3/A-, below Baa1/BBB+ to or below Baa2/BBB, below Baa3/BBB- or to or below Ba2/BB+ by Moody's or S&P, respectively. In calculating the payment amounts that would be required upon termination of the derivative contracts, we assumed that the amounts for each counterparty would be netted in accordance with the provisions of the master netting agreements for each counterparty. The net payment amounts are based on the fair value of the underlying derivative instrument, excluding the credit risk valuation adjustment, plus any unpaid accrued interest amounts.
(Dollars in thousands) |
| Notional Amount |
| Payable Due From CFC |
| Receivable Due to CFC |
| Net (Payable)/Receivable | ||||||||
Impact of rating downgrade trigger: |
|
|
|
|
|
|
|
| ||||||||
Falls below A3/A- (1) | | $ | 56,985 | | | $ | (11,670 | ) | | $ | - | | | $ | (11,670 | ) |
Falls below Baa1/BBB+ |
| 7,236,383 | | | (143,459 | ) | | 7,428 | | | (136,031 | ) | ||||
Falls to or below Baa2/BBB (2) |
| 455,152 | | | - | | | 1,577 | | | 1,577 | | ||||
Falls below Baa3/BBB- |
| 264,981 | |
| (18,102 | ) |
| - | |
| (18,102 | ) | ||||
Total |
| $ | 8,013,501 | | | $ | (173,231 | ) | | $ | 9,005 | | | $ | (164,226 | ) |
____________________________
(1) Rating trigger for CFC falls below A3/A-, while rating trigger for counterparty falls below Baa1/BBB+ by Moody's or S&P, respectively.
(2) Rating trigger for CFC falls to or below Baa2/BBB, while rating trigger for counterparty falls to or below Ba2/BB+ by Moody's or S&P, respectively.
Our largest counterparty exposure, based on the outstanding notional amount, represented approximately 23% of the total outstanding notional amount of derivatives as of both November 30, 2017 and May 31, 2017 , respectively. The aggregate fair value amount, including the credit risk valuation adjustment, of all interest rate swaps with rating triggers that were in a net liability position was $173 million as of November 30, 2017 .
NOTE 9-EQUITY |
Total equity increased by $141 million to $1,240 million as of November 30, 2017 . The increase was primarily attributable to our reported net income of $188 million for the six months ended November 30, 2017 , which was partially offset by patronage capital retirement of $45 million in September 2017. The following table presents the components of equity as of November 30, 2017 and May 31, 2017 .
73
NATIONAL RURAL UTILITIES COOPERATIVE FINANCE CORPORATION
NOTES TO CONDENSED CONSOLIDATED FINANCIAL STATEMENTS
(UNAUDITED)
(Dollars in thousands) |
| November 30, 2017 |
| May 31, 2017 | ||||
Membership fees |
| $ | 968 | |
| $ | 971 | |
Educational fund |
| 1,398 | |
| 1,929 | | ||
Total membership fees and educational fund |
| 2,366 | |
| 2,900 | | ||
Patronage capital allocated |
| 716,481 | |
| 761,701 | | ||
Members' capital reserve |
| 630,305 | |
| 630,305 | | ||
Unallocated net loss: |
|
|
|
| ||||
Prior year-end cumulative derivative forward value losses (1) |
| (332,525 | ) |
| (507,904 | ) | ||
Current year derivative forward value gains (1) |
| 117,340 | |
| 175,379 | | ||
Current period-end cumulative derivative forward value losses (1) |
| (215,185 | ) |
| (332,525 | ) | ||
Other unallocated net income (loss) |
| 63,763 | |
| (5,603 | ) | ||
Unallocated net loss |
| (151,422 | ) |
| (338,128 | ) | ||
CFC retained equity |
| 1,197,730 | |
| 1,056,778 | | ||
Accumulated other comprehensive income |
| 11,899 | |
| 13,175 | | ||
Total CFC equity |
| 1,209,629 | |
| 1,069,953 | | ||
Noncontrolling interests |
| 30,419 | |
| 28,852 | | ||
Total equity |
| $ | 1,240,048 | |
| $ | 1,098,805 | |
____________________________
(1) Represents derivative forward value gains (losses) for CFC only, as total CFC equity does not include the noncontrolling interests of the consolidated variable interest entities NCSC and RTFC. See "Note 12-Business Segments" for the separate statements of operations for CFC .
In July 2017, the CFC Board of Directors authorized the allocation of the fiscal year 2017 adjusted net income as follows: $90 million to members in the form of patronage capital; $43 million to members' capital reserve; and $1 million to the Cooperative Educational Fund. The amount of patronage capital allocated each year by CFC's Board of Directors is based on adjusted net income, which excludes the impact of derivative forward value gains (losses). See "MD&A-Non-GAAP Financial Measures" for information on adjusted net income.
In July 2017, the CFC Board of Directors authorized the retirement of patronage capital totaling $45 million , which represented 50% of the fiscal year 2017 allocation of patronage capital of $90 million . We returned the $45 million to members in cash in September 2017. The remaining portion of the allocated amount will be retained by CFC for 25 years under guidelines adopted by the CFC Board of Directors in June 2009.
The CFC Board of Directors is required to make annual allocations of adjusted net income, if any. CFC has made annual retirements of allocated net earnings in 38 of the last 39 fiscal years; however, future retirements of allocated amounts are determined based on CFC's financial condition. The CFC Board of Directors has the authority to change the current practice for allocating and retiring net earnings at any time, subject to applicable laws. See "Item 1. Business-Allocation and Retirement of Patronage Capital" of our 2017 Form 10-K for additional information.
Accumulated Other Comprehensive Income
The following tables summarize, by component, the activity in AOCI as of and for the three and six months ended November 30, 2017 and 2016 .
74
NATIONAL RURAL UTILITIES COOPERATIVE FINANCE CORPORATION
NOTES TO CONDENSED CONSOLIDATED FINANCIAL STATEMENTS
(UNAUDITED)
|
| Three Months Ended November 30, 2017 | ||||||||||||||||||
(Dollars in thousands) |
| Unrealized Gains (Losses) AFS Securities |
| Unrealized Gains |
| Unrealized Losses Foreclosed Assets |
| Unrealized Losses Defined Benefit Plan |
| Total | ||||||||||
Beginning balance |
| $ | 10,865 | |
| $ | 3,510 | |
| $ | - | |
| $ | (2,416 | ) |
| $ | 11,959 | |
Unrealized gains |
| 8 | |
| - | |
| - | |
| - | |
| 8 | | |||||
Losses reclassified into earnings |
| - | |
| - | |
| - | |
| 126 | |
| 126 | | |||||
Gains reclassified into earnings |
| - | |
| (194 | ) |
| - | |
| - | |
| (194 | ) | |||||
Other comprehensive income (loss) |
| 8 | |
| (194 | ) |
| - | |
| 126 | |
| (60 | ) | |||||
Ending balance |
| $ | 10,873 | |
| $ | 3,316 | |
| $ | - | |
| $ | (2,290 | ) |
| $ | 11,899 | |
|
| Three Months Ended November 30, 2016 | ||||||||||||||||||
(Dollars in thousands) |
| Unrealized Gains (Losses) AFS Securities |
| Unrealized Gains Derivatives |
| Unrealized Losses Foreclosed Assets |
| Unrealized Losses Defined Benefit Plan |
| Total | ||||||||||
Beginning balance |
| $ | 7,391 | |
| $ | 4,290 | |
| $ | - | |
| $ | (964 | ) |
| $ | 10,717 | |
Unrealized losses |
| (1,761 | ) |
| - | |
| - | |
| - | |
| (1,761 | ) | |||||
Losses reclassified into earnings |
| - | |
| - | |
| - | |
| 44 | |
| 44 | | |||||
Gains reclassified into earnings |
| - | |
| (199 | ) |
| - | |
| - | |
| (199 | ) | |||||
Other comprehensive income (loss) |
| (1,761 | ) |
| (199 | ) |
| - | |
| 44 | |
| (1,916 | ) | |||||
Ending balance |
| $ | 5,630 | |
| $ | 4,091 | |
| $ | - | |
| $ | (920 | ) |
| $ | 8,801 | |
|
| Six Months Ended November 30, 2017 | ||||||||||||||||||
(Dollars in thousands) |
| Unrealized Gains (Losses) AFS Securities |
| Unrealized Gains Derivatives |
| Unrealized Losses Foreclosed Assets |
| Unrealized Losses Defined Benefit Plan |
| Total | ||||||||||
Beginning balance |
| $ | 12,016 | |
| $ | 3,702 | |
| $ | - | |
| $ | (2,543 | ) |
| $ | 13,175 | |
Unrealized losses |
| (1,143 | ) |
| - | |
| - | |
| - | |
| (1,143 | ) | |||||
Losses reclassified into earnings |
| - | |
| - | |
| - | |
| 253 | |
| 253 | | |||||
Gains reclassified into earnings |
| - | |
| (386 | ) |
| - | |
| - | |
| (386 | ) | |||||
Other comprehensive income (loss) |
| (1,143 | ) |
| (386 | ) |
| - | |
| 253 | |
| (1,276 | ) | |||||
Ending balance |
| $ | 10,873 | |
| $ | 3,316 | |
| $ | - | |
| $ | (2,290 | ) |
| $ | 11,899 | |
|
| Six Months Ended November 30, 2016 | ||||||||||||||||||
(Dollars in thousands) |
| Unrealized Gains (Losses) AFS Securities |
| Unrealized Gains Derivatives |
| Unrealized Losses Foreclosed Assets |
| Unrealized Losses Defined Benefit Plan |
| Total | ||||||||||
Beginning balance |
| $ | 7,402 | |
| $ | 4,487 | |
| $ | (9,823 | ) |
| $ | (1,008 | ) |
| $ | 1,058 | |
Unrealized losses |
| (1,772 | ) |
| - | |
| - | |
| - | |
| (1,772 | ) | |||||
Losses reclassified into earnings |
| - | |
| - | |
| 9,823 | |
| 88 | |
| 9,911 | | |||||
Gains reclassified into earnings |
| - | |
| (396 | ) |
| - | |
| - | |
| (396 | ) | |||||
Other comprehensive income (loss) |
| (1,772 | ) |
| (396 | ) |
| 9,823 | |
| 88 | |
| 7,743 | | |||||
Ending balance |
| $ | 5,630 | |
| $ | 4,091 | |
| $ | - | |
| $ | (920 | ) |
| $ | 8,801 | |
75
NATIONAL RURAL UTILITIES COOPERATIVE FINANCE CORPORATION
NOTES TO CONDENSED CONSOLIDATED FINANCIAL STATEMENTS
(UNAUDITED)
We expect to reclassify approximately $0.5 million of amounts in AOCI related to unrealized derivative gains into earnings over the next 12 months.
NOTE 10-GUARANTEES |
The following table summarizes total guarantees, by type of guarantee and by member class, as of November 30, 2017 and May 31, 2017 .
(Dollars in thousands) |
| November 30, 2017 |
| May 31, 2017 | ||||
Total by type: |
|
|
|
| ||||
Long-term tax-exempt bonds (1) |
| $ | 318,425 | |
| $ | 468,145 | |
Letters of credit (2) |
| 230,117 | |
| 307,321 | | ||
Other guarantees |
| 113,954 | |
| 114,151 | | ||
Total |
| $ | 662,496 | |
| $ | 889,617 | |
|
|
|
|
| ||||
Total by member class: |
|
|
|
| ||||
CFC: |
|
|
|
| ||||
Distribution |
| $ | 129,066 | |
| $ | 126,188 | |
Power supply |
| 511,624 | |
| 743,678 | | ||
Statewide and associate |
| 5,005 | |
| 5,054 | | ||
CFC total |
| 645,695 | |
| 874,920 | | ||
NCSC |
| 15,227 | |
| 13,123 | | ||
RTFC |
| 1,574 | |
| 1,574 | | ||
Total |
| $ | 662,496 | |
| $ | 889,617 | |
____________________________
(1) Represents the outstanding principal amount of long-term fixed-rate and variable-rate guaranteed bonds.
(2) Reflects our maximum potential exposure for letters of credit.
Long-term tax-exempt bonds of $318 million and $468 million as of November 30, 2017 and May 31, 2017 , respectively, consisted of $251 million and $400 million , respectively, of adjustable or variable-rate bonds that may be converted to a fixed rate as specified in the applicable indenture for each bond offering. We are unable to determine the maximum amount of interest that we may be required to pay related to the remaining adjustable and variable-rate bonds. Many of these bonds have a call provision that allows us to call the bond in the event of a default, which would limit our exposure to future interest payments on these bonds. Our maximum potential exposure generally is secured by mortgage liens on the members' assets and future revenue. If a member's debt is accelerated because of a determination that the interest thereon is not tax-exempt, the member's obligation to reimburse us for any guarantee payments will be treated as a long-term loan. The remaining long-term tax-exempt bonds of $67 million as of November 30, 2017 are fixed-rate. The maximum potential exposure for these bonds, including the outstanding principal of $67 million and related interest through maturity, totaled $96 million as of November 30, 2017 . The maturities for long-term tax-exempt bonds and the related guarantees extend through calendar year 2042.
Of the outstanding letters of credit of $230 million and $307 million as of November 30, 2017 and May 31, 2017 , respectively, $42 million and $125 million , respectively, was secured. We did not have any letters of credit outstanding that provided for standby liquidity for adjustable and floating-rate tax-exempt bonds issued for the benefit of our members as of November 30, 2017 . Letters of credit include $76 million to provide the standby liquidity for adjustable and floating-rate tax-exempt bonds issued for the benefit of our members as of May 31, 2017 . Security provisions include a mortgage lien on
76
NATIONAL RURAL UTILITIES COOPERATIVE FINANCE CORPORATION
NOTES TO CONDENSED CONSOLIDATED FINANCIAL STATEMENTS
(UNAUDITED)
substantially all of the member's assets, future revenue and the member's investment in our commercial paper. The maturities for the outstanding letters of credit as November 30, 2017 extend through calendar year 2027.
In addition to the letters of credit listed in the table above, under master letter of credit facilities in place as of November 30, 2017 , we may be required to issue up to an additional $65 million in letters of credit to third parties for the benefit of our members. All of our master letter of credit facilities were subject to material adverse change clauses at the time of issuance as of November 30, 2017 . Prior to issuing a letter of credit, we would confirm that there has been no material adverse change in the business or condition, financial or otherwise, of the borrower since the time the loan was approved and confirm that the borrower is currently in compliance with the letter of credit terms and conditions.
The maximum potential exposure for other guarantees was $115 million as of both November 30, 2017 and May 31, 2017 , all of which were unsecured. The maturities for these other guarantees listed in the table above extend through calendar year 2025.
Guarantees under which our right of recovery from our members was not secured totaled $302 million and $297 million and represented 46% and 33% of total guarantees as of November 30, 2017 and May 31, 2017 , respectively.
In addition to the guarantees described above, we were also the liquidity provider for $251 million of variable-rate tax-exempt bonds as of November 30, 2017 , issued for our member cooperatives. While the bonds are in variable-rate mode, in return for a fee, we have unconditionally agreed to purchase bonds tendered or put for redemption if the remarketing agents are unable to sell such bonds to other investors. We were not required to perform as liquidity provider pursuant to these obligations during the six months ended November 30, 2017 or the prior fiscal year.
Guarantee Liability
As of November 30, 2017 and May 31, 2017 , we recorded a guarantee liability of $8 million and $15 million respectively, which represents the contingent and noncontingent exposures related to guarantees and liquidity obligations. The contingent guarantee liability was $1 million as of both November 30, 2017 and May 31, 2017 , based on management's estimate of exposure to losses within the guarantee portfolio. The remaining balance of the total guarantee liability of $7 million and $14 million as of November 30, 2017 and May 31, 2017 , respectively, relates to our noncontingent obligation to stand ready to perform over the term of our guarantees and liquidity obligations that we have entered into or modified since January 1, 2003.
NOTE 11-FAIR VALUE MEASUREMENT |
We use fair value measurements for the initial recording of certain assets and liabilities and periodic remeasurement of certain assets and liabilities on a recurring or nonrecurring basis. The accounting guidance for fair value measurements and disclosures establishes a three-level fair value hierarchy that prioritizes the inputs into the valuation techniques used to measure fair value. The levels of the fair value hierarchy, in priority order, include Level 1, Level 2 and Level 3. For additional information regarding the fair value hierarchy and a description of the methodologies we use to measure fair value, see "Note 14-Fair Value Measurement" to the Consolidated Financial Statements in our 2017 Form 10-K.
The following tables present the carrying value and fair value for all of our financial instruments, including those carried at amortized cost, as of November 30, 2017 and May 31, 2017 . The tables also display the classification within the fair value hierarchy of the valuation technique used in estimating fair value.
77
NATIONAL RURAL UTILITIES COOPERATIVE FINANCE CORPORATION
NOTES TO CONDENSED CONSOLIDATED FINANCIAL STATEMENTS
(UNAUDITED)
|
| November 30, 2017 |
| Fair Value Measurement Level | ||||||||||||||||
(Dollars in thousands) |
| Carrying Value |
| Fair Value |
| Level 1 |
| Level 2 |
| Level 3 | ||||||||||
Assets: |
|
|
|
|
|
|
|
|
|
| ||||||||||
Cash and cash equivalents |
| $ | 280,315 | |
| $ | 280,315 | |
| $ | 280,315 | |
| $ | - | |
| $ | - | |
Restricted cash |
| 11,323 | |
| 11,323 | |
| 11,323 | |
| - | |
| - | | |||||
Time deposits |
| 51,000 | |
| 51,000 | |
|
|
| 51,000 | |
|
| |||||||
Investment securities, available-for-sale |
| 91,411 | |
| 91,411 | |
| 91,411 | |
| - | |
| - | | |||||
Investment securities, held-to-maturity |
| 248,155 | |
| 247,257 | |
| - | |
| 247,257 | |
| - | | |||||
Deferred compensation investments |
| 5,176 | |
| 5,176 | |
| 5,176 | |
| - | |
| - | | |||||
Loans to members, net |
| 24,787,917 | |
| 24,351,976 | |
| - | |
| - | |
| 24,351,976 | | |||||
Accrued interest receivable |
| 116,770 | |
| 116,770 | |
| - | |
| 116,770 | |
| - | | |||||
Debt service reserve funds |
| 17,151 | |
| 17,151 | |
| 17,151 | |
| - | |
| - | | |||||
Derivative assets |
| 87,453 | |
| 87,453 | |
| - | |
| 87,453 | |
| - | | |||||
|
|
|
|
|
|
|
|
|
|
| ||||||||||
Liabilities: |
|
|
|
|
|
|
|
|
|
| ||||||||||
Short-term borrowings |
| $ | 3,557,192 | |
| $ | 3,556,637 | |
| $ | 1,446,065 | |
| $ | 2,110,572 | |
| $ | - | |
Long-term debt |
| 18,386,819 | |
| 18,975,545 | |
| - | |
| 11,452,351 | |
| 7,523,194 | | |||||
Accrued interest payable |
| 143,085 | |
| 143,085 | |
| - | |
| 143,085 | |
| - | | |||||
Guarantee liability |
| 8,211 | |
| 8,423 | |
| - | |
| - | |
| 8,423 | | |||||
Derivative liabilities |
| 304,307 | |
| 304,307 | |
| - | |
| 304,307 | |
| - | | |||||
Subordinated deferrable debt |
| 742,341 | |
| 789,430 | |
| - | |
| 789,430 | |
| - | | |||||
Members' subordinated certificates |
| 1,399,675 | |
| 1,399,697 | |
| - | |
| - | |
| 1,399,697 | | |||||
|
| May 31, 2017 |
| Fair Value Measurement Level | ||||||||||||||||
(Dollars in thousands) |
| Carrying Value |
| Fair Value |
| Level 1 |
| Level 2 |
| Level 3 | ||||||||||
Assets: |
|
|
|
|
|
|
|
|
|
| ||||||||||
Cash and cash equivalents |
| $ | 166,615 | |
| $ | 166,615 | |
| $ | 166,615 | |
| $ | - | |
| $ | - | |
Restricted cash |
| 21,806 | |
| 21,806 | |
| 21,806 | |
| - | |
| - | | |||||
Time deposits |
| 226,000 | |
| 226,000 | |
| - | |
| 226,000 | |
| - | | |||||
Investment securities, available-for-sale |
| 92,554 | |
| 92,554 | |
| 92,554 | |
| - | |
| - | | |||||
Deferred compensation investments |
| 4,693 | |
| 4,693 | |
| 4,693 | |
| - | |
| - | | |||||
Loans to members, net |
| 24,329,668 | |
| 24,182,724 | |
| - | |
| - | |
| 24,182,724 | | |||||
Accrued interest receivable |
| 111,493 | |
| 111,493 | |
| - | |
| 111,493 | |
| - | | |||||
Debt service reserve funds |
| 17,151 | |
| 17,151 | |
| 17,151 | |
| - | |
| - | | |||||
Derivative assets |
| 49,481 | |
| 49,481 | |
| - | |
| 49,481 | |
| - | | |||||
|
|
|
|
|
|
|
|
|
|
| ||||||||||
Liabilities: |
|
|
|
|
|
|
|
|
|
| ||||||||||
Short-term borrowings |
| $ | 3,342,900 | |
| $ | 3,342,990 | |
| $ | 1,527,990 | |
| $ | 1,815,000 | |
| $ | - | |
Long-term debt |
| 17,955,594 | |
| 18,744,331 | |
| - | |
| 11,215,290 | |
| 7,529,041 | | |||||
Accrued interest payable |
| 137,476 | |
| 137,476 | |
| - | |
| 137,476 | |
| - | | |||||
Guarantee liability |
| 15,241 | |
| 16,204 | |
| - | |
| - | |
| 16,204 | | |||||
Derivative liabilities |
| 385,337 | |
| 385,337 | |
| - | |
| 385,337 | |
| - | | |||||
Subordinated deferrable debt |
| 742,274 | |
| 788,079 | |
| - | |
| 788,079 | |
| - | | |||||
Members' subordinated certificates |
| 1,419,025 | |
| 1,419,048 | |
| - | |
| - | |
| 1,419,048 | | |||||
78
NATIONAL RURAL UTILITIES COOPERATIVE FINANCE CORPORATION
NOTES TO CONDENSED CONSOLIDATED FINANCIAL STATEMENTS
(UNAUDITED)
Investment Securities, Held-to-Maturity, Fair Value
As discussed above in "Note 3-Investment Securities," we did not have any securities classified as HTM as of May 31, 2017 . During the second quarter of fiscal year 2018, we commenced the purchase of additional investment securities, consisting primarily of certificates of deposit, commercial paper and corporate debt securities, commercial MBS and other ABS traded in secondary markets. We designated these securities as HTM.
Management estimates the fair value of our HTM securities utilizing the assistance of third-party pricing services. Methodologies employed, controls relied upon and inputs used by third-party pricing vendors are subject to management review when such services are provided. This review may consist of, in part, obtaining and evaluating control reports issued and pricing methodology materials distributed. We review the pricing methodologies provided by the vendors in order to determine if observable market information is being used to determine the fair value versus unobservable inputs. Investment securities traded in secondary markets are typically valued using unadjusted vendor prices. These investment securities, which include those measured using unadjusted vendor prices, are generally classified as Level 2 because the valuation typically involves using quoted market prices for similar securities, pricing models, discounted cash flow analyses using significant observable market where available or a combination of multiple valuation techniques for which all significant
assumptions are observable in the market.
Transfers Between Levels
We monitor the availability of observable market data to assess the appropriate classification of financial instruments within the fair value hierarchy and transfer between Level 1, Level 2, and Level 3 accordingly. Observable market data includes but is not limited to quoted prices and market transactions. Changes in economic conditions or market liquidity generally will drive changes in availability of observable market data. Changes in availability of observable market data, which also may result in changes in the valuation technique used, are generally the cause of transfers between levels. We did not have any transfers between levels for financial instruments measured at fair value on a recurring basis for the six months ended November 30, 2017 and 2016 .
Recurring Fair Value Measurements
The following table presents the carrying value and fair value of financial instruments reported in our condensed consolidated financial statements at fair value on a recurring basis as of November 30, 2017 and May 31, 2017 , and the classification of the valuation technique within the fair value hierarchy.
|
| November 30, 2017 |
| May 31, 2017 | ||||||||||||||||||||
(Dollars in thousands) |
| Level 1 |
| Level 2 |
| Total |
| Level 1 |
| Level 2 |
| Total | ||||||||||||
Investment securities, available for sale |
| $ | 91,411 | |
| $ | - | |
| $ | 91,411 | |
| $ | 92,554 | |
| $ | - | |
| $ | 92,554 | |
Deferred compensation investments |
| 5,176 | |
| - | |
| 5,176 | |
| 4,693 | |
| - | |
| 4,693 | | ||||||
Derivative assets |
| - | |
| 87,453 | |
| 87,453 | |
| - | |
| 49,481 | |
| 49,481 | | ||||||
Derivative liabilities |
| - | |
| 304,307 | |
| 304,307 | |
| - | |
| 385,337 | |
| 385,337 | | ||||||
Nonrecurring Fair Value
|
|
|
|
|
|
|
|
|
|
|
|
|
We did not have any assets reported in our condensed consolidated financial statements at fair value on a nonrecurring basis as of November 30, 2017 and May 31, 2017 and there were no unrealized losses for the three and six months ended November 30, 2017 and 2016 related to these assets.
79
NATIONAL RURAL UTILITIES COOPERATIVE FINANCE CORPORATION
NOTES TO CONDENSED CONSOLIDATED FINANCIAL STATEMENTS
(UNAUDITED)
Significant Unobservable Level 3 Inputs
Impaired Loans
We utilize the fair value of estimated cash flows or the collateral underlying the loan to determine the fair value and specific allowance for impaired loans. The valuation technique used to determine fair value of the impaired loans provided by both our internal staff and third-party specialists includes market multiples (i.e., comparable companies). The significant unobservable inputs used in the determination of fair value for individually impaired loans is a multiple of earnings before interest, taxes, depreciation and amortization based on various factors (i.e., financial condition of the borrower). In estimating the fair value of the collateral, we may use third-party valuation specialists, internal estimates or a combination of both. The significant unobservable inputs for estimating the fair value of impaired collateral-dependent loans are reviewed by our Credit Risk Management group to assess the reasonableness of the assumptions used and the accuracy of the work performed. In cases where we rely on third-party inputs, we use the final unadjusted third-party valuation analysis as support for any adjustments to our consolidated financial statements and disclosures.
Because of the limited amount of impaired loans as of November 30, 2017 and May 31, 2017 , we do not believe that potential changes in the significant unobservable inputs used in the determination of the fair value for impaired loans will have a material impact on the fair value measurement of these assets or our results of operations.
NOTE 12-BUSINESS SEGMENTS |
The following tables display segment results for the three and six months ended November 30, 2017 and 2016 , and assets attributable to each segment as of November 30, 2017 and November 30, 2016 .
80
NATIONAL RURAL UTILITIES COOPERATIVE FINANCE CORPORATION
NOTES TO CONDENSED CONSOLIDATED FINANCIAL STATEMENTS
(UNAUDITED)
|
|
|
|
|
|
|
|
| ||||||||
|
| Three Months Ended November 30, 2017 | ||||||||||||||
(Dollars in thousands) |
| CFC |
| Other |
| Elimination |
| Consolidated Total | ||||||||
Statement of operations: |
|
|
|
|
|
|
|
| ||||||||
Interest income |
| $ | 263,180 | |
| $ | 12,257 | |
| $ | (9,614 | ) |
| $ | 265,823 | |
Interest expense |
| (194,943 | ) |
| (9,841 | ) |
| 9,614 | |
| (195,170 | ) | ||||
Net interest income |
| 68,237 | |
| 2,416 | |
| - | |
| 70,653 | | ||||
Benefit for loan losses |
| 304 | |
| - | |
| - | |
| 304 | | ||||
Net interest income after benefit for loan losses |
| 68,541 | |
| 2,416 | |
| - | |
| 70,957 | | ||||
Non-interest income: |
|
|
|
|
|
|
|
| ||||||||
Fee and other income |
| 5,490 | |
| 301 | |
| (249 | ) |
| 5,542 | | ||||
Derivative gains (losses): |
|
|
|
|
|
|
|
| ||||||||
Derivative cash settlements |
| (18,990 | ) |
| (645 | ) |
| - | |
| (19,635 | ) | ||||
Derivative forward value gains |
| 143,452 | |
| 1,776 | |
| - | |
| 145,228 | | ||||
Derivative gains |
| 124,462 | |
| 1,131 | |
| - | |
| 125,593 | | ||||
Results of operations of foreclosed assets |
| (10 | ) |
| - | |
| - | |
| (10 | ) | ||||
Total non-interest income |
| 129,942 | |
| 1,432 | |
| (249 | ) |
| 131,125 | | ||||
Non-interest expense: |
|
|
|
|
|
|
|
| ||||||||
General and administrative expenses |
| (20,292 | ) |
| (1,622 | ) |
| - | |
| (21,914 | ) | ||||
Losses on early extinguishment of debt |
| - | |
| - | |
| - | |
| - | | ||||
Other non-interest expense |
| (618 | ) |
| (249 | ) |
| 249 | |
| (618 | ) | ||||
Total non-interest expense |
| (20,910 | ) |
| (1,871 | ) |
| 249 | |
| (22,532 | ) | ||||
Income before income taxes |
| 177,573 | |
| 1,977 | |
| - | |
| 179,550 | | ||||
Income tax expense |
| - | |
| (827 | ) |
| - | |
| (827 | ) | ||||
Net income |
| $ | 177,573 | |
| $ | 1,150 | |
| $ | - | |
| $ | 178,723 | |
|
|
|
|
|
|
|
|
| ||||||||
81
NATIONAL RURAL UTILITIES COOPERATIVE FINANCE CORPORATION
NOTES TO CONDENSED CONSOLIDATED FINANCIAL STATEMENTS
(UNAUDITED)
|
|
|
|
|
|
|
|
| ||||||||
|
| Three Months Ended November 30, 2016 | ||||||||||||||
(Dollars in thousands) |
| CFC |
| Other |
| Elimination |
| Consolidated Total | ||||||||
Statement of operations: |
|
|
|
|
|
|
|
| ||||||||
Interest income |
| $ | 254,689 | |
| $ | 11,129 | |
| $ | (8,662 | ) |
| $ | 257,156 | |
Interest expense |
| (183,395 | ) |
| (8,934 | ) |
| 8,675 | |
| (183,654 | ) | ||||
Net interest income |
| 71,294 | |
| 2,195 | |
| 13 | |
| 73,502 | | ||||
Provision for loan losses |
| (738 | ) |
| - | |
| - | |
| (738 | ) | ||||
Net interest income after provision for loan losses |
| 70,556 | |
| 2,195 | |
| 13 | |
| 72,764 | | ||||
Non-interest income: |
|
|
|
|
|
|
| | ||||||||
Fee and other income |
| 4,628 | |
| 1,727 | |
| (1,258 | ) |
| 5,097 | | ||||
Derivative gains (losses): |
|
|
|
|
|
|
| | | |||||||
Derivative cash settlements |
| (20,821 | ) |
| (766 | ) |
| - | |
| (21,587 | ) | ||||
Derivative forward value gains |
| 358,423 | |
| 3,824 | |
| - | |
| 362,247 | | ||||
Derivative gains |
| 337,602 | |
| 3,058 | |
| - | |
| 340,660 | | ||||
Results of operations of foreclosed assets |
| (549 | ) |
| - | |
| - | |
| (549 | ) | ||||
Total non-interest income |
| 341,681 | |
| 4,785 | |
| (1,258 | ) |
| 345,208 | | ||||
Non-interest expense: |
|
|
|
|
|
|
| | ||||||||
General and administrative expenses |
| (18,991 | ) |
| (1,641 | ) |
| - | |
| (20,632 | ) | ||||
Other non-interest expense |
| (517 | ) |
| (1,245 | ) |
| 1,245 | |
| (517 | ) | ||||
Total non-interest expense |
| (19,508 | ) |
| (2,886 | ) |
| 1,245 | |
| (21,149 | ) | ||||
Income before income taxes |
| 392,729 | |
| 4,094 | |
| - | |
| 396,823 | | ||||
Income tax expense |
| - | |
| (1,519 | ) |
| - | |
| (1,519 | ) | ||||
Net income |
| $ | 392,729 | |
| $ | 2,575 | |
| $ | - | |
| $ | 395,304 | |
|
|
|
|
|
|
|
|
| ||||||||
82
NATIONAL RURAL UTILITIES COOPERATIVE FINANCE CORPORATION
NOTES TO CONDENSED CONSOLIDATED FINANCIAL STATEMENTS
(UNAUDITED)
|
| Six Months Ended November 30, 2017 | ||||||||||||||
(Dollars in thousands) |
| CFC |
| Other |
| Elimination |
| Consolidated Total | ||||||||
Statement of operations: |
|
|
|
|
|
|
|
| ||||||||
Interest income |
| $ | 526,591 | |
| $ | 23,206 | |
| $ | (18,059 | ) |
| $ | 531,738 | |
Interest expense |
| (387,448 | ) |
| (18,512 | ) |
| 18,059 | |
| (387,901 | ) | ||||
Net interest income |
| 139,143 | |
| 4,694 | |
| - | |
| 143,837 | | ||||
Benefit for loan losses |
| 602 | |
| - | |
| - | |
| 602 | | ||||
Net interest income after benefit for loan losses |
| 139,745 | |
| 4,694 | |
| - | |
| 144,439 | | ||||
Non-interest income: |
|
|
|
|
|
|
|
| ||||||||
Fee and other income |
| 9,378 | |
| 701 | |
| (592 | ) |
| 9,487 | | ||||
Derivative gains (losses): |
|
|
|
|
|
|
|
| ||||||||
Derivative cash settlements |
| (38,554 | ) |
| (1,303 | ) |
| - | |
| (39,857 | ) | ||||
Derivative forward value gains |
| 117,341 | |
| 1,911 | |
| - | |
| 119,252 | | ||||
Derivative gains |
| 78,787 | |
| 608 | |
| - | |
| 79,395 | | ||||
Results of operations of foreclosed assets |
| (34 | ) |
| - | |
| - | |
| (34 | ) | ||||
Total non-interest income |
| 88,131 | |
| 1,309 | |
| (592 | ) |
| 88,848 | | ||||
Non-interest expense: |
|
|
|
|
|
|
|
| ||||||||
General and administrative expenses |
| (40,030 | ) |
| (3,520 | ) |
| - | |
| (43,550 | ) | ||||
Other non-interest expense |
| (1,140 | ) |
| (592 | ) |
| 592 | |
| (1,140 | ) | ||||
Total non-interest expense |
| (41,170 | ) |
| (4,112 | ) |
| 592 | |
| (44,690 | ) | ||||
Income before income taxes |
| 186,706 | |
| 1,891 | |
| - | |
| 188,597 | | ||||
Income tax expense |
| - | |
| (859 | ) |
| - | |
| (859 | ) | ||||
Net income |
| $ | 186,706 | |
| $ | 1,032 | |
| $ | - | |
| $ | 187,738 | |
|
|
|
|
|
|
|
|
| ||||||||
|
| November 30, 2017 | ||||||||||||||
|
| CFC |
| Other |
| Elimination |
| Consolidated Total | ||||||||
Assets: |
|
|
|
|
|
|
|
| ||||||||
Loans to members |
| $ | 24,788,572 | |
| $ | 1,111,438 | |
| $ | (1,075,319 | ) |
| $ | 24,824,691 | |
Less: Allowance for loan losses |
| (36,774 | ) |
| - | |
| - | |
| (36,774 | ) | ||||
Loans to members, net |
| 24,751,798 | |
| 1,111,438 | |
| (1,075,319 | ) |
| 24,787,917 | | ||||
Other assets |
| 1,081,850 | |
| 107,516 | |
| (97,040 | ) |
| 1,092,326 | | ||||
Total assets |
| $ | 25,833,648 | |
| $ | 1,218,954 | |
| $ | (1,172,359 | ) |
| $ | 25,880,243 | |
83
NATIONAL RURAL UTILITIES COOPERATIVE FINANCE CORPORATION
NOTES TO CONDENSED CONSOLIDATED FINANCIAL STATEMENTS
(UNAUDITED)
|
| Six Months Ended November 30, 2016 | ||||||||||||||
(Dollars in thousands) |
| CFC |
| Other |
| Elimination |
| Consolidated Total | ||||||||
Statement of operations: |
|
|
|
|
|
|
|
| ||||||||
Interest income |
| $ | 508,706 | |
| $ | 22,351 | |
| $ | (17,066 | ) |
| $ | 513,991 | |
Interest expense |
| (364,227 | ) |
| (17,610 | ) |
| 17,103 | |
| (364,734 | ) | ||||
Net interest income |
| 144,479 | |
| 4,741 | |
| 37 | |
| 149,257 | | ||||
Provision for loan losses |
| (2,666 | ) |
| - | |
| - | |
| (2,666 | ) | ||||
Net interest income after provision for loan losses |
| 141,813 | |
| 4,741 | |
| 37 | |
| 146,591 | | ||||
Non-interest income: |
|
|
|
|
|
|
|
| ||||||||
Fee and other income |
| 8,956 | |
| 2,624 | |
| (1,953 | ) |
| 9,627 | | ||||
Derivative gains (losses): |
| | |
| | |
| | |
| | | ||||
Derivative cash settlements |
| (43,430 | ) |
| (1,547 | ) |
| - | |
| (44,977 | ) | ||||
Derivative forward value gains |
| 194,210 | |
| 3,134 | |
| - | |
| 197,344 | | ||||
Derivative gains |
| 150,780 | |
| 1,587 | |
| - | |
| 152,367 | | ||||
Results of operations of foreclosed assets |
| (1,661 | ) |
| - | |
| - | |
| (1,661 | ) | ||||
Total non-interest income |
| 158,075 | |
| 4,211 | |
| (1,953 | ) |
| 160,333 | | ||||
Non-interest expense: |
|
|
|
|
|
|
|
| ||||||||
General and administrative expenses |
| (37,770 | ) |
| (3,721 | ) |
| - | |
| (41,491 | ) | ||||
Other non-interest expense |
| (960 | ) |
| (1,916 | ) |
| 1,916 | |
| (960 | ) | ||||
Total non-interest expense |
| (38,730 | ) |
| (5,637 | ) |
| 1,916 | |
| (42,451 | ) | ||||
Income before income taxes |
| 261,158 | |
| 3,315 | |
| - | |
| 264,473 | | ||||
Income tax expense |
| - | |
| (1,430 | ) |
| - | |
| (1,430 | ) | ||||
Net income |
| $ | 261,158 | |
| $ | 1,885 | |
| $ | - | |
| $ | 263,043 | |
|
|
|
|
|
|
|
|
| ||||||||
|
| November 30, 2016 | ||||||||||||||
|
| CFC |
| Other |
| Elimination |
| Consolidated Total | ||||||||
Assets: |
|
|
|
|
|
|
|
| ||||||||
Loans to members |
| $ | 23,813,591 | |
| $ | 1,037,545 | |
| $ | (1,000,424 | ) |
| $ | 23,850,712 | |
Less: Allowance for loan losses |
| (33,911 | ) |
| - | |
| - | |
| (33,911 | ) | ||||
Loans to members, net |
| 23,779,680 | |
| 1,037,545 | |
| (1,000,424 | ) |
| 23,816,801 | | ||||
Other assets |
| 1,318,908 | |
| 112,264 | |
| (100,252 | ) |
| 1,330,920 | | ||||
Total assets |
| $ | 25,098,588 | |
| $ | 1,149,809 | |
| $ | (1,100,676 | ) |
| $ | 25,147,721 | |
84
Item 3. | Quantitative and Qualitative Disclosures About Market Risk |
For quantitative and qualitative disclosures about market risk, see "Part I-Item 2. MD&A-Market Risk" and "Note 8-Derivative Instruments and Hedging Activities."
Item 4. | Controls and Procedures |
As of the end of the period covered by this report, senior management, including the Chief Executive Officer and Chief Financial Officer, evaluated the effectiveness of our disclosure controls and procedures as defined in Rules 13a-15(e) and 15d-15(e) of the Securities Exchange Act of 1934. Based on this evaluation process, the Chief Executive Officer and Chief Financial Officer concluded that our disclosure controls and procedures are effective. There were no changes in our internal control over financial reporting that occurred during the three months ended November 30, 2017 that have materially affected, or are reasonably likely to materially affect, our internal control over financial reporting.
PART II-OTHER INFORMATION
Item 1. | Legal Proceedings |
From time to time, CFC is subject to certain legal proceedings and claims in the ordinary course of business, including litigation with borrowers related to enforcement or collection actions. Management presently believes that the ultimate outcome of these proceedings, individually and in the aggregate, will not materially harm our financial position, liquidity, or results of operations. CFC establishes reserves for specific legal matters when it determines that the likelihood of an unfavorable outcome is probable and the loss is reasonably estimable. Accordingly, no reserve has been recorded with respect to any legal proceedings at this time.
Item 1A. | Risk Factors |
Refer to "Part I- Item 1A. Risk Factors" in our 2017 Form 10-K for information regarding factors that could affect our results of operations, financial condition and liquidity. We are not aware of any material changes in the risk factors set forth under "Part I- Item 1A. Risk Factors" in our 2017 Form 10-K.
Item 2. | Unregistered Sales of Equity Securities and Use of Proceeds |
Not applicable.
Item 3. | Defaults Upon Senior Securities |
Not applicable.
Item 4. | Mine Safety Disclosures |
Not applicable.
Item 5. | Other Information |
None.
85
Item 6. Exhibits
The following exhibits are incorporated by reference or filed as part of this Report.
EXHIBIT INDEX
Exhibit No. |
| Description |
10.1* | - | Amendment No. 2 dated as of November 20, 2017 to the Amended and Restated Revolving Credit Agreement dated as of November 19, 2015 maturing on November 20, 2020. |
10.2* | - | Amendment No. 2 dated as of November 20, 2017 to the Amended and Restated Revolving Credit Agreement dated as of November 19, 2015 maturing on November 20, 2022. |
10.3* | - | Series M Bond Purchase Agreement between the Registrant, Federal Financing Bank and Rural Utilities Service dated as of November 9, 2017 for up to $750,000,000. |
10.4* | - | Series M Future Advance Bond from the Registrant to the Federal Financing Bank dated as of November 9, 2017 for up to $750,000,000 maturing on July 15, 2042. |
10.5* | - | Fourth Amended, Restated and Consolidated Pledge Agreement dated as of November 9, 2017 between the Registrant, the Rural Utilities Service and U.S. Bank National Association. |
10.6* | - | Fourth Amended, Restated and Consolidated Bond Guarantee Agreement dated as of November 9, 2017 between the Registrant and the Rural Utilities Service. |
12* | - | Computation of Ratio of Earnings to Fixed Charges |
31.1* | - | Certification of the Chief Executive Officer required by Section 302 of the Sarbanes-Oxley Act of 2002 |
31.2* | - | Certification of the Chief Financial Officer required by Section 302 of the Sarbanes-Oxley Act of 2002 |
32.1† | - | Certification of the Chief Executive Officer required by Section 906 of the Sarbanes-Oxley Act of 2002 |
32.2† | - | Certification of the Chief Financial Officer required by Section 906 of the Sarbanes-Oxley Act of 2002 |
101.INS* | - | XBRL Instance Document |
101.SCH* | - | XBRL Taxonomy Extension Schema Document |
101.CAL* | - | XBRL Taxonomy Calculation Linkbase Document |
101.LAB* | - | XBRL Taxonomy Label Linkbase Document |
101.PRE* | - | XBRL Taxonomy Presentation Linkbase Document |
101.DEF* | - | XBRL Taxonomy Definition Linkbase Document |
____________________________
* Indicates a document being filed with this Report.
† Indicates a document that is furnished with this Report, which shall not be deemed "filed" for purposes of Section 18 of the Securities Exchange Act of 1934, or otherwise subject to the liability of that Section.
86
SIGNATURES
Pursuant to the requirements of the Securities Exchange Act of 1934, the registrant has duly caused this report to be signed on its behalf by the undersigned thereunto duly authorized.
NATIONAL RURAL UTILITIES |
COOPERATIVE FINANCE CORPORATION |
Date: January 11, 2018
By: | /s/ J. ANDREW DON |
| J. Andrew Don |
| Senior Vice President and Chief Financial Officer |
By: | /s/ ROBERT E. GEIER |
| Robert E. Geier |
| Controller (Principal Accounting Officer) |
87